MANUFACTURING PRODUCTIVITY UNDER …icrier.org/pdf/wp107.pdfMANUFACTURING PRODUCTIVITY UNDER VARYING...
48
WORKING PAPER NO. 107 MANUFACTURING PRODUCTIVITY UNDER VARYING TRADE REGIMES: INDIA IN THE 1980s AND 1990s DEB KUSUM DAS July 2003 INDIAN COUNCIL FOR RESEARCH ON INTERNATIONAL ECONOMIC RELATIONS Core-6A, 4 th Floor, India Habitat Centre, Lodi Road, New Delhi-110 003
Transcript of MANUFACTURING PRODUCTIVITY UNDER …icrier.org/pdf/wp107.pdfMANUFACTURING PRODUCTIVITY UNDER VARYING...

WORKING PAPER NO. 107
MANUFACTURING PRODUCTIVITY UNDER VARYING TRADEREGIMES: INDIA IN THE 1980s AND 1990s
DEB KUSUM DAS
July 2003
INDIAN COUNCIL FOR RESEARCH ON INTERNATIONAL ECONOMIC RELATIONSCore-6A, 4th Floor, India Habitat Centre, Lodi Road, New Delhi-110 003

Content
Foreword............................................................................................................................. i
1. Introduction ........................................................................................................... 1
2. Trade Regimes and Indian Industry: 1980s and 1990s ..................................... 3
3. Methodology and Data base ............................................................................... 10
4. Productivity Growth Estimates: 1980s and 1990s............................................ 19
5. Conclusion............................................................................................................ 34
Appendix .......................................................................................................................... 36
References ........................................................................................................................ 41

i
Foreword
This paper forms a part of a larger study on Productivity Growth and TradeRegimes: A Study of Indian Manufacturing Industries in the 1980s and 1990s, beingundertaken at ICRIER. Following changes in India’s trade policy stance in the 1980s and1990s, the linkage between trade liberalization and productivity growth as an indicator ofindustrial performance has assumed importance. To this end the study seeks to explorethe nature and magnitude of total factor productivity (TFP) change under different traderegimes.
The standard growth accounting methodology is applied to data compiled fromthe Annual Survey of Industries for selected 3-digit use-based manufacturing sectors overthe period 1980-2000. The analysis focuses on the overall period and four sub periods(1980-85, 1986-90, 1991-95 and 1996-00) to reflect the shifts in trade policy regime.There is no evidence of much change in total factor productivity growth followingliberalization of the regime initiated in the early 1990s. As in the 1980s, factoraccumulation rather than productivity growth accounts for most of the output growthduring this period.
Like many other studies on India and globally, this paper finds negative TFPgrowth, based on invested capital, in many industries over certain periods. It is difficult toconceive of negative technical change (exogenous or endogenous) and therefore negativeTFP change must represent underlying structural and cyclical factors that need to beinvestigated and understood. Such structural factors would include exit restrictionsarising from inability to dismiss workers or declare bankruptcy. Such exit restrictionsresult in accumulation of sick firms that pull down the industry TFP growth into negativeterritory. Other potential structural changes are sharp reductions in quantitativerestrictions and tariffs that change relative prices from a protective configuration to worldlevels. In such a situation the measurement of TFP growth at world relative prices maydiverge significantly from TFP growth measured in domestic prices (adjusted foraggregate inflation). Cyclical movements would also affect utilization of capital (andeven unskilled labor, which is a quasi-fixed factor if retrenchment is not possible) overthe cycle thus raising the possibility of negative TFP growth in a period of rising excesscapacity. Reforms that improve animal spirits and sharply raise investments, as during1994–95 to 1996–97 could perversely lead to higher excess capacity and lower measuredTFP.
Arvind VirmaniDirector & Chief Executive
ICRIERJuly 2003

1
MANUFACTURING PRODUCTIVITY UNDER VARYING TRADE REGIMES:INDIA IN THE 1980s AND 1990s*
DEB KUSUM DAS
1. Introduction**
Industrial performance has been a subject of debate in India since the advent in
the early 1950s of import substitution and industrialization strategy based on public
sector as the engine of growth. Following changes in trade policy stance in the 1980s and
1990s, the linkage between trade liberalization and productivity growth as an indicator of
industrial performance has assumed importance. The 1980s saw changes in the external
and the industrial sector in matters pertaining to licensing for scale and technology as
well as quantitative restrictions on imports and tariff rates. The 1990s brought about
comprehensive trade liberalization encompassing abolition of non-tariff barriers,
reduction of peak tariff rates and dispersion along with devaluation of the rupee. Against
this background, it is important to analyze the impact of the economic liberalization on
manufacturing productivity in the industrial sector. More importantly, in the context of
policy reforms, we need to assess whether there was any beneficial impact on
productivity growth of trade liberalization. To this end our study seeks to explore the
nature and magnitude of total factor productivity (TFP) change under different trade
regimes.
* This paper forms a part of a larger study on “Productivity Growth and Trade Regimes: A Study of
Manufacturing Industries in the 1980s and 1990s” being undertaken at Indian Council for Research onInternational Economic Relations (ICRIER). I am thankful to Professors K.L.Krishna, Suresh D.Tendulkar, and B.N Goldar for extensive comments on earlier drafts of the paper. Helpful commentsfrom Professors Arvind Virmani and Shankar Acharya, during a presentation at ICRIER are gratefullyacknowledged. I am also greatly indebted to Professor Prema-Chandra Athukorala for valuable insightsand advice. Finally, research assistance by Sasanka Sarmah is gratefully acknowledged. The usualdisclaimers apply. Please address any comments to [email protected]
** The paper examines productivity performance of Indian manufacturing under varying trade regimes.The standard growth accounting methodology is applied to data compiled from the Annual Survey ofIndustries for selected 3-digit use-based manufacturing sectors over the period 1980-2000. The analysisfocuses on the overall period and four sub periods (1980-85, 1986-90, 1991-95 and 1996-00) to reflectthe shifts in trade policy regime. There is no evidence of much change in total factor productivitygrowth following liberalization of the regime initiated in the early 1990s. As in the 1980s, factoraccumulation rather than productivity growth accounts for most of the output growth during this period.

2
The performance of the Indian industry, somewhat encouraging with respect to
overall growth and diversification, has been poor when judged in terms of productivity
growth. Though the performance of Indian industries in terms of productivity growth has
been documented to be unsatisfactory, there have been very few attempts at analyzing the
factors behind the insignificant productivity growth1. The analysis in Ahluwalia (1991,
94) draws some tentative conclusions about the role of industrial and trade policies in
bringing about the turn around in productivity growth. Our appraisal of the studies shows
that the question of “turn-around” dominated the analysis of the productivity growth
performance of the 1980s2 and the issue of whether there was an improvement in the
early 1980s is still far from resolved. The evidence for the 1990s however confirms that
there has been a fall in TFP growth rate in the 1990s relative to the 1980s. The evidence
of a decline in the 1990s holds across different data sets (ASI, RBI) as well as levels of
disaggregation- firm and industry. Further, the estimates are quite robust to the alternative
methodologies for measuring productivity.
The question of why the TFP growth in the manufacturing industries declined in
the 1990s assumes significance as an important objective of the reforms in the 1990s was
to make Indian industries competitive in international markets and enhancing
productivity growth constituted a means to that end. There could be several possible
inferences. First, the failure of TFP growth to accelerate with the economic liberalization
is perhaps indicative of the harmful lag effects of the previous interventionist regime.
Second, since there was a spurt in investment activity in the 1990s in response to the
economic reforms, there could be an immediate adverse effect due to gestation lags.
The paper is organized as follows. The following section provides an over view of
the policy regimes facing the manufacturing sector in the 1980s and 1990s. Section 3
deals with the methodology and database of productivity growth measurement.
1 Studies by Parhi (1997) and Mitra et al (1998) have examined the role of factors like R&D,
Infrastructure etc in productivity growth. A large number of studies have however addressed themethodological issues in estimating manufacturing productivity and debating the “turnaround”phenomenon,
2 See Das (2001) for a review of the recent studies on productivity growth in Indian manufacturing in the1980s and 1990s.

3
Productivity growth estimates for the 1980s and 1990s are documented and analyzed in
section 4. Section 5 concludes the study.
2. Trade Regimes and Indian Industry: 1980s and 1990s
The policy regime facing the manufacturing sector in developing countries is
often a major constraint in attaining high levels of efficiency. In particular, trade and
industrial policies play a crucial role in shaping the manufacturing sector’s growth.
India’s economic policies towards industry and manufacturing sector have had a large
measure of success in the development of a diversified industrial base. Nevertheless these
policies have also carried with it some costs- low productivity and lack of
competitiveness.3
The industrial stagnation that marked the period from the mid-1960s to the late
70s led to rethinking on the role of trade-policy in India [Alexander (1977), Hussain
(1984) and Narasimham (1984)]. Up to the 1970s the focus of trade policy was on
regulating the utilization of foreign exchange through the use of quantitative restrictions.
The import control system divided imports into three broad categories- intermediate
inputs (raw materials, components, spares and supplies), capital goods and consumer
products.4 Consumer goods other than those imported via state agencies (food-grains,
edible oils, certain drugs and pharmaceuticals medicines) and canalized were not
permitted. Other imports were listed as non-permissible, limited permissible, automatic
permissible and those in open general list subject to tariff rates applicable. This implied
licensing for all categories of imports except those on OGL.5 Two important categories of
import licenses were the ‘actual-users’ (AU) licenses for import of intermediate and raw
materials and ‘capital goods’ (CG) licenses for import of capital goods. These were non-
3 See World Bank (1989), Dhar (1990) for an appraisal of the policy regime in India in the 1980s.4 See the chart on India’s Import Control Mechanism-1975-76 in Narahari Rao (1985) and also
reproduced as figures 5.1 and 5.2 in chapter 5 of Srinivasan (1993).5 OGL refers to Open General License, an import-licensing scheme, where a product is available for
imports against tariff. CANALIZED means that imports are only allowed by the government or any ofits agencies
4
transferable and required the fulfillment of two criteria: (i) the ‘essentiality’ of the
proposed import and (ii) ‘indigenous’ non-availability of the proposed import. The actual
allocation across industries and firms within an industry were ad hoc, based on
bureaucratic perceptions of ‘fairness’ and ‘equity’.
The 1980s witnessed some changes in the trade regime with regard to imports of
intermediate inputs and capital goods with many items of intermediate inputs and capital
goods being brought under the OGL. Further, even small-scale units were free to import
raw materials covered in the OGL category. Imports were also allowed for certain
canalized products. The 1982-83 trade policy raised the value limit for imports to
promote technological up gradation and modernization under the technical development
fund scheme to US$ 500,000. Access to foreign exchange for improvement of technology
by way of import of know-how, designs and consultancy was also improved in certain
cases. The reforms initiated in 1985 made an attempt to bring stability and continuity in
the external sector by spelling out a three-year trade policy (1985-88). The expansion of
items under the OGL lists was backed up by removal of QRs and their replacements by
tariffs on non-competitive imports. Amongst the products, more items of machinery were
brought under the free category. Further imports of capital goods against replenishment
licenses were granted to both small-scale and non small-scale units whose exports of
select products were less than the minimum prescribed ten percent of their production. A
significant feature of the 1988-91 export-import policy was the provision for ‘flexibility’
in regard to the Replenishment (REP) license, which was freely transferable. REP
licenses were automatically endorsed for a certain degree of flexibility permitting import
of limited permissible and canalized items. The range of export products qualifying for
import replenishment has also widened. Further additions were made in the OGL in
1989-90 in terms of capital goods required for manufacturing footwear (rubber and
canvas) and silk items.
The 1991-92 trade reforms have been well documented [Mishra and Goldar
(1996), Joshi and Little (1994), Chadha (2000)]. We concentrate on three aspects of the
1991 trade-reform package: removal of quantitative restrictions, lowering and
5
rationalizing of tariffs and export subsidies. The major change in the trade policy of
1992-97 is a negative list of products banned due to health, defense and environmental
concerns. Except for consumer goods, almost all items of capital and intermediate goods
can be freely imported subject to tariffs. The imports of some restricted items, has been
liberalized by permitting their imports to certain categories of exporters through freely
transferable special import licenses [around 300 items allowed to be imported via special
import license (SIL) in 1991-92]. Further, all second-hand capital goods having a
minimum residual life of 5 years are free to be imported. Comparing the periods 1986-90
and 1991-95 we observe that a high proportion of items (in terms of value of imports and
number) have been freed from the restrictions of import licensing.6
Prior to 1991, import tariffs in India were amongst the highest in the world. The
removal of quantitative restrictions on imports was accompanied by a gradual lowering of
import duties in each of the budgets presented from 1991 onwards. The maximum tariff
rate was lowered from a peak of 355 per cent in 1990-91 to around 40 per cent by the
year 1999-00. The rate for the manufacturing sector was reduced to 30 per cent in 1999-
00 from a high of around 125 per cent before the 1991 trade policy changes. The
reductions in import duty rates were especially sharp for capital goods. The composite
duty rate on "project imports" (imports of various capital goods needed to set up new
projects) was lowered from 85 per cent to around 25 per cent. There is an even lower rate
of 20 per cent applicable for machinery for electricity generation, petroleum refining,
coal mining and zero for machinery for fertilizer projects. A number of changes were also
made to simplify the system- reduction in inter-product variations and rationalization of
the tariff structure. In addition, many end-use exemptions were removed. As a result of the
tariff reforms, the collection rate of duty at the aggregate level fell from 47 per cent in
1990-91 to 30 per cent in 1999-00.
6 See Table 8 in Mishra and Goldar (1996), wherein the HS codes subject to OGL increased from 13
percent in 1987-88 to 55 percent in 1994-95. Further, the frequency distribution for 1987-88 shows thataround 29 percent of HS codes are in unidentified category as the licensing status could not beascertained, whereas no such ambiguity was reported for 1994-95.
6
India does not provide direct subsidies to exporters, however there are duty and
tax concessions, export-finance, marketing and promotion. Between the 1970s and 1980s,
a number of incentives were designed to compensate exporters for the cost escalating
effects of domestic taxes. The negative list for exports was significantly pruned
removing a number of restrictions earlier applicable on exports, particularly of
agricultural products (items subject to export controls were reduced from 439 to 215 by
1993-94). The emphasis of the export incentive system has been changed considerably
since 1991. The role of duty free import licenses for exporters was enhanced since 1991
through the lists of products with published physical input-output norms to facilitate
computation of values of duty-free import licenses. A new class of value-based duty
exempt import licenses was introduced in which exporters could import materials of his
choice, rather than pre-defined precise values of certain categories of import, up to the
permitted foreign exchange value of the licenses. A special scheme known as Export
Promotion Capital Goods (EPCG) originally introduced in 1990s was liberalized in 1992
to encourage imports of capital goods. The concessional import duty was reduced from
25 per cent to 15 per cent.
We can discern 4 distinct phases of India's trade liberalization, in the study period.
The first phase saw the emergence of thinking about the need for change in trade policies
as discussed in above. The second phase starts with the Long Term Fiscal Policy
proposing the removal of import licensing and simplification of the tariff structure and,
importantly, the first instance of a 3-year trade policy. The third phase starts with the
comprehensive trade policy changes in 1991-92. The final phase starts with the EXIM
Policy of 1997-2002 that aims at simplified procedures and rationalized tariff rates. The
major changes in export and import policies during the four phases of trade reform are in
Table1.

7
Table 1: Import and Export Policy Changes in the four Trade Reform Phases
Phase-1: 1980-85 Phase-2: 1986-90 Phase-3: 1991-95 Phase-4: 1996-00• OGL items not on
the banned list canbe allowed onessentiality andindigenousclearance
• REP licenses toregistered exportersmade transferable
• REP licenses issuedto manufacturer–exporters whetherthey export directlyor through others
• Advance licensewith benefit ofcustom dutyexemption wasextended to newproducts and newmarkets
• Setting up ofTrading Houses forexports
• Trading houseswere allowed accessto restricted andcanalized items
• Value of imports topromotetechnological up-gradations doubledto US $500,000
• Imports of rawmaterials by SSIunder OGL allowed
• Facility for importof certain canalizeditems allowed.
• Greater role byremoving QR fortariff in regulatingimports
• Abolition ofadvance licenses
• Items under OGLexpanded
• More items de-canalized
• Expansion in capitalgoods lists underOGL includingmachinery
• Imports of capitalgoods against REPlicenses granted toSSI/ non-SSI
• Import of capitalgoods for NRI to setup industries
• Import ofmachinery and rawmaterial for exportpromotion in thrustareas
• Exports under barterdeals [East Europe]eligible for REPbenefits
• Concessions forexport orientedunits & Free TradeZones
• export-import(XM) pass book formanufacturerexporter
• Import control vialicensing eliminatedexcept for anegative list ofmostly consumergoods
• REP system wasenlarged andrestructured
• Capital goods, rawmaterials andcomponents may beimported by anyperson whether AUor not
• All second handcapital goodshaving a minresidual life of 5years may beimported by the AUwithout a license
• Some imports ofconsumer goodsallowed
• Imports ofconsumer goodsunder SIL
• Number of itemssubject to exportcontrol reduced
• Several incentivesavailable toexporters
• Tariffs werelowered andrationalized
• Peak duty rateslowered in stagesfrom 150 to 50%
• Duty rate on capitalgoods lowered from85 to 25%
• Peak tariff ratesreduced
• Lists of freelyimportableconsumer goodsexpanded
• Transferability ofimport licensesliberalized
• More items put onOGL
• Import of gold andsilver liberalized
• Basic customsduties on IT sectorsrationalized
• Special additionalcustoms dutyimposed
• Furtherrationalization ofpeak tariff rates toaround 30 percent
Source: Economic Survey, Government of India- Various Years
Industrial Policy Changes
The stagnation of industrial production in the late 1970s induced some thinking
on the industrial policies and there was recognition of the need for reforms in industrial
8
sector to complement any foreign trade liberalization attempts. The 1980s witnessed a
wide array of initiatives aimed at creating a dynamic industrial environment. The thrusts
of these reforms were to lower some of the policy induced entry barriers in a number of
industries. Second, these reforms were aimed at offering larger discretion and decision
making to corporate managers without reference to government machinery. Third,
minimum efficient scales were announced for various industries for attaining
international competitiveness. These changes also may be seen as the first step in
removing the preemptive claims of the government in undertaking production in pre-
designated sectors of industrial activity. The internal liberalization package included
measures such as- automatic endorsement of capacity expansion up to 25 percent of
licensed capacity, broad-banding of industrial licensing to allow firms to overcome a
tightly defined product specification, de-reservation of 40 industries and permitting large
firms to enter, raising the investment limits for inclusion in SSI limits, revising the ceiling
upwards for inclusion in MRTP classification and de-licensing of several industries
especially if these capacities are established in back ward areas or dedicated
predominantly for exports. Further, policies for specific sectors were also initiated.7
In 1985, firms with assets below Rs 50 million and located at least 30 miles
beyond urban areas no longer required a license. By 1988, this limit was raised to Rs 150
million and to Rs 500 million for industries located in ‘backward’ areas. In addition, 25
broad categories of industries were de-licensed subject to the conditions that they were
not covered under (1) Monopolies Restrictive Trade Practices Act [MRTP] (2) Foreign
Exchange Regulation Act [FERA]. (3) Small-scale industries reservation and (4) not
located in urban setting8. For many industries, which remained within the ambit of
licensing, the facility of broad banding was accorded to allow them to make rapid
changes in their product-mix. Broad banding was also extended in stages and some 28
industry-groups were covered by the 1986.A provision was also made for capacity re-
7 Aside from general policy thrust, the government announced a new textile policy and as a follow up to
the new textile policy, licensing policies for synthetic yarns and fibres have also been liberalized. Stepshave also been taken to strengthen the business environment for the electronics industry with aliberalized policy framework.
8 See Table 4.1 of Economic Survey (1985-86) for the list of 25 broad categories of industries. In June1985, de-licensing was extended to drugs and pharmaceutical products.

9
endorsement to all licensed units, which achieved 80 percent of their licensed capacity
during any of the previous five years ending 31st March 1985.9 Further more, some firms
even after capacity increases through re-endorsement were left at uneconomic scales of
operation. The government invited proposals for these firms, to expand up to minimum
economic scales without the need for licenses.
The MRTP act was also rationalized. The asset threshold bringing a unit under the
purview of the MRTP act was raised to Rs100 crores taking into account the price
increases since 1969. In addition, the government also permitted 30 broad group of
industries to seek a license from Industrial Development Regulatory Agency without
obtaining a clearance from the Department of Company Affairs for a new project or
substantial expansion. Further, FERA and MRTP companies were allowed to continue to
be permitted if the product was predominantly for exports with an export share of 60
percent (75 percent if the item was reserved for the small-scale sector). To promote
industrialization in backward areas, conditions permitting these industries in such areas
were also liberalized.
Three aspects of the industrial reforms in the 1990s merit attention. First, the
across the board de-licensing and the repealing of the MRTP act, reducing the barriers to
entry into the industrial sector. Firms are now free to manufacture any article except
those subject to compulsory licensing in response to market signals since industrial
licensing for capacity has been removed. . The licensing requirement has been abolished
in all but 15 industries where strategic and environmental concerns dominate or the
import content is very high. This was done with the purpose of increasing the role of
commercial considerations in investment planning apart from reducing the bureaucratic
discretion. Second, clear articulation of policy with respect to reforming the public sector
and subjecting certain industries hitherto reserved exclusively for the public sector to
competition from the private entrepreneurs. The number of areas reserved for public
9 The capacity on their licenses will be endorsed to the extent of the highest production achieved during
any of the previous years plus one-third thereof. The facility is however not available to small-scalesector or certain identified industries characterized as suffering from shortage of raw materials,infrastructure or pollution levels or industrial setups in urban locales or MRTP/FERA companies.

10
sector is reduced to six- defense, atomic energy, minerals for atomic energy, coal,
mineral oils and railway transport. Even in sectors reserved for public sector, private
investment is permitted on a case-by-case basis. Finally, freeing of restrictions on foreign
collaborations, technical as well as financial. The new policy provides for automatic
approval of FDI up to 51 percent foreign equity holding in 35 specified high priority,
capital- intensive, high-technology industries. The foreign equity should cover the foreign
exchange involved in importing capital goods and outflow on account of dividend
payments and is balanced by export earnings over a period of 7 years from the
commencement of production. The barriers to exit however still remain a problem, as
Board for Industrial and Financial Reconstruction (BIFR), Companies Act and Urban
Land Ceiling Act stood in the way of providing the necessary flexibility in re-deploying
resources from the unproductive and economically non-viable sectors to the more vibrant
sectors.
3. Methodology and Data base
Growth stems from two sources: factor accumulation and productivity growth.
The basic issue is the relative importance of each of these components .The concept of
productivity used in this study is that of total factor productivity (TFP)10. Productivity is a
technical concept, which refers to a ratio of output to input, a measure of the efficiency
with which the factors of production are used. Whereas conventional measures of
productivity such as labor productivity and capital productivity suffer from the
drawbacks of including gains in efficiency due to an increase in availability of other
inputs, The TFP measure attempts to avoid this problem by taking into account the usage
of all inputs. The index of productivity is defined as output per unit of the composite of
all factors of production. The question arises as to how to weight the inputs in the index.
It is in this sense that the notion of TFP becomes theory dependent. For classification
purposes, we can conceptualize the notion of TFP through an index or through a
production function. Solow (1957) proposed the economic theory of production as the
explicit analytical framework for TFP measurement. He defined TFP growth as the shift
10 See Diewert (1992) for a review of the notion of TFP and its computations.
11
in an aggregate production function and since then the technique has been used
extensively to analyze technological change in both developed and developing
countries.11
Two important methodologies used in most studies on productivity growth have
been growth accounting and the econometric estimation of production functions. The
objective of the growth accounting technique is to determine how much output growth is
due to accumulation of inputs and how much can be attributed to technical progress. In
other words, how much of growth can be explained by movements along a production
function and how much should be attributed to advances in technological and
organizational competence. The rationale for the growth accounting approach depends
not only on the existence of the aggregate production function for the sector or economy,
but also on the validity of the marginal productivity theory of factor pricing. Therefore
direct estimation of the aggregate production function is an alternative.12 However, a
major limitation is that the coefficients to be estimated must be treated as constants over
the data samples used in estimation. If flexible functional forms are adopted because
more parameters have to be estimated larger samples are needed.
3.1 Productivity Growth at the Industry Level: Jorgenson Methodology
The existence of the aggregate production function imposes stringent conditions
on the production patterns at the industry level. Jorgenson (1995) argued that these
assumptions are incongruent with reality and data for sectoral production accounts can be
generated in ways that avoid some of the more restrictive assumptions. In a sequence of
papers that Jorgenson co-authored with Gollop (1980, 1983), with Fraumeni (1980,1986),
and with Gollop and Frauemeni (1987), the aggregate production function is dispensed
11 Advances in closely related areas of economic theory and measurements have strengthened the
theoretical foundations of TFP measurement. Particularly relevant are advances in duality theory,including the work by Shepard (1953,70), Uzawa (1964) and McFadden (1966,78). Advances have alsobeen made in the area of aggregation, e.g. in defining appropriate quantity and price indices of output,input and TFP. These contributions include those of Diewert (1976, 78).
12 The estimation of production function (or other related producer behavioral equation) permits departurefrom some of the assumptions underlying the traditional growth accounting exercises, thus can providea framework for testing some of these assumptions- constant returns to scale and perfect competition.

12
with and industry output growth is instead represented by an industry level function of
capital, labor and intermediate inputs as well as industry level productivity. The growth
of output at the sectoral aggregate level is allocated between the contribution of inputs
and changes in productivity. The contribution of each input to growth is separated into its
quantity components and growth in input quality.
The TFPG estimation in this study follows the methodology developed in
Joregenson et al (1987) which ultimately rests on Solow (1957) who showed that under
certain conditions the growth rate of TFP could be estimated as the growth rate of output
minus the growth rate of total input. The latter in turn equals the sum of the value share
weighted growth rates of individual inputs. The assumptions on which the approach rests
are that the producers are price takers in both output and input markets, so that output
prices are equal to the marginal costs of production and that the technology is
characterized by constant returns to scale.13
Following Jorgenson et al. (1987) we assume that for each industry there exists a
production function relating output to labor, capital, materials, energy and time. For the
ith industry,
Yi= Fi( Li, Ki, Mi, Ei, t), i=1,2,……….75
Where Y is real gross output, L is labor input, K is real capital stock, M is real material
input, E is real energy input and t is time. TFP growth for the ith industry in year t is
calculated using the Tornqvist approximation as
13 These assumptions enable the estimation of TFP growth without having to estimate the parameters of
the production function, even when the data-set does not have a large number of time seriesobservations In the light of the new growth theory [Romer (1986), Lucas (1988)] which emphasizeexternalities and learning effects, this approach may seem outdated. The new growth theories mayaffect the interpretation rather than the validity of the TFP calculations. Further, it is possible to use theestimates, derived on the assumptions of constant returns, absence of externalities, and so on, to testwhether the patterns of productivity growth are indeed consistent with the assumptions.

13
Ln[TFP(t)/TFP(t-1)]=Ln[O(t)/O(t-1)]- v l(t)Ln[L(t)/L(t-1)]- v k(t)Ln[K(t)/K(t-1)]-v m(t)Ln[M(t)/M(t-1)]- v e(t)Ln[E(t)/E(t-1)]
where, v l(t) =1/2[vl(t)+vl(t-1)], v k(t) =1/2[vk(t)+vk(t-1)], v m(t) =1/2[vm(t)+vm(t-1)] and v e(t) = 1/2[ve(t) +ve(t-1)]
v l , v k , v m, and v e are the averages of the shares of labor, capital, materials and
energy for the years (t) and (t-1) as defined above The methodology assumes perfect
competition and constant returns to scale. Further, the revenue shares of the factor inputs
sum to unity.14 The productivity growth estimates are computed for the full sample of 75
three-digit manufacturing industries as well as the use-based classification: intermediate,
capital and consumer goods groups of industries.
3.2 Data and Variables
Data Description and Variables Construction
We consider a set of 75 three-digit manufacturing industries. The period of
analysis is 1980-81 to 1999-00. The panel of 75 three-digit industries, cover the
following two-digit industries- cotton textiles (23), textile products (26), leather and
leather products (29), basic chemicals (30), rubber, plastics and petroleum products (31),
basic metals (33), metal products (34), non electrical machinery (35), electrical
machinery (36) and transport and equipment (37). The choice of the industries is guided
by considerations of covering a wide range of industries, which have been the
beneficiaries of the trade and industrial policy changes of the 1980s and 90s. Sectors like
electrical and non electrical machinery, basic metal and metal products, chemicals, cotton
textiles, textile products and leather have been chosen keeping in mind the our objective
of exploring the trade liberalization- productivity linkage.
14 Hall (1986,1988) argues that the measurement of productivity is likely to have pro-cyclical bias due to
the assumptions of perfect competition and constant returns to scale. Studies by Harrison (1994),Srivastava (1996), Krishna and Mitra (1998) and Balakrishnan et.al (2000) have taken into accountHall’s argument in computing TFPG.

14
The chosen industries account for a large percentage of manufacturing value
added. Appendix Table A1 presents the value-added shares for four points of time- 1980-
81, 1985-86, 1990-91 and 1995-96. In all four years, we observe that the 75 industries
contribute over 65 percent of total manufacturing value added. These industries are
further classified as intermediate, capital and consumer goods sectors comprising 30, 25
and 20 three-digit industries respectively. These industries cover the organized or the
registered sector of manufacturing. It may be noted that till 1988-89 the classification of
industries followed in ASI was based on the national industrial classification 1970 (NIC-
1970). The switch to the NIC-1987 from the year 1989-90 necessitated some matching
of the NIC-1970 with NIC-1987. We treated the NIC-1987 as the base and accordingly
carried out data adjustment at the 3-digit industries level. Some industries had to be
merged (302+306, 338+339, 343+349, 344+345, 363+364 and 365+366) to build a
comparable series for pre 1989-90 and post 1989-90 periods. Rest of industries were
adjusted using the procedure outlined in the CSO document (1987) to arrive at
comparable series.
The basic source of data used for the productivity estimates is the Annual Survey
of Industries (Central Statistical Organization, Government of India). Most of the earlier
studies [e.g Goldar (1986a), Ahluwalia (1991), Mohan Rao (1996a)] have also used this
as the principal database. For correcting the reported data on nominal gross output and
intermediate inputs, suitable deflators have been constructed with the help of the official
series on wholesale price indices (Index Number of Wholesale Prices in India, prepared
by the Office of the Economic Advisor, Ministry of Industry, Government of India). For
purposes of deflating the material and energy inputs, we needed to create a weighted
price index. For this purpose, the appropriate weights were taken from the 115 sector
input-output table for the years 1983-84, 1989-90 and 1993-94 (Central Statistical
Organization, Government of India). For estimating the capital input series, estimates of
the gross-net ratios to compute the capital stock for the bench- mark years were taken
from the 1973-74 RBI bulletin. The deflator for the capital stock series was computed
from the yearly volumes of the National Accounts Statistics (Central Statistical
Organization, Government of India).

15
Construction of Variables
The basic variables for the estimation of the yearly TFP growth rates are gross
output, capital stock, number of workers, materials consumed and energy consumed. To
arrive at the measures of output and inputs in real terms, suitable deflators for the
variables were constructed.
One of the important advances in the industry- level productivity measurement
has been to utilize gross output rather than value-added as a measure of product at the
industry level. Jorgenson argues that an important advantage of focusing on industry
gross output for growth accounting is that intermediate inputs can be treated
symmetrically with inputs of capital and labor. Griliches and Ringstad (1971) however
have preferred gross value added to gross output, preference being based on various
reasons cited in their work.15 In the Indian case, a study by Balakrishan and
Pushpangadan (1994) has shown that a gross value added measure using a single
deflation procedure might produce a bias in the estimates if material prices do not move
parallel to output prices. Gross output in the present study is defined as the ex-factory
value of products and by-products manufactured during the accounting year. It also
includes the receipts for industrial and non-industrial services rendered to others.
There are various arguments put forward while specifying a measure of labor
input.16 Total persons engaged in industrial units are used as the measure of labor input.
For recent issues, it is reported in the ASI under the head “persons engaged”, for earlier
issues it is reported as “ number of employees”. This relates to all persons engaged by the
15 Gollop and Jorgenson (1980), Griliches and Ringstad (1971) and Goldar (1986a) dicusses the choice
between gross and net value added.16 Solow (1957) did consider treating workers with different skill level as a separate input factors and
explicitly recognized that doing so would lead to a reduction in measured productivity residual.Jorgenson argues that hours worked for persons with different accumulated stocks of human capitalmust be weighted by their corresponding and presumably differing marginal products. Jorgenson’s 1967paper with Griliches presents a constant quality index for labor input focussing on differences ineducational attainment amongst workers. Jorgenson’s subsequent papers with Gollop (1980,83)produced constant quality indices of labor input for 51 industrial sectors of the US economy.

16
factory for wages or not in work directly connected or indirectly with the manufacturing
process and includes administrative, technical, clerical staff as also labor used in
production of capital assets for factory’s own use. Implicit in such a measure is the
assumption that workers and other than workers are perfect substitutes. This may not be a
proper assumption to work with when the objective of the study is to compare the
productivity growth across the industries and management is one of the vitally important
factors in explaining inter-industry differentials.
Most studies do not consider intermediate inputs into account in that either a
gross/net value added is used as measure of output. Jorgenson (1988) has shown that in a
three input production framework, the contribution of intermediate input is the most
significant source of output growth vis-a-vis capital and labour in the context of US
economy. Intermediate input in our study consists of materials and energy inputs
separately. Materials consumed represents the total delivered value of all items of raw
material, components, chemicals, packing material and stores which actually entered the
production of the firm during the accounting year. It however excludes all intermediate
products, which are subject to further manufacturing process. The yearly fuels consumed
are taken as a measure of energy input. Fuels represents the total purchases of fuels,
lubricants, electricity, water by the firms during the accounting period. It excludes that
part of fuels that is consumed by employees as apart of the amenities.
The Capital Stock Variable
The measurement of capital stock is the most complex of all input measurements.
The conceptual problems involved in the measurement of capital input have been widely
discussed by writers on productivity study.17 Given the theoretical reservations, there are
also wide differences in the actual methodology used to build the estimates of capital
stock. The most widely used procedure is that of the “perpetual inventory method.” 18
17 See Denison (1957), Ruggles and Ruggles (1967) and Griliches and Jorgenson (1967).18 Goldsmith (1951) advocated the perpetual inventory method. See Dan Usher (1980), Young and
Musgrave (1980) as well as comments by Rhymes and Faucett for a critical appraisal of the perpetualinventory method.

17
Gross fixed capital stock series at constant prices was derived using the perpetual
inventory method. To arrive at the real gross fixed capital stock, we need (1) an estimate
of benchmark gross fixed capital stock, (2) time series on gross investment and (3) time
series of capital goods price.
The benchmark gross fixed capital stock for the three-digit industries for the year
1973-74 is arrived at by multiplying the net fixed capital stock as reported in the ASI by
the gross-net ratios as available from an RBI Bulletin. The gross-net ratios were available
for some broad two-digit industries necessitating mapping between the two and three-
digit sectors.19 The benchmark real capital stock is computed by inflating with the
average of the capital goods price for the period 1964-65 to 1974-75. For each industry,
the yearly gross investment in current prices was computed, from the figures of book
values of net fixed capital assets and depreciation reported in ASI.20 The yearly gross
investment is deflated by an index of capital goods price series with 1981-82=100 as base
to arrive at a real gross investment series. The post benchmark real gross fixed capital
stock is arrived at by the following procedure: real gross fixed capital stock (t) = real
gross fixed capital stock (t-1) + real gross investment (t). The annual rate of discarding of
the capital stock was assumed to be zero.
Deflators for the Variables in Nominal Values
Time series data on gross output, costs of intermediate inputs- material as well as
energy and current price gross fixed capital stock have been deflated by suitable deflators
(base 1981-82=100). Needless to say that construction of suitable deflators for gross
output and intermediate inputs is crucial for the measurement of the productivity growth.
The procedure followed for constructing the deflators is described below.
19 An alternative would have been to consider the gross-net ratios available from Hashim and Dadi (1970).20 Gross investment in year t denoted by I(t) is computed as I(t)= B(t)- B(t-1) + D(t), where B(t) is the
book-value of fixed assets in year t and D(t) is depreciation of fixed assets in year t, both as reported inASI

18
1. Gross Output: It was difficult to get an entirely satisfactory deflator for each of
the 75 three-digit industries from the wholesale price statistics. Therefore for
some industries we were required to construct a weighted average combining two
or more wholesale price indices to arrive at a reasonably accurate deflator for the
concerned industry.
2. Material Input: To compute a price series of material inputs, we need to have an
idea about the type of materials used by industry groups. ASI does not provide a
breakup of the materials consumed at the three-digit industry level. For our study,
we established a mapping between ASI three-digit industries and the input- output
table to identify the material inputs for each industry. We excluded sectors, which
covered capital goods and energy respectively. The rest of the entries were
identified as components of materials. The prominent materials are organic and
inorganic chemicals, rubber, plastics, paints, synthetic fibers, other chemicals,
nonmetallic mineral products, metal products, nonferrous metals, iron and steels,
paper, wood and coal tar etc. In addition, there were also products specific to
particular industry groups. On an average, there were around 20 entries per
industry, which were classified as material components.
For each industry, we constructed a weighted-index of material prices. Since each
industry had a large number of material inputs, we had to draw upon several
wholesale price indices to capture these inputs across industries. The weights for
each of these components were computed from the 1983-84, 1989-90 and 1993-
94 input-output tables and used for the years of the study21. It would be important
to point out that such a procedure provides industry specific deflators for material
inputs, which vary across industries as the structural coefficients are not
uniform22.
21 The I-O table 1983-84 was used for the years 1980-81 till 1988-89, 1989-90 was used for the years
1989-90 till 1992-93 and 1993-94 was used for the years 1993-94 till 1999-00.22 Appendix Tables II.4A and B in Das (2001) provides a description of the major categories of material
inputs across the industries and the list of WPI series used to approximate as closely as possible thesematerial inputs.

19
3. Energy Input: For purposes of our study, the energy input comprises the following
types: (1) coal [or lignite], (2) natural gas [or petroleum] and (3) electricity. Since
the break up according to these categories was not available from the ASI
database, a mapping was established with the I-O sector to have an idea about the
weights of these categories. The relative weights were obtained from the 1983-84,
1989-90 and 1993-94 I-O tables and used for the period of the study. The
wholesale price indices (base 1981-82=100) of coal, mineral oil and electricity
were used for the three types of energy input.
4. Gross Fixed Capital Stock: A price deflator for capital goods is needed to deflate
the yearly gross investment series. For our study, fixed capital was of two types:
(1) structures and (2) equipment. We use construction and machinery &
equipment to proxy for structures and equipment. The implicit price deflator for
investment in construction and machinery & equipment (base 1981-82=100) is
used to deflate the current rupee investment series. The price deflator is
computed as the ratio of current price gross capital formation by type of assets to
constant price gross capital formation by type of assets. The industry specific
shares of buildings and plant & machinery in the total are used as weights for
structures and equipment in computing a weighted implicit price deflator. The
weights were obtained from the 1983-84 ASI and used for the entire period of
study.
4. Productivity Growth Estimates: 1980s and 1990s
TFP growth rates are computed for 75 three-digit industries and three use-based
industry groups for the four phases of trade reforms and the overall period 1980-2000.23
We discuss the contribution of productivity change and input expansion in accounting for
the industry's output growth in the decades of 1980s and 1990s. We also document the
23 The use-based classification used in this paper is based on Das (2001) which in turn largely reflects the
Ahluwalia (1985) classification. Consumer goods is however inclusive of both consumer durable andnon-durable.
20
magnitude and direction of productivity growth across different industries and use-based
sectors for the four phases of trade reforms.
TFP growth or Factor Accumulation?
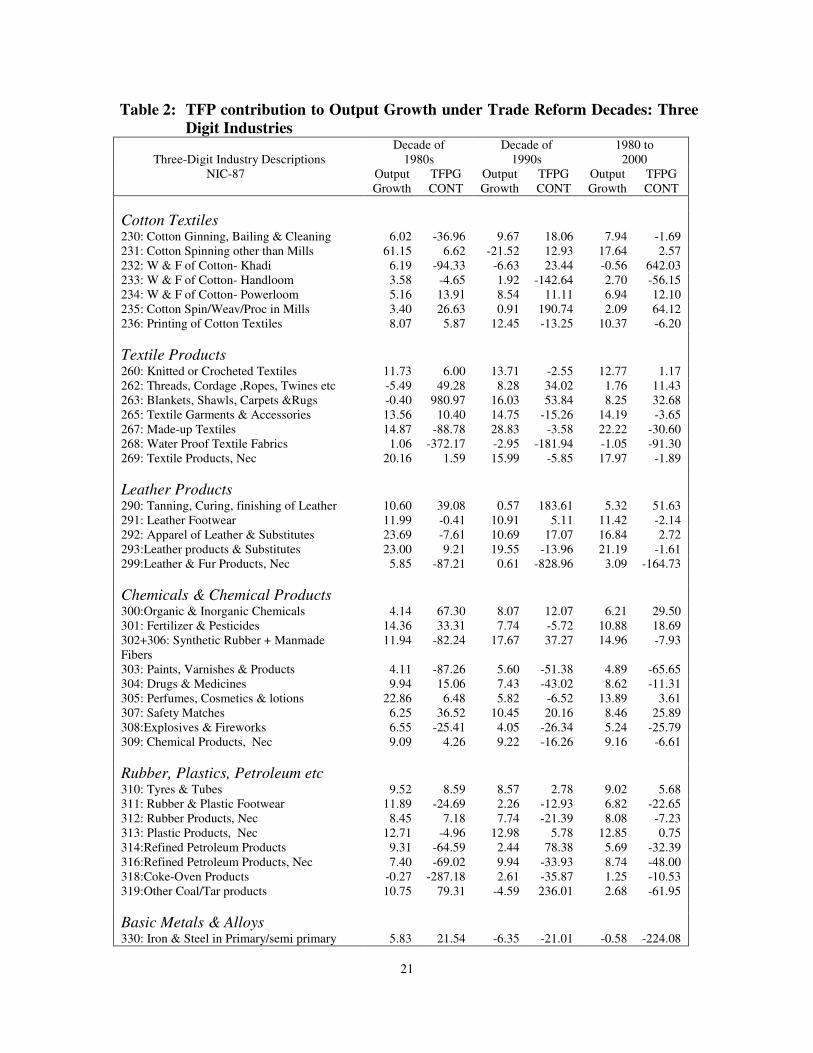
Our empirical estimates based on growth accounting at a detailed level for 75
three-digit industries on one hand and the use-based sectors on the other has clearly
highlighted the TFP growth performance during the phases of trade reform. Table 2
shows the relative contribution of TFP growth and factor input growth in accounting for
the growth of output during the decades of 1980s and 1990s as well as the 20-year period
extending from 1980 till 2000. For all-industries, we note that the contribution of TFP is
insignificant for the period 1980-2000. For the decade of 1980s, the contribution is a low
7 percent per annum whereas for the 1990s, it is insignificant.
Observing the individual three digit industries, we see that the TFP growth
contribution is either negative or very insignificant across the two decades of trade
reforms. For some industries, however the TFP growth contribution to output growth is
substantial. For few industries in each decade, we also record more than 100 percent
contribution from TFP growth. For the period 1980-00, only two industries record TFP
growth contribution of 50 percent or more- weaving and finishing of cotton khadi (232)
and tanning, curing and finishing of leather (290). Most of the machinery goods
industries record low positive TFP contributions.
In conclusion, we see that in most of the industries increases in factor-input
account for the observed growth in output. This holds true across the industries and the
time periods. The TFP contribution also varies across different ranges of output growth.
21
Table 2: TFP contribution to Output Growth under Trade Reform Decades: ThreeDigit Industries
Three-Digit Industry DescriptionsDecade of
1980sDecade of
1990s1980 to
2000 NIC-87 Output
GrowthTFPGCONT
OutputGrowth
TFPGCONT
OutputGrowth
TFPGCONT
Cotton Textiles230: Cotton Ginning, Bailing & Cleaning 6.02 -36.96 9.67 18.06 7.94 -1.69231: Cotton Spinning other than Mills 61.15 6.62 -21.52 12.93 17.64 2.57232: W & F of Cotton- Khadi 6.19 -94.33 -6.63 23.44 -0.56 642.03233: W & F of Cotton- Handloom 3.58 -4.65 1.92 -142.64 2.70 -56.15234: W & F of Cotton- Powerloom 5.16 13.91 8.54 11.11 6.94 12.10235: Cotton Spin/Weav/Proc in Mills 3.40 26.63 0.91 190.74 2.09 64.12236: Printing of Cotton Textiles 8.07 5.87 12.45 -13.25 10.37 -6.20
Textile Products260: Knitted or Crocheted Textiles 11.73 6.00 13.71 -2.55 12.77 1.17262: Threads, Cordage ,Ropes, Twines etc -5.49 49.28 8.28 34.02 1.76 11.43263: Blankets, Shawls, Carpets &Rugs -0.40 980.97 16.03 53.84 8.25 32.68265: Textile Garments & Accessories 13.56 10.40 14.75 -15.26 14.19 -3.65267: Made-up Textiles 14.87 -88.78 28.83 -3.58 22.22 -30.60268: Water Proof Textile Fabrics 1.06 -372.17 -2.95 -181.94 -1.05 -91.30269: Textile Products, Nec 20.16 1.59 15.99 -5.85 17.97 -1.89
Leather Products290: Tanning, Curing, finishing of Leather 10.60 39.08 0.57 183.61 5.32 51.63291: Leather Footwear 11.99 -0.41 10.91 5.11 11.42 -2.14292: Apparel of Leather & Substitutes 23.69 -7.61 10.69 17.07 16.84 2.72293:Leather products & Substitutes 23.00 9.21 19.55 -13.96 21.19 -1.61299:Leather & Fur Products, Nec 5.85 -87.21 0.61 -828.96 3.09 -164.73
Chemicals & Chemical Products300:Organic & Inorganic Chemicals 4.14 67.30 8.07 12.07 6.21 29.50301: Fertilizer & Pesticides 14.36 33.31 7.74 -5.72 10.88 18.69302+306: Synthetic Rubber + ManmadeFibers
11.94 -82.24 17.67 37.27 14.96 -7.93
303: Paints, Varnishes & Products 4.11 -87.26 5.60 -51.38 4.89 -65.65304: Drugs & Medicines 9.94 15.06 7.43 -43.02 8.62 -11.31305: Perfumes, Cosmetics & lotions 22.86 6.48 5.82 -6.52 13.89 3.61307: Safety Matches 6.25 36.52 10.45 20.16 8.46 25.89308:Explosives & Fireworks 6.55 -25.41 4.05 -26.34 5.24 -25.79309: Chemical Products, Nec 9.09 4.26 9.22 -16.26 9.16 -6.61
Rubber, Plastics, Petroleum etc310: Tyres & Tubes 9.52 8.59 8.57 2.78 9.02 5.68311: Rubber & Plastic Footwear 11.89 -24.69 2.26 -12.93 6.82 -22.65312: Rubber Products, Nec 8.45 7.18 7.74 -21.39 8.08 -7.23313: Plastic Products, Nec 12.71 -4.96 12.98 5.78 12.85 0.75314:Refined Petroleum Products 9.31 -64.59 2.44 78.38 5.69 -32.39316:Refined Petroleum Products, Nec 7.40 -69.02 9.94 -33.93 8.74 -48.00318:Coke-Oven Products -0.27 -287.18 2.61 -35.87 1.25 -10.53319:Other Coal/Tar products 10.75 79.31 -4.59 236.01 2.68 -61.95
Basic Metals & Alloys330: Iron & Steel in Primary/semi primary 5.83 21.54 -6.35 -21.01 -0.58 -224.08

22
331:Semi-finished Iron & Steel 2.01 -90.71 17.42 6.19 10.12 -2.94332: Ferro-Alloys 6.20 -49.76 8.33 13.05 7.32 -12.15333:Copper Manufacturing 4.91 -34.70 20.97 31.53 13.36 19.99334:Brass Manufacturing -4.25 87.58 10.87 -25.90 3.71 -87.40335:Aluminium Manufacturing 10.59 28.77 5.48 -5.76 7.90 16.16336: Zinc Manufacturing 3.72 -85.02 5.94 -12.50 4.89 -38.65338+339:Metal Scraps & Non ferrous Metals -0.68 97.11 -2.14 -176.61 -1.45 -115.69
Metal Products340: Fab Structural Metal Products 5.28 -75.81 4.64 -48.09 4.95 -62.12341: Fab Structural Metal Products, Nec 2.42 -94.19 6.66 -31.96 4.65 -47.28342: Furniture & Fixtures -17.79 55.75 21.62 37.03 2.95 -16.43343+349: Hand Tools, Weights Etc 1.78 -53.64 5.79 9.16 3.89 -4.41344+345: Metal Products & Stamping/Forging 25.81 16.26 7.10 -32.94 15.96 4.74346: Metal Kitchen Ware -1.21 42.27 9.41 -20.96 4.38 -29.22
Machinery & Parts350: Agr Machinery, Equipment & Parts 5.52 18.00 8.64 1.59 7.17 7.58351:Constr/Mining Machinery & Equipment 6.66 14.85 1.71 -134.88 4.06 -18.39352: Prime Movers & Boilers 6.08 20.16 0.88 -49.12 3.35 10.52353: Food & Textile Machinery 5.99 19.77 4.12 -45.39 5.00 -8.47354: Other machinery 10.16 28.48 4.04 3.98 6.94 20.97355: Refrigerators & Air conditioners 11.38 11.94 11.41 19.94 11.40 16.16356:Gen Purpose Machinery 7.61 6.96 8.23 -2.42 7.93 1.84357: Machine Tools, Parts & Accessories 5.53 29.73 0.11 775.91 2.68 46.36358: Office & Computing Machines 13.31 33.95 14.46 14.12 13.92 23.10359: Special Purpose Machinery 8.20 27.32 4.39 -5.16 6.20 15.20
Electrical Machinery & Parts360: Electrical Industrial Machinery 6.06 38.69 5.24 -33.59 5.63 3.29361: Wires & Cables 3.93 1.30 8.42 0.29 6.29 0.59362: Cells & Batteries 5.82 45.90 5.82 -15.86 5.82 13.39363+364: Electrical Lamps, Fans & DomesticAppl
7.33 41.86 9.66 34.79 8.55 37.66
365+366: Radio & TV Apparatus 22.07 24.47 10.00 66.84 15.71 38.66368: Electronic Valves &Tubes etc 21.01 23.84 17.32 12.35 19.07 18.35369: X-Ray Machines & Electrical Equip, Nec 13.37 44.25 13.85 43.42 13.62 43.81
Transport Equipment & Parts370: Ships & Boats -2.46 -4.02 11.83 10.80 5.06 14.21371: Locomotives & Parts -4.14 56.26 4.13 27.46 0.21 -238.39372: Wagons & Coaches 4.22 99.58 -21.17 7.10 -9.14 -13.12373+374: Motor Vehicles, Cars & Parts 9.00 12.65 11.54 -6.93 10.34 1.15375: Motorcycles, Scooters & Products 17.98 8.72 9.13 -10.27 13.32 1.87376: Bicycles and Parts 6.67 2.03 8.50 -2.32 7.63 -0.52377: Aircraft & Related Products 10.05 3.83 6.98 37.83 8.43 18.64379: Transport Equipment, Nec 11.04 1.31 3.18 33.94 6.90 9.21
All-Industries 8.54 7.30 7.18 -0.18 7.82 -3.88Notes: All-Industries is a simple average of the 75 three digit industriesSource: Author’s calculation based on the Annual Survey of Industries.

23
Magnitude and Direction of Productivity change
Table 3 presents the TFPG estimates for top-ten three-digit industries in each
trade reform phase. We find that the combined value added shares of the top-ten
industries are around 40 percent or more for each of the three phases of trade reforms.
The following industry groups namely: iron and steel in primary form (330), cotton
spinning in mills (235), organic & inorganic chemicals (300), primary plastics, synthetic
rubber & manmade fibers (302+306), refined petroleum products (314), industrial
electrical machinery (360), drugs and medicines (304) and motor vehicles (373+374) etc
are the major contributors to value added for all the periods. Several industries within the
top-ten value added contributors however record negative TFP growth rates. In the fourth
phase of trade reforms, most industries record TFP growth rates above 1 percent per
annum. Observing the period 1980-2000 in terms of the phases of trade reforms, we find
that TFP growth rates have improved by the end of the 1990s, thereby indicating the
lagged effect of productivity growth. This is consistent with the hypothesis that trade-
reforms impact on productivity performance with a lag.
Chart 1 along with appendix Table A4 shows that for each phase, the maximum
number of industries across the three-use based industry groups falls in the negative TFP
growth range. Further, very few industries have TFP growth rates in excess of 5 percent
under the different phases of trade reforms. For intermediate and capital goods industries,
there is however an increase in the number of industries with TFP growth rates in excess
of 5 percent per annum in the 1990s. For the all-industries group, more than 50 percent of
the industries are below 1 percent TFP growth in each trade regime as evident from
chart1. Comparing the 1980s with the 1990s, we observe that 62 and 48 percent of the
industries recorded positive growth rates of TFP. For the period 1980-00, 41 industries
recorded positive TFP growth accounting for around 39 percent gross value-added share.

24
Table 3: TFPG and Output Growth under Trade Reform Phases: Top Ten Contributors to Value added
Phase-11980-85
Phase-2 1986-90
Phase-3 1991-95
Phase-4 1996-00
MajorContributors
ToValue Added
Top 10
VA1
Share
(%)
TFPG
(%:pa)
OutputGrowth
(%pa)
MajorContributors
ToValue Added
Top 10
VAShare
(%)
TFPG
(%:pa)
OutputGrowth
(%pa)
MajorContributors
ToValue Added
Top 10
VAShare
(%)
TFPG
(%:pa)
OutputGrowth
(%pa)
MajorContributors
ToValue Added
Top 10
VAShare
(%)
TFPG
(%:pa)
OutputGrowth
(%pa)
235 11.3 -1.92 0.38 330 8.8 2.44 9.71 330 9.4 0.53 4.06 330 7.22 1.60 -28.64330 8.3 0.68 14.8 235 6.4 3.50 6.60 235 5.9 -0.71 5.10 302+306 5.15 -0.37 15.19373+374 3.9 2.04 7.58 314 5.7 -5.25 7.42 373+374 4.4 4.84 11.11 301 5.06 1.14 11.78300 3.5 1.16 8.46 373+374 4.4 0.46 10.33 314 4.0 -1.23 -3.26 373+374 4.88 1.14 5.26360 3.5 0.00 1.75 300 3.6 3.85 2.23 360 3.5 -2.36 3.28 314 4.21 9.20 -2.24301 3.4 3.62 11.14 304 3.0 2.79 11.84 301 3.4 -3.05 1.32 235 3.27 5.28 -3.52331 3.2 -3.24 -1.46 331 2.87 -0.09 3.18 300 3.0 -3.48 4.30 304 3.24 1.50 2.50304 3.0 -0.12 7.3 360 2.84 5.56 13.42 304 2.8 -0.35 6.41 360 2.81 2.64 2.49314 1.6 -7.88 12.55 352 2.30 -1.45 -1.76 302+306 2.3 2.36 11.54 300 2.58 6.78 11.19302+306 1.5 1.31 12.16 302+306 1.88 -7.88 0.54 365+366 1.7 2.07 14.63 335 2.55 -1.89 -2.88
Average2 43.23 -0.43 Average 41. 83 -0.39 Average 40.4 3 -0.13 Average 41.03 2.70Notes: 1VA shares for Phases 1, 2, 3 and 4 are for the years 1980-81, 1985-86, 1990-91 and 1995-96 respectively.
2 Simple averages of the top ten industries3 Indicates the total Value-added share of top ten industries
Source: Author’s calculation based on the Annual Survey of Industries and other data sources

25
Chart 1Ranges of Average Annual TFP Growth under various Trade Reform Phases: All Industries
All Industries (1980–85)
54%21%
9%4%
12%
negative
0-1%
1-3%
3-5%
above 5%
All Industries (1986–90)
34%
27%
19%
8%
12%
negative
0-1%
1-3%
3-5%
above 5%
All Industries (1991–95)
43%
24%
9%
16%
8%
negative
0-1%
1-3%
3-5%
above 5%
All Industries (1996–00)
54%17%
7%
13%
9%
negative
0-1%
1-3%
3-5%
above 5%
All Industries (1980s)
38%
23%
11%5%
23%
negative0-1%1-3%3-5%above 5%
All Industries (1990s)
52%23%
3%9%
13%
negative0-1%1-3%3-5%above 5%

26
The appendix Tables A2 and A3 have attempted to classify the three-digit industries
according to ranges of TFP growth rates and levels of protection, as captured by the effective
rate of protection for the 1980s and 1990s. For the 1980s we observe that 43 industries with
54 percent share of total manufacturing value added record positive productivity growth. The
majority of these industries numbering around 34 and a value added share of 40 percent
however have protection level lower than the average ERP (118.53) for the industry. These
industries are mainly from the capital goods sector and comprise the following two-digit
sectors: namely non-electrical machinery (35), electrical machinery (36) and transport
equipment (37). The following industries namely drugs and medicines (304), organic and
inorganic chemicals (300), fertilizer and pesticides (301), chemical products (309), coke oven
(318) and coal and tar products (319) and cotton textiles (231,234,235 and 236) comprise the
rest. The industries with high protection as well as negative TFP growth comprise industries
from the following two-digit categories: textile product (262, 267 and 268), leather and
products (291,292,293, 299), basic chemicals (302+306, 303), rubber et al (311, 313), basic
metals (331) and metal products (340, 341, 342 and 346).
In the 1990s exactly the same number of industries (47) had protection level less than
the average ERP (93.52) for the industry. There was however a decline in the category of
industries with TFP growth rates in the range of 0>TFPG > 2 and lower than average
protection levels. Many more industries were situated in the –2< TFPG < 0 range as
compared to the 1980s. Further, these primarily comprised the capital goods industries (351,
352,353, 356, 359, 360, 372 and 379) along with basic metals (335, 336), chemicals (301,
308, 309) and cotton textiles (232, 236). The industry groups with TFP growth rates higher
than 2 percent in the 1990s numbering around 15 contributed around 5 percent of total
manufacturing value-added share. Further 10 industries had lower than average protection
levels.
Use-based Industry Groups
The use-based classification of manufacturing into capital goods, intermediate goods
and consumer goods allows us to trace the performance of these industries in line with the

27
focus of trade policies within the overall industrialization strategy. Accordingly we have split
the 75 three-digit industries into intermediate goods (30), capital goods (20) and consumer
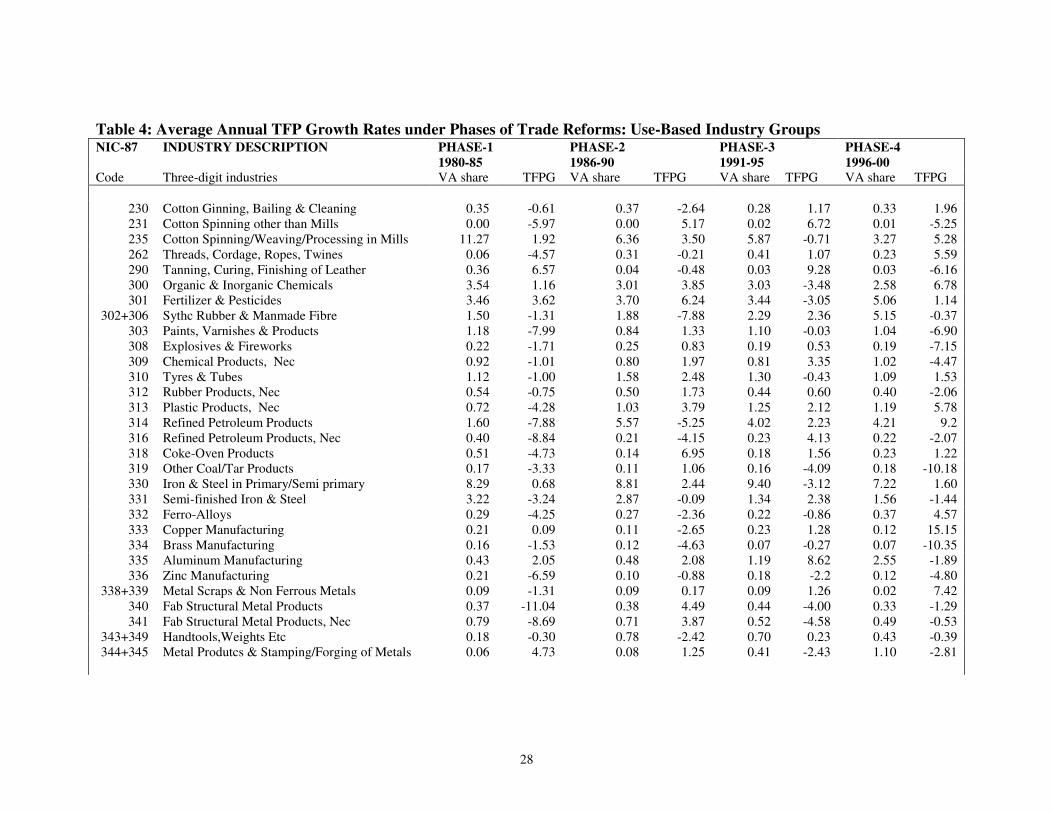
goods (25). The TFP growth rates are documented in Table 4 according to the use-based
industry groups for the four phases of trade reforms. A large number of industries are situated
in the range of zero or negligible growth rates across the use-based sectors and the trade
reform phases. Observing the TFP growth rates, we find that there are wide fluctuations
across the industries as well as the phases of trade reforms for each of the use-based sectors.
Many industries belonging to the three use-based categories record negative TFP
growth in each of the trade reform phases. For the intermediate goods sector 22, 12, 14 and
17 industries contributing around 24, 12, 22 and 15 percent of total manufacturing value
added record negative TFP growth rate. For the capital goods sector, the number of industries
recording negative TFP growth is the largest in the fourth phase of trade reforms. The
consumer goods sector shows a large concentration of industries in the range of 1 to < 5
percent TFP growth.
In case of the intermediate goods sectors, we observe very few industries above 2
percent rate of growth of TFP in each phase. Tanning and curing of leather (290) records the
maximum TFP growth (6.57 percent) in the period 1980-85. In the second phase of trade
reform, we observe 11 industries above TFP growth rate of 2 percent per annum. In the
period of 1990s captured in two phases of trade reforms 1991-95 and 1996-00, we find
marginal decline in the number of industries with TFP growth in excess of 2 percent. Cotton
spinning in mills (235), threads, ropes and cordage (262), organic and inorganic chemicals
(300), plastic products (313) and copper manufacturing (333) are however some of the
industries which record TFP growth rates in excess of 5 percent. The average TFP growth for
the intermediate goods sector remained either zero or negative for all the four phases of trade
reforms.
28
Table 4: Average Annual TFP Growth Rates under Phases of Trade Reforms: Use-Based Industry GroupsNIC-87 INDUSTRY DESCRIPTION PHASE-1
1980-85PHASE-21986-90
PHASE-31991-95
PHASE-41996-00
Code Three-digit industries VA share TFPG VA share TFPG VA share TFPG VA share TFPG
230 Cotton Ginning, Bailing & Cleaning 0.35 -0.61 0.37 -2.64 0.28 1.17 0.33 1.96231 Cotton Spinning other than Mills 0.00 -5.97 0.00 5.17 0.02 6.72 0.01 -5.25235 Cotton Spinning/Weaving/Processing in Mills 11.27 1.92 6.36 3.50 5.87 -0.71 3.27 5.28262 Threads, Cordage, Ropes, Twines 0.06 -4.57 0.31 -0.21 0.41 1.07 0.23 5.59290 Tanning, Curing, Finishing of Leather 0.36 6.57 0.04 -0.48 0.03 9.28 0.03 -6.16300 Organic & Inorganic Chemicals 3.54 1.16 3.01 3.85 3.03 -3.48 2.58 6.78301 Fertilizer & Pesticides 3.46 3.62 3.70 6.24 3.44 -3.05 5.06 1.14
302+306 Sythc Rubber & Manmade Fibre 1.50 -1.31 1.88 -7.88 2.29 2.36 5.15 -0.37303 Paints, Varnishes & Products 1.18 -7.99 0.84 1.33 1.10 -0.03 1.04 -6.90308 Explosives & Fireworks 0.22 -1.71 0.25 0.83 0.19 0.53 0.19 -7.15309 Chemical Products, Nec 0.92 -1.01 0.80 1.97 0.81 3.35 1.02 -4.47310 Tyres & Tubes 1.12 -1.00 1.58 2.48 1.30 -0.43 1.09 1.53312 Rubber Products, Nec 0.54 -0.75 0.50 1.73 0.44 0.60 0.40 -2.06313 Plastic Products, Nec 0.72 -4.28 1.03 3.79 1.25 2.12 1.19 5.78314 Refined Petroleum Products 1.60 -7.88 5.57 -5.25 4.02 2.23 4.21 9.2316 Refined Petroleum Products, Nec 0.40 -8.84 0.21 -4.15 0.23 4.13 0.22 -2.07318 Coke-Oven Products 0.51 -4.73 0.14 6.95 0.18 1.56 0.23 1.22319 Other Coal/Tar Products 0.17 -3.33 0.11 1.06 0.16 -4.09 0.18 -10.18330 Iron & Steel in Primary/Semi primary 8.29 0.68 8.81 2.44 9.40 -3.12 7.22 1.60331 Semi-finished Iron & Steel 3.22 -3.24 2.87 -0.09 1.34 2.38 1.56 -1.44332 Ferro-Alloys 0.29 -4.25 0.27 -2.36 0.22 -0.86 0.37 4.57333 Copper Manufacturing 0.21 0.09 0.11 -2.65 0.23 1.28 0.12 15.15334 Brass Manufacturing 0.16 -1.53 0.12 -4.63 0.07 -0.27 0.07 -10.35335 Aluminum Manufacturing 0.43 2.05 0.48 2.08 1.19 8.62 2.55 -1.89336 Zinc Manufacturing 0.21 -6.59 0.10 -0.88 0.18 -2.2 0.12 -4.80
338+339 Metal Scraps & Non Ferrous Metals 0.09 -1.31 0.09 0.17 0.09 1.26 0.02 7.42340 Fab Structural Metal Products 0.37 -11.04 0.38 4.49 0.44 -4.00 0.33 -1.29341 Fab Structural Metal Products, Nec 0.79 -8.69 0.71 3.87 0.52 -4.58 0.49 -0.53
343+349 Handtools,Weights Etc 0.18 -0.30 0.78 -2.42 0.70 0.23 0.43 -0.39344+345 Metal Produtcs & Stamping/Forging of Metals 0.06 4.73 0.08 1.25 0.41 -2.43 1.10 -2.81

29
Intermediate goods sectorMean1 42.225 -1.26 41.50 1.17 39.84 -0.39 40.81 1.76Standard Deviation2 3.23 3.82 2.19 4.12Coefficient of Variation3 -256 327 -561 233Correlation Coefficient4 0.04 -0.34 -0.43 0.05
350 Agr Machinery, Equipment & Parts 0.82 1.11 0.80 1.76 0.88 1.41 0.78 -2.78351 Const /Mining Machines & Equipment 0.68 -1.13 0.52 1.25 0.37 -1.16 0.28 -2.24352 Prime Movers & Boilers 1.32 2.71 2.30 -1.45 0.95 0.51 1.13 -0.54353 Food & Textile Machinery 1.39 -1.76 0.93 4.04 0.91 2.20 0.97 -7.61354 Other Machinery 0.43 2.81 0.41 0.99 0.69 -0.54 0.33 2.84356 General Purpose Machinery 1.48 0.66 1.52 0.84 1.55 1.76 1.54 -3.37357 Machine tools, Parts & Accessories 0.86 4.66 1.10 -1.75 0.60 2.38 0.61 -0.71358 Office & Computing Machines 0.13 3.78 0.16 4.04 0.08 2.01 0.05 2.99359 Special Purpose Machinery 0.34 2.66 0.36 0.95 0.32 6.08 0.63 -7.63360 Electrical Industrial Machinery 3.51 0.00 2.84 5.56 3.48 -2.36 2.81 -3.13361 Wires & Cables 1.26 -1.49 0.67 1.33 0.95 -1.81 0.97 2.64362 Cells & Batteries 0.46 0.44 0.38 2.69 0.35 7.85 0.57 -10.01
365+366 Radio & TV Apparatus 0.98 5.49 1.54 3.31 1.75 2.07 1.54 15.28368 Electronic Valves &Tubes etc 0.13 2.30 0.17 5.76 0.27 3.98 0.41 1.56369 X-ray Mach & Electrical Equipment Nec 0.15 3.14 0.15 5.62 0.15 6.94 0.22 8.71370 Ships & Boats 0.82 -2.78 0.23 2.36 0.15 3.57 0.22 -0.53371 Locomotives & Parts 1.16 -7.80 0.19 -0.32 0.21 -0.43 0.18 8.29372 Wagons & Coaches 1.36 2.94 1.33 4.98 1.10 -0.68 0.60 -3.36377 Aircraft & Related Products 0.19 1.13 0.16 0.87 0.13 7.27 0.26 -4.12379 Transport Equipment NEC 0.13 -2.02 0.07 2.05 0.15 5.27 0.16 -3.61
Capital goods sectorMean1 17.605 0.34 15.83 2.23 15.04 0.62 14.26 -0.51Standard Deviation2 3.06 2.59 2.56 6.50Coefficient of Variation3 904 116 416 -1270Correlation Coefficient4 0.16 0.09 -0.23 0.13
232 W& F of Cotton Khadi 0.01 6.63 0.03 -13.91 0.01 -13.51 0.01 -5.84233 W & F of Cotton- Handloom 0.05 3.94 0.04 -5.82 0.02 0.47 0.03 -0.17234 W & F of Cotton- Powerloom 0.10 3.12 0.10 -3.46 0.08 7.65 0.15 0.72
30
236 Printing of Cotton Textiles 0.39 0.58 0.41 -0.17 0.33 -0.76 0.23 0.47260 Knitted or Crochted Textiles 0.18 -0.70 0.24 2.38 0.35 -0.91 0.49 0.70263 Blankets, Shawls, Carpets &Rugs 0.10 -2.20 0.06 -0.17 0.09 -1.14 0.05 -3.90265 Textile Garments & Accessories 0.41 -1.48 0.45 2.91 1.04 -1.89 1.79 1.41267 Made-Up Textiles 0.01 -29.80 0.01 4.49 0.01 1.53 0.04 -13.21268 Water Proof Textile Fabrics 0.09 -9.71 0.05 4.63 0.05 -1.60 0.05 -3.93269 Textile Products, Nec 0.03 0.00 0.02 -2.22 0.03 -0.01 0.05 0.32291 Leather Footwear 0.26 1.42 0.30 -2.16 0.40 2.18 0.31 -0.05292 Apparel of Leather & Substitutes 0.01 -5.90 0.02 1.50 0.08 6.69 0.08 -1.80293 Leather Products & Substitutes 0.00 0.05 0.01 2.27 0.04 7.09 0.12 2.12299 Leather & Fur Products, Nec 0.00 -10.22 0.00 -0.06 0.01 -7.41 0.01 -5.10304 Drugs & Medicines 3.00 -0.12 3.03 2.79 2.79 -0.35 3.24 1.50305 Perfumes, Cosmetics & lotions 0.67 -1.31 0.60 4.57 1.12 -1.59 0.87 1.48307 Safety Matches 0.24 2.40 0.21 1.96 0.10 6.67 0.11 2.28311 Rubber and Plastic Footwear 0.14 -0.78 0.12 0.06 0.56 -5.11 0.12 -0.06342 Furniture & Fixtures 0.34 0.08 0.30 -17.44 0.03 11.91 0.04 -9.92346 Metal Kitchen Ware 0.31 2.22 0.23 -4.00 0.15 -3.55 0.16 -0.51355 Refrigerators & Air conditioners 0.77 1.90 0.75 -0.64 0.09 1.23 0.33 1.36
363+364 Electric Lamps, & Domestic Appliances 0.66 2.93 0.65 2.90 0.59 3.54 0.45 3.07373+374 Motor vehicles, Cars & Relative Prods 3.93 2.04 4.38 0.46 4.35 4.84 4.88 1.14
375 Motor cycles, Scooters & Products 0.52 -0.08 0.85 3.83 1.28 1.92 1.50 1.57376 Bicycles and Parts 0.29 -1.63 0.26 3.42 0.40 0.44 0.31 0.14
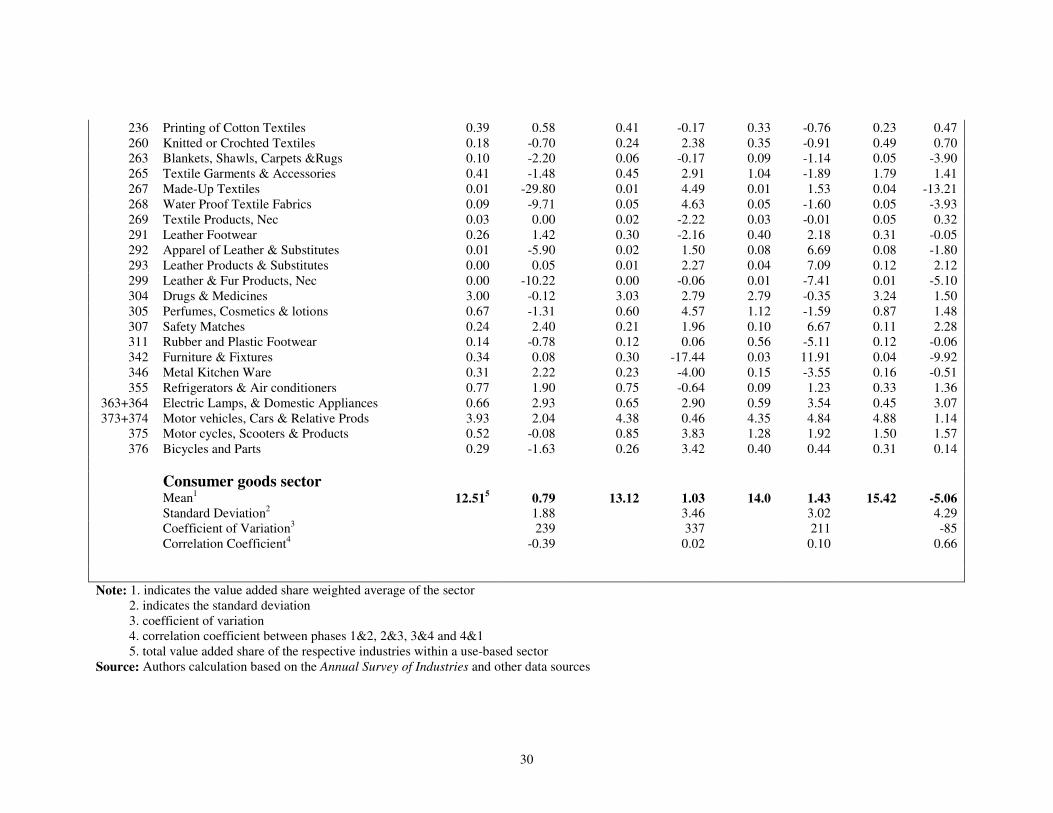
Consumer goods sectorMean1 12.515 0.79 13.12 1.03 14.0 1.43 15.42 -5.06Standard Deviation2 1.88 3.46 3.02 4.29Coefficient of Variation3 239 337 211 -85Correlation Coefficient4 -0.39 0.02 0.10 0.66
Note: 1. indicates the value added share weighted average of the sector 2. indicates the standard deviation 3. coefficient of variation 4. correlation coefficient between phases 1&2, 2&3, 3&4 and 4&1 5. total value added share of the respective industries within a use-based sectorSource: Authors calculation based on the Annual Survey of Industries and other data sources

31
The capital goods sector comprises 3-digit industries from the following two-digit
sectors, namely non-electrical machinery and parts (35), electrical machinery (36) and
transport equipment (37). This sector accounts for around 18 percent of manufacturing
value added and records TFP growth an average TFP growth of more than 2 percent in
the second and third periods of trade reforms. Two industry groups namely electronic
valve and tubes (386) and x-ray machines and other electronic equipment (369) record
TFP growth rates above the average consistently for each of the periods of trade reforms.
The 25 industries listed under the consumer goods industries account for around
12-15 percent of the total manufacturing value added for the phases of trade reforms.
More than half the industries record TFP growth rates in the ranges of either zero or
negligible (0 <TFPG< 1%) in each of the four phases of trade reforms. The number of
industries with TFP growth rates in excess of 2 percent per annum is the highest for the
second phase of trade reforms. The average TFP growth rate for each of the four phases
of trade reforms is negligible or negative. For the period 1980-2000, we observe only
four industry groups namely, blankets et.al. (263), safety matches (307), electrical lamps
et al (363+364) and motor vehicles et al (373+374) to record TFP growth rates in the
range of 2-6 percent per annum.
Chart 2 presents the comparative productivity growth profile for the use-based
sectors in the 1980s and 1990s. Observing the intermediate goods sector, we find that for
some industries [cotton weaving (230), threads et al (262), synthetic and manmade fibers
(3032+306), refined petroleum products (314), iron and steel (331), ferro-alloys (332),
copper manufacturing (333), metal scraps et al (338+339)] there is a switch from negative
TFP growth to large positive growth rates in the 1990s. There is however no change in
the average TFP growth rate for this sector in the 1990s when compared to the 1980s.
For capital goods sector, we find that only for one industry group [locomotives and parts
(371)], there is a change from negative to positive TFP growth rates. The average TFP
growth rates for the capital goods sector declines in the 1990s from a growth rate of over
2 percent in the 1980s. For consumer goods industries we however find three industry
groups namely blankets et al (263), water proof textiles (268) and furniture and fixtures

32
of metals (342) recording large jumps in TFP growth rates between 1980s and 1990s. In
the case of the consumer goods industries, we find that there is a marginal improvement
in the average TFP growth rate for the 1990s as compared to the 1980s.
Comparing the three use based sectors, we find that only for four industry groups,
there is further improvement in the 1990s from an already positive TFP growth scenario
in the 1980s [radio and TV apparatus (365+366), x-ray machines and other equipment
(369), refrigerators and air-conditioners (355) and electrical lamps et al (363+364)].

33
Chart 2TFP Growth in 1980s and 1990s: Use-based Industries
Intermediate Good Industries
Capital Goods Industries
Consumer Goods Industries
-12
-10
-8
-6
-4
-2
0
2
4
6
8
10
230
231
235
262
290
300
302+
306
301
303
308
309
310
312
313
314
316
318
319
330
331
332
333
334
335
336
338+
339
340
341
343+
349
344+
345
Industry Code
TFPG (%)
80s 90s
-3
-2
-1
0
1
2
3
4
5
6
7
350
351
352
353
354
356
357
358
359
360
361
362
365+
366
366
369
370
371
372
377
379
Industry Code
TFPG (%)
80s 90s
-14
-12
-10
-8
-6
-4
-2
0
2
4
6
8
10
232
233
234
236
260
263
265
267
268
269
291
292
293
299
304
305
307
311
342
346
355
363+
64
373+
74 375
376
Industry Code
TFPG (%)
80s 90s

34
5. Conclusion
Using data from the Annual Survey of Industries, total factor productivity growth
rates have been computed for the period from 1980-81 to 1999-00 and for the four sub-
periods corresponding to the 4 phases of trade reforms. Our results at the three-digit level
of disaggregation indicate TFP growth of 0.08 percent per annum averaged over 75 three-
digit industries for the entire period. The standard deviation and coefficient of variation
both show considerable variations in TFP growth. The TFP growth rates for individual
industries are either negative or in the 0 to 2 percent range. The capital goods sector is the
only one to register a positive growth (1.39 percent per annum) throughout the period, the
intermediate and consumer goods sectors both record negative growth in TFP during the
entire period. The performance of the capital goods sector suggests that easing of
quantitative restrictions on imports of machinery and spare parts has introduced external
competition in the capital goods industries resulting in an improvement in productivity
growth.
Comparison across the phases of trade reform shows that in all the three use-
based sectors, TFP growth performance is best either in the third phase (1991-95) [capital
as well as consumer goods sector] or the second phase (1986-90) [intermediate goods
sector]. The second phase of trade liberalization coincided with the announcement of a
three-year import-export policy complementing some of the industrial policy reforms. An
increasing number of capital goods and intermediates and raw materials were added to
the open general licensing lists. Replacement of quantitative restrictions by tariffs
however led to an increase in the tariff rates. Further, the period was also marked by
unsustainable fiscal expansion leading to demand and capacity utilization and resultantly
productivity growth. The TFP growth in the 1990s is found to be lower than in the
1980s. In addition, for all three use-based sectors, the TFP growth in the second half of
the 1990s (1996-00) is lower than the first half of the 1990s (1991-95).
Our results indicate that productivity performance seemed to worsen as the pace
of trade reform gathered momentum. This is evident from the TFP growth recorded by

35
the industries in successive phases of trade reform. The experience of the eighties on the
productivity front seemed to have provided assurance of the potential that existed from
reforms in trade and industrial policy. Our result suggests that this was misplaced. We
observe that there is a marked fall in the growth rate of TFP in Indian manufacturing in
the 1990s as compared to the 1980s. Further this is corroborated by several studies
covering the period of 1990s [Trivedi et al. (2000), Srivastava (2000), Balakrishnan et al
2000), Goldar (2000) and Banga (2003)].
The worsening of TFP growth rate in the 1990s for a vast majority of industries
seems perplexing, as this was the phase when substantial and far-reaching trade reforms
encompassing the lowering of both tariff and non-tariff barriers were initiated. Two
possible explanations for the slow down in TFP growth may be offered. First industrial
production in the years 1990-91 and 1991-92 was constrained by factors like import
compression, tight-money policy, inflationary pressures and fiscal contraction initiated by
the government as part of the macroeconomic stabilization programs. These led to a
recessionary trend in the manufacturing sector. Second, Mergers began to pick up only
towards the end of the 1995 and constraints operate in the functioning of the labor
markets, particularly the exit policies that ought to supplement the trade liberalization
attempts. In addition, it should be noted that available evidence from various countries
shows that the beneficial impact of trade liberalization on productivity can take
considerable time to show up after structural adjustment and industrial restructuring has
taken place. This needs to be explored in future research.

36
Appendix
Table A1: Sample Industries and Value added Shares: Three-digit IndustrialClassification
CodeNIC87
Three-Digit IndustriesDescription 1980-81 1985-86 1990-91 1995-96
23 Cotton Textile 16.83 10.31 9.54 4.03230 Cotton Ginning, Bailing & Cleaning 0.35 0.37 0.28 0.33231 Cotton Spinning other than Mills 0.00 0.00 0.02 0.01232 W& F of Cotton Khadi 0.01 0.03 0.01 0.01233 W & F of Cotton- Handloom 0.05 0.04 0.02 0.03234 W & F of Cotton- Powerloom 0.10 0.10 0.08 0.15235 Cotton Spin/Weav/Proc in Mills 11.27 6.36 5.87 3.27236 Printing of Cotton Textiles 0.39 0.41 0.33 0.23
26 Textile Products 1.21 1.20 2.31 2.48260 Knitted or Crochted Textiles 0.18 0.24 0.35 0.49262 Threads, Cordage,Ropes,Twines etc 0.06 0.04 0.03 0.03263 Blankets, Shawls, Carpets &Rugs 0.10 0.06 0.09 0.05265 Textile Garments & Accessories 0.41 0.45 1.04 1.79267 Made-Up Textiles 0.01 0.01 0.01 0.04268 Water Proof Textile Fabrics 0.09 0.05 0.05 0.05269 Textile Products, Nec 0.03 0.02 0.03 0.05
29 Leather and Leather Products 0.89 0.90 1.37 0.75290 Tanning, Curing, Finishing of Leather 0.36 0.31 0.41 0.23291 Leather Footwear 0.26 0.30 0.40 0.31292 Apparel of Leather & Substitutes 0.01 0.02 0.08 0.08293 Leather Products & Substitutes 0.00 0.01 0.04 0.12299 Leather & Fur Products, Nec 0.00 0.00 0.01 0.01
30 Chemicals and Chemical Products 20.37 20.98 21.40 19.26300 Organic & Inorganic Chemicals 3.54 3.61 3.03 2.58301 Fertlizer & Pesticides 3.46 3.70 3.44 5.06
302+306 SyntheticRubber & Manmade Fibre 1.50 1.88 2.29 5.15303 Paints, Varnishes & Products 1.18 0.84 1.10 1.04304 Drugs & Medicines 3.00 3.03 2.79 3.24305 Perfumes, Cosmetics & Lotions 0.67 0.60 1.12 0.87307 Safety Matches 0.24 0.21 0.10 0.11308 Explosives & Fireworks 0.22 0.25 0.19 0.19309 Chemical Products, Nec 0.92 0.80 0.81 1.02
31 Rubber,Plastics,Petroleum etc 7.18 13.05 11.72 7.64310 Tyres & Tubes 1.12 1.58 1.30 1.09311 Rubber & Plastic Footwear 0.14 0.12 0.56 0.12312 Rubber Products, Nec 0.54 0.50 0.44 0.40313 Plastic Products, Nec 0.72 1.03 1.25 1.19314 Refined Petroleum Products 1.60 5.57 4.02 4.21316 Refined Petroleum Products, Nec 0.40 0.21 0.23 0.22318 Coke-Oven Products 0.51 0.14 0.18 0.23319 Other Coal/Tar Products 0.17 0.11 0.16 0.18

37
33 Basic Metals and Alloys 17.84 18.08 18.32 12.03330 Iron & Steel in Primary/Semiprimary 8.29 8.81 9.40 7.22331 Semi-finished Iron & Steel 3.22 2.87 1.34 1.56332 Ferro-Alloys 0.29 0.27 0.22 0.37333 Copper Manufacturing 0.21 0.11 0.23 0.12334 Brass Manufacturing 0.16 0.12 0.07 0.07335 Aluminium Manufacturing 0.43 0.48 1.19 2.55336 Zinc Manufacturing 0.21 0.10 0.18 0.12
338+339 Metal Scraps & Non Ferrous Metals 0.09 0.09 0.09 0.02
34 Metal Products 2.85 3.49 3.25 2.53340 Fab Structural Metal Products 0.37 0.38 0.44 0.33341 Fab Structural Metal Products, Nec 0.79 0.71 0.52 0.49342 Furniture & Fixtures 0.34 0.30 0.03 0.04
343+349 HandTools, Weights ,Etc 0.18 0.78 0.70 0.43344+345 Metal Prods & Stamping/Forging of metals 0.06 0.08 0.41 1.10
346 Metal Kitchen Ware 0.31 0.23 0.15 0.16
35 NonElectrical Machinery and Parts 11.35 12.46 10.02 6.95350 Agr Machinery, Equipments & Parts 0.82 0.80 0.88 0.78351 Constr/Mining Machines & Equipment 0.68 0.52 0.37 0.28352 Prime Movers & Boilers 1.32 2.30 0.95 1.13353 Food & Textile Machinery 1.39 0.93 0.91 0.97355 Refrigerators & Air conditioners 0.77 0.75 0.69 0.33354 Other machinery 0.43 0.41 0.61 0.62356 General Purpose Machinery 1.48 1.52 1.55 1.54357 Machine Tools, Parts & Accessories 0.86 1.10 0.60 0.61358 Office & Computing Machines 0.13 0.16 0.08 0.05359 Special Purpose Machinery 0.34 0.36 0.32 0.63
36 Electrical Machinery and Parts 9.88 9.00 10.87 6.97360 Electrical Industrial Machinery 3.51 2.84 3.48 2.81361 Wires & Cables 1.26 0.67 0.95 0.97362 Cells & Batteries 0.46 0.38 0.35 0.57
363+364 Electric Lamps, Fans & Domestic Appliances 0.66 0.65 0.59 0.45365+366 Radio & TV Apparatus 0.98 1.54 1.75 1.54
368 Electronic Valves &Tubes etc 0.13 0.17 0.27 0.41369 X-Ray Machines & Electrical Equipment ,Nec 0.15 0.15 0.15 0.22
37 Transport Equipment and Parts 11.61 10.53 11.20 8.10370 Ships & Boats 0.82 0.23 0.15 0.22371 Locomotives & Parts 1.16 0.19 0.21 0.18372 Wagons & Coaches 1.36 1.33 1.10 0.60
373+374 Motor Vehicles, Cars & Products 3.93 4.38 4.35 4.88375 Motorcycle, Scooter & Products 0.52 0.85 1.28 1.50376 Bicycles & Parts 0.29 0.26 0.40 0.31377 Aircraft & Related Products 0.19 0.16 0.13 0.26379 Transport Equipment, Nec 0.13 0.07 0.15 0.16
All- Industries 72.33 71.05 69.51 70.75Notes: 1.Value-added share represents share in total manufacturing gross value added 2.Sectors share is computed as the sum of individual industries share in sample manufacturing gross value-addedSource: Author’s calculation based on the Annual Survey of Industries

38
Table A2: Distribution of 3 digit industries by TFP growth and Protection level: The decade of 1980sProtection TFPG< -2.00 -2.00<TFPG<0.00 0.00<TFPG<2.00 TFPG >2.00 Total
ProtectionLevel HigherthanAVG ERP(> 118.53)
262 (0.03)267 (0.02)268 (0.06)293 (0.04)299 (0.01)302+306 (2.29)303 (1.10)311 (0.57)340 (0.44)341 (0.53)342 (0.04)
(11)5.13
291 (0,41)292 (0.08)(1.25)331 (1.35)346 (0.15)
(5) 3.24
260 (0.35)265 (1.04)269 (0.03)305 (1.12)310 (1.30)312 (0.44)330 (9.40)
(7) 13.68
290 (0.41)362 (0.35)
(2) 0.76 (25) 22.81
ProtectionLevel LowerthanAVG ERP(<118.53)
230 (0.28)232 (0.01)263 (0.09)314 (4.02)316 (0.23)332 (0.22)336 (0.18)371 (0.21)
(8) 5.24
233 (0.02)308 (0.19)333 (0.23)338+339 (0.09)343+349 (0.70)
(5) 1.23
234 (0.09)235 (5.87)236 (0.33)304 (2.79)309 (0.82)318 (0.18)350 (0.88)351 (0.37)352 (0.95)353 (0.91)355 (0.61)356 (1.55)357 (0.60)361 (0.96)370 (0.16)373+374 (4.35)375 (1.28)376 (0.40)377 (0.30)379 (0.15)
(20) 23.55
231 (0.02)300 (3.03)301 (3.44)319 (0.10)335 (1.19)354 (0.69)358 (0.08)359 (0.32)360 (3.48)363+364 (0.59)365+366 (1.75)368 (0.28)369 (0.15)372 (1.10)
(14) 16.22 (47) 46.24Total (19) 10.37 (10) 4.47 (27) 37.23 (16) 16.98 (72) 69.05
Note: The average ERP is computed from industry-wise ERPs for the period 1980-81 to 1989-90, See Das (2002b)Source: Authors Calculations
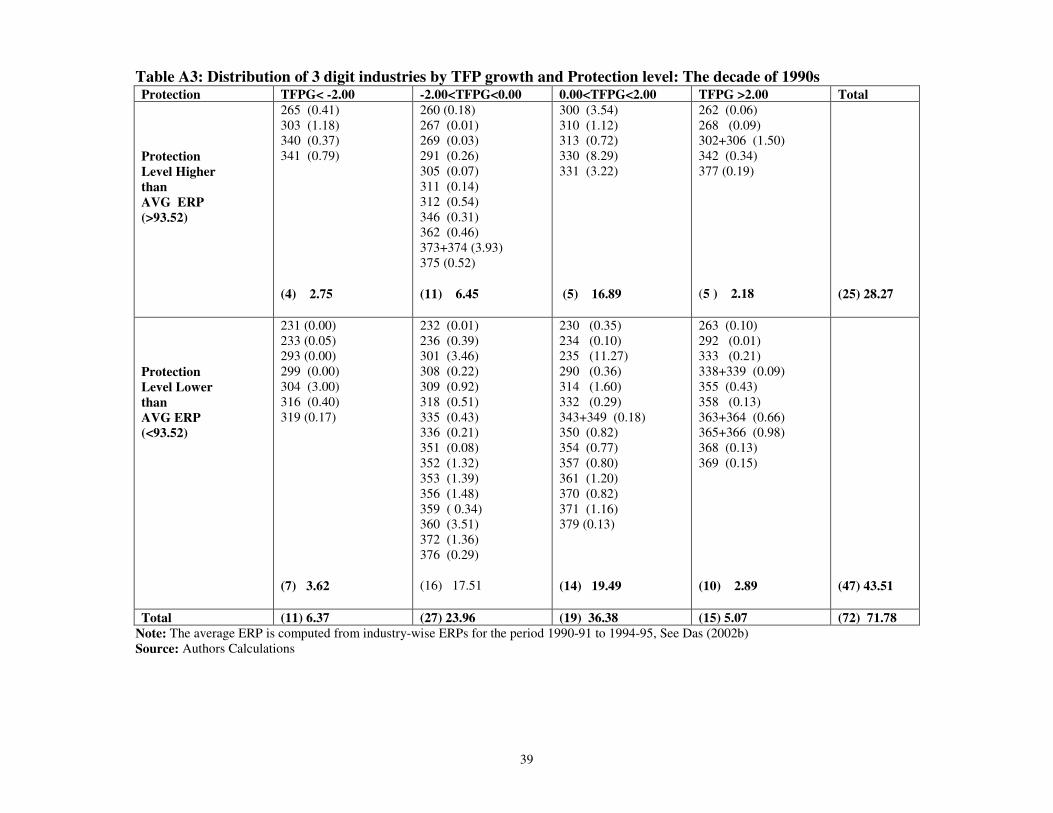
39
Table A3: Distribution of 3 digit industries by TFP growth and Protection level: The decade of 1990sProtection TFPG< -2.00 -2.00<TFPG<0.00 0.00<TFPG<2.00 TFPG >2.00 Total
ProtectionLevel HigherthanAVG ERP(>93.52)
265 (0.41)303 (1.18)340 (0.37)341 (0.79)
(4) 2.75
260 (0.18)267 (0.01)269 (0.03)291 (0.26)305 (0.07)311 (0.14)312 (0.54)346 (0.31)362 (0.46)373+374 (3.93)375 (0.52)
(11) 6.45
300 (3.54)310 (1.12)313 (0.72)330 (8.29)331 (3.22)
(5) 16.89
262 (0.06)268 (0.09)302+306 (1.50)342 (0.34)377 (0.19)
(5 ) 2.18 (25) 28.27
ProtectionLevel LowerthanAVG ERP(<93.52)
231 (0.00)233 (0.05)293 (0.00)299 (0.00)304 (3.00)316 (0.40)319 (0.17)
(7) 3.62
232 (0.01)236 (0.39)301 (3.46)308 (0.22)309 (0.92)318 (0.51)335 (0.43)336 (0.21)351 (0.08)352 (1.32)353 (1.39)356 (1.48)359 ( 0.34)360 (3.51)372 (1.36)376 (0.29)
(16) 17.51
230 (0.35)234 (0.10)235 (11.27)290 (0.36)314 (1.60)332 (0.29)343+349 (0.18)350 (0.82)354 (0.77)357 (0.80)361 (1.20)370 (0.82)371 (1.16)379 (0.13)
(14) 19.49
263 (0.10)292 (0.01)333 (0.21)338+339 (0.09)355 (0.43)358 (0.13)363+364 (0.66)365+366 (0.98)368 (0.13)369 (0.15)
(10) 2.89 (47) 43.51
Total (11) 6.37 (27) 23.96 (19) 36.38 (15) 5.07 (72) 71.78Note: The average ERP is computed from industry-wise ERPs for the period 1990-91 to 1994-95, See Das (2002b)Source: Authors Calculations

40
Table A4: Distribution of Use-Based Industries by TFPG under Trade Reform Phases
TFP GrowthIntermediate
GoodsCapitalGoods
ConsumerGoods
All- Industries
Phase-1: 1980-85TFPG Range N VAS N VAS N VAS N VASNegative 22 24.36 6 5.43 12 5.42 40 35.210- 1 percent 2 8.50 3 5.45 4 0.77 9 14.721-3 percent 3 5.48 7 4.93 6 5.84 16 16.253-5 percent 2 3.53 3 1.13 2 0.15 7 4.81Above 5 percent 1 0.36 1 0.98 1 0.01 3 1.35Total 30 42.2 20 17.9 25 12.1 75 72.33
Phase-2: 1986-90TFPG Range N VAS N VAS N VAS N VASNegative 12 12.63 3 3.60 11 1.86 26 18.090- 1 percent 2 0.34 4 2.79 3 4.53 9 7.661-3 percent 8 13.2 6 2.66 6 4.58 20 20.443-5 percent 5 12.09 4 3.97 5 1.77 14 17.83Above 5 percent 3 3.84 3 3.16 0 0.00 6 7.00Total 30 42.11 20 16.18 25 12.77 75 71.05
Phase-3: 1991-95 TFPG Range N VAS N VAS N VAS N VASNegative 14 22.45 6 6.81 12 6.53 32 35.790- 1 percent 3 10.45 1 0.91 2 0.42 6 11.781-3 percent 8 4.8 6 4.60 4 2.31 18 11.713-5 percent 3 1.62 2 0.43 2 6.10 7 8.15Above 5 percent 2 0.43 5 1.10 5 0.35 12 1.88Total 30 39.75 20 13.85 25 15.71 75 69.31
Phase-4: 1996-00 TFPG Range N VAS N VAS N VAS N VASNegative 17 15.08 13 10.55 11 0.88 40 26.510- 1 percent 1 1.09 0 0 6 1.56 7 2.651-3 percent 4 12.83 1 2.05 7 12.51 13 27.393-5 percent 1 0.37 3 0 1 0.45 5 0.82Above 5 percent 7 11.42 3 1.94 0 0.00 10 13.36Total 30 40.80 20 14.55 25 15.40 75 70.75
Notes: 1. For each 3-digit industry group, TFP growth is the average of the year to year annual ratesof growth over the specified period.
2. VAS stands for share of the 3-digit industry in total manufacturing gross value-added 3. N stands for the number of 3-digit industry groups in each categorySources: Authors calculation based on the Annual Survey of Industries and other data sources

41
References
Ahluwalia, I.J. (1985), Industrial Growth in India. Stagnation since the Mid-Sixties,Oxford University Press, Delhi.
Ahluwalia, I.J. (1991), Productivity and Growth in Indian Manufacturing, OxfordUniversity Press, Delhi.
Ahluwalia, I.J. (1994), 'The Role of Trade Policy in Indian Industrialization' inHelleiner, G.K (ed.) Trade Policy and Industrialization in Turbulent Times,Routledge, London and New York.
Alexander, P.C. (1977), Report of the Committee on Import-Export Policies andProcedures, Ministry of Commerce, Government of India.
Balakrishnan, P. and K. Pushpangadan (1994), 'Total Factor Productivity Growth inManufacturing Industry: A Fresh Look', Economic and Political Weekly, July30, 2028-2035.
Balakrishnan, P., K.Pushpangadan and M. Suresh Babu (2000), 'Trade Liberalizationand Productivity growth in Manufacturing: Evidence from Firm Level PanelData' Economic and Political Weekly, October 7, 3679-3682.
Banga, R (2003), The Nature, pattern and Impact of Japanese and U.S. Foreign DirectInvestments in Indian Manufacturing, Unpublished Ph.D. Dissertation, DelhiSchool of Economics, University of Delhi, March.
Bhagwati, J.N. (1988), 'Export-Promoting Trade Strategies-Issues and Evidence,'World Bank Research Observer, 3(1), 27-57.
Chadha, R. (2000), 'The Decade of India's Economic Transformation: ImpactAnalysis of Unilateral and Global Changes in Trade Policy,' Paper presentedat the Conference to Honour Professor K.L.Krishna, Centre for DevelopmentEconomics, Delhi School of Economics, Dec 20-22.
Chelliah, R.J. (1992), Tax Reforms Committee: Final Report, Parts 1 & 2,Government of India.
Crafts, N. (1992), 'Productivity Growth Reconsidered,' Economic Policy, 15, October,387-414.
Crafts, N. (1993), 'Can De-industrialization Seriously Damage your Wealth?', HobartPaper # 120, Institute of Economic Affairs, London.
Das, D.K. (2001), Some Aspects of Productivity Growth and Trade in IndianIndustry, Unpublished Ph.D. Dissertation, Delhi School of Economics,University of Delhi, November.

42
Das, D.K. (2002a), 'Trade Liberalization and Industrial Productivity: An Assessmentof Developing Country Experiences' Working Paper #77, Indian Council forResearch on International Economic Relations (ICRIER), April.
Das, D.K. (2002b), 'Quantifying Trade Barriers: Has Protection DeclinedSubstantially in Indian Manufacturing', Paper Presented at the South andSoutheast Asia Econometric Society Meetings, Lahore, December28-30.
Denison, E.F. (1957), 'Theoretical Aspects of Quality Change, Capital Consumptionand Net Capital Formation' in Problems of Capital Formation, NBER.
Dhar, P.N. (1990), Constraints on Growth: Reflections on the Growth Experience,Oxford University Press, Delhi.
Dholakia, R.H. and B.H. Dholakia (1994), 'Total Factor Productivity Growth inIndian Manufacturing', Economic and Political Weekly, December 31, 342-44.
Diewert, W.E. (1976), 'Exact and Superlative Index Numbers,' Journal ofEconometrics, 4, 115-145.
Diewert, W.E. (1978), 'Superlative Index Numbers and Consistency in Aggregation,'Econometrica, 46, 883-900.
Diewert, W.E. (1992), 'The Measurement of Productivity,' Bulletin of EconomicResearch, 44(3), 163-198.
Edwards, S. (1989a), 'Openness, Trade Liberalization and Economic Performance inDeveloping Countries,' Working Paper #2908, NBER, Cambridge Mass.
Fraumeni, B.M. and D .W. Jorgenson (1980), 'The Role of Capital in US EconomicGrowth 1948-76' in Furstenberg, G.M.V. (ed.) Capital. Efficiency andGrowth, Ballinger, Cambridge, 9-25.
Fraumeni, B.M. and D .W. Jorgenson (1986), 'The Role of Capital in US EconomicGrowth 1948-79' in Dogramaci, A (ed.) Measurement Issues and Behavior ofProductivity Variables, M. Nijhoff, Boston MA, 161-244.
Goldar, B.N. (1986a),Productivity Growth in Indian Industry, Allied Publishers, NewDelhi.
Goldar, B.N. (2000), 'Productivity Growth in Indian Manufacturing in the 1980s and1990s', Paper presented in the Conference to Honor Professor K.L.Krishna,.on the theme "Industrialization in a Reforming Economy: A QuantitativeAssessment" Center for Development Economics, Delhi School of Economics,Delhi.
Goldsmith, R.W. (1951), 'A Perpetual Inventory of National Wealth' Studies inIncome and Wealth, 14, NBER, New York.

43
Gollop, F. M. and D.W. Jorgenson (1980), 'US Productivity Growth by Industry 1947-1973' in Kedrick, J.A. and B.N. Vacarra (ed.) New Developments inProductivity Measurement and Analysis, NBER.
Griliches, Z. and Y. Ringstad (1971), Economies of Scale and the Form of theProduction Function, North Holland, Amsterdam.
Greenway, D. (1988), 'Evaluating the Structure of Production in Less DevelopedCountries in D.Greenway (ed.) Economic Development and InternationalTrade, Macmillan, London.
Hall, R.(1988), 'The Relation between Price and Marginal Cost in the US Industry',Journal of Political Economy,96,5, 921-947.
Harrison, A. E. (1994), 'Productivity, Imperfect Competition and Trade Reform:Theory and Evidence', Journal of International Economics, 36, 53-73.
Hashim, B.R. and M.M. Dadi (1973), Capital-Output Relations in IndianManufacturing (1946-64), MS University, Baroda
Hussain, Abid (1984), Report of the Committee on Trade Policies, Ministry ofCommerce, Government of India.
Jorgenson, D. W.(1988), 'Productivity and Post War US Economic Growth,' Journalof Economic Perspective, 2, No. 4, 23-41.
Jorgenson, D.W. (1995), Productivity, Volumes1&2, MIT Press, CambridgeMassachusetts.
Jorgenson, D.W. et.al (1987), Productivity and US Economic Growth, HarvardUniversity Press, Cambridge Mass.
Joshi, V. and I.M.D. Little (1994), India's Economic Reforms 1991-2001, OxfordUniversity Press, Delhi.
Krishna, P. and D. Mitra (1998), 'Trade Liberalization, Market Discipline andProductivity Growth: New Evidence from India', Journal of DevelopmentEconomics, 56, 447-62.
Krueger, A. O. (1986), 'General Issues In Economic Liberalization' in Choksi, A andD.Papageorgiou (eds), Economic Liberalization in Developing Countries,Basil Blackwell, Oxford.
Lucas, R.E. (1988), 'On the Mechanics of Economic Development,' Journal ofMonetary Economics, 22, 3-42.
Mankiw, N.G., D. Romer and D.N.Weil (1992),'A Contribution to the Empirics ofEconomic Growth,' Quarterly Journal of Economics, Vol. CVII, May, 407-437.
44
McFadden, D. (1966), 'Cost, Revenue and Profit Function: A Cursory Review,'Working Paper # 86, IBER, University of California at Berkeley, March.
McFadden, D. (1978), 'Cost Revenue and Profit Functions' in Fuss, M and D. McFadden (ed.) Production Economics: A Dual Approach to Theory andApplications, Vol-1, North Holland, Amsterdam.
Michaely, M. (et.al.) (1991), Liberalizing Foreign Trade, Blackwell, Oxford.
Mishra.S.N. and B.N.Goldar (1996) India's Trade and Investment Policies, Mimeo,Institute of Economic Growth, February.
Mitra, A (et.al.) (1998), 'State Infrastructure and Productive Performance in IndianManufacturing,' Development Centre Technical Paper # 139, OECD, Paris
Mohan Rao, J.(1996a), 'Manufacturing Productivity Growth: Methods andMeasurement', Economic and Political Weekly, November 2, 2927-2936
Narasimham, M. (1984) Report of the Committee to Examine the Principles of aPossible Shift from Physical to Financial Controls, Government of India.
Oulton, N. and M. O'Mahony (1994), Productivity and Growth: A Study of BritishIndustry 1954-1986, Cambridge University Press, Cambridge
Parhi, M. (1997), Liberalization, Productivity and R&D: An Inter-Industry Analysis,Unpublished M.Phil Dissertation, Delhi School of Economics, Delhi.
Pradhan, G. and K.Barik (1998), 'Fluctuating Total Factor Productivity Growth inIndia: Evidence from Selected Polluting Industries,' Economic and PoliticalWeekly, February 28, M25-M30.
Pritchett, L. (1996), 'Measuring Outward Orientation in LDCs: Can it be Done?',Journal of Development Economics, Vol.49, 307-335
Rao, N. (1985), Exchange Rate and Commercial Policy in a Controlled TradeRegime: A Case Study of India, Ph.D Dissertation, Oxford University.
Romer, P. (1986), 'Increasing Returns and Long Run Growth' Journal of PoliticalEconomy, 94, 1002-1037
Ruggles ,N. and W.Ruggles (1967), 'Concept of Real Capital Stock and Services' inInput, Output and Productivity Measurement, Studies in Income and Wealth,25, NBER
Shepard, R.W. (1953), Cost and Production Functions, Princeton University Press,Princeton NJ.
Shepard, R.W (1970), The Theory of Cost and Production Functions, PrincetonUniversity Press, Princeton NJ.

45
Solow, R.(1957), 'Technical Change and Aggregate Production Function,' Review ofEconomic and Statistics, Vol. 39, 312-20.
Srinivasan, T.N. (1993) Agriculture and Trade in China and India- Policies andPerformance since 1950, ICEG- California
Srivastava, V. (1996) Liberalization, Productivity and Competition: A Panel Study ofIndian Manufacturing', Oxford University Press, Delhi.
Srivastava, V. (2000) The Impact of India's Economic Reforms on IndustrialProductivity, Efficiency and Competitiveness, Report of a Project sponsoredby the Industrial Development Bank of India, National Council of AppliedEconomic Research (NCAER), New Delhi.
Thomas, V. and J.Nash (1991), 'Reform of Trade Policy: Recent Evidence fromTheory and Practice', The World Bank Research Observer, Vol.6, No.2, 219-240.
Trividi, P et al (2000), ' Productivity in Major Industries in India: 1973-74 to 1997-98', Development Research Group Study #20, Department of EconomicAnalysis and Policy, Reserve Bank of India, Mumbai
Uzawa, H. (1964), 'Duality Principles in the Theory of Cost and Production,'International Economic Review, Vol.5, 216-220.
World Bank (1989) India-An Industrializing Economy in Transition, A World BankCountry Study, The World Bank, Washington DC.
Young, A.H. and J.C. Musgrave (1980), 'Estimation of Capital Stock in the UnitedStates' in Usher, D (ed.) The Measurement of Capital, NBER, University ofChicago Press, Chicago and London.