MANUFACTURING BUILDING - Lean Construction · PDF fileWHY THIS APPROACH: • No Value...
38
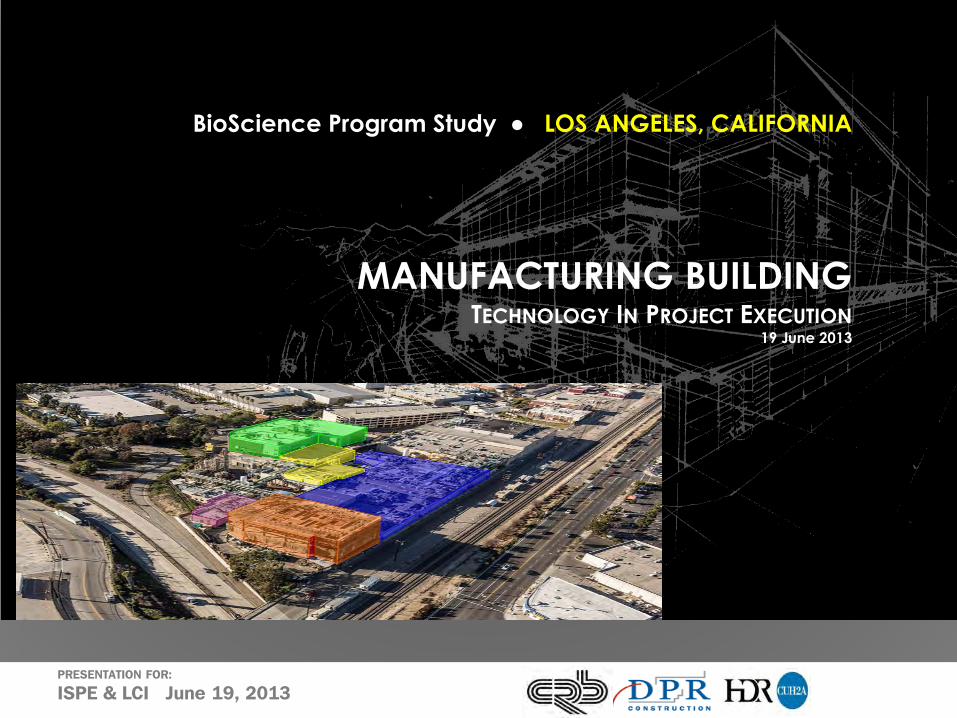
PRESENTATION FOR: ISPE & LCI June 19, 2013 BioScience Program Study ● LOS ANGELES, CALIFORNIA MANUFACTURING BUILDING TECHNOLOGY IN PROJECT EXECUTION 19 June 2013
Transcript of MANUFACTURING BUILDING - Lean Construction · PDF fileWHY THIS APPROACH: • No Value...
PRESENTATION FOR:
ISPE & LCI June 19, 2013
BioScience Program Study ● LOS ANGELES, CALIFORNIA
MANUFACTURING BUILDING TECHNOLOGY IN PROJECT EXECUTION
19 June 2013
PRESENTATION FOR:
ISPE & LCI June 19, 2013
INTRODUCTION & OVERVIEW
19 June 2013
PRESENTATION FOR:
ISPE & LCI June 19, 2013
LEAN APPROACH
TECHNOLOGY TOOLS
SIMULATION
RESULTS
19 June 2013
PRESENTATION FOR:
ISPE & LCI June 19, 2013
LEAN Approach
Hybrid IPD TVD/TVE Co-Location Schedule Methodologies Risk Analysis BIM Utilization Benchmarks/Mock-ups Just In Time KanBan Systems

PRESENTATION FOR:
ISPE & LCI June 19, 2013
IPD (Integrated Project Delivery) DESIGN–BID–BUILD, NOT CONTRACTUALLY IPD BUT…
Integrated team, assembled early, open & collaborative Co-Located - Owner, Architect, Engineer and GC DPR involved in design / CRB involved in cost CRB 3D model transitioned to DPR BIM model Streamlined Communication Information sharing
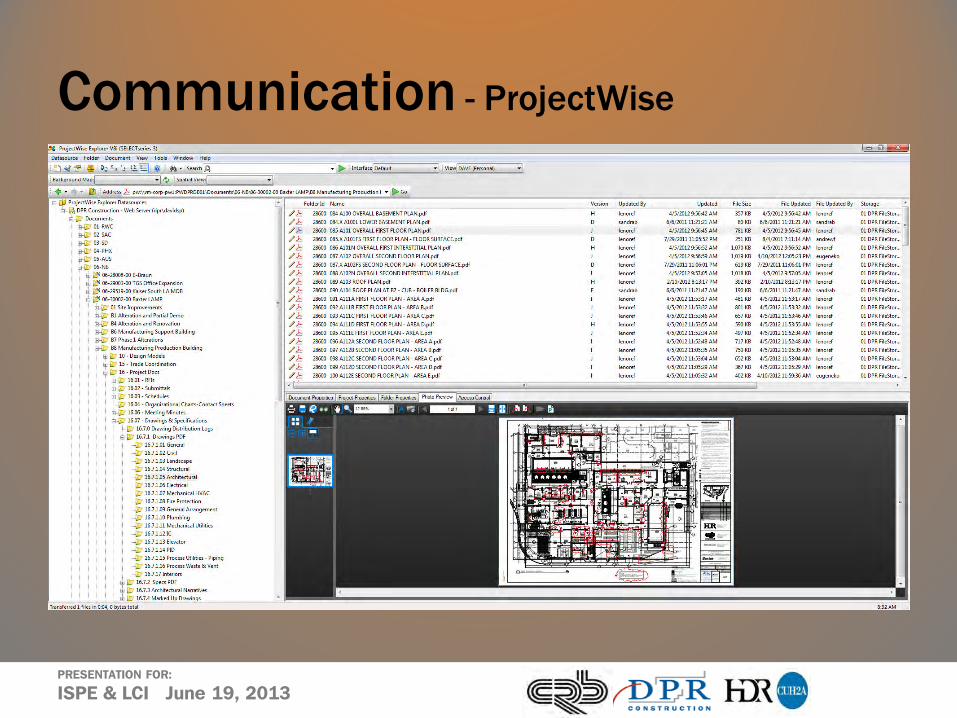
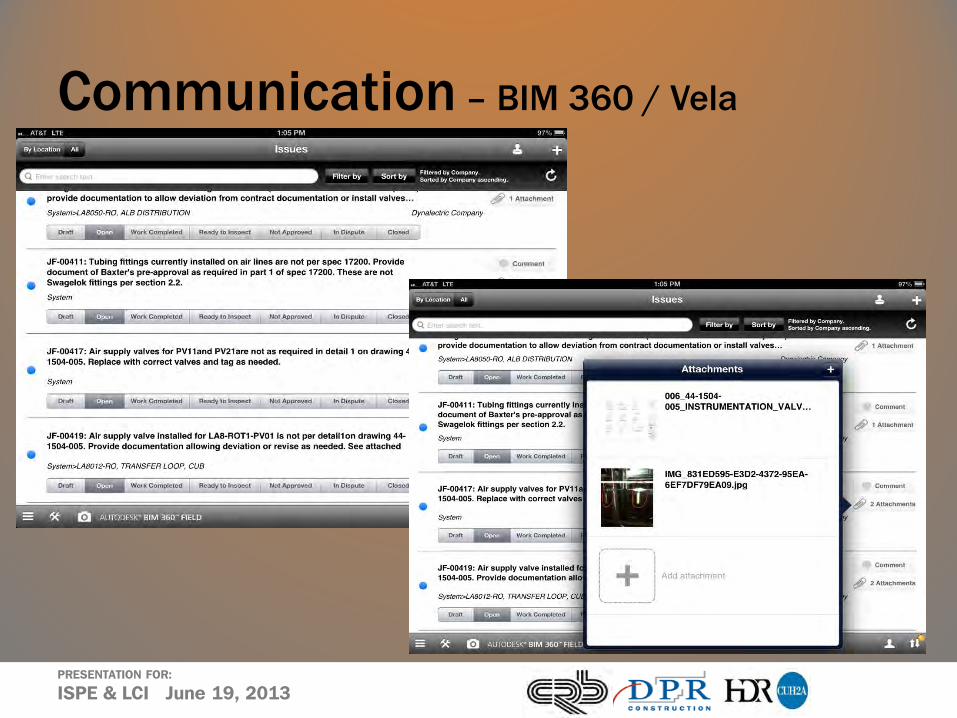
All project info on ProjectWise BIM 360 Field & BIM 360 Glue PlanGrid (Cloud)
PRESENTATION FOR:
ISPE & LCI June 19, 2013
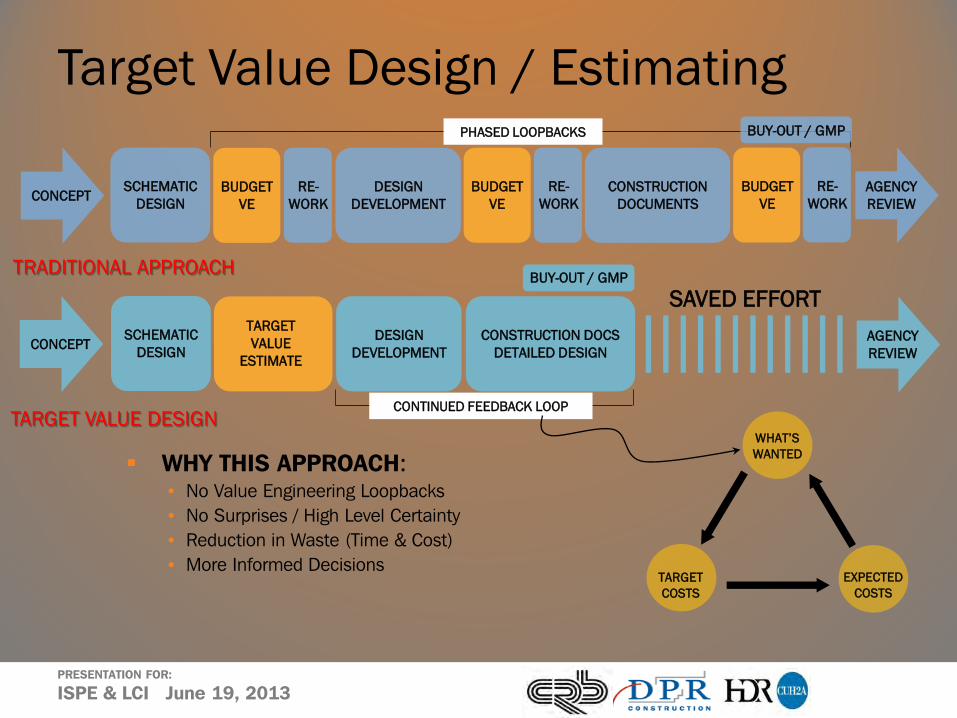
Target Value Design / Estimating
WHY THIS APPROACH: • No Value Engineering Loopbacks • No Surprises / High Level Certainty • Reduction in Waste (Time & Cost) • More Informed Decisions
TRADITIONAL APPROACH
CONCEPT AGENCY REVIEW
SCHEMATIC DESIGN
BUDGET VE
RE- WORK
DESIGN DEVELOPMENT
BUDGET VE
RE- WORK
BUDGET VE
RE- WORK
CONSTRUCTION DOCUMENTS
PHASED LOOPBACKS
TARGET VALUE DESIGN
CONCEPT AGENCY REVIEW
SCHEMATIC DESIGN
TARGET VALUE
ESTIMATE
DESIGN DEVELOPMENT
CONSTRUCTION DOCS DETAILED DESIGN
SAVED EFFORT
CONTINUED FEEDBACK LOOP
WHAT’S WANTED
EXPECTED COSTS
BUY-OUT / GMP
BUY-OUT / GMP
TARGET COSTS
PRESENTATION FOR:
ISPE & LCI June 19, 2013
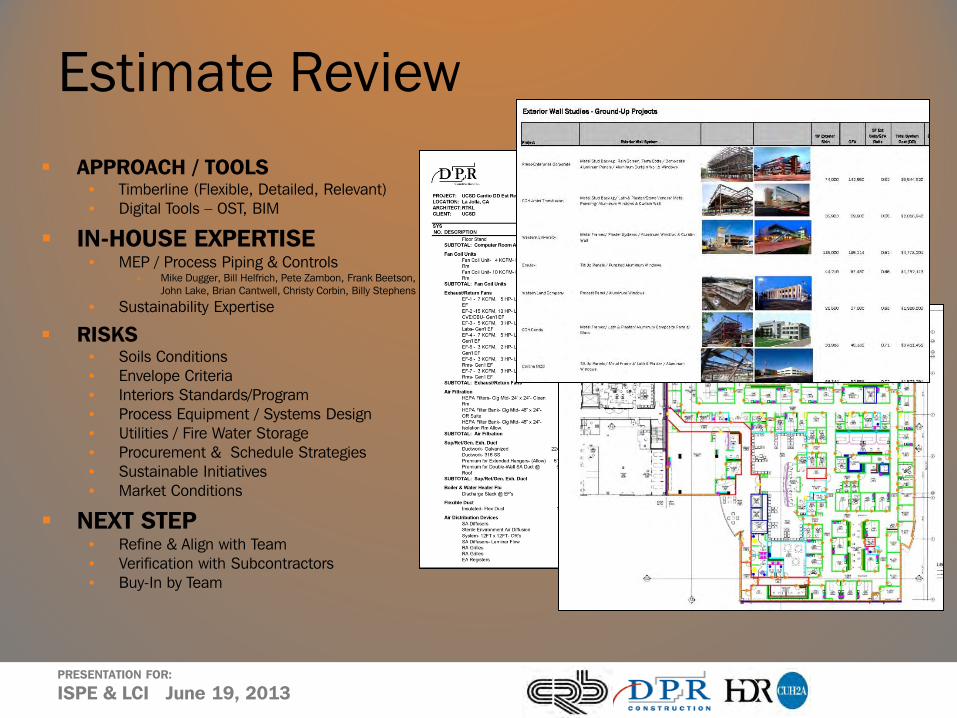
Estimate Review APPROACH / TOOLS
• Timberline (Flexible, Detailed, Relevant) • Digital Tools – OST, BIM
IN-HOUSE EXPERTISE • MEP / Process Piping & Controls
» Mike Dugger, Bill Helfrich, Pete Zambon, Frank Beetson, John Lake, Brian Cantwell, Christy Corbin, Billy Stephens
• Sustainability Expertise
RISKS • Soils Conditions • Envelope Criteria • Interiors Standards/Program • Process Equipment / Systems Design • Utilities / Fire Water Storage • Procurement & Schedule Strategies • Sustainable Initiatives • Market Conditions
NEXT STEP • Refine & Align with Team • Verification with Subcontractors • Buy-In by Team
PRESENTATION FOR:
ISPE & LCI June 19, 2013
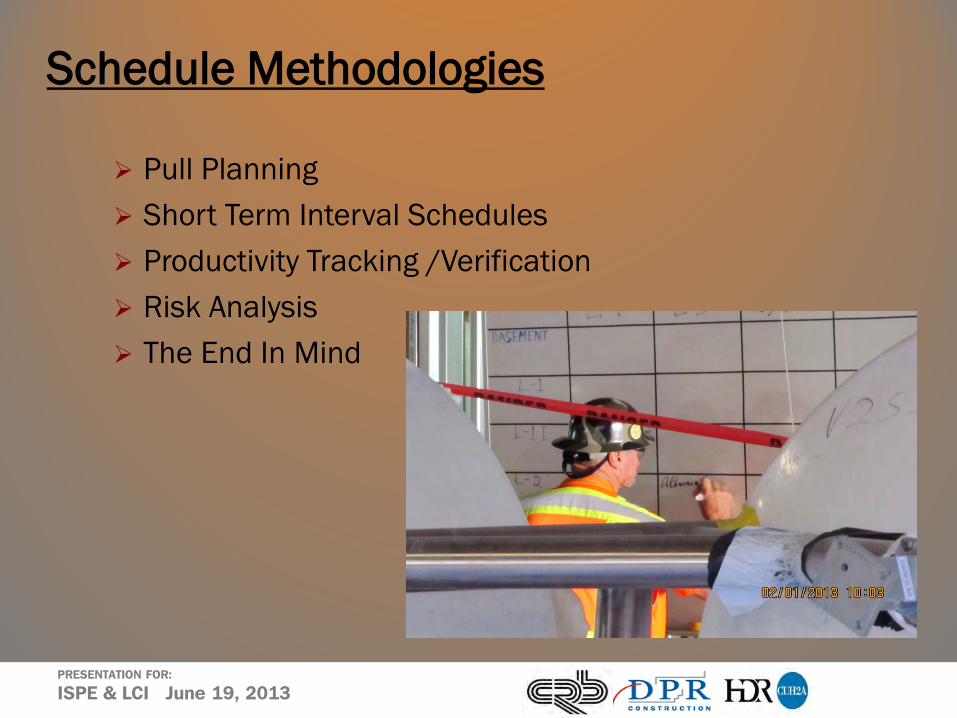
Schedule Methodologies
Pull Planning Short Term Interval Schedules Productivity Tracking /Verification Risk Analysis The End In Mind
PRESENTATION FOR:
ISPE & LCI June 19, 2013
Delivery Team (Category) Risk ID
Risk Label (brief description of the risk) Risk Description
Impact (Results of failure to contain risk) Likelihood
ScheduleConsequences
Schedule Activity Impacted %Criticality
EV Schedule Impact Days
U/S Construction 027 PL delay to shore crossing ops
Pipelines: Downstream schedule change delays shore crossing operations
-Delay in start of shore crossing-Lack of space and access to allocated areas -Schedule delay*-Cost increase
5. Remote 5. Minor Lay Export P/L From Shore 1% 4
U/S Construction 029 PL CRA flowline damage
Pipelines: Introduction of untreated seawater into CRA clad flowlines or wet buckle of CRA flowline during installation
-Loss of flowline-Production restricted*-Cost Increase-Significant revenue impact due to LNG export capability
4. Unlikely 4. Moderate Install Infield Lines 1% 14
U/S Construction 032 PL damage to 3rd party PL Pipelines: Damage to third party pipelines/infrastructure.
-Repair costs-Schedule delay-3rd party claims-Environmental impact*-Cost increase
5. Remote 3. Major Install 36" 3GLB 1% 16
U/S HSE 047 PL discovery of indigenous artifacts
Pipelines / Shore Crossing: Discovery of indigenous artifacts during beach excavation
*-Delay in schedule-Potential claims-Relocate pipeline-Increase cost
3. Seldom 5. Minor Excavate Shore Crossing 2% 14
Project Management 050 Lack of platform EPCI org
cap
Lack of platform EPCI contractor organizational capability (people, project management systems, interface management for internal or external interfaces, sub-contractor management)
-Poor quality-Rework-Increase owner's team cost*-Schedule delay
4. Unlikely 4. Moderate HUC CPP Topsides 3% 14
U/S Operations 066 Drilling installation failure Drilling: Complete loss of well during drilling *-Cost increase
-Schedule delay 5. Remote 4. Moderate First LNG 6% 7
Project Area Risk ID Risk Label (brief description of the risk) Likelihood CostConsequence Mitigation
000 000-05The contractor / Vendor may not be ready for Pre-Operational Checkout when Precommissioning wants to start
2 3 Planning and Management
000 000-10 Contractor personnel may not be available to support Pre-Commissioning 2 2 Planning and management
000 000-15 Vendor Availability to Support Precommissioning / Commissioning 3 3 Planning and management of
Vendors
000 000-20 Damage to equipment after turnover prior to commissioning 4 3 Security; Monitoring
000 000-25 Precalibration, Checking out of software; blows the instrument or software 2 3 Pre-checkouts; spares
availability
-0.13%
-0.19%
-0.43%
-0.51%
-0.65%
-0.86%
-1.00%
-1.26%
-1.53%
-2.40%
0.13%
0.22%
0.54%
0.58%
0.81%
1.01%
1.18%
1.52%
1.92%
2.97%
-4.0% -2.0% 0.0% 2.0% 4.0%
110 - Piling
801 - Insulation Piping
803 - Fireproofing
200 - Structural Steel
100 - Earthwork and Civil
700 - Instrumentation and Controls
120 - Concrete
600 - Electrical
400 - Mechanical Equipment
500 - Piping
Project Name: Total Cost TornadoTop 10 Items with Greatest Uncertainity Range with Respect to the P50
2.0% threshold1.0% threshold
0.0% threshold
35,690 45,193
*Cost in $MMP10 P90
Risk Analysis Results
46,764 52,879
19,000 23,931
14,135 18,010
15,822 19,134
8,958 11,544
8,216 10,149
6,333 8,059
2,466 3,189
2,674 3,140
The percentages are calculated using simulation values as follows: ((P10-P40)/Total P40) and ((P90-P40)/Total P40)
* The P10 and P90 cost provides a reader with the potential cost impact of that line item* A P10 or P90 cost of $0 does not equate to 0% uncertainty. This is only true if the P40 cost is $0 as well
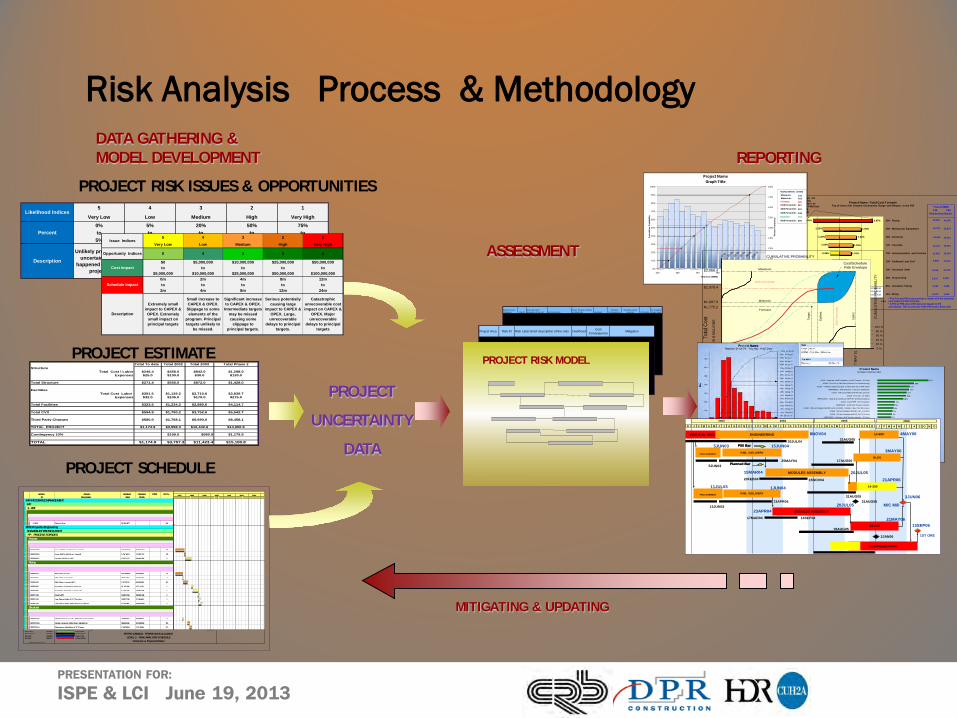
Risk Analysis Process & Methodology
ASSESSMENT
DATA GATHERING & MODEL DEVELOPMENT
PROJECT SCHEDULE
PROJECT RISK ISSUES & OPPORTUNITIES
PROJECT
UNCERTAINTY
DATA
Project Start 06JAN97Project Finish 02AUG03Data Date 06JAN97Run Date 08NOV97
© Primavera Systems, Inc.
Expected BarUn-Risked BarProgress BarCritical Activity
RSK3 Sheet 1 of 9
PETRO-CANADA - TERRA NOVA ALLIANCELEVEL 2 - RISK ANALYSIS SCHEDULE
Unrisked vs. Expected Dates
ActivityID
ActivityDescription
UnriskedStart
UnriskedFinish
FP50 Crit %
IMT-INTEGRATED MANAGEMENTIMTII - IMT
00001 Project Start 06JAN97* 84FPSO-Topsides EngineeringSHAWMOUNT BROWN & ROOTFP - PROCESS TOPSIDESProcess
2FPPR005 Issue P&IDs on IDC (incl. Vessel) 04MAR97* 05NOV97 28
2FPPR010 Issue P&IDs AFD (incl. Vessel) 17NOV97 12DEC97 28
2FPPR015 Develop P&IDs to AFC 15DEC97 29MAY98 2Piping
2FPPI064 Plot Plans for IDC 03MAR97* 26SEP97 14
2FPPI065 Plot Plans From IDC 29SEP97 10OCT97 4
2FPPI070 Plot Plans Layouts AFD 13OCT97 06FEB98 30
2FPPI085 Isometrics Supports 1st Issues 01JUN98 13JUL98 1
2FPPI090 Isometrics Supports Last Issues 14JUL98 15DEC98 1
2FPPI115 Final MTO 16DEC98 29DEC98 1
2FPPI120 Last Piping Bulks P.O. Top Ups 30DEC98 21JAN99 1
2FPPI125 Last Piping Bulks Manufacture & Deliver 22JAN99 16MAR99 1Structural
2FPST165 Module Design Loads - Preliminary for Vessel 29SEP97 30SEP97 7
2FPST135 Design Analysis Preliminary Modelling 09FEB98 10APR98 30
2FPST140 Preliminary Modelling & 2D Extract 13APR98 12JUN98 30
1997 1998 1999 2000 2001 2002 2003
PROJECT ESTIMATE
REPORTING
MITIGATING & UPDATING
0.0%
1.0%
2.0%
3.0%
4.0%
5.0%
6.0%
7.0%
8.0%
0%
10%
20%
30%
40%
50%
60%
70%
80%
90%
100%
230 280 330 380 430 480
Perc
ent F
requ
ency
Cum
ulat
ive
Prob
abili
ty
Total Cost ($MM)
Project NameGraph Title
346
Estimate:
Minimum: 231
289
Maximum: 491
Expected:
50th Percentile:
10th Percentile: 257
35390th Percentile: 459
40th Percentile: 321
HIGHLIGHTERS ($MM)
Maximum
Earli
est
Minimum
Late
st
CUMULATIVE PROBABILITY
CUM
ULA
TIVE
PRO
BABI
LITY
CO
ST IN
$ M
ILLI
ON
S
0 % 20 %
40 %
60 %
80 %
100 %
20 %40 %60 %80 %
100 %
0 %
Cost/ScheduleRisk Envelope
$2,088.4
$1,978.4
$1,897.9
50th Percentile
21 S
EP 0
0
7 M
AY 0
1
50th
Per
cent
ile
TIME
Tota
l Cos
t
Product Available
27 D
EC 0
0
31 J
UL 0
0Ta
rget
Forecast$1,775.2
2%
2%
2%
2%
2%
2%
2%
3%
4%
4%
5%
5%
5%
6%
6%6%7%
7%10%
11%
11%
12%
13%
14%
20%A1030 - Fabricate WHP Foundation (15,000 Tonnes) - S.E Asia
A1800 - First Gas to LNG Plant (Onshore For Commissioning)
A1160 - 4 Months Engineering prior to Fabrication Start -WHP Jacket
UPEPCMB000 - EPCI & Pipeline Contractor Mobilisation
A1630 - Drill and Complete Well WP_BR_1(6.5Km)
A1550 - First LNG - (6 Wells)
UPEPCCO005 - Hook Up & Commission WHP (Pre Drill Rig Installation)
A1040 - Install WHP - Raft Foundation
UPEPCIN020 - Install WHP Topsides Modules
A1590 - Drill and Complete Well WP_AAD_1(4.0Km) - Includes 3 days TAD Disconnect
A1580 - Drill and Complete Well WP_AAF_4 (4.0Km)
A1600 - Drill and Complete Well WP_AAD-2 (4.0Km)
UPEPCFB010 - Fabricate WHP Topsides Modules - S.E Asia
A1560 - Drill and Complete Well WP_AAF_2 (2.5Km)
A1570 - Drill and Complete Well WP_AAF_3 (2.5Km)
A1060 - Drill and Complete Well WP_AAF_1 (2.5Km)
UPEPCCO105 - Hook Up & Commission CPP Platform
A1810 - Ramp Up of Production for RFSU
UPEPCEN015 - Mechanical Detailed Design - Bid & Aw ard Major LLI Mechanical Equipment - ...
A1050 - Mobilise and Install TAD - Ready for Drilling
A1170 - 12 Months Engineering prior to Fabrication Start - CPP Topsides
A1410 - Fabricate & Install Duplex Spools -CPP Topsides - Korea
UPEPCPO025 - Procure/ Deliver/Customs Clear - Fire Water Pump - WHP Topsides
A1830 - HUC Available Wells for f irst LNG (6 Wells required , 7 w il be available)
UPEPCPO130 - Procure/Deliver/Customs Clear - Duplex Piping & Valves - CPP Topsides
Project NameSchedule Sensitivity Index
PROCUREMENT
M/C Mill
P50 BarP50 Bar
Planned BarPlanned Bar
30JUL04
D M AJ F J AM J N DS O M AJ F J AM J N DS O M AJ F J AM J N DS O
2003 2004 2005
M AJ F J AM J N DS O
2006
CRITICAL ENG. ENGINEERING
FAB. / DELIVERY
25MAY045JUN03
5JUN03
8NOV04
15JUN04
PROCUREMENT FAB. / DELIVERY
13APR0413JUN03
11JUL03 1JUN04
MODULES ASSEMBLY
20JUL0523APR04
17MAR04 14SEP04
MODULES ASSEMBLY 20JUL0515MAR0423FEB04 15NOV04
21MAY06
19AUG05
31AUG05
21APR06
17AUG05
3MAY06
31AUG0514-600 4MAY06
31AUG053JUN06
14-300
14-200
BLDG
COMMISSIONING
13SEP06
2JAN06 1ST ORE
Total To date Total 2002 Total 2003 Total Phase 2Structure
Total Cost \ Labor $246.4 $456.0 $842.0 $1,298.0Expenses $25.0 $100.0 $30.0 $130.0
Total Structure $271.4 $556.0 $872.0 $1,428.0
FacilitiesTotal Cost Labor $291.5 $1,129.2 $2,710.6 $3,839.7
Expenses $32.0 $105.0 $170.0 $275.0
Total Facilities $323.5 $1,234.2 $2,880.6 $4,114.7
Total CVX $594.9 $1,790.2 $3,752.6 $5,542.7
Third Party Charges $580.0 $1,768.1 $6,690.0 $8,458.1
TOTAL PROJECT $1,174.9 $3,558.3 $10,442.6 $14,000.9
Contingency 10% $199.0 $980.9 $1,179.9
TOTAL $1,174.9 $3,757.3 $11,423.4 $15,180.8
PROJECT RISK MODEL
5 4 3 2 1
Very Low Low Medium High Very High0% 5% 20% 50% 75%to to to to to5% 20% 50% 75% 95%
Unlikely probability, uncertainty has
happened on other projects
Small probability, uncertainty not likely to occur
Probability uncertainty may or
may not occur
Probability uncertainty likely to
occur
Probability uncertainty will occur, possibly several times
Likelihood Indices
Description
Percent5 4 3 2 1
Very Low Low Medium High Very High
$0 $5,000,000 $10,000,000 $25,000,000 $50,000,000 to to to to to
$5,000,000 $10,000,000 $25,000,000 $50,000,000 $100,000,000 0m 2m 4m 8m 12mto to to to to2m 4m 8m 12m 24m
Extremely small impact to CAPEX & OPEX. Extremely small impact on principal targets
Small increase to CAPEX & OPEX. Slippage to some elements of the
program. Principal targets unlikely to
be missed.
Significant increase to CAPEX & OPEX.
Intermediate targets may be missed causing some
slippage to principal targets.
Serious potentially causing large
impact to CAPEX & OPEX. Large, unrecoverable
delays to principal targets.
Catastrophic unrecoverable cost impact on CAPEX &
OPEX. Major unrecoverable
delays to principal targets
Description
Schedule Impact
Cost Impact
Issue Indices
5 4 3 2 1Opportunity Indices
PRESENTATION FOR:
ISPE & LCI June 19, 2013
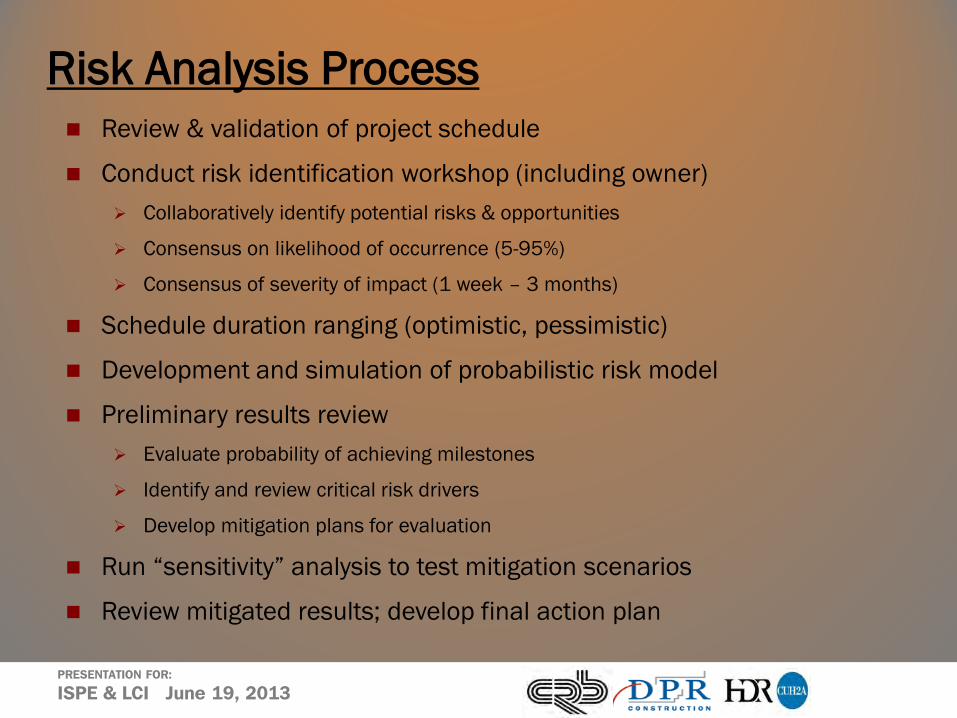
Risk Analysis Process Review & validation of project schedule
Conduct risk identification workshop (including owner) Collaboratively identify potential risks & opportunities
Consensus on likelihood of occurrence (5-95%)
Consensus of severity of impact (1 week – 3 months)
Schedule duration ranging (optimistic, pessimistic)
Development and simulation of probabilistic risk model
Preliminary results review Evaluate probability of achieving milestones
Identify and review critical risk drivers
Develop mitigation plans for evaluation
Run “sensitivity” analysis to test mitigation scenarios
Review mitigated results; develop final action plan
PRESENTATION FOR:
ISPE & LCI June 19, 2013
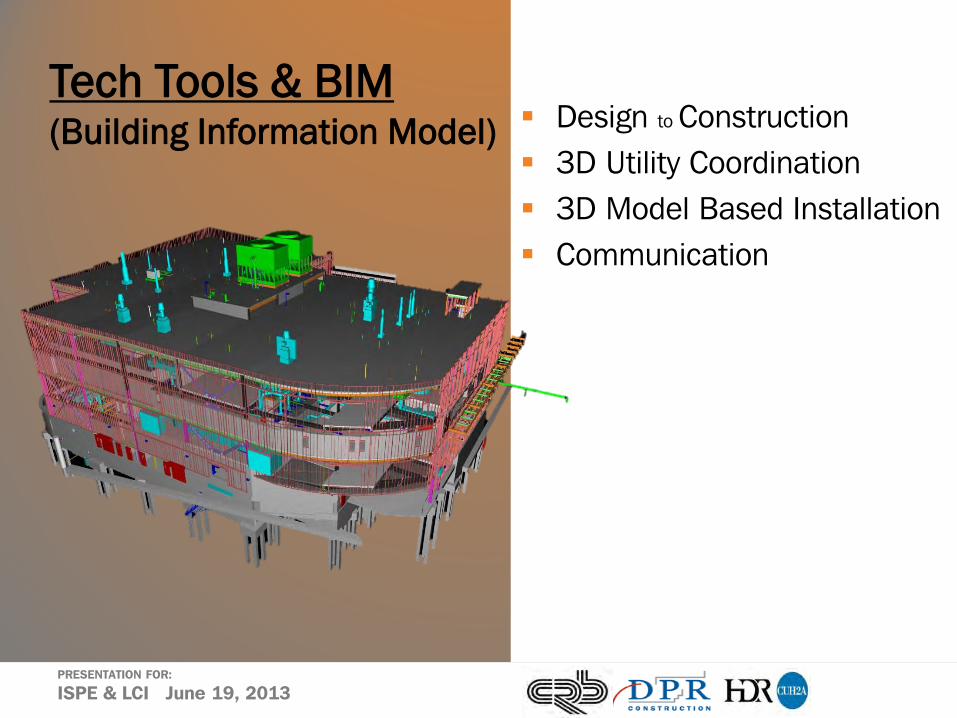
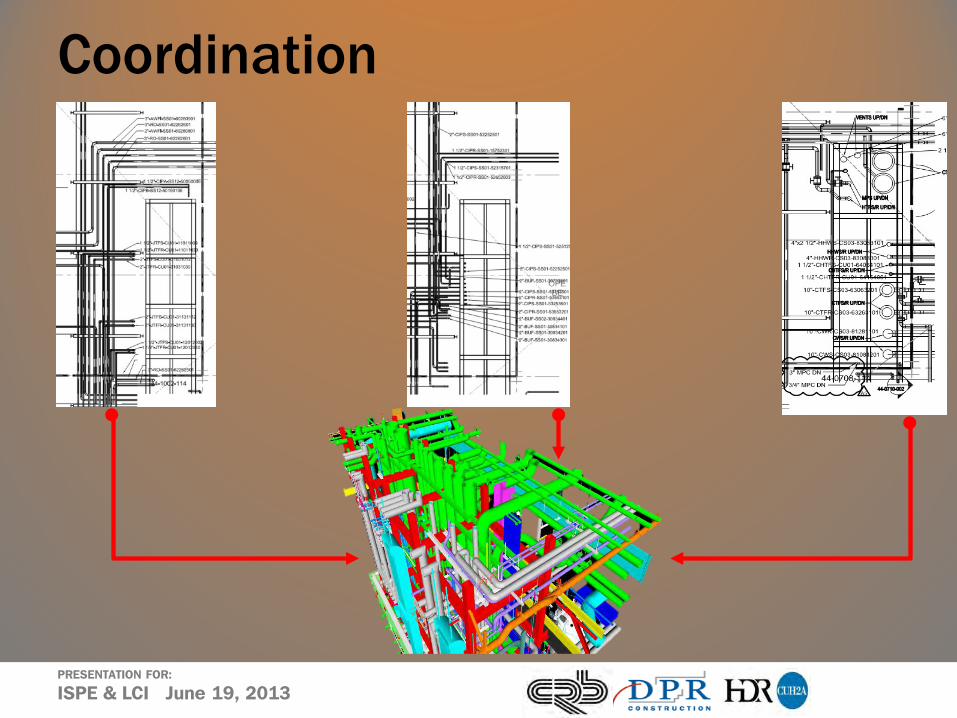
Tech Tools & BIM (Building Information Model)
Design to Construction 3D Utility Coordination 3D Model Based Installation Communication
PRESENTATION FOR:
ISPE & LCI June 19, 2013
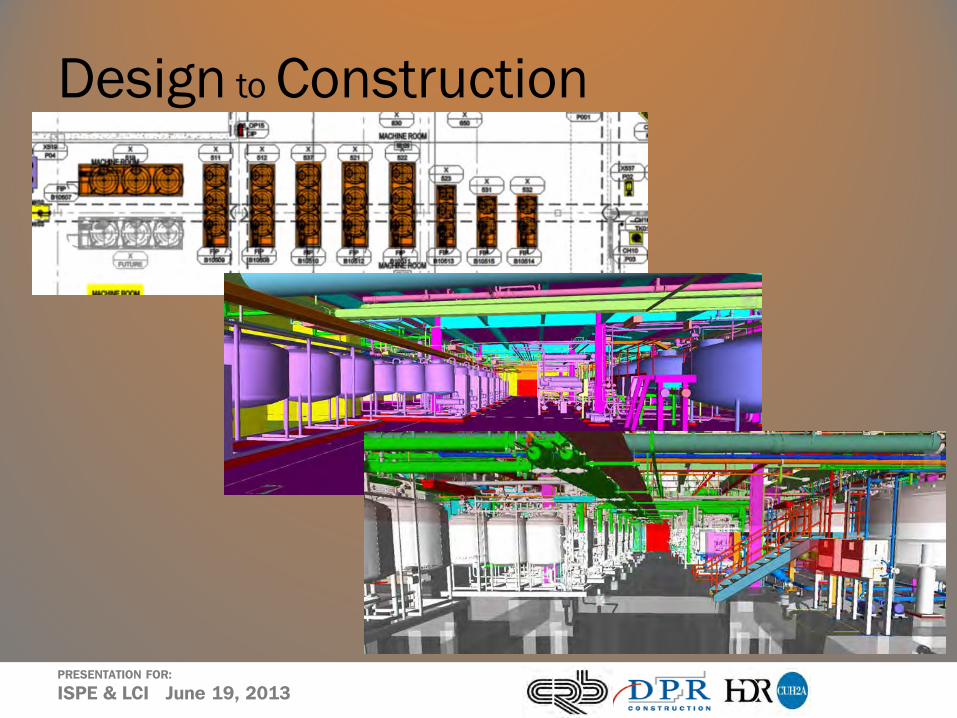
Design to Construction

PRESENTATION FOR:
ISPE & LCI June 19, 2013
Coordination -Laser Scan
PRESENTATION FOR:
ISPE & LCI June 19, 2013
Coordination

PRESENTATION FOR:
ISPE & LCI June 19, 2013
Coordination
PRESENTATION FOR:
ISPE & LCI June 19, 2013
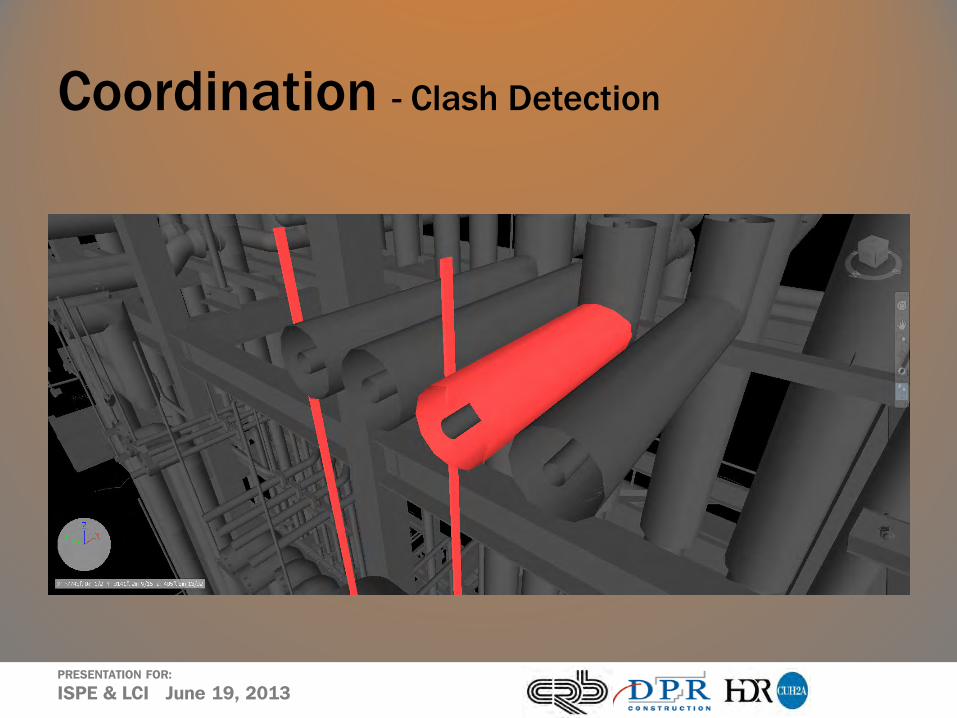
Coordination - Clash Detection

PRESENTATION FOR:
ISPE & LCI June 19, 2013
Installation - Trimble Robot

PRESENTATION FOR:
ISPE & LCI June 19, 2013
Fabrication & Installation Model to Shop to Field
PRESENTATION FOR:
ISPE & LCI June 19, 2013
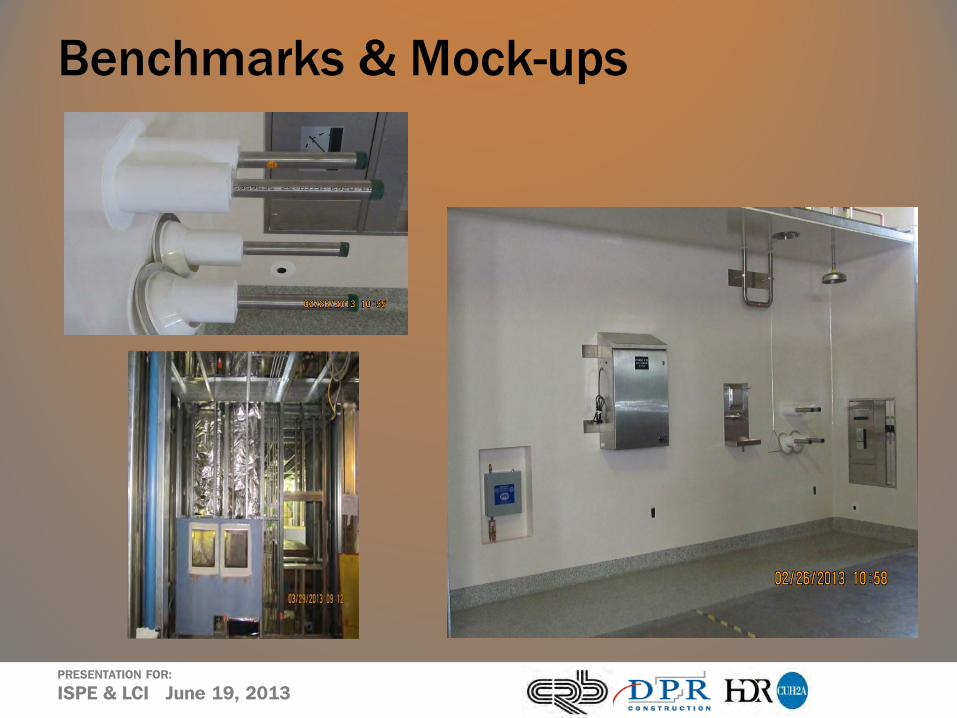
Benchmarks & Mock-ups

PRESENTATION FOR:
ISPE & LCI June 19, 2013
Just In Time & Modules

PRESENTATION FOR:
ISPE & LCI June 19, 2013
Process Module Considerations
PRESENTATION FOR:
ISPE & LCI June 19, 2013
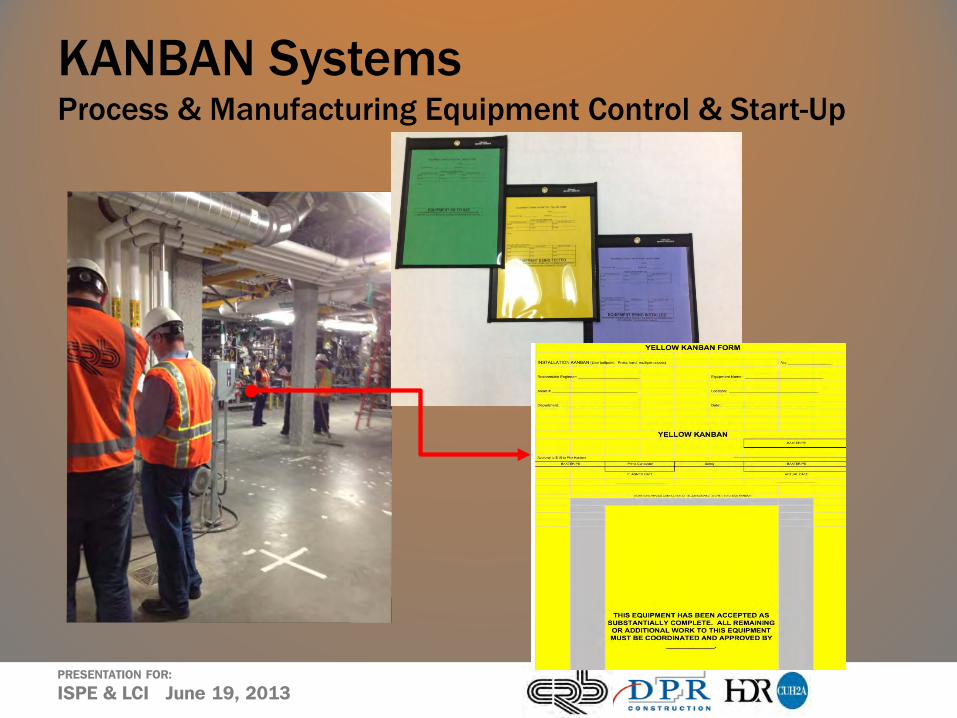
KANBAN Systems Process & Manufacturing Equipment Control & Start-Up
PRESENTATION FOR:
ISPE & LCI June 19, 2013
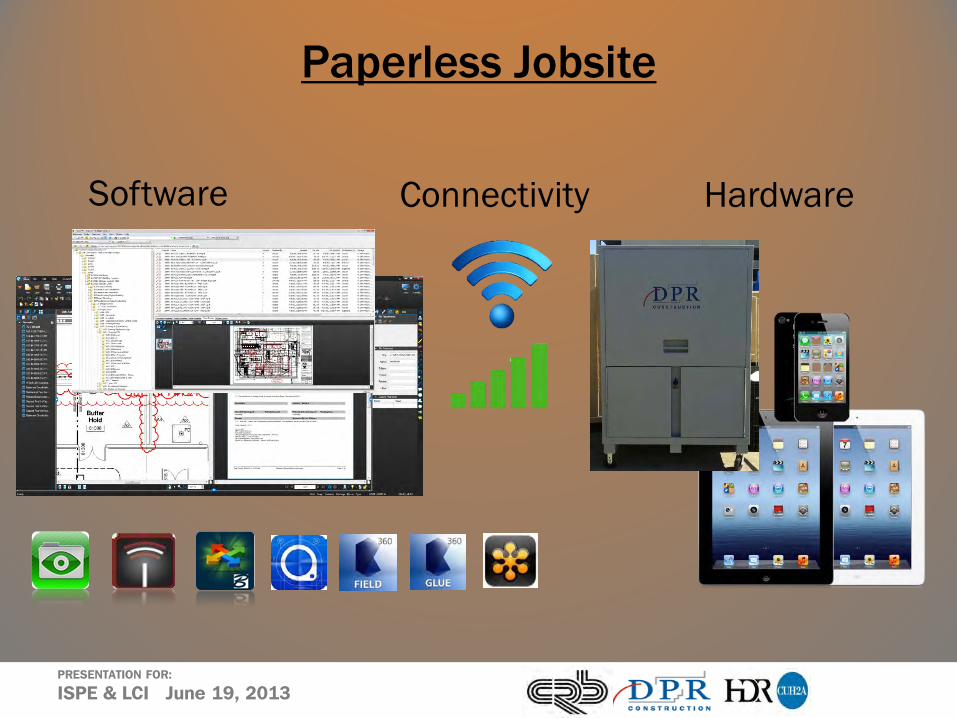
Paperless Jobsite
Software Hardware Connectivity
PRESENTATION FOR:
ISPE & LCI June 19, 2013
Communication - ProjectWise
PRESENTATION FOR:
ISPE & LCI June 19, 2013
Communication – BIM 360 / Vela

PRESENTATION FOR:
ISPE & LCI June 19, 2013
Communication - Hardware

PRESENTATION FOR:
ISPE & LCI June 19, 2013
LEAN Design
Simulation
PRESENTATION FOR:
ISPE & LCI June 19, 2013
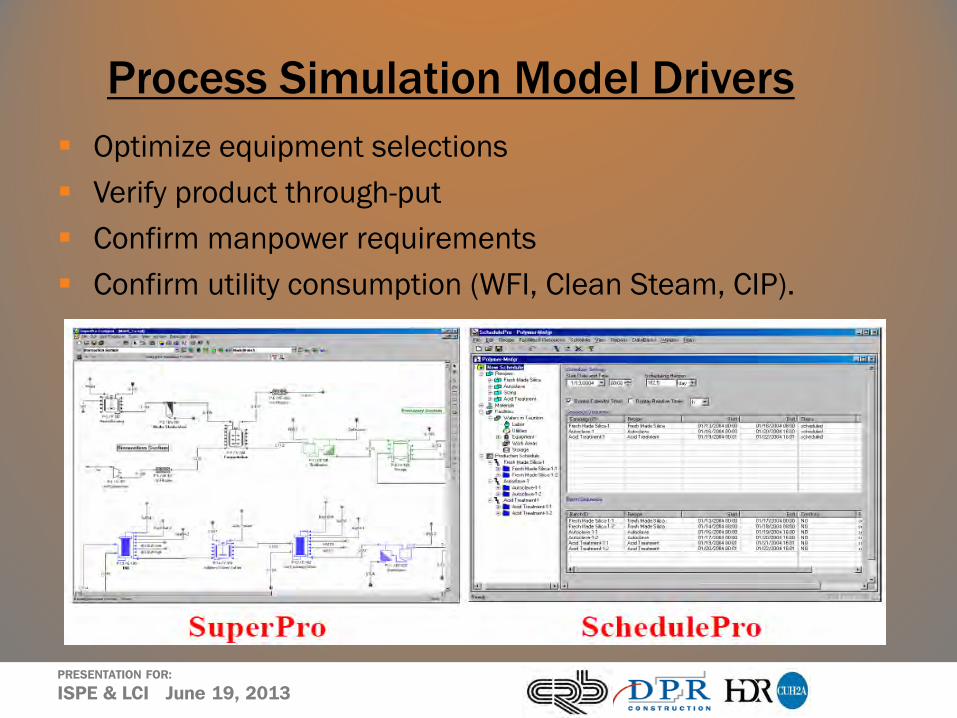
Process Simulation Model Drivers Optimize equipment selections Verify product through-put Confirm manpower requirements Confirm utility consumption (WFI, Clean Steam, CIP).

PRESENTATION FOR:
ISPE & LCI June 19, 2013
Occupancy and Utilization Results

PRESENTATION FOR:
ISPE & LCI June 19, 2013
Utilities and Waste Results
PRESENTATION FOR:
ISPE & LCI June 19, 2013
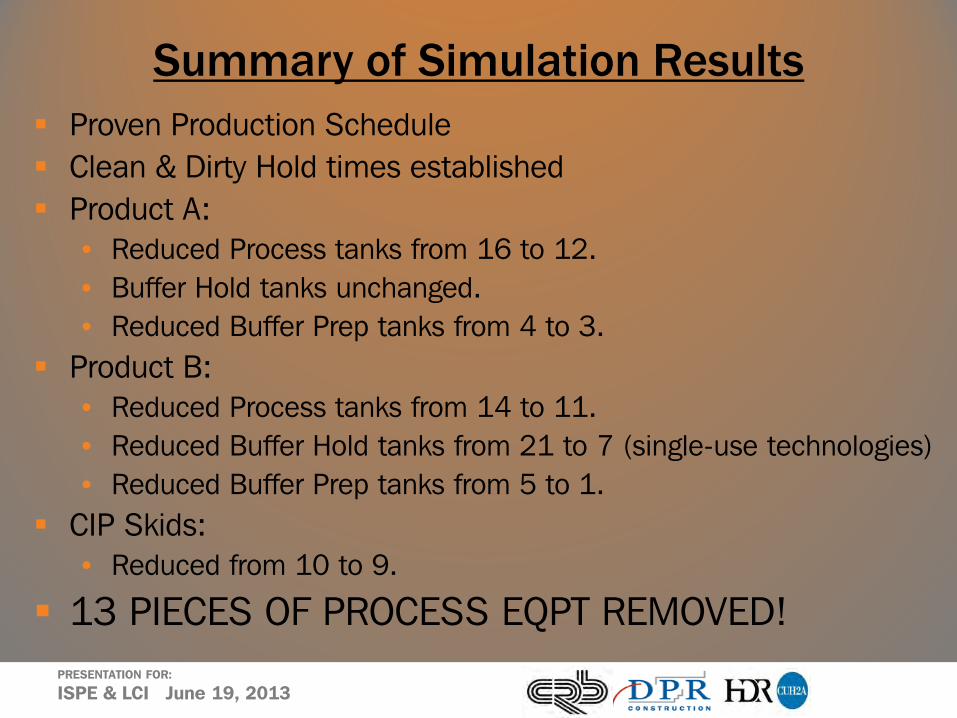
Proven Production Schedule Clean & Dirty Hold times established Product A:
• Reduced Process tanks from 16 to 12. • Buffer Hold tanks unchanged. • Reduced Buffer Prep tanks from 4 to 3.
Product B: • Reduced Process tanks from 14 to 11. • Reduced Buffer Hold tanks from 21 to 7 (single-use technologies) • Reduced Buffer Prep tanks from 5 to 1.
CIP Skids: • Reduced from 10 to 9.
13 PIECES OF PROCESS EQPT REMOVED!
Summary of Simulation Results
PRESENTATION FOR:
ISPE & LCI June 19, 2013
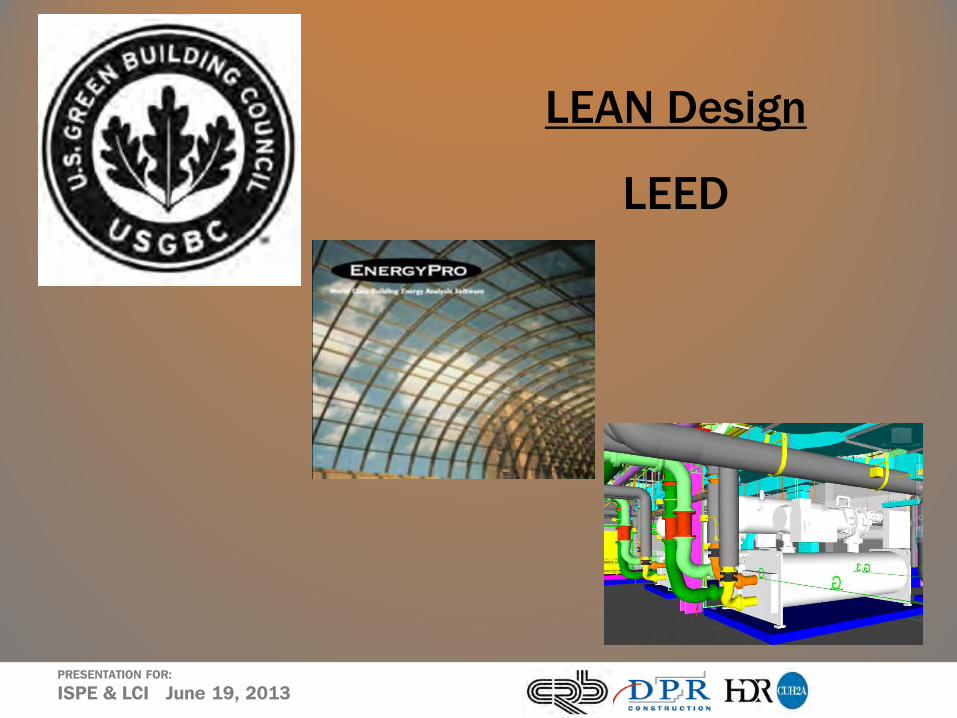
LEAN Design
LEED

PRESENTATION FOR:
ISPE & LCI June 19, 2013
Energy Modeling
EnergyPro Used for Permitting (T-24 Compliance) Design Considerations Equipment Selection Process Energy Inputs LEED Submission
PRESENTATION FOR:
ISPE & LCI June 19, 2013
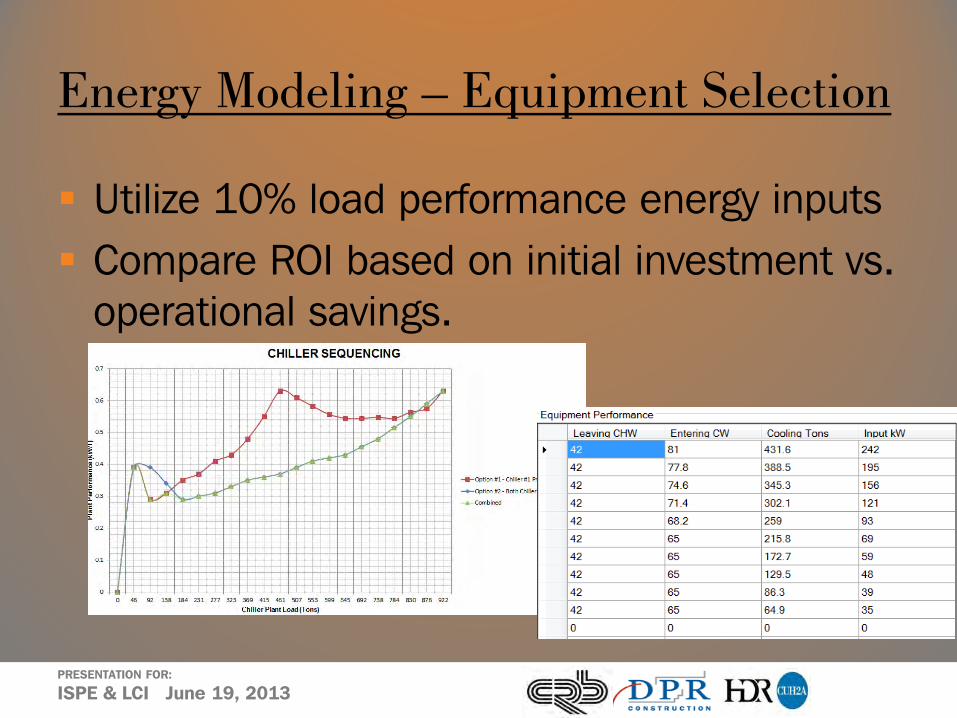
Energy Modeling – Equipment Selection
Utilize 10% load performance energy inputs Compare ROI based on initial investment vs.
operational savings.

PRESENTATION FOR:
ISPE & LCI June 19, 2013
Energy Modeling – Process Energy
PRESENTATION FOR:
ISPE & LCI June 19, 2013
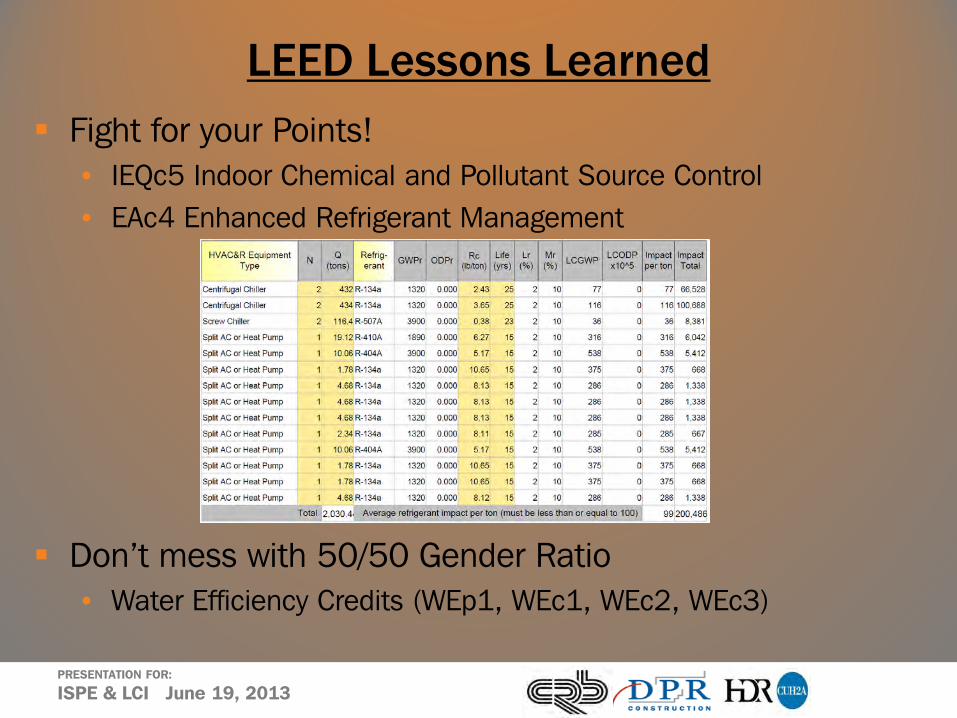
Fight for your Points! • IEQc5 Indoor Chemical and Pollutant Source Control • EAc4 Enhanced Refrigerant Management
Don’t mess with 50/50 Gender Ratio • Water Efficiency Credits (WEp1, WEc1, WEc2, WEc3)
LEED Lessons Learned

PRESENTATION FOR:
ISPE & LCI June 19, 2013
Results
Pushing the Tech Envelope
Reduced Cost On-Time Delivery Efficient Execution Limited Rework High Quality
PRESENTATION FOR:
ISPE & LCI June 19, 2013
BioScience Program Study ● LOS ANGELES, CALIFORNIA
QUESTIONS ?
TECHNOLOGY IN PROJECT EXECUTION 19 June 2013