Manufacturing and characterization of single cell ...
175
HAL Id: tel-01127176 https://tel.archives-ouvertes.fr/tel-01127176 Submitted on 7 Mar 2015 HAL is a multi-disciplinary open access archive for the deposit and dissemination of sci- entific research documents, whether they are pub- lished or not. The documents may come from teaching and research institutions in France or abroad, or from public or private research centers. L’archive ouverte pluridisciplinaire HAL, est destinée au dépôt et à la diffusion de documents scientifiques de niveau recherche, publiés ou non, émanant des établissements d’enseignement et de recherche français ou étrangers, des laboratoires publics ou privés. Manufacturing and characterization of single cell intermediate-temperature solid oxide fuel cells for APU in transportation application Visweshwar Sivasankaran To cite this version: Visweshwar Sivasankaran. Manufacturing and characterization of single cell intermediate-temperature solid oxide fuel cells for APU in transportation application. Chemical Physics [physics.chem-ph]. Université de Bourgogne, 2014. English. NNT : 2014DIJOS027. tel-01127176
Transcript of Manufacturing and characterization of single cell ...

HAL Id: tel-01127176https://tel.archives-ouvertes.fr/tel-01127176
Submitted on 7 Mar 2015
HAL is a multi-disciplinary open accessarchive for the deposit and dissemination of sci-entific research documents, whether they are pub-lished or not. The documents may come fromteaching and research institutions in France orabroad, or from public or private research centers.
L’archive ouverte pluridisciplinaire HAL, estdestinée au dépôt et à la diffusion de documentsscientifiques de niveau recherche, publiés ou non,émanant des établissements d’enseignement et derecherche français ou étrangers, des laboratoirespublics ou privés.
Manufacturing and characterization of single cellintermediate-temperature solid oxide fuel cells for APU
in transportation applicationVisweshwar Sivasankaran
To cite this version:Visweshwar Sivasankaran. Manufacturing and characterization of single cell intermediate-temperaturesolid oxide fuel cells for APU in transportation application. Chemical Physics [physics.chem-ph].Université de Bourgogne, 2014. English. �NNT : 2014DIJOS027�. �tel-01127176�
UNIVERSITE DE BOURGOGNE
UFR Sciences et Techniques
Ecole Doctorale CARNOT-PASTEUR
LABORATOIRE INTERDISCIPLINAIRE CARNOT DE BOURGOGNE
ICB-UMR 6303 CNRS UB
INSTITUT FEMTO-ST UMR CNRS 6174
FCLAB FR CNRS 3539
THESE DE DOCTORAT
Discipline : Sciences
Spécialité : Chimie-Physique
Visweshwar SIVASANKARAN
Defended on 9th July2014 before Jury:
Prof. M.Cassir Ecole Nationale Superieure de Chimie de Paris, France, President
Dr. J. P.Viricelle Ecole des Mines de Saint.Etienne, France, Reviewer
Prof. A.Barbucci Université de Genova, Italie, Reviewer
Dr. P.Briois Université de Belfort-Montbeliard, France, Invited
Dr. L.Combemale Université de Bourgogne, France, Co-Director of Thesis
Prof. M.C.Pera Universite de Franche-Comte, France, Co-Director of Thesis
Prof.G.Caboche Université de Bourgogne, France. Director of Thesis
Manufacturing and characterization of single cell Intermediate - Temperature Solid Oxide Fuel Cells for APU in transportation application.
Acknowledgement
First of all, I would like to thank my beloved project advisors, Prof. G.Caboche
(UB), Prof. Marie–Cecile Pera (UFC), Dr. Lionel Combemale (UB) for their constant support
and guidance through the entire tenure of my thesis work.
I extend my hearty thanks to Mr. Serge Vives, Mr. Laurent Girardot, for their
guidance in developing test bench in FC-LAB. I deeply acknowledge Dr. Samir Jamei, Fabien
Harel for helping us in fruitful discussions in developing test bench. I also express my gratitude
to Mr. Patric Szabo from DLR Stuttgart Germany, for his technical support in building of stack
and development of test bench in FC-LAB. I am grateful to Mr. Jean Marc Dachicourt,
Ms.Marie Laure Leonard, Mr. Nicolas Geoffroy, Ms. Claudie Josse for their support in
performing Scanning Electron Microscopy and XRD measurements. I also acknowledge Ms.
Nathalie Roudergues for her assistance in the ICB lab.
I would like to thank my lab directors, Prof. Alain Dereux (Dijon), Raphael
Ihringer (Switzerland) EPFL scientific park A who have given a place for me to work in their
esteemed laboratories. And I thank all my ICB, FC-LAB mates who made my stay, pleasant and
peaceful in Dijon and Belfort.
I thank my financial supporters namely Region de Bourgogne and Region de
Franche Comte. Finally it was all possible only with constant support and encouragement from
my parents (Mr and Mrs M.Sivasankaran).
Visweshwar Sivasankaran
Table of contents
1
Table of Contents
Acknowledgement ................................................................................................................................ 1
General Introduction .............................................................................................................................. 9
I. General aspects of IT-SOFC ............................................................................................................... 9
II. Previous works done at ICB Laboratory ............................................................................................ 9
II.1. Study of surface and volume properties of oxides type of La1-xSrxMnO3±δ .................................. 9
II.2. Analysis of interfacial properties of system LaMnO3/YSZ ......................................................... 10
II.3 Properties and reactivity of interfacial compounds of La0.8Sr0.2Mn1-yFeyO3±δ compounds as Fuel
cell cathodes .................................................................................................................................. 11
II.4. Preparation and reactivity of interfacial oxide perovskites based on Lanthanum Strontium
chrominum and Ruthenium (LSCrRu) as the anode materials for intermediate (IT-SOFC). .............. 12
II.5. Elaboration and characterization of BaCe(0.9-x)ZrxY0.1O3-δ as electrolyte material for Proton
conducting fuel cells ...................................................................................................................... 12
III. Contribution of this PhD thesis ......................................................................................................... 13
III.1. Fundamental Objectives ......................................................................................................... 14
III.2. Synopsis of Manuscript .......................................................................................................... 14
Chapter 1: Presentation of fuel cells as an energy transformer ............................................................ 17
Part I. General Introduction ............................................................................................................... 17
I. The challenge of climate changes ................................................................................................ 17
II. Need for alternative energy. ...................................................................................................... 22
III. History of fuel cell, its types and working principles .................................................................. 24
III.1. History of fuel cells ............................................................................................................. 24
III.2. Fuel cell Types .................................................................................................................... 25
III.3. Motivation to choose SOFC and IT-SOFC ............................................................................. 27
Part II: Fuel cells working principles, Materials and Techniques used ................................................. 32
I. Solid Oxide Fuel cells working principles ..................................................................................... 32
II. Deviation from theoretical to actual performances .................................................................... 34
II.1. Activation polarization or charge transfer polarization ........................................................ 35
II.2. Ohmic or Resistance polarization ........................................................................................ 35
II.3. Diffusion or concentration polarization ............................................................................... 36

Table of contents
2
III. Different designs of SOFCs ........................................................................................................ 37
IV. Materials for IT-SOFC’s ............................................................................................................. 40
IV.1. Electrolytes ........................................................................................................................ 40
IV.2. Anodes ............................................................................................................................... 47
IV.3.Cathodes ............................................................................................................................ 49
IV.4. Interconnectors ................................................................................................................. 54
IV.5. Sealants ............................................................................................................................. 55
IV.6. Balance of Plant (BOP) ....................................................................................................... 56
V. Cell preparation techniques ....................................................................................................... 57
V.I. Screen printing ..................................................................................................................... 57
V.2. Physical vapour deposition .................................................................................................. 58
V.3. Spin coating ........................................................................................................................ 58
V.4. Tape casting. ....................................................................................................................... 59
VI. Scope of this Thesis ................................................................................................................... 60
Chapter 2: Synthesis, development, formulation and optimization of suspensions for tape casting
process ................................................................................................................................................. 69
Part I ................................................................................................................................................. 69
I. Electrolyte and electrode properties ........................................................................................... 69
I.1. Electrolyte (GDC 10) nano particles synthesis and their characterization .............................. 69
I.2. Experimental procedure for synthesis of GDC nano powder ................................................. 69
I.2.1.GDC properties and characterization by X-Ray Diffraction .............................................. 70
I.2.2. GDC10 Characterization by SEM .................................................................................... 72
I.2.3.GDC10 characterization by BET ....................................................................................... 73
II. Cathode preparation its properties, and their characterization .................................................. 74
II.1. LSCF48 preparation by solid state synthesis ......................................................................... 74
II.2. LSCF48 characterization by XRD and its properties .............................................................. 75
II.3. LSCF48 characterization SEM and BET ................................................................................. 77
III.Anode properties and their characterization .............................................................................. 77
IV. Conclusion ................................................................................................................................ 80
Patent Protected ................................................................................................................................ 81
Part II ................................................................................................................................................ 82
II.1.Tape casting................................................................................................................................. 82

Table of contents
3
II.1.1.General tape casting principle ............................................................................................... 83
II.1.2.Stability ................................................................................................................................. 83
II.1.3 Solvent .................................................................................................................................. 84
II.1.4. Dispersant ............................................................................................................................ 85
II.1.5 Binder ................................................................................................................................... 85
II.1.6. Plasticizer ............................................................................................................................. 86
II.1.7. Pore formers ........................................................................................................................ 86
II.2. Slurry or suspension preparation ................................................................................................ 87
II.2.1. Preparation of an anode support slurry ................................................................................ 87
II.2.2. Preparation of an electrolyte slurry ...................................................................................... 88
II.2.3. Preparation of cathode slurry ............................................................................................... 88
II.2.4.Preparation of an anode functional layer slurry ..................................................................... 88
II.3. Casting of suspension.................................................................................................................. 89
II.4 Sintering ...................................................................................................................................... 93
II.5 Conclusion ................................................................................................................................... 98
Part III................................................................................................................................................ 99
III.1. Adaptation of new process for fabricating a cell ..................................................................... 99
III.2. Development of new fabrication process by tape casting approach...................................... 100
III.2.1. Tape casting from cathode layer .................................................................................... 101
III.2.2. Optimizing of sintering temperature .............................................................................. 103
III.2. Pore former selection. ...................................................................................................... 108
III.3. Shrinkage measurement. ..................................................................................................... 112
III.4. Optimization of warpage. ..................................................................................................... 113
III.5. Conclusion ........................................................................................................................... 117
Part. IV. Electrochemical results obtained by 10 cm2
active area cells fabricated by new single step
sintering process ............................................................................................................................. 118
IV.1. Cell with starch pore former ................................................................................................ 120
IV.2. Cell with carbon pore former ............................................................................................... 122
IV.3. Effect of cathode layer thickness and carbon pore former.................................................... 124
IV.4. Effect of electrolyte thickness in the cell .............................................................................. 126
IV.5. Effect of using carbon pore former in cathode layer. ............................................................ 128
IV.6. Final optimization performed. .............................................................................................. 130

Table of contents
4
IV.7. Conclusion. .......................................................................................................................... 134
NDA Protected with DLR ...................................................................................................................... 140
Chapter 3: Long term ageing results, development of test bench and stack ....................................... 141
I. Introduction ................................................................................................................................. 141
II. Ageing results of cells .................................................................................................................. 141
III. Products needed for stacking ...................................................................................................... 150
III.1 Interconnectors .................................................................................................................... 150
III.2. Current collectors meshes in stack between cells ................................................................. 150
III.3.Sealants ................................................................................................................................ 151
III.4. Steel plates .......................................................................................................................... 152
III.5. Gas manifolds and gas flow directions .................................................................................. 152
IV. Balance of plant components involved in building of test bench ................................................. 153
IV.1. Furnace selection and requirements .................................................................................... 153
IV.2. Gas module .......................................................................................................................... 155
IV.3. Ceramic bricks ..................................................................................................................... 156
IV.4. Ceramic tubes ...................................................................................................................... 157
IV.5. Current connectors .............................................................................................................. 157
IV. 6. Thermocouples ................................................................................................................... 158
IV.7. Lab View software for data input and acquisition. ................................................................ 159
IV.8. Flow diagram of test bench .................................................................................................. 161
V.Conclusion .................................................................................................................................... 162
General Conclusion ............................................................................................................................. 164
Perspectives ........................................................................................................................................ 166
Table of contents
5
Figure I. 1 Graph showing electricity consumption in Terrawatthour Vs different parts and decades around the world [8]
................................................................................................................................ 18
Figure I. 2 World electricity generation by different fuels [9] .................................................................. 19
Figure I. 3 World energy supply from different fuels [9] .......................................................................... 20
Figure I. 4 Emissions of CO2 in metric tons by different types of fossil fuels with respect to time [9] ...... 21
Figure I. 5 Temperature difference during spring from 1910-2010 across world [10] ................................ 21
Figure I. 6 Efficiency comparison of fuel cells with other power plants [11] ............................................. 23
Figure I.7 Different fuel cells with its corresponding operating temperature and its reactions [13]. ........... 26
Figure I. 8 Graphs showing highest volumteric and gravimeteric enerygy density among its peers [17] .... 28
Figure I. 9 Schematic and working principle of SOFC ........................................................................... 32
Figure I. 10 Graph showing different losses in actual performance of cell .............................................. 35
Figure I. 11 Tubular SOFC design ......................................................................................................... 38
Figure I. 12 Planar SOFC design ........................................................................................................... 38
Figure I. 13 Different types of planar cells ............................................................................................. 39
Figure I. 14 Evolution of ionic conductivity as a function of temperature for different electrolyte materials [13]
......................................................................................................................................................... 41
Figure I. 15 Specific ionic conductivity of electrolyte for IT-SOFC [24] .................................................. 42
Figure I. 16 Ionic conductivities for anode support and electrolyte supported cells ................................. 44
Figure I. 17 Polarization resistance as a function of temperature for major components of a cell ............ 50
Figure II. 1 GDC crystal structure .......................................................................................................... 70
Figure II. 2 XRD of GDC10 powder synthesized by citrate process ....................................................... 71
Figure II. 3a) 3b) GDC nano particles in clusters ................................................................................... 72
Figure II. 4 XRD of GDC10-HP powder ................................................................................................ 74
Figure II. 5 Crystal structure of LSCF48 ................................................................................................ 76
Figure II. 6 XRD pattern of LSCF48 ...................................................................................................... 76
Figure II. 7 LSCF48 SEM picture .......................................................................................................... 77
Figure II. 8 Crystal structure of NiO ...................................................................................................... 78
Figure II. 9 XRD of NiO........................................................................................................................ 79
Figure II. 10 SEM picture of NiO .......................................................................................................... 80
Figure II. 11 Automated tape casting machine ....................................................................................... 90
Figure II. 12 Electrolyte layer ................................................................................................................ 90
Figure II. 13 AFL on top of electrolyte layer .......................................................................................... 91
Figure II. 14 Anode support layer above AFL ........................................................................................ 92
Figure II. 15 Sintering protocol foranode support half cell ..................................................................... 94
Figure II. 16 Sintered half cell ............................................................................................................... 94
Figure II. 17 Full cell by only tape casting Figure II. 18 Sintering protocol for cathode layer ................. 95
Figure II. 19 Cross section of cell by SEM Figure II. 20 Electrolyte layer with 45% of solids ............. 96
Figure II. 21 EDX analysis on an anode layer ........................................................................................ 97
Figure II. 22 EDX spectra on an anode layer .......................................................................................... 97
Figure II. 23 EDX on electrolyte with 55% weight of solids ................................................................... 99

Table of contents
6
Figure II. 24 EDX analysis on half cell containing 55% weight of solids .............................................. 100
Figure II. 25a) Cathode layer b) electrolyte layer on cathode c) AFL and anode support layer on electrolyte, d) green cell before sintering ............................................................................................. 101
Figure II. 26 Full cell by tape casting ................................................................................................... 102
Figure II. 27a) Electrolyte sintered 1100°C b) Electrolyte sintered 1215°C .......................................... 104
Figure II. 28 a) Electrolyte sintered at 1300 °C 28b) Electrolyte sintered at 1400°C ............................. 105
Figure II. 29 Cells sintered at high temperature above 1300°C ............................................................. 105
Figure II. 30 XRD patternof anode different sintering temperature ....................................................... 106
Figure II. 31 XRD pattern of cathode at different sintering temperature ............................................... 107
Figure II. 32 Flaw less cell obtained by only tape casting after sintering ............................................... 108
Figure II. 33 R-Cell of 24 cm2 active area ............................................................................................ 109
Figure II. 34 Cross section of cell with starch poreformer .................................................................... 110
Figure II. 35 a) Cross section of cell with 8% of starch in anode b) 5% of starch in anode .................... 111
Figure II. 36 Cross section of cell with carbon black pore former ......................................................... 112
Figure II. 37 Button cells ..................................................................................................................... 113
Figure II. 38 Button cells after sintering with load ............................................................................... 115
Figure II. 39 cell with 10cm2 active area .............................................................................................. 115
Figure II. 40 Schema of cells preparation for stacking with 36 cm2 cathode active area ........................ 116
Figure II. 41 Optimized cross section of cell ........................................................................................ 117
Figure II. 42 Fiaxell Set up .................................................................................................................. 119
Figure II. 43 Cell with starch poreformer [44] ........................................................................................ 121
Figure II. 44 Cross section of cell ........................................................................................................ 122
Figure II. 45 Electrochemical results of cell with carbon poreformer .................................................... 123
Figure II. 46 Surface and cross section of cell ...................................................................................... 124
Figure II. 47 Electrochemical results of cell with thick cathode layer[44] ............................................... 125
Figure II. 48 cross section of cell with thick cathode layer ................................................................... 126
Figure II. 49 Electrochemical results of thick electrolyte cell[44] ........................................................... 127
Figure II. 50 Cross section showing thick electrolyte ........................................................................... 128
Figure II. 51 Electrochemical result of cell with carbon in cathode layer[44] .......................................... 129
Figure II. 52 Cross section of cell showing pores in cathode layer. ....................................................... 130
Figure II. 53 Cross section of cell ........................................................................................................ 131
Figure II. 54 Final optimized electrochemical results ........................................................................... 132
Figure III. 1 Cell Voltage and Power density Vs Current density [5] ...................................................... 143
Figure III. 2 Long term results showing Cell Voltage Vs Time ............................................................. 144
Figure III. 3 Anode microstructure after reduction ............................................................................... 145
Figure III. 4 Anode surface after 100 Hours ......................................................................................... 146
Figure III. 5 Image of cell with different layers .................................................................................... 146
Figure III. 6XRD pattern before and after reduction ............................................................................. 148
Figure III. 7 XRD pattern of cathode before and after ageing. .............................................................. 149
Figure III. 8 Nickel meshes placed on bipolar plates ............................................................................ 151
Figure III. 9 Interconnector with serpentine flow pattern ...................................................................... 153

Table of contents
7
Figure III. 10 Furnace with heating coils in sides and removed bottom plate ........................................ 155
Figure III. 11 Photo of gas module ....................................................................................................... 156
Figure III. 12 Gas module separated by brick from base plate .............................................................. 156
Figure III. 13 Gas module alligned with ceramic tubes ......................................................................... 157
Figure III. 14 Bottom plates with D40 flanges...................................................................................... 158
Figure III. 15 current connectors and thermocouples fixed in bottom plate ........................................... 159
Figure III. 16 Global view of furnace and software .............................................................................. 160
Figure III. 17 Lab view parameters screen ........................................................................................... 160
Figure III. 18 Flow diagram of test bench [1] ........................................................................................ 161
Table I. 1 Different electrolytes and their TEC values ............................................................................ 46
Table I. 2 Different cathodes and their TEC values ................................................................................ 53
Table II. 1 Density after different sintering temperature ....................................................................... 103
Table III. 1 Results obtained from cell ................................................................................................. 143

Table of contents
8
Introduction
General Introduction
I. General aspects of IT-SOFC ............................................................................................................... 9
II. Previous works done at ICB Laboratory ............................................................................................ 9
II.1. Study of surface properties and volume type oxides of La1-xSrxMnO3±δ ...................................... 9
II.2. Analysis of interfacial properties of system LaMnO3/YSZ ......................................................... 10
II.3 Properties and reactivity of interfacial compounds of La0.8Sr0.2Mn1-yFeyO3±δ compounds as Fuel
cell cathodes .................................................................................................................................. 11
II.4. Preparation and reactivity of interfacial oxide perovskites based on Lanthanum Strontium
chrominum and Ruthenium (LSCrRu) as the anode materials for intermediate (IT-SOFC). .............. 12
II.5. Elaboration and characterization of BaCe(0.9-x)ZrxY0.1O3-δ as electrolyte material for Proton
conducting fuel cells ...................................................................................................................... 12
III. Contribution of this PhD thesis ......................................................................................................... 13
III.1. Fundamental Objectives ......................................................................................................... 14
III.2. Synopsis of Manuscript .......................................................................................................... 14

Introduction
9
I. General aspects of IT-SOFC
Solid Oxide Fuel Cells (SOFC) systems operating with humidified hydrogen as fuel emit
no harmful effluents to atmosphere. This gives major interest on SOFC systems. The
conventional systems use Yttria Stabilized Zirconia (YSZ) as an electrolyte material which
operates best above 800°C imposes serious problems related to cost and commercialization. The
only viable option for effective commercialization seems to be reduction of working temperature
down 700°C or below called as Intermediate Temperature-SOFC (IT-SOFC). This system allows
wide path for selection of new electrode, electrolyte materials, their synthesis process involved
and fabrication process used.
The main goal of this work is to obtain a new inexpensive fabrication process, with large
active area planar IT-SOFC for APU application. This work also covers the development of a
new test bench and stacking of cells. This requires deep understanding, of conventional
electrode, electrolyte materials used, the fabrication process involved, their advantages and
disadvantages in particular.
II. Previous works done at ICB Laboratory
The previous PhD work performed in ICB lab Dijon was given as gist.
II.1. Study of surface and volume properties of oxides type of La1-xSrxMnO3±δ
The objective of the thesis of P. Decorse [1] was to determine and compare the chemical
composition and the oxidation state of Mn, a share in the volume of solid type La1-xSrxMnO3± δ
Introduction
10
and, secondly, in their diapers superficial. The surface layers played an important role in the
overall properties (reactivity at the interface and transport to the electrolyte).
The study showed, in the case of a fine powder of La0.8Sr0.2MnO3, the chemical
composition in the surface layers is very dependent on the conditions of heat treatment under
oxygen. The same was true for the average oxidation state of the Mn ion which is very close to
the Mn4+ state.
In the case of sintered La1-xSrxMnO3± δ with varying compositions of (x = 0, 0.2, 0.5 and
1) in oxygen at high temperature, the surface was enriched in Sr with larger values of x.
Moreover, whatever the composition, oxygen deficiency was always highlighted in the surface
layers. A correlation between the surface concentration of Sr and the level of oxidation of the Mn
was established.
II.2. Analysis of interfacial properties of system LaMnO3/YSZ
The thesis of G. Bertrand [2] aimed at the realization of an experimental model of
LaMnO3 half-cell SOFC. This cell was adapted to the study of the degradation reaction at
interface between the cathode and the electrolyte. This work was also designed to detect the
formation of lanthanum zirconate, La2Zr2O7 at the cathode-electrolyte interface, depending on
the ratio La/Mn and analyze the mechanisms involved.
This study was distinguished by the choice of the synthesis method to prepare thin layer
of the cathode at low temperature: by low pressure-MOCVD. This direct synthesis at low
Introduction
11
temperature (600°C) and using as a substrate for single crystal YSZ has developed an ideal
model system for the study of the degradation of the LM/YSZ interface.
The reactivity of these assemblies at higher operating temperature (1100°C) was
discussed. The scanning Auger microscopy combined with electron diffraction and X-ray
diffraction at grazing incidence had specified both the chemistry and crystallography of the
interface in binding experimental conditions related to the insulating nature of the substrate. Data
on the reaction products and their location depends on the composition of the films; the
temperature and duration of treatment has been presented. A reaction mechanism was proposed
for each chemical composition studied to optimize the aging of the half-cells.
II.3 Properties and reactivity of interfacial compounds of La0.8Sr0.2Mn1-yFeyO3±δ compounds as
Fuel cell cathodes
The PhD work, done by M. Petitjean [3], presents new data on ferromanganites
lanthanum-strontium La0.8Sr0.2Mn1-yFeyO3±δ (noted: LSMF) that can be used as cathode materials
for IT-SOFC (700°C).
XPS analysis, conducted as part of this study showed the positive influence of iron on the
electrocatalytic ability, of LSMF materials. The measurement of S.I.M.S. diffusivity of oxygen,
coupled to a Mössbauer analysis showed that the Fe, little oxidizable in the crystalline network
with respect to Mn, encourages the creation of anion vacancies and hence the diffusion of
oxygen.
The chemical reactivity at 800°C of the electrolyte (YSZ) with the cathode LSMF,
developed by thin layer magnetron sputtering, has also been studied by S.I.M.S., iron also played
Introduction
12
an important role in the degradation of the interface, but greatly improved the mobility of oxygen
vacancies. The optimization of the chemical composition and morphology of the cathode LSMF
proposed was a strong point of this study.
II.4. Preparation and reactivity of interfacial oxide perovskites based on Lanthanum
Strontium chrominum and Ruthenium (LSCrRu) as the anode materials for intermediate (IT-
SOFC).
In the PhD work of L. Combemale [4], new data on the interest of ruthenium doped
lanthanum strontium chromite La1-xSrxCr1-yRuyO3±δ (LSCrRu) as an anode in IT-SOFC are
presented. This also gives insights of micro wave synthesis of mixed oxides allowing shaping of
half-cells and complete cells using sputtering and screen printing methods.
This work also deals with study and analysis of obtained powders as anode materials for
IT-SOFC’s with methane as fuel and its reforming property has been studied in mono-chamber
system coupled with mass spectrometer.
A part of the work has been dedicated to study anode/electrolyte interfacial reactivity
using SIMS and XRD on half cell model after ageing under H2 at 800°C to obtain chemical
composition of a film after heat treatment. The complete cells tested under working conditions,
presents the selective dissolution of LSCrRu film, and also shows microstructure modification of
anode/electrolyte interface which was not seen in XPS, SEM-EDX techniques.
II.5. Elaboration and characterization of BaCe(0.9-x)ZrxY0.1O3-δ as electrolyte material for
Proton conducting fuel cells
The work of S. Ricote [5] dealt with the study of BaCe (0.9-x) ZrxY0.1O3-δ (x=0.3, 0.7 and
0.9) as electrolyte for Proton Conducting Fuel Cells (PCFC). The powders were synthesized by

Introduction
13
solid state reaction, and sintered to form dense pellets at 1700°C. Its chemical, morphological,
structural, and mechanical characterizations were done on samples using, ICP AES, SEM, XRD,
Raman and dilatometery techniques respectively.
SIMS, XPS and XRD studies showed the insertion of protonic species in the samples,
when treated in a moisturized atmosphere. Water uptake experiments provided quantification of
the proton content between 400°C and 600°C: the protonic concentration increases with
increasing Ce content and with decreasing temperature. The DC conductivity measured in wet
atmosphere was expressed as the sum of a p-type component, prominent at high oxygen partial
pressure, and an ionic contribution. A study of conductivity isotope effect revealed a significant
protonic conductivity at 500°C and 600°C. When the cerium content increases, the activation
energy, determined from Arrhenius plots of conductivity, increases and the resistivity of the
grain boundaries decreased compared to that of bulk.
III. Contribution of this PhD thesis
The work presented here is the knowledge of the phenomena, obtained during the
development of new simplified fabrication process of planar IT-SOFC with large active area.
The development, optimization of the new simplified process [6] to achieve a large area planar
cell, their limiting factors and difficulties in obtaining the cells will be discussed. The ultimate
goal is to i) prepare large planar cells of active area 25 cm2 in first instance. ii) Build a new test
bench for adapting this geometry, iii) testing their electrochemical performance.
The new fabrication process, its optimization partly with respect to factors such as i) pore
formers, ii) thickness of layers, iii) Optimization of sintering temperature are discussed.

Introduction
14
The long term ageing performances in real time working conditions were studied and its
results are presented. The products required and process involved in developing the new test
bench and stack are described.
III.1. Fundamental Objectives
The fundamental objectives are:
- Fabrication of large active area planar cells by simple and cost effective process for
stacking ;
- Obtaining 400 mW.cm-2 for large area cells ;
- Studying long term ageing performance of single cell under real working conditions
- Building a new test bench to fit the stack geometry;
III.2. Synopsis of Manuscript
The manuscript is divided in three main chapters. The first chapter deals with a general
introduction which briefly presents the history of energy consumption and the necessity to use
fuel cells. It gives insights of different types of fuel cells, and their working principles. It also
explains the materials used, its selection criteria as an anode, cathode, an electrolyte, an anode
functional material, for IT-SOFC application; the different fabrication process used in the
preparation of fuel cell.
The second chapter describes the synthesis of nano, bulk materials of cathode and
electrolyte required for the work. It gives detailed study of the new fabrication process for
obtaining planar cells with large active area. The brief insights about the progress, difficulties

Introduction
15
faced, the optimization of single cell to achieve higher performance, and its supporting
electrochemical results are discussed.
The third chapter deals with regards to the preparation of test bench. It gives
information’s of stack preparation and test bench preparation, like materials needed and used. It
also throws light on long term ageing test results obtained.
The last part will deal with conclusions and perspectives of this work.

Introduction
16
Chaper 1. Presentation of fuel cells as an energy transformer
Chapter 1: Presentation of fuel cells as an energy transformer
Chapter 1: Presentation of fuel cells as an energy transformer .............................................................. 17
Part I. General Introduction ............................................................................................................... 17
I. The challenge of climate changes ................................................................................................ 17
II. Need for alternative energy. ...................................................................................................... 22
III. History of fuel cell, its types and working principles .................................................................. 24
Part II: Fuel cells working principles, Materials and Techniques used ................................................. 32
I. Solid Oxide Fuel cells working principles ..................................................................................... 32
II. Deviation from theoretical to actual performances .................................................................... 34
III. Different designs of SOFCs ........................................................................................................ 37
IV. Materials for IT-SOFC’s ............................................................................................................. 40
V. Cell preparation techniques ....................................................................................................... 57
V.2. Physical vapour deposition ...................................................................................................... 58
VI. Scope of this Thesis ................................................................................................................... 60

Chaper 1. Presentation of fuel cells as an energy transformer
17
Part I. General Introduction
I. The challenge of climate changes
Since the beginning of an epipaleolithic age, the development of industries from the
nomadic people has led to committal of energy for different purposes. This need for energy has
boosted with the different groups of people, and started increasing exorbitantly with the ages.
Due to the increase in population and the development of modern civilization, this change has
been accompanied with exponential increase in demand for energy and power needs from the
people. From then, people have started using variant sources of available energy within easy
reach. Vast supply of energy needs was fulfilled by combustion of fossil fuels and woods since
industrial revolution [7]. People started to exploit coal and crude oil at a rapid rate which is cheap
compared to renewable energy sources. With the development of science and technology and
industrial modernization and globalization in the modern era, the energy consumption boomed
very high and leads to new inventions. The Figure I.1 shows the electricity consumption in
different regions of world from the time scale ranging from 1980 to 2030 [8]. This figure depicts
the electricity consumption in Asia region which is expected to be doubled in the coming
decades. The increase of electricity needs from other parts of world is also shown in the Figure
I.1.

Chaper 1. Presentation of fuel cells as an energy transformer
18
Figure I. 1 Graph showing electricity consumption in Terrawatthour Vs different parts and
decades around the world [8]
Heat engines, power plants which produce necessary energy and electricity have started
using fossil fuels to larger extent which in turn leads to rapid consumption and utilization rate of
non renewable energy sources such as fossils fuels. Figure I. 2 shows the electricity generation in
Twh (Terrawatthour) by different types of fuels. From the Figure I.2 it is clear that until, now the
majority of electricity is produced by burning fossil fuels in power plants. The major
atmospheric pollution arises due to the burning of fossil fuels to produce electricity.

Chaper 1. Presentation of fuel cells as an energy transformer
19
Figure I. 2 World electricity generation by different fuels [9]
So from the above graph it is also evident that fossil fuel demand increase greatly for the
electricity generation. Due to this reason, there is an ecological imbalance like depletion of fossil
fuels. This adds to significant increase in the contribution and concentration of carbon di-oxide
with other green house gases (GHG) in atmosphere. This increase of GHG ratio in atmosphere
causes series of problems including atmospheric pollution, large impact on global warming,
climate change and health hazards of human kind, which has a moderate effect in the present
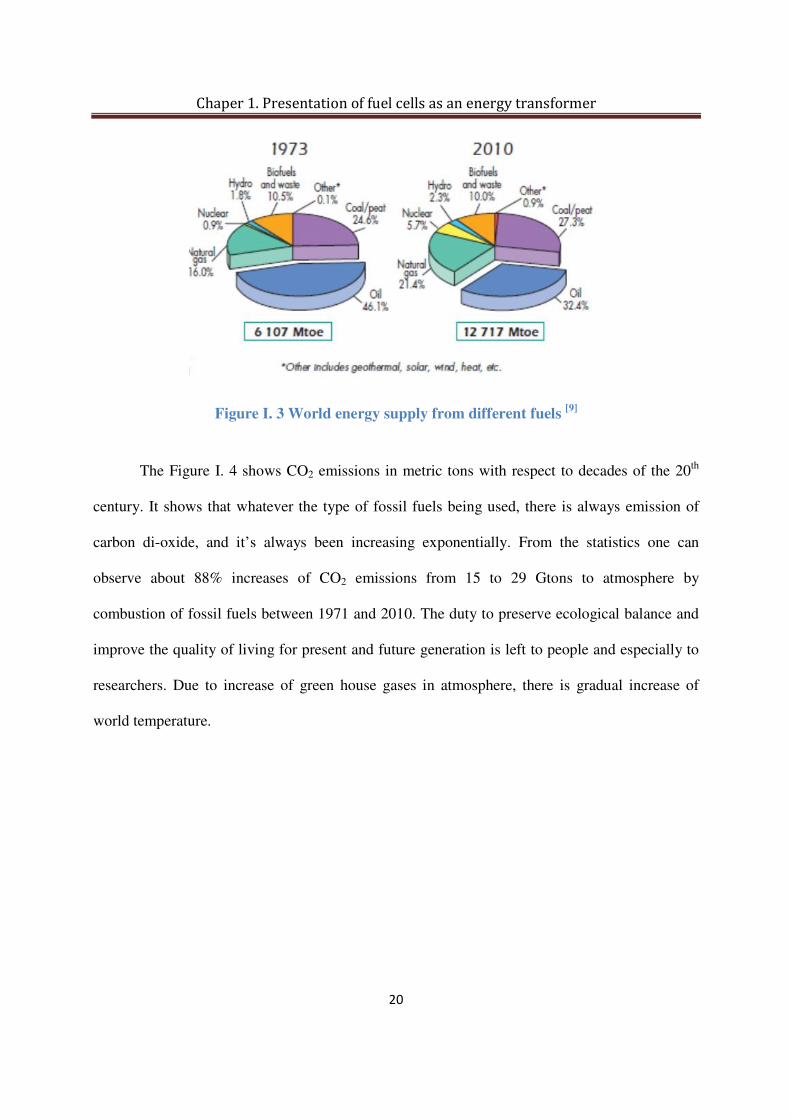
generation but is expected to have a drastic effect on the future generations to come. Figure I.3
pie chart shows the energy supply from different sources. It is evident that during the
development of technology, the dependence of fossil fuels was slowed down from 86.7% in 1973
to 81.1% in 2010 [9].
Chaper 1. Presentation of fuel cells as an energy transformer
20
Figure I. 3 World energy supply from different fuels [9]
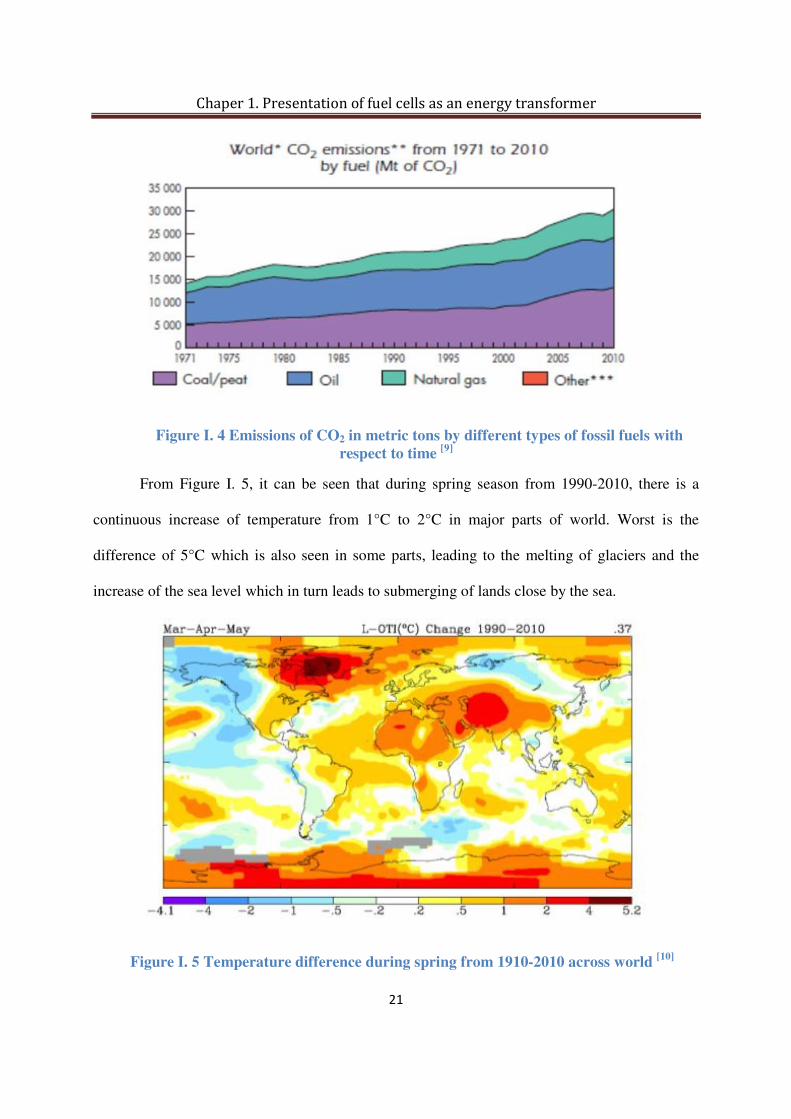
The Figure I. 4 shows CO2 emissions in metric tons with respect to decades of the 20th
century. It shows that whatever the type of fossil fuels being used, there is always emission of
carbon di-oxide, and it’s always been increasing exponentially. From the statistics one can
observe about 88% increases of CO2 emissions from 15 to 29 Gtons to atmosphere by
combustion of fossil fuels between 1971 and 2010. The duty to preserve ecological balance and
improve the quality of living for present and future generation is left to people and especially to
researchers. Due to increase of green house gases in atmosphere, there is gradual increase of
world temperature.
Chaper 1. Presentation of fuel cells as an energy transformer
21
Figure I. 4 Emissions of CO2 in metric tons by different types of fossil fuels with
respect to time [9]
From Figure I. 5, it can be seen that during spring season from 1990-2010, there is a
continuous increase of temperature from 1°C to 2°C in major parts of world. Worst is the
difference of 5°C which is also seen in some parts, leading to the melting of glaciers and the
increase of the sea level which in turn leads to submerging of lands close by the sea.
Figure I. 5 Temperature difference during spring from 1910-2010 across world
[10]

Chaper 1. Presentation of fuel cells as an energy transformer
22
II. Need for alternative energy.
Using fossil fuels leads to depletion of these resources, and create ecological imbalance
in reserves and the increase of green house gases in atmosphere. This in turn affects the increase
of atmospheric temperature gradually, thus leading to the melting of glaciers which
automatically increase the sea level causing coastal areas to submerge. GHG also affect mankind
badly with respect to health hazards. So all this detrimental effects to atmosphere and mankind
suggests that there is a urgent need for researchers to save fossils fuels for the future generations,
also to save present and future generations from all possible adverse effects.
The hard work of researchers and scientists have left us in the present stage of extensive
and deep research on alternative energy fuels, renewable energy conversion, its storage, and
usage of highly efficient systems.
The alternative energy research has been carried out for many decades on different fields
like wind energy, nuclear energy, hydrothermal energy, solar energy, geothermal energy,
biomass energy, marine energy and electrochemical energy. Among them, electrochemical
energy has been widely spread due to the availability of raw materials in lab scale that can be
commercialized into variety of household, portable and industrial applications. Interest in fuel
cells started growing steadily with the realization of questions of how to provide electrical
energy for supporting world growing energy economy without pollution. Today’s fuel cells have
an answer to all the questions and have an immiscible power to supply part of world energy
needs for the future in case of oil crisis. This also has a great advantage concerning energy
Chaper 1. Presentation of fuel cells as an energy transformer
23
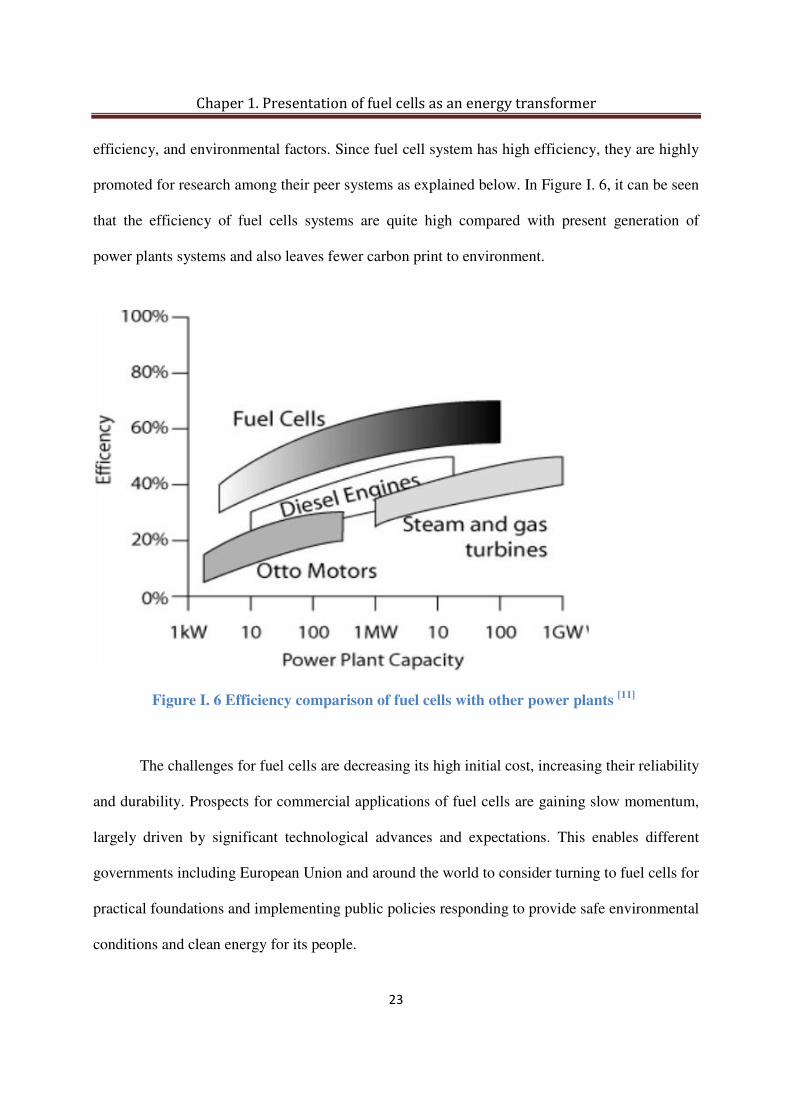
efficiency, and environmental factors. Since fuel cell system has high efficiency, they are highly
promoted for research among their peer systems as explained below. In Figure I. 6, it can be seen
that the efficiency of fuel cells systems are quite high compared with present generation of
power plants systems and also leaves fewer carbon print to environment.
The challenges for fuel cells are decreasing its high initial cost, increasing their reliability
and durability. Prospects for commercial applications of fuel cells are gaining slow momentum,
largely driven by significant technological advances and expectations. This enables different
governments including European Union and around the world to consider turning to fuel cells for
practical foundations and implementing public policies responding to provide safe environmental
conditions and clean energy for its people.
Figure I. 6 Efficiency comparison of fuel cells with other power plants [11]

Chaper 1. Presentation of fuel cells as an energy transformer
24
III. History of fuel cell, its types and working principles
III.1. History of fuel cells
In early 1839, Sir William Robert Groove, a welsh judge and physicist was the first to
discover the operating principles of fuel cell by reversing the electrolysis of water to produce
electricity by introducing hydrogen and oxygen. Few decades later, the name was coined as fuel
cells in 1889 by Ludwig Mond and Charles Langer who build big working fuel cells which gave
enough electricity by using air as oxidant and industrial coal gas as fuel. Some are also claiming
that William White Jacques was the one to define the term fuel cells. The serious research in the
field of fuel cells took place nearly after 100 years of initial proposal of fuel cell operating
principles.
“Fuel cell is an electrochemical device that continuously converts chemical energy to
electrical energy as long as fuel and oxidant are supplied” [12].
In 1920, fuel cell research in Germany has opened the gateway of carbonate cycle and
Solid Oxide Fuel Cells (SOFC) of today. In 1932, Francis T. Bacon started an extensive research
in the field of fuel cells. After almost three decades, he demonstrated 5 kilowatt (kW) fuel cell
and named it as “Bacon cells”. During early 1960, General Electric power has designed fuel cell
system that powered NASA’s Gemini and Apollo space shuttles. These also had an additional
advantage by supply water to the crew members.

Chaper 1. Presentation of fuel cells as an energy transformer
25
During the same decade Baur and Pries, in 1937 [12], developed SOFC. They investigated
ceramic materials as electrolyte from 1050°C to 1100°C, which showed high resistance due to its
large volume in the system. Series of compositions was tested and the term “Nernst mass” was
coined. It is a mixture of 85% of ZrO2 and 15% of Y2O3, which exhibited the least resistance
among the different compositions studied. In 1962, Ruka and Weissbart from Westinghouse
Electric Corporation developed tubular SOFC with 85% ZrO2 and 15% CaO as an electrolyte,
porous platinum as electrodes. From then there is continuous research and developments taking
place with SOFC technology to make it commercially viable and reliant systems for power
generation.
III.2. Fuel cell Types
Scientists and researchers have designed many different types and sizes of fuel cells in
search of higher efficiency. The technical insights of each kind vary. Mainly fuel cell developers
are constrained by the choice of electrolyte. The selection of materials for electrodes depends on
electrolyte. Today, the main electrolyte types used in fuel cells are alkali, molten carbonate,
phosphoric acid, proton exchange membrane, direct methanol, and solid oxide. The first three
types use liquid as an electrolyte; last three use solid electrolytes: proton exchange and direct
methanol using polymer as an electrolyte and solid oxide using ceramic material as an electrolyte
respectively. The type of fuel to be fed depends on electrolyte, and also on working temperature.
Some types need pure hydrogen for example, polymer electrolyte is very sensitive to impurities,
hence it requires pure hydrogen. Solid oxide (ceramic electrolyte) can handle minor quantities of
impurities since its operating temperature is very high around 1000°C. Liquid electrolytes
circulate in alkali fuel cells, which require pumps. The type of electrolyte also dictates the

Chaper 1. Presentation of fuel cells as an energy transformer
26
operating temperature of cells, for instance “Molten” carbonate run hot, just as the name implies.
The operating temperature of this type is around 600°C.
Figure I.7 Different fuel cells with its corresponding operating temperature and its
reactions [13]
.
The Figure I.7 explains different types of fuel cells, their operating temperature and
conducting ions involved in each type of cells.
In this study, SOFC is of main interest.
Solid Oxide Fuel Cells: This type of fuel cells uses hard ceramic compounds like calcium or
zirconium oxides as electrolytes. Efficiency of this type of systems is about 60% and 85% in
cogeneration and its operating temperature varies from 500°C to 1000°C. Stack output are up to
Chaper 1. Presentation of fuel cells as an energy transformer
27
100 kW. At such high temperature a reformer is not mandatory to extract hydrogen from the fuel
in case of usage of hydrocarbons. The waste heat can be recycled to make additional electricity
and improve efficiency of systems. However, the high temperature limits the applications of
SOFC units, and also it will be large in size to accommodate in transportation systems. The cells
operated in range of temperatures from 500°C to 700°C are called as an IT-SOFC which uses
doped cerium oxide as their electrolytes.
III.3. Motivation to choose SOFC and IT-SOFC
SOFC’s are unique systems among its peers, which have an ability to use wide range of
fuels like biogas, gasoline, hydrogen, jet fuel, natural gas, or any other oxidizable fuel for its
operation. These systems have been very prolific in doing this with high electrical efficiency of
about 50-65% in lower heating value of fuel (LHV), and for cogeneration systems with
combined heat and power efficiency is expected to reach 80-90% [14]. Further combined heat and
power generation systems demonstrated in 2009 by Japan new energy foundation achieved 70%
efficiency under working conditions, which is generally twice of fossil fuel power plants that can
be confirmed from Figure I. 6 [15]. This is possible because of low exergetic losses with SOFC’s
[16].
Furthermore SOFC have the highest gravimetric and volumetric energy density of any
energy technology. This can be seen from Figure I.8 [17].

Chaper 1. Presentation of fuel cells as an energy transformer
28
Figure I. 8 Graphs showing highest volumteric and gravimeteric enerygy density among its
peers [17]
The other major reason for choosing SOFC is that, it is reliable for long term, this was
recently demonstrated in FZ Julich for 40,000 hours (5years) with lowest possible
degradation[18]. High efficiency is directly related to reduced costs for heat, power and possible
extension of fossil fuel reserves for future generation. SOFC’s don’t produce sulphur and
nitrogen oxide by burning fossil fuels, so SOFC are highly attractive as, clean, almost non
polluting source of energy and it also reduce health related expenditure of common people. The

Chaper 1. Presentation of fuel cells as an energy transformer
29
effluents of SOFC’s operating with hydrocarbon contain humidified CO2, and thus it can be used
in CO2 capturing technology, reducing the green houses gases emitted in to the atmosphere.
SOFC’s can easily adopt any fuel supply. They also serve as secure and reliable
stationary application in remote places, that can be used as clean and continuous power sources
with lower emissions compared with other energy sources. Since SOFC’s can be easily adapted
as stationary application source, as they tend to reduce the transmission losses caused in long
distance transmission of electricity [19].
SOFC’s does not need noble metals for operation, high quality of exhaust heat is useful
for cogeneration in large scale. They do not have problems with electrolyte management and
electrolyte losses are eliminated. In case of liquid electrolyte, they can cause corrosion which is
not seen in SOFC.
All the other power plants be it, a thermal power plant, solar power plant, hydro
powerplant, wind power plant, requires huge volume of land areas for large group of population.
SOFC’s use much smaller land areas compared to the others and thus helps in cost savings with
related to land. Other thermal power plants needs huge quantity of water for cooling purposes
where as the amount of water used for SOFC’s are quite low, thus helping in water conservation
and cost related to it [20].
SOFC’s are fuel flexible, they can reform methane internally when using carbon
monoxide as a fuel. This internal reforming is heat absorbing reaction where it tends to cool the
Chaper 1. Presentation of fuel cells as an energy transformer
30
stack and module, which can pave the way to reduce power supply needed for reforming.
SOFC’s are partly tolerant to sulphur impurites in fuels supply, thus helping it to adapt to present
commercial desulphurization process.
SOFC’s have the modularity characteristics, means these can be easily increased or
decreased in size. Thus SOFC modular cells can be tailored to any size, according to the
requirements. Since the efficiency of fuel cell is relatively independent of size, it can be easily
designed to follow loads quickly without much efficiency loss at part load operations.
With the ability to produce in modular sizes, they can be easily placed in different
locations with minimum sitting requirements. They don’t have moving parts, so the operation of
SOFC is quiet, the acceptable sound arises only from auxillary equipments. Consequenly this
makes it suitable to adapt them in its work places directly such as residential areas, malls,
offices.
Even with various advantages of SOFC, the elevated operating temperature of
conventional SOFC (800°C-1000°C) imposes its own limitations in selection of choice of
materials, its compatibility to use in large scale and implementation of expensive materials for
short life time. This results in new research interest in the same field with respect to reduction of
operating temperature, while maintaining all its advantages like high power density, high
efficiency and usage of different fuels. Generally from conventional operating temperatures
(800°C-1000°C) it is reduced to intermediate range of (500°C-700°C) and called as
Intermediate-Temperature Solid Oxide Fuel Cells (IT-SOFC). This reduction of temperature
Chaper 1. Presentation of fuel cells as an energy transformer
31
adds more advantages like reduction cost of selection of materials. By this way it enhances the
possibility of commercialization, like the reduction of the cost of the whole system. It also
increases its durability by reducing the possible degradation of materials caused in reaction at
high temperature and interdiffusion. This IT-SOFC solves the problem of thermal cycling and
increases the overall performance of the system. On contrary reducing the operating temperature
reduces the ionic conductivity of electrolytes resulting in fewer cell voltage and power. Thus for
facing effective commercialization of IT-SOFC, the main challenges like the selection of right
materials, and a cost effective fabrication process should be addressed.

Chapter 1. Presentation of fuel cells as an energy transformer
32
Part II: Fuel cells working principles, Materials and Techniques used
I. Solid Oxide Fuel cells working principles
Fuel cells are devices which generate electricity, provided the fuel gases are supplied
continuously. All SOFC’s has three parts namely, porous positive electrode called cathode,
porous negative electrode called anode and dense electrolyte. The fuel, oxidants are passed
through anode and cathode respectively. In case of IT-SOFC the fuels can be hydrogen, or
hydrocarbons and oxidant can be air or oxygen. In this case, hydrogen was taken as fuel and air
as an oxidant. These two gases are separated by dense electrolyte in the cell. In cathode side
where air is supplied the catalytic activity of the cathode itself dissociates and reduce the
adsorbed oxygen to form oxygen ions. These oxygen ions pass through ionic conducting
electrolyte to the anode side where oxidation takes place, thus reducing the incoming hydrogen
to form water and releases electrons. The presence of electrons in anode side creates higher
electronic potential at one end and creates a potential difference between two electrodes causing
passage of electrons through the external circuit producing electricity. This way of producing
electricity from chemical reaction is called an electrochemical reaction. The schematic and
working principle of SOFC is shown in Figure I. 9.
Figure I. 9 Schematic and working principle of SOFC

Chapter 1. Presentation of fuel cells as an energy transformer
33
The cell reaction taking place at the cathode, reduction of oxygen gas, is given by equation 2.1
X
OOg OeVO ⇒++•• '
)(2 2)21( (2.1)
The cell reaction taking place at the anode, reduction of hydrogen, is given by equation 2.2
'O)g(2
XO)g(2 e2VOHOH ++⇒+
•• (2.2)
The overall cell reaction is given by equation 2.3
)(2)(2)(2 21 ggg OHOH ⇔+ (2.3)
The maximum electrical work which can be produced from an electrochemical cell at standard
temperature and pressure is given by change in the Gibbs free energy ∆G°
∆G° = - nF.E° (2.4)
n is number of free electrons, F is Faraday’s constant 96485 C.mol-1. E° is the reversible
potential of the cell considering standard state for reactants and products at (25°C, 1 atm).
Considering a cell reaction
�� + �� => + �� (2.5)
The Gibbs free energy of a reaction at standard condition can be given by
∆G= ∆G° - RT ln[�]�[�]�
[�]��[�]� (2.6)
Substituting equation 2.4 in equation 2.6 gives
E= E°- ��
��ln
[�]�[�]�
[�]�[�]� (2.7)
This shows that potential of a fuel cell can be directly related to concentration of products and
reactants.

Chapter 1. Presentation of fuel cells as an energy transformer
34
The concentration which contributes to chemical activity is also related to partial pressures of
gases. In case of hydrogen and oxygen fuel cells, 2 electrons are involved and the equation can
be written as
O2 + 4H+ + 4 e - 2 H2O (2.8)
equation 2.8 another represention of linear combination of equation 2.1 and 2.2 where E° =1.23V
E= E°+ ��
��ln
!". (%")'"(
(!")) (2.9)
The equilibrium voltage or open circuit voltage (OCV) is the one at which there is no net current
flowing through the cell.
R is the universal gas constant 8.3144 J.mol-1.k-1. T is temperature, PO2 is the partial pressure of
oxygen at cathode and PH2 is the partial pressure of hydrogen. The OCV at ideal conditions for
pure hydrogen and oxygen is 1.23 V. The obtained equilibrium voltage will be less compared to
theoretical OCV due to losses. The equilibrium voltage obtained generally decreases with
increasing temperature, and the cell is more efficient at higher temperature due to lower
electrical losses.
II. Deviation from theoretical to actual performances
Fuel cells are not subjected to Carnot limitations, they have three times higher efficiency
compared to internal combustion engine. At higher temperature of about 900°C their efficiency
reaches to 70%, when it is connected to external devices, the internal resistance increases and
potential decreases due to various phenomena occurring at the cell.
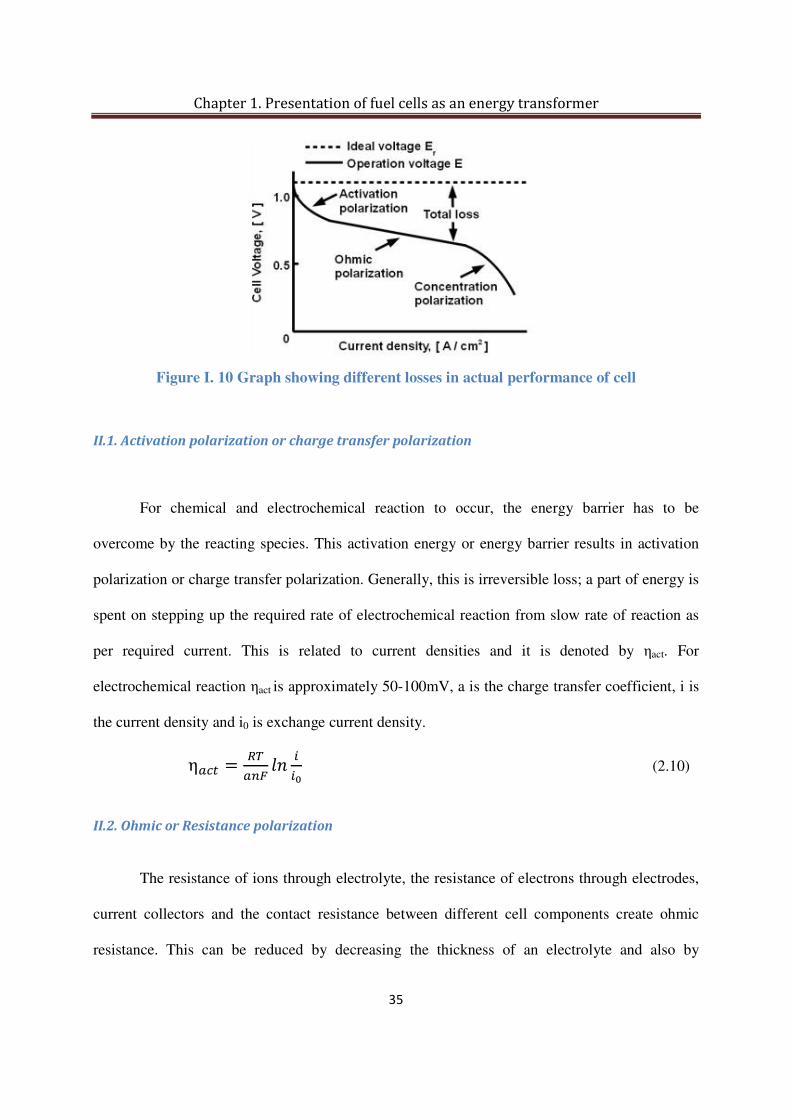
They can be explained by the following picture (see Figure I. 10).
Chapter 1. Presentation of fuel cells as an energy transformer
35
Figure I. 10 Graph showing different losses in actual performance of cell
II.1. Activation polarization or charge transfer polarization
For chemical and electrochemical reaction to occur, the energy barrier has to be
overcome by the reacting species. This activation energy or energy barrier results in activation
polarization or charge transfer polarization. Generally, this is irreversible loss; a part of energy is
spent on stepping up the required rate of electrochemical reaction from slow rate of reaction as
per required current. This is related to current densities and it is denoted by ηact. For
electrochemical reaction ηact is approximately 50-100mV, a is the charge transfer coefficient, i is
the current density and i0 is exchange current density.
�+ =��
���,-
.
./ (2.10)
II.2. Ohmic or Resistance polarization
The resistance of ions through electrolyte, the resistance of electrons through electrodes,
current collectors and the contact resistance between different cell components create ohmic
resistance. This can be reduced by decreasing the thickness of an electrolyte and also by

Chapter 1. Presentation of fuel cells as an energy transformer
36
improving the conductivity of electrolyte materials. All the electrolyte and electrode materials
undergo ohmic losses quoted ηohm. The ratio of ohmic loss to current is given by
η)01 = 2. 3 (2.11)
Where I is current and R is total ohmic resistance of the cell (ionic+contact+electronic).
II.3. Diffusion or concentration polarization
The mass transport becomes a limiting factor when the flow of concentration of reactants
or removal of products from the electrochemical sites is slower than the corresponding charging
or discharging current. This occurs mainly due to concentration gradient and at higher current
density; it can be reduced by using optimized electrode microstructures. It is denoted byηcon.
η�)� =��
��ln(1 −
.
.6) (2.12)
il is limiting current.
The actual voltage of the cell is given by
7 = 8 − η9:; − η<=> − η:<? (2.13)
Even after the different losses it is still possible to have an efficiency ε of cell. The total
efficiency of cell is given as the product of different efficiency related to different losses.
ε = εv.εf.εh (2.14)
Where εv is voltage efficiency εf is fuel efficiency and εh is heating efficiency
εv is the ratio of actual voltage obtained to the OCV
εA = B
CD�E (2.15)
Chapter 1. Presentation of fuel cells as an energy transformer
37
εh is the heating efficiency. It is the ratio of the amount of enthalpy of fuel species present in fuel
to generate electricity ∆H0 to total enthalpy of all combustible species in the fuel ∆Hm.
ε0 =FG/
FGH (2.16)
εf is the fuel efficiency and also called as fuel utilization. This the ratio of fuel used in the
process to fuel fed to the system.
εI =JKLMKNLO
JKLMPLO;<;=LNQN;L> (2.17)
The total efficiency of SOFC system can give more than 60% electrical efficiency. The overall
efficiency can reach to 85% in combined heat and power systems CHP.
III. Different designs of SOFCs
One of the main concerns related to effective commercialization of SOFC lies with its
design. Recently, there are different designs of fuel cells which can be sub-categorized under two
main designs namely planar and tubular. The tubular design was investigated and first put
forward by Siemens Westinghouse Power Corporation in 1960’s [21]. These cells are
predominantly with diameter greater than 20 mm and length 1.5m. It was cathode supported cell
fabricated by electrochemical vapor deposition. The air flowed through the cathode in the center
of tube and fuel hydrogen in same direction but outside the tube. Dense electrolyte serves as a
barrier between them. The main snags for this type of cells are high manufacturing costs, low
power density and high polarization resistance compared to its planar peer. The Figure I.11
shows the tubular SOFC. Micro tubular SOFC are used for miniature electrical appliances. The
only advantage of this type is using cheap sealing materials; it can also be used as seal less stack
sometimes. They performed for 70,000 hours with 0.1% degradation per 1000 hours [22].

Chapter 1. Presentation of fuel cells as an energy transformer
38
Figure I. 11 Tubular SOFC design [21]
In planar SOFC’s the anode, cathode and electrolyte were sandwiched as flat plate which
are connected in series. This type enjoys various advantages with its peer, like low polarization
losses, high power density, ease of fabrication by conventional technique at low cost, provides
negligible leakage through electrolyte and avoids short circuit.
Figure I. 12 Planar SOFC design [21]
The Figure I.12 shows different parts of planar SOFC necssary to form a stack. The three major
sub type of planar cell are rigorously studied.

Chapter 1. Presentation of fuel cells as an energy transformer
39
i) Self supported or electrolyte supported cells (ESC): The electrolyte in these cells serves as
mechanical support and on which electrodes are fabricated. The main disadvantages of these
cells are higher resistance due to low conductivity of the electrolyte and higher operating
temperatures are required to reduce its ohmic losses. Figure I.13 explains different types of
planar cells.
Figure I. 13 Different types of planar cells
ii) Cathode supported cells (CSC): In this type, cathode serves as mechanical support on which
electrolyte and anode are fabricated. It enjoys low operating temperature by use of thin
electrolyte and it suffers from low conductivity, high concentration losses due to thick cathode
layer.
iii) Anode supported cells (ASC): This type of cells have high power density, low polarization
losses, highly conductive anode, and low operating temperature by use of thin electrolyte. In this
type, anode serves as mechanical support and also reduce the polarization losses occurring in the
cells. Due to its advantages this type of cells is studied in detail and its fabrication process will
be explained in later part of this thesis. From now on, the focus in this work will be towards only
anode supported planar cells. All materials requirements and fabrication types will be choosen
for ASC.
Chapter 1. Presentation of fuel cells as an energy transformer
40
IV. Materials for IT-SOFC’s
In the last four decades, SOFC is extensively studied for its greatest advantages like
higher efficiency, low pollution, no noise, ability to use variety of fuels. The main challenge is to
make it a strong competitor among the present energy technologies and as a reliable alternative
energy source of the future to lead it to commercialization.
The main problems focused in research are to develop i) high quality conducting
materials for electrolyte and electrodes, ii) reduce the cost of fabrication of cells, iii) increase
performance at low temperature for thus making it available for transportation applications, iv)
use of less expensive catalysts or no catalyst, v) reducing the degradation of cells and increasing
their reliability, vi) modularity in design to adapt to consumer specification, vii) usage of low
cost, toxic free sealants, coatings and interconnectors for stacks to reduce cost of systems.
There are different views in literature with respect to electrodes and electrolyte. The main
requirements to choose different electrode and electrolyte materials are discussed below.
IV.1. Electrolytes
SOFC electrolyte is a solid non-porous ceramic oxide material possessing ionic
conductivity and should conduct oxide ions through them. There are some specific
characteristics that electrolyte should possess for its usage in SOFC. The general requirements
are as follows:
1) It should be ionically conductive [23]
2) Electronically insulating,

Chapter 1. Presentation of fuel cells as an energy transformer
41
3) Chemically stable at high temperature (500°C-700°C for IT-SOFC,800°C- 1000°C for
SOFC) ,
4) Chemically stable in reducing and oxidising environments,
5) Should be as in expensive as possible,
6) Should be gas tight/free of porosity,
7) Their Thermal Expansion Coefficient (TEC) should match electrodes and
corresponding contacting elements.
Figure I. 14 Evolution of ionic conductivity as a function of temperature for different
electrolyte materials [13]
Figure I.14, shows the different possible electrolyte and its ionic conductivity at different
temperatures. In SOFC, the operating temperature plays a major role in selecting electrolyte
materials. Generally electrolytes for SOFC are classified under four categories namely i) fluorite

Chapter 1. Presentation of fuel cells as an energy transformer
42
based materials (doped Zirconia oxide, Ceria oxide, Bismuth oxide and Pyrochlore materials),
ii) perovskite based materials, and related growth structures (Lanthanum gallate, brown
millerites, BiMeVOx), iii) Lanthanum based materials (LAMOX) and iv) apatites with general
formula [M10(XO4)6O2]. For intermediate temperature (500°C-700°C) the electrolyte should be
very thin of about 10-20µm to reduce polarization losses and it is generally fabricated on either
anode or cathode substrate. The Figure 1.15 represents the specific ionic conductivity of
electrolytes for intermediate temperature range.
Figure I. 15 Specific ionic conductivity of electrolyte for IT-SOFC [24]
The values shown above are tending to change according to fabrication technique,
sintering process, sintering temperature and the microstructure of the material. Generally fluorite
materials are doped like Zirconia with Scandia but it’s costly. Yttria Stabilized Zirconia (YSZ)

Chapter 1. Presentation of fuel cells as an energy transformer
43
exhibits best performance in operating temperature range of 800-1000°C and present
compromise between price and performance. Normally, 8% doped YSZ possess ionic
conductivity ranges between 5.0 x 10⁻² S.cm-1 and 6.2 x 10⁻² S.cm-1 at 800°C and 600°C [25].
Replacing yttria by scandia gives higher ionic conductivity than YSZ but yttria is more
commonly available and low cost material compared to expensive Scandium. This zirconia
doped materials tends to react with lanthanum based cathode and hence while using them in a
cell, a barrier layer between electrolyte and cathode is necessary. It results in low ionic
conductivity at intermediate working temperature range.
Doped ceria discovery was exciting and it helped to reduce the operating temperature,
and it was sufficient to replace YSZ for the intermediate temperature range. Gadolinium Doped
Ceria (GDC) has the highest ionic conductivity at temperature range of 500-650°C, thus making
it the best suitable candidate for IT-SOFC. The conductivity of Ce0.8Gd0.2O1.9 is 6.5 x 10⁻² S.cm-1,
1.3 x 10⁻² S.cm-1 at 800°C and 600°C, respectively [26-32]. The other available doped ceria’s are
Yttria Doped Ceria (YDC) [33], Samarium Doped Ceria (SDC) [34], but their conductivities are
lower than GDC. The ceria based electrolytes have some instability and suffers from partial
reduction of Ce4+ to Ce3+ at low partial pressure of PO2 at temperature above 650°C. The anode
degradation also affects this type of electrolyte material and cause lattice expansion, creating
micro cracks in the electrolyte, thus in turn reduces the OCV. Sometimes these cracks also cause
short-circuit of cell by electronic conduction through them, and make the cell dead completely.

Chapter 1. Presentation of fuel cells as an energy transformer
44
Figure I. 16 Ionic conductivities for anode support and electrolyte supported cells
The Figure I.16 shows ionic conductivities of different electrolytes suitable for electrolyte
supported cells and anode supported cells.
To address the problem of choosing the best ceria electrolyte for intermediate range,
investigations were carried on doping levels, maintaining high ionic conductivity at low
temperatures. Ce0.9Gd0.1O1.95 (GDC10) was chosen as an ideal candidate for IT-SOFC operation.
The other perovskite materials such as lanthanum gallates doped with strontium and manganese
[LaxSr1 - x GayMg1- yO3 (LSGM)] were also studied as an alternative to YSZ. These materials
exhibited higher ionic conductivity than YSZ and GDC, the ionic conductivity of
La0.8Sr0.2Ga0.8Mg0.2O3, (LSGM) at 800°C was found be to 0.1S.cm-1 [35], it has the lowest
possible electronic conductivity at low partial pressures of oxygen and good chemical stability.
However, they are very expensive compared to YSZ and GDC. They can give best possible
results only when operated below 400°C, they are not stable in reducing atmospheres of

Chapter 1. Presentation of fuel cells as an energy transformer
45
hydrogen, and they have parasitic reactions with NiO forming LaNiO3[36]. Lanthanum based
materials of LaMOx (La2MO2O9) materials were investigated. Various substitutions have been
studied in this family to have stabilized material at room temperature with good conductivity;
they proved to have low stability at low partial pressures of oxygen, they are reduced partially
creating electronic conductivity [37, 38].
The apatites which have good ionic conductivity at moderate temperatures were also one
among the candidates for electrolyte. Their general formula is M10(XO4)6O2, where M is rare
earth metal or alkaline earth metal and X corresponds to P, Si, Ge. Lanthanum silicates has
highest and purest ionic conductivity in wide range of oxygen partial pressures, their main
problem relates to requirement of sintering temperature above 1600°C to achieve dense
electrolyte. Their conductivity is based on interstitial oxygen ions compared to oxygen ion
vacancies in fluorite and perovskite based materials [39-41]. They are best suited for operating
temperature below 600°C [36].
The planar type design of anode supported cells exhibit the best performances. The
thickness of electrolyte on this type should be in the range of 10-20µm, to have the lowest
possible ohmic resistance. The table I.1 throws light on TEC values of different solid electrolytes
in air condition which can be used to obtain good thermo mechanical stability of cells.
So, for obtaining the best results for working at intermediate temperature GDC10
(Ce0.9Gd0.1O2-δ) was chosen as an electrolyte in this study to match with TEC of its adjacent
materials. From now on the focus will concentrate majorly on GDC10. The density studies of

Chapter 1. Presentation of fuel cells as an energy transformer
46
GDC10 have been conducted in this work, by varying their sintering temperature to obtain best
possible density in cell to give higher performance of cell.
Electrolyte composition TEC *10-6K-1 T(K)
Ce0.9Gd0.1O2-δ [42] 13.4± 0.1 300-1100
Ce0.85Gd0.15O1.925 [43] 11.6
Ce0.80Gd0.20O2-δ [42] 11.8±0.1 300-1100
Ce0.80Gd0.18Pr0.02O2-δ [44] 11.5+0.1 300-1050
Ce0,8Sm0,2O1,95 [28, 45-47] 8-10 300-1273
Ce0.83Sm0.17O1.915 [48] 8.6
Ce0.8Sm0.12O1.9 [49] 11.4 300-1173
Ce0.8Sm0.1Mg0.1O2-δ [50] 12.34 473-1073
Zr0.9Y0.1O2-δ [51] 11 300-1273
Zr0.92Y0.08O2-δ [52] 10 300-1273
Zr0.85Y0.15O2-δ [51] 10.9 300-1273
La0.9Sr0.1Ga0.8Mg0.2O2.85 [53] 11.6 300-1273
La0.8Sr0.2Ga0.8Mg0.2O3−δ [53] 11.4 300-1273
La0.8Sr0.2Ga0.76Mg0.19Co0.05O3−δ [54] 12.7 300-1473
La0.9Sr0.1(Ga0.9Co0.1)0.8Mg0.2O3−x [53] 13 300-1273
Table I. 1 Different electrolytes and their TEC values
Chapter 1. Presentation of fuel cells as an energy transformer
47
IV.2. Anodes
One of the main advantages of SOFC over PEMFC is their fuel flexibility. SOFC’s can
be operated with different fuels such as hydrogen, carbon monoxide, hydrocarbon fuel like
natural gas and gasified coal. Anode is the place in SOFC where electrochemical oxidation of
fuel takes place. Then it transfers electrons to external circuit through a conducting wire in a
single cell and for terminal cell in stack. The general characteristics that anodes for SOFCs
should possess are listed as
1) Good electronic conductivity [23],
2) Chemical compatibility and stability in reducing environment,
3) TEC must match other components of cell, like electrolyte and interconnectors,
4) Should be inexpensive materials,
5) Should be a good catalyst for fuel oxidation.
At initial stages of SOFC research, platinum and gold were used as an anode material.
Since they are expensive, some transitions metals like iron and nickel were also used. These
metals meet most of the requirements being less expensive. Nickel is a good catalyst, still it has
high a TEC of 13.4*10-6°C-1 [55]. Nickel performance with respect to hydrogen is the highest
among its peers of transition metals [56-58]. So nickel was chosen as anode. However during the
course of the reaction, there is grain growth and it tends to coarsen the microstructure. So in
order to reduce the TEC and avoid coarsening of microstructure, nickel oxide is used with
ceramic materials like Yttria Stabilised Zirconia (YSZ) or Gadolinium Doped Cerium (GDC).
This composite is called cermet (ceramic+metal). This cermet helps to maintain the necessary
porosity which induces transfer of gases and helps in formation of the necessary Triple Phase
Chapter 1. Presentation of fuel cells as an energy transformer
48
Boundary (TPB) where the electrochemical reaction occurs. NiO present in cermet is reduced to
nickel during the reaction and thus caters oxidation of fuel. To improve the performances of cell,
different compounds like Ni/Al2O3 and Ni/TiO2 were used as subtrate in combination of Ni/YSZ
[59, 60]. In contrary to expectation, observed electrochemical performances are reduced.
Ni/YSZ is sensitive to sulfur present in the natural gas fuel that it can poison the
electrode. When the water in the fuel is less than the required amount, it forms coking of anode
and reduces the overall performances of the cells. To overcome this, anode containing copper
were tried as an alternative. Copper does not favor oxidation but it inhibits carbon formation, still
serves as a good conductor of electricity. Copper has low melting point and is normally used at
low temperature compared to Nickel anode. [61, 62]. Alloys of copper cobalt, copper nickel were
tried to overcome carbon forming. This Cu-Co, Cu-Ni alloys shows better performance with
hydrogen and improved resistance to carbon forming [63]. The fabrication of thin film of Yttria
doped ceria (YDC) between YSZ and Ni-YSZ improves oxidation for methane at low
temperatures. The composite of Cu-CeO2-YSZ/SDC gives higher performance for all
hydrocarbon fuels [64-68].
Ru-YSZ were developed and investigation on it exhibits lower polarization compared to
Ni-YSZ and as Ru has higher sintering resistance, Ru-Al2O3 shows carbon forming resistance
and performs high reforming reacting activities [69,70]. However Ru is an expensive metal and it’s
ruled out for commercialization. Some other bimetallic and trimetallic alloys were also tested as
anode for SOFC. The cell consisting of trimetallic anode of [FexCo0.5-xNi0.5/ Sm0.2 Ce0.8O1.9]
with GDC electrolyte layer, and composite cathode of samarium strontium doped

Chapter 1. Presentation of fuel cells as an energy transformer
49
cobalt/strontium doped ceria alloys exhibits low interfacial resistance, providing high power
density for X=0.25 [71].
Other materials studied in the literature were (Sr,La)TiO3, (Sr,Y)TiO3, (La,Sr)(Cr,Mn)O3,
(La,Sr)CrO3, (La,Sr)(Al,Mn)O3, (La,Sr)(Ti,Mn)O3, but they exhibited lower performances than
Ni-YSZ due to mismatch of some of the basic requirements as an anode. So to improve their
performances, doping of these compounds was suggested (Sr, Y) TiO3/YSZ/Ru, (Sr, Y)
TiO3/YSZ/Ni, (Sr, La) TiO3/YSZ/Pd–CeO2, (Sr, La) TiO3/Ni/YSZ [72-75]. The other pyrochlore
materials, perovskite materials and fluorite materials were also tried as an anode material.
Among all of them, only Ni possesses the most preferable qualities to serve as an anode for
SOFC. The composite of Nickel cermet is widely selected as anode material for SOFC. Ni/GDC
has the best anode properties to operate in intermediate temperature range, and it is chosen as
anode in this work.
IV.3.Cathodes
Design requirements for cathode materials are as follows:
1) High electronic conductivity [23] ,
2) Chemically compatible with electrolyte,
3) Stable in oxidising atmosphere,
4) Large triple phase boundary,
5) High ionic conductivity,
6) Inexpensive materials and simple for fabrication.
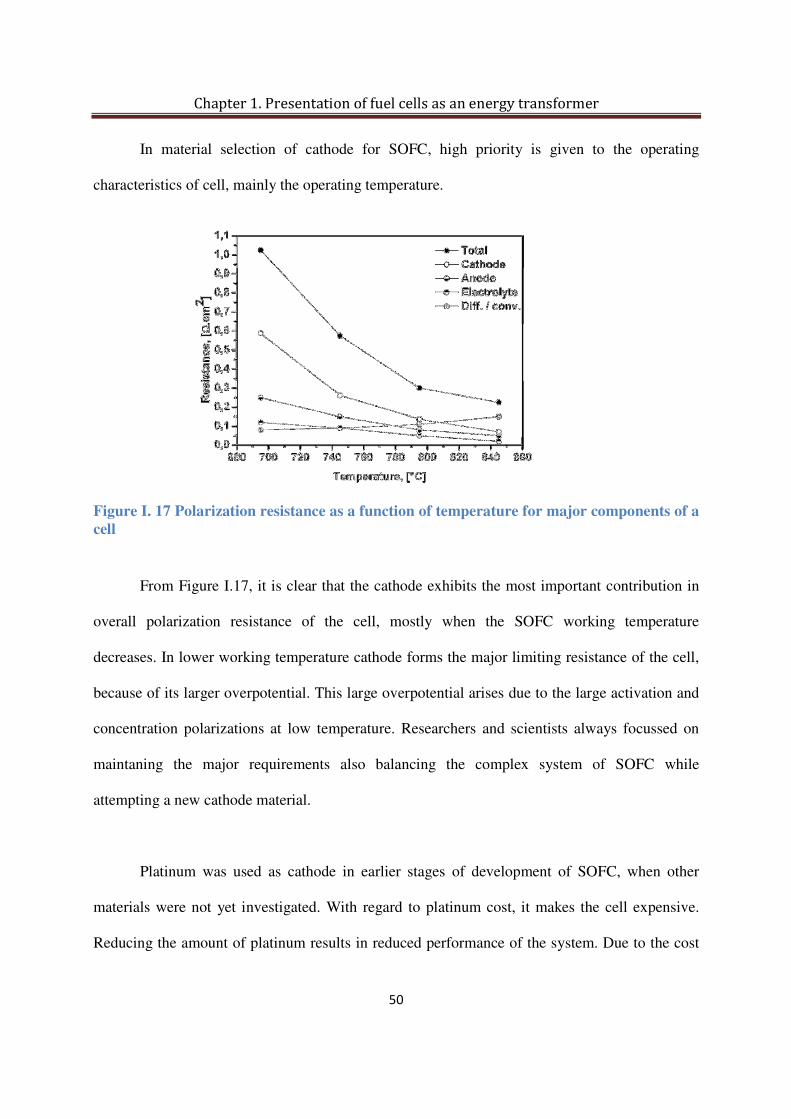
Chapter 1. Presentation of fuel cells as an energy transformer
50
In material selection of cathode for SOFC, high priority is given to the operating
characteristics of cell, mainly the operating temperature.
Figure I. 17 Polarization resistance as a function of temperature for major components of a
cell
From Figure I.17, it is clear that the cathode exhibits the most important contribution in
overall polarization resistance of the cell, mostly when the SOFC working temperature
decreases. In lower working temperature cathode forms the major limiting resistance of the cell,
because of its larger overpotential. This large overpotential arises due to the large activation and
concentration polarizations at low temperature. Researchers and scientists always focussed on
maintaning the major requirements also balancing the complex system of SOFC while
attempting a new cathode material.
Platinum was used as cathode in earlier stages of development of SOFC, when other
materials were not yet investigated. With regard to platinum cost, it makes the cell expensive.
Reducing the amount of platinum results in reduced performance of the system. Due to the cost

Chapter 1. Presentation of fuel cells as an energy transformer
51
of platinum, researchers investigated for other possible alternative cathode materials. The
discovery of perovskites crystal structure of ABO3 was attractive, in this hunt of alternative
cathode. ABO3 possessed all the major requirements and had the possiblity to use in optimized
quantities to make cost effective system. The most commonly used cathode material is either
pure perovskite or composite of perovskite and electrolyte. A number of different families of
perovskite have been researched. Perovskites are oxides with the property of relatively good
electronic conduction at high temperature in oxidising atmosphere.
In 1969, first cathode perovskite lanthanum cobaltite (LaCoO3) was tested and it showed
good initial performance in the cell. When long term ageing test were performed, it reacted with
YSZ electrolyte and had serious degradation problem. The family of LSM [(La1-xSrx) MnO3] was
tested by Siemens Westing House and ABB companies. These cathodes were characterized as
good candidates with respect to good stability and long term experiments with YSZ at higher
temperatures. LSM also exhibited good catalytic activity towards oxygen dissociation. LSM is an
electronic conductor and oxygen reduction is restricted only to TPB sites. In order to extend TPB
sites, composite electrode is used. This composite reduces the high TEC of cathode to make it
viable for usage without any TEC mismatch problem, thus it helps in improving chemical
compatibility of cell.
The other cobaltite tested was Pr1-xSrCoO3. This compound was observed to be reactive
with YSZ and thus resulting in formation of an electro active layer at cathode/electrolyte
interface [23]. This compound can be used as potential cathodes along with ceria based
electrolyte. Another interesting cobaltite material is gadolinium strontium cobaltite, which also
Chapter 1. Presentation of fuel cells as an energy transformer
52
reacts with YSZ electrolyte and thus forming secondary phase. But they do not react with ceria
based electrolytes and can possibly be used in intermediate temperature application. To
overcome all the degradation, there was necessity for improved performance and stable materials
that can worked in intermediate and as well as at low temperature. The mixed ionic and
electronic conductor (MIEC) was a fruitful discovery in cathode field. These compounds
belonging to the other common perovskite of lanthanum strontium cobaltite (LSC) was tested for
SOFC. It exhibited good conductivity and was stable in oxidizing environments. However the
issues related to LSC are its reactivity with YSZ materials and it’s reducing property at lower
oxygen partial pressure. This is non reactive with ceria based electrolyes and it has high TEC
causing TEC mismatch with electrolyte used. Their reactivity with YSZ can be suppressed by
applying a Ceria layer between cathode and electrolyte. The most common ferrite cathode
material is La1-xSrxCoyFe1-yO3 (LSCF) [26]. These are characterized by good chemical
compatiblity with ceria based electrolyte and shows low resistance losses while being mixed
ionic and electronic conductor. The addition of pure lanthanum iron oxide (LaFeO3) has shown
poor ionic and electronic conductivity at low concentrations of vacancies and Fe2+ ions, but
processing of doping strontium ions into A site (ie) lanthanum site gradually increases the
electrical conductivity of the compound [76].
Since LSC compounds have high TEC, using a composite with electrolyte material helps
to overcome this problem. Cathode material performance is dependent on temperature, size,
micro structure, and the formation or deposition process. The most popular ferrite perovskites for
intermediate temperature range is La0.6Sr0.4Co0.2Fe0.8O3-δ (LSCF 48). It has significant electronic
conductivity at 600°C [76] and also gives better performance with GDC electrolyte because of its

Chapter 1. Presentation of fuel cells as an energy transformer
53
stability [35] and thermal expansion compatibility [42]. The TEC of pure LSC was 20.5*10-6 K-1
and 17.5*10-6 K-1[77]. Replacing Co with Fe reduces TEC to 13.8*10-6 K-1. Conductivity of LSCF
decreases with increasing Fe Content [53]. It also has the advantage of exhibiting low power loss
at lower temperature and less susceptibility to poisoning by chromium [78].
The table I.2 shows cathode materials and their respective TEC values at corresponding
temperature.
Composition TEC *10-6K-1 T(K)
La0.6Sr0.4Co0.2Fe0.8O3-δ [53, 77] 17.5 300-1000
La0.58Sr0.4Co0.2Fe0.8O3-δ [87] 17.4 300-1000
La0.6Sr0.4Co0.2Fe0.8O3-δ [88] 13.7 100-500
La0.9Sr0.9Mn0.3 [89] 11.2 300-1000
Nd2NiO4+δ [84, 90] 11.6 300-1000
La2NiO4+δ .[84, 91] 13.6 300-1000
Dy0,2Sr0,8CoO3 [92] 19 300-1000
La0.3Sr0.,7CoO3 [53] 25 300-1000
La0.6Sr0.4CoO3 [53, 93] 20.5 300-1000
Table I. 2 Different cathodes and their TEC values
The other family of materials was tested by changing A (lanthanum site) and B (cobalt
site) of the perovskites by changing the concentrations of these elements. The compound
Ba0.5Sr0.5Co0.8Fe0.2O3 has large TEC and also possesses high oxygen ion mobility. Because of
this property, its use is minimal, and also shows high degration for CO2 containg atmospheres [79,

Chapter 1. Presentation of fuel cells as an energy transformer
54
80]. During recent years, to obtain the best optimal performance, research in cathode is of great
interest, which leads to discovery of double perovskites. The oxides with K2NiF4+x structures are
referred as Ruddlesden-popper phases. These have high oxygen exhange kinetics and posses
high ionic conductivity. However even possessing high ionic conductivity, it shows low
electronic conductivity, which proves to give good performance results in intermediate working
temperature range [81-85]. The other recent researched structures are called ordered double layered
perovskites. Their general formula is LnBaCo2O5+δ where (Ln= Pr, Nd, Sm, Eu, Gd, Tb, Dy, and
Ho). These are known showing encouraging performance at intermediate working temperature
[86]. So with respect to meeting all requirements for best cathode material, LSCF48 was chosen in
this study for IT-SOFC. From now on the discussion of cathode will be based on only LSCF48.
IV.4. Interconnectors
The interconnectors are also called bipolar plates. Since SOFC single cell gives
maximum of one volt, in order to obtain desired voltage, interconnectors are much essential part
to form SOFC stack which can be tailored to meet essential voltage and power requirements.
They also provide mechanical strength to cell in the stack. They play another major role of
electrical connection between cells. Interconnectors are covering the electrodes; they ensure the
even gas distribution throughout the surface of electrodes, and help in gas separation between
cells. The desired qualities of a material to be choosen for interconnectors are listed below.
1) Good chemical and thermal stability with fuel and oxidant gases,
2) Low contact resistance,
3) Low cost,
4) Good mechanical strength,

Chapter 1. Presentation of fuel cells as an energy transformer
55
5) Good thermal and electrical conductivity and corrosion resistance,
6) Their TEC should be compatible with adjust components, so that mismatch is avoided
between electrodes and interconnectors. The selection of this material is very critical to its
working temperature. The main interconnector materials are choosen from two wide classes of
ceramic materials, or metallic alloys.
For high temperature SOFC whose working temperature is higher than 800°C, ceramic
materials were used as interconnectors in initial stages. The available ceramic material which
best fits into requirements is LaCrO3.There are certain disadvantages of this material, since it
belongs to rare earth group, it is expensive, and the second being since it is a ceramic material,
its fabrication process restricted to geometry is tedious. This ceramic material needs specific
sintering methods to obtain the maximum density, which adds to fabrication cost of the cell. So
alternative materials research leads to discovery of metallic alloys.
Metallic alloys are best suited for high temperature SOFC and IT-SOFC. These alloys are
classified into three major types as chromium based alloys, Fe-Cr based alloys, and Ni-Cr based
alloys. Chromium containing alloys has problem of Cr evaporation at high temperature and it can
be avoided by usage of coating in the alloys. For IT-SOFC operation low cost ferritic alloys are
best suited and are selected for study in this work.
IV.5. Sealants
The sealants are one of the major components of planar SOFC stack system. This helps in
avoiding mixing of fuel gas and oxidant gas, and also prevents leakage of gases. By ensuring gas
Chapter 1. Presentation of fuel cells as an energy transformer
56
tight system, these sealants can gradually improve the stack efficiency. The main requirement for
sealants is that it should be an electrical insulator to avoid short circuit in the stack. They should
have compatible TEC that should match adjusting components. There are two types of sealants;
i) bond sealants and ii) compressive seals.
Bonded seals are glass seals or glass ceramics; these are sealants which does not need any
load during operation to ensure gas tight system. This seal are best operated above 625°C the Tg
glass transition temperature of glasses. They can break when mismatch of TEC occurs.
Compressive seals are sealants which require certain load during operation. These seals will
soften at high temperature and hence it requires load in the form of spring load system with bolts
or direct load applied during operation. In some system like probostat gold rings are also used as
sealants. Since gold rings are very expensive, compressive seals are selected for study in this
work.
So to summarize the materials selected for this work, GDC10 is selected as an electrolyte, NiO is
selected as anode which is used as a composite with GDC10, and LSCF48 will be used as
cathode in composite with GDC10. Ferritic alloys were chosen as interconnectors, and
compressive seal will be used in stack.
IV.6. Balance of Plant (BOP)
For the development of inbuilt test bench and stack system, there are many other major
criteria that should be addressed. The interconnectors, sealants, current collectors, gas manifolds,
heat exchangers, gas tubes for feed and exhaust, gas reforming unit, safety valves are collectively
termed as balance of plant. Other then selection of anode, cathode and electrolyte, the selection

Chapter 1. Presentation of fuel cells as an energy transformer
57
of BOP is very important to achieve good performance, high efficiency, and longer life time of
the stack system. These BOP accounts to major part of the cost associated while building the
system. So selection of BOP along with electrodes and electrolytes becomes very important for
effective and inexpensive system performance.
V. Cell preparation techniques
Once all the electrode and electrolyte materials were chosen, the next step is the
fabrication of cell. The cell preparation is an important factor which play significance role in the
performance of the cells. Since planar SOFC is selected in this study, the conventional
fabrication of a complete cell implies different techniques. It requires high initial cost for
equipments and many different application of each layer of the cell. This also includes many
steps of sintering which add to cost of the system.
Conventionally for an ASC planar SOFC cell preparation, the anode substrate is mostly
fabricated by tape casting technique, the application of electrolyte and cathode layers and
sintering them are tedious and require costly equipments. There are different and many stages of
sintering and fabricating a full cell. Some of the common fabrication techniques used in
preparation of planar cells is described below.
V.I. Screen printing
Screen-printing is one of the relatively expensive and common techniques used to deposit
electrolyte and electrode materials on substrate. The electrode or electrolyte layers are deposited
from a suspension which consists of an organic solvent. The corresponding electrolyte or

Chapter 1. Presentation of fuel cells as an energy transformer
58
electrode suspensions are prepared by dispersing the powder in a 3 wt% solution of ethyl
cellulose in terpineol, where the former acts as a binder and the latter as the solvent [94].
Fabrication of larger area geometry is possible by this technique, its disadvantage being that it
requires high initial investment, many sintering steps and stages. Cheaper and cost effective
fabrication technique is much preferred to reduce the cost of the whole system.
V.2. Physical vapour deposition
Half cell or anode substrate is generally prepared by tape casting. PVD equipment is used
for making thin film electrolyte and cathode coatings. Radiation heater and electron beam were
used to increase substrate temperature. The deposition was done at high vacuum of 10-2 Pa by
turbo molecular pump and distance between substrate and evaporation target was 250 mm [95]
This equipment installation requires high initial cost. This involves sequential high temperature
sintering for electrolyte, followed by the deposition of the electrode layer. Finally by the
sintering of cathode one can obtain a complete cell [95]. So expensive, complex nature of this
system and fabrication steps involved allows users to opt for an alternative cheaper techniques.
V.3. Spin coating
This is one of the techniques used to fabricate thin film of electrolyte and electrode. The
anode substrate is placed for deposition of different consecutive layers. Electrolyte layer was
prepared by a so called wet route using polymer precursors. The precursors were prepared by
dissolving cerium nitrate and gadolinium nitrate in ethyl glycol and water. These were slowly
heated to 70-90°C for 24 h then water was fully evaporated and ethyl glycol also starts to
evaporate. The viscosity was measured at 0.02-12 Pa at constant temperature and blade gap of
500 µm. The prepared solutions were deposited on half cells and spin coated at 2000 rpm. After

Chapter 1. Presentation of fuel cells as an energy transformer
59
this, layer was dried in a conveyor belt furnace at 250°C at 30 min except where noted. [96] The
electrolyte layer is sintered, and then cathode layer deposited is sintered again to obtain a
complete cell. So all the conventional process involves multi step sintering and is expensive.
Considering the complexity and different steps involved to make a cell, cheaper fabrication
techniques will be preferred to reduce the system costs and effective commercialization of SOFC
systems in large scale.
V.4. Tape casting.
Tape casting is a convenient and the cheapest shaping technique to fabricate two-
dimensional thin ceramic plates from 10–1000 µm thickness. This can be done either manually
or in an automatic way. Commonly automated machines are preferred for tapecasting to avoid
uneven thickness of tape. A paste-like suspension, consisting of powder, organic solvent,
dispersant, polymer (binder) and plasticizer is cast on a clean glass substrate by a moving doctor
blade at a constant speed rate. The dried green tape obtained is flexible; care should be taken to
remove the tape from glass plate without any deformation. A half cell is usually prepared by this
method. [97]
By tape casting, one can obtain a large area tape, without any hurdles. This technique
requires less maintenance and operating costs compared to other fabrication techniques.
This work is a new attempt in fabricating an anode supported cell consisting of thick
anode substrate, an anode functional layer, a thin electrolyte layer, and a thin cathode layer. The
multilayer tape is prepared only by tapecasting. So by using this process, expensive deposition
techniques like screen printing, PVD, and spin coating can be avoided. This patented process

Chapter 1. Presentation of fuel cells as an energy transformer
60
will explain the possiblity to obtain a complete working planar cell by one step sintering. By
using this technique the cost of fabricating cell is gradually reduced and mass production at large
scale is feasible.
VI. Scope of this Thesis
The objective of this present thesis is to obtain a cost effective technique to fabricate a
single operating full cell of large area above 25 cm2 only by tape casting and later improved tape
casting along with single step sintering. The process of tapecasting involves selection of required
electrode, electrolyte materials respective binders, solvents, and dispersant. The selections of
composition of materials are explained previously. The influence of sintering temperature, pore
formers, load required during sintering are also explained in detail. The electrochemical
performances of the obtained cells are discussed in chapter 2. Chapter 3 throws light on long
term ageing results, building of new test bench and stacking process of cell. Finally conclusions
and perspectives of this work are given.
Chapter 1. Presentation of fuel cells as an energy transformer
61
References
1. P. Decorse, "Etude comparative des propriétés de surface et de volume d’oxydes de type
pérovskite La1-xSrxMnO3±δ (0≤x≤1) utilisables dans les piles à combustible haute température",
Thèse LRRS Dijon, France, 1997.
2. G. Bertrand, "Films minces de manganites de lanthane (LaxMnyO3+δ) sur zircone yttriée ((100)
YSZ) comme modèle de demi-pile à combustible à oxydes solides (SOFC) : élaboration par LP-
MOCVD et propriétés interfaciales", Thèse LRRS Dijon, France, 2000.
3. M. Petitjean, "Propriétés et réactivité des ferromanganites de lanthane strontium cathodes de
piles à combustible SOFC", Thèse LRRS Dijon, France, 2003.
4. L.Combemale, "Elaboration et réactivité interfaciale d’oxydes pérovskites à base de Lanthane
Strontium Chrome Ruthénium (LSCrRu) comme composés d’anode de piles à combustible à
température intermédiaire (ITSOFC) ", Thèse LRRS Dijon France, 2005.
5. S.Ricote "Elaboration et characterization du materiau D’electrolyte pour pile a combustible a
conduction Protonique BaCe0.9-x Zr xY0.1 O3- δ", LRRS Dijon, France, 2008.
6. V.Sivasankaran*, L.Combemale, Gilles Caboche, Method for Preparing a Fuel Cell, filed on
10.10.2012, FR12/59643 French Patent.
7. T.S. Zhao, K-D.Kreuer, Trung Van Nguyen, Advances in fuel cells vol 1 2007.
8. http://world-nuclear.org/info/Current-and-Future-Generation/World-Energy-Needs-and-Nuclear-
Power/#.UhqdvBuWTUM
9. http://www.iea.org/publications/freepublications/publication/kwes.pdf
10. Nasa goddrad institute for space studies.
11. Kordesh, K. and G. Simader, Fuel cells and their applications. Weinheim: VCH. 1996.

Chapter 1. Presentation of fuel cells as an energy transformer
62
12. Gregor Hoogers, Fuel cell technology handbook CRC press 2003.
13. Steele, B.C.H. and A. Heinzel, Materials for fuel-cell technologies. Nature, 414, 345, 2001.
14. Maru, H. C. National Renewable Energy Laboratory 1-10 kW Stationary Combined Heat and
Power Systems Status and Technical Potential: Independent Review. 2010.
15. Hosoi, K. & Nakabaru, M. Status of National Project for SOFC Development in Japan. ECS
Transactions 25, 11, 2009.
16. P. Nehter. Thermodynamische und ökonomische Analyse von Kraftwerksprozessen mit
Hochtemperatur-Brennstoffzelle SOFC. Shaker Verlag, Dissertation, 2005.
17. E.D wascmann Science 334, 935, DOI: 10.1126/science.1204090, 2011.
18. Blum, L., Packbier, U., Vinke, I. C. & de Haart, L. G. J. Long-Term Testing of SOFC Stacks at
Forschungszentrum Juelich.Fuel Cells, Online Early View, 2012.
19. http://www.sofccanada.com/
20. http://www.bloomenergy.com/clean-energy/
21. Subash C.Singhal, Kevin Kendall High temperature solid oxide fuel cells 2003.
22. R. A. George. Status of tubular SOFC field unit demonstrations. Journal of Power Sources, 86,1-
2:134, 2000.
23. K. C. Wincewicz and J. S. Cooper, J. Power Sources, 140, 280, 2005.
24. Daniel J. L. Brett, AAtkinson, Nigel P. Brandon and SJ. Skinner DOI: 10.1039/b612060c.
25. Menzler N.H., Tietz F., Uhlenbruck S., Buchkremer H.P., Stoever D., J. Mater. Sci., 45 3109,
49, 2010.
26. S. Wang, T. Kato, S. Nagata, T. Kaneko, N. Iwashita, T. Honda , M. Dokiya, Solid State Ionics,
152–153, 477, 2002.
27. B. C. H. Steele, Solid State Ionics, 134, 3, 2000.

Chapter 1. Presentation of fuel cells as an energy transformer
63
28. B. C. H. Steele, Solid State Ionics, 129, 95, 2000.
29. T. S. Zhang, J. Ma, L. B. Kong, P. Hing and J. A. Kilner, Solid State Ionics, 167, 191, 2004.
30. T. S. Zhang, J. Ma, L. H. Luo and S. H. Chan, J. Alloys Compd., DOI:
10.1016/j.jallcom.2005.11.049.
31. Y. J. Leng, S. H. Chan, S. P. Jiang and K. A. Khor, Solid State Ionics, 170, 1-2, 9, 2004.
32. C. Hatchwell, N. M. Sammes and I. W. M. Brown, Solid State Ionics, 126, 201, 1999.
33. Ye, F.; Mori, T.; Ou, D. R.; Takahashi, M.; Zou, J.; Drennan, J. J. Electrochem. Soc. 154, B180,
2007.
34. Balazs, G. B.; Glass, R. S. Solid State Ionics, 76, 155, 1999.
35. O. Yamamoto, Electrochim. Acta, 45, 2423, 2000.
36. Huang K., Tichy R.S., Goodenough J.B., J. Am. Ceram. Soc. 81, 2581, 2000.
37. D. Marrerolopez, J. Canalesvazquez, J. Ruizmorales, J. Irvine, and P. Nunez, Electrochimica
Acta, 50, 4385, 2005.
38. S. Georges, F. Goutenoire, O. Bohnke, L.M. Stei, S. Skinner, H. Wiemhofer, and P.Lacorre,
Journal of New Materials for Electrochemical Systems, 7, 51, 2004.
39. S. Nakayama, Journal of the European Ceramic Society, 19, 507 1999.
40. M. Higuchi, Y. Masubuchi, S. Nakayama, S. Kikkawa, and K. Kodaira, Solid State Ionics, 174,
73, 2004.
41. S. Nakayama and M. Sakamoto, Journal of the European Ceramic Society, 18, 1413, 1998.
42. Kharton, V. V.; Figueiredo, F. M.; Navarro, L.; Naumovich, E. N.; Kovalevsky, A. V.;
Yaremchenko, A. A.; Viskup, A. P.; Carneiro, A.; Marques, F. M. B.; Frade, J. R. Journal of
Materials Science 36, 1105, 2001.
43. Zajac, W.; Swierczek, K.; Molenda, J. Journal of Power Sources 173, 675, 2007.

Chapter 1. Presentation of fuel cells as an energy transformer
64
44. Kharton, V. V.; Kovalevsky, A. V.; Viskup, A. P.; Shaula, A. L.; Figueiredo, F. M.; Naumovich,
E. N.;Marques, F. M. B. Solid State Ionics, 160, 247, 2003.
45. H. Inaba and H. Tagawa, Solid State Ionics, 83, 1, 1996.
46. J. VanHerle, Solid State Ionics, 86-88, 1255, 1996.
47. W. Huang and P. Shuk, Solid State Ionics, 95, 337, 1997.
48. Huang, W.; Shuk, P.; Greenblatt, M. Solid State Ionics. 113, 305, 1998.
49. Sameshima, S.; Ichikawa, T.; Kawaminami, M.; Hirata, Y. Materials Chemistry and Physics 61,
31, 1999.
50. Zheng, Y.; Gu, H.; Chen, H.; Gao, L.; Zhu, X.; Guo, L. Materials Research Bulletin, 44, 775,
2009.
51. Tietz, F. Solid State Ionics 5, 129, 1999.
52. Mori, M.; Abe, T.; Itoh, H.; Yamamoto, O.; Takeda, Y.; Kawahara, T. Solid State Ionics. 74,
157, 1994.
53. Ullmann, H.; Trofimenko, N.; Tietz, F.; Stöver, D.; Ahmad-Khanlou, A. Solid State Ionics 138,
79, 2000.
54. Stevenson, J. W.; Hasinska, K.; Canfield, N. L.; Armstrong, T. R. J. Electrochem. Soc. 147,
3213, 2000.
55. Encyclopedia of Electrochemical Power Sources ISBN: 978-0-444-52745-5.
56. Eguchi K, Setoguchi M, Sawano M, Tamura S, Arai H, Proceedings of international symposium
on SOFC 603, 1991.
57. Digiuseppe, G.; Selman, J. R. J. Mater. Res., 16, 2983, 2001.
58. Sunagawa, Y.; Yamamoto, K.; Muramatsu, A. J. Phys. Chem. 2006, 110, 6224, 2006.

Chapter 1. Presentation of fuel cells as an energy transformer
65
59. Tietz F., Dias F.J., Naoumidis A. In: Stevens P. Proceedings of 3rd Eur. SOFC Forum, vol 1,
171. 1998.
60. Meschke. F, Dias F.J, Tietz F, J.Mater.Sci 36, 5719, 2001.
61. . S.Park, R. Cracium, J.M. Vohs, R.J. Gorte R. J. Nature 404, 6775, 265, 2000.
62. Gorte, R. J.; Park, S.; Vohs, J. M.; Wang, C. Adv. Mater. 12,1465, 2000.
63. Lee, S.-I.; Ahn, K.; Vohs, J. M.; Gorte, R. J.Electrochem. Solid-State Lett., 8, A48–A51, 2005.
64. E.P. Murray, T. Tsai, S.A. Barnett, Nature 400, 649, 1999.
65. S. Mcintosh, J.M. Vohs, R.J. Gorte, Electrochima. Acta 47, 3815, 2002.
66. S. Park, R. Cracium, J.M. Vohs, R.J. Gorte, J. Electrochem. Soc. 146 3603, 1999.
67. C. Lu, W.L. Worrell, R.J. Gorte, J.M. Vohs, J. Electrochem. Soc. 150 A354, 2003.
68. B.C.H. Steele, P.H. Middleton, R.A. Rudkin, Solid State Ionics 40-41,388, 1990.
69. Suzuki M, Sasaki H, Otoshi S, Ippomatsu M, International symposium on SOFC 585-591.
70. Zhan, Z.; Barnett, S. A. Science 308, 5723, 844, 2005.
71. Z. Xie, W. Zhu, B. Zhu and C. Xia, Electrochima. Acta, 51, 3052, 2006.
72. Kurokawa H., Yang L.M., Jacobsen C.P., De Jonghe L.C., Visco S.J., J. Power Sources 164,
510, 2007.
73. Fu Q.X., Tietz F., Sebold D., Tao S.W., Irvine J.T.S., J. Power Sources 171, 663, 2007.
74. Kim G.T., Gross M.D., Wang W.S., Vohs J.M., Gorte R.J., J. Electrochem. Soc. 155 B360.
2008.
75. Pillai M.R., Kim I.W., Bierschenk D.M., Barnett S.A., J. Power Sources 185,1086, 2008.
76. Y.Chen, Veronica Alexandra B.Almeida, Francois Gitzhofer, J.Thermal spray Technology 20, 1-
2, 145,2011.
77. Anthony petric, Peng Huang Frank Tietz, Solid State Ionics, 135, 1-4, 719, 2000.

Chapter 1. Presentation of fuel cells as an energy transformer
66
78. Ken Kuang, keith Easler, Fuel cells electronics and packaging, 2007.
79. Yan A., Cheng M., Dong Y.L., Yang W.S., Maragou V., Song S.Q., Tsiakaras P., Appl. Catal. B
66,64, 2006.
80. Bucher E., Egger A., Caraman G.B., Sitte W., J. Electrochem. Soc. 155, B1218, 2008.
81. Takeda Y., Nishijima M., Imanishi N., Kanno R., Yamamoto O., Takano M., J. Solid State
Chem. 96,72, 1992.
82. Skinner S.J., Kilner J.A., Solid State Ionics 135,709, 2000.
83. Boehm E., Bassat J-M., Dordor P., Mauvy F., Grenier J-C., Stevens P., Solid State Ionics, 176,
2717,2005.
84. Munnings C.N., Skinner S.J., Amow G., Whitfield P.S., Davidson I.J., Solid State Ionics 176
1895,2005.
85. Sayers R., De Souza R.A., Kilner J.A., Skinner S.J., Solid State Ionics, 181, 386, 2010.
86. Maignan, A.; Martin, C.; Pelloquin, D.; Nguyen, N.; Raveau, B., J. Solid State Chem. 142, 247,
1999.
87. Mai.A, Haanappel, V.A, Uhlenbruck.S, Tietz.F, Stover Solid State Ionics, 176, 15-16, 1341, 2005.
88. Swierzcek.K, Solid State Ionics, 179, 1,126, 2008.
89. Jiang S.P J.Mat.Sci 43, 6799, 2008.
90. T. Nakamura, K. Yashiro, K. Sato, and J. Mizusaki, Solid State Ionics, 181, 402, 2010.
91. S. Skinner, Solid State Ionics, 135,709, 2000.
92. H. Tu, Y. Takeda, N. Imanishi, and O. Yamamoto, Solid State Ionics, 100, 283,1997.
93. W. Sitte, E. Bucher, and W. Preis, "Nonstoichiometry and transport properties of strontium-
substituted lanthanum cobaltites," Solid State Ionics, 154-155, 517, 2002.
94. C.J.Fu, Q.L.Liu, S.H.Chan, X.M.Ge, G.Pasciak, Int.J, Hydrogen energy 35, 11200, 2000.

Chapter 1. Presentation of fuel cells as an energy transformer
67
95. Bin Meng, Xiaodong He, Yue Sun, Mingwei Li. Material Science and Engineering, 150, 83,
2008.
96. Pawel Plonczak, Mario Joost, , Johan Hjelm, Martin Sogaard, Mats Lundberg, Peter Vang
Hendriksen J.Power sources, 196, 1156, 2011.
97. Lorenz P.meier, Lukas Urech, LudwigJ.Gauckler, J. European Ceramic Society 24, 3753, 2004.

Chapter 1. Presentation of fuel cells as an energy transformer
68

Chapter 2. Synthesis, development, formulation and optimization of suspensions for tape casting
process
Chapter 2: Synthesis, development, formulation and
optimization of suspensions for tape casting process
Chapter 2: Synthesis, development, formulation and optimization of suspensions for tape casting
process .................................................................................................................................................. 69
Part I ................................................................................................................................................. 69
I. Electrolyte and electrode properties ........................................................................................... 69
II. Cathode preparation its properties, and their characterization .................................................. 74
III.Anode properties, and their characterization ............................................................................. 77
IV. Conclusion ................................................................................................................................ 80
Patent Protected ................................................................................................................................ 81
Part II ................................................................................................................................................ 82
II.1.Tape casting................................................................................................................................. 82
II.1.1.General tape casting principle ............................................................................................... 83
II.1.2.Stability ................................................................................................................................. 83
II.1.3 Solvent .................................................................................................................................. 84
II.1.4. Dispersant ............................................................................................................................ 85
II.1.5 Binder ................................................................................................................................... 85
II.1.6. Plasticizer ............................................................................................................................. 86
II.1.7. Poreformers ......................................................................................................................... 86
II.2. Slurry or suspension preparation ................................................................................................ 87
II.2.1. Preparation of an anode support slurry ................................................................................ 87
II.2.2. Preparation of an electrolyte slurry ...................................................................................... 88
II.2.3. Preparation of cathode slurry ............................................................................................... 88
II.2.4.Preparation of an anode functional layer slurry ..................................................................... 88
II.3. Casting of suspension.................................................................................................................. 89
II.4 Sintering ...................................................................................................................................... 93
II.5 Conclusion ................................................................................................................................... 98
Part III ............................................................................................................................................... 99
III.1. Adaptation of new process for fabricating a cell ..................................................................... 99

Chapter 2. Synthesis, development, formulation and optimization of suspensions for tape casting
process
III.2. Development of new fabrication process by tape casting approach...................................... 100
III.3. Shrinkage measurement. ..................................................................................................... 112
III.4.Optimization of warpage. ...................................................................................................... 113
III.5. Conclusion ........................................................................................................................... 117
Part. IV. Electrochemical results obtained by 10cm2
active area cells fabricated by new single step
sintering process ............................................................................................................................. 118
IV.1. Cell with starch poreformer ................................................................................................. 120
IV.2. Cell with carbon poreformer ................................................................................................ 122
IV.3. Effect of cathode layer thickness and carbon poreformer .................................................... 124
IV.4. Effect of electrolyte thickness in the cell .............................................................................. 126
IV.5. Effect of using carbon poreformer in cathode layer. ............................................................. 128
IV.6. Final optimization performed. .............................................................................................. 130
IV.7. Conclusion. .......................................................................................................................... 134

Chapter 2. Synthesis, development, formulation and optimization of suspensions for tape casting
process
69
Chapter 2: Synthesis, development, formulation and optimisation of
suspensions for tape casting process Part I
I. Electrolyte and electrode properties
I.1. Electrolyte (GDC 10) nano particles synthesis and their characterization
As discussed earlier, the ionic conductivity of Gadolina Doped Ceria [Ce0.9Gd0.1O1.95
(GDC10)] based solid solutions is highest among its class of electrolytes. For this reason GDC10
suits itself best for IT-SOFC (500°C-700°C) applications. There are several techniques available
for preparation of GDC10, like powder mixing, glycine nitrate process [1,2], hydrothermal
synthesis [3] and oxalate co-precipitation [4,5]. In this work citrate process was followed for
synthesis of nano particles of GDC as described below. This was considered as the quickest and
effective process for producing required nano particles.
I.2. Experimental procedure for synthesis of GDC nano powder
The different percentage of GDC were synthesized and finally concluded to proceed
with GDC10 as discussed in chapter 1. For the preparation of this nano powder sol-gel, synthesis
method by citrate process was chosen [6, 7]. The selected percursors were cerium nitrates
hexahydrate Ce (NO3)3, 6H2O, and gadolinum nitrate hexahydrate Gd (NO3)3, 6H2O. These
precursors were dissolved in deionised water individually and the solutions were mixed under
constant stirring for one hour. Anhydrous citric acid was dissolved in deionised water and added
to nitrate solutions. The molar ratio of oxides and citric acid used was 1:2 ratios. All these
solutions were mixed together in one large beaker followed by constant stirring, to make it a
homogenised solution. This homogeneous solution was heated in the water bath at a temperature

Chapter 2. Synthesis, development, formulation and optimization of suspensions for tape casting
process
70
of about 80°C to remove excess water to transform it into a gel. The gel was transferred to
alumina crucible and calcined in furnace at 500°C for 1 hour. The nitrates were evolved around
250°C and the final powders were collected and characterized by different techniques such as
XRD, SEM. The results are discussed below.
I.2.1.GDC properties and characterization by X-Ray Diffraction
The Figure II.1 shows the crystal structure of GDC10. It possesses a fluorite type
crystal structure. The Gd and Ce atoms are shown in purple color and oxygen atom is shown in
red color. This falls in Fm3m space group. This structure was later characterized by XRD for
purity and for surface area measurements by Brunauer–Emmett–Teller (BET) method.
Figure II. 1 GDC crystal structure drawn by Topaz software
The Figure II.2 shows the X-Ray Diffraction (XRD) pattern of synthesized GDC10
powders. The pattern was recorded in a Bruker D8 device, equipped with Kα radiation. This
experiment was performed to study the crystal structure of the compound.It exhibits cubic
structure a=b=c= 5.418(Å). This parameter was calculated by topaz software after XRD

Chapter 2. Synthesis, development, formulation and optimization of suspensions for tape casting
process
71
measurement. This was also confirmed from literature [7]. The purity of powders was also
verified with this XRD pattern. The peak in black shows the nano powers obtained, it was
matched with original crystal structure of GDC10 from the database ICDD file number 01-075-
0161.which is in red color. From the Figure II.1, it can be seen that all the peaks were exactly
matching the database. There were no new peaks found, which confirms that the nano powders
obtained were pure without any impurity. The broad peaks refer to the large surface area of the
powders. The particle size was also calculated by Scherrer formula in equation 3.1 where D=
diameter of particle in nm, ƛ is the wavelength in nm, Sr is the peak width in radian, Ѳ is the
scattering angle in degree.
D=ƛ
UV�%WѲ (3.1)
Figure II. 2 XRD of GDC10 powder synthesized by citrate process
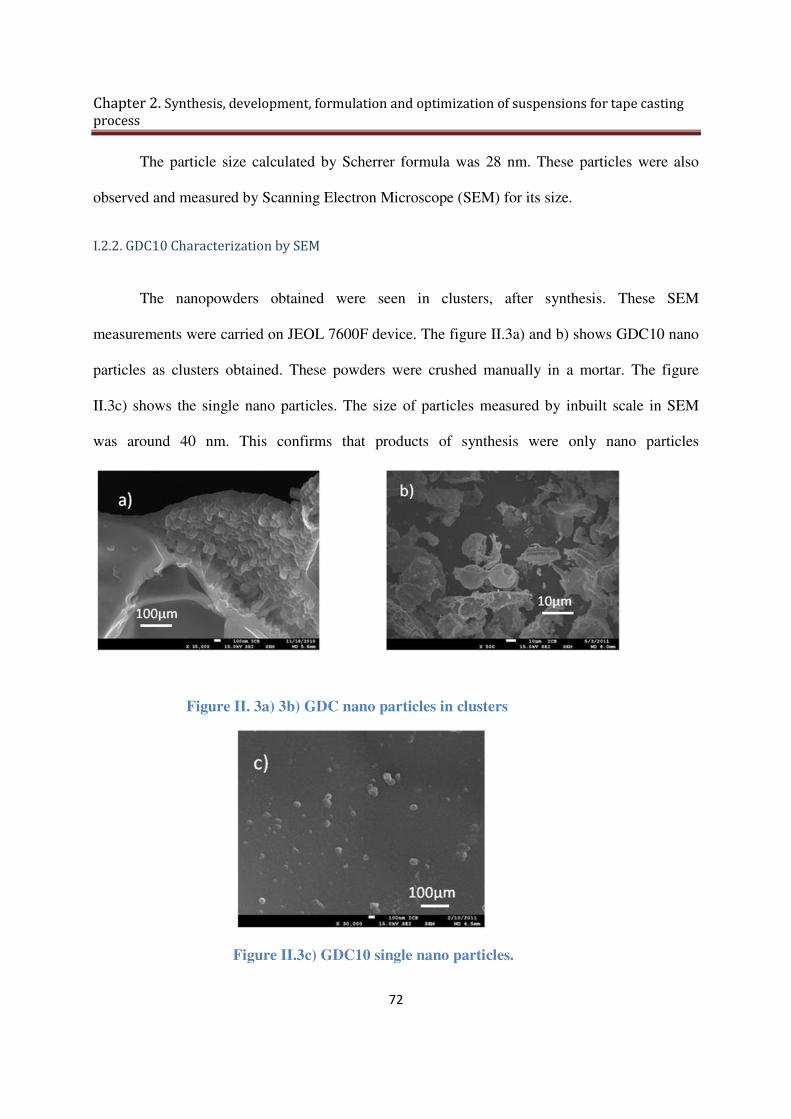
Chapter 2. Synthesis, development, formulation and optimization of suspensions for tape casting
process
72
The particle size calculated by Scherrer formula was 28 nm. These particles were also
observed and measured by Scanning Electron Microscope (SEM) for its size.
I.2.2. GDC10 Characterization by SEM
The nanopowders obtained were seen in clusters, after synthesis. These SEM
measurements were carried on JEOL 7600F device. The figure II.3a) and b) shows GDC10 nano
particles as clusters obtained. These powders were crushed manually in a mortar. The figure
II.3c) shows the single nano particles. The size of particles measured by inbuilt scale in SEM
was around 40 nm. This confirms that products of synthesis were only nano particles
Figure II. 3a) 3b) GDC nano particles in clusters
Figure II.3c) GDC10 single nano particles.

Chapter 2. Synthesis, development, formulation and optimization of suspensions for tape casting
process
73
I.2.3.GDC10 characterization by BET
To measure the surface area of synthesized powders, BET method was used. The
experiment was performed on micromeritics Tristar II 3020 device. Nitrogen was used as an
adsorbative gas. This was kept in vacuum at 250°C for 2 hours. The sample mass of 0.3 g was
used for experiment. When subjected to measurement, the powders possessed 28.8 m2.g-1 active
surface area. The large surface area results explain that the particles were of very small in size.
This implies powders were nano particles. The particle size were also found using the equation
below where d is the diameter of particle in microns or nm, ρis the density of GDC10 in g.cm-3
S is the surface area in m2.g-1 found by BET.
d= X
ρY (3.2)
The diameter of the particle estimated by equation (3.2) is 29 nm.
Thus by citrate process, pure nano particles were obtained. However by this synthesis
procedure, nano powders yielded maximum of 2.5 grams per batch. The efficiency of this
synthesis process is 94%. In order to fabricate cell by the new process, many trial cells have been
made. For all these trial experiments, GDC10 was used in all layers of ASC, so the required
amount was about approximately one and half kilogram. Due to lack of time and low yield of
nano powders in lab, the process were continued with commercial GDC10 powders bought from
Fuel cells Materials, supplied in France by Neyco.
GDC10-HP, high premium powders brought from Neyco with LOT no 6A074, were also
characterized by XRD for purity and BET for surface area. These powders were pure without
any impurities. The powders had surface area of 12.1 m2.g-1.The diameter of particle estimated

Chapter 2. Synthesis, development, formulation and optimization of suspensions for tape casting
process
74
by equation 3.2 was 70 nm. The Figure II.4 shows the XRD pattern of GDC10-HP powders. The
base of peak in Figure II.4 was very narrow, compared to the Figure II.2 for nano particles.
Figure II. 4 XRD of GDC10-HP powder
From now on, these GDC10-HP powders will be used for this work.
II. Cathode preparation its properties, and their characterization
II.1. LSCF48 preparation by solid state synthesis
Two preparation methods were investigated for cathode synthesis by E.Fatome Jacquelot
in ICB lab. They were solid state synthesis and hydrothermal synthesis. The solid state process
yielded micrometric particles, while hydrothermal synthesis resulted in nano metric powders.
Since micrometric electrolyte powders were chosen for this work, solid state synthesis process
was selected for cathode synthesis. By choosing these particles, there will be good cohesion

Chapter 2. Synthesis, development, formulation and optimization of suspensions for tape casting
process
75
between electrolyte and cathode powders. This synthesis method was quite easy compared to
hydrothermal synthesis process and larger quantities of powders can be achieved.
The synthesis of La0.6Sr0.4Co0.2Fe0.8O3-δ (LSCF 48) was performed from precursors of
strontium carbonate (SrCO3), Lanthanum oxide (La2O3), Cobalt oxide (Co2O3) and iron oxide
(Fe2O3). All these powders were brought from Sigma-Aldrich. The stoichiometric ratios of
precursors were taken and milled by zirconium balls in ethanol for 15 hours. This was dried in
furnace at 60°C for 24 hours at ambient temperature. Then the powders were calcined at 1100°C
for 24 hours, with heating and cooling ramp of 100°C per hour.
II.2. LSCF48 characterization by XRD and its properties
The synthesized powders were subjected to XRD characterization, for checking their
purity and structure. XRD was carried on D8 Bruker device, coupled with Kα radiation. The
Figure II.5 shows the crystal structure of LSCF48. It exhibited rhombohedral structure. The
lattice parameters were a=5.4919 Å, c= 13.364. Å. Its volume was 349.1 Å3 [8]. La, Sr is shown
in green, Co, Fe is represented in blue and Oxygen is depicted in red color. These LSCF48
powders were then characterized by SEM and BET.

Chapter 2. Synthesis, development, formulation and optimization of suspensions for tape casting
process
76
Figure II. 5 Crystal structure of LSCF48
Figure II. 6 XRD pattern of LSCF48
The figure II.6 shows the XRD pattern of cathode synthesized. There is no ICDD file
matching the composition of LSCF48. The lattice parameter was calculated by topaz software

Chapter 2. Synthesis, development, formulation and optimization of suspensions for tape casting
process
77
and was similar to the values obtained from G.ch Kostogloudis et al [8]. From this, it was found
that the obtained LSCF powders were pure and in single phase without any impurities.
II.3. LSCF48 characterization SEM and BET
The LSCF48 powders were characterized by SEM with the same conditions as an
electrolyte powder measurement. These powders were also seen as agglomerates after synthesis.
The morphology of powders by SEM studies shows that the grain was in microscopic size as
seen in Figure II.7. Their surface area is calculated by BET under the same condition as for an
electrolyte powder. Their surface area was found to be 0.7 m2.g-1. The diameter of particle
estimated by equation 3.2 was 1.35 microns. From now on, this powder will be used in this
process.
Figure II. 7 LSCF48 SEM picture
III. Anode properties and their characterization
Anode used in this study was NiO, this 99.99% pure powders brought from Sigma-
Aldrich France. The Figure II.8 shows the NiO crystal structure. It was supposed to exhibit cubic

Chapter 2. Synthesis, development, formulation and optimization of suspensions for tape casting
process
78
structure in Fm3m space group where a=4.178 Å. Ni is presented in white and O is in red. This
powder were directly subjected to XRD characterization.
Figure II. 8 Crystal structure of NiO
The Figure II.9 shows the XRD pattern of NiO powders used. The peak in black shows
the peaks of NiO powders, which was matched from NiO in database ICDD file number 01-071-
1179, which was shown in red color. All the peaks were exactly matching with NiO structure
from database. Since there were no new peaks, then it can be concluded that the powders were
pure without any impurities
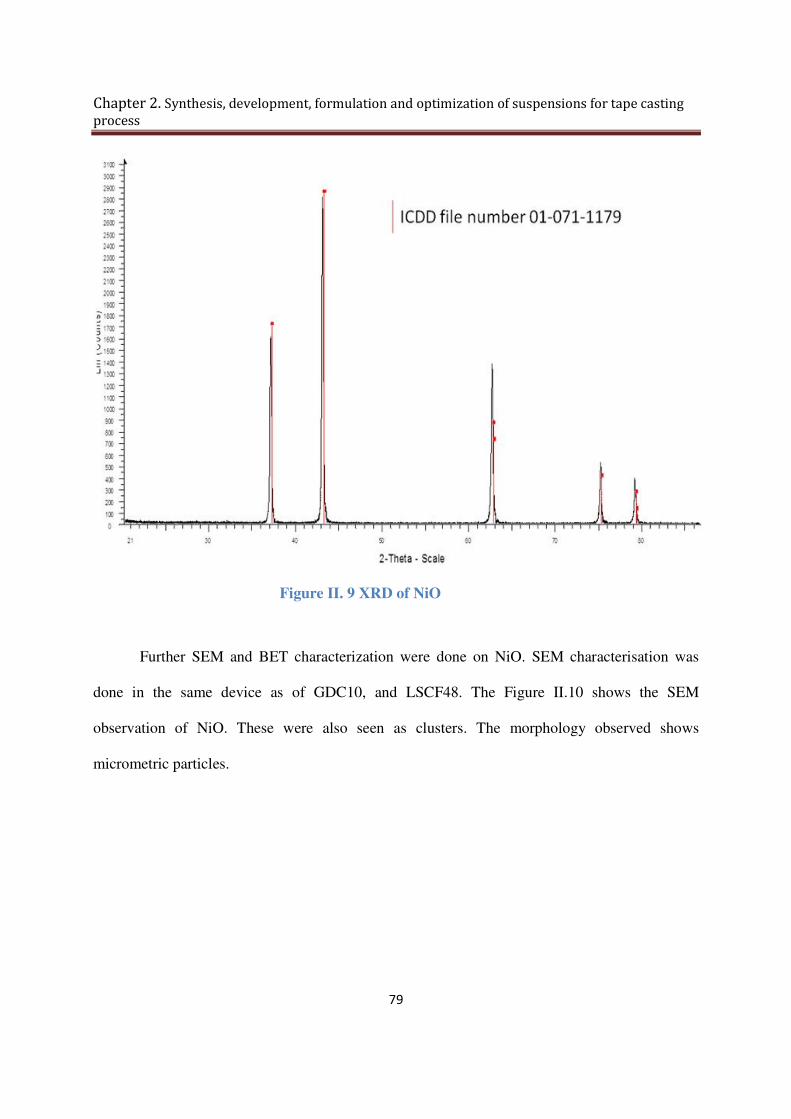
Chapter 2. Synthesis, development, formulation and optimization of suspensions for tape casting
process
79
Figure II. 9 XRD of NiO
Further SEM and BET characterization were done on NiO. SEM characterisation was
done in the same device as of GDC10, and LSCF48. The Figure II.10 shows the SEM
observation of NiO. These were also seen as clusters. The morphology observed shows
micrometric particles.
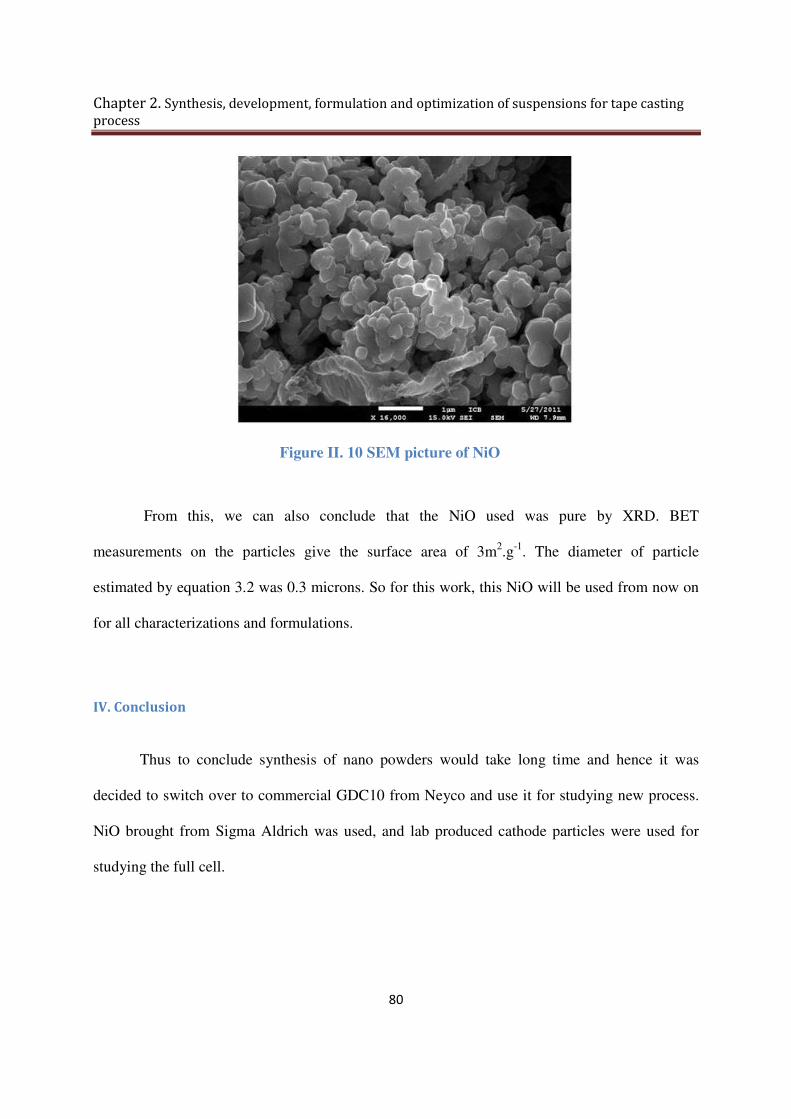
Chapter 2. Synthesis, development, formulation and optimization of suspensions for tape casting
process
80
Figure II. 10 SEM picture of NiO
From this, we can also conclude that the NiO used was pure by XRD. BET
measurements on the particles give the surface area of 3m2.g-1. The diameter of particle
estimated by equation 3.2 was 0.3 microns. So for this work, this NiO will be used from now on
for all characterizations and formulations.
IV. Conclusion
Thus to conclude synthesis of nano powders would take long time and hence it was
decided to switch over to commercial GDC10 from Neyco and use it for studying new process.
NiO brought from Sigma Aldrich was used, and lab produced cathode particles were used for
studying the full cell.
Chapter 2. Synthesis, development, formulation and optimization of suspensions for tape casting
process
81
Patent Protected
Chapter 2. Synthesis, development, formulation and optimization of suspensions for tape casting
process
82
Part II
II.1.Tape casting
Planar cell was the subject of study in this work. Since anode support planar cells were
chosen to obtain the best possible performance, its fabrication is focused in detail in this thesis.
When it comes to fabrication of planar cells, the key factor is to obtain a dense electrolyte. These
fabrications of dense electrolyte are generally considered under two approaches namely
particulate approach and deposition approach. The deposition approach requires either anode or
cathode support formed by physical or chemical process, on which electrolyte will be deposited
and sintered. The deposition methods are namely spin coating, physical vapor deposition,
chemical vapor deposition, dip coating, sputtering, screen printing, plasma spraying, spray
pyrolysis. All this process requires high initial investment and maintenance cost. This deposition
approach to obtain dense electrolyte also require sequential and multi sintering steps to obtain a
single cell. The particulate approach tends to usage of ceramic powders to form cell components
by sintering at high temperature to form dense structure. There are two types of particulate
process namely i) tape casting and ii) tape calendering. Tape casting is the process for making
thin sheet of ceramic layers for SOFC. This involves formation of slurry and then casting it to
thin films by using doctor blade on a glass plate support. These are then dried; green tapes are
peeled, cut in required size and sintered.
In tape calendering, first the slurry containing ceramic powders and binders are made.
This slurry is then cast to the required thickness and pressed between two rolls. This tape is
sintered. Many layers of tape are made and can be laminated to form multilayer. Considering the
fact of high initial investment, maintenance costs and ease of fabrication particulate approach is

Chapter 2. Synthesis, development, formulation and optimization of suspensions for tape casting
process
83
preferred over deposition approach. In particulate approach, tape casting is chosen in this study
since it does not require any laminating process, which further reduces the fabrication cost. They
are generally the quickest process to obtain large area. So particulate approach by tape casting to
form a full cell was carried out and discussed in detail.
II.1.1.General tape casting principle
In tape casting, firstly mixture of powders, organic solvents, dispersants, plasticizers and
binders are made. These are called suspensions or slurry or slip. This slip must be stable to make
a sheet which is later dried to form a tape. To obtain a tape, the slurry should be homogeneous
which refers to even mixing of powders. It should not be of high viscosity, there should not be
any settling of powders, as well as it should form a single monolithic structure after sintering.
The various ingredients for the suspension are discussed below.
II.1.2.Stability
The ceramic particles in solid medium when mixed with liquid organic medium are
subjected to various forces. First, it can possibly settle causing sedimentation. This settling or
sedimentation is caused by weight and size of particles used, gravity forces of the particles
causing sedimentation. Second the particles can be attracted by Vanderwaals force, which cause
dipolar interactions. It can be avoided by constant stirring or agitation, the later being always
preferred. The stability of the suspensions are improved and maintained by altering the
composition. The sedimentation problem can be avoided by using small particles of the same

Chapter 2. Synthesis, development, formulation and optimization of suspensions for tape casting
process
84
size. The Vanderwaals force can also be avoided by usage of dispersant. The different properties
of materials used in suspension are mentioned below.
II.1.3 Solvent
There are generally two types of solvents that are used in the process of tape casting.
They are namely aqueous and organic solvents. The aqueous solvents are always considered as
the best in regards to economical and environmental conditions. Although aqueous solvents has
the best qualities to suit the purpose, the fabrication process by using them is considered as
difficult in respect to drying of tapes and it will be time consuming to study a new process. Since
this work is focused on the development of new fabrication process which is already time
consuming, choice of organic solvents was preferred. Usage of organic solvents paves way for
adding mixture of different solvents in the same suspension. It also helps in dissolving all the
other ingredients in the suspension.
By using organic solvents, viscosity and drying rate of suspension can be controlled. The
viscosity is measure of shear stress to shear rate, this viscosity measurement was done by
rheology studies. The suitable viscosity researched for tape casting was found to be 20 mPa.s at
shear rate of 10s-1[9]. Drying is the next major parameter to be controlled in tape casting. Drying
can be made in controlled atmosphere or in open air. Solvents are the material which is used to
evaporate during drying. Drying performed in controlled atmosphere is always better and
preferred, but in general case drying is performed in open air. Some solvents used in suspension
can dry very quickly on opening the slurry to atmosphere which is not suitable for tape casting
Chapter 2. Synthesis, development, formulation and optimization of suspensions for tape casting
process
85
ex Ethyl Methyl Ketone [MEK]. This gives necessity to use mixture of solvents. The other
solvent which can be used is ethanol. Normally ethanol evaporates a bit slower compared to
MEK. In suspension generally, azeotropic mixture of ethanol and MEK which has the same
drying rate in liquid and gas phase are used. By using this mixture, drying rate can be controlled
as per requirement. So in this work mixture of ethanol and MEK were used as solvent to have a
controlled drying rate. This was brought from Sigma – Aldrich.
II.1.4. Dispersant
For the suspension, the solvents used should be enough to disperse the powders in the
slurry. But this is not actually the case. So dispersant are added to suspension to ensure the
stability. These dispersants helps to avoid agglomeration of particles and sedimentation. They are
also called surfactants. They are polymer which adhere to the surface of the particle and keep
them separate. Triethanol amine is the dispersant used in this work.
II.1.5 Binder
There are water soluble aqueous binders and non aqueous binders. Since an organic
solvent was used in this study, non aqueous binders are chosen. The main prerequisite of usage
of binders is to give mechanical strength to tape. These binders form a network of different
constituents in the suspension. During drying when all solvents have evaporated, the binder’s
forms link between powder particles, forms a long chain that gives the tape after casting. There
are two types of organic binders available: namely polyvinyl and poly acrylic binders. In this
Chapter 2. Synthesis, development, formulation and optimization of suspensions for tape casting
process
86
work Polyvinyl Butyral (PVB) binder was chosen that can be soluble in selected solvent ethanol.
This binder is brought from Sigma-Aldrich whose commercial name is Butvar B98. This is
insoluble in MEK.
II.1.6. Plasticizer
Plasticizers are additives used, while making suspension for SOFC tape casting. They
increase the fluidity of suspension and increase the plasticity of tape after it has dried. Once the
tape is dried on glass plate, it will be peeled of from glass plate and kept in furnace for sintering.
For removing a green tape, it has to have mechanical strength provided by binder and the
plasticity provided by them. This plasticizer also helps to avoid the breakage or tearing or
cracking of tape while peeling from glass plate. Benzyl Butyl phthalate (BBP) and Poly ethylene
glycol (PEG) were selected to be used in this work, since it is compatible with chosen solvents.
Both plasticizers were bought from Sigma-Aldrich.
II.1.7. Pore formers
Pore formers are additives used in the preparation of suspension for tape casting. Their
main role is to form pores by burning themselves during the sintering of tape. Since an
electrolyte needs to be as dense as possible, pore formers are not used in electrolyte suspension
preparation. These are normally used in anode suspensions and cathodes if necessary. It makes
electrodes porous which in turn will increase the performance of cell. The common pore formers
are namely carbon black, potato starch, rice starch and graphite [10]. In this work both carbon

Chapter 2. Synthesis, development, formulation and optimization of suspensions for tape casting
process
87
black and potato starch were tried among which carbon black was most preferred due to its
advantages. Carbon black and potato starch are bought from Sigma-Aldrich.
II.2. Slurry or suspension preparation
Once all the ceramic powders, solvents, dispersants, binders, plasticizers, poreformers are
selected; these are taken in grinding jar. The zirconia balls of diameter 10mm were used along
with the ingredients to grind or mill them. Slurry preparation is generally done in two steps to
ensure homogeneous suspension. Firstly ceramic powders, dispersants, solvents are added in and
made to disperse well, pore formers are also added in the first step of the preparation of electrode
slurry. This is made to mill well for 24 hours. In the second step binders, plasticizers are added
and milled for another 24 hours. So now the suspension is ready to use. The viscosity of the
suspensions is already custom made according to the amount of powders and solvents used.
II.2.1. Preparation of an anode support slurry
The chosen anode material was NiO. It was used with GDC10 electrolyte to make a
composite cermet. This cermet structure will be employed to give high fuel conversion efficiency
and create as large TPB as possible to enhance performance [11]. The chosen ceramic powders in
suspensions was prepared with mass ratio of 65:35 for NiO to GDC10, while maintaining the
ratio of solid content to liquid 60:40 [12.13]. This gives the best optimal performance and after
reduction, the amount of 40% volume of Ni remains in the cermet [14]. The pore formers are not
active materials as it burns out during sintering step. In first attempt, potato starch was used as
Chapter 2. Synthesis, development, formulation and optimization of suspensions for tape casting
process
88
pore former. Different percentage of pore former was tried and results are discussed and then
other pore former carbon black was also tested.
II.2.2. Preparation of an electrolyte slurry
For electrolyte preparation two different amounts of solid active materials to liquid
content were tried. The ratio containing 45:55 of solid to liquid content was first used [15] which
is later optimized to have best density at chosen temperature. The optimized ratio in this work
was 55:45 for solid to liquid for selected temperature.
II.2.3. Preparation of cathode slurry
For preparation of cathode slurry LSCF48 is chosen as an active material, this is mixed
with GDC10 to make composite slurry to improve cell performance by polarization of cathode
[16, 17]. In this work mass ratio of 65:35 for LSCF48 to GDC10 was chosen, so that the
composition remains the same for anode and cathode while maintaining the lowest polarization
for cathode. However in literature different mass ratio of 70:30 [18] and 50:50 [19] were used to
reduce polarization. It was concluded that, cathode polarization also depends on microstructure,
sintering temperature and composition of cathode material used [20-21].
II.2.4.Preparation of an anode functional layer slurry
Anode functional layer (AFL) is used in an ASC, to increase its performance. Since an
anode support is very thick and with lot of pores, there will be less TPB. The thickness of anode

Chapter 2. Synthesis, development, formulation and optimization of suspensions for tape casting
process
89
support can lead sometimes to large polarization. So to avoid polarization, to maximize TPB and
to increase the performance, AFL is used in the cell [22]. The thickness of the anode functional
layer also plays a crucial parameter. Generally thin layer should be used in the cell. The optimal
thickness of AFL should be between 10-20 µm [23-25]. There are many techniques used for
deposition of this AFL on anode support layer. They are namely dip coating, spray coating, slip
casting, and tape casting [26-30]. Since anode support was fabricated by tape casting in this work,
it will be easy to deposit AFL by tape casting. The composition for an anode functional layer is
the same as the anode support layer, but the pore formers were not used.
II.3. Casting of suspension
Once the suspensions are made, they are casted. Normally casting is done on a flat, clean
surface. This is done usually on glass plate or on a mylar plastic sheet made of polyethylene
terephthalate. This will help to peel the tape easily after drying. The thickness of layer to be
casted will depend on the electrode or electrolyte suspension. Since anode support is the case of
study in this work, the anode support layer will be made thicker. The thickness of casting layer
was adjusted by the doctor blade, which helps to obtain uniform tape. The electrolyte suspension
was casted to a thin layer on glass plate and anode support on it. The subsequent layers are
casted only after the layer dried well in air. The casting was performed by automated machine in
this study. The casting was always done at a constant speed of 4 mm.s-1 for all the layers. The
Figure II.11 shows an automated tape casting machine used in this study.
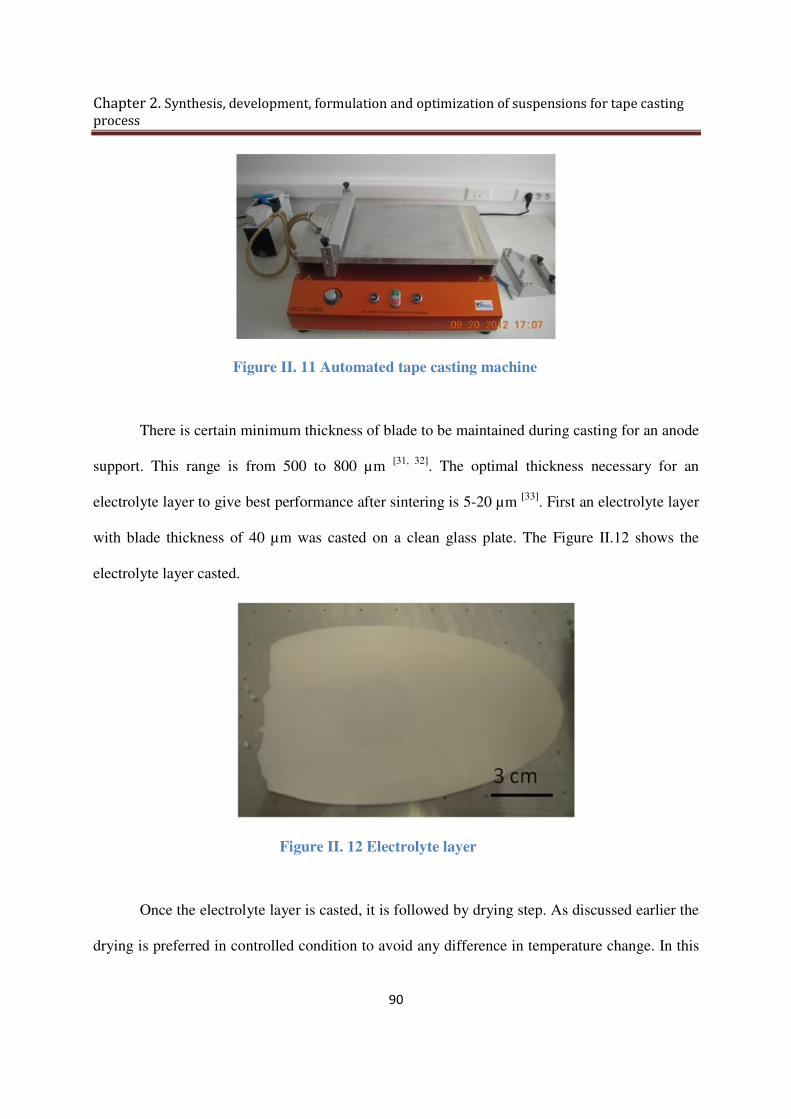
Chapter 2. Synthesis, development, formulation and optimization of suspensions for tape casting
process
90
Figure II. 11 Automated tape casting machine
There is certain minimum thickness of blade to be maintained during casting for an anode
support. This range is from 500 to 800 µm [31, 32]. The optimal thickness necessary for an
electrolyte layer to give best performance after sintering is 5-20 µm [33]. First an electrolyte layer
with blade thickness of 40 µm was casted on a clean glass plate. The Figure II.12 shows the
electrolyte layer casted.
Figure II. 12 Electrolyte layer
Once the electrolyte layer is casted, it is followed by drying step. As discussed earlier the
drying is preferred in controlled condition to avoid any difference in temperature change. In this
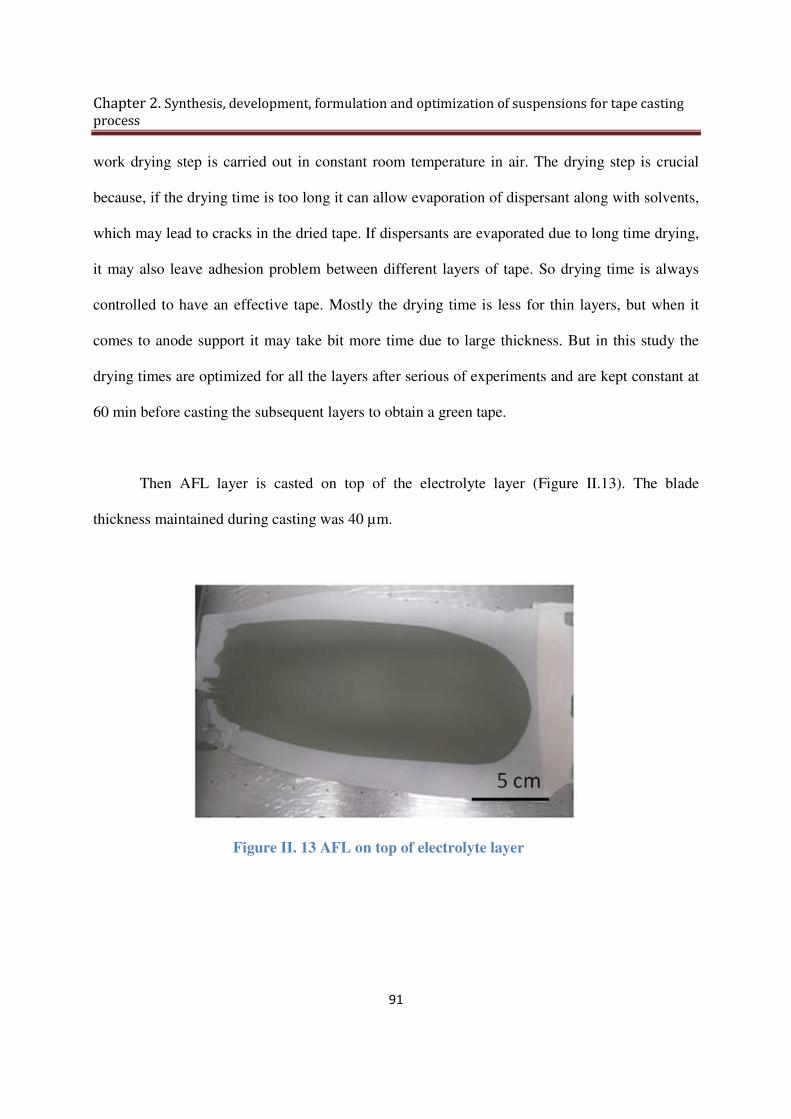
Chapter 2. Synthesis, development, formulation and optimization of suspensions for tape casting
process
91
work drying step is carried out in constant room temperature in air. The drying step is crucial
because, if the drying time is too long it can allow evaporation of dispersant along with solvents,
which may lead to cracks in the dried tape. If dispersants are evaporated due to long time drying,
it may also leave adhesion problem between different layers of tape. So drying time is always
controlled to have an effective tape. Mostly the drying time is less for thin layers, but when it
comes to anode support it may take bit more time due to large thickness. But in this study the
drying times are optimized for all the layers after serious of experiments and are kept constant at
60 min before casting the subsequent layers to obtain a green tape.
Then AFL layer is casted on top of the electrolyte layer (Figure II.13). The blade
thickness maintained during casting was 40 µm.
Figure II. 13 AFL on top of electrolyte layer

Chapter 2. Synthesis, development, formulation and optimization of suspensions for tape casting
process
92
This layer was dried for 60 min before casting the next layer of anode support. With the
blade thickness of 720 µm, anode support layer is cast above the AFL. This is shown in Figure
II.14.
Figure II. 14 Anode support layer above AFL
This was also dried for an hour and then it is carefully removed and sintered. This
structure consisting of anode support layer, AFL and electrolyte layer is called half cell.
Once the suspension is dried to form a green tape, it is removed and cut in required
shape. In this work both coin cells of active area 2 cm2 and large planar cells of active area from
10 cm2 till 50 cm2 were prepared. Cutting was done by normal knife blade for large area and by
mold punches for button cells. This cutting of electrode seems to be crucial step, because if there
are little deformed edges, it affects the consequent layers and leads to breakage of cell during
sintering. The preparation of button cells was easy and quick compared to large area cells
because, it leaves less deformed area during cutting. Cutting of large area electrode was always
difficult and lot of time and efforts are taken to perform it to have least possible deformation and
obtain a good cell.

Chapter 2. Synthesis, development, formulation and optimization of suspensions for tape casting
process
93
II.4 Sintering
Sintering is the heating step done to a tape. Sintering is the normal process of heating of a
ceramic material to a temperature below its melting point to obtain a required shape or structure.
This is always facilitated at higher temperatures. During sintering the diffusion of atoms takes
place at higher temperature and also it helps in grain growth. It also helps in getting a compact
microstructure.
During sintering, all the solvents, binders, dispersants, plasticizers, poreformers are
evaporated and burnt. The burning of binders and poreformers leave enough porosity in
electrodes, while sintering at higher temperature helps in attaining dense electrolyte. This
sintering of green tape was always peformed on sintering plates made of alumina silica plates
which are non reactive to chosen electrode active materials. Sintering is one of most important
step in obtaining a cell.
The choice of temperature is crucial to obtain porous electrodes while maintaining the
best possible dense electrolyte. Generally for an anode support consisting of NiO/GDC10 and
electrolyte layer of GDC10, the sintering temperature used in literature is 1350°C for 3 hours [15].
In this work, the cell was sintered at 1350°C for 3 hours to test. Rising of temperature during
sintering is another factor to be chosen carefully. Rapid increase of temperaure can cause cracks
in tape, which eventually leads to deformed cell structure. In this study rising of temperature was
done at 1°C per minute to avoid any deformation in green tape. Gradual increase of temperature
to sintering temperature leads to irregular burn out of pore formers. So increasing temperature
was done at constant rate. For burnout of pore formers, different temperatures were tested and

Chapter 2. Synthesis, development, formulation and optimization of suspensions for tape casting
process
94
optimized to 280°C isothermal for 1 hour and then it is raised to final temperature. Once after
sintering the furnace is also cooled to room temperature at same rate as heating. Once sintering is
done, a required structure will be obtained. This process of sintering many layers together is
called as cosintering. All this sintering was done in air atmosphere. The Figure II.15 shows the
sintering protocol used.
Figure II. 15 Sintering protocol for anode support half cell
Then the sintered half cell with an anode support layer, AFL, and electrolyte layer were
taken out from the furnace. The Figure II.16 shows the sintered half cell: The half cell obtained
is leached by the sintering plate during sintering; the electrolyte layer is on top.
Figure II. 16 Sintered half cell
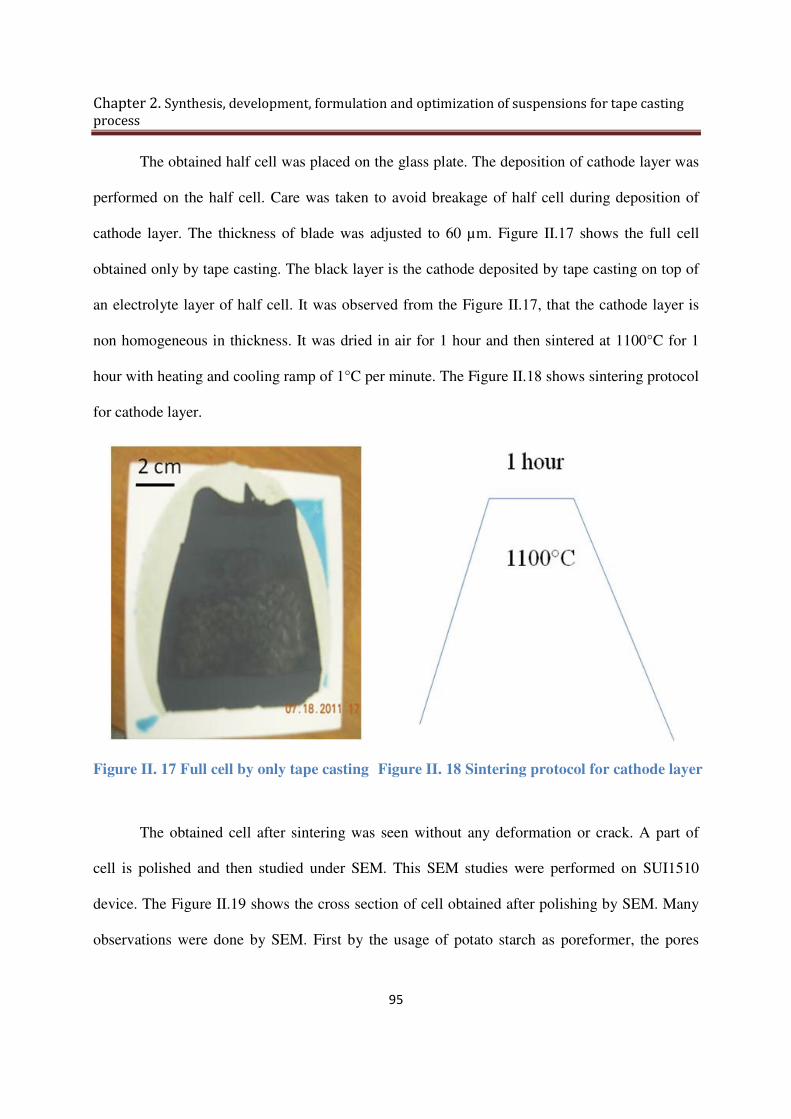
Chapter 2. Synthesis, development, formulation and optimization of suspensions for tape casting
process
95
The obtained half cell was placed on the glass plate. The deposition of cathode layer was
performed on the half cell. Care was taken to avoid breakage of half cell during deposition of
cathode layer. The thickness of blade was adjusted to 60 µm. Figure II.17 shows the full cell
obtained only by tape casting. The black layer is the cathode deposited by tape casting on top of
an electrolyte layer of half cell. It was observed from the Figure II.17, that the cathode layer is
non homogeneous in thickness. It was dried in air for 1 hour and then sintered at 1100°C for 1
hour with heating and cooling ramp of 1°C per minute. The Figure II.18 shows sintering protocol
for cathode layer.
Figure II. 17 Full cell by only tape casting Figure II. 18 Sintering protocol for cathode layer
The obtained cell after sintering was seen without any deformation or crack. A part of
cell is polished and then studied under SEM. This SEM studies were performed on SUI1510
device. The Figure II.19 shows the cross section of cell obtained after polishing by SEM. Many
observations were done by SEM. First by the usage of potato starch as poreformer, the pores

Chapter 2. Synthesis, development, formulation and optimization of suspensions for tape casting
process
96
seen after sintering were very large, and they were irregular in structure. In some places they
were continuous from anode to cathode. The C refers to cathode layer on the left side of
electrolyte in the SEM picture. E refers to electrolyte layer in the middle and A refers to anode
support layer on the right side in the SEM picture.
Figure II. 19 Cross section of cell by SEM Figure II. 20 Focus on electrolyte layer with 45% of solids
The thickness of full cell was also estimated by SEM. The Figure II.20 shows the focus
on electrolyte layer of cell which is represented by E in the middle. The Anode layer is
represented by A on the right side of the electrolyte in SEM picture and Cathode layer
represented by C on the left side of the electrolyte. More effort was made to study an electrolyte
layer. The thickness of electrolyte layer obtained after sintering was 8 µm. The cathode layer
thickness estimated by SEM was 35 µm. The thickness of AFL and anode supported was 245
µm. The main observation was the GDC layer was porous after sintering.
EDX analysis was done on sample to check if there is any infiltration or interfacial
reaction at electrode /electrolyte interface. The Figure II.21 shows the EDX analysis on back
scattered SEM image. From Figure II.21, GDC10-HP can be seen in white colour. The black
dark patches on the anode layer come from pore formers after sintering.
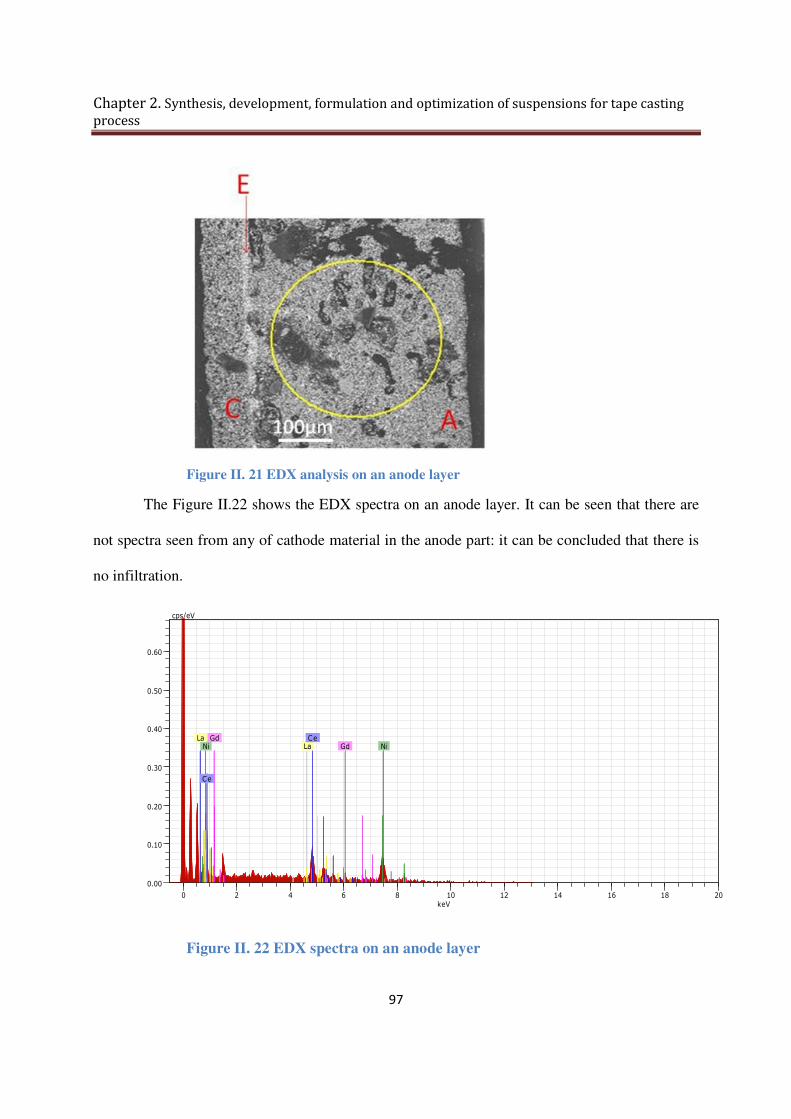
Chapter 2. Synthesis, development, formulation and optimization of suspensions for tape casting
process
97
Figure II. 21 EDX analysis on an anode layer
The Figure II.22 shows the EDX spectra on an anode layer. It can be seen that there are
not spectra seen from any of cathode material in the anode part: it can be concluded that there is
no infiltration.
Figure II. 22 EDX spectra on an anode layer
0 2 4 6 8 10 12 14 16 18 20keV
0.00
0.10
0.20
0.30
0.40
0.50
0.60
cps/eV
Ni Ni La La Ce
Ce
Gd Gd
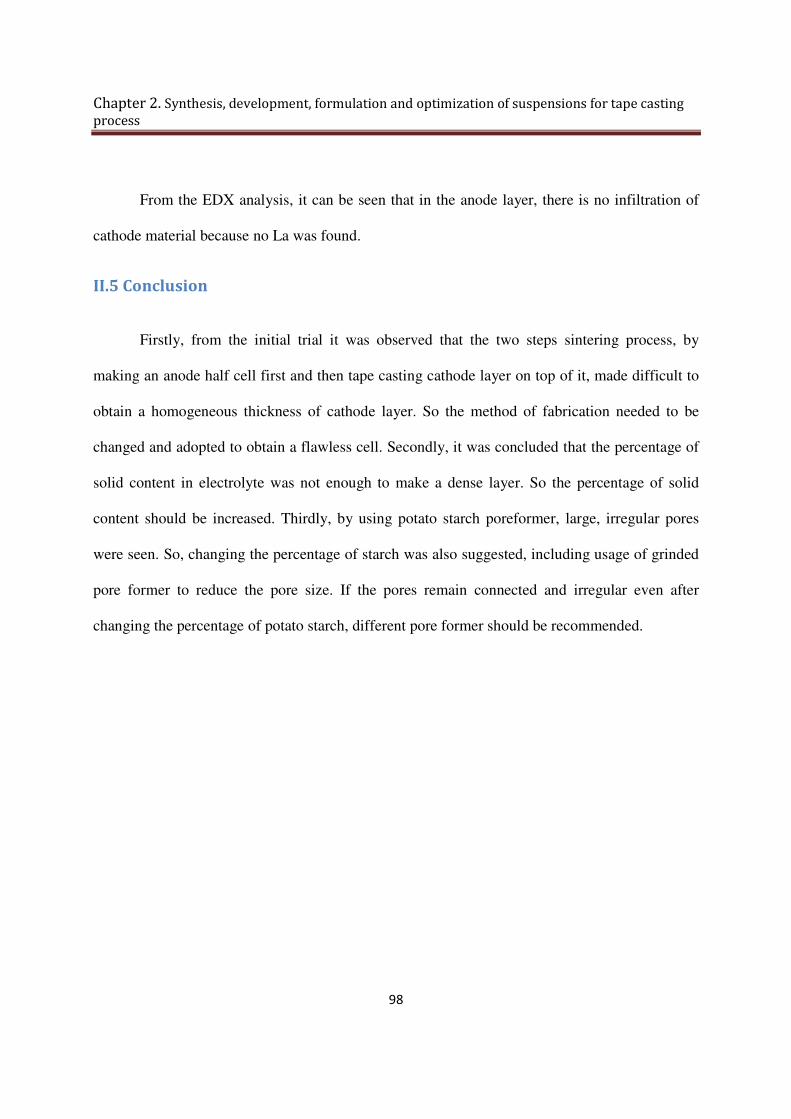
Chapter 2. Synthesis, development, formulation and optimization of suspensions for tape casting
process
98
From the EDX analysis, it can be seen that in the anode layer, there is no infiltration of
cathode material because no La was found.
II.5 Conclusion
Firstly, from the initial trial it was observed that the two steps sintering process, by
making an anode half cell first and then tape casting cathode layer on top of it, made difficult to
obtain a homogeneous thickness of cathode layer. So the method of fabrication needed to be
changed and adopted to obtain a flawless cell. Secondly, it was concluded that the percentage of
solid content in electrolyte was not enough to make a dense layer. So the percentage of solid
content should be increased. Thirdly, by using potato starch poreformer, large, irregular pores
were seen. So, changing the percentage of starch was also suggested, including usage of grinded
pore former to reduce the pore size. If the pores remain connected and irregular even after
changing the percentage of potato starch, different pore former should be recommended.
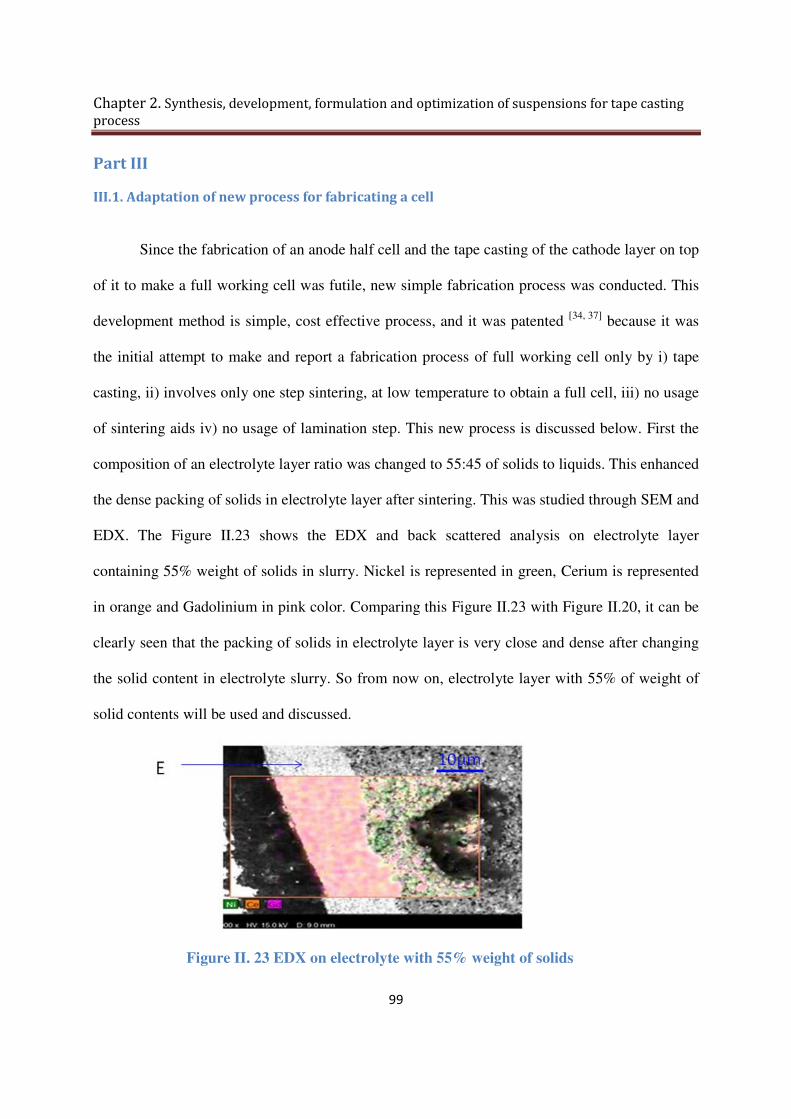
Chapter 2. Synthesis, development, formulation and optimization of suspensions for tape casting
process
99
Part III
III.1. Adaptation of new process for fabricating a cell
Since the fabrication of an anode half cell and the tape casting of the cathode layer on top
of it to make a full working cell was futile, new simple fabrication process was conducted. This
development method is simple, cost effective process, and it was patented [34, 37] because it was
the initial attempt to make and report a fabrication process of full working cell only by i) tape
casting, ii) involves only one step sintering, at low temperature to obtain a full cell, iii) no usage
of sintering aids iv) no usage of lamination step. This new process is discussed below. First the
composition of an electrolyte layer ratio was changed to 55:45 of solids to liquids. This enhanced
the dense packing of solids in electrolyte layer after sintering. This was studied through SEM and
EDX. The Figure II.23 shows the EDX and back scattered analysis on electrolyte layer
containing 55% weight of solids in slurry. Nickel is represented in green, Cerium is represented
in orange and Gadolinium in pink color. Comparing this Figure II.23 with Figure II.20, it can be
clearly seen that the packing of solids in electrolyte layer is very close and dense after changing
the solid content in electrolyte slurry. So from now on, electrolyte layer with 55% of weight of
solid contents will be used and discussed.
Figure II. 23 EDX on electrolyte with 55% weight of solids

Chapter 2. Synthesis, development, formulation and optimization of suspensions for tape casting
process
100
The Figure II.24 shows the EDX anlaysis on the electrolyte and anode layer of half cell
containing 55 weight percentages of solids. It was observed that there was no infiltration either
by sintering plates or anode materials on the electrolyte layer; pure dense electrolyte layer only
with GDC10 was obtained.
Figure II. 24 EDX analysis on half cell containing 55% weight of solids
III.2. Development of new fabrication process by tape casting approach
In order to obtain a homogeneous cathode layer thickness by tape casting on an anode
support cell, new idea was drawn, and implemented in the fabrication process. By implementing
the new idea, it was possible to obtain a complete full working cell. This idea also leads to many
other advantages as discussed below.
0 2 4 6 8 10 12 14 16 18 20keV
0.0
0.2
0.4
0.6
0.8
1.0
1.2
1.4
1.6
1.8
cps/eV
Ni Ni Ce
Ce
Gd Gd
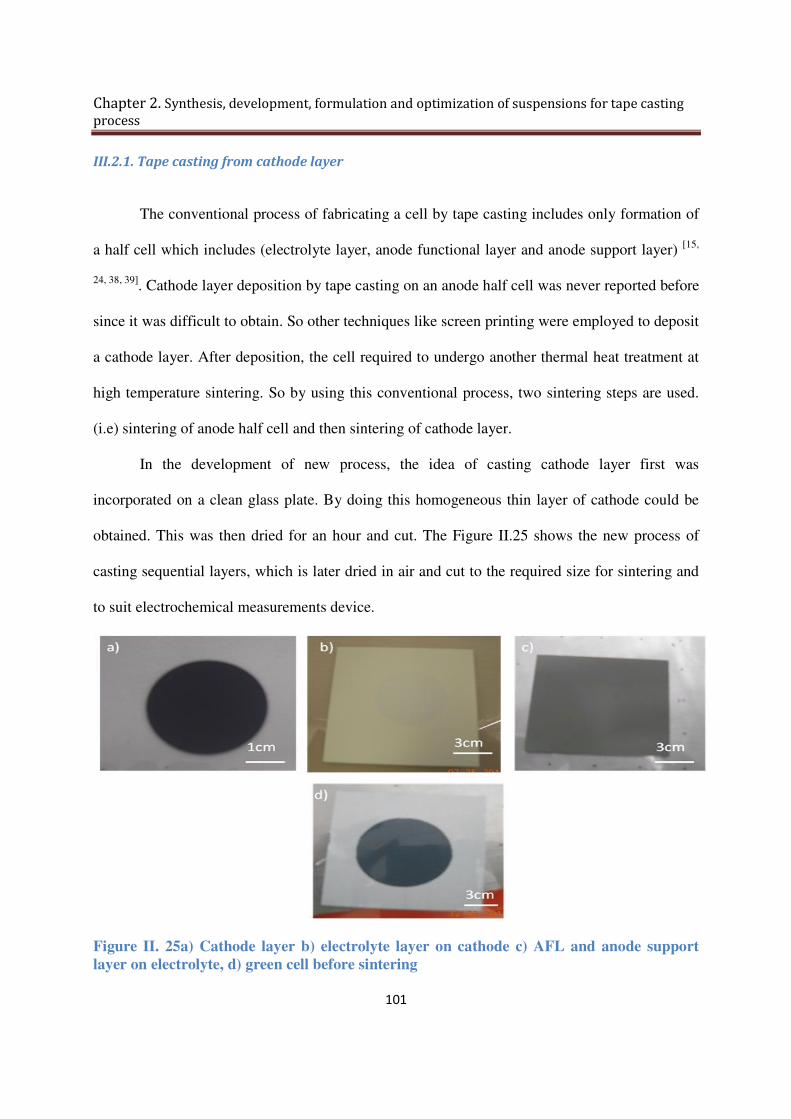
Chapter 2. Synthesis, development, formulation and optimization of suspensions for tape casting
process
101
III.2.1. Tape casting from cathode layer
The conventional process of fabricating a cell by tape casting includes only formation of
a half cell which includes (electrolyte layer, anode functional layer and anode support layer) [15,
24, 38, 39]. Cathode layer deposition by tape casting on an anode half cell was never reported before
since it was difficult to obtain. So other techniques like screen printing were employed to deposit
a cathode layer. After deposition, the cell required to undergo another thermal heat treatment at
high temperature sintering. So by using this conventional process, two sintering steps are used.
(i.e) sintering of anode half cell and then sintering of cathode layer.
In the development of new process, the idea of casting cathode layer first was
incorporated on a clean glass plate. By doing this homogeneous thin layer of cathode could be
obtained. This was then dried for an hour and cut. The Figure II.25 shows the new process of
casting sequential layers, which is later dried in air and cut to the required size for sintering and
to suit electrochemical measurements device.
Figure II. 25a) Cathode layer b) electrolyte layer on cathode c) AFL and anode support
layer on electrolyte, d) green cell before sintering

Chapter 2. Synthesis, development, formulation and optimization of suspensions for tape casting
process
102
This green cell obtained was sintered at conventional sintering temperature of maximum
1400°C in first instance, and then it was reduced to 1300°C. The cathode cannot be sintered
above 1300°C, considering the fact that higher sintering temperature of cathode leads to
microstructure change, increases the grain size, lowers electrical conductivity and makes it
dense. These high sintering temperatures of cathode reduces also the activation energy for
oxygen permeation in cathode and in turn increase of oxygen permeation flux. [40]. After
sintering, the cell was taken and observed to be broken as shown in Figure II.26. The reason for
broken cell was unkown in initial stages. All the cells co-sintered by one step sintering at 1300°C
were broken. After fabrication of several cells at the same sintering temperature it was concluded
that the sintering temperature was the problem and a change of sintering temperature was
adopted.
.
Figure II. 26 Full cell by tape casting sintered at 1300°C
The reduction of the sintering temperature may be good for cathode to be porous, but care
should be taken because reducing the sintering temperature will lead to porous electrolyte. This
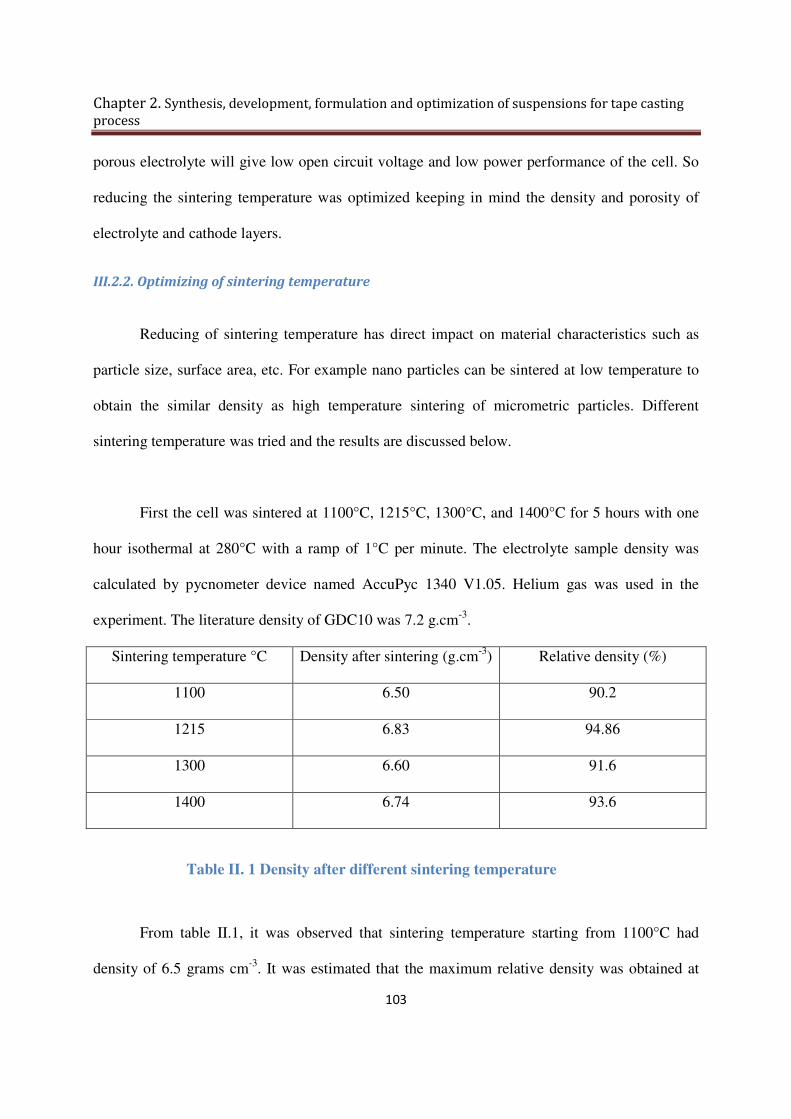
Chapter 2. Synthesis, development, formulation and optimization of suspensions for tape casting
process
103
porous electrolyte will give low open circuit voltage and low power performance of the cell. So
reducing the sintering temperature was optimized keeping in mind the density and porosity of
electrolyte and cathode layers.
III.2.2. Optimizing of sintering temperature
Reducing of sintering temperature has direct impact on material characteristics such as
particle size, surface area, etc. For example nano particles can be sintered at low temperature to
obtain the similar density as high temperature sintering of micrometric particles. Different
sintering temperature was tried and the results are discussed below.
First the cell was sintered at 1100°C, 1215°C, 1300°C, and 1400°C for 5 hours with one
hour isothermal at 280°C with a ramp of 1°C per minute. The electrolyte sample density was
calculated by pycnometer device named AccuPyc 1340 V1.05. Helium gas was used in the
experiment. The literature density of GDC10 was 7.2 g.cm-3.
Sintering temperature °C Density after sintering (g.cm-3) Relative density (%)
1100 6.50 90.2
1215 6.83 94.86
1300 6.60 91.6
1400 6.74 93.6
Table II. 1 Density after different sintering temperature
From table II.1, it was observed that sintering temperature starting from 1100°C had
density of 6.5 grams cm-3. It was estimated that the maximum relative density was obtained at

Chapter 2. Synthesis, development, formulation and optimization of suspensions for tape casting
process
104
1215°C. The normal phenomenon is increase of density with respect to temperature. However
decrease in density after the threshold temperature of 1215°C was observed. The reason observed
was that rather than forming a dense microstructure, the particles seems to coarsen. The
maximum density which can be obtained for the particles produced by co precipitation process
was 95% [41]. This is however evident from SEM pictures. The Figure II.27 a) shows the
electrolyte sintered at 1100°C. At this temperature much pores in electrolyte layer were observed
and it is directly ruled out to use this temperaurte further. The Figure II.27 a) shows the cross
section of cell, where the left layer corresponds to cathode, the white layer in the middle is the
electrolyte layer which is represented as (e). Figure II.27 b) shows electrolyte sintered at 1215°C.
It was seen that the packing of solids in electrolyte layer was close and has less or no pores in
comparison with Figure II27 a) which was sintered at 1100°C. This temperature can be used in
the process as it exhibits highest density of electrolyte layer.
Figure II. 27a) Electrolyte sintered 1100°C b) Electrolyte sintered 1215°C
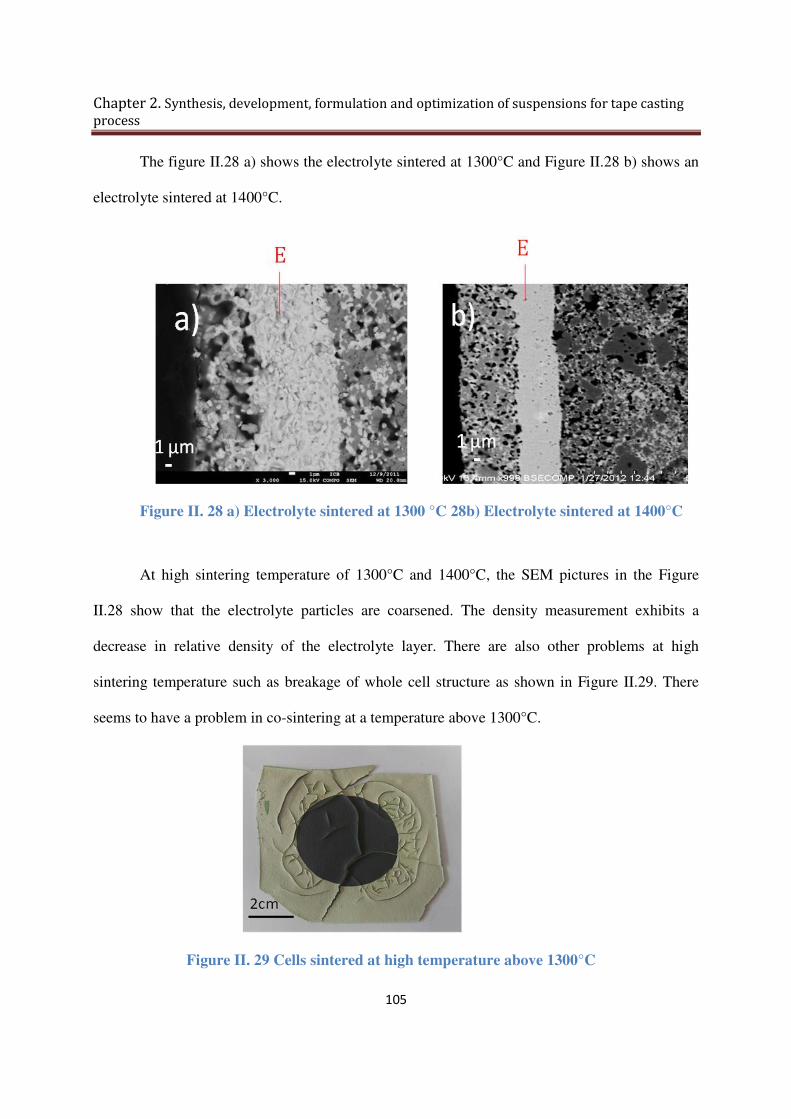
Chapter 2. Synthesis, development, formulation and optimization of suspensions for tape casting
process
105
The figure II.28 a) shows the electrolyte sintered at 1300°C and Figure II.28 b) shows an
electrolyte sintered at 1400°C.
Figure II. 28 a) Electrolyte sintered at 1300 °C 28b) Electrolyte sintered at 1400°C
At high sintering temperature of 1300°C and 1400°C, the SEM pictures in the Figure
II.28 show that the electrolyte particles are coarsened. The density measurement exhibits a
decrease in relative density of the electrolyte layer. There are also other problems at high
sintering temperature such as breakage of whole cell structure as shown in Figure II.29. There
seems to have a problem in co-sintering at a temperature above 1300°C.
Figure II. 29 Cells sintered at high temperature above 1300°C

Chapter 2. Synthesis, development, formulation and optimization of suspensions for tape casting
process
106
XRD characterization was performed on the anode sample, to check for any change in the
lattice parameter. The Figure II.30 shows the XRD pattern of NiO-GDC obtained after different
sintering temperatures starting from 1215°C in red, 1255°C in blue, 1300°C in green, and
1400°C in pink. The black color peaks represents the raw NiO-GDC before sintering. It was
observed that there is no change in material structure at sintering temperature till 1400°C.
Further no new peaks were also seen. It shows that there is no interdiffusion between NiO-
GDC10.
Figure II. 30 XRD pattern of anode at different sintering temperature
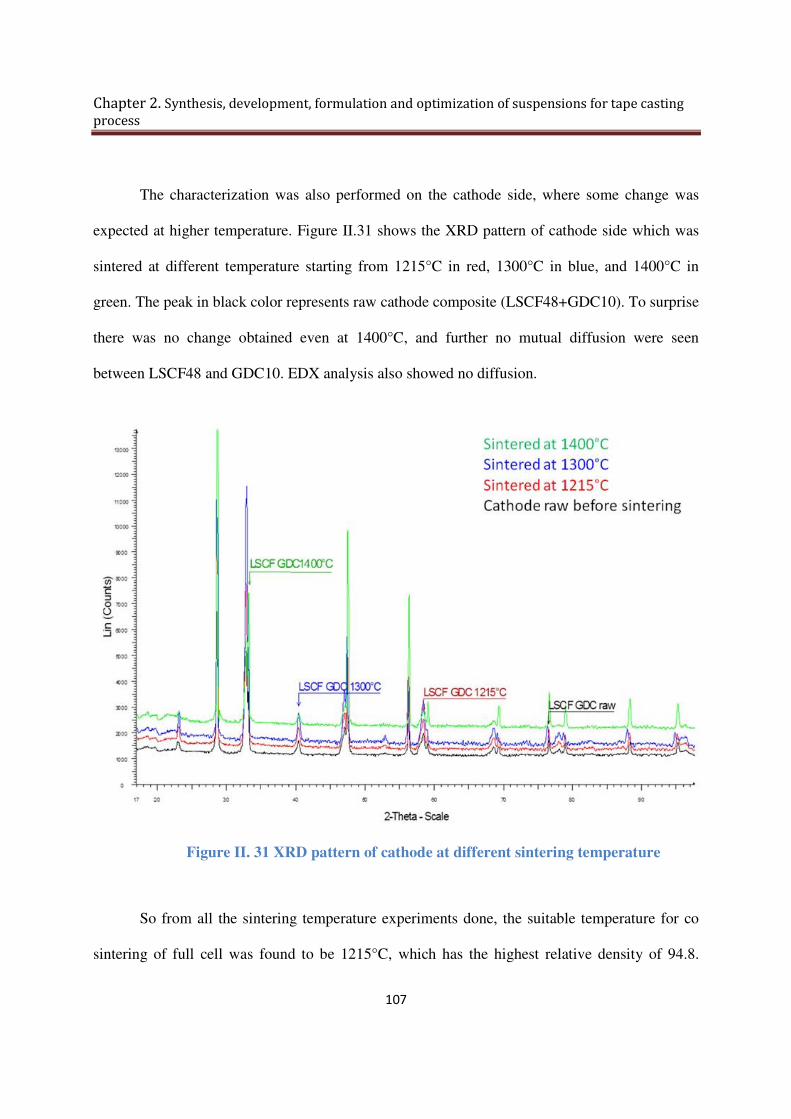
Chapter 2. Synthesis, development, formulation and optimization of suspensions for tape casting
process
107
The characterization was also performed on the cathode side, where some change was
expected at higher temperature. Figure II.31 shows the XRD pattern of cathode side which was
sintered at different temperature starting from 1215°C in red, 1300°C in blue, and 1400°C in
green. The peak in black color represents raw cathode composite (LSCF48+GDC10). To surprise
there was no change obtained even at 1400°C, and further no mutual diffusion were seen
between LSCF48 and GDC10. EDX analysis also showed no diffusion.
Figure II. 31 XRD pattern of cathode at different sintering temperature
So from all the sintering temperature experiments done, the suitable temperature for co
sintering of full cell was found to be 1215°C, which has the highest relative density of 94.8.
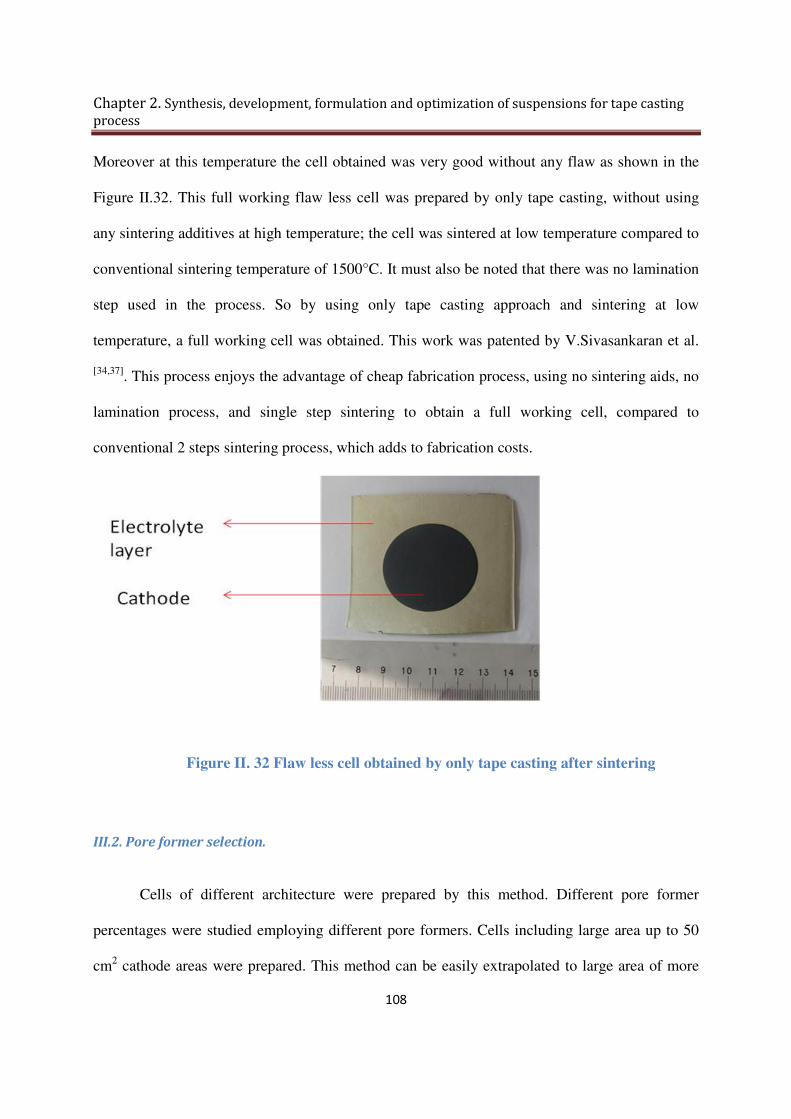
Chapter 2. Synthesis, development, formulation and optimization of suspensions for tape casting
process
108
Moreover at this temperature the cell obtained was very good without any flaw as shown in the
Figure II.32. This full working flaw less cell was prepared by only tape casting, without using
any sintering additives at high temperature; the cell was sintered at low temperature compared to
conventional sintering temperature of 1500°C. It must also be noted that there was no lamination
step used in the process. So by using only tape casting approach and sintering at low
temperature, a full working cell was obtained. This work was patented by V.Sivasankaran et al.
[34,37]. This process enjoys the advantage of cheap fabrication process, using no sintering aids, no
lamination process, and single step sintering to obtain a full working cell, compared to
conventional 2 steps sintering process, which adds to fabrication costs.
Figure II. 32 Flaw less cell obtained by only tape casting after sintering
III.2. Pore former selection.
Cells of different architecture were prepared by this method. Different pore former
percentages were studied employing different pore formers. Cells including large area up to 50
cm2 cathode areas were prepared. This method can be easily extrapolated to large area of more
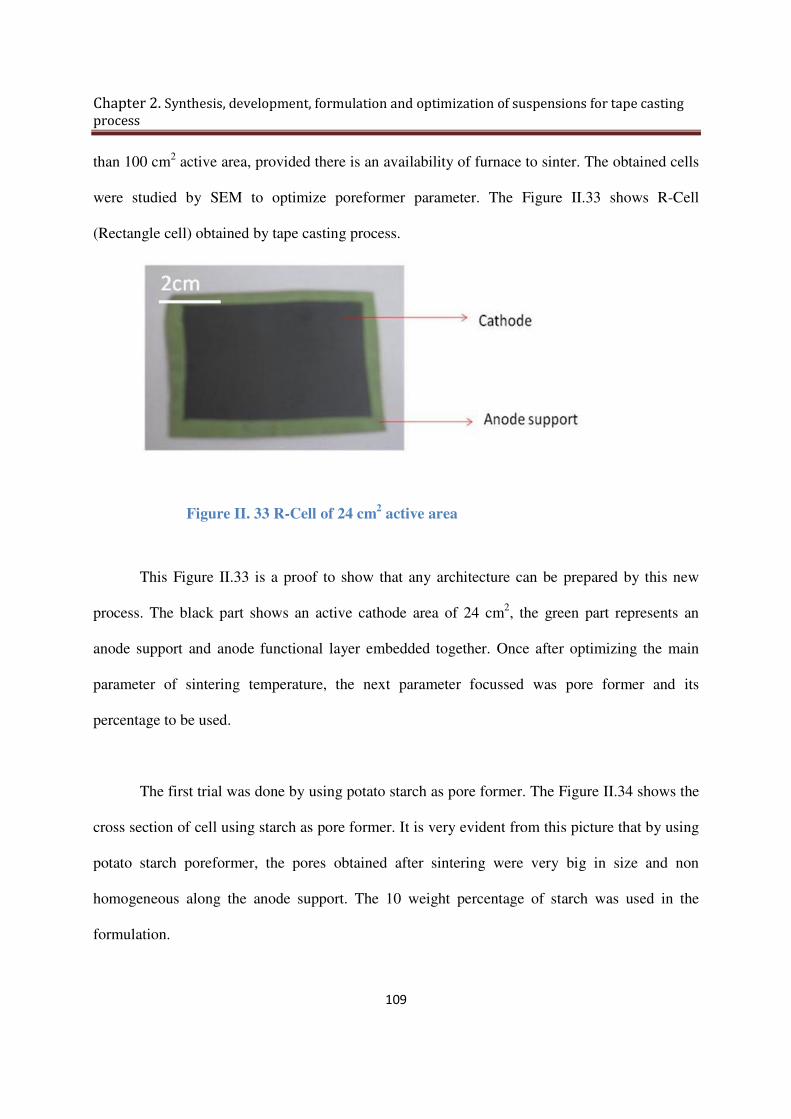
Chapter 2. Synthesis, development, formulation and optimization of suspensions for tape casting
process
109
than 100 cm2 active area, provided there is an availability of furnace to sinter. The obtained cells
were studied by SEM to optimize poreformer parameter. The Figure II.33 shows R-Cell
(Rectangle cell) obtained by tape casting process.
Figure II. 33 R-Cell of 24 cm2 active area
This Figure II.33 is a proof to show that any architecture can be prepared by this new
process. The black part shows an active cathode area of 24 cm2, the green part represents an
anode support and anode functional layer embedded together. Once after optimizing the main
parameter of sintering temperature, the next parameter focussed was pore former and its
percentage to be used.
The first trial was done by using potato starch as pore former. The Figure II.34 shows the
cross section of cell using starch as pore former. It is very evident from this picture that by using
potato starch poreformer, the pores obtained after sintering were very big in size and non
homogeneous along the anode support. The 10 weight percentage of starch was used in the
formulation.

Chapter 2. Synthesis, development, formulation and optimization of suspensions for tape casting
process
110
Figure II. 34 Cross section of cell with starch poreformer
This non homogeneous pore structure will have an impact in the performance of cell with
regards to high polarization in anode. So this was optimized. Using high percentage of pore
former in anode support leads sometimes to breakage of cell during sintering. So a change in
pore former percentage formulation was done to reduce the pore size and breakage. The Figure
II.35 a) shows the cross section of cell with 8% of starch and Figure II.35 b) shows the cross
section of cell with 5% in weight of starch in anode. It was observed that when using lower
percentage of starch in an anode support layer the pores were reduced in size and seems to be
more homogeneous across the anode. However, cell with 5% in weight will be subjected to
electrochemical characterization later. The layer on the left side represents cathode and the white
intermediate layer is electrolyte, the layer next to electrolyte is the anode functional layer with no
pores, the layer with pores is an anode support layer.

Chapter 2. Synthesis, development, formulation and optimization of suspensions for tape casting
process
111
Figure II. 35 a) Cross section of cell with 8% of starch in anode b) 5% of starch in anode
Another pore former named carbon black was also employed in preparation process. It
can be seen from the Figure II.36 showing the cross section of cell using carbon black as
poreformer that the pores obtained were very small and homogeneous. There was no difficulty or
breakage during sintering. The dispersion of carbon black in the initial step of slurry was a very
important factor to be noted. After adding the carbon pore former, the jar should be manually
agitated for some few minutes to make the carbon disperse well. On direct milling of carbon,
settling of carbon was observed, which leads to unhomogeneous slurry not suitable for casting.
The layer on left side represents the cathode and the white layer is the electrolyte, the anode
functional layer is clearly seen when using carbon pore former and the large layer on right is the
anode support layer. So after electrochemical characterization, carbon black was chosen as the
best pore former, (ranging from 2-5%) and all optimizations from now will be based on carbon
poreformer. All the results are discussed in detail.
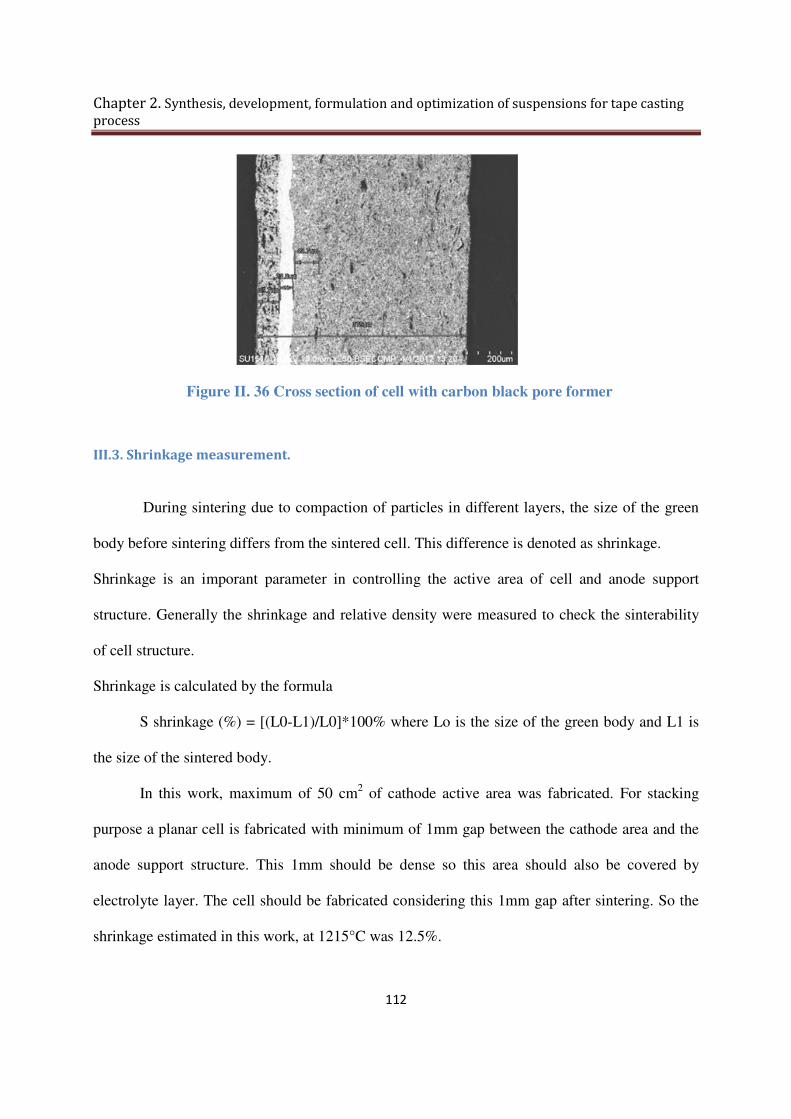
Chapter 2. Synthesis, development, formulation and optimization of suspensions for tape casting
process
112
Figure II. 36 Cross section of cell with carbon black pore former
III.3. Shrinkage measurement.
During sintering due to compaction of particles in different layers, the size of the green
body before sintering differs from the sintered cell. This difference is denoted as shrinkage.
Shrinkage is an imporant parameter in controlling the active area of cell and anode support
structure. Generally the shrinkage and relative density were measured to check the sinterability
of cell structure.
Shrinkage is calculated by the formula
S shrinkage (%) = [(L0-L1)/L0]*100% where Lo is the size of the green body and L1 is
the size of the sintered body.
In this work, maximum of 50 cm2 of cathode active area was fabricated. For stacking
purpose a planar cell is fabricated with minimum of 1mm gap between the cathode area and the
anode support structure. This 1mm should be dense so this area should also be covered by
electrolyte layer. The cell should be fabricated considering this 1mm gap after sintering. So the
shrinkage estimated in this work, at 1215°C was 12.5%.
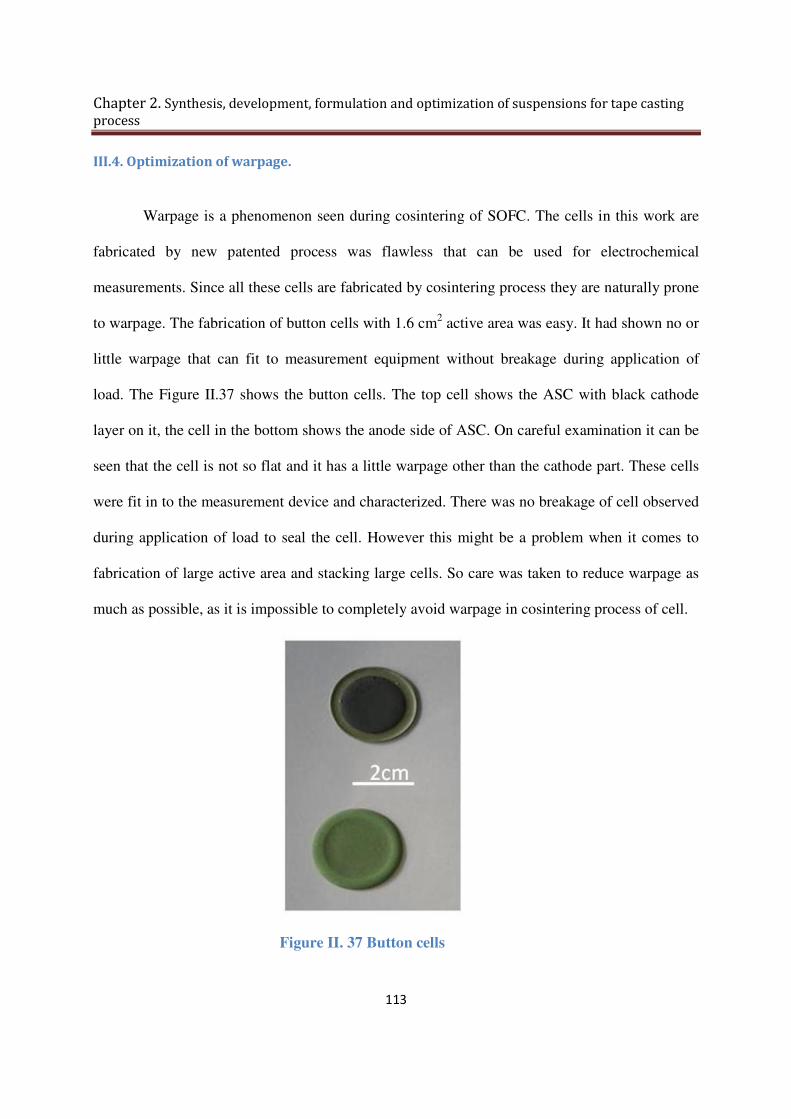
Chapter 2. Synthesis, development, formulation and optimization of suspensions for tape casting
process
113
III.4. Optimization of warpage.
Warpage is a phenomenon seen during cosintering of SOFC. The cells in this work are
fabricated by new patented process was flawless that can be used for electrochemical
measurements. Since all these cells are fabricated by cosintering process they are naturally prone
to warpage. The fabrication of button cells with 1.6 cm2 active area was easy. It had shown no or
little warpage that can fit to measurement equipment without breakage during application of
load. The Figure II.37 shows the button cells. The top cell shows the ASC with black cathode
layer on it, the cell in the bottom shows the anode side of ASC. On careful examination it can be
seen that the cell is not so flat and it has a little warpage other than the cathode part. These cells
were fit in to the measurement device and characterized. There was no breakage of cell observed
during application of load to seal the cell. However this might be a problem when it comes to
fabrication of large active area and stacking large cells. So care was taken to reduce warpage as
much as possible, as it is impossible to completely avoid warpage in cosintering process of cell.
Figure II. 37 Button cells

Chapter 2. Synthesis, development, formulation and optimization of suspensions for tape casting
process
114
The optimization of warpage is the next parameter considered for the study. This warpage
normally occurs due to compaction of solid particles during cosintering. This compaction leads
to dense structure. The main layer which is subjected to undergo compaction and become dense
at sintering temperature is electrolyte part of cell. Since this process deals with cosintering of
multilayers, care was taken to study from where and which temperature warpage tends to occur.
It was observed that an electrolyte leads to more warpage at high sintering temperature.
In multilayers, cathode layer will also warp concave at lower temperature. This warpage
of multilayers can be reduced by changing the viscosity properties of GDC layers [42]. The other
possible solution is gradual loading during sintering [43]. It was also shown that loading the green
body was a failure. To the contrary, the warpage was successfully drastically reduced in smaller
area of less than 1.6 cm2 button cells by loading the initial green body during sintering. After
series of trials with different load, it was found that the optimal threshold load weight required
for 1.6 cm2 was 115 g equally distributed along the sintering plates. Even, by placing 5 grams
more could break the cell as in the same way, 5 grams less could lead to distortion in cell
structure. By using this way maximum of 4 cells can be sintered at once. This weight is the load
exclusive of the sintering plates that used to cover the green cell structure. Hence by this way
introducing the load initially before sintering, we were successful in reducing the warpage for
cell, by optimizing the load required for it. The Figure II.38 shows the button cell with reduced
warpage after loading the green body during sintering. The load required for reduction of
warpage is different for different architecture.
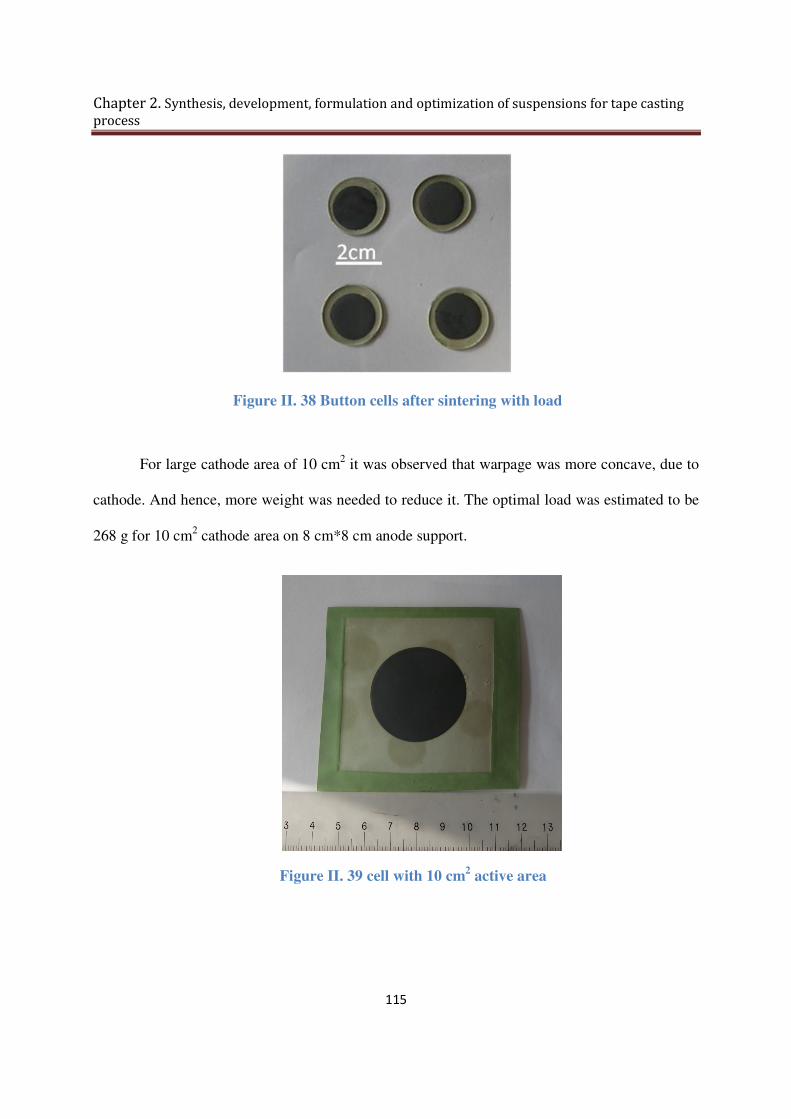
Chapter 2. Synthesis, development, formulation and optimization of suspensions for tape casting
process
115
Figure II. 38 Button cells after sintering with load
For large cathode area of 10 cm2 it was observed that warpage was more concave, due to
cathode. And hence, more weight was needed to reduce it. The optimal load was estimated to be
268 g for 10 cm2 cathode area on 8 cm*8 cm anode support.
Figure II. 39 cell with 10 cm2 active area

Chapter 2. Synthesis, development, formulation and optimization of suspensions for tape casting
process
116
To prepare a square or rectangle architecture for stacking, with cathode active area above
25 cm2, there should be 1 cm area on all sides for sealing. Reducing warpage in this type of cells
was a huge task as to optimize the load needed. It was optimized to 310 g rectangular load
equally distributed all along the sintering plates. The Figure II.40 shows the schema of cell
prepared for stacking with cathode active area of around 36 cm2. By this way flawless cell with
large active area of 36 cm2 fabricated by only tape casting and single step sintering at low
temperature was obtained.
Figure II. 40 Schema of cells preparation for stacking with 36 cm2 cathode active area
The Figure II.41 shows the cross section of cell after optimizing, all parameters including
electrolyte slurry solid percentage, pore former, and sintering temperature.

Chapter 2. Synthesis, development, formulation and optimization of suspensions for tape casting
process
117
Figure II. 41 Optimized cross section of cell
III.5. Conclusion
So, in this part the solid content of electrolyte slurry was optimized. New approach of
fabricating a full cell only by tape casting was presented considering the optimization of
sintering temperature, selection of different pore former and its percentage to be used and
reduction of warpage. By this new process, it is possible to obtain different architecture of cell
right from small area that can be extrapolated to large active area as explained in detail.

Chapter 2. Synthesis, development, formulation and optimization of suspensions for tape casting
process
118
Part. IV. Electrochemical results obtained by 10 cm2 active area cells
fabricated by new single step sintering process
This part will detail the electrochemical results obtained from the cells fabricated only by
tape casting process. All the electrochemical experimental results presented here are obtained at
Fiaxell Sarl in EPFL scientific park in Switzerland, Lausanne in Raphael Ihringer lab. The Figure
II.42 shows the Fiaxell set up used for the electrochemical measurements. This is an open flange
setup where all experiments were done without sealing for cells. This set up was inbuilt on
ceramic insulation plates to avoid loss of temperature, which is shown in the Figure II.42 as (p).
This has 4 spring load steel tubes, through which spring load rod is placed which is shown as (c)
steel tube is mentioned as (m) in the figure. Through these tubes it is possible to put enough load
on the system, by using spring from outside the device. The fuel feeding tube is represented by
(o) through which fuel gas is fed to anode part of cell during experiment. This tube is made of
inconel. The flat bottom flange is made of inconel which is represented as (i). This is the place
where the cell will be placed during experiment. In the bottom, flange alumina felt will be placed
to reduce the gas leakage. This is represented as (f) on top of the bottom plate. There are two
other bores in ceramic insulation where there is provision for current and voltage collection.
Provision for voltage measurement is denoted by (i), cathode current collection is represented by
(j). For an anode current collection nickel anode meshes are used which is represented as (k). For
cathode current collection, gold meshes are used which is shown as (g). To measure the
temperature of cell during experiment, a thromocouple type K is used. There is special provision
for thermocouple port which is shown in the figure as (b). Once the cell is placed on alumina felt
with nickel meshes at bottom of cell and gold meshes at top of the cathode another alumina felt
is used to cover the cell to reduce leakage of gases. Now this part is covered by inconel upper

Chapter 2. Synthesis, development, formulation and optimization of suspensions for tape casting
process
119
flange which is represented as (e). This upper flange is connected with air feeding tube through
which an oxidant gases are fed to the cell during experiment. This is represented as (a).
Figure II. 42 Fiaxell Set up
Once the cell is placed on the device, it is screwed well to tighten so that there is no
movement of cell during experiment. Care should be taken in order not to break the cell while
mounting. Then flange set up are placed on the furnace where temperature rises up and readings
will be measured. All the cells were measured in the same device, using hydrogen as fuel gas
with 3% of H2O and air as the oxidant gas. After placing the device on the furnace, automatic
fixed controller program will rise the temperature of the furnace. The furnace is manually
programmed for rising the temperature.

Chapter 2. Synthesis, development, formulation and optimization of suspensions for tape casting
process
120
The rise up of temperature is always accompanied by feeding air gas at both sides of cell.
This is done to avoid any damage of cell during rise up. Once the furnace has reached the
operating temperature, the air gas on the anode side of furnace is slowly replaced by mixture of
N2 and H2 in the ratio 90:10. This gas mixture was used in the initial step of reducing the cell.
This mixture will avoid the sudden reduction of anode and avoids breakage of cell. This gas was
used for first 10 min of reduction step and then it is slowly replaced by supplying pure hydrogen.
Care should be taken during this step of reduction when this mixture is fully replaced by pure
humidified hydrogen gas. Reduction of an anode was done for 2 hours at 750°C before
measurements. Now the voltmeter, ammeter, and electronic load are connected to the system for
taking electrochemical measurements. This rise up of temperature and reduction of the cell takes
approximately 7 hours. All the gas flow was kept at constant rate all the experiments. The results
obtained on different cells are detailed taking in consideration the different configuration of the
cells with active area of 10 cm2.
IV.1. Cell with starch pore former
The first cell used starch as a pore former, the electrochemical results obtained are shown
in Figure II.43. The Figure II.43 shows the graph of V vs I and P vs I at different temperature.
This cell was characterized at 610°C and 640°C and exhibited OCV of 0.924 V and 0.879 V
respectively. The maximum power density obtained 610°C and 640°C were 120 mW.cm-2 and
123 mW.cm-2 respectively. It was observed that in first test of cell, when using starch as a
poreformer there was not much difference in power density at temperature higher than 610°C,
even though there is little difference in the polarization at such a temperature. The reason for

Chapter 2. Synthesis, development, formulation and optimization of suspensions for tape casting
process
121
lower power density was known only after studying the cross section of cell by SEM. Cathode
thickness was 10 µm and Electrolyte were 20 µm.
Figure II. 43 V vs I and P vs I curves of cell with starch pore former [44]
The cell was observed for morphology by SEM. The Figure II.44 shows the cross section
of the cell. It shows the cathode on the left side, followed by the electrolyte layer in white, then
by AFL and finally by the anode support, which is seen with large pores obtained from burning
of starch pore former. These were irregular in shape and inhomogenous along the anode support,
leading to lower TPB. These inhomogeneous and large pores also create large polarization and
poor power density. Thus it was concluded to stop using starch pore former and proceed only by
using carbon as pore former. From now on, all the cells will be using only carbon pore former.

Chapter 2. Synthesis, development, formulation and optimization of suspensions for tape casting
process
122
Figure II. 44 Cross section of cell
IV.2. Cell with carbon pore former
Cells were prepared by using carbon as pore former. As explained earlier the cells were
little warped and in the optimization process, one trial was done by reducing the thickness of the
cathode layer. The Figure II.45 shows the electrochemical results obtained from the cell with
cathode layer of approximately 10 µm. The Figure II.45 shows the I vs V and I vs P at
temperature starting from 500°C till 650°C at interval of every 50°C. The OCV values obtained
are 0.920 V, 0.862 V, 0.785 V, 0.667 V at 500°C, 550°C, 600°C and 650°C respectively. The
maximum power density of 46 mW.cm-2 was obtained at 600°C. When using carbon as pore
former, there was clear difference in OCV and power density above 550°C. The cell was
observed by SEM for morphology and cross section. Several interesting results were obtained.

Chapter 2. Synthesis, development, formulation and optimization of suspensions for tape casting
process
123
Figure II. 45 Electrochemical results of cell with carbon poreformer
The Figure II.46 a) shows the cathode surface area. It clearly shows the presence of large
bubbles on the surface. The FigureII.46 b) shows the cross section of cell whose cathode
thickness was found to be 10 µm. approximately. The reason for lower power density was found
to be the bubbles and perceived as during the electrochemical reaction, water from anode side
passed through the electrolyte and water was logged on the bubbles surface, this leads to higher
polarization at operating temperature. Due to higher polarization by bubbles, there was also a
degradation of the cathode surface at temperature above 650°C. They were the reason for lower
power density while obtaining good OCV values. From this cell it was concluded that the
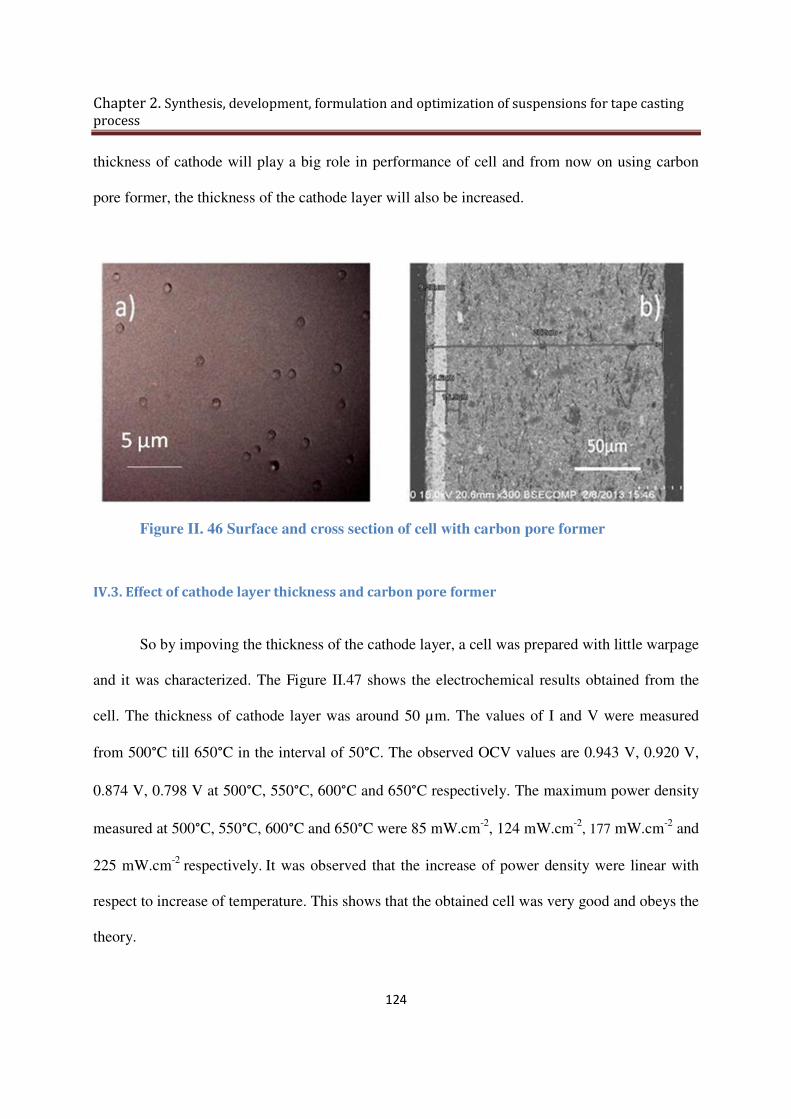
Chapter 2. Synthesis, development, formulation and optimization of suspensions for tape casting
process
124
thickness of cathode will play a big role in performance of cell and from now on using carbon
pore former, the thickness of the cathode layer will also be increased.
Figure II. 46 Surface and cross section of cell with carbon pore former
IV.3. Effect of cathode layer thickness and carbon pore former
So by impoving the thickness of the cathode layer, a cell was prepared with little warpage
and it was characterized. The Figure II.47 shows the electrochemical results obtained from the
cell. The thickness of cathode layer was around 50 µm. The values of I and V were measured
from 500°C till 650°C in the interval of 50°C. The observed OCV values are 0.943 V, 0.920 V,
0.874 V, 0.798 V at 500°C, 550°C, 600°C and 650°C respectively. The maximum power density
measured at 500°C, 550°C, 600°C and 650°C were 85 mW.cm-2, 124 mW.cm-2, 177 mW.cm-2 and
225 mW.cm-2 respectively. It was observed that the increase of power density were linear with
respect to increase of temperature. This shows that the obtained cell was very good and obeys the
theory.
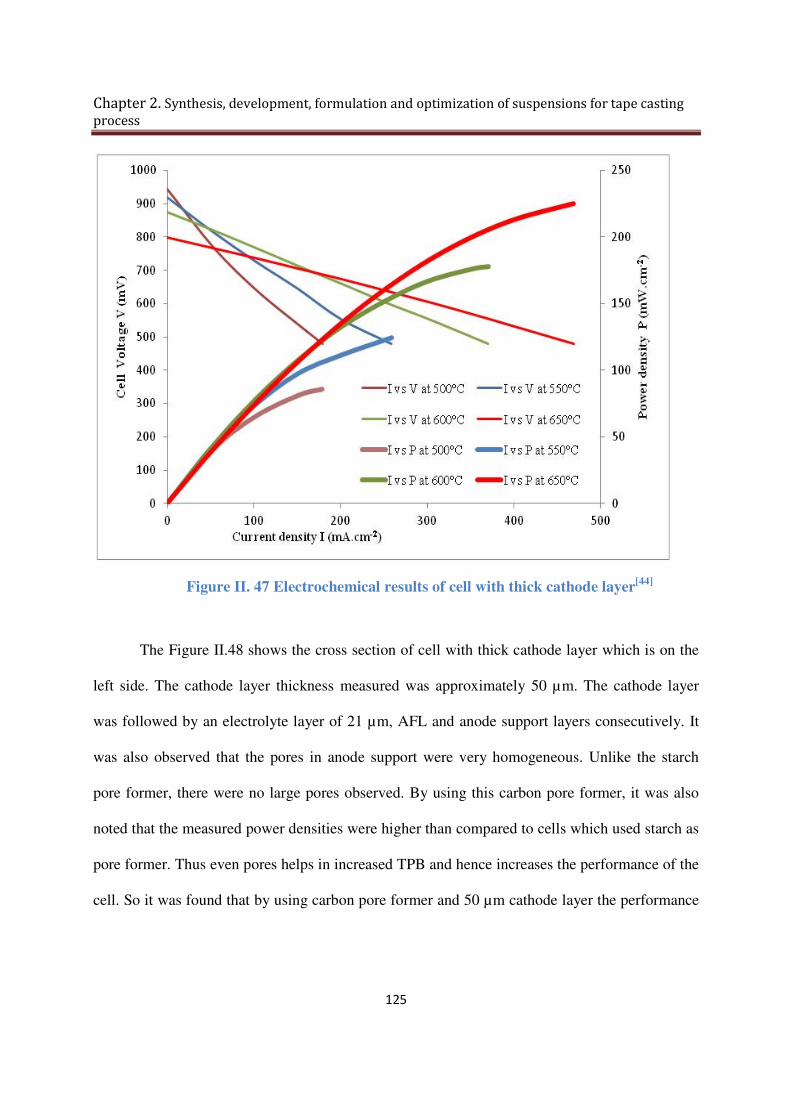
Chapter 2. Synthesis, development, formulation and optimization of suspensions for tape casting
process
125
Figure II. 47 Electrochemical results of cell with thick cathode layer[44]
The Figure II.48 shows the cross section of cell with thick cathode layer which is on the
left side. The cathode layer thickness measured was approximately 50 µm. The cathode layer
was followed by an electrolyte layer of 21 µm, AFL and anode support layers consecutively. It
was also observed that the pores in anode support were very homogeneous. Unlike the starch
pore former, there were no large pores observed. By using this carbon pore former, it was also
noted that the measured power densities were higher than compared to cells which used starch as
pore former. Thus even pores helps in increased TPB and hence increases the performance of the
cell. So it was found that by using carbon pore former and 50 µm cathode layer the performance

Chapter 2. Synthesis, development, formulation and optimization of suspensions for tape casting
process
126
was improved drastically twice. This was considered as one of the best improvement on this
patented process. Next studies were carried on by changing the thickness of electrolyte used.
Figure II. 48 cross section of cell with thick cathode layer
IV.4. Effect of electrolyte thickness in the cell
So from the results obtained so far, it can be concluded that by using carbon pore former
a cathode layer of 50 µm and a 21 µm electrolyte, the power density was increased by twice
when using carbon pore former. Further studies were done by changing thickness of the
electrolyte layer by keeping all the other parameters constant. The thickness of the electrolyte
was doubled approximately. The Figure II.49 shows the electrochemical results obtained from
the cell. The obtained OCV values were 0.879 V, 0.825 V, 0.732 V, 0.632 V at 500°C, 550°C,
600°C and 650°C respectively. The measured maximum power densities at 500°C, 550°C, 600°C
and 650°C were 149 mW.cm-2, 190 mW.cm-2, 175 mW.cm-2 and 110 mW.cm-2 respectively.
Several interesting results were obtained. It was noted that by increasing the thickness of an
electrolyte layer, the OCV obtained was lower starting from 500°C. The thickness of an

Chapter 2. Synthesis, development, formulation and optimization of suspensions for tape casting
process
127
electrolyte layer plays crucial role in performance of cell. By increasing the thickness of the
electrolyte layer, the path for transfer of oxygen ion increases and much of the energy is lost in
the thickness. Ohmic losses were also high with thick electrolyte. This leads to low OCV and in
turn low power density. It was also discovered that the maximum power density was obtained at
550°C and at higher temperature than 550°C, the power density seems to be reduced.
Figure II. 49 Electrochemical results of thick electrolyte cell [44]
The Figure II.50 shows the cross section of cell. It was measured that the thickness of
cathode layer was 37 µm approximately. The cathode layer is on the left side followed by
electrolyte, AFL and anode support layers. By increasing the thickness of electrolyte layer, the
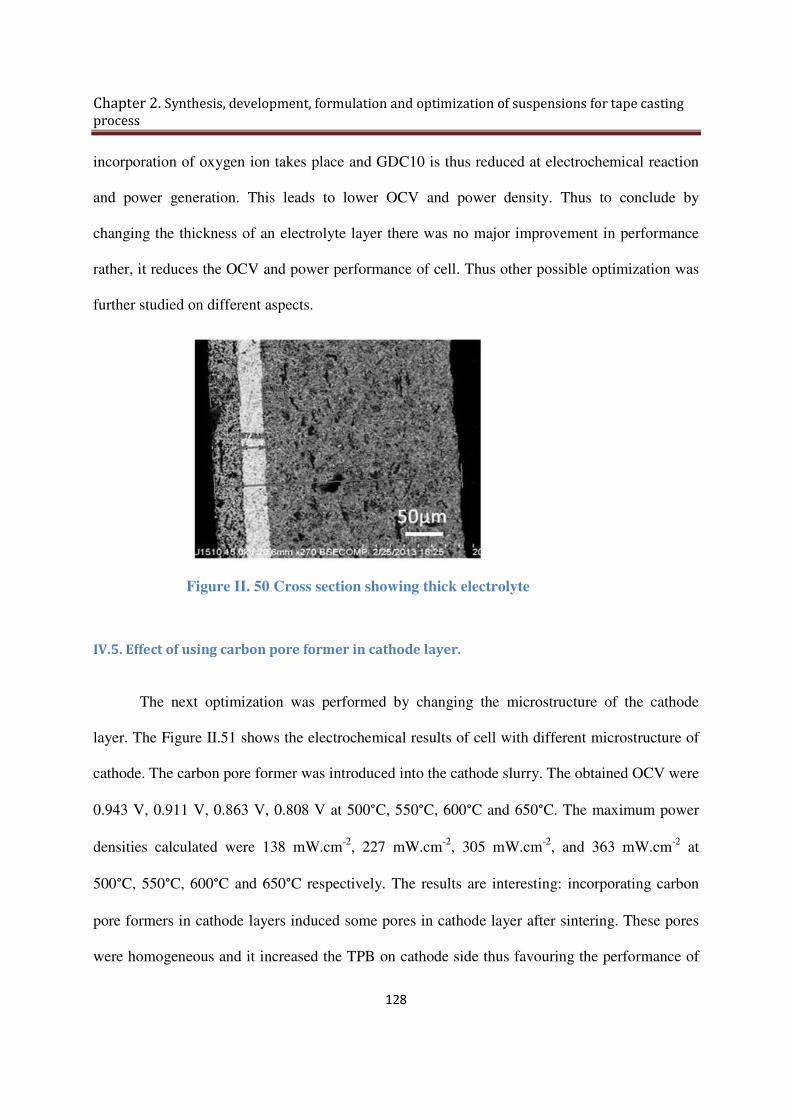
Chapter 2. Synthesis, development, formulation and optimization of suspensions for tape casting
process
128
incorporation of oxygen ion takes place and GDC10 is thus reduced at electrochemical reaction
and power generation. This leads to lower OCV and power density. Thus to conclude by
changing the thickness of an electrolyte layer there was no major improvement in performance
rather, it reduces the OCV and power performance of cell. Thus other possible optimization was
further studied on different aspects.
Figure II. 50 Cross section showing thick electrolyte
IV.5. Effect of using carbon pore former in cathode layer.
The next optimization was performed by changing the microstructure of the cathode
layer. The Figure II.51 shows the electrochemical results of cell with different microstructure of
cathode. The carbon pore former was introduced into the cathode slurry. The obtained OCV were
0.943 V, 0.911 V, 0.863 V, 0.808 V at 500°C, 550°C, 600°C and 650°C. The maximum power
densities calculated were 138 mW.cm-2, 227 mW.cm-2, 305 mW.cm-2, and 363 mW.cm-2 at
500°C, 550°C, 600°C and 650°C respectively. The results are interesting: incorporating carbon
pore formers in cathode layers induced some pores in cathode layer after sintering. These pores
were homogeneous and it increased the TPB on cathode side thus favouring the performance of

Chapter 2. Synthesis, development, formulation and optimization of suspensions for tape casting
process
129
cell. The power densities increased gradually starting from lower temperature. The power density
of 363mW.cm-2 was seen as another important improvement in the optimization.
Figure II. 51 Electrochemical result of cell with carbon in cathode layer [44]
The Figure II.52 shows the cross section of cell with carbon incorporated cathode layer.
Thus the cathode is represented as C and the electrolyte is represented as E and the anode is
represented as A. From Figure II.52 it can be clearly seen that there is an even distribution of
pores in the cathode layer which gradually increased the power density by 140 mW.cm-2 at
650°C.

Chapter 2. Synthesis, development, formulation and optimization of suspensions for tape casting
process
130
Figure II. 52 Cross section of cell showing pores in cathode layer.
IV.6. Final optimization performed.
So by using the knowledge obtained, further optimization was considered by keeping
pore former in cathode, maintaining electrolyte thickness of around 20 µm. The next
optimization was considered by reducing to optimal thickness of cathode layer while avoiding
bubbles that may degrade the cell quickly, but by providing good performance of the cell. The
thickness of cathode and electrolyte layer was reduced by almost half. The thickness of the
whole cell was around 325 µm, the cathode layer was approximately 19 µm the electrolye was
10 µm and the AFL and anode support layer measuring the remaining thickness of cell. The
Figure II.53 a) shows the cross section of full cell. II.53 b) shows magnified cathode, electrolyte
and anode functional layer.

Chapter 2. Synthesis, development, formulation and optimization of suspensions for tape casting
process
131
Figure II. 53 Cross section of cell
The Figure II.54 shows electrochemical results obtained from the cell. The measurements
were done at 500°C, 600°C and 648°C. OCV values obtained are given as 1.002 V, 0.920 V,
0.863 V. respectively. The maximum power densities calculated were 124 mW.cm-2, 364
mW.cm-2 and 466 mW.cm-2 at 500°C, 600°C and 648°C respectively. Thus by reducing the
thickness of cathode layer by half and an electrolyte layer by half power density was increased
by 110 mW.cm-2 at 648 °C. Practical value above 1 V was obtained at 500°C.

Chapter 2. Synthesis, development, formulation and optimization of suspensions for tape casting
process
132
Figure II. 54 Final optimized electrochemical results [35]
These values are compared to the theoretical values, and to similar cells from literature.
The linear voltage drop of a cell with respect to increasing current density proves that the cell
was not broken under load conditions and exhibits good cell behavior. The results showed that,
achieved OCV values at 500°C and 600°C is 1.002 V and 0.920 V (with 10 µm electrolyte
sintered at 1215°C) and it is 42 mV and 10 mV higher at respective temperatures with 4 µm
electrolyte sintered at 1300°C reported by C.Ding et al [45]. Conventional sintering temperature
for nano particles of GDC is 1300°C and micro sized particles are 1500°C. However cell voltage
reported in this study at 500°C and 600°C, (using GDC10-HP particles sintered at 1215°C ) is 38
mV and 56 mV lower at respective temperatures when compared to C.Ding et al [46] using nano
particles of GDC with high surface area and high sintering temperature of 1300°C. However, it is
possible to achieve a large number of TPB, using nano particles with higher surface areas, which
Chapter 2. Synthesis, development, formulation and optimization of suspensions for tape casting
process
133
in turn will give higher OCV. The OCV values from this study were also compared and found to
be higher than Q.L.Liu et al [47] using higher sintering temperature of 1500°C and two steps of
sintering to achieve a single cell. This explains that GDC layer obtained by this process is dense,
crack free with no open pores at low sintering temperature of 1215°C compared to conventional
sintering temperature of 1500°C which is used for micro metric particles.
The maximum power density obtained at 500°C, 600°C, and 648°C are 124 mW.cm-2,
364 mW.cm-2, and 466 mW.cm-2 respectively. The reported power outputs were lower compared
to [45-47]. The difference in power density can be linked to first the fact of using higher sintering
temperature of cathode. In this one step sintering process a temperature of 1215°C is used which
is 315°C higher compared to [45-47]. Higher sintering temperature of cathode plays a major role in
microstructure and high densification of cathode. These results in low porosity and in turn very
few numbers triple phase boundaries for reaction to occur in cathode. The second reason can
probably be the use of low surface area of cathode and electrolyte powders in this process. Even
with such low surface area powders, it was still possible to achieve higher OCV values when
compared to J.Ding et al [48]. The maximum power density obtained were also higher at lower
temperature of 500°C and 550°C, though they have used BSCF as cathode in [48] which is
expected to provide higher performance than LSCF used in this study. The other reason for lower
power density can also be due to high internal resistance due to co-sintering of many layers as
explained by H.Ohrui et al [49].
So the preliminary results obtained prove that our process of fabrication of unit planar
cell by tape casting and single step sintering at low temperature was successful and can be

Chapter 2. Synthesis, development, formulation and optimization of suspensions for tape casting
process
134
extrapolated to large area cells of any architecture and dimension. The large area cells obtained
by this process are about to be stacked and studied for long term performance.
IV.7. Conclusion.
Thus in this chapter the process of obtaining large area cells by using only tape casting
and single step sintering was explained. The major factors included the selection of material,
slurry preparation process, casting the multilayers, drying time of green body, optimization of
sintering temperature and pore former, playing with thickness of different layers of cell. Thus to
conclude the cell was fabricated by using only tape casting process, by sintering at low
temperature without using any sintering aids, lamination process and multistep sintering process
and costly techniques. The optimized cell possessed 20 µm thick cathode layer with carbon pore
formers incorporated in the cathode slurry, the thickness of electrolyte layer was 10 µm and the
thickness of whole cell was 325 µm. OCV obtained at 500°C was 1.002 V and maximum power
density obtained at 648°C were 466 mW.cm-2. The main factor to be noted is that all the results
were obtained from cells of 10 cm2 active area, and all measurements were done in open flange
set up without using any costly sealing materials. There is further larger room for optimization
with regards to many parameters in cell. Considering the goal of 400 mW.cm-2 was reached and
with little time left for preparation of cells above 25 cm2 and stacking, preparation of large area
rectangular planar cell was focussed. The other goal of long term ageing was also performed and
results are presented in the next chapter.
Chapter 2. Synthesis, development, formulation and optimization of suspensions for tape casting
process
135
References
1. C. Xia, M. Liu, Solid State Ionics 144, 249, 2001.
2. C. Xia, M. Liu, J. Am. Ceram. Soc. 84, 1903, 2001.
3. S. Dikmen, P. Shuk, M. Greenblatt , H. Gocmez solid state sciences 4, 585, 2002.
4. K. Higashi, K. Sonoda, H. Ono, S. Sameshima, Y. Hirata, J. Mater.Res. 14, 957, 1999.
5. J. Van herle, T. Horita, T. Kawada, N. Sakai, H. Yokokawa, M.Dokiya, J. Am. Ceram.
Soc. 80,933, 1997.
6. Rodolfo O.Fuentes Richard Baker, J.Hydrogen Energy 33, 3480, 2008.
7. Rodolfo O.Fuentes Richard Bake, J.Power Sources 186, 268, 2009.
8. G.Ch. Kostogloudis , Ch. Ftikos Solid State Ionics 126,143, 1999.
9. V.Sivasankaran Master Thesis Engineering of intermetallic based negative electrodes
2010.
10. A. Sanson, P. Pinasco, E. Roncari J of European Ceramic Society 28, 1221, 2008.
11. Yoshio Matsuzaki, Yoshitaka babu, Teruhiro Skurai Solid state Ionics 172, 81, 2004.
12. C.J.Fu, Q.L.Liu, S.H.Chan, X.M.Ge, G.Pasciak Int. J.Hydrogen Energy 35, 11200, 2010.
13. T.L.Wen, D.Wamg , H.Y.Tu, M.Chen, Z.Lu, Z.Zhang,H.Nie,W.Huang Solid state ionics
152-153, 399-404, 2002.
14. Tahereh Talebi, Mohsen Haji, Babak Riasi, Amir Maghsoudipour Int. J. Hydrogen
Energy 35, 9455, 2010.
15. Jung-Hoon Song, Sun-Il Park, Jong-Ho Lee, Ho-Sung Kim Journal of materials
processing technology 198, 414, 2008.
16. Murray EP, Barnett SA. Solid State Ionics 143, 265, 2001.
17. Leng YJ, Chan SH, Khor KA, Jiang SP. J Solid State Electrochem 10:339, 47, 2006.

Chapter 2. Synthesis, development, formulation and optimization of suspensions for tape casting
process
136
18. Dusastre V, Kilner JA Solid State Ionics 126, 163, 1999.
19. Murray EP, Sever MJ, Barnett SA. Solid State Ionics; 148, 27, 2002.
20. Liu QL, Khor KA, Chan SH. Proceeding of the third international conference on
Materials Processing for Properties and Performance (MP3). East Asia: Institute of
Materials, 657, 2004.
21. Qiang F, Sun KN, Zhang NQ, Zhu XD, Le SR, Zhou DR. J Power Sources 168, 338,
2007.
22. W.Z. Zhu, S.C. Deevi, Mater. Sci. Eng. A 362, 228, 2003.
23. Zhenrong Wang, Jiqin Qian, Jiadi Cao, Shaorong Wang Tinglian Wen, J. Alloys and
Compounds 437, 264, 2007.
24. Hwan Moona, Sun Dong Kima, Sang Hoon Hyuna, Ho Sung Kimb Int.J. Hydrogen
Energy 33, 1758, 2008.
25. Young Min Park, Hoo Jung Lee, Hong Yeol Bae, Jin Su Ahn, Haekyoung Kim Kimb
Int.J. Hydrogen Energy, 37, 494, 2012.
26. Kim, S.H. Hyun, J. Moon, J.-H. Kim, R.H. Song, J. Power Sources 139, 67, 2005.
27. T.L. Reitz, H.M. Xiao, J. Power Sources 161, 437, 2006.
28. R.Q. Yan, D. Ding, B. Lin, M.F. Liu, G.Y.Meng, X.Q. Liu, J. Power Sources 164
567, 2007.
29. R.N. Basu, G. Blass, H.P. Buchkremer, D. Stover, F. Tietz, E. Wessel, I.C. Vinke, J.
Eur. Ceram. Soc. 25, 463, 2005.
30. Hae-Gu Park, Hwan Moon Sung-Chul Park, Jong-Jin Lee, Daeil Yoon, Sang-Hoon Hyun,
Do-Heyoung Kim. J.power sources. 195, 2463, 2010.

Chapter 2. Synthesis, development, formulation and optimization of suspensions for tape casting
process
137
31. G.M Christie, J.P.P.Huijsmans, U.Stimming, S.C.Singhal, H.Tagava , W.Lenhert(Eds),
Proc. 5th international symp Solid Oxide Fuel Cells , The Electrochemical Society,
Pennington NJ,.718,1997.
32. G.M Christie, J.P.Ouweltjes, R.C.Huiberts, E.J.Siewers, F.P.FVan Berkel,
J.P.P.Huijsmans, 3rd international fuel cell conf.Nagoya, Japan, 361, 1999.
33. F.Tietz, H-P.Buch Kremer, D.Stover Solid state ionics 152-153, 373, 2002.
34. V.Sivasankaran, L.Combemale, G.Caboche. FR12/59643 French Patent, 2012.
35. V.Sivasankaran, L.Combemale, M.C.Pera, G.Caboche. Doi: 10.1002/fuce.201300159.
36. V.Sivasankaran, L.Combemale, M.C.Pera, G.Caboche ECS transactions, volume, 53, 30,
159-162, Doi:10.1149/05330.0159 ecst.
37. V.Sivasankaran, L.Combemale, G.Caboche PCT/FR2013/0542408, World patent, 2013.
38. Hwan Moon, Sun Dong Kim, Eon Woo Park, Sang Hoon Hyun, Ho Sung Kimb Int. J.
Hydrogen Energy 33, 2826, 2008.
39. Zhenrong Wang, Jiqin Qian, Jiadi Cao, Shaorong Wang and Tinglian Wen Fuel cell
bulletin 2007, 12, 2007.
40. Pingying Zeng, Ran Rana, Zhihao Chen, Hongxia Gua, Zongping Shao, J.C. Diniz da
Costa, Shaomin Liu Journal of Membrane Science 302,171, 2007.
41. J.Cheng, S.Zha, X.Fang, X.Liu, G.Meng, Material research bulletin 37, 2437, 2002.
42. Jaemyung Changa, Olivier Guillonb, Jurgen Rodelb, Suk-Joong L. Kanga, J.Power
Sources 185,759, 2008.
43. Sang-Ho Lee, Gary L. Messing, Masanobu Awano, J. Am. Ceram. Soc., 91, 2 421,2008.
44. V.Sivasankaran, L.Combemale, M.C.Pera, G.Caboche Manuscript to be submitted to
advanced energy.

Chapter 2. Synthesis, development, formulation and optimization of suspensions for tape casting
process
138
45. C. Ding, H. Lin, K. Sato, T. Hashida, J. Membr. Sci, 350, 1, 2010.
46. C. Ding, H. Lin, K. Sato, T. Hashida, Scr. Mater. 60, 254, 2009.
47. Q. L. Liu, S. H. Chan, C. J. Fu, G. Pasciak, Electrochem.Com. 11, 871, 2009.
48. J. Ding, J. Liu, G. Yin, J. Membr. Sci., 371, 219. 2011.
49. H. Ohrui, T. Matsushima, T. Hirai, J. Power. Sources, 71, 185, 1998.

Chapter 2. Synthesis, development, formulation and optimization of suspensions for tape casting
process
139

Chapter 3 Long term ageing results, development of test bench and stack
140
NDA Protected with DLR

Chapter 3 Long term ageing results, development of test bench and stack
Chapter 3: Long term ageing results, development of test bench
and stack
Chapter 3: Long term ageing results, development of test bench and stack ......................................... 141
I. Introduction ................................................................................................................................. 141
II. Ageing results of cells .................................................................................................................. 141
III. Products needed for stacking ...................................................................................................... 150
III.1 Interconnectors .................................................................................................................... 150
III.2. Current collectors meshes in stack between cells ................................................................. 150
III.3.Sealants ................................................................................................................................ 151
III.4. Steel plates .......................................................................................................................... 152
III.5. Gas manifolds and gas flow directions .................................................................................. 152
IV. Balance of plant components involved in building of test bench ................................................. 153
IV.1. Furnace selection and requirements .................................................................................... 153
IV.2. Gas module .......................................................................................................................... 155
IV.3 Ceramic bricks ...................................................................................................................... 156
IV.4. Ceramic tubes ...................................................................................................................... 157
IV.5. Current connectors .............................................................................................................. 157
IV. 6. Thermocouples ................................................................................................................... 158
IV.7. Lab View software for data input and acquisition. ................................................................ 159
IV.8. Flow diagram of test bench .................................................................................................. 161
V.Conclusion .................................................................................................................................... 162

Chapter 3. Long term ageing results, development of test bench and stack
141
Chapter 3: Long term ageing results, development of test bench and
stack
I. Introduction
The last part of this thesis is dedicated to the path towards an IT-SOFC stack. Three
contributions are described: the ageing results on large cells, the stacking process of the newly
developed planar cells and the development of a stack test bench. The results of the ageing
perfomance of 10 cm2 cells performed in Fiaxell device, and their post mortem analysis are
reported. Then the step and products involved in stack building are briefly described. The stack
foot print was provided by the DLR, German Aerospace Center. Finally, a test bench dedicated
to the study of the stacks is presented. A test bench was already available in Belfort [1], at
FCLAB, a CNRS Research Federation on fuel cell systems, but it needed a complete updating to
comply with the test of the developed cell. The developments were made in collaboration with
DLR.
II. Ageing results of cells
In order to achieve an operational stack, a mile stone is the measurement of the ageing
performance of large cells. A Fiaxell open flange device, similar to the one described in Chapter
2, at EPFL, has been set up in ICB, Dijon. A single cell of 10 cm2 active area cells was tested for
long term ageing performance in Dijon. The cells are comprised of Ni/GDC//GDC//LSCF/GDC
with best known configuration. This set up includes a Kittec Furnace squadro11, a humidifier for

Chapter 3. Long term ageing results, development of test bench and stack
142
hydrogen, connecting wires, mass flow meters, a voltmeter, an ammeter, a power load and a
hydrogen detecting valve.
Once after all the gas pipes, voltmeter, ammeter, and power load are connected, the
furnace was started to increase the temperature. During start up, air was supplied in both sides
while increasing in temperature. During reduction, firstly a mixture of hydrogen and nitrogen
was supplied to the cell, then it was slowly replaced with hydrogen. The reduction of NiO to Ni
took place under pure hydrogen at 750°C for 2 hrs. The hydrogen and air flows were kept
constant during measurements. The humidified hydrogen passing through the tube of water was
supplied at flow rate of 100 ml.min-1 and air was supplied at 600 ml.min-1. The Figure III.1
shows the Current density Vs Cell voltage and Power density of the cell. The voltage
measurements were started at 500°C in intervals of 50°C till 650°C. The OCV obtained at
500°C, 550°C 600°C, and 650°C were, 0.917 V, 0.874 V, 0.772V, 0.644 V respectively. The
reasons for the lower values was perceived as all the current collectors and device were new,
there was some initial resistance due to the oxidation of the anode current collector mesh. Second
thickness of nickel meshes were different. Third flow rates of gas were different from ICB lab
and Fiaxell lab. Still the experiment was performed on the new set up in Dijon to study long term
ageing performance. In practical situation, the OCV obtained will be always lesser than the
theoretical value. The reason for lower OCV in the practical condition than the theoretical OCV
is due to leakage of electrons through the electrolyte. The OCV values decreases with increasing
temperature, it implies that the cell is working and in good condition. In OCV conditions, the
GDC is more reduced at higher temperature than at lower temperature, this result in higher

Chapter 3. Long term ageing results, development of test bench and stack
143
conductivity of electrons and in turn leads to higher leakage of electrons. The maximum power
density obtained at different temperatures are given in Table III.1
Temperature in °C Voltage in V Current (I) in A Power density in mW.cm-2
500 0.917 0.695 44
550 0.874 0.695 52
600 0.772 0.695 43
650 0.664 0.695 28
Table III. 1 Results obtained from cell
Figure III. 1 Cell Voltage and Power density Vs Current density [5]
The Figure III.1 shows the cell voltage and power density vs current density. During
electrochemical reaction at temperature of above 600°C, the application of current increases the
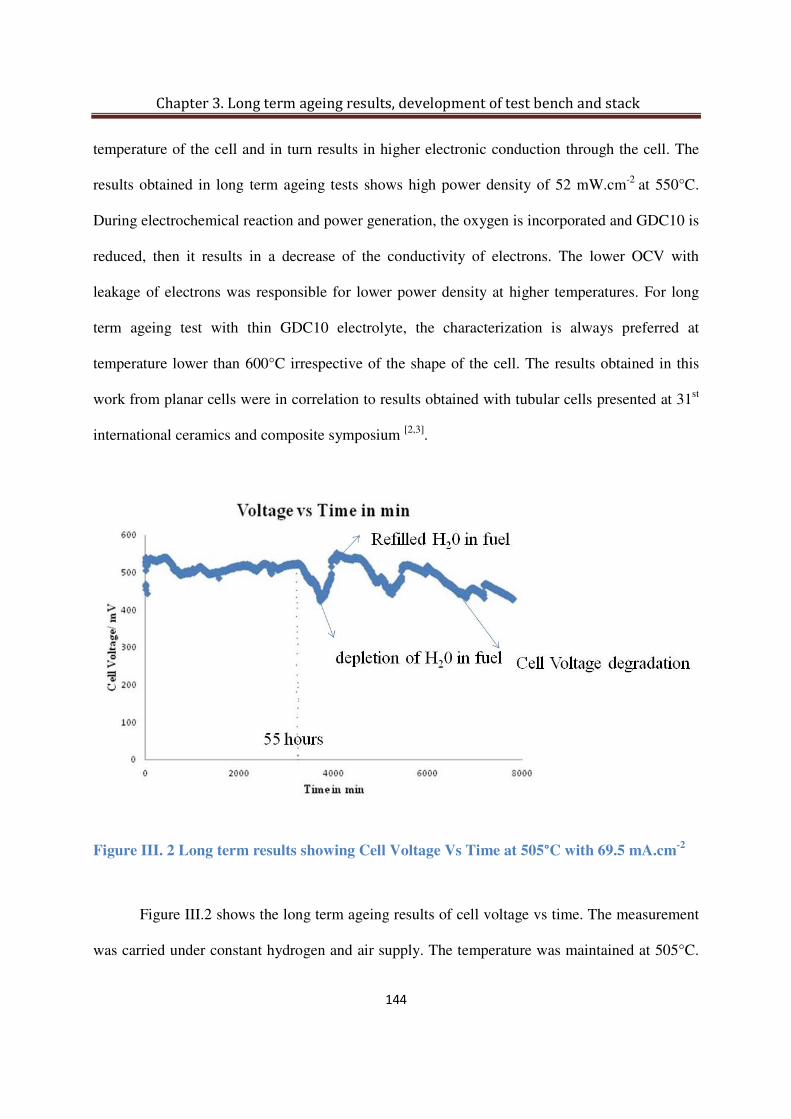
Chapter 3. Long term ageing results, development of test bench and stack
144
temperature of the cell and in turn results in higher electronic conduction through the cell. The
results obtained in long term ageing tests shows high power density of 52 mW.cm-2 at 550°C.
During electrochemical reaction and power generation, the oxygen is incorporated and GDC10 is
reduced, then it results in a decrease of the conductivity of electrons. The lower OCV with
leakage of electrons was responsible for lower power density at higher temperatures. For long
term ageing test with thin GDC10 electrolyte, the characterization is always preferred at
temperature lower than 600°C irrespective of the shape of the cell. The results obtained in this
work from planar cells were in correlation to results obtained with tubular cells presented at 31st
international ceramics and composite symposium [2,3].
Figure III. 2 Long term results showing Cell Voltage Vs Time at 505°C with 69.5 mA.cm-2
Figure III.2 shows the long term ageing results of cell voltage vs time. The measurement
was carried under constant hydrogen and air supply. The temperature was maintained at 505°C.
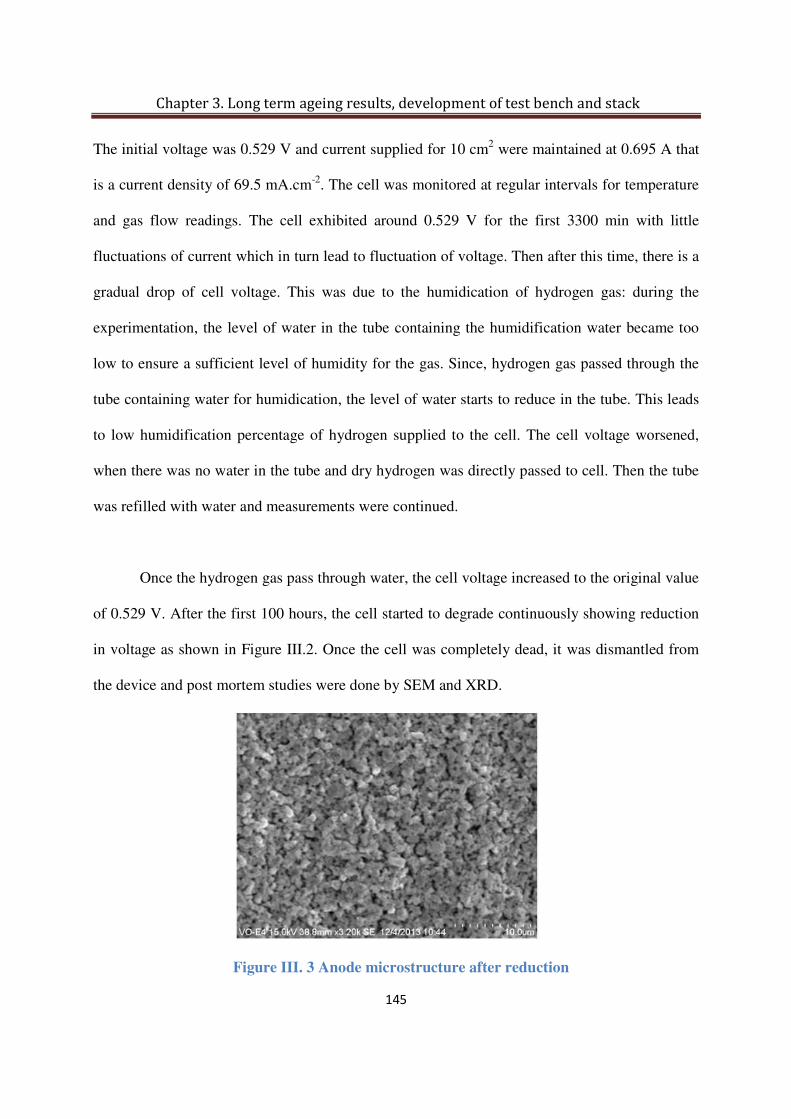
Chapter 3. Long term ageing results, development of test bench and stack
145
The initial voltage was 0.529 V and current supplied for 10 cm2 were maintained at 0.695 A that
is a current density of 69.5 mA.cm-2. The cell was monitored at regular intervals for temperature
and gas flow readings. The cell exhibited around 0.529 V for the first 3300 min with little
fluctuations of current which in turn lead to fluctuation of voltage. Then after this time, there is a
gradual drop of cell voltage. This was due to the humidication of hydrogen gas: during the
experimentation, the level of water in the tube containing the humidification water became too
low to ensure a sufficient level of humidity for the gas. Since, hydrogen gas passed through the
tube containing water for humidication, the level of water starts to reduce in the tube. This leads
to low humidification percentage of hydrogen supplied to the cell. The cell voltage worsened,
when there was no water in the tube and dry hydrogen was directly passed to cell. Then the tube
was refilled with water and measurements were continued.
Once the hydrogen gas pass through water, the cell voltage increased to the original value
of 0.529 V. After the first 100 hours, the cell started to degrade continuously showing reduction
in voltage as shown in Figure III.2. Once the cell was completely dead, it was dismantled from
the device and post mortem studies were done by SEM and XRD.
Figure III. 3 Anode microstructure after reduction
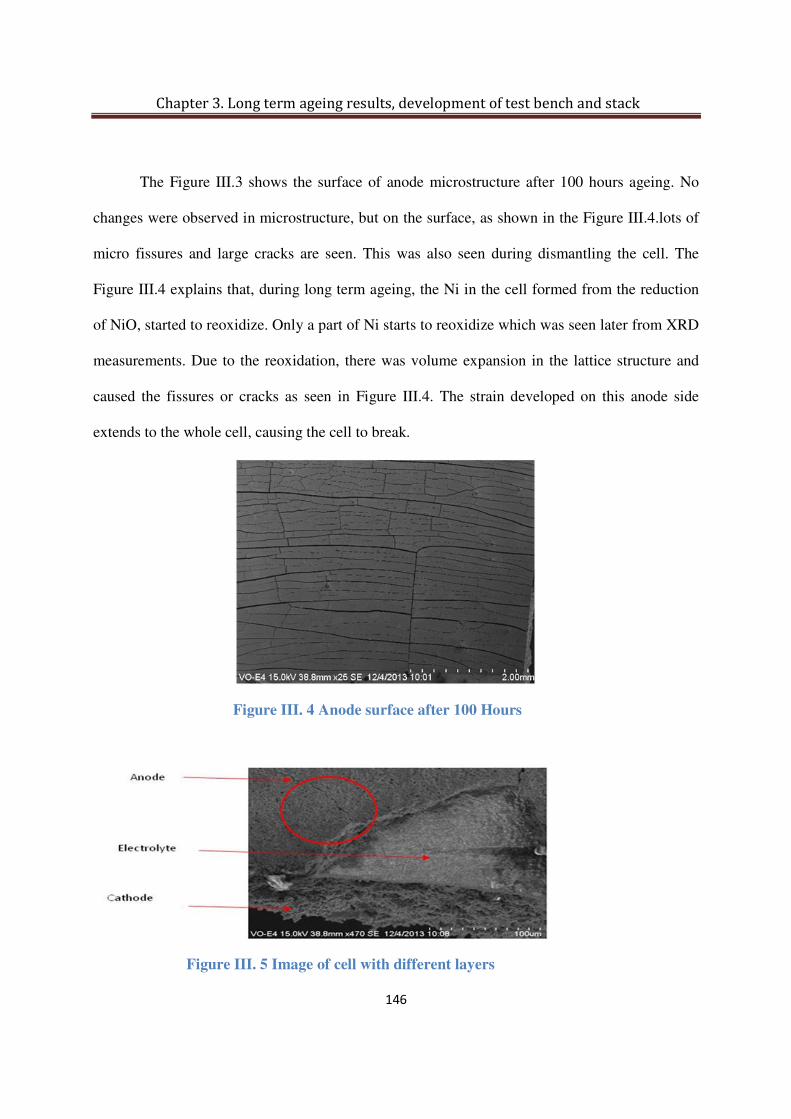
Chapter 3. Long term ageing results, development of test bench and stack
146
The Figure III.3 shows the surface of anode microstructure after 100 hours ageing. No
changes were observed in microstructure, but on the surface, as shown in the Figure III.4.lots of
micro fissures and large cracks are seen. This was also seen during dismantling the cell. The
Figure III.4 explains that, during long term ageing, the Ni in the cell formed from the reduction
of NiO, started to reoxidize. Only a part of Ni starts to reoxidize which was seen later from XRD
measurements. Due to the reoxidation, there was volume expansion in the lattice structure and
caused the fissures or cracks as seen in Figure III.4. The strain developed on this anode side
extends to the whole cell, causing the cell to break.
Figure III. 4 Anode surface after 100 Hours
Figure III. 5 Image of cell with different layers

Chapter 3. Long term ageing results, development of test bench and stack
147
The Figure III.5 shows evidently that the cracks developed only on anode side and were
due to reoxidation. There was no deformation seen in electrode or cathode layer in particular.
XRD studies were performed on anode and cathode sides, before long term ageing test
and after ageing for 100 hours. This also confirms the changes occured only on anode side
during long term ageing.
The Figure III.6 shows XRD pattern of anode before and after ageing. The graph
represents peak intensity versus 2 theta. The peaks in red color show the NiO/GDC before the
test. The peaks in black color show the Ni/GDC after 100 hours ageing. During the
electrochemical reaction NiO which was reduced to Ni. While ageing test was conducted some
of the particles of Ni were again oxidized to NiO. The structural change is clearly seen by
reduction in intensity of peaks of NiO, as well as strong peak of Ni was observed at 44, 52, 79,
and 94 on 2 theta scale.

Chapter 3. Long term ageing results, development of test bench and stack
148
Figure III. 6 XRD pattern before and after ageing
The figure III.6 clearly shows the presence of nickel along with NiO after ageing for 100
hours.
The Figure III.7 shows XRD pattern observed on the cathode side before and after
ageing. The peaks in red color represent the cathode before ageing and the peaks in black color
show the cathode after 100 hours of ageing. No change occurs on the cathode side, either with
regards to GDC10 or LSCF48. This observation confirms that this is the volume expansion on
the anode side which caused the fissures and extends to cathode resulting in degradation of the
cell.
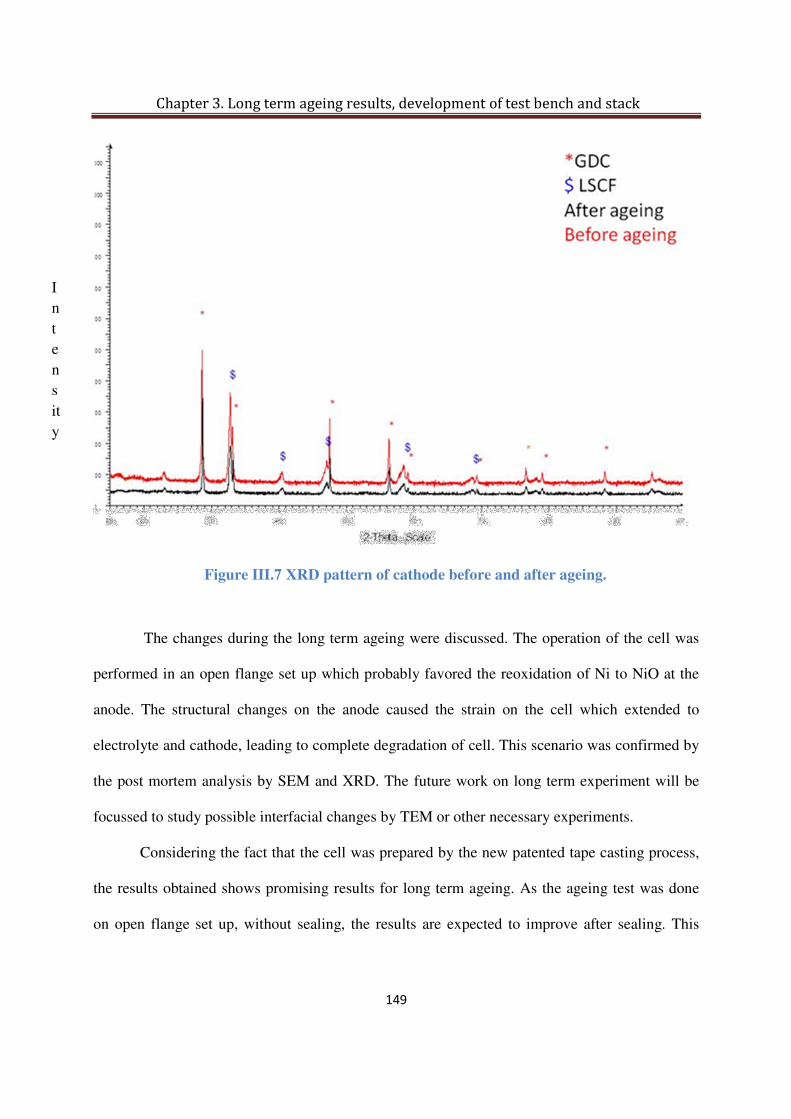
Chapter 3. Long term ageing results, development of test bench and stack
149
Figure III.7 XRD pattern of cathode before and after ageing.
The changes during the long term ageing were discussed. The operation of the cell was
performed in an open flange set up which probably favored the reoxidation of Ni to NiO at the
anode. The structural changes on the anode caused the strain on the cell which extended to
electrolyte and cathode, leading to complete degradation of cell. This scenario was confirmed by
the post mortem analysis by SEM and XRD. The future work on long term experiment will be
focussed to study possible interfacial changes by TEM or other necessary experiments.
Considering the fact that the cell was prepared by the new patented tape casting process,
the results obtained shows promising results for long term ageing. As the ageing test was done
on open flange set up, without sealing, the results are expected to improve after sealing. This
Intensity

Chapter 3. Long term ageing results, development of test bench and stack
150
process with little improvements on the formulation of cell could be extended to large scale mass
production process for commercialization.
III. Products needed for stacking
The products which are mandatory for stacking process are explained.
III.1 Interconnectors
The main usage of interconnectors in SOFC stack relates to two functions. The first role
is to provide gas separation in the stack; the second role is to provide electrical connection
between the cells. Like other components of stack, main requirements for interconnectors are
mentioned in chapter 1. Metal alloys of inconel type has TEC mismatch between other
components. For this work, interconnectors made of crofer were chosen [4]. The interconnectors
can be used for other tests after sand blasting.
III.2. Current collectors meshes in stack between cells
In a stack, the cell is sandwiched between current collector meshes. The stack in this
work will be built with an anode supported cells (ASC). In general for testing single button cells
of small area of around 2 cm2, platinum current collectors are used. For ASC stack of an active
area of 25 cm2, anode current collectors generally nickel meshes nickel meshes are used. The
cathode current collectors used in testing of single cells of small area are platinum and/or gold
meshes. These have the least possible contact resistance, so that it can provide enough catalytic
activity and as well help in current collection from cathode. However, for stacks of cells with
large active area and many cells, usage of platinum gradually increase the building price and
making it expensive. So in the stack of multiple cells, generally the cathode paste itself acts as

Chapter 3. Long term ageing results, development of test bench and stack
151
the current collector [4]. Since in this work the stack will comprise only one cell of above 25 cm2,
in order to avoid contact resistance between interconnectors, gold meshes are used and stack will
measured with seal. The thickness of gold meshes was 100 microns. The advantage of using gold
meshes in a short stack under development is that, after testing, it can be recovered and re-used
for another set of experiments. The Figure III.8 shows nickel meshes used in stack placed on
bipolar plates. These nickel meshes are generally replaced after every tests.
Figure III. 8 Nickel meshes placed on bipolar plates
III.3.Sealants
As explained in chapter 1 under sealant section, compressive seals will be used in this
work. The glass paste will be supplied by Fraunhofer IKTS named AF 45. This is also called as
Areva glass seal. They have TEC close to 13*10-6K-1 at working temperature. This paste does
not have any solid state reactions with the chosen crofer material at working temperature. These
glass seals are applied in the interconnectors before the startup of the test bench. They can be
scrapped off by sandblasting device after the experiment. Thus it allows reusing the
interconnectors for future experiments.
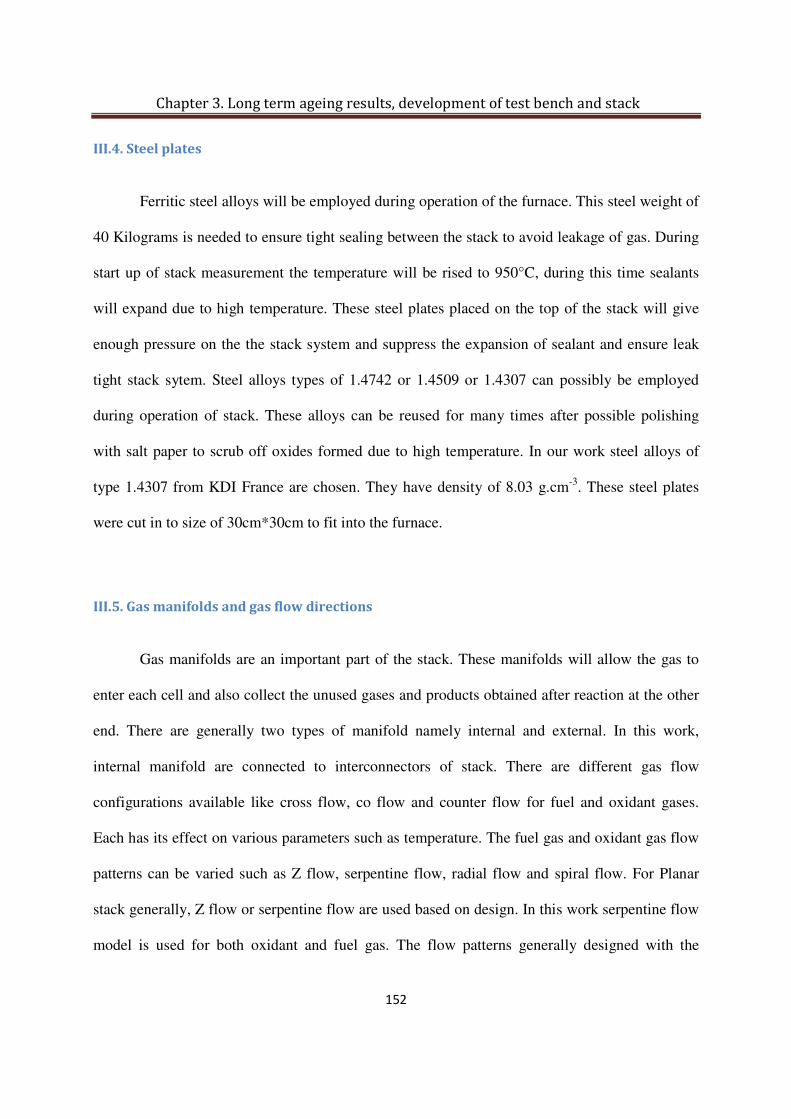
Chapter 3. Long term ageing results, development of test bench and stack
152
III.4. Steel plates
Ferritic steel alloys will be employed during operation of the furnace. This steel weight of
40 Kilograms is needed to ensure tight sealing between the stack to avoid leakage of gas. During
start up of stack measurement the temperature will be rised to 950°C, during this time sealants
will expand due to high temperature. These steel plates placed on the top of the stack will give
enough pressure on the the stack system and suppress the expansion of sealant and ensure leak
tight stack sytem. Steel alloys types of 1.4742 or 1.4509 or 1.4307 can possibly be employed
during operation of stack. These alloys can be reused for many times after possible polishing
with salt paper to scrub off oxides formed due to high temperature. In our work steel alloys of
type 1.4307 from KDI France are chosen. They have density of 8.03 g.cm-3. These steel plates
were cut in to size of 30cm*30cm to fit into the furnace.
III.5. Gas manifolds and gas flow directions
Gas manifolds are an important part of the stack. These manifolds will allow the gas to
enter each cell and also collect the unused gases and products obtained after reaction at the other
end. There are generally two types of manifold namely internal and external. In this work,
internal manifold are connected to interconnectors of stack. There are different gas flow
configurations available like cross flow, co flow and counter flow for fuel and oxidant gases.
Each has its effect on various parameters such as temperature. The fuel gas and oxidant gas flow
patterns can be varied such as Z flow, serpentine flow, radial flow and spiral flow. For Planar
stack generally, Z flow or serpentine flow are used based on design. In this work serpentine flow
model is used for both oxidant and fuel gas. The flow patterns generally designed with the

Chapter 3. Long term ageing results, development of test bench and stack
153
interconectors. The Figure III.9 shows the interconnector with serpentine flow pattern in the
cathode side bipolar plate.
Figure III. 9 Interconnector with serpentine flow pattern
IV. Balance of plant components involved in building of test bench
The development of the test bench was made with the help of, FC-LAB engineers,
Mr.Serge VIVES, Mr.Laurent GIRARDOT, and Mr.Fabien HAREL, Dr.Samir JEMEI was also
involved in fruitful discussion regarding electronic load and other necessary components. The
BOP was selected in accordance to suit intermediate working temperature range of 500-750°C.
Previously available data acquisition system from the lab was used to collect and record datas of
new test bench which will comprise of the stack.
IV.1. Furnace selection and requirements
The furnace needed to be replaced as the previous one was too small. In general the
furnace should have enough accessible area where temperature will be maintained constant

Chapter 3. Long term ageing results, development of test bench and stack
154
during operation. The heating coil should be placed all around the furnace to have equal
distribution of heat.
In order to fit a planar stack of 2 cells containing the active area of 50 cm2 the accessible
area should be minimum of 22 cm in breadth and 33 cm in width. The height of the working part
of furnace is very crucial, where the stack and the load need to keep seal in contact will
approximately occupy 80%. During operation of the stack, due to high temperatures, there will
be oxide formation on steel weights, which will cause some volume expansion. This occurs, due
to long exposure of the load to atmosphere. So a minimum height of 40 cm high will be
preferred.
The bottom part of the furnace becomes important as most of the connections like gas
feeding and exhaust pipes, current collectors are located here, so the bottom part must be easily
removable and accessed. To have removable bottom part, there should not be any heating coils in
it. Finally Kittec Furnace 150S as presented in the Figure III.10, which has all the requirements
was bought for the new test bench.

Chapter 3. Long term ageing results, development of test bench and stack
155
Figure III. 10 Furnace with heating coils in sides and removed bottom plate
IV.2. Gas module
Gas module is a unit on which the stack will be built. This enables easy, flexible stack
setup and it also serves as an interface. This gas module must be raised to a minimum of 5 cm
from the base plate of furnace to facilitate the start up and to avoid the uneven temperature
distribution if there is any. The gas module is equipped with 4 gas tubes of diameter 10mm and
length of 400 mm. This will also comprise of 4 thermocouple ports with standard compression
fitting for sheated thermocouple. There are also two holes at corners of opposite end of gas
module to accomodate ceramic tube. This will help in alignment of stack position. This gas
module was supplied by DLR as a part of collaboration. The provision of ceramic tubes was of
diameter 7.2 mm.
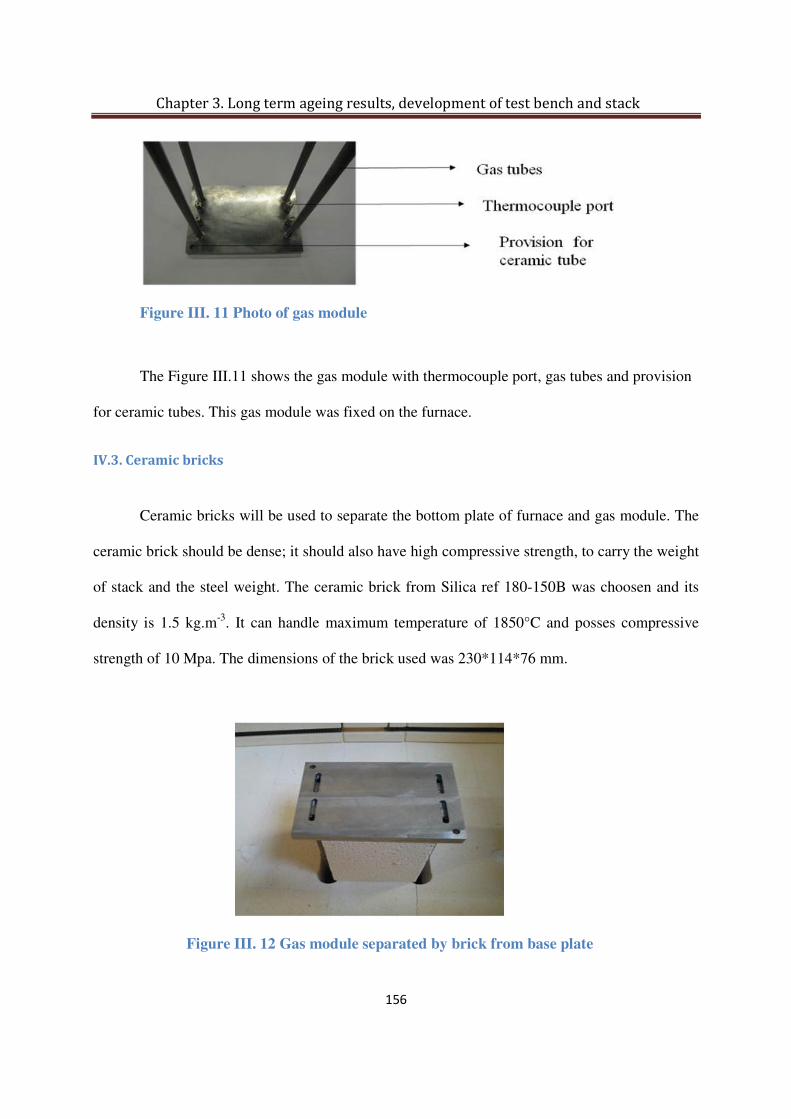
Chapter 3. Long term ageing results, development of test bench and stack
156
Figure III. 11 Photo of gas module
The Figure III.11 shows the gas module with thermocouple port, gas tubes and provision
for ceramic tubes. This gas module was fixed on the furnace.
IV.3. Ceramic bricks
Ceramic bricks will be used to separate the bottom plate of furnace and gas module. The
ceramic brick should be dense; it should also have high compressive strength, to carry the weight
of stack and the steel weight. The ceramic brick from Silica ref 180-150B was choosen and its
density is 1.5 kg.m-3. It can handle maximum temperature of 1850°C and posses compressive
strength of 10 Mpa. The dimensions of the brick used was 230*114*76 mm.
Figure III. 12 Gas module separated by brick from base plate
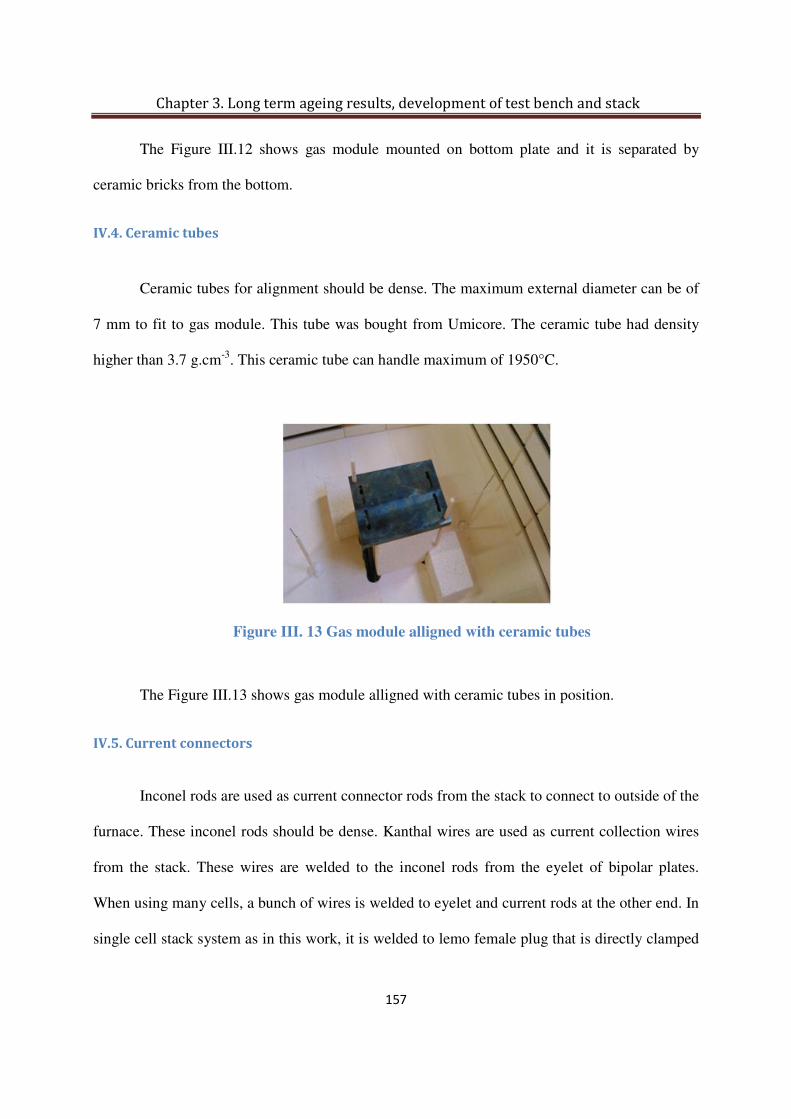
Chapter 3. Long term ageing results, development of test bench and stack
157
The Figure III.12 shows gas module mounted on bottom plate and it is separated by
ceramic bricks from the bottom.
IV.4. Ceramic tubes
Ceramic tubes for alignment should be dense. The maximum external diameter can be of
7 mm to fit to gas module. This tube was bought from Umicore. The ceramic tube had density
higher than 3.7 g.cm-3. This ceramic tube can handle maximum of 1950°C.
Figure III. 13 Gas module alligned with ceramic tubes
The Figure III.13 shows gas module alligned with ceramic tubes in position.
IV.5. Current connectors
Inconel rods are used as current connector rods from the stack to connect to outside of the
furnace. These inconel rods should be dense. Kanthal wires are used as current collection wires
from the stack. These wires are welded to the inconel rods from the eyelet of bipolar plates.
When using many cells, a bunch of wires is welded to eyelet and current rods at the other end. In
single cell stack system as in this work, it is welded to lemo female plug that is directly clamped

Chapter 3. Long term ageing results, development of test bench and stack
158
to D40 flanges outside the furnace. This is then connected with M5 screws and nuts. To enhance
the contact on the screws silver paste is used. This is then connected to the data acquistion
system. The Figure III.14 shows bottom of furnace with fixed current connector clamped to D40
flanges.
Figure III. 14 Bottom plates with D40 flanges
IV. 6. Thermocouples
Thermocouples are chosen according to the working temperature of the stack. Since it is
an IT-SOFC stack, the maximum of 650°C temperature will be maintained during measurement
of data. During the start up of the stack and to set the sealing glass paste, the temperature of the
furnace will be raised to maximum of 950°C. Thermocouple of type K was chosen. This K type
can measure temperature range of -40°C to 1000°C. The diameter of this thermocouple will be of
around 1 mm. Minimum of 4 thermocouples will be needed, each for fuel gas inlet, outlet and
oxidant gas inlet and outlet. One more thermocouple can also be used to measure the temperature
of around the stack, but normally, the average temperature of inlet and outlet gas temperature is
considered as the temperature of stack. K type thermocouples used in the test bench were
brought from Thermocoax. These are seen in the provision, drilled from base plate and will be

Chapter 3. Long term ageing results, development of test bench and stack
159
connected to the data acquring software externally. The Figure III.15 shows thermocouples fixed
to test bench.
Figure III. 15 current connectors and thermocouples fixed in bottom plate
IV.7. Lab View software for data input and acquisition.
The test bench will be controlled by automated manner, using inbuilt software in FC-
LAB, developed from Labview by Fabien Harel. This software helps the operator of test bench
to provide and get data of stack either manually or in an automatic way. This inbuilt software
will accept user instructions for operation of test bench and record the data. The other necessary
auxillary sytems such as mass flow controller, pressure gauge, current wires, thermoucouple
from test bench, solenoid valve voltage wires, and sensors are connected to the software by a
frame grabber. The electronic load needed for operation is directly connected and controlled by
the software. This software allows us to view all the parameters of stack during operation. The
Figure III.16 shows the global view of the test bench with furnace mounted and connected with
lab view software. The Figure III.17 shows lab view software parameter screen for verification
during experiment.

Chapter 3. Long term ageing results, development of test bench and stack
160
Figure III. 16 Global view of furnace and software
Figure III. 17 Lab view parameters screen

Chapter 3. Long term ageing results, development of test bench and stack
161
IV.8. Flow diagram of test bench
The Figure III.18 shows the flow diagram of test bench. It gives clear insights of fuel gas
and an oxidant gas which flows to test bench from gas supply bottle. In this work, hydrogen will
be used as fuel gas and air will be used as an oxidant gas for operation. However for startup, N2
is mixed with hydrogen and used in the ratio of (95% N2+ 5% H2). This is used during start up,
when the cell starts to reduce. When pure hydrogen is supplied, there is a possibility to damage
the cells. So in order to avoid this, nitrogen and hydrogen mixture is supplied and then slowly
replaced by humidified hydrogen for experiments. In this test bench generally 3 lines in parallel
for fuel gases are used, one pure hydrogen, one mixture of (nitrogen + hydrogen) and third for
reformate gases. Similarly air line and air mixed with nitrogen are installed, but for experiments
in this work only air will be used.
Figure III. 18 Flow diagram of test bench [1]
Chapter 3. Long term ageing results, development of test bench and stack
162
The boiler can be heated by a resistor which can increase the temperature of the steam
supplied to fuel gas. The sensor inserted in the humidifier regulates the steam gas which is mixed
and supplied to cell. There are also pressure and temperature sensor installed for gas
measurements. In case of problem in the automatic gas supplying, there are also provisions for
manual adjustments in the set up. The current supplied to stack is available from electronic load
system installed which can be operated either manually or by software. The temperature, the
voltage, the current wires and sensors are externally connected to software for accessing data.
Trial of first stacking process with other necessary part was made and could not be disclosed due
to NDA with DLR. The first stack of single cell with sealing will be made in near future and will
be tested in this newly built test bench.
V.Conclusion
Thus in this chapter long term ageing performance obtained from 10 cm2 cells are
discussed. The products needed for stacking of cells were explained. The test bench preparation
and the required products for making it are presented. As of now the new test bench is ready,
temperature profile of furnace will be done before measuring the stack. Single cell will be
stacked with sealing and the electrochemical performance will be performed on the newly built
test bench.
Chapter 3. Long term ageing results, development of test bench and stack
163
References
1. M.Chnani “Modelisation macroscopic de piles PEFC et SOFC pour l’etude de leur
couplage” These FC-LAB, France 2008.
2. T.Otake Misuzu Yokoyama, Kohki Nagai, Kenji Ukai, Yasunobu Mizutani 10th
International Symposium on Solid Oxide Fuel Cells (SOFC-X), Japan, 2007.
3. T.Otake Misuzu Yokoyama, Kohki Nagai, Kenji Ukai, Yasunobu Mizutani 31st
International Cocoa beach Conference & Exhibition on advanced ceramic and
composites, USA, 2007.
4. M.Yokoo, Y.Tabata, Y.Yoshida, K.Hyashi, Y.Nozaki, K.Nozawa, H.Arai, J. Power
Sources 178, 1, 59, 2008.
5. V.Sivasankaran L.Combemale, M.C-Pera, G.Caboche manuscript to be submitted to
electrochemistry communications.

Conclusions and Perspectives
164
Conclusions and Perspectives
Conclusions and Perspectives
165
General Conclusion
In this thesis titled “Manufacturing and characterization of single cell Intermdeiate
temperature Solid oxide fuel cells for APU in transportation application”, the fuel cells and its
working principles were discussed. IT-SOFC and selection of materials to be used are briefed
along with selection of planar design. The work presented here gives knowledge of the
phenomena, obtained during development of new simplified fabrication process of planar IT-
SOFC with large active area. The development, optimization of the new simplified process to
achieve a large area planar cell, their limiting factors and difficulties in obtaining the cells are
discussed. The goal of to i) prepare large planar cells of active area 25 cm2 in first instance was
achieved ii) Build a new test bench for adapting this geometry was done iii) testing
electrochemical performance of single cells of 10 cm2 was performed.
This fabrication of flawless planar cells by newly developed process was patented later
The new fabrication process, its optimization partly with respect to factors such as i) pore
formers, ii) thickness of layers.iii) Optimization of sintering temperature were detailed. iv)
changing microstructure were performed and discussed.
The long term ageing performances in real time working conditions were studied and its
results are presented. The products required and process involved in developing the new test
bench, are explained in detail. The stacking process of cells is also briefed.
The fundamental objectives such as i) Fabrication of large active area planar cell of for
stacking ; by simple and cost effective process; ii) Obtaining 400 mW.cm-2 for large area cells;
Conclusions and Perspectives
166
iii) To study long term ageing performance of single cell under real working conditions, iv)
Building a new test bench to fit the stack geometry, were done.
Perspectives
This process was carried out with organic solvents, next this process will be performed
with aqueous solvents and using required binders and dispersants. The electrochemical
performance on button cells will be done to study impedence performance on cell in probostat.
The large cells will be stacked and tested in the new test bench prepared in Belfort for long term
ageing performance, which includes impedence spectroscopy measurements.

Abstract et Résumé
167
The fabrications of large area IT-SOFC planar cell by new simple and cost effective
process were explained.
The optimization of the new process with respect to pore formers, thickness of layers,
sintering temperature were performed.
The electrochemical results of 10cm2 performed in Fiaxell open flange set up were
detailed with respect to different configuration.
Long term ageing performance tests of single cells were conducted in Fiaxell device and
results are discussed.
Preparation of new test bench and stacking process performed till now were briefed.
La fabrication de cellules de piles à combustible IT-SOFC de large dimension par un
nouveau procédé simple et peu coûteux est présentée dans ce manuscrit.
L’optimisation de ce nouveau procédé en regard de l’utilisation d’agents de porosité,
d’épaisseur de couches et de température de frittage a été réalisée.
Les résultats des tests électrochimiques sur des cellules de surface active 10 cm2 réalisés
dans le dispositif Fiaxell semi-ouvert ont été détaillés pour différentes cellules.
Des tests de performance de longue durée ont également été menés sur le dispositif
Fiaxell, présentés et discutés.
La préparation et la réalisation d’un nouveau banc de test de stack a également été mené
et présenté dans ces travaux.
Key words: IT-SOFC, tape casting, single step cell preparation, cosintering, Anode Functional
Layer, long term ageing performance, stack, test bench.