
Manually locating physical and virtual reality objects...
31
Page 1 of 31 Manually locating physical and virtual reality objects 1 2 Karen B. Chen, Ryan A. Kimmel, Aaron Bartholomew, Kevin Ponto, Michael L. Gleicher, and 3 Robert G. Radwin* 4 5 University of Wisconsin-Madison, Madison, Wisconsin, USA 6 7 *Corresponding author 8 University of Wisconsin-Madison 9 1550 Engineering Drive 10 Madison, WI 53706-1608 11 [email protected] 12 13 Running head: Manually Locating Physical and VR Objects 14 15 Keywords: virtual reality, physical interface, simulation, CAVE 16 17 18 Abstract 19 Objective: This study compared how users locate physical and equivalent three-dimensional images of 20 virtual objects in a CAVE using the hand to examine how human performance (accuracy, time, and 21 approach) is affected by object size, location, and distance. 22 Background: Virtual reality (VR) offers the promise to flexibly simulate arbitrary environments for 23 simulation and studying human performance. Previous VR research primarily considered differences 24 between virtual and physical distance estimation rather than reaching for close-up objects. 25 Method: Fourteen participants completed manual targeting tasks that involved reaching for corners on 26 equivalent physical and virtual boxes of three different sizes. Predicted errors were calculated from a 27 geometric model based on user interpupillary distance, eye location, distance from the eyes to the 28 projector screen and object. 29 Results: Users were 1.64 times less accurate (p<.001) and spent 1.49 times more time (p=.01) targeting 30 virtual than physical box corners using the hands. Predicted virtual targeting errors, were on average 31
Transcript of Manually locating physical and virtual reality objects...

Page 1 of 31
Manually locating physical and virtual reality objects 1
2
Karen B. Chen, Ryan A. Kimmel, Aaron Bartholomew, Kevin Ponto, Michael L. Gleicher, and 3
Robert G. Radwin* 4
5
University of Wisconsin-Madison, Madison, Wisconsin, USA 6
7
*Corresponding author 8
University of Wisconsin-Madison 9
1550 Engineering Drive 10
Madison, WI 53706-1608 11
13
Running head: Manually Locating Physical and VR Objects 14
15
Keywords: virtual reality, physical interface, simulation, CAVE 16
17
18
Abstract 19
Objective: This study compared how users locate physical and equivalent three-dimensional images of 20
virtual objects in a CAVE using the hand to examine how human performance (accuracy, time, and 21
approach) is affected by object size, location, and distance. 22
Background: Virtual reality (VR) offers the promise to flexibly simulate arbitrary environments for 23
simulation and studying human performance. Previous VR research primarily considered differences 24
between virtual and physical distance estimation rather than reaching for close-up objects. 25
Method: Fourteen participants completed manual targeting tasks that involved reaching for corners on 26
equivalent physical and virtual boxes of three different sizes. Predicted errors were calculated from a 27
geometric model based on user interpupillary distance, eye location, distance from the eyes to the 28
projector screen and object. 29
Results: Users were 1.64 times less accurate (p<.001) and spent 1.49 times more time (p=.01) targeting 30
virtual than physical box corners using the hands. Predicted virtual targeting errors, were on average 31
Page 2 of 31
1.53 times (p<.05) greater than the observed errors for farther virtual targets, but not significantly 32
different for close-up virtual targets. 33
Conclusion: Target size, location, and distance, in addition to binocular disparity, affected virtual object 34
targeting inaccuracy. Observed virtual box inaccuracy was less than predicted for farther locations, 35
suggesting possible influence of cues other than binocular vision. 36
Application: Human physical interaction with objects in VR may be useful for simulation, training and 37
prototyping. Knowledge of user perception and manual performance helps understand limitations of 38
simulations involving reaching and manually handling virtual objects. 39
40
Précis: We examined user locating nearby virtual objects in a CAVE compared to equivalent physical 41
objects. Target location, distance, and binocular disparity affected performance; accuracy was less, and 42
time was longer for virtual than physical objects. Errors locating objects were less than predicted for 43
farther locations suggesting importance of other visual cues. 44
45
Page 3 of 31
Introduction and Background 46
The motivation for this research is the prospect of simulating natural interactions with objects in 47
the physical environment (PE), such as reaching for, acquiring, and handling objects with the hands, by 48
using visually mediated virtual objects in a three-dimensional (3D) virtual reality (VR) environment. This 49
study examines possible differences between how users physically reach for and locate virtual objects. 50
Observing and comparing user performance in the PE and VR may help better understand how to best 51
use VR simulation technology for prototyping new products and devices, and studying human 52
interactions and behaviors in living environments. 53
The present study was conducted in a commercially built CAVE (Cave Automatic Virtual 54
Environment), which is a projection-based VR first introduced for scientific visualization (Cruz-Neira, 55
Sandin, & DeFanti, 1993; Cruz-Neira, Sandin, DeFanti, Kenyon, & Hart, 1992). In general, projection-56
based VR is advantageous for studying natural physical interactions with virtual objects because it allows 57
users to see their own hands relative to the virtual objects, and user performance was found to be less 58
awkward than in other VR environments (Havig, McIntire, & Geiselman, 2011; Sander, Roberts, Smith, 59
Otto, & Wolff, 2006; Sutcliffe, Gault, Fernando, & Tan, 2006). 60
We are ultimately interested in creating more natural VR interactions where users’ hands 61
physically touch, grasp, and handle virtual objects. We wish to first comprehend user accuracy of 62
manually targeting virtual objects in various locations in the 3D space in accordance with the graphics 63
software, and apply those findings to enhance natural interactions with virtual objects so that collisions 64
with visually mediated objects and user movements in the CAVE are accurately detected and displayed. 65
Since 3D vision in a CAVE creates the perception that the virtual objects observed are located in three-66
space, the coordinates where users perceive and physically locate those images may not perfectly 67
coincide with the coordinates of the object created by the CAVE software. Even small differences 68
Page 4 of 31
between the perceived and actual locations may prevent users from efficiently completing manual tasks. 69
This study investigates the magnitude of such differences and study factors that might affect them. 70
Human perception research in VR space has previously looked at distance approximation. 71
Generally, studies have reported distance underestimation in VR (Thompson et al., 2004; Witmer & 72
Kline, 1998) relative to PE (Alexandrova et al., 2010; Willemsen & Gooch, 2002). However distance 73
estimation through walking in large screen VR and PE were similar in adults and children (Plumert, 74
Kearney, Cremer, & Recker, 2005). It was also suggested that distance estimation in different VR 75
simulation technologies had varying degrees of accuracy, and simulations displayed on computer 76
monitors had the lowest accuracy (Lampton, McDonald, Singer, & Bliss, 1995). Although there is a 77
general consensus on distance underestimation in VR, the magnitude of error during target reach and 78
location in a CAVE is still unclear. 79
Others have tried to understand differences in user performance between VR and PE through 80
target aiming (Liu, van Liere, Nieuwenhuizen, & Martens, 2009) and object grasping (Magdalon, 81
Michaelsen, Quevedo, & Levin, 2011). Task performance and movement time were longer in VR for 82
both HMD and single desktop 20-inch stereo monitor (Liu et al., 2009; Magdalon et al., 2011). 83
Additionally, users who wore pinch gloves to intercept virtual and physical objects in a CAVE spent 84
significantly longer time to complete virtual object movement tasks (Sutcliffe, Gault, Fernando, & Tan, 85
2006). These experiments reported performance differences in PE and VR for those studied tasks, and 86
they needed to be accounted for when simulating natural interactions in VR. 87
Human performance is also affected by various depth perception cues and individual factors, as 88
well as objects and screen distance from the eyes (Bajcsy & Lieberman, 1976; Mather, 1996; O'Shea, 89
Blackburn, & Ono, 1994; Walk & Gibson, 1961). Binocular disparity is one of the cues, and its association 90
with interpupillary distance (IPD) (Wann, Rushton, & Mon-Williams, 1994), an individual factor, has been 91
Page 5 of 31
mathematically demonstrated (Ogle, 1953). Accurately perceiving stereoscopic objects has been 92
suggested to be related to binocular disparity, which is associated with IPD (Patterson, 1997). However 93
it was suggested that binocular disparity alone was insufficient to provide accurate depth perception 94
(Hibbard & Bradshaw, 2003), and it was investigated with another cue, motion parallax, in order to 95
understand how users perceive depth (Bradshaw, Parton, & Glennerster, 2000). Users would 96
strategically utilize different cues under different tasks and constraints, yet seldom binocular disparity 97
and motion parallax cues were incorporated while performing their given tasks (Bradshaw et al., 2000). 98
Recently a geometric model developed by Ponto, Gleicher, Radwin, and Shin (2013) 99
demonstrated a relationship between user VR binocular perception and a CAVE binocular disparity 100
setting. Their geometric model considers participant IPD, eye location, and distances from eye to the 101
projector screen (DS), and eye to the object projection (DP) for calculating binocular disparity targeting 102
error in a CAVE (Figure 1). The geometry based on the distances and locations of the points is outlined 103
in Eq. 1, and these equations are combined and rearranged to solve for DP in Eq. 2. The difference 104
between distance to virtual point (DV) and DP is the calculated binocular disparity error, which 105
suggested the importance to investigate the influence of binocular disparity in relation to user 106
performance. 107
108

Page 6 of 31
109
110
Figure 1. Geometric model of a user’s line of sight to a virtual target (indicated as a single point, depicted by the 111 star symbol). CAVE binocular disparity (CAVE BD) is the distance between the CAVE virtual cameras. The location 112 of the projected image by the cameras is labeled as the virtual point (VP), depicted by the star (*), and its distance 113 to the viewer is labeled as DV. IPD is the distance between the two eyes for each subject. Distance from the eyes 114 to the perceived point (PP) is indicated as DP. Display (Disp) is the distance between the two points of the line of 115
sight from both the cameras and the user that landed on the screen. 116
117
��������
���
�� ��
(Eq. 1) �����
���
�� ��
118
119
�����
������� � ��� ���
�� � ��� ���
(Eq. 2)
�� ���� � �� � ��
������ � �� ������ � �� � ��� � ��
120
The current study compared human reach and localization of visually mediated virtual objects in 121
a CAVE against equivalent physical objects located at arm-length distances. It was hypothesized that 122
human performance in the virtual condition was not equivalent to the physical condition. Participants 123
Page 7 of 31
were asked to reach for the four corners on the upper face of three physical boxes and three equivalent 124
virtual boxes projected in a CAVE. The localization of a box corner represented the perceived location of 125
the box corner. We compare the perceived location of virtual against the physical box corners, and then 126
assess the extent of the contribution of external and internal factors to user performance in VR. 127
Methods 128
Participants 129
Sixteen students were recruited with informed consent from the University of Wisconsin-130
Madison campus, and Table 1 lists their self-reported demographics. Inclusion criteria were self-131
reported normal or corrected-to-normal vision and the ability to stand for at least 20 minutes. Exclusion 132
criteria included reported history of epileptic seizures or blackouts, tendency for motion sickness when 133
experiencing visual motion conflicts, neuromotor impairments, Lasik eye surgery, perception-altering 134
medication, claustrophobia in 3mX3mX3m square room, or were sensitive to flashing lights. Two 135
participants were excluded due to Lasik eye surgery or forgotten eye glasses. 136
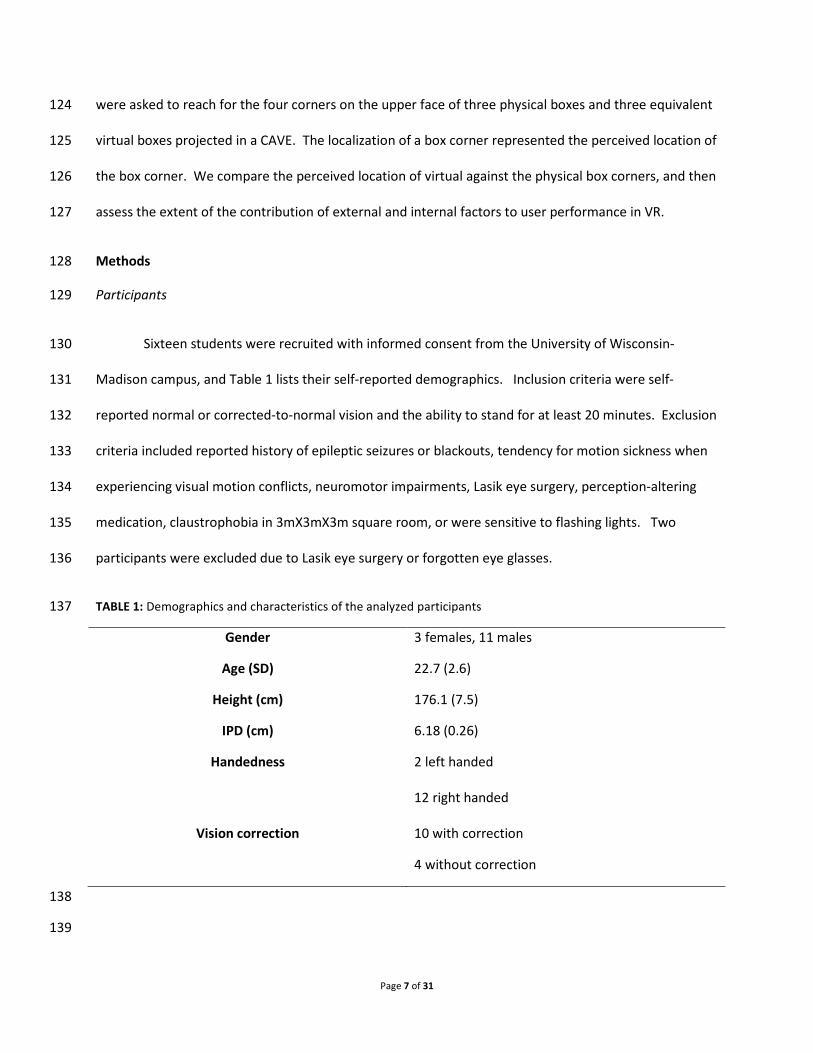
TABLE 1: Demographics and characteristics of the analyzed participants 137
Gender 3 females, 11 males
Age (SD) 22.7 (2.6)
Height (cm) 176.1 (7.5)
IPD (cm) 6.18 (0.26)
Handedness 2 left handed
12 right handed
Vision correction 10 with correction
4 without correction
138
139
Page 8 of 31
Procedure 140
Stature and arm length were measured using an anthropometric caliper, and IPD was measured 141
using a digital pupilometer (Digital PD ruler PM-100, Luxvision, www.luxvsion.net). Participants were 142
instructed to stand in the CAVE in their stocking feet (only wearing socks or booties) and performed 143
targeting tasks. 144
Instrumentation 145
The VR was created in a 2.93 m X 2.93 m X 2.93 m rear-projected six-faced CAVE consisting of 146
four walls, one ceiling, and one solid acrylic floor. Two 3D projectors (Titan model 1080p 3D, Digital 147
Projection, Inc. Kennesaw, GA, USA) with maximum brightness of 4500 lumens per projector, total 148
1920x1920 pixels combined, and 70 Hz of update rate per eye, projected images onto each surface of 149
the CAVE. Immersive 3D scenarios were implemented using the VirtualLab software package (Virtual 150
CAVELib API, Mechdyne, Marshalltown, IA, USA), and four workstations (2 x Quad‐Core Intel Xeon) 151
generated displayed graphics. Audio was generated by a 5.1 surround sound audio system. 152
The data acquisition system consisted of an ultrasonic tracker set (VETracker Processor model 153
IS-900, InterSense, Inc. Billerica, MA, USA) including a hand-held wand (MicroTrax model 100-91000-154
EWWD, InterSense, Inc. Billerica, MA, USA ) and head trackers (MicroTrax model 100-91300-AWHT, 155
InterSense, Inc. Billerica, MA, USA) that sampled at 60Hz. Twelve ultrasonic emitters evenly placed 156
along the upper (two per edge) and vertical (three per edge) edges of the CAVE allowed full 6 degrees of 157
freedom wand and head tracking. Shutter glasses (CrystalEyes 4 model 100103-04, RealD, Beverly Hills, 158
CA, USA) with head trackers mounted on the top rim created stereoscopic images from the user’s 159
viewpoint. 160
161
Page 9 of 31
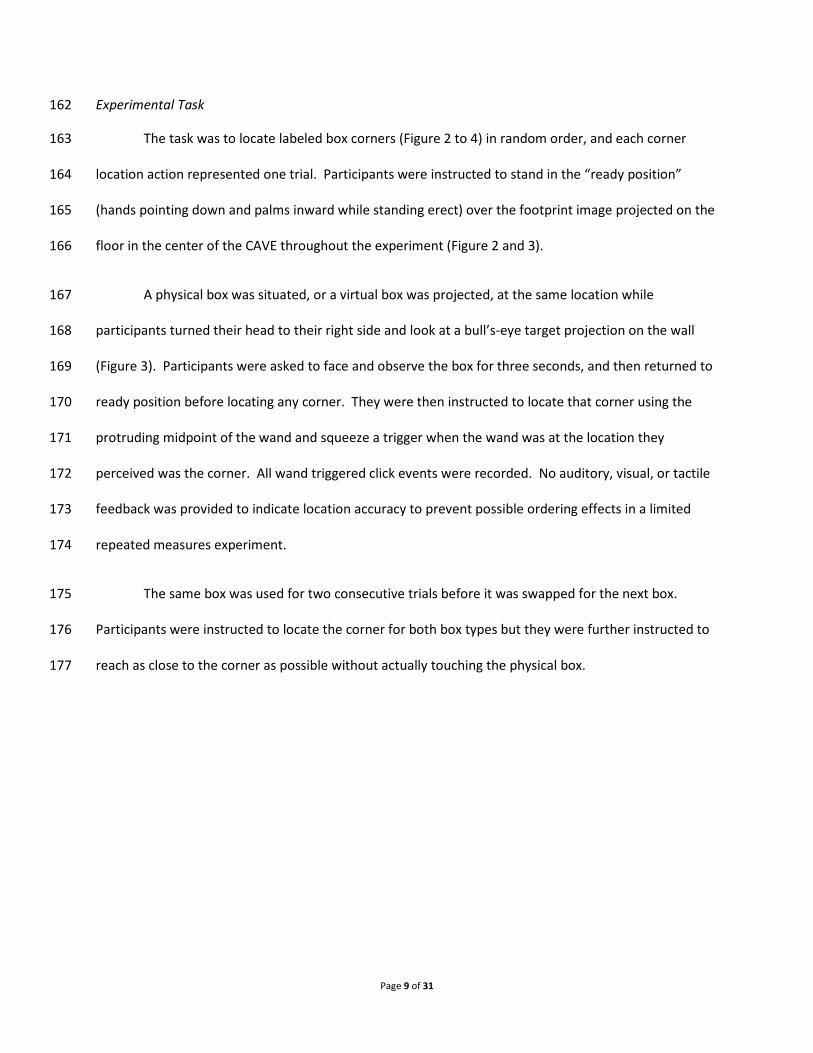
Experimental Task 162
The task was to locate labeled box corners (Figure 2 to 4) in random order, and each corner 163
location action represented one trial. Participants were instructed to stand in the “ready position” 164
(hands pointing down and palms inward while standing erect) over the footprint image projected on the 165
floor in the center of the CAVE throughout the experiment (Figure 2 and 3). 166
A physical box was situated, or a virtual box was projected, at the same location while 167
participants turned their head to their right side and look at a bull’s-eye target projection on the wall 168
(Figure 3). Participants were asked to face and observe the box for three seconds, and then returned to 169
ready position before locating any corner. They were then instructed to locate that corner using the 170
protruding midpoint of the wand and squeeze a trigger when the wand was at the location they 171
perceived was the corner. All wand triggered click events were recorded. No auditory, visual, or tactile 172
feedback was provided to indicate location accuracy to prevent possible ordering effects in a limited 173
repeated measures experiment. 174
The same box was used for two consecutive trials before it was swapped for the next box. 175
Participants were instructed to locate the corner for both box types but they were further instructed to 176
reach as close to the corner as possible without actually touching the physical box. 177
Page 10 of 31
178
Figure 2. Relative locations of the box, corners, and the participant. Corners of the boxes were labeled 1 through 179 4; corners 1 and 2 were the closer left and right corners, and 3 and 4 were the farther right and left corners, 180 respectively. The red dot indicates the midpoint between corners 1 and 2, which also represents the origin of the 181 coordinate system when measured from the floor. The positive x-axis was toward the posterior, the positive y-axis 182
was to the right, and the positive z-axis was toward the superior direction. 183
184
(a) (b) (c)
Figure 3. A participant inside the CAVE, standing on foot print images projected on the CAVE floor while 185 performing indicated tasks: (a) turning to the right and looking at the projected target; (b) pointing to a corner of a 186 virtual box while standing on the projected footprints; and (c) pointing to a corner of a physical box while standing 187
on the projected footprints. 188
189
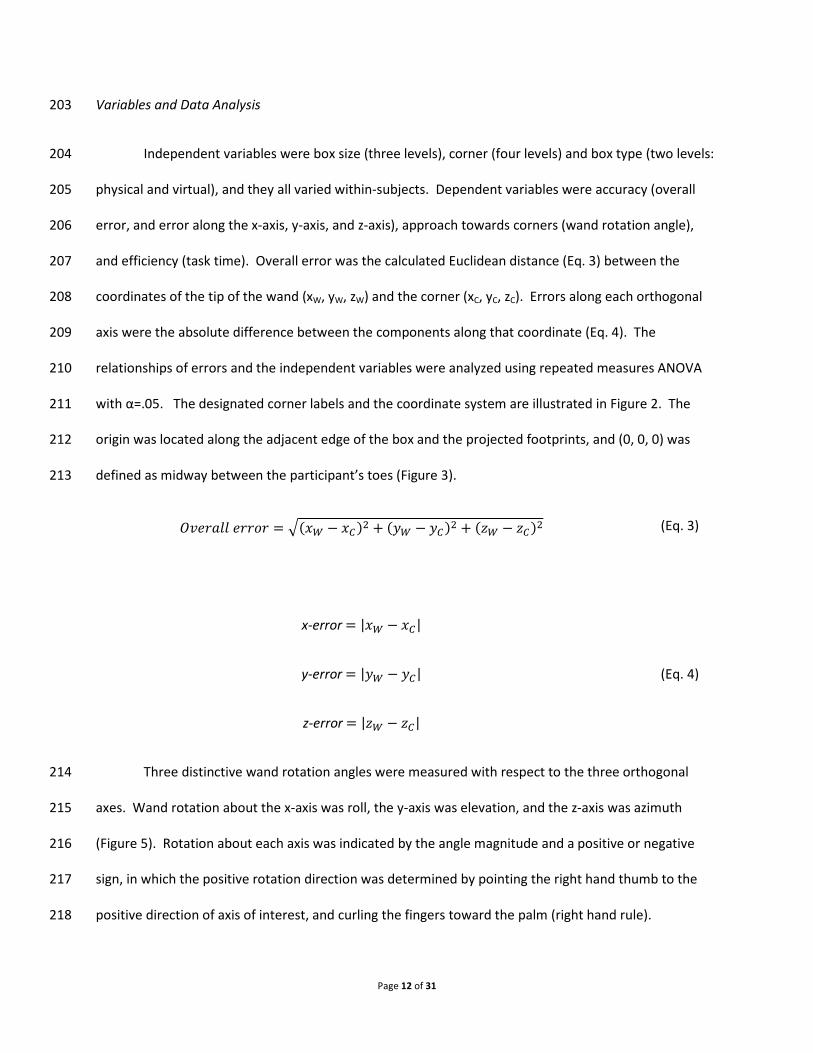
Participants completed 48 trials; two replications for each of the four corners for three physical 190
and three virtual boxes. The physical boxes sizes were chosen based on convenience and availability 191

Page 11 of 31
(Figure 4), and the images of the virtual boxes were then photographed and constructed to match the 192
dimensions of the physical boxes. No practice was provided. 193
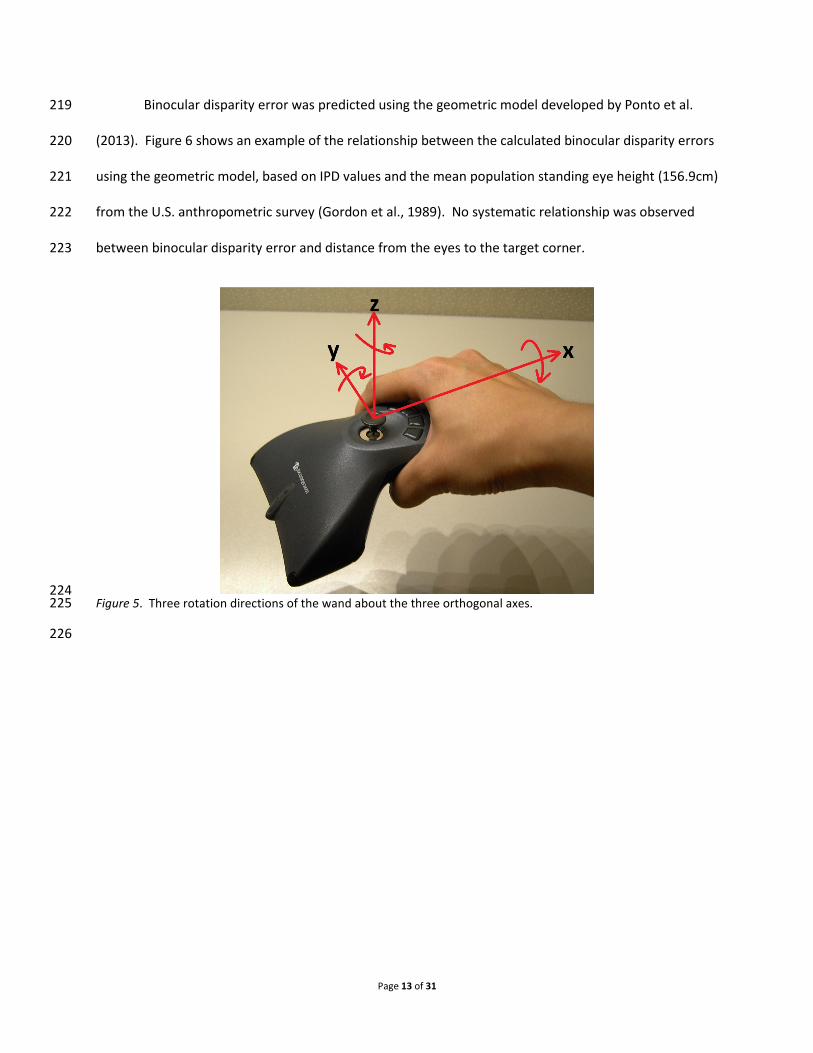
(a)
(b)
(c)
(d)
Figure 4. Views of three physical boxes from different planes and angles showing their relative sizes. Images a, b, 194 and c display the boxes in the order of box A, B, and C (from left to right). Box A dimension was 47x32x72, box B 195 was 59x28x74, and box C was 31x34x102(length X width X height, in centimeters). Image d displays the boxes in 196 the order of C, B, A (from left to right). The illustrations show the: (a) side view looking at the x-z plane; (b) side 197 view looking at the y-z plane; (c) top view looking at the y-x plane; and (d) side view looking at boxes from an 198 angle. 199
200
201
202
Page 12 of 31
Variables and Data Analysis 203
Independent variables were box size (three levels), corner (four levels) and box type (two levels: 204
physical and virtual), and they all varied within-subjects. Dependent variables were accuracy (overall 205
error, and error along the x-axis, y-axis, and z-axis), approach towards corners (wand rotation angle), 206
and efficiency (task time). Overall error was the calculated Euclidean distance (Eq. 3) between the 207
coordinates of the tip of the wand (xW, yW, zW) and the corner (xC, yC, zC). Errors along each orthogonal 208
axis were the absolute difference between the components along that coordinate (Eq. 4). The 209
relationships of errors and the independent variables were analyzed using repeated measures ANOVA 210
with α=.05. The designated corner labels and the coordinate system are illustrated in Figure 2. The 211
origin was located along the adjacent edge of the box and the projected footprints, and (0, 0, 0) was 212
defined as midway between the participant’s toes (Figure 3). 213
������������ � ���� ���� � � � ��� � �!� !��� (Eq. 3)
x-error � |�� ��|
y-error � | � �|
z-error � |!� !�|
(Eq. 4)
Three distinctive wand rotation angles were measured with respect to the three orthogonal 214
axes. Wand rotation about the x-axis was roll, the y-axis was elevation, and the z-axis was azimuth 215
(Figure 5). Rotation about each axis was indicated by the angle magnitude and a positive or negative 216
sign, in which the positive rotation direction was determined by pointing the right hand thumb to the 217
positive direction of axis of interest, and curling the fingers toward the palm (right hand rule). 218
Page 13 of 31
Binocular disparity error was predicted using the geometric model developed by Ponto et al. 219
(2013). Figure 6 shows an example of the relationship between the calculated binocular disparity errors 220
using the geometric model, based on IPD values and the mean population standing eye height (156.9cm) 221
from the U.S. anthropometric survey (Gordon et al., 1989). No systematic relationship was observed 222
between binocular disparity error and distance from the eyes to the target corner. 223
224 Figure 5. Three rotation directions of the wand about the three orthogonal axes. 225
226
Page 14 of 31
Figure 6. The left graph is the binocular disparity targeting error calculated from the geometric model against 227 increasing DV, while holding user standing eye height at the mean of the U.S. Army Personnel Anthropometric 228 Survey (156.86 cm) with varying interpupillary distance from the U.S. Army Personnel Anthropometric Survey 229 (Gordon et al., 1989). The right graph is the binocular disparity targeting error calculated from the geometric 230 model against increasing DV, while holding user interpupillary distance at the mean of the U.S. Army Personnel 231 Survey (6.35 cm) with varying standing eye height from the U.S. Army Personnel Anthropometric Survey (Gordon 232 et al., 1989). Binocular disparity error in all cases increased with increasing IPD or increasing standing eye height. 233
Closer corners were corners 1 and 2, and far corners were corners 3 and 4 (Figures 2 and 4). 234
235
Results 236
Mean overall error for the VR cases was plotted against trial number, and a log-log regression curve 237
was fitted to examine potential practice effect over the 24 trials (F(1,22) = 11.96, p = .002). Mean error 238
of the first VR trial was the average error of all participants’ first virtual box trial, and then subsequent 239
data points were calculated similarly to obtain the mean errors of remaining VR trials. The difference in 240
overall error between VR trials 1 and 4 was 1.36 cm, whereas the difference between VR trials 4 and 24 241
was 0.3 cm. The first replicate of each corner for all three virtual and three physical boxes was excluded 242
from data analysis to remove practice effects, and also to maintain a full factorial experiment. To test if 243
the practice effect was removed, we regressed the errors over order for the remaining VR trials. No 244
statistically significant effect of time on error was observed (F(1,10) = 2.51, p = .144). 245
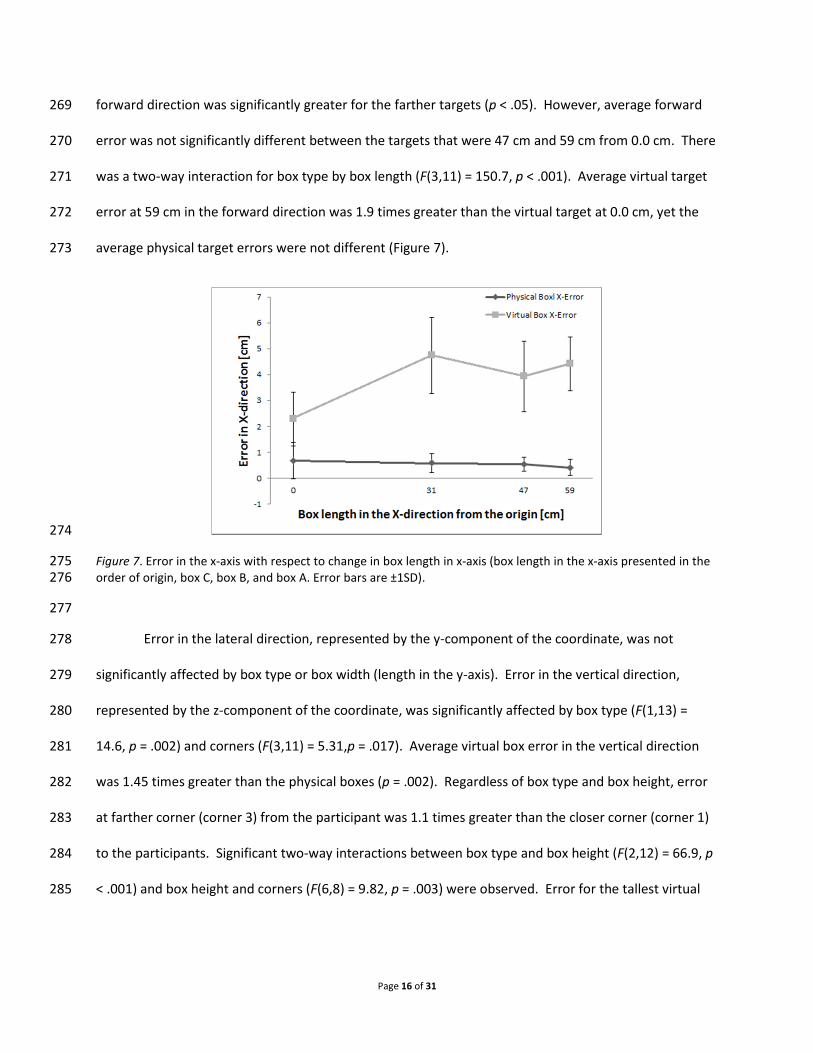
Page 15 of 31
Though the experimenter did not observe any physical box touches it was still analytically verified. 246
Wand trajectories were sampled at 60 Hz, and the velocity and acceleration profiles were calculated 247
using numerical differentiation for each participant to assess potential physical box contacts. High 248
frequency noise of the profiles was filtered out using a Gaussian smoothing algorithm. It was 249
anticipated that the wand would have zero velocity and rapid deceleration if a touch occurred. 250
Assuming that it would take at least 90 milliseconds to react to a touch, at a 60 Hz sampling rate we 251
would expect at least 5 data points that were at or near zero velocity while rapid deceleration occurred. 252
Trajectory data for 10 seconds before and after every click response of all physical box trials were 253
examined, and it was determined that no profiles matched the criteria listed above. It was concluded 254
that the participants did not touch the physical boxes as instructed. 255
Overall Error 256
Overall error was significantly affected by box type (F(1,12) = 31.2, p < .001) and corner (F(3,11) = 257
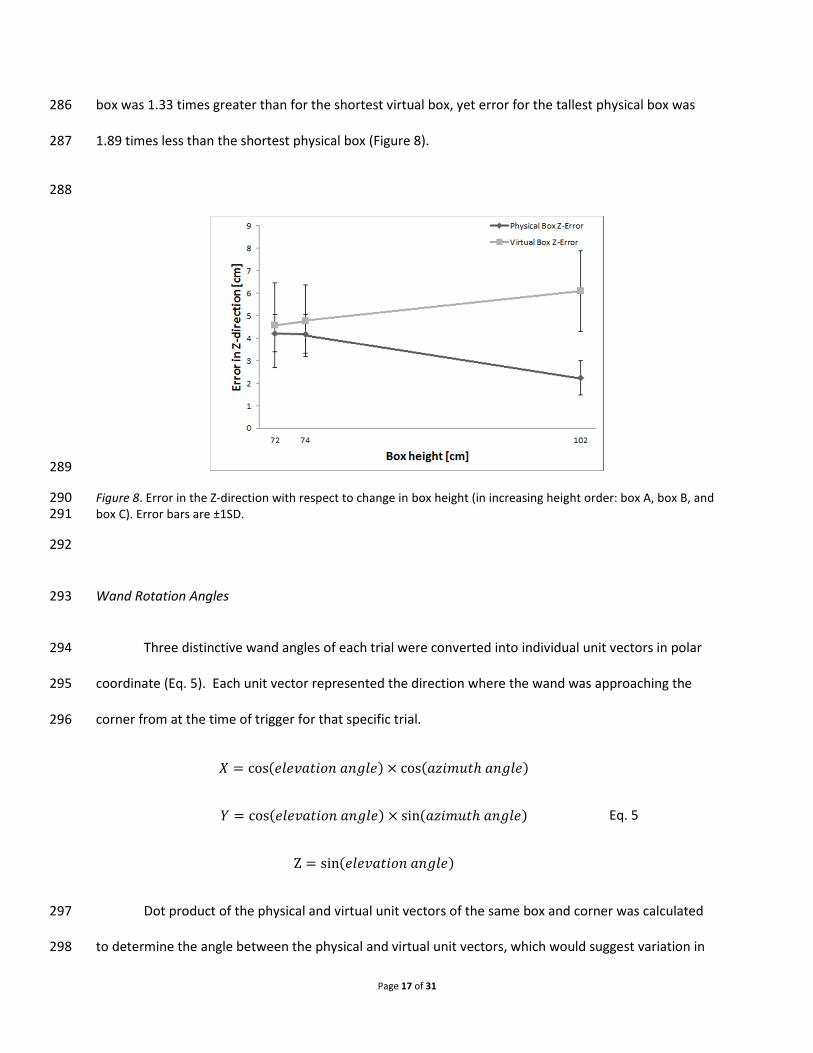
3.70, p = .046). Post-hoc analysis revealed that average virtual boxes error was 1.64 times greater than 258
physical box error (p < .05). In general, farther corners (corner 4) from the participant resulted in 259
greater error (1.1 times greater) than closer corners (corner 2), statistically controlling for box type and 260
box (A, B, and C). Two-way interactions were observed for box type by box (F(2,12) = 69.2, p < .001), 261
box type by corner (F(3,11) = 5.92, p = .012), and box by corner (F(6,8) = 9.49, p = .003). Errors of the 262
three boxes (collapsed across corners) for the different box types are graphically compared in Figure 10. 263
Errors in the forward, lateral, and vertical directions 264
Error in the forward direction was represented by the x-component of the coordinate, and it 265
was significantly affected by box type (F(1,13) = 95.0, p < .001) and box length along the forward 266
direction (F(3,11) = 19.2, p < .001). On average virtual box error was 5.54 times greater than the 267
physical box error in the forward direction (Figure 7). Post-hoc analysis indicated that error in the 268
Page 16 of 31
forward direction was significantly greater for the farther targets (p < .05). However, average forward 269
error was not significantly different between the targets that were 47 cm and 59 cm from 0.0 cm. There 270
was a two-way interaction for box type by box length (F(3,11) = 150.7, p < .001). Average virtual target 271
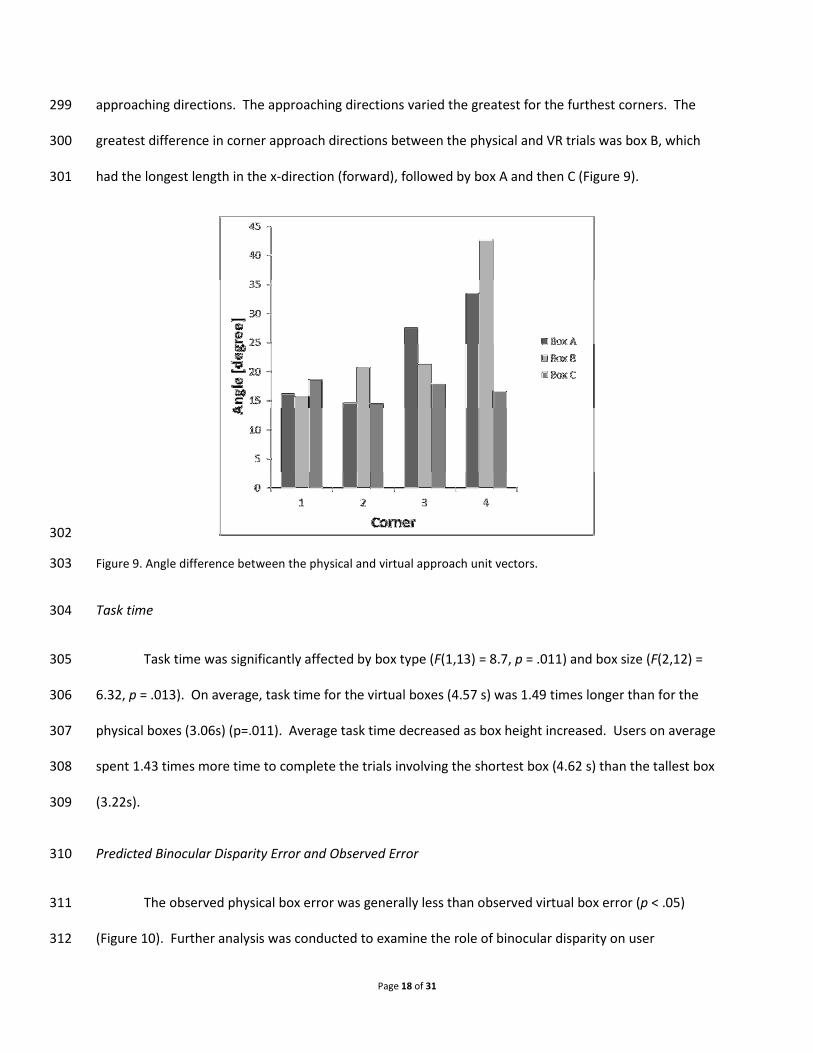
error at 59 cm in the forward direction was 1.9 times greater than the virtual target at 0.0 cm, yet the 272
average physical target errors were not different (Figure 7). 273
274
Figure 7. Error in the x-axis with respect to change in box length in x-axis (box length in the x-axis presented in the 275
order of origin, box C, box B, and box A. Error bars are ±1SD). 276
277
Error in the lateral direction, represented by the y-component of the coordinate, was not 278
significantly affected by box type or box width (length in the y-axis). Error in the vertical direction, 279
represented by the z-component of the coordinate, was significantly affected by box type (F(1,13) = 280
14.6, p = .002) and corners (F(3,11) = 5.31,p = .017). Average virtual box error in the vertical direction 281
was 1.45 times greater than the physical boxes (p = .002). Regardless of box type and box height, error 282
at farther corner (corner 3) from the participant was 1.1 times greater than the closer corner (corner 1) 283
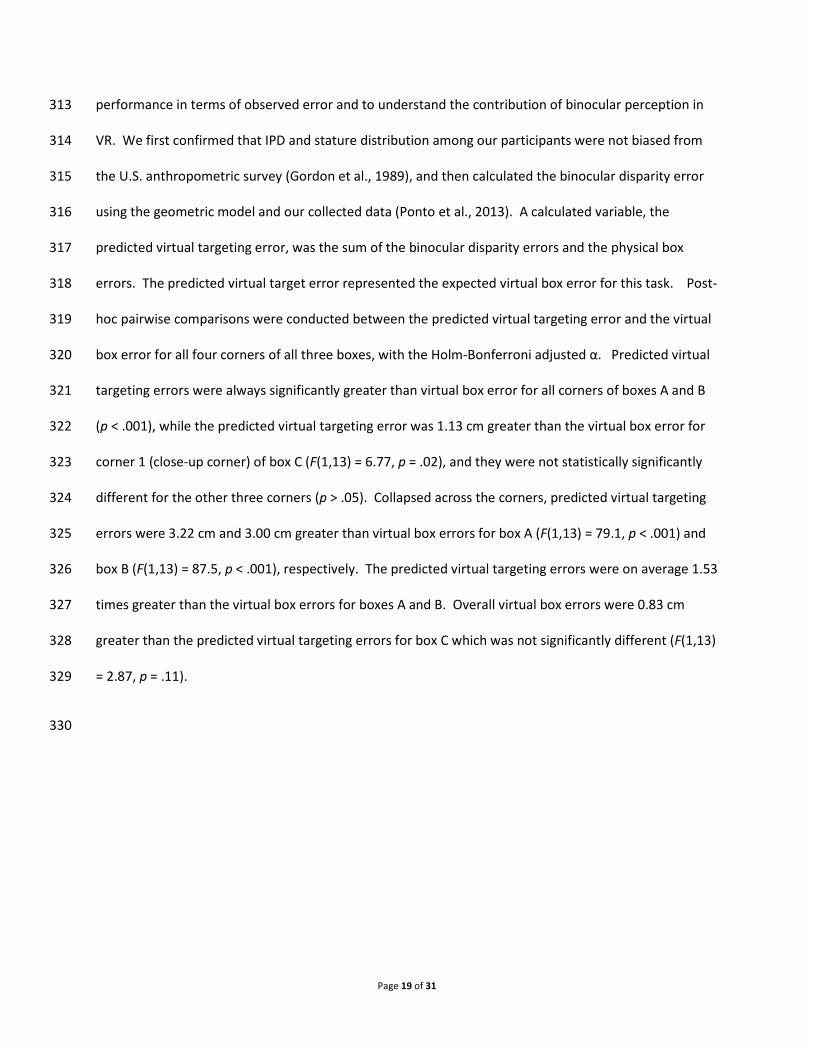
to the participants. Significant two-way interactions between box type and box height (F(2,12) = 66.9, p 284
< .001) and box height and corners (F(6,8) = 9.82, p = .003) were observed. Error for the tallest virtual 285
Page 17 of 31
box was 1.33 times greater than for the shortest virtual box, yet error for the tallest physical box was 286
1.89 times less than the shortest physical box (Figure 8). 287
288
289
Figure 8. Error in the Z-direction with respect to change in box height (in increasing height order: box A, box B, and 290 box C). Error bars are ±1SD. 291
292
Wand Rotation Angles 293
Three distinctive wand angles of each trial were converted into individual unit vectors in polar 294
coordinate (Eq. 5). Each unit vector represented the direction where the wand was approaching the 295
corner from at the time of trigger for that specific trial. 296
# � cos������'�(�()��� � cos��!*+',�()���
- � cos������'�(�()��� � sin��!*+',�()���
Z � sin������'�(�()���
Eq. 5
Dot product of the physical and virtual unit vectors of the same box and corner was calculated 297
to determine the angle between the physical and virtual unit vectors, which would suggest variation in 298
Page 18 of 31
approaching directions. The approaching directions varied the greatest for the furthest corners. The 299
greatest difference in corner approach directions between the physical and VR trials was box B, which 300
had the longest length in the x-direction (forward), followed by box A and then C (Figure 9). 301
302
Figure 9. Angle difference between the physical and virtual approach unit vectors. 303
Task time 304
Task time was significantly affected by box type (F(1,13) = 8.7, p = .011) and box size (F(2,12) = 305
6.32, p = .013). On average, task time for the virtual boxes (4.57 s) was 1.49 times longer than for the 306
physical boxes (3.06s) (p=.011). Average task time decreased as box height increased. Users on average 307
spent 1.43 times more time to complete the trials involving the shortest box (4.62 s) than the tallest box 308
(3.22s). 309
Predicted Binocular Disparity Error and Observed Error 310
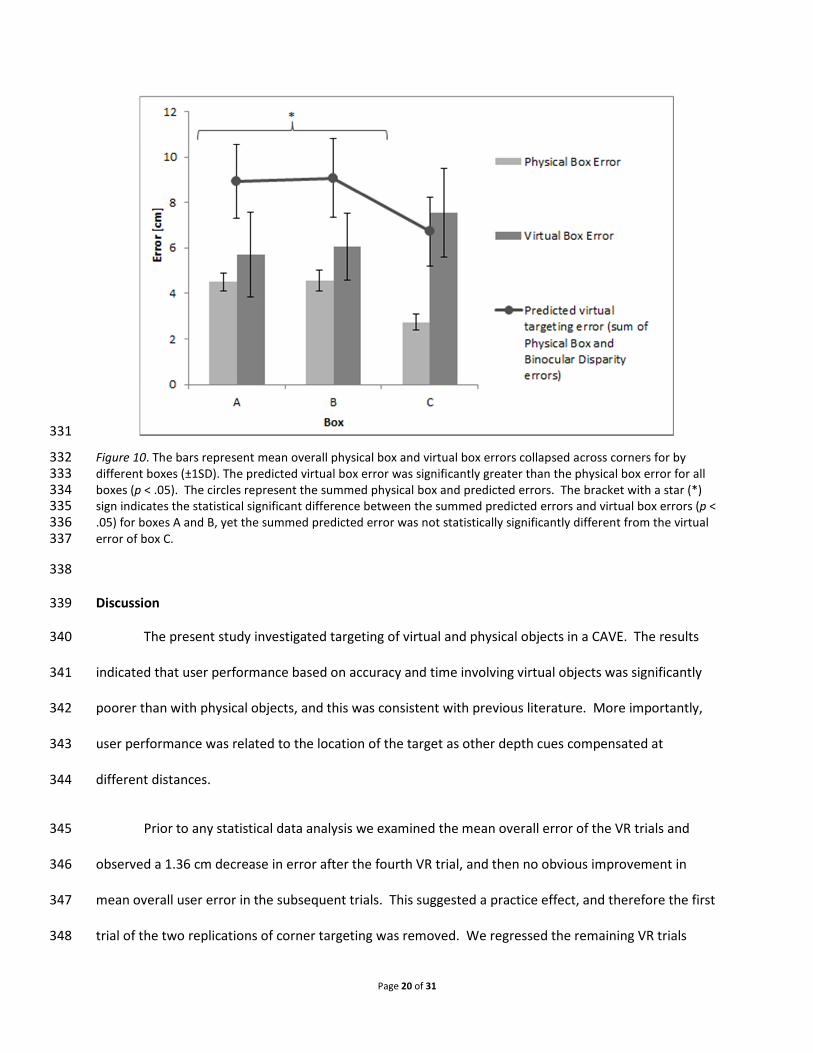
The observed physical box error was generally less than observed virtual box error (p < .05) 311
(Figure 10). Further analysis was conducted to examine the role of binocular disparity on user 312
Page 19 of 31
performance in terms of observed error and to understand the contribution of binocular perception in 313
VR. We first confirmed that IPD and stature distribution among our participants were not biased from 314
the U.S. anthropometric survey (Gordon et al., 1989), and then calculated the binocular disparity error 315
using the geometric model and our collected data (Ponto et al., 2013). A calculated variable, the 316
predicted virtual targeting error, was the sum of the binocular disparity errors and the physical box 317
errors. The predicted virtual target error represented the expected virtual box error for this task. Post-318
hoc pairwise comparisons were conducted between the predicted virtual targeting error and the virtual 319
box error for all four corners of all three boxes, with the Holm-Bonferroni adjusted α. Predicted virtual 320
targeting errors were always significantly greater than virtual box error for all corners of boxes A and B 321
(p < .001), while the predicted virtual targeting error was 1.13 cm greater than the virtual box error for 322
corner 1 (close-up corner) of box C (F(1,13) = 6.77, p = .02), and they were not statistically significantly 323
different for the other three corners (p > .05). Collapsed across the corners, predicted virtual targeting 324
errors were 3.22 cm and 3.00 cm greater than virtual box errors for box A (F(1,13) = 79.1, p < .001) and 325
box B (F(1,13) = 87.5, p < .001), respectively. The predicted virtual targeting errors were on average 1.53 326
times greater than the virtual box errors for boxes A and B. Overall virtual box errors were 0.83 cm 327
greater than the predicted virtual targeting errors for box C which was not significantly different (F(1,13) 328
= 2.87, p = .11). 329
330
Page 20 of 31
331
Figure 10. The bars represent mean overall physical box and virtual box errors collapsed across corners for by 332 different boxes (±1SD). The predicted virtual box error was significantly greater than the physical box error for all 333 boxes (p < .05). The circles represent the summed physical box and predicted errors. The bracket with a star (*) 334 sign indicates the statistical significant difference between the summed predicted errors and virtual box errors (p < 335 .05) for boxes A and B, yet the summed predicted error was not statistically significantly different from the virtual 336
error of box C. 337
338
Discussion 339
The present study investigated targeting of virtual and physical objects in a CAVE. The results 340
indicated that user performance based on accuracy and time involving virtual objects was significantly 341
poorer than with physical objects, and this was consistent with previous literature. More importantly, 342
user performance was related to the location of the target as other depth cues compensated at 343
different distances. 344
Prior to any statistical data analysis we examined the mean overall error of the VR trials and 345
observed a 1.36 cm decrease in error after the fourth VR trial, and then no obvious improvement in 346
mean overall user error in the subsequent trials. This suggested a practice effect, and therefore the first 347
trial of the two replications of corner targeting was removed. We regressed the remaining VR trials 348
Page 21 of 31
against time, and there was not a statistically significant difference of error over time. Since the 349
participants did not receive any visual feedback from the VR system or verbal feedback from the 350
experimenter regarding their performance, as we would anticipate greater improvement in 351
performance if the participants adjusted their final wand location by considering the feedback provided. 352
Relatively smaller error observed in the physical box trials confirmed that even if a practice effect 353
existed for the physical boxes, the effect was much smaller than for the virtual boxes, and therefore its 354
effects were not considered. 355
A limitation of the experiment was the participants were not instructed to look away at the 356
bull’s-eye between two consecutive touches that involved the same box. However, the presentation of 357
boxes was randomized, and there were no observable systematic trends among consecutive trials.. 358
User accuracy (error) 359
Users generally had significantly greater accuracy when reaching for corners of a physical box 360
than a virtual box. Averaged across all three boxes of the same type (physical or virtual), participants 361
triggered the wand at 6.6 cm away from the virtual corners, and the error was 4 cm for the physical 362
corners. It was hypothesized that human performance in VR and PE are different, and this is supported 363
by our data. Similar trends were previously reported for traversed and verbal estimated distances 364
(Alexandrova et al., 2010; Witmer & Kline, 1998). Interestingly, there was on average 4 cm of physical 365
box error, which may be explained by participant instructions not to actually make contact with the 366
physical box surface. It is expected that the difference between the virtual and physical box errors 367
would increase if participants were permitted to touch the physical corners. 368
Errors were further analyzed with distinctive components along the x, y, and z axes. Results 369
indicated that errors in the forward and vertical directions (x-axis and z-axis, respectively) were 370
influenced by corner location (i.e., target distance), but not in the lateral direction (y-axis). Virtual box 371
Page 22 of 31
error in the forward direction (along the x-axis) was significantly greater for the farther corners than the 372
closer corners, yet the physical box errors were not statistically significantly different amongst the 373
corners of the same direction. Moreover, users had greater error when they aimed at far virtual targets 374
in the horizontal (4.4 cm error for the far corners compared to 2.3 cm error for the closer corners). This 375
result suggested that the accuracy of aiming at a virtual target is related to its location, and it is 376
consistent with the literature (Interrante, Ries, & Anderson, 2006), but this relationship was not seen in 377
physical targets. It is plausible that virtual box errors were related to the reaching posture since they 378
increased as the target was farther in the forward direction. Images taken by the CAVE video camera 379
were also reviewed, and we observed that users reached for virtual box corners with relatively different 380
bending postures compared to reaches for physical box corners. There was more bending and wrist 381
turning for far virtual box corners. Based on this finding, we would suggest that the source of the 382
physical box error was not due to target location or reaching posture instability since the physical box 383
error did not change significantly in relation to the increase in target distance in the forward direction 384
(Figure 7). 385
The magnitude of virtual box error increased with increasing box height but physical box error 386
decreased. In this study, taller boxes represented closer targets to the participants since all boxes were 387
shorter than all participant’s standing eye height. As a result, virtual box errors were the greatest when 388
the target was the closest to the participants’ eyes along the z-axis. On the other hand, greater accuracy 389
was observed for closer physical targets that varied in vertical distances (Figure 8). We hypothesize that 390
close-up virtual box errors may be due to visual perception, and farther virtual box errors observed in 391
the forward direction may be due to physical reach and postural constraints. In order for users to 392
interact with virtual objects based on their perceived location of the object, targets may need to be 393
adjusted for activation boundaries. 394
Page 23 of 31
Another plausible explanation for the observed effects was the use of a physical wand to aim at 395
virtual targets, such that users may have viewed the physical wand while aiming for a virtual box corner, 396
which may have resulted in an accommodation mismatch (Drascic & Milgram, 1996). In this condition, 397
the one vergence point and accommodation for the physical wand are the same however the vergence 398
point of the virtual target on the virtual box corner, yet accommodation was the on CAVE screen. We 399
suggest that the virtual box errors were most likely perceptual, which relates back to the earlier 400
discussion. The possibility that an accommodation mismatch was responsible for the errors observed 401
should be considered in future studies. 402
Though it is possible that the VR 3D goggles may have interfered with the users’ ability to 403
perceive the location of the physical box corners, the VR 3D goggles allowed the users to see through 404
them, and therefore we do not anticipate interference. Assuming the physical box errors was not 405
attributed to wearing the 3D goggles, then the physical box error would be the smallest possible error in 406
this type of task and setting. If this effect exists, it is representative of the conditions that would arise in 407
a CAVE simulation involving people interacting with virtual objects and therefore the findings of this 408
study reflect that experience. 409
The present study outcome was consistent with other studies that resulted in greater error for 410
virtual targets and less error for the physical targets, although this study primarily investigated user 411
interaction with virtual and physical objects within arm-length distances with boxes as opposed to 412
longer distance estimation. Errors in the x-axis and z-axis were also significantly affected by box type. 413
Both x-axis and z-axis errors in VR were greater than for the PE. 414
Task time 415
Task time was also significantly affected by virtual and physical box types. Our participants 416
spent 1.49 times longer to complete virtual box trials than physical box trials, and Liu et al. (2009) also 417
Page 24 of 31
reported less efficient aimed movements in VR. The result suggested that users moved more cautiously 418
when aiming at virtual corners, and this is important to consider when analyzing movement time in VR. 419
Since users were slower in aiming virtual targets, simulated tasks may not be completely transferrable to 420
the physical equivalent. 421
Approach angles 422
Participants used the wand to approach different corners from various angles. Wand approach 423
angles were significantly different among the four corners regardless of box type, implying that users 424
approached the same corner number similarly in both physical and virtual box types. Although overall 425
wand approach angles were not significantly different between the virtual and physical boxes, an 426
increase in the difference between the virtual and physical approach angles was observed for the 427
farthest corner. This could be explained by potential obstruction of the projection to form virtual 428
objects by the participant’s hand when reached for the farthest corner. It would be relatively more 429
difficult to aim at a corner when parts of the image were blocked. This reinforces the importance of 430
visualizing complete objects to perform tasks that require accuracy in VR. The participants may have 431
approached the corners from an angle that would minimize blocking the images, which could explain 432
smaller errors observed for closer virtual corners in the forward direction. On the other hand, users may 433
have taken a more natural route when approaching the physical corners by moving across the box since 434
they did not have to be concerned about blocking visual information because none of the physical box 435
components relied on projector image creation. 436
Predicted targeting error and observed error 437
We found no significant difference between the predicted virtual targeting error and the virtual 438
error for box C, but found that participants tended to perform better than anticipated for boxes A and B 439
(Figure 10). We propose that the difference in performance was due to the difference in target 440

Page 25 of 31
locations (distances) to the eyes. Box C (102 cm in height) was the tallest box, and therefore the target 441
locations were closer to the eyes of the participants than the targets on boxes A and B (72 cm and 74 cm 442
in height, respectively). Moreover, the virtual box error of the closer corner of box C was statistically 443
significantly greater than its predicted virtual targeting error supporting the suggestion such that 444
participant targeting accuracy decreased for closer targets. These results mirror that found by Pollock, 445
Burton, Kelly, Gilber, and Winer (2012) when studying difference in perception of non-tracked users in 446
VR, and by Woods, Docherty, and Koch (1993) when studying image distortions in stereoscopic video 447
systems. Recent study conducted by Renner, Velichkovsky, Helmert, and Stelzer (2013) also pointed out 448
that accounting just for IPD in the CAVE setting was not sufficient to completely reduce the error of the 449
users, in which IPD was related to binocular disparity. We further suspect that users utilized depth cues 450
other than binocular disparity when viewing farther virtual targets as some studies have suggested that 451
depth information in VR does not solely rely on binocular disparity cues, and the type of visual cues 452
utilized is dependent on the type of task (Bradshaw et al., 2000; Hibbard & Bradshaw, 2003). It is likely 453
possible those visual cues not based on binocular disparity assisted in overcoming the incorrect 454
perceived position of the target location, specifically for the corners of boxes A and B (relative to box C). 455
Results of this study revealed that there is varying levels of user aiming accuracy and approach 456
angle due to target location, which provides some insights for future designs of visually mediated 457
objects in VR. It is important to account for user aiming inaccuracy by modifying the activation 458
boundary of virtual objects in order to provide users better experience when studying natural gestures 459
and manipulation of virtual objects. Moreover, user accuracy was lower for targets in the far horizontal 460
location and as well as close-up corners. Consequently, users performed better when they aimed at 461
corners that were not too far or too close. This result suggests that there may be a range that users 462
would best operate in for a target aiming task. 463
Page 26 of 31
Any virtually projected object on a screen should appear to be at that location, as there is no 464
virtual disparity (Ponto et al, 2013). As the virtual object moves away from the screen, the artifacts of 465
virtual reality become more pronounced (Woods et al., 1993). For instance, as the object comes farther 466
out from the screen, depth compression becomes a greater factor. Additionally, motion parallax will 467
increase as the object is closer to the user resulting in increased problems from any incorrect head 468
tracking/positioning (Cruz-Neira et al., 1993). Adjustment of the CAVE binocular disparity setting 469
relative to user IPD to account for differences in user binocular disparity individually might help reduce 470
some error, but the results of this study indicated that binocular disparity may be just one source that 471
contributed to user accuracy. Furthermore, individual IPD adjustments may not be feasible when 472
multiple observers are participating in a CAVE simulation. 473
Conclusions 474
Human performance in VR was less accurate (greater error) and less efficient than in the PE as 475
error was greater for both close and far virtual objects. Users approached the virtual and physical 476
targets (within 1 m) from similar angles. It is important to consider how the users approach and acquire 477
virtual objects within a distance range, which will help the researchers better understand the activation 478
boundaries of virtual objects and then manipulate VR that will allow more natural interactions. 479
Our data indicated that physical target error was not due to the target location or the postural 480
instability of the user reaching for the target because the magnitude of error was not affected by 481
distance to the target. We anticipate that farther virtual target error was associated with the awkward 482
reaching posture, and the closer virtual target error was associated with binocular disparity because 483
closer targets involved less awkward reaching posture. The evaluation of user perception of virtual and 484
physical objects provides some insights to user performance, which may contribute to future studies 485
involving natural interactions of hands and virtual objects in VR. 486
Page 27 of 31
Finally, we anticipate that other depth cues in addition to binocular disparity may be involved 487
with targeting farther virtual objects because users performed better than our prediction using a 488
geometric model. The geometric model accounted for the binocular disparity but did not take into 489
account all factors related to performance. For instance, other means of determining depth besides 490
binocular disparity could be to determine corner position. Future studies will aim to better understand 491
these factors. 492
Acknowledgement 493
Finding was provided from the University of Wisconsin-Madison Computation and Informatics in 494
Biology and Medicine program (National Institutes of Health), the Wisconsin Alumni Research 495
Foundation, and Wisconsin Institute for Discovery. 496
Key points: 497
• Virtual box errors were generally greater than physical box errors. 498
• Participants approached the physical and virtual box corners from similar angles, but the 499
variation increased as the distance from the user to the corner increased. 500
• Inaccuracy of the nearer virtual targets is associated to binocular disparity, and the inaccuracy of 501
the farther virtual targets is associated to user reaching posture. 502
• Task time was longer with the virtual trials. 503
Page 28 of 31
References 504
Alexandrova, I. V., Teneva, P. T., de la Rosa, S., Kloos, U., Bulthoff, H. H., & Mohler, B. J. (2010). 505
Egocentric distance judgments in a large screen display immersive virtual environment. Paper 506
presented at the 7th Symposium on Applied Perception in Graphics and Visualization, Los Angeles, 507
California. pp. 57-60. 508
Bajcsy, R., & Lieberman, L. (1976). Texture gradient as a depth cue. Computer Graphics and Image 509
Processing, 5(1), 52-67. 510
Bradshaw, M. F., Parton, A. D., & Glennerster, A. (2000). The task-dependent use of binocular disparity 511
and motion parallax information. Vision research, 40(27), 3725-3734. 512
Cruz-Neira, C., Sandin, D. J., & DeFanti, T. A. (1993). Surround-screen projection-based virtual reality: 513
The design and implementation of the CAVE. Paper presented at the 20th Annual Conference on 514
Computer Graphics and Interactive Techniques, Anaheim, CA. pp. 135-142. 515
Cruz-Neira, C., Sandin, D. J., DeFanti, T. A., Kenyon, R. V., & Hart, J. C. (1992). The CAVE: Audio visual 516
experience automatic virtual environment. Communications of the ACM, 35(6), 64-72. 517
Drascic, D., & Milgram, P. (1996). Perceptual issues in augmented reality. Paper presented at the 518
Electronic Imaging: Science & Technology. 519
Gordon, C. C., Churchill, T., Clauser, C. E., McConville, J. T., Tbbetts, I., & Walker, R. A. (1989). 1988 520
Anthropometric survey of U.S. army personnel: Summary statistics interim report (unclassified. 521
Natick, Massachusetts: unclassified. Natick, Massachusetts: U.S. Army Natick Research, 522
Development and Engineering Center) 523
Hibbard, P. B., & Bradshaw, M. F. (2003). Reaching for virtual objects: binocular disparity and the control 524
of prehension. Experimental Brain Research, 148(2), 196-201. 525
Interrante, V., Ries, B., & Anderson, L. (2006). Distance perception in immersive virtual environments, 526
revisited. Paper presented at the IEEE Virtual Reality Conference, Alexandria, Virginia. pp. 3-10. 527
Lampton, D. R., McDonald, D. P., Singer, M., & Bliss, J. P. (1995). Distance estimation in virtual 528
environments. In Proceedings of the Human Factors and Ergonomics Society Annual Meeting, 529
39(20), 1268-1272. 530
Liu, L., van Liere, R., Nieuwenhuizen, C., & Martens, J. -B. (2009). Comparing aimed movements in the 531
real world and in virtual reality. Paper presented at the IEEE Virtual Reality Conference, Lafayette, 532
Louisiana. pp. 219-222. 533
Magdalon, E. C., Michaelsen, S. M., Quevedo, A. A., & Levin, M. F. (2011). Comparison of grasping 534
movements made by healthy subjects in a 3-dimensional immersive virtual versus physical 535
environment. Acta Psychologica, 138(1), 126-134. 536
Page 29 of 31
Mather, G. (1996). Image blur as a pictorial depth cue. Proceedings of the Royal Society of London. Series 537
B: Biological Sciences, 263(1367), 169-172. 538
O'Shea, R. P., Blackburn, S. G., & Ono, H. (1994). Contrast as a depth cue. Vision research, 34(12), 1595-539
1604. 540
Ogle, K. N. (1953). Precision and validity of stereoscopic depth perception from double images. Journal 541
of the Optical Society of America, 43(10), 906-913. 542
Patterson, R. (1997). Visual processing of depth information in stereoscopic displays. Displays, 17(2), 69-543
74. 544
Plumert, J. M., Kearney, J. K., Cremer, J. F., & Recker, K. (2005). Distance perception in real and virtual 545
environments. ACM Transactions on Applied Perception, 2(3), 216-233. 546
Pollock, B., Burton, M., Kelly, J. W., Gilbert, S., & Winer, E. (2012). The right view from the wrong 547
location: Depth perception in stereoscopic multi-user virtual environments. Visualization and 548
Computer Graphics, IEEE Transactions on, 18(4), 581-588. 549
Ponto, K., Gleicher, M., Radwin, R. G., & Shin, H. J. (2013). Perceptual calibration for immersive display 550
environments. IEEE transactions on visualization and computer graphics, 19(4), 691-700. 551
Renner, R. S., Velichkovsky, B. M., Helmert, J. R., & Stelzer, R. H. (2013). Measuring interpupillary 552
distance might not be enough. Paper presented at the Proceedings of the ACM Symposium on 553
Applied Perception. 554
Sutcliffe, A., Gault, B., Fernando, T., & Tan, K. (2006). Investigating interaction in CAVE virtual 555
environments. ACM Transactions on Computer-Human Interaction, 13(2), 235-267. 556
Thompson, W. B., Willemsen, P., Gooch, A. A., Creem-Regehr, S., Loomis, J. M., & Beall, A. C. (2004). 557
Does the quality of the computer graphics matter when judging distances in visually immersive 558
environments? Presence: Teleoperators and Virtual Environments, 13(5), 560-571. 559
Walk, R. D., & Gibson, E. J. (1961). A comparative and analytical study of visual depth 560
perception. Psychological Monographs: General and Applied, 75(15), 1. 561
Wann, J. P., Rushton, S., & Mon-Williams, M. (1995). Natural problems for stereoscopic depth 562
perception in virtual environments. Vision Research, 35(19), 2731-2736. 563
Willemsen, P., & Gooch, A. A. (2002). Perceived egocentric distances in real, image-based, and 564
traditional virtual environments. Virtual Reality, 2002. Proceedings. IEEE, pp. 275-276. 565
Witmer, B. G., & Kline, P. B. (1998). Judging perceived and traversed distance in virtual environments. 566
Presence: Teleoperators and Virtual Environments, 7(2), 144-167. 567
Woods, A. J., Docherty, T., & Koch, R. (1993). Image distortions in stereoscopic video systems. Paper 568
presented at the IS&T/SPIE's Symposium on Electronic Imaging: Science and Technology. 569

Page 30 of 31
570
Page 31 of 31
Biographies 571
Karen B. Chen is a PhD student at the University of Wisconsin (Madison, WI) in Biomedical Engineering. 572
She has a BS degree (2009) and a MS degree (2010) from the University of Wisconsin (Madison, WI). 573
Ryan A. Kimmel has BS (2010) and MS (2011) degrees in Biomedical Engineering from the University of 574
Wisconsin (Madison, WI). He currently works for Abbott Laboratories (Lake County, IL). 575
Aaron Bartholomew is a Masters student at the University of Wisconsin (Madison, WI) in Mechanical 576
Engineering. He has BS degrees (2012) in Computer Science and Mathematics, and a BBA degree (2012) 577
in Business Management and Human Resources from the University of Wisconsin (Madison, WI). 578
Kevin Ponto is a post-doctoral researcher at the University of Wisconsin (Madison, WI) in Computer 579
Science. He has a BS degree (2004) from the University of Wisconsin-Madison, a MS degree from the 580
University of California, Irvine (2006), and a PhD from the University of California, San Diego (2010). 581
Michael Gleicher is a Professor at the University of Wisconsin (Madison, WI) in the Department of 582
Computer Sciences. He earned a B.S.E. degree (1988) from Duke University and M.S. (1991) and Ph. D. 583
(1994) degrees from Carnegie Mellon University (Pittsburgh, PA). 584
Robert G. Radwin is a professor at the University of Wisconsin (Madison, WI) in Biomedical Engineering, 585
Industrial and Systems Engineering, and Orthopedics and Rehabilitation. He has a BS degree (1975) 586
from New York University Polytechnic Institute, and he earned MS degrees (1979) and a PhD (1986) 587
from the University of Michigan (Ann Arbor, MI). 588