Manual on SAND DAMS in Ethiopia - SamSamWater · Manual on Sand Dams in Ethiopia ... Guideline for...
50
In cooperation with: Acacia Insitute, VU Amsterdam SASOL, Kenia Manual on Sand Dams in Ethiopia - A practical approach on sand dam site selection, design and construction. - A tool for combining sand dams with other rainwater harvesting structures. ERHA (Ethiopian Rainwater Harvesting Association) P.O. Box 27671/1000 Addis Ababa, Ethiopia Email: [email protected] Website: www.erha.com RAIN Foundation (Rainwater Harvesting Implementation Network) Donker Curtiusstraat 7-523, 1051 JL Amsterdam, The Netherlands Email: Website: www.rainfoundation.org Logo sasol
Transcript of Manual on SAND DAMS in Ethiopia - SamSamWater · Manual on Sand Dams in Ethiopia ... Guideline for...
In cooperation with: Acacia Insitute, VU Amsterdam SASOL, Kenia
Manual on Sand Dams in Ethiopia - A practical approach on sand dam site selection, de sign and construction. - A tool for combining sand dams with other rainwater harvesting structures.
ERHA (Ethiopian Rainwater Harvesting Association) P.O. Box 27671/1000 Addis Ababa, Ethiopia Email: [email protected] Website: www.erha.com
RAIN Foundation (Rainwater Harvesting Implementation Network) Donker Curtiusstraat 7-523, 1051 JL Amsterdam, The Netherlands Email: Website: www.rainfoundation.org
Logo sasol

1
Contents Manual on Sand Dams Introduction 6 1. Sand dam or subsurface dam 7 1.1 What is a sand dam or subsurface dam? 1.1.1 Definition of a sand dam
1.1.2 Functions of a sand dam 1.1.3 Types of sand dams 1.2 Hydrological principles of a sand dam 1.2.1 Filling of the sand dam aquifer 1.2.2 Water balance of the sand storage dam catchment
segment 1.3 Steps to sand dam construction 2. Site selection 12
2.1 Introduction 2.2 Potential catchments for sand dams 2.3 Selecting potential riverbeds
2.3.1 Community involvement 2.3.1 Physical criteria of a riverbed
2.3.2 Other criteria for site selection 2.4 Selecting riverbed section(s) and the sand dam location(s)
2.4.1 Storage capacity and extraction percentage of sand 2.4.2 Plan, longitudinal and cross profile of riverbed section
3. Water demand vs. water yield and impact assessme nt 20 3.1 Water demand vs. water yield 3.2 Impact assessment 4. Design 22 4.1 Introduction 4.2 Dam and spill way height
4.3 Spillway, wing wall and stilling basin dimensions 4.4 Wells or extraction points
5. Excavation and construction 26 5.1 Materials and Labor

2
5.1.1 Materials 5.1.2 Labor
5.2 The trench 5.2.1 Setting the trench
5.2.2 Excavating the trench 5.2 Construction of the dam
6. Maintenance and management 30 4.1 Training of local communities 4.2 Management 4.2 Technical maintenance 4.3.1 Repairing cracks and weak points in the dam 4.3.2 Cleaning of the outlet 4.3.3 Removing silt from the top of riverbed of the reservoir 7. The catchment approach: an example project of co mbining 33
water harvesting techniques in Borena

3
References:
- Beekman, H. E., Xu, Yongxin (2003), Review of Groundwater Recharge Estimation in Arid and Semi-Arid, Southern Africa, Environmental and University of the Western Cape, 16 p
- Borst, L., Haas, S.A. (2006), Hydrology of Sand Storage Dams, A case study in
the Kiindu catchment, Kitui District, Kenya. Master thesis, Vrije Universiteit, Amsterdam
- FAO (2005), New LocClim 1.06, Environment and Natural Resources Service (SDRN), Working paper No. 20 (CDROM)
- Gezahegne, W. (1986), Sub-surface dams for rural water supply in arid and
semi-arid regions of developing countries, Department of Civil Engineering, Tampere University of Technology;
- Hellwig, D.H.R. (1973), Evaporation of water from sand, 4: The influence of the
depth of the water-table and the particle size distribution of the sand, Journal of Hydrology, 18, 317 – 327 pp.
- Louis Berger International Inc. (1983), Arid and Semi-Arid Lands Development
Project, Kitui District Water Resources Study, Executive Summary, Government of Republic of Kenya
- Munyao, J.N., Munywoki, J.M., Kitema, M.I., Kithuku, D.N., Munguti, J.M.,
Mutiso, S. (2004), Kitui Sand Dams: Construction and Operation, SASOL Foundation
- Negassi, A., Bein, E., Ghebru, K., Tengnäs, B. (2002), Soil and water
conservation manual for Eritrea, Regional Land Management Unit (RELMA), Swedish International Development Coorperation Agency (Sida);
- Nissen-Petersen, E. (2006), Water from Dry Riverbeds, Danish International
Development Assistance (Danida);

4
List of attachments:
- Attachment 1: Check list for first and detailed site selection - Attachment 2: Probing the selected river section
- Attachment 3: Wall dimensions and reinforcement requirements for different wall
heights
- Attachment 4: Calculating the quantities of materials � has to be completed after field visit SASOL/Acacia
- Attachment 5: Guideline for sand dam construction � has to be completed after field visit SASOL/Acacia
- Attachment 6: Example project sand dam in Borena

5
Technical dictionary Storage capacity Extraction percentage Probing

6
Introduction Riverbeds have provided water since centuries. During extreme droughts, when all other water sources have dried up, water can still be found in riverbeds. Elephants, ant-eaters and some other wild animals have a special sense by which they can locate water in riverbeds. Rural people and most well-diggers know by experience that water can only be found at certain places in riverbeds. They can also give a rough estimate on how deep they have to dig to reach the water. Their knowledge is based on the fact that certain species of trees and vegetation must have roots reaching down and into the water-table in order to survive droughts. Sand dams are a very old technology which is said to have been practiced by the Babylonians more than 4,000 years ago. Extracting water from riverbeds is therefore nothing new, but the volume of water can be increased by constructing sand dams in the riverbed to create a larger reservoir. Rather that using only pockets of water found in these sandy rivers, man made barriers can be constructed. Some sand dams which were made more than 50 years ago in Kitui are functional to date with little or no maintenance (Munyao et al, 2004). Still an evaluation showed that many dams built in the last 40 years were not functioning properly (Nissen-Petersen, E., 2006). The major reasons for these failures are caused by insufficient knowledge of:
- Identifying suitable sites for dam walls and dam reservoirs. - Design criteria and flood dynamics. - Construction procedures. - Maintenance requirements.
This manual on sand dams is a guideline on all the above mentioned aspects on sand dams. It is based on published literature on sand dams and on the trainings during the pilot project on sand dams in Ethiopia “Water harvesting to improve livelihoods in southern Ethiopia: from pilots to mainstream”. A project by ERHA (Ethiopian Rainwater Harvesting Association), RAIN (Rainwater Harvesting Implementation Network), ACACIA Institute and SASOL. We would like to thank ACACIA Institute and SASOL for their input for this manual.

7
1. Sand dam or subsurface dam 1.1 What is a sand dam or subsurface dam? 1.1.1 Definition of a sand dam A sand dam is a partially subsurface dam build in a dry and sandy riverbed* onto bedrock or an impermeable layer. It is constructed across a river to block the subsurface flow of water, hence creating a reservoir upstream of the dam within the riverbed material. The main function of sand dams is to store water in the sand of the riverbed and therefore increase the volume of sand and water in riverbeds. The reservoir will be filled due to percolation of water during flood events. The water within the riverbed (reservoir) can be used for domestic use and livestock. Other functions of sand dams can be: sand harvesting, rehabilitation of gullies and groundwater recharge.
Figure 1: Schematic cross-section of sand dam (Source: Borst & Haas, 2006). * Dry and sandy riverbeds = Dry and sandy riverbeds are seasonal water courses that transport runoff-water from catchment areas into rivers or swamps once or a few times in a year. Dry riverbeds are also called ephemeral streambeds, seasonal water courses or sand rivers. Most of the rainwater being transported downstream in riverbeds appears as high flood events that can be up to several meters high.
8
1.1.2 Functions of a sand dam A sand dam can have several functions: 1) Increasing water supply by storing water in the sandy riverbed: Sand consists of small stone particles that originate from stones and rocks being broken down by the effects of rain and temperature variations. The spaces (or voids) between the sand particles can serve as a reservoir for water. When dry riverbeds are flooded, the air in the voids is pressed out by the water. This process is known as saturation (Nissen-Petersen, E., 2006). Sand dams increase the storage capacity of riverbeds by blocking the subsurface flow and/or increasing the depth of the sand within a riverbed. 2) Sand harvesting and rehabilitating of gullies: Sand dams can also be built in gullies to supply sand, while also rehabilitating the gullies. For example: 10 sand dams built in gullies harvest sand instead of the sand silting up Lake Victoria. The construction cost of the sand dams was recovered in less than 18 months through the sale of sand. If the purpose of building sand dams is to harvest sand and rehabilitate gullies, then weirs built of plastic bags filled with soil are more profitable (Nissen-Petersen, E., 2006). 3) Groundwater recharge: A series of sand dams in a cascade can create a continuous aquifer with an uplifted water level, hence a recharge of the groundwater. This can affect the environment in the surrounding area of the dam. 1.1.3 Types of sand dams Sand dams can be classified into four types depending in the materials used for their construction (Negassi, A. et al, 2002): 1) Masonry dams: consists of concrete blocks and stones. This type of dam can be easily constructed by local artisan. A masonry dam is also durable and suitable for any dam height. The dam is cheap when construction materials are available within the dam area.
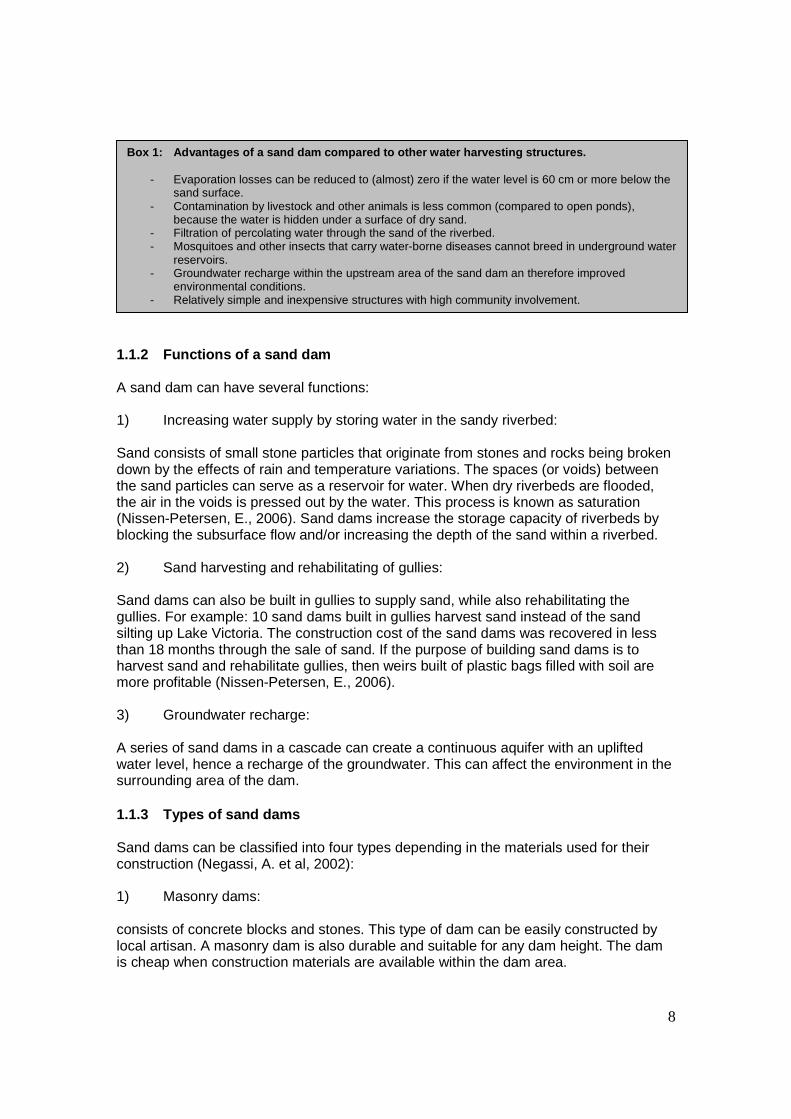
Box 1: Advantag es of a sand dam compared to other water harvesting structures.
- Evaporation losses can be reduced to (almost) zero if the water level is 60 cm or more below the sand surface.
- Contamination by livestock and other animals is less common (compared to open ponds), because the water is hidden under a surface of dry sand.
- Filtration of percolating water through the sand of the riverbed. - Mosquitoes and other insects that carry water-borne diseases cannot breed in underground water
reservoirs. - Groundwater recharge within the upstream area of the sand dam an therefore improved
environmental conditions. - Relatively simple and inexpensive structures with high community involvement.

9
2) Reinforced concrete dams: consists of a thin wall made of reinforced concrete. is a durable structure, relatively expensive but suitable for any dam height. 3) Earth dams: consists of impermeable soil material (mostly clay or clayey soils, or black soils). This type of dam is relatively expensive to construct and it requires special skill for its design and construction. An earth dam can easily be damaged and even destroyed by underground flow. Earth dams are not popular, are seldom used an only for minor works. 4) Geo-membrane dams: consists of impermeable geo-membrane. It is the cheapest of all types with regard to construction cost and no special skill is required for its installation. The geo-membrane material may be expensive, however. Next to different materials, a differentiation in different designs can be made: 1) Horizontal dam with u-shaped spillway:
This dam has been constructed in Kitui Kenya by SASOL. It has been built in a single stage and has a u-shaped spillway. The downstream area of the dam has been reinforced (concrete slab) to prevent erosion of the riverbed by the flood water. This design has been proven to be most effective and practical after many years of experience in Kitui, Kenya. Building in stages has not been necessary, because of the coarse sand within the catchments and the high riverbed slope (if more than 5%, silt will not settle).
(Source: Hoogmoed, M., 2006)
If a dam is build without stages, there is a possibility of settlement of silt in the reservoir. If the material within the catchment is coarse and the slope of the riverbed is high enough, settlement of silt can be neglected. SASOL has been building sand dams without stages for many years without settlement of silt in the reservoir.

10
2) V-shaped dam with spill way build in stages:
This dam with v-shaped weirs has been functioning for 50 years without failure. The spillway is raised in stages of 30 cm height above the level of sand deposited by floods to minimize sedimentation of fine material like silt (Nissen-Petersen, E., 2006).
(Source: Nissen-Petersen, E., 2006)
3) Horizontal dam with several spillways:
This dam has a double horizontal spillway. But because one spillway is higher than the other, one side of the spillway was heavily eroded by floods (Nissen-Petersen, E., 2006).
(Source: Nissen-Petersen, E., 2006)
In this manual we will focus on masonry dams with a reinforced foundation and a u-shaped spillway. After many years of practical experience and research on sand dam design by SASOL, this design has proven to be most effective, durable and easiest to be constructed by local community’s. 1.2 Hydrological principles of a sand dam 1.2.1 Filling of the sand dam aquifer Area’s suitable for the application of sand dams are characterized by heavy rainfall events, mostly during the night. Only a minor part of the rain will infiltrate in the soils on the slopes of the catchment, because these mainly consist of bare, low permeable clays and silts, and the slopes are poorly protected against erosion. Since the rainfall intensity is larger than the infiltration rate a large part of the rain will flow towards the riverbed as overland flow (Horton overland flow), either directly or via an uncontrolled gully or one of the tributaries. Since most of the land is bare at the start of the rainy season leaving the soils poorly protected against soil erosion, the silt and sand load in the water is high (Borst & Haas, 2006). The coarse sands in the riverbed will allow a rapid infiltration of the water into the sand. During the first few rain showers this will lead to a large and rapid increase in the groundwater level in the riverbed. The river will only flow for a short period during and shortly after the rains. As the rains continue during the wet season, the increased amount and velocity of the water will disturb the sediment in the riverbed, take the silts into suspension and discharge them downstream over the dam. The increased water level in the riverbed will induce a sideward flow of groundwater from the riverbed towards the riverbanks (see

11
figure 2). After a few weeks the water level in the banks has reached the same level as the water level in the riverbed and the sideward flow will stop. Once the rainy season is over, the water level in the riverbed will start to decline due to a number of reasons. Firstly a part of the water will evaporate from the sand. Since evaporation is decreased by 90% when the water level is at 60 cm below the sand surface, evaporation will only occur if the water level is less than 1 m below sand surface. Secondly water will flow slowly through the weathered top layer of the hard rock and through cracks and fissures in the hard rock. A part of this water will flow downward and recharge the deep groundwater. Another part might flow in longitudinal direction through the weathered top layer of the hard rock (shallow longitudinal base flow) or trough cracks in deeper parts of the hard rock (deep longitudinal base flow) and seep back up in the riverbed somewhere downstream of the dam. Thirdly, groundwater flow around the dam through the riverbanks and leakage through and underneath the dams is another component of loss from the sand reservoir. In the case of a series of cascading dams in one river, this water will return into a downstream sand storage dam aquifer and will remain available. Fourthly and finally, a significant part of the water will be extracted by humans and animals as drinking, cooking and irrigation water. The groundwater in the riverbed will however be replenished by slow groundwater base flow from the slopes. Part of the water from rainfall that has infiltrated into the soils will be evapotranspirated. The remaining part will flow as interflow (lateral movement of percolated water) towards the river and will reach the groundwater table. This groundwater will, under the influence of gravity, flow slowly down towards the river, recharging the groundwater in the riverbed. Because of evaporation and use of water from the riverbed, the water level in the riverbed will decrease more rapidly than the water level in the riverbanks. Once the water level in the riverbed is lower than the water level in the banks, base flow will start from the riverbanks towards the riverbed, increasing the volume of available water in the riverbed. The water level in the riverbed will continue to decline until the start of the next rainy season (Borst & Haas, 2006). 1.2.2 Water balance of the sand storage dam catchme nt segment To evaluate the fluxes of the hydrological cycle that might influence the performance of sand dams, insight in the water balance is essential. In the water balance described below, all potentially present fluxes are discussed so that it can be used as a guide in all situations. The main aim of evaluating the water balance is to determine the amount of water available for human use, and the effect of sand storage dams on this amount (Borst & Haas, 2006). Only the part of the catchment that directly drains to the part of the river between two dams is taken into account for this water balance. This makes the water balance independent of the location of the dam in the total catchment. The segment is also independent of variations in fluxes such as runoff and precipitation in the upstream part of the catchment. In this way the study can easily be repeated for other areas or catchment segments. To convert from mm to m3 in the following calculations, an accurate estimation of the catchment size contributing to the reservoir has to be made. A standard water balance consists of input (I), output (O) and change of storage (∆S):
I = O + ∆S

12
When it is assumed that the system is in equilibrium, then ∆S is 0 (zero) and the equation becomes:
I = O In the sand storage dam case fluxes within the system also occur, which will be quantified. Table 1 gives all inputs, outputs and fluxes within the system and the schematised system are given in figure 2. Input Fluxes in system Output Precipitation P Surface runoff from
slopes to river R Outflow from leakage
through and around dam L out
River discharge inflow over upstream dam
Qin Lateral base flow from recharge higher parts of the banks
Bs Evapotranspiration from hill slopes ET
Inflow from leakage through and around upstream dam
L in
Recharge from riverbed and banks to basement aquifer
Gr
Shallow and deep longitudinal base flow
Bl in Evaporation from riverbed E
Shallow and deep longitudinal base flow
Bl out
River discharge outflow over the downstream dam
Q out
Extractable water by people and animals
Up
Table 1: Overview of potential fluxes in catchment segment (Borst & Haas, 2006)
A basic assumption of the water balance set up here is that the reservoir behind the dam is empty at the start of the rainy period. In reality some water still may be in the reservoir.
Figure 2: Schematic image of the water balance where sand dams have been built in cascade (Borst &
Haas, 2006).
P
ET
E
B s
L outQout
Up
L in
Q in
G r
R
B l

13
Box 3: Fluxes within the system of a sand dam (see figure 2) R – Runoff on hill slopes Part of the precipitation that falls in the catchment segment will flow down as surface runoff (R) towards the river. This surface runoff is calculated using the runoff coefficient. Because rainfall intensities vary in different wet seasons, the runoff coefficient also varies. When the daily rain intensity in a wet season is smaller compared to other wet seasons, more water is able to infiltrate in the soil, leaving less water available for surface runoff. Surface runoff estimations carried out by Louis Berger International Inc. (1983) in the Kalundu catchment in Kenya estimated average runoff coefficients for 2 wet seasons on 50% and 30% (of total precipitation) respectively. Bs – Lateral base flow After the surface runoff has been lost from the total precipitation, the remaining part of the precipitation will infiltrate in the soil or evaporate immediately. The infiltrated part will evapotranspirate or recharge to the groundwater in the basement aquifer. The latter will flow down towards the river and add to the reservoir in the riverbed. This volume, called the lateral base flow (Bs), infiltrates through cracks in the upper part of the hard rock and on the surface of the hard rock. This volume will recharge to the groundwater and subsequently flow towards the river. In Kenya, Borst & Haas (2006) used a percentage of 0.25 % (of total precipitation) for Bs, but this is based on estimation.
Box 2: Input of water balance of a sand dam (see figure 2) P – Precipitation In this water balance the annual precipitation has to be separated into the distinctive wet seasons. The amount of precipitation falling in the wet period prior to the dry season can be used to store water into the upstream reservoir for use in the dry season. The average precipitation for each of the wet seasons in Ethiopia can be determined using New LocClim (FAO, 2005). Qin – River discharge inflow over upstream dam The inflow of surface water over dam Kwa Kangesa is a significant volume of water with respect to the other components. This volume can be determined by taking discharge measurements, or it can be estimated using the following formula (Manning):
Q = 1/n * A * R2/3 * S1/2 (see paragraph 4.3 for further explanation) L in – Inflow from leakage through and around upstream dam Sand dams and their foundations are not completely impermeable. A part of the water can flow underneath and around the upstream dam through the soil, adding to the reservoir of the downstream dam. However, the downstream dam will also have some leakage, which is subtracted from the study area. The water leaking from the downstream dam will add to the catchment segment downstream. The inputs by leakage through and around the upstream dam are assumed to be equal to the amount of outflow from leakage trough and around the downstream dam, so the net effect of this component is assumed to be zero. Bl in – Shallow and deep longitudinal base flow Upstream of a sand dam water may infiltrate in the hard rock and can flow through cracks and fissures, resurfacing downstream of the dam. This flow can occur both at shallow and larger depths. The input of longitudinal base flow from upstream infiltration is assumed to be equal to the output of locally originated base flow, so the net effect becomes zero, similar to the inflow and outflow through and around dams. N.B. It should be noted however that in a real situation the input will not be equal to the output due to local differences in dam construction, cracks in the hard rock, etc. For one dam the input will be larger than the output, while for another it will be the other way round. For a series of dams the net effect will be zero.

14
1.3 Steps to sand dam construction
This manual will guide you trough 5 basic steps of sand dam construction. These steps are: site selection, water demand vs. water yield & impact assessment, design,
Box 4: Output of water balance of a sand dam (see figure 2) Lout – Outflow from leakage through and around dam As discussed before, the inflow of leakage through and around the upstream dam is taken to be equal to the outflow of leakage through and around the downstream dam. ET – Evapotranspiration from hill slopes A part of the water on the hill slopes and in the soil will evaporate almost directly. A part runs off as surface runoff and a part infiltrates in the soil. Of this infiltrated water a part will recharge and the remaining volume will evaporate or be transpired by vegetation. Potential evapotranspiration in the dry season can be determined using New LocClim (FAO, 2005). In Kenya, Borst & Haas (2006) estimated that 99.75% of water in the soil that doesn’t recharge to the basement aquifer will evapotranspirate. Gr – Recharge from riverbed and banks to basement a quifer Water in the riverbed and in the banks will flow through cracks and fissures, recharging the basement aquifer. In literature values of around 30 mm per year are found (e.g. Beekman and Xu, 2003), but these are average values over large areas. Since water is present in the riverbed most of the time the recharge to the basement aquifer is expected to be much higher. In Kenya, Borst & Haas estimated a value of 100 mm per year. E – Evaporation from riverbed Water that accumulated behind the dam in the sand is also subjected to evaporation. Below a depth of about 60 cm evaporation is very limited. To calculate the evaporation from the riverbed some simplifications are made. First of all it is assumed for the ease of calculation that the water evaporates as if the waterlevel doesn’t lower due to use and other outputs, so evaporation is the only output. This means that the calculated evaporation will be slightly overestimated. Secondly if the evaporation is less than 60 cm deep, an average of 0.3 times the potential evaporation is taken to be a good measure. This value of 0.3 is about the average over the depth of 0 to 60 cm (Hellwig, 1973c). Then evaporation from the riverbed can be calculated using the following formula (Borst & Haas, 2006):
E = L x Wr x 0.3 x Epot x n
With: E = total evaporation from the riverbed (m3) L = length of river segment (m) Wr = width of river (m) Epot = potential evaporation (mm) n = porosity of the sand in the riverbed (%) Blout – Shallow and deep longitudinal base flow As discussed at the inputs, the outflow of the longitudinal base flow is assumed to be equal to the inflow. This holds true for a cascade of dams, in the case of a single dam the longitudinal base flow may constitute a significant loss. Qout – River discharge During rainy season the riverbed and banks fill up with runoff water. The rest of the runoff will leave the catchment segment as river discharge. In a research catchment in Kitui, Kenya (Borst & Haas, 2006) 2.3% to 2.5% of the total runoff produced is retained by the sand storage dams. Up – Extractable water For the use of water a distinct difference is made between the extractable water and the actual use. The extractable water is the volume that in theory could be harvested from the riverbed, and the actual use is the amount that according to local people is really used. This is further explained in paragraph 3.1.

15
excavation & construction and maintenance & management (see box 5). Each chapter will take you step by step through the different phases of constructing a sand dam. To keep this manual easy to read and understand, attachments have been added in which further detail is given to checklists, designing and mathematical aspects. 2. Site selection: from catchment to dam location
l
Box 5: Stepping stones in sand dam construction
Site selection
Water demand and Water yield
Design
Excavation and Construction
Maintenance and Management
1. Possibility map for sand dams (catchment level) 2. Fieldwork: collecting field data and verifying possibility map (catchment level) 3. Involving/organizing local community(s) 3. Fieldwork: taken measurements at potential riverbeds for sand dams (riverbed level) 4. Selecting location(s) for sand dam(s)
1. Getting baseline data from local community to determine water demand 2. Making rough estimation on water storage capacity of selected location(s) for sand dam(s) 3. Determining social, economic and environmental impacts of sand dam(s) within the catchment.
1. Calculating maximum discharge in riverbed 2. Calculating maximum dam and spillway height 3. Designing spillway, wing walls and stilling basin 4. Making total sand dam design 5. Bill of quantities (materials and labour)
1. Setting the trench based on design dimensions 2. Excavation of the trench 3. Construction of the dam
1. Training of local communities 2. Management 3. Technical maintenance
Impact assessment
16
2. Site selection 2.1 Introduction Site selection is the first and most important step in constructing a sand dam. The site selection will determine the success of the dam. It has two different aspects: selecting a suitable site based on both physical and social aspects of an area. This chapter will guide you through site selection by 3 steps:
1) Selecting potential catchments for sand dams from a possibility map for sand dams.
2) Selecting potential riverbeds for sand dams by combining the possibility map with field data (taking measurements along riverbeds and interviewing local communities).
3) Selecting riverbed sections and the sand dam location(s). 2.2 Potential catchments for sand dams For site selection it is important to first make a quick scan of the selected catchment or area by using digital or analog data. If available, the below mentioned data can be useful first site selection: 1) Topography, hydrology, drainage maps: By knowing the hydrological characteristics of a catchment, riverbeds can be selected where sand dams could be suitable. These have to be dry riverbeds (for a longer period(s) a year) and should preferably have a maximum width of 25 meter. Dry riverbeds can be classified into 3 classes (Nissen-Petersen, E., 2006) for potential water extraction through sand dams (or subsurface dams):
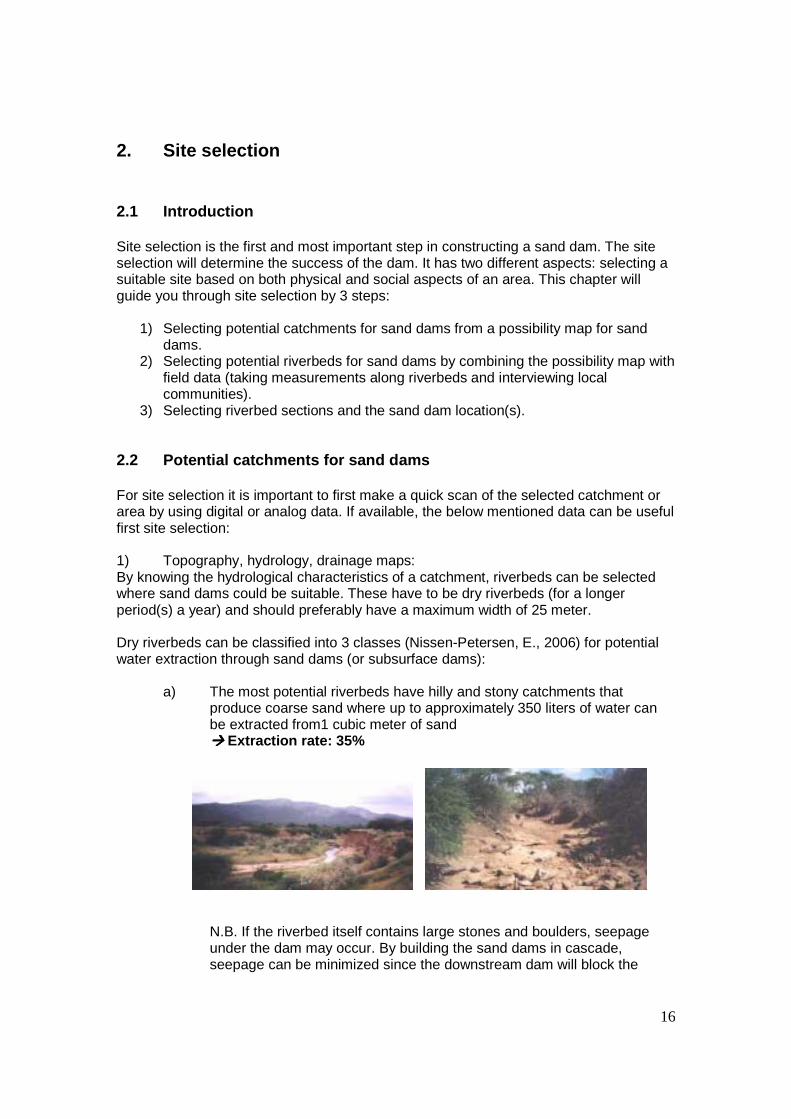
a) The most potential riverbeds have hilly and stony catchments that produce coarse sand where up to approximately 350 liters of water can be extracted from1 cubic meter of sand ���� Extraction rate: 35%
N.B. If the riverbed itself contains large stones and boulders, seepage under the dam may occur. By building the sand dams in cascade, seepage can be minimized since the downstream dam will block the

17
seepage water from the upstream dam. Nevertheless: when large boulders occur, special care should be taken to site selection.
b) Gullies originating from stony hills have a
potential for sand dams consisting of medium coarse sand where approximately 250 liters of water can be extracted from 1 cubic meter of sand ���� Extraction rate: 25%
c) Riverbeds having catchments of flat
(farm)land usually contain fine textured sand (or silt or even clay) that can only yield a maximum of approximately 100 liters of water from 1 cubic meter of sand ���� Extraction rate: 10% (or less)
2) Digital Elevation Model: An elevation model can give useful information on where to locate the sand dams, because a local drainage direction map can be derived from it (drainage pattern of a catchment) and it gives you information on the slopes within a catchment. The most suitable locations for sand dams have a slope gradient between 1.5 to 4 percent. In some cases sand dams can be constructed in areas with slope gradients up to 15 percent. The particle size of sediments accumulated along streams and in riverbeds is proportional to the slope gradient, whereas the depth and the lateral extent of these sediments are inversely proportional to the slope gradient. The optimum relation between these two factors is found on the gentle slopes between hills and plains (Gezahegne, W., 1986). 2) Soil data, geology, or satellite images: Soil data can give information on where to locate sandy areas within a catchment. By using aerial photographs and satellite images you can locate riverbeds by the morphology and reflection ratio of the sand. It also gives you a better understanding of the material within the catchment: hence the source of sand. 3) Precipitation and evaporation data: To calculate the yield of a sand dam, it is essential to know the climatologically behavior of an area. By getting data on precipitation and evaporation, a analysis of the dry and wet seasons can be made while in the same time a estimation can be made of the expected water harvesting potential. 4) Flood data: Flood data can be used for determining the maximum flood height and therefore the necessary height of the riverbanks (see also paragraph 2.2.1: criteria 2). It can provide information on the filling time of a reservoir and on the behavior of a catchment during rainfall.

18
2.3 Selecting potential riverbeds 2.3.1 Community involvement Community involvement is the process of sensitizing and mobilizing communities to improve the quality of their life through collective self-help. Many types of community organizations exist in a community at any particular time depending on the current needs, problems and aspirations. Before starting a sand dam project in an area, the community must be intensively involved in the whole process. This creates a feeling of ownership which will contribute to the success of the construction and maintenance of the dam. The construction of a sand dam is a collective effort, but there can be additional individual needs (like irrigation of specific land plots). Thus an organization with sensitivities which cater for collective as well as individual effort is required for a sand dam catchment development (Munyao et al, 2004). The usual procedure in organizing a community involves (Munyao et al, 2004):
- Organising an initial community meeting with the facilitation of the leader or head of the community: This is a get to know each other meeting. In this meeting both the community and the implementing organisation discuss the possibilities and conditionality’s of the anticipated sand dam project in the area.
- Deriving baseline data from the community: To effect a meaningful planning for an ideal volume of the sand dam(s), the community should provide data on the amount of people in the area, households, number of animals, distance to present water resources, distance and time to their present source of water. The baseline data gives the current development status of the community and forms a platform from which they can measure their progress (see also paragraph 3.1).
- Organizing an implementation committee: For each site, an implementation committee has to be formed. This committee consists of local people from the selected communities as the implementing organisation(s). Its duty is to mobilize resources, plan the site works, record progress, supervise and monitor the implementation process. The committee must on weekly basis monitor and evaluate the progress. This is important, otherwise the attendance will fall. The monitoring system also ensures compliance to the rules and regulations agreed for the site. These rules will eventually be used in allowing an individual to use the sand dam when completed. In the case of non-participants a pre-determined fee is paid to gain access to the sand dam.
Community involvement is an essential key for deriving valuable information on site selection. Local people are very well aware of the characteristics of the area they are living in. They can assist in getting the information as mentioned in the following paragraphs.

19
2.3.1 Physical criteria of a riverbed After making a potential sand dam map, it is necessary to verify the potential locations in the field by site surveys. During these site surveys the following criteria should be taking into account:
- A stony catchment area (source of sand) and sandy riverbeds: The potential catchment area should contain stones or stony hills. This can provide the source of sand that will be deposited into the sand dam reservoir. The riverbed within this catchment has to contain sandy material.
- Two high and strong riverbanks:
Suitable riverbeds must have two high riverbanks. During flood events the water should not leave the riverbed. If flood water is allowed to flow over the wing walls and riverbanks, it will erode the riverbanks and cause the river to change its course, thereby leaving the sand dam as a ruin in the riverbank. By using flood data and local information from local water bureau and community’s, the maximum water height during a flood event can be determined. The minimal height of the riverbanks should be:
Height of dam + Flood height + x* cm safety
* x is depending on regional circumstances and experience.
The riverbanks should consist of bedrock or a strong soil type to ensure a strong anchoring of the dam into the riverbanks (see also paragraph 4.4).
- A ( preferred) maximum width of 25 meter:
A riverbed width preferably doesn’t exceed 25 meters. The reinforcement required for such kind of long dam walls is too expensive; hence the sand dam will not be cost-effective.
- A minimum riverbed slope of 5%: The riverbed slope must be higher than 5% to ensure deposition of sand. Below 5% settlement of silt will occur.
- A impermeable (bedrock)layer: To ensure storage of water within the sandy riverbed, the dam has to be built onto solid bedrock or an impermeable layer. Otherwise the water will infiltrate into the subsurface layers.
- No fractured rocks or large boulders:
Dam walls should never be built on fractured rocks or large boulders because they can have cracks, which will drain water from the reservoir into the ground below.
- No salty rocks:
If salty rocks (white and pink mineral rocks) are situated in the riverbanks upstream of a dam, then the water may be saline and therefore only useful for

20
livestock. Local communities often know if there are any salty rocks, because livestock like to lick them for their salt content.
2.3.2 Other criteria for site selection Apart from the above mentioned physical properties of a catchment and potential riverbed for sand dams, the following criteria can indicate the water availability within a riverbed. These criteria are not obligatory for selection of a sand dam site, but can be good indicators for sand dam site selection. Local communities mostly have very good knowledge on these criteria:
- Presence of water-indicating vegetation: Vegetation that indicate the presence of water, can be growing on the banks where the reservoir will be located, as proof of the riverbed capacity to store water.
Botanical name Ethiopian name Depth to water -level (m below surface) Cyperus Rotundus 3 – 7 Vangueria Tomentosa 5 – 10 Delonix Elata 5 – 10 Grewia 7 – 10 Markhamia 8 – 15 Hyphaene Thebacia 9 – 15 Borassus Flabellierfer 9 – 15 Ficus Walkefieldii 9 – 15
Table 2: Water-indicating vegetation with root depth.
- Presence of waterholes: Waterholes (places where local community’s gets water from the riverbed), even temporary ones, should preferably be located where dam reservoirs are to be constructed to prove that the riverbed has no leakages draining water into the ground below.
- Presence of riverbed crossings:
Rural roads often cross riverbeds. Riverbed crossings can be made into sand dams capable of holding water upstream of the crossing.
Also socio-economic and ecological factors can determine the location of a sand dam (Negassi, A. et al, 2002). These are:
- Ownership of the dam site: The community has to be closely involved in selecting the sites for sand dam in accordance to user suitability and their knowledge of the most ideal sites for development to create and strengthen feeling of ownership for the sand dam. Within each confirmed site, the community has to elect a committee to supervise the implementation, operation and maintenance procedures (Munyao et al, 2004).

21
- Impact assessment:
To avoid conflicts, care should be taken in areas where the dam site is owned or used by two or more villages or individuals. The new sand dam shouldn’t lead water related problems for people living in downstream areas. A quick scan impact assessment has to be made of the area before starting the site selection, which include social, economic and ecological aspects. After completing the site selection, a detailed impact assessment can be made (see paragraph 3.2).
- Type, suitability and availability of construction material: This will help to decide what type of dam (as described in paragraph 1.2) to construct. Obviously a masonry dam is not a good choice if there are no stones in the area and transporting them from other areas is very expensive.
2.4 Selecting riverbed section(s) and the sand dam location(s) 2.4.1 Storage capacity and extraction percentage of sand Water storage and extraction depend on the riverbed material. Water extraction can be most profitable when extracted from riverbeds containing coarse sand than from riverbeds with fine textured sand. No water can be extracted from riverbeds containing silt, such as in sand dams whose spillways were built in stages higher than 30 cm. Silt and sand extractability was tested and classified as follows:
Silt Fine Sand Medium Sand Coarse Sand Size (mm) < 0.5 0.5 – 1.0 1.0 – 1.5 1.5 – 5.0 Saturation 38% 40% 41% 45% Water Extraction 5% 19% 25% 35%
Table 3: Sand fractions, saturation and extraction rates (Nissen-Petersen, E. 2006).
The porosity and extractable capacity of sand are found by saturating 20 liters of sand with a measured volume of water. The water is then drained out of the container and measured by removing a plug from the bottom of the container. By measuring the amount of water extracted and knowing the time of percolation, a good estimate can be made of the extraction rate of the riverbed sediment. 2.4.2 Plan, longitudinal and cross profile of river bed section The potential riverbed section(s) should be investigated in further detail for suitability for sand dams. This can be done by taking measurements of the riverbed dimensions along the selected river section. This data can be used for:
- Drawing a plan and profiles (longitudinal and cross-sectional) of the riverbed to identify the deepest place from which water should be extracted and the shallowest place where the sand dam can be constructed.
- Estimating the volume of sand in the reservoir and the extractable volume of water from the sand (chapter 3).
22
- Providing the required data for drawing the designs and estimating the costs of construction (chapter 4 and 5).
Figure 3 is an example of a plan. The plan shows information about the river length and width, locations of cross-sectional, longitudinal profiles, water-indicating trees and waterholes.
Downstream Upstream
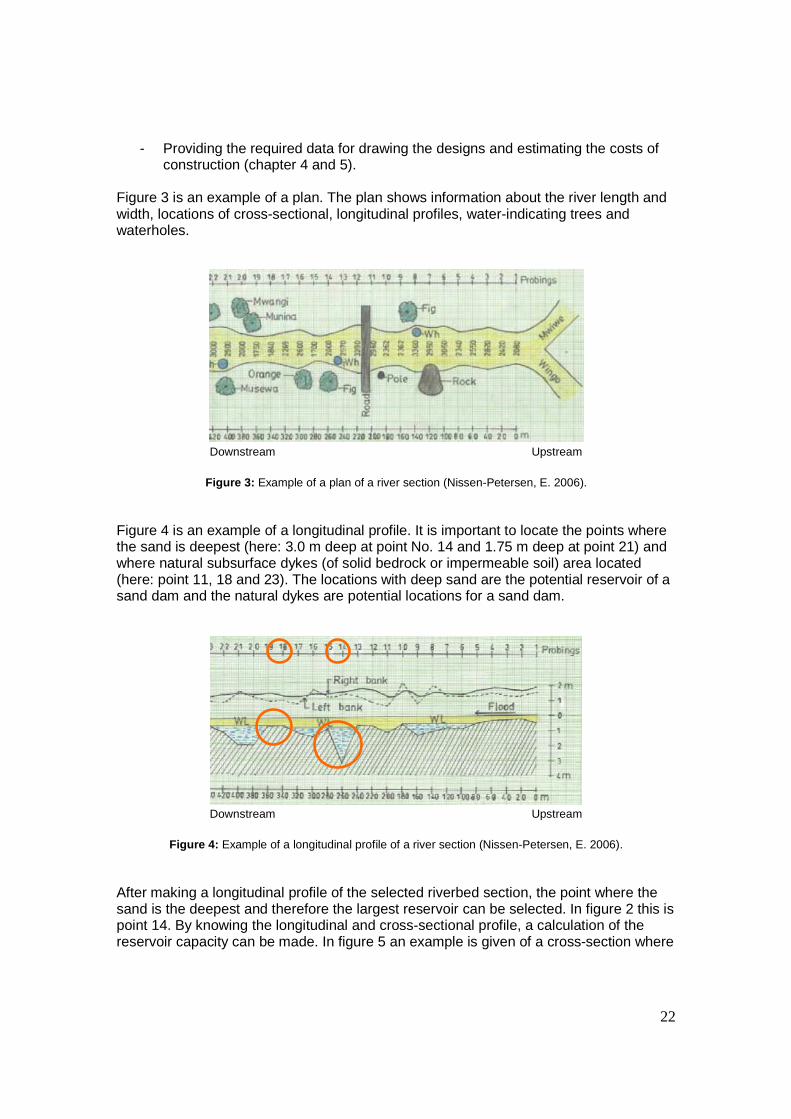
Figure 3: Example of a plan of a river section (Nissen-Petersen, E. 2006). Figure 4 is an example of a longitudinal profile. It is important to locate the points where the sand is deepest (here: 3.0 m deep at point No. 14 and 1.75 m deep at point 21) and where natural subsurface dykes (of solid bedrock or impermeable soil) area located (here: point 11, 18 and 23). The locations with deep sand are the potential reservoir of a sand dam and the natural dykes are potential locations for a sand dam.
Downstream Upstream
Figure 4: Example of a longitudinal profile of a river section (Nissen-Petersen, E. 2006).
After making a longitudinal profile of the selected riverbed section, the point where the sand is the deepest and therefore the largest reservoir can be selected. In figure 2 this is point 14. By knowing the longitudinal and cross-sectional profile, a calculation of the reservoir capacity can be made. In figure 5 an example is given of a cross-section where

23
the sand is deepest. It is important to take measurements every 1 or 2 meter across the riverbed to determine the riverbed morphology.
Figure 5: Table and cross profile of point 14 from figure 2 (Nissen-Petersen, E. 2006). The longitudinal profile showed that the natural underground dyke at point 18 is the most suitable for a sand dam (see figure 4). This is where the bedrock material or impermeable layer reaches closest to the surface. Therefore the excavation depth can be reduced which will reduce excavation time, manpower and material costs.
Figure 6: Table and cross profile of point 18 from figure 2 (Nissen-Petersen, E. 2006).

24
3. Water demand vs. water yield and impact assessme nt 3.1 Water demand vs. water yield Before starting the design of the sand dam, the water demand of the local community has to be known. The amount of water used by people for domestic purposes as drinking, cooking and cleaning, as well as for irrigation is assumed to remain the same all year around. The number of households benefiting from water from the dam reservoir needs to be determined. Also the water requirements of the individual households have to be carefully assessed on both domestic needs and the water requirements for irrigation or cattle. In table 4 an example of a water demand inventory report is shown. After determining the water demand it can be useful to increase the water demand by 10% (= expected community growth and/or predicted effects of climate change). Category Daily water demand
(liters/day/individual) Nr of beneficiaries
Annual water demand (m3)
Demand during 4 months without rain (m3)
Population 15 65 975 117 Livestock 10 100 365 122 Schools 5 30 55 18 Health Centers 10 30 110 37 Other community facilities 10 15 55 18 Total 55 240 1060 312
Table 4: Example of a water demand inventory report with a dry period of 4 months.
The amount of water which can be extracted from a sand dam reservoir (the water yield) can be calculated in two ways:
- By determining the water balance at the sand dam location (more precise method): see box 6;
- By determining the volume of the reservoir: see box 7. The water demand and water yield should be at least of the same amount. If not, it can be necessary to increase the water yield of the reservoir. This can be done by increasing the size of the reservoir, by building up the height of the sand dam or increasing the number of sand dams within the riverbed (cascade). These additional dams should preferably be constructed on natural underground dikes.
Water demand (m3) = Water yield (m3) + Volume of increased reservoir or additional reservoir(s) (m3)

25
Box 7: The water yield of the selected location of the sand dam can be roughly estimated by calculating the dimensions of the reservoir with the collected data from the longitudinal and cross-sectional profiles and the water extraction ratio of the sand. The sand volume (m3) can be calculated by: ½ (Depth of sand at sand dam location (m) * Length of the reservoir (m)) * average Width of the storage
bed (m) With:
Length of the reservoir (m) = (Depth of sand at sand dam location * 100)/ Slope of the riverbed (%) The water volume (m3) (= water yield) can then be calculated by:
Sand Volume (m3) * (water extraction (%)/100)
Box 6: The amount that can be harvested is the total of the amounts that can be yielded from the riverbed and riverbank plus the lateral base flow that adds to the amount in the riverbed during the season, minus evaporation from the riverbed and recharge to the basement aquifer (Borst & Haas, 2006):
U = Yr + Yb + Bs – E – Gr With: U = extractable water Yr = amount of extractable water from riverbed Yb = amount of extractable water from riverbanks Bs = lateral base flow E = evaporation Gr = leakage from riverbed Not all water present in the sediment can be harvested, because a small film of water remains around the soil particles. The amount that can be harvested is the specific yield. It should be noted that because a part of the water remains in the soil, during the next wet season only the specific yield has to be added to the reservoir to fill it up again, and not the volume of water equal to the total pore space. The amount extractable from the riverbed then equals (Borst & Haas, 2006):
Yr = L * Wr * Dr * Syr With: Yr = amount of extractable water from riverbed (m3/season) L = length of river segment (m1) Wr = average width of river (m1) Dr = average thickness of the riverbed (m1) Syr = specific yield riverbed (%)

26
3.2 Impact assessment Vulnerability Categories Vulnerability indicators Before dam
construction After dam construction
Agriculture # of cash crops 1.5 2.8 % irrigated crops 37 68 Special aspects Water collection Domestic (minutes) 140 90 Water collection Life Stock (minutes) 110 50 Gender Average walking distance women to water (km) 3 1 Economic Income (US$./year) 230 350 Health % households suffering from malnutrition 31.6 0
Table 5: Measured social and economic impacts of sand dams in the Kitui region, Kenya (Thomas, 1999). >
Remko?

27
4. Design 4.1 Introduction After determining the water demand and the water yield (roughly) at the selected location, the design of the sand dam can be made. There are different approaches in designing a sand dam, but this manual will focus on the designing approach of SASOL. There are 4 different parts within a sand dam:
� The dam; � The spillway; � The wing walls; � The stilling basin.
In the next paragraphs the design of each part will be addressed. Some of the sand dam dimensions are fixed in the SASOL approach. Therefore a summary of designing criteria from other engineers is given (Nissen-Petersen, E. 2006) to give some more background to the fixed values used by SASOL (see also attachment 3):
- The width of the base should be 0.75 (3/4) of the height of the dam and the thickness of the key of the wing walls should be 0.55 of the height of the dam: to counter balance the force of the water and sand in dam reservoirs against the dam.
- The width of the crest and its height on the downstream side should be 0.2 (1/5) of the height of its dam wall.
- The front of the dam should leaning downstream with a gradient of 0.125 (1/8) of the height of the dam.
4.3 Dam and spill way height When determining the dam and spillway height at the selected location, it is very important that the water level and flood line (in figure 5: New WL and New FL) remain below the riverbanks after construction of the dam, or that flooding will not lead to problems up- or downstream of the dam. If the flood level is higher than the riverbanks (Bh), construction of a dam is not advisable.
With: Old WL = old waterline New WL = new waterline (after sand dam construction) Old FL = old flood level New FL = new flood level (after sand dam construction)
Figure 5: Example of a cross-sectional profile at a dam location (Nissen-Petersen, E. 2006).

28
The maximum discharge can be calculated in 2 different ways:
� Calculating the maximum discharge by the highest peak level (known by flood marks on the banks or information from local community’s)
� Calculating the discharge at the selected location by using a certain return period (for example: a rain event which happens once every 25 years) within the catchment area (by using a rainfall-runoff model or a mathematical formula for catchment runoff).
In this manual we will use the discharge determined by the maximum flood level. This method has been used very successful in Kitui region, Kenya by SASOL for many years. In the picture above you see a cross-section at a dam location, with the different parameters that have to be known to calculate the maximum discharge. 4.4 Spillway, wing walls and stilling basin dimensi ons The maximum discharge (as calculated in paragraph 4.2) can be used to determine the spillway dimensions. The formula is given in the box below.
Maximum discharge in riverbed section:
Q = 1/n * A * R2/3 * S1/2 Q = maximum discharge in riverbed section (m3/s) n = Manning roughness of riverbed A = wetted cross-sectional area (m2), by: ½*(channel width + riverbed width)* flood height P = wetted perimeter (m), by: B1 + riverbed width + B2 R = hydraulic radius (m), by: A/P S = slope of riverbed (m/m)

29
When determining the distance the wing walls go into the banks, bank characteristics have to be taken into account (Munyao et al, 2004):
- in loose riverbanks: approximately 7 meters into the riverbanks; - in hard soils: approximately 5 meters into the riverbanks; - in hard and impermeable soil: approximately 0 – 1 meter into riverbanks; - in rock formation: no need of constructing in riverbanks.
The length of the wing wall (Lw) should be approximately 2 meters into the riverbanks. The length of the wing wall extension (Lwe) should be approximately 5 meters. This is an example of wing wall dimensions in loose riverbanks. Currently a research is done by SASOL and ACACIA Institute on the water balance at sand dams, which will lead to more specific guidelines on wing wall dimensions.
Spillway dimensions Q = c * Ls* H
3/2
Q = maximum discharge in riverbed section (m3/s) c = 1,9 (constant depending on spillway shape, here: broad crested weir) Ls = length of spillway (m) H = height of spillway (m)
Legend of cross -sectional profile width dimensions sand dam Gf = gross freeboard (m) Lw = length wing wall (m) Hf = height freeboard (m) Lwe = length wing wall extension (m) Hd = total height of dam (m) Hs = total height of spillway (m) Ls = length spillway (m)
River bed level before construction

30
Stilling basin goes up to dam and not under dam. Bo dy under dam has same material as dambody
4.5 Wells or extraction points A maximum of 3 wells should be located on the upstream side and very close to the dam embankment (within 3 – 10 meter). It can be located either in the stream bed or on one side of the stream bed. If it is located in the stream bed, it must be protected from siltation by keeping its height about 0.5 – 1 meter below the surface of the riverbed. The top must be covered with a concrete slab, and water can be extracted with a motor pump or hand pump. An outlet can have several functions: to collect water, to drain the reservoir for maintenance purposes and to control and supply water to downstream users. An outlet can be installed as a perforated concrete pipe 20 – 50 meter upstream of the dam at the
Legend of cross -sectional profile length dimensions sand dam Hd = height of dam (m) Sl = length of stilling basin (m): 0.1 m Fh = height of foundation (m) Sh = height of stilling basin (m): 0.5 m Fl = length of foundation (m) Lt = length of top of dam (m) Ah = height of anchor (m): 0.4 m Lb = length of base of dam (m): 1 m Al = length of anchor (m)
Stilling basin dimensions SL = c * L1/3 * H2
1/2 SL = length of stilling basin (m) c = 0,96 (constant) H2 = height of freefall (m): height of water level upstream – height of water level downstream

31
required depth (just above the impermeable layer). The pipe should be covered fully with filter material to prevent entry of sand and silt into the pipe that may block it. Different sizes of sand and gravel are normally used. Include SASOL pump design: Julius!

32
5. Excavation and construction 5.1 Materials and Labor 5.1.1 Materials The types of materials needed to construct a sand dam depend on the type of dam (paragraph 1.2) that is found most suitable at the selected location. This depends on physical properties of the catchment and on the materials available. If stones and sand can be found within the area of the sand dam, this will reduce the costs (of materials and transport). In this chapter we will focus on the bill of quantity for reinforced masonry dams.
Reinforcements bars are optional for concrete dams or high dams (ask SASOL), mostly not necessary for masonry dams. Make reinforcement up to top of dam a nd change slap to slab
Construction materials masonry sand dam Stilling basin:
� 1:3 mortar � Large boulders
Dam: � 1:4 mortar with well interlocked stones, ratio cement:sand:hardcore = 1:4:9-12 � Upstream wall and top of dam plastered with 1:3 mortar (30 mm)
Foundation: � 1:3 mortar foundation (100 mm) � 1:4 mortar with well interlocked stones, ratio cement:sand:hardcore = 1:4:9-12 � (reinforcement bars of barbed wire (400 mm spacing))

33
Description Unit Quantity Unit cost (Birr) Total cost
(Birr) Value of community contribution (Birr)
Bags of cement 50 kg bags 250 River sand Tonnes 150 - Hardcore Tonnes 120 - Water 50 liter
container 30 -
Barbed wire 20 kilogram roll 4 Iron bars (12 mm) Meter 30 Iron bars (8mm) Meter 30 Cost of Material Hardware lorry loads 7 Tonnes Tractor trailer loads 3 Tonnes Cost of Transport
Table 4: Example of a bill of quantity for materials and transportation costs.
In attachment 4 you will find the guidelines to calculate the quantity of the materials derived from the dimensions of the dam. 5.1.2 Labor In table 5 an example is given of the bill of quantity for labor costs. As is mentioned before in paragraph 3.2.1, the contribution of community workers will reduce costs. Description Unit Quantity Unit cost (Birr) Total cost (Birr) Value of
community contribution (Birr )
Surveyor/Designer 1 10 days Supervisor 1 18 days Contractor 1 42 days Artisans 4 40 days Community workers 15 40 days Cost of labour
Table 5: Example of a bill of quantity for labor costs.

34
5.2 The trench 5.2.1 Setting the trench This is marking the position and the size of the dam taking in to account the size of the wing walls and working space during construction. To estimate the size of the trench, the following should be taken into account:
- Measure the appropriate distance from on one of the river banks depending on bank characteristics and fix a peg at the distance.
- Fix another peg across the river perpendicular to the river course at the appropriate distance.
- Use a plumb bob and line mark several points from the building line and fix pegs. The marked trench should resemble the figure shown below.
P 7 P8 P 9 P 10
60cm Building line
P 1 P 3 P 4 P 6 P 5 P 2
River course
Figure 6: Example of setting a trench with pegs (Munyao et al, 2004). 5.2.2 Excavating the trench The marked trench is dug guided by the building line (see figure 6). The depth of the trench is guided by the depth of impermeable material in the ground to avoid seepage below the wall. When scooping, the scooped material should be placed downstream to avoid filling the reservoir upstream. If the dam is build into bedrock material, it is advisable to cut a trench into the rock to ensure a secure jointing of the rock and mortar. Investigations should be carried to avoid fractures and areas of weathering. This can be done by poring water on the suspected weathered zones. The rock surface should be cleaned to avoid missing the fractures and areas of weakness. If clay or marrum??? is discovered, it should be dug into for about 0.5 m to avoid seepage. After these conditions are met, the trench is ready for dam setting and construction (Munyao et al, 2004). 5.3 Construction of the dam Construction starts with putting in place the reinforcement columns vertically in the trench, which is followed by laying the foundation blinding slab. After this the second

35
horizontal reinforcement layer is placed. This is flowed by the second foundation blinding slab and then the actual masonry structure (of hard core and mortar) starts (Munyao et al, 2004). In attachment 5 you will find a detailed guideline for construction of a sand dam.

36
6. Training, management and maintenance ���� This chapter has to be updated with the field experience of AFD and ERHA in past projects and the Swiss Re project in Borena 6.1 Training of local communities Training methodology is based on carefully selected guiding questions to facilitate group discussions. It creates a forum for the community to critically examine their situation, identify their problems and suggest possible solutions. The community then can make a plan of action to tackle their problems by implementing suitable solutions according to a defined order, to achieve their goals and aspirations. The training of local communities can be divided in 4 different aspects (Munyao et al, 2004):
- The training and installation of a Implementation Committee: This had already been explained in paragraph 2.2.
- A Sanitation and Hygiene training: This training purposely deems to dialogue with the community awareness of possible contamination of their water source. Water can be a medium for spreading diseases. This training takes 5 days??? and is based the Water Quality guidelines produced by ERHA and RAIN and water quality guidelines from the WaSSH program??? Each site gives 5 participants for this training. The participants will be provided with the necessary information on sanitation and hygiene aspects.
- A Natural Resource Management training: Effective management of natural resources is the path to improve living standards. This trainings aims to facilitate ways and means of developing these resources. The natural resource management is designed as a 5 day training. The training is held at a community facility. Each site elects 5 participants for attendance of the training. With the help of a questionnaire the community gathers the necessary information about their available natural resources. They then, explore ways and means of utilizing their natural resources to create wealth. For example: a shortage of water during a dry season will lead to less crop production. Increasing the availability of water during this season and proper management of this water will lead to increased crop production. This enhanced productivity will lead to improved food availability and incomes. By the end of the training each village develops a comprehensive list of the natural resources found in their village. They compile the possible ways and means of using their resources to reduce poverty and create wealth in a action plan.
- A Project Management training: This training facilitates the community to explore what factors lead to failed projects and which factors make successful projects. The failure creating factors can then be avoided, whereas, the success promoters can be embraced. It examines the role of social structures, community institutions, processes and their interactions with other institutions for mutual benefits. For 5 days, 5 participants from each site meet at a village facility to discuss on these issues.
37
Using a questionnaire, the village makes gathers the information of the projects undertaken in the village in the past 5 years. For each project an analysis of success or failure is made. Then a division is made between successful and failed projects by listing the success and failing factors. Discussion on factors of successful leads to a definition of concrete principles of future projects for success. On the other hand it gives pitfalls which must be avoided to achieve success. For example, it is important to avoid conflict in projects; however, the community must be ready to resolve conflicts as it is likely to occur due to human differences. By the end of this training the village prepares an action plan. This outlines how future projects will be handled in the village to ensure success and minimize failure. It also highlights what community institutions promote success and how and where to get help from other organizations.
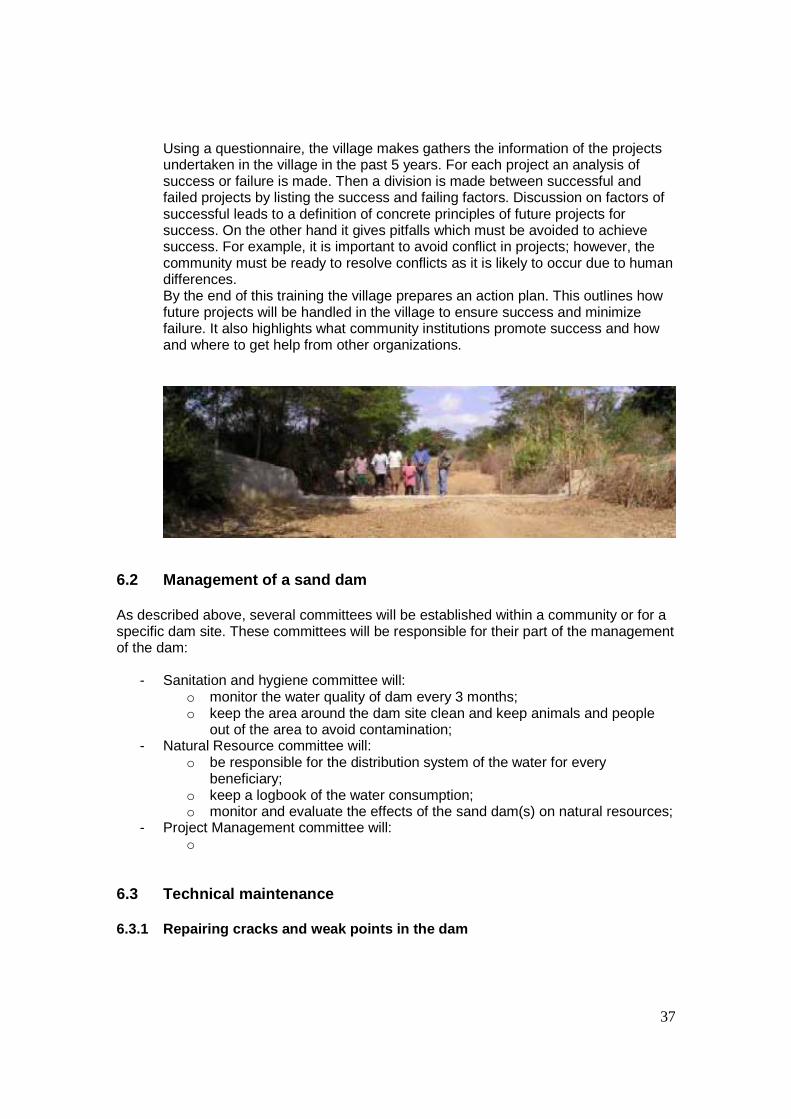
6.2 Management of a sand dam As described above, several committees will be established within a community or for a specific dam site. These committees will be responsible for their part of the management of the dam:
- Sanitation and hygiene committee will: o monitor the water quality of dam every 3 months; o keep the area around the dam site clean and keep animals and people
out of the area to avoid contamination; - Natural Resource committee will:
o be responsible for the distribution system of the water for every beneficiary;
o keep a logbook of the water consumption; o monitor and evaluate the effects of the sand dam(s) on natural resources;
- Project Management committee will: o
6.3 Technical maintenance 6.3.1 Repairing cracks and weak points in the dam

38
Sand dams require careful maintenance, and immediate repair, as flooding causes hundreds of tons of water to fall over the dam wall and onto the spill-over apron. Flood water may also spill over and erode the wing walls and, perhaps, even over the riverbanks during heavy rains. Also changes in temperature can cause the structure 63.2 Cleaning of the outlet It is very important that the outlet isn’t blocked with silt of other fine textured material. Therefore during construction it is always important to have a good access to the outlet construction. Blocking of the outlet can be prevented by the designing criteria as mentioned in paragraph 3.2.3. Also cleaning of the riverbed after a flood, can prevent silt from blocking the outlet. 63.3 Removing silt from the top of riverbed of the reservoir The riverbed of the reservoir has to be cleaned: rocks, branches, leaves, dead animals, animal dropping and fine textured material can reduce the capacity of the dam, lead to blocking of the reservoir and outlet or cause, causes damage to the dam structure and lead to contamination of the water within the reservoir. Debris like rocks, branches, leaves and sediment are usually deposited after a flood event, so the time of inspecting is well known. But dead animals, animal dropping and other debris can be deposited any time. It is wise to have a strict schedule for inspection of the dam and its surroundings.

39
7. The catchment approach: an example project of co mbining water harvesting techniques in Borena, southern Eth iopia
At least 89% of Ethiopia’s population continues to reside within rural areas. As many as 88% of these people do not have access to safe water, having no choice but to utilize potentially harmful sources of water. A considerably higher proportion of rural inhabitants have inadequate access to water, struggling each day to produce sufficient to meet their basic needs. The Borena Zone in southern Ethiopia is a semi-arid region in which rural communities depend on small-scale agriculture and livestock farming (mostly pastoralists). Both activities are highly constrained by water availability, there being no perennial rivers and with rainfall varying highly, both spatially and temporally. Children in this region have the lowest school enrolment rate in the country, spending substantial amounts of time in collecting water and in addition to other domestic tasks. A reliable nearby source of water frees up time previously spent by children and women in water collection, resulting in improved school attendance and women’s involvement in social and economic activities. Such water-enabled opportunities empower people to improve their livelihoods, providing them with more security and new choices. Water harvesting has proven to be an attractive decentralized water source in areas where other means of water supply have little potential, with these being remote or because groundwater is inaccessible or not potable. The project in Borena will increase access to a reliable source of water for at least 10 communities in the critically dry Borena Zone of southern Ethiopia. An innovative combination of infrastructure, to harvest rain and surface runoff water, will ensure drinking and productive use water in the short- and long-term for communities living both adjacent to an ephemeral watershed (by sand dams) and those further away (by rainwater harvesting tanks). It is the combining of centralized sand dams with decentralized tanks in one catchment (see figure 7).
Figure 7: Hypothetical example of catchment approach in rainwater harvesting: combining sand dams and
rainwater harvesting tanks in one (sub)catchment.
Rwh tank with 2 hour walking radius (one way)
Sand dam with 2 hour walking radius (one way) if rwh tank is empty (during unexpected long dry season, water from sand dams can be used

40
Attachment 1: Check lists for first and detailed si te selection Criteria for first site selection : compulsory optional A stony catchment area (source of sand) and sandy riverbeds x A sandy riverbed x Two high and strong riverbanks x A maximum width of 25 meter x No fractured rocks or large boulders x No salty rocks x Presence of water-indicating vegetation x Presence of waterhole x Presence of riverbed crossings x Type of community structures within in the area, possible conflicts etc.
x
Type, suitability and availability of construction material x Steps for detailed site selection: compulsory Measuring the water extraction rate of potential riverbed(s) section(s) x Making a plan of the potential riverbed(s) section(s) with information on the river length and width, locations of cross-sectional and longitudinal profiles, water-indicating trees and waterholes
x
Making a longitudinal profile of the potential riverbed(s) section(s) by probing (see attachment 2)
x
Making cross-sectional profiles of the potential riverbed(s) section(s) by probing (see attachment 2)
x
Selecting different points in the riverbed section in which the sand is the deepest (potential reservoirs) and in which the natural underground dykes are most shallow (potential sand dams locations)
x
Selecting the point where the sand is the deepest and therefore the largest reservoir can be selected
x
Selecting the point where the underground dyke is most shallow and therefore the location of the sand dam
x
Making a cross-sectional profile of the potential sand dam location x

41
Attachment 2: Data collection for the selected rive r section The tools required for simple surveys as follows (Nissen-Petersen, E. 2006):
- Measuring rods made of 16 mm (5/8”) iron rods for measuring depths of sand. Notches should be cut in the probing rods for every 25 cm to collect sand samples when the rods are pulled up.
- A circular leveling tool made of a transparent hosepipe for measuring the gradients of riverbeds.
- Two long tape measures, one hanging down vertically from the horizontal one, to measure width and depth of riverbeds.
- A tripod ladder for hammering long probing rods into the sand. - A mason hammer. - A 20 liters jerry can with water. - Half a dozen of transparent plastic bottles with water. - A knife and writing materials, - A Data Sheet as shown below.
Example of a Data Sheet:
Measurement nr.
Distance between measurements (m)
Width of riverbed (m)
Depth to water (m from surface)
Depth of the sand (m from surface)
Type of sand
Type of bedrock or soil under the sand
Height of the riverbank (m)
Items seen on the riverbanks
Left
Right
1 0 20.8 - 0.5 Medium Clay 1.5 1.9 Acacia tree
2 20 24.2 - 0.6 Fine Clay 1.0 1.6 3 20 28.2 - 0.7 Medium Clay 1.4 1.84 Waterhole 4 20 25.5 0.30 1.25 Medium Rock 1.3 1.7 5 20 19.5 - 0.8 Coarse Rock 1.4 1.65 Figtree 6 20 21.3 - 0.7 Coarse Clay 1.4 1.7 7 20 18.6 0.8 1 Medium Clay 1.97 1.55 8 20 17 1.2 1.3 Coarse Clay 1.3 1.64 Rock

42
Attachment 3: Wall dimensions and reinforcement req uirements for different wall heights (Negassi, A. et al, 2002)
Reinforced concrete and masonry dams: Height of the wall (m)
Thickness (m)
Reinforcement bar diameter, main (mm)
Reinforcement bar diameter, tie (mm)
Top Bottom Diameter Spacing Diameter Spacing < 1.5 0.15 0.15 10 200 8 200 1.5 – 3 0.15 0.25 16 210 8 220 3 – 4.5 0.15 0.35 20 155 10 150 > 4.5 0.15 0.45 20 95 10 130
Masonry dams: Dam height (m) Wall thickness (m)
0 – 1 0.5 1 – 2 1.2 2 – 3 1.7 3 – 4 2.2 4 – 5 2.7

43
Attachment 4: Calculating the quantities of materia ls ���� update, rewrite and simplify this with field data from Swiss Re project. AFD and ERHA have to closely monitor the process of designing in the field List of materials
Material Units 1. Cement 50 kg 2. Barbed wire g16 in rolls 3. Reinforcement bars 12.5 mm by 12m 4. Reinforcement bars 6.25 mm by 12m 5. Wire nails 100mm pieces 6. Cypress timber 50mm by 50mm 7. Polythene paper Rolls 8. Hard core tones 9. Sand tones 10. Water liters 11. Unskilled labor Man-day 12. Skilled laboring, Man-days 13. Supervision Man-days.
1) Cement (bags of 50 kg)
Total Volume of Cement in Masonry = VBFVswVw ++(14
1
Mass of cement = VBFVswVw ++(14
l
Bags of Cement = VBFVswVw ++×
(5014
1440)
Cement in Masonry = 2(Vw+Vsw+VBF) Cement is also in Ve, Vus, Vb, VPBF (Mixing ratio 1:3)
Bags of cement = 50
4
1×ceml
(Vsw+Vc+Vus+Vb+VpBf)
= )(1450
1440VpbfVbVusVcVsw ++++
×
Cement in Mortar = 7.0(Vc+Vus+Vb+VpBf) Total cement requirement = 2(Vw+Vsw+VBF)+ 7.0(Vc+Vus+Vb+VpBf) 2) Hard Core (Tonnes)
9/14 x Total volume of H/c Total volume of hard core = Hardcore in main wall = Hardcore in spillway = hardcore in back flow

44
VH/C = 9/14 (Vw+Vsw+VBF)
Tones of Hardcore =1000
/.
14
9 cPhcVh ××
Tones of H/C in Masonry = 1.4(Vw+Vsw+VBF)
3) Sand (Tonnes)
- Sand in masonry. - Sand in mortar.
Tones of sand in masonry = 4/14 ¥ sand/1000(Vw+Vsw+VBF) ¥ sand
=1600 = 0.5(Vw+Vsw+VBF
Tones of sand in mortar (1:3) = 3/4ρ sand/1000(Vc+Vus+Vb+VpBF) ρ sand=1600. (Vc+Vus+Vb+VpBF) Total tones of sand=0.5(Vw+Vsw+VBF)+0.3(Vc+Vus+Vb+VpBF) 4) Reinforcement Bars Types of reinforcement bars used:
- Round bar 12 mm diameter and length of 12m - Round bars 8 mm diameter and length of 12m
Spacing columns. Columns are spaced 2m side to side. No of columns=Ld/2-1 Note that it is unwise to place columns at the extreme like it done in fencing posts. That is why we use.
Total length
No of R12.5mm= No of columns x 4 x De .
DeLd
4)12
( −
Number of pieces of R12. = 12
(12
4 −LdDe
Note: One piece of reinforcement bar=12m.
∴= )12
(33.0 −LdDe
Example: When De=2.0m, Ld=20m
Number of R12.5 bars = 0.33 x 20( 12
20 − )
=6.60-0.66 =5.94. Length of one ring of R 6.25 0.4 0.4 0.4 0.4
=0.4 x 4=1.6.

45
5) Barbed Wire
Gauge 16, Length=610m, Spacing= 0.45
Average strands=10
Total length of barbed wire= 10 x Ld
No of layers of Barbed wire =45.0
De
Total length of Barbed wire = 45.0
.10 DeLd
No of rolls of Barbed wire = 61045.0
.10
x
DeLd
No of rolls of Barbed wire = 0.04 LdDe
Example: Ld=20, De =2 No of rolls of barbed wire= 0.4 x 20 x 2 = 1.6
6) Nails
1 kg on nails should be enough.
7) Timber
An average dam requires about 15m of cypress timber 50mm x 50 mm. A bigger dam may require about 30m of the timber.
Number of rings per average columns
= DeDe
Spacing
De2
5.0==
Total length of R6.25 =Length per Ring x No of Rings per average column x No of columns.
=1.6(2De+1)( 12
−Ld)
= )12
2(6.1 ++− LdDeDeLd
No of R6.25
=12
6.1)1
22( ++− Ld
DeDeLd
=0.13 )12
2( ++− LdDeDeLd
Example:
Ld=20, De=20.
=0.13 )12
20)22()220( +−− xx
=(5.2 –0.52+1.3+0.13) =6.11 NB: 0.13 can be Negligible. Hence
No of R 6.25=
0.13 )12
2( −−− LdDeDeLd

46
8) Water (litres)
Litres of water = 1.8* VT * 200 With: VT = total volume of the dam (m3) NB. From experience 1m3 of a dam requires 1.8 drums of water.
9) Skilled Labour
From experience, one artisan and 15 men can construct 1.4m3 of a dam per day.
Man artisan days = 4.1
Vt

47
Attachment 5: Guideline for sand dam construction ���� Update and rewrite this with field data from Swiss Re project. AFD and ERHA have to closely monitor the process of construction in the field. Step 1: Placing reinforcements
These are placed vertically across the entire length of the dam at an interval of 2.5m. They are round bars of diameter of 12.5 mm and the length depends on the height of the dam. The amount necessary can be determined as follows:
No of columns = 12
−Ld For example: iIf Ld=10, Then No of columns = 41
2
10 =−
Mark the positions of the columns along the building line, then measure the vertical depths and record them as follows.
No 1 =2.5m, No 2=2.0m , No 3 = 3.0m
Marking of the reinforcement columns along the building line in the trench.
Φ=12 Φ=6.25 0..3 m 0.4m 0.4m
0.40m
2m 2m 2m 2m

48
The round bars of the columns are firmly grouted into holes on 5cm deep that have been cut into the foundation at the requested depth (depending on the bedrock material or soil type).
Step 2: Making the foundation blinding slab A layer of cement mortar (1:3) is prepared on the foundation to the depth of 5cm. When there is no foundation rock the vertical iron bars are placed in the mortar layer. Step 3: Constructing the first horizontal reinforce ment layer After the mortar layer 12 strands of barbed wire are evenly divided over the building slab along the dam.
Step 4: Constructing the second foundation blinding slab The barbed wire is covered by 5cm of foundation blinding slab.
Step 5: Masonry comprising hardcore and mortar sub structure
After the foundation blinding slab sets and holds the columns firmly, the foundation trench is filled with masonry comprising clean hardcore and mortar (1:4). Mortar for filling should have more water. The joints between the rocks are filled 25mm of this mortar. The rocks should be tapped well to settle completely into all voids. When the filling reaches the level of the back flow, the construction of the backflow should be done along side that of the wall as shown.
River course
Filled trench
back flow trench
Step 6 Step 7 Step 8 Step 9

49
Attachment 6: Example project sand dam in Borena ���� Update with field data from Swiss Re project. AFD and ERHA have to closely monitor the different process in the field as described in this manual and report every single phase.