Manual on Crop Area and Production Statistics
111
1 CSO-M-AG-01 Manual On Area and Crop Production Statistics
Transcript of Manual on Crop Area and Production Statistics

1
CSO-M-AG-01
Manual On
Area and
Crop Production Statistics

2
Preface
One of the mandates of the Central Statistical Organisation (CSO) is laying down
norms and standards and evolving concepts, definitions , methodology and classification in
relation to statistics. Even though CSO has been performing this mandate in many fields of
statistics, the absence of proper documentation in this regard led to a decision to prepare
statistical manuals in respect of 24 subjects detailing concepts, definition, classifications, data
collection procedures, compilation of data, estimation procedures, dissemination and other
relevant explanatory notes, including methodological framework in the statistical indicators/
statistics to make the manual a comprehensive reference book comparable to the manuals being
produced by the UNSD from time to time.
This manual on ‘Area and Crop Production Statistics’ is aimed to provide to the
compilers of Agricultural Area and Crop Production Statistics, the sources of data, methods of
data collection including adequacy of data, timeliness, reliability and uniformity in concepts and
definitions, general guidelines to be adopted for preparing the estimates of crop area, crop
production etc. The manual has been prepared in the Indian Agricultural Statistical Research
Institute(IASRI) under the guidance of a Steering Committee, headed by the Director General,
CSO, constituted for preparation of the manuals. I am thankful to Dr.S.D.Sharma, Director, IASRI
and his team of officers, namely Dr. Randhir Singh and Dr. Anil Rai for their hard work in
preparing the manual. Thanks are also due to Dr. S. M. Jharwal, the then Principal Adviser,
Directorate of Economics and Statistics, Ministry of Agriculture, Government of India and his
team of officers for their expert suggestions/comments on the draft which have been duly
considered in its finalization.
I hope that the manual will serve as a useful reference document on the subject.
Any suggestion to further improve its contents is most welcome.
(Dr.S.K.Nath)
DG, CSO

3
Contents
Title Page No.
List of Acronyms 4 Chapter-I Introduction 1.0 Introduction 7 1.1 Measurement needs of the sector 10 1.2 Concepts and definitions 11 1.3 Organization of the Manual
13
Chapter-II Sources and Systems of Data Collection 2.1. Introduction 16 2.2. System of data collection for area estimation 16 2.3 System of data Collection for crop yield estimation 20 2.4 System for crop forecasting 29 2.5 Index numbers of crop statistics in agriculture 30 2.6 Co-ordination and supervision of data collection 32 2.7 Application of remote sensing and GIS technology 32 2.8 Small Area Estimation (SAE) Approach 35 Chapter-III Monitoring Quality of Crop Statistics
3.1 Introduction 37 3.2 Improvement of Crop Statistics Scheme 37 3.3 High Level Coordination Committee (HLCC) to
monitor the crop statistics system 39
3.4 Some Major Issues Emerging from the ICS Scheme 39 3.5 Corrective Measures 42 Chapter-VI International Status of Crop Statistics
4.1 Introduction 47 4.2 Canada 47 4.3. United States of America 49 4.4 Peoples Republic of China 55 4.5 Comparison of Indian system of collecting
agricultural statistics with other countries 60
Annexures I Year of implementation of TRS/EARAS and ICS
scheme in different States 62
II Methods of estimation of area under mixed crops
63

4
III State wise details of sampling design under general crop estimation surveys
67
IV Crop coverage under crop estimation surveys
76
V Details of driage experiments of the crop estimation surveys
80
VI Estimation procedure for estimation of crop yield through Crop Estimation Surveys
85
VII Methodology for Calculation of Index Numbers of Area, Production and Yield
87
VIII Primary agency for crop cutting experiments Under Crop Estimation Surveys
89
IX Procedure for estimation of area and yield rate of different crops along with standard error
91
X Recommendations of National Statistical Commission 2001
96
XI Model Schedules for Crop Estimation Surveys
98

5
List of Acronyms
1 AGRISTARS Agriculture and Resources Inventory Survey through Aerospace Remote Sensing
2 BAES Bureau of Applied Economics and Statistics 3 CAPE Crop Acreage and Production Estimation 4 CATI Computer Assisted Telephoning Interviewing 5 CBWE Corn Blight Watch Experiment 6 CCE Crop Cutting Experiments 7 CES Crop Estimation Survey 8 CIAS Committee on Improvement of Agricultural
Statistics 9 CIP Crop Identification Performance 10 CITARS Crop Identification and Technology Assessment
for Remote Sensing 11 CSO Central Statistical Organisation 12 CWWG Crop Weather Watch Group 13 DAC Department of Agriculture & Cooperation 14 DES Directorate of Economics and Statistics 15 EARAS Establishment of Agency for Reporting Agricultural
Statistics 16 EO Earth Observation 17 FASAL Forecasting Agricultural Output Using Space,
Agro-metrology and Land-based observations 18 FSA Farm Service Agency 19 FSA Farm Service Agency 20 GCES General Crop Estimation Surveys 21 GCES General Crop Estimation Survey 22 GDP Gross Domestic Product 23 GIEWS Global Information and Early Warning System 24 GIS Geographical Information System 25 GP Gram Panchayat 26 HLCC High Level Coordination Committee 27 IARS Agricultural Research Statistics, 28 IASRI Indian Agricultural Statistics Research Institute 29 ICAR Indian Council of Agricultural Research
30 ICS Improvement of Crop Statistics 31 ISI Indian Statistical Institute 32 ISRO Indian space Research Organization 33 ISS Integrated Sample Survey 34 ITT Terms of Trade 35 LACIE Large Area Crop Inventory Experiment 36 MARS Monitoring Agriculture through Remote Sensing 37 NAIS National Agricultural Insurance Scheme

6
38 NASS National Agricultural Statistics Service 39 NCA National Commission on Agriculture 40 NCFC National Crop Forecasting Centre 41 NCFC National Crop Forecasting Centre 42 NESAC North-Eastern Space Application Center 43 NOL Non-Overlap 44 NSC National Statistical Commission 45 NSSO National Sample Survey Organization 46 PRC Peoples Republic of China) 47 PSU Primary Sampling Units 48 RCA Royal Commission on Agriculture 49 RMA Risk Management Agency 50 SAC Space Application Center 51 SAE Small Area Estimation 52 SASA The State Agricultural Statistics Authorities 53 SRSWOR Simple Random Sampling Without Replacement 54 SSB State Statistical Bureau 55 SYMAP Synagraphic mapping 56 TCCAS Technical Committee on Coordination of
Agricultural Statistics 57 TRS Timely Reporting Scheme 58 TYA Three-Year Average 59 USDA United States Department of Agriculture

7
CHAPTER-I
Introduction

8
1.0 Introduction: India is primarily an agriculture-based country and its economy largely depends upon agriculture. Presently, contribution of agriculture about one third of the national GDP and provides employment to over seventy percent of Indian population in agriculture and allied activities. Therefore, our country’s development largely depends upon the development of agriculture. The agricultural production information is very important for planning and allocation of resources to different sectors of agriculture. Agricultural statistics in India have a long tradition. Artha Shastra of Kautilya makes a mention of their collection as a part of the administrative system. During the Moghul period also some basic agricultural statistics were collected to meet the needs of revenue administration. Ain-e-Akbari is most important document which throws great light on the manner in which statistics were collected during the moghul period. After the Moghul period British rule started in the country Ryotwari System was introduced during 18th Century by the East India Company to collect land revenue. The historical famine of 1860 emphasized the need for more statistical information. In 1866, the British Government Initiated collection of agricultural statistics mainly as a byproduct of revenue administration and these reflected the then primary interest of the Government in the collection of land revenue. Subsequently, the emphasis shifted to crop forecasts designed primarily to serve the British trade interests. On a representation made by a leading firm of Liverpool, trading in wheat, the preparation of wheat forecast was taken up in 1884 and the land utilization statistics are available in the country since 1884. By 1900, oilseeds, rice cotton, jute indigo and sugarcane had also been added to the list of forecast crops. After the First World War significant improvements were made in the agricultural statistics of the country. The Royal Commission of Agriculture was appointed in 1926 by Government of India, to examine the conditions of agricultural and rural economy. The report of the commission was published in 1928. Considerable improvements in the statistics collected were brought about through acceptance by the Government, the recommendation made by the Royal Commission on Agriculture (RCA), with regard to the quality and coverage of the statistics as well as for re-organizing the country’s statistical set up. The Commission recommended the constitution of the Imperial Council of Agricultural Research which was renamed after independence as the Indian Council of Agricultural Research (ICAR). During the Second World War, when the attention of the Government was focused on the critical food situation, the need for timely and reliable statistics of food production was keenly felt for implementation of food policy and administration of controls. The initiation of the crop-cutting experiments based on random sample surveys for estimation of yield rates of principal crops for replacing the traditional eye-appraisal method was the direct result. In 1949, the Technical Committee on Coordination of Agricultural Statistics (TCCAS) was set

9
up by the Ministry of Agriculture which highlighted the gaps in agricultural statistics and the improvements necessary to remove the defects. In an attempt to fill the gap, during that period Prof. Mahalanobis introduced a new statistical system to estimate crop statistics which is known as Grid sampling. In sample surveys the final estimate is prepared from information collected for sample units of definite size (area) located at random. In large-scale surveys, cost and precision of the result depends on size of sampling units (area) and the number of sampling units. Therefore, it is important to strike a balance between these two quantities in planning of surveys. In this context, the approach of grid sampling has been proposed by Prof. P. C. Mahalanobis for areal sampling. According to this approach, the whole area is considered as a statistical field consisting of a large number of basic cells each having a definite value of the variate under study. These values (with suitable grouping) form an abstract frequency distribution corresponding to which there exists a set of associated space distributions generated by allocating the variate values to different cells in different ways. This raises novel problems which are space generalizations of the classical theory of sampling distribution and estimation. On the applied side it also enables classification of the technique into two types: (a) 'individual' or (b) 'grid' sampling depending on whether each sample unit consists of only one or more than one basic cell. For most space distribution, precision of the result is nearly equal for both types of sampling; these are called fields of random type. For certain fields (including those usually observed in nature) precision depends on sampling type i.e. these are fields of non-random type. This technique was applied in estimation of acreage under jute covering 60,000 sq. miles in Bengal in 1941-42, and it was observed that the margin of error of the sample estimate was about 2%, while cost was only a fifteenth of that of a complete census made in the same year by an official agency. With the ushering in of the planning era in 1951-52 greater attention was paid to the improvements in the collection of statistical data on a number of items and various schemes for improvement of agricultural statistics were implemented by the Central and State Governments as part of the successive five year plans. During the First and Second Plan periods, the Directorate of Economics and Statistics (DES), Ministry of Agriculture and Irrigation sponsored schemes for adoption of basic annual and quinquennial forms recommend by the TCCAS, extension of reporting area, estimation of production of principal foods and minor crops of commercial importance, rationalized supervision over the work of the area enumeration, preparation of index numbers relating to agricultural economy ------------------------------------------------------------------------------------------------------------ (References for Grid sampling :
1. P. C. Mahalanobis (1944). On large- scale sample surveys. Philosophical Transactions of the Royal Society of London. Series B, Biological Sciences, Vol. 231, No. 584 (Oct. 31, 1944), pp. 329-451.
2. J.K. Ghosh, P. Maiti, T.J. Rao, B.K. Sinha (1999). Evolution of Statistics in India International Statistical Review 67 (1), 13–34.)

10
etc. A number of other organizations like the Institute of Agricultural Research Statistics (IARS) presently named as Indian Agricultural Statistics Research Institute (IASRI), Central Statistical Organization (CSO), Directorate of National Sample Survey, now re-organized as the National Sample Survey Organization (NSSO) and the Indian Statistical Institute (ISI) also participated in the efforts directed towards the improvement of agricultural statistics in different ways. A standing Committee on Improvement of Agricultural Statistics (CIAS) was set up in the Ministry of Agriculture in 1961 to guide and review the implementation of schemes for improvement of agricultural statistics. Efforts for improving the quality and content of the statistics continued during the Third and Fourth Plan periods. In December 1969, a Data Improvement Committee was set up under the chairmanship of Dr. B.S. Minhas to look into the problems of improving the data base of the economy. In regard to agricultural statistics, this Committee pointed out the gaps in data and made several important recommendations for improvement to meet short term policy needs. In retrospect, the decade of fifties witnessed a period of initiation of new schemes for improvement of agricultural statistics, while during the sixties, efforts were made to consolidate the improvements. The National Commission on Agriculture was appointed in 1970 under the chairmanship of the then Minister of Agriculture & Irrigation, Govt. of India which made several important recommendations for strengthening and improving the system of data collection. Agriculture being a state subject and statistics falling in the concurrent list the Agricultural Statistics System is a decentralized one with the state governments (The State Agricultural Statistics Authorities, or SASAs, henceforth) playing a predominant role in collection and compilation of agricultural statistics and more particularly the crop statistics. The Directorate of Economics and Statistics (DES), Ministry of Agriculture at the Centre is the pivotal agency for coordination and compilation of agricultural statistics at all India level. Other principal agencies which collect data and conduct methodological studies on agricultural statistics are the National Sample Survey Organisation (NSSO), the Indian Agricultural Statistics Research Institute (IASRI), the State Directorate of Economics and Statistics (State DESs),etc. The present system of agricultural statistics generates valuable statistics on a vast number of parameters. Some of the very important statistics are land-use statistics and area under principal crops through the Timely Reporting Scheme (TRS) and also on complete enumeration basis, yield estimates through the General Crop Estimation Surveys (GCES), cost of production estimates, agricultural wages, irrigation statistics etc. It also generates data on livestock products through the scheme of integrated Sample Survey (ISS), collects wholesale and retail prices, conducts market intelligence and observes rainfall and weather conditions. The basic information on various aspects is also

11
collected through the Agricultural Census and Livestock Census on quinquennial basis, 1.1. Measurement needs of the sector: The information related to crop area and production plays important role in planning and allocations of resources for development of agriculture sector. The importance of various indicators of crop production statistics along with related schemes are described in the following sub-sections. 1.1.1. Crop Area Statistics: The information on crop area statistics is backbone of Agricultural statistical system. Reliable and timely information on crop area is of great importance to planners and policy makers for efficient and timely agricultural development and making important decisions with respect to procurement, storage, public distribution, export, import and other related issues. India possesses an excellent administrative setup, which has long standing tradition of generating quality information. Most parts of the country are having detailed cadastral survey maps, frequently updated land records and institutions like permanent village reporting agency for providing reliable and continuous data on crop area. However with more emphasis on local area planning, there is further need for crop area with respect to different varieties grown in the area, irrigation availability, the soil type etc. which can go a long way in rapid development of the region 1.1.2 Yield Statistics: Crop production estimates are obtained by multiplying yield rates with area sown under the crop. In the past there were two series of estimates i.e. official series and N.S.S. series for yield estimation. The N.S.S. series was mostly confined to cereals only and was discontinued from 1970-71 and more emphasis was laid on the improvement in the quality of data from the official series. The yield estimation in official series was normally done on the basis of normal yield and condition factor. Normally, yield of crops in various states were estimated on the basis of crop cutting experiments, which used to be modified at the time of estimating yield on the basis of actual condition. Under this method production statistics was calculated by finding area under crop and average yield per acre of the particular crop. The average yield was calculated by multiplying normal yield with condition factor. This method was known as condition factor or the Annawari estimate. The concept of normal yield and condition or seasonal factor was discarded in 1943 and the yield was estimated directly from crop cutting experiments. 1.1.3 Crop production forecasting: The advance estimates of crop production are needed much before the actual harvest of the crops for making various decisions such as pricing, distribution, export and import etc. However, the final estimates of crop production which are

12
based on area through complete enumeration and yield rate through crop cutting experiments are made available much after the harvest of the crop. Therefore, there is great need for developing suitable and reliable models using information from different sources like agricultural inputs, meteriological data and remote sensing data for providing the reliable and timely forecast of crop production. At present the main responsibility of providing advance estimates of crop production lies with the Directorate of Economics and Statistics, Ministry of Agriculture (DES MOA). 1.1.4 Index numbers of crop production statistics: In agriculture the index numbers are generated to study the trends over time with respect to area, production, productivity etc. Index numbers also provide comparative performance of agricultural sector with respect to other sectors of economy. The index numbers generated by the Ministry of Agriculture can be grouped into two broad categories:
a) Index numbers of area, production and yield and b) Index numbers of terms of trade between agricultural and non-agricultural
sectors
1.2. Concepts and definitions: The various concepts and definitions related to crop production statistics and frequently used in the Manual are discussed in this section Temporarily settled states: The system of temporary settlements was introduced in our country in 1892, with a view to fix land revenue for a period, which was subject to change at the time of the next settlement. There are 18 States and five Union Territories which have adopted this system as of now covering 86% reporting area. Permanently settled states: In case of permanently settled states (area) land revenue was permanently fixed and question of revision ordinarily did not arise. There are 3 permanently settled states covering 9% reporting area. Non-reporting areas: The regions for which there is no system of reporting crop area in the country. Mostly NE States covering 5% reporting area. Patwari/ Karnam Telathi/Karamchari/ Lekhpal .: In temporarily settled areas the information on crop area statistics are collected by the village accountant. The village accountant is known as Patwari in most of the Northern Indian States. He is called in South as Karnam ,in Maharashtra asTelathi, in Bihar as Karamchari and in Uttar Pradesh as Lekhpal . Khasra : The crop area statistics are collected by the village accountant or Patwari and are recorded in a register (village Form Register) which is popularly known in northern India as Khasra. Girdawari : The crop area statistics collected by village accountant on the basis of complete enumeration of operational holdings called girdawari.

13
Kanungo: The work of village accountant is supervised by immediate superior officer known by the name of Quanungo in northern India. Police Chaukidar: The police Chaukidar was usually providing the statistics on the basis of his personal guess in some temporarily states. Village headman: The village headman usually provides the crop statistics on the basis of his personal guess in some temporarily setteled states. Cadastral Survey: The complete enumeration of all the survey numbers of the village based on cadastral map. Jinswar statement: After completion of entries for each survey number of the village a abstract of area sown under different crops is prepared which is called “Jinswar statement”. Random Sample: A sample in which all the sampling units are selected with pre-assigned selection probability. Agricultural Year: In India the agricultural year starts in the month of July and ends next year in the month June. Stratum: In case of sample surveys the population is divided in to sub-populations of homogeneous sampling units which is called stratum. Cluster: A group of sampling units, which are normally homogeneous in nature. Area apportioning: In case of mixed crops, the allocation of area to different component crops is called area apportioning. Mixed Crops: In case of mixed crops a number of crops are grown on the same piece land in the form of mixture. Cropping Pattern: System of growing different crops in a particular season is called cropping pattern. Recognized Mixture: A ratio for allocation of area under different crops under mixed crops is fixed for recognized mixtures. Un-Recognized Mixture: A ratio for allocation of area under different crops under mixed crops is not fixed for un-recognized mixtures. Normal yield: “The moving average of actual yields per acre as determined on the basis of the results of crop cutting surveys over a period of ten years is called the normal yield of the crop”. This was used to determine the crop production in the past. Condition factor: The condition factor was normally determined based on actual condition of the crop to obtain production statistics. This was used to determine the crop production in the past. Average yield: The average yield was calculated by multiplying normal yield with conditional factor. This was used to determine the crop production in the past. Primary field staff: The staff, which is mainly responsible for field data collection in different states, is called primary field staff. Stratified three stage random sampling: A method of selection of ultimate sampling units through the process of randomization at three stages after dividing the population in to different stratum is called stratified three stage random sampling. In this process of selection sampling units at different stages are different. Sampling design: List of sampling units with their identification particulars and pre-assigned probability of selection.

14
Sampling frame: List of sampling units along with their identification particulars. Sampling unit: The smallest units which can be identified and are used for drawing samples and on which observations can be recorded Population: The population is collection of all sampling units which posses certain characteristics as per the objectives of the survey. Stratified multi-stage random sampling: A method of selection of ultimate sampling units through the process of randomization in two or more than two stages after dividing the population in to different stratum is called stratified multi- stage random sampling. In this process of selection sampling units at different stages are different. Marketable grain: The weight of the harvested grain, which can be sold in the market after drying is called marketable grain. Systematic sample: A sample in which all the sampling units are selected with equal probability by randomly selecting a particular unit and selecting subsequent units at fixed distance/ Driage experiments: Technique of drying the harvested produce to obtain the weight of marketable weight. Ginning: It is a process of separating lint of cotton from its seed. Crop-cutting experiment: It is technique of selecting random plot of a given size in the field of a specified crop and harvesting its produce by following specified methodology. Experimental plot: It is randomly selected plot in which crop-cutting experiment is to be conducted. First stage sampling units: All the sampling units, which can be selected at the first stage of random process in multistage sampling design. Second stage sampling units: All the sampling units, which can be selected at the second stage of random process in multistage sampling design. Ultimate stage sampling units: All the sampling units, which can be selected at the last stage of random process in multistage sampling design. Operational holding: An operational holding is defined as a techno-economic unit wholly or partly for agricultural production and operated by one person along or with the assistance of others, without regard to title, size or location. Household: A household is a group of persons normally living together and taking food from a common kitchen. 1.3 Organization of the Manual The manual highlights the strengths and weaknesses of the crop area and production statistics. The current status of agricultural statistics related to crop area and production statistics, the methods of their collection, gaps and lacunae with regard to their adequacy, timeliness, reliability and uniformity in concepts and definitions are given in this Manual. The Manual also deals with suggestions/ comments for improvements in agricultural statistics. Chapter – I of the Manual gives introduction to the crop statistics system of the country and the need and importance of various indicators of crop production

15
statistics. Various concepts and definition used in the Manual are also described in this chapter. Chapter – II describes the various sources and the existing system of data collection for obtaining statistics of crop area, crop yield, crop yield forecasting and index numbers of crop statistics. The existing system of coordination and supervision of data collection is also given in this chapter. The scope for application of recent technologies like remote sensing and GIS for improving the system are also discussed. Chapter – III deals with the important issue of monitoring the quality of data through the ‘Improvement of Crop Statistics’(ICS) scheme and various quality issues experienced during the past about thirty years of continuation of the scheme. Suitable corrective measures and new initiatives needed to maintain the quality and reliability of data are also discussed in this chapter. Chapter – IV gives the international picture of agricultural statistics system as adopted in major agriculture producer countries. The systems of Canada, USA and the Peoples Republic of China are described in detail. The manual ends with a list of eleven annexures giving important information on various parameters of the agriculture statistics system.

16
CHAPTER – II
Sources and Systems of data collection

17
2.1. Introduction: India has a well-established system of collection of agricultural statistics. The information on various agricultural statistics used to be collected even during Moghul period and continued to be improved in the British period. Systematic agricultural statistics are being maintained in the country since 1884. The present sources and system of data collection for various crop production indicators are discussed in the following sections. 2.2. System of data collection for area estimation: The country can be divided into four broad categories with respect to collection of area statistics namely (i) Temporarily settled states also known as ‘Land Record States’,(ii) Permanently settled states also known as ‘Non Land Record States’, (iii) Other regions and (IV) Non-reporting areas. (i) Temporarily settled States: The system of temporarily settlements was introduced in our country in 1892, with a view to fix land revenue for a period, which was subject to change at the time of the next settlement. Ordinarily, the interval between two settlements was 25 to 30 years. In order to determine the land revenue and to develop estimates of production detail statistics are to be collected about land revenue, land value etc. In temporarily settled areas the information on crop area statistics are collected by the village accountant or Patwari and are recorded in a register which is popularly known in northern India as Khasra. The village accountant has been called by different names in different parts of the country such as Karnam in South, Telathi in Maharashtra, Karamchari in Bihar, lekhpal in Uttarpradesh etc. This category covers around 86% of total reported area of the country. The crop area statistics collected by village accountant in the Temporarily settled States are on the basis of complete enumeration called girdawari. The village accountant is to visit each and every field of the village in each crop season and record the information such as area under different crops / land use categories and its status in standard forms called Khasra register. The work of village accountant is supervised by immediate superior officer known by the name of Quanungo in northern India. Most of the geographical areas of temporarily settled states are cadastrally surveyed and detailed maps are available in tehsil and district Headquarters. The statistics obtained by different village accountants are aggregated to get the crop area statistics at higher administrative units such as blocks, tehsils, district, states etc. This system of data collection is being followed in 18 states namely Andhra Pradesh, Assam (excluding hill districts). Bihar, Chattisgarh, Goa, Gujarat, Haryana, Himachal Pradesh, Jammu & Kashmir, Jharkhand, Karnataka, Madhya Pradesh, Maharashtra, Punjab,

18
Rajasthan, Tamil Nadu Uttaranchal and Uttar Pradesh and 5 union territories Chandigarh , Dadra and Nagar Haveli, Daman & Due, Delhi and Pondichery. (ii) Permanently Settled States: There are three states namely Kerala, Orissa and West Bengal which come under the category of permanently settled states. In case of these states land revenue was permanently fixed and question of revision ordinarily did not arise. In these states there is no system of recording details of area statistics as there is no permanent revenue staff for a village like village accountant as in the case of temporarily settled area. Initially there was no uniform system of collecting area statistics in these regions. The police Chaukidar or village headman was usually providing the statistics on the basis of guess work which were however, not very reliable. In order to improve the quality of these statistics in these permanently settled states. A scheme known as “Establishment of Agency for Reporting Agricultural Statistics (EARAS)” was initiated in 1968-69. (Presently, the area statistics in these states are collected by specially appointed field staff under the scheme). In these States covered by EARAS, the complete enumeration of all fields (survey numbers) i.e. girdawari is conducted every year in a random sample of 20% villages of the States, which are selected in such a way that during a period of 5 years, the entire state is covered. This category covers around 9% of total reported area of the country. (iii) Other regions : The remaining eight states in North Eastern regions namely Arunachal Pradesh, Manipur, Meghalaya, Mizoram, Nagaland, Sikkim and Tripura and two other union territories namely Andaman and Nicobar Islands and Lakshdweep yet do not have a proper reporting system, though states of Tripura and Skkim (except some minor pockets ) are cadastrally surveyed. In these regions compilation of area statistics are based on conventional methods in which estimates are reported by village choukidars on the basis of personal assessment. This category covers around 5% of total reported area of the country. (iv) Non-reporting areas: Out of the total geographical area of 328 million hectares, land use statistics are available for roughly 306 million hectares. Thus, for about 7 per cent of the geographical area of the country these data are not available. Of the 22 million hectares for which land use data are not available, 17.7 million hectares are located in Jammu & Kashmir and broadly cover the area under illegal occupation of Pakistan and China. The non-reporting area in other States largely consists of hill tracts in Arunachal Pradesh, Nagaland, Manipur and Tripura. Besides, there are small tracts in some States where due to the absence of cadastral survey and/or the village revenue agency, no regular statistics are collected. Some of these areas are either not accessible or being covered either by forests or by barren mountains. Regular cadastral survey of these areas is bound to take time. In some areas which are covered by barren hills or which are under snow all round the year, cadastral survey may not also be necessary. For completing the coverage of the land utilization statistics, it should, however, be possible to estimate the geographical area of these non-

19
reporting areas and their broad land use classification on the basis of aerial photographs coupled with broad topographical survey on the ground. Steps have been taken up with the Governments of Assam, Nagaland, Manipur. Tripura and Mizoram to prepare ad-hoc estimates of land utilization for the non-reporting areas falling within their respective territories. In the states where land record are maintained of (temporary settled) the village accountant is in-charge of a village or a group of villages for carrying out field to field crop inspection in each crop season for an agricultural year to record the crop area and land utilization statistics. He is supposed to record the crop details related to area and land utilization in Khasra register. After the completion of entries for each survey number of the village a abstract of area sown under different crops “Jinswar statement” is prepared and sent to next higher official in the revenue hierarchy. At the end of each agricultural year a land utilization area statistics are compiled and abstract is sent to related higher official. The crop wise and land utilization wise area statistics obtained from different villages are aggregated at the revenue circle, tehsil and district levels. The district wise area statistics are sent to State Agricultural Statistics Authority (SASA), which is generally Director of Statistical Bureau or the Director of Agriculture or the Director of Land Records. The state level aggregation is done by SASA and forwarded to Directorate of Economics and Statistics (DES), Ministry of Agriculture & Cooperation, Govt. of India, which is the nodal agency for releasing the state level and the all India level estimates. 2. 2.1. Timely Reporting Scheme (TRS) In order to reduce the time-lag between the sowing and availability of estimates of area and harvesting of crops and availability of estimates of production, a Centrally sponsored scheme for Timely Reporting of Estimates of Area and Production of Principal Crops (TRS), was initiated by the Ministry of Agriculture and Irrigation in the year 1968-70. The basic objective of TRS is to reduce time lag for making available to area statistics of major crops in addition to providing the sample frame for selection of crop growing fields for crop cutting experiments. Under the scheme, the villages in each stratum (tehsil/revenue inspector circle/patwari circle etc.) are divided into 5 independent non-overlapping sets, each comprising one fifth of the total number of villages One set of randomly selected village is chosen for crop inspection on priority basis immediately after the sowing in each season are completed, but in advance of the period prescribed in the land records manuals for such crop inspection. The village crop area statements for these villages are submitted to higher authorities by stipulated date to provide estimates of crop area in advance for major crops. These estimates are further used for crop forecasting purposes. The sampled villages under TRS are selected in such a way that the entire temporarily settled parts of the country are covered over a period of five years. The TRS provides for recording the area under irrigation as well as area under high yielding varieties in the selected villages. Besides ensuring accuracy and

20
timeliness of the enumeration of the area under crops, statistical staff under the scheme is required to inspect the fieldwork of crop cutting experiments and ensure timely dispatch of the results. This scheme has been taken up in a phased manner in different States beginning with Uttar Pradesh and Maharashtra. Details of implementation of TRS in different states are provided in Annexure-I 2.2.2. Establishment of an Agency for Reporting of Agricultural Statistics Scheme (EARAS): In the permanently settled states of Kerala, Orissa and West Bengal a scheme similar to TRS was introduced with same objectives of obtaining area estimates based on 20% sample for use of both by Center and States. Here also, it was envisaged that complete enumeration of fields for area figures would be available for all villages over a period of five years as in case of TRS. Details of implementation of EARAS in different states are provided in Annexure-I Area enumeration under TRS has to be completed on priority basis in a random sample of 20% of the villages during each crop season in a state. EARAS was introduced as a sequel to TRS in the non-land record states namely Kerala, Orissa and West Bengal. This scheme provides for setting up whole time agency to cover 20% of villages every year so that all the villages of a state are covered in 5 years. In the sample villages under this scheme, the crop area is to be reported on the basis of complete enumeration. The EARAS was initiated in Kerala during 1975-76 with 10% sample size of villages, which was increased to 20% in 1977-78. In Orissa, it was introduced during 1976-77 covering 6% of the villages, which was subsequently increased to 10% in 1977-78 and to 20% level in 1981-82. Under this scheme, in Orissa each Community Development Block is considered a stratum. In West Bengal the scheme was implemented from 1981-82 with the coverage of 7% of the villages, which was increased to 10% in 1982-83. In 1985-86 the coverage was extended to 14% and presently the coverage is 18%. Thereafter, the coverage of EARAS in the state was almost of the same order. The method of collection of area statistics in Kerala has undergone a change from 1987-88. The state was divided in 811 Investigator zones. A sample of key plots is selected from each Investigator zone with respect to key plot, a cluster consisting of five sub-survey numbers is formed and land utilization statistics are collected from these 100 clusters of five sub-survey division numbers. 2.2.3. Method of Recording Area under Mixed Crops: The practice of sowing mixed crops in the same field is quite common in almost every part of the country. This practice of mixed cropping provides protection to cultivators against weather uncertainties. But the method of sowing mixed crop is not uniform across the country. The crops in mixture are sown either row-wise separately or mixed altogether. The technique of area apportioning for different mixture crops differs from state to state. The major states of the country can be

21
divided into three broad categories with respect to area recording techniques under mixed crops. (i) States following apportionment of area at field level: In the states Andhra Pradesh, Assam, Bihar, Gujarat, Himachal Pradesh (except Kangra district), Karnataka, Maharashtra and Tamil Nadu the allocation of area recorded under different mixed crop is done at the field level recording itself based on the estimates of area under different mixture crops by the village accountant. (ii) States following apportionment of area at higher level based on fixed ratio: In many states major crop mixtures are identified and combined area at the field level are recorded as such. The allocations of area under different crops of identical crop mixtures are done at higher level based on fixed ratio. In case of unrecognized crop mixtures allocation are done at field level itself. The states following this technique are Haryana, Kangra district of Himachal Pradesh, Jammu & Kashmir, Punjab and Rajasthan. (iii) Other States: In some of the states major crop mixtures are identified and area of the fields under different crop are done at the subsequent level following fixed ratio. But for unrecognized mixture, the entire area is recorded against the major crop of the recognized crop mixtures and minor constituents are ignored. Madhya Pradesh and Uttaranchal follow this procedure. The methods of recording area under mixed crops for different states are given in Annexure-II 2.3. System of data Collection for crop yield estimation: Presently the yield rates are estimated through a national programme known as General Crop Estimation Survey (GCES). It is based on scientifically designed survey methodology based on for crop cutting experiments (CCE) in which 68 crop (52 food and 16 non food) are covered in 22 states and 4 union territories. Every year around 5,00,000 experiments are conducted with the help of state revenue and agricultural staff. Currently, about 95% of the production of food grains is estimated on the basis of yield rates obtained from crop cutting experiments. NSSO coordinates the work under CES in all states and UT’s and also provides necessary guidance on crop estimation surveys. In each selected primary unit generally two survey numbers/fields growing the experimental crop are selected for conducting crop-cutting experiments. However, in Dadra and Nagar Haveli three fields are selected instead of two. Generally, 80-120 experiments are conducted for a crop in a major district. A district is considered as major for a given crop if the area under the crop in the district exceeds 80,000 hectares or lies between 40,000 and 80,000 hectares but exceeds the average area per district in the State. Otherwise, district is considered a minor for a given crop. Experiments in minor districts are so adjusted that the precision of the estimates is fairly high and the workload on the field staff is manageable. On an average, about 44 or 46 experiments are planned in a minor district. The number of experiments allotted to a district is

22
distributed among the strata within the district roughly in proportion to the area under the crop in the stratum. Generally, the crop cutting is done in a plot of size 5m x 5m size for most of the crops in most of the states. However, in UP the shape of the plot is of an equilateral triangle of size 10 meters and in West Bengal a circular plot of radius 1.745 meters is taken for crop cut. 2.3.1 Sampling Design and procedure of data collection for general Crop
yield Estimation Surveys
The process of crop cutting experiments consists of (i) locating and marking of an experimental plot of specified size in a field selected on the principles of random sampling (ii) harvesting and threshing of its produce and (iii) recording weight of the produce in the prescribed forms. The sampling design adopted for the general crop estimation survey (GCES) is a multistage stratified random sampling with tehsils/taluks/CD blocks as strata, villages within a stratum as primary sampling unit, fields within a village as second stage sampling units and experimental plot of specified size within a field as the ultimate sampling unit. The experiments to be planned on a particular crop in a district are determined in proportion to the area under crop in different districts. Within districts the number of experiments to be conducted in a stratum is determined on the basis of area under a particular crop in different strata. The villages for conducting crop cutting experiments are randomly selected from Timely Reporting Scheme (TRS) villages. In each of these randomly selected villages two crop cutting experiments of specified size are conducted on two randomly located distinct survey/sub-survey numbers. Procedure for Selection of villages: Crop cutting experiments (CCE) on each crop are generally conducted on two randomly located survey/sub-survey numbers from each selected village, therefore the number of villages to be selected for CES is half of the number of CCE planned for the crop. But it is not necessary to select a fresh set of villages for each crop. After allocation of the experiments to different stratum for different crops for each season in proportion to the area under the crop, highest number of experiments to be conducted on any single crop during any season in each stratum has to be worked out. The number of villages to be selected is thus equal to half of this highest number. These sets of villages are to be retained for conducting crop-cutting experiments on all the crops during all seasons. The number of villages for conducting CCE on other crops are to be randomly selected from the villages of major crop. After determination of the sample size of villages in each stratum, the villages are randomly selected from the list of villages coming under TRS by simple random sampling without replacement (SRSWOR). For every one of these selected villages two more additional villages are to be selected by SRSWOR. Attempt should be made to select additional villages from TRS villages of same revenue circle to which the original village belongs. In the case of non-availability of TRS villages in the same circle the selection of additional village can be made from the list of TRS villages of the

23
stratum. If, subsequently the experimental crop is reported to be absent in the selected village(s) or additional village(s), then supervisor at district level must select 3 more additional villages for each originally selected village from the list of TRS villages and should communicate the name of substituted villages to the person concerned. This procedure may be repeated till the TRS villages are exhausted and in the event of the non-availability of the experimental crops in any of the TRS villages, non-TRS villages may be substituted. After selection of villages, the supervisor at district level must prepare a plan of experiments and provide the four important informations (i) village-wise allocation of experiments among primary workers (ii) three digital random numbers for selection of survey numbers/sub-survey numbers (iii) pair of three digit random numbers for location of plot for each experiment and (iv) experiments which have to be supervised by different agencies. Procedure for selection of survey numbers: The procedure for selection of the survey numbers for all the crops is same. The highest survey number of the village is obtained from the village accountant. The random number provided for selection of survey number as per plan of experiments is compared with the highest survey number in the selected village and if the random number is smaller than or equal to the highest survey number, then the survey number corresponding to the random number itself is selected. If, however, the random number is higher than the highest survey number, the random number is divided by the highest survey number and the remainder is noted. This survey number corresponding to this remainder is selected. If, however, the two random numbers lead to selection of same survey number, then the next highest survey number growing the experimental crop is selected for the second experiment. The survey number thus selected is identified with the help of village accountant and village map (cadastral map). If, experimental crop is not grown in the selected survey number, then the next higher survey number growing experimental crop is selected. In case, the experimental crop is not grown in any higher survey numbers (including the highest survey number) then starting from the lowest survey number, the first survey number growing the experimental crop is selected. If, in this process the same survey number is selected for both the experiments then next higher survey number growing the experimental crop is selected for the second experiment. Sometimes the selected survey number is to be amalgamated with the adjacent survey number(s). In this case the whole amalgamated area, whether such amalgamation is registered in the village record or not, is treated as one survey number. If the two experiments happen to fall in the same amalgamated number, then the next higher survey number growing the experimental crop is selected for second experiment.

24
Procedure for selection of sub-survey number/ sub-division number In case the selected survey number has a number of sub-survey numbers/sub-survey divisions, then one of the sub-survey number/sub-division number is to be selected at random. For this purpose, the selected survey number itself is treated as random number. If this random number (selected survey number) is smaller than or equal to the number of sub-divisions in it, than that sub-division number which is equal to random number (selected survey number) is to be selected. If however, the random number (selected survey number) is higher than the number of sub-division in it, then the random number is to be divided by the number of sub-divisions and the sub-division corresponding to the remainder is selected. If the remainder happen to be zero than the highest sub-division number is to be selected. If the selected sub-division number does not have experimental crop, then the next higher sub-division number growing that crop is selected. If, however, none of the higher sub-division number is sown with the experimental crop, then starting from the lowest sub-division number, the first of the sub-division growing the crop is selected. Procedure for selection of field: For the purpose of crop cutting experiments, a field is a distinct patch of land with no bunds inside it and having the experimental crop or experimental crop mixed with other crop(s) and clearly demarcated on all sides by bunds or by strip of uncultivated land or sown with other crop(s) different from the experimental crop. Different mixtures of the experimental crop with other crop(s) on the same patch of land constitute different fields. If the selected survey/sub-division number contains more than one field (as defined above) growing the experimental crop, the field nearest to the south-west corner of the survey/sub-division number which satisfies the following conditions must be selected.
• The area of the field must at least be equal to the size of experimental plot.
• If the field is sown with mixed crops. the experimental crop must constitute at least 10% of its crops area.
• The experimental crop in the field is not meant for prize competition or seed production or demonstration, and
• The experimental crop is not grown for fodder purpose. It must however be noted that if (a) the experimental crop has not germinated or has failed but its area is recorded by the Village Accountant, or (b) the field growing the experimental crop is grazed by cattle or damaged partially or completely by wild life, or (c) the experimental crop is affected by pests/diseases/heavy rainfall/inadequate rainfall even then, the field must be considered for selection for conduct of crop cutting experiment and yield obtained

25
from the plot must be recorded. In case, the experimental crop is damaged, completely, then yield must be recorded as zero. In the following cases, viz. (a) the experimental crop has not germinated or failed and its area is not recorded by the Village Accountant, or (b) the experimental crop has withered or dried up and another crop has been raised in its place in the same season, the area of latter has been recorded by the Village Accountant, then, the field need not be considered for selection. In case two or more fields satisfying the above conditions are equidistant from the South-West corner of the selected survey number/sub-survey number, then the Southern most field must be selected. Substitution of fields is not allowed on the plea of poor growth or of prior harvest by cultivators without intimation or due to late visit by primary worker. Further, if a part or whole of the selected field has been already harvested, the experiment should not be conducted in that field, and it has to be treated as lost.If, however, none of the fields in the selected survey/sub-division number is big enough to accommodate the experimental crop (i.e., 5m x 5m or 10m x 5m as the case may be) the survey number/sub-division number should be rejected and the next higher survey number/sub-division number growing the experimental crop must be selected. After so selecting the field, starting from south-west corner, the length and breadth of the field must be measured in steps, length along longer side and breadth along smaller side.If, however, the selected field is of irregular shape, a minimum rectangle circumscribing the field must be marked so as to include the whole selected field. After this process is completed that is after selecting the survey number/sub-survey number and the field and measuring the length and breadth of the selected fields for both the experiments on the given crop in the selected villages the concerned district supervisor is to be informed at least in one-month advance of the harvesting period. Procedure for location of experimental plot: The primary worker must get in touch with the cultivator of the selected field from time to time and ascertain the date of harvest. He must be present on the day of harvest. He must locate the experimental plot of specified size before the cultivator starts harvesting the field. In each selected field, the experimental plot of the specified size must be located at random. This is to be done with the help of the pair of random numbers given in the plan of experiments. The procedure for locating the experimental plots, which differs from crop to crop, is explained below.

26
A: When fields are of Regular Shape: A1: Identification of plot size of size 5Mx5M: The South-West corner of the selected field must be identified. Beginning from this point, the length and breadth of the field must be measured in steps and the number (of steps) must be noted down. From the length, 7 steps must be deducted and the reduced number (after deducting 7 steps) must be noted. The same procedure is to be followed for the breadth of the field. The reduced number of length and breadth (in steps) so obtained must be compared with the pair of random numbers given for length and breadth in the plan of experiments, and
(a) if the random numbers given for length and breadth are smaller than or equal to the corresponding numbers then these random numbers determine the starting point (i.e., south-west corner) of the experimental plot.
(b) if, however, the random numbers given for length and breadth are greater than the reduced length and reduced breadth (after deducting 7 steps), the random numbers for length and breadth must be divided by the reduced length and breadth respectively and corresponding remainders must be obtained. The remainders thus obtained determine the starting point of the experimental plot.
(c) If the random number given either for length or breadth is greater than the corresponding reduced length or breadth then that random number must be divided by the reduced length or breadth as the case may be and the remainder obtained. This remainder (for or breadth) together with the random number (for length or breadth) determines the starting point of the experimental plot.
A2: Identification of plot of size 10Mx5M: The plot size of 10Mx5M is generally selected for those crops which are sown in rows. If the experimental crop is not sown in rows the procedure for identification of plot remains the same as in case of 5Mx5M plot. Otherwise, after identifying the South-West corner of the field, measure the length and breadth of the selected field, in steps, along its length and breadth respectively. From the length, deduct 13 steps and note down the reduced length (after deducting 13 steps). Deduct 7 steps from breadth and note down the reduced breadth (after deducting 7 steps). As these crops are generally grown in rows, the plot is so formed as to have its longer side parallel to the rows. Here the South-West corner of the plot is to be located with reference to the random numbers for row and length given in the plan of experiments. First, using the random number for row, one of the rows is to be selected at random. Using the random number for length the starting point of the experimental plot is to be located on the selected row. The method of marking the experimental plot when rows are 10 meters or longer differs slightly from the one when the rows are less than 10 meters long. These methods are explained below:

27
( i) When the length of rows is 10 M or longer: Starting from the South-West corner of the field, count the number of rows in it, let this be N. Add 1 to N and note down (N+1). Find out how many rows are there in a width of 5 meters. This observation may be made randomly thrice and its average (rounded off to the nearest integer) noted. Let it be R= (R1+R2+R3)/3 3 From (N+1), deduct R and obtain the result (i.e., N+1-R). Compare this number (N+1-R), with the random number given for row. If the random number is smaller than or equal to this number (N+1-R), then select the row corresponding to the random number. If however, the random number is larger than (N+1-R), then divide the former by the latter and obtain the remainder. Select the row corresponding to this remainder. After selecting the row, measure the length of the row in steps by walking in between the selected row and the previous row and note down the number of steps. Deduct 13 steps from this number and note down the reduced number (obtain after deducting 13 steps). This number has to be compared with the random number given for length. If the random number is smaller than or equal to the reduced number, then the random number is considered as the random step, which determines the starting point on the selected row. If the random number given for length is greater than the reduced length, then divide the former by the latter and obtain the remainder. This remainder is the random step in this case. Now, starting from the beginning of the selected row measure the distance in steps, along the row, equal to the random step number and fix a peg (P1) here, i.e. in the space between the selected row and proceeding row. P1 is the southwest corner and the starting point of the experimental plot. From this point measure a distance of 10 meters along the row and fix the second peg (P2) opposite to P1. From P2, count ‘R’ number of rows coming in 5 meters width and fix a peg (P3) in between rows opposite to P2. From P3 measure 10 meters and fix a peg P3 opposite to P1. Thus, P1 P2 P3 P4 is the required experimental plot. These pegs should not disturb until the last picking is completed. (ii) When the length of the rows is less than 10 meters: In this case also, the procedure is more or less similar to case (a), but, here the number of rows (R) that can be accommodated in 10 meters length is deducted from the total number of rows in the selected field plus one viz., (N+1) instead of deducting the number of rows that can be accommodated as in 5 meters width in case of (a), and from the length of the selected row 8 steps are deducted instead of 13 steps as in case (a).

28
B). Location of experimental plot in the case of irregular field: After converting an irregular field into regular field by marking a minimum rectangle as explained earlier the location of experimental plot for various crops has to be done in the same way as explained above. However, if the experimental plot falls partially or completely out of the irregular field but within the minimum rectangle, a fresh pair of random numbers for location of experimental plot should be selected from the Random Number table. Procedure of harvesting the experimental plot: After fixing the pegs P1, P2, P3, P4 at the corners of the experimental plots, tie a string connecting these pegs all around. The string must be stretched tight and plants along the border must be examined. In the case of border plants, if more than 50 per cent of the bottom of the plants fall within the experimental plot, then such plants fall within the experimental plot, then such plants should be completely included in the experimental plot. If otherwise, the border plants must be completely excluded from the experimental plot i.e., such plants must not be harvested. The experimental plot must be harvested on the day when the cultivator harvests the field. However, the experimental plot must be harvested prior to harvesting of the field. In the case of mixture crop, the experimental crop alone must be harvested. Procedure for conducting driage experiments: The weight of the harvested produce reported at the time of harvest, relates to the weight of the crop immediately after harvest. Except in the case of sugarcane and cotton and other similar crops, it is necessary to carryout driage experiments to obtain estimates of yield in terms of final dried produce. In the case of sugarcane, the final produce is expressed in terms of cane only. In the case of cotton, the final produce is expressed in terms of lint after adopting ginning percentage (kapas to lint) as obtained from the ginning factories. Driage experiments are to be conducted at the district statistical office in respect to different crops. The driage experiments are conducted in respect of 15 per cent of the experiments planned for the specified crops or subject to a minimum of four experiments per crop. For this purpose, crop cutting experiments supervised by the State Statistical staff (preferably Assistant Statistical Officer/District Supervisor Officer) at harvest stage, must be selected. One kilogram of harvested produce, taken at random should be taken for drying to the District Statistical Supervisor. When the produce from the experimental plot is less than one kilogram, the entire produce is to be taken. Some special features of sampling design in Permanently settled States In the case of three non-land record states i.e. Kerala, Orissa and West Bengal both area and yield are estimated on the basis of sample surveys. The crop

29
cutting experiments are planned in a sub-sample of the primary units selected for the purpose of area enumeration. The general procedure of selecting sampling units remains same at different stages as in that of other states. However, some special features of these states need to be mentioned specifically. In Kerala block/city corporation or municipalities with an area of 10 Sq- Kms. and above are treated as separate stratum. Municipalities with an area of less than 10 Sq. Kms. are merged with adjoining blocks and treated as a single stratum. These blocks are divided into a number of Investigator Zones depending on the area of a block, nature of land, etc. City Corporation area is divided into three Investigator Zones. Each municipality with an area more than 10 Sq, Kms. is treated as a single Investigator Zone. The number of crop cutting experiments conducted in each Investigator Zone is six per season for paddy, three each for Coconut and Banana and two each for Tapioca, Arecanut, Cashewnut, Pepper, Plantain and Jackfruit in an agricultural year. In a municipal area having separate Investigator Zone, 10 crop-cutting experiments are conducted in respect of paddy per season and 5 for Coconut per year. For City Corporation areas, six experiments for paddy per season and five for coconut per year in one Investigator Zone are conducted. In Orissa, crop-cutting experiments for paddy are conducted in a sub-sample of 40% of EARAS villages having even serial nos. except serial nos. ending with “Zero” i.e. 10, 20, etc. in each block and for other crops, in 50% of sample villages occurring against the even serial nos. i.e. 2, 4, 6, etc. during Autumn and Winter seasons. In summer season, all the villages selected for area enumeration under EARAS are covered under CES for paddy and other crops. For paddy, the crop cutting experiments are planned in proportion to crop area subject to minimum of two and maximum four experiments in a village. For other crops, only one experiment is conducted in a village. In the State of West Bengal, the area and yield surveys conducted by the Bureau of Applied Economics and Statistics (BAES) on the basis of grid sampling followed till 1985-86, have been dispensed with and the Scheme “Establishment of an Agency for Reporting Agricultural Statistics” (EARAS) has become the primary source for area statistics and also the source to provide the frame for selection of villages for conduct of crop cutting experiments (CCEs) under General Crop Estimation Survey in the State. Since Kharif 1996-97, the frame for sampling of plots for CCEs is prepared by the BAES. Ten mouzas out of all the EARAS mouza in a block are randomly selected for CCE. A 10% systematic sample (subject to a minimum of 100 plots) of all the plots in selected mouzas is taken and the type of land use for each plot in the sample is identified. In this way, a sub-frame of plots cultivating each crop is prepared for each such mouza. If the number of plots growing a crop in a mouza is too small, all the plots growing the crop are enumerated. The plots for conducting CCEs are sampled out of this sub-frame. In all, 20 plots are taken in the form of two inter-penetrating sub-samples of size 10 each for each block for a crop. On the basis of these, two

30
independent estimates of yield rate are obtained for a block and these are later combined to give an overall estimate. The Annexure-III provides the details of the stratum, shape and size of the experimental plot for each crop in different States / U.Ts. The General Crop Estimation Surveys cover principal cereals and pulses, major fibers like cotton, jute and mesta, principal oil seeds such as groundnut, seasamum, linseed, rape, mustard and castor as well as sugarcane and tobacco, wherever these crops are sown in larger tracts. Annexure-IV provides details of the crops covered under crop estimation surveys in different states. The procedures of conducting the driage experiments are different for different crops. Details of driage experiments are provided in Annexure-V Details of estimation procedure for crop yield used in crop estimations surveys are provided in Annexure-VI. 2.4 System for crop forecasting: The advance estimates of crop area and production are released with respect to principal food and non-food crops (food grain, oilseeds, sugarcane, fibers etc.), which covers nearly 87% of agricultural output. Presently four forecasts are issued, first in middle of September, the second in January, the third towards the end of March and fourth in the month of June every year. First forecast The first official forecast of area and production of Kharif crop is prepared in the middle of September every year when south-west monsoon season is about to be over and Kharif crops are at an advanced stage of maturity. This coincides with holding of the National Conference of agriculture for Rabi campaign where states bring assessments of their respective kharif crops. Although there is no specific guideline/methodology issued by the Department of Agriculture & Cooperation (DAC) to make the assessment, these are made by the State Governments based on the reports from the field offices of the State Department of Agriculture. They are mainly guided by visual observations. These are validated on the basis of inputs from the Space Application Centre, Ahmedabad the proceedings of Crop Weather Watch Group (CWWG) meetings and other feedback such as relevant availability of water in major reservoirs, availability/supply of important inputs including credit to farmers etc. Second Advance Estimates: The second assessment for crop forecast is made sometimes in the month of January every year when the advance estimates of kharif crops prepared during the National Conference of Agriculture for Rabi Campaign may undergo a revision in the light of flow of more precise information from states. Around this time, the first advance estimates of rabi crops are also prepared. The Second Advance Estimates then cover the second assessment in respect of Kharif Crops and the first assessment in respect of Rabi Crops.

31
Third Advance Estimates: The third advance estimates are prepared towards the end of March/beginning of April every year when the National Conference on Agriculture for kharif campaign is convened and the states come up with their assessment for both kharif and rabi crops. The earlier advance estimates of both kharif and rabi seasons are firmed up/validated with the information available with State Agricultural Statistical Authorities (SASAs), remote sensing data as well as the proceedings of CWWG. Fourth Advance Estimates: The fourth advance estimates are prepared in Towards end of June/beginning of July every year when the National Workshop on Improvement of Agricultural Statistics isz held. Since most of the rabi crops get harvested by the end of May. SASAs are in a position to supply the estimates of both kharif and rabi seasons as well as likely assessment of summer crops during the National Workshop. Like third advance estimates, the fourth advance estimates are duly validated with the information available from other sources. In addition to these four forecasts, the DES, MOA provides final estimates in January. The system of preparing fully revised estimates for a crop year after 18 months which was in vogue till crop year 2003-04 has since being discontinued keeping in view the long time involved thus reducing the utility of such estimates. Secretary Ministry of Agriculture has desired that the final estimates should be made available in the month of May with the fourth forecast which should be based on all the information available and the practice of revising these estimates in next December should be discontinued. The National Crop Forecasting Centre (NCFC) has been setup by Ministry of Agriculture with the objective of examining existing mechanism of making forecasts and developing more objective technique. The NCFC should also strengthen the crop forecasting system of the country by incorporating more objective techniques and models based on sound statistical techniques. 2.5. Index numbers of crop statistics in agriculture: Index numbers are important indicators to monitor the performance over time and also the relative performance compared to other sectors at any given point of time. Directorate of Economics and Statistics generates the index numbers of area, production and yield for each state covering 46 crops. The classifications of crops are done in two main groups and eight sub-groups. The group pertaining to food grain is further classified as foodgrains i.e. Rice, Wheat. Jowar, Bajra, Maize, Ragi, Barley and Small Millets. From this group except Rice and Wheat constitute a sub-group, which is called coarse cereals. Another sub-group of cereals is pulses in which crops such as Gram, Tur and other pulses. The second group is further divided into six sub-groups: (i) oilseeds, (ii) fibres, (iii) plantation crops, (iv) condiments and spices, (v) fruits and vegetables, (vi) other

32
crops. Sub-group oilseeds consists Groundnut, Sesamum, Rapeseed and Mustard, Linseed, casterseed, Safflower, Nigerseed, Soyabean, Sunflower, Coconut and Cotton seed (The oilseed crops except coconut and cottonseed constitute 9 oilseeds). Second sub-group of fibres consist of cotton, jute, mesta and Sannhemp. Third sub-group of plantation crops consists of tea, coffee and rubber. Fourth sub-group of condiments and spices consists of pepper, ginger, garlic, chillies, turmeric, arecanut, corriander and cardamom. Fifth sub-group of fruits and vegetables consists of potato, onion, banana, cashewnut, tapioca and sweet potato. The last sub-group i.e. other crops consists of sugarcane, tobacco and guar seed. The Directorates of Economics & Statistics also generates the national level indices apart from state level indices. The base year for the present series of “Index of Area, Production and Yield in Agriculture” is the triennium ending 1993-94 so as to be in harmony with the other series of indices such as Index of Industrial Production, wholesale Price Index and other series of National Accounts Statistics. The base year values of indices are based on average value of area and production of the triennium in order to smoothen the fluctuation of annual production. The weighting factor of each commodity for construction of this index is based on production over a triennium ending 1993-94 and national average price of the commodity during 1993-94 as obtained from National Accounts Statistics. This procedure has been adopted to fix the base production at its average level by eliminating the cyclic variations and to evaluate the production with the same price for all the states in view of wide variations observed in state prices. The index number of area is obtained as percentage of current year area with respect to base year area of the crop. The index number of production is also calculated on similar lines. In case of index number of yields, index number of production is divided by index number of area. The details of methodology adopted for development of index numbers is given in Annexure-VII. In order to compare the prices of export of Agricultural Sector with prices of imports from non-agricultural sector, the Ministry of Agriculture constructs the Index number of Terms of Trade (ITT) between agricultural and non-agricultural sectors. This index measures the relative changes in the prices received by the farmers for produce sold by them in relation to the prices paid by them for the other commodities purchased for final or intermediate consumption as well as capital formation. It has been observed that index numbers of area, production and yields are prepared for every state covering all the crops which may be misleading as all the crops may not be important for a particular state. Therefore, it is desirable to include only important crops so that the correct pictures of the states are

33
obtained. However, in construction of all India Index number, all the crops may be included with appropriate weighting factors. 2.6 Co-ordination and supervision of data collection: The Field Operation Division of NSSO has the overall responsibility of assisting the States in developing suitable techniques for obtaining reliable and timely estimates, providing technical guidance and ensuring adoption of uniform concepts, definitions and procedures in the Crop Estimation Survey (CES) in the States. It reviews the design, plan, details of implementation and the results of the surveys and, associates itself in the conduct of training camps organized for the States field staff and participates in the primary field work of exercising technical supervision. Supervision of fieldwork is an essential part of any large-scale sample survey for ensuring quality of data. A threefold approach is adopted in the States for supervision of crop cutting experiments planned under Crop Estimation Surveys. This includes
a) Supervision by the statistical staff of State Agricultural Statistics Authorities (SASAs),
b) Supervision by the Departmental staff i.e. by the supervisory officers of the Departments whose workers are responsible for the conduct of crop cutting experiments in the field and
c) Supervision by the Technical personnel of the Field Operation Division of National Sample Survey Organization.
In the States of Goa, Orissa, West Bengal and the UT of Pondicherry where the field work is conducted only by the staff of Statistics Department, the supervision is done by the Statistical staff only whereas in the case of Bihar, Himachal Pradesh, Union Territories of Dadra & Nagar Haveli and Daman & Diu, though there are other primary field agencies, the supervision is done by the State statistical staff only. Though supervision of the conduct of crop cutting experiments in various states is in vogue since inception of Agricultural Statistical Wing from the year 1973-74 (Rabi) onwards, NSSO personnel are participating in the supervision by conducting sample check on crop cutting experiments in the post-harvest stages in a pre-assigned sample under the Scheme for Improvement of Crop Statistics (ICS) in 20 states and 2 Union Territories. Under this Scheme, State statistical staff also undertakes similar sample checks on a matching basis. The details regarding primary agency and main supervisory staff used for this data collection are provided in Annexure-VIII 2.7. Application of remote sensing and GIS technology: Developments in computer technology over the past years have resulted in the availability, at relatively low cost, of compact, high performance computers, which are well suited to the demands of remote sensing satellite data processing which has great advantage of vast coverage and online information. Together with the

34
emergence of a range of commercial Geographical Information System (GIS) packages and other software tools for the manipulation of spatially referenced datasets, has facilitated the emergence of a range of new applications of satellite Earth Observation (EO) data which have been developed or have entered operational service over the decade. These developments in the field of computer technology have also given new direction to handling and using spatial data for assessment, planning and monitoring. The concept of using the computers for making maps and analysing them was initiated with the SYMAP- Synagraphic mapping system, developed by Harvard School of Computer Graphics in the early 1970. Since then, there has been wide range of automated methods for handling maps using computers. The history of using computers for mapping and spatial analysis shows that there have been parallel developments in automated data capture, data analysis and presentation in several broadly related fields. All these efforts have been oriented towards the same sort of operation- namely to develop powerful tools for collecting, storing, retrieving at will, transforming, integrating and displaying spatial and non-spatial data from the real world for a particular set of purpose. These set of tools constitute Geographic Information System (GIS). The GIS can be used to solve broader range of problems as comparable to any isolated system for spatial or non-spatial data alone. For example using a GIS:
a) Users can integrate geographical features displayed on computer map and retrieve associated attribute information for display or further analysis.
b) Maps can be constructed by querying or analysing attribute data. c) New sets of information can be generated by performing spatial
operations. d) Different items of attribute data can be associated with one another
through shared location code. The GIS field is characterised by a great diversity of applications and concepts developed in many diverse areas like agriculture, statistics, computer science, graphics, mathematics, surveying, cartography, geology, geography, database technology, resource management and decision making etc. The diversification of applications leads to different concepts and methods of GIS, thus making a proper definition difficult. For the purpose of understanding, the following definition of GIS encompasses most of the concepts. A GIS is a specific information system applied to geographical data and is mainly referred to as a system of hardware, software, and procedures designed to support the capture, management, manipulation, analysis, modelling and display of spatially-referenced data for solving complex planning and management problems. While many other graphical packages could handle spatial data- say AUTOCAD and other statistical packages, GIS is distinct in its capability to perform spatial operations of integration, it is this characteristic of GIS that helps in distinguishing it from other graphical packages.
35
With the advent of remote sensing technology and launch of the first remote sensing satellite by USA in 1992, new vistas have been opened for use of satellite data in developing more reliable and timely agricultural statistics. The application of remote sensing satellite digital data for estimation of crop area was initiated in USA under Corn Blight Watch Experiment (CBWE) in 1971. Crop Identification and Technology Assessment for Remote Sensing (CITARS) experiment was started in 1973 to quantify the Crop Identification Performance (CIP) followed by Large Area Crop Inventory Experiment (LACIE) during 1974-1977 for forecasting of wheat production of major wheat growing regions. A major programme for research and development named as Agriculture and Resources Inventory Survey through Aerospace Remote Sensing (AGRISTARS) was taken up in 1988. Number of methodological studies have been carried out in Africa, Europe, Argentina, Australia, Brazil, Canada, Japan for using remote sensing satellite data etc. Currently, major programs are under way in Africa under Global Information and Early Warning System (GIEWS) and in Europe under Monitoring Agriculture through Remote Sensing (MARS). A large number of small level studies have been carried out for acreage estimation of major crops. Some of such studies are by Lepoutre (1991), Meyer (1991), Fang(1998) etc.. In India, Indian Council of Agricultural Research (ICAR) and Indian space Research Organization (ISRO) jointly conducted the first multi-spectral air born study for identification of root-wilt disease in coconut in 1969. The country level studies related to applications of remote sensing technologies were initiated after launch of IRS-IA satellite. Crop Acreage and Production Estimation (CAPE) was one of the important projects in this direction for estimation of crop area under wheat, rice, cotton, ground nut, sugarcane, potato, sorghum& mustered. Apart from these national level projects, a number of other studies have been carried out to develop methodologies for application of satellite data in various fields of agricultural and rural development by Department of Space. Some of these studies are by Dadhwal et al (1985,1991), etc.. Several methodological studies related to estimation of crop area and production have been carried out at the Indian Agricultural Statistics Research Institute (IASRI), New Delhi. Singh et.al. (1992) used satellite data for stratification of crop area for the General Crop Estimation Surveys and obtained more precise estimator of crop yield. Singh et. al. (1999) developed small area estimator of crop yield using the satellite spectral data and the yield data obtained from General Crop Estimation Surveys. Singh et. al.(2002) used satellite data and the farmers eye estimate of crop yield for developing a reliable crop yield forecasting model. Application of remote sensing and GIS technology for estimation of land use statistics using spatial models has been explored by Rai et.al.(2004). A project has also been taken up jointly by IASRI New Delhi, Space Application Center (SAC) Ahamdabad and North-Eastern Space Application Center (NESAC) Shillong with the support of Directorate of Economic and Statistic of Meghalya state to explore the possibility of estimation of area and

36
production of field crops by integration of remote sensing technology, GIS and field studies. In order to utilize the capabilities of remote sensing and improve the crop production and crop forecasting methodologies, a National Crop Forecasting Centre (NCFC) has been established in the Ministry of Agriculture in Dec. 1998. Recently, a project entitled “Forecasting Agricultural Output Using Space, Agro-metrology and Land-based observations (FASAL) has been launched under (NCFC) to meet the requirements of timely nation wide and multi- crop reliable forecast. The results of all these studies are very encouraging and indicate that remote sensing and GIS have a great potential to improve the quality of area and production statistics of the country. 2.8 Small Area Estimation (SAE) Approach: The need for crop production estimates for small areas (C.D. blocks, panchayats) has assumed urgency especially after the introduction of NAIS (crop insurance), Expansion of the scale of CCEs to meet this need is almost impossible if NAIS is implemented throughout the country and covers many more crops than at present. An approach other than CCEs has to be sought and the technique of “Small Area Estimation” (SAE) holds out a promising solution. One approach is use of auxiliary information through farmers’ appraisal survey for obtaining crop yield estimate at Block/ Gram Panchayat level for the purpose of estimation of yield rates under NAIS. The procedure involves scaling down the yield estimates from GCES at district/block level to Gram Panchayat (GP) level for insurance purposes. Another approach for estimation at small area level is to make use of remote sensing digital data along with yields data from general crop estimation surveys. IASRI has taken up some studies for development of crop yield estimation at block level using remote sensing satellite data along with CCE yield data.

37
CHAPTER – III
Monitoring Quality of Crop Statistics

38
3.1. Introduction: The reliable information on agricultural production statistics is very crucial for national planning and for improving the standard of living of rural masses. A large number of individuals and agencies are involved in the collection, coordination and supervision of data collection for crop area and the fieldwork of the GCES for crop yield. Various steps have been taken from time to time to adopt uniform methods for ensuring the quality of data. However, it is being constantly felt that the data is subject to a large number of non-sampling errors and there are wide differences observed in estimates developed by different agencies. In a major step to improve the quality of data a new scheme named “Improvement of Crop Statistics (ICS)” has been in operation since 1973-74 which is described in detail in the following section. 3.2 Improvement of Crop Statistics Scheme (ICS): In addition to the crop area estimates developed by the state government, the National Sample Survey (NSS) used to develop area estimates based on sample surveys during its regular rounds of surveys till 24th round which was conducted during July 1969- June 1970. Thus two sets of estimates of crop production were generated for the whole country and also for certain population zones and naturally there were differences between the two sets of estimates. But some times quite significant differences between two series of data on crop area statistics were observed which raised questions about the quality of data. In order to probe into these high differences a technical committee on crop statistics was set up in 1963. The committee favoured inter alia the estimates based on complete enumeration. As a consequence the NSS discontinued its land utilization surveys and also crop cutting experiments under household surveys in 1970-71. Thereafter, the NSSO introduced the ICS scheme in 1973-74 with the main objective of improving the quality of statistics through joint efforts of centre and state authorities. Currently the scheme is in operation in 20 states and two Union Territories of Delhi and Pondicherry. In this scheme an independent agency (NSSO) carries out the supervision and physical verification of girdwari in a sub-sample of four clusters of five survey numbers in each of the TRS sample villages. An assessment is made for extent of discrepancies between the entries of supervisor and girdwari completed by village accountant for each of the selected survey numbers in the sample. The supervisors for checking possible errors of aggregations also scrutinize the crop abstract of the village, which is prepared by patwaries. The permanently settled states are also covered under this scheme where a sub-sample of EARAS sample villages (survey number) is scrutinized following the same methodology as adopted for temporarily settled area. Generally, a total of 10,000 sample villages are covered by the ICS out of which 8,500 are in the temporarily settled states and 1,500 in the permanently settled states. National Sample Survey Organization (NSSO) is mainly responsible for planning and operations of ICS by employing full time field staff for supervision. The responsibility of field supervision is also shared by designated state agencies which is responsible for carrying out the field supervision in approximately half of

39
the sampled villages. Details of implementation of ICS in different states are provided in Annexure-I 3.2.1 Sampling design of ICS for crop area statistics: The sampling design for sample check on area enumeration is stratified multistage random sampling where talukas/tehsils /CD blocks/group of tehsils in a district forms a stratum. The villages within each stratum form the first stage units and survey numbers within each village form the second or ultimate stage sampling units. Sample villages are selected from the set of TRS/EARAS villages in a stratum for the current year with the help of simple random sampling without replacement (SRSWOR). In all 4 clusters of 5 survey numbers each are selected with the help of circular systematic sampling with equal probability in selected villages. In case of selection of clusters, all survey numbers or sub- survey numbers are given serial numbers treating each sub- survey number as a sampling unit. This constitutes the sampling frame in all states except U.P where survey numbers are treated as sampling units, Survey numbers selection made during the first season are retained for sample check during subsequent season(s) also. Two sets of area figures under different crops for the selected 20 survey numbers are obtained, one set of figures as observed by the Superintendents of NSSO/State Supervisors and the other set as copied from the corresponding entries of the Khasra Register prepared by Patwari. The totals of the area under various crops recorded for the 20 survey numbers are also obtained. Two separate estimates of crop area viz. A-III and A-IV respectively based on the Patwari’s record and Superintendent’s/State Supervisor’s observations are prepared. The details of estimation procedure are given in Annexure- IX 3.2.2 Sampling design of ICS for Yield Statistics: The ICS scheme was implemented by the government in 1973-74through NSSO, which acts as a watchdog on the implementation of TRS, EARAS and GCES. The main purpose of scheme was to improve the quality of crop statistics. Under this scheme for checking the quality of data for crop yield statistics, about 30,000 crop-cutting experiments are inspected at the time of harvest. Under the sample check on crop cutting experiments, the supervisors are likely to point out the deviations, if any, from prescribed procedures during crop cutting experiments by primary workers. The deviations may be related to use of random numbers for selection of plots, harvesting of produce, use of standard equipments and weightment of grain etc. Supervisors also correct any mistakes observed while filling the schedules and only these corrected versions of schedules are used for tabulation. The sampling design adopted for selection of sample for inspection of crop cutting experiments is that of stratified multi-stage random sampling. Districts of the states are treated as stratum, villages as first stage units, survey numbers/ sub survey numbers within the villages as second stage units and a plot of

40
specified size within a survey/ sub survey number as the ultimate sampling units. The villages are selected through Simple Random Sampling without replacement (SRSWOR) from the list of already selected villages for sample check for area enumeration and in which crop cutting experiments are planned under GCES. In case the number of villages selected in the sample is equal to the desired sample size for check on crop cutting experiments then no selection is done. If the number villages are less than the desired sample for sample check on crop cutting experiments, additional number of villages are selected in the second phase from the remaining villages selected for GCES. After selection of villages the approach of circular systematic sampling is adopted for selection of ultimate unit of population Sample checks on crop cutting experiments are planned on two experiments for a crop in each of the selected villages. The State primary workers conduct the experiments in the presence of Superintendent/State Supervisor who supervise the experiment and also correct the error, if any. The corrected yield rate as observed by the Superintendent/State Supervisor is filled in ICS schedule. On the basis of this information the estimates of yield rates for the district and state are worked out. The details of estimation procedure are given in Annexure- IX 3.3. High Level Coordination Committee (HLCC) to monitor the crop
statistics system Currently, the most important forum to discuss various aspects of crop statistics system in the States is the institutional mechanism in the form of High Level Coordination Committee set up generally under Agriculture Production Commissioner/Additional Chief Secretary In charge of Agriculture/Secretary, Agriculture or Planning with representation from Department of Revenue, Planning, Agriculture, Horticulture, Space, IT etc. from the state side and Economics and Statistical Adviser of Ministry of Agriculture, Chief of NSSO(FOD), and Director, IASRI from the Centre. In this Committee both technical and field problems relating to agriculture statistics are discussed and decisions are taken to solve the problems. The conclusions from the ICS reports brought out by FOD are also discussed and State Govt. is requested to resolve the problems highlighted in the report The major advantage of having the HLCC is that the top administrator value the importance of reliable and timely agriculture statistics, and monitor the implementation of the decisions in a time bound manner and fix responsibility for non-compliance, whenever such a need arises. 3.4. Some Major Issues Emerging from the ICS Scheme The ICS scheme has been in operation for more than twenty five years. The purpose of the scheme has been to look into the maladies affecting the agricultural statistics system and to suggest remedial measures to improve the quality of these statistics. National Statistical Commission (NSC), taking note of the potential of the ICS scheme, set up an expert group to review the ICS progarmme and suggest modifications in the survey design. The committee

41
made several recommendations for redefining objective of the ICS and modifications in sampling design for sample check of area enumeration and aggregation. The committee also recommended that ICS may cover only principal crops with All India importance and covering not less than 10 percent area in at least one state. Other major findings of the ICS related to crop area, crop production and crop forecasting are described in the following sections. 3.4.1 Crop area statistics: The basic purpose of ICS has been to improve the quality of crop statistics. It has been observed over number of years through ICS that to a great extent Girdawari is not completed in time and also there are a large number of inaccuracies in the girdawari which are completed by the patwaris. Some of the main problem areas as reported by ICS are as follows:
1. The crop statements submitted by patwaris are many times based on incomplete girdawaries.
2. The village crop statements are not submitted in time and there are large percentages of non-response.
3. The entries in the girdawaries are found to be incorrect in a large number of survey numbers.
4. Recording area under mixed crops is a major source of errors as it is not uniform across the states.
5. Sometimes there is uncertainty regarding recording of area under crop as area sown or area harvested. This leads to inaccurate estimation of area, if area sown is recorded as area under crop and there is no germination.
6. Area sown more than once is also responsible for some confusion about statistics of area under various crops.
7. Inclusion of field ridges, bunds in measurements result in inaccuracy, which may be quite high in some of the cases.
8. Due to introduction of new technology / varieties a number of short duration crops are grown and also, there is shift in cropping pattern towards value added crops which are not reflected properly in girdawari.
3.4.2 Yield Statistics: The method of crop cutting experiments is based on an objective and unbiased technique and if this method is properly followed it should provide reliable estimates of yield rates. In practice, however, the field staff do not strictly adhere to the prescribed procedure and thereby the survey estimates are subjected to a variety of non-sampling errors. The supervisory check by ICS staff reveals a number of such lapses. The ICS and GCES yield estimates have been seen to differ widely from each other, much more than what could be attributed to sampling errors. The review of ICS shows that the experiments in the GCES are conducted properly in about 80 per cent of the cases while the rest have one defect or the other. The defects

42
mainly related to wrong selection of sample fields, location of experimental plots, failure to properly use essential equipment such as proper weighting scales, etc.. GCES carries out around 5,00,000 experiments every year; but these are not still adequate to provide usable estimates below the district level. With the introduction of National Agricultural Insurance Scheme (NAIS) in several States a need is felt for assessment of yields of insured crops at the lower level such as tehsil or C.D. Block and even at the panchayat level. NAIS has, therefore, prescribed for additional crop cutting experiments for this purpose at the rate of 16 per block or 8 per panchayat for insured crops. Some of the states have already implemented this scheme of crop-cutting experiments. This imposes an enormous additional burden on the field agency and increases the non-sampling errors considerably resulting in further deterioration of the production statistics. Some major problems of yield statistics are as follows:
1. It has been observed that field staff appointed by the State Governments do not strictly adhere to the prescribed procedures and thereby the survey estimates are subject to a variety of non-sampling errors.
2. The errors are introduced mainly due to wrong selection of fields and deviation of selected experimental plots. The use of defective instruments such as weighing machine introduces considerable amount of measurement errors.
3. The state departments of revenue and agriculture, which are responsible for carrying out the survey, keep these programmes on low priority and there is inadequate higher level of supervision and control of field operations. The “High Level Coordination Committee (HLCC) on Agricultural Statistics” in the states have also not shown much impact in improving the quality of data.
4. In order to meet the requirements of getting estimates at block/village panchayat levels especially for crop insurance purposes some of the State increased the number of crop cutting experiments considerably. This imposes an enormous burden on the field agency, increases considerably the non-sampling errors, which results in further deterioration of quality of data collected through GCES. There is possibility of under estimation of yield rates in case of crop insurance due to local pressure from insured farmers where interest lies in depressing the crop yield.
5. It has been observed that inadequate training is provided to the field staff for conducting the crop cutting experiments.
6. Another important factor, which has bearing on the quality of production data is, the late time schedule fixed for certain crops in Kharif season in some states. In this case crop-cutting experiments are to be conducted before completion of the season due to early harvesting. Such situations have been arising in respect of Kharif crops like maize, jowar, bajra, groundnut, cotton, soyabean etc. in States like Gujarat, Haryana, Karnataka and M.P. Due to early harvesting of these crops, area under crop is generally under reported.

43
3.4.3 Crop forecasting: Some of the major issues in case of forecasting crop production are as follows:
• The present technique is mostly subjective and is not based on sound statistical technique.
• No multi-dimensional models exists in which the information generated from different sources can be integrated.
• The flows of information from different generating agencies are not time bound and appropriate.
• The DES, MOA loosing confidence of users group due to frequent changes in production figures specially most of the time differences in the forecasted estimates are huge. These differences create lot of confusion and doubt among users.
• There is strong need to develop suitable forecasting models which integrate information from different sources on parameters related to crop production such as crop conditions, agro meteorology, water availability etc.
3.5 Corrective Measures: Reliability, adequacy and timeliness are three major ingredients of any sound statistical system. The Indian Agricultural Statistics system, widely acclaimed in the world for long, has come under widespread criticism recently both from within and outside Government. Some important measures to be taken to bring about lasting improvements in reliability adequacy or timeliness of the system are suggested in the following sections. 3.5.1 Area statistics: The corrective measures that need to be taken up to improve the quality of area statistics are as follows:
1. The primary reason for poor quality of area statistics is the failure of village accountant to devote adequate time and attention to girdawari due to overburden of multifarious functions and large geographical jurisdiction. In general one village accountant has four to five villages but some states such as Bihar, Himachal Pradesh, Orissa, Uttaranchal etc.. it is more than 10 villages. The National Commission on Agriculture (NCA) already recommended for reducing his jurisdiction so that quality of area statistics can be improved. Apart from this strict and intensive supervision through ICS and the state department is required to improve the quality of the statistics.
2. Initially village accountant used to be appointed through hereditary system, which has been replaced by some states with cadre system based on regular transfers. This change seems to be watering towards positive direction. Therefore, other states where this system is not adopted may also adopt the same system.

44
3. Girdawari should be given high priority in the working schedule of village accountant (Patwari). It must be a mandatory requirement for patwaris to carry out crop inspection according to prescribed time schedule.
4. If TRS can be carried out under strict operational and technical control the area estimate obtained based on 20% of villages can be used to get not only advance estimates but also for the final estimates of crop production. This will also improve the timeliness of the estimates.
5. North-Eastern States and Union Territories need to improve their method of data collection based on personal judgment. The application of recent tools such as Remote Sensing (RS) and Geographical Information System (GIS) need to be explored in this region.
6. Area sown more than once should be counted separately. 7. Area sown and area harvested must be appropriately accounted if crop
germination fails in adverse conditions. 8. Adjustment of the area under crop may be incorporated for area under
field ridges and bunds. 9. Area under short duration photosensitive crops / varieties needs to be
recorded in the girdwari. Further, area under value added crops / minor crops such as mushroom, flowers etc. needs to recorded during girdawari. This may indicate shift in cropping pattern due to open economy in the country.
10. In a number of states major crop mixtures are identified on the basis of the cropping pattern, still there are number of states in which the identification of crop mixture is not done. The apportionments of area for recognized mixture are done on the basis of fixed ratios. These ratios were fixed long back and may not conform with respect to present cultivation practices in the country. There is strong need to revise these ratios at various levels from time to time. The data collection during ICS may be used for this purpose. In the case of non recognized mixtures, the area under different crops sown as mixed crops in the field are allocated at field level through eye appraisal which brings inaccuracies in recording area. In some states minor constituents under mixed crops are ignored which is not proper. Therefore for reporting area under mixed crops a more scientific and uniform technique need to be adopted throughout the country.
11. Agriculture is a dynamic sector where cropping practices change over time and new crops especially of short duration are sown and harvested. However, the Village Crop Register (Khasra Register) and other records maintained by patwari have remained almost the same since the mid 50s. The list of crops covered by the village Crop Abstract (Jinswar) needs a review that may also result in some changes in the manual of instructions for the girdawari.
12. Computerization of land records is another major effort to modernize the agricultural statistics system. Some of the states have already undertaken the computerization work quite seriously and it is expected that all efforts will be made to complete the computerization of land records in all the states.

45
The National Statistical Commission 2001 has given a number of suggestions to improve the system of data collection on crop area statistics which are given in the Annexure- X
3.5.2 Yield Statistics: The corrective measures that need to be taken up to improve the quality of yield statistics are as follows:
1. Strict measures should be taken by the State Governments to enforce the
field staff to follow prescribed procedure of crop cutting experiment. There is need to supervise the fieldwork by high level revenue and agricultural officers of the states. Strict action needs to be taken up against the non-performing field staff.
2. The immediate steps need to be taken up to reduce non-sampling errors. This needs intensive training of the field staff, which includes field training as well. The quality and standard of the equipment must be ensured. If possible improved and smoothly portable instruments should be provided to the field staff.
3. The field operations of crop cutting experiments must be the responsibility of minimum number of agencies in the State, so that the operations can be controlled and monitored in a better way. Attempts should be made to involve State agricultural and statistical agencies for controlling the whole operations of GCES.
4. The technique of small area estimation needs to be explored for obtaining estimates of lower administrative units such as block / village panchayats. The number of crop cutting experiments should not be increased in order to meet this requirement, as it will have adverse effect on quality of data.
5. There is need to adopt uniform plot size in all the states for crop cutting experiments of different crops based on past experiences.
6. There is need to fix the appropriate time for girdawari in each season. This may be fixed by keeping in view the crop calendar of each season of the region. This may be different across the states.
7. The quality of data is likely to suffer if the primary worker is not properly trained. Therefore regular training of the patwaris and other field staff involved in conduct of crop cutting experiments and collection of data should be an important ingredient.
The National Statistical Commission 2001 has given a number of suggestions to improve the system of data collection on yield statistics which are given in the Annexure- X

46
3.5.3 Crop forecasting: Some corrective measures that need to be taken up to improve the quality of forecasting crop productions in the country are as follows:
1. There is strong need to develop forecasting models/techniques based on sound statistical methodology
2. The possibility of utilization of remote sensing technology may be explored to provide information of crop area and crop conditions at various stages of crop growth.
The National Statistical Commission 2001 has given number of very important suggestions to improve the system of data collection on crop forecast statistics which are given in the Annexure-X.

47
CHAPTER-IV
International Status of Crop Statistics

48
4.1: Introduction: India has a well established agricultural statistics system. The system has been appreciated by various countries and international agencies and many countries have adopted our system with some minor modifications as per their requirements. In order to provide a comparative view of our system as compared to some other well developed agricultural countries, we present here the system of agricultural statistics as adopted in Canada, USA and China. 4.2: Canada: The main agency for generation of crop production statistics in Canada is Statistics Canada. The agricultural statistics in Canada is generated through National Farm Survey and Agricultural Census. The description of these sources are given below: 4.2.1 National Farm Survey: This survey produces the annual data on the agricultural sector. It was based on a sample of farming operations. The information collected covers farms, operating arrangements, land use, tenure and size, livestock and poultry, field crops, operating expenses, farm capital, and farm income and cash receipts. The subjects of this survey are (i) Agricultural land use (ii) Agriculture (iii) Crops and (iv) Livestock. This is a sample survey with a cross-sectional design. This survey targets all farming operations in Canadian provinces with sales of farm products of $250 or more ($2,500 in Newfoundland) in the twelve months preceding the survey. (It excludes institutional farms and farms on Indian reserves and settlements.) The methodology for sample selection and data collection varies depending on region. The Canadian Wheat Board area (Prairie Provinces and the Peace River District in British Columbia) uses two list frames and one area frame. The list frames contain: (1) relatively large census farms vis-à-vis crop, livestock and expenses criteria; and (2) census farms with more than twenty acres which are not in list one but which complement it. The area frame contains all agricultural enumeration areas. The Quebec and Ontario region uses one list frame, made up of census farms, and one area frame, made up of agricultural enumeration areas. Only one frame, a list of census farms, is used in the Maritime Provinces and the rest of British Columbia. In Newfoundland there is complete enumeration of census farms. With the exception of Newfoundland, each of the above frames is stratified within sub provincial areas on the basis of crop, livestock and expense characteristics. Samples are drawn from the various frames for the different regions using circular systematic sampling. In the Canadian Wheat Board area and in the Quebec and Ontario region, data collection procedures consist of two phases. In all cases, data collection is carried out using one or more of the following methods: telephone; mail-out with interviewer pick-up; personal interview; mail-out with telephone interview. Responding to this survey is mandatory. Data are collected directly from survey respondents.

49
Imputation: Tabulations from first and second contacts are revised with final tabulations. Imputations are made to deal with partial non-response and inconsistencies. Some of these imputations are deterministic. The others are made using the nearest-neighbor "hot-deck" method. Raising factor adjustment is used to account for total non-response (i.e. no contact or total refusal). Level and trend estimates are obtained by weighting the sampling units - that is, individual farms for the list sample and segments for the area sample - using the inverse of their probability of selection. For the segments, there are a few steps before the weighting. In effect, when a farm in a segment is enumerated, its total non-woodland area and its total non-woodland area within the segment boundaries are determined. Then the proportion of the farm that is in the segment is calculated and this figure is applied to all the data collected for the entire farm. In this way, the part of a farm's acreage, livestock inventories, and expenses that can be attributed to the segment is estimated. Finally, a figure for the total acreage, livestock inventories, and expenses of a given segment is obtained by following these procedures for all the farms involved in this segment and by adding the figures.
4.2.2 Census of Agriculture: The Census of Agriculture is conducted Quinquennially (5 year) to develop a statistical portrait of Canada's farms and its agricultural operators. Statistics Canada conducts the Census of Agriculture. The data provide users with a comprehensive picture of the major commodities of the agriculture industry while also supplying information on new or less common crops, livestock, finances and use of technology. The data collected by the Census of Agriculture are used to calculate estimates and determine the sample frame for the agricultural surveys. The information is also used by Agriculture and Agri-Food Canada and provincial governments to develop, administer and evaluate agricultural policies, and by universities and agri-businesses for research and planning. The census takes place every five years as decreed by The Statistics Act. It provides a historical perspective on Canadian agriculture and on trends in the industry over the years. The major areas covered under this are (i) Agricultural products (ii) Agriculture (iii) Farm finance (iv) Farmers and (v) Farms. The target population of this census is All agriculture operations in Canada. Although the questionnaire is updated every census to reflect data users' changing requirements as identified through the Canada-wide workshops, certain basic or core questions appear on every census. Repeating basic questions allows the census to measure change over time, while adding new questions and dropping others allows data to be collected that reflect new technologies and structural changes in the agriculture industry. The reference period for the Census of Agriculture data varies with the variable under consideration. The most common reference periods Include the previous calendar year (e.g. value of agricultural products sold) and census day (e.g. number of livestock on the operation).

50
Error detection and Imputation: Error detection methods involve numerous edits to identify and resolve problems related to capture errors, missing data and geographic identification of farm operator's residences and headquarters. It is for the most part an automated process and focuses on individual questionnaires. The Progress of Seeding Follow-up Survey was used again in 2001 to verify or update crop data. Seeding of crops across Canada typically occurs between the first of May and early June. The change in Census Day from the first Tuesday in June to the second Tuesday in May be able to significantly affect the field crop area reported by agricultural operators in that crops seeded after Census Day could differ considerably from what had been planned and reported on the census questionnaire.
Some records in a Census will be incomplete or inconsistent and will require imputation. Where an enumerator's follow-up with respondents was unsuccessful in obtaining missing information or resolving data inconsistencies, an automated imputation procedure is used. Where possible, incomplete or inconsistent records receive substitute values derived from other information on the record. In cases of total non-response and for data that cannot be derived from the incomplete record, a process of selecting suitable data from "nearest neighbor" records is used. The system searches for another operation with similar characteristics and within the same geographic area as the questionnaire with the problem. Once a suitable match is made the system duplicates the donor's responses in the recipient questionnaire.
4.3. United States of America (USA): In United States of America, National Agricultural Statistics Service (NASS), United States Department of Agriculture (USDA) is the nodal organization for collecting all agricultural statistics including crop area and production as well as crop forecasting. A number of surveys are conducted in the country to collect information related to crop area and production including crop forecasting. A brief description of these surveys is provided in the following sections: 4.3.1. Census of Agriculture: The basic purpose of this census is to provide detail county level data that are collected, tabulated, and published using a uniform set of definitions and methodology for 3200 plus counties in the U.S. The census collects data on all commodities produced in the U.S. as well as detailed information on expenses, income, and operator characteristics. The census of agriculture is conducted in all 50 states on a target population, which are all farms and ranches selling or intending to sell $1,000 or more of agricultural products including horticulture. A census of agriculture is also conducted in Puerto Rico using a farm definition of $500 or more in sales and intentions.

51
The census is designed to obtain data on a totally exhaustive list of commodities. Census questionnaires are designed with open-ended questions to allow respondents to report every item produced on the farm, even the rare of commodities. Expense items and income from all sources are obtained. Operator characteristics such as race, gender, age, tenure on the farm, and operating arrangement are also collected. The frequency of this census is every five years in years ending in 3 and 8 covering the preceding year. The reference period for crop, economic, and demographic data is the calendar year ending in 2 and 7. For livestock, the reference date is the December 31 of the reference year. NASS maintains a universe list of farms and ranches on a continual basis. This list undergoes an intensive list building effort before the start of each census to maximize coverage. The first mass mailing of census forms is done in December. Follow up mailings to maximize response are scheduled at predetermined intervals. Unique farms and special handling cases are removed from the mailing list and data are collected using other strategies like telephone, personal visit, or using custom cover letters. Response to the census is mandatory. NASS supplements the June Area survey with additional segments to measure list incompleteness (under coverage). Returned census forms are computer imaged (photographed) and optical character recognition software is used to capture responses in electronic form. Images may be recalled on demand to Guide to the Sample Survey and Census Programs of NASS to help resolve data discrepancies. Data are reviewed for consistency and completeness. Imputation methodology has been developed to account for missing data cells (partial non-response). Unit non-response and under-coverage adjustments are made by re-weighting techniques applied to data from reporting farms. The census numbers provide the most detailed information on the structure and changes occurring in agriculture. 4.3.2 June Area Survey: The June Area survey is one of the largest annual NASS survey projects and provides significant utility for the entire NASS survey program. The data collected are used to supply direct estimates of acreage and measures of sampling coverage. The June Area survey utilizes an area-sampling frame. The area frame consists of all land, stratified by land use, in all states except Alaska and Hawaii. The primary sampling units (PSU), based on land area, provide complete coverage of all agriculture activity occurring on that land and, therefore, provide complete coverage of all operators in the state. A sample of over 11,000 segments, smaller units of a PSU measuring roughly one square mile, are selected from each land use stratum for data collection. All farm operators operating within the boundaries of the selected segments are interviewed. In a given year, approximately 85,000 agricultural and non-agricultural land use tracts are identified within the sampled segments. From that identification, over 35,000 detailed personal interviews are conducted with farmers operating farms inside the segment boundaries or who have the potential to qualify as a farm. Every five years, over 2,000 extra segments are sampled to supplement census coverage measures. The June Area Survey is designed to

52
account for every acre of land, all agricultural activities, and land uses within segment boundaries. Crop acreage, genetically modified crop acreage, grain stocks, cattle inventory, hog inventory, sheep inventory, poultry inventory, land values, cash rents, farm numbers, and value of sales data are collected. The diverse range of items is needed for direct estimation requirements and sample design needs for projects later in the survey year. The June Area survey is conducted annually. Data collection for the June Area survey is completed entirely by personal interview during the first two weeks of June. Personal interviews must be conducted since operators within the selected segments are not known until significant screening is completed. Also, respondents must examine an aerial photograph to identify each field boundary and report the crop planted. Acreage data refer to the current crop year, while livestock and stocks data refer to June. The June Area frame survey provides direct estimates for several projects and generates a unique population of respondents. Those operations, which did not have the opportunity to be sampled from the list frame, comprise the non-overlap (NOL) domain. The NOL domain, identified from this survey, is used as a sampling source to calculate an incompleteness measure for multiple frame estimates for no fewer than 19 major survey projects. This domain also provides NASS the ability to be responsive to the data needs of state and federal cooperators by ensuring complete sampling coverage for multiple reimbursable survey projects. The detailed crop acreage data are also used as a sampling source for several of the Objective Yield Surveys. 4.3.3. Acreage and Production Survey: The basic purpose of this survey is to provide data needed to estimate acreage and production of selected crops and inventory of major livestock species at the county level for state and federal programs. Data are also collected to update commodity information on the NASS list frame for sampling purposes. The Acreage and Production survey is conducted in 42 states. All counties in these states must be represented in the sample. The commodities covered by the survey are specific to each state. NASS, USDA Risk Management Agency (RMA), and USDA Farm Service Agency (FSA) jointly define a federal county estimates program. Individual states will add commodities to the program to cover special needs of local cooperators. States will also add items to the survey to refresh aging sampling information. The list of commodities is fairly exhaustive in most states. Operators are asked to provide information for their entire farm. For field crops and vegetables, farmers are asked for planted acres, area harvested for grain and silage, and quantity harvested. For fruit, number of trees or vines and quantity harvested are asked. For livestock, total inventory and numbers by subclasses like beef cows, dairy cows, and calves are obtained. This survey is conducted annually at the end of the harvest season. Some states conduct two surveys, one in late summer for the early harvested crops (small grains) and another in late fall for row crops, hay, and livestock. Most states conduct only one late fall survey.

53
The target population is all farms and ranches in each state. Operations in other acreage and livestock surveys are excused from the acreage and production survey, however their responses to these other surveys are merged into the county summaries. Special sampling considerations are employed to ensure all counties and rare commodities are adequately represented. Also, farms that have not responded to a survey for several years are often added to the sample for the purpose of refreshing sampling information. The Acreage and Production survey is designed to increase the usable sample size to a level adequate for county level estimation. Federal county estimates for small grains are released in mid-February. Federal row crop estimates are published from early March through late June. Livestock county estimates are released from mid-May through August. State program county estimates are published by each state according to individual state release schedules. The RMA uses county estimate data to determine when crop loss insurance payments are to make to farmers. They also use the data directly and indirectly in their actuarial process. The FSA uses the estimates in their formulas for posted county prices and disaster assistance programs. 4.3.4 Agricultural Yield Survey: The basic purpose of this survey is to provide farmer reported survey data of expected crop yields used to forecast and estimate crop production levels throughout the growing season. The Agricultural Yield survey is conducted in all states except Alaska and Hawaii. Samples of farm operators are selected from the March Crops/Stocks survey (small grains) and the June Crops/Stocks survey (late season crops and tobacco). Farmers reporting acreage of at least one commodity of interest are included in the monthly data collection to forecast crop yields. Farm operators provide data for small grain crops (winter wheat, durum wheat, other spring wheat, barley, oats), row crops (corn, cotton, dry edible beans, peanuts, rice, soybeans, sorghum, sugarcane), tobacco (burley, air cured, and dark fired), and hay (alfalfa and other hay) being produced on the operation. Hay stocks data are also collected. Acreage planted, acreage for harvest and expected yield per acre are collected from each operator for the crop of interest the first month. In following months, the same samples of operators are contacted to update expected yield per acre data. Updating reported information from the same sample of operators each month provides a measure of change resulting from growing conditions. The Agricultural Yield survey is a monthly survey running from May through November. Small grains data are collected from May through August. Row crop data are collected from August through November. Hay yield data are collected in August and October with hays stocks collected in May. Tobacco data are collected from May through November. The reference date for each monthly survey is the first of the month. Data collection for each survey begins no earlier than the 25 of the previous month for mail data collection. Phone data collection begins no earlier than the 28 of the previous month. Data collection concludes about the 5th of each month

54
depending on the release date of the Crop Production report. Sample sizes run from 6,000 (June) to 25,000 (August). The primary method of data collection is telephone interview. Mail out-mails back data collection is a highly cost effective and less burdensome method. However, the narrow data collection period each month requires a quick Guide to the Sample Survey and Census Programs of NASS 8 response thus reducing the effectiveness of data collection by mail. Personal interview data collection is used on a limited basis when requested by the respondents. Phone enumerators utilize CATI software, which allows the enumerator to verbally maintain a conversation with the respondent while following the instrument flow and question text. Data are entered directly into an electronic format and the software performs simple consistency checks which drastically reduces the need to make follow up contacts to the respondent. The software further reduces respondent burden by using previously reported data files to avoid unnecessarily re-asking questions answered by the respondent in a previous month. The Crop Production report is published no later than the 12 of each month. Acreage, yield, and production forecasts and estimates are prepared for the crops in season. The Agricultural Yield survey is one component of the estimation process for commodity production estimates. The NASS estimates of supply are the official, independent, and unbiased baseline. The price discovery mechanism determines crop prices using credible estimates of supply that reflect the changing conditions during the season. Producers rely on credible estimates of supply to minimize swings in farm gate prices. Crop production estimates are valuable for producers and industry alike to plan the marketing and movement of the commodity throughout the year. 4.3.5 Crop Progress and Condition Survey: The purpose of this survey is to provide frequent and timely updates of farmer activities such as planting and harvesting, progress of crops through various phenological stages of development, and crop condition ratings throughout the growing season. All states participate in the survey. Each state maintains a list of reporters, largely extension agents and Farm Service Agency staff, who report progress and conditions of selected crops in their area for the current week. Nearly every county in every state has at least one reporter. Reports returned each week account for over 75 percent of the acreage for major commodities. There are two types of questions, crop progress and crop conditions. Reporters are asked to respond as of Sunday. Crop progress questions ask reporters to estimate the percent of a particular crop that is at or beyond a specified stage of development. Progress questions are grouped into two categories, human activity and phenological development. Human activity includes field tillage, spraying, planting, cultivating, harvest, pruning, etc. Phenological development includes crop emergence, maturation, and various reproductive stages. Crop condition questions ask reporters to estimate the percent of a particular crop that is in each of five condition categories ranging from very poor to excellent. Crop progress surveys are conducted weekly from early April until late November. From December through March, field offices report on agricultural activities monthly.

55
Data are collected through several modes. Reporters responding by mail complete the questionnaire on Friday and mail it back to the state office for inclusion in the summary the following Monday. The most common mode of data collection is through a secured internet site. Reporters are given a user ID and password that allows them access to the site and report as late as Monday morning. Some states collect data by phone, also on Monday. Some reports are submitted by facsimile and a few are sent by e-mail. All reports are processed by mid-day Monday and states submit their results to Headquarters by early afternoon. The official report must be prepared by 4:00 p.m. Eastern Time. 4.3.6 Crop/Stock Survey: The basic purpose of this survey is to provide detail estimates of crop acreage, yields and production, and quantities of grain and oilseeds stored on farms. The Crops/Stocks surveys are conducted in all states quarterly. Farm operations are selected from an area frame and a list frame to produce “multiple frame” estimates. Farm and ranch operators from the list frame are selected by size depending on the proportion of the commodities of interest the operation has in comparison with other operators on the list. The area frame sample is added to account for land not covered by the list frame. The sample targets producers of row crops and small grains and farms operations with grain storage capacity. Operators provide data on the total acres they operate, acreage in each commodity of interest and amount produced at harvest. Grain and oilseeds stored are asked in amount stored of each grain or oilseed. Each state has a unique set of commodities asked depending on which commodity is grown in the state and at what acreage level. Commodities are collected according to their growing season. For instance, data for a small grain like winter wheat would be obtained in December, March, and June, to determine acreage, and September to determine production. On the other hand, data for row crops, like corn, are collected in March and June for acreage determination, and again in December after the majority of the crop is harvested and the production has been determined. Crops/Stocks surveys are conducted four times per year. Farmers planting intentions are collected in March. Acres planted and acres expected for harvest are collected in June. Small grains acres harvested and production are collected in September, and row crop and hay production are collected in December. Information and grains or oilseeds stored on the farm for major commodities such as corn, soybeans, wheat, sorghum, barley, and oats are collected all four quarters, while specialty crops such as rye, flaxseed, rapeseed, safflower, mustard seed, canola, and hay are collected once annually in selected producing states. Other specialty crops such as sunflowers, dry edible peas, Austrian winter peas, lentils, and chickpeas (garbanzo) are surveyed twice per year in selected producing states. Sample size targets are set for each commodity in the survey. The desired number of samples for Guide to the Sample Survey and Census Programs of NASS 36 each commodity are controlled with a minimum overall sample size.

56
Total sample sizes range from about 55,000 in September to about 79,000 in June because the number of crops of interest varies between quarters. In the Crops/Stocks survey, targeting is important for the row crops and small grains stocks panels, for rare commodities, and specialty crops. Specialty crops such as potatoes can also be summarized as a separate survey to meet earlier publication dates. Data are collected for approximately two weeks beginning the last day of the month prior to the survey reference date. Modes of data collection include mail, telephone, Computer Assisted Telephoning Interviewing (CATI), and personal interviewing. Over 75 percent of the data are collected by phone and CATI. 4.3.7 Objective Yield Survey: The purpose of this survey is to provide data for monthly forecasts and end-of-season estimates of planted and harvested acres, yield and production of winter (w), durum (d), and other spring (s) wheat, corn for grain, soybeans, fall potatoes, and upland cotton. All acres for harvest as grain in the leading producing states are eligible for this survey. The operator is interviewed to verify acreage reported on the parent survey and obtain permission to enter the sample field to make counts and measurements. Monthly plant and fruit counts, fruit measurements, and maturity determinations are made until the crop is mature or harvested. At maturity or immediately before harvest, a final crop cutting is made. Sample fruit (ears, pods, bolls, heads, or tubers) are sent to a lab to determine fruit weight, threshed grain weight, and moisture content. A post-harvest visit is made to glean fruit left in some sample fields. Fields for corn, cotton, soybeans, durum and spring wheat are selected from June Area survey tracts with planted acres of the commodity of interest. Winter wheat samples are selected from March Crops/Stocks reports with winter wheat planted for harvest as grain. Potato samples are selected from June Crops/Stocks survey operators reporting fall potato acreage for harvest. Data must be collected using personal visits to the field. These visits are made monthly with the final visit occurring when the crop is mature or the farmer plans to harvest. Guide to the Sample Survey and Census Programs of NASS 66 Counts and weights are expanded to per acre yield and adjusted to standard moisture for the commodity. Estimates of harvest loss are computed and subtracted from the biological (gross) yield of the harvest plots to determine net yield per acre. The Objective Yield survey fieldwork begins April 25 for winter wheat, and July 25 for all the other crops. Sample units are visited at the end of each month during the growing season. 4.4 Peoples Republic of China: (PRC) The Peoples Republic of China did not inherit a strong statistical system when it came to power in 1949. With the aim to create an efficient statistical system, the State Statistical Bureau (SSB) was established in 1952. The statistical system grew through mid- decade, but was disrupted substantially during the frantic activity of the Great Leap Forward (1958-1960) when statistical reports were

57
grossly exaggerated to match production goals. An attempt was made to restore objectivity to the system in the early 1960's. The statistical system was again severely disrupted during the Cultural Revolution (1966- 1976). Statistical organizations were abolished and workers were assigned to other occupations. In 1972, some government statistical institutions were reestablished, but by 1980 staffing at the national level was less than half that of 1956. It should be noted that considerable emphasis is now placed on keeping the statistical reports from being influenced by official production goals. The PRC's main agricultural reporting system is based on the collection of census data. Each of the PRC's more than 5 million agricultural production teams (small collective farms) enter about 500 different categories of data in 13 quarterly and annual statistical reporting tables each year. There are three categories of agricultural statistics: (i) Basic Information- construction of communal property and arable land, commune and team prices, and scientific information similar to that provided by Agricultural Extension Service, (ii) Agricultural Production- crops, livestock, and forestry (iii) Miscellaneous - mechanization, fertilizer, distribution of commodities produced, and income. Three methods are used to collect data for regularly scheduled agricultural forecasts and estimates namely censuses, typical area investigations, and sample surveys. 4.4.1. Censuses: Two types of agricultural censuses are conducted: (I) the annual (sometimes referred to as "fixed time") census, which is completed by the end of February and (2) a seasonal census, which is done in each growing season. The SSB provides the leadership and reporting format for the collection of census data, which they sometimes call “all around”, or "overall" surveys. Forms are adjusted for local conditions and filled out under the combined leadership of the local Government agencies so that the various data requirements can be met. Census data are provided by the basic production teams and summarized upward through governmental levels to the State level. Although a census requires a considerable amount of labor, the methodology is simple and administration is relatively easy due to the size and structure of the Government bureaucracy. The information is used for planning at all levels. The brigade provides the basis for the seasonal census. In some sense the brigade is like farm as a reporting unit in that the brigade keeps planting and yield records, as reported by the teams, for each field in the brigade. For a census during the growing season, the brigade has the following three subjective methods to "forecast" brigade yield. ÷ A group formed from the statistical cadre and an informed peasant drives
around with the brigade statistician and subjectively evaluates the yield of the fields.
÷ In some fields, grains are counted on some plants (not selected in a mathematically random manner). Historic records of these counts are

58
compared to the current count and used with historic yields to subjectively derive yield. This method reportedly works better than the first.
÷ A "typical" field is selected and the group carefully evaluates the yield.
Fertilizer use, weather, and their historical relationships are examined in the subjective development of these yield forecasts. For spring crops, the data is reported to the county no later than June 10th, for autumn crops, no later than October 20th. Besides crop forecasting, the census system is used to report livestock numbers and economic data. The commune reviews and adds the data from brigade reports and passes them onto the county with written comments. The county reviews the data (usually from about 650 brigades), summarizes the commune reports to county level, and passes this information to the next higher level of government. The manual summarization process is repeated up to the State level. The census information from each of these levels provides crucial data for the sampling plans used in the PRC. 4.4.2 Typical Area Investigations: This method sometimes referred to as the "spot" or "key area method" has been adopted at the province, prefecture, and county level. The data must be reported twice each year, for the summer by the end of April and for autumn plantings by the 20th of September. At the county level, technicians from the county offices of the SSB, the Agriculture Bureau, and the Food Group form a team to forecast yields. Originally, they chose "typical" brigades or pieces of land on which they did their survey work. Now the team goes by truck and stops every five minutes to evaluate a field. These are the "typical" fields in a non-mathematically random sense. Visual examination, counts of stalks or kernels, and past harvest data are used to make the estimate of yield for each field. The prefecture and province also supply technicians to go with the county teams to the "typical" fields to do forecast work. This grouping provides agreement on the data used in the summary of average yield for the county, 4.4.3 Sample Surveys for crop forecast: Although some counties have continuously used the sampling system initiated in the 1950's, regional scale sampling has only been re-instituted in recent years. More emphasis is now being placed on sample forecasting methods. The PRC instituted a new system of agricultural production responsibility, which made the production unit smaller and thus may affect existing forecasting methods. Crop forecasts are one of the most important statistical series. Although the PRC makes widespread use of census methods to generate statistical information, sample surveys are not uncommon. Sampling methods were initiated in the early 1950's. In the early 1960's, groups were set up to investigate crop yield estimation using sampling. During the Cultural Revolution most of this sampling work stopped. Therefore, until recent years, most information was collected via census. Although agricultural censuses are still vital to the collection of planning

59
information, sample surveys are being re- instituted and interest in improved sampling techniques continues to grow. Sample surveys are conducted during the two main crop seasons. Each crop has an individual sample survey rather than a single sample survey used for the collection of multiple data items. Depending on the province, surveys might be done for paddy rice, wheat, corn, sorghum, millet, and/or sweet potatoes. The sample surveys are conducted in some of the agricultural provinces using a five stage sampling design, which utilized prior census data to develop the sampling frame. As other provinces establish survey teams, sample surveys are expected to become more widespread until the goal of nationwide sample surveys is reached. In selecting the sample for use in the first year, the province uses the prior three years of census data for the counties to draw the first stage sample. The three-year average (TYA) of yield per mu (a unit of area equal to 336 one-fifteenth of a hectare or 666.7 square meters) for each county is computed using end of season census data for the crop being surveyed. (On the average, provinces consist of about 80 counties.) Counties are arranged in ascending order by this average yield; then the cumulative county area of the crop is computed. A sampling interval is determined such that approximately 20 percent of the counties (with a minimum of 7) are selected using a systematic sample of the cumulative area values. The TYA yield per mu is computed for these selected counties and compared to the province TYA yield per mu. If the sample value is not within + 2 percent of the province value, the sampling interval is reduced and a new and larger sample is drawn. The second stage-sampling unit is the commune. (On the average there are 23 communes per county.) The TYA yield per mu from census data reported by the communes in each selected county is computed. Communes are arranged in ascending order by the TYA yield, and then the cumulative commune area of the crop is computed. A sampling interval is set such that about 30 percent of the communes in each county (with a minimum of 7) are selected using a systematic sample of the cumulative area values. Again, the TYA yield for the communes in the sample is compared with county TYA yield. The process is repeated with a larger sample size if the +_ 2 percent tolerance is not met. The third stage-sampling unit is the production team. A production team has the responsibility for the agricultural activities of, on the average. A production team consists of about I or 2% of commune's land. At this stage, the TYA yield per mu from census data reported by the production team in the selected communes is computed. Teams are arranged in ascending order of the TYA yield, and then the cumulative team area of the crop is computed. A sampling interval is set such that about 5 percent of the production teams in each commune (with a minimum of 3) are selected using systematic sampling of the cumulative area values. As in the previous stages, the + 2 percent tolerance between the sample and commune TYA yield is required. At the fourth stage of sampling, the sample units are the fields. Sampled units vary each year in areas where crop rotation is practiced. A group of technicians visits each field. Each production team has a list of fields by name, e.g. round or crescent, and a historic record of production for each field. The group uses the

60
historic information and the observed condition of the growing crop to assign the field an expected yield. When this work is complete, the team arranges the fields in ascending order based on expected yield. In some areas of the country, a three-year average production rather than field visits is used to arrange the fields. Next, the cumulative production is computed. At this stage, using a predetermined sample size, a sampling interval is set to obtain a systematic sample of fields. In the North where fields are larger, at least 7 fields are chosen. In the South where fields are smaller, at least 15 fields are chosen. The number of fields chosen above the minimum depends upon the +_ 2 percent criterion used at this stage. At the fifth stage of sampling, sample plots are laid out in the selected fields. A systematic point sampling scheme is generally used to determine the centers of the plots. Even in nonrectangular fields this procedure is used by modifying the x's to "zig zag" along parallel lines which go through the field at a distance of d apart. In the special case of a narrow field, parallel lines cannot be formed within the field at the required distance, so an alternative procedure is used. In this instance, the field is divided into m (the desired number of sample points) equal rectangles with the center of each rectangle as the sample point. At each of these sample points a mechanism is used to define the sample plot for crops not planted in rows or those with narrow rows. In some parts of the country, the plot is determined using a two-thirds meter-by one-meter rectangular frame. When crop rows are present, these frames are laid out at a 45 degree angle to the crop rows. In some areas an instrument similar to a protractor is used which measures a circular sample of about I .I square meters. In wide row crops, a fixed length of row (3.3 meters to 6.7 meters depending on the crop and area) is used. The systematic procedure is measured across the rows with the selected points determining the chosen rows. The sample length is centered at each point. A measurement is taken from the sample row across eleven rows to obtain the average space between rows. Data collection for the sample plots consists of two types: (i) forecast and (ii) harvest data. Survey teams in the local areas do the collection of this data. These enumerators are of two types: (i) full-time employees of a State Statistical Bureau's Sample Survey Team and (ii) part-time workers hired for the survey. The same plots are used for both the forecast and harvest estimate of production surveys. Currently no pre-fruiting surveys are conducted. The only forecast survey is conducted after the grains develop. In some areas, early season visits are made to these plots to estimate the number of seedlings per unit area and the tillers. During the forecast survey, a team of enumerators counts the number of ears or heads of grain within the sample plots. From sub-sample first ten ears, the numbers of grains are counted. Historic information about the average weight per grain by variety is used to forecast the yield. The peasant family, which manages the sampled field, is instructed to give the survey team one or two days notice before harvesting the field. The survey team harvests the sample plots before the field is harvested.

61
4.5 Comparison of Indian system of collecting agricultural statistics with other countries:
The technique of data collection of various parameters of crop statistics depends on administrative organization socio-economic structure, package and practices followed for crop production, crops and its seasonal diversification, development of rural infrastructure etc. The traditional system of collecting crop statistics in India has it roots from ancient and medieval India. This system was again reorganized during British rule. Numbers of steps were initiated during this era for making uniform system of data collection throughout the country. After independence, government of India recognized the importance of collection of reliable crop statistics and initiated number of schemes for this purpose. The system data collection of crop statistics in the country is highly depended on land records maintained for collecting land revenue from farmers.
In case of developed countries such as USA or European nations relatively small percentage of population is involved in agricultural production. The farm sizes are quite large. Therefore, most of the surveys related to agriculture, depends on list frame of farmers. In this a complete list of the farmers are available along with other relevant details. Apart from this, due to large form sizes and less diversification of crops in a particular season, it is possible to prepare accurate area frame of farm holding using remote sensing technology. In contrast, almost 70% population of India is dependent on agriculture. The farm sizes in India are very small with diversified crops in each season. The practice of mixed cropping in India is quite dominant. Almost 70% agricultural land of the country depends of monsoon for agricultural production. Therefore, it may not be possible to prepare accurate area frame using remote sensing technology due to limitations of satellite sensor in detecting and differentiating small fields and crops grown. However, it is interesting to observe that in countries like USA or Canada there is a nodal organization which coordinates the whole data collection process in agricultural sector including livestock, fisheries etc. This is true for both census and surveys, which are conducted on regularly. This makes it possible to avoid duplication in collection of information and also provides input of information to other related census or surveys. Therefore, all the schemes are inter related and uniform, which makes then cost efficient. In contrast with this, in India various organizations/departments are involved in collection of agricultural statistics and there seems to be lack of uniformity and coordination among themselves. This needs to be reorganized with in the framework of Indian administrative and socio-economic set up, which will definitely make the whole system more reliable and cost efficient.

62
Important References
1. Agricultural Statistics at a Glance (2004). Directorate of Economics and Statistics. Ministry of Agriculture Govt. Of India.
2. Tables of Agricultural Statistics of state for the year (99). Directorate of Economics and Statistics. Ministry of Agriculture Govt. Of India.
3. Consolidated results of Crop Estimation Survey on Principal Crops (2001-02). Ministry of Statistics and Programme Implementation, NSSO Govt. of India.
4. Agricultural Statistics Part-II (2001). Ministry of Statistics and Programme Implementation, NSSO, Govt. of India.
5. Instruction manual for the field staff on survey under the scheme “Establishment of an Agency for Reporting Agricultural Statistics in Kerala (EARAS) 2001”. Department of Economics and Statistics Thiruvananthapuram.
6. Manual on Crop Estimation Survey and Agro-economic Surveys in command area in Andhra Pradesh (1977). Command Area Development, Department of Andhra Pradesh.
7. Instruction Manual for supervisors for Crop Estimation Survey (1987). Department of Revenue, Rajasthan.
8. Manual of Agricultural Statistics for CES, West Bengal. 9. Instructions on Crop Cutting Surveys, Financial Commissioner Office
J&K. 10. Booklet of instruction on Crop Estimation Survey (1977). Department of
Statistics, Tamil Nadu. 11. Crop Estimation Surveys on principal food and non-food crops in Assam. 12. Manual on Crop Estimation Surveys (1993). Department of Economics
and Statistics, Karnataka. 13. Crop Cutting Experiments by the Random Sampling Method 14. Establishment of an Agency for Reporting Agricultural Statistics
(Instruction Manual) 1996. Directorate of Economics and Statistics, Orissa.
15. Instruction Manual for Pilot Crop Cutting Method in Madhya Pradesh. Department of Land Records Madhya Pradesh.
16. Instruction Manual for Estimation of Principal Crops using Pilot Survey in Uttar Pradesh (1995). Department of Revenue, Uttar Pradesh.
17. Instruction Manual for Crop Cutting Experiments using random sampling in Himachal Pradesh. Department of Agricultural Himachal Pradesh.
18. Sukhatme P.V. and Panse V.G. (1951). Crop surveys in India – II Jr. of Indian Society of Agricultural Statistics. Pp 97-168
19. www.cso.gov.bw 20. www.dacnet.nic.in 21. www.usda.gov 22. www.fao.org

63
Annexure-I
Year of implementation of TRS/EARAS and ICS scheme in different States
Year of Start Sl.
No. Name of the State
TRS/EARAS ICS 1 2 3 4
1. Andhra Pradesh Kh. - 1971-72 Kh. - 1974-75 2. Assam L.Kh. (Win) 1973-74 Kh. - 1974-75 3. Bihar L.Kh. (Agh) 1969-70 Rabi. - 1973-74 4. Chhattisgarh* Rabi - 2001-2002 Rabi - 2001-2002 5. Gujarat Kh. - 1972-73 Rabi - 1973-74 6. Haryana Rabi - 1973-74 Rabi - 1973-74 7. Himachal Pradesh Kh. - 1978-79 Rabi - 1974-75 8. Jammu & Kashmir Kh. - 1975-76 Rabi - 1974-75 9. Jharkhand* Rabi - 2001-2002 Rabi - 2001-2002 10. Karnataka Kh. - 1969-70 Rabi - 1973-74 11. Madhya Pradesh Rabi - 1972-73 Rabi - 1973-74 12. Maharashtra Kh. - 1968-69 Rabi - 1973-74 13. Punjab Kh. - 1975-76 Rabi - 1973-74 14. Rajasthan Kh. - 1972-73 Rabi - 1973-74 15. Tamil Nadu 1972-73 1974-75 16. Uttar Pradesh Kh. - 1968-69 Rabi - 1973-74 17. Uttaranchal* Rabi - 2001-2002 Rabi - 2001-2002 18. Delhi Kh. - 1981-82 Kh. - 1978-79 19. Pondicherry Kh. - 1980-81 Kh. - 1980-81 20. Kerala 1975-76 E.Kh.(Aut.) 1975-76 21. Orissa 1976-77 Kh. - 1974-75 22. West Bengal 1981-82 Rabi - 1975-76 Note: 1. Kh. = Kharif, Win. = Winter, Agh. = Aghani, E.Kh. = Early Kharif LKh. = Late Kharif,
2. * = In existence w.e.f. November, 2000

64
Annexure-II
Methods of Estimation of Area under Mixed Crops
Andaman & Nicobar Islands – Cultivation of mixed crops is not in practice. Andhra Pradesh – Where two or more crops are sown in Rows, the area occupied by each is estimated by the village official in the ratio of number of rows, and also allocation of the area to the constituent crops grown in mixture is done at field level only. Assam – Half the area of the field is shown under each of the crops (Vide rule 65 Assam Land Records Manual). Punjab and Haryana – In certain districts of the State the mixed crops are shown separated by the patwari according to his estimate, by first measuring the area under mixed crops by Kadmi paimaish and then estimating the ratio in which it has been sown. In other districts, the area under mixed crops such as wheat-gram, barley-gram, is entered under the separate columns for the different crop mixtures, provided in the Jinswar and Lal Kitab. Mixed crops are distributed by office of the kanungos under appropriate headings of single crops. The area of cotton and oilseeds, which are sown mixed with other crops, is estimated according to the rule locally followed in preparation of crop abstracts. In case of wheat and gram however, the area under each of these crops when sown in mixture is taken as half and half of the total area. Kerala – The area covered by such mixed crops is recorded by eye estimates. Himachal Pradesh – The area under mixed crops is recorded separately for each crops . Orissa – The net area under each crop is estimated on the field itself and recorded separately under each crop. Karanataka – The area under mixed crops is being based on eye estimates. Coorg area of Karnataka: In case of mixed crops inter-sown with ragi such as Tur dal etc. the area of the plot under each crop is assessed on the basis of the extent sown. In case of Kumri cultivation, the mixed crops are rice, tur dal and vegetables and the area is assessed at about 1/3 of the area sown under each crop. In other mixed crops where the constituent crops are sown in rows, they are estimated on the basis of the number of rows under each. Madhya Pradesh – The mixture is shown under the predominant crop if no separate heading is prescribed in jinswar for such a mixture.

65
Maharashtra – Separate columns of mixed crops are allocated and shown separately in the crop statement. The area is estimated by the village official (talathi) by eye estimate or by counting the rows of the particular crop in the survey number on the basis of the ratio between the main crop and the sub crop. The procedure followed for the calculation of mixed crop is as under:
a) If the mixed crops is sown by broad casting method, the area under individual crops is calculated by eye estimation and the used seed rate.
b) If the mixed crop is sown in rows the area of each crop is calculated by
using the proportion of their number of rows. Tamilnadu – The following crop mixtures with millets are sown in Tamil Nadu: Cumbu and Groundnut, Cholan and Redgram, Cholam and Pulses, Cholam groundnut and redgram, Cholam and Ground, Cumbu and Pulses, Cumbu and Cowpea etc. The following yardsticks are adopted for recording the areas of crop when sown as mixed crops: 1. Cumbu and Groundnut for millets 4/5th area 2. Cholam and Redgram for millets 4/5th area 3. Cholam and Pulses for millets 4/5th area 4. Cholam, Groundnut & Redgram for millets 4/5th area 5. Cholam and Groundnut for millets 4/5th area 6. Cumbu and Pulses for millets 4/5th area Procedures for computing the mixed crops of pulses into pure crops are: 1. Redgram Pure Full (i.e. One acre in the
field is taken as one acre) 2. Blackgram in Sugarcane ½ (i.e. Blackgram in one
acre of Sugarcane is taken as ½ acre of blackgram)
3. Greeengram in Sugarcane ½ 4. Redgram in Paddy field bunds ¼ 5. Blackgram in Paddy field bunds 1/6 6. Greengram in Paddy field bunds 1/6 7. Redgram in dry groundnuts ½ 8. Redgram in Varagu, Cholam and millets ½ 9. Blackgram pure Full 10. Greengram in irrigated groundnuts 1/6 11. Blackgram in irrigated groundnuts 1/6 12. Blackgram in dry cotton 1/3 13. Greengram in dry cotton 1/3

66
14. Blackgram in rice fallow Full 15. Greengram in rice fallow Full 16. Blackgram in tapioca 1/6 17. Greengram in tapioca 1/6 18. Lab in millets 1/4 19. Bengalgram pure Full 20. Redgram in Banana 1/4 21. Redgram in turmeric 1/4 22. Redgram in blackgram or greengram in
coconut tapes 1/4
23. Lab in dry groundnut 1/4 24. Bengalgram in rain fed cotton and coriander 1/4 25. Blackgram or greengram in irrigated ragi and
other millets 1/3
26. Blackgram or greengram in irrigated cotton 1/3 27. Blackgram in dry groundnut 1/4 28. Greengram in dry groundut 1/4 The above procedure is done at village level by the village Administrative Officers. Rajasthan - The identified crop mixtures are bajra-moong, jowar-bajra, til-moth, jowar-til, in kharif and wheat-barley, wheat-barley-gram, in rabi and no mixed crop in zaid. The procedure for calculation of area under mixed crops is by eye estimation. Uttar Pradesh: In U.P. the important mixtures such as wheat and barley are entered in the village registers as “mixtures”, no attempt being made by the village officers themselves to separate the areas of component crops. The sub-division of area is done in the Central Offices on formulae supplied to them. An appropriate formula for each crop has been prepared for every district or homogeneous proportion in the district, in consultation with the District Officer. For unimportant mixtures, that is, for mixed crops with no separate heading, the minor constituent is ignored and the whole area is to be credited to the principal crop. In the case of mixed oilseeds, which are not recorded separately, the area and yield are therefore arrived at as follows: Area under mixed = ½ of the total acreage under gram plus 1/6 of the total acreage of wheat and barley and their mixtures. Yield of linseed per acre sown mixed with gram=1 ½ maunds. Yield of linseed per acre sown mixed with a crop other than gram = ½ maund. West Bengal – The area covered under mixed crops, if found, is recorded by eye estimates i.e. the total mixed cropped area in any plot is divided into areas under individual crops according to the density of crop plants.

67
Bihar – The area under mixed crops is recorded at the field level by the Revenue Karamcharis on the basis of seed/plant ratio and after consultation with farmers and on the basis of eye estimation. Goa – No mixed crops are cultivated in the state of Goa. However, the area under each crop is estimated separately as based on benchmark survey and eye estimates. Meghalaya – The state of Meghalaya has no cadastrally recorded information in respect of the different areas of the state. However, only some portions of Garo Hills region in the plain are having land record, which could provide data on the area of the land as possessed by the cultivators. It may be mentioned here that the land tenure system of the state is totally different from the rest of the country in respect of land holding and propriety right over land. In view of the above hurdles, the only alternative to show the area of land is to go by guess estimation by following certain norms like seed rates etc. In order to have some broad ideas in the area coverage conforming to the prevalent cultivation practices of important crops, the following norms observed in the case of oral study with some cultivators are given below: Jhum cultivation (Multiple cropping) Main crops Subsidiary crops
Mixed crops: Paddy 90% Vegetables etc. 10% Ginger 95% Mixed Vegetables 5% Paddy 95% Mesta 2% Other Vegetables 3% Permanent Cultivation (non-Jhum) Potato 75% Maize 25% Maize 80% Mixed Vegetables 20% Mizoram – The area under mixed crops is assessed by calculating the quantity of various seeds used for planting. Manipur – If a plot grows two or more crops in mixture, the total area under the mixed crops defined to be the gross area under each of the component crops of the mixture. For instance, the plot growing paddy and maize in the mixture in an area of 10 acres, the gross area under paddy is 10 acres and the gross area under maize is also 10 acres.

68
Annexure-III
State wise details of sampling design under general crop estimation surveys
Crop Season Year of
initiation of survey
Year of adoption of results
Plot Size & Shape
Dimension (M×M)
Stratum
1 2 3 4 5 6 1. ANDHRA PRADESH Paddy Kh.
Rabi 1945-46 1945-46
1954-55 1954-55
5×5 5×5
Mandal Mandal
Jowar Kh. Rabi
1951-52 1951-52
1955-56 1955-56
5×5 5×5
Mandal Mandal
Bajra 1951-52 1955-56 5×5 Mandal Maize Kh.
Rabi 1951-52 1951-52
1955-56 1955-56
5×5 5×5
Mandal Mandal
Ragi Kh. Rabi
1951-52 1951-52
1955-56 1955-56
5×5 5×5
Mandal Mandal
Redgram 1958-59 1960-61 10×10 Mandal Greengram Kh.
Rabi 1976-77 1976-77
1976-77 1976-77
5×5 5×5
Mandal Mandal
Blackgram Kh. Rabi
1962-63 N.A
1963-64 N.A
5×5 5×5
Mandal Mandal
Horsegram Kh. Rabi
1980-81 N.A
1980-81 N.A
5×5 5×5
Mandal Mandal
Bengalgram Rabi N.A N.A 5×5 Mandal Korra 1976-77 1976-77 5×5 Mandal Sugarcane Plt-Rt 1954-55 1957-58 5×5 Mandal Chillies Kh.
Rabi 1976-77 N.A
1976-77 N.A
5×5 5×5
Mandal Mandal
Groundnut Kh. Rabi
1957-58 1957-58
1959-60 1959-60
5×5 5×5
Mandal Mandal
Sesamum Kh. Rabi
1957-58 1957-58
1959-60 1959-60
10×10 10×10
Mandal Mandal
Castor 1957-58 1964-65 10×10 Mandal Cotton 1957-58 1965-66 10×10 Mandal Mesta 1976-77 1976-77 5×5 Mandal Tobacco (N&V) 1957-58 1963-64 5×5 Mandal Sunflower Kh.
Rabi 1992-93 N.A
1992-93 N.A
5×5 5×5
Mandal Mandal
2. ASSAM @ Paddy Aut.
Wint. Sum.
1947-48 1947-48 1974-75
1951-52 1951-52 1974-75
5×5 5×5 5×5
R. Circle R. Circle Sub-Division
Wheat 1973-74 1973-74 5×5 Sub-Division Blackgram 1962-63 1962-63 5×5 Sub-Division Sugarcane 1957-58 1957-58 5×5 Sub-Division Potato 1950-51 1952-53 5×7 R. Circle Rape & Mustard
1957-58 1958-59 5×5 R. Circle
Jute 1951-52 1951-52 5×5 Sub-Division

69
3. BIHAR Paddy Bha.
Agh. Gar.
1945-46 1945-46 1969-70
1948-49 1948-49 1969-70
10×5 10×5 10×5
Anchal Anchal Anchal
Maize Bha. Agh. Gar.
1959-60 1976-77 1959-60
1959-60 1976-77 1959-60
10×5 10×5 10×5
Anchal Anchal Anchal
Ragi Bha. 1976-77 1976-77 10×5 Anchal Wheat 1945-46 1948-49 10×5 Anchal Barley 1945-46 1950-51 10×5 Anchal Gram 1945-46 1949-50 10×5 Anchal Tur 1962-63 1962-63 5×5 Anchal Greengram Bha.
Gar. 1976-77 1977-78
1977-78 1977-78
10×5 10×5
Anchal Anchal
Lakh 1966-67 1966-67 10×5 Anchal Masur 1945-46 1966-67 10×5 Anchal Sugarcane 1958-59 1958-59 5×5 Anchal Chillies 1970-71 1970-71 5×5 Anchal Lichi 1963-64 1963-64 2 tree Anchal Banana 1964-65 1964-65 2 tree Anchal Mango 1963-64 1963-64 2 tree Anchal Guava 1976-77 1976-77 2 tree Anchal Potato Agh.
Rabi 1964-65 1964-65
1964-65 1964-65
5×5 5×5
Anchal Anchal
Onion 1970-71 1970-71 5×5 Anchal Brinjal Agh.
Rabi 1972-73 1972-73
1972-73 1972-73
5×5 5×5
Anchal Anchal
Tomato Agh. Rabi
1972-73 1972-73
1972-73 1972-73
5×5 5×5
Anchal Anchal
Cauliflower 1973-74 1973-74 5×5 Anchal Jackfruit 1965-66 1965-66 2 tree Anchal Rape& Mustard
1966-67 1966-67 5×5 Anchal
Jute 1958-59 1958-59 5×5 Anchal Mesta 1959-60 1962-63 5×5 Anchal 4. CHHATTISGARH Paddy 2000-01 2000-01 5×5 R.I. Circlre Jowar 2000-01 2000-01 5×5 R.I. Circlre Maize 2000-01 2000-01 5×5 R.I. Circlre Wheat 2000-01 2000-01 5×5 R.I. Circlre Barley 2000-01 2000-01 5×5 R.I. Circlre Gram 2000-01 2000-01 5×5 R.I. Circlre Tur 2000-01 2000-01 5×5 R.I. Circlre Lakh 2000-01 2000-01 5×5 R.I. Circlre Soyabean 2000-01 2000-01 5×5 R.I. Circlre Kodan-Kutki 2000-01 2000-01 5×5 R.I. Circlre Chillies 2000-01 2000-01 5×5 R.I. Circlre Potato 2000-01 2000-01 5×5 R.I. Circlre Onion 2000-01 2000-01 5×5 R.I. Circlre Groundnut 2000-01 2000-01 5×5 R.I. Circlre Sesamum 2000-01 2000-01 5×5 R.I. Circlre Rape & Mustard
2000-01 2000-01 5×5 R.I. Circlre
Linseed 2000-01 2000-01 5×5 R.I. Circlre

70
5. GOA Paddy Kh.
Rabi 1967-68 1967-68
1967-68 1967-68
5×5 5×5
Taluka Taluka
Ragi 1970-71 1970-71 5×5 Taluka 6. GUJRAT Paddy Kh.
Sum. 1945-46 2000-01
1956-57 2000-01
5×5 5×5
Taluka Taluka
Jowar Kh. Rabi
1956-57 1945-46
1956-57 1956-57
5×5 5×5
Taluka Taluka
Bajra Kh. Sum.
1946-47 1974-75
1956-57 1974-75
5×5 5×5
Taluka Taluka
Maize 1951-52 1951-52 5×5 Taluka Ragi 1951-52 1955-56 5×5 Taluka Wheat 1945-46 1956-57 5×5 Taluka Gram 1951-52 1956-57 5×5 Taluka Redgram 1976-77 1984-85 10×5 Taluka Greengram 1977-78 1984-85 5×5 Taluka Guvar 1994-95 - N.A - Cumin 1964-65 1971-72 5×5 Taluka Fennel 1964-65 1971-72 5×5 Taluka Onion 1968-69 1984-85 5×5 Taluka Potato 1972-73 1984-85 5×5 Taluka Groundnut Kh.
Sum. 1951-52 1977-78
1957-58 1983-84
5×5 5×5
Taluka Taluka
Rape & Mustard
1984-85 1984-85 5×5 Taluka
Sesamum 1961-62 1964-65 5×5 Taluka Castor 1961-62 1964-65 10×5 Rows Taluka Cotton 1946-47 1957-58 10×5 Taluka Tobacco 1946-47 1951-52 5×5 Taluka Isabgul 1964-65 1983-84 5×5 Taluka 7. HARYANA Paddy 1951-52 1957-58 10×5 Tehsil Bajra 1952-53 1952-53 10×5 Tehsil Maize 1952-53 1952-53 10×5 Tehsil Wheat 1943-44 1951-52 10×5 Tehsil Barley 1951-52 1956-57 10×5 Tehsil Gram 1951-52 1951-52 10×5 Tehsil Sugarcane 1951-52 1961-62 10×5 Tehsil Rape & mustard
1951-52 1968-69 10×5 Tehsil
Cotton 1951-52 1996-97 10×5 Tehsil 8. HIMACHAL PRADESH Paddy 1952-53 1953-54 10x2 Kanungo circle Maize 1952-53 1959-60 10x2 Kanungo circle Wheat 1951-52 1953-54 10x2 Kanungo circle Barley 1960-61 1964-65 10x2 Kanungo circle 9. JAMMU & KASHMIR Paddy Plain&Hill 1958-59 1963-64 10x5 Tehsil Maize Plain&Hill 1958-59 1963-64 10x5 Tehsil Wheat Plain&Hill 1958-59 1963-64 10x5 Tehsil Saffron 1969-70 ** 4x4 Tehsil Rape&Mustard
1969-70 ** 10X5 Tehsil

71
Linseed 1969-70 ** 10X5 Tehsil 10. JHARKHAND Paddy Agh. 2001-02 2001-02 10x5 Anchal Wheat 2001-02 2001-02 10x5 Anchal Barley 2001-02 2001-02 10x5 Anchal Gram 2001-02 2001-02 10x5 Anchal Tur 2001-02 2001-02 10x5 Anchal Masur 2001-02 2001-02 10x5 Anchal Potato Agh.
Rabi 2001-02 2001-02
2001-02 2001-02
5x5 5x5
Anchal Anchal
Brinjai Rabi 2001-02 2001-02 5x5 Anchal Tomoto Agh.
Rabi 2001-02 2001-02
2001-02 2001-02
5x5 5x5
Anchal Anchal
Rape&Mustard
2001-02 2001-02 5x5 Anchal
11. KARNATAKA Paddy Kh.
Rabi Sum.
1945-46 1970-71 1970-71
1945-46 1970-71 1970-71
5x5 5x5 5x5
Tehsil Tehsil Tehsil
Jowar Kh. Rabi Sum.
1945-46 1945-46 1970-71
1945-46 1945-46 1970-71
5x5 5x5 5x5
Tehsil Tehsil Tehsil
Bajra Kh. 1945-46 1946-47 5x5 Tehsil Maize Kh.
Rabi Sum.
1970-71 1970-71 1970-71
1970-71 1970-71 1970-71
5x5 5x5 5x5
Tehsil Tehsil Tehsil
Ragi Kh. Rabi Sum.
1950-51 1984-85 1975-76
1950-51 1984-85 1975-76
5x5 5x5 5x5
Tehsil Tehsil Tehsil
Wheat Rabi 1945-46 1945-46 5x5 Tehsil Gram Rabi 1951-52 1951-52 5x5 Tehsil Redgram Kharif 1957-58 1957-58 10x5 Tehsil Greengram Kh.
Rabi 1971-72 1981-82
1971-72 1981-82
5x5 5x5
Tehsil Tehsil
Blackgram Kh. Rabi
1971-72 1981-82
1971-72 1981-82
5x5 5x5
Tehsil Tehsil
Horsegram Kh. Rabi
1970-71 1981-82
1970-71 1981-82
5x5 5x5
Tehsil Tehsil
Soyabeen Kh. 1991-92 1991-92 5x5 Tehsil Navane Kh. 1970-71 1970-71 5x5 Tehsil Save Kh. 1971-72 1971-72 5x5 Tehsil Sugarcane Annual 1958-59 1958-59 5x5 Tehsil Potato Kh.
Rabi 2000-01 2000-01
2000-01 2000-01
N.A N.A
Tehsil Tehsil
Onion Kh. Rabi
2000-01 2000-01
2000-01 2000-01
N.A N.A
Tehsil Tehsil
Groundnut Kh. Sum.
1957-58 1970-71
1957-58 1970-71
5x5 5x5
Tehsil Tehsil
Sesamum Kh. 1957-58 1957-58 5x5 Tehsil Castor Kh. 1957-58 1957-58 10x5 Tehsil Linseed Rabi 1957-58 1957-58 5x5 Tehsil Safflower Rabi 1977-78 1977-78 5x5 Tehsil Sunflower Kh.
Rabi 1978-79 1988-89
1978-79 1988-89
10x5 10x5
Tehsil Tehsil
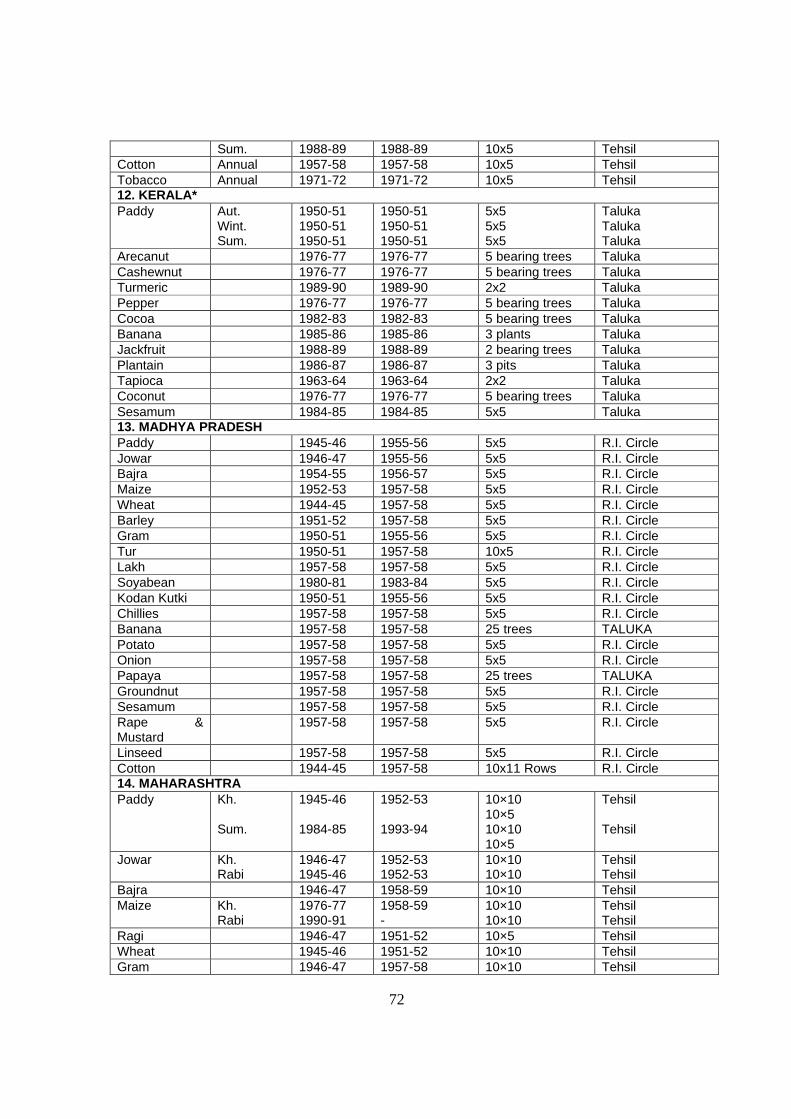
72
Sum. 1988-89 1988-89 10x5 Tehsil Cotton Annual 1957-58 1957-58 10x5 Tehsil Tobacco Annual 1971-72 1971-72 10x5 Tehsil 12. KERALA* Paddy Aut.
Wint. Sum.
1950-51 1950-51 1950-51
1950-51 1950-51 1950-51
5x5 5x5 5x5
Taluka Taluka Taluka
Arecanut 1976-77 1976-77 5 bearing trees Taluka Cashewnut 1976-77 1976-77 5 bearing trees Taluka Turmeric 1989-90 1989-90 2x2 Taluka Pepper 1976-77 1976-77 5 bearing trees Taluka Cocoa 1982-83 1982-83 5 bearing trees Taluka Banana 1985-86 1985-86 3 plants Taluka Jackfruit 1988-89 1988-89 2 bearing trees Taluka Plantain 1986-87 1986-87 3 pits Taluka Tapioca 1963-64 1963-64 2x2 Taluka Coconut 1976-77 1976-77 5 bearing trees Taluka Sesamum 1984-85 1984-85 5x5 Taluka 13. MADHYA PRADESH Paddy 1945-46 1955-56 5x5 R.I. Circle Jowar 1946-47 1955-56 5x5 R.I. Circle Bajra 1954-55 1956-57 5x5 R.I. Circle Maize 1952-53 1957-58 5x5 R.I. Circle Wheat 1944-45 1957-58 5x5 R.I. Circle Barley 1951-52 1957-58 5x5 R.I. Circle Gram 1950-51 1955-56 5x5 R.I. Circle Tur 1950-51 1957-58 10x5 R.I. Circle Lakh 1957-58 1957-58 5x5 R.I. Circle Soyabean 1980-81 1983-84 5x5 R.I. Circle Kodan Kutki 1950-51 1955-56 5x5 R.I. Circle Chillies 1957-58 1957-58 5x5 R.I. Circle Banana 1957-58 1957-58 25 trees TALUKA Potato 1957-58 1957-58 5x5 R.I. Circle Onion 1957-58 1957-58 5x5 R.I. Circle Papaya 1957-58 1957-58 25 trees TALUKA Groundnut 1957-58 1957-58 5x5 R.I. Circle Sesamum 1957-58 1957-58 5x5 R.I. Circle Rape & Mustard
1957-58 1957-58 5x5 R.I. Circle
Linseed 1957-58 1957-58 5x5 R.I. Circle Cotton 1944-45 1957-58 10x11 Rows R.I. Circle 14. MAHARASHTRA Paddy Kh.
Sum.
1945-46 1984-85
1952-53 1993-94
10×10 10×5 10×10 10×5
Tehsil Tehsil
Jowar Kh. Rabi
1946-47 1945-46
1952-53 1952-53
10×10 10×10
Tehsil Tehsil
Bajra 1946-47 1958-59 10×10 Tehsil Maize Kh.
Rabi 1976-77 1990-91
1958-59 -
10×10 10×10
Tehsil Tehsil
Ragi 1946-47 1951-52 10×5 Tehsil Wheat 1945-46 1951-52 10×10 Tehsil Gram 1946-47 1957-58 10×10 Tehsil

73
Tur 1951-52 1967-68 20×10 Tehsil Greengram 2001-02 2001-02 N.A. Tehsil Blackgram 2001-02 2001-02 N.A. Tehsil Sugarcane 1959-60 1964-65 5×5 Tehsil Arecanut 1959-60 1959-60 Cluster of 9
palms Tehsil
Cashewnut 1967-68 1967-68 Cluster of 6palms Tehsil Groundnut Kh.
Sum 1946-47 2001-02
1957-58 2001-02
10×10 10×10
Tehsil Tehsil
Sesamum Kh. Rabi
1959-60 1959-60
1960-61 1960-61
10×10 10×10
Tehsil Tehsil
Linseed 1959-60 1970-71 10×10 Tehsil Safflower 1966-67 1966-67 10×10 Tehsil Sunflower Kh.
Sum Rabi
1983-84 1989-90 N.A
1992-93 1993-94 N.A.
10×10 10×10 10×10
Tehsil Tehsil Tehsil
Coconut 1959-60 1959-60 Cluster of 6palms Tehsil Niger 1966-67 1975-76 10×10 Tehsil Soyabean 2001-02 2001-02 N.A. Tehsil Cotton 1946-47 1957-58 20×10 Tehsil Tobacco 1951-52 1958-59 10×10 Tehsil 16. MEGHALAYA Paddy Aut.
Wint 1971-72 1971-72
1973-74 1973-74
5×5 5×5
District District
Potato Sum. 1973-74 1977-78 Not Fixed District Jute 1973-74 Not adopted 5×5 District 16. ORISA Paddy Aut.
Wint. Sum.
1944-45 1944-45 1963-64
1959-60 1959-60 1963-64
5x5 5x5 5x5
C.D Block C.D Block C.D Block
Mize Aut. Wint. Sum.
1976-77 1976-77 1976-77
1990-91 1990-91 1990-91
5x5 5x5 5x5
C.D Block C.D Block C.D Block
Ragi Aut. Wint. Sum.
1976-77 1976-77 1976-77
1990-91 1990-91 1990-91
5x5 5x5 5x5
C.D Block C.D Block C.D Block
Wheat Sum. 1976-77 1990-91 5x5 C.D Block Greengram Aut.
Wint. Sum.
1976-77 1976-77 1976-77
1990-91 1990-91 1990-91
5x5 5x5 5x5
C.D Block C.D Block C.D Block
Blackgram Aut. Wint. Sum.
1976-77 1976-77 1976-77
1990-91 1990-91 1990-91
5x5 5x5 5x5
C.D Block C.D Block C.D Block
Horsegram Wint. Sum.
1976-77 1976-77
1990-91 1990-91
5x5 5x5
C.D Block C.D Block
Sugarcane Wint. 1976-77 1990-91 5x5 C.D Block Potato Wint. 1967-68 1967-68 5x8 rows C.D Block Groundnut Aut.
Wint. Sum.
1967-68 1967-68 1967-68
1990-91 1990-91 1990-91
5x5 5x5 5x5
C.D Block C.D Block C.D Block
Sesamum Aut. Wint. Sum.
1967-68 1967-68 1967-68
1990-91 1990-91 1990-91
5x5 5x5 5x5
C.D Block C.D Block C.D Block
Rape & Wint. 1976-77 1990-91 5x5 C.D Block

74
Mustard Jute Aut. 1957-58 1959-60 5x5 C.D Block 17. PUNJAB Paddy 1951-52 1957-58 5x5 C.D Block Bajra 1952-53 1952-53 5x5 C.D Block Maize 1952-53 1952-53 5x5 C.D Block Wheat 1943-44 1951-52 5x5 C.D Block Barley 1951-52 1956-57 5x5 C.D Block Gram 1951-52 1951-52 5x5 C.D Block Sugarcane 1958-59 1961-62 5x5 C.D Block Rape & Mustard
1958-59 1972-73 5x5 C.D Block
Cotton 1958-59 1979-80 5x5 C.D Block 18. RAJASTHAN Paddy 1976-77 1976-77 5x5 Tehsil Jowar 1952-53 1953-54 5x5 Tehsil Bajra 1952-53 1956-57 5x5 Tehsil Maize Kh.
Rabi 1952-53 1997-98
1953-54 N.A.
5×5 5×5
Tehsil Tehsil
Wheat 1949-50 1952-53 5x5 Tehsil Barley 1951-52 1953-54 5x5 Tehsil Gram 1951-52 1956-57 5x5 Tehsil Greengram 1994-95 1994-95 5x5 Tehsil Blackgram 1994-95 1994-95 5x5 Tehsil Moth 1994-95 1994-95 5x5 Tehsil Chowla 1994-95 1994-95 5x5 Tehsil Cumin Seed 1997-98 1998-99 5x5 Tehsil Soyabean 1988-89 1988-89 5x5 Tehsil Sugarcane 1970-71 1970-71 5x5 Tehsil Groundnut 1970-71 1970-71 5x5 Tehsil Sesamum 1957-58 1957-58 5x5 Tehsil Rape & Mustard
1957-58 1957-58 5x5 Tehsil
Linseed 1957-58 1958-59 5x5 Tehsil Tara Meera 1997-98 1998-99 5x5 Tehsil Cotton 1953-54 1956-57 10x5 Tehsil 19. TAMIL NADU Paddy K/K/S
S/T/P N/K
1944-45 1944-45 1985-86
1955-56 1955-56 1985-86
5x5 5x5 5x5
Block Block Block
Jowar 1950-51 1955-56 5x5 Block Bajra 1950-51 1955-56 5x5 Block Ragi 1950-51 1955-56 5x5 Block Redgram 1976-77 1976-77 10x5 Block Greengram 1977-78 1977-78 10x5 Block Blackgram 1976-77 1976-77 10x5 Block Horsegram 1986-87 1986-87 10x5 Block Sugarcane 1954-55 1964-65 5x5 Block Chillies 1971-72 1972-73 5x5 Taluka Turmeric 1980-81 1980-81 5x5 Taluka Corinder 1991-92 1991-92 2x2 Taluka Ginger 1980-81 1980-81 2x1 Taluka Tapioca 1975-76 1976-77 2x2 Taluka Potato Wint. 1971-72 1972-73 10x2 Taluka

75
Sum 1971-72 1972-73 10x2 Taluka Onion 1971-72 1972-73 5x5 Taluka Groundnut 1959-60 1973-74 5x5 Block Sesamum 1973-74 1973-74 10x5 Block Cotton 1959-60 1964-65 10x5 Block Sunflower 1983-84 1983-84 10x5 Block Varagu 1986-87 1986-87 5x5 Block Sami 1986-87 1986-87 5x5 Block 20. UTTAR PRADESH Paddy 1945-46 1950-51 Equilateral
triangle T Block
Jowar 1950-51 1950-51 -do- Block Bajra 1950-51 1950-51 -do- Block Maize 1950-51 1950-51 -do- Block Wheat 1943-44 1949-50 -do- Block Barley 1949-50 1949-50 -do- Block Gram plain 1949-50 1949-50 -do- Block Tur/Arhar 1950-51 1950-51 -do- Block Greengram Kh.
Zaid 1965-66 1978-79
1965-66 Not adopted
-do- Block Block
Blackgram Kh. Zaid
1965-66 N.A.
1965-66 N.A
-do- Block Block
Masur 1964-65 1964-65 -do- Block Peas 1959-60 1959-60 -do- Block Sawan/jhongora
Kh. Zaid
1976-77 1976-77
1976-77 1976-77
-do- -do-
Block Block
Kodan 1978-79 N.A. -do- Block Soyabean 1988-89 Not adopted -do- Block Potato 1979-80 1979-80 -do- Block Onion Zaid 1958-59 1959-60 -do- Block Sugarcane 1959-60 1960-61 -do- Block Groundnut 1956-57 1957-58 -do- Block Rape & Mustard
1956-57 1957-58 -do- Block
Linseed 1959-60 1959-60 -do- Block Sesamum 1958-59 1959-60 -do- Block Sunflower Zaid 1991-92 1991-92 -do- Block Cotton 1958-59 1960-61 20×10. Block Tobacco Rabi
Zaid 1988-89 N.A
- N.A.
5×5. 5×5
Block Block
21. WEST BENGAL Paddy Aus.
Aman. Sum
1975-76 1944-45 1980-81
1975-76 1944-45 1980-81
Circle F -do- -do-
Block Block Block
Maize Kh. 1980-81 1980-81 -do- Block Wheat 1951-52 1951-52 -do- Block Barley 1951-52 1951-52 -do- Block Gram 1951-52 1951-52 -do- Block Redgram 1951-52 1951-52 15×15 feet Block Greengram 1951-52 1951-52 Circle Block Blackgram 1951-52 1951-52 -do- Block Lakh 1951-52 1951-52 -do- Block Masur 1951-52 1951-52 -do- Block Peas 1951-52 1951-52 -do- Block

76
Sugarcane 1951-52 1951-52 15×15 feet Block Rape & Mustard
1951-52 1951-52 Circle Block
Sesamum Rabi 1980-81 1980-81 -do- Block Linseed 1952-53 1952-53 -do- Block Jute 1951-52 1951-52 -do- Block Mesta 1980-81 1980-81 -do- Block 22. DADRA & HAVELI Paddy 1967-68 1967-68 5×5 Patelad Ragi 1968-69 1968-69 5×5 Patelad 23. DELHI Paddy 1967-68 1967-68 5×5 C.D. Block Bajra 1959-60 1964-65 5×5 C.D. Block Wheat 1946-47 1958-59 5×5 C.D. Block 24. DAMAN & DIU Paddy Kh. 1967-68 1967-68 5×5 Taluka Bajra 1976-77 1976-77 5×5 Taluka 25. PONDICHERRY Paddy 1 1974-75 1974-75 5×5 Taluka 2 1965-66 1968-69 5×5 Taluka 3 1974-75 1974-75 5×5 Taluka Note:1. ** :- In actual practice results are not adopted for official estimate due to small
sample size and considered not reliable at district level. 2.: *:- For minor crops, surveys are conducted periodically but not regularly. 3. ; @:- Excluding Darjeeling district. 4. : T:-Equilateral triangle of side 10 mts. Area of tringle =
5. : F :- Circle of radious 1.7145 mts.(approx.)

77
Annexure-IV
Crop coverage under crop estimation surveys
Sl. No.
CROPS States Covering the Crop under C.E.S. Total No. of states
1 2 3 4 1. FOOD CROPS
(A) CEREALS 1. Paddy Andhra Pradesh, Assam, Bihar, Chhattisgarh,
Goa, Gujarat, Haryana, Himachal Pradesh, Jammu & Kashmir, Jharkhand, Karnataka, Kerala, Madhya Pradesh, Maharashtra, Meghalaya, Orrisa, Punjab, Rajasthan, Tamil Nadu, Uttar Pradesh, West Bengal, Dadra & Nagar Haveli, Delhi, Daman & Diu and Pondicherry.
25
2. Jowar Andhra Pradesh, Chhattisgarh, Gujarat, Karnataka, Madhya Pradesh, Maharashtra, Rajasthan, Tamil Nadu and Uttar Pradesh.
9
3. Bajra Andhra Pradesh, , Gujarat, Haryana, Karnataka, Madhya Pradesh, Maharashtra, Punjab, Rajasthan, Tamil Nadu, Uttar Pradesh, , Delhi and Daman & Diu.
12
4. Maize Andhra Pradesh, Bihar, Chhattisgarh, Gujarat, Haryana, Himachal Pradesh, Jammu & Kashmir, Karnataka, Madhya Pradesh, Maharashtra, Orrisa, Punjab, Rajasthan, Uttar Pradesh and West Bengal.
15
5. Ragi Andhra Pradesh, Bihar, Goa, Gujarat, Karnataka, Maharashtra, Orrisa, Tamil Nadu and Dadra & Nagar Haveli.
9
6. Wheat Assam, Bihar, Chhattisgarh, Gujarat, Haryana, Himachal Pradesh, Jammu & Kashmir, Jharkhand, Karnataka, Madhya Pradesh, Maharashtra, Orrisa, Punjab, Rajasthan, Uttar Pradesh, West Bengal and Delhi.
17
7. Barley Bihar, Chhattisgarh, Haryana, Himachal Pradesh, Jharkhand, Madhya Pradesh, Punjab, Rajasthan, Uttar Pradesh and West Bengal.
10
(B) PULSES & BEANS 1. Gram Andhra Pradesh, Bihar, Chhattisgarh, Gujarat, 13

78
(Bengalgram) Haryana, Jharkhand, Karnataka, Madhya Pradesh, Maharashtra, Punjab, Rajasthan, Uttar Pradesh and West Bengal.
2. Redgram (Tur/Arhar)
Andhra Pradesh, Bihar, Chhattisgarh, Gujarat, Jharkhand, Karnataka, Madhya Pradesh, Maharashtra, Tamil Nadu, Uttar Pradesh and West Bengal.
11
3. Greengram (Moong)
Andhra Pradesh, Bihar,Gujarat (on pilot basis), Karnataka, Maharashtra, Orrisa, Rajasthan, Tamil Nadu, Uttar Pradesh and West Bengal.
10
4. Blackgram (Urd/Mathikalai)
Andhra Pradesh, Assam, Karnataka, Maharashtra, Orrisa, Rajasthan, Tamil Nadu, Uttar Pradesh and West Bengal.
9
5. Lakh (Khesari) Bihar, Chhattisgarh, Madhya Pradesh and
West Bengal. 4
6. Masur Bihar, Jharkhand, Uttar Pradesh and West Bengal.
4
7. Horsegram (Kulthi)
Andhra Pradesh, Karnataka, Orrisa and Tamil Nadu.
4
8. Peas Uttar Pradesh and West Bengal. 2 9. Moth Rajasthan. 1 10. Chowla Rajasthan. 1 11. Guar Gujarat. 1 ( C ) SMALL MILLETS 1. Sawan
(Jhangora) Uttar Pradesh. 1
2. Korra Andhra Pradesh. 1 3. Kodon-Kutti Chhattisgarh, Madhya Pradesh and Uttar
Pradesh. 3
4. Navane Karnataka 1 5. Save Karnataka 1 6. Samai Tamil Nadu 1 7. Varagu Tamil Nadu 1 ( D ) SUGAR 1 Sugarcane Andhra Pradesh, Assam, Bihar, Haryana,
Karnataka, Maharashtra, Orrisa, Punjab, Rajasthan, Tamil Nadu, Uttar Pradesh and West Bengal.
12
2 Cocoa Kerala. 1 ( E ) CONDIMENTS & SPICES 1. Chillies Andhra Pradesh, Bihar, Chhattisgarh, Madhya
Pradesh, and Tamil Nadu. 5
2. Cumin Gujarat and Rajasthan. 2

79
3. Fennel Gujarat. 1 4. Arecanut Kerala and Maharashtra. 2 5. Pepper Kerala. 1 6. Saffron Jammu and Kashmir. 1 7. Turmeric Tamil Nadu and Kerala. 2 8. Ginger Tamil Nadu. 1 9. Corinder Tamil Nadu. 1 ( F ) FRUITS & VEGETABLES 1. Lichi Bihar. 1 2. Banana Bihar, Kerala and Madhya Pradesh. 3 3. Mango Bihar. 1 4. Guava Bihar. 1 5. Jackfruit Bihar and Kerala. 2 6. Cashewnut Kerala and Maharashtra. 2 7. Tapioca Kerala and Tamil Nadu. 2 8. Potato Assam, Bihar, Chhattisgarh, Gujarat,
Jharkhand, Karnataka, Madhya Pradesh, Meghalaya, Orrisa, Tamil Nadu and Uttar Pradesh.
9. Onion Bihar, Chhattisgarh, Gujarat (on pilot basis),
Karnataka, Madhya Pradesh, Tamil Nadu and Uttar Pradesh.
7
10. Brinjal Bihar and Jharkhand. 2 11. Tomato Bihar and Jharkhand. 2 12. Cauliflower Bihar 1 13. Papaya Madhya Pradesh 1 14. Plantain Kerala. 1
II NON FOOD CROP ( A ) OIL SEEDS 1. Groundnut Andhra Pradesh, Chhattisgarh, Gujarat,
Karnataka, Madhya Pradesh, Maharashtra, Orrisa, Punjab, Rajasthan, Tamil Nadu and Uttar Pradesh.
11
2. Sesamum Andhra Pradesh, Chhattisgarh, Gujarat, Karnataka, Kerala, Madhya Pradesh, Maharashtra, Orrisa, Rajasthan, Tamil Nadu, Uttar Pradesh and West Bengal.
12
3. Castor Andhra Pradesh, Gujarat and Karnataka. 3 4. Rape and
Mustard Assam, Bihar, Chhattisgarh, Gujarat, Haryana, Jammu & Kashmir, Jharkhand, Madhya Pradesh, Orrisa, Punjab, Rajasthan, Uttar Pradesh and West Bengal.
13
5. Linseed Chhattisgarh, Jammu & Kashmir, Karnataka, Madhya Pradesh, Maharashtra, Rajasthan,
8

80
Uttar Pradesh and West Bengal. 6. Safflower Karnataka and Maharashtra. 2 7. Sunflower Andhra Pradesh, Karnataka, Maharashtra,
Tamil Nadu and Uttar Pradesh. 5
8. Soyabean Chhattisgarh, Karnataka, Madhya Pradesh, Maharashtra, Rajasthan, and Uttar Pradesh.
6
9. Tara Meera Rajasthan. 1 10 Coconut Kerala and Maharashtra. 2 11 Niger Maharashtra 1 ( B ) FIBER 1. Cotton Andhra Pradesh, Gujarat, Haryana,
Karnataka, Madhya Pradesh, Maharashtra, Punjab, Rajasthan, Tamil Nadu and Uttar Pradesh.
10
2. Jute Assam, Bihar, Meghalaya, Orrisa, and West Bengal.
5
3. Mesta Andhra Pradesh, Bihar and West Bengal. 3 ( C ) DRUGS & NARCOTICS 1. Tobacco Andhra Pradesh, Gujarat, Karnataka,
Maharashtra, and Uttar Pradesh. 5
2. Isabgol Gujrat 1

81
Annexure - V
Details of driage experiments of the crop estimation surveys
Contents of produce For weighment
Sl. No.
State Crop
First Final
Sub-sampling not done/done at the level of village/field/both
Sampling produce to be dried part (Weight) or whole
Duration of driage (Codes)
Level of Application Stratum/District/State
1 2 3 4 5 6 7 8 9 1. Andhra
Pradesh Paddy Jowar Bajra Maize Ragi Korra Chillies Castor Groundnut Sunflower Mesta
Wet Paddy Cobs Cobs Cobs Cobs Cobs Wet chillies Wet Capsules Green Pods Green seed Wet Plants
Dry paddy Dry Grain Dry Grain Dry Grain Dry Grain Dry Grain Dry Chillies Dry capsules Dry Pods Dry Seed Dry Fibre
Village Village Village Village Village Village Village Village Village Village Village
1 Kg. 2 Kgs. 2 Kgs. 2 Kgs. 2 Kgs. 2 Kgs. 500 gms. 500 gms. (Each picking) 2 Kgs 500 gms. 25 Kgs.
C.W. C.W. C.W. C.W. C.W. C.W. C.W. C.W. C.W. C.W. C.W.
State State State State State State State State State State State
2. Assam Paddy
Wheat Blackgram Rape & Mustard Jute
Wet Paddy Wet Grain Wet Grain Wet Grain Wet Plants
Dry Paddy Dry Grain Dry Grain Dry Grain Dry Fibre
Village Village Village Village Village
1 Kg. 1 Kg. 1 Kg. 1 Kg. Whole
C.W. C.W. C.W. C.W. Weight Dry Fibre
Stratum Stratum Stratum Stratum Stratum
3. Bihar Paddy Maize Ragi Wheat Barley Gram Redgram Greengram Lakh Masur Rape & Mustard Chillies Jute Mesta
Wet Paddy Wet Grain Wet Grain Wet Grain Wet Grain Wet Grain Wet Grain Wet Grain Wet Grain Wet Grain Wet Grain Wet Chillies Wet Plants Wet Plants
Dry paddy Dry Grain Dry Grain Dry Grain Dry Grain Dry Grain Dry Grain Dry Grain Dry Grain Dry Grain Dry Grain Dry Chillies Dry Fiber Dry Fiber
Village Village Village Village Village Village Village Village Village Village Village Both Village Village
Whole Whole Whole Whole Whole Whole Whole Whole Whole Whole Whole Whole Whole Whole
15 days 31 days 31 days 31 days 31 days 31 days 31 days 15 days 15 days 15 days 15 days 15 days 17 days 17 days
District District District District District District District District District District District District District District
4. Chattisgarh Paddy
Jowar Maize Wheat Barley Gram Kodan Kutki Groundnut
Wet Paddy Cobs Cobs Cobs Cobs Cobs Wet grain Wet Pods
Dry Paddy Dry Grain Dry Grain Dry Grain Dry Grain Dry Grain Dry Grain Dry Pods
Village Village Village Village Village Village Village Village
Whole Whole Whole Whole Whole Whole Whole Whole
15 days 15 days 15 days 15 days 15 days 15 days 15 days 15 days
District District District District District District District District
5. Goa Paddy Wet Paddy Dry Paddy Village 5 Kgs. 10 - 15 days Stratum 6. Gujrat Paddy
Jowar Wet Paddy Wet Grain
Dry Paddy Dry Grain
Not done Not done
1 Kg. 1 Kg.
Part C.W.
Stratum Stratum

82
Bajra Maize Ragi Wheat Gram Groundnut
Wet Grain Wet Grain Wet Grain Wet Grain Wet Grain Wet Grain
Dry Grain Dry Grain Dry Grain Dry Grain Dry Grain Dry Grain
Not done Not done Not done Not done Not done Not done
1 Kg. 1 Kg. 1 Kg. 1 Kg. 1 Kg. 1 Kg.
C.W. C.W. C.W. C.W. C.W. C.W.
Stratum Stratum Stratum Stratum Stratum Stratum
7. Haryana Paddy
Bajra Maize Wheat Barley Gram Rape & Mustard
Wet Paddy Cobs Cobs with sheath Wet Grain Wet Grain Wet Grain Wet Grain
Dry Paddy Dry Grain Dry Grain Dry Grain Dry Grain Dry Grain Dry Grain
Not done Not done Not done Not done Not done Not done Not done
Whole Whole Whole Whole Whole Whole Whole
15 days 22 days 22 days 15 days 15 days 15 days 15 days
State State State State State State State
8. Himachal
Pradesh Paddy Maize Wheat Barley
Wet Paddy Cobs Wet Grain Wet Grain
Dry Paddy Dry Grain Dry Grain Dry Grain
Village Village Village Village
Whole Whole Whole Whole
15 days 31 days 15 days 15 days
State State State State
9. Jammu &
Kashmir Paddy Maize Wheat Saffron Rape & Mustard Linseed
Wet Paddy Wet Cobs Wet Grain Wet Bristles Wet Grain Wet Grain
Dry Paddy Dry Grain Dry Grain Dry Grain Dry Grain Dry Grain
Village Village Village Field Village Village
2 Kgs 2 Kgs 2 Kgs Whole 1 Kgs 1 Kgs
15 days 25 days 15 days 10 days 15 days 15 days
District District District District District District
10. Jharkhand Paddy
Wheat Barley Gram Redgram Masur Rape & Mustard
Wet Paddy Wet Grain Wet Grain Wet Grain Wet Grain Wet Grain Wet Grain
Dry Paddy Dry Grain Dry Grain Dry Grain Dry Grain Dry Grain Dry Grain
Village Village Village Village Village Village Village
Whole Whole Whole Whole Whole Whole Whole
15 days 31 days 31 days 31 days 31 days 15 days 15 days
District District District District District District District
11. Karnataka Paddy
Jowar Bajra Maize Ragi Navane Wheat Gram Redgram Greengram Blackgram Horsegram Soyabean Sesamum Save Groundnut Castor Linseed Safflower Sunflower Tobaco
Wet Paddy Cobs Cobs Cobs Cobs Cobs Wet Grain Plants Plants Plants Plants Plants Plants Plants Plants Wet Pods Capsules Plants Plants Flower Green Leaves
Dry Paddy Dry Grain Dry Grain Dry Grain Dry Grain Dry Grain Dry Grain Dry Grain Dry Grain Dry Grain Dry Grain Dry Grain Dry Grain Dry Grain Dry Grain Dry Grain Dry seeds Dry seeds Dry seeds Grain Cured Leaves
Expts. Expts. Expts. Expts. Expts. Expts. Expts. Expts. Expts. Expts. Expts. Expts. Expts. Expts. Expts. Expts. Expts. Expts. Expts. Expts. Expts.
1 Kg. 1 Kg. 1 Kg. 1 Kg. 1 Kg. 1 Kg. 1 Kg. 1 Kg. 1 Kg. 1 Kg. 1 Kg. 1 Kg. 1 Kg. 1 Kg. 1 Kg. 1 Kg. 1 Kg. 1 Kg. 1 Kg. 1 Kg. 1 Kg.
Part C.W. C.W. C.W. C.W. C.W. C.W. C.W. C.W. C.W. C.W. C.W. C.W. C.W. C.W.-3 C.W.-3 C.W. C.W. C.W. C.W. C.W.
District District District District District District District District District District District District District District District District District District District District District
12. Kerala Paddy Wet Paddy Dry Paddy Both 250 gms C.W. District

83
13. Madhya Pradesh
Paddy Jowar Bajra Maize Wheat Barley Gram Kodan Kutki Groundnut
Wet Paddy Cobs Cobs Cobs Cobs Cobs Cobs Wet Grain Wet Grain
Dry Paddy Dry Grain Dry Grain Dry Grain Dry Grain Dry Grain Dry Grain Dry Grain Dry Pods
Village Village Village Village Village Village Village Village Village
Whole Whole Whole Whole Whole Whole Whole Whole Whole
15 days 15 days 15 days 15 days 15 days 15 days 15 days 15 days 15 days
District District District District District District District District District
14. Maharashtra Paddy
Jowar Bajra Maize Ragi Wheat Gram Groundnut Arecanut Cashewnut
Wet Paddy Wet Grain Wet Grain Wet Grain Wet Grain Wet Grain Wet Grain Wet Pods Asoli Wet Nut
Dry Paddy Dry Grain Dry Grain Dry Grain Dry Grain Dry Grain Dry Grain Dry Pods Rotha Dry Nut
Village Village Village Village Village Village Village Village Village Village
5 Kgs. 5 Kgs. 5 Kgs. 5 Kgs. 5 Kgs. 5 Kgs. 5 Kgs. 5 Kgs. 5 Kgs. 5 Kgs.
C.W. C.W. C.W. C.W. C.W. C.W. C.W. 15 days 21-28 days C.W.
District District District District District District District District District District
15. Meghalaya Paddy (Aut. &
Wint.) Jute
Wet Paddy Wet plants
Dry Paddy Dry fibre
Both Both
2 Kgs Whole
C.W. C.W.
District District
16. Orissa Paddy
Maize Ragi Wheat Greengram Blackgram Horsegram Groundnut Seasum Rape & Mustard Jute
Wet Paddy Cobs Pods Wet Grain Wet Grain Wet Grain Wet Grain Wet Grain Wet Pods Wet Pods Wet Pods
Dry Paddy Dry Grain Dry Grain Dry Grain Dry Grain Dry Grain Dry Grain Kernal Dry Grain Dry Grain Dry Fibre
Both Both Both Both Both Both Both Both Both Both Both
1 Kg. 1 Kg. 1 Kg. 1 Kg. 250 gms 250 gms 250 gms 250 gms 250 gms 250 gms 1 Kg.
C.W. C.W. C.W. C.W. C.W. C.W. C.W. C.W. C.W. C.W. C.W.
District State State State State State State State State State State
17. Punjab Paddy Maize Wheat Barley Gram Rape & Mustard Cotton
Wet Paddy Cobs with Sheath Wet Grain Wet Grain Wet Grain Wet Grain Wet Kapas
Dry Paddy Dry Grain Dry Grain Dry Grain Dry Grain Dry Grain Dry Kapas
Village Not done Village Village Village Village Village
Whole 5 Kgs. Whole Whole Whole Whole Whole II Pickings
15 days 20 days 15 days 15 days 15 days 15 days 15 days
State State State State State State State
18. Paddy
Jowar Bajra Maize Wheat Barley Gram Chowla Greengram Blackgram Moth Cumin Soyabean Groundnut Sesamum
Wet Paddy Cobs Cobs Cobs Wet Grain Wet Grain Wet Grain - - - - - Wet Grain Wet Pods Wet Grain
Dry Paddy Dry Grain Dry Grain Dry Grain Dry Grain Dry Grain Dry Grain - - - - - Dry Grain Dry Grain Dry Grain
Not done Village Village Village Village Village Village - - - - - Village Village Village
Whole Whole Whole Whole Whole Whole Whole - - - - - Whole Whole Whole
15 days 22 days 22 days 22 days 15 days 15 days 15 days - - - - - 15 days 15 days 15 days
District District District District District District District District District District District District District District District

84
Rape & Mustard Linseed Tarameera
Wet Grain Wet Grain Wet Grain
Dry Grain Dry Grain Dry Grain
Village Village Village
Whole Whole Whole
15 days 15 days N.A
District District District
19. Tamil Nadu Paddy
Bajra Jowar Ragi Turmeric Chillies Coriander Varagu Samai Groundnut
Wet Paddy Wet Cobs Wet Cobs Wet Cobs Wet Turmeric Wet Chillies WetCoriender Wet Grain Wet Grain Wet Pods
Dry Paddy Dry Cobs Dry Cobs Dry Cobs Dry Turmeric Dry Chillies WetCoriendr Dry Grain Dry Grain DryPods
Village Village Village Village Not done Not done Not done Village Village Village
2 Kgs. 2 Kgs. 2 Kgs. 2 Kgs. 1 Kgs. 1 Kgs. 1 Kgs. 2 Kgs. 2 Kgs. 2 Kgs.
C.W. C.W. C.W. C.W. C.W. 3 to 4days C.W. C.W. C.W. C.W.
Block Block Block Block Taluka Taluka Taluka Block Block Block
20. Uttar
Pradesh Paddy Jowar Bajra Maize Wheat (Pln.) Barley (Pln) Gram Greengram Blackgram Masur Soyabean Peas Sawan/Jhangora Kodan Kutki Tur Groundnut Sesamum Rape & Mustard Linseed Sunflower Cotton Tobaco
Wet Paddy Cobs Cobs Cobs Wet Grain Wet Grain Wet Grain Wet Grain Wet Grain Wet Grain Wet Grain Wet Grain Wet Grain Wet Grain Wet Grain Pods Pods Pods Wet Grain Wet Grain N.A. Wet Cotton Wet Leaf & Stalk
Dry Paddy Dry Grain Dry Grain Dry Grain Dry Grain Dry Grain Dry Grain Dry Grain Dry Grain Dry Grain Dry Grain Dry Grain Dry Grain Dry Grain Dry Grain Dry Pods Dry Pods Dry Pods Dry Grain Dry Grain N.A. Dry Cotton Dry Leaf & Stalk
Village Village Village Village Village Village Village Village Village Village Village Village Village Village Village Village Village Village Village Village N.A. Expts. Village
5 kgs. 10 kgs. 10 kgs. 10 kgs. 5 kgs. 5 kgs. 5 kgs. 5 kgs. 5 kgs. 5 kgs. 5 kgs. 5 kgs. 5 kgs. 5 kgs. 5 kgs. 5 kgs. 5 kgs. 10 kgs. 5 kgs. 5 kgs. N.A. Whole 10 kgs.
15 days 15 days 15 days 15 days 15 days 15 days 15 days 15 days 15 days 15 days 15 days 15 days 15 days 15 days 15 days 15 days 15 days 15 days 15 days 15 days N.A. Same day 20 days
District District District District District District District District District District District District District District District District District District District District District District District
21. West Bengal Paddy
Wheat Barley Maize Gram Redgram Blackgram Lakh Masur Peas Rape & Mustard Linseed Sesamum Jute Mesta
Wet Paddy Ear heads Ear heads Cobs with Sheath Pods Pods Pods Pods Pods Pods Pods Seed buds Seed buds Plants Plants
Dry Paddy Dry Grain Dry Grain Dry Grain Dry Grain Dry Grain Dry Grain Dry Grain Dry Grain Dry Grain Dry Grain Dry Grain Dry Grain Dry Fibre Dry Fibre
Expts. Expts. Expts. Expts. Expts. Expts. Expts. Expts. Expts. Expts. Expts. Expts. Expts. Expts. Expts.
500 gms. 500 gms. 500 gms. 500 gms. 500 gms. 500 gms. 500 gms. 500 gms. 500 gms. 500 gms. 500 gms. 500 gms. 500 gms. 20 Kgs. 20 Kgs.
12 days 12 days 12 days 12 days 12 days 12 days 12 days 12 days 12 days 12 days 12 days 12 days 12 days 12 days 12 days
Block Block Block Block Block Block Block Block Block Block Block Block Block Block Block
22. Dadar
&Nagar Haveli
Paddy Ragi
Wet Paddy Wet Grain
Dry Paddy Dry Grain
Expts. Expts.
1 kg 1 kg
3 days 3 days
Stratum Stratum
23. Delhi Paddy Wet Paddy Dry Paddy Not done Whole C.W.-3 State

85
Bajara Wheat
Cobs Wet Grain
Dry Grain Dry Grain
Not done Not done
Whole Whole
3 days C.W.-3
State State
24. Daman &
Diu Paddy Bajara
Wet Paddy Wet Cobs
Dry Paddy Dry Cobs
Village Expts.
5 Kgs 5 Kgs.
C.W.-3 C.W.-3
Taluka Taluka
25. Pondicherry Paddy (I, II, III) Wet Paddy
Dry Paddy
Note done Part 6 - 9 days Regional level
Note:- 1. C.W. = Constant Weight for unspecified consecutive weightments. 2. C.W.-3 = Constant Weight for 3 consecutive weightments.

86
Annexure - VI
Estimation procedure for estimation of crop yield through Crop Estimation Surveys
The methodology generally adopted for estimating the average yield of
crop and its sampling error is outlined below:
At the stratum level, the average yield of the crop is obtained as a simple arithmetic mean of plot yields (net) within it. If
ijkX = The plot yield (net) in gms/plot of the kth plot in the jth village in the
ijn = Number of experiments analyzed in the jth village of ith stratum.
im = Number of villages in which experiments are analyzed in the ith stratum.
in = Number of experiments analyzed in the ith stratum. S = The number of strata in a district.
ia = The area (net) of the crop in the ith stratum. d = The driage ratio. f = The conversion factor for converting the green yield per plot into the yield of
dry marketable produce per hectare. We obtain the stratum level average of the green yield for the ith stratum as
∑∑= =
=
i ijm
j
n
kijk
iij X
nX
1 1
1
and the district level average yield of the dry marketable produce per hectare is given by
∑
∑
=
== S
ii
S
iiji
a
XafdX
1
1..
The sampling variance of X is obtained as
( )
( )
2
1
12
1
22
1
222.
−+
=
∑
∑∑
∑
=
=
=
=
S
ii
S
i ii
m
jijiS
i i
i
a
n
naWB
na
Wfd
XV
i
λ
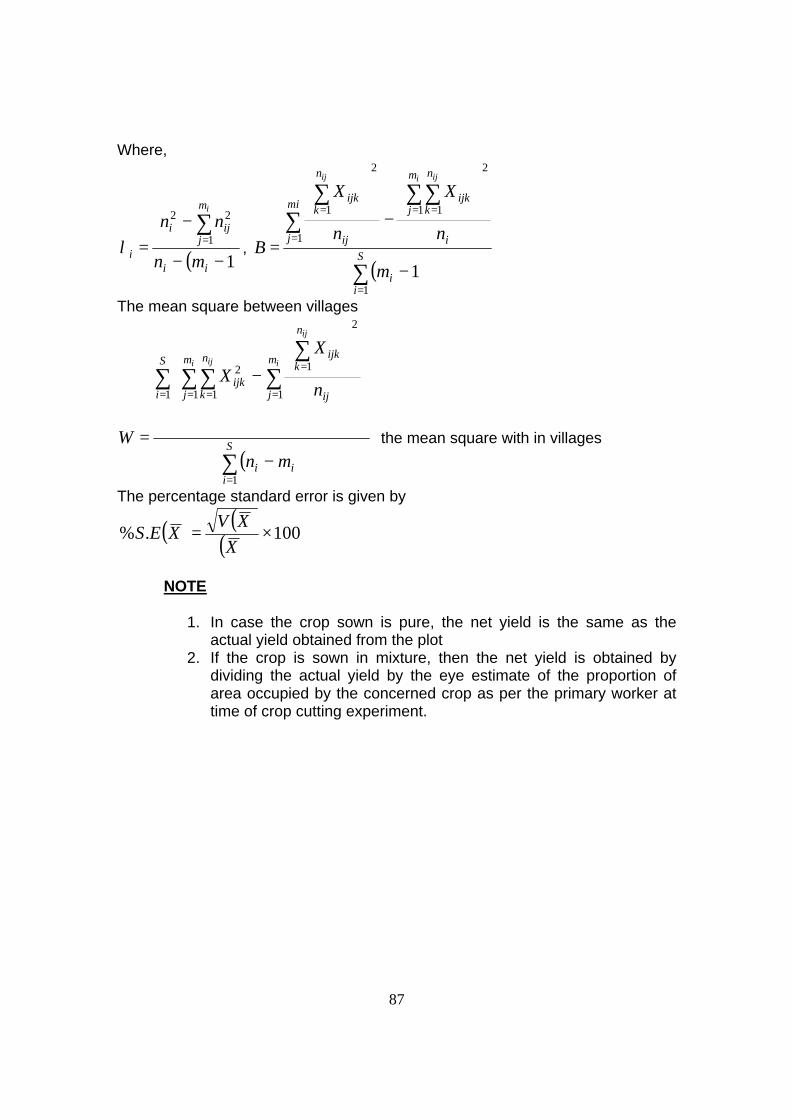
87
Where,
( )11
22
−−
−=
∑=
ii
m
jiji
i mn
nni
λ ,
( )∑
∑∑∑
∑
=
= =
=
=
−
−
= S
ii
i
m
j
n
kijkmi
j ij
n
kijk
m
n
X
n
X
B
i ijij
1
2
1 1
1
2
1
1
The mean square between villages
( )∑
∑ ∑∑ ∑∑
=
= = = =
=
−
−
= S
iii
S
i
m
j
n
k
m
j ij
n
kijk
ijk
mn
n
X
X
W
i ij i
ij
1
1 1 1 1
2
12
the mean square with in villages
The percentage standard error is given by
( ) ( )( ) 100.% ×=X
XVXES
NOTE
1. In case the crop sown is pure, the net yield is the same as the actual yield obtained from the plot
2. If the crop is sown in mixture, then the net yield is obtained by dividing the actual yield by the eye estimate of the proportion of area occupied by the concerned crop as per the primary worker at time of crop cutting experiment.

88
Annexure-VII
Methodology for Calculation of Index Numbers of Area, Production and Yield
Let aijk be the area under ith crop in the jth year in kth state. aiok be the area under ith crop in base year period in kth state. Pijk be the production of ith crop in the jth year in kth state. Piok be the production of ith crop in base year period in kth state. Wik be the weight of ith crop in kth state. Bio be the price per unit of the ith crop in the base period. For the k and for the j, individual crop indices are calculated as below:
(a) Index number of area = ijkIA 100 x =iok
ijk
a
a
(b) Index number of production = ijkIP 100 x =iok
ijk
P
P
(c) Index number of yield = 100 x ijk
ijk
IA
IP
For any sub-group G of commodities, the indices for the year j and state k are calculated as below:
(a) Index number of area = 100 x ∑∑
iok
ijk
a
a
The state index is obtained by including all the items of the state in sub group G where the summation is taken over items in G.

89
(b) Index number of production = 100 x ioiok
ioijk
BP
BP
∑∑
(c) Index number of yield = 100 x area ofnumber Index
production ofnumber Index

90
Annexure-VIII
Primary agency for crop cutting experiments Under Crop Estimation Surveys
Sl. No.
State Agency Designation
1 2 3 4 1. Andhra Pradesh 1. Statistical
2. Agriculture Assistant Statistical Officer Agricultural Extention Officer
2. Assam Statistical Field Assistant 3. Bihar 1. Revenue
2. Statistical
3. Agriculture
Circle Inspector A. Block Statistical Supervisor B. Junior Field Investigator Block Agricultural Officer
4. Chhattisgarh Revenue A. Revenue Inspector B. Headquarter Patwari
5. Goa Agricultural Statistics Investigator 6. Gujarat Agriculture Gram Sevak 7. Haryana 1. Agriculture
2. Revenue
Asstt. Development Officer Girdawar Kanungo
8. Himachal Pradesh
1. Agriculture 2. Revenue
Agricultural Inspector Field Kanungo
9. Jammu & Kashmir
Revenue A. Office kanungo B. Girdawar Kanungo C. Backward Class Girdawar D. Statistical Girdawar
10. Jharkhand N.A. N.A. 11. Karnataka 1. Revenue
2. Agricultural Village Accountant Agricultural Assistant
12. Kerala Statistical Investigator 13. Madhya Pradesh Revenue A. Revenue Inspector
B. Headquarter Patwari 14. Maharashtra 1. Revenue
2. Zila Parishad 3. Agricultural
Revenue Inspector Gram Sewak Agricultural Assistant and Gram Extension Worker

91
15. Meghalaya Statistical Field Assistant 16. Orissa Statistical Statistical Field Surveyor 17. Punjab Agricultural A. Agricultural Inspector
B. Compost inspector 18. Rajasthan 1. Revenue
2. Agricultural
Inspector Land Records Assistant Agricultural Officer
19. Tamil Nadu 1. Agricultural 2. Statistical 3. Horticultural
Agricultural Officer Block Statistical Inspector Horticultural Officer
20. Uttar pradesh 1. Revenue 2. Cane Development 3. Cotton Development
Revenue Inspector Cane Supervisor Cotton Supervisor and Kamdar
21. West Bengal Agricultural Statistics Asstt. Investigator 22. Dadra & Nagar
Haveli 1. Revenue 2. Development & Planning
Patel Talahi Gram Sevak
23. Delhi Agriculture Village level Worker 24. Daman & Diu 1. Revenue
2. Rural Development
Talathis Gram Sevak & Village Panchayat Secretary
25. Pondicherry Statistical Field Supervisor

92
Annexure IX Procedure for estimation of area and yield rate of different crops along with standard error I- Estimation of Area 1. Estimates A-III and A-IV: Two sets of area figures under different crops for the selected 20 survey numbers from each of the selected village under the ICS scheme are obtained, one set of figures as copied from the corresponding entries of the Khasra Register prepared by Patwari and the other set as observed by the Superintendents of NSSO/State Supervisors. The totals of the area under various crops recorded for the 20 survey numbers are also obtained. Thus from schedules of I.C.S. two area figures under different crops for 20 survey/serial numbers will be known, the first set being the area figures as recorded by the Patwari in the Khasra Register and the second set being the area figures as observed by Superintendent/State Supervisor. Two separate estimates viz. A-III and A-IV respectively based on the Patwari’s record and Superintendent’s/State Supervisor’s observations are prepared. The estimated area under the crop in the in the jth village in ith stratum in the district is given by
ijij
ijij a
S
HY ×=
The estimated area in the ith stratum is obtained as
∑=
=in
jij
i
ii y
nN
Y1
ˆ
where,
ija = Total area under a crop in the selected survey numbers in the jth village of
ith stratum.
ijS = Number of selected survey numbers in the jth village in the ith stratum.
ijH = Highest survey/serial numbers in the jth sample village in the ith stratum.
in = Number of sample villages selected in the ith stratum and
iN = Total number of revenue villages in the ith stratum. The estimates of area thus obtained for each stratum in a district are added to get the estimates of area at the district level ( dY ) and the total of the district level estimates gives the state level estimate of area of the crop.

93
In case of permanently settled states for which total geographical area of the village is not available and selection of plots has been done by method of selection of households in the village, the estimated area under the crop in the jth
village in the ith stratum is given by using the inflation factor: ( )
ijij bhouseholdssampleofNumber
villagetheinhouseholdsofnumberTotaly ×=
where,
ijb = Total area under the crop in the selected households in the jth sample village
of ith stratum. In this way we obtain two sets of area estimates, A-III and A-IV based on entries made in the Khasra Register by patwari and observations of Superintendent/State Supervisor respectively as stated before. The estimates of variance at district level is calculated from
( ) ( )( )
−
−−
=∑∑
∑∑′
= =
′
= =
11 1
2
1 12
n
n
YY
nnNN
YV
K
i
n
j
K
i
n
jij
ij
d
i
i
where, K ′= the number of strata in a district in which the estimates of area under the reference crop is not zero.
∑′
==
K
iiNN
1 and ∑
′
==
K
iinn
1
The variance at state level is the sum of the variance of district level estimate. The percentage standard error of the estimate of area at state level is obtained as follows:
% Standard Error = 100..
×Estimate
EstimatetheofES
Where, standard error is the square root of the state level variance which is the sum of variances of the district level estimates. 2. Estimates A-I and A-II Patwari prepares crop abstracts for each village on the basis of entries of area figures under different crops in the Khasra Register. ICS schedule gives area figures under different crops, as reported by patwari in the crop abstract. Superintendent of NSSO/State Supervisor checks the page-wise totaling of area

94
figures recorded under different crops under Khasra Register by the Patwari and records the corrected totals of area under crop in the ICS schedule. Thus again we obtain two sets of area figures under a crop in a selected village. Based on these two sets of area figures under a crop in a village two estimates A-I and A-II respectively are prepared. The estimation procedure for preparing these estimate is similar to that given at para 1 above except that the estimate now represents the area under a crop as reported in ICS schedule. 3. Pooling of estimates: The estimates of the Central and State samples at State level are pooled as under: Let
cY = estimate of area at state level for Central sample.
sY = estimate of area at state level for State sample.
cV = estimate of variance at state level for Central sample. and
sV = estimate of variance at state level for State sample.
Calculate c
c Ve ˆ
1= and
ss V
e ˆ1
=
Then pooled estimate of area is given by
sc
ssccp ee
YeYeY
++
=ˆˆ
ˆ
and an estimate of its variance by
( )sc
p eeYV
+=
1ˆ
II- Estimate of Yield Rates Sample checks on crop cutting experiments are planned on two experiments for a crop in each of the selected villages. The State primary workers conduct the experiments in the presence of Superintendent/State Supervisor who supervise the experiment and also correct the error, if any. These corrected yield rate are filled in ICS schedule. On the basis of this information the estimates of yield rates for the district and state are worked out. Let
ijkY = plot yield in gms/plot. in the kth experimental plot of jth sample village in the
ith district.
ijn = number of crop cutting experiments conducted in the jth sample village of the
ith district. in = number of crop cutting experiments selected in the ith district.

95
ia = Total area under the crop in the ith district.
im = number of selected villages in which crop cutting experiments are conducted in the ith district. E= mean square of yield between villages F= mean square of yield within village and d= number of districts in the state. f= The conversion factor for converting the green yield per plot in to the yield of dry marketable produce per hectare. Then the average yield under the crop in the ith district is given by:
i
m
j
n
kijk
i n
YY
i ij
∑∑= == 1 1
and the estimated average yield rate at state level is given by:
fa
YaY d
ii
d
iii
××
=∑
∑
=
=
1
1
Average yield thus obtained is converted to dry grain yield in terms of Kg./ha. The estimated variance of estimated yield rate at state level is given by
( )
( )
2
1
12
1
22
1
2
−+
=
∑
∑∑
∑
=
=
=
=
d
ii
d
i ii
m
jijid
i i
i
a
n
naFE
na
F
YV
i
λ
Where,
( )11
22
−
−=
∑=
ii
m
jiji
i mn
nni
λ

96
( )∑
∑ ∑∑∑∑
=
= =
= ==
−
−
= d
ii
d
i
m
j i
m
j
n
kijk
ij
n
kijk
m
n
Y
n
Y
E
i
i ijij
1
1 1
2
1 1
2
1
1
( )∑
∑ ∑ ∑∑
∑
=
= = =
=
=
−
−
= d
iii
d
i
m
j
m
j ij
n
kijkn
kijk
mn
n
Y
Y
F
i i
ij
ij
1
1 1 1
2
1
1
2
and percentage standard error is given by
( ) ( )100% ×=
yyV
YSE

97
Annexure-X Recommendations of National Statistical Commission 2001 The National Statistical Commission (2001) recommendations for improving the quality of area statistics, yield statistics and crop forecasting are as follows: Area Statistics
(i) As the data from a 20 per cent sample of villages is large enough to estimate crop area with a sufficient degree of precision at the All-India, State and district levels, crop area forecasts and final area estimates issued by the Ministry of Agriculture should be based on the results of the 20 per cent Timely Reporting Scheme (TRS) villages in the temporarily settled States and Establishment of an Agency for Reporting Agricultural Statistics (EARAS) scheme villages in the permanently settled states. In the case of the North-Eastern States, Remote Sensing Methodology should be used for this purpose after taking its viability.
(ii) The patwari and Supervisors above him should be mandated to accord the highest priority to the work of the girdawari and the patwari be spared, if necessary, from other duties during the period of girdawari.
(iii) The patwari and the primary staff employed in Establishment of an Agency for Reporting Agricultural Statistics (EARAS) should be imparted systematic and periodic training and the field work should be subjected to intensive supervision by the higher-level revenue officials as well as by the technical staff.
(iv) For proper and timely conduct of the girdawari, the concerned supervisory staff should be made accountable.
(v) Timely Reporting Scheme (TRS) and Establishment of an Agency for Reporting Agricultural Statistics (EARAS) scheme should be regarded as programmes of national importance and the Government of India at the highest level should prevail upon the State Governments to give due priority to them, deploy adequate resources for the purpose and ensure proper conduct of field operations in time.
Yield Statistics
(i) In view of the importance of reliable estimates of crop production, the States should take all necessary measures to ensure that the crop cutting surveys under the General Crop Estimation Survey (GCES) are carried out strictly according to the prescribed programme.
(ii) Efforts should be made to reduce the diversity of agencies involved in the fieldwork of crop cutting experiments and use as far as possible agricultural and statistical personnel for better control of field operations.

98
(iii) A statistical study should be carried out to explore the feasibility of using the ICS data for working out a correction or adjustment factor to be applied to official statistics of crop area to generate alternative estimates of the same. Given the past experience of the Land Utilisation Surveys of the NSS and the controversies they created, the Commission is of the view that the objective of redesigning of the ICS at present, should be restricted to working out a correction factor.
(iv) The two series of experiments conducted under the National Agricultural Insurance Scheme(NAIS) and the General Crop Estimation Survey (GCES) should not be combined for deriving estimates of production as the objectives of ht two series are different and their merger will affect the quality of general crop estimates.
(v) Crop estimates below the level of district are required to meet several needs including those of the National Agricultural Insurance Scheme (NAIS) Special studies should be taken up by the National Statistical Office to develop appropriate “small area estimation “techniques for this purpose.
Crop Forecasting
a) The Ministry of Agriculture and the National Crop Forecasting Centre (NCFC) should soon put in place an objective method of forecasting the production of crops/.
b) The National Crop Forecasting Centre (NCFC) should be adequately strengthened with professional statisticians and experts in other related fields.
c) The programmer of Forecasting Agricultural output using Space, Agro-
meteorology and Land based observations (FASAL), which is experimenting the approach of Remote Sensing to estimate the area under principal crops should be actively pursued.
d) The states should be assisted by the center in adopting the objective
techniques to be developed by the National Crop Forecasting Centre (NCFC).

99
Annexure-XI
Model Schedules for Crop Estimation Surveys
FORM I - Particulars of selected fields
Note: 1. Fill up the form on the date of field selection at least a month in advance of General crop harvest dates in the tract.
2. Answer every item. If any is nil write ‘nil’. If any Information could not be obtained write ‘not available’. Delete inappropriate items where choices
are provided. 3. Prepared three copies and post one copy, the same day the field
selection is done, to Director, Agriculture and Jt. Director (Stat.). Name of crop: Variety if any:
1. Particulars of Village 2. Particulars of visit
1.1 Year 1.2 Season 1.3 District 1.4 Taluk 1.5 Block 1.6 Project 1.7 Village 1.8 Area under the crop in the village
in the current season 1.9 Area under the crop in the
corresponding season of last year according to revenue records
1.10 State the reasons for variation in area during the current season as compared to last year.
2.1 Date of visit to the village
2.2 Date of dispatch of the result
2.3 Name of the primary worker
2.4 His designation and Headquarters

100
3. Selection of Fields Experiment I II 3.1 Random numbers assigned 3.2 Remainder on dividing the Random number by the
Highest Serial number of the survey number in the village 3.3 Reason for rejection, if any, of the Survey numbers (list
out the rejected survey numbers against the concerned item) (a) Crop not grown (b) Crop is not germinated or replaced by other crop (c) Plot not accommodated in any of the fields
3.4 Survey number finally selected 3.5 (a) Remainder on divisions of the selected Survey No.
(b) Remainder on divisions of the selected Survey No. by the number of sub-division in it. (c) Sub-division numbers rejected, if any, with reasons (d) Sub-division number finally selected.
3.6 Survey and Sub-division No. finally selected 3.7 (i) State whether systematic land development in the
selected field is completed and extension work is carried out on 100% (ii) State whether systematic land development in the selected field is completed and extension work is carried out between 50% to 100%. (iii) State whether systematic land development in the selected field is completed and extension work is carried out 50% and below. (iv) Systematic land development is not yet taken up.
3.7 (a) Number of fields in the selected Survey/Sb-Division No.
3.8 Average width of the bunds round the selected field (based on at least 4 observations).
3.9 Name of the cultivator of the selected field 3.10 Soil type, texture of the selected field:
(a) Clay, Loamy, Sandy, Sandy Loamy, Clay Loamy, deep black Cotton soil, light black Cotton soil, or others (specify)
(b) Type of soil according to Revenue Settlement Record if available

101
4. Selection of Plots 4. (A) Paddy, Jowar, Bajra, Ragi, Maize, Groundnut, Sesamum and other crops when they are not sown in rows
Experiment I II
L B L B 4.1 Length and breadth from the S.W. corner of the field
selected (in steps) 4.2 Length minus 7 steps and breadth minus 7 steps except
in few crops as the case may be. 4.3 Random numbers selected for location of plots
(B) Redgram, Castor, Sugar-cane, Cotton Tobacco and other crops(in one direction) where the crop is sown in direct rows.
Experiment I II
L B L B 4.4 Total number of rows in the field (i.e. breadth of the field) 4.5 Average number of rows falling in a distance equal to 10
M. for Redgram, Castor and Cotton, and 5 M for Sugar-cane and Tobacco or as the case may be.
4.6 Total number of rows minus average number of rows contained in 10M/5M plus one.
4.7 Number of random row selected 4.8 Length of the longest row in steps 4.9 Length minus 13 steps for Redgram, Castor and Cotton,
and length minus 7 steps for Sugar-cane and Tobacco or as the case may be.
4.10 Random step number selected 4.11 Total Number of rows along the length and breadth of
the field 4.12 Average number of rows in a distance of 5 meters
(separately for Length and Breadth) 4.13 Total number of rows along the length/breadth minus
average number of rows falling in 5 M. plus one 4.14 Number of random row selected for length and breadth

102
5. Information on the cultural practices followed in the Selected Fields
Experiment I II
5.1 Appropriate date and month of sowing for transplanting 5.2 State – early, normal or late 5.3 Method of sowing:
(Broadcasting, transplanting, line sowing, drill sowing etc.) 5.4 Name of the last crop grown in the field 5.5 Date fixed for harvesting 5.6 (a) Seed sown (Kgs. Per acre)*
(b) Name and strain No. (c) Whether local or improved or high yielding variety (d) Source (i.e. whether the seed is from the cultivator’s
previous harvest or procured locally or through departmental agencies)
*Enquire from cultivator the quantity of seed actually sown in the field and covert in into Kgs. Per acre.
6. Information on Irrigation of the Selected Fields
Experiment I II
6.1 Field irrigated or unirrigated 6.2 If irrigated state the source [canal/tank/well/others(specify)]
7. Condition of the Crop
Experiment
I II 7.1 Condition of the crop in the field whether the crop is
affected by abnormal seasonal conditions/pests/diseases or damaged due to any other reason, (reason to be specified)
7.2 Eye Estimate of the net yield per acre of the experimental crop

103
8 Information on the proportion of the constituent crops in the Selected Fields
Experiment
I II 8.1 State whether the experimental crop is sown
(a) Pure (b) Mixture
8.2 If sown as mixture state:
(a) Whether the experimental crop is sown exclusively in separate rows (without any other crop in the same row)
(b) Whether the experimental crop is sown mixed up with other crop by mixing the seed (either in rows or otherwise)
Crop Rows
Crop Rows
8.3 (a) If sown in separate rows, state: (i) Average number of rows of each crop falling in a
distance of 10 Metres/5 Meters (equal to plot size of the experiment) (Calculate averages based on observations at three different places)
(ii) Normal distance required between two rows of experimental crop for sowing as pure crop
1. 2. 3`.
(b) If sown mixed up with other crops
(i) Seed actually used in the field in Kgs. /acre
(ii) Seed rate for raising as pure Kgs./ acre
[Particulars for items (i) and (ii) above should be given crop-wise for all crops in the mixture]
Crop Seed (Kg.) 1. 2. 3. 4. 1. 2. 3. 4.
Crop Seed (Kg.)
9.1 Rough Sketch of the selected field 9.2 Signature of the Primary Worker 9.3 Signature of Inspecting Officer with designation, date of visit and remarks, if
any

104
Model Schedules for Crop Estimation Surveys
FORM II - Results of harvesting
Note 1. Fill up the form on the date of harvest. 2. Answer every item. Do not leave blanks. If any item is nil write ‘Nil”. Delete inappropriate items where choices are given. Name of crop: Variety if any:
1. Particulars of Villages 1.1 Year 1.2 Season 1.3 District 1.4 Taluk 1.5 Block 1.6 Village
1.7 Name of the primary worker 1.8 His designation and Head- Quarter 1.9 Date/Dates of harvest of 1st and 2nd pickings
Experiment 2. Particulars of Selection of Plots I II
2.1 Survey/Sub-Division number selected for experiment 2.2 Name of the cultivator 2.3 Plot size adopted (in Meters) L B L B 2.4 Give actual dimensions of the four sides of the selected plot in Meters and Centimeters for the identified crops.
L1 L2
B1 B2
2.5 State whether the experimental crop is sown pure or mixture
2.5 Crop Mixtures: In the case of crop mixtures furnish the following: (a) If the experimental crop is sown exclusively in separate
rows without any other crop in the same row state:
(i) Number of rows of the experimental crop actually falling in the selected plot
(ii) Normal distance required between two rows of the Experimental crop for sowing as pure crop.

105
(b) If sown mixed up with other crops by mixing of the seed:
(i) Seed actually used in the field in Kgs. per acre (furnish crop-wise particulars for all crops in the mixture).
Crop: Seed Kgs. per acre 1. 2. 3.
(ii) Seed rate required for raising pure crops in Kgs. per acre (furnish crop-wise particulars for all crops in the mixture)
1. 2. 3.
2.6 State whether systematic land development in the selected field is completed and extension work is carried out on (i)100% (ii) Between 50 to 100% (iii) 50% and below (iv) Systematic land development is not yet taken up.
Item Experiments I II
2.7 Condition of the crop in the selected field whether the crop is affected by abnormal seasonal conditions/pests/diseases or damage due to any other reason (to be specified)
2.8 General condition of the crop in the village
3. Information on irrigation of the selected field 3.1 Field irrigated or unirrigated 3.2. (a) If irrigated state the source
(Canal/Tank/Well/Others, specify) (b) State whether the water was adequate for raising the crop in the field. If not adequate state: (i) The number of wettings required normally (ii) The number of wettings actually given

106
4. Information on Manuring, Fertilizer Application and
Pesticides/Insecticides used in the Selected Field
4.1 If manured in the current season specify the name and quantity of the manure applied:
(a) Green Manure: Name Quantity (Kgs. per acre) (b) Bulky Manure: Name Quantity (Cart loads per acre) (c) Other organic and organic concentrates: Name Quantity (Kgs. per acre) (d) Chemical fertilizers : 1. Name Quantity (Kgs. per acre) 2. Name Quantity (Kgs. per acre) 3. Name Quantity (Kgs. per acre) 4. Name Quantity (Kgs. Per acre)
(e) Fertilizer Mixtures: Name Quantity (Kgs. per acre)
4.2 Pesticides or Insecticides used: Name Quantity per acre :

107
5. Results of Harvesting Experiment
I II 5.1 Date fixed for harvesting as per Form I 5.2 Actual date of harvest 5.3 Date of first weigment, if different from 5.2 above with
reasons 5.4 Weight of produce soon after harvest (Note against the
concerned item deleting the inapplicable terms).
(a) Weight of un-dried grain (b) Number of cobs in case of Jowar, Bajra, Maize (c) Number of bundles in case of Redgram and Sesamum (d) Weight of un-dried cobs Jowar/Bajra/Maize (sheathed
cobs/Ragi (ear heads) (e) Weight of un-dried cleaned pods (Groundnut) (f) Weight of stripped cane (Sugar-cane) (g) Weight of Cotton (Kapas) 1st Picking 2nd Picking (h) Weight of un-dried Castor (capsules) 1st Picking 2nd Picking (i) Number of green leaves of Tobacco 1st Picking (Virginia) 2nd Picking (j) Weight of green leaves of Tobacco 1st Picking (Virginia) 2nd Picking (k) Number of green leaves of Tobacco (Natu) (l) Weight of green leaves of Tobacco (Natu)
(More row items can be added in this according to the crop covered) 5.5. Did the cultivator harvest any part of the field prior to the
harvest of the plot (Yes or No) 5.6. If he did, was the position of the experimental plot
affected? 5.7. (a) Normal yield for the village in (Kgs. per acre)
(b) Reasons for significant increase or decrease in the actual yields compared to the normal yield

108
6. Sketch of the Field showing the experimental plot Experiment
I II 7. Remarks of the Inspecting Officer with special reference to the condition of
the Crop in the Field and in the Village
Name Designation Date of visit Remarks
8. Signature of the Primary Worker

109
Model Schedules for Crop Estimation Surveys FORM III - Results of driage
Note 1. This form should be dispatched immediate after completion of the
driage process. 2. Answer every item. Do not leave blanks. If any item is nil write ‘Nil”. Delete inappropriate items where choices are provided. Name of crop: Variety if any:
1. Particulars of Villages 1.1 Year 1.2 Season 1.3 District 1.4 Taluk 1.5 Block 1.6 Village
1.7 Name of the primary worker 1.8 His designation and Head- Quarter 1.9 Date/Dates of harvest of 1st and 2nd pickings
2. PARTICULARS OF HARVEST AND DRIAGE
ITEM Experiments I II 2.1 Date of harvest of crop in the plot 2.2 Date of first weighment of harvested produce 2.3 Weight of first weighment of paddy (un-dried grain);
Jowar, Bajra, Ragi (undried cobs/ear heads); maize (sheathed cobs), groundnut (pods) at the time of harvest of the experimental plots; sugar-cane (stripped cane taken for preparation of gur); tobacco (natu), (green leaves) or the for the other crops as the case may be.
Kgs. gms.
Kgs. gms.
2.4 Weight of redgram/sesamum after threshing (dried seed). All sesamum seeds may not come at the 1st threshing. The threshing operations have to be continued more than one time and the local practices may be followed. The field worker has to ensure that no seed is left out in the capsules. The weight should be recorded at every time soon after threshing and the total dried weight of sesamum seed has to be noted. After threshing the seed should be exposed to the sun for a few hours. This type of case may be there for other crops also.
2.5 Weight of un-dried grain/un-dried cobs/un-dried pods

110
taken for driage experiments. The quantity of seeds to be taken for driage may be taken as per the specification given for identified crops.
2.6 Date of completion of driage/ curings 2.6 Weight of the dried and processed produce paddy (grain)
jowar, bajra, ragi and maize (grain); groundnut (dried pods) sugar-cane (gur), tobacco natu, (cured leaf) or the other crops as the case may be.
2.8. Weight of Kernal obtained from one Kg. of dried harvested produce of groundnut pods or other similar crops.
3. PARTICULARS OF PICKINGS OF TOBACCO (VIRGINA) CASTOR COTTON AND OTHER SIMILAR CROPS
3.1 Particulars of crops such as Tobacco Virgina (green leaves) Castor (capsules). Cotton (kapas) Sl. No. of pickings
Dates of different pickings
No. of green leaves (for tobacco) or other similar crops.
Weight of the produce in Kgs./Grams
Experiment I 1. 2. 3. 4. 5. 6.
Total Experiment II
1. 2. 3. 4. 5. 6.
Total 3.2 Particulars of Tobacco Virginia (cured leaves) Castor (Dried seed) or other
similar crops Sl. No. of Date of dry TOBACC0 CASTOR

111
picking wt. No. of cured leaves
Wt. of cured Leaves Kgs. grams
Wt. of capsules taken for driage kgs grams
Wt. of dried seed Kgs. grams
Experiment I 1. 2. 3. 4. 5. 6.
Total Experiment II 1. 2. 3. 4. 5. 6.
Total 3.3 Remarks regarding yield of the crop
Experiment
(a) Normal yield per acre for the village (in Kgs.) I II (c) Reasons for any significant increase or decrease in the
actual yield as compared to the normal yield in the village
3.4 Remarks regarding quality of Tobacco other similar crops (effect of seasonal conditions on quality
Signature of the Primary Worker:
Remarks of the Inspecting Officer, with particular reference to the quality of the crop (whether affected by adverse seasonal conditions etc.) Name, Designation and Address Date of visit Remarks Date: Signature