Manual for Healthcare Quality & Safety
287
1 Directorate of Healthcare Quality & Safety Ministry of Health Manual for Healthcare Quality & Safety
Transcript of Manual for Healthcare Quality & Safety

1
Directorate of Healthcare Quality & Safety
Ministry of Health
Manual for
Healthcare Quality & Safety

2
Sri Lanka

3
Manual for Master Trainers Healthcare Quality & Safety
Directorate of Healthcare Quality & Safety Ministry of Health
April 2014

4
Message from Secretary – Health . . . .
The history of Medicine in Sri Lanka has been flourishing over the decades as
various governments have committed themselves to ensure continuous provision of
healthcare to the public which is safe, accessible, of good quality and sustainable. At
present, the health system of the country is facing a period of transition with the recent
introduction of Quality & Safety in healthcare.
The development of a collective national commitment island wide is very important in order
to pursue the health vision addressed by ‘Mahinda Chinthana’. It is a well identified fact
that even though the policy support from the central government and the high level
administration is satisfactory, the leadership island wide at all levels is insufficient in the
implementation of those policies. Hence, it is a challenge that requires significant changes
in the current health system towards a health promoting nation.
Accordingly, the Ministry of Health has taken all necessary actions for decentralization of
authority by continuous policy development, staff development, conducting island wide
training programmes, re-orientation of health services and re-organization of the health
system shifting the paradigm towards a health promoting nation. As a step forward, the
Directorate of Healthcare Quality & Safety was first established in September, 2012 to
ensure provision of quality care and patient safety island wide.
As capacity building is one of the key components of Healthcare Quality & Safety
programme, this Manual for Master Trainers in Healthcare Quality & Safety is published as a
reference book for Master Trainers island wide.
I wish to thank all the stakeholders involved in the development of this manual. In
particular, Dr. Reggie Perera, former Secretary – Health who led the working group; Dr.
Lakshmi C Somatunge, Deputy Director General (Medical Services – I) who supervised the
whole developmental process and Dr. S Sridharan, Director - Healthcare Quality & Safety
who coordinated and facilitated the drafting work of the manual.
While appreciating the hard work of all the experts who actively participated in the project, I
sincerely wish this manual be fruitful for all Master Trainers island wide in achieving the
goals of a health system nourished with quality care and patient safety!
Dr. Y D Nihal Jayathilaka
Secretary - Health

5
Message from Director General of Health Services . . .
Sri Lanka, being a country with a low middle income, possesses an unstinted
commitment in the provision of quality health care as indicated by impressive health
indicators.
Even though indicators are satisfactory, unfortunately, many patients in the country possess
firsthand experiences related to adverse events, near misses, unresponsiveness and poor
quality care of the existing health system. Therefore, it has been a pressure to change the
system, to effectively enforce the policies made and to assure the provision of quality care
and patient safety towards a healthier nation which is driven by continuously increasing
demands from unsatisfied patients in the country.
In order to meet these challenges and experiencing the need to improve the quality & safety
of care, which is the responsibility of all healthcare providers, this manual is published
demarcating a benchmark in the process of decentralization of the training programmes and
development of Master Trainers in Healthcare Quality & Safety island wide.
It is a movement that holds great promise for improved continuous quality and safety of the
system and with the publication of this Manual for Master Trainers in Healthcare Quality &
Safety, a reference book is presented as a sound material support for capacity building
programmes, making training a rewarding experience for both the trainer and the trainees.
I hope all Master Trainers Island wide will understand the fruitfulness of the use of this
manual as a concise reference book in their training programmes.

6
Dr. P G Mahipala
Director General of Health Services
Preface
Deputy Director General (Medical Services) 1 …..
It is a pleasure to preface this Manual for Master Trainers in Healthcare
Quality & Safety which is published by the Directorate of Healthcare Quality & Safety,
fulfilling a long awaited need in the health system of the country.
The journey to write a complete and comprehensive manual is strewn with triumphs,
failures and near misses. This manual is the final fruit of combined experiential knowledge,
evidence and analyses of the experts in the field of healthcare management. Primarily, it is
intended as a reference book for Master Trainers in Healthcare Quality & Safety to equip
the prospective trainer with essential understanding of the training procedure. Throughout
these pages, a trainer will find a wide range of issues related to patient safety and quality
care which are at the core of the health system of the country. This manual is structured to
allow the trainer a great deal of freedom in how to organize and present the material in
their training programmes and the flow charts and the explanatory text provide definitive
and irrefutable details making understanding easy.
Spurred by the impressive feedback obtained following the pilot programme conducted for
14 selected Master Trainers from Southern and Northern provinces, it was convinced that
subject areas and contents of this Manual were tempered by the test of being able to teach
trainers effectively.
There are a number of individuals who have helped us with the contents of this manual.
First and foremost, I offer my sincere gratitude to Dr. Reggie Perera, former Secretary –
Health and Health Systems Management Specialist/Institution for Health Policy, who has
7
been a well recognized pioneer in the introduction of Quality & Safety to health system of
the country, for his enormous contribution in offering chairmanship for the working group
and editing the manual.
Many thanks go to all the members of the working group for their material support,
constructive criticisms and useful suggestions which were extremely fruitful in finalizing the
draft manual.
I am grateful for all the contributors in the list who have collaborated in various sections of
this manual. In addition, I would like to acknowledge the Translators at the Translation
Branch – Ministry of Health for the efforts made in translating the manual into Sinhala and
Tamil media.
Last, but not least I am indebted to Dr. S Sridharan, Director/Healthcare Quality & Safety for
coordinating the process, for bearing the whole burden under his untiring shoulders and all
the triumphs and tribulations made in publishing the manual.
I hope this manual will be a useful reference book for Master Trainers in Healthcare Quality
& Safety Island wide and a curtain raiser in the identification of multifaceted strategies to
create change within health systems of the country striving for excellence.
Dr. Lakshmi C Somatunge
Deputy Director General (MS) 1
8
Coordinated by
Dr S Sridharan; Director / Healthcare Quality & Safety
Edited By
Dr Regie Perera; Former Secretary, Ministry of Health
Dr S Sridharan; Director / Healthcare Quality & Safety
Working Group and List of Contributors
Dr Chandhrathialake Madhawa; Senior Lecturer, Medical Faculty, University of Kelaniya
Dr De Silva Susantha; Former DDG (planning), Ministry of Health
Dr Dharmaratne G S K; Medical Superintendent, DGH Gampaha
Dr. Gunasekara Chandrani; Deputy Director (Retired)/Castle Street Hospital for Women,
Colombo
Dr Hewage A Ratnasiri; Director/Lady Ridgeway Hospital for Children, Colombo
Dr Kumerendharan B; Lecturer, Medical Faculty, University of Kelaniya
Dr Olupeliyawa Asela; Senior Lecturer, Medical Faculty, University of Colombo
Dr Perera M A L R; Former Secretary, Ministry of Health & Health Systems Management
Specialist and Senior Fellow/Institute for Health Policy (Chairman of the Working
Group)
Dr Samarage S M; Former DDG (Planning) - Ministry of Health, National Consultant / World
Health Organization
Dr Sridharan S; Director / Healthcare Quality & Safety (Convener of the Working Group)
Mr Thliakasiri M; Senior Consultant, Sri Lanka Institute of Development Administration

9
List of Contributors
Dr Amarapathy M T; Medical Officer, GH Sri Jayawardhanepura
Dr Hettigoda G M; Medical Officer, Directorate Healthcare Quality & Safety
Dr Jayasekera N E L W; Director General of Health Services / Sri Lanka Navy
Dr Karandagoda K K W; Director Lanka Hospitals, Colombo
Dr Ludowyke Alan; Deputy Director, Castle Street Hospital for Women
Dr Ranasinghe J P; Medical Superintendent BH Kamburupitiya
Translated By:
Sinhala – Ms Manoja Gayani Liyanarachchi
Dr Madhawee Hettigoda
Tamil - Mrs S Pathmasamy
Dr A Ketheeswaran
Dr S Sridharan

10
TABLE OF CONTENTS
Chapter Page
Introduction INTRODUCTION TO THE TRAINER’S MANUAL
Objectives of the Programme
Manual Guidelines
References
Annexure I
Annexure II
Annexure III
MODULE 01: INTRODUCTION TO HEALTHCARE QUALITY & SAFETY
Chapter 1 INTRODUCTION TO HEALTHCARE QUALITY & SAFETY
SESSION PLAN - 01
INTRODUCTION TO HEALTHCARE QUALITY & SAFETY
1.1 Background & Situation Analysis
1.2 Introduction to Healthcare Quality
1.3 Definitions of Quality
1.4 Quality Control, Assurance and Total Quality Management
(TQM)
1.5 Quality & Cost
1.6 Implementation of Quality Improvement Programme
1.7 Basic Definitions in Healthcare Management
Chapter 2 HOSPITAL SYSTEMS
SESSION PLAN - 02
HOSPITAL SYSTEMS
2.1 Introduction
11
2.2 The Systems Approach
2.3 Historical Development of the Systems Model
2.4 Basic Systems Concept and Definitions
2.5 The Nature of Inputs
2.6 The Nature of Outputs
2.7 Throughputs
2.8 Feedback
2.9 Application of General Systems Theory
2.10 Viewing the Work Organization as a Total System
2.11 Conclusion
Chapter 3 POSITIVE ATTITUDE – ITS SIGNIFICANCE AND
DEVELOPMENT
SESSION PLAN - 03
POSITIVE ATTITUDE – ITS SIGNIFICANCE AND
DEVELOPMENT
3.1 Introduction
3.2 Significance of a Positive Attitude
3.3 Factors Affecting Development of Attitudes
3.4 Developing a Positive Attitude
3.5 Conclusion
Chapter 4 RESPONSIVENESS
SESSION PLAN - 04
RESPONSIVENESS – A VITAL ASPECT OF HEALTH
SYSTEMS
4.1 Background
4.2 Responsiveness
4.3 Recommended Ways to Improve the Responsiveness in the
Health
Chapter 5 SESSION PLAN - 05
PATIENT SAFETY
5.1 Introduction
5.2 Patient Safety Culture
5.3 Importance of Patient Safety

12
5.4 Classification of Hospital Accidents
5.5 Evolution of Patient Safety Culture
5.6 Creating Patient Safety Culture
5.7 Conclusion
MODULE 02 QUALITY IMPROVEMENT TECHNIQUES
chapter 6 APPLICATION OF JAPANESE 5S CONCEPT IN
HEALTHCARE MANAGEMENT;
Session Plan - 6
APPLICATION OF JAPANESE 5S CONCEPT IN
HEALTHCARE MANAGEMENT
6.1 Introduction
6.2 Common Problems in Hospitals
6.3 Overview of 5S
6.4 SEIRI – S1 (Organize/Sort & Clear)
6.5 SEITON – S2 (Orderliness/Systemization)
6.6 SEISO – S3 (Shine – Cleaning with Meaning and
Beautifying)
6.7 SEIKETSU – S4 (Standardization)
6.8: SHITSUKE S5 (Training and Self-Discipline – Sustain)
6.9 Implementation of 5S Programme in an Organization
6.10 5S Tools
Chapter 7 KAIZEN IN HOSPITAL MANAGEMENT
SESSION PLAN - 07
KAIZEN IN HOSPITAL MANAGEMENT
7.1 Introduction
7.2 Elements of Kaizen
7.3 Kaizen and Suggestion Management
7.4 Kaizen Activity Chart
7.5 The Role of Supervisors in kaizen
7.6 Gemba Kaizen
7.7 What is PDCA Cycle?
7.8 Conclusion
13
Chapter 8 WORK IMPROVEMENT TEAMS (WIT)
SESSION PLAN - 08
WORK IMPROVEMENT TEAMS (WIT)
8.1 Introduction
8.2 Objectives of Work Improvement Teams (WIT)
8.3 Quality Improvement Areas
8.4 Role of the Leader of WIT
8.5 Role of Members of WITs
8.6 Role of the Quality Improvement Team (QIT
8.7 Role of the Facilitato
8.8 Operation of the Work Improvement Team (WIT)
Chapter 9 QUALITY IMPROVEMENT TOOLS
SESSION PLAN - 09
QUALITY IMPROVEMENT TOOLS
9.1 Introduction
9.2 Pareto Chart
9.3 Fish Bone Diagram (Cause and Effect Diagram)
9.4 Histogram
9.5 Problem Tree
9.6 WHY-WHY Diagram
9.7 Conclusion
MODULE 03: IMPLEMENTATION OF QUALITY IMPROVEMENT
PROGRAMME
Chapter 10 DIMENSIONS OF QUALITY
SESSION PLAN - 10
DIMENSIONS OF QUALITY
10.1 Introduction
10.2 Dimensions of Quality
10.3 Conclusion

14
Chapter 11 MONITORING OF HEALTHCARE PRODUCTIVITY AND
QUALITY ASSURANCE PROGRAMME
SESSION PLAN – 11
MONITORING OF HEALTHCARE PRODUCTIVITY AND
QUALITY ASSURANCE PROGRAMME
11.1 Introduction
11.2 Tools of Monitoring
11.3 Principal Methods of Measuring Hospital Performance
mj;jpahak; 12 THE PROCESS OF CONDUCTING A STUDY VISIT TO AN
INSTITUTION PRACTICING TOTAL QUALITY
MANAGEMENT
SESSION PLAN - 12
THE PROCESS OF CONDUCTING A STUDY VISIT TO AN
INSTITUTION PRACTICING TOTAL QUALITY
MANAGEMENT
12.1 Introduction
12.2 How to Organize the Visit by Hospital B
12.3 Preparation by Hospital A
mj;jpahak; 13 GROUP WORK
SESSION PLAN - 13
GROUP WORK
13.1 Introduction
13.2 Setting up Groups/Teams
13.3 Strategies to Enhance Effective Group Work;
13.4 Conducting Group Work
13.5 Conclusion

15
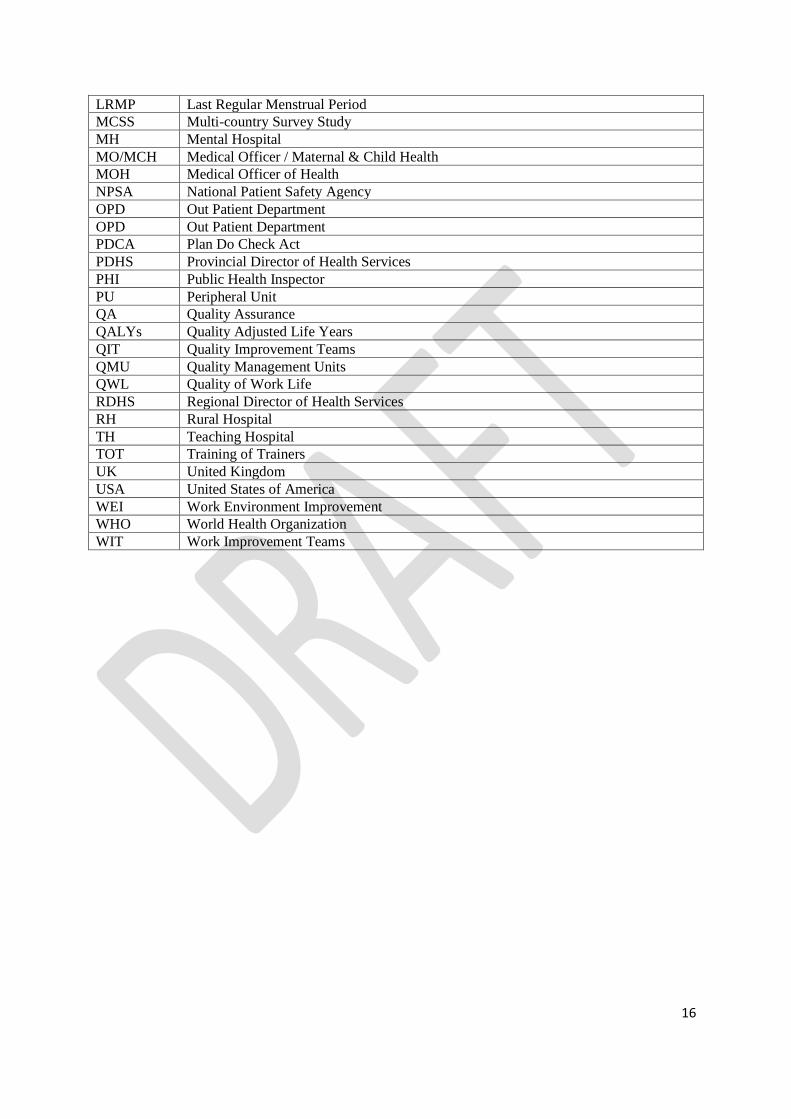
ABBREVIATIONS AAKCP Asia-Africa Knowledge Co-creation Programme
ADE Adverse Drug Events
BH Base Hospital
BHT Bed Head Ticket
CHI Commission for Health Improvement
CLSD Central Linen Supplies Department
CQI Continuous Quality Improvement
CSSD Central Sterile Supplies Department
DDG (MS) Deputy Director General (Medical Services)
DGH District General Hospital
DPDHS Deputy Provincial Director of Health Services
EBM Evidence-Based Medicine
ETU Emergency Treatment Unit
EUA/D &C Examination Under Anaesthesia / Dilatation and Curettage
FHS Fetal Heart Sound
GDP Gross Domestic Product
GNP Gross National Product
HMA Health Management Assistant
HQS Healthcare Quality & Safety
IOM Institute of Medicine
IOM Institute of Medicine
ISO International Organization for Standardization
JCAHO Joint commission for Accreditation of Health care Organizations
JICA Japan International Cooperation Agency
KPA Key Performance Assessment
LOS Length of Stay
16
LRMP Last Regular Menstrual Period
MCSS Multi-country Survey Study
MH Mental Hospital
MO/MCH Medical Officer / Maternal & Child Health
MOH Medical Officer of Health
NPSA National Patient Safety Agency
OPD Out Patient Department
OPD Out Patient Department
PDCA Plan Do Check Act
PDHS Provincial Director of Health Services
PHI Public Health Inspector
PU Peripheral Unit
QA Quality Assurance
QALYs Quality Adjusted Life Years
QIT Quality Improvement Teams
QMU Quality Management Units
QWL Quality of Work Life
RDHS Regional Director of Health Services
RH Rural Hospital
TH Teaching Hospital
TOT Training of Trainers
UK United Kingdom
USA United States of America
WEI Work Environment Improvement
WHO World Health Organization
WIT Work Improvement Teams

17
Introduction
18
INTRODUCTION TO THE TRAINER’S MANUAL
Introduction
Sri Lanka has achieved a commendable health status measured in terms of traditional health
indices in relation to its Gross Domestic Product (GDP). Sri Lanka’s health indicators have
over the past few decades been above the regional averages. For further improvement, the
island’s health system is focusing more towards patient-centered quality care and patient
safety.
The focus on patient-centered care, holistic practice and provision of value for money
means that there is a greater need to ensure health professionals, allied teams and
managers have the necessary knowledge and skills and they develop appropriate attitudes,
to improve and develop healthcare services. A wide range of techniques have been used to
improve healthcare including establishment of Quality Improvement Teams (QIT) and Work
Improvement Teams (WIT), introduction of Quality Improvement Tools, Clinical Audits,
Guidelines, Evidence-Based Medicine (EBM), Continuous Quality Improvement (CQI),
leadership, choice and competition. All of these initiatives require health professionals and
managers to learn and apply new skills. The Ministry of Health believes that training can be
an effective lever for improving the quality of healthcare. This initiative needs to be
decentralized to the Provinces/Districts/Institutions, so that the training teams at these
levels can tailor make programmes to cater to their needs. As a prelude to this initiative,
this manual on training of trainers has been developed.
Research suggests that lack of knowledge and skills among managers and clinical staff is a
significant barrier to improving quality in healthcare (Neale, 2007). Training health
professionals in quality improvement has the potential to impact positively on attitudes,
knowledge and behaviours (O’Brien, 2001). In fact, some suggest that training professionals
may be just as effective as financial incentives for improving the quality of healthcare
(Epstein, 2008).
19
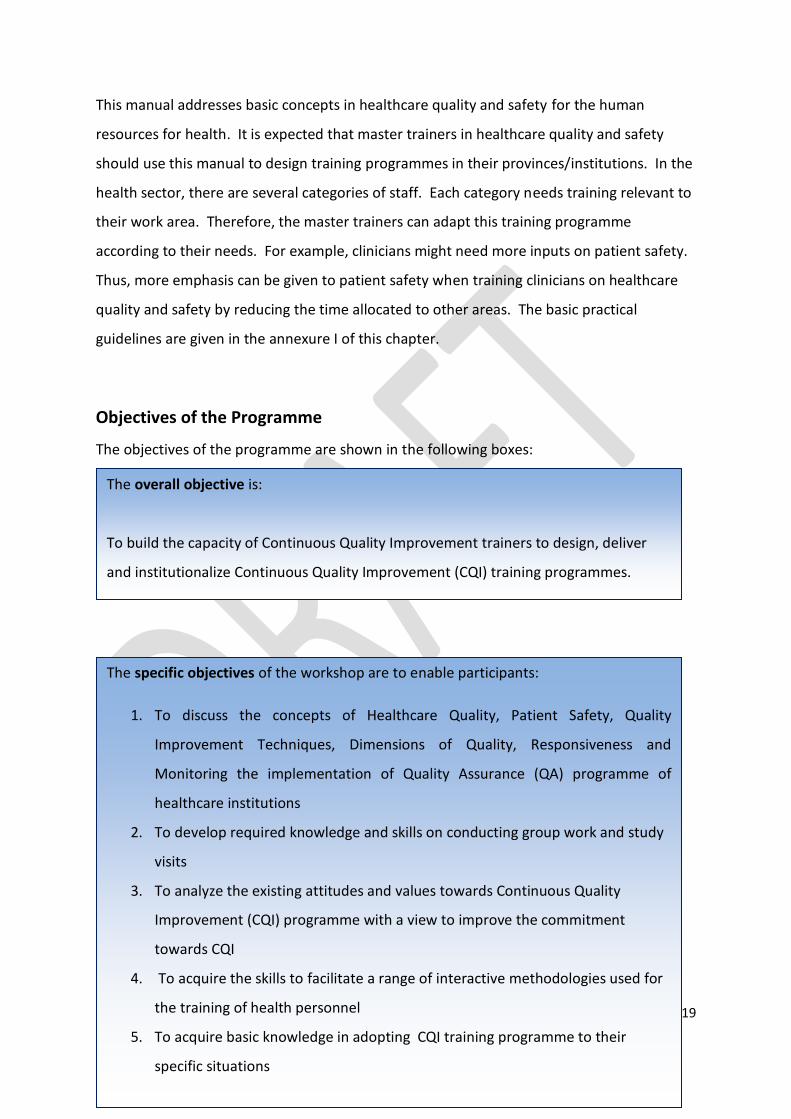
This manual addresses basic concepts in healthcare quality and safety for the human
resources for health. It is expected that master trainers in healthcare quality and safety
should use this manual to design training programmes in their provinces/institutions. In the
health sector, there are several categories of staff. Each category needs training relevant to
their work area. Therefore, the master trainers can adapt this training programme
according to their needs. For example, clinicians might need more inputs on patient safety.
Thus, more emphasis can be given to patient safety when training clinicians on healthcare
quality and safety by reducing the time allocated to other areas. The basic practical
guidelines are given in the annexure I of this chapter.
Objectives of the Programme
The objectives of the programme are shown in the following boxes:
The overall objective is:
To build the capacity of Continuous Quality Improvement trainers to design, deliver
and institutionalize Continuous Quality Improvement (CQI) training programmes.
The specific objectives of the workshop are to enable participants:
1. To discuss the concepts of Healthcare Quality, Patient Safety, Quality
Improvement Techniques, Dimensions of Quality, Responsiveness and
Monitoring the implementation of Quality Assurance (QA) programme of
healthcare institutions
2. To develop required knowledge and skills on conducting group work and study
visits
3. To analyze the existing attitudes and values towards Continuous Quality
Improvement (CQI) programme with a view to improve the commitment
towards CQI
4. To acquire the skills to facilitate a range of interactive methodologies used for
the training of health personnel
5. To acquire basic knowledge in adopting CQI training programme to their
specific situations

20
Expected Outcome: The development of confident, competent CQI trainers with the skills
to design, implement and evaluate training programmes in CQI for
human resources for health in their respective districts / institutions.
Expected Impact: Institutionalization of the CQI programme in their districts /
institutions to assure sustainability of Quality & Safety in health
institutions.
An average of 21 hours (03 days) but may vary from training to
training. The topics and exercises presented here are organized into
day-long sessions. There are flexible amount of time allocated, so no
exact time table is presented for each day. A trainer should review
the material ahead of time and plan the amount of time that fits the
needs of the particular training
Manual Guidelines
To improve quality of care in healthcare institutions, health personnel need to learn about
healthcare quality and safety. There is progression from knowing “what” to knowing “how”
and ultimately to “doing” it. Best learning is through hands-on experience with feedback
from trainees, along with mentoring and coaching. The topics for this programme have
been carefully designed so that health care workers in Sri Lanka will be able to understand
the concepts of quality and patient safety comprehensively.
MODULE 01: INTRODUCTION TO HEALTHCARE QUALITY & SAFETY
Expected Time for
Training:
21
Chapter 01: Chapter one addresses the concept of Continuous Quality Improvement,
different quality concepts and history of healthcare quality improvement programme in Sri
Lanka and the world. In order to understand the concept of quality unambiguously, basic
terms used in healthcare management are explained in this chapter.
Chapter 02: A system may be defined as an assemblage or combination of things or parts
forming a complex or unitary whole, a set of interacting units. The essential focus of the
systems approach is the relationship and interdependence of the parts. The system
approach moves beyond structure or function (e.g. organization charts,
departmentalization) to emphasize the flow of information, the work, the inputs and the
outputs. Hence, knowledge on systems is important in improving healthcare quality &
safety. This chapter will focus on system level issues that result from dynamic interactions
in the health care system (human factors and technical systems) and how they may affect
health care quality and safety.
Chapter 03: Quality improvement is mainly associated with change management. In any
change management, positive thinking of employees of an organization plays a dominant
role. Setting a positive mindset among health personnel has been detailed in chapter three.
This chapter mainly focuses on the significance of positive thinking and ways and means of
developing positive attitude.
Chapter 04: Responsiveness to patients is now seen as a key characteristic of an effective
health system. Health systems throughout the world are searching for ways of making their
services more responsive to patients and the public. The seven domains of responsiveness
as discussed in this chapter are, dignity, autonomy, confidentiality of information, prompt
attention, access to social-support networks, quality of basic amenities, and choice of
health-care provider.
Chapter 05: Patient safety is relatively a new field of science. In 1999, the Institute of
Medicine (IOM) of the National Academy of Sciences, USA released a report, ‘To Err is
Human: Building a Safer Health System’ and the report was focused on the staggering
statistics: out of 44,000 to 98,000 preventable deaths occurring annually due to medical

22
errors in hospitals, 7,000 preventable deaths are related to medication errors alone. This
chapter will focus on causes of medical errors and their mitigations.
MODULE 02: QUALITY IMPROVEMENT TECHNIQUES
Chapter 06: Japanese 5S concept is considered as the entry point for the quality
improvement programme in Sri Lankan health sector. This chapter elaborates on the 5S
concept, application of 5S concept in healthcare settings, its benefits and 5S tools.
Chapter 07: Kaizen is a system that involves every employee - from upper management
level to the cleaning crew on an ongoing basis. Everyone is encouraged to come up with
small improvement suggestions on a regular basis. This is not a once a month or once a year
activity but it is continuous. In Japanese companies, such as Toyota and Canon, a total of 60
to 70 suggestions per employee per year are written down, shared and implemented using
the PDCA cycle. There is evidence that this Kaizen practice has been successfully
implemented in health sector too. Hence, this chapter orients on Kaizen, Gemba Kaizen and
PDCA cycle.
Chapter 08: Work Improvement Teams (WIT) are small groups of employees from the
workplace organized to participate in mutual development and problem-solving activities
that are helpful to improve the quality and productivity of an organization. Understanding
the concept of Work Improvement Teams as detailed in this chapter is fundamental to
improving productivity, quality and safety in a healthcare institution.
Chapter 09: In order to improve a process to deliver desired results, a systematic, fact-
based approach that enables permanent solutions to root causes of problems should be
used. Quality improvement is a continuous process. This chapter addresses important
quality improvement tools such as Histograms, Pareto Analysis, Why-Why diagram, Fish-
Bone Diagram and Problem Tree. The knowledge gained from these chapters can be
applied to identify the root causes of problems.

23
MODULE 03: IMPLEMENTATION OF QUALITY IMPROVEMENT PROGRAMME
Chapter 10: Knowing the dimensions of service quality will enable healthcare organizations
to maximize patient satisfaction and meet their expectations. This chapter elaborates on
the dimensions of quality in the Sri Lankan context.
Chapter 11: A monitoring system enables healthcare providers to set priorities, establish
quality indicators and assess the hospital’s performance to ensure that the desired
outcomes are achieved. The foundation of a monitoring system consists of standards and
indicators, the guideposts for achieving quality. Monitoring provides a way to compare
performance with standards, both at a specific point in time and over a period of time, and
also with the performance of other hospitals. The results provide a way to determine
causes for variance and identify areas for improvement.
Chapter 12: A Chinese philosopher & reformer Confucius (551 BC - 479 BC) said “I hear and
I forget; I see and I remember; I do and I understand”. The next two chapters are about
developing skills by seeing, interviewing and doing things. Chapter 13 briefs on conducting
study visits to a best performing hospitals.
Chapter 13: Action planning is a process which will help you to focus your ideas and to
decide on the steps you need to take to achieve particular goals that you may have.
Preparing an Action Plan is a good way to help you to reach your objectives in the
Continuous Quality Improvement (CQI) programme. This chapter guides the trainees to
identify the barriers and challenges in implementing Continuous Quality Improvement (CQI)
programmes and to develop action plans for their health institutions.
Quality is not about creating individual heroes but building up a team that enables the
healthcare organization to create a sustainable CQI programme. The training programme
‘Introduction to Continuous Quality Improvement in Healthcare’ will be an impetus to
create such a dedicated team.
24
The Curriculum of the training programme is annexed (Annexure: II).
The evaluation form for the training programme is annexed (Annexure: III). Make sure that
the evaluation form is given at the start of the training programme and collected at the end
of the training programme. It is also necessary to analyze and give feedback to the resource
personnel and coordinator of the programme so that the future programmes can be
improved.
References
o Epstein A M. Performance Measurement and Professional Improvement:
Approaches, Opportunities and Challenges. Health Systems, Health and Wealth
WHO Ministerial Conference on Health Systems, June 2008.
o Neale G, Vincent C, Darzi A. The Problem of Engaging Hospital Doctors in Promoting
Safety and Quality in Clinical Care. Journal of Royal Society of Medicine 2007;
127:87- 94.
o O’Brien M A, Freemantle N, Oxman A D, Continuing Education Meetings and
Workshops: Effects on Professional Practice and Health Care Outcomes. Cochrane
Database of Systematic Reviews 2001, Issue 2.
25
Annexure I
PRACTICAL TIPS TO CONDUCT A TRAINING PROGRAMME
KEY CONSIDERATIONS FOR COORDNIATORS
The role of a coordinator is very important during a group discussion or workshop. A
coordinator should never forget his/her roles and responsibilities, which include the
following:
Always remain neutral!! Your role as a coordinator is to facilitate the discussion of
others; your own personal opinions and priorities must be put aside.
Be positive and try to go to the workshop with energy and genuine enthusiasm!
Ensure that the participants feel welcome and are encouraged to participate.
Always remember the objectives of the meeting.
Try not to let one or two people dominate the discussion; provide an opportunity for
everyone to participate.
After a group discussion has finished, try to summarize the discussion before moving on
to the next topic or agenda item.
It is your responsibility to prepare the agenda and follow it.
Always listen carefully to what others have to say.
Guide and encourage the groups’ participation.
Always observe your group; if energy or interest levels are low, change gears, do an
energizer or take a small break.
Always stay in communication with your group; ensure that the information presented is
clear and that people are ready to move forward. Do not always wait for someone to
ask a question; observe body language and facial expressions.
Create a comfortable and safe environment for participants.
26
Be prepared to handle people with different opinions or situations of conflicts. Ensure
that the tone is always respectful and while people may disagree, everyone should feel
safe and welcome to participate.
Be aware of the different backgrounds of the participants and design a process that
reflects different contributions and be aware of ‘sensitive’ issues that may require
attention.
Ensure that you are organized. Participants will lose confidence if there aren’t enough
handouts, if the Power-point projector is not working properly; if tea/coffee is late!
Lastly, take the opportunity to continue your own learning. Participants often have
insights, experiences and opinions that challenge your own. Be open!
Dos and Don’ts of Training
The following “Dos and Don’ts” should ALWAYS be kept in mind by the coordinators during
any session of this module.
Dos –
Prepare in advance
Maintain good eye contact
Involve participants
Write clearly and boldly
Use visual aids and ensure visibility of aids to all
Speak clearly and loud enough
Recap at the end of each session
Encourage questions
Use logical sequencing of the topics
Bridge one topic to the next
Encourage participation and give appropriate feedbacks
Avoid distracting mannerisms and distractions in the room
Be aware of the participant’s body language

27
Provide clear instructions
Check whether your instructions are understood clearly
Keep the group focused on the task
Use good time management and evaluate as you go
Keep it simple and summarized
Don’ts –
Don’t talk to the flip chart
Don’t read from the curriculum
Don’t block the visual-aids
Don’t stand at one spot
Don’t ignore the participants’ comments and feedbacks (verbal & non-verbal)
Don’t lose your temper
Training Basics
People learn best when they know what to expect. Irrespective of the duration of the
training programme, the participants should know the following:
What can I expect?
Participants often arrive feeling nervous, particularly with a sensitive topic like Patient
Safety. Help participants relax by reviewing the agenda with the group.
Who are my fellow participants?
Through introductions, talking about participant expectations and ice breakers, participants
can learn about each other and express their own identities.
Who is my trainer?
28
Telling participants about you, your background and a few personal details sets a friendly
and open tone.
What is the purpose of this training?
Tell participants the purpose of each session. This can be done by reviewing the learning
objectives.
Training Tips:
Be positive and confident; Smile!
Show excitement and enthusiasm.
Express genuine interest in each individual’s contribution.
Speak loudly, clearly and not too quickly—especially if you or the participants are
speaking a second language.
Take notes for the group to see clearly and quickly, in dark colors considering
alternating between two colors when writing on a flipchart.
If working with people from different groups, find positive ways to acknowledge and
bridge differences.
Use open-ended questions that truly encourage discussion.
Encourage discussion among group members instead of dialogues between
participants and yourself. One way is to redirect questions to the entire group, for
example: “What do you think of Gamini’s suggestion?”
Tell participants when you have learned something new from them.
Come prepared with necessary supplies.
Practice techniques beforehand to feel confident and think clearly. Visualize the
entire session—imagining how to arrange the room, what to say, how to create
transition between activities and so on; Jot short notes on a card to refer to.
Participants have different learning styles. Use different speeds, styles, and types of
activities to reach them all.
29
Good discussions must sometimes be stopped when time runs out. Place key ideas
on a “parking lot” paper—to revisit later. Be sure to schedule time to do get back to
the “parking lot” issues.
At times, you may have difficulty getting discussion started. If you ask a question
and no one answers it, wait—count to five slowly to yourself without showing
anxiety or irritation. Be comfortable with the silence. If no one answers, smile,
rephrase the question, and wait again. If discussion continues to be slow, ask
participants to discuss the question with a partner for a few minutes. Then ask
several pairs what they came up with.
When energy is low, take a three minute break for an “energizer.” Ask participants
for “energizer” ideas.
Often a few participants dominate, while others seem interested but keep quiet.
*Tips for balancing the group:
Don’t put the quiet ones on the spot—but do ask them if they’d like to
contribute or not
Change the makeup of small groups often. Quieter people will eventually
meet up with other quiet types and speak up.
In a large group discussion, ask participants to jot down a few ideas before
anyone speaks; then, ask each person around the room to read an idea.
Look for body language. People who are ready with ideas may sit forward,
meet your eyes, or shift in their seats while another person is speaking.
If a participant begins to over-dominate, enlist their help in encouraging
others to speak up.
When dealing with sensitive issues, it is important to try to *set people at ease. You can
model using words that may be uncomfortable and allow people to “come along” with you
gradually.
Don’t put people on the spot to share information they may not want to share, or that they
may regret sharing later. Avoid building false expectations of confidentiality.

30
The Training Environment
What is the training environment?
The training environment includes everything that affects the learner including physical,
social, cultural, psychological and emotional influences.
How can you create a physical environment that supports and enhances learning?
Participants are more likely to learn and share their experiences when they feel comfortable
and safe in their training environment.
There are several factors to consider when selecting or using a space for effective learning:
Space size
Room layout
Accessibility
Cleanliness
Temperature
Decoration
Atmosphere
Social/emotional safety
How do you make sure that your learning environment supports learning?
Know your audience: To create a safe space, it is important to base decisions on each
participant group. Consider gender, culture, ethnicity, hierarchy, language, tensions
between subgroups and typical ways of learning of each group.

31
Size: Is the space for the learning activities of the right size? It should be large
enough for participants to move about but small enough to create a bit of intimacy.
If the space is not ideal, consider re-arranging furniture, removing tables, or adding
some decorations.
Layout: What is the ideal room arrangement for what you want to accomplish?
Having people seated formally around a large conference table can make people feel
nervous and awkward. Having rows of chairs with a teacher standing in front of the
room can put participants in a hierarchical teacher-student mindset. However,
seating arrangements in a circle or semi-circle in chairs (or on the floor) encourages
participation. Another option is arranging groups spread around the room, seated
on the floor or chairs around small tables when there is lot of writing but small group
work.
Accessibility: Can people get to the workshop location? Provide good directions
before commencement of the workshop and display signs directing people once they
arrive. Let participants know where to find toilets, water and snacks, if appropriate.
Visuals: Can participants see you, each other, materials you plan to use from the
given places seated? Be sure to try out your visuals by actually writing something on
the flipchart or chalkboard or by turning on a video/DVD, or projector beforehand.
Is your handwriting legible? Posters or other materials on the walls and/or a
resource table can provide additional information and color. Consider literacy levels
and the language of your participants when deciding on posters and written
resources.
Atmosphere: Once you have designed the sessions and created a comfortable
physical space, consider the per-to-person atmosphere. The first day sets the tone
for the entire training experience. Every learner brings fears and expectations to a
new learning situation. You and the training team can make participants

32
comfortable within a welcoming atmosphere of open communication, respect and
learning.
References
o Trainer’s Guide, “The Road to Good Health” HIV Prevention in Infrastructure Project,
World Bank-East Asia Pacific Region, 2008
o Training of Trainers Manual, Youth Peer Education Toolkit, Youth Peer Education
Network, UNFPA, 2005

33
34
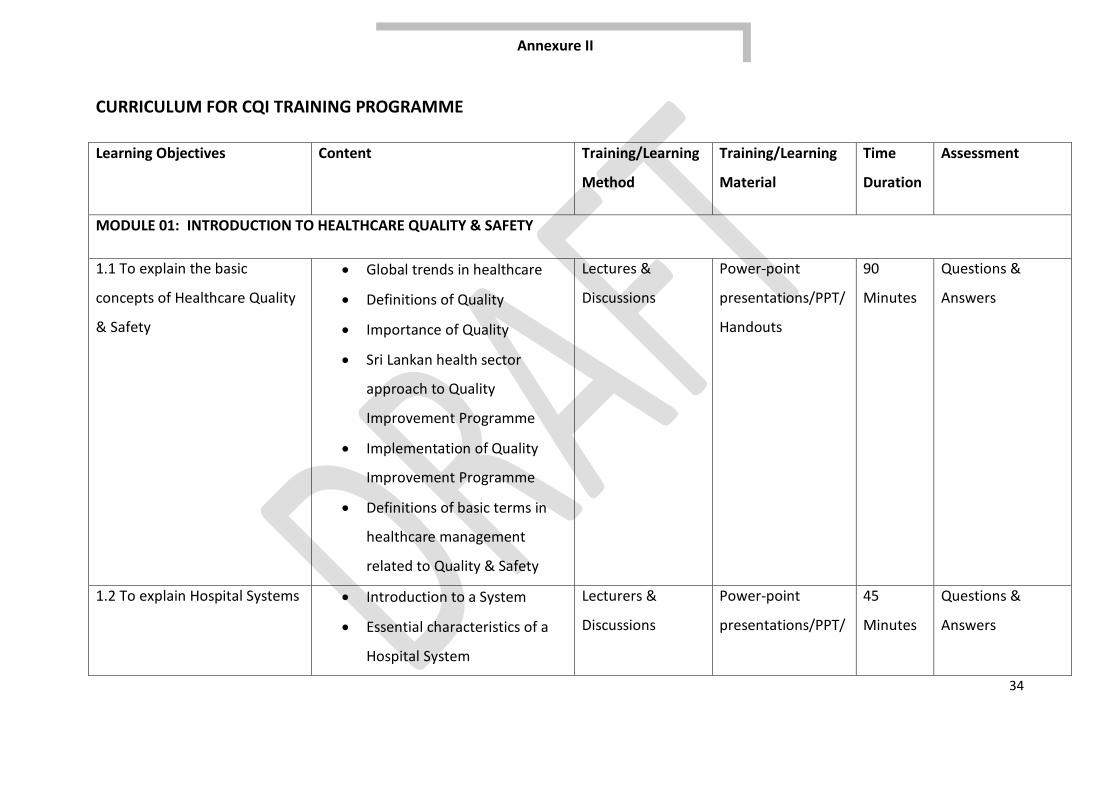
CURRICULUM FOR CQI TRAINING PROGRAMME
Learning Objectives Content Training/Learning
Method
Training/Learning
Material
Time
Duration
Assessment
MODULE 01: INTRODUCTION TO HEALTHCARE QUALITY & SAFETY
1.1 To explain the basic
concepts of Healthcare Quality
& Safety
Global trends in healthcare
Definitions of Quality
Importance of Quality
Sri Lankan health sector
approach to Quality
Improvement Programme
Implementation of Quality
Improvement Programme
Definitions of basic terms in
healthcare management
related to Quality & Safety
Lectures &
Discussions
Power-point
presentations/PPT/
Handouts
90
Minutes
Questions &
Answers
1.2 To explain Hospital Systems Introduction to a System
Essential characteristics of a
Hospital System
Lecturers &
Discussions
Power-point
presentations/PPT/
45
Minutes
Questions &
Answers
Annexure II
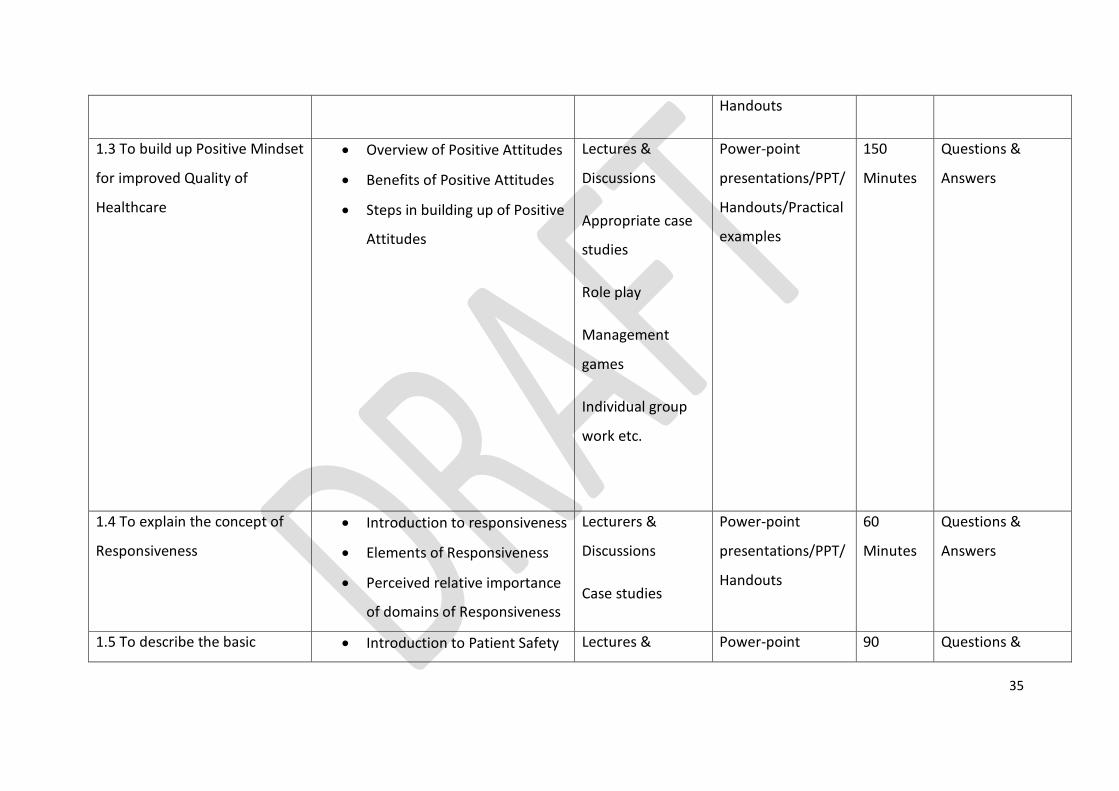
35
Handouts
1.3 To build up Positive Mindset
for improved Quality of
Healthcare
Overview of Positive Attitudes
Benefits of Positive Attitudes
Steps in building up of Positive
Attitudes
Lectures &
Discussions
Appropriate case
studies
Role play
Management
games
Individual group
work etc.
Power-point
presentations/PPT/
Handouts/Practical
examples
150
Minutes
Questions &
Answers
1.4 To explain the concept of
Responsiveness
Introduction to responsiveness
Elements of Responsiveness
Perceived relative importance
of domains of Responsiveness
Lecturers &
Discussions
Case studies
Power-point
presentations/PPT/
Handouts
60
Minutes
Questions &
Answers
1.5 To describe the basic Introduction to Patient Safety Lectures & Power-point 90 Questions &
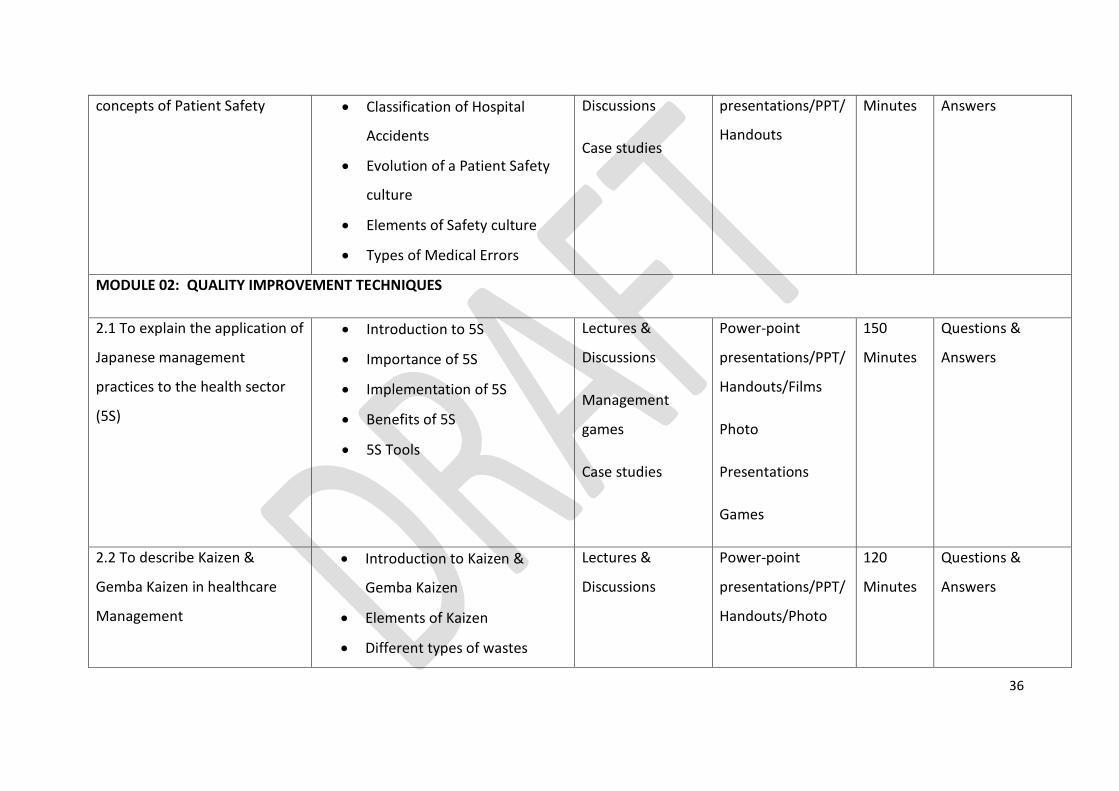
36
concepts of Patient Safety Classification of Hospital
Accidents
Evolution of a Patient Safety
culture
Elements of Safety culture
Types of Medical Errors
Discussions
Case studies
presentations/PPT/
Handouts
Minutes Answers
MODULE 02: QUALITY IMPROVEMENT TECHNIQUES
2.1 To explain the application of
Japanese management
practices to the health sector
(5S)
Introduction to 5S
Importance of 5S
Implementation of 5S
Benefits of 5S
5S Tools
Lectures &
Discussions
Management
games
Case studies
Power-point
presentations/PPT/
Handouts/Films
Photo
Presentations
Games
150
Minutes
Questions &
Answers
2.2 To describe Kaizen &
Gemba Kaizen in healthcare
Management
Introduction to Kaizen &
Gemba Kaizen
Elements of Kaizen
Different types of wastes
Lectures &
Discussions
Power-point
presentations/PPT/
Handouts/Photo
120
Minutes
Questions &
Answers
37
Benefits of Kaizen
Rules of implementing Kaizen
presentations
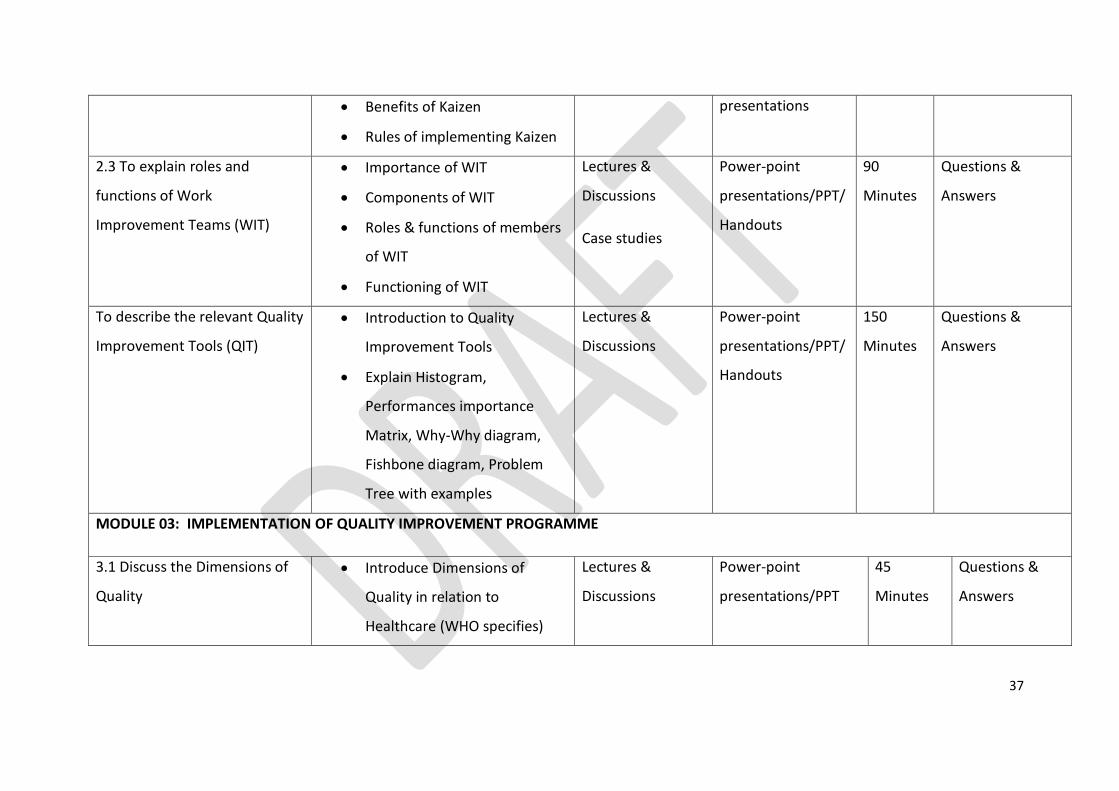
2.3 To explain roles and
functions of Work
Improvement Teams (WIT)
Importance of WIT
Components of WIT
Roles & functions of members
of WIT
Functioning of WIT
Lectures &
Discussions
Case studies
Power-point
presentations/PPT/
Handouts
90
Minutes
Questions &
Answers
To describe the relevant Quality
Improvement Tools (QIT)
Introduction to Quality
Improvement Tools
Explain Histogram,
Performances importance
Matrix, Why-Why diagram,
Fishbone diagram, Problem
Tree with examples
Lectures &
Discussions
Power-point
presentations/PPT/
Handouts
150
Minutes
Questions &
Answers
MODULE 03: IMPLEMENTATION OF QUALITY IMPROVEMENT PROGRAMME
3.1 Discuss the Dimensions of
Quality
Introduce Dimensions of
Quality in relation to
Healthcare (WHO specifies)
Lectures &
Discussions
Power-point
presentations/PPT
45
Minutes
Questions &
Answers
38
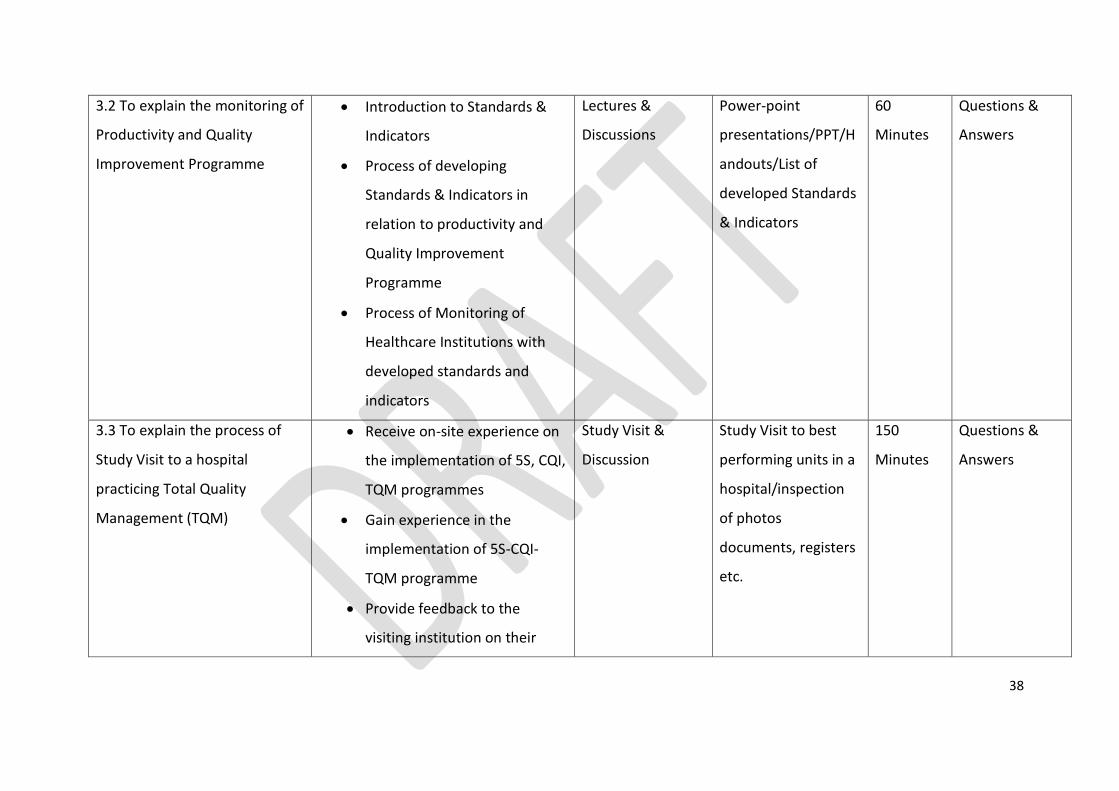
3.2 To explain the monitoring of
Productivity and Quality
Improvement Programme
Introduction to Standards &
Indicators
Process of developing
Standards & Indicators in
relation to productivity and
Quality Improvement
Programme
Process of Monitoring of
Healthcare Institutions with
developed standards and
indicators
Lectures &
Discussions
Power-point
presentations/PPT/H
andouts/List of
developed Standards
& Indicators
60
Minutes
Questions &
Answers
3.3 To explain the process of
Study Visit to a hospital
practicing Total Quality
Management (TQM)
Receive on-site experience on
the implementation of 5S, CQI,
TQM programmes
Gain experience in the
implementation of 5S-CQI-
TQM programme
Provide feedback to the
visiting institution on their
Study Visit &
Discussion
Study Visit to best
performing units in a
hospital/inspection
of photos
documents, registers
etc.
150
Minutes
Questions &
Answers

39
practices
Reflect on the practices of
visitors and identify measures
for improvement of their own
institutions
3.4 To develop an Action Plan
(Group Work) and presentation
of Group Work
Introduction to Group Work
Performing Group Work
Presentation of Group work to
a panel of resource personnel
Group work
presentation &
Discussion
Group Work
presentations using
Flip charts
150
Minutes
Questions &
Answers during
presentations
Preparation The Lecturer’s attire should be appropriate. He/she should not use negative/disappointing terms to the
participants. He/she should thoroughly go through the training material before conducting the lecture session. In
addition, the lecturer should use suitable examples relevant to health sector. The handouts must be made
available to the participants beforehand.
Training Material The handouts based on Power-point presentations need to be given to participants (06 slides/page). Along with
pens and pencils, half sheets/note pad can be given to make important remarks. Give handouts before the
lecture.
Materials should be attractive, clear and of as high a quality as possible; include instructions where relevant. It
may be worth making some material reusable. Supply everything needed for all activities in sufficient quantity.

40
Annexure III
Overall Session/Lecture Evaluation by trainees on Training of Introduction to Healthcare
Quality and Safety
Your valuable ideas are very much appreciated to improve future programmes and therefore please
feel free to share your unbiased ideas with us. Please complete each lecture evaluation immediately
after the lecture.
A. Overall module (please complete after finishing the module)
Please underline your response.
1. Timing of the entire module: Too congested/ congested/ Just right/ relaxed/ Too relaxed
2. Sequence of the lectures: Excellent/ Very good/ Good/ Satisfactory/ Needs improvement
3. Did the module fulfill your expectations? Not at all/ to some extent/ reasonable/ good/ very
good
4. Has the module helped you to develop new skills or improved your knowledge? Not at all/ to
some extent/ reasonable/ good/ very good
5. Lecture hall facilities: Excellent/ Very good/ Good/ Satisfactory/ Needs improvement
6. Hand outs and other materials for learning: Excellent/ Very good/ Good/ Satisfactory/ Needs
improvement
7. Your honest opinion on how the lectures/ module could be further improved (please write in
your own words):
………………………………………………………………………………………………………………………………………………
B. Lectures: Please rate in a scale of 1 to 4 (instructions on how to fill the table below is provided )
Please mark 1 or 2 or 3 or 4 in the space that best represents your evaluation of the lecture.
1-Poor 2-Adequate 3-Good 4-Excellent
Enthusiasm Speaks expressively or emphatically Moves about while lecturing
Gestures with hands and arms
Shows facial expressions
Uses humor Uses extemporaneous delivery
Clarity Uses concrete examples of concepts
Gives multiple examples
Points out practical applications
Stresses important points Repeats difficult ideas
Interaction Addresses students by name
Encourages questions and comments
Talks with participants after class
Praises students for good ideas
Asks questions of class
Task Orientation Proceeds at good pace for topic
Stays on the theme of the lecture States course objectives
Rapport Friendly, easy to talk to
Shows concern for participant’s progress
Offers to help participants with problems
Tolerant of other viewpoints
Organization Puts outline of lecture on board Uses headings and subheadings
Gives preliminary overview of lecture
Signals transition to new topic

41
Explains how each topic fits in To
pic
Enth
usi
asm
clar
ity
Inte
ract
ion
Task
ori
enta
tio
n
Rap
po
rt
Org
aniz
atio
n

42
This evaluation form was adapted from Pamela Cooper's adaptation of the form by Harry Murray, "Classroom teaching behaviors
related to college teaching effectiveness." In J. Donald and A. Sullivan (eds.) Using Research to Improve Teaching.San Francisco:
Jossey-Bass, 1985, p. 25
Changes for this or other sessions:
Add activities
Better preparation by facilitator / trainer
Draw more on participants’ experience
More review, move more slowly
Incorporate more collaboration
Move faster
Other ___________________
Other Topics to Cover:
_________________________________________________________________________
_________________________________________________________________________
_________________________________________________________________________

43
MODULE 01:
INTRODUCTION TO
HEALTHCARE QUALITY &
SAFETY
CHAPTER 01

44
TOPIC: INTRODUCTION TO HEALTHCARE QUALITY & SAFETY
Objectives: To make the participants understand and recognize the basic concepts of
Quality & Safety in relation to different levels of organizations
Total Amount of Time: 90 Minutes Number of Participants: 35 (Approx.)
Preparation: Since this is the first lecturer in this training programme, the lecturer should
come to the lecture at least 15 minutes in advance and make sure that the
auditorium is well set up for the training programme as mentioned in the
introduction chapter. Also refer the curriculum (Annexure: II of Introduction
Chapter)
Materials: Refer Curriculum (Annexure II of Introduction Chapter)
TRAINING OPENING
Engage Participants: (Ice-breaker/warm-up activity related to the topic)
Time: 05 Minutes
Start with emphasizing the importance of Quality Assurance Programme for their provinces,
regions and institutions and the milestones of Quality Assurance Programme in Sri Lanka.
Introduce the Topic: One power-point slide showing the main areas that will be covered
Time: 10 Minutes
SESSION PLAN - 01

45
Motivate participants, show them why the topic is important and share objectives and the
agenda. Introduce the topic with definitions of Quality and moving towards Healthcare
Quality. Give examples of ‘poor quality’ as against ‘good quality’ (develop examples of your
own experience) with implications for the staff, patients and cost.
TRAINING MIDDLE
Explain the Topic: Explain the topic in detail; demonstrate and discuss the concept,
practice and application of the topic
Time: 60 Minutes
Explain various quality concepts, approaches to Quality Improvement Programmes and
practical ways of implementing such programmes in a healthcare organization. Also, finally
explain the basic definitions of Quality & Safety in healthcare management.
TRAINING WRAP-UP AND CLOSING
Summarize the Topic: Reconnect with the objectives; check for understanding and discuss
questions
Time: 10 Minutes
Summarize learning; ask for questions and look back at objectives. Discuss questions in full
group; ask for participant responses to questions. Display the first power-point slide
showing the main areas that were covered. Possible obstacles that they may face should be
discussed.
Closing Comments: Acknowledge, motivate and inspire
Reinforce the importance of Quality & Safety in the healthcare organization; confirm that
the time was well spent and thank participants; reinforce group respect and rapport.

46
QUICK CHECK FOR FACILITATOR/TRAINER (To be filled after every session)
Reflects on how the training went on to develop training skills, to plan on future training
topics and to note potential next steps
Topic: Introduction to Healthcare Quality & Safety Date: ________
Attendees:
___________________________________________________________________________
___________________________________________________________________________
___________________________________________________________________________
___________________________________________________________________________
Observations Made by the Trainer:
___________________________________________________________________________
___________________________________________________________________________
___________________________________________________________________________
___________________________________________________________________________
___________________________________________________________________________
___________________________________________________________________________
___________________________________________________________________________
___________________________________________________________________________
47
CHAPTER 01: INTRODUCTION TO HEALTHCARE QUALITY & SAFETY
1.1 Background & Situation Analysis
This chapter is for the trainers to be convinced of the need for quality assurance in health
care. It starts with the current situation with regard to the health services, the reasons for
the good health indicators, the need of the hour, namely quality and the approaches made
so far and what more is required. It recaps the difficult road traversed so far to establish the
national QA programme. Further consolidation and gains depend on the efforts to be made
by the Provinces/Districts to which, the manual on Training of Trainers (TOT) is to provide a
road map.
Sri Lanka provides free healthcare services to all the citizens irrespective of their status,
income or geographic location and has achieved remarkable health outcomes, particularly
relative to neighboring countries with a similar income range. Nevertheless, there are
certain drawbacks in the hospital-based component of the healthcare delivery system which
have affected the quality and efficiency of its services as demonstrated by overcrowding in
the higher level institutions, deficiencies of amenities and patient dissatisfaction.
Over the last three decades successive governments in Sri Lanka have strived to address
these deficiencies in order to improve the healthcare service provision in the preventive and
curative sectors. The preventive health service areas were re-demarcated to serve people
more efficiently. Many hospitals in the remote areas were upgraded. The Health Sector
reforms instituted from 1994 established District General Hospitals in each district which
provide basic specialized services. Training of health personnel was intensified.
Medical/Nursing and Paramedical staff were appointed. The intensive care facilities and
laboratory services were expanded with appropriate technology.
Despite these initiatives by the Ministry of Health to improve the services, certain major
deficiencies still exist in the government health sector, as follows:
Some hospitals do not provide services focusing on the expectations of
customers/patients
48
Services provided by the hospitals are not attractively presented to the people
Many hospitals ignore non-health related expectations of the people such as,
o Basic human needs
o Dignity
o Kindness & compassion
o Communication with patients and relatives
o Prompt attention in emergency care
There had been numerous complaints on deaths and disabilities due to inappropriate care in
hospitals (WHO, 2000).
These deficiencies can be addressed by strengthening the National Quality Assurance
Programme.
Globally, the main reasons to implement quality assurance strategies are:
Unsafe health systems
Unacceptable levels of variations in performance, practice and outcome
Ineffective or inefficient (overuse, misuse or underuse) healthcare technologies
and/or delivery
User dissatisfaction
Waiting lists (in OPD, clinics, Operating Theatre etc.)
Unaffordable costs to the society
Waste from poor quality
According to a report by the Institute of Medicine (IOM) that quotes estimates from two
major studies, between 44 000 and 98 000 preventable medical deaths occur in healthcare
facilities in the United States each year. A study published by Health Grades in March 2011
found that, from 2007 through 2009, 52 127 Medicare inpatients developed hospital-
acquired bloodstream infections and 8,114 of them did not survive their hospitalization.
The study also reported that in the same period there were 708 642 total patent events
affecting 667 828 Medicare beneficiaries and there were 79 670 patient deaths among
those who experienced one or more patient events. According to a World Health
Organization report, 1 in 10 individuals receiving medical care will suffer preventable harm.

49
A study by the IOM found that 1.5 million Americans are injured by a medication error every
year. According to the Centres for the Disease Control, there are two million acquired
infections in hospitals in the United States every year. It is estimated that medical errors
cost between US$ 17 – 29 billion annually (Pauley & Pauley, 2011).
Even though our hospitals provide valuable services to the public, the services are not well
recognized by the public. Consequently, many hospitals have taken their own initiatives to
improve the services by way of improving infrastructure, introducing monthly performance
reviews, preparing manuals and guidelines, productivity improvement programmes etc. The
Ministry of Health has published valuable documents in Quality related activities in different
service areas such as Quality Assurance of Patient Care Services in 1995 and Guidelines on
Introduction to Quality and Safety in Healthcare Institutions in 2010.
The formal initiative in Quality Assurance in Sri Lanka has origins in late 1988, when the DDG
(MS) at that time came across with the publication, “Quality Assessment & Assurance in
Primary Health Care; M.I. Roemer & C. Montoya Aguilar. WHO Geneva, 1988”. Two pilot
projects were undertaken in the same year, one by the DDG (MS) & the other by the DPDHS
(the Regional Director of Health Services at that time) Kegalle. A presentation was made at
the monthly conference of the senior staff of the Ministry of Health in 1989 and a decision
was taken to initiate a Quality Assurance Programme for the health sector. A National
Consultative meeting was held in December same year & a National Programme with 32
sets of indicators & standards was launched (see Quality Assurance of Patient Care Services,
pages 13 to18). This programme mostly was concentrated on the availability of services
and improving quality in the areas of basic patient needs, cleanliness, health education and
maternity care. The programme was extended in a phased manner to selected Teaching &
Provincial hospitals. Some senior managers made use of the indicators to assess quality of
care during their inspections of institutions. A competition was held in 1991/92 to select
the best hospital that makes use of the indicators above to assess quality of care. The
competition was carried out at different levels of care namely, primary, secondary &
tertiary. Winners were selected at the provincial level. The final stage to judge winners at
the national level was however, not held.

50
An innovative work was done in the Uva province with the center being the GH Badulla. The
pioneering work was the result of individual initiatives led by Drs. Neil Fernando & Wimal
Karandagoda. The former started the programme in the MH - Angoda, when he assumed
duties as the Consultant Psychiatrist. The programme commenced on the 1st of July 2001.
The latter played the leading role in the revitalization of the programme in the
contemporary era. During 1990 – 1995 a number of awareness programmes were
conducted in the state sector hospitals around the country. A manual on Quality Assurance
of Patient Care Services was published in 1995.
A review of the programme was held in Kurunegala in 1994. It was felt that the programme
needed more focus. Accordingly, five critical areas of care were selected; fresh indicators &
standards were developed. An attempt was also made to extend the programme to the
Preventive sector but the initiative did not take root (Perera, MALR, 2004).
In 1995, the Ministry of Health has published a handbook on National Quality Assurance
Programme which provides basic concepts of Quality and Guidelines on monitoring
indicators. Even though, the pilot project was not formally expanded to other hospitals,
some institutions have embraced the concept and marched forward to introduce quality
improvement programmes to their own institutions.
The major drawbacks observed in this programme were not paying attention to customers’
expectations, staff welfare and human resource development. The concept was worked out
in a closed environment with limited participation of employees. As such, during late 1990’s
and in the new millennium, the professionals working on quality emphasized the
importance of improving systems rather than blaming failures and ensuring that the
customers’ expectations are properly addressed. The philosophy, ‘Quality fails when
System Fails’ by Sir Donald Berwick, one of the pioneers in Quality Healthcare in USA and
European countries, took root. Learning from health and non-health organizations to
prevent mistakes, improve systems and satisfy the customers was considered more fruitful.
The Quality Assurance Programme was re-launched in 2000 with the concept of ‘Quality
Healthcare through Productivity’. As an entry point for the quality improvement
programme, Castle Street Hospital for Women used the celebrated Japanese concept of ‘5S’
51
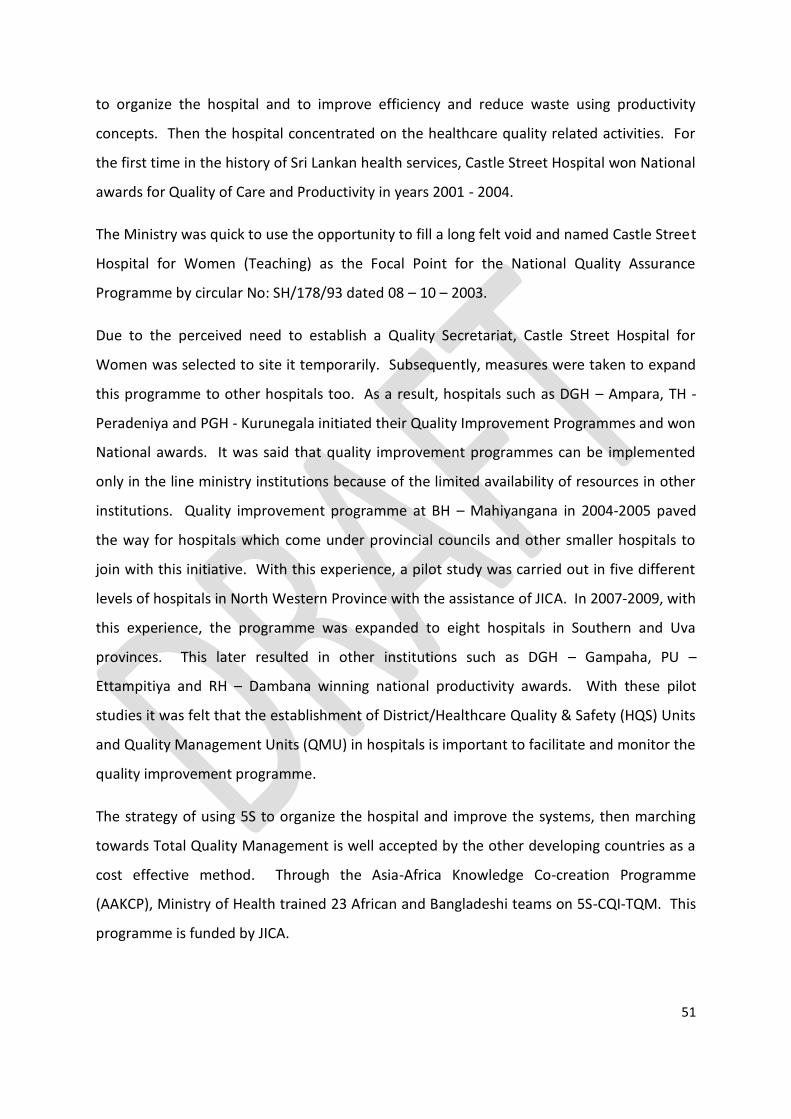
to organize the hospital and to improve efficiency and reduce waste using productivity
concepts. Then the hospital concentrated on the healthcare quality related activities. For
the first time in the history of Sri Lankan health services, Castle Street Hospital won National
awards for Quality of Care and Productivity in years 2001 - 2004.
The Ministry was quick to use the opportunity to fill a long felt void and named Castle Street
Hospital for Women (Teaching) as the Focal Point for the National Quality Assurance
Programme by circular No: SH/178/93 dated 08 – 10 – 2003.
Due to the perceived need to establish a Quality Secretariat, Castle Street Hospital for
Women was selected to site it temporarily. Subsequently, measures were taken to expand
this programme to other hospitals too. As a result, hospitals such as DGH – Ampara, TH -
Peradeniya and PGH - Kurunegala initiated their Quality Improvement Programmes and won
National awards. It was said that quality improvement programmes can be implemented
only in the line ministry institutions because of the limited availability of resources in other
institutions. Quality improvement programme at BH – Mahiyangana in 2004-2005 paved
the way for hospitals which come under provincial councils and other smaller hospitals to
join with this initiative. With this experience, a pilot study was carried out in five different
levels of hospitals in North Western Province with the assistance of JICA. In 2007-2009, with
this experience, the programme was expanded to eight hospitals in Southern and Uva
provinces. This later resulted in other institutions such as DGH – Gampaha, PU –
Ettampitiya and RH – Dambana winning national productivity awards. With these pilot
studies it was felt that the establishment of District/Healthcare Quality & Safety (HQS) Units
and Quality Management Units (QMU) in hospitals is important to facilitate and monitor the
quality improvement programme.
The strategy of using 5S to organize the hospital and improve the systems, then marching
towards Total Quality Management is well accepted by the other developing countries as a
cost effective method. Through the Asia-Africa Knowledge Co-creation Programme
(AAKCP), Ministry of Health trained 23 African and Bangladeshi teams on 5S-CQI-TQM. This
programme is funded by JICA.

52
In the year 2008, with the objective of reducing some variations in clinical practice, 93
clinical guidelines were prepared and disseminated to all secondary and tertiary care
hospitals. This was funded by the World Bank under Hospital Quality and Efficiency
component of the Health Sector Development Project. Also, six guidelines for the
improvement of healthcare quality and safety of different types of healthcare institutions
were prepared by the Ministry of Health.
Post war conditions in Sri Lanka have created a unique climate for overall development. Sri
Lanka’s private healthcare industry grew by 23 percent last year and the country has a huge
potential to develop medical tourism (WHO 2012). To achieve this, it is imperative that the
quality and safety standards of healthcare be assured. The need arose to establish an apex
body to facilitate the quality improvement programme. Therefore, under World Bank -
HSDP funds, a building was constructed for the apex body of the National Quality Assurance
Programme. A consultative committee was appointed to decide on the scope and functions
of the Directorate / Healthcare Quality and Safety. The Directorate was commissioned in
September 2012. Since then, measures have been taken to carry out the quality
improvement programme of the Ministry of Health in a planned manner. The Directorate
which is situated at the premises of the Castle Street Hospital for Women functions under a
Director under the purview of DDG (MS) 1. Currently this Directorate works towards a
‘Centrally Driven, Locally Led, Clinically Oriented, Patient Centered Continuous Quality
Improvement Programme.’
1.2 Introduction to Healthcare Quality
Quality can be defined in a variety of ways and increasingly, the terms, ‘Quality’ and ‘Safety’
are being used interchangeably. Safety may be regarded as one element of quality. The
most widely used definition of quality in healthcare is one that is safe, efficient, effective,
patient –centered, equitable, and timely.
In his book, ‘Managing for World-Class Quality’, Edwin Schecter (1992) states that achieving
quality requires a clear sense of what quality is. He defines quality using the following
characteristics:

53
1. Conformance: meeting or exceeding the minimum standards
2. Fitness for use: performing the task as advertised Reliability: performing the
intended function in the specified environment for the prescribed period of time
3. Yield: the percent of the product/service that conforms to specifications at each
evaluation point
4. Customer satisfaction: the customer’s perception of value; meeting customer
expectations (Schecter1992).
Defining quality by specific characteristics enables one to convert quality goals into
measurable indicators of performance.
1.3 Definitions of Quality
To define quality, it is worth considering several definitions that present the concept most
expressively. Here is a list of some of these definitions:
“Quality is conformance to requirements or specifications” – Philip Crosby, 1978
“Quality is doing the right thing right the first time and doing it better next time” -
AL-Assaf, 1993
“Quality is the degree to which care services influence the probability of optimal
patient outcomes” - American Medical Association, 1991
“Quality is meeting the requirements of the customer, both internally and externally,
for defect free products and services” – IBM, 1992
“Quality is providing our customers with innovative products and services that fully
satisfy their requirements”- Xerox,1993
“Quality is a process of meeting the needs and expectations of the customers, both
internal and external. Quality can also be referred to as a continuous process of
incremental improvement” - AL-Assaf, 1998

54
By these definitions, the importance of meeting the needs not the wants of the customers is
emphasized. Certainly, the issue of affordability and availability of resources should be
taken into consideration. Also, one should study the needs and expectations of both types
of customers, external and internal. Staff and employees are internal customers to the
administration and their needs and expectations should be studied and every effort should
be made to meet them.
External customers are represented primarily by the patients, but other entities that the
organization in question deals with should also be investigated and studied to identify and
meet their needs and expectations. Thus, quality has many perspectives where each
customer has specific needs and expectations to be fulfilled by the provider organization
(Al-Assaf, 2001).
Definitions of Quality in Healthcare
Work groups such as those in the Institute of Medicine (IOM) have attempted to define
quality of health care in terms of standards.
This led to a definition of quality that appeared to be dependent on listings of quality
indicators, which are expressions of the standards. These standards are not necessarily in
terms of the possibilities or conceptual clusters for these indicators. Further, most clusters
of quality indicators were and often continue to be comprised of the 5Ds— Death, Disease,
Disability, Discomfort and Dissatisfaction rather than more positive components of quality
(Mitchell, 2008).
Initially, the IOM defined quality as the “the degree to which health services for
individuals and populations increase the likelihood of desired health outcomes and are
consistent with current professional knowledge” (Lohr, 1990).
The definition of Quality in Public Care in defined as ‘Fully meeting the needs of those
who need the service most, at the lowest cost to the organization, within limits and
directives set by higher authority (Ovretveit, 1990).

55
The idea behind the phrase ‘Fully meeting the needs of those who need the service most’
reflects that there may not be sufficient resources to meet everyone’s needs. The phrase
‘at the lowest cost to the organization’ is a management issue, i.e., using the resources
more efficiently by eliminating all possible waste. The phrase ‘within limits and directives
set by higher authority’ indicates that the public sector organizations do have
responsibilities placed upon them that are essentially non-negotiable and have to work
within these (Moullin, 2002).
The appearance of certain recurrent quality related problems in a hospital shows clearly the
importance of maintaining quality. The need for quality is perhaps self-evident; it is useful
to list some of the main reasons why quality is important:
It is important for patients and service users
It is important for the staff
It can help reduce costs and provide an even better service within a given budget
(Moulin, 2002)
The implications of poor quality in hospitals are described in the following table.

56
Table 2.1: Implications of poor quality in hospitals
Description Implications for
patients
Implications for the
staff
Cost implications
(Examples from a
Government
hospital)
Inadequate clinical
details given to the
Pathology
Department
E.g. Not mentioning
the LRMP of the
patient when her
curetting was sent
to the laboratory
following EUA/D &C
Delays to patients
Risks of incorrect
test results and
interpretations
Increased length
of stay
Extra work for
the Pathology
staff
Extra pathology
costs
Cost for the
increased length
of stay
Cancellation of
some other
appointments
given
(Example from a
private hospital)
Patients are kept
waiting over an
hour for pre-
booked
appointments
Stress &
frustration
Problems in
parking vehicles
as car park is not
being cleared
Staff has to play
the defensive
role
Extra staff time
on explaining
and mollifying
Need for larger
waiting rooms
and car parks

57
According to Peter Drucker, a management expert, people have different stereotypes and
beliefs on quality. He calls them myths of quality and they are the following:
Quality means goodness, luxury, shininess or weight (Quality does not have to be the
most expensive or the most prominent approach or product. Actually, quality can be
as simple as doing one’s job better continuously. A quality of care does not have to
be only a care provided in the most expensive settings and by the most eminent
professors of medicine. Healthcare quality can be as simple as providing appropriate
and necessary care to the right healthcare consumer in the most efficient manner,
utilizing the currently available resources).
Quality is intangible and therefore is not measurable (People often believe that
Quality is something of an ideal that cannot be calculated or attained. However, this
is not true. Quality is tangible and is measurable. Healthcare is a system. Therefore,
according to the simple system theory as applied to health care by Dr. Avedis
Donabedian in 1966, each healthcare system can be divided into three components:
structure i.e. human and physical resources, processes i.e. the procedure and
activities of care and treatment and outcomes i.e. the results of care and services.
Certainly, each of these components has a number of quantifiable elements that can
be accurately defined and measured.)
There is ‘economics of quality’. The common belief is, (incorrectly), that quality is
too expensive to achieve and therefore, we cannot afford it. In reality, quality is
based on the principle of cost saving.
Quality problems are caused by the workers (actually, more than 85% - 90% of the
errors could be system-related while only 10-15% could be human or workers’
errors).
Quality originates in the quality department (Quality department should only act as a
facilitator, an advocate or a coordinator of the quality efforts in the system. It is
really the responsibility of every worker to provide quality, to practice quality and to
ensure improvements towards quality. Quality is everyone’s responsibility and it

58
should originate from the system’s units and by the system’s workers (Al Assaf,
2002).)
Total Quality Management (TQM) has gained wide coverage and many reported successes
in a wide variety of organizations in the private and public sectors. ‘TQM is an ongoing
process, requiring commitment from top management and involving everyone in the
organization, to meet the requirements of service users and other stakeholders while
keeping costs to a minimum’.
However, there have been failures too in the organizations that have adopted the TQM
approach because it seemed the right buzzword, but have ignored many of its features.
TQM is not a bolt-on method that allows managers to continue as before, but with this extra
‘tool’ called TQM. It requires them to rethink of their entire management strategy.
1.4 Quality Control, Assurance and Total Quality Management (TQM)
There are many quality ‘buzzwords’ going around both in healthcare and in the wider
business world. These include Quality Control, Quality Assurance, Quality Management and
Total Quality Management (TQM). To some extent, these terms are used interchangeably
(but incorrectly) but it is important to understand their meanings and differences.
Quality Control – Controlling and monitoring processes to produce quality products (E.g.
double checking that a clinical test has been analyzed correctly).
Quality Assurance – Also concerned with the prevention of quality problems through
planned and systematic activities including documentation, training, and reviewing the
process (E.g. Feeding back information on quality problems which are found in the checking
process and changing the procedures to reduce the number of errors).
Quality Management – This focuses on the management and people issues involved in
achieving real and lasting quality improvement (E.g. Addressing, the laboratory such as poor
motivation, training, staff involvement, communication and leadership)

59
Total Quality Management (TQM) – An ongoing process requiring commitment from top
management and involving everyone in the organization, to meet the requirements of
service users and other stakeholders while keeping the cost to a minimum (E.g. Going
beyond the laboratory to address the problems that users encounter, not just in the
laboratory but in the whole hospital and referring agencies) (Moullin, 2002).
Continuous Quality Improvement (CQI) – The continuous process of attaining a new level of
performance or quality that is superior to any previous level of quality (Katz & Green, 1997).
1.5 Quality & Cost
The relationship between quality and cost is often misunderstood. The following comments
are perhaps typical: ‘We can’t afford to improve quality, we’re already t over budget as it is’;
‘How can we afford to improve quality when we can’t even afford a decent……’ However,
the relationship between quality and cost is not so clear-cut. Most improvements in quality
will cost money, but many can be seen as investments which will repay themselves many
times over in a short space of time.
It is not difficult to think of examples where improving quality costs more. Upgrading the
existing facilities or extending the opening hours of a drop-in clinic will both carry a price
tag. However, other costs may be reduced. For example, better X-ray or ultrasound
imaging equipment may lead to more people being diagnosed correctly or sooner, reducing
the cost of patient stays in hospital. Similarly, better facilities for staff may reduce
absenteeism and turnover, saving recruitment and training costs (Moulin, 2002).

60
Figure 1.1: Costs of quality before and after quality improvement
(Adopted from Moulin 2002)
1.6 Implementation of Quality Improvement Programme
The most important feature of the process to achieve quality in healthcare services is that it
is lengthy and it consists of following three steps:
Step 1 . . . . . . . . . . . . 5S activities to improve work environment
Step 2 . . . . . . . . . . . . KAIZEN activities for participatory problem solving in the
service front
Step 3 . . . . . . . . . . . . TQM as an approach to make maximal use of the capacity of
the entire organization

61
Figure 1.2: Growth of 5S – KAIZEN – TQM Programme
(Adopted from Hasegawa, 2011)
During initial 5S step (Step 1), the main focus is Work Environment Improvement (WEI)
ensuring the productivity improvement of organization/hospital. Then the target is
gradually shifted to the improvement of Quality/Safety and thereafter, to the realization of
TQM.
MoH
Growing
TQM
Field Hospital
Whole Country
SEEDS
Strategic
Paper
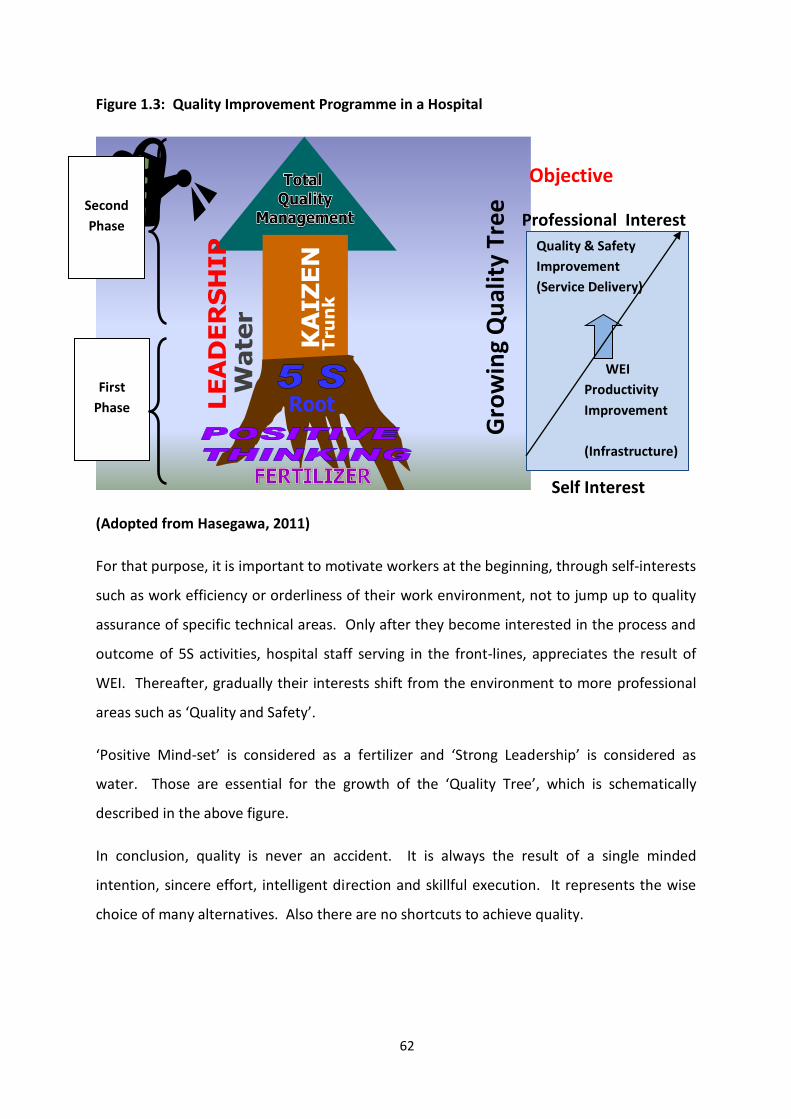
62
Figure 1.3: Quality Improvement Programme in a Hospital
KA
IZ
EN
LE
AD
ER
SH
IP
Wa
ter
Tru
nk
Root
(Adopted from Hasegawa, 2011)
For that purpose, it is important to motivate workers at the beginning, through self-interests
such as work efficiency or orderliness of their work environment, not to jump up to quality
assurance of specific technical areas. Only after they become interested in the process and
outcome of 5S activities, hospital staff serving in the front-lines, appreciates the result of
WEI. Thereafter, gradually their interests shift from the environment to more professional
areas such as ‘Quality and Safety’.
‘Positive Mind-set’ is considered as a fertilizer and ‘Strong Leadership’ is considered as
water. Those are essential for the growth of the ‘Quality Tree’, which is schematically
described in the above figure.
In conclusion, quality is never an accident. It is always the result of a single minded
intention, sincere effort, intelligent direction and skillful execution. It represents the wise
choice of many alternatives. Also there are no shortcuts to achieve quality.
Second
Phase
First
Phase
Gro
win
g Q
ual
ity
Tree
Quality & Safety
Improvement
(Service Delivery)
WEI
Productivity
Improvement
(Infrastructure)
Self Interest
Professional Interest
Objective

63
The implementation of quality improvement programme has five phases. Those five phases
and the phases related to each activity are described in the following figures.
Figure 1.4: Road Map for Quality Improvement
Implementation
Introduction
Expanding
Preparation
Sustaining
Quality
Phase 1
Phase 2
Phase 3
Phase 4
Phase 5
Road Map for Quality Improvement
CONTINUOUS QUALITY IMPROVEMENT (CQI)
Figure 1.5: Road Map for Quality Improvement – Phase I
Implementation
Introduction
Expanding
Preparation
Sustaining
Quality
Road Map for Quality Improvement
• Learn about 5S, Kaizen, Productivity and Quality
• Situation Analysis (Kaizen Diagnosis Team, photos/
Video)
• Integrate and align ‘ Quality Goals’ into the hospital
plan
• Determine how transfer initiative will be integrated
with other processes and initiatives already in the
organization
• Select resource persons
• Address financial issues
• Identify 10 key areas for improvement

64
Figure 1.6: Road Map for Quality Improvement – Phase II
Implementation
Introduction
Expanding
Preparation
Sustaining
Quality
Road Map for Quality Improvement
• Establish infrastructure
- QMU
- Steering committee
- Work Improvement Teams
• Develop and begin implementation of the communication
plan
- Internal
- External
• Establishment of objectives
•Develop Kaizen Improvement activity programme.
• Training of middle level managers and dissemination of
objectives
•Study visits
Figure 1.7: Road Map for Quality Improvement – Phase III
Figure 1.8: Road Map for Quality Improvement – Phase IV
Implementation
Introduction
Expanding
Preparation
Sustaining
Quality
Road Map for Quality Improvement
• Train staff members and disseminate objectives
• Conduct pilot projects
•Form WITs
•Start with implementing 5S (No cost, Low cost activities)
• Support and monitor projects
• Measure and review programme
• Customer and employee satisfaction surveys
• Review lessons learned
• Make decisions
• Involve consultants
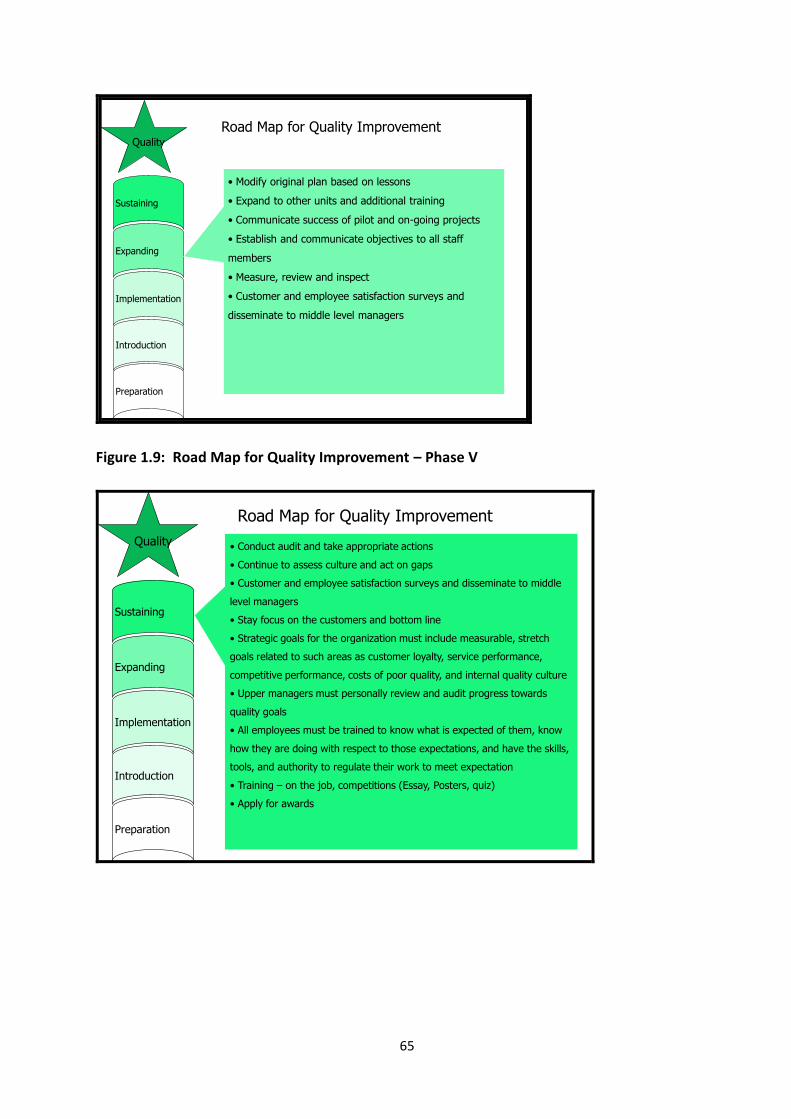
65
Implementation
Introduction
Expanding
Preparation
Sustaining
Quality
Road Map for Quality Improvement
• Modify original plan based on lessons
• Expand to other units and additional training
• Communicate success of pilot and on-going projects
• Establish and communicate objectives to all staff
members
• Measure, review and inspect
• Customer and employee satisfaction surveys and
disseminate to middle level managers
Figure 1.9: Road Map for Quality Improvement – Phase V
Implementation
Introduction
Expanding
Preparation
Sustaining
Quality
Road Map for Quality Improvement
• Conduct audit and take appropriate actions
• Continue to assess culture and act on gaps
• Customer and employee satisfaction surveys and disseminate to middle
level managers
• Stay focus on the customers and bottom line
• Strategic goals for the organization must include measurable, stretch
goals related to such areas as customer loyalty, service performance,
competitive performance, costs of poor quality, and internal quality culture
• Upper managers must personally review and audit progress towards
quality goals
• All employees must be trained to know what is expected of them, know
how they are doing with respect to those expectations, and have the skills,
tools, and authority to regulate their work to meet expectation
• Training – on the job, competitions (Essay, Posters, quiz)
• Apply for awards

66
1.7 Basic Definitions in Healthcare Management
Term Explanation
Problem A difficulty requiring a solution
P= ( E-A ) * C
P = Problem E = Expected situation
A = Actual situation C = Concern
Policy An expression of goals for improving a situation, the priorities among
these goals and the main directions for attaining them.
Planning Making a set of advanced decisions based on analytical approach
concerning efficient use of resources to bring the desired change in a
given situation
Objective An objective is the desired extent improvement of the problem
Objectives are essentially steps towards the goal
Input The resources available to provide the service
Process Processes are repeated activities that take resources as inputs, add value
to them and provide outputs to customers
Output The quantifiable products of the resources
Outcome Is the effect on the consumer on using the output
Standard Professionally (or humanely) agreed level of performance for a particular
setting which is
Desirable, Achievable and Measurable
Quality
Assurance
A system of activities which enables the production of a defined service to
agreed standards within given resources.
67
Productivity Optimization of production/service using the given resources.
(ensure the product or service that people want to purchase/like)
Total Quality
Management
A comprehensive & fundamental rule or belief for Leading & operating an
organization aimed at, Continuously improving performance over long
term by focusing on Customers while addressing the needs of all
stakeholders
Quality
Indicator
A variable or parameter that can measure changes in a phenomenon
directly or indirectly in a valid, objective, sensitive and specific way.
(Karandagoda, 2007)
References
AL-Assaf A F, Healthcare Quality – An International Perspective, World Health
Organization, Regional Office for South-East Asia, 2001
Hasegawa T and Karandagoda W, Change Management through stepwise approach
with 5S-KAIZEN-TQM: Jan. 2011, Japan International Cooperation Agency (JICA),
Japan
Karandagoda Wimal, Lecture Notes, 2007
Katz M. Jacqueline, Green Eleanor, Managing Quality, A guide to system-wide
performance management in healthcare, second edition, Mosby, 1997
Lohr K N, Medicare: A Strategy for Quality Assurance, Washington D.C., National
Academic Press
Mitchell PH (2004), Lang NM. Nurse staffing: a structural proxy for hospital quality?
Medical Care. Jan 2004;42(1):1-3
Moulin Max, Delivering Excellence in Health and Social Care, Open University Press,
2002

68
Overtveit, J, What is quality of health services? Health Services Management, June
1990, 132-3
Pauley Ann Judith, PauleyF Joseph, Establish a Culture of Patient Safety, ASQ Quality
Press, 2011
Perera, MALR, Current status and outcomes of the national quality assurance
programme report of a Consultancy 23.07. 2004
Schecter E, Managing for World Class Quality, Milwaukee, 1992, Quality Press
WHO, Report of National Conference on Patient Safety, 2012

69
MODULE 01:
INTRODUCTION TO
HEALTHCARE QUALITY &
SAFETY
CHAPTER 02
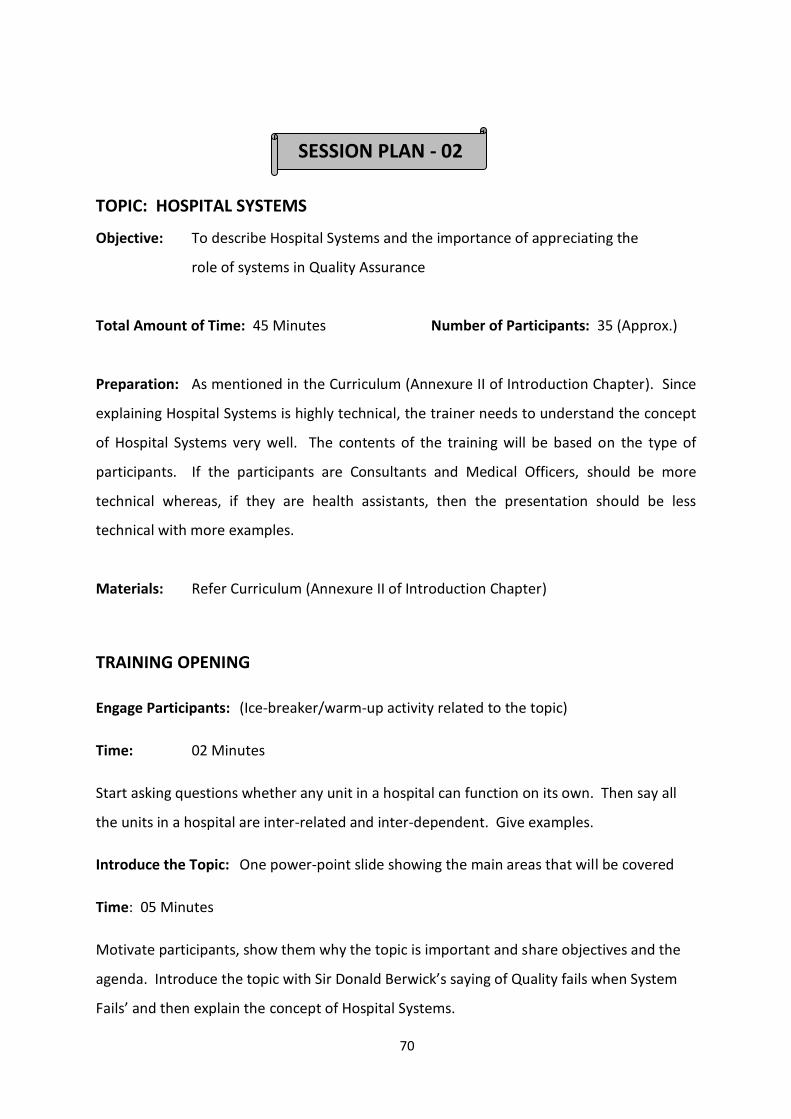
70
TOPIC: HOSPITAL SYSTEMS
Objective: To describe Hospital Systems and the importance of appreciating the
role of systems in Quality Assurance
Total Amount of Time: 45 Minutes Number of Participants: 35 (Approx.)
Preparation: As mentioned in the Curriculum (Annexure II of Introduction Chapter). Since
explaining Hospital Systems is highly technical, the trainer needs to understand the concept
of Hospital Systems very well. The contents of the training will be based on the type of
participants. If the participants are Consultants and Medical Officers, should be more
technical whereas, if they are health assistants, then the presentation should be less
technical with more examples.
Materials: Refer Curriculum (Annexure II of Introduction Chapter)
TRAINING OPENING
Engage Participants: (Ice-breaker/warm-up activity related to the topic)
Time: 02 Minutes
Start asking questions whether any unit in a hospital can function on its own. Then say all
the units in a hospital are inter-related and inter-dependent. Give examples.
Introduce the Topic: One power-point slide showing the main areas that will be covered
Time: 05 Minutes
Motivate participants, show them why the topic is important and share objectives and the
agenda. Introduce the topic with Sir Donald Berwick’s saying of Quality fails when System
Fails’ and then explain the concept of Hospital Systems.
SESSION PLAN - 02

71
TRAINING MIDDLE
Explain the Topic: Explain the topic in detail; demonstrate and discuss the concept,
practice and application of the topic
Time: 30 Minutes
Nature of Input, Output, throughputs and feedback should be explained. Then, viewing the
work organization as a total system has to be addressed.
TRAINING WRAP-UP AND CLOSING
Summarize the Topic: Reconnect with the objectives; check for understanding and discuss
questions
Time: 05 Minutes
Allow participants to ask questions and discuss those questions
Closing Comments: Acknowledge, motivate and inspire Time: 03 Minutes
Inform participants that in any quality improvement programme, looking the organization as
a system is vital and motivate them to build the system within their organization.

72
QUICK CHECK FOR FACILITATOR/TRAINER (To be filled after every
session)
Reflects on how the training went on to develop training skills, to plan on future training
topics and to note potential next steps
Topic: Hospital Systems Date: ________
Attendees:
___________________________________________________________________________
___________________________________________________________________________
___________________________________________________________________________
___________________________________________________________________________
Observations Made by the Trainer:
___________________________________________________________________________
___________________________________________________________________________
___________________________________________________________________________
___________________________________________________________________________
___________________________________________________________________________
___________________________________________________________________________
____________________________________
___________________________________________________________________________
_______________________________________

73
CHAPTER 02: HOSPITAL SYSTEMS
2.1 Introduction
Healthcare provision in developing countries is complicated since most of them do
not perceive and appreciate the interaction of systems in the delivery of services. This is
specially seen in the hospital sector. Patient care outcomes depend on how best the care is
provided in different systems (sub units) in a well coordinated manner. Systems such as
Logistics, Physical structures, Medical equipments & Technologies and deployment of
human resources influence quality of care.
Over the last century, many theories have been put forward to understand systems.
These theories teach us that a hospital has to be seen as a composite system & should be
considered in terms of vertical as well as horizontal relationships of subsystems to improve
quality. The outstanding performance of a human body is taken as an example where a
number of sub systems actively contribute to the whole body responding to provide best
outcomes in a given scenario.
Developed countries are also facing issues with systems failures. Sir Donald Berwick of IHI
(Institute of Health Improvement) states,
When an organized institution provides services or manufacture products, it needs
resources and processes to manufacture a product or provide service. During this series of
manufacturing activities, an organization needs to monitor the different processes.
2.2 The Systems Approach
Each school of management thought tends to emphasize one major feature of an
organization:
“QUALITY FAILS WHEN SYSTEMS FAILS”
74
1. Scientific management focuses on work
2. Human relations and behaviorism stress the worker and the worker-manager-
relationship
3. Structuralism emphasizes organizational design
4. Management process theory focuses on the functions of the manager
5. Management science theory adds computer technology to the scientific method
The search for a management method that takes into account each of these essential
features led to the systems approach. This focuses on the organization as a whole, its
internal and external components, the people in the organization, the work process and the
overall organizational environment (Liebler and McConnell, 2012).
2.3 Historical Development of the Systems Model
The systems model is generally accepted in the area of computer technology, but its use
need not be limited to such an application; at its origin, it was not so restricted. A more
flexible use of this approach provides the manager with a framework within which the
interaction of internal and external organizational factors (systems) can be visualized. The
systems approach to management emphasizes the total environment of the organization.
The cycle of each component consists of inputs and processes transformed to output. The
changes in organizational environment can be assessed continually in a structured manner
to determine the impact of change.
Management theorists turned to biologists and other scientists to develop the idea of
considering an organization as a total system. With this ecological approach, a change in
any one aspect of the environment has an effect on the other components of the
organization. The specifics are analyzed, but always in terms of the whole. The institution is
considered an entity that ‘lives’ in a specific environment and has essential parts that are
interdependent.
General systems theory as a concept was introduced by Bertalanffy, a biologist in 1951. His
terminology is the foundation for the basic concepts of the general systems theory
(Bertalanffy, 1962).

75
2.4 Basic Systems Concept and Definitions
A system may be defined as an assemblage or combination of things or parts forming a
complex or unitary whole, a set of interacting units. The essential focus of the systems
approach is to understand the relationship and interdependence of the parts. The system
approach moves beyond the structure or function (e.g. organization charts,
departmentalization) to emphasize the flow of information, the work, the inputs and the
outputs. Systems and horizontal relationships to the vertical relationships contained in
traditional organizational theory.
The systems model is made up of four basic components: (1) inputs, (2) throughputs or
processes, (3) outputs and (4) feedback (Figure 2-2). The overall environment also must be
considered.
Figure 2-1: Basic Systems Model
Output of a process can be an input of another process.
The following diagram shows the systems model.
Input Output
Feedback

76
Figure 3.2: Systems Model
Core Process: Service
Delivery
Inputs
Patient
Trained Personnel
Supplies / Equipment
Clean facility
House Keeping
Equipment
(Maintenance)
Medical Records
Medications
(Pharmacy)
X-ray report
(radiology)
Lab. Report
Reception and Rx
areas
Infection control and
standards
Outcome
Pt. treated
according to agreed
upon standards
Satisfied client
Improved health
status
Process
Admission
Diag. exams, tests,
procedures
Medical Rx
Nursing care
Complementary
services
Counseling and Pt.
education
Follow up / discharge
plan
Inputs
Room Needing
cleaning
Worker with
knowledge of proper
cleaning techniques
Cleaning materials
Process
Cleaning the room
according to
cleaning procedures
Support System: House Keeping
The systems model in relation to diagnosis and treatment is shown below:
Figure 2.3: Systems Model in Diagnosis & Treatment
Structure OutcomeProcess
Characteristics of the diagnosis laboratory
Physician’s Characteristics
Test performed by the laboratory
Test ordered by the physician
Results of tests interpreted by the physician
Treatment chosen and executed by physician, other personnel and patient
Results of tests
Diagnosis: the illness and its characteristics
Change in the patient’s health

77
The excellence of a product or service depends on how much of values are added to the
process and the removal of unwanted effects in a process.
E.g.: 1. Use of sterile material in a wound dressing is a value addition.
2. Involvement of an untrained person for the care process is a
non value addition.
2.5 The Nature of Inputs
Inputs are elements the system must accept because they are imposed by outside forces.
The many constraints on organizational processes, such as government regulations and
economic factors are examples of typical input constraints imposed by outside forces.
Certain inputs are needed to achieve organizational goals; for example, the inputs are often
the raw materials that are processed to produce some object or service. The concept of
inputs may be expanded to include the demands made on the system, such as deadlines,
priorities or conflicting pressures. Goodwill towards the organization and general support
(or the lack of these) also may be included as inputs.
A systematic view of inputs for a healthcare organization or one of its departments could
include the following elements:
Characteristics of clients – average length of stay, diagnostic categories, payment
status
Ministry requirements – adherence to standards specified by the Ministry of Health
Laws concerning employers – the Occupational Safety and Health Act, worker’s
compensation, Occupational Safety
Multiple Goals – patient care, teaching, research
2.6 The Nature of Outputs

78
Outputs are the goods and services that the organization (or subdivision/unit) must
produce. These outputs may be routine, frequent, predictable and somewhat easy to
identify. The stated purpose of the organization usually contains information on its basic,
obvious outputs. For example, a fire department provides fire protection, a hospital offers
patient care, a department store sells goods, a factory produces goods and airline supplies
transportation. Managers control routine and predictable outputs through proper planning.
Other necessary outputs are infrequent but predictable. By careful analysis of
organizational data over a relatively long period of time, these infrequent outputs can
usually be identified. For example, hospitals or programs are reaccredited periodically and
plans can be made for the reaccreditation process because it is predictable. Most managers
must deal with a third category of outputs: the unpredictable outputs for which they can
and must plan. In an outpatient clinic, for example, the number of walk-in and emergency
patients is not completely predictable. To plan for these relatively random demands of the
system, the manager can study the pattern of walk-in and emergency patients, their times
of arrivals and the purposes of their visits. Some patient education would probably be done
to help clients to take advantage of orderly scheduling. Staffing patterns would be adjusted
to meet the anticipated needs. The planning is designed to shift the unpredictable to the
predictable as far as possible. Other examples of unpredictable outputs for which plans can
be developed include telephone calls, employee turnover rates and even activities required
by certain kinds of seasonal disasters (e.g. Floods or cyclones) or by seasonal changes in the
numbers and types of clients (e.g. in a resort area).
Some outputs are unexpected, such as those that become necessary because of natural
disasters or sudden economic chaos. Even in these instances, managers can anticipate and
plan for Armageddon in any of its symbolic or real forms. Disaster planning, for example, is
a required part if institutional healthcare management. The renewed emphasis on disaster
planning in light of bioterrorism or other major political-social disruption has added urgency
to such planning in contemporary times.

79
2.7 Throughputs
Throughputs are the structures or processes by which inputs are converted to outputs.
Physical plant, work flow, methods & procedures and hours of work are throughputs.
Inputs originate in the environment of the organization; throughputs, as the term implies,
are contained within the organization. Throughputs are analyzed by work sampling, work
simplification, methods improvement, staffing patterns and physical layout analysis.
Management may be severely limited in their ability to control inputs but the processes,
structures, organizational patterns and procedures that constitute the throughputs are
areas of management prerogative. For example, a chief of service cannot control patient
arrival for walk-in services in a clinic; this input is imposed on the system. The policies and
procedures for processing walk-in patients, however, constitute a cluster of throughputs
that can be determined by the manager. The physical space allotment for a department
may be imposed; the manager must accept this input but the final and detailed physical
layout of the department is under the manager’s control.
In a specialized service, the control of throughputs is directly related to the manager’s
professional knowledge. For example, procedures for processing patient flow within a clinic
are developed by the head of the service because of that person’s knowledge on patient
care procedures, priorities and the interrelationships among components of the treatment
plan. The policies and procedures for the release of information from patients’ health
records are aspects of highly technical processes that are the domains of the professional
health information specialist.
In some cases, elements that theoretically belong to the throughputs category are
considered inputs. These are elements that are imposed by the environment (i.e. the
organization as a whole). Managers may not be able to exert direct control over some
aspects of the work (e.g. in the case of physical space limitations, budget cuts and personnel
vacancies) and these elements could be listed as special inputs.

80
2.8 Feedback
Changes in the input mix must be anticipated. To respond to these changes, managers need
feedback on the acceptability and adequacy of the outputs. It is through the feedback
process that inputs and even throughputs are adjusted to produce new outputs. The
communication network and control processes are the usual sources of organized feedback.
Routine, orderly feedback is provided by such activities as market research and forecasting
in business organizations, client surveys in service organizations and periodic accreditation
surveys in healthcare institutions, periodic employee evaluations in work groups and
periodic testing and grading in an educational system. The management by objectives
(MBO) process and short interval scheduling and program evaluation review technique
(PERT) networks constitute specific management tools of planning and controlling that
include structured, factual feedback.
If there is an absence of planned feedback, if the communication process is not sufficiently
developed to permit safe and acceptable avenues for feedback, or if the feedback actually
received is ignored, a certain amount of feedback will occur spontaneously. In this case, the
feedback tends to take a negative form, such as a client outburst of anger, a precipitous
lawsuit, a riot, a wildcat strike, a consumer boycott or an epidemic. Spontaneous feedback
could take a positive form, of course, such as the acclamation of a hero or leader after a
crisis or an unsolicited letter of satisfaction from a client.
Some feedback is tacit and the manager may assume that since there is no overt evidence
to the contrary, all outputs are fine. The danger in such an assumption is that problems and
difficulties may not come to light until a crisis occurs. The planning process is undermined
because there are no reliable data that can be used to assess the impact of change and to
implement the necessary adjustments.
2.9 Application of General Systems Theory
The systems approach enables managers to focus on the organization as a whole and to
view each particular division or unit in the organization in relation to the whole. Through
the systems approach, managers can cut across organizational lines to determine
interrelationships in the work flow and to assess complexities in the structure and in the
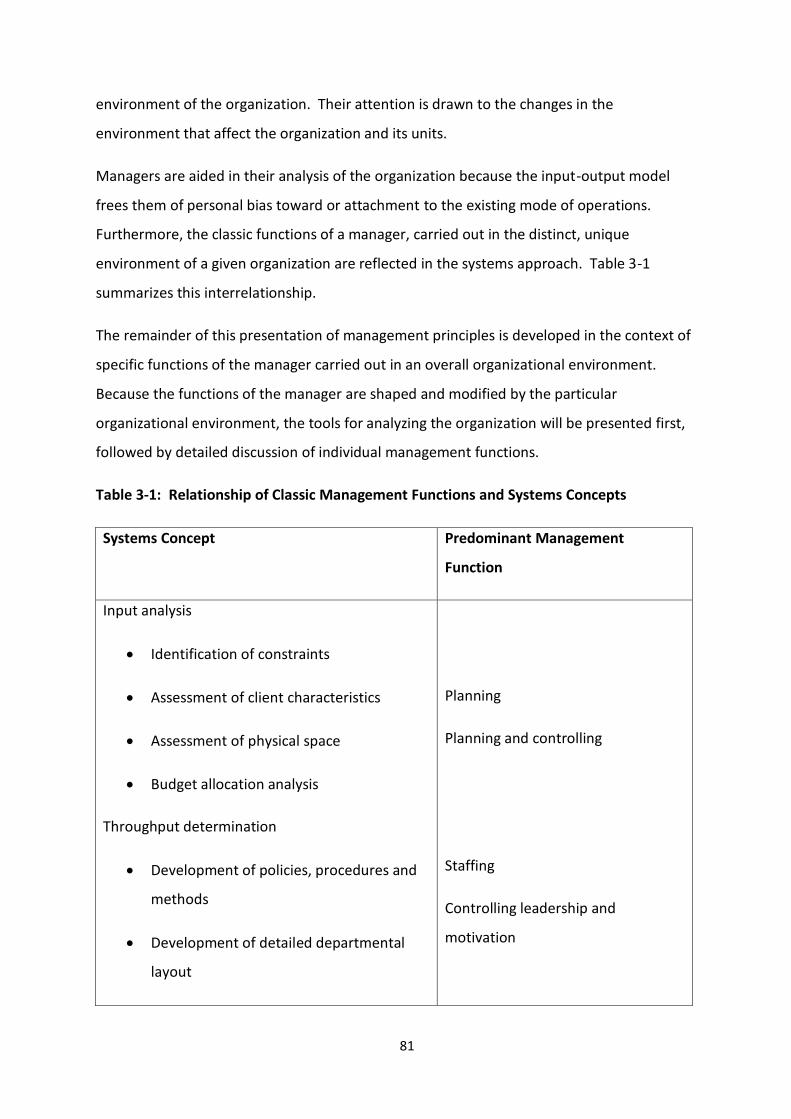
81
environment of the organization. Their attention is drawn to the changes in the
environment that affect the organization and its units.
Managers are aided in their analysis of the organization because the input-output model
frees them of personal bias toward or attachment to the existing mode of operations.
Furthermore, the classic functions of a manager, carried out in the distinct, unique
environment of a given organization are reflected in the systems approach. Table 3-1
summarizes this interrelationship.
The remainder of this presentation of management principles is developed in the context of
specific functions of the manager carried out in an overall organizational environment.
Because the functions of the manager are shaped and modified by the particular
organizational environment, the tools for analyzing the organization will be presented first,
followed by detailed discussion of individual management functions.
Table 3-1: Relationship of Classic Management Functions and Systems Concepts
Systems Concept Predominant Management
Function
Input analysis
Identification of constraints
Assessment of client characteristics
Assessment of physical space
Budget allocation analysis
Throughput determination
Development of policies, procedures and
methods
Development of detailed departmental
layout
Planning
Planning and controlling
Staffing
Controlling leadership and
motivation
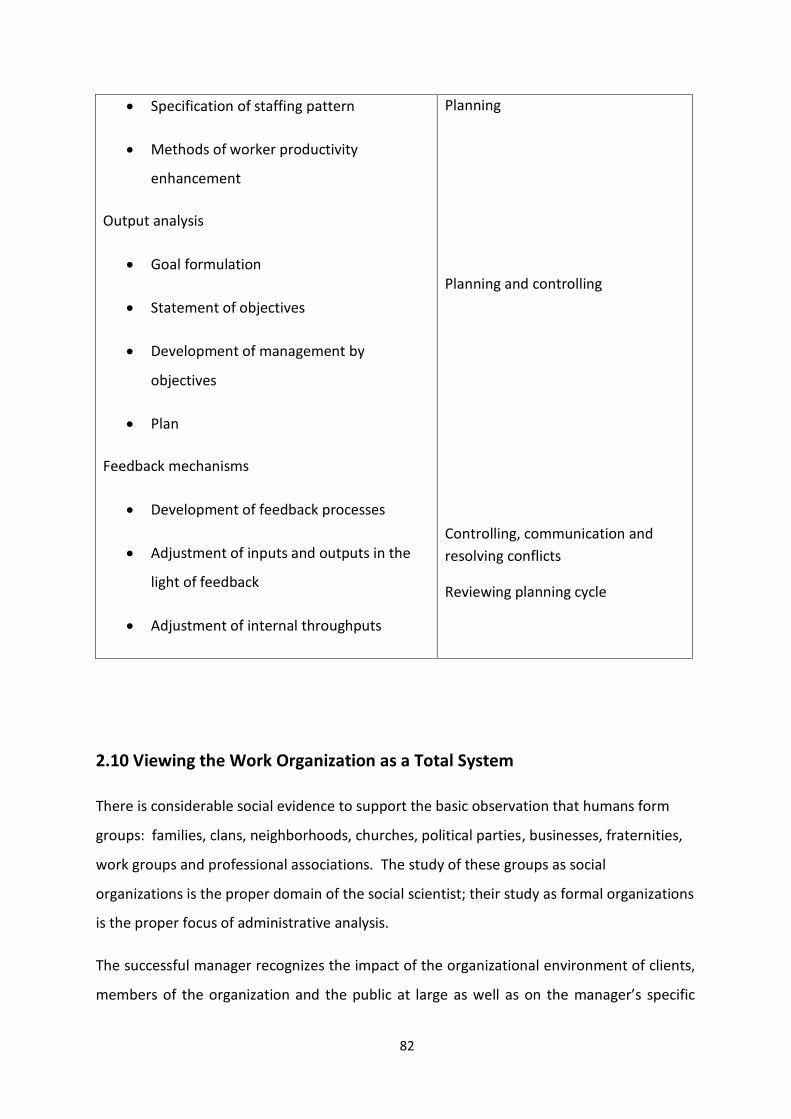
82
Specification of staffing pattern
Methods of worker productivity
enhancement
Output analysis
Goal formulation
Statement of objectives
Development of management by
objectives
Plan
Feedback mechanisms
Development of feedback processes
Adjustment of inputs and outputs in the
light of feedback
Adjustment of internal throughputs
Planning
Planning and controlling
Controlling, communication and
resolving conflicts
Reviewing planning cycle
2.10 Viewing the Work Organization as a Total System
There is considerable social evidence to support the basic observation that humans form
groups: families, clans, neighborhoods, churches, political parties, businesses, fraternities,
work groups and professional associations. The study of these groups as social
organizations is the proper domain of the social scientist; their study as formal organizations
is the proper focus of administrative analysis.
The successful manager recognizes the impact of the organizational environment of clients,
members of the organization and the public at large as well as on the manager’s specific

83
role. An organization does not exist in a static world; rather, it is in a continual state of
transaction with its environment. As an open system, the organization receives inputs from
its environment, acts on them and produces outputs such as goods and services (and even
organizational survival which can be considered an essential output). Consequently, the
organizational environment consists of both internal and external components. The specific
functions of the manager are modified by the organizational environment (i.e. the specific
attributes of the given work setting).
Classical organizational theory provides the manager with concepts to assess the
organizational environment. The organizational environment may be assessed by an
examination of its characteristics and components through a typology of organizations, a
review of the organizational life cycle and an analysis of the purpose and functions of
organizations. The use of clientele network and systems models yields further information
about the internal and external components of the organizational environment. Managers
may anticipate organizational conflict when stated purposes or goals and actual practices
become disparate; such an occurrence should alert managers to changes in the
organizational environment so that they can develop an anticipatory response rather than a
reactive response (Liebler and McConnell, 2012).
2.11 Conclusion
Every unit in a hospital is interrelated and interdependent. Therefore, it is vital to look at a
hospital from a systems point of view when implementing a quality improvement
programme. By applying the above mentioned systems theory, any hospital can be
successfully managed.

84
References:
Bertalanffy Ludwig von, “General Systems Theory: A critical Review,” General
Systems 7 (1962)
Boulding E Kenneth, “General Systems Theory: The Skeleton of Science,”
Management Science 2 (1956)
Liebler G Joan & McConnell R Charles, ‘Management Principles for Health
Professionals’, Jones & Bartlett Learning, 2012

85
MODULE 01:
INTRODUCTION TO
HEALTHCARE QUALITY
& SAFETY
CHAPTER 03
86
TOPIC: A POSITIVE ATTITUDE – ITS SIGNIFICANCE AND DEVELOPMENT
Objectives: To provide learning opportunities for participants
To update their understanding and awareness on the nature,
significance and the role of Positive Attitude to improve productivity,
quality and safety in healthcare organizations
To develop strategies, methods and techniques to change attitudes to
improve productivity, quality & safety in healthcare organizations
Total Amount of Time: 120 Minutes Number of Participants: 35 (Approx.)
Preparation: Refer the Curriculum (Annexure II of Chapter 01)
Materials: Refer the Curriculum (Annexure II of Chapter 01)
LEARNING/TRAINING OPENING
Engage Participants: (Ice-breaker/warm-up activity related to the topic)
Time: 05 Minutes
Greet participants warmly and introduce yourself. Start with a notable quotation on
Positive Attitude which is culturally sensitive. For example, for a Sinhalese crowd, start with
a saying of Lord Buddha; for Tamil participants, quote a notable saying by Thiruvalluvar and
for an English crowd, a popular saying by Aristotle or Winston Churchill which will have an
impact on the presentation.
(During the entire session, the lecturer should not criticize any of the participants or a health
worker by the name).
Introduce the Topic: One power-point slide showing the main areas that will be covered
Time: 15 Minutes
SESSION PLAN - 03

87
Motivate participants, show them why the topic is important and share objectives and the
agenda. Say what the Positive Attitude is and its significance.
TRAINING MIDDLE
Explain the Topic: Explain the topic in detail; demonstrate and discuss the concept,
practice and application of the topic
Time: 80 Minutes
Explain the factors affecting positive attitude, benefits of positive attitudes, consequences
of negative attitudes, how to develop positive attitudes; strategies, techniques, methods
related to positive attitude and the difference between winners and losers.
TRAINING WRAP-UP AND CLOSING
Summarize the Topic: Reconnect with the objectives; check for understanding and discuss
questions
Time: 15 Minutes
Clarify any doubts of the participants; check for understanding by asking how the
participants will motivate their workers towards positive thinking. Suggest further reading
material for participants to update their knowledge.
Closing Comments: Acknowledge, motivate and inspire Time: 05 Minutes
Acknowledge the participants for listening. Wish the participants for their future
endeavours related to quality & safety in healthcare.
QUICK CHECK FOR FACILITATOR/TRAINER (To be filled after every
session)

88
Reflects on how the training went on to develop training skills, to plan on future training
topics and to note potential next steps
Topic: A positive Attitude – Its Significance and Development Date: ________
Attendees:
___________________________________________________________________________
___________________________________________________________________________
___________________________________________________________________________
___________________________________________________________________________
Observations Made by the Trainer:
___________________________________________________________________________
___________________________________________________________________________
___________________________________________________________________________
___________________________________________________________________________
___________________________________________________________________________
___________________________________________________________________________
___________________________________________________________________________
___________________________________________________________________________

89
CHAPTER 03: A POSITIVE ATTITUDE – ITS SIGNIFICANCE AND
DEVELOPMENT
3.1 Introduction
Attitude reflects a persistent tendency to think (cognitive), feel (affective) and act (behave)
towards somebody or something. Hence, attitude is an established mindset which could be
either positive or negative. For example, when someone says he/she likes teaching, it
means a positive attitude towards work.
Absence of disease does not mean that a person is healthy. Likewise, absence of negative
attitudes does not imply that he/she has a positive attitude. People with positive attitudes
have special characteristics and can be easily identified. They are usually kind, confident,
patient and humble. They will usually have lots of expectations from themselves and also
from others.
3.2 Significance of a Positive Attitude
The saying “Knowledge and skills aren’t enough; it’s your positive attitude which makes the
difference” reflects the significance of a positive attitude. Having a positive attitude is very
essential for personality development and growth.
Procrastination until conditions are perfect to start a project is another major obstacle to
development. This was noted by Lord Buddha who said that not starting and not finishing
are two fatal errors that keep great projects from coming to life. One can think and talk
about a project for a long time, but only action will manifest it. If you wait until you’re
ready, you’ll never get anything done. Don’t wait until all the conditions are perfect for you
to begin. An attitude of beginning makes the conditions perfect (Cohen, 2007).
Attitude is a mind-set. It is the way you look at things mentally. How you behave
communicates your attitude to others. When you are optimistic and anticipate successful
encounters, you transmit a positive attitude and people usually respond favorably. When
you are pessimistic and expect the worst, your attitude is often negative and people tend to
avoid you. Negative thinking can become a destructive habit. Watch your thoughts more
closely, and aim to turn off your negative attitudes. Your attitude towards anything in life

90
will affect the outcome. If a person has a consistent negative attitude in life, i.e. no hope,
no real goal or purpose, then that person will go exactly in that direction. A positive attitude
is one that gives hope and purpose. It's a willing heart and joyful spirit no matter the
situation that will win the day.
Attitude is also closely linked to employment success. A Harvard University research found
that if someone applies for a job, his attitudes contribute 85%, and his knowledge and
personality contribute 15% for him to get the job. Despite this observation, the astonishing
factor is that almost all the money spent on education is on developing knowledge (Shiv
Khera, 2002).
Benefits of positive attitude are numerous and can easily be recognized. Some of the
benefits from an individual perspective are the development of an energetic pleasing
personality who enjoys life and inspires others. Benefits from a society perspective include
development of capability for fostering team work, problem solving and increasing
productivity, relationships and loyalty.
3.3 Factors Affecting Development of Attitudes
Are we born with our attitudes? Or are they made with the exposure to the environment as
we grow older? The answer is that, attitudes are mainly made or acquired through direct
experience or indirect social learning with very little contribution from inheritance or genes.
Hence, the major contributors to attitudinal development are direct experiences and
indirect education gained by the environment in which we operate.
Environmental factors affecting attitude consist of cultural influences from home, school
(influence exerted by friends and peers), workplace, media (television, newspapers,
journals, radio and cinema), society, religion and politics.
Direct experiences in life by interacting with others also contribute significantly to
attitudinal development. If we have a good experience with a person, we will have a
positive attitude towards him. On the contrast, if we have a bad experience with a person,
it will create a negative attitude towards him.

91
Education both formal and informal also contributes to attitude development. A teacher
can play a vital and key role in building the right attitudes of students. If the teacher
portrays a negative influence, it can significantly affect the student to follow the wrong
steps. Hence, teachers have to act as role models and whatever they preach must be first
practiced by them before they ask the students to follow. The contribution made by a
teacher, therefore, is one of the key factors for building the attitude of the future
generations. The education system should not only teach the student how to make a living
but also teach how to live.
3.4 Developing a Positive Attitude
Even though attitudes are developed relatively early in life and are resistant to change in
adulthood, they can be improved for the betterment. This is further exemplified by a
statement made by Professor William James of the Harvard University, who said “The
greatest discovery of my generation is that human beings can alter their lives by altering
their attitudes of mind”.
Developing positive attitude particularly later in life requires considerable commitment,
which in turn will determine the success. A few tips to building a positive attitude are
explained below.
Be willing to change your perception: We see the world through our own glasses. We see
the good and the bad; the beautiful and the ugly. What we see (reality) is not always what
actually exists (real). We see what we feel from within and what we want to see. Our
perceptions reflect what we are from within. Our attitudes and beliefs force us to look for
consistencies in the outside world. Our attention becomes selective and we do not see the
real in totality but only in segments, the reality. Such information is not only harmful to
ourselves but to others also with whom we interact. We have to learn to view the situation
in totality and then only weigh the pros and cons before we form opinions. In short, we
have to change our focus of attention and how we perceive. Look at the better side of
things and people. We all have our weaknesses but it is our strengths that are of
importance. We have to identify and tap our potentials and those of others for effective
living.

92
Count your blessings and name them one by one: Count your blessings and name them
one by one and it will surprise you what has been done by others for you. Mostly we have a
tendency to think and list things that others have not done for us. We surely have
expectations from others to fulfill our needs, but it is not possible for them to fulfill each
and every need of ours. We have to place ourselves in their shoes and then think if it was
possible. Children often make unnecessary demands from parents, but parents do not
always do the needful. It is not that parents do not love their children but they use their
discretion, as well as act within their limitations. In the same way, when our demands are
not met we should not have a grudge. In fact, we should be grateful and thankful for what
has been done for us so far and will be done in the near future. Thus, we have to develop
an attitude of gratitude.
Enhance moral education and strengthen the superego: Are you literate? Are you
educated? These two questions may seem the same to you, but they are not. There is a
vast difference between literacy and education. We may be literate but not educated, as an
educated individual is one who has received moral training.
We have to enhance our moral values. Our society does not accept the immoral. We have
to educate ourselves with what is morally right. We have to strengthen our superego –
which is the internal representative of traditional values and norms of society and which
makes us aware of the good and the bad and the right and wrong.
Develop positive feelings about yourself: In psychological terms, feelings about oneself are
referred to as self-esteem. High self-esteem – a feeling of self-worth - pays dividends.
People who feel good about themselves have fewer ulcers and fewer sleepless nights,
succumb less easily to pressure, are less likely to use drugs, are more persistent at difficult
tasks and are happier. People with low self-esteem do not necessarily see themselves as
worthless or wicked, but they lack good things to say about themselves. Such low self-
esteem has its own costs. More often than not, unhappiness and despair coexist with low
self-esteem. People who feel they are falling short of their hopes are vulnerable to
depression. Those whose self-image falls short of what they think they ought to be, are
93
vulnerable to anxiety. Thus, it is important for us to appreciate our good points, accept our
weaknesses and work towards improving them.
Be focused and set your direction: We all have been blessed with the ability to act
purposefully, to think rationally and to deal effectively with our environment. We should
have a definite purpose and direction in life. Activities, which are misleading but appearing
attractive, may tempt us into changing our tracks. However, remember that you have a
mission to fulfill and a goal to achieve in life. The temptation to deviate may be attractive,
but you have promises to keep and miles to go before you achieve your goal. You have to
think rationally. Reasoning and understanding are very essential for the development of a
positive attitude. We have to efficiently manipulate our environment to achieve our goals.
We have to use our discretion to judge good and bad. We have to go with the good and try
to curb the bad on the way.
Be passionate about your work: We all have assigned work to be done. Work will result in
layoffs temporarily but it has to be eventually done. If we have a negative attitude towards
our work, we will find it difficult to do. Hence, try to generate an interest in your work and
be passionate about it. Try a different approach and it will not only contribute to your
performance but also will enhance your creativity. A good strategy to do work that does not
interest you much is to do first what is essential, then what is possible and finally you will
realize that you are doing the impossible. It is the attitude with which you look at things
that act as a force to achieve your goals. Think positive, do positive.
A good start is half the battle won: What do you say when you get up n the morning? Oh,
God! It is morning or Thank God, it is morning! The first statement is a pessimistic outlook
for the day and the second is an optimistic one. The way you begin your day is important.
Think of the entire objective that you have to achieve in a day. Every day look back at the
things you did yesterday and then try to improve on them. You have to move ahead with
your own frame of reference that is healthy for you as well as for others. It is just a matter
of time and effort. You will surely achieve near perfection.
Keep going! You have it in you: Though there is an alpha, there is no omega for developing
positive attitudes. An end means that it is over. Perfection does not end and it always
begins afresh. No individual is perfect. We try, we achieve but we fail too – no matter how
94
hard we try, we all are humans. But those who stop, lose and retry achieve goals which
were impossible before. Achieving perfection is a cyclic process that does not have an end.
So keep trying; do not quit. You have it in you (Abraham, 2007).
Stay away from negative influences: Today children as well as adults learn a lot from the
environment. Some develop certain negative habits due to peer pressure. Most do not
have courage to say ‘No’ to such negative influences displaying low self-esteem. Some of
these negative influences include: smoking, drugs and alcohol; pornographic pictures and
movies.
Be a winner not a loser: Some people win in their endeavors, while others lose. Therefore,
it is absolutely important to differentiate between winners with a positive attitude and
losers with a negative attitude.

95
• The winner is part of the answer; the loser is part of the problem.
• The winner has a program; the loser has an excuse.
• The winner says, “Let me do it for you”; the loser says, “That is not my job.”
• The winner sees an answer for every problem; the loser sees a problem in every
answer.
• The winner says, “It may be difficult but it is possible”; the loser says, “It may be
possible but it is too difficult.”
• When a winner makes a mistake, he says, “I was wrong”; when a loser makes a
mistake, he says, “It wasn’t my fault.”
• Winners make commitments; losers make promises.
• Winners have dreams; losers have schemes.
• Winners say, “I must do something”; losers say, “Something must be done.”
• Winners are a part of the team; losers are apart from the team.
• Winners see the gain; losers see the pain.
• Winners see possibilities; losers see problems.
• Winners believe in win- win; losers believe in win-lose.
• Winners see the potential; losers see the past.
• Winners are like a thermostat; losers are like thermometers.
• Winners choose what they say; losers say what they choose.
• Winners use hard arguments but soft words; losers use soft arguments but hard
words.
• Winners stand firm on values but compromise on petty things; losers stand firm
on petty things but compromise on values.
• Winners follow the philosophy of empathy” “Don’t do to others what you would
not want them to do to you”; losers follow the philosophy, “Do it to others before
they do it to you.”
• Winners make it happen; Losers let it happen.
96
3.5 Conclusion
We all like to be winners in personal, family, work and social lives. To be a winner, one
needs a positive attitude. The basic steps we must always follow to be winners are
mentioned below.
Check focus, look for the positive
Make it a habit of doing things now
Develop an attitude of gratitude
Get into a continuous education programme
Develop self-esteem for yourself
Be away from negative influences
Start liking the essential things you have to do
Always start your day with a positive note
Let us follow these steps and make ourselves and our country winners.
References:
Abraaham Amit, Personality through Positive Thinking, SHREE, 2007
Cohen Alan, 365 Recipes that will make you Think Positive, Putak – Mahal, 2nd Indian
Edition, 2007
Shiv Khera, You Can Win, MacMillan, First Edition, 2002

97
MODULE 01:
INTRODUCTION TO
HEALTHCARE QUALITY
& SAFETY
CHAPTER 04

98
TOPIC: RESPONSIVENESS – A VITAL ASPECT OF HEALTH SYSTEMS
Objective: To understand and apply the concept of responsiveness in healthcare
settings
Total Amount of Time: 60 Minutes Number of Participants: 35 (Approx.)
Preparation: The trainer must be knowledgeable about the WHO systems model and the
concepts of responsiveness. Also refer the Curriculum (Annexure II of
Chapter 01)
Materials: Refer Curriculum (Annexure II of Introduction Chapter)
TRAINING OPENING
Engage Participants: (Ice-breaker/warm-up activity related to the topic)
Time: 05 Minutes
Greet participants and inquire whether they are comfortable with the lecture hall. Tell the
students to assume that he/she is a patient seeking care from a hospital. Then ask , “What
do you expect from a hospital?”
Introduce the Topic: One power-point slide showing the main areas that will be covered
Time: 05 Minutes
Motivate participants, show them why the topic is important and share objectives and the
agenda. Introduce the WHO system model and the place of responsiveness in the WHO
model.
SESSION PLAN - 04
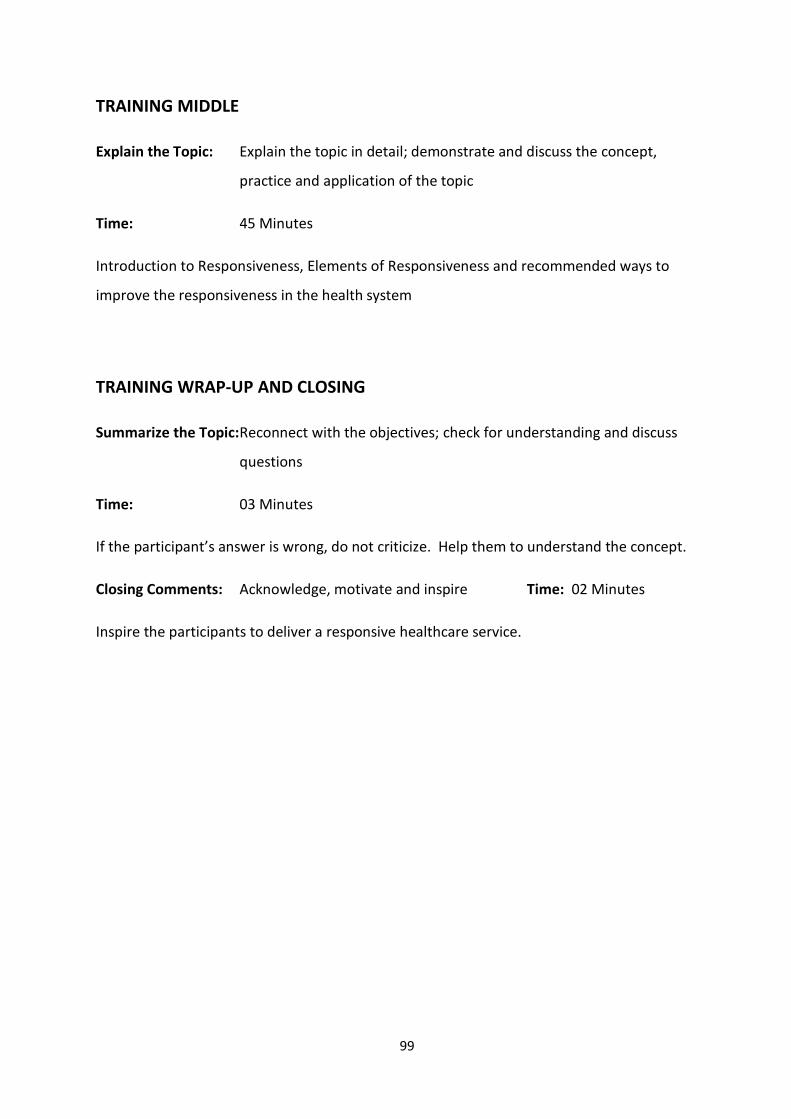
99
TRAINING MIDDLE
Explain the Topic: Explain the topic in detail; demonstrate and discuss the concept,
practice and application of the topic
Time: 45 Minutes
Introduction to Responsiveness, Elements of Responsiveness and recommended ways to
improve the responsiveness in the health system
TRAINING WRAP-UP AND CLOSING
Summarize the Topic: Reconnect with the objectives; check for understanding and discuss
questions
Time: 03 Minutes
If the participant’s answer is wrong, do not criticize. Help them to understand the concept.
Closing Comments: Acknowledge, motivate and inspire Time: 02 Minutes
Inspire the participants to deliver a responsive healthcare service.

100
QUICK CHECK FOR FACILITATOR/TRAINER (To be filled after every
session)
Reflects on how the training went on to develop training skills, to plan on future training
topics and to note potential next steps
Topic: Responsiveness – A Vital Aspect of Health Systems Date: ________
Attendees:
___________________________________________________________________________
___________________________________________________________________________
___________________________________________________________________________
___________________________________________________________________________
Observations Made by the Trainer:
___________________________________________________________________________
___________________________________________________________________________
___________________________________________________________________________
___________________________________________________________________________
___________________________________________________________________________
___________________________________________________________________________
___________________________________________________________________________
___________________________________________________________________________

101
CHAPTER 04: RESPONSIVENESS – A VITAL ASPECT OF HEALTH
SYSTEMS
4.1 Background
All over the world, people expect the health systems to treat them humanely, with dignity,
and to be accommodated with comforts and conveniences within reason and to the extent
possible (responsiveness). Hence, responsiveness was identified as a key goal of health
systems in the 2000 World Health Report (WHO, 2000). The relationship between functions
and the objectives of a health system can be illustrated as follows:
Figure 4.1: Relationships between Functions and Objectives of a Health System
Source: The World Health Report 2000
World Health Organization described 3 intrinsic goals to be considered as indicators of the
performance of health systems in the World Health Report of 2000. They are Health, Fair
financing and Responsiveness.

102
Figure 4.2: The WHO Health System Framework
Health: This means making the health status of the entire population as good as possible
throughout their lifecycles. Health is defined by the WHO as a state of complete physical,
mental, spiritual and social well-being and not merely the absence of disease or infirmity.
Fair financing: A fair financing system ensures financial protection for everyone (e.g. free
health system as in Sri Lanka).
Responsiveness is not a measure of how the system responds to health needs of the
population which is shown up in health outcomes, but how the system performs in relation
to non-health aspects of the population, meeting or not meeting their expectations of
treatment as a whole. Recognizing responsiveness as an intrinsic goal of health systems
establishes an assurance that these systems are to serve people, and involves more than an
assessment of people’s satisfaction in relation to the medical care they receive.

103
Figure 4.3: Clusters of Responsiveness
This concept of responsiveness is clustered into two:
1. Respect for persons
2. Client orientation
In 2000 – 2001, WHO Multi-country Survey Study on Health and Health System's
Responsiveness (MCSS) found that the responsiveness is largely a subjective element; and is
influenced by a number of system features and respondent’s features. It covers a set of
non-clinical and non-financial dimensions of quality of care that reflect respect for human
dignity and interpersonal aspects of the care process (Valentine N.B., 2009). Human rights
include concepts such as respecting patient autonomy and dignity, while interpersonal
Clusters of Responsiveness
RESPONSIVENESS
CLIENT ORIENTATION
RESPECT FOR PERSONS
Responsiveness refers to how the health system meets the legitimate
expectations of the population for non-health, enhancing aspects of the system
(World Health Organization, 2000).

104
aspects of care or client orientation, are focused on concepts that are commonly expressed
in relation to the quality of basic amenities (for example, hotel facilities).
Over the years, Sri Lanka has achieved a commendable level in health by achieving several
health goals and reasonable improvements in the health status of its people. The country's
health indicators show a steady improvement over the recent decades, particularly in
maternal and infant mortality rates and life expectancy which are quantitative in their
nature. Health achievements have been remarkable in comparison to the country’s Gross
National Product (GNP). This was mainly due to the social policies adopted by the
successive governments (Mahinda Chinthana, 2010). However, when delivering good
healthcare services, there is also a qualitative aspect to be considered that goes beyond
improving the health outcome of the patient alone. Unfortunately, the following significant
deficiencies still prevail in the services provided by the public hospitals in Sri Lanka.
Many of the hospitals ignore the non-health expectations of the people such as the
availability of basic human needs, maintenance of dignity, kindness and compassion, proper
communication with the patients and their relatives, and prompt attention to emergencies.
There is growing consumer dissatisfaction with the services rendered by most of the state-
owned health care facilities. The issues that need particular concern include overcrowding
of large hospitals, long waiting times, poor surroundings and the unsatisfactory attitudes of
some health care workers.
Responsiveness is one of the service quality dimensions too (Parasuraman, 1985).
The services provided by some hospitals are not focused on the expectations of
patients.
The services provided by the hospitals are not attractively packaged or presented to
the people.
105
4.2 Responsiveness
Respect for persons comprises of the following:
Maintenance and respect the dignity of the person - this means not humiliating or
demeaning patients.
Maintenance of confidentiality or offering the right to determine who has the access to
one’s personal health information.
Provision of autonomy to participate in choices about one’s own health. This includes
helping them to choose what treatment to receive or not to receive.
Communication: Clarity of communication (Parasuraman, 1985).
Client orientation includes:
Prompt attention: Immediate attention in emergencies, and reasonable waiting times
for non-emergencies.
Basic amenities: Amenities of adequate quality such as cleanliness, space, and hospital
food.
Access to social support network: Ability to access family and friends- for people
receiving care.
HOW IT WORKS
• Improved Responsiveness
• Good compliance
• Acceptable outcomes
106
Choice of provider: Freedom to select which individual or organization delivers one’s
care.
4.2.1 Respect for Persons
Dignity
♦ Individuals should be treated with respect:
welcomed at the health care unit, addressed
respectfully at all times, not shouted at or abused.
♦ Individuals should be treated with concern
♦ Individuals should be examined and treated in a
manner that respects their privacy.
♦The rights of Individuals with communicable diseases such as HIV+ and leprosy as well as
any other type of disease should be safeguarded and not violated
Confidentiality (of information)
Consultations with patients should be
carried out in a manner that protects
their privacy.
♦ Health care providers should
maintain the confidentiality of any
information that is provided by the
patient (except if the information is
needed for treatment by other
healthcare providers).
107
♦ Health care providers should keep information in medical records of patients confidential
(except where such information is needed to be given to another health care provider).
Autonomy
Individuals should be told about
alternative treatment options.
♦ Individuals should be allowed to make
decisions regarding the type of
treatment after discussions with the
health care provider
♦ Individuals should be encouraged to
clear their doubts
♦ Patients of sound mind should have the right to refuse treatment.
Communication
Health care providers should listen to patients
carefully.
♦ Health care providers should explain things simply
and clearly so that patients can understand.
♦Patients should be given a chance to ask questions
and clarify any doubts.
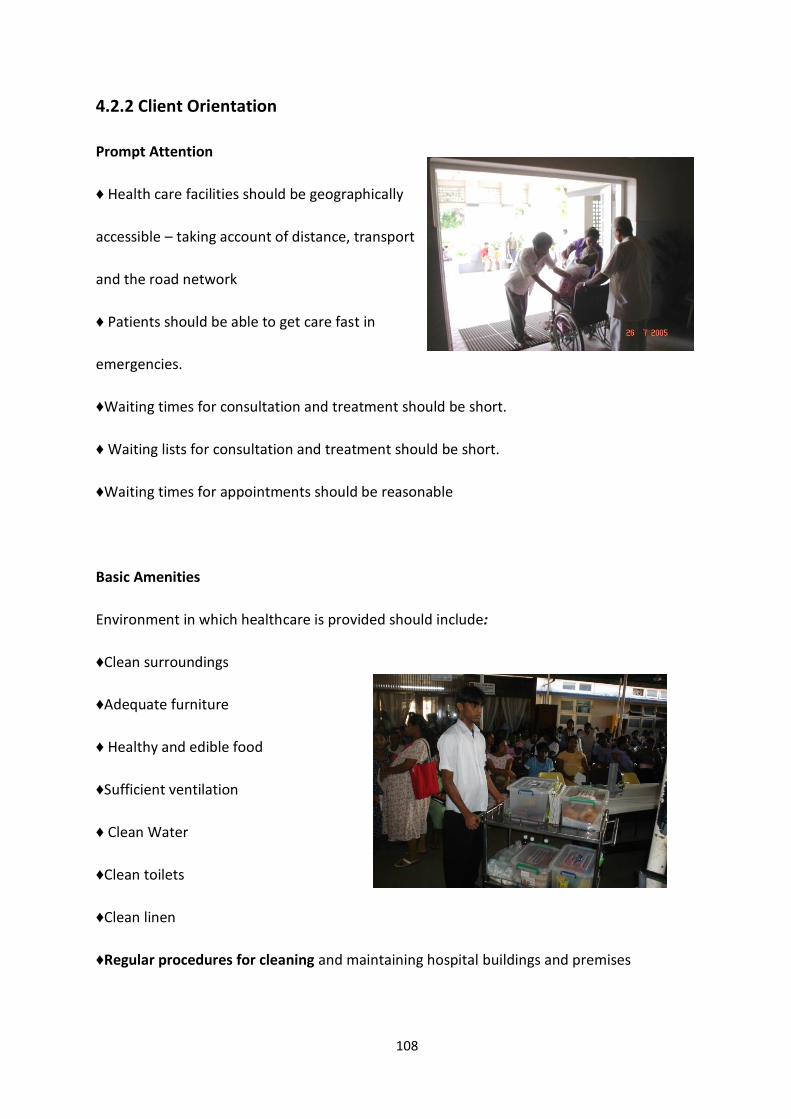
108
4.2.2 Client Orientation
Prompt Attention
♦ Health care facilities should be geographically
accessible – taking account of distance, transport
and the road network
♦ Patients should be able to get care fast in
emergencies.
♦Waiting times for consultation and treatment should be short.
♦ Waiting lists for consultation and treatment should be short.
♦Waiting times for appointments should be reasonable
Basic Amenities
Environment in which healthcare is provided should include:
♦Clean surroundings
♦Adequate furniture
♦ Healthy and edible food
♦Sufficient ventilation
♦ Clean Water
♦Clean toilets
♦Clean linen
♦Regular procedures for cleaning and maintaining hospital buildings and premises

109
Provision of Social Needs
Procedures within in-patient health care units should allow
♦ Visits by relatives and friends
♦ Provision of food and other consumables by
relatives and friends, if not provided by the hospital
♦ Religious practices that do not prove to be a
hindrance to hospital activities or hurt the sensibilities
of other individuals
♦ Access to radios, newspapers or some reading materials
♦Some type of support for patients suffering from ongoing illness or illnesses from which
they will die
♦ Post-hospital support
Choice of Provider Doctor/Nurse/Care Provider or Facility
♦ Patients should be able to reach health services of choice without much difficulty
♦Within a health care unit, individuals should be able to choose their health care provider
♦ Individuals should be able to get a second opinion in case of severe or chronic illness or
surgery
♦ Individuals should be able to get general and specialist care as appropriate
4.3 Recommended Ways to Improve the Responsiveness in the Health
System

110
a. Addressing the key determinants to improve its service quality and
responsiveness
b. Develop a cultural change at the hospital, which concerns more and assesses
patient’s views first.
c. Executing educational and training programs (to make patient centered
culture).
d. Conduct staff and customer surveys, clinical and management meetings over
time
e. Publish Quarterly Statistical Bulletin and Annual Reports.
f. Empower the community by improving public awareness of their rights,
responsibilities and options for care.
g. Implement monitoring mechanisms
h. Start with costless elements of responsiveness, e.g. practice of good
communication.
i. Get the darner support for the hospital to maintain hotel qualities.
j. Comparative studies and survey research, including private hospitals in Sri
Lanka, should also be carried out.
k. Standards should be set for the measurement of responsiveness as in quality
standards according to the particular setup.
l. Practice good examples from private sector business promotion activities;
e.g., treat the customer as the “KING”.
Responsiveness
“Is not a measure of how the system responds to health needs which
shows up in health outcomes
But, of how the system performs relative to non-health aspects meeting
or not meeting a population’s expectations
111
References
Anon., 2000.The World Health report 2000: health systems: improving performance.,s.l :
WHO.
Parasuraman, A., Zeithaml, V.A. and Berry, L.L. (1985), “A conceptual model of service
quality and its implications for future research”, Journal of Marketing, Vol. 49 No. 3, pp.
41-50.
Mahinda Chintana 2010. Government of SriLanka 2010.s.l.:
Valentine, N.B., Prasad, A., Rice, N., Robone, S. and Chatterji S. (2009) Health systems
responsiveness - a measure of the acceptability of health care processes and systems In:
Performance measurement for health system improvement: experiences, challenges
and prospects (eds P. Smith,E. Mossialos, S. Leatherman). London: WHO European
Regional Office
WHO, 2000. The World Health Report 2000: health systems: improving performance.,
s.l.:s.n
112
MODULE 01:
INTRODUCTION TO
HEALTHCARE QUALITY &
SAFETY
CHAPTER 05
113
TOPIC: PATIENT SAFETY
Objective: To make the participants understand and recognize the basic concepts of
Patient Safety which should operate in a patient safety culture.
Total Amount of Time: 90 Minutes Number of Participants: 35 (Approx.)
Preparation: Refer Curriculum (Annexure II of Introduction Chapter). The trainer must get
ready to explain contents of the topic using photographs. If possible, he/she can invite a
sectional head to share his/her experience.
Materials: Refer Curriculum (Annexure II of Introduction Chapter)
TRAINING OPENING
Engage Participants: (Ice-breaker/warm-up activity related to the topic)
Time: 05 Minutes
Show participants paper reports and photos on hospital adverse events
Introduce the Topic: One power-point slide showing the main areas that will be covered
Time: 10 Minutes
Motivate participants, show them why the topic is important and share objectives and the
agenda. Explain what patient safety is, its present context globally and in Sri Lanka.
TRAINING MIDDLE
SESSION PLAN - 05

114
Explain the Topic: Explain the classification of hospital incidents, describe the evolution
of patient safety culture, explain the elements of patient safety
culture and discuss the types of medical errors.
Time: 60 Minutes
TRAINING WRAP-UP AND CLOSING
Summarize the Topic: Reconnect with the objectives; check for understanding and discuss
questions
Time: 10 Minutes
Ask core questions on patient safety culture in the organization to
assess the current status of patient safety culture and how to
institutionalize it.
Closing Comments: Acknowledge, motivate and inspire
Time : 05 Minutes
Reinforce the importance of the topic, confirm that the time was well spent and thank
participants; reinforce group respect and rapport.

115
QUICK CHECK FOR FACILITATOR/TRAINER (To be filled after every
session)
Reflects on how the training went on to develop training skills, to plan on future training
topics and to note potential next steps
Topic: Patient Safety Date: ________
Attendees:
___________________________________________________________________________
___________________________________________________________________________
___________________________________________________________________________
___________________________________________________________________________
Observations Made by the Trainer:
___________________________________________________________________________
___________________________________________________________________________
___________________________________________________________________________
___________________________________________________________________________
___________________________________________________________________________
___________________________________________________________________________
___________________________________________________________________________
___________________________________________________________________________

116
CHAPTER 05: AN INTRODUCTION TO BASIC CONCEPTS OF PATIENT
SAFETY
5.1 Introduction
Patient safety is a major concern for all healthcare providers. It appears perverse that
patients can suffer harm when they are being treated and cared for. However, healthcare is
complex and its outcome is influenced by many factors. It is inevitable that within any
healthcare system, patients may be harmed and in every encounter, there is the potential
for harm to occur. This has been recognized since the time of the physicians of Ancient
Greece and Rome – ‘First, do no harm.’
Safest place for patients is a Hospital. Are hospitals as safe as we think they are? A vast
number of misconducts, negligence and adverse events are recorded from these patient
care institutions. ‘Patients are harmed from their health care either resulting in permanent
injury, increased Length of Stay (LOS) in hospitals and even death. Adverse events occur not
because bad people intentionally hurt patients but rather that the system of health care
today is so complex and consequently, the successful treatment and outcome for each
patient depends on a range of factors, not just on the competence of an individual health-
care provider’ (What is Patient Safety – WHO, 2009). There is no institution that can provide
total patient safety. Risk that patients have to face is not homogeneous. It differs according
to how sick the patient is and the number of interventions he /she has to go through and
the duration of the stay. Unless substantial changes in the system are made, the vulnerable
have to carry the burden of errors (Weingart, et al, 2000).
In Sri Lanka, the numbers of adverse events related to patient safety seem to be rising.
There are many reported as well as unreported cases related to patient safety. Moreover,
there are allegations made that hospitals are covering up these incidents. Necessity of
initiating patient safety culture in a health care system and a compensation mechanism has
been raised (Ruwanpura, 2009). It was found that medical staff lacks proper awareness on
patient safety and its importance. Blame and shame leads to underreporting. In turn, the
organization lacks the opportunity to learn from its errors and prevent / mitigate future
adverse events (Amarapathy, 2012).
117
Patient safety is a new concept introduced to Sri Lankan health care system. “To Err is
Human; Building a Safer Health System” was an eye opener which highlighted patient safety
and patient safety culture. Health sector has learnt safety culture from other highly reliable
organizations such as aviation, nuclear power industry etc. Similar to those organizations,
the highly reliable health care providers have an inbuilt patient safety culture (Katharine et
al, 2008).
It can make healthcare institutions safer, reliable and trust worthy by learning from
mistakes, preventing adverse events and mitigating possible adverse outcomes. Patient
safety is not only for the benefits of the patient but it is also for the healthcare providers.
Institutions will have reliable patient safety mechanisms, reliable services, patient
satisfaction and credibility. Health institutions in the world have developed various systems
and indicators to introduce and sustain safety practices. Indicators will monitor
complications and adverse events following all procedures. The Patient Safety Indicators
(PSIs) can be used to help hospitals identify potential adverse events that might need
further study; provide the opportunity to assess the incidence of adverse events using
administrative data (AHRQ, www.qualityindicators). Patient safety is identified as a part of
health care quality; in turn, it is a significant criterion in hospital accreditation. ‘The
accreditation process is a way of identifying conditions of unsafe practice and supporting
health care organizations to promote safe care. In particular, it is a means of reducing risk
and fostering attention to continuous quality improvement. The Canadian accreditation has
six goals in patient safety. They are:
a. Culture - Create a culture of safety within the organization
b. Communication - Improve the effectiveness and coordination of
communication among care/service providers and with the recipients of
care/service across the continuum
c. Medication Use - Ensure the safe use of high risk medications
‘Patient safety can be defined as the prevention or reduction of adverse outcomes’
(Alahmadi, 2009).

118
d. Work life /Workforce - Create a work life and physical environment that
supports the safe delivery of care/service
e. Infection Control - Reduce the risk of health service organization-acquired
infections and their impact across the continuum of care/service
f. Risk Assessment - The organization identifies safety risks inherent to its client
population’
(Patient safety accreditation Canada -www.accreditation.canada)
One of the key methods to develop and strengthen patient safety is to build up a patient
safety culture within the health institution.
5.2 Patient Safety Culture
Patient safety culture is an important discipline in health care. To improve patient safety
culture, we have to improve the attitudes, values and beliefs of the health staff. Introducing
patient safety thinking patterns to health care system, we can create a patient safety culture
within the system. One of the important theories is system thinking where the providers
take the health care service as a single system but not as different units; e.g., the whole
hospital works as a health team but not as different wards or departments. This promotes
unity, teamwork, high productivity, teaching and learning from errors; identification of new
methods, reliable preventive methods and most of all, creation of a sustainable patient
safety culture. However much the system is prepared, there will always be unpredictable
situations. Higher the reliability, more resilient is the organization for these unpredictable
situations. When improving safety in a health care system, the level of safety leaps from
one level to another (Emanuel, et al, n.d).
Patient safety culture is defined as status made of values, beliefs and assumptions within
the members of an organization towards patient safety. Patient safety culture emphasizes
the reporting, analysis and prevention of errors that lead to adverse health care events
(Alahmadi, 2009).
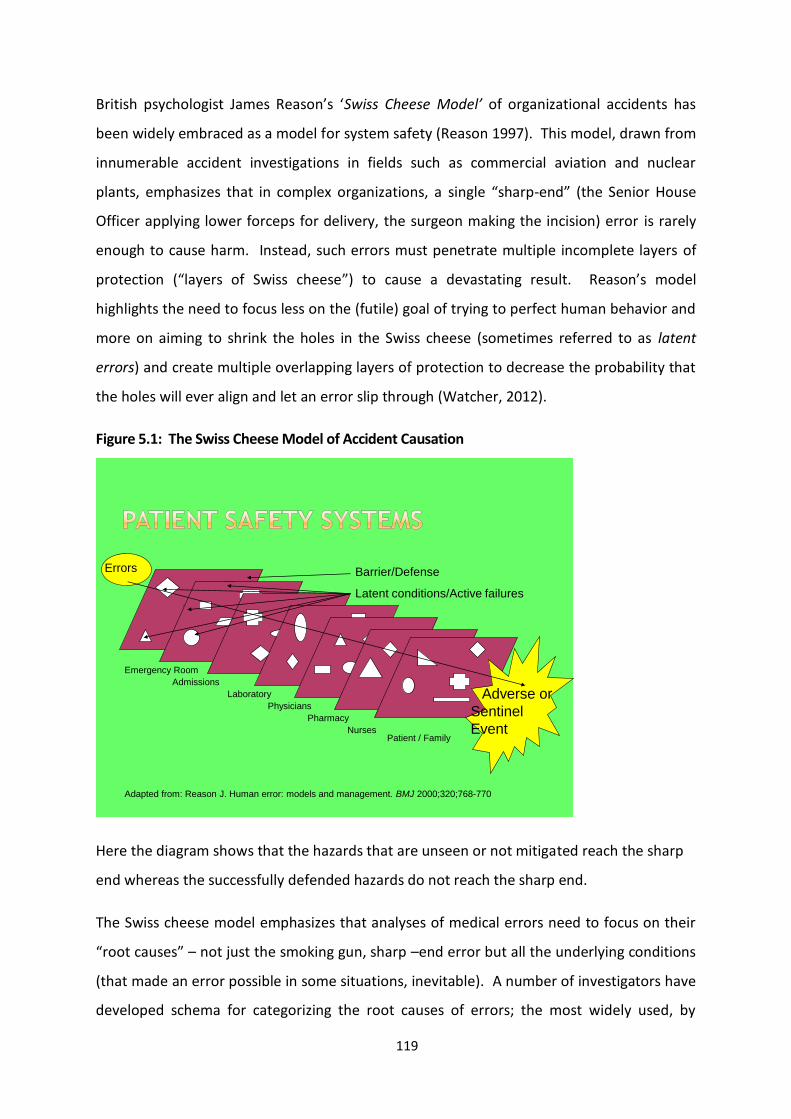
119
British psychologist James Reason’s ‘Swiss Cheese Model’ of organizational accidents has
been widely embraced as a model for system safety (Reason 1997). This model, drawn from
innumerable accident investigations in fields such as commercial aviation and nuclear
plants, emphasizes that in complex organizations, a single “sharp-end” (the Senior House
Officer applying lower forceps for delivery, the surgeon making the incision) error is rarely
enough to cause harm. Instead, such errors must penetrate multiple incomplete layers of
protection (“layers of Swiss cheese”) to cause a devastating result. Reason’s model
highlights the need to focus less on the (futile) goal of trying to perfect human behavior and
more on aiming to shrink the holes in the Swiss cheese (sometimes referred to as latent
errors) and create multiple overlapping layers of protection to decrease the probability that
the holes will ever align and let an error slip through (Watcher, 2012).
Figure 5.1: The Swiss Cheese Model of Accident Causation
Emergency Room
Admissions
Laboratory
Physicians
Pharmacy
NursesPatient / Family
Barrier/Defense
Latent conditions/Active failures
Adapted from: Reason J. Human error: models and management. BMJ 2000;320;768-770
Errors
Adverse or
Sentinel
Event
Here the diagram shows that the hazards that are unseen or not mitigated reach the sharp
end whereas the successfully defended hazards do not reach the sharp end.
The Swiss cheese model emphasizes that analyses of medical errors need to focus on their
“root causes” – not just the smoking gun, sharp –end error but all the underlying conditions
(that made an error possible in some situations, inevitable). A number of investigators have
developed schema for categorizing the root causes of errors; the most widely used, by

120
Charles Vincent, is shown in the table below. The schema explicitly forces the error
reviewer to ask whether there should have been a checklist or read back, whether the
Medical Officer was too fatigued to think clearly, or whether the young nurse was too
intimidated to speak up when she suspected an error.
Table 5.1: Framework of Factors Influencing Clinical Practice and Contributing to Adverse
Events
Framework Contributory Factors Examples of Problems that
Contribute to Errors
Institutional Regulatory Context
Medico-legal environment
Insufficient priority given by
regulators to safety issues; legal
pressures against open discussion,
preventing the opportunity to
learn from adverse events
Organization and
management
Financial resources and
constraints
Policy standards and goals
Safety culture and priorities
Lack of awareness of safety issues
on the part of senior
management; policies leading to
inadequate staffing levels
Work environment Staffing levels and mix of
skills
Patterns in workload and
shifts
Design, availability, and
maintenance of equipment
Administrative and
managerial support
Heavy workloads, leading to
fatigue; limited access to essential
equipment; inadequate
administrative support, leading to
reduced time patients

121
Team Verbal communication
Written communication
Supervision and willingness to
seek help
Team leadership
Poor supervision of junior staff;
poor communication among
different professions;
unwillingness of junior staff to
seek assistance
Individual staff
member
Knowledge and skills
Motivation and attitude
Physical and mental health
Lack of knowledge or experience;
Long-term fatigue and stress
Task Availability and use of
protocols
Availability and accuracy of
test results
Unavailability of test results or
delay in obtaining them; lack of
clear protocols and guidelines
Patient Complexity and seriousness
of condition
Language and communication
Personality and social factors
Distress; language barriers
between patients and caregivers
(Source: Vincent C, 2003)
Hierarchy of Safety Culture starts with safety attitude, which is the perception of safety at
personal or unit levels. A collection of safety attitudes builds the safety climate. It is the
group level perception of safety or the shared perception regarding the events, practices
and procedures as well as kind of behaviour that gets rewarded, supported and expected in
a particular organizational setting. This is the measurable aspect of patient safety culture.
These terms can be interchanged with each other when necessary.

122
Figure 5.2: Safety Hierarchy of Patient Safety Culture
Safety attitude and climate leads to organization culture. It should never be
underestimated. It may not be visible. Alahmadi (2010) defined it as the shared values and
tacit assumptions of members within an organization. Safety culture is a part of the
organizational culture. It is the overall perception of safety in the organization. Safety
culture is found in every individual’s attitude and values (Vincent, 2010).
Safety standards- Health sector
Safety culture-Hospital
Safety climate – Unit /department
Safety attitude-
individual/
team
Adapted from Advances in Health Care Management
123
5.3 Importance of Patient Safety
Millions of patients receive healthcare of high quality every year. Unfortunately,
preventable medical errors occur and they occur fairly often. For example, a surgeon in a
hospital, Florida, amputated the wrong leg of a patient; in the state of Washington, a heart
transplanted patient received a heart with the wrong blood type. In a Boston hospital, one
doctor simultaneously was overseeing blood transfusions for two patients undergoing
operations and switched the different blood types. In another instance, an
anaesthesiologist forgot to turn the anaesthesia on after paralyzing the patient during an
orthopaedic operation; although the patient tried to signal the surgeon, he was unable to do
it as she was paralyzed. She subsequently sued the anaesthesiologists (Pauley, 2012).
In another hospital, a female patient was about to undergo a routine surgical procedure.
The anesthesiologist had difficulty in administering the anaesthetic and decided to intubate
the patient. He was not able to do so at first but continued to try even though the patient’s
condition was deteriorating. He ignored suggestions from one nurse to say that the ‘trachy
machine’ was available. He also ignored the suggestion of another nurse that there was a
bed available at the intensive care unit. Finally, he gave up and decided to revive the
patient. They were unsuccessful and finally rushed her to the intensive care unit. The
patient remained in a coma and died 13 days later without ever regaining her consciousness
(ibid et al, 2012).
According to a report issued by the Institute of Medicine (IOM) which quotes estimates from
two major studies, between 44 000 and 98 000 preventable medical deaths occur in
healthcare facilities in the United States each year (IOM, 2000). A study carried out by
Health Grades in March 2011 found that from year 2007 to 2009, a number of 52 127
Medicare inpatients developed hospital-acquired infections and 8,114 of them did not
survive their hospitalization. The study also reported that during the same period, there
were 79 670 deaths among patients who experienced one or more patent events (Heath
Grades, 2011). According to a report by World Health Organization, one in 10 individuals
receiving medical care will suffer preventable harm (Donaldson, 2004). A study by the IOM
found that 1.5 million Americans are injured by a medication error every year (IOM, 2010).
According to the Centers for Disease Control, there are 2 million hospital-acquired infections

124
in the United States every year. It is estimated that medical errors cost between $17 billion
and $29 billion annually. Clearly, this is not acceptable and has to be improved (Scott,
2009).
In a recent article published in the New England Journal of Medicine, researchers reported
that there had been no significant improvement in patient safety for the 10 years since the
IOM published its report To Err Is Human. The researchers studied 10 hospitals in North
Carolina from year 2002 - 2007 and found that medical harms remain common, with little
evidence of widespread improvement. They also found that there was no significant
improvement in patient safety from year to year. They concluded saying, “Further efforts
are needed to translate effective safety interventions into routine practice and to monitor
healthcare safety over time” (Landrigan et al, 2010).
Although the number of patients who die contributes to a relatively small percentage of the
millions of patients who are treated successfully every year, the objective is to reduce the
number of errors taking place to as close to zero as possible. The question is how to reduce
the number of these errors and improve patient safety and satisfaction.
By using checklists & quality tools and by collecting data on various processes in healthcare
facilities, healthcare providers can improve the systems to reduce errors. For example, at a
Suburban Hospital in Bethesda - Maryland, a patient had 80% blockage in two coronary
arteries. A doctor used the femoral artery to access the arteries in order to place stents to
keep the arteries open. After the operation, a nurse in the catheter lab briefed the patient
on what he needed to do to keep from rupturing the artery, including the need to avoid
straining when he went to the bathroom. The patient followed her instructions faithfully
and was looking forward to a complete recovery. Two days later the patient was taking a
soft drink from a plastic carton when the plug loosened and fell over the femoral artery and
ruptured. The patient was readmitted to the hospital. The next morning the nurse from the
cath lab visited the patient to debrief him on what happened to cause the rupture. After
the patient was explained what happened, the nurse said she would include that in her
briefing from then onwards so that other patients could benefit from his experience. The
patient was impressed and told the nurse so. She replied that she used the quality tool
PDSA (Plan, Do, Study, Act) every day to improve patient safety at the hospital. She added

125
that the hospital was committed to continuous improvement in developing a culture of
patient safety (Pauley 2012).
At Inova Mount Vernon Hospital in Mount Vernon - Virginia, patients were spending too
much time in the emergency department because of the inefficiency of the processes. To
eliminate dissatisfaction among patients and the community, the hospital used quality tools
to strengthen the processes of the emergency department and to reduce patients’ length of
stay by nearly two hours. According to the article ‘On the Clock’, the time that had elapsed
from a patient being entered the emergency department to the time the patient was
discharged was two hours longer than that of the best emergency departments in United
States (Robert, 2011).
Impacts of adverse events on patients include suffering due to pain, disability, psychological
trauma and failure of treatment & betrayal of trust. Staff suffers from shame, guilt,
depression, litigations and complaints (Vincent, 2010). Economic cost or loss from adverse
events per annum includes lost bed days consequent to prolonged stay. Lost working time
and expenditure for disability benefits should be added to this cost. So must lost income,
lost household production (Vincent, 2010, Watcher, 2008). Studies which were carried out
in various countries have shown that dealing with adverse events is expensive. Some
countries such as USA and UK spend a huge sum of money on them. Moreover, the
insurance companies quote a high price for medical provider coverage. This has resulted in
narrowing down the range of treatment offered to patients by providers (Obama, 2006).
Instilling patient safety culture in health care system is one of the best methods to
overcome these grievances and economical burdens. Having a reliable system to overcome
unpredictable adverse events makes institutions trustworthy for patients and gives pleasure
to the working staff.
Patients may experience adverse events from their medical care even in the absence of any
errors (i.e., due to accepted complications of a surgery or side effects of medications). The
patient safety literature separates preventable adverse events from those that are non-
preventable. The following figure shows a Venn diagram depicting these various terms.

126
Figure 5.3: Venn diagram – Patient Safety Terminology
Near Misses
All Errors
All Adverse Events
Any injury or harm
resulting from
Medical Care
Preventable
Adverse Event
Non Preventable
Adverse Event
All Adverse Events
Failure of a planned
action or use of a
wrong plan
Event caught
before harming a
patientNegligent
Adverse Event
(Source: Wachter, 2012)
Now, where do errors or mistakes fit in? The safety literature commonly defines an error as
“an act of commission (doing something wrong) or omission (failing to do the right thing)
leading to an undesirable outcome” (www.ahrq.gov, 14th May 2013). It should be noted
that many errors do not result in adverse events (refer figure). Generally most serious ones
are characterized as “near misses” or “close calls”. Some errors involve care that falls below
professional standards where this is called negligence and may create legal liability or a duty
to compensate for the patient in some systems. Although most preventable adverse events
involve errors, not all of them do.
5.4 Classification of Hospital Accidents
In a healthcare system there are adverse events, errors and failures. Some of them are
preventable. The approach of patient safety is to prevent the preventable events.
Adverse events are injuries or harm resulting from medical care. Adverse events are either
preventable or non preventable. Recent studies have shown that the percentage of adverse

127
events taking place in health systems accounts for 8-12% of total events. About half of
them are preventable (Vincent, 2010).
Adverse events are of two types:
a. Adverse events occurring due to the consequences of lack of care received by
the patients
b. Harm that a patient may undergo due to accepted maximum care in the
absence of any errors such as accepted side effects of a surgery (Wachter &
Robert, 2008).
Errors are of two types. They are:
Normative errors – knowingly conducted errors or those of negligence.
Technical errors -- errors that take place due to technical incapacity
Near misses and preventable adverse events come under technical errors. Errors could be
medical errors, surgical errors or diagnostic errors.
Approximately, 5% of in-patients experience medical errors due to Adverse Drug Events
(ADE). Adverse Drug Events include harm caused by the medication itself, its side effects or
consequences and 5% -10% of patients face potential Adverse Drug Events which are near
misses. Patients on medications at home experience ADE more than in-patients. Some of
them are very serious events. Medical errors could be prescription errors such as
prescribing the wrong drug, wrong dose, in illegible writing or errors related to failures in
recognizing allergies and the possibilities of drug reactions (drug-drug/drug-diet). Errors
related to administration of drugs include administering by the wrong route, to the wrong
site, in wrong frequency, to the wrong patient or ultimately the wrong drug itself. Patients
also contribute to these ADE. Strategies for safe drug administration have been developed,
for example, in 2003, the Joint Commission prohibited the providers to use “high risk
abbreviations”, so that the dispenser as well as the administrator clearly understands the
prescription; double check all the important procedures, so that two people should check
individually (Emanuel, et al, n.d).

128
Surgical errors are adverse events faced by patients who undergo surgical procedures.
These could take place as a result of negligence. There are “Never Events” which should
never take place, i.e. doing the wrong surgery on the wrong site or in the wrong patient. To
overcome this, the Joint Commission has introduced Universal protocols (Emunuel, et al,
n.d.).
Diagnostic errors are cognitive and judgmental. These are mainly “slips” and “mistakes”.
Slips are “unconscious lapses of some automatic tasks”. Mistakes are due to distraction,
lack of experience, lack of information or applying wrong decisions (Wachter & Robert,
2008; Vincent & Charles, 2010).
Failures were found while analyzing the root causes for breakdown of organizational patient
safety. They are:
Active failures - Failures that occur due to failures of ‘front line’ workers while
delivering services; e.g.; between patients and nurses
Latent failures - Failures that take place due to gaps in the higher levels e.g.
managerial level.
Examples of Medical Errors:
System Errors (Latent)
• Heavy workload/fatigue
• Incomplete or unwritten policies
• Inadequate training or supervision
• Inadequate maintenance of equipment/buildings /communication
Human Mistakes (Active)
• Action slips or failures (e.g. picking up the wrong syringe)
• Cognitive failures (e.g. memory lapses, mistakes through misreading a
situation)
• Violations (i.e. deviation from standard procedures; e.g. work-
around)

129
Post-accident investigations have shown that the local trigger factors are active failures in
the system. Majority of the active failures occur due to the latent failure; i.e. weaknesses in
the organizational system and managerial deficiencies. Latent failure accounts for 85% of
the failures in an organization. Therefore, Patient Safety Culture of an organization plays an
important role in reducing errors and mistakes (Reason, 1990).
5.5 Evolution of Patient Safety Culture
In 1982, ABC television network broadcast “Deep Sleep” which awakened the health
providers as well as the purchasers. They stated that 6000 Americans die or suffer brain
damage by anaesthetic accidents (Tomline, 1982). As a result, worlds’ first ‘Anaesthesia
Patient Safety Foundation’ was formed by the American Society of Anaesthesiologists. This
was where the word ‘Patient safety’ was born. In 1989, Australian Patient safety
Foundation was formed (Anaesthesia Patient Safety Foundation). The first conference on
patient safety and system errors was held at Annenberg Center for Health sciences,
California in 1996. In 2003, the Joint Commission began to promote Patient safety.
Australia and the UK followed the pathway by forming Safety and Quality in Health Care’s
Priority Programs and National Patient Safety Agency (NPSA) respectively. In the year 2003,
Taiwan appointed a Patient Safety Committee; in year 2002, WHO globalised patient safety
by launching the World Alliance Resolution. The resolution stated that, to tackle patient
safety globally a comprehensive and multifaceted approach is needed (Lian, 2004; Wachter
& Robert, 2008; Emanuel, et al, n.d; Wung, 2011).
In 2004, the Patient Safety Committee of Experts on patient safety developed annual
patient safety goals, strategies, principles and reference procedures. There were five goals
at that time and by year 2007 it was increased up to eight. The committee also developed
details for implementation. The goals were:
improving the safety of using medication;
reducing health care-associated infection;

130
eliminating wrong site, wrong patient;
eliminating wrong-procedure surgery;
improving the accuracy of patient identification;
prevention of patient falls;
encouragement of staff to report any incident to improve communication and safety
during patient transfer; and
Increase patient and customer involvement (Hughes, 2008).
University of California, Evidence –Based Practice Center began its work by defining patient
safety practice as “a type of process or structure whose application reduces the probability
of adverse events resulting from exposure to the health care system across a range of
diseases and procedures” (Markowitz, et al, 2001). Following the development and
implementation of patient safety culture goals and procedures, the necessity for evaluation
of patient safety arose. USA Joint Commission initiated an accreditation process. ‘The Joint
commission for Accreditation of Health care Organizations’ (JCAHO) conducts an annual
assessment (Pronovost, et al, 2010). This is very expensive. Therefore, some countries like
Thailand, Taiwan, India developed self-evaluation questionnaires to evaluate the
achievements of the goals.
Westrum in 1991 developed a cultural maturity model to explain the evolution of culture.
According to him, there are five stages of maturity. It is arranged in a step ladder manner as
shown below.

131
Figure 5.4: The Stages of Patient Safety Evolution
PathologicalWho cares as long as we are not
caught
ReactiveOrg. Start to take safety seriously but
there is only action after incidents
Calculative
Safety is driven by Mx systems with collection &
analysis of data. Primarily driven by top Mx. rather
than looked by the workforce
ProactiveWorkforce involvement starts. We work on
the problems that we still find
GenerativeSafety is how we do business round here –
safety is inherent part of the business
Adapted from: Hudson P, Applying the lessons of high risk industries to health care, Quality Safety Health Care 2003;12(Suppl. 1):i7–i12
Increasinginformedness
Increasingtrust
In pathological culture where staff is not worried about any adverse events as long as they
are not caught, events keep taking place. Next phase is the reactive stage, at which the
staff starts working on whenever an adverse event takes place. Third phase is the
calculative stage where the management is aware of the importance and necessity of
patient safety. They act on it, but the lower levels of staff are not yet a part of the process.
Proactive stage is where everybody takes part in the process but, unexpected safety issues
still arise. The desired stage of safety is the Generative stage where safety is in-built in the
health care system where there is active participation at all levels. Adverse events are
analyzed and actions are planned well ahead to prevent them. This is a retrospective action.
When patient safety replaces blame culture, safety depends on the system created. Here,
the system anticipates errors and either prevents or detects them before harm (Wachter &
Robert, 2008; Hudson, 2003). According to a study carried out in Sri Lanka, it was found
that patient safety culture in hospitals was in a reactive stage. ‘Staff has a fear of reporting
incidents. In turn, the learning opportunities are less. This can lead to errors not being
identified and thus, no contingency plans being made. There is a chance of repeating errors
132
and new errors may take place. Action is taken retrospectively to rectify the errors’
(Amarapathy, 2013).
5.6 Creating Patient Safety Culture
Although culture of safety has no universally accepted clear definition, perhaps the best
description is this one: "A safety culture exists within an organization [when] each
individual employee, regardless of his/ her position, assumes an active role in error
prevention and that role is supported by the organization”. Likewise, there are no clear
pathways how this patient safety culture can be created in a healthcare organization.
Anyhow, the first step is to practice No Blame Culture, i.e. not to find fault with someone or
try to find who is wrong. If an adverse event occurs, the organization must respond to the
situation rather than reacting to it. After avoiding blaming anybody, the organization has to
practice open culture, just culture, learning culture, informed culture and reporting culture
in order to promote patient safety culture. The characteristics of these cultures are
explained in the following table:
Table 5.2: Promoting Culture towards Patient Safety
Elements Characteristics
Informed
Culture
Those who manage and operate the systems have current knowledge
about the factors that determine the safety of the system
Reporting
Culture
Prepared to report their errors and near misses
Staff have confidence in the local incident reporting system and
use it to notify healthcare managers of incidents that are
occurring, including near misses
Barriers to incident reporting have been identified and removed:
o staff is not blamed and punished when they report
incidents
o they receive constructive feedback after submitting an
incident report
o the reporting process itself is easy
Staff, patients and careers are treated fairly, with empathy and
133
Just Culture
considerations when they have been involved in a patient safety
incident or have raised a safety issue
Encouraged and even rewarded for providing safety-related
information, but must be clear about what is acceptable and
unacceptable behaviour
Learning
Culture
Willingness and know-how to draw the right conclusion from a
safety information system and to implement reforms
The organisation:
o is committed to learn safety lessons
o communicates them to colleagues
o remembers them over time
Open culture
Staffs feel comfortable discussing patient safety incidents and
raising safety issues with both colleagues and senior managers.
Everyone in the team is given equal opportunity to discuss about
the patient safety issues
5.7 Conclusion
Even though several studies and initiatives have been carried out to improve patient safety
in healthcare organizations for the last two decades, this discipline is still in its infancy stage.
Sri Lankan health sector for the past two decades has shown immense progress in its
service, especially in relation to cost–effectiveness and its indicators are comparable with
those of the developed countries. Sri Lankan Health infrastructure and health personnel
have enormous potential in service delivery. Since the global trend is now towards patient
safety, it is vital for us to begin the journey as early as possible and set an example to other
developing countries.
References
AHRQ- Patient safety indicators,
www.qualityindicators.ahrq.gov/modules/psi_overview.aspx.
Alahmadi H.A. Assessment of patient safety culture in Saudi Arabian Hospitals.
British Medical Journal. 2009

134
Alahmadi H.A. Assessment of patient safety culture in Saudi Arabian hospital. Qual
Suf Health 2010; 19:e17.2010
Amarapathy M, Sridharan S, Perera R, Factors Affecting Patient Safety Culture in a
Tertiary care Hospital, Dissertation. 2012
Amarapathy M , Sridharan S, Perera R, Handa Y. Factors Affecting Patient Safety
Culture in A Tertiary Care Hospital in Sri Lanka. International Journal of Scientific &
Technology Research Volume 2, Issue 3, March 2013, page 173-180
Anesthisia Patient Safety Foundation: Anesthesia Patient Safety
Foundation;comments from the anesthesia patient safety foundation.
(http://www.apsf.org/about/poineering_safety/page3.mspx)
Deilkås E, D. Hofoss. (2010). Patient safety culture lives in departments and wards:
Multilevel partitioning of variance in patient safety culture. Bio Med Central Health
Services Research 2010;10:85.
Donaldson Liam, Philip Pauline, “Patient Safety – a Global Priotiy,” Bulletin of the World
Health Organization 82,no.12. (2004),
http://www.who.int/bulletin/volume/82/12/editorial11204html/en
Emanuel Linda, Don Berwick, James Conway, John Combes, Martin Hatlie, Lucian Leape,
James Reason, Paul Schyve, Charles Vincent, ; Merrilyn Walton, (n.d.). What is exactly
patient safety? www.ahrq.gov/downloads/pub/advances2/vol1/advances-eman...
(HYPERLINK "http://www.nlm.nih.gov/hmd/greek/greek_oath.html"
HealthGrades, HealhGrades Patient Safety in Americal Hospitals Study, March 2011,
http://www.healthgrades.com/business/img/HealthGradesPatientSafetyIn
AmericanHopsitalsStudy2012.pdf
Hughes Ronda G, Patient Safety and Quality: An Evidence-Based Handbook for Nurses, AHRQ
Publication No. 08-004, April 2008
Institute of Medicine, To Err Is Human: Building a Safer Health System, Washington,
DC, National Academy Press, 2000
Institute of Medicine, The safe Initiative and Health Literacy: A Workshop, December
2010,-http://www.iom.edu/2012/The-Safe-Use-Initiative-and-Health-Literacy-A-
Workshop.aspx

135
Katherine J, Skinner A, Liyan Xu, Junfeng Sun and Keith Mueller. The AHRQ Hospital
Survey on patient Safety Culture: A tool plan and Evaluate Patient safety progrms.
Advances in Patient Safety: New Directions and Alternative Approaches (Vol 2:
culture and Redesign) Aug 2008.
Landrigan C P, Parry G J, Bones C B, Hackbarth A D, Goldman D A, Sharek P J,
‘Temporal Trends in Rates of Patient Harm resulting from Medical Care,’ New
England Journal of Medicine, 363, no.22 (2010): 2124-2134
Lian, Philip P (2004, Dec). Patient Safety - a global priority. Bulletin of the World
Health Organization , p. 82(12).
Markowitz AJ, Shojania KG, Duncan BW, McDonald KM, Wachter RM, Making health care
safer: a critical analysis of patient safety practices, Evidence Report Technology Assessment
(Summary). 2001;(43):i-x, 1-668.
Obama, H. Clinton. Making Patient Safety the Centerpiece of medical liability reform.
The New England Journal of Medicine 354(21):2205-8. 2006 May 25
Patient safety accreditation Canada -www.accreditation.canada
Pauley A P, Pauley J F, Establishing a Culture of Patient Safety, American Society of
Quality Press, 2012
Pronovost PJ , Weast B, Holzmuller CG,BJ Rosenstein, R P Kidwell, KS Haller, ER
Feroli, JB Sexton and HR Rubin . Evaluation of the culture of safety; survey of
clinicians and mangers in an academic medical center. Quality & Safety in Health
Care 2003: 12: 405-410.
Reason JT, Managing the Risk of Organizational Accidents, Aldershot, Hampshire,
England: Ashgate; 1997
Reason J. Safety paradoxes and safety culture. Injury Control and Safe Prevention ,
7:3–14.2000
Reason J. Managing the risk of organizational accidents. Burlington (VT): Ashgate.
2000
Reason J. The Contribution of Latent Human Failures to the Breakdown of Complex
Systems. Royal society publishing, 1990 vol. 327 no. 1241 475-484.
Robert Q, Watson, Lesson, “On the Clock,” ASQ Quality Progress, March 2011,
http://asq.org/quality-progress/2011/03/best-practices/on-the-clock.html
136
Ruwanpura R. Litigation against medical practitioners: facts and myths. Galle
Medical journal. Vol 14: No. 1, September 2009
Scott Douglas, The Direct Medical Costs of Healthcare Associated Infections in U.S.
Hospitals and the Benefits of Prevention, March 2009, Centers for Disease Control and
Prevention, http://www.cdc.gov/ncidod/ghqp/pdf/Scott_CostPaper.pdf
Tomline J. (1982). The Deep Sleep;6000 will die or suffer brain damage. Chicago: WLS-TV
20/20.
Vincent (2003), Understanding and Responding to Adverse Events, The New England
Journal of Medicine, med 348;11, march 13, 2003
Vincent C., (2010). Patient Safety. London: Wiley-Blackwell.
Wachter Robert, Pronovost, Miller (2008). Understanding patient safety. California.
JAMA. 2006;296(6):696-699 (doi:10.1001/jama.296.6.696)
Watcher M Robert, Understanding Patient Safety, McGrawHill, Second Edition, 2012
Weingart, Wilson, Gibbert, Harison. (2000). Epidemology of medical errors. British
Medical Journal.2000: 320;774-7.
Weingart SN, Farbstein K, Davis RB,Phillip RS. Using a multihospital survey to examine the
safety culture. Joint Commission Journal on Quality Safety 2004, 30:125–32.
What is Patient safety WHO, www.who.int/patientsafety /education/curriculum /
who_mc_topic-1.pdf. 2009
http://www.nlm.nih.gov/hmd/greek/greek_oath.html 12th May 2013
www.ahrq.gov, 14th May 2013

137
MODULE 02:
QUALITY IMPROVEMENT
TECHNIQUES
CHAPTER 6

138
TOPIC: Application of Japanese 5S Concept in Healthcare Management (the
gateway to improve quality of care in healthcare organizations)
Objectives: To explain the application of Japanese management practices - 5S for the
Health sector
Total Amount of Time: 150 Minutes Number of Participants: 35 (Approx.)
Preparation: The trainer should have a comprehensive understanding on 5S concepts.
Trainer must be prepared with suitable live examples for each 5S step related
to the healthcare organization. He must be prepared to share experience, if
possible, with his own experience too. The trainer should be aware of the
technical terms used in the application of 5S and its tools. Also, refer the
Curriculum (Annexure II of Introduction Chapter).
Materials: Handouts of the power-point presentations, photos and films relevant to 5S
can be used. Refer Curriculum (Annexure II of Chapter Introduction).
TRAINING OPENING
Engage Participants: (Ice-breaker/warm-up activity related to the topic)
Time: 10 Minutes
Engage participants with common problems faced in the hospitals with suitable examples
related to healthcare organizations.
Introduce the Topic: One power-point slide showing the main areas that will be covered
Time: 10 Minutes
Motivate participants, show them why the topic is important and share objectives and the
agenda. Introduce 5S as the gateway to quality improvement programmes in hospitals. It
SESSION PLAN - 06
139
should be specially mentioned that application of 5S is not achieving quality but an entry
point to a quality improvement programme.
TRAINING MIDDLE
Explain the Topic: Explain the topic in detail; demonstrate and discuss the concept,
practice and application of the topic
Time: 110 Minutes
Each step in 5S should be explained with visual-aids such as photos, pictures and also with
suitable examples. The implementation of 5S is then explained with practical examples and
live stories. The benefits of 5S also are enlightened with suitable examples. Here it is
recommended to come up with examples which are culturally related to a healthcare
organization and the geographical area of concern. Then, the 5s tools can be detailed. It is
recommended to explain each term in 5S tools.
TRAINING WRAP-UP AND CLOSING
Summarize the Topic: Reconnect with the objectives; check for understanding and discuss
questions
Time: 15 Minutes
Summarize the 5S concept and its importance. Check understanding of 5S by showing some
photos to check super 5S.
Closing Comments: Acknowledge, motivate and inspire Time: 05 Minutes
Reinforce the importance of the topic; confirm that the time was well spent and thank
participants; reinforce group respect and rapport.

140
QUICK CHECK FOR FACILITATOR/TRAINER (To be filled after every
session)
Reflects on how the training went on to develop training skills, to plan on future training
topics and to note potential next steps
Topic: Application of Japanese 5S Concept in healthcare Management Date: ________
Attendees:
___________________________________________________________________________
___________________________________________________________________________
___________________________________________________________________________
___________________________________________________________________________
Observations Made by the Trainer:
___________________________________________________________________________
___________________________________________________________________________
___________________________________________________________________________
___________________________________________________________________________
___________________________________________________________________________
___________________________________________________________________________
___________________________________________________________________________
___________________________________________________________________________
141
CHAPTER 06: APPLICATION OF JAPANESE 5S CONCEPT IN
HEALTHCARE MANAGEMENT
6.1 Introduction
Hospitals are complex systems and many hospitals provide a wide range of services. These
services must not only be carried out around the clock, but also must be implemented
across the units in the hospital. Further, in a hospital, there are many professional groups
working with their own professional cultures. Hence, cooperation among the units and
teamwork are essential to run the hospital smoothly. Hence, improving the systems in a
healthcare organization is essential.
Before thinking about quality in a healthcare organization, it is essential to improve the
systems in that organization.
Healthcare facilities are like living organisms, moving and changing in flexible relationships
with their environments. In the world of healthcare, patient needs are always being
changed; new healthcare technologies are continually being developed; new medicines and
medical procedures generation after generation are being introduced. Meanwhile, the
pressure to improve quality and reduce the cost of healthcare mounts each passing year.
Due to these challenges, healthcare facilities must move beyond old organizational concepts
and customs which are no longer applied and must adopt new methods that are
appropriate to the times (Jackson, 2009).
6.2 Common Problems in Hospitals
Common problems or complaints encountered in a day-to-day life of a healthcare
organization are listed below.
Sir Donald Berwick, former President and Chief Executive Officer of the Institute for
Healthcare Improvement said that ‘Quality Fails when Systems Fails’.

142
i. Increased workload – Staff always feels that they are overburdened with work.
Whenever an assignment is given to the staff, they complain that they are unable to
comply because they are overburdened with routine work.
ii. High absenteeism – The frequent absenteeism of some categories is another major
setback faced by the hospital management. If a nurse of an operating theatre is
absent for her morning shift, the Nursing Sister-in-charge of that operating theatre
will come to know about it around 7.30 a.m. This absence might delay the
commencement of the theatre list. The Nursing Sister then will inform the Matron
requesting another nurse. Then the Matron has to pick a nurse from another unit or
request a nurse who is in the nurses’ quarters to act for the nurse who is absent.
This arrangement will take another one hour. Eventually, the theatre list will be
started not at 8.00 a.m. but around 8.45 a.m. with couple of surgeries being
postponed.
iii. High turnover – If the hospital settings are not conducive to work, then the
employees might not stay long. They will be requesting for transfers. High turnover
is a disadvantage to any organization because that organization is losing well trained
employees.
iv. Employee demotivation – Another common problem faced in healthcare
organizations is the demotivation of employees. The reason for demotivation is the
poor Quality of Work Life (QWL). Another vital aspect of demotivation is not
appreciating the employees for their good work. On the other hand, the worst is the
appreciation of the wrong people.
v. Disorganized / cluttered environment – It is a well known experience that wards
and clinics are disorganized. The drugs and equipments which are needed are
sometimes not easily accessible during an emergency.

143
vi. Mistakes / Errors - Dispensing a drug to the wrong patient or giving a wrong drug to
a patient is a common mistake made in hospital settings. Wrong site surgeries also
are experienced in the health sector worldwide.
vii. Accidents – Patient falls is another major problem encountered in hospitals.
Likewise, staff accidents are another setback to the smooth functioning of hospitals.
One of the major reasons for such accidents is an unorganized environment.
viii. Dissatisfied patients (patient complaints) – It should be noted that even though the
health sector contributes immensely to the public, patients are sometimes not
satisfied with the services given. This is due to reasons such as rudeness of the staff
to patients, not listening to patients, long waiting time and the unavailability of
essential drugs etc.
ix. Stress and strain – Hospital staffs work under stressful conditions. This is mainly due
to the fact that the necessary instruments and equipments are not arranged in an
organized manner. Lots of time is consumed for searching these essential items.
x. Staff conflicts – It is not unusual for employees of different categories of staff to
quarrel with each other. Most of the time, the reason for these conflicts are some
minor problems which can be sorted out at the unit level. Anyhow, these conflicts
sometimes escalate to trade union actions.
6.3 Overview of 5S
5S is considered a workplace housekeeping technique. It is much more than that. It is
about creating an efficient workplace, which forms the basis for all other improvements in
any given organization.
One of proven solutions for these problems is the application of 5S
which is found to be one of the entry points to a Quality Improvement
Programme.

144
It is a Japanese technique, which has been successfully used by them in creating an
organizational environment for continuous improvements. It is a technique not only used
for improving the shop floor areas, but also in equal importance, for the creation of an
efficient workplace.
The application of 5S to an organization fixes a determination to organize the workplace; to
keep it neat and clean; to maintain standardized conditions and the discipline that is needed
to do a good job. The name ‘5S’ comes from the first letters of five Japanese words which
form the five simple steps needed to create a well-organized workplace. These five
Since it is going to be a little difficult to understand and remember these 5 Japanese words,
it is necessary to translate them into English.
Japanese Word English Translation Meaning
Seiri Sort Organization
Seiton Set Orderliness / Systemize
Seiso Shine Cleaning with meaning and beautifying
Seiketsu Standardize Standardization
Shitsuke Sustain Training and self discipline
Japanese steps are as follows:
1. Seiri
2. Seiton
3. Seiso
4. Seiketsu
5. Shitsuke

145
Figure 6.1: Steps for Implementation of Quality Improvement
5S has been the starting / entry point of the Sri Lankan Quality Assurance
programme; 5S is the foundation for a Quality Improvement Programme.
5S:
creates quality culture among employees
organizes the hospital
is a gateway to quality improvement programme
is the foundation for quality improvement programme
146
6.4 SEIRI – S1 (Organize/Sort & Clear)
SEIRI means sorting. This is the first step of implementing 5S.
S 1 focuses on eliminating unnecessary items from the workplace that are not needed for
current processes in the hospital. SEIRI can be done in the following way.
Look around you. Are there things, which you do not need?
Look at spaces, furniture, devices, documents and materials
Segregate items which are not needed and send them to condemning stores
Identify housekeeping problems and deal with the causes (to prevent, reduce or
remove dirt and grime).
It helps a unit by:
Clearing the clutter
Creating more space
Solving housekeeping problems
Practical Guidelines on S – 1:
What is meant by ‘unnecessary items’?
i. Unserviceable items - Usually known as condemning items such as broken
equipments, broken furniture etc.
ii. Excessive items – This means having more than what is required. For example, in
year 2002, a hospital had 5000 sets of maternal mortality forms where only 12 – 15
maternal deaths island wide were reported in a year those days. For these 5000 sets
‘SEIRI means distinguishing between the necessary and the un-necessary and getting
rid of what you do not need’.
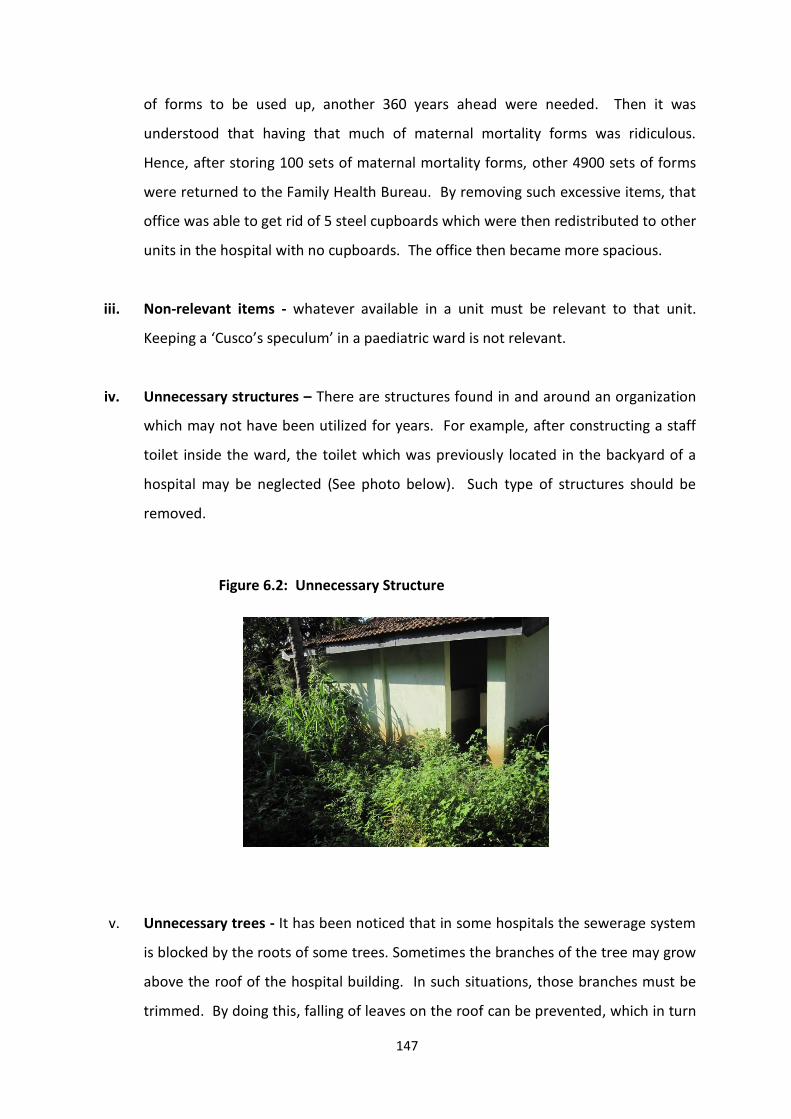
147
of forms to be used up, another 360 years ahead were needed. Then it was
understood that having that much of maternal mortality forms was ridiculous.
Hence, after storing 100 sets of maternal mortality forms, other 4900 sets of forms
were returned to the Family Health Bureau. By removing such excessive items, that
office was able to get rid of 5 steel cupboards which were then redistributed to other
units in the hospital with no cupboards. The office then became more spacious.
iii. Non-relevant items - whatever available in a unit must be relevant to that unit.
Keeping a ‘Cusco’s speculum’ in a paediatric ward is not relevant.
iv. Unnecessary structures – There are structures found in and around an organization
which may not have been utilized for years. For example, after constructing a staff
toilet inside the ward, the toilet which was previously located in the backyard of a
hospital may be neglected (See photo below). Such type of structures should be
removed.
Figure 6.2: Unnecessary Structure
v. Unnecessary trees - It has been noticed that in some hospitals the sewerage system
is blocked by the roots of some trees. Sometimes the branches of the tree may grow
above the roof of the hospital building. In such situations, those branches must be
trimmed. By doing this, falling of leaves on the roof can be prevented, which in turn
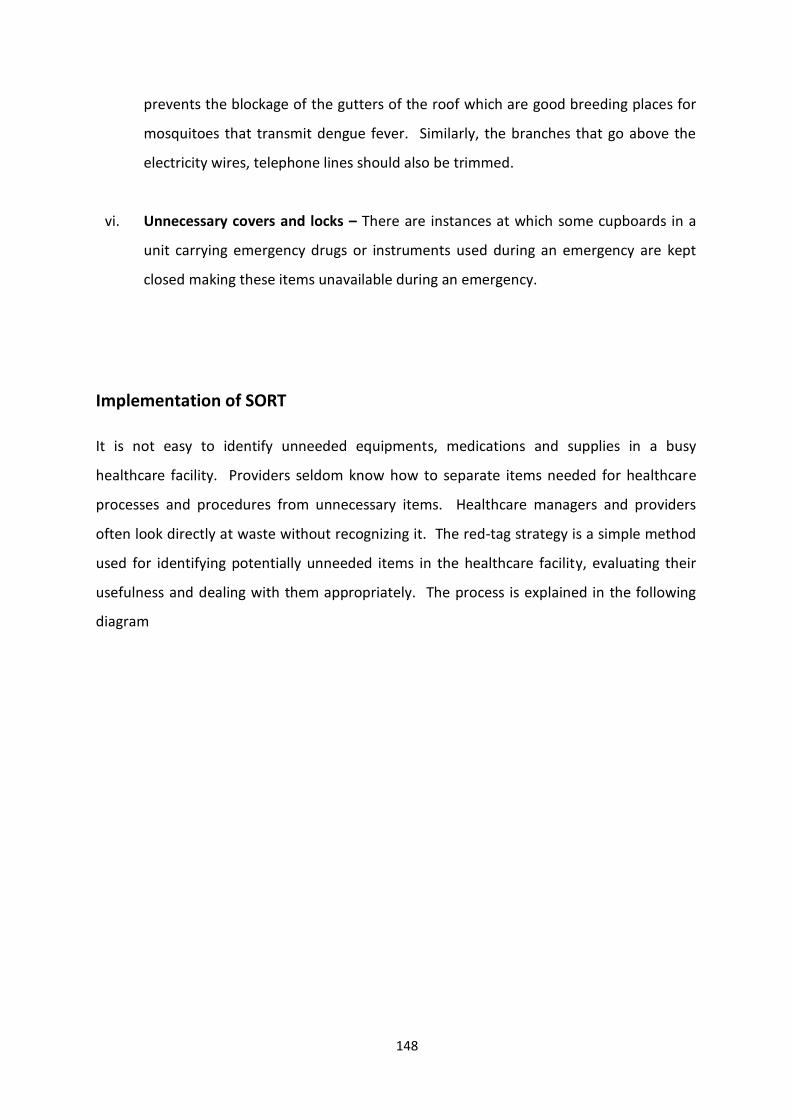
148
prevents the blockage of the gutters of the roof which are good breeding places for
mosquitoes that transmit dengue fever. Similarly, the branches that go above the
electricity wires, telephone lines should also be trimmed.
vi. Unnecessary covers and locks – There are instances at which some cupboards in a
unit carrying emergency drugs or instruments used during an emergency are kept
closed making these items unavailable during an emergency.
Implementation of SORT
It is not easy to identify unneeded equipments, medications and supplies in a busy
healthcare facility. Providers seldom know how to separate items needed for healthcare
processes and procedures from unnecessary items. Healthcare managers and providers
often look directly at waste without recognizing it. The red-tag strategy is a simple method
used for identifying potentially unneeded items in the healthcare facility, evaluating their
usefulness and dealing with them appropriately. The process is explained in the following
diagram
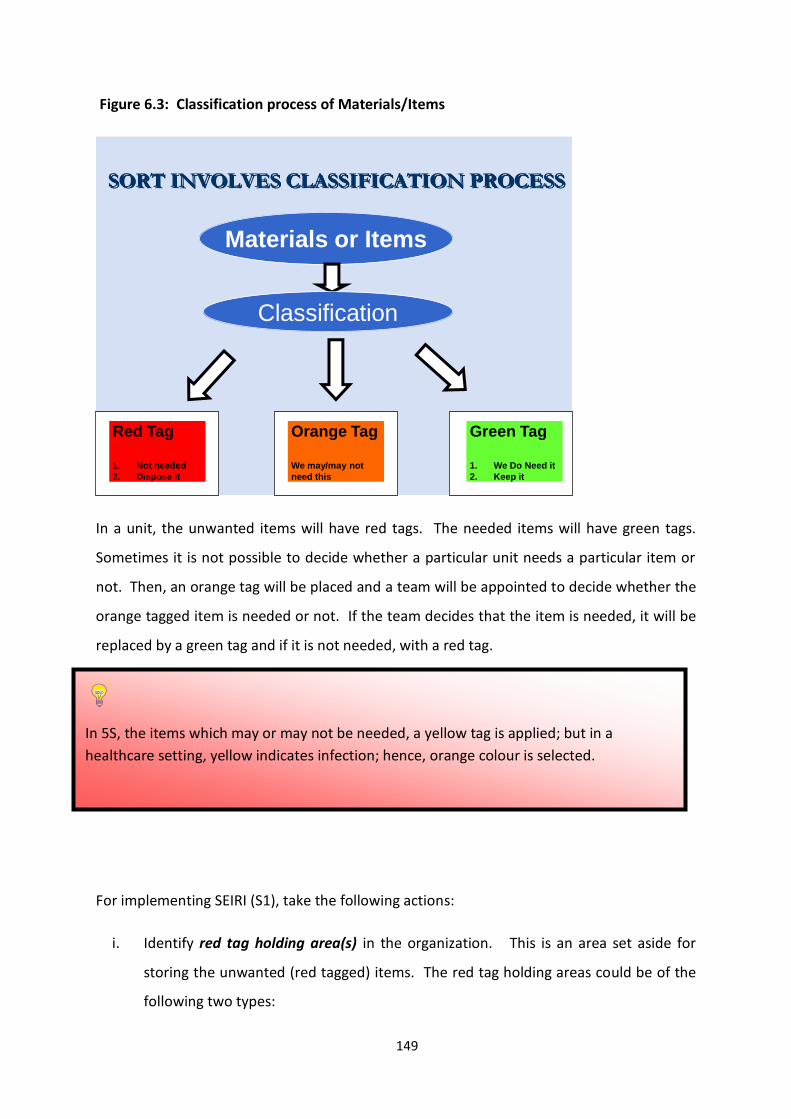
149
Figure 6.3: Classification process of Materials/Items
SORT INVOLVES CLASSIFICATION PROCESS
Materials or Items
Classification
Orange Tag
We may/may not
need this
Red Tag
1. Not needed
2. Dispose it
Green Tag
1. We Do Need it
2. Keep it
In a unit, the unwanted items will have red tags. The needed items will have green tags.
Sometimes it is not possible to decide whether a particular unit needs a particular item or
not. Then, an orange tag will be placed and a team will be appointed to decide whether the
orange tagged item is needed or not. If the team decides that the item is needed, it will be
replaced by a green tag and if it is not needed, with a red tag.
For implementing SEIRI (S1), take the following actions:
i. Identify red tag holding area(s) in the organization. This is an area set aside for
storing the unwanted (red tagged) items. The red tag holding areas could be of the
following two types:
In 5S, the items which may or may not be needed, a yellow tag is applied; but in a
healthcare setting, yellow indicates infection; hence, orange colour is selected.
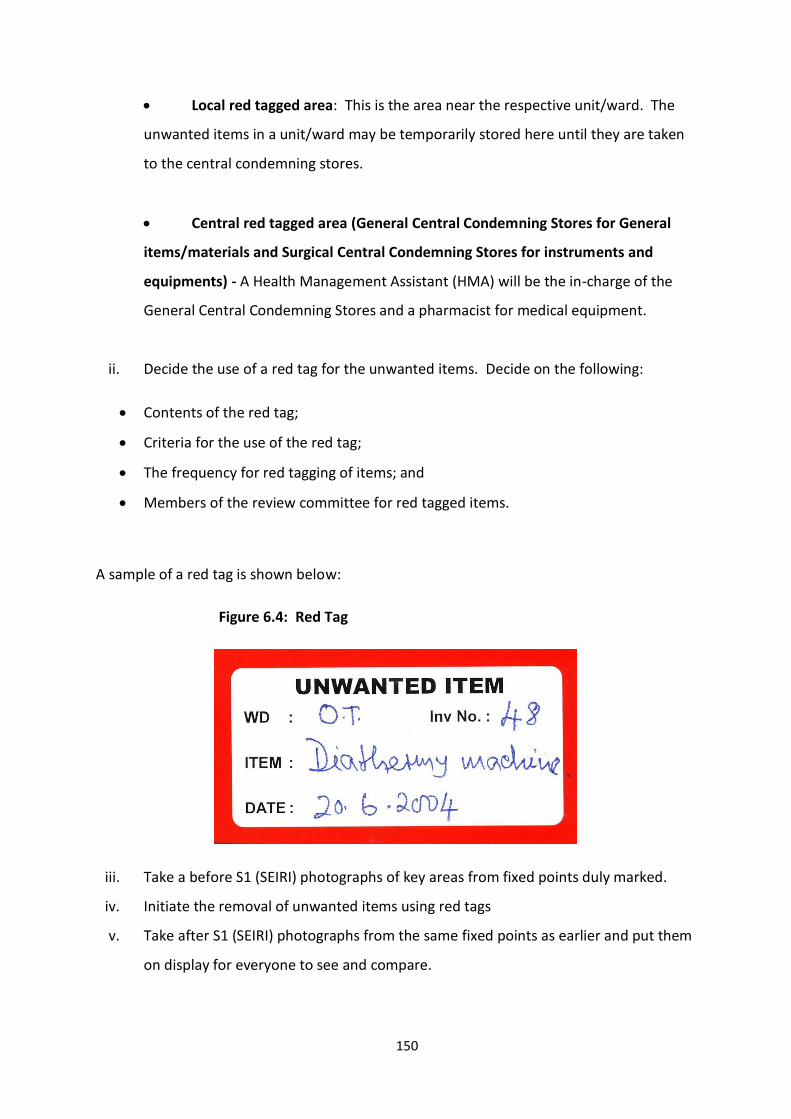
150
Local red tagged area: This is the area near the respective unit/ward. The
unwanted items in a unit/ward may be temporarily stored here until they are taken
to the central condemning stores.
Central red tagged area (General Central Condemning Stores for General
items/materials and Surgical Central Condemning Stores for instruments and
equipments) - A Health Management Assistant (HMA) will be the in-charge of the
General Central Condemning Stores and a pharmacist for medical equipment.
ii. Decide the use of a red tag for the unwanted items. Decide on the following:
Contents of the red tag;
Criteria for the use of the red tag;
The frequency for red tagging of items; and
Members of the review committee for red tagged items.
A sample of a red tag is shown below:
Figure 6.4: Red Tag
iii. Take a before S1 (SEIRI) photographs of key areas from fixed points duly marked.
iv. Initiate the removal of unwanted items using red tags
v. Take after S1 (SEIRI) photographs from the same fixed points as earlier and put them
on display for everyone to see and compare.

151
vi. When the red tagged items are sent to the Central Condemning Stores, evaluate the
red tagged items; if they are usable,
a) Relocate to another units, which require them
b) If the institution does not require it, relocate to another institution in the region or
province, or any other healthcare institution in the country which requires it after
completing official processes.
If the red tagged items are not usable,
a) Find out whether minor repairs can be done; if so, use petty cash for minor repairs
b) If major repairs are needed, then follow the appropriate procedures
If major repairs also cannot be done, continue with the condemning process.
The success of the implementation of S1 shall be assessed by the size of the area freed up.
The objective of this exercise is to save space and recover space.
6.5 SEITON – S2 (Orderliness/Systemization)
SEITON means ‘setting in order’ or arranging things systematically.
Once you have eliminated all the unneeded items, then it is your turn to deal with the
leftover items. Then the next question will be, ‘how much of what should be put aside and
where?’ This is NEATNESS (SEITON). Examples of neatness are:
Efficiently parked trolleys and wheel chairs
Systematically arranged records in a ward
Orderly lay out plan in a clinic
Layout of tools in a maintenance unit
Systematically arranged drugs in an indoor pharmacy
‘SEITON means establishing a neat layout so that you can always get just as much as, of
what you need and when you need’.

152
Visual control of septic and aseptic areas
There are 3 steps in implementing SEITON:
a. Deciding where things should belong to (deciding locations)
Locate frequently required items nearer and vice versa
Location should result in economical body motions
Plant (site) layout to reduce travel time an wasteful activities
b. Deciding how things should be put away (identifying locations and deciding storage
conditions)
Reinforce item ‘names’, ‘locations’ and ‘quantities’ by marking; e.g. labeling,
outlining, placement marking, etc.
Decide appropriate storage conditions based on the type of item; e.g. use of
stands, shelves, special containers, bins, trays etc.
c. Obeying the put-away rules
Always put things where they belong to.
Some of the SEITON activities are visually shown below.
Figure 6.5: Arrangement of Drugs

153
When drugs are being arranged, make sure that they are arranged left to right according to
the alphabetic order. This is because our eyes are trained to read from left to right; hence,
it will be easy for a nurse to search for a drug. Anyhow, we might encounter a problem of
arranging similarly named drugs together which is shown below.
Figure 6.6: Arrangement of Drugs – Alphabetic Order
Diclophenac
SodiumDilantin
Sodium
D. Sodium Di. Sodium
In an emergency situation, a nurse might read the first few and the last few letters of a drug
and take it out from the store. Due to this, there is a possibility for an error to occur. To
avoid this, the concept of visual control can be applied; i.e. displaying common letters of
similar named drugs in black colour and different letters of such drugs in red colour (Red
indicates danger, attention). By doing so, the chances of taking out of a wrong drug can be
minimized. This is shown in the following figure.

154
Figure 6.7: Arrangement of Drugs – Using Visual Control
Diclophenac
Sodium
Dilantin
Sodium
Figure 6.8: Stock Level Indicators
B10-100 B12-100
B10-150 B12-150
•Transparent / no cover
•Stock level indicatorsSUPERSEITON
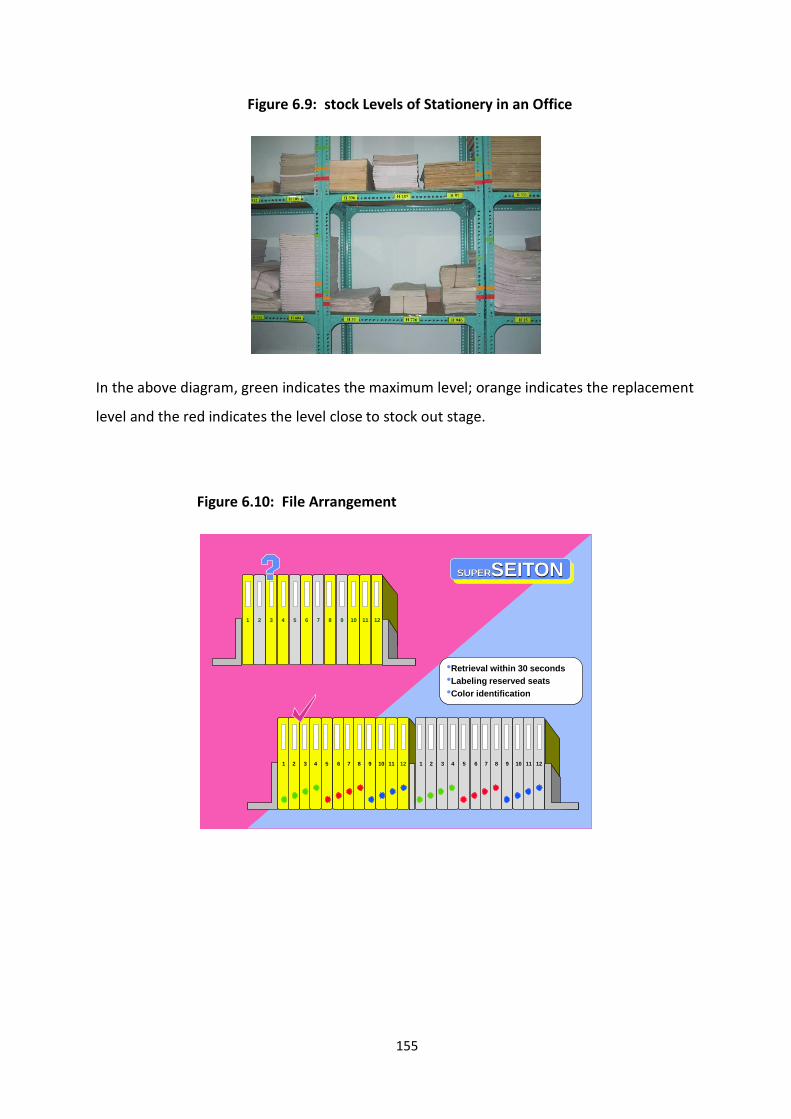
155
Figure 6.9: stock Levels of Stationery in an Office
In the above diagram, green indicates the maximum level; orange indicates the replacement
level and the red indicates the level close to stock out stage.
Figure 6.10: File Arrangement
•Retrieval within 30 seconds
•Labeling reserved seats
•Color identification
1 2 3 4 5 6 7 8 9 10 11 12 1 2 3 4 5 6 7 8 9 10 11 12
8 102 9 111 3 4 5 6 7 12
SUPERSEITON
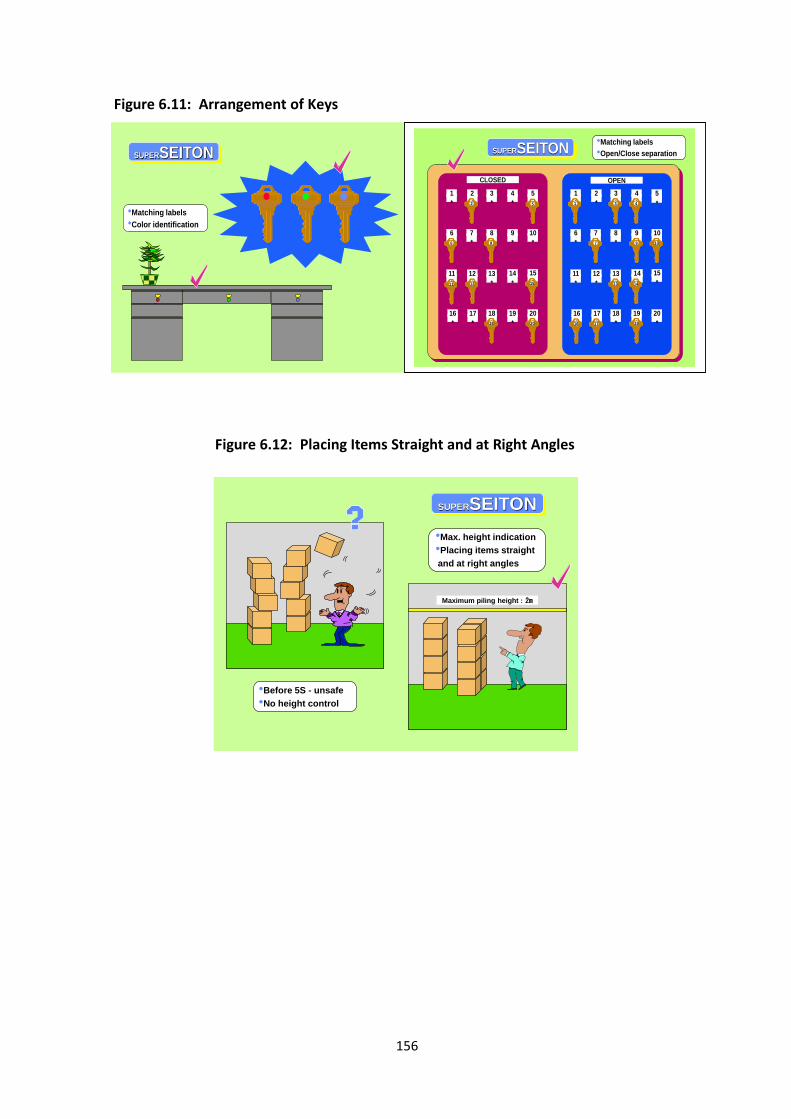
156
Figure 6.11: Arrangement of Keys
Figure 6.12: Placing Items Straight and at Right Angles
Maximum piling height:2m
•Max. height indication
•Placing items straight
and at right angles
•Before 5S - unsafe
•No height control
SUPERSEITON
•Matching labels
•Color identification
SUPERSEITON
•Matching labels
•Open/Close separationSUPERSEITON
*
3
*
2
*
1
*
5
*
4
*
8
*
7
*
6
*
10
*
9
*
13
*
12
*
11
*
15
*
14
*
18
*
17
*
16
*
20
*
19
11 1512
2 5
86
18 20
*
3
*
2
*
1
*
5
*
4
*
8
*
7
*
6
*
10
*
9
*
13
*
12
*
11
*
15
*
14
*
18
*
17
*
16
*
20
*
19
13 14
31 4
7 109
1716 19
CLOSED OPEN

157
Figure 6.13: Colour Identification and Clear Ground Surfaces
COLD HOTCOLD HOT
•Hanging hoses on hooks
•Color identification
•Clear ground surfaces
SUPERSEITON
Figure 6.14: Arrangement of Tools
Various Cleaning Tools

158
6.6 SEISO – S3 (Shine – Cleaning with Meaning and Beautifying)
SEISO means cleaning up one’s workplace completely, so that there is no dust on floors,
machines or equipment. ‘It means eliminating trash and foreign matter for creating a
cleaner work place. It also means using cleaning as a form of inspection and correcting the
defects’.
Cleaning means more than just keeping things clean. It is more a state of mind and a
commitment to be responsible for all aspects of the things you use and to ensure that they
are kept in a tidy condition.
Cleaning is to be seen as a form of inspection. As you clean an item, it is likely that the
defects of the item will become visible, e.g. when you clean a machine with a leakage of oil,
you may notice the place from where the leakage is occurring. Similarly, when you clean a
tool, the places where it has been cracked will become visible. Apart from this, you will also
notice which housekeeping problems are causing quality defects in the services provided to
the patients.
Implementation of SEISO – S3
Conduct thorough cleaning of everything using the following approach.
Importance of SEITON – S2
It creates neatness for
o Efficiency (e.g. quick retrieval of items)
o Quality (e.g. protection of materials)
o Safety (e.g. protection against falls and slips)
It eliminates the need for searching

159
Assign Individual cleaning responsibilities – The responsibility of cleaning of each and
every item in a unit/ward is assigned to a particular person. This responsibility can
be interchanged once in three months; for example, cleaning of trolleys,
wheelchairs, drug cupboards, toilets etc. It means that the responsible person
coordinates or sees whether the cleaning is carried out successfully.
Figure 7.15: Cleaning Checklist and Assigning Responsibility
Item Responsible Person Time I II III IV
Wheel chair
Trolley
Fernando
Perera
Sat. 3.00pm
Sun 10.00am
x
x
August 2013
Figure 6.16: Display of a Cleaning Checklist

160
Make cleaning and inspection easier – Use of cleaning checklists makes the cleaning
and inspection much easier.
Clean the places where most of the people do not notice – Cleanliness is the first
step towards ‘Total Quality Management’. Hence, the backyard should be given the
same importance as the entrance of the hospital.
Figure 6.17: Cleaning Map
Figure 6.18: Cleanliness is the First Step towards Total Quality Management

161
Figure 6.19: Clean where People do not Notice
Figure 6.20: Healing Environment
Cleaning inspections and correcting minor problems – During the cleaning process,
minor problems of instruments, wheel chairs, trolleys etc., can be identified and
corrected. For example, when cleaning the trolleys and wheelchairs, grease can be
applied to the wheels which will favor a longer life for the wheels. This will also help
to reduce the noise arising from those wheels.

162
Figure 6.21: Correction of Minor Problems as a Team
Regular sparkling cleaning campaigns – It should be remembered that regular
sparkling cleaning campaigns with the participation of the entire team in the
unit/ward are essential to maintain the cleanliness of that unit/ward.
The success of implementing S3 (SEISO) can be assessed through the measurement of the
degree of cleanliness. A healthcare organization can develop a formula for measuring this
depending upon the type of the unit. For example, Operating Theatre, Intensive Care Units
(ICUs), Labour Rooms and Special Care Baby Units (SCBU) etc, should be given the top
priority with regard to cleanliness. The aim should be to achieve zero grime or zero dirt, etc.
Another way of measuring is through internal auditing and allocating a rating on the audit
observations. ‘After-S3 (SEISO) photographs can further motivate people towards 5S
movement and in sustaining the gains.
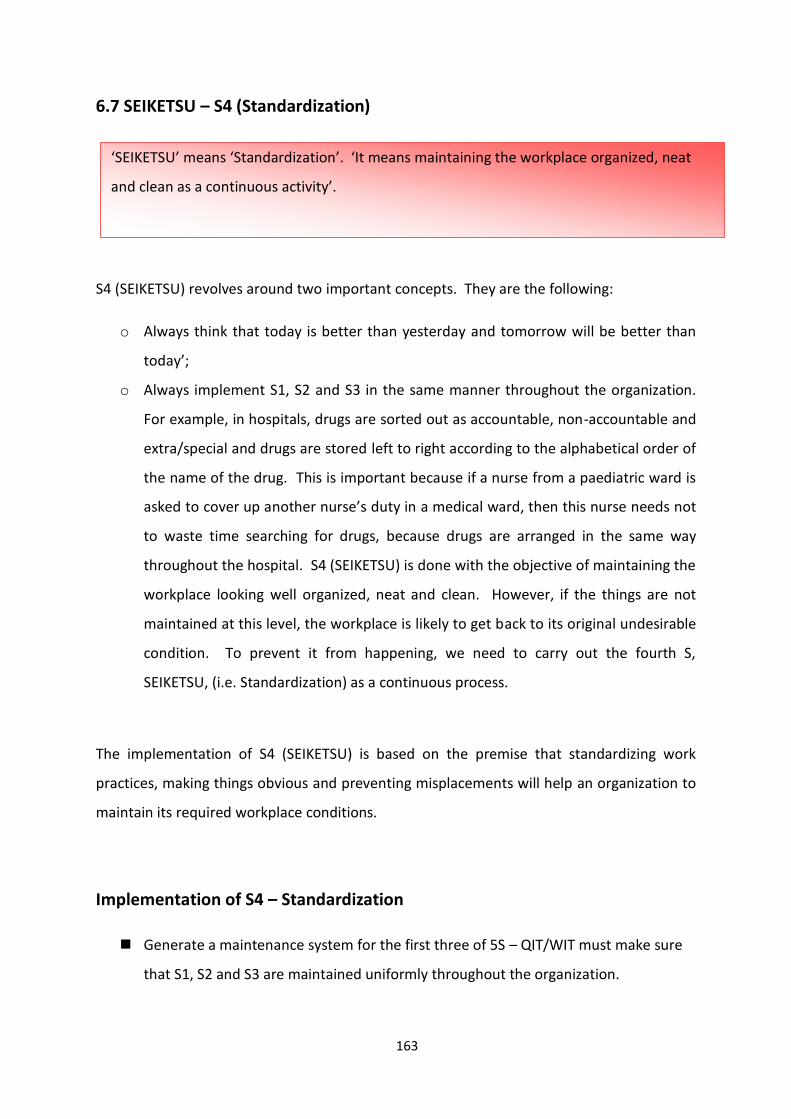
163
6.7 SEIKETSU – S4 (Standardization)
S4 (SEIKETSU) revolves around two important concepts. They are the following:
o Always think that today is better than yesterday and tomorrow will be better than
today’;
o Always implement S1, S2 and S3 in the same manner throughout the organization.
For example, in hospitals, drugs are sorted out as accountable, non-accountable and
extra/special and drugs are stored left to right according to the alphabetical order of
the name of the drug. This is important because if a nurse from a paediatric ward is
asked to cover up another nurse’s duty in a medical ward, then this nurse needs not
to waste time searching for drugs, because drugs are arranged in the same way
throughout the hospital. S4 (SEIKETSU) is done with the objective of maintaining the
workplace looking well organized, neat and clean. However, if the things are not
maintained at this level, the workplace is likely to get back to its original undesirable
condition. To prevent it from happening, we need to carry out the fourth S,
SEIKETSU, (i.e. Standardization) as a continuous process.
The implementation of S4 (SEIKETSU) is based on the premise that standardizing work
practices, making things obvious and preventing misplacements will help an organization to
maintain its required workplace conditions.
Implementation of S4 – Standardization
Generate a maintenance system for the first three of 5S – QIT/WIT must make sure
that S1, S2 and S3 are maintained uniformly throughout the organization.
‘SEIKETSU’ means ‘Standardization’. ‘It means maintaining the workplace organized, neat
and clean as a continuous activity’.

164
Develop procedures, schedules, practices and work instructions. This is to make sure
that all the activities are performed in the same way. Operating instructions of all
equipments must be displayed near the relevant equipment.
Figure 7.22: Work Instructions of a Blood Pressure Apparatus
Continue to assess the need and the disposal of unusable items
Regularly audit using checklists and measures of housekeeping – For this sorting (red
tagging) frequency or schedules should be maintained and sorting must be
performed strictly according to the schedule.
Real challenge is to keep it clean – When the 5S programme is started, the real crisis
arises with regard to the maintenance of cleanliness throughout the day.
Transparency (e.g. glass covers for see through) – Transparency makes disorderliness
apparent. Make the lockers, shelves and covers etc transparent or provide
inspection windows in metal panels. By doing this, the possibilities of keeping things
under the carpet can be avoided. People are motivated to maintain the orderliness
them properly otherwise, the eyesores will be visible to everyone.

165
Figure 6.23: Transparency in Hospital Stores
Straight line & right angle arrangements – when placing notices, arranging the
furniture etc., follow X-Y axis principle. Nothing should be arranged in an oblique
manner.
Figure 6.24: Straight Line & Right Angle Arrangement
Visual and colour standardization – For keeping the workplace in the right condition
all the time, we need to be reminded as and when there is an abnormality. One such
system is colour standardization. The different colour codes of tags / labels can thus
be used to bring out their status clearly to everyone. The colour codes which are
applicable to a healthcare organization are shown below.
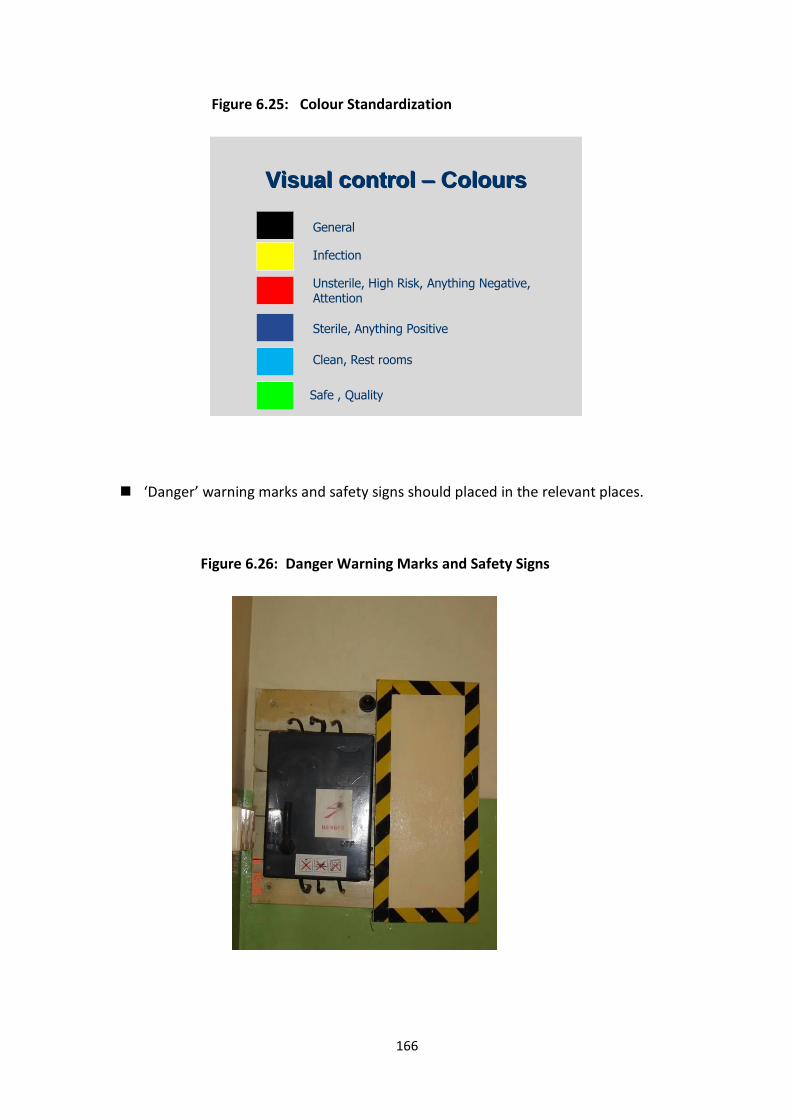
166
Figure 6.25: Colour Standardization
Visual control – Colours
General
Infection
Unsterile, High Risk, Anything Negative, Attention
Sterile, Anything Positive
Safe , Quality
Clean, Rest rooms
‘Danger’ warning marks and safety signs should placed in the relevant places.
Figure 6.26: Danger Warning Marks and Safety Signs

167
Fire extinguisher and ‘Exit’ signs and safety devices should be placed in relevant
places with appropriate symbols. Errors that can lead to accidents or product
defects can be highlighted in front of the operator with help of caution / danger
signs; e.g. safety alert for moving machinery parts, etc.
Figure 6.26: Fire Extinguisher and Safety Sign
Electrical switches should be labeled with the warning to keep switched off when not
required – This enables the use of electricity more efficiently.
Figure 6.27: Switch Labels
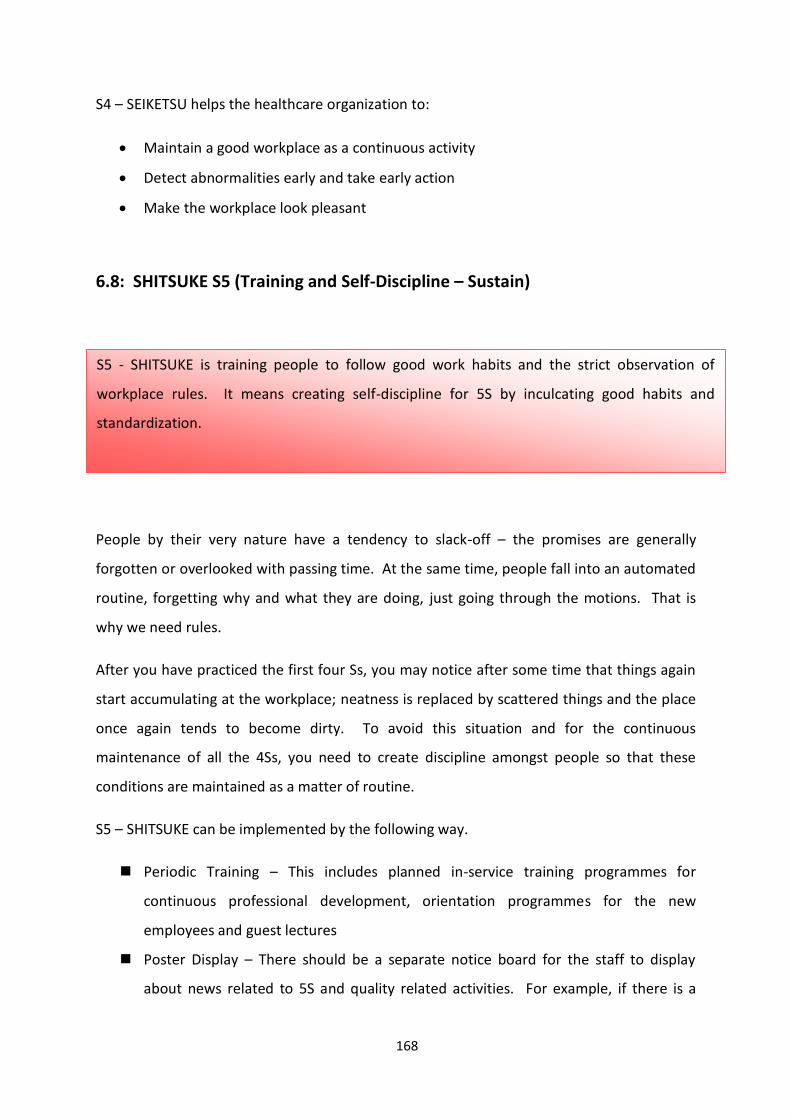
168
S4 – SEIKETSU helps the healthcare organization to:
Maintain a good workplace as a continuous activity
Detect abnormalities early and take early action
Make the workplace look pleasant
6.8: SHITSUKE S5 (Training and Self-Discipline – Sustain)
People by their very nature have a tendency to slack-off – the promises are generally
forgotten or overlooked with passing time. At the same time, people fall into an automated
routine, forgetting why and what they are doing, just going through the motions. That is
why we need rules.
After you have practiced the first four Ss, you may notice after some time that things again
start accumulating at the workplace; neatness is replaced by scattered things and the place
once again tends to become dirty. To avoid this situation and for the continuous
maintenance of all the 4Ss, you need to create discipline amongst people so that these
conditions are maintained as a matter of routine.
S5 – SHITSUKE can be implemented by the following way.
Periodic Training – This includes planned in-service training programmes for
continuous professional development, orientation programmes for the new
employees and guest lectures
Poster Display – There should be a separate notice board for the staff to display
about news related to 5S and quality related activities. For example, if there is a
S5 - SHITSUKE is training people to follow good work habits and the strict observation of
workplace rules. It means creating self-discipline for 5S by inculcating good habits and
standardization.
169
newspaper article on 5S, productivity or quality, it can be displayed in the notice
board.
5S Competitions – Organize unit-wise 5S competitions, leagues and tournaments
where different teams compete with each other for 5S results. A panel of judges
may evaluate the areas on pre-determined criteria on 5S and declare winners. Essay,
quiz and poster competitions can also be arranged among the staff.
On the Job Training – Another effective way of training is on the job. Invite a
resource person to guide the staff for further improvement.
Library – Self-learning is the best way of learning. Having a library for quality related
activities provides an opportunity for employees to gain knowledge on 5S,
productivity and quality concepts. If there is a library, a portion can be allocated for
5S, productivity and quality- related materials.
5S - SHITSUKE (Sustain / Self -Discipline) contributes to an organization in the following way.
Inoculates courtesy & good habits
Driving force behind all 5S
Make it a way of life
Part of health and safety
Involve the whole workforce
Develop and keep good habits
Although the application of 5S appears to be very simple, it may turn out to be difficult to
implement because it requires continuous discipline & commitment of the people involved.
5S is a very simple thing to understand but requires a lot of determination to implement.
The best way is to develop a structure and methodology for implementation that is best
suited to your organization and then stick to this methodology. The top management’s
support and participation is essential in bringing everyone into the 5S fold.
170
6.9 Implementation of 5S Programme in an Organization
5S is an organization-wide participatory program involving everyone in the organization. It
is not a programme of the Head of the Institution/unit. Managers, supervisors, operators
and all employees have to identify their roles in the 5S process and implement them in
totality. Only one level of people cannot do it alone.
It is recommended to start implementing 5S in a well chosen pilot unit or pilot process and
spread to the others step by step. From change management, we know when any change is
introduced to an organization, only a few (around 10% of staff) will support it. Likewise,
when 5S is introduced too, only a few will respond favourably. Therefore, it is essential to
identify those staff with positive attitudes and implement 5s in their units as a pilot.
Attitude has to be changed from correction to prevention. ‘Correction’ is putting things
right when problems arise (or when results are bad), whereas, ‘prevention’ means looking at
causes, controlling the processes, so that all the results are right.
5S programme is within the reach of organizations of any size: small, medium or large and
can be implemented in any type of organization such as those in the manufacturing sector
or the service sector; e.g. in a hospital or an office.
It is a well known that after implementing 5S, results are visible to everyone - insiders
(employees) and outsiders (Clients/customers/patients), within a short period of time.
Therefore, other employees who have been reluctant to implement 5S too will join this
programme. When the results are visible, the organization will get more and more support
form well wishers. These visible results enhance the generation of more and new ideas
among the staff. It should be remembered that 5S is a tool which promotes creativity
among employees and sky is the limit for creativity.
Four key factors to observe for successful 5S are:
1. Continued commitment and support by top management
2. 5S starts with education and training
3. There are no observers in 5S, everyone participates
4. Repeat the 5S cycle in order to achieve a higher standard

171
An organization which is implementing 5S successfully is always:
1. High in Productivity – Healthcare facilities and offices are store houses or waste.
Implementation of 5S can help eliminate following types of waste:
o Excessive amounts of in-process supplies and supplies held on central store
rooms
o Space waste for excessive storage
o Time waste searching for medication or equipments that are hard to find
o Motion waste, in side stepping poorly located equipments and supplies
2. Consistent in Quality – Clinical defects result from many causes, including using the
wrong medication and treating the wrong patient. Sort and Set in Order prevent
these types of errors. Furthermore, keeping equipments and the work environment
clean, reduces the amount of ‘walk time’ spent searching for missing supplies. These
and other effects of 5S implementation increase hours at the bedside and contribute
to fewer clinical defects.
3. Cost-effective – S3 – Healthcare organizations cannot make or save money without
providing quality care or having the trust of patients. The 5S provide a strong base
upon which quality and patient trust and, in turn, loyalty is built. Therefore,
healthcare facilities with a solid 5S foundation are more likely to become financially
stable.
4. Accurate in Delivery – In healthcare facilities which lack thorough implementation of
5S, deadlines whiz by and patients wait while the staff is busy engaged in various
activities such as, trying to remember what they did to the last patient, searching for
equipment and supplies, waiting for doctors to make rounds, waiting for laboratory
results…etc, the list goes on. It is difficult to keep patients from waiting in the face of
problems related to wasteful motion, too many errors and clinical/administrative
defects. When these problems are eliminated, processes become more reliable and
patients can be treated with less or no delay.

172
5. Safe for people to work in – Injuries to patients or staff can be expected when
equipment, medications and supplies are left in hallways and when supplies are
piled high in storage areas, or when work surfaces and equipment are covered with
dust and other contaminants.
6. High in Morale – 5S can significantly improve employee morale. Studies have shown
that healthcare providers who are more satisfied with their work environment are
less likely to seek employment elsewhere. Considering the cost, this can give a very
significant financial benefit (Jackson, 2009).
6.10 5S Tools
The tools of 5S shown below will give a good insight to implementing 5S.
1
ALIGNMENT
2
X-Y AXIS
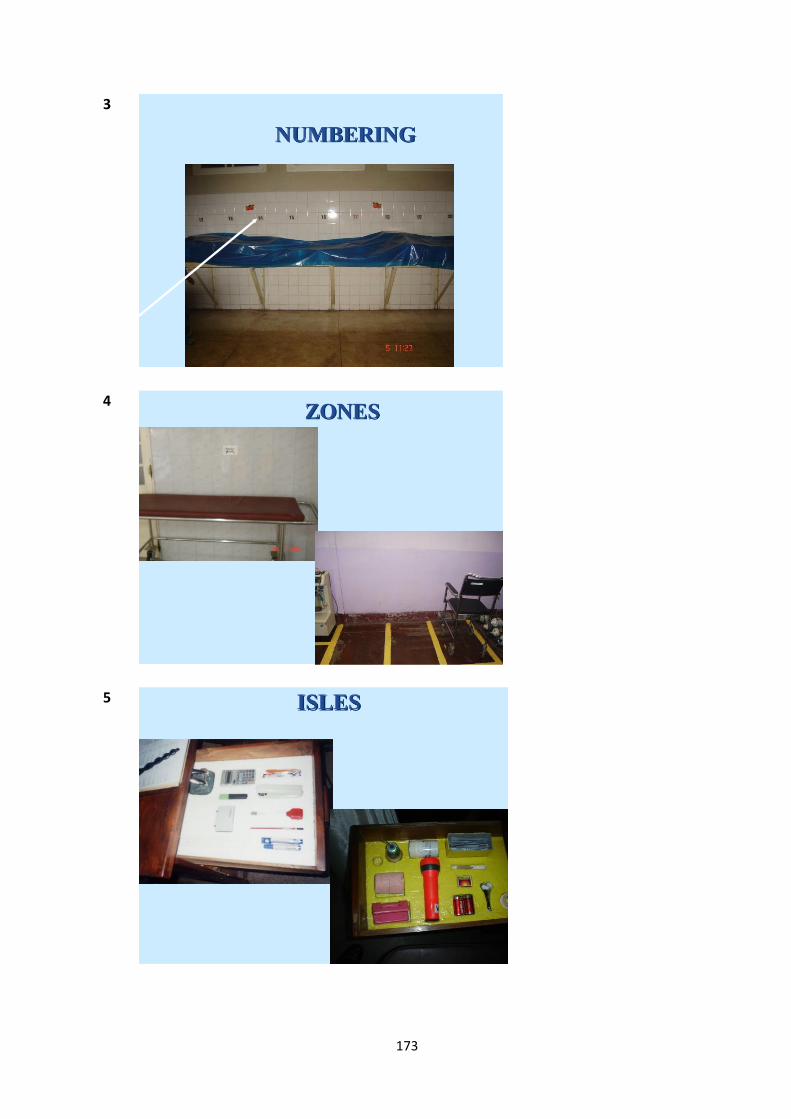
173
3
NUMBERING
4 ZONES
5 ISLES

174
6 VISUAL CONTROL
7 SAFETY SIGNS
8
SYMBOLS
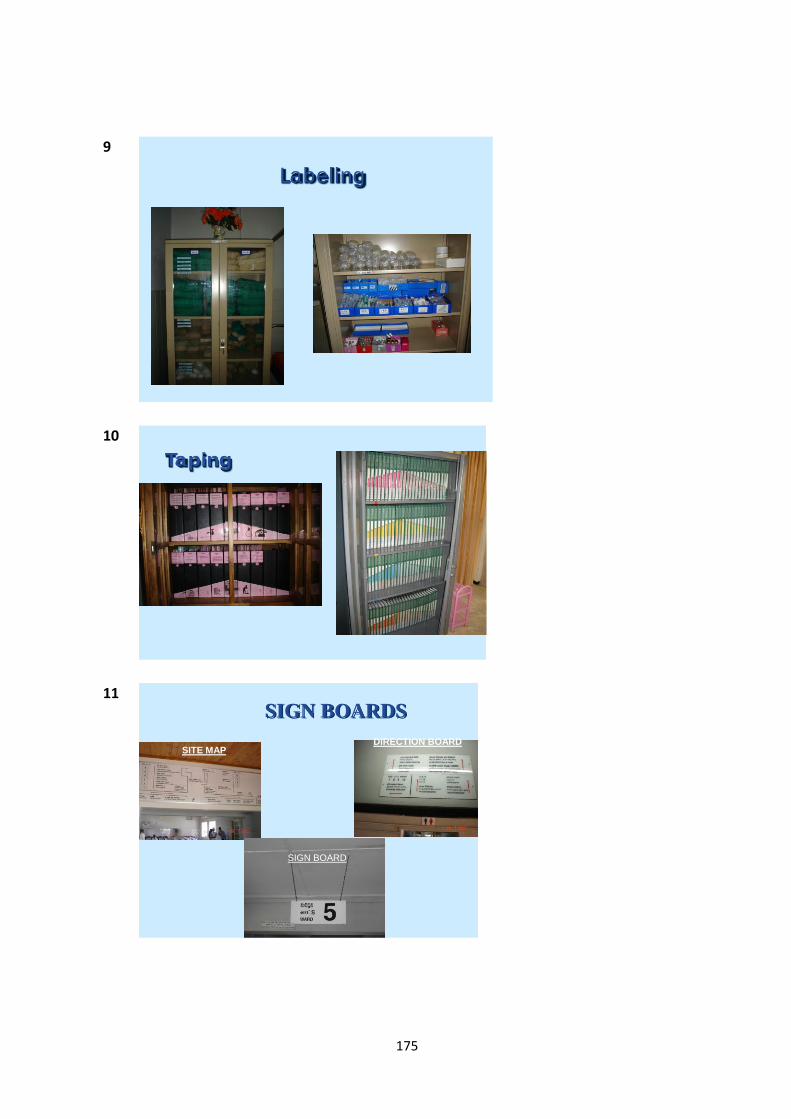
175
9
Labeling
10
Taping
11 SIGN BOARDS
SITE MAPDIRECTION BOARD
SIGN BOARD

176
12
STREET LINE ARRANGEMENT
13
RED TAG
14
CHECK LISTS

177
15
INSTRUCTION SHEETS
References
Jackson L Thomas, 5S for Healthcare, CRC Press, 2009
To implement 5S, what we need is
little knowledge,
little hard work,
little dedication, and
A very big positive attitude!

178
MODULE 02:
QUALITY IMPROVEMENT
TECHNIQUES
CHAPTER 07

179
TOPIC: KAIZEN IN HOSPITAL MANAGEMENT
Objective: To describe the concepts of Kaizen and Gemba Kaizen in healthcare
management
Total Amount of Time: 120 Minutes Number of Participants: 35 (Approx.)
Preparation: the trainer must be adequately prepared him/herself with suitable examples.
He must get ready to explain kaizen using photographs. If possible, he can
invite a sectional head to share his/her experience. Also refer the Curriculum
(Annexure II of Introduction Chapter)
Materials: Refer Curriculum (Annexure II of Introduction Chapter)
TRAINING OPENING
Engage Participants: (Ice-breaker/warm-up activity related to the topic)
Time: 05 Minutes
Engage participants by asking few questions on 5S lectures, especially on S4.
Introduce the Topic: One power-point slide showing the main areas that will be covered
Time: 10 Minutes
Motivate participants, show them why the topic is important and share objectives and the
agenda. Define Kaizen with healthcare based examples. Give a brief on the importance of
Kaizen in healthcare management.
SESSION PLAN - 07

180
TRAINING MIDDLE
Explain the Topic: Explain the topic in detail; demonstrate and discuss the concept,
practice and application of the topic
Time: 80 Minutes
Describe the elements of kaizen. Explain Gemba Kaizen. List out the different types with
suitable examples related to health sector. Also, the benefits of kaizen should be addressed.
Rules of implementing kaizen with a kaizen chart needs to be explained. Introduce the
concept and the application of PDCA cycle.
TRAINING WRAP-UP AND CLOSING
Summarize the Topic: Reconnect with the objectives; check for understanding and discuss
questions
Time: 20 Minutes
Check the understanding by showing photos. Ask questions.
Closing Comments: Acknowledge, motivate and inspire Time: 05 Minutes
Reinforce the importance of the topic; confirm that the time was well spent and thank
participants. Reinforce group respect and rapport.

181
QUICK CHECK FOR FACILITATOR/TRAINER (To be filled after every
session)
Reflects on how the training went on to develop training skills, to plan on future training
topics and to note potential next steps
Topic: Kaizen in Hospital Management Date: ________
Attendees:
___________________________________________________________________________
___________________________________________________________________________
___________________________________________________________________________
___________________________________________________________________________
Observations Made by the Trainer:
___________________________________________________________________________
___________________________________________________________________________
___________________________________________________________________________
___________________________________________________________________________
___________________________________________________________________________
___________________________________________________________________________
___________________________________________________________________________
___________________________________________________________________________

182
CHAPTER 07: KAIZEN IN HOSPITAL MANAGEMENT
7.1 Introduction
This chapter aims at convincing participants that any organization that wishes to improve
quality continuously should use kaizen as the most suitable management technique.
The approach to 5S described in the previous chapter relies more on the simple and
effective rules implemented for the maintenance of tidiness and housekeeping. 5S
deployment is the first step in continuous quality improvement process that merges into
Kaizen and progresses towards Total Quality Management (TQM) in an organization.
Although improvements under kaizen are small and incremental, the kaizen process brings
about dramatic results over time. The kaizen concept explains why western companies
cannot remain static for long in Japan. Western management, meanwhile, worships
innovation attributed to the latest management concepts or production/service techniques.
Innovation is dramatic, a real attention getter. Kaizen, on the other hand is often subtle and
undramatic. However, innovation is one-shot and its results are often problematic while the
kaizen process, based on common sense and low-cost approaches, assures incremental
progress that pays off in the long run. Kaizen is also a low-risk approach. Managers can
always go back to the old way without incurring large costs.
Most “uniquely Japanese” management practices such as, total quality control or
companywide quality control, quality circles, and styles of labour relations can be reduced
to one word: KAIZEN. Using the term ‘kaizen’ in place of such buzzwords as Productivity,
Total Quality Control (TQC), Zero Defects (ZD), Just-In-Time (JIT) and the suggestion systems
In Japanese, kaizen means continuous improvement. The word implies improvement that
involves everyone – both managers and workers – and entails relatively little expense. The
kaizen philosophy assumes that our way of life – be it our working life, social life or home life –
should be focused on continuous improvement efforts. Kaizen has contributed a lot to Japan’s
competitive success
183
paints a clearer picture of what has been going on in continuously quality improving
industries. Kaizen is an umbrella concept for all these practices (Imai, 2001).
7.2 Elements of Kaizen
The following are described as elements of KAIZEN:
Appreciate the process, not the result (always appreciate “human effort”);
Encourage ‘Team Work’ for problem solving and decision making (WIT – work
improvement teams);
Go search for the problem; do not let it come to you;
Identify and eliminate waste;
Deliver the best service possible. Make the workers aware of productivity and
quality; maintain a clean, orderly and safe working environment.
7.3 Kaizen and Suggestion Management
Kaizen allows us to build upon our routine work. Kaizen is meant to be a daily process
where many small improvements are implemented in an ongoing basis. Kaizen should not
be a bureaucratic process where ideas are generated only by managers or administrators. It
should be a process that engages employees in improvement cycles, allowing them to take
ownership of improving their processes. Employees should be encouraged to bring
suggestions directly to their co-workers or supervisors in a face-to-face manner as often as
possible.
Wherever an improvement idea comes from, it should be treated as a suggestion for an
experiment. Not every new idea will work out in practice, so a trial must take place in a
limited place (one unit or one room, rather than the whole hospital) and over a limited time
frame. During and after the trial period, all participants need to evaluate if the change really
has improved the system. If so, the change can be accepted as a new process. If not, the
team can go back to the old methods or continue looking for a new one.
Since the scientific method and the change process allow for a hypothesis (“this change will
improve the system”) to be proven incorrect, leaders must create an environment where

184
quick experimentation is encouraged. Rather than pondering over the problem forever and
trying to come up with the perfect solution on the first attempt, it is better to try something,
in a limited way to see if it works. Part of the approach is that the employees must not be
ashamed of making a suggestion that does not work as expected. It is something to be
learned from. The team can try different ideas, starting with rethinking about the problem
statement and going through the rest of the improvement cycle. On the other hand, this
environment of rapid experiment should not be considered as an excuse to try ideas that
are not well thought out but implemented just for the sake of trying something new.
General agreement on this approach often leads to specific questions about how we
actually implement kaizen:
How do we manage suggestions?
How do we evaluate ideas?
How do we keep continuous improvement from being uncontrolled or chaotic?
How do we get inputs from everybody and keep everybody informed, without being
too bureaucratic?
What if people change things they should not have changed? (Graban, 2009)
7.4 Kaizen Activity Chart
Kaizen activity chart is a tool used to implement suggestions by the employees of a unit.
This chart consists of the activities, the responsible person for each activity and also
indicates the progress of the activity. Each month the suggested activities are evaluated and
entered in the chart according to the pre-defined colour code as mentioned below:
Red – The activity is not started yet
Orange – The activity is in the early stage
Blue – 50 % of the activity has been completed
Green – The activity has been completed
At the bottom of the chart, the progress in each month is mentioned. A sample chart is
shown below

185
Figure 7.1: Kaizen Activity Chart
Serial
Number
Activity Responsible
Person
Indicator of the progress
(Draw Circles with Relevant Colours)
1
Preparing a clinical dashboard to
identify the critically ill patients
Date 21/05/2013 21/06/2013 21/07/2013 21/08/2013
2
Preparing the Emergency Drug tray with
check list
Date 21/05/2013 21/06/2013 21/07/2013 21/08/2013
3
Arranging the boxes for different sizes
of surgical gloves with stock levels
Date 21/06/2013 21/07/2013 21/08/2013
6
Date

186
Monthly Progress
Month No. of Activities
Suggested
No. of non
initiated
activities
No. of
activities
in early
stage
No. of
activities
where the
progress is
more than
50%
No of
activities
completed
Remarks
April 2013
May 2013
June 2013
July 2013
187
7.5 The Role of Supervisors in kaizen
Supervisors and managers should be appreciative of employees coming forward with
complaints or problems. Exposing and embracing problems instead of covering them up or
avoiding them is a positive step forward. When a complaint is brought to their attention,
such as “We are too busy between 8 am and 10 a.m.,” supervisors should challenge the
employees to come up with a solution or a suggestion. A simple, yet an effective question
to ask is, “What would you do to fix that?” The question should be asked in an open, honest
tone rather than in an accusatory tone that suggests there is no solution to be found.
Asking employees of what they think might catch some people by surprise, given common
pre-lean environments. Some supervisors find it threatening to not be the ones coming up
with answers all of the time. Supervisors and managers are not to be excluded from the
problem-solving process, but they are not the ones who must come up with all of the
answers. The front-line employees doing the actual work are more likely to have effective,
practical solutions.
In some cases, employees do not have the authority required to solve problems themselves.
For example, if a laboratory employee brings a complaint or a problem forward, saying
nurses in the Emergency Department (ED) are not properly labeling specimens, that is the
problem outside the employee’s control. In situations such as these, leaders must step
forward to take action on behalf of and in support of their employees. Leaders should play
the dual role of encouraging and empowering employees by challenging them to develop
their own solutions and also by stepping in to help them when needed, particularly with
value stream problems that cross department boundaries.
The surest way to stop the flow of ideas by employees is to respond negatively to them.
How many times is our initial reaction to an idea or suggestion one of the following?
‘That’s a dumb idea’
‘That won’t work’
‘We can’t do that’
‘We tried that before’

188
Supervisors have to go out of their way to be positive when suggestions or ideas are
presented. Even if the idea seems like a dumb one, supervisors should respond by asking
questions. Ask the employee to step back and state the problem. Do anything other than
saying ‘NO’. Since employees are not required to give suggestions, in a formal sense,
supervisors must treat suggestions like a gift. When presented with a seemingly
inappropriate suggestion, a manager should try to understand why the employee thinks that
it is a valuable suggestion and then use it as a developmental opportunity.
7.6 Gemba Kaizen
Gemba is a Japanese word meaning “real place” – now adapted in management terminology
to mean the “workplace” – or that place where value is added. In the manufacturing set up,
it usually refers to the shop floor.
Gembutsu the tangible objects found at Gemba such as work pieces, rejects, jigs, tools, and
machines.
Go to Gemba is the first principle of Gemba kaizen. This is a reminder that whenever an
abnormality occurs or whenever a manager wishes to know the current state of operations,
he or she should go to Gemba right away, since Gemba is the source of all information.
In many service sectors, Gemba is where the customers come into contact with the services
offered. In the hospital sector, for instance, Gemba is everywhere: in OPD, ward,
dispensary, operating theatre, laboratory etc. In the field of hotel management, it is in the
lobby, the dining room, guest rooms, the reception desk, the check-in counters, and the
concierge station. Most departments in these service companies have internal customers
with whom they have inter-departmental activity, which also represents Gemba.
MUDA, MURA and MURI
To start kaizen in Gemba, Muda offers a handy checklist and Mura and Muri offer a handy
reminder for this purpose.
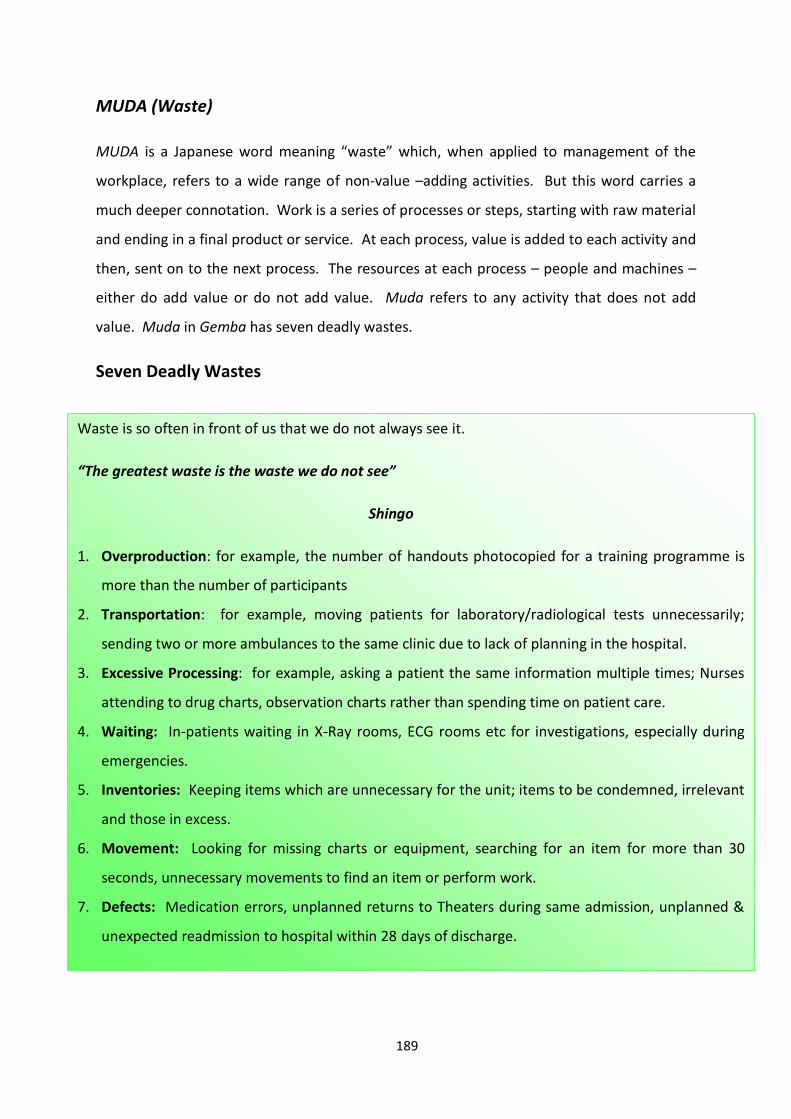
189
MUDA (Waste)
MUDA is a Japanese word meaning “waste” which, when applied to management of the
workplace, refers to a wide range of non-value –adding activities. But this word carries a
much deeper connotation. Work is a series of processes or steps, starting with raw material
and ending in a final product or service. At each process, value is added to each activity and
then, sent on to the next process. The resources at each process – people and machines –
either do add value or do not add value. Muda refers to any activity that does not add
value. Muda in Gemba has seven deadly wastes.
Seven Deadly Wastes
Waste is so often in front of us that we do not always see it.
“The greatest waste is the waste we do not see”
Shingo
1. Overproduction: for example, the number of handouts photocopied for a training programme is
more than the number of participants
2. Transportation: for example, moving patients for laboratory/radiological tests unnecessarily;
sending two or more ambulances to the same clinic due to lack of planning in the hospital.
3. Excessive Processing: for example, asking a patient the same information multiple times; Nurses
attending to drug charts, observation charts rather than spending time on patient care.
4. Waiting: In-patients waiting in X-Ray rooms, ECG rooms etc for investigations, especially during
emergencies.
5. Inventories: Keeping items which are unnecessary for the unit; items to be condemned, irrelevant
and those in excess.
6. Movement: Looking for missing charts or equipment, searching for an item for more than 30
seconds, unnecessary movements to find an item or perform work.
7. Defects: Medication errors, unplanned returns to Theaters during same admission, unplanned &
unexpected readmission to hospital within 28 days of discharge.
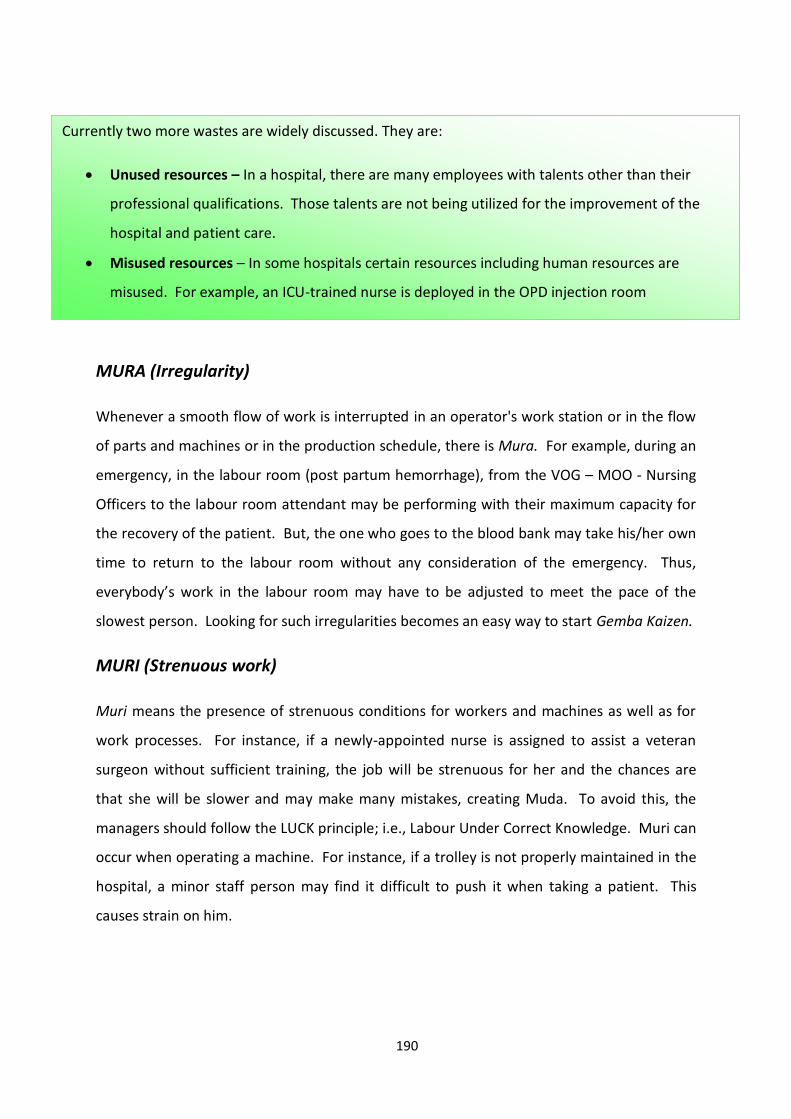
190
MURA (Irregularity)
Whenever a smooth flow of work is interrupted in an operator's work station or in the flow
of parts and machines or in the production schedule, there is Mura. For example, during an
emergency, in the labour room (post partum hemorrhage), from the VOG – MOO - Nursing
Officers to the labour room attendant may be performing with their maximum capacity for
the recovery of the patient. But, the one who goes to the blood bank may take his/her own
time to return to the labour room without any consideration of the emergency. Thus,
everybody’s work in the labour room may have to be adjusted to meet the pace of the
slowest person. Looking for such irregularities becomes an easy way to start Gemba Kaizen.
MURI (Strenuous work)
Muri means the presence of strenuous conditions for workers and machines as well as for
work processes. For instance, if a newly-appointed nurse is assigned to assist a veteran
surgeon without sufficient training, the job will be strenuous for her and the chances are
that she will be slower and may make many mistakes, creating Muda. To avoid this, the
managers should follow the LUCK principle; i.e., Labour Under Correct Knowledge. Muri can
occur when operating a machine. For instance, if a trolley is not properly maintained in the
hospital, a minor staff person may find it difficult to push it when taking a patient. This
causes strain on him.
Currently two more wastes are widely discussed. They are:
Unused resources – In a hospital, there are many employees with talents other than their
professional qualifications. Those talents are not being utilized for the improvement of the
hospital and patient care.
Misused resources – In some hospitals certain resources including human resources are
misused. For example, an ICU-trained nurse is deployed in the OPD injection room
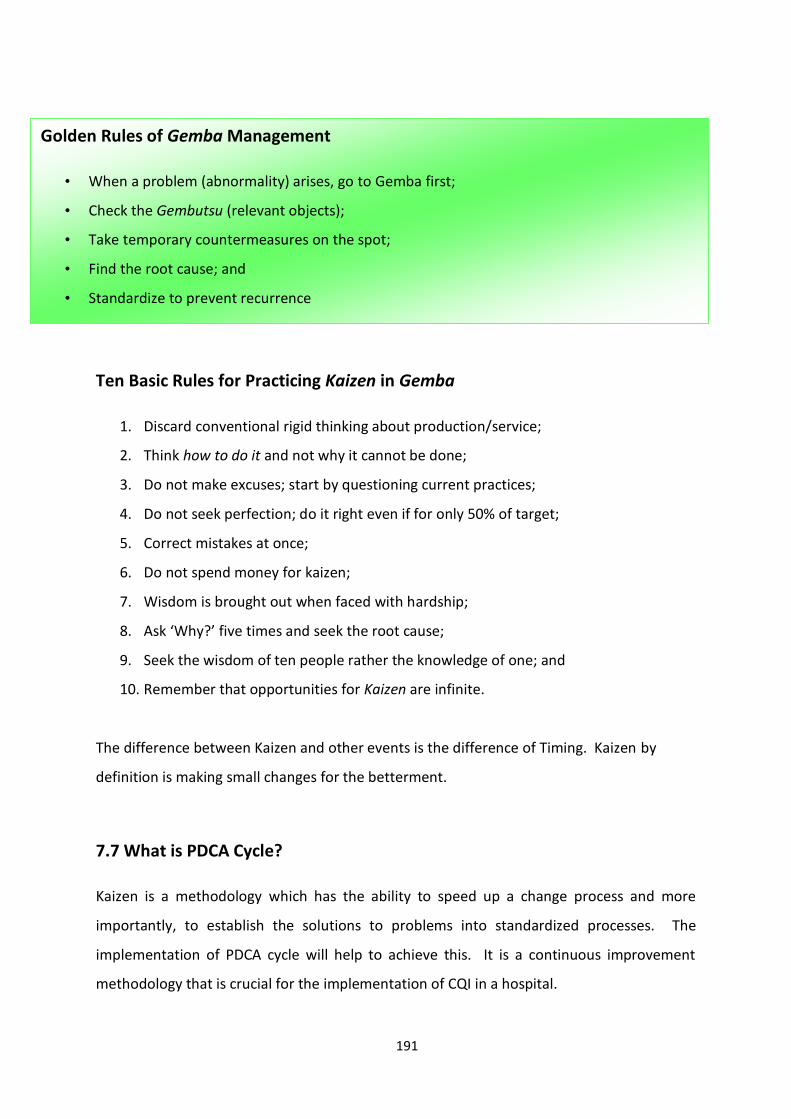
191
Ten Basic Rules for Practicing Kaizen in Gemba
1. Discard conventional rigid thinking about production/service;
2. Think how to do it and not why it cannot be done;
3. Do not make excuses; start by questioning current practices;
4. Do not seek perfection; do it right even if for only 50% of target;
5. Correct mistakes at once;
6. Do not spend money for kaizen;
7. Wisdom is brought out when faced with hardship;
8. Ask ‘Why?’ five times and seek the root cause;
9. Seek the wisdom of ten people rather the knowledge of one; and
10. Remember that opportunities for Kaizen are infinite.
The difference between Kaizen and other events is the difference of Timing. Kaizen by
definition is making small changes for the betterment.
7.7 What is PDCA Cycle?
Kaizen is a methodology which has the ability to speed up a change process and more
importantly, to establish the solutions to problems into standardized processes. The
implementation of PDCA cycle will help to achieve this. It is a continuous improvement
methodology that is crucial for the implementation of CQI in a hospital.
Golden Rules of Gemba Management
• When a problem (abnormality) arises, go to Gemba first;
• Check the Gembutsu (relevant objects);
• Take temporary countermeasures on the spot;
• Find the root cause; and
• Standardize to prevent recurrence
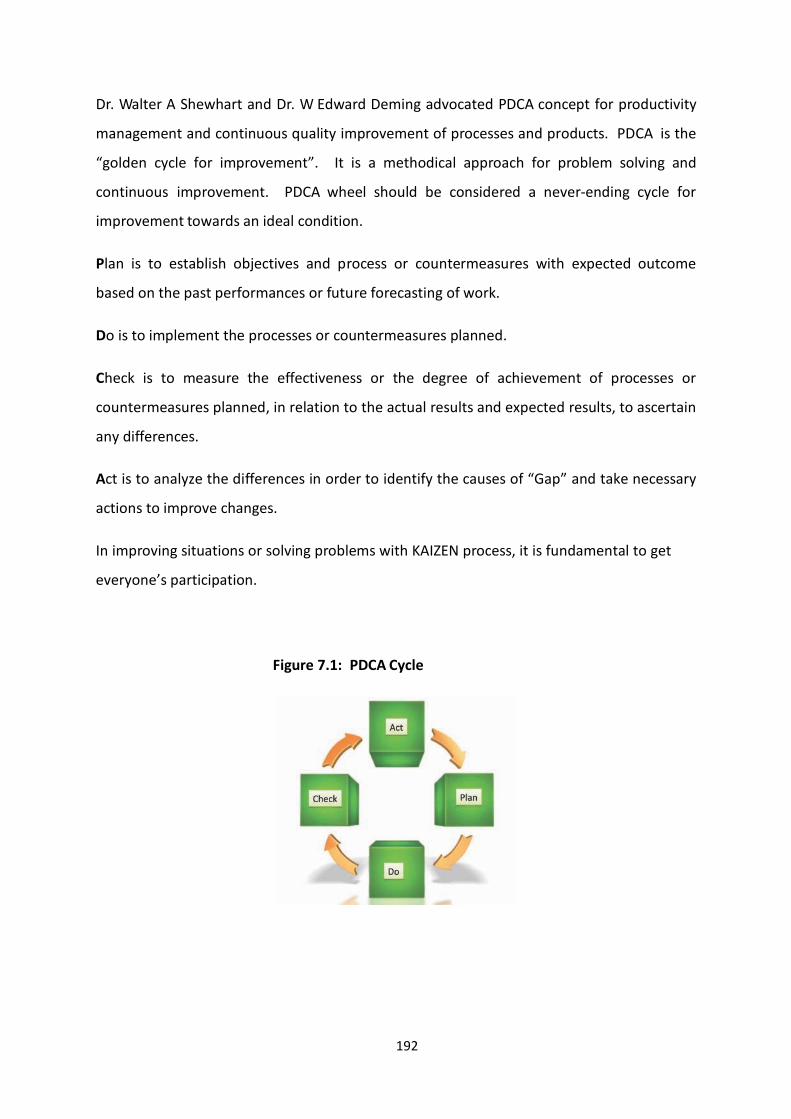
192
Dr. Walter A Shewhart and Dr. W Edward Deming advocated PDCA concept for productivity
management and continuous quality improvement of processes and products. PDCA is the
“golden cycle for improvement”. It is a methodical approach for problem solving and
continuous improvement. PDCA wheel should be considered a never-ending cycle for
improvement towards an ideal condition.
Plan is to establish objectives and process or countermeasures with expected outcome
based on the past performances or future forecasting of work.
Do is to implement the processes or countermeasures planned.
Check is to measure the effectiveness or the degree of achievement of processes or
countermeasures planned, in relation to the actual results and expected results, to ascertain
any differences.
Act is to analyze the differences in order to identify the causes of “Gap” and take necessary
actions to improve changes.
In improving situations or solving problems with KAIZEN process, it is fundamental to get
everyone’s participation.
Figure 7.1: PDCA Cycle
193
7.7.1 PDCA Cycle and Kaizen
PDCA cycle is the concept behind the KAIZEN approach. Look at how the PDCA cycle is
used in the KAIZEN approach. PDCA is rotated like the way described in the diagram.
During planning, there is 5W-1H which is needed to be clarified against the theme or the
topic as shown below:
Why are we undertaking the project?
What are we going to do? What data is required?
Who is responsible for each task? Who should be involved?
Where can we find relevant data and facts from?
When must a task be completed? When do we need to give feedback?
How must it be accomplished? How do we review?
Then, implement the plan and see the effectiveness and efficiency of those activities that are
performed. Then, activities that show good result should be standardized and adopted by
the routine practice. The activities that do not resolve problems should be discontinued and
it is necessary to plan for better activities for the improvement of the situation.
This matches exactly with the KAIZEN Process that will be explained in the next section.
However, PDCA cycle consists of four steps only and the cycle may be stopped at the step,
‘Act’ often. Kaizen aims to raise the standards of our workplace, productivity, quality and
safety in a continuous upward spiral through rotating PDCA cycle, reflecting on
achievements of KAIZEN and taking action to improve the way for next KAIZEN.
Plan - preparing how to implement KAIZEN - Clarifies the objectives and decides on the
control characteristics (control items) - Set measurable target - Decide on the methods to be
used to achieve the target.
Do - Implementing KAIZEN activities - Study and train in the method to be used - Utilize the
method - Collect the measurable data set up on the plan for decision-making.
Check - Reviewing the result of KAIZEN activities and achievements - Check whether the
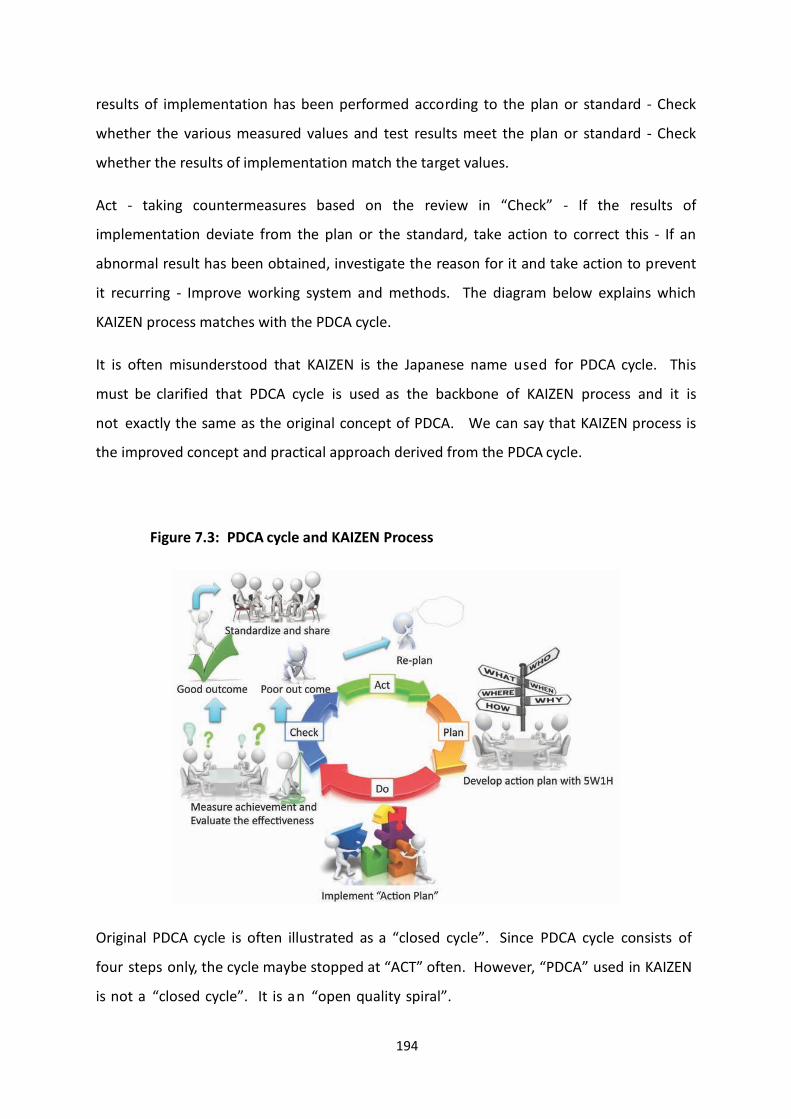
194
results of implementation has been performed according to the plan or standard - Check
whether the various measured values and test results meet the plan or standard - Check
whether the results of implementation match the target values.
Act - taking countermeasures based on the review in “Check” - If the results of
implementation deviate from the plan or the standard, take action to correct this - If an
abnormal result has been obtained, investigate the reason for it and take action to prevent
it recurring - Improve working system and methods. The diagram below explains which
KAIZEN process matches with the PDCA cycle.
It is often misunderstood that KAIZEN is the Japanese name used for PDCA cycle. This
must be clarified that PDCA cycle is used as the backbone of KAIZEN process and it is
not exactly the same as the original concept of PDCA. We can say that KAIZEN process is
the improved concept and practical approach derived from the PDCA cycle.
Figure 7.3: PDCA cycle and KAIZEN Process
Original PDCA cycle is often illustrated as a “closed cycle”. Since PDCA cycle consists of
four steps only, the cycle maybe stopped at “ACT” often. However, “PDCA” used in KAIZEN
is not a “closed cycle”. It is an “open quality spiral”.

195
Figure 7.4: “Open Quality Spiral” for Continuous Quality Improvement (CQI)
Figure 7.4: PDCA cycle and KAIZEN Process
In order to implement the above, a practical approach is to follow the following steps:
Define the problem (step 1)

196
Document the current situation (step 2)
Visualize the ideal situation by identifying the causes (step 3)
Define measurement targets (step 4)
Brainstorm solutions to the problem (step 5)
Develop Kaizen plan (step 6)
Implement the plan (step 7)
Measure, record and compare results to targets (step 8)
Prepare summary documents (step 9)
Create short term action plan, on-going standards and a sustaining plan (step 10)
The above should be undertaken on a routine basis by WITs in hospitals and supervised by
QMUs (Implementation Guidelines for 5S-KAIZEN-TQM Approaches in Tanzania, 2013).
7.8 Conclusion
For any organization that wishes to improve quality continuously, kaizen is the most suitable
management technique to apply. The manager should visit the Gemba, the real work place,
to find waste and eliminate Muda, Mura and Muri to gain dramatic results over time using
PDCA cycle. This has been proven in many manufacturing and service sectors.
References:
Graban Mark, Lean Hospitals, CRC Press, 2009
Imai Masaaki, Gemba Kaizen, A commonsense, low-cost approach to management,
2001, Mc-Graw – Hill International Edition
Implementation Guidelines for 5S-KAIZEN-TQM Approaches in Tanzania,
“Foundation of all Quality Improvement Programs”, Ministry of Health and Social
Welfare, Tanzania, Health Quality Assurance Division, March 2013, ISBN No.
978-9987-737-04-8

197
MODULE 02:
QUALITY IMPROVEMENT
TECHNIQUES
CHAPTER 08
198
TOPIC: WORK IMPROVEMENT TEAMS (WIT)
Objective: To provide learning opportunities for participants to:
Improve their understanding of the nature, objectives and the role of WIT s;
Understand the role of WIT members, leaders, facilitators, monitoring and steering
teams and how these operate to improve quality of services
Total Amount of Time: 90 Minutes Number of Participants: 35 (Approx.)
Preparation: The trainer must be adequately prepared himself with suitable
examples. If possible he can invite a sectional head to share his/her
WIT experience and show the minutes of WITs meetings. Also, refer
the Curriculum (Annexure II of Introduction Chapter).
Materials: Refer Curriculum (Annexure II of Introduction Chapter).
TRAINING OPENING
Engage Participants: (Ice-breaker/warm-up activity related to the topic)
Time: 05 Minutes
Engage participants by discussing the importance of team work.
Introduce the Topic: One power-point slide showing the main areas that will be covered
Time: 10 Minutes
Motivate participants, show them why the topic is important and share objectives and the
agenda. Explain what a WIT is and its importance.
SESSION PLAN - 08

199
TRAINING MIDDLE
Explain the Topic: Explain the purpose, role and operations of WIT s. The functions of
the members of WIT s, of the leaders and facilitators of the WIT s,
monitoring team and steering team should be explained.
Time: 60 Minutes
TRAINING WRAP-UP AND CLOSING
Summarize the Topic: Reconnect with the objectives; check for understanding and discuss
questions. Allow participants to ask questions of WIT s.
Time: 10 Minutes
Closing Comments: Acknowledge, motivate and inspire Time: 05 Minutes
Acknowledge the participants and underline the importance of WIT s.

200
QUICK CHECK FOR FACILITATOR/TRAINER (To be filled after every
session)
Reflects on how the training went on to develop training skills, to plan on future training
topics and to note potential next steps
Topic: Work Improvement Teams Date: ________
Attendees:
___________________________________________________________________________
___________________________________________________________________________
___________________________________________________________________________
___________________________________________________________________________
Observations Made by the Trainer:
___________________________________________________________________________
___________________________________________________________________________
___________________________________________________________________________
___________________________________________________________________________
___________________________________________________________________________
___________________________________________________________________________
___________________________________________________________________________
___________________________________________________________________________

201
CHAPTER 08: WORK IMPROVEMENT TEAMS
8.1 Introduction
A Kaizen strategy includes small-group activities – informal, voluntary groups intra-
organizational, organized to carry out specific tasks in a unit environment. The most
popular type of small-group activity is Work Improvement Teams (WITs). The term ‘Work
Improvement’ is a synonym of Quality Circles. In a healthcare setting, the word WIT is
commonly used. WIT is designed to address not only quality issues but also such issues as
cost, safety and productivity; and may be regarded as a collection of group-oriented Kaizen
activities. WITs have played an important part in improving service quality and productivity
in Japan. Management plays a leading role in realizing quality – in ways that include
building quality assurance systems, providing employee training, establishing and deploying
policies and building up cross-functional systems for quality, cost, and delivery. Successful
WIT activities indicate that management plays an invisible but vital role in supporting such
activities.
Dos and Don’ts for WIT:
Some themes that may be studied by WIT are Housekeeping, Accident & Sickness
prevention/Safety, Cost reduction/minimization, Service quality improvement, Work
simplification/Method improvement, Energy Conservation, Preventive maintenance,
Customer Relations and Teambuilding. Themes that are outside of their purview and should
not be undertaken for study include, Ministry rules of employment, collective labour
agreements with the union, personal grievances, budget planning and allocation and
financial matters.
Work Improvement Teams (WITs) are essentially made for employee-based small group
activities. A WIT comprises a group of between 3-15 members belonging to the same work
unit (e.g. the OPD members) who meet regularly to identify, analyze and solve problems
and improve outputs of their work unit. They also take the initiative to introduce /
implement improvement measures or recommend them to management.

202
8.2 Objectives of Work Improvement Teams (WIT)
The objectives of Work Improvement Teams are:
Improving Performance
o Improving quality of service
o Improving productivity
Motivation
o Making work more meaningful, thus increasing job satisfaction of the
workers
o Providing challenges to enhance creativity among staff
o Having open and effective communication by providing each member of the
WIT the opportunity to speak and contribute their suggestions openly.
o Developing more positive attitudes by continuous training and reminding the
objectives of the organization are important factors which contribute
towards positive thinking of employees.
Improving the Quality of Work Life (QWL)
o Job satisfaction – Participation in WIT has an influence on job satisfaction of
employees.
o Working environment – WIT meetings provide an opportunity to understand
the problems faced by the other employees especially, minor staff. Thus,
WIT becomes a platform to improve the work environment of staff and thus
improving their QWL.
o Teamwork and human relations – WIT is a foundation in a unit to create
teamwork among the members of the unit. Also, it must be understood that
hospital is an organization where all the units and health personnel are inter
203
related and inter dependent. Therefore, developing human relations is a vital
component to improve quality of healthcare. WIT provides an environment
to develop human relations.
8.3 Quality Improvement Areas
Work Improvement Teams (WIT) seek to effect quality improvements in the following areas:
Service to the customer/public - In a hospital setting, Medical Officers, Nurses and
Minor Staff are those who have direct contacts and are closely associated with
patients. Therefore, their inputs regarding patient-needs and expectations are
important. By providing an opportunity for these front line staff to actively
participate in WITs, the management will be able to recognize the patients’ needs
and expectations.
Inputs, outputs - WIT meetings will provide opportunities to use minimum inputs
more efficiently to obtain maximum useful outputs. Hence, WIT is important to
reduce cost.
Use of resources - Efficient use of resources including human and physical can be
practically discussed in WIT meetings.
Procedures, workflow, systems and methods – Another vital aspect of quality
improvement is improving procedures, workflow, systems and methods. The inputs
from those who are involved directly in each and every activity will provide useful
suggestions to improve the procedures, workflow, systems and methods.
Workload management – Another important area addressed by the WIT is workload
management. If all the staff can openly discuss their workload, the WIT can find
solutions for those who have increased workload. This can be done by sharing of
work.

204
Coordination – Since all the activities in a hospital setting are inter-related and inter
dependent, better coordination among these activities is important. WIT will be a
platform for this better coordination.
Safety – Teamwork is essential to patient safety. Patient safety is discussed in detail
in another chapter.
Efficiency and effectiveness - Efficiency basically deals with reducing the waste and
effectiveness with goal attainment. To achieve both of these, teamwork is essential
which is crafted by the WIT.
Skills and knowledge – WIT is a means to identify the hidden talents of the staff. This
is important for creative thinking and creative work in the organizations. These
hidden talents of employees can be utilized to reduce the cost and achievement of
objectives of that particular unit.
8.4 Role of the Leader of WIT
The success of a WIT depends on the leader of that WIT. The leader:
Gets subordinates to join WIT activities – A leader of a WIT must encourage his/her
staff to participate in WIT meetings. Since participating in WIT is voluntary, the
leader should not execute any force to join or participate in WIT. If they are
forcefully joined, the true contribution cannot be expected.
Leads the WIT and involves team members in solving problems or bringing about
improvements to the team’s work.
Works closely with the facilitator in projects undertaken by WIT – Usually the officer-
in-charge of Quality Management Unit (QMU) will be the facilitator for the quality
related activities. Hence, the leader of the WIT should work closely with that Officer.
205
8.5 Role of Members of WITs
Attend meetings regularly – It is expected that the members of WIT should attend
meetings regularly. The WIT meeting in each unit should be scheduled in advance,
so that most of the members can attend the meeting. For example, in a ward, the
WIT meeting can be arranged at 12.30 pm, so that the nurses who are off at 1.00 pm
and also those who are coming for the 1.00 pm shift can attend by coming a little
early. It will also be convenient for the consultants and Medical Officers who can by
then complete their patient care activities and join the meeting. The minor staff too
without any hindrance joins the meeting. Since it is visiting hours, it gives a positive
feedback on teamwork by the ward staff to the patients and their visitors.
Share and contribute ideas, efforts and time to help and improve the team’s
effectiveness – Everybody should contribute in the WIT meeting. A small suggestion
can have a big impact on the improvement of a ward activity.
Cooperate with and help the team leader and others – It is necessary to cooperate
with and help the leader and other members of the WIT; the members can in return
benefit.
Participate in problem-solving activities of the group – It is essential to participate in
problem-solving activities by using problem solving tools such as why-why diagram,
fish-bone diagram which is explained elsewhere in this book.
Effect improvements arising from projects carried out by the team – The WIT can
carry out several projects. A WIT member may not be a member of that particular
project. Still, if that WIT member thinks that there can be improvements made in a
particular project, he should communicate his suggestions to the project team.

206
8.6 Role of the Quality Improvement Team (QIT)
Quality Improvement Team is the steering committee for the quality improvement
programme of an organization. It consists of 7 to 9 members of all main categories of staff
such as Medical Officer, Nurse and Professions Supplementary to Medicine, Paramedics and
Overseer. The QIT is established to make sure that the quality improvement programme is
not dependent on one person. If the quality programme is dependent on one person, when
that person leaves the organization, the entire quality programme suffers. To overcome
this, the QIT has to function as a steering committee for the quality improvement
programme. QIT reports to the Head of the Institution on a regular basis and works under
the instructions of the Head of the Institution.
The Quality Improvement Team:
Sets overall goals and objectives for WITs – Goals and objectives of each unit/WIT
should be set in such a way to achieve the vision of the organization. There cannot
be more than one vision in an organization. Therefore, QIT should assist to set goals
and objectives to each and every WIT.
Sets policies and procedures for WITs operations – The functions of WITs in a
healthcare organization should be standardized. It assures that all the WITs in an
organization function in a similar way throughout. It promotes WITs activities – QIT
plays an important role by promoting WITs activities. A QIT must appreciate those
WITs which are performing well rather than blaming the WITs those are not
performing well.
Selects and appoints facilitators for WITs– Each and every WIT should have a
facilitator who will be the coordinator acting with the QIT and Quality Management
Unit of the healthcare organization. This facilitator has to be appointed by the QIT.
Usually the leader of the WIT will function as the facilitator.
Evaluates and rewards WITs activities – Another vital function of the QIT is
evaluating the functions of WITs. When selecting the best unit of a healthcare
organization, the functions of the WIT also can be considered. Competitions among
the WITs can be organized and the best performing WITs can be awarded. It should

207
be remembered that the criteria for selecting the best WIT should be communicated
to all WITs well in advance.
Allocates resources for WITs operation – To perform certain suggestion of WIT, they
need resources. QIT should negotiate with the Head of the institution and the
Accountant to allocate funds.
Manages WITs programmes and takes corrective action wherever necessary –
Whenever a WIT deviates from its set norm, the QIT has to intercept and take
corrective action.
8.7 Role of the Facilitator
The Officer who is in-charge of Quality Management Unit (QMU) will function as the
facilitator of the quality improvement programme. His/her role with regard to WIT is listed
below.
Energizes and catalyses the formation of WITs by creating an environment for the
formation of WITs. Usually when a quality improvement programme is initiated, all
the units will not form WITs at once. The facilitator should support and provide
environment to form the WITs by all units.
Trains WIT leaders – Leadership and conducting meetings in a professional way is a
vital component of a successful WIT. Therefore, the facilitator should take necessary
steps to train the leaders of WITs. Training Need Analysis (TNA) will be useful for this
purpose.
Coaches and advices the leaders and members; e.g., remind the WIT to take into
account organizational and customer needs and helps the WIT to accept feedback
positively.
Acts as a link between the WITs and the Steering Committee – provides feedback to
both and coordinates with the management.

208
Registers WITs, monitors and reports activities of WITs to the Steering committee.
The facilitator should attend the WIT meetings if time permits. The facilitator should
go through the minutes of the WIT meetings to ensure that the facilitator is aware of
the functioning of the minutes and their needs.
8.8 Operation of the Work Improvement Team (WIT)
The basic operation of the Work Improvement Teams (WITs) is explained in the following
figure.
Figure
8.1:
Operati
ons of
the
Work
Improv
ement
Team
(WIT)
Step 1: Problem identification may be from the WIT members, management, staff or
technical experts. Typically, several problems are identified in a WIT meeting. Problem
analysis is performed by the WIT with assistance, if needed, by the appropriate technical
experts.
Step 1
Identify areas to
be improved
Step 2
Priorities and select areas
to be improved
Step 3
Collect, examine and
Analyze data
Step 4
Develop proposals
/ recommendations
Step 5Communicate
Recommendations to
management
Step 6
Implement
Step 7
Monitor and take
corrective action
209
Step 2: After analyzing the problems, the identified problems should be prioritized using a
brainstorming session with the WIT members. Accordingly, the areas to be improved have
to be identified with a time frame.
Step 3: The, collect necessary information regarding the problem; analyze the information
using problem solving tools such as Fish-bone diagram, Pareto analysis or Why-Why diagram
Step 4: After identifying the root causes of the problem, develop proposals and
recommendations. These proposals must be approved by the WIT members to make sure
that the WIT members support the proposals.
Step 5: When the proposal is ready, it should be presented to the top management through
the facilitator and QIT. This ensures that the proposals do not deviate from the strategic
plans of the organization. To implement the proposed activities, it is necessary to obtain
the blessings from the top management.
Step 6: After getting the approval from the top management, the proposals should be
implemented.
Step 7: During the implementation, the progress of the activity should be monitored using
KAIZEN activity chart (this is mentioned in chapter ‘Kaizen in Hospital Management). Any
deviation must be immediately corrected, if necessary, with the relevant technical staff.
Case Study
Quality Circle in Toyota
Quality circles are a vital part of Kaizen at Toyota. The American quality movement in
1980’s briefly tried out Quality Circles which were regarded as a tool for participative
management. The results were dismal. Hourly workers devoted much of the meeting to
creature comforts; for example, moving the drinking fountain. There were some projects
that improved quality and these widely publicized the company but they were few and far
between. Eventually, this “management fad” died out. It was one more good idea gone
badly. What was missing? Basically, all of the fundamentals of the Toyota way were

210
missing. Well-trained employees, the team leader role, well-trained group leaders guiding
the initiative, a culture of continuous improvement and tools of lean such as standardized
work were missing.
Management was taking a top –down culture with poorly trained employees, giving them
“micro-waved “problem –solving training and suddenly expecting miraculous projects
selected by the workers.
Quality Circles have never been a fad at Toyota. They have been an essential, ongoing
management tool for productivity and quality improvement for decades and are still
considered a sign of a highly evolved Toyota sites and are still developing.
Participation in Quality Circles is voluntary, but many people at Toyota choose to participate
because they want to take part in improving the work area. Quality Circles are a good
method to improve quality and make other improvements; and are also an excellent activity
to promote teamwork and develop the capabilities of individuals. Each member of the
circle is responsible for fulfilling each role on the team, such as taking minutes, keeping the
meeting on time or facilitating the meeting. A team leader usually leads the circle and looks
upon it as a development opportunity. The leader is responsible for establishing desired
outcomes with management, planning each meeting, clearly setting expectations for the
team and coordinating activities with others, such as engineering and maintenance.
The circle is responsible for setting goals and meeting schedules but the group leader acts in
an advisory capacity. The primary role of the group leader is to ensure that the circle is
addressing a meaningful issue (one that will improve the team or group) and the time is
spent wisely and productively. He or she will check in with the facilitator weekly for an
update and to provide any necessary support or guidance. The team is allotted one paid
hour (overtime pay) per week (each person) for meeting and any assignment activity. The
team may elect to meet before or after work; or in some cases, during a working lunch.
Most circles deal with issues in the work area; so many meetings are conducted at the
actual work site (Gemba).
At the completion of an activity, the circle group prepares a short presentation for
management, explaining the activity and the results. This presentation is primarily a

211
congratulatory opportunity for management to express gratitude to the team for their
efforts and work to improve the operation. Any suggestions implemented by the circle also
quality for a payment award in the suggestion system program (see below). In this case, the
members are paid for their time during the meetings and for the improvement ideas. Each
year, the best quality circle projects are selected for bronze, silver, gold and platinum
awards and make formal presentations to vice presidents of Toyota. The American Toyota
plants each select a platinum award winner to be present in Japan at Toyota’s International
Quality Circle Conference. At Georgetown in 2004, there were about 22 percent of
employees in voluntary circles, compared to a target in the 40 to 50 percent range.
Participation of over 80 percent is not uncommon in Japan. This is a good opportunity to
develop and use abilities and to be rewarded for the effort; not a bad deal at all.
Case Example - Work Activities Help People Gain Grater Personal Ability and Satisfaction
An employee at the Toyota plant in the Georgetown was very shy and did not like to speak
in front of others as is common in the culture. They had discussions daily, reported on
issues in the work area and often presented the results of Quality Circles and continuous
improvement teams to members of management. Being too afraid to speak in public, this
women preferred to stay away from these activities (most were voluntary). She was
interested in promotion potential but could not get past her fear.
She was finally persuaded to join a Quality Circle and when the time came for presentation,
she was terrified. Even though she had her notes, she went entirely blank but still managed
to make it through. With a little encouragement, she tried again and improved her
presentation skills over the years. She moved to another job and when we finally met again
she told us that she’d joined the Lions club and become the special events coordinator - a
position that required her to make a report of activities at each meeting! She was proud
that she’d been able to overcome her fear and participate in activities that interested her
outside of work (Liker & Meier, 2006).

212
Case Example – Work Improvement Team (WIT)
A feature of Kaizen activities observed at Inoue hospital – Japan is active WITs, which were
begun in 1983. This table shows how the number of WITs at the hospital has grown over
the years.
Year Number of WITs Number of Staff Involved
1983 10 127
1985 18 132
1990 23 282
1995 41 429
The main subject areas addressed by WITs, in the order of the number of projects are:
quality, efficiency, safety and cost. A total of 189 projects have been completed since the
first quality circle was organized.
Other topics addressed by the WITs of the hospital included the following:
Improvement of clinical diagnosis forms
Improvements of fail-safe switch for blood pump to catch abnormalities in dialysis
apparatus
Elimination of dosage mistakes
Reduction of waiting time for dialysis
Elimination of switching in the air-detection apparatus
Optimum inventory of drugs
Reduction of mistakes in serving special dietary meals
In order to evaluate the hospital’s effectiveness, management always works hard to collect
information from the following sources:
Patients’ claims
Patients’ remarks at the time of leaving hospital
Review by a third party
Countermeasures against an accident

213
Cases in which death was involved
Specific patients’ symptoms
“Hot mail” from patients to the hospital director
The hospital encourages its staff to experience medical treatment from the patient’s
perspective. In 1994, 16 nurses underwent haemodialysis; one administrative staff member
used a wheelchair; two secretaries tried laxatives and one clerk underwent an examination
by stomachic camera. The following remarks are from employees who underwent such
experiences in 1995:
Nurse A: “I underwent the experience of getting haemodialysis as a patient. I was
expecting the pain of having the needle in the vein but when I had to stretch my arm
for three and a half hours, the muscles around my shoulder and elbow ached badly
and this was the hardest part. As I couldn’t use my right arm, it was not easy to have
a cup of tea and lunch lying on the bed”.
Nurse B: “I am right –handed and as the needle was attached to my right hand, I
had to eat with my left hand. I was unable to eat the Chinese food and could only
eat rice dumplings and I was very hungry. I was anxious to know who would be
attending me as my nurse and hoped that it would be someone good at injecting the
needle painlessly. Normally, when I am acting as a nurse and I hear the patient say
something like that, I feel upset as I am always trying to do my best”.
Nurse C: “When I was lying down on the bed, I felt very uneasy. I suppose the
patient feels the same way. I was very relieved when the nurse came to me and
said, “Are you OK”? When you take off your white uniform and lie down on the bed,
you feel very feeble. From the bed, people standing by you look very tall and the
doctor looks really great! It’s a different feeling from what you get as a nurse.
Everyone looks great from the bed. So, I think we shouldn’t talk to them as if we are
looking down upon the patients”.

214
Nurse D: “It seems that some patients hesitate to call a nurse even if they know the
nurse well enough. It will be better if we can anticipate such needs and go to
patients’ beds without being called. I feel that they should not hesitate to call us but
think we should take the initiative of calling them”.
Administrative Staff Member: “I have experienced sitting in the wheelchair. I found
that the button on the side of the elevator was too high and inconvenient to push.
We never had such complaints from patients but when unattended, the patient will
have to ask someone else to help”.
In addition to gaining firsthand experience as patients, staff members are encouraged to
experience working in areas outside their usual jobs. This helps them to better understand
how business is conducted in other departments and assists them in building cross –
functional teamwork (Masaaki, 2001).
St. Francis of Assisi, one of the most venerated religious figures in history, said that:
“Start with what is important; then do what is possible; suddenly you realize that you will be
doing what you thought was impossible”.
This is because it is important to start with what is possible and be successful in the
undertaken projects. By being successful in a taken project, the confidence of the WIT as
well as other staff grows up. This encourages other non-members of WIT to join WIT. Also,
this motivates WIT members to perform well than earlier.
In the quality improvement programme we say that:
“Start with what is possible; then do what is important; suddenly you realize
that you will be doing what you thought was impossible”.

215
References:
Liker Jeffrey K, Meier David, The Toyota Way – Field Book, Tata McGraw-Hill Edition,
2006
Masaaki Imai, Gemba Kaizen, McGraw Hill International Edition, 2001
216
MODULE 02:
QUALITY IMPROVEMENT
TECHNIQUES
CHAPTER 09

217
TOPIC: QUALITY IMPROVEMENT TOOLS
Objective: To develop knowledge and skills in using five (5) selected Quality
Improvement Tools
Total Amount of Time: 150 Minutes Number of Participants: 35 (Approx.)
Preparation: The lecturer must develop few examples related to healthcare settings, to
explain each quality improvement tool. Also, refer the Curriculum (Annexure
II of Introduction Chapter)
Materials: Refer Curriculum (Annexure II of Introduction Chapter )
TRAINING OPENING
Engage Participants: (Ice-breaker/warm-up activity related to the topic)
Time: 05 Minutes
Relate the quality improvement tools to a cricket match. Ask participants, anyone who is
interested in playing cricket to come forward. Make a ball using a half sheet and throw it to
him. He may be able to catch it or else will drop it. If he catches, throw the same ball to
him so that he may drop the ball on the second instance. Then ask if a cricketer drops the
ball during a match, what the coach’s analysis will be. It was expected that the fielder must
catch the ball. Then tell participants that the coach would be analyzing the event using
various techniques to find out why the fielder dropped the ball. Similarly, when a problem
occurs in a healthcare institution, the management needs to analyze it using the quality
improvement tools and see what the root causes for the problem will be.
SESSION PLAN - 09

218
Introduce the Topic: One power-point slide showing the main areas that will be covered
Time: 10 Minutes
Motivate participants, show them why the topic is important and share objectives and the
agenda. Define Quality Improvement Tools and emphasize the importance of using those
tools in the improvement of the services.
TRAINING MIDDLE
Explain the Topic: Explain the topic in detail; demonstrate and discuss the concept,
practice and application of the topic
Time: 50 Minutes
Explain Fish-Bone diagram, Histogram, Pareto chart, Why – Why diagram and the Problem
Tree with examples.
Group Work Time: 45 Minutes
Form 4-5 groups. Ask each group to select one of the above tools and analyze a selected
problem. Make sure that each one of the above-mentioned tools has been taken up by at
least one group. It is desirable if the lecturer/facilitator allows the group to decide on the
tool in which they are going to work.
This exercise is carried out in order to make participants understand the Quality
Improvement Tools and not to solve problems in their institutions. Hence, they have the
liberty to select any problem they are willing to attend to. It may be a problem related to
their ward or may be one of their personal problems such as one of the participants being
unable to pass his exam or a common problem such as increase in Road Traffic Accidents
(RTA) in a particular area.

219
Presentation of the group work Time: 30 Minutes
Each group will be given eight minutes to present their work for discussion.
TRAINING WRAP-UP AND CLOSING
Summarize the Topic: Reconnect with the objectives; check for understanding and discuss
questions
Time: 05 Minutes
The lecturer should summarize the tools that have been discussed in the session.
Closing Comments: Time: 05 Minutes
Acknowledge, motivate and inspire participants to introduce Quality Improvement Tools to
their respective institutions.

220
QUICK CHECK FOR FACILITATOR/TRAINER (To be filled after every
session)
Reflects on how the training went on to develop training skills, to plan on future training
topics and to note potential next steps
Topic: Quality Improvement Tools Date: ________
Attendees:
___________________________________________________________________________
___________________________________________________________________________
___________________________________________________________________________
___________________________________________________________________________
Observations Made by the Trainer:
___________________________________________________________________________
___________________________________________________________________________
___________________________________________________________________________
___________________________________________________________________________
___________________________________________________________________________
___________________________________________________________________________
___________________________________________________________________________
___________________________________________________________________________

221
CHAPTER 09: QUALITY IMPROVEMENT TOOLS
9.1 Introduction
Health care providers deliver variety of services for their customers and get the feedback for
continuous quality improvement. In this context, the establishment of a sustainable,
organization-wide quality programme with the participation of all stakeholders is a major
concern. At the incipient stage, health managers have to assess the current situation of
health care provision and then, it is important to plan the desired improvements. This gap
may envisage different problematic situations and the tools described in this chapter will
help to identify the solutions which are more practical and applicable. Eventually, they will
find out how much the previous situation has been improved after the application of Quality
Improvement Tools. This is the basis of an evidence-based quality improvement
programme.
In order to prioritize and solve problems in any organization, several quality tools can be
used. It is necessary to educate and train the staff of the way to apply these tools in the
appropriate context.
There are several Quality Improvement tools used for evidence-based quality improvement.
Out of those tools, it is necessary to know about Basic seven (7) Quality Improvement Tools
and New Seven (7) Quality Improvement Tools that can be utilized for KAIZEN Process.
Those tools are as follows:
Basic 7 Quality Improvement Tools New 7 Quality Improvement Tools
1 Cause-and-effect (fishbone diagram) 1 Affinity Diagram
2 Check Sheet 2 Inter-relationship Diagram
3 Control charts: 3 Tree Diagram
4 Histogram 4 Prioritization Matrix
5 Pareto Chart 5 Matrix Diagram
6 Scatter diagram: 6 Process Decision Program Chart

222
7 Why-Why Diagram 7 Activity Network Diagram
In this Chapter, tools that are often used during KAIZEN process are explained in details.
The selected tools are Pareto Chart, Fish Bone Diagram, Histogram, Problem Tree and Why-
Why technique.
9.2 Pareto Chart
This principle was formally observed in 1906 by an Italian economist Vilfredo Pareto who
investigated on the pattern of distribution of wealth in his country and found that 20% of
people owned 80% of the total wealth of the country.
A Pareto chart is a type of chart that contains both bars and a line graph, where individual
values are represented in descending order by bars, and the line represents the cumulative
total.
The left vertical axis is the frequency of occurrence but it can alternatively represent cost or
another important unit of measure. The right vertical axis is the cumulative percentage of
the total number of occurrences - total cost or total of the particular unit of measure.
Because the reasons are in decreasing order, the cumulative function is indicated in a
concave line.
The purpose of the Pareto chart is to highlight the most important among a (typically large)
set of factors. In quality control, it often represents the most common sources of defects,
the highest occurring type of defect or the most frequent reasons for customer complaints,
and so on.
This is based on the Pareto principle which is also known as 80 – 20 rule. It highlights the
importance of vital few causes of any given problem. It means that anything few (20%) is vital
and many (80%) are trivial.
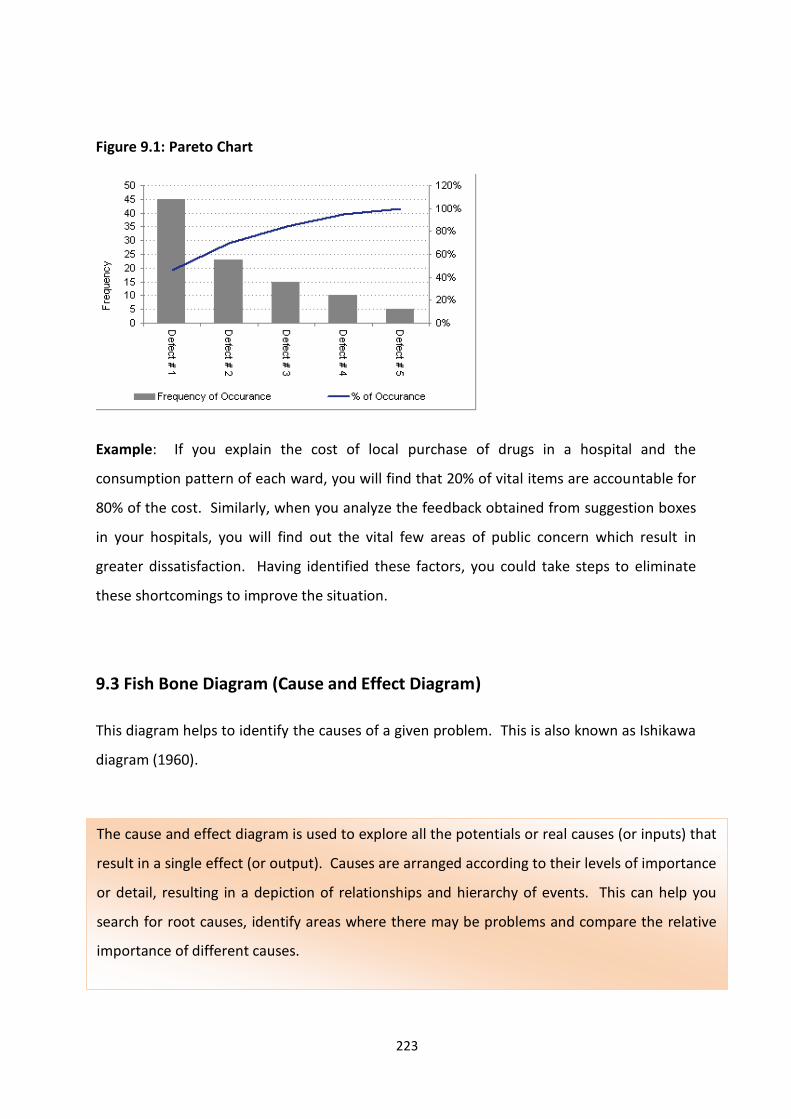
223
Figure 9.1: Pareto Chart
Example: If you explain the cost of local purchase of drugs in a hospital and the
consumption pattern of each ward, you will find that 20% of vital items are accountable for
80% of the cost. Similarly, when you analyze the feedback obtained from suggestion boxes
in your hospitals, you will find out the vital few areas of public concern which result in
greater dissatisfaction. Having identified these factors, you could take steps to eliminate
these shortcomings to improve the situation.
9.3 Fish Bone Diagram (Cause and Effect Diagram)
This diagram helps to identify the causes of a given problem. This is also known as Ishikawa
diagram (1960).
The cause and effect diagram is used to explore all the potentials or real causes (or inputs) that
result in a single effect (or output). Causes are arranged according to their levels of importance
or detail, resulting in a depiction of relationships and hierarchy of events. This can help you
search for root causes, identify areas where there may be problems and compare the relative
importance of different causes.
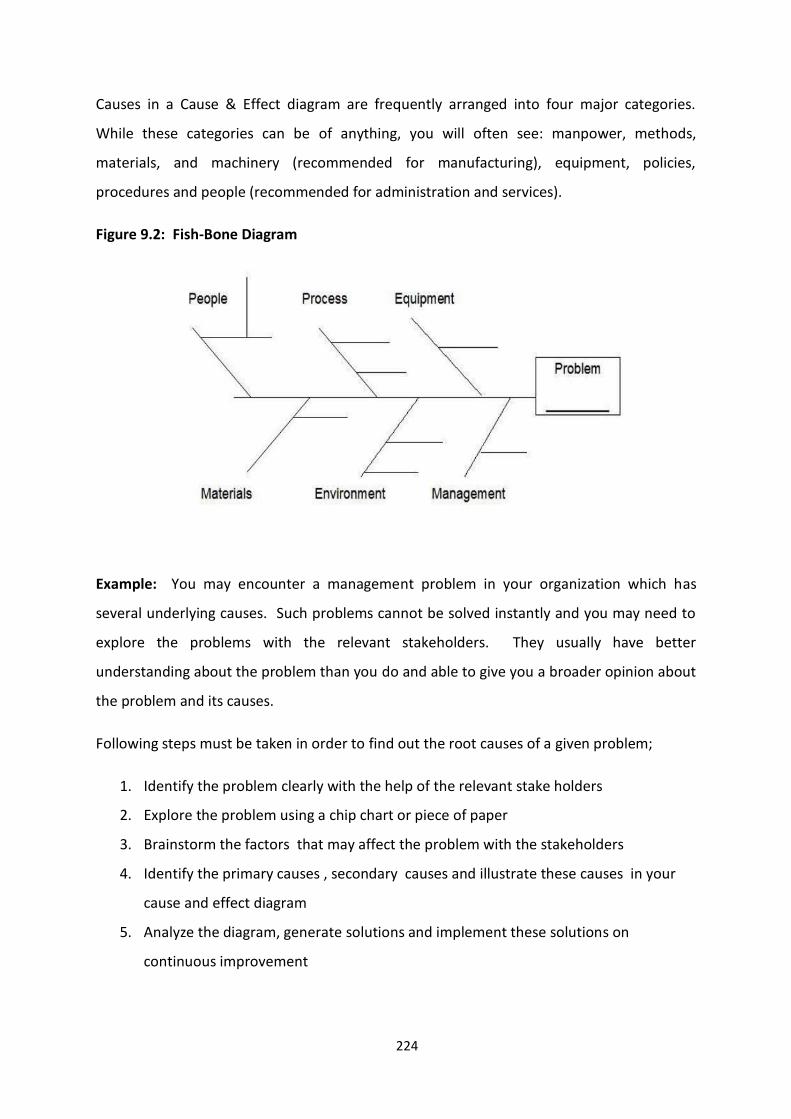
224
Causes in a Cause & Effect diagram are frequently arranged into four major categories.
While these categories can be of anything, you will often see: manpower, methods,
materials, and machinery (recommended for manufacturing), equipment, policies,
procedures and people (recommended for administration and services).
Figure 9.2: Fish-Bone Diagram
Example: You may encounter a management problem in your organization which has
several underlying causes. Such problems cannot be solved instantly and you may need to
explore the problems with the relevant stakeholders. They usually have better
understanding about the problem than you do and able to give you a broader opinion about
the problem and its causes.
Following steps must be taken in order to find out the root causes of a given problem;
1. Identify the problem clearly with the help of the relevant stake holders
2. Explore the problem using a chip chart or piece of paper
3. Brainstorm the factors that may affect the problem with the stakeholders
4. Identify the primary causes , secondary causes and illustrate these causes in your
cause and effect diagram
5. Analyze the diagram, generate solutions and implement these solutions on
continuous improvement

225
Example: Consider a situation of a hospital where the wards are unclean and toilet
conditions are not satisfactory. You want to find out the root causes of the problem. You
call upon relevant stakeholders (Administrative officer, Matron, two sisters-in-charge of
relevant wards, infection control nurse, overseer, cleaning supervisor, PHI, two cleaning
attendants etc.) for a brainstorming session. Your MO/Planning will have to supply clip
chart and piece of paper and other logistics and facilitate the session. For example, ideas
generated can mimic the following:
Core Problem: Lack of cleanliness of ward toilets
Causes:
Management related issues: Wrong selection of the contractor (Cleaning service),
Extension of the period of the contractual services irrespective of repeated
complaints
Equipment related issues: Floor Cutters/Washers are not functional
Process related issues: Detergents have not been issued by the store/Sister has not
maintained supervisory check list for cleaning of toilet
Environment related issues: Pigeons habitat on the top of the toilets/water is leaking
from the adjacent toilet in the above floor
People related issues: Cleaning staff is demotivated as their wages were not paid;
higher absenteeism
Material related issues: Poor quality detergents, brushes are not available etc.
Benefits:
Even though the problem has multiple causes and is more complex, you can
determine the root causes of the problem with the help of your stake holders.
It's simple and easy to learn and apply.

226
9.4 Histogram
It was introduced by Karl Pearson (1895) and used to assess the probability distribution of a
given variable by depicting the frequency of observations occurring during a given period of
time.
Figure 9.3: Histogram
Example: MO/ NCD (Non-Communicable Diseases) conducted a screening program in a
hospital for the staff. The staff between 35-40 years of age was the target group. He
measured the Body Mass Index (BMI) of the relevant staff and tabulated the data in a paper.
Data was produced to the Director and he said “Fine. Tell me the mean”. As there were fifty
in the target group, he could not calculate at once. However, MO / Quality Management
has a better idea of depicting data in a more attractive way using bar chart, Histogram Etc.
Histogram is a graphical display of tabular frequencies and density of the data similar to bar
chart. Each bar is erected over an interval, with an area equal to the frequency of the interval.
The height of a bar is also equal to the frequency density of the interval. The total area of the
histogram is equal to the number of data. The histogram visualizes the trend of the data such
as average, median, mode and out-layers.

227
He advised to enter these data in an ‘Excel Sheet’ and analyzed it. In order to give this
information to the hospital Director in a more attractive way, he visualized it using a
Histogram. The Director said, “Brilliant!”
9.5 Problem Tree
Being in-charge of a healthcare organization, you may face a wide range of problems and
most of these problems are brought to your desk by your subordinates. Former British
Prime Minister, M Thatcher once said, “Don’t bring me problems; bring me solutions”. But
you cannot ask your staff to bring solutions unless they have been taught the way of
exploring a problem. The approach to a Problem Tree is a simple way of illustrating a
problem with the help of your staff in order to arrive at a sound practical solution.
At the beginning, you have to call upon your staff that brought the problem to your desk or
else, you may call the other parties concerned who have been affected by the problem.
Don’t forget to call the people around you who are having a genuine interest about solving
the problem. Generally, they have a sound knowledge about the problem and the context
within which the problem revolves around; hence, they are known as stakeholders of the
problem. Now you have a team comprising of 8-10 members who can explore the problem.
The first step is to discuss and agree on the problem to be analyzed. Problem Tree analysis
is best carried out using flip chart papers. The problem is written at the centre of the flip
chart and it becomes the ‘trunk’ of the tree. This is the focal problem.
Then you have to draw the Problem Tree and it will break down the problem. Next, the
group identifies the causes of the focal problem- these form the roots – and then, identifies
Problem Tree is a tool which can be used for the analysis of a situation which needs
improvement. As Problem Tree is defined as “a gap between existing situation and the
expected situation”, you have to identify the problem clearly. A problem might have multiple
underlying causes. Hence, a thorough explanation of the problem is needed with a view to
finding out all the underlying causes as an ultimate aim to get a comprehensive solution for
the problem.
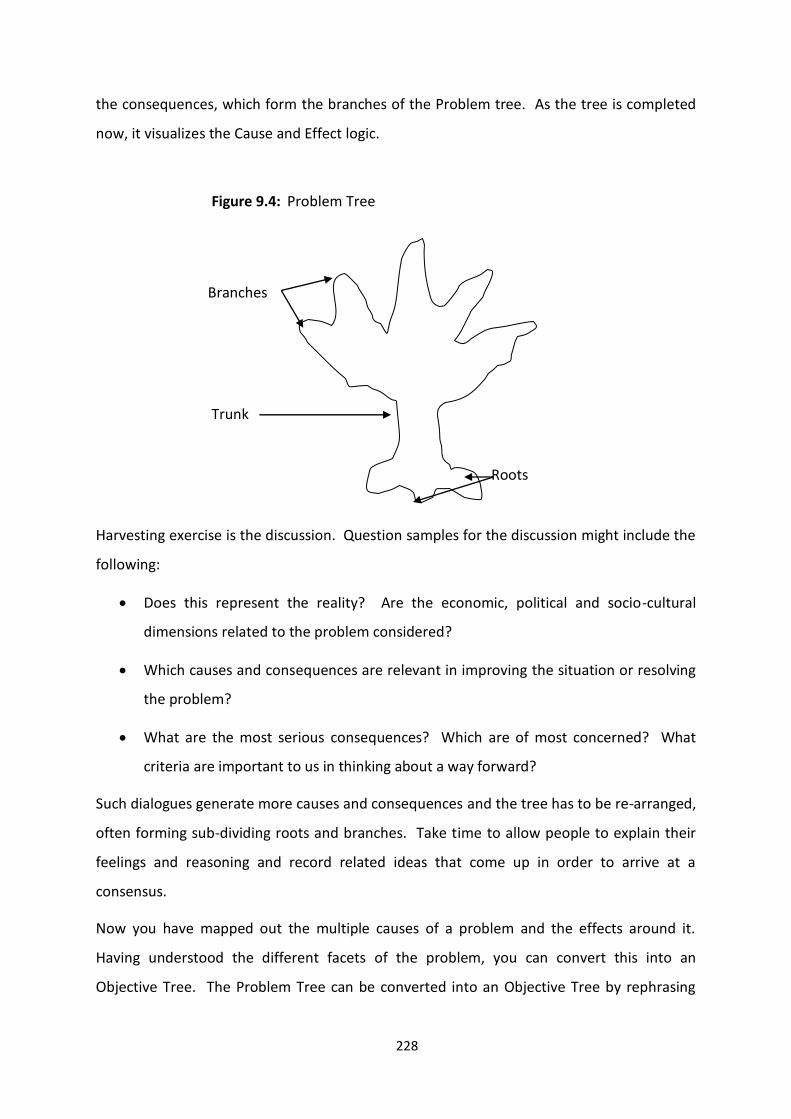
228
the consequences, which form the branches of the Problem tree. As the tree is completed
now, it visualizes the Cause and Effect logic.
Figure 9.4: Problem Tree
Branches
Trunk
Roots
Harvesting exercise is the discussion. Question samples for the discussion might include the
following:
Does this represent the reality? Are the economic, political and socio-cultural
dimensions related to the problem considered?
Which causes and consequences are relevant in improving the situation or resolving
the problem?
What are the most serious consequences? Which are of most concerned? What
criteria are important to us in thinking about a way forward?
Such dialogues generate more causes and consequences and the tree has to be re-arranged,
often forming sub-dividing roots and branches. Take time to allow people to explain their
feelings and reasoning and record related ideas that come up in order to arrive at a
consensus.
Now you have mapped out the multiple causes of a problem and the effects around it.
Having understood the different facets of the problem, you can convert this into an
Objective Tree. The Problem Tree can be converted into an Objective Tree by rephrasing

229
each of the problems into a positive desirable outcome – as if the problem had already been
treated. In this way, root causes and consequences are turned out to be root solutions and
the key project or the influencing entry points are quickly established.
Example: There was a river in district A and the people there made several complaints to
the Medical Officer of Health, saying that the quality of the water in the river is
deteriorating. As a part of designing a Water-Quality-Improvement project, a team was
appointed by the RDHS. The team leader was the regional epidemiologist and he needed to
have a deeper understanding of various issues and constraints related to the problem. He
visited the area and had a discussion with the MOH/PHI etc.
Before moving into an action plan, the team decided to conduct focus group interviews with
potential target groups and service providers. They visited the riverside and met the
‘Gramasevaka” and the affected villagers. Through inquiries made through the focus
groups, the team gained a much deeper understanding of poor water quality-related
problems, constraints and opportunities. At the same time, participants in the group
learned much about the common problems they themselves were facing and their possible
solutions.
Through discussions, they were able to exchange ideas about the way to improve the
existing situation. Some had a policy-oriented focus and helped to understand the
opportunities at which, changes in the government practice and legislations could be of
help. These issues were then brought to the RDHS’ notice and were raised at the District
Development Committee Meeting where the solutions were integrated into the district plan
through an activity output, dealing with a wider involvement of respective authorities.
Benefits:
In addition to the finding out the causes of the problem, you may visualize the
consequences of it.
The Objective Tree can be formulated easily.

230
Figure 9.5: Analysis of River Water-Quality using a Problem Tree
Problem Tree analysis brings several advantages:
The problem can be broken down into manageable and definable areas.
There is more understanding of the problem; this is often the first step in finding out
win-win solutions.
This enables a clearer prioritization of factors and helps to focus objectives.
It identifies the constituent issues, arguments and barriers.
It can help to find out whether further information, evidence or resources are
needed to make a strong case or build up a convincing solution.
Inconspicuous issues are dealt with and identified.
The process of analysis often helps build a shared sense of understanding and pave
the way for collective action.

231
9.6 WHY-WHY Diagram
The commonest question we ask in our childhood is “why”. The buzz word of all inventors,
scientists, entrepreneurs is “Why”. If someone wishes to challenge the status quo “Why” is
a sina quo non. The question begins with “Why”, the simple way of reasoning about
anything which you are interested in. If someone wishes to explore and extend that
reasoning, he or she can keep on asking Why and Why? So on and so forth. This was the
basis of the origin of WHY- WHY technique.
How to Use the Tool:
When you are looking forward to solve a problem, start at the end result and work
backward (toward the root cause), continually asking: "Why?" You'll need to repeat this
over and over again, until the root cause of the problem becomes apparent.
The application of 5 ‘Why’s is a simple problem-solving technique that helps you to get to
the root of a problem quickly. It was made popular in the 1970s by the Toyota
Production System, the Five Whys strategy involves looking at any problem and asking:
"Why?" and "What caused this problem?" Very often, the answer to the first "why" will
lead to another "why" and the answer to the second "why" will lead to another and so
on; hence, this technique has been named as the 5 Whys strategy.
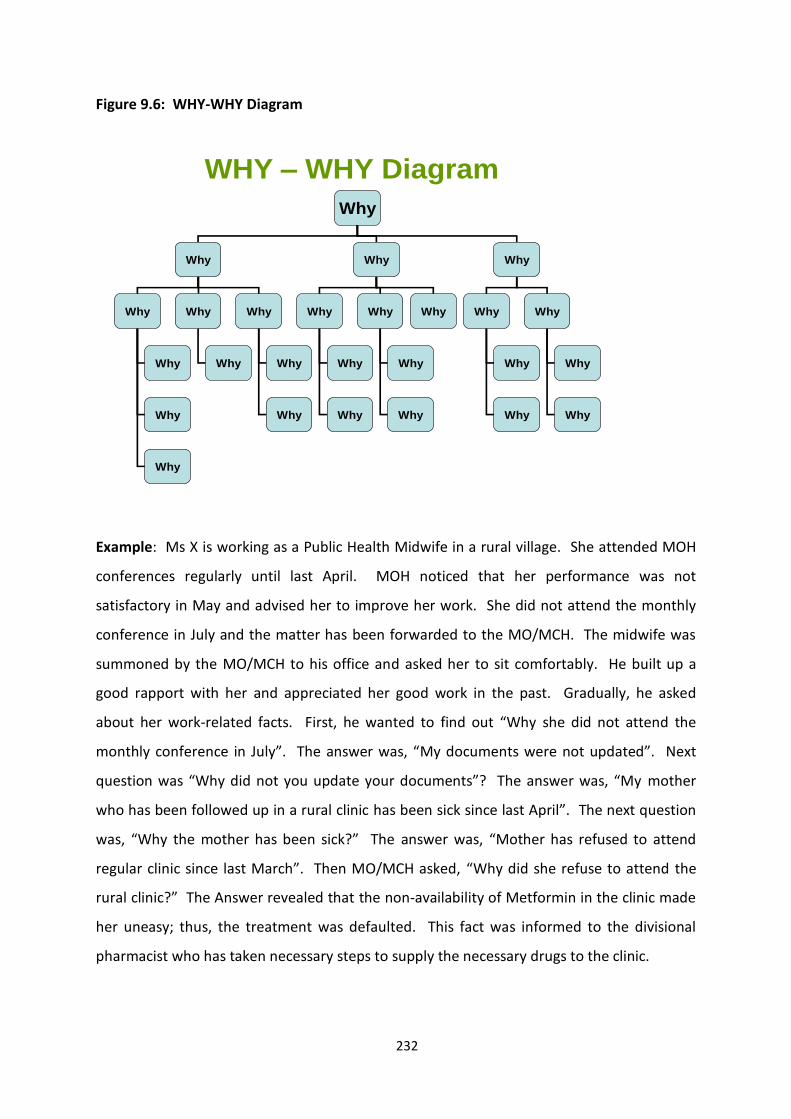
232
Figure 9.6: WHY-WHY Diagram
WHY – WHY Diagram
Why
Why Why Why
Why Why Why Why Why Why Why Why
Why
Why
Why
Why Why
Why
Why
Why
Why
Why
Why
Why
Why
Why
Example: Ms X is working as a Public Health Midwife in a rural village. She attended MOH
conferences regularly until last April. MOH noticed that her performance was not
satisfactory in May and advised her to improve her work. She did not attend the monthly
conference in July and the matter has been forwarded to the MO/MCH. The midwife was
summoned by the MO/MCH to his office and asked her to sit comfortably. He built up a
good rapport with her and appreciated her good work in the past. Gradually, he asked
about her work-related facts. First, he wanted to find out “Why she did not attend the
monthly conference in July”. The answer was, “My documents were not updated”. Next
question was “Why did not you update your documents”? The answer was, “My mother
who has been followed up in a rural clinic has been sick since last April”. The next question
was, “Why the mother has been sick?” The answer was, “Mother has refused to attend
regular clinic since last March”. Then MO/MCH asked, “Why did she refuse to attend the
rural clinic?” The Answer revealed that the non-availability of Metformin in the clinic made
her uneasy; thus, the treatment was defaulted. This fact was informed to the divisional
pharmacist who has taken necessary steps to supply the necessary drugs to the clinic.

233
Benefits:
It helps you to quickly determine the root cause of a problem.
It's simple; easy to learn and apply.
But bear in mind that if the problem has multiple facets and is more complex, you
may deviate from the core problem as the respondent can lead you down a false
trail. If it doesn't quickly give you an answer which is obviously right, then you may
need to use another problem solving technique such as Cause and Effect Analysis.
9.7 Conclusion
Identifying the root causes of any problem is vital for a quality improvement programme.
Quality tools mentioned in this chapter are the basic tools which can be applied in any
healthcare organizations without much effort.

234
MODULE 03:
IMPLEMENTATION OF QUALITY
IMPROVEMENT PROGRAMME
CHAPTER 10

235
TOPIC: DIMENSIONS OF QUALITY
Objective: To provide learning opportunities for participants to:
Improve their understanding on Dimensions of Quality
Enhance skills to apply the dimensions of service quality to meet the
customer expectations
Total Amount of Time: 45 Minutes Number of Participants: 35 (Approx.)
Preparation: The trainer must be aware of the Dimensions of Quality which is described in
this manual. As the differences between each of these dimensions are
marginal, the trainer must be able to recognize the differences. In addition,
suitable examples, related to healthcare organizations must be prepared in
advance for each of these dimensions. Also, refer the Curriculum (Annexure
II of Introduction Chapter).
Materials: Refer Curriculum (Annexure II of Introduction Chapter)
TRAINING OPENING
Engage Participants: (Ice-breaker/warm-up activity related to the topic)
Time: 05 Minutes
Start with asking the definition of Quality and different concepts of Quality.
Introduce the Topic: One power-point slide showing the main areas that will be covered
Time: 05 Minutes
SESSION PLAN - 10

236
TRAINING MIDDLE
Explain the Topic: Explain the topic in detail; demonstrate and discuss the concept,
practice and application of the topic
Time: 30 Minutes
Explain each dimension of quality with relevant examples.
TRAINING WRAP-UP AND CLOSING
Summarize the Topic: Reconnect with the objectives; check for understanding and discuss
questions
Time: 03 Minutes
Summarize stating the importance of Dimensions of Quality in initiating and implementing a
quality improvement programme.
Closing Comments: Acknowledge, motivate and inspire Time: 02 Minutes
Acknowledge the participants and wish them for a successful quality programme.

237
QUICK CHECK FOR FACILITATOR/TRAINER (To be filled after every
session)
Reflects on how the training went on to develop training skills, to plan on future training
topics and to note potential next steps
Topic: Dimensions of Quality Date: ________
Attendees:
___________________________________________________________________________
___________________________________________________________________________
___________________________________________________________________________
___________________________________________________________________________
Observations Made by the Trainer:
___________________________________________________________________________
___________________________________________________________________________
___________________________________________________________________________
___________________________________________________________________________
___________________________________________________________________________
___________________________________________________________________________
___________________________________________________________________________
___________________________________________________________________________
238
CHAPTER 10: DIMENSIONS OF QUALITY
10.1 Introduction
The definition of quality is often a hotly debated topic. While it may seem intuitive, when
we get right down to it, “quality” is a difficult concept to define with any precision. The
most fundamental definition of a quality service is one that meets the expectations of the
customer. However, even this definition may be too simple to be considered adequate. The
services provided by the hospitals should be based on quality dimensions. The dimensions
of quality should be given due respect when standards and indicators for performance are
developed.
Quality in healthcare is a kind of an elephant with different structures and continuously
moving parts of assessment, measurement and performance changing over time; further
complicating the issue. Like the six blind men who commented on the appearance of an
elephant, different stakeholders reach out to touch and define quality from their
perspectives but no single stakeholder actually describes the whole. The complexity of
defining quality in healthcare becomes readily apparent when the variability of stakeholders
extending from administrators, clinicians, nurses, regulators, private hospital owners,
attorneys, the media and lastly, to the patients is concerned. Different stakeholders
describe aspects of quality that are considered to be important in their perceptions but the
entire shape of the elephant remains elusive.
Rather than struggling to define the indefinable, another approach may be to simply
describe the perspectives of quality and leave the portrayal of the whole to the
philosophers. Some elements for defining quality in healthcare have been presented in the
Institute of Medicine’s (IOM’s) seminal report crossing the Quality Chasm (2001). The IOM
defined quality as “the degree to which health services for individuals and populations
increase the likelihood of desired health outcomes and are consistent with current
professional knowledge”. Furthermore, the IOM viewed quality as a whole which consists
of six sentinel attributes: safe, timely, effective, patient-centered, efficient and equitable.
(Cohen, 2012)

239
10.2 Dimensions of Quality
To initiate and implement a quality improvement programme in a healthcare organization,
the health personnel should have a clear knowledge of the dimensions of quality. All these
dimensions cannot be addressed at the beginning of a quality improvement programme but
can be addressed in a phased manner. Healthcare Quality and Safety programme in Sri
Lanka addresses fourteen dimensions of quality.
i. Availability (amount and type of service) - Availability is used to describe the
amount and type of service available from healthcare organization as prescribed
by the Department of Health. For example, there are circulars on the essential
drugs that should be available in a Divisional Hospital.
ii. Awareness (knowledge of the users of the services) – Healthcare users should be
knowledgeable about the services available in healthcare institutions. Patients
should be informed about the treatment options available, the investigations to
be carried out and why they are carried out.
iii. Accessibility (open to all those who need services) - Accessibility is assessed
according to the degree of ease, with regard to the location of the institution,
opening hours, availability of physicians, waiting times for appointments as well
as the availability of services for emergency and urgent needs, with which
patients could access healthcare services provided by an organization (Pineault
and Daveluy 1986). Accessibility is not only limited to geographical accessibility
but also for financial, linguistic and cultural accessibilities.
iv. Acceptability (convenient, satisfactory, good environment with customer
satisfaction) - The services provided by a healthcare organization should be of
certain standards that are acceptable by the patients. For example, the food,
drinking water and toilets should be clean. Further, health personnel should
improve their soft skills such as saying ‘Good Morning’, ‘Please’ and ‘Excuse’ etc.
Presently, these soft skills are lacking among some of the hospital employees.

240
v. Appropriateness (fitting to the service demanded by the population based on
scientific evidence) - The demand for an evidence-based health service generates
an increase in the competence among health service providers. It motivates
decision-makers to use scientific methods (Gray & Muir 2009). An appropriate
service is one that is expected to do more good than harm for a patient with a
given indication or set of indications. An inappropriate service is one that is not
expected to benefit the patient or, in the more extreme case, may harm the
patient.
vi. Coverage (how many clients are covered with a particular activity) – If a hospital
starts a new service it should not be limited to a particular segment of the
population but should cover every one in that geographical area.
vii. Concentration (the number of activities of a given service provided for a set of
clients) – For example, if a hospital starts a Diabetic Clinic, the management
should make sure that all services related to diabetic care are available at the
clinic. After commissioning the clinic, it is unreasonable to ask patients to get
investigations done from a private laboratory.
viii. Continuity (un-interrupted and well coordinated service) - There are three types
of continuity of care: They are:
Relational continuity - the existence of a continuing relationship
between a patient and a physician or a primary care organization
Informational continuity – continuous flow/transfer of information
collected during visits to other physicians on referral
Management continuity - continuous role played by the patient's
usual source of care on requests made for consultations with medical
specialists (Reid et al. 2002).
If a hospital starts a new service, the management must make sure that the
new service is continuous. It has been noticed that some clinics, such as
Diabetic clinics are being started due to the interest of some clinicians and

241
when the relevant clinician is transferred, that diabetic clinic gets suspended.
Such sudden termination of a service creates doubts among patients and
ultimately they lose confidence on the services of that hospital.
ix. Equity (absence of socially unjust or unfair health disparities) – Equity means
social justice or fairness; it is an ethical concept, grounded in principles of
distributive justice. Equity in health can be—and has widely been—defined as
the absence of socially unjust or unfair health disparities (Braveman & Gruskin,
2003). Equity can be of two types:
Horizontal equity – equal healthcare to those who have same need
Vertical equity – treating differently those who have different needs
x. Efficiency (value for money, good use of resources) - Institute of Medicine (2001)
defines efficiency as avoiding waste including waste of equipment, supplies,
ideas and energy (AHRQ, 2008). Efficiency measures whether healthcare
resources are being used to get the best value for money. Health care can be
seen as an intermediate product, in the sense of being a means to the end of
improved health. Efficiency is concerned with the relationships between
resource inputs [costs - in the form of labour, capital or equipment] and either
intermediate outputs [numbers treated, waiting time, etc] or final health
outcomes [lives saved, life years gained, Quality Adjusted Life Years (QALYs).
Although many evaluations use intermediate outputs as a measure of
effectiveness, this can lead to suboptimal recommendations. Ideally, economic
evaluations should focus on final health outcomes.
Adopting the criterion of economic efficiency implies that society makes choices
which maximize the health outcomes gained from the resources allocated to
healthcare.
Technical Efficiency refers to the physical relationship between resources (capital
and labour) and health outcome. A technically efficient position is achieved
when the maximum possible improvement in outcome is obtained from a set of
resource inputs. An intervention is technically inefficient if the same (or greater)

242
outcome could be achieved with less of one type of input. Consider treatment of
Osteoporosis using Alendronate. A recent randomized trial showed that a 10 mg
daily dose was as effective as the 20 mg dose. The lower dose is technically more
efficient.
Productive Efficiency - Technical efficiency cannot, however, directly compare
alternative interventions where one intervention produces the same (or better)
health outcome with less (or more) of one resource than another. Consider, for
example, a policy of changing from maternal age screening to biochemical
screening for probable screening for Down’s syndrome. Biochemical screening
uses amniocenteses and also requires the use of another resource—biochemical
tests. Since different combinations of inputs are being used, the choice between
interventions is based on the relative costs of these different inputs. The
concept of productive efficiency refers to the maximization of health outcome for
a given cost, or the minimization of cost for a given outcome. If the sum of the
costs of the new biochemical screening programme is smaller than or the same
as the maternal age screening and outcomes are equal or better, then the
biochemical screening is productively efficient in relation to the maternal age
screening. In health care, productive efficiency enables the assessment of the
relative value for money of interventions with directly comparable outcomes. It
cannot address the impact of reallocating resources at a broader level—for
example, from geriatric care to mental illness—because the health outcomes are
not comparable.
Allocative Efficiency — To inform resource allocation decisions on a broader
context, a global measure of efficiency is required. The concept of allocative
efficiency takes account not only of the productive efficiency with which
healthcare resources are used to produce health outcomes but also the
efficiency with which these outcomes are distributed among the community.
Such a societal perspective is rooted in welfare economics and has implications
for the definition of opportunity costs. In theory, the efficient pattern of
resource use is such that any alternative pattern makes at least one person
worse off. In practice, strict adherence to this criterion has proved impossible.

243
Further, this criterion would eliminate as inefficient changes that resulted in
many people becoming much better off at the expense of a few being made
slightly worse off. Consequently, the following decision rule has been adapted:
allocative efficiency is achieved when resources are allocated so as to maximize
the welfare of the community.
Thus, technical efficiency addresses the issue of using given resources to
maximum advantage; productive efficiency of choosing different combinations of
resources to achieve the maximum health benefit for a given cost; and allocative
efficiency of achieving the right mixture of healthcare programmes to maximize
the health of society. Although productive efficiency implies technical efficiency
and allocative efficiency implies productive efficiency, none of the converse
implications necessarily hold. Faced with limited resources, the concept of
productive efficiency will eliminate as “inefficient” some technically efficient
resource input combinations, and the concept of allocative efficiency will
eliminate some productively efficient resource allocations (Palmer & Torgerson,
1999).
xi. Effectiveness (results achieved as expected and free of complications) -
Effectiveness is the extent to which planned outcomes, goals or objectives are
achieved as a result of an activity, strategy, intervention or initiative intended to
achieve the desired effect, under ordinary circumstances.
Example: A vaccine is effective when it is capable to produce the desired effect
(protection against disease) in the population, under ordinary circumstances.
xii. Extensiveness (quantity of service relative to the problem) – The services
provided to the patients should be comprehensive. A patient with hemi paresis
will be treated in a hospital during the acute stage. When the patient is
discharged from the hospital, health services should have a mechanism to
continuously care for the patient.

244
xiii. Responsiveness (willingness of staff to help customers and provide prompt
service) - Responsiveness is not a measure of how the system responds to health
needs which is shown up in health outcomes but, of how the system performs
relative to non-health aspects, meeting or not meeting a populations’
expectations of how it should be treated by providers of prevention, curative or
non personal services (WHO Report, 2000).
Responsiveness basically addresses the following:
Reduction of the damage to one’s dignity and autonomy and the fear and
shame that sickness often brings with it
Treating the people with individual dignity
Prompt attention to the needs of patients in order to minimise long delays
in waiting for diagnosis and treatment
Respect the value of peoples time and reduce their anxiety
Ensure confidentiality
Allow choices
Ensure there is no errors, delays, rudeness, hostility and indifference by
the health worker
Protect them against financial cost of illness
Responsiveness is described in detail in another chapter.
xiv. Safety (health care that does not harm patients) - Patient safety is the prevention
of errors and adverse effects to patients associated with health care.
A definition for patient safety has emerged from the health care quality
movement that is equally abstract, with various approaches to the more
concrete essential components. Patient safety was defined by the IOM as “the
prevention of harm to patients”. Emphasis is placed on the system of care
delivery that (1) prevents errors; (2) learns from the errors that do occur; and (3)

245
is built on a culture of safety that involves health care professionals,
organizations, and patients (Mitchell, 2008).
Unexpected and unwanted events can take place in any setting where healthcare
is delivered (primary, secondary and tertiary care, community care, social and
private care, acute and chronic care). Every 10th patient in Europe experiences
preventable harm or adverse events in hospital, causing suffering and loss for the
patient, their families and health care providers, and taking a high financial toll
on health care systems. Safety is part of the quality agenda and therefore, a
dimension of the quality culture, requiring broad commitment from both the
organization and the community. Patient safety is described in detail in another
chapter.
10.3 Conclusion
These dimensions are somewhat independent. Therefore, a service can be excellent in one
dimension and average or poor in another. Rarely, very few services excel in all dimensions.
Therefore, to begin with, quality services can be determined by using a few of the
dimensions of quality.
References:
AHRQ, Health Care Efficiency Measures: Identification, Categorization, and
Evaluation, April 2008
Braveman P and Gruskin S, Defining equity in health, J Epidemiol Community
Health 2003 ; 57: 254-258 doi:10.1136 /jech.57.4.254
Cohen L Daniel, Quality in Healthcare: A Five-Dimensional View, Patient Safety
and Quality in Healthcare, November / December 2012
Gray, J. A. Muir. Evidence-based health care & public health. Edinburgh: Churchill
Livingstone. 2009

246
Mitchell H Pamela, Patient Safety and Quality: An Evidence-Based Handbook for
Nurses. Vol. 1, Agency for Healthcare Research and Quality (US); 2008 Apr
Palmer Stephen & Torgerson J David, Definitions of efficiency, British Medical
Journal, 1999 April 24; 318(7191): 1136.
Pineault R., Daveluy C. La Planification de la santé: concepts, méthodes et
stratégies. Montreal: Éditions Nouvelles; 1986.
Reid R., Haggerty J., McKendry R. Defusing the Confusion: Concepts and
Measures of Continuity of Healthcare. 2002. Final report submitted to the
Canadian Health Services Research Foundation, the Canadian Institute for Health
Information and the Federal, Provincial and Territorial Advisory Committee on
Population Health. Retrieved January 7, 2011. <
http://www.chspr.ubc.ca/node/213>
WHO Report, Health Systems: Improving Performance, 2000

247
MODULE 03:
IMPLEMENTATION OF QUALITY
IMPROVEMENT PROGRAMME
CHAPTER 11

248
TOPIC: MONITORING OF HEALTHCARE PRODUCTIVITY AND QUALITY
ASSURANCE PROGRAMME
Objective: To explain the importance of monitoring Quality Assurance programme, the
indicators and standards and suggest a mechanism for establishing
monitoring.
Total Amount of Time: 60 Minutes Number of Participants: 35 (Approx.)
Preparation: The lecturer must select few examples for standards and indicators. A set of
standards and indicators are shown in the Annexure. Also refer the
curriculum (Annexure: II of Introduction Chapter)
Materials: Refer Curriculum (Annexure II of Introduction Chapter)
TRAINING OPENING
Engage Participants: (Ice-breaker/warm-up activity related to the topic)
Time: 05 Minutes
Introduce yourself. Explain the importance of monitoring Quality & Safety in a healthcare
organization.
Introduce the Topic: One power-point slide showing the main areas that will be covered
Time: 05 Minutes
Motivate participants, show them why the topic is important and share objectives and the
agenda. Introduce to standards and indicators.
SESSION PLAN - 11

249
TRAINING MIDDLE
Explain the Topic: Explain the topic in detail; demonstrate and discuss the concept,
practice and application of the topic. Introduce the tools of
monitoring.
Time: 40 Minutes
TRAINING WRAP-UP AND CLOSING
Summarize the Topic: Reconnect with the objectives; check for understanding and discuss
questions
Time: 08 Minutes
Summarize learning; ask for questions and look back at objectives. Discuss questions in full
group; ask for participant responses to questions. Display the first power-point slide
showing the main areas that were covered. Possible obstacles that they may face should be
discussed.
Closing Comments: Acknowledge, motivate and inspire Time: 02 Minutes
Motivate participants to use standards and indicators for monitoring purpose regularly.

250
QUICK CHECK FOR FACILITATOR/TRAINER (To be filled after every
session)
Reflects on how the training went on to develop training skills, to plan on future training
topics and to note potential next steps
Topic: Monitoring of Healthcare Productivity & Quality Assurance Programme
Date: ______________
Attendees:
___________________________________________________________________________
___________________________________________________________________________
___________________________________________________________________________
___________________________________________________________________________
Observations Made by the Trainer:
___________________________________________________________________________
___________________________________________________________________________
___________________________________________________________________________
___________________________________________________________________________
___________________________________________________________________________
___________________________________________________________________________
___________________________________________________________________________
___________________________________________________________________________

251
CHAPTER 11: MONITORING OF HEALTHCARE PRODUCTIVITY AND
QUALITY ASSURANCE PROGRAMME
11.1 Introduction
Monitoring is central to the concept of quality improvement; it provides a means to define
what hospitals and other healthcare institutions actually do, and to compare that with the
original targets and with other similar institutions in order to identify opportunities for
improvement.
It is essential to differentiate the meaning of monitoring and evaluation. Monitoring is
defined as the routine collection and use of data to assess progress in achieving program
objectives. These data are generally derived from program records. Evaluation involves
collecting special data on a periodic or “as needed” basis to address issues that cannot be
examined using routinely collected data, like a project’s cost- effectiveness or overall
impact.
11.2 Tools of Monitoring
a. Quality Standard
A standard is an expectation of that is explicit (written) or implicit (understood). “Implicit”
healthcare standards are derived from the expertise of professionals who work in a specific
environment. For example, professionals who work in the pediatric ward may know the
treatment that a dehydrated child needs but differ on ideas about the most appropriate way
to provide the treatment (e.g., dosage, duration, and frequency). Converting implicit
standards to explicit standards provides uniformity in the way to provide quality care and
allows a baseline measure for monitoring quality.
“Explicit” healthcare standards appear in a variety of forms, such as specifications,
procedures, or protocols. These standards may be developed by the Ministry of Health,
professional colleges, international organizations (e.g. World Health Organization) or by a
hospital itself.

252
Applied standards should be most up-to-date and should be:
Realistic: The standard can be followed or achieved with existing resources
Reliable: Following the standards for a specific intervention should result in the
same outcome (all factors being equal)
Valid: The standard is based on scientific evidence or other acceptable experience
Clear: The standard is understood in the same way by everyone concerned and is
not subjected to distortion or misinterpretation
Measurable: The standard is amenable to assessment and quantification
b. Quality Indicator
An indicator of quality is a measure that is used to determine the degree of adherence to a
standard. Indicators translate a qualitative statement (as expressed by a standard) into a
quantitative one. For example, “the proportion of healthcare providers who greet their
patients by name” measures the extent to which the standard for a quality reception is
being met. Indicators can be expressed as a number (a count), an average or a ratio (a
proportion or rate). An indicator presented as a ratio consists of a numerator (the number
of times an event occurs) and a denominator (the total number of times the event should
have occurred). An example of a ratio is the proportion of post-surgical patients whose
temperature was taken by the healthcare worker according to protocol.
It is useful to select indicators that measure inputs, processes and outcomes. The basis for
selecting an indicator is its importance or potential impact on the quality of care. Be aware
that outcome indicators measure the level of achievement of the intervention and
therefore, can serve as indirect measures of the quality of care and services. However, a
good outcome does not necessarily means that the process has been managed correctly and
vise versa. Therefore, the measurement of input, process and outcome indicators is
warranted. Some quality experts believe that organizations should strive for zero defects.
They suggest that setting a level of expected quality limits the highest level of quality that
might otherwise be achieved. The belief is that once the quality level—e.g., targeted

253
infection control rates—is attained; the staff will be satisfied with this level rather than
continuing to strive to decrease infection control rates to zero infections. Keeping this view
in mind, establishing indicators remains an established means of setting the bar at a
reasonable level of achievement and the bar can (and should be) raised/lowered as the
targets are being achieved.
11.3 Principal Methods of Measuring Hospital Performance
The methods used for monitoring of Healthcare Productivity and Quality Assurance
Programs have not been rigorously evaluated. The evidence to support these strategies is
mostly based on individual descriptive studies carried out at several hospitals in Sri Lanka.
Monitoring strategies can be divided in to two basic types, namely:
1. Internal and
2. External.
Internal monitoring involves the strategies implemented by the hospital itself and the
external monitoring includes external or third party monitoring.
Internal Monitoring
For the purpose of internal monitoring, the establishment of quality teams and the
appointment of a quality coordinator are almost mandatory tasks. As soon as a quality
coordinator is selected and a quality team is established, the team can begin the monitoring
process. Monitoring one or two of the indicators is a good way to begin.
The most effective means of monitoring is direct patient observation. But this is not feasible
all the time. When direct observation is not feasible, the monitoring team can examine
records. It is essential to develop data collection tool.
External Monitoring
There are four basic types of external monitoring:
I. Regulatory Inspection
II. Surveys of Consumers’ Experiences
III. Third-Party Assessments
254
IV. Statistical Indicators
i. Regulatory Inspections
Most developed countries have statutory inspectorates to monitor compliance of hospitals
with published licensing regulations. Examples include inspectorates to monitor infection
control and blood transfusions. When the assessment is managed by a designated agent,
there is a national consistency. Examples are the Joint Commission in the United States and
the Commission for Health Improvement (CHI).
ii. Surveys of Patients’ Experiences
Standardized surveys of experiences of patients and relatives can reliably measure hospital
performance against explicit standards. Surveys range from local pencil-and-paper surveys
outside a clinic to national stratified sample surveys. Advantages of this method are that it
identifies what is valued by patients and the general public, and standardized surveys can be
tailored to measure specific domains of experience and satisfaction. However, traditional
satisfaction surveys have been methodologically weak and focused on the agenda of
clinicians and managers rather than on patients.
iii. Third-party Assessments
Third-Party assessments are identified as systematic approaches linking national or
international standards to local practices of private or public hospitals.
ISO Standards
International Organization for Standardization (ISO) certification measures hospital
performance in terms of compliance with international standards for quality systems. ISO
developed a series of standards (ISO 9000) originally for the manufacturing industries
(medicines, medical devices) that have been used to assess quality systems in specific
aspects of health services, hospitals and clinics. The theoretical advantage is that ISO
certification is internationally recognized in many other services and manufacturing areas,

255
but ISO 9000 standards relate more to administrative procedures rather than to hospital
performance.
Peer Review
Peer review is a closed system for professional self-assessment and development.
Reciprocal visiting is driven by professional organizations / colleges and has a long tradition
as a form of peer review.
Accreditation
Accreditation programs measure hospital performance in terms of compliance with
published standards of organizational – and, increasingly, clinical – processes and results.
They are mostly independent and aimed at organizational development more than
regulation but could contribute reliable data to national performance measurement
systems. They are independent, voluntary programmes developed from a focus on training
into multi-disciplinary assessments of health care functions, organizations and networks.
Their standards of assessment have been developed specifically for health care.
iv. Statistical Indicators
Statistical indicators such as Bed Occupancy Rate can suggest issues for performance
management and quality improvement. They provide relative rather than absolute
messages. There is a need for these indicators to be interpreted with caution which are
inversely proportional to the quality of the underlying data and of the definitions used.
Indicators are tools for assessing hospital performance either internally or externally. They
should be designed to measure the achievement of predetermined objectives, but in
practice, they are often selected on the basis of whatever the data are routinely available.
Standardization is essential for measurements within hospitals and critical for
measurements between hospitals.
256
References:
Shaw C (2003) How can hospital performance be measured and monitored?
Copenhagen, WHO Regional Office for Europe (Health Evidence Network report;
http://www.euro.who.int/document/e82975.pdf, accessed 29 August 2003)
Department of Child and Adolescent Health and Development Family and
Community Health Cluster WORLD HEALTH ORGANIZATION, 2003, Health Facility
Survey Tool to evaluate the quality of care delivered to sick children attending
outpatient facilities (using the Integrated Management of Childhood Illness clinical
guidelines as best practices)

257
Annexure Ministry of Health
Directorate / Healthcare Quality & Safety
MONITORING INDICATORS
Key Performance Area
Indicator Standard Score Results Remarks
1. Organization to implement the Quality Management Programme
Quality Management Units
1. Availability of a room 10 2. Basic furniture: (Table, chairs, cupboard)
20
3. Office equipment computer and a printer Photocopier
20
4. Staff
Medical Officer
Nursing Officer
Development Assistant
Management Assistant
50
Record keeping of the Quality Management Programme
1. File folders and files are opened according to given guidelines
20
2. Files are updated 50 3. Organization results are displayed
30
Sub Total for KPA 200 2. Customer focused organization
Customer care 1. Display of service instructions at the entrance of the hospital
10
2. Reception counter with a working receptionist
10
3. Public complains are documented and investigated
30
4. Suggestion boxes are placed in the Out Patient Dept.
10
5. Customer satisfaction surveys are conducted once a year
20
6. Health Education sessions are 20

258
conducted recorded and updated. Sub Total for KPA 100
3. Quality of Work Environment
Organization Orderliness
1. Visible name board in all three languages.
10
2. 10 selected items in wards/units are kept in order following 5S principles
20
3. Directions boards are displayed in Sinhala and Tamil languages
10
4. Files are kept in order quick for retrieval
20
5. Drugs stores is arranged in systems/Alphabetically order.
20
6. General stores is arranged in order following 5S principles
20
Organization Development 1. Vision and Mission is displayed in all languages at the Entrance
10
2. Quality Management Action Plan is available
20
3. Quality convention/Rewarding function was conducted during the previous year
20
4. Quality Management Team (Steering committee) is formed and active
20
5. 100% of Work Improvement Teams are functioning
30
Sub Total for KPA 200 4.Basic Human Needs
Responsiveness 1. Patients are examined in covered environment
10
2. Waiting areas are clean, adequate ventilation and lighting
20
3. Seating facilities in OPD areas are available for 1/4th of the daily attendance
20
4. Patients are provided fresh bed 10

259
sheet on admission
5. Patients eating area is available and provided with safe drinking water
10
6. Toilets to be cleaned at least three times a day
10
7. Health Education is done and records are updated.
20
Sub Total for KPA 100 5. Productive Maintenance of Equipment
Material Management 1. Files are opened for major equipment
20
2. Availability of a functioning Maintenance Unit for repair of furniture
10
3. Availability of a functioning Maintenance Unit
20
4. Records are maintained and updated on repairs and maintenance.
20
5. Monthly/Quarterly progress reports on maintenance are prepared
10
6. Availability of Unwanted Items store for General and Surgical items
10
7. Record keeping of Unwanted items disposal is updated.
10
Supplier Quality 1. Annual Procurement Plan is available
30
2. Supplier and support services information bulletin is prepared and updated.
30
3. Purchasing guidelines are available and updated.
20
4. Equipment maintenance guidelines are displayed in selected five items.
20
Sub Total for KPA 200
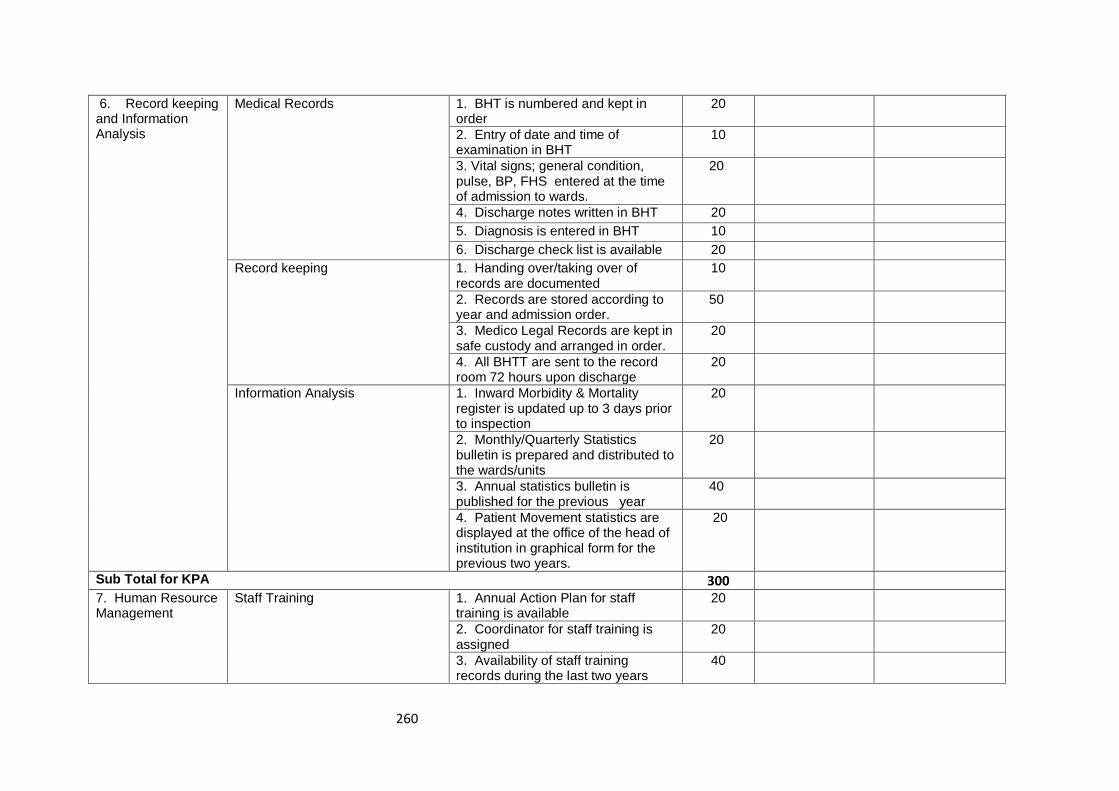
260
6. Record keeping and Information Analysis
Medical Records 1. BHT is numbered and kept in order
20
2. Entry of date and time of examination in BHT
10
3. Vital signs; general condition, pulse, BP, FHS entered at the time of admission to wards.
20
4. Discharge notes written in BHT 20 5. Diagnosis is entered in BHT 10 6. Discharge check list is available 20
Record keeping 1. Handing over/taking over of records are documented
10
2. Records are stored according to year and admission order.
50
3. Medico Legal Records are kept in safe custody and arranged in order.
20
4. All BHTT are sent to the record room 72 hours upon discharge
20
Information Analysis 1. Inward Morbidity & Mortality register is updated up to 3 days prior to inspection
20
2. Monthly/Quarterly Statistics bulletin is prepared and distributed to the wards/units
20
3. Annual statistics bulletin is published for the previous year
40
4. Patient Movement statistics are displayed at the office of the head of institution in graphical form for the previous two years.
20
Sub Total for KPA 300 7. Human Resource Management
Staff Training 1. Annual Action Plan for staff training is available
20
2. Coordinator for staff training is assigned
20
3. Availability of staff training records during the last two years
40

261
4. Minimum of one staff awareness survey on Productivity and Quality concepts is conducted during a year
20
Deployment of Staff 1. Cadre register is maintained and updated.
20
2. Staff distribution is recorded and displayed in Medical, Nursing and Attendants
30
3. Presence of updated 'On call' display of Medical Officers.
20
4. Job description (duty list) is available for selected10 categories of staff.
30
Sub Total for KPA 200 8. Infection free Environment
Waste Management 1. Five types of waste general infected, sharps, plastics and glass are segregated in three selected wards
30
2. Waste Management colour charts are displayed in three selected wards.
10
3. Waste segregation is organized at the disposal area
30
4. Availability of a functioning Incinerator
30
Infection Control 1. A separate unit is established for Infection control with a Nursing Officer in-charge
10
2. Infection Control sub-committee is conducted once in 3 months and records maintained
20
3. Cleaning checklists are displayed and updated in selected wards
20
4. Notification register is available and updated.
20
5. Infection Identification registers is maintained and updated.
30
Sub Total for KPA 200

262
9. Patient Care Out Patients Care 1. Availability of basic examination instruments in OPD consultation Rooms 1.1 B.P. Apparatus 1.2. Tongue depressor 1.3 Torch
15
2. Availability of referral clinics chart information at the consultation room
10
3. OPD prescription consists of following particulars 1. Date 2. Patient name 3. Age 4. Sex 5. Date 6. Probable Diagnosis 7. Treatment dose; frequency and duration 8. Signature of Examining officer
30
4. Drugs are dispensed in envelops with required instructions
15
5. Sterile packets are used for wound dressings
15
6. Emergency drugs tray with drugs and consumables as in the check list
15
Emergency Care 1. Availability of a 24 hrs functioning ETU
20
2. Emergency equipment is kept
orderly in accessible place and in
working order
a. Suction Apparatus
b. O2 regulators
c. Nebulizer
15

263
3. Emergency care guidelines are prepared and displayed
20
4. Disaster Management Plan is updated
20
5. 10 essential medical items are available in the Emergency tray.
25
Patient safety 1. Safety signs are displayed in accident prone areas
10
2. Adverse incidents are reported and recorded in a format
20
3. Transfusion reactions are reported and recorded
20
4. Observations of post operative patients are recorded and updated.
30
5. Death reviews are conducted in selected deaths and recorded.
20
KPA Sub Total 300 10. Work Performance
Performance Reviews 1 Management Committee is held once a month and records are maintained
30
2. Peri-natal Mortality Review is held once a month and records are maintained
20
3. Drugs Review committee is held once in three months and records are maintained
20
4. Supervision Inspections are done and records are maintained by the Administrative Officer, Special Grade Nursing Officer and Chief Pharmacist
30
5. Institutional Quality Management system is monitored through a pre-designed check list/indicators
100
Sub Total for KPA 200 GRAND TOTAL
FOR KPA 2000

264
MODULE 03:
IMPLEMENTATION OF QUALITY
IMPROVEMENT PROGRAMME
CHAPTER 12

265
TOPIC: THE PROCESS OF CONDUCTING A STUDY VISIT TO AN INSTITUTION
PRACTICING TOTAL QUALITY MANAGEMENT
Objectives:
To receive on-site experience on the implementation of 5S-CQI-TQM
programme
To gain experiences in the implementation of 5S-CQI-TQM
programme
To provide feedback to the visiting institution on their practices
To reflect on the practices of visitors and identify measures for
improvement of their institution
Total Amount of Time: 180 Minutes (Approximately, but may vary according to the size of
the institution)
Number of Participants: 35 (Approximately, divided into 4-5 subgroups)
Preparation:
i. Identify a suitable site and confirm the date and time for the study visit
ii. Identify clear learning objectives that should be achieved by the end of the study
visit
iii. Ensure a resource person from the receiving institution is arranged
iv. Identify participants for the study visit and allocate into groups; identify a group
leader
v. Collaborate with group members and the receiving institution to ensure areas that
will be visited are identified and a route map prepared
vi. Arrange transport and meals if necessary
vii. Prepare materials to be given to participants
SESSION PLAN - 12

266
Materials: Route map and a documentary introduction to the institution; handouts on
learning objectives, other handouts field note books and files
TRAINING OPENING
Engage Participants: (Ice-breaker/warm-up activity related to the topic)
Time: 10 Minutes
Introduce the resource persons from receiving institution and participants
Activity: Ask participants on their expectations of the study visit
Introduce the Topic: One power-point slide showing the main areas that will be covered
Time: 10 Minutes
The receiving institution to provide an overview of their Quality Improvement
Programme using a lecture or a video presentation
Introduce the activities which enhance the participant engagement; e.g., a
participant maintains a checklist of observations
TRAINING MIDDLE
Explain the Topic: Explain the topic in detail; demonstrate and discuss the concept,
practice and application of the topic
Time: 120 Minutes
Conduct the Study Visit. It is important to show frontline services and other areas that have
been identified. Group activities, observation checklists etc. can be used to ensure that the
participants are actively engaged during the study visit.

267
TRAINING WRAP-UP AND CLOSING
Summarize the Topic: Reconnect with the objectives; check for understanding and discuss
questions
Time: 30 Minutes
Discuss the highlights observed during the study visit
Provide constructive feedback to the receiving institution
Question and answer sessions to clarify any remaining doubts
Reflect and identify practice gap in your own institution and discuss probable
remedial measures
Closing Comments: Acknowledge, motivate and inspire Time: 10 Minutes
Encourage participants to initiate and implement the Quality Improvement Programme and
wish them all success.

268
QUICK CHECK FOR FACILITATOR/TRAINER (To be filled after every
session)
Reflects on how the training went on to develop training skills, to plan on future training
topics and to note potential next steps
Topic: The Process of Conducting a Study Visit to an Institution Practicing Total Quality
Management
Date: ________
Attendees:
___________________________________________________________________________
___________________________________________________________________________
___________________________________________________________________________
___________________________________________________________________________
Observations Made by the Trainer:
___________________________________________________________________________
___________________________________________________________________________
___________________________________________________________________________
___________________________________________________________________________
___________________________________________________________________________
___________________________________________________________________________
___________________________________________________________________________
___________________________________________________________________________

269
CHAPTER 12: THE PROCESS OF CONDUCTING A STUDY VISIT TO AN
INSTITUTION PRACTICING TOTAL QUALITY MANAGEMENT
12.1 Introduction
In a health care setting, adverse events arising from treatments rather than from diseases
themselves can lead to serious harm, complications, patient suffering and death. Clinical
risk management is an approach to improve the quality of care and to ensure safe delivery
of healthcare by placing special emphasis on identifying circumstances that put patients at
risk or harm and to take necessary actions to prevent or minimize those risks.
As there are still no rules or guidelines established to prevent those risky situations,
individual events are managed as and when they occur to the best of the ability of those
involved. A Study visit to a hospital practicing Total Quality Management (which will be
indicated as ‘hospital A’ in further writing) will help to improve the knowledge of the study
group of the visiting hospital (which will be indicated as ‘hospital B’ in further writing). By
visiting to hospital A, the visitors from hospital B get the opportunity to observe directly and
share knowledge.
12.2 How to Organize the Visit by Hospital B
1. Following things should be considered:
Number of participants for the visit
The number may vary according to the size of the hospital B; e.g., larger
number from a Teaching Hospital and may be smaller number from a District
Hospital
Whether the whole hospital B or a given section or unit from hospital B is
going to apply total quality principles.
E.g., in a Teaching Hospital, members of the given section only may
participate. However, for maximum benefit, the number should not exceed
35 at a time.

270
Number of visits planned
This again depends on the size of the hospital B. If the hospital B is a larger
one, several visits may be necessary. This will depend on the financial
allocation for the project as well as the willingness of the hospital A to
accommodate participants from hospital B
Selection of participants for the visit
Ideally the group should consists of
o Members of the top management level
o Middle level managers
o Leaders of Work Improvement Teams (WITs)
o If the number permits, a few staff members who are interested in quality
management process may be allowed to join.
Obtaining permission
Heads of both hospitals (A & B) should discuss and dates should be fixed
according to the convenience of both institutions. Two study groups from
two different hospitals preferably should not visit on the same day. The visit
should not cause any disturbance to the routine work of the hospital A or its
staff. Written permission should be obtained by the Head of hospital B at
least ten days prior to the fixed date. Once the written permission has been
received, the Head of the hospital B should inform the participants through
the group leader.
2. Making necessary arrangements for the visit
Transport
Depending on the number of participants and the financial situation, a
vehicle can be arranged
Arrangement of duty and the grant of duty leave
Cover-up arrangements should be made so as not to disturb the routine work
carried out in hospital B on the day of the visit.

271
Meals
Group leader should contact the Quality Management Unit (QMU) of Hospital
A and make arrangements for the tea and meals if it’s a full day visit.
Awareness of the visit
Group leader should call a meeting for the participants of the study visit
three to four days prior to the visit to discuss the objectives and things to be
observed during the visit; for example:
o application of 5S and how it has been applied to make the working
environment pleasant
o application of colour code in different locations for easy identification
o procedures carried out at different places to simplify the work
o staff arrangements
o Central Sterile Supplies Department (CSSD) and Central Linen
Supplies Department (CLSD)
o waste management area
o arrangement of stores and distribution of goods
o arrangement of the record room
o emergency arrangements
o staff discipline
o pictures and photos
o results achieved after applying TQM
o awards received
o patient satisfaction surveys carried out and suggestion schemes
3. Allocating responsibilities among visiting group
Group leader should nominate members of the group to take photographs,
to take notes and to discuss with relevant unit heads to get necessary
information on their practical experiences.
Confirmation of the date
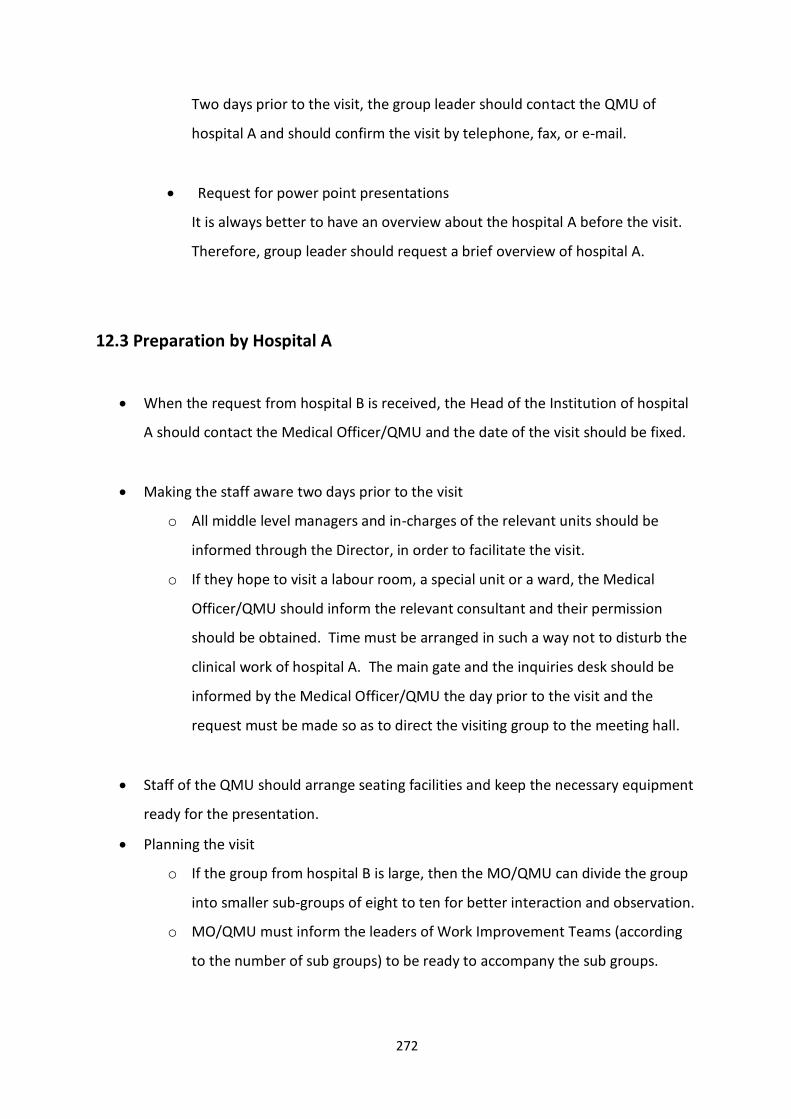
272
Two days prior to the visit, the group leader should contact the QMU of
hospital A and should confirm the visit by telephone, fax, or e-mail.
Request for power point presentations
It is always better to have an overview about the hospital A before the visit.
Therefore, group leader should request a brief overview of hospital A.
12.3 Preparation by Hospital A
When the request from hospital B is received, the Head of the Institution of hospital
A should contact the Medical Officer/QMU and the date of the visit should be fixed.
Making the staff aware two days prior to the visit
o All middle level managers and in-charges of the relevant units should be
informed through the Director, in order to facilitate the visit.
o If they hope to visit a labour room, a special unit or a ward, the Medical
Officer/QMU should inform the relevant consultant and their permission
should be obtained. Time must be arranged in such a way not to disturb the
clinical work of hospital A. The main gate and the inquiries desk should be
informed by the Medical Officer/QMU the day prior to the visit and the
request must be made so as to direct the visiting group to the meeting hall.
Staff of the QMU should arrange seating facilities and keep the necessary equipment
ready for the presentation.
Planning the visit
o If the group from hospital B is large, then the MO/QMU can divide the group
into smaller sub-groups of eight to ten for better interaction and observation.
o MO/QMU must inform the leaders of Work Improvement Teams (according
to the number of sub groups) to be ready to accompany the sub groups.

273
o When the visiting group reaches the hospital A, group leader should meet the
Head of the Institution and the group should be directed to the meeting hall.
o After the welcome, Deputy Director or MO/QMU can make a brief
presentation about the hospital A.
It should include
• Past situation of the hospital (can show some photographs)
• Present situation
• Challenges and barriers encountered/faced during the introduction and
implementation of Quality Improvement Programme.
• Measures taken to change the staff attitude
• Results achieved after applying TQM principles
After the presentation MO/QMU can divide the group into three or four sub groups.
MO/QMU of hospital A should draw a roadmap which specifies the time to be spent in each
unit to avoid two groups meeting concurrently at the same place. This roadmap should be
circulated among the relevant units of Hospital A, so that those units will also be prepared
to welcome the visiting team. This makes sure that in each unit, a capable person is kept
ready to explain the matters related to quality improvement in the particular unit. Each
subgroup from hospital B should be given a copy of the road map prepared. The visiting
team should strictly adhere to the road map given by hospital A.
The whole group can be directed to spacious places like the waste disposal area at the same
time to make the demonstrations more convenient.
At the end of the study visit, the group should gather at the meeting hall and discuss what
they have observed with the QMU staff and the Deputy Director.
Time should be allocated for any clarifications and an opportunity can be given for the
visiting group to point out any deficiencies identified and share the knowledge gained.
Deputy Director of hospital A can show awards received by the hospital to motivate the
visiting group.

274
The group leader can obtain any photographs, charts, stickers etc. from QMU if available
with the permission of the Director.
It will be beneficial for hospital B to get the contact numbers of any relevant personnel at
the QMU for further clarifications.
MO / QMU must enter the details of the visiting group in the relevant record book kept at
the QMU.

275
MODULE 03:
IMPLEMENTATION OF
QUALITY IMPROVEMENT
PROGRAMME
CHAPTER 14

276
TOPIC: GROUP WORK
Objective: To prepare an Action Plan for the Quality Improvement Programme of the
healthcare institution
Total Amount of Time: 150 Minutes
Number of Participants: 35 (Approx.) in 4-5 groups
Preparation: First, set up five groups consisting of 07 members. The topic for the group
work must be selected by the coordinator well in advance. If possible, the
title for the group work should be communicated to the participants on the
first day of the programme. Also, invite few resource persons such as the
PDHS, RDHS, Director, Deputy Director, Matron, Administrative Officer,
Accountant, Medical Officer/District Healthcare Quality & Safety Unit etc. for
the presentation.
Materials: Half Sheets, Pens, Flip Charts, Platinum Pens. Refer Curriculum (Annexure II
of Introduction Chapter )
GROUP WORK OPENING
Engage Participants: (Ice-breaker/warm-up activity related to the topic)
Time: 10 Minutes
Depending on the participants, you may ask to carry out a group work on the following
areas.
Preparation of an Action Plan for the Continuous Quality Improvement (CQI)
Programme (ideally for top and middle level managers).
SESSION PLAN - 13

277
Identify the barriers and challenges come across in the implementation of CQI
programme and ways and means to overcome these barriers (ideally for operational
level staff).
GROUP WORK
Time: 60 Minutes
Each group should select a leader, note taker, time keeper and a presenter. The coordinator
should facilitate the group work and he/she should not provide his/her ideas to the group.
The group can make notes in half sheets. The final presentation must be written in flip
charts. If resources are available, the presentation can be done in Power-Point.
PRESENTATION
Time: 75 Minutes
Each group should be given 10 minutes for the presentation. The presentation should be
done by the presenter of the group, in the presence of the group leader. After the
presentation, other participants should be allowed to comment or ask questions which the
leader of the relevant group or the presenter should answer. Then the resource personnel
should comment on the presentation or ask for any clarifications from the presenting group.
GROUP WORK WRAP-UP AND CLOSING
Time: 05 Minutes
Thank all participants for involving in the group work. Ask participants to apply what they
have done during the work group.

278
QUICK CHECK FOR FACILITATOR/TRAINER (To be filled after every
session)
Reflects on how the training went on to develop training skills, to plan on future training
topics and to note potential next steps
Topic: Group Work Date: ________
Attendees:
___________________________________________________________________________
___________________________________________________________________________
___________________________________________________________________________
___________________________________________________________________________
Observations Made by the Trainer:
___________________________________________________________________________
___________________________________________________________________________
___________________________________________________________________________
___________________________________________________________________________
___________________________________________________________________________
___________________________________________________________________________
___________________________________________________________________________
___________________________________________________________________________

279
CHAPTER 13: GROUP WORK
13.1 Introduction
Research has shown that an important factor in improving trainees’ learning, motivation
and behaviour at training programmes is the opportunity given to them to work in groups.
Given that we retain 90% of what we do when we work in a group whereas, we retain much
less by studying individually; it would seem fitting that the group work promotes
collaborative learning. Collaborative learning has also shown to promote a deeper
understanding, improve learners’ self-esteem and enhance generic skills such as
communication and leadership.
However, successful group work demands a lot of skill on the part of teachers, many of
whom may often feel reluctant to use it because of lack of confidence, experience and
insufficient training, or because they do not wish to undermine their control, particularly in
challenging situations.
Using co-operative teaching and learning processes in the classroom can have many benefits
for both teachers and students (Kagan, 1992). Trainers should:
Organize classes into small groups with a common goal
Ensure that trainees within a group work collaboratively until they have completed
the task
Ensure that trainees engage in peer teaching, learning and assessment
Reward collaborative efforts with trainees.
13.2 Setting up Groups/Teams
Important considerations in setting up collaborative learning groups include the group size,
group composition, role allocation, group rules and modes of communication. The ideal
group size is 6-8 members, for maximum engagement and individual accountability of group
members. The group composition may be based on the aims of the training programme. In
developing skills in Healthcare Quality and Safety for which all health professions are
280
responsible, it may be useful to have multi professional groups. However, facilitators need
to be aware of issues such as hierarchy and inter professional conflicts within the group
members and actively promote teamwork even within such groups. Setting up of ground
rules, promoting shared mental models of group goals and tasks, understanding the stages
of group development and facilitating progression through each stage, promoting effective
modes of communication during and after group discussions and establishing systems for
self/peer/facilitator feedback on group process, accountability, and performance are
important in promoting collaborative learning.
When setting up collaborative learning activities, it is important for the trainer to use
his/her professional judgment to decide on the best option whether to assign roles for the
trainees or to let them decide roles for themselves within their groups. The educational
maturity of the trainees, their place of work (trainees of the same institution can be
grouped together), their familiarity with group work and the available time for the
collaborative activity can also be key determining factors. However, letting trainees decide
for themselves can sometimes incur the risk of them repeatedly playing the safe and
choosing the role they feel most comfortable with, as opposed to stepping outside their
comfort zone and choosing another position which, while daunting, might equally
encourage them to develop other skills. To help overcome such situations, the trainer might
opt for role rotation to ensure that all trainees experience several roles. Other factors to
bear in mind when assigning groups might be to mix high and low contributors (as
evidenced from previous activities), considering gender, age and cultural background. It is
important that every trainee understands his/her role within the group.
Each group should select its leader, note taker, time keeper and the presenter.
The group leader makes sure everyone knows what to do to complete the task. The Group
Leader needs to:
Keep the group on the task
Ensure that everyone has a chance to participate
Encourage everyone to listen and consider other's views

281
Summarize the outcome for the group
It is the note taker’s job to make notes for the group. The Note Taker will need to:
Listen carefully
Write clearly
Summarize main points
Check the accuracy of notes with the group
It is the timekeeper’s job to ensure that the task is completed in time. The Timekeeper will
need to:
Give regular time checks
Encourage the group to keep to time
Indicate when a task is about to end (2 minute warning)
It is the presenter’s job to report on the group’s ideas. The Presenter will need to:
Record information clearly and accurately
Summarize the main ideas
Structure feedback clearly
Report back to trainer/plenary
13.3 Strategies to Enhance Effective Group Work
In addition to carefully managing the allocation of roles within groups, trainers should also
make themselves available to their trainee groups, if or when needed, and:
Discourage trainee anonymity by limiting the size of the group;
Allow sufficient time for trainees to plan and discuss within their groups;
Foster creativity through encouraging trainees to engage in debate as part of their
group discussions;
Promote fruitful collaborative talk;
Give trainees both open-ended tasks (e.g. a wide theme to talk about) and enjoyable
activities;
282
Design formative assessment of both the work itself and the group work;
Encourage presentations which engage the audience.
13.4 Conducting Group Work
Depending on the participants, you may ask to carry out a group work on the following
areas:
Preparing an Action Plan for the Continuous Quality Improvement (CQI) programme
Identify the barriers and challenges come across in the implementation of the CQI
programme and means and ways of overcome those barriers.
Preparation of an Action Plan
Preparing an Action Plan may be for the organization as a whole or the participant’s relevant
units. The preparation of the action plan should be done where the decision makers, heads
of institutions or unit heads participate. It should be follow the following format.
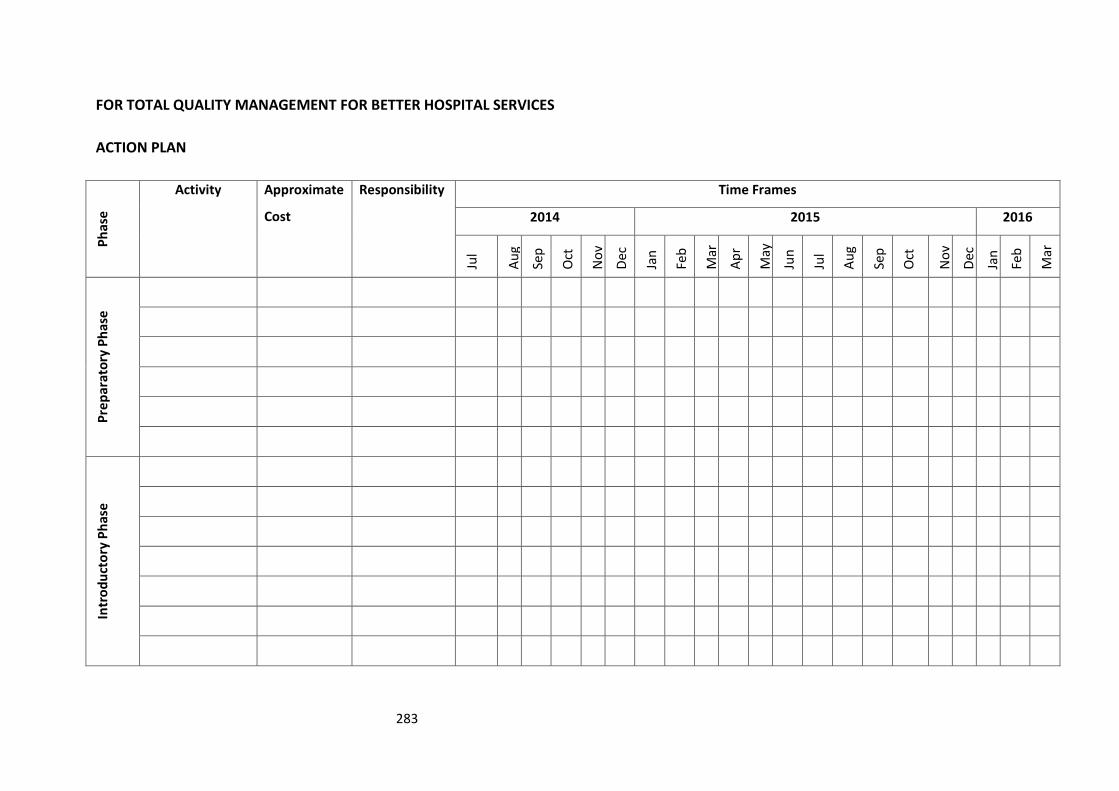
283
FOR TOTAL QUALITY MANAGEMENT FOR BETTER HOSPITAL SERVICES
ACTION PLAN
Ph
ase
Activity Approximate
Cost
Responsibility Time Frames
2014 2015 2016
Jul
Au
g
Sep
Oct
No
v
Dec
Jan
Feb
Mar
Ap
r
May
Jun
Jul
Au
g
Sep
Oct
No
v
Dec
Jan
Feb
Mar
Pre
par
ato
ry P
has
e
Intr
od
uct
ory
Ph
ase

284
Im
ple
me
nta
tio
n P
has
e
Exp
and
ing
Phas
e
s t a i n
i n
g

285
Su
stai
nin
g P
has
e

286
Identify the Barriers and Challenges
Another important area which the group can work on is the identification of the barriers and
challenges come across in implementing a CQI programme and ways and means to
overcome those barriers. This will be an interesting area. Group work on identifying
barriers and challenges should be done by the operating level participants. The format for
the group work is given below.
Challenges and barriers come across in
implementing a Continuous Quality Improvement
(CQI) Programme
Ways and means to overcome
those challenges and barriers
1
2
3
4
5
6
7
Each group must identify at least ten such barriers and challenges and also explain the
measures to overcome those.
It is recommended to invite the respective heads of institutions during the group
presentations. During the group presentations, encourage other participants to express
their views and experiences in similar areas of such barriers and challenges.

287
13.5 Conclusion
The group work sessions should give ownership and create enthusiasm among participants.
The discussions during the presentation must be objective and not criticize individuals.
During the group work, the trainer should also verify the knowledge gained by the
participants.