Mantel Test Evaluates correlation between distance, similarity, correlation or dissimilarity...
18
Mantel Test •Evaluates correlation between distance, similarity, correlation or dissimilarity matrices •Null: no relationship between matrices •Pearson correlation (r) can be used to measure strength of relationship •r ranges from -1 to 1
-
Upload
griselda-fleming -
Category
Documents
-
view
258 -
download
3
Transcript of Mantel Test Evaluates correlation between distance, similarity, correlation or dissimilarity...

Mantel Test•Evaluates correlation between distance, similarity, correlation or dissimilarity matrices
•Null: no relationship between matrices
•Pearson correlation (r) can be used to measure strength of relationship
•r ranges from -1 to 1

Test for Significance
• Evaluates the results from repeated randomizations
• If randomizations frequently produce a correlation stronger or as strong as the original data little evidence that correlation differs from zero.
• Order of randomization is important- order of row and columns are shuffled for one matrix
Randomization cont.• Mantel’s Z statistic is computed after each
permutations and a distribution is created• Z statistic from nonrandomized data is compared to the
distribution of the shuffled matrix.• If null is true, Mantel statistic will fall near the middle of
the reference distribution• 10,000 randomizations is recommended • wij = connectivity or Euclidean distance matrix and xij =
dissimilarity or distance matrix
wijxij
n
n
i =1 j=1 i=j j=i
Z=

What is really computed?
• Is the relationship between distance measures not the raw data

When to use
Examples:
• Two groups of organisms form same set of sample units
• Community structure before and after disturbance
• Genetic distance and geographic distance
• Ecological distance and geographic distance

Partial Mantel Test
• Quantifies the relationship between two matrices while controlling for the effects of a third one.

Problem with Mantel
• Relationship is a global outcome for all variables
• Can pick out which variables have the most influence
• Solution:
Use ordination: CCA and RDA

Reference Rosemary Scrub
Semi-improved Pasture Disturbed Scrub
Vegetation Types

1 2 3 4
4 5 6 7
8 9 10 12
13 14 15 16
17 18 19 20
21 22 23 24
25 26 27 28
29 30 31 32
1 2 3
4 5
6 7 8
9 10
11 12 1316 X 16 m
2 x 2 m
Macroplot
Subplot
Quadrat
40 x 40 cm
Sampling Design

Data Matrices
Seed BankHorn-Morisita
Percent CoverBray-Curtis
X-Y CoordinatesEuclidean
1 2 3 4
4 5 6 7
8 9 10 12
13 14 15 16
17 18 19 20
21 22 23 24
25 26 27 28
29 30 31 32

Mantel Test in R
• ecodist and vegan package• Both matrix must be identical and contain x and
y coordinates• Must choose an appropriate distance measure:- Bray-Curtis - Manhattan- Euclidean- Morisita- Horn-Morisita
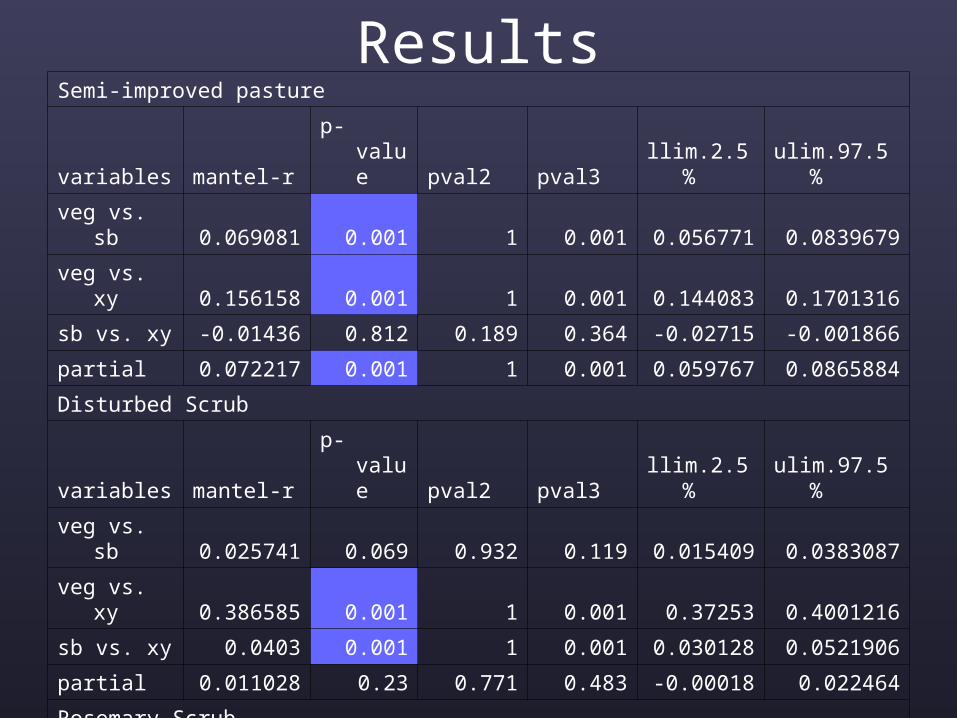
ResultsSemi-improved pasture
variables mantel-r p-value pval2 pval3 llim.2.5% ulim.97.5%
veg vs. sb 0.069081 0.001 1 0.001 0.056771 0.0839679
veg vs. xy 0.156158 0.001 1 0.001 0.144083 0.1701316
sb vs. xy -0.01436 0.812 0.189 0.364 -0.02715 -0.001866
partial 0.072217 0.001 1 0.001 0.059767 0.0865884
Disturbed Scrub
variables mantel-r p-value pval2 pval3 llim.2.5% ulim.97.5%
veg vs. sb 0.025741 0.069 0.932 0.119 0.015409 0.0383087
veg vs. xy 0.386585 0.001 1 0.001 0.37253 0.4001216
sb vs. xy 0.0403 0.001 1 0.001 0.030128 0.0521906
partial 0.011028 0.23 0.771 0.483 -0.00018 0.022464
Rosemary Scrub
variables mantel-r p-value pval2 pval3 llim.2.5% ulim.97.5%
veg vs. sb 0.012174 0.077 0.924 0.137 0.005401 0.0182065
veg vs. xy 0.098474 0.001 1 0.001 0.088841 0.107974
sb vs. xy 0.012598 0.143 0.858 0.284 0.003271 0.0220178
partial 0.010987 0.095 0.906 0.174 0.004906 0.0177172

Pasture
0 500 1500
-0.0
50
.00
0.0
50
.10
Distance
veg
eta
tion
ma
nte
l r
0 500 1500
-0.0
15
-0.0
05
0.0
05
0.0
15
Distance
see
d b
an
k m
an
tel r

Disturbed Scrub
0 500 1500
-0.1
0-0
.05
0.0
00
.05
0.1
00
.15
Distance
veg
eta
tion
ma
nte
l r
0 500 1500
-0.0
10
.00
0.0
10
.02
0.0
3
Distance
see
d b
an
k m
an
tel r

Rosemary Scrub
0 500 1500
0.0
00
.05
0.1
0
Distance
veg
eta
tion
ma
nte
l r
0 500 1500
-0.0
05
0.0
00
0.0
05
0.0
10
Distance
see
d b
an
k m
an
tel r


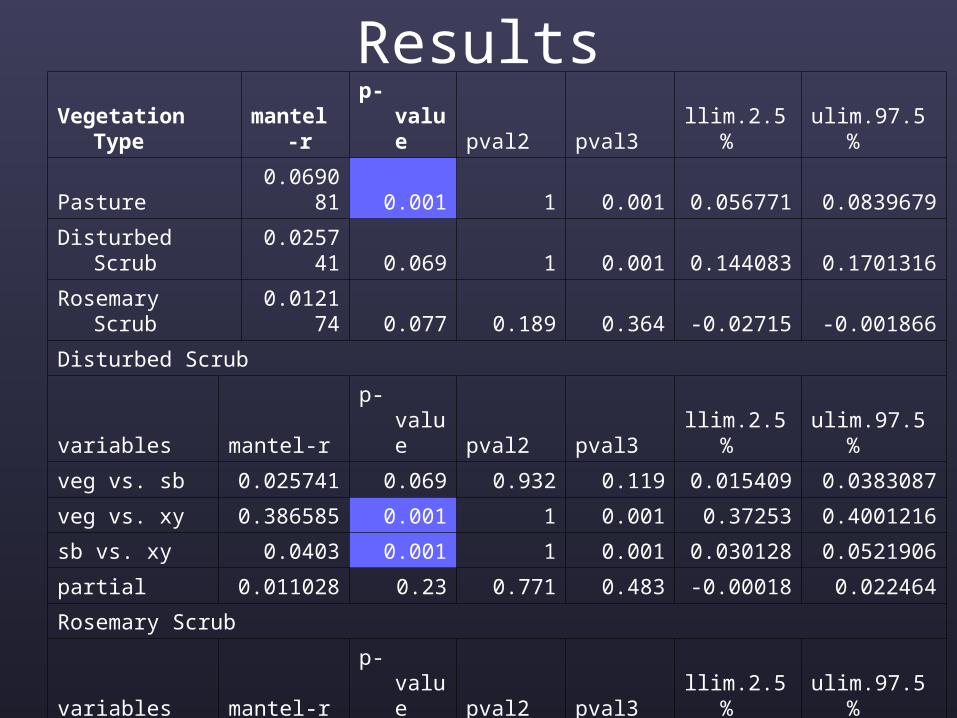
ResultsVegetation Type mantel-r p-value pval2 pval3 llim.2.5% ulim.97.5%
Pasture 0.069081 0.001 1 0.001 0.056771 0.0839679
Disturbed Scrub 0.025741 0.069 1 0.001 0.144083 0.1701316
Rosemary Scrub 0.012174 0.077 0.189 0.364 -0.02715 -0.001866
Disturbed Scrub
variables mantel-r p-value pval2 pval3 llim.2.5% ulim.97.5%
veg vs. sb 0.025741 0.069 0.932 0.119 0.015409 0.0383087
veg vs. xy 0.386585 0.001 1 0.001 0.37253 0.4001216
sb vs. xy 0.0403 0.001 1 0.001 0.030128 0.0521906
partial 0.011028 0.23 0.771 0.483 -0.00018 0.022464
Rosemary Scrub
variables mantel-r p-value pval2 pval3 llim.2.5% ulim.97.5%
veg vs. sb 0.012174 0.077 0.924 0.137 0.005401 0.0182065
veg vs. xy 0.098474 0.001 1 0.001 0.088841 0.107974
sb vs. xy 0.012598 0.143 0.858 0.284 0.003271 0.0220178
partial 0.010987 0.095 0.906 0.174 0.004906 0.0177172