Manipulation and Flow of Biological Fluids in Straight Channels Micro Machined
5
CUN. CHEM. 40/1,43-47(1994) #{149} utomation an d A n al yt ic al T ec hn iq ue s CUNICAL CHEMISTRY, Vol.40,No. 1, 1994 43 Manipulation and Flow of BiologicalFluids in StraightChannels Micromachined in Silicon Peter W ilding,’ Joseph Pfahier,2 Haim H. Bau,3 Jay N. Zem el,4 and Larry J . Krlcka”5 Analysis o f minute sample volumes is a major analytical challenge that requires an understanding of fluid flow in microstructures. Accordingly, flow dynamics of biological fluids and cell suspensions in straight glass-capped sili- co n microchannels (40 to 150 m wide, 20 and 40 m deep) were s tu die d. We demonstrated that these micro- structures are appropriate components fo r microfluidic analytical devices. Different fluids were easily manipu- lated in the microchannels, and measurements of flow rate as a function of pressure for whole human blood, serum, plasma, a nd cell suspensions revealed non-New- tonian behavior. By means of micromach ned filters (5 m ) located in channels, blood cells and microparticles were effectively separated from nanoliter-sized samples, clearly indicating the future role of microstructures for a v ar ie ty of analytical purposes. Indexing Terms: viscosity/shear rate/non-Newtonianfluids/micro- channels A trend in clinical laboratory analysis has been th e progressive reduction in the volume of sample required fo r assay. Early methods required at least 1 mL of sam- ple, but modern-day techniques can analyze volumes as small as 1 L (1). Various factors a re r es po ns ib le fo r this trend, including concerns over the hazard posed by bloodborne pathogens in some clinical samples (huma immunodeficiency virus; hepatitis A, B, and C), pa- t ie nt s’ convenience (fingerstick samples), reduction in reagent usage, and cost of testing. The next a na ly tic al challenge is to further reduce sample volumes to the nanoliter-picoliter range (10_9_10_12 L). M an y clini- cally important substances are present at micromole per liter concentrations (10-s m ol/L ); thu s, 1 nL of sample could contain 1 fmol of analyte, w hich corresponds to 100 miffion molecules. This umber of molecules is well within th e detection range of several analytical m eth od s (e.g., chemiluminescence an d fluorescence) (2). The ma- jo r hurdle to implementing analysis on nanoliter an d picoliter v lumes is that th e m ic ro flu id ic s required fo r handling such small volumes has n ot been developed. W e believe that micromachined sfficon structures in- corporating interconnected m icro ch ann els an d cham- bers will p ro v id e the necessary devices for handling and anal zing very small volumes of sample (3, 4). Silicon micromachining has been used to produce microme- Departments of ‘Pathology and Laboratory Medicine, ‘Me- chanical Engineering and A pplied Mechanics, and4 E lectrical E n - gineering, University of Pennsylvania, P h il ad e lp h ia , P A 19104. ‘APD C ry og en ic s, Allentown, PA 18103. 5Author f or c or re sp on de nc e. Fax 215-662-7529. ReceivedJune 16 , 1993; accepted September 10 , 1993. chanical devices such as valves, filters, cantilevers, ro- tors, and gas chromatographs (5-9). This technology is readily ada pta ble to the development of microfluidic analytical devices. We u se d photolithographic tech- niques to fabricate straight channels, 20-40 m deep, an d filter systems of different geometries on silicon chips. The advantage of this new test system is that disposable, highly reproducible, complex microchannel networks can be batch-manufactured inexpensively. We report here the flow characteristics of biological fluids and blood cell suspensions in straight channels of differing size with volumes in the nanoliter range. MaterIals a nd Methods Fabrication o f microchannels. Microchannels and ml- crochannel structures (Fig. IA) w e re fabricated by using planar p ho to lith og ra ph y or reactive io n etching in sili- con (400-sm-thick wafers, crystallographic orientation <1,1,0>, anisotropic K O H etchant) (SGS Thomson, Montgomeryville, PA) w ith photolithographic masks (Align-Rite, Santa Clara, C A ). The wafers were diced into 17 x 11 mm chips and then sealed with 1.58-mm- thick Pyrex glass (Mooney Precision Glass, Huntington, W V) by using a diffusive bonding technique (10). A n entrance and an exit port (500 x 500 ) ere etched through te 400-pin-thick silicon at each end of the 11.7-mm-long channel. For each batch of channels, the depth of one channel was measured w ith a surf ce pro- ifiom eter with a pre ision of ± 1%. Channels produced w ith the anisotropic etchant had a trapezoidal cross- section (Fig. 1 B ). Flow studies. W e quantitated fluid flow in microchan- nels w ith th e experimental apparatus shown in Fig. 2. A chip was held in a custom-built holder (Faulkner Instru- ments, Pitman, N J) on a microscope stage (Aristomet, Wild L eitz, Heerbrugg, Switzerland). T h e inlet port of the chip was connected to a syringe, housed in a syringe driver (Model 350; Sage Instruments, Boston, M A ), an d actuated by a stepper m otor (marimum force 20 N). A load cell measured the applied force from which th e d riv in g p re ssu re w as deduced. T h e f or ce m e as ur em e nt was corrected for frictional losses in th e system, i.e ., due to f ric tio n between the s yr in ge plunger and the syringe barrel an d pressure losses in the s yr in ge itself. T h e force required to overcome these frictional losses w as deter- mined by filling a syringe with distilled water and then measuring th e force required to empty the syringe as a function of flow rate. The functional losses ranged from 5% to 20 % of the total force at the highest to the lowest pump speed, respectively. The flow rate for each of the speeds w as obtained b y timing th e syringe plunger dis- placement. A ll measurements were conducted under a
Transcript of Manipulation and Flow of Biological Fluids in Straight Channels Micro Machined

8/6/2019 Manipulation and Flow of Biological Fluids in Straight Channels Micro Machined
http://slidepdf.com/reader/full/manipulation-and-flow-of-biological-fluids-in-straight-channels-micro-machined 1/5
CUN . CHEM.40/1,43-47(1994) #{149}utomation an d An al yt ic al T ec hn iq ue s
CUNICAL CHEMISTRY,Vol .40, No. 1, 1994 43
Man ipu la tion and F low o f B io logica lF lu ids in S tr aigh t Channe ls M ic romachined
in Si licon
Peter W ild ing,’ Joseph Pfahier,2 Haim H . Bau,3 Jay N . Zem el,4 and Larry J. Krlcka”5
Analysis of m in ute s amp le v olume s is a m ajo r analyt ical
chal lenge th a t r equ ir es an unde rs ta nd ing o f flu id f low inmic ros tructu res . Accord ing ly , f low dynamics o f b io log ica l
f lu ids and cell suspensions in s tr aigh t glass-capped sili-
co n microchannels (40 to 150 m wide, 20 and 40 m
deep) we re s tu die d. W e demonst ra ted tha t these micro -structures a re a pp ro pr ia te components fo r microfluidic
analy tic a l devices. D iffe re nt flu id s w ere easily manipu-la te d in th e m ic ro ch an ne ls , a nd me as ur ements o f flow
ra te as a function o f p re ss ure fo r w ho le h um an blood,
se rum, p lasma , and ce ll suspensions reveal ed non -New-
to nia n b eh av io r. B y me an s o f m ic romac hin ed f ilte rs (5
m) located i n channe ls , b lo od c ells a nd m ic ro pa rtic le s
were e ff ec ti ve ly sepa ra ted f rom nano lit er -s ized samp les ,
c lea rly i nd ica ti ng the future ro le o f m icros truc tu res for av ar ie ty o f a na ly tic al p urp os es .
Indexing Terms: viscosity/shear rate/non-Newtonianfluids/micro-
channels
A trend in clinical laboratory analysis has been th e
progressive reduction in the volume of sample required
fo r assay. Early methods required at least 1 mL of sam -
p le , b ut modern-day tech niques can analy ze volumes as
small as 1 L (1). Various factors a re r es po ns ib le fo r
th is trend, including concerns over th e hazard po sed by
bloo db orne patho gen s in some clinical sam ples (hum an
immunodeficiency virus; hepatitis A , B , and C ), pa-
t ie nt s’ c on v en ie nc e (fingerstick samples), reduction in
reagent usage, and cost of testing. The n ex t a na ly tic al
challenge is to further reduce sample volumes to the
nanoliter-p icoliter range (10_9_10_12 L). M any clini-
cally im portant substances are present at micromole per
liter con cen tration s (10-s m ol/L ); thu s, 1 nL of sample
could contain 1 fmol of analyte, w hich corresponds to
100 m iffion molecules. This num ber of molecules is well
within th e detection range of several ana lytical m eth od s
(e.g., chemiluminescence an d fluorescence) (2). The m a-
jo r hurdle to implementing analysis on nanoliter an d
picoliter volum es is that th e m ic ro flu id ic s r eq uire d fo r
handling such small volumes has not been developed.
We b elie ve th at m icro ma ch in ed sfficon structures in -
corporating in tercon nected m icro ch ann els an d cham-
b ers w ill p rov ide th e necessary devices for hand ling and
analyzing very small volumes of sample (3 , 4 ). Silicon
m icrom achining has been used to produce m icrome-
Departments of ‘Pathology a n d La bo ra to ry Medicine, ‘Me-
chanical E ngineering and A pplied M echanics, and4 E lectrical En-g in e er in g , Un iv er si ty of P enn sy lv an ia , P h il ad e lp h ia , PA 19104.‘APD C ry og en ic s, A lle nt ow n , PA 1 81 03 .5 Au th or f or c or re sp on de nc e. F ax 215-662-7529.ReceivedJune 16 , 1993 ; a cc e pt ed S ept ember 10 , 1993.
chanica l devices such as valves, filters, cantilevers, ro-
tors, and gas chromatographs (5-9). This technology is
read ily ada pta ble to the development of microfluidic
analytical devices. W e u sed p hotolith ograph ic tech-
n iques to fabricate straight channels, 20-40 m deep ,
an d filter system s of different geo metries on silico n
ch ip s. The advantage of this new test system is that
disposable, highly reproducible, complex microchannel
networks can be batch-manufactured inexpensively.
We report here the flow characteristics o f b io lo g ic a l
flu id s a nd blood cell suspensions in straight channels of
differing size with volumes in the nanoliter range.
Mate rIa ls a nd Methods
Fabrication of microchannels. Microchannels and m l-crochannel structures (Fig . IA ) we re f ab ric ate d by using
planar p ho to lith og ra ph y o r reactive io n etching in sili-
con (400-sm -thick wafers, cry stallog ra phic orien tation
<1,1,0>, anisotropic KOH etchant) (SGS Thomson,
M ontgom eryville, PA) w ith photolithographic m asks
(Align-Rite, Santa Clara, CA ). The wafers w ere diced
into 17 x 11 mm chips and then sealed w ith 1 .58-mm -
thick P yrex glass (Mooney P re cis io n G la ss , H u ntin gto n,
W V) by using a diffusive bonding technique (10). An
entrance and an exit port (500 x 500 m ) were etched
through the 400-pin-th ick silicon at each end of the
11.7-m m-long channel. For each batch of channels, the
depth of one channel was measured w ith a surface pro-ifiom eter w ith a precision of ± 1%. C han nels p rod uced
w ith th e an isotrop ic etchant had a trapezoidal cross-
section (F ig. 1B ).
Flow studies. We quantitated f lu id flow in m ic ro ch an -
nels w ith th e experim ental apparatus shown in Fig. 2. A
chip was held in a custom-built holder (F aulkner Instru-
ments, Pitman, NJ) on a m icroscop e stage (Aristomet,
Wild L eitz, H eerbrugg, S witzerland). The in let port of
the ch ip was connected to a syrin ge, housed in a syrin ge
driver (M odel 350; Sage Instruments, B oston, M A ), an d
actuated by a stepper m otor (m arimum force 20 N ). A
load cell m easured the applied force from which th e
d riv in g p re ssu re w as d edu ced . The f or ce m e as ur em e nt
was corrected for frictional lo sse s in th e system, i.e ., d ue
to f ric tio n b etw ee n th e s yr in ge plunger and the syringe
barrel an d pressure losses in th e s yr in ge itself. The force
req uired to overcom e these fr ic tio na l lo ss es w as d eter-
mined by filling a syringe w ith distilled water and then
measuring th e force required to empty the syringe as a
function of flow rate. The fun ction al losses rang ed from
5% to 20% of the tota l force at the h ighest to the lowest
pump speed, respectively. The flow rate for each of the
speeds was obtained by t iming th e syringe plunger dis-
placem ent. A ll m easurem ents were conducted under a

8/6/2019 Manipulation and Flow of Biological Fluids in Straight Channels Micro Machined
http://slidepdf.com/reader/full/manipulation-and-flow-of-biological-fluids-in-straight-channels-micro-machined 2/5
Flow Channel- \B
Inlet Sump
SIllcon-i
AA
LOADca
1=c
I YRDRNER
Fig . 2. Expe rImen ta l a pp a ra tu s fo r o bs er vin g a nd recording flo w Insi licon microchannels .
VDU , v i d eo d is p la y u n it ; VCR, videocassette recorder.
Out let Sump
A
4 4 C UN IC ALCH EM IS TRY,Vol. 4 0 , No . 1 , 1994
a. Top View
Row Channe l
Inlet Sump - Silicon Out let Sump
b . C ro ss -Sec tio na ’V iew (Sec t. A -A )
c . C hann el C ro ss -S ec tio n (S ec t. B -B )F ig . 1 . (A ) Silicon chip w ith tw o straigh t channels (airows) (upperchannel 60 ian wide, low er 80 cufl wide); (B ) Schematic of s i li conchip.
m icroscope to detect channel clogging. The pressure
losses in the syringe and supp ly p ip ing was <1% of th e
to tal pressure drop.
Flow in the channels was observed and recorded w ith
a black an d w hite television cam era (D age-M TI, M ich-
igan City , IN ) and a videocassette recorder (P VM -122;
Sony, Teaneck, N J). No failures were detected in th e
diffusive bonded glass-silicon junctions in an y of the
chips studied. A ll studies w ere perform ed at am bien t
temperature (22.3 ± 1.5#{176}C)n a n e nv iro nm e nta lly con-
t ro ll ed l ab o ra to ry .
Biological samples and m icrob ead s. Blood from a
h ealthy v olun teer (J.P .) w as collected into heparinized
and plain tubes. A leukocyte (W BC) suspension was
prepared b y u sin g Lymphocyte Separation Medium (O r-
ganon Tekn ika, Durham , NC) (11). Washed erytbro-
cytes (RBCs) were prepared with isotonic sa lin e. L atex
m icrobeads (5 .78 pin diameter) were purchased from
Polysciences (Warrington, PA).
P rotein -co ated cha nne ls. The inside surfaces of some
of the microchanneis were coated w ith albumin b y fill-
ing them with a solution of albumin (5 0 g/L ) (Sigma, St .Louis, MO), and then drying the channels in a m icro-
wave oven .
Results
We investigated the flow of complex fluids (whole
bloo d, serum , washed RBCs an d WBCs) from a 50 0 x
500 m entrance sump into straig ht c han nels (11.7 mm
long) w ith cross-sectional dimensions 80 &m wide (top)
x 20 m deep (volume -17 nL) an d 150 m wide (top)
x 40 p in deep (volume -64 nL ). The results of ou r
measurements are depicted in Figs. 3 and 4 for the
40-pin- and 20-pin-deep channels, respectively . F igs. 3A
and 4A show thepressure
head (thepressure
needed to
drive the flow ) as a function o f f low rate. Figs. 3B and 4B
dep ict the pressure head needed to transport various
biological fluids (APB) norm alized w ith th e pressure re -
quired to transport w ater CAP) at the same flow rate
(relative viscosity &R = P3/iP).
Although it is conven tional in flu id mechanics topre-
sent resu lts as functions of th e Reynolds n um ber (c ross-
sectional averaged velocity x effective diameter/viscos-
ity), w e have not done so because of possib le ambiguity
in the definition of th e viscosity of biological fluids that
e xh ib it n on -N ewto ni an behavior.
150-pm-wide x 40 -pin -deep ch an nel. Flow rate as a
function of pressure head and relative viscosity for d is-
tilled water, serum , and RBCs are shown in Fig. 3. The
p ressu re re quire d to ach ieve a given flow rate increased
as the complexity an d viscosity of th e flu id increased -
e.g., for a flow rate of 0.25 mLlm in , distilled water re-
quired a pressure of-75 kPa, whereas th e identical flow
rate w ith whole blo od requ ired >250 kPa (Fig. 3A) .
Whole blood,, diluted 3500:1 in iso to nic sa lin e to give th e
same cell concentration as the WBC preparation, re-
quired less driving force than th e WBCs at a given flow
rate. T his is because whole blood is made up primarily of
RBCs, which are highly flexib le an d much smaller than
8/6/2019 Manipulation and Flow of Biological Fluids in Straight Channels Micro Machined
http://slidepdf.com/reader/full/manipulation-and-flow-of-biological-fluids-in-straight-channels-micro-machined 3/5
A
I50 0
45 0
40 0
35 00
a-- 30 04)
25 0(4
20 0
a- 15 0
10 0
50
I
1 60 0
1 4 0 0
I
00.03
o D istilled Woter - -#{149}Serum - - -
A RBC in s al in e - - -
6. 5
0.09 0.15 0.22 0.28 0.34 0.40 0.46 0.53 0.59 0.65F lo w R ot e, m L/m in
RBCSol ine
CLINICA LCHEMISTR Y,Vol. 40 , No . 1 , 1994 45
5.5
2’45
UU,
53.5
>0
, 2. 5
1 .5
0. 5 -
0.05
p1200
- 1000
(44)
a-
0.15 0.25 0.35 0.45 0.55 0.65
F low Ro te. nL /m in
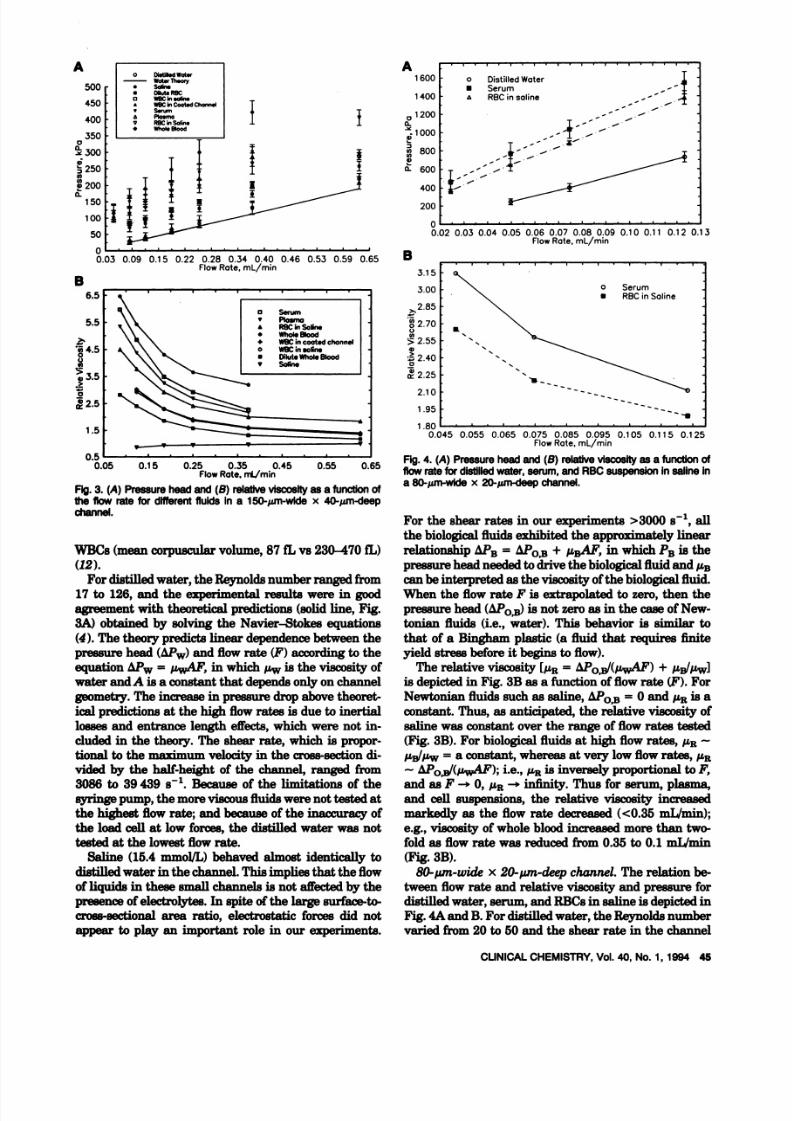
Ag. 3. (A ) P ressure head and (B ) r ela tiv e v is co sity a s a f un cti on o fth e flow r at e f or different fluids in a 150-m -w ide x 40-1an-deep
channel.
W BC s (m ean corpuscular volume, 87 fL vs 230-470 fL)
(12).
For distified w ater, the Reynolds num ber ranged from17 to 126, and the experim ental results were in good
agreement with theoretical predictions (solid line, F ig.
3A ) obtained by solving th e Navier-Stokes equations
(4). The theory p re dic ts lin ea r dependence between th e
pressure head (SF ) and flow rate (F ) according to the
equation -“w = AF, in wh ich w is the viscosity of
water and A is a constant that depends on ly on channel
geometry. The increase in pressure drop above theoret-
i ca l p re d ic ti on s at the h igh flow rates is due to inertial
losses an d en tra nc e len gth effects, which were not in -
duded in the theory. The shear rate, wh ich is propor-
tional to the mrnrimum velocity in the cross-section di-
vided by the half-height of the channel, ranged from
3086 to 39439 s’. Because of the l imitations of the
syringe pum p, the m ore viscous fluids w ere no t tested at
the h ighest flow rate; and because of the inaccuracy of
th e load cell at low forces, th e distilled water was not
tested at the lowest flow rate.
Saline (15.4 mmol/L) behaved alm ost identically to
distified water in the channel. This imp lies that the flow
of liquids in these sm all channels is not affected by the
presence of electro lytes. In spite of th e large surface-to-
cro ss-sec tio na l a re a ratio, electrostatic forces d id not
appear to play an important role in our experiments.
B
80 0
60 0
40 0
20 0
00.02 0.03 0.04 0.05 0.06 0.07 0.08 0.09 0.10 0 .11 0 .12 0.13
F lo w R ot e, m L/m in
3.15
3.00
>2.85
2.70
2.55
. 2.400
4)
a - 2 .2 5
2.10
1.95
1.800.045 0.055 0.065 0.075 0.085 0.095 0.105 0.115 0.125
F lo w R ote , m L/m in
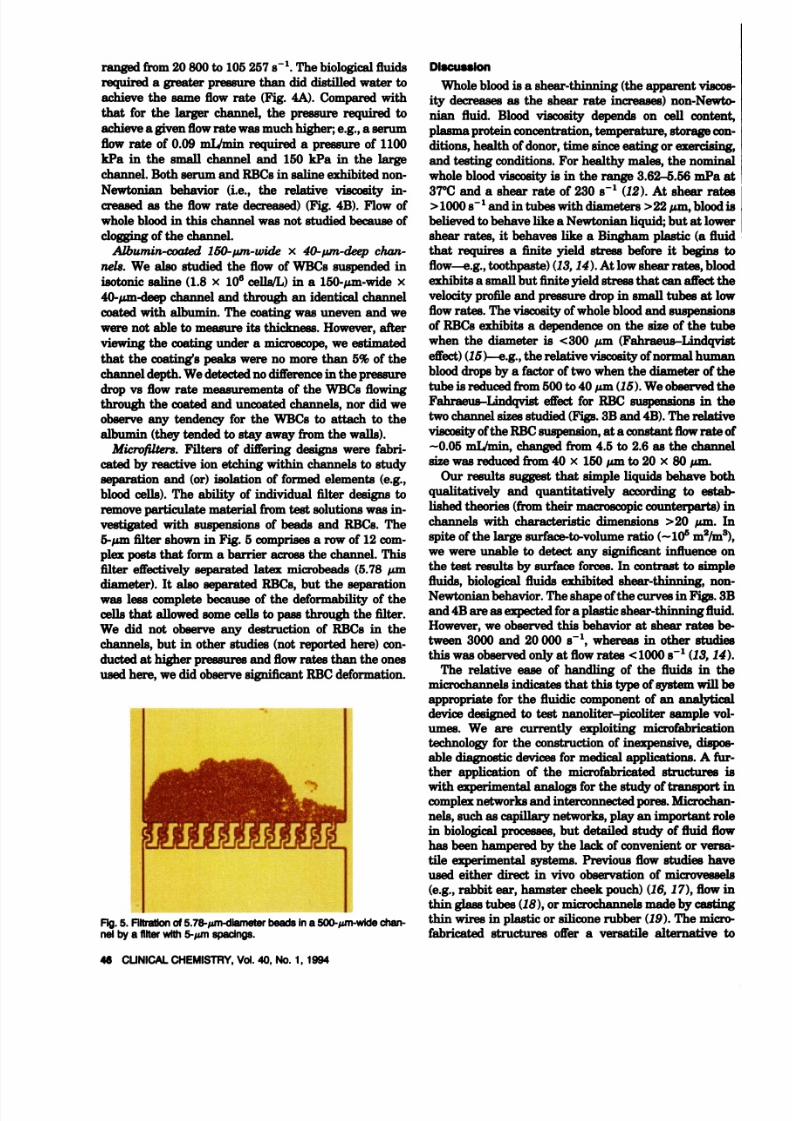
Fig. 4. (A ) P ressure head an d (B ) re la tiv e v is co sity a s a fu nc tio n o fflow rate fo r d i st il led wa t er , se rum, an d R BC suspension in saline ina 80-L m-w tde x 20-1inI-deep channel.
For the shear rates in our experiments >3000 s’, all
th e b iolog ical fluid s ex hib ited the approxim ately linear
relationship 2B = -‘O ,B + i5A1 in wh ich PB is the
pressu re head needed to drive th e biological flu id and 1B
can be interpreted as th e viscosity o f t he b io lo gic al fluid.When the flow rate F is extrapolated to zero, then the
pressure head (AP0) is not zero as in the case of New -
tonian fluids (i.e ., water). Th is behavior is sim ilar to
that of a Bingham plastic (a flu id that re qu ires fin ite
yield stress before it begins t o f lo w) .
T he r ela tiv e viscosity [P R = P/(AF) + ‘w]
i s d ep ic te d in Fig . 3B as a function of flow rate (F). For
Newtonianfluidssuchassaline,APOB = 0andRisa
constant. Thus, as anticipated, th e r ela tiv e viscosity of
saline was constant over the range of flow rates tested
(Fig. 3B). For b io log ica l flu id s at high f lo w r ate s, 1R -
FLat/Lw= a constant, whereas at very low flow rates, FL R
- P/(,AF); i.e., ILR i s i nve rs e ly proportional to F ,
an d as F - 0, ILR - infinity. Thus fo r serum, plasma,
and cell suspensions, th e rela tive viscosity increased
markedly as the flow rate decreased (<0.35 mI.dmin);
e.g., viscosity of w hole blood increased more than two-
fo ld as flow rate was reduced from 0.35 to 0.1 mL/min
(Fig. 3B).
80-pm-wide x 20-pm-deep channel. The relation be-
tween flow rate and relative viscosity and pressure for
distified w ate r, seru m, an d RBCs in saline is dep icted in
Fig . 4A and B. For distilled water, the Reynold s num ber
varied from 20 to 50 an d th e shear rate in the channel
8/6/2019 Manipulation and Flow of Biological Fluids in Straight Channels Micro Machined
http://slidepdf.com/reader/full/manipulation-and-flow-of-biological-fluids-in-straight-channels-micro-machined 4/5
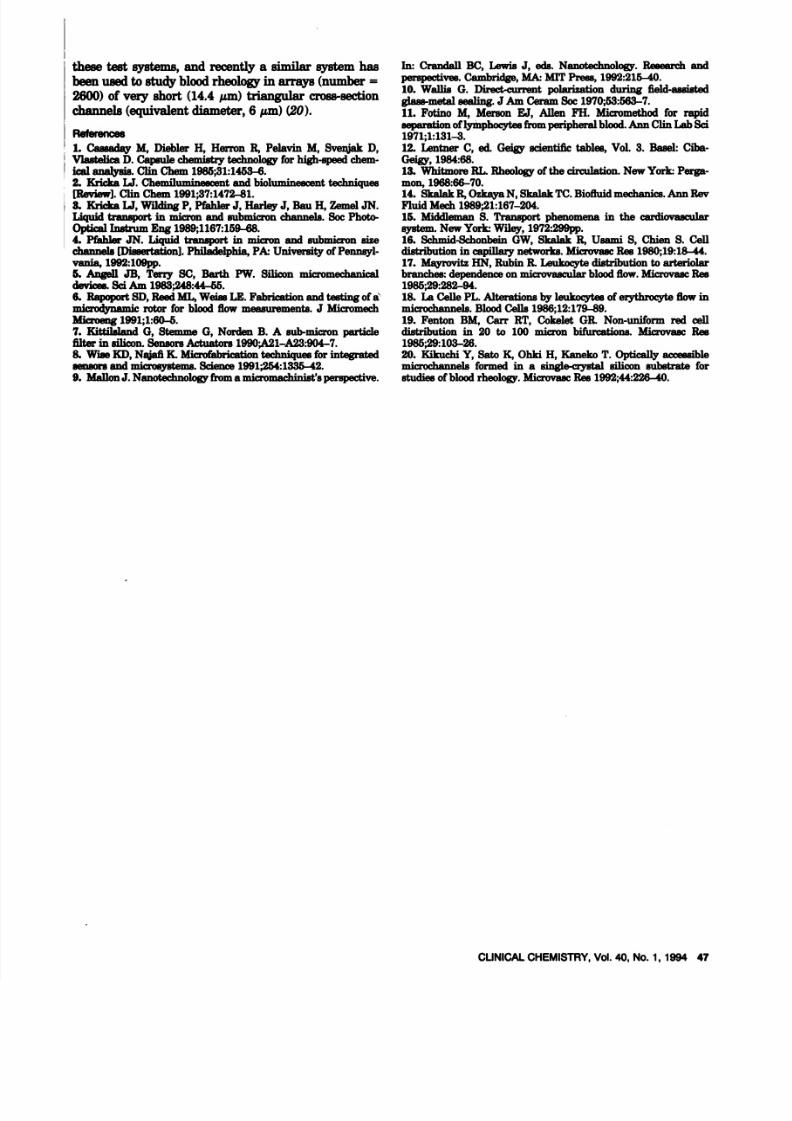
Ag. 5. F il tr at io n o f 5 .7 8 -am -d iamet er b e ad s ma 5 00 -tm -wi de c ha n-nel by a f il te r w it h 5 -t ni spacings.
46 C UN ICA L CH EM ISTR Y, Vol. 40, No. 1 , 1994
ranged from 20 800 to 105 257 s’. The b iological flu id s
required a greater pressure than d id distilled w ater to
achieve th e same flo w r ate (F ig . 4A). Compared with
that for the larger channel, th e p re ssu re re qu ired to
achieve a given flow rate w as m uch higher; e .g ., a se rum
flow rate of 0.09 mL/m in required a pressure of 1100
kP a in th e sm all channel and 150 kP a in the large
channel. B oth se ru m an d RBCs in s al in e e xh ib it ed non-
Newtonian behavior (i.e ., the relative viscosity in -creased as the flow rate decreased) (Fig. 4B). Flow of
whole blood in this channel was not stud ied b ecau se of
clogging o f th e channel.
Albumin-coated 150-pm-w ide x 40-pm-deep chan-
nels. We a ls o s tu die d the flow of WBC s suspended in
isotonic saline (1 .8 x 106 cells/L) in a 150-pm -w ide x
40-pm-deep channel and th rough an identical channel
coated with albumin. The coating was uneven and we
were not able to measure it s thickness. However, after
viewing the coating under a m icroscope, w e estimated
that the co atin g’s p eak s were no more than 5% of the
channel d ep th . W e detected no difference in th e pressure
drop vs flow rate measurements of the WBCs flo wingthrough th e coated an d uncoated channels, nor did we
observe any tendency for the WBCs to attach to th e
album in (they tended to stay away from th e walls).
Microfilters. Filters of differing designs were fabri-
cated by reactive io n e tc hin g w ith in channels to study
separation and (or) iso lation of form ed elem ents (e.g.,
b lo od c ells ). The ability of in div idu al ifiter designs to
remove p ar tic ula te m ate ria l from test solu tion s w as in -
vestigated with suspensions of beads and RBCs . The
5-pin filter show n in Fig. 5 comprises a row of 12 com -
plex posts that form a barrier across th e channel. This
filter effectively separated latex microbeads (5 .78 pm
diameter). It also separated RBCs, but the separationwas less complete because of the deformability of the
cells that allowed som e cells to pass through th e filter.
We did not observe any destruction of RBCs in th e
channels , but in other studies (not reported h ere ) c on -
ducted at higher pressures a nd flo w rates than th e on es
used here, w e d id o bs er ve significant RBC deformation.
DIscussIon
W hole blood is a shear-thinning (the apparent viscos-
ity decreases as th e shear rate increases) non-Newto-
nian fluid . B lood viscosity depends on cell content,
plasma p rot ei n con c en t ra ti on , temperature, storage con-
ditions, health of donor, tim e since eating or exercising,
and testing conditions. For healthy males, th e nominal
whole blood viscosity is in th e r an ge 3 .6 2-5 .5 6 mPa at
37#{176}Cnd a shear rate of 230 s (12). At shear rates>1000 s’ andintubeswithdiameters > 22 pm ,b lo od is
believed to behave like a New tonian l iquid; but at low er
shear rates, it behaves like a Bingham plastic (a fluid
that requires a fin ite yield stress before it begins to
flow-e.g., toothpaste) (13,14). At low shear rates, blood
exhibits a sm all but fin ite yield stress that c an a ffe ct th e
velocity p rofile a nd p ressure d rop in sm all tu bes at low
flow rates. The viscosity o f whol e blood and suspens io n s
of RBCs exhibits a dependence on the size of the tube
when the d iameter is <300 pm (Fahraeus-Lindqvist
effect) (15)-e.g., t he r el at iv e viscosity of normal hiimsin
b lo od d ro ps by a factor of two when the diameter of th e
tube is reduced from 500 to 40 pm (15). W e observed theFahraeus-Lindqvist effect for R BC suspensions in th e
tw o c ha nn el sizes stu died (F igs. 3B and 4B ). T he relative
viscosity o f t he RBC s us pe ns io n, at a constant flow rate of
-0.05 mL/min , changed from 4.5 to 2.6 as th e channel
s iz e w as reduced from 40 x 150 pm to 20 x 80 pm .
Our results suggest that sim ple liquids behave both
qualitatively and quantitatively according to estab-
lished theories (from their m acroscopic counterparts) in
channels w ith characteristic d imensions >20 pm . In
spite of the large surface-to-volume ratio (-10 m21m3) ,
we w ere unable to detect an y s ig nif ic an t in flu en ce on
th e test results by s urfa ce f or ce s. In contrast to sim ple
flu id s, b iological flu id s exhibited shear-th inn ing, non -N ew to nian beh avior. T he shape of the curves in Figs. 3B
and 4B are as expected for a p la st ic s he a r- th in n in g fluid.
H owever, w e observed this behavior at shear rates be-
tween 3000 and 20000 s’, whereas in o th er s tu die s
this was observed only a t flow rates <1000 s’ (1 3, 1 4) .
T he r ela tiv e ease of handling of the flu ids in the
microchannels indicates that this type of system will be
appropriate for the flu id ic componen t of an analytical
d ev ic e d es ig ne d to test nanoliter-picoliter sample vol-
um es. W e are currently exploiting m icrofabrication
technology for the construction of inexpensive, d ispos-
able diagnostic devices fo r medical app lication s. A fur-
ther app lication of the m ic ro fa bric ate d stru ctu re s is
with experimental analogs fo r th e study of transport in
c omp le x n e two rk s and interconnected pores. M icrochan-
nels, such as capillary networks, play an important role
i n b io lo g ic a l processes, but detailed study of flu id flow
has been ham pered by the lack of convenient or versa-
tile experim ental system s. P revious flow studies have
used either direct in v ivo observation of microvessels
(e .g ., r ab bit e ar , hamster cheek pouch) (1 6, 1 7), flow in
thin glass tubes (18), or microchannels made by casting
th in w ires in plastic o r silic on e ru bb er (19). T he m ic ro -
fa bric ate d s tru ctu re s offer a versatile alternative to
8/6/2019 Manipulation and Flow of Biological Fluids in Straight Channels Micro Machined
http://slidepdf.com/reader/full/manipulation-and-flow-of-biological-fluids-in-straight-channels-micro-machined 5/5
CUNICALCHEMISTRY ,V ol. 4 0, N o. 1 , 1994 47
these test system s, an d recently a similar system has
been used to s tu dy b lo od rh eo lo gy in arrays (num ber =
2600) of very short (14.4 pm ) triangu lar cross-section
channels (equivalent diam eter, 6 pm ) (20).
References
1 Cassaday M , D iebler H , Herron R , Pelavin M , Svenjak D ,
V lastelica D . C apsu le ch em istry tech no lo gy for h igh -speed chem-ic al a na ly sis . C li n C h em 1 98 5;3 1:1 45 3- 6.2. K ricka L I. Chem ilum ineacent and biolum inescent techniques
[Rev iew ]. C li n Chess 1991;37:1472-81.3. K ric ka L 1, W ild in g P , P fa hl er J, Harley J, B au H , Zemel JN .Liquid transport in m icron and sub micro n c han nels. S oc P ho to -O ptic al I ns tr uin E ng 1989;1167:159-68.4. Pfabler JN . Liquid transport in m icron and subm icron size
chan nels [D issertatio n]. P hiladelph ia, P A: U niversity of Pennsyl-vania, 1992:lO9pp.5. AngeII JB , Terry SC, Barth PW . Silicon m icromechanical
d ev ices. S d A m 19 83;2 48 :4 4-5 5.
6 . R apoport SD , Reed M L, W eiss LE. Fabrication a nd testin g o f am icrod ynam ic roto r fo r blood flow measurements. J Micromech
Microeng 1991;l:60-5.7. K ittilsland G , S tem me G, Norden B. A sub-micron partidefilte r in s il ic on . S ensor s Ac tu at or s 1 9 90A21-A23 :9 04-7.8. W ise K D, N ajafi K . Mi cr of ab ri ca ti on t ec hn iq ue s fo r integratedsensors an d m i crosys tem s. Sc ie nce 1991;254:1335 -. 42.9. Mallon J. N an ote cb no lo gy fr om a mi cr oma ch in is t’ s p er sp ec ti ve .
In : C ra nd all BC , Lewis J, ads. Nan ot ec hn ol og y. R es ea rc h an dperspectives. Cam bridge, M A M IT Press, 1992:215-40.
10 . W allis 0. D irect-current polarization during field-assisted
g la ss -m e ta l s ea li ng . JA m Ceram Soc 1970;53:563-7.11 . Fotino M , M erson EJ, A llen FH . M icromethod fo r rapidseparation of lym ph oc yte s from pe riphe ral blood . A nn C lin L ab S d1971;1:131-3.12 . Lentner C , ed Geigy scientific tables, VoL 3. Basel: Ciba-G ei gy , 1 98 4:6 8.
1 3. W hitxn ore R L. R heolo gy o f t he circ ula tio n. N ew York: Perga-mo n, 1 96 8: 66 -7 0.
14 . Skalak R , O zkaya N , Skalak TC . B ioflu id mechanics. Ann RevFluid Mech 1989;21:167-204.
15 . M idd lem an S . T ran spo rt phenomena in t he c ard io v as cu la rsy stem . N ew York: W i le y, 1 97 2: 29 9p p.
16 . Schmid-Schonbein GW , Skalak R , IJsam i 5, Chien S . Celld istribu tion in cap illary n etw ork s. M icro vasc B aa 1 98 0;19 :18 -44 .
1 7. Ma yr ov it z HN , R ub in R . L euko cy te d istrib ution to arteriolarbranches: d ep end en c e on mi crova scu la r blood f low . M i crova sc Re s1985;29:282-94.18. La Celle PL Alterations by l eu ko cy te s o f e ry th ro cy te f low inmicrochannels. Blood C e ll s 1 9 86 ;1 2 :1 7 9- 89 .
19 . Fenton BM , Carr RT , Cokelet GR. Non-uniform red celldistr ibution in 20 to 100 m icron bifurcations. M icrovaac Rea
1985;29:103-26.
20 . Kikuchi Y , Sate K , Ohki H, K an ek o T . O ptically accessib le
microchannels formed in a s in g le .c ry st al silicon substrate for
stu dies o f b loo d rheo log y. M icro vasc R es 1 99 2;44 :22 6-4 0.