Mangi L. Jat, Kent L. Martin, Yadvinder- Bijay-Singh, R. K...
17
1 23 Agronomy for Sustainable Development Official journal of the Institut National de la Recherche Agronomique (INRA) ISSN 1774-0746 Volume 31 Number 3 Agronomy Sust. Developm. (2011) 31:589-603 DOI 10.1007/ s13593-011-0005-5 Assessment of the nitrogen management strategy using an optical sensor for irrigated wheat Bijay-Singh, R. K. Sharma, Jaspreet-Kaur, Mangi L. Jat, Kent L. Martin, Yadvinder- Singh, Varinderpal-Singh, Parvesh Chandna, Om Parkash Choudhary, et al.
Transcript of Mangi L. Jat, Kent L. Martin, Yadvinder- Bijay-Singh, R. K...
1 23
Agronomy for SustainableDevelopmentOfficial journal of the InstitutNational de la RechercheAgronomique (INRA) ISSN 1774-0746Volume 31Number 3 Agronomy Sust. Developm.(2011) 31:589-603DOI 10.1007/s13593-011-0005-5
Assessment of the nitrogen managementstrategy using an optical sensor forirrigated wheat
Bijay-Singh, R. K. Sharma, Jaspreet-Kaur,Mangi L. Jat, Kent L. Martin, Yadvinder-Singh, Varinderpal-Singh, ParveshChandna, Om Parkash Choudhary, et al.

1 23
Your article is protected by copyright and
all rights are held exclusively by INRA and
Springer Science+Business Media B.V.. This
e-offprint is for personal use only and shall
not be self-archived in electronic repositories.
If you wish to self-archive your work, please
use the accepted author’s version for posting
to your own website or your institution’s
repository. You may further deposit the
accepted author’s version on a funder’s
repository at a funder’s request, provided it is
not made publicly available until 12 months
after publication.
ORIGINAL PAPER
Assessment of the nitrogen management strategyusing an optical sensor for irrigated wheat
Bijay-Singh & R. K. Sharma & Jaspreet-Kaur & Mangi L. Jat & Kent L. Martin &
Yadvinder-Singh & Varinderpal-Singh & Parvesh Chandna & Om Parkash Choudhary &
Rajeev K. Gupta & Harmit S. Thind & Jagmohan-Singh & Harminder S. Uppal &Harmandeep S. Khurana & Ajay-Kumar & Rajneet K. Uppal & Monika Vashistha &
William R. Raun & Raj Gupta
Accepted: 30 July 2010 /Published online: 15 March 2011# INRA and Springer Science+Business Media B.V. 2011
Abstract Blanket fertilizer nitrogen (N) recommendationsfor large irrigated wheat tracts lead to low N-use efficiencydue to field-to-field variability in soil N supply and seasonalvariability in yield. To achieve high N use efficiency, a site-specific N management strategy using GreenSeeker™ opticalsensor was evaluated. We conducted seven field experiments
during 2004–2006 at three locations to define relationshipsbetween in-season sensor measurements and yield of wheatand to know whether response of wheat to fertilizer N can beestimated by sensor measurements. During 2005–2007, fourfield experiments were conducted to assess the sensor-basedN management strategy and to work out prescriptiveN management to be followed prior to applying sensor-guided fertilizer dose. We observed robust relationshipsbetween in-season sensor-based estimates of yield at Feekes5–6 and 7–8 stages and actual wheat yields. Response ofwheat to fertilizer N defined by the sensor was highlycorrelatedwith harvest response index. Sensor-guided fertilizerN applications resulted in high yield levels and high N-useefficiency. Application of 90 kg N ha-1 at planting or in twoequal doses at planting and crown root initiation stage wasthe appropriate prescriptive fertilizer N management. Thisstudy reveals that high N-use efficiency in irrigated wheat canbe achieved by replacing blanket fertilizer recommendationby an optical sensor-based N management strategy consistingof applying moderate amount of fertilizer N at planting andcrown root initiation stages and sensor-guided fertilizer Ndose at Feekes 5–6 or 7–8 stages of wheat.
Keywords Indo-Gangetic Plain . Irrigated wheat . Nitrogenmanagement . Response index . GreenSeeker opticalsensor . Potential yield
1 Introduction
Traditionally, farmers in the Indo-Gangetic Plains of SouthAsia and elsewhere apply N uniformly as a blanketrecommendation for large regions in wheat growing tracts.Many farmers often use uniform rates of N fertilizers based
Bijay-Singh (*) : Jaspreet-Kaur :Yadvinder-Singh :Varinderpal-Singh :O. P. Choudhary :R. K. Gupta :H. S. Thind :Jagmohan-Singh :H. S. Uppal :Ajay-Kumar :R. K. Uppal :M. VashisthaDepartment of Soil Science, Punjab Agricultural University,Ludhiana, Indiae-mail: [email protected]
R. K. SharmaDirectorate of Wheat Research,Karnal, India
M. L. JatPDCSR,Modipuram, India
K. L. MartinSouthwest Area Extension, Kansas State University,Garden City, KS 67846, USA
P. Chandna :R. GuptaRice-Wheat Consortium-CIMMYT,NASC Complex, Pusa,New Delhi, India
H. S. KhuranaInternational Plant Nutrition Institute (IPNI), West India Program,Pune, India
W. R. RaunDepartment of Plant and Soil Sciences,Oklahoma State University,Stillwater, OK 74078, USA
Agronomy Sust. Developm. (2011) 31:589–603DOI 10.1007/s13593-011-0005-5
Author's personal copy
on expected yields (yield goal) that could be inconsistentfrom field-to-field and year-to-year depending on factorsthat are difficult to predict prior to fertilizer application.Also, farmers often apply fertilizer N in doses much higherthan the blanket recommendations to ensure high cropyields. Large temporal and field-to-field variability of soilN supply restricts efficient use of N fertilizer when broad-based blanket recommendations are used (Adhikari et al.1999; Dobermann et al. 2003). Under such situations, in-season site-specific N management can effectively replacethe blanket fertilizer N recommendations for achieving highN-use efficiency. Application of fertilizer N that corre-sponds to the spatial variability of the N need of cropsshould not only lead to increased N-use efficiency but alsoto reduced possibility of fertilizer N-related environmentalpollution (Khosla and Alley 1999). For example, accordingto Kranz and Kanwar (1995) as much as 70% of the total Nleached comes from as little as 30% of the total field area.With 50% or more operational land holdings in South Asiahaving less than 2 ha (remaining 30–40% up to 10 ha)(Indian Agricultural Statistics Research Institute 2007), itseems that high fertilizer N-use efficiency can be improvedthrough field-specific fertilizer N management because ittakes care of both spatial and temporal variability in soil Nsupply. Successful strategies will comprise of managementoptions based on location-specific fertilizer N requirementsof crops according to year-to-year variations in climate(particularly solar radiation) and spatial as well temporalvariations of indigenous soil N supplies (Giller et al. 2004).Although generally good correlations with grain yield havebeen observed with methods based on soil tests andlaboratory analyses of tissue samples to predict cereal Nneeds during vegetative growth stages (Fox et al. 1989;Hong et al. 1990; Magdoff et al. 1990; Justes et al. 1997;Lemaire and Gastal 1997), these are time-consuming,cumbersome, and expensive. Tissue tests are also of lessvalue for the support of decisions on N supplementationthan indicators that are directly related to measurement ofleaf and canopy greenness (Schröder et al. 2000).
Dynamic N management requires rapid assessment ofleaf N content—a sensitive indicator of changes in crop Ndemand during the growing season. The chlorophyll orSPAD meter (SPAD-502, Minolta, Ramsey, NJ, USA), andits inexpensive and simple alternative, the leaf color chartcan quickly and reliably monitor relative greenness of leafas an indicator of leaf N status. These tools have helped indeveloping real-time N management strategies for rice(Ladha et al. 2005) but do not take into accountphotosynthetic rates or the biomass production andexpected yields for working out fertilizer N requirements.Application of optical sensors in agriculture is increasingrapidly through measurement of visible and near-infrared(NIR) spectral response from plant canopies to detect N
stress (Peñuelas et al. 1994; Ma et al. 1996; Raun et al.2001). Chlorophyll contained in the palisade layer of theleaf controls much of the visible light (400–720 nm)reflectance as it absorbs between 70% and 90% of allincident light in the red wavelength bands (Campbell2002). Reflectance of the NIR electromagnetic spectrum(720–1,300 nm) depends upon the structure of mesophylltissues, which reflects as much as 60% of all incident NIRradiation (Campbell 2002). Spectral vegetation indices suchas the normalized difference vegetation index (NDVI) havebeen shown to be useful for indirectly obtaining informa-tion such as photosynthetic efficiency, productivity poten-tial, and potential yield (Peñuelas et al. 1994; Thenkabail etal. 2000; Ma et al. 2001; Raun et al. 2001; Báez-Gonzálezet al. 2002) and have been found to be sensitive to leaf areaindex, green biomass (Peñuelas et al. 1994), and photosyn-thetic efficiency (Aparicio et al. 2002). Raun et al. (2001)found expected yield as determined from NDVI to show astrong relationship with the actual grain yield in winter wheat.Using NDVI measurements of wheat at different times duringcrop growth period, Raun et al. (2001, 2002) developedconcepts of response index and potential yield, and thesewere used to define a fertilizer nitrogen algorithm for workingout the fertilizer N requirement in winter wheat based onexpected yields as well as achievable greenness of the leaves.Raun et al. (2002) showed that prediction of wheat responseto N applications guided by optical sensor was positivelycorrelated to measured N response and increased N-useefficiency. Recently, Li et al. (2009) evaluated optical sensor-based N management in winter wheat in China by conducting30 on-farm experiments. Averaged across site-years, sensor-based strategy and farmer’s practices produced similar yieldsbut applied 67 and 372 kg N ha-1, respectively.
In the Indo-Gangetic Plains in northwestern India wheatis generally grown under assured irrigation conditions.Following blanket recommendations, N fertilizers areapplied at the rate of 120 (in the state of Punjab) or 150(in the states of Haryana, Uttar Pradesh) kg N ha-1 in twoequal split doses at planting and at crown root initiationstages. The second dose coincides with first irrigation eventaround 21 days after planting. This being a blanketrecommendation for the region consists of applying Ndoses at planting and crown root initiation stage (Meelu etal. 1987) high enough to meet the crop requirement aswell as to compensate the losses of N via ammoniavolatilization, denitrification and leaching (Bijay-Singhand Yadvinder-Singh 2003). To achieve high fertilizer useefficiency, prescriptive N doses at planting and crown rootinitiation stage (or first irrigation stage) can be moderatelyreduced provided N needs of the crop taking into accountthe field-to-field and temporal variability are worked outusing a suitable criteria to apply a corrective fertilizer dosecoinciding with second or third irrigation event. It cannot
590 Bijay-Singh et al.
Author's personal copy
only ensure site-specific N management in wheat but alsoavoid over application of fertilizer N.
In the present investigation, we developed relationshipsbetween NDVI measurements made by GreenSeekeroptical sensor after applying one or two prescriptive dosesof N and yield of wheat. Using these relations and responseindices, fertilizer N doses to be applied at Feekes 5–6 orFeekes 7–8 stage of irrigated spring wheat were workedout. The major objective of the present study was toevaluate optical sensor-based N management in irrigatedwheat vis-à-vis prevalent blanket fertilizer N recommenda-tions in the Indo-Gangetic Plains. Since GreenSeeker-guided N application could be made only once, it wasimportant to define the appropriate set of prescriptive Napplications at planting and crown root initiation stagewhich preceded it. Thus, other major objective of the studywas to define the prescriptive N management scenariosbased on application of fertilizer N doses at planting andcrown root initiation stage of the crop with which opticalsensor-guided fertilizer N applications can be combined forimproved fertilizer N-use efficiency. Different combinationsof prescriptive and corrective N management scenarioswere therefore evaluated vis-à-vis blanket recommenda-tions for N in the region to suggest a viable and betteralternative to current completely prescriptive approach forN management in wheat. In the irrigated wheat in the Indo-Gangetic Plains in the northwestern India, the application offertilizer N doses along with 2nd or 3rd irrigation eventsshould almost coincide with Feekes 5–6 and 7–8 stages ofthe crop.
2 Materials and methods
2.1 Site description
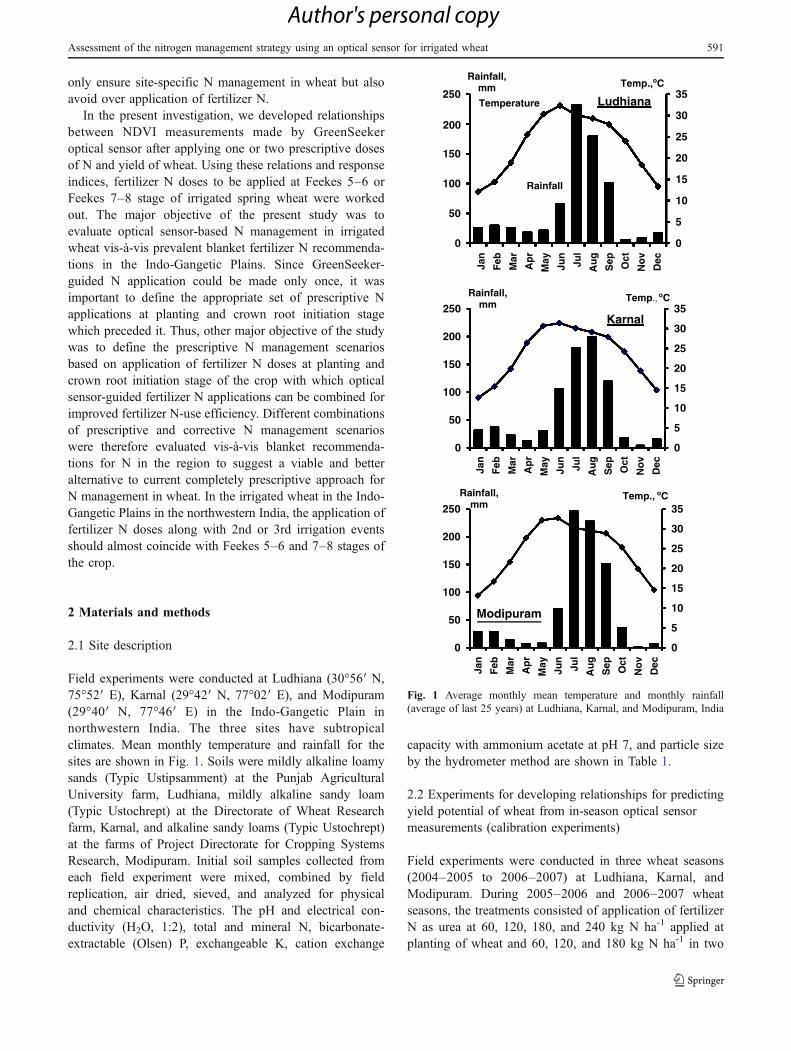
Field experiments were conducted at Ludhiana (30°56′ N,75°52′ E), Karnal (29°42′ N, 77°02′ E), and Modipuram(29°40′ N, 77°46′ E) in the Indo-Gangetic Plain innorthwestern India. The three sites have subtropicalclimates. Mean monthly temperature and rainfall for thesites are shown in Fig. 1. Soils were mildly alkaline loamysands (Typic Ustipsamment) at the Punjab AgriculturalUniversity farm, Ludhiana, mildly alkaline sandy loam(Typic Ustochrept) at the Directorate of Wheat Researchfarm, Karnal, and alkaline sandy loams (Typic Ustochrept)at the farms of Project Directorate for Cropping SystemsResearch, Modipuram. Initial soil samples collected fromeach field experiment were mixed, combined by fieldreplication, air dried, sieved, and analyzed for physicaland chemical characteristics. The pH and electrical con-ductivity (H2O, 1:2), total and mineral N, bicarbonate-extractable (Olsen) P, exchangeable K, cation exchange
capacity with ammonium acetate at pH 7, and particle sizeby the hydrometer method are shown in Table 1.
2.2 Experiments for developing relationships for predictingyield potential of wheat from in-season optical sensormeasurements (calibration experiments)
Field experiments were conducted in three wheat seasons(2004–2005 to 2006–2007) at Ludhiana, Karnal, andModipuram. During 2005–2006 and 2006–2007 wheatseasons, the treatments consisted of application of fertilizerN as urea at 60, 120, 180, and 240 kg N ha-1 applied atplanting of wheat and 60, 120, and 180 kg N ha-1 in two
Rainfall,
0
5
10
15
20
25
30
35
0
50
100
150
250Temp.,oC mm
Ludhiana
0
5
10
15
20
25
30
35
0
50
100
150
200
200
250Temp., oCRainfall,
mm
Karnal
0
5
10
15
20
25
30
35
0
50
100
150
200
250
Jan
Feb
Mar
Ap
r
May
Jun
Jul
Au
g
Sep Oct
No
v
Dec
Jan
Feb
Mar
Ap
r
May
Jun
Jul
Au
g
Sep Oct
No
v
Dec
Jan
Feb
Mar
Ap
r
May
Jun
Jul
Au
g
Sep Oct
No
v
Dec
Temp., oCRainfall, mm
Modipuram
Temperature
Rainfall
Fig. 1 Average monthly mean temperature and monthly rainfall(average of last 25 years) at Ludhiana, Karnal, and Modipuram, India
Assessment of the nitrogen management strategy using an optical sensor for irrigated wheat 591
Author's personal copy

Tab
le1
Soil(0–15
cm)prop
ertiesof
experimentalsites,Lud
hiana,
Karnal,andMod
ipuram
,India
Exp
erim
ent/locationandyear
Sand
(gkg
−1)
Clay
(gkg
−1)
pHa
EC(dSm
−1)
Organic
carbon
b
(gkg
−1)
CEC(1
MNH4OAc)
(cmol
ckg
−1)
Pc(m
gkg
−1)
K(1M
NH4OAc)
(cmol
ckg
−1)
Total
Nd
(gkg
−1)
Mineral
Ne
(mgkg
−1)
Calibratio
nexperiments
Lud
hiana20
04–20
0567
613
77.6
0.19
3.5
8.2
14.5
1.6
0.58
7.5
Karnal20
04–20
0566
016
48.3
0.27
3.6
9.5
11.1
1.7
0.68
10.9
Karnal20
05–20
0663
317
08.2
0.25
3.7
10.2
10.5
0.71
12.3
Mod
ipuram
2005
–20
0668
014
38.1
0.25
4.9
9.8
9.9
1.4
0.76
15.2
Lud
hiana20
05–20
06and20
06–20
0779
010
17.2
0.27
3.5
7.9
8.2
0.3
0.60
8.5
Evaluationexperiments
Exp
.1.
Lud
hiana20
05–20
0665
0110
7.2
0.16
3.3
7.7
10.8
1.2
0.59
9.2
Exp
.2.
Karnal20
06–20
0763
015
68.3
0.28
3.9
9.3
8.9
1.8
0.64
12.2
Exp
.3.
Mod
ipuram
2006
–20
0762
016
58.2
0.26
5.4
10.9
10.5
0.2
0.69
15.9
Exp
.4.
Lud
hiana20
06–20
0770
8117
7.1
0.18
4.8
7.5
6.8
0.9
0.60
8.9
ECElectricalcond
uctiv
ity,CECcatio
nexchange
capacity
a1:2soil/water
bWalkley
(194
7)cOlsen
etal.(195
4)dBremner(196
5a)
eBremner(196
5b)
592 Bijay-Singh et al.
Author's personal copy
equal split doses, one at planting and the other at crownroot initiation stage that occurs around 21 days afterplanting and coincides with first irrigation. A no-N controlplot was also maintained. During 2004–2005 wheat season,two on-going field experiments at Ludhiana and one on-going experiment at Karnal were used to generate data todevelop relationships for in-season estimation of wheatyields. In these experiments, doses of urea-N varyingfrom 0 to 90 kg N ha-1 were applied in two equal doses atplanting and at the crown root initiation stage of wheat.During 2006–2007 at Ludhiana, two experiments wereconducted with zero-till sown wheat; one with rice strawmulch and the other without mulch. Details of theexperiments such as planting date, sensing date, andvariety are given in Table 2. All field experiments werelaid out in a randomized complete block design with threeor four replications.
During the month of January in 2005, 2006, and 2007,spectral reflectance readings were taken at the time ofapplying second and third irrigations to wheat crop (the firstirrigation was applied at crown root initiation stage 3 weeksafter planting of crop) coinciding with Feekes (Large 1954)growth stages 5–6 and 7–8. Sensing dates in differentexperiments are listed in Table 1. Sensor measurementswere taken from treatments with varying levels of Nnutrition within each replication. Spectral reflectanceexpressed as NDVI was measured using a handheldGreenSeeker™ optical sensor unit (NTech IndustriesIncorporation, Ukiah, CA, USA). The unit senses a0.6 x 0.1 m2 area when held at a distance of approximately0.6–1.0 m from the illuminated surface. The senseddimensions remain approximately constant over the heightrange of the sensor. The sensor unit has self-containedillumination in both the red ([656 nm with ~25 nm full
width half magnitude (FWHM)) and NIR (774 with ~25 nmFWHM) bands (http://www.ntechindustries.com/datasheets.php, confirmed on 01 September 2008). The device uses apatented technique to measure the fraction of the emittedlight in the sensed area that is returned to the sensor (cropreflectance) and calculates NDVI as:
NDVI ¼ FNIR � FRed
FNIR þ FRedð1Þ
where FNIR and FRed are respectively the fractions ofemitted NIR and red radiation reflected back from thesensed area. The sensor outputs NDVI at a rate of tenreadings per second. The sensor was passed over the crop ata height of approximately 0.9 m above the crop canopy andoriented so that the 0.6 m sensed width was perpendicularto the row and centered over the row. With advancing stageof growth, sensor height above the ground increasedproportionally. Travel velocities were at a slow walkingspeed of approximately 0.5 ms−1 resulting in NDVIreadings averaged over distances of 0.05 m.
In-season estimated yield proposed by Raun et al. (2002)as the measure of the daily accumulated biomass from thetime of planting to the day of sensing was calculated bydividing the NDVI data by the number of growing degreedays (GDD)>0 (GDD=(Tmin+Tmax)/2–4.4°C, where Tmin
and Tmax represent daily ambient low and high temper-atures) from planting to sensing. The yield potential with noadditional fertilization (YP0) was calculated using anempirically derived function relating in-season estimatedyield to yield potential as: YP0=a*(estimated yield)b.
In five experiments carried out at Ludhiana, Karnal, andModipuram during 2005–2006 and 2006–2007 wheatseasons, fertilizer N doses as high as 180 or 240 kg N ha-1
were applied. Thus, maximum wheat yields could be
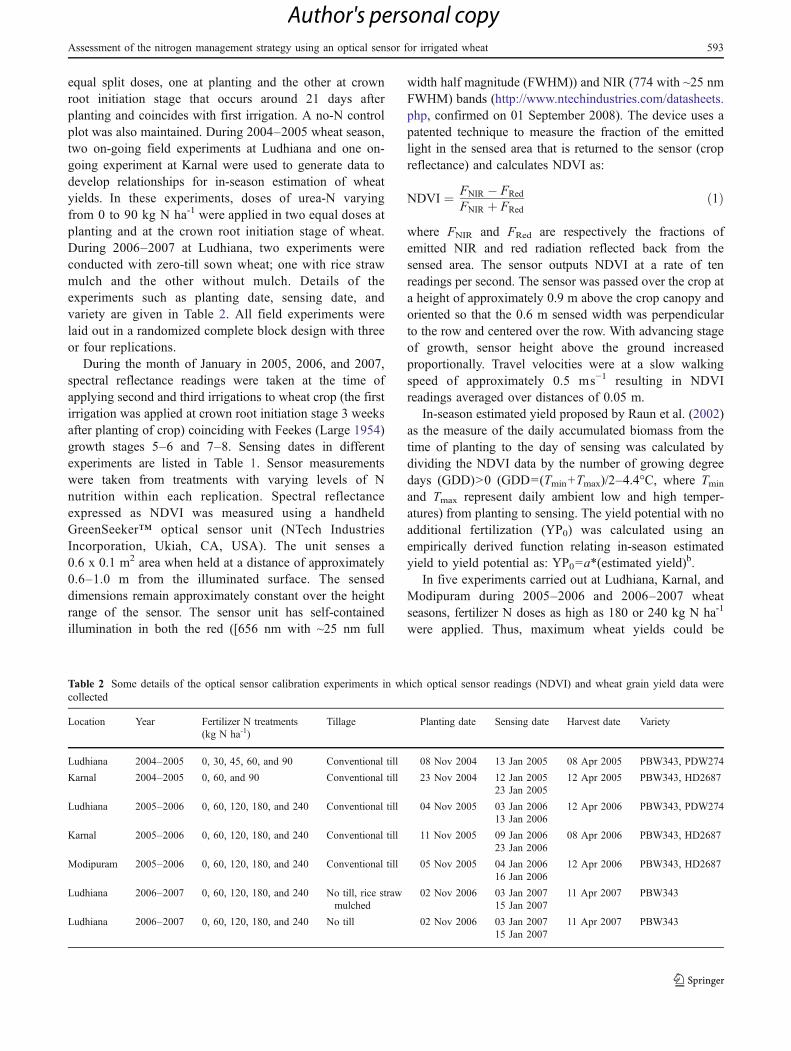
Table 2 Some details of the optical sensor calibration experiments in which optical sensor readings (NDVI) and wheat grain yield data werecollected
Location Year Fertilizer N treatments(kg N ha-1)
Tillage Planting date Sensing date Harvest date Variety
Ludhiana 2004–2005 0, 30, 45, 60, and 90 Conventional till 08 Nov 2004 13 Jan 2005 08 Apr 2005 PBW343, PDW274
Karnal 2004–2005 0, 60, and 90 Conventional till 23 Nov 2004 12 Jan 2005 12 Apr 2005 PBW343, HD268723 Jan 2005
Ludhiana 2005–2006 0, 60, 120, 180, and 240 Conventional till 04 Nov 2005 03 Jan 2006 12 Apr 2006 PBW343, PDW27413 Jan 2006
Karnal 2005–2006 0, 60, 120, 180, and 240 Conventional till 11 Nov 2005 09 Jan 2006 08 Apr 2006 PBW343, HD268723 Jan 2006
Modipuram 2005–2006 0, 60, 120, 180, and 240 Conventional till 05 Nov 2005 04 Jan 2006 12 Apr 2006 PBW343, HD268716 Jan 2006
Ludhiana 2006–2007 0, 60, 120, 180, and 240 No till, rice strawmulched
02 Nov 2006 03 Jan 2007 11 Apr 2007 PBW34315 Jan 2007
Ludhiana 2006–2007 0, 60, 120, 180, and 240 No till 02 Nov 2006 03 Jan 2007 11 Apr 2007 PBW34315 Jan 2007
Assessment of the nitrogen management strategy using an optical sensor for irrigated wheat 593
Author's personal copy

recorded in these experiments. It allowed computation ofresponse (to fertilizer N) indices RINDVI and RIHarvest(Mullen et al. 2003; Johnson and Raun 2003) as:
RINDVI ¼ NDVI of the highest yield treatmentð Þ =NDVI of the test plotð Þ ð2Þ
RIHarvest ¼ maximum yieldð Þ = yield of the test plotð Þ ð3Þ
2.3 Experiments for evaluating optical sensor-based Nmanagement (evaluation experiments)
In all, four field experiments were conducted to evaluateoptical sensor-based N management in wheat vis-à-visblanket recommendation for the region. During 2005–2006wheat season, an experiment was conducted at Ludhianawhereas during 2006–2007 experiments were located atModipuram, Karnal, and Ludhiana. Blanket recommenda-tions for N management in wheat in northwestern Indiaconsisting of applying half of the total dose of 120(Ludhiana) or 150 (Karnal and Modipuram) kg N ha-1 atplanting and remaining half at the crown root initiationstage coinciding with first irrigation event 3–4 weeks afterplanting, constituted the reference treatments for evaluatingthe GreenSeeker-based N management. Since fertilizer Napplication to wheat has to coincide with an irrigationevent, GreenSeeker-based N management treatments wereplanned to determine fertilizer N applications to wheat atFeekes 5–6 or Feekes 7–8 stage with different doses of Napplied as prescriptive N management at planting and atcrown root initiation stage. Also, Feekes 5–6 and Feekes7–8 stages almost coincide with 2nd and 3 rd irrigationevents and relationships between in-season estimated yieldand potential yield of wheat at these stages have beenworked out. The treatments in the four experiments as listedin Tables 4, 5, 6, and 7 were laid out in randomizedcomplete block design with three replications. Two sets oftreatments consisting of applying prescriptive dose of Neither only at planting or at both planting and at crown rootinitiation stages were tested to define the prescriptivefertilizer N application strategies compatible with an optical
sensor-guided N application at 2nd or 3rd irrigation stage.Dates on which fertilizer N was applied corresponding todifferent growth stages of wheat are listed in Table 3.
In all the four experiments, an N-rich strip wasestablished by applying 200 kg N ha-1 in split doses toensure that nitrogen was not limiting. The NDVI measure-ments from the N rich strip (NDVINRICH) and the test plots(NDVITEST) were used to calculate response index (RI) tofertilizer N (Johnson and Raun 2003) as per Eq. 2. TheN-rich strips were characterized by the highest NDVIvalues. As advocated by Raun et al. (2002) the yield ofthe test plot achievable by applying additional fertilizer N(YPn) was estimated as the product of YP0 and RINDVI. TheN fertilizer algorithm to compute fertilizer N to be appliedusing GreenSeeker optical sensor (Raun et al. 2002) isbased on determining the difference in estimated N uptakebetween YPn and YP0. It was done by estimating the meanN content of the grain at harvest (1.85% N for spring wheatgrown in Indo-Gangetic Plains of South Asia; in Experi-ment 1 a value of 1.6% was used) and multiplying thisnumber by YPn and YP0, respectively. The difference in Nuptake between YP0 and YPn was then divided byefficiency factor (taken as 0.5 to be reasonably achievableunder South Asian conditions; Singh et al. 2007) to workout the fertilizer N dose as:
Fertilizer N dose ¼ 1:85 � ðYPn � YP0Þ100� 0:5
ð4Þ
In this equation, YPn and YP0 are expressed in kg ha−1
so as to calculate fertilizer dose in kg N ha-1.The values of YP0 used in fertilizer algorithm for
computing fertilizer N doses to be applied in experimentsconducted in 2005–2006 and 2006–2007 were based on in-season estimated yield—YP0 relationships developed fromdata collected from experiments conducted up to 2004–2005 and 2005–2006, respectively.
2.4 Crop management
Wheat was planted in rows 20 cm apart in 16.8 to 24 m2
plots on dates as indicated in Tables 2 and 3. Prior toseeding, the land was plowed twice to about 20-cm depth
Table 3 Crop management details for the four field experiments conducted to evaluate optical sensor-based N management in wheat in India
Crop management attribute Exp. 1. Ludhiana2005–2006
Exp. 2. Karnal2006–2007
Exp. 3. Modopuram2006–2007
Exp. 4. Ludhiana2006–2007
Date of planting 28 Oct 2005 09 Nov 2006 10 Nov 2006 04 Nov 2006
Crown root initiation stage, first irrigation 19 Nov 2005 30 Nov 2006 02 Dec 2006 03 Dec 2006
Feekes 5–6 stage, 2nd irrigation 29 Dec 2005 03 Jan 2007 29 Dec 2006 03 Jan 2007
Feekes 7–8 stage, 3rd irrigation 23 Jan 2006 22 Jan 2007 19 Jan 2007 29 Jan 2007
Harvesting 10 Apr 2006 11 Apr 2007 09 Apr 2007 19 Apr 2007
594 Bijay-Singh et al.
Author's personal copy
and leveled. After seeding with a seed-cum-fertilizer drill, aplank was dragged over the plots to cover the seed. All P(26 kg P ha−1 as Ca(H2PO4)2) and K (25 kg K ha−1 as KCl)were drilled below the seed at sowing. The basal dose of Nper treatment was mixed in the soil just before sowing. Inthe 2006–2007 seasons at Ludhiana, two experiments wereconducted for developing a relationship between in-seasonestimated yield and YP0 when wheat was sown after theharvest of rice crop under zero-till conditions. In theseexperiments, soil was not tilled after harvesting and wheatwas planted using a zero-till seed-cum-fertilizer drill. In oneof the experiments, rice straw was removed, while in theother 6 Mg ha−1 rice straw was allowed to remain in thefield as mulch.
Four to five irrigations were applied at crown rootinitiation stage, Feekes 5–6, Feekes 7–8, flowering/booting,and grain-filling stages (depending upon rainfall events andclimate) using both well and canal water. The dates ofirrigation-cum-fertilizer application in four experimentsconducted to evaluate GreenSeeker-guided N managementvis-à-vis blanket recommendation are given in Table 3. Thefertilizer N dose at planting of wheat was mixed with thesoil. Both prescriptive and optical sensor-guided fertilizer Ndoses in the standing crop were uniformly hand broadcast-ed. Weeds, pests, and diseases were controlled as required.
Crops were harvested by hand at ground level atmaturity on dates listed in Tables 2 and 3. Grain and strawyields were determined from an area (8–13.2 m2) located atthe center of each plot. Grains were separated from strawusing a plot thresher, dried in a batch grain dryer, andweighed. Grain moisture was determined immediatelyafter weighing, and subsamples were dried in an oven at65°C for 48 h. Grain weight for wheat was expressed at120 g kg-1 water content. Straw weights were expressedon oven-dry basis.
2.5 Plant sampling and analysis
Grain and straw subsamples were dried at 70°C and finelyground to pass through a 0.5 mm sieve. Nitrogen content ingrain and straw was determined by digesting the samples insulfuric acid followed by analysis for total N by a micro-Kjeldahl method (Yoshida et al. 1976). The N in grain plusthat in straw was taken as the measure of total N uptake.
2.6 Data analysis
Data generated from the four experiments conducted forevaluating the optical sensor-based N management wereanalyzed following analysis of variance using IRRISTATversion 5.0 (International Rice Research Institute, Philip-pines) and mean comparisons were performed based onleast significant difference test at 0.05 probability level. The
data generated from the calibration experiments were used tofit relationships between in-season estimated yield and YP0.Power functions of the type YP0=a*(estimated yield)b andcoefficients of determination (R2) were determined using MSEXCEL (Microsoft Corporation, Redland, CA, USA).
The N-use efficiency measures - recovery efficiency(RE), agronomic efficiency (AE), and physiological effi-ciency (PE) as described by Baligar et al. (2001) werecomputed as follows:
RE %ð Þ
¼ total N uptake inN fertilized plot� total N in noN plotð Þ � 100
quantity of N fertilizer applied inN fertilized plotð Þð5Þ
where N uptake is the total N uptake in grain and straw.
AE kg grain=kg N applied
¼ grain yield in N fertilized plot� grain yield in no N plotð Þquantity of N fertilizer applied in N fertilized plotð Þ
ð6ÞPE kg grain=kg N uptakeð Þ
¼ grain yield in N fertilized plot� grain yield in no N plotð Þtotal N uptake in N fertilized plot� total N uptake in no N plotð Þ
ð7Þ
3 Results and discussion
3.1 Predicting yield potential of wheat from in-seasonoptical sensor measurements
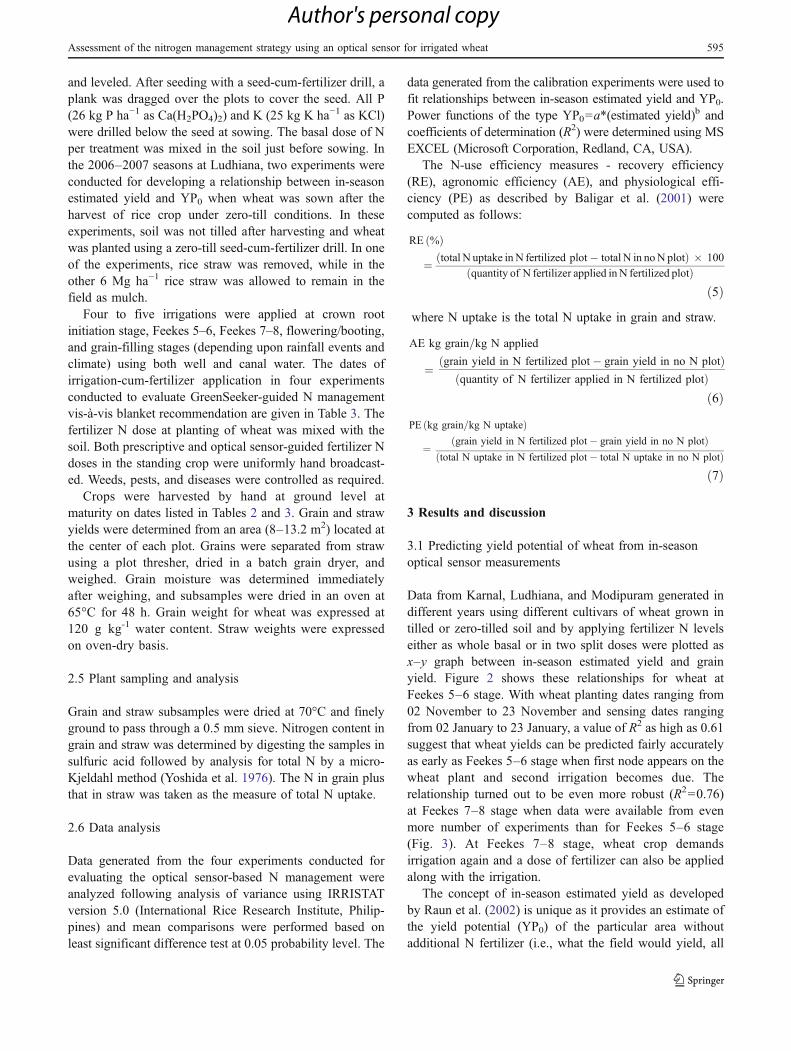
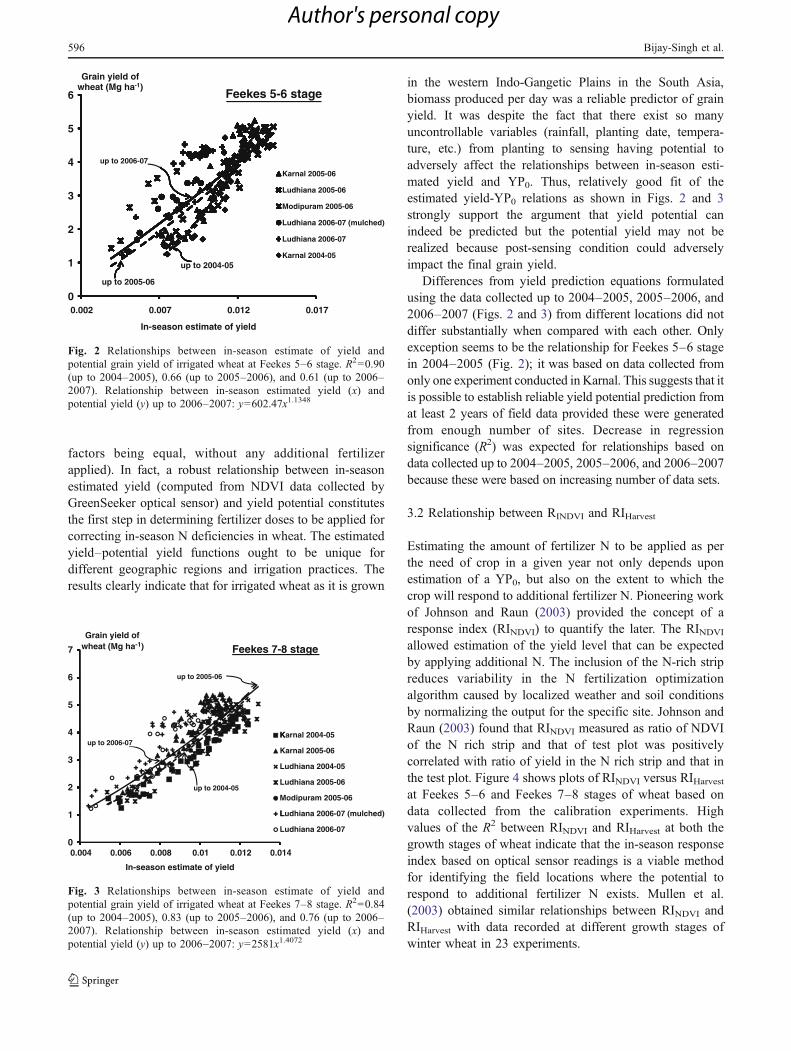
Data from Karnal, Ludhiana, and Modipuram generated indifferent years using different cultivars of wheat grown intilled or zero-tilled soil and by applying fertilizer N levelseither as whole basal or in two split doses were plotted asx–y graph between in-season estimated yield and grainyield. Figure 2 shows these relationships for wheat atFeekes 5–6 stage. With wheat planting dates ranging from02 November to 23 November and sensing dates rangingfrom 02 January to 23 January, a value of R2 as high as 0.61suggest that wheat yields can be predicted fairly accuratelyas early as Feekes 5–6 stage when first node appears on thewheat plant and second irrigation becomes due. Therelationship turned out to be even more robust (R2=0.76)at Feekes 7–8 stage when data were available from evenmore number of experiments than for Feekes 5–6 stage(Fig. 3). At Feekes 7–8 stage, wheat crop demandsirrigation again and a dose of fertilizer can also be appliedalong with the irrigation.
The concept of in-season estimated yield as developedby Raun et al. (2002) is unique as it provides an estimate ofthe yield potential (YP0) of the particular area withoutadditional N fertilizer (i.e., what the field would yield, all
Assessment of the nitrogen management strategy using an optical sensor for irrigated wheat 595
Author's personal copy
factors being equal, without any additional fertilizerapplied). In fact, a robust relationship between in-seasonestimated yield (computed from NDVI data collected byGreenSeeker optical sensor) and yield potential constitutesthe first step in determining fertilizer doses to be applied forcorrecting in-season N deficiencies in wheat. The estimatedyield–potential yield functions ought to be unique fordifferent geographic regions and irrigation practices. Theresults clearly indicate that for irrigated wheat as it is grown
in the western Indo-Gangetic Plains in the South Asia,biomass produced per day was a reliable predictor of grainyield. It was despite the fact that there exist so manyuncontrollable variables (rainfall, planting date, tempera-ture, etc.) from planting to sensing having potential toadversely affect the relationships between in-season esti-mated yield and YP0. Thus, relatively good fit of theestimated yield-YP0 relations as shown in Figs. 2 and 3strongly support the argument that yield potential canindeed be predicted but the potential yield may not berealized because post-sensing condition could adverselyimpact the final grain yield.
Differences from yield prediction equations formulatedusing the data collected up to 2004–2005, 2005–2006, and2006–2007 (Figs. 2 and 3) from different locations did notdiffer substantially when compared with each other. Onlyexception seems to be the relationship for Feekes 5–6 stagein 2004–2005 (Fig. 2); it was based on data collected fromonly one experiment conducted in Karnal. This suggests that itis possible to establish reliable yield potential prediction fromat least 2 years of field data provided these were generatedfrom enough number of sites. Decrease in regressionsignificance (R2) was expected for relationships based ondata collected up to 2004–2005, 2005–2006, and 2006–2007because these were based on increasing number of data sets.
3.2 Relationship between RINDVI and RIHarvest
Estimating the amount of fertilizer N to be applied as perthe need of crop in a given year not only depends uponestimation of a YP0, but also on the extent to which thecrop will respond to additional fertilizer N. Pioneering workof Johnson and Raun (2003) provided the concept of aresponse index (RINDVI) to quantify the later. The RINDVIallowed estimation of the yield level that can be expectedby applying additional N. The inclusion of the N-rich stripreduces variability in the N fertilization optimizationalgorithm caused by localized weather and soil conditionsby normalizing the output for the specific site. Johnson andRaun (2003) found that RINDVI measured as ratio of NDVIof the N rich strip and that of test plot was positivelycorrelated with ratio of yield in the N rich strip and that inthe test plot. Figure 4 shows plots of RINDVI versus RIHarvestat Feekes 5–6 and Feekes 7–8 stages of wheat based ondata collected from the calibration experiments. Highvalues of the R2 between RINDVI and RIHarvest at both thegrowth stages of wheat indicate that the in-season responseindex based on optical sensor readings is a viable methodfor identifying the field locations where the potential torespond to additional fertilizer N exists. Mullen et al.(2003) obtained similar relationships between RINDVI andRIHarvest with data recorded at different growth stages ofwinter wheat in 23 experiments.
7
6
5
4
3
2
1
0
up to 2005-06up to 2005-06up to 2005-06up to 2005-06
K
up to 2005-06up to 2005-06
up to 2006 07
up to 2005-06
up to 2006-07
up to 2005-06
up to 2006-07
up to 2005-06
t 2004 05
up to 2006-07
up to 2005-06
up to 2004-05
up to 2006-07
L
up to 2005-06
up to 2004-05
up to 2006-07
up to 2005-06
up to 2004-05
up to 2006-07
up to 2005-06
up to 2004-05
up to 2006-07
up to 2005-06
up to 2004-05
up to 2006-07
0.004 0.006 0.008 0.01 0.012 0.014
Karnal 2005-06
up to 2005-06
up to 2004-05
up to 2006-07
up to 2005-06
up to 2004-05
up to 2006-07
Grain yield ofwheat (Mg ha-1)
In-season estimate of yield
Feekes 7-8 stage
Karnal 2004-05
Ludhiana 2004-05
Ludhiana 2005-06
Modipuram 2005-06
Ludhiana 2006-07 (mulched)
Ludhiana 2006-07
up to 2005-06
up to 2004-05
up to 2006-07
Fig. 3 Relationships between in-season estimate of yield andpotential grain yield of irrigated wheat at Feekes 7–8 stage. R2=0.84(up to 2004–2005), 0.83 (up to 2005–2006), and 0.76 (up to 2006–2007). Relationship between in-season estimated yield (x) andpotential yield (y) up to 2006–2007: y=2581x1.4072
up to 2006 07up to 2006-07up to 2006-07up to 2006-07up to 2006-07up to 2006-07up to 2006-07up to 2006-07up to 2006-07up to 2006-07up to 2006-07up to 2006-07up to 2006-07up to 2006-07up to 2006-07
up to 2004-05
0
1
2
3
4
5
6
0.002 0.007 0.012 0.017
Grain yield of wheat (Mg ha-1)
In-season estimate of yield
Feekes 5-6 stage
Karnal 2005-06
Ludhiana 2005-06
Modipuram 2005-06
Ludhiana 2006-07 (mulched)
Ludhiana 2006-07
Karnal 2004-05
up to 2006-07
up to 2005-06
Fig. 2 Relationships between in-season estimate of yield andpotential grain yield of irrigated wheat at Feekes 5–6 stage. R2=0.90(up to 2004–2005), 0.66 (up to 2005–2006), and 0.61 (up to 2006–2007). Relationship between in-season estimated yield (x) andpotential yield (y) up to 2006–2007: y=602.47x1.1348
596 Bijay-Singh et al.
Author's personal copy

3.3 Estimating fertilizer N dose using optical sensorfor correcting in-season N deficiency
Predicting the yield of the test plot with additional fertilizer(YPn) allows quantification of the amount of fertilizer N tobe applied, and this is accomplished by obtaining theproduct of YP0 and RINDVI. Using YPn and YP0, the
amount of additional N fertilizer required was determinedby taking the difference in estimated N uptake between YPnand YP0 and an efficiency factor (Raun et al. 2002). Sinceresponse to fertilizer N application depends not only uponsupply of nonfertilizer N (mineralized from soil organicmatter, deposited through rainfall or through irrigation etc.),the amount of fertilizer N applied at planting and at crownroot initiation stage (along with first irrigation event) alsodetermined RINDVI. As shown in Tables 4, 5, 6, and 7,prescriptive N management in the form of applyingdifferent doses of fertilizer N at planting and the crownroot initiation stage of wheat and whether optical sensor-based N management was practiced at Feekes 5–6 orFeekes 7–8 stage greatly influenced the dose of fertilizer Nto be applied following N fertilizer optimization algorithm.In general, amount of N to be applied at Feekes 5–6 stageas guided by optical sensor turned out be less than thatworked out at Feekes 7–8 stage. Data pertaining to YP0 andRINDVI as listed in Tables 4, 5, 6, and 7 reveal that forsimilar application of fertilizer N at planting and the crownroot initiation stage, higher optical sensor-guided fertilizerN doses at Feekes 7–8 stage were due to higher RINDVIvalues recorded at this stage than at the Feekes 5–6 stage.Obviously due to passage of more time after applying the
Feekes 7-8 stage
00 0.5 1 1.5 2 2.5 3
0.5
1
1.5
2
2.5
3
0
0.5
1
1.5
2
2.5
3
RINDVI
RIHarvest RIHarvest
0 0.5 1 1.5 2 2.5 3
RINDVI
Feekes 5-6 stage
Fig. 4 Relationship between RINDVI (response index computed byin-season measurement of NDVI) and RIHarvest (response indexdetermined from grain yield data at the harvest of the crop) inexperiments conducted at Ludhiana, Karnal, and Modipuram during2005–2006 (y=1.186x−0.165; R2=0.91) and 2006–2007 (y=1.945x−0.170; R2=0.90) wheat seasons
Table 4 Evaluation of GreenSeeker-based N management in wheat (cultivar PBW 343) at Ludhiana, India during 2005–2006
Treatment Fertilizer N application (kg N ha-1) YP0 (Mg ha−1) RI Grain yield(Mg ha−1)
Total N uptake(kg ha−1)
AE RE (%) PE
Basal atsowing
CRI, 1stirrigation
Feekes 5–6stage, 2ndirrigation
Feekes 7–8 stage, 3rdirrigation
Total
1 0 0 – – 0 1.52 31.9
2 60 60 – – 120 4.35 103.2 23.6 59.2 39.9
3 75 75 – – 150 4.41 110.3 19.3 52.3 37.1
4 60 0 17a – 77 3.25 1.16 3.66 73.1 27.8 53.2 52.2
5 80 0 12a – 92 3.52 1.11 3.80 87.8 24.8 60.9 40.7
6 100 0 10a – 110 3.61 1.09 4.20 95.2 24.4 57.3 42.5
7 40 40 3a – 83 4.02 1.02 3.81 88.5 27.6 68.1 40.6
8 50 50 0a – 100 4.30 0.98 4.32 98.8 28.0 67.0 41.8
9 60 60 0a – 120 4.20 0.99 4.39 105.4 23.9 61.3 39.3
10 60 0 – 29a 89 2.98 1.30 3.99 94.2 27.8 69.7 39.4
11 80 0 – 24a 104 3.24 1.24 4.13 97.6 25.1 63.5 40.5
12 100 0 – 21a 121 3.43 1.19 4.29 102.4 22.9 58.3 39.2
13 40 40 – 18a 98 3.62 1.15 4.27 100.5 28.1 70.0 39.9
14 50 50 – 12a 112 3.84 1.10 4.35 108.5 25.3 68.4 36.8
15 60 60 – 15a 135 3.77 1.12 4.40 115.2 21.3 61.5 34.7
LSD (p=0.05) 0.367 11.04 3.03 9.52 4.41
AE agronomic efficiency of applied N (kg grain kg−1 N applied), RE recovery efficiency of applied N (%), PE physiological efficiency (kg grain kg−1 Nuptake), YP0 yield potential with no additional fertilizer N applied, RI response index, RINDVI, LSD least significant differenceaGreenSeeker-guided N applicationbCrown root initiation stage
Assessment of the nitrogen management strategy using an optical sensor for irrigated wheat 597
Author's personal copy

Table 5 Evaluation of GreenSeeker-based N management in wheat (cultivar PBW 343) at Karnal, India during 2006–2007
Treatment Fertilizer N application (kg N ha-1) YP0(Mg ha−1)
RI Grain yield(Mg ha−1)
Total N uptake(kg ha−1)
AE RE (%) PE
Basal atsowing
CRI, 1stirrigation
Feekes 5–6stage, 2ndirrigation
Feekes 7–8 stage, 3rdirrigation
Total
1 0 0 – – 0 1.89 39.2
2 75 75 – – 150 4.56 138.3 17.8 66.1 26.9
3 80 0 25a – 105 3.56 1.19 4.01 107.7 20.2 65.2 31.3
4 100 0 20a – 120 3.76 1.14 4.10 119.8 18.4 67.2 27.4
5 40 40 25a – 105 3.61 1.19 4.24 115.5 22.4 72.7 30.8
6 50 50 19a – 119 3.82 1.13 4.34 121.2 20.6 68.9 29.9
7 60 60 17a – 137 3.88 1.12 4.43 133.9 18.5 69.1 26.8
8 80 0 – 37a 117 3.50 1.29 4.21 113.2 19.8 63.2 31.4
9 100 0 – 32a 132 3.59 1.24 4.43 126.9 19.2 66.4 29.0
10 40 40 – 29a 109 3.58 1.22 4.47 112.0 23.7 66.8 35.4
11 50 50 – 23a 123 3.78 1.16 4.35 126.5 18.5 65.6 28.2
12 60 60 – 13a 133 3.91 1.09 4.45 131.1 19.2 69.1 27.9
LSD (p=0.05) 0.423 10.11 3.29 7.45 5.00
AE agronomic efficiency of applied N (kg grain kg−1 N applied), RE recovery efficiency of applied N (%), PE physiological efficiency (kg grain kg−1 Nuptake), YP0 yield potential with no additional fertilizer N applied, RI response index, RINDVI, LSD least significant differenceaGreenSeeker-guided N applicationbCrown root initiation stage
Table 6 Evaluation of GreenSeeker-based N management in wheat (cultivar PBW 343) at Modipuram, India during 2006–2007
Treatment Fertilizer N application (kg N ha-1) YP0(Mg ha−1)
RI Grain yield(Mg ha−1)
Total N uptake(kg ha−1)
AE RE (%) PE
Basal atsowing
CRI, 1stirrigation
Feekes 5–6stage, 2ndirrigation
Feekes 7–8 stage, 3rdirrigation
Total
1 0 0 – – 0 1.46 33.8
2 60 60 – – 120 5.26 118.2 31.7 70.3 45.3
3 75 75 – – 150 5.57 130.1 27.4 64.2 43.1
4 60 0 19a – 79 2.98 1.17 3.74 84.9 28.9 64.7 44.3
5 80 0 15a – 95 3.44 1.12 4.57 99.5 32.7 69.2 47.7
6 100 0 11a – 111 3.96 1.08 4.96 111.8 31.5 70.3 45.5
7 40 40 9a – 89 3.58 1.07 4.30 91.5 31.9 64.8 49.2
8 50 50 7a – 107 4.44 1.04 5.27 103.3 35.6 65.0 54.8
9 60 60 4a – 124 4.65 1.02 5.53 121.8 32.8 71.0 46.3
10 60 0 – 24a 84 2.84 1.23 3.68 93.9 26.4 71.5 36.9
11 80 0 – 21a 101 3.66 1.16 4.52 101.5 30.3 67.0 45.2
12 100 0 – 18a 118 4.10 1.12 4.73 118.8 27.7 72.0 39.0
13 40 40 – 18a 98 3.64 1.13 4.39 101.2 29.9 68.8 43.8
14 50 50 – 14a 114 4.70 1.08 5.42 108.8 34.7 65.8 52.8
15 60 60 – 10a 130 4.88 1.06 5.60 122.4 31.8 68.2 46.7
LSD (p=0.05) 1.109 9.52 9.03 7.43 14.81
AE agronomic efficiency of applied N (kg grain kg−1 N applied), RE recovery efficiency of applied N (%), PE physiological efficiency (kg grain kg−1 Nuptake), YP0 yield potential with no additional fertilizer N applied, RI response index, RINDVI, LSD least significant differenceaGreenSeeker-guided N applicationbCrown root initiation stage
598 Bijay-Singh et al.
Author's personal copy
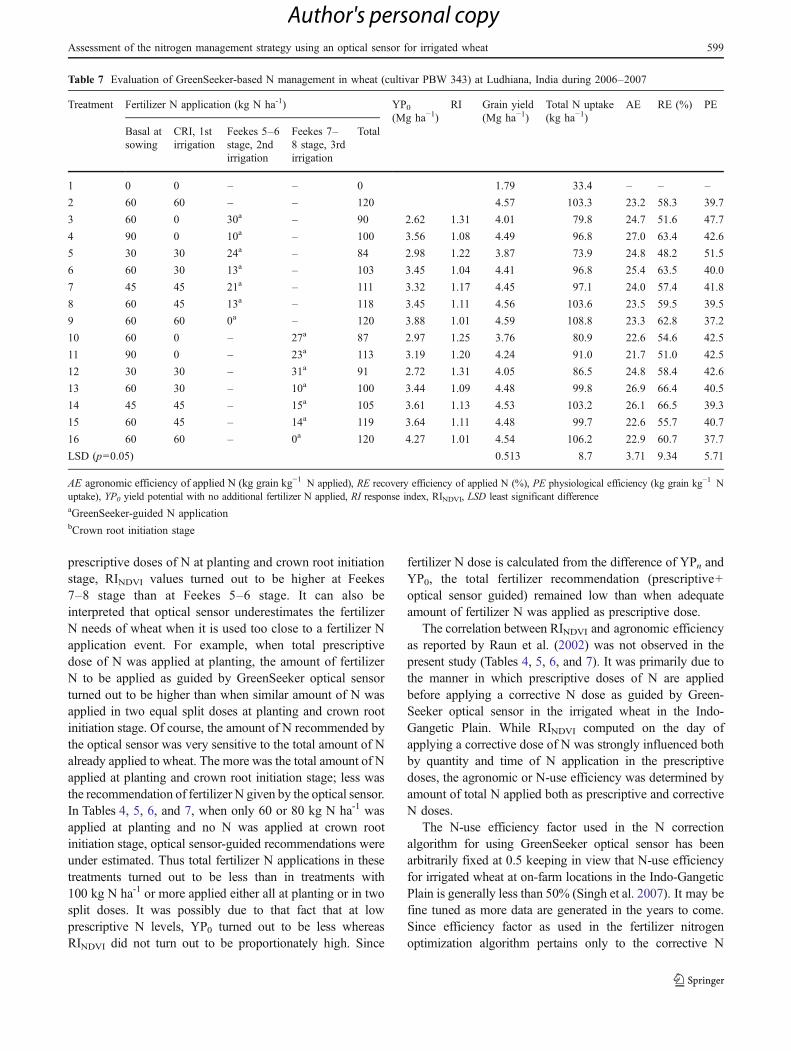
prescriptive doses of N at planting and crown root initiationstage, RINDVI values turned out to be higher at Feekes7–8 stage than at Feekes 5–6 stage. It can also beinterpreted that optical sensor underestimates the fertilizerN needs of wheat when it is used too close to a fertilizer Napplication event. For example, when total prescriptivedose of N was applied at planting, the amount of fertilizerN to be applied as guided by GreenSeeker optical sensorturned out to be higher than when similar amount of N wasapplied in two equal split doses at planting and crown rootinitiation stage. Of course, the amount of N recommended bythe optical sensor was very sensitive to the total amount of Nalready applied to wheat. The more was the total amount of Napplied at planting and crown root initiation stage; less wasthe recommendation of fertilizer N given by the optical sensor.In Tables 4, 5, 6, and 7, when only 60 or 80 kg N ha-1 wasapplied at planting and no N was applied at crown rootinitiation stage, optical sensor-guided recommendations wereunder estimated. Thus total fertilizer N applications in thesetreatments turned out to be less than in treatments with100 kg N ha-1 or more applied either all at planting or in twosplit doses. It was possibly due to that fact that at lowprescriptive N levels, YP0 turned out to be less whereasRINDVI did not turn out to be proportionately high. Since
fertilizer N dose is calculated from the difference of YPn andYP0, the total fertilizer recommendation (prescriptive+optical sensor guided) remained low than when adequateamount of fertilizer N was applied as prescriptive dose.
The correlation between RINDVI and agronomic efficiencyas reported by Raun et al. (2002) was not observed in thepresent study (Tables 4, 5, 6, and 7). It was primarily due tothe manner in which prescriptive doses of N are appliedbefore applying a corrective N dose as guided by Green-Seeker optical sensor in the irrigated wheat in the Indo-Gangetic Plain. While RINDVI computed on the day ofapplying a corrective dose of N was strongly influenced bothby quantity and time of N application in the prescriptivedoses, the agronomic or N-use efficiency was determined byamount of total N applied both as prescriptive and correctiveN doses.
The N-use efficiency factor used in the N correctionalgorithm for using GreenSeeker optical sensor has beenarbitrarily fixed at 0.5 keeping in view that N-use efficiencyfor irrigated wheat at on-farm locations in the Indo-GangeticPlain is generally less than 50% (Singh et al. 2007). It may befine tuned as more data are generated in the years to come.Since efficiency factor as used in the fertilizer nitrogenoptimization algorithm pertains only to the corrective N
Table 7 Evaluation of GreenSeeker-based N management in wheat (cultivar PBW 343) at Ludhiana, India during 2006–2007
Treatment Fertilizer N application (kg N ha-1) YP0(Mg ha−1)
RI Grain yield(Mg ha−1)
Total N uptake(kg ha−1)
AE RE (%) PE
Basal atsowing
CRI, 1stirrigation
Feekes 5–6stage, 2ndirrigation
Feekes 7–8 stage, 3rdirrigation
Total
1 0 0 – – 0 1.79 33.4 – – –
2 60 60 – – 120 4.57 103.3 23.2 58.3 39.7
3 60 0 30a – 90 2.62 1.31 4.01 79.8 24.7 51.6 47.7
4 90 0 10a – 100 3.56 1.08 4.49 96.8 27.0 63.4 42.6
5 30 30 24a – 84 2.98 1.22 3.87 73.9 24.8 48.2 51.5
6 60 30 13a – 103 3.45 1.04 4.41 96.8 25.4 63.5 40.0
7 45 45 21a – 111 3.32 1.17 4.45 97.1 24.0 57.4 41.8
8 60 45 13a – 118 3.45 1.11 4.56 103.6 23.5 59.5 39.5
9 60 60 0a – 120 3.88 1.01 4.59 108.8 23.3 62.8 37.2
10 60 0 – 27a 87 2.97 1.25 3.76 80.9 22.6 54.6 42.5
11 90 0 – 23a 113 3.19 1.20 4.24 91.0 21.7 51.0 42.5
12 30 30 – 31a 91 2.72 1.31 4.05 86.5 24.8 58.4 42.6
13 60 30 – 10a 100 3.44 1.09 4.48 99.8 26.9 66.4 40.5
14 45 45 – 15a 105 3.61 1.13 4.53 103.2 26.1 66.5 39.3
15 60 45 – 14a 119 3.64 1.11 4.48 99.7 22.6 55.7 40.7
16 60 60 – 0a 120 4.27 1.01 4.54 106.2 22.9 60.7 37.7
LSD (p=0.05) 0.513 8.7 3.71 9.34 5.71
AE agronomic efficiency of applied N (kg grain kg−1 N applied), RE recovery efficiency of applied N (%), PE physiological efficiency (kg grain kg−1 Nuptake), YP0 yield potential with no additional fertilizer N applied, RI response index, RINDVI, LSD least significant differenceaGreenSeeker-guided N applicationbCrown root initiation stage
Assessment of the nitrogen management strategy using an optical sensor for irrigated wheat 599
Author's personal copy
dose, one should be able to set its value as high as 0.7, but itsvalidity needs to be checked by further experimentation.
3.4 Evaluation of GreenSeeker-guided N managementvis-à-vis blanket recommendation
Application of 120 kg N ha-1 in two equal split doses atplanting and the crown root initiation stage of irrigatedwheat constitutes the blanket recommendation in the Indianstate of Punjab where Ludhiana site is located. In theneighboring states of Haryana and Uttar Pradesh where theother two sites—Karnal and Modipuram—are located, therecommendation is to apply 150 kg N ha-1 (Yadvinder-Singhet al. 2007). Thus, different GreenSeeker optical sensor-based fertilizer N management scenarios in wheat as listedin Tables 4, 5, 6, and 7 were evaluated vis-à-vis blanketrecommendations of 120 and 150 kg N ha-1. Application offertilizer N in two equal split doses—half at sowing andhalf at crown root initiation stage (along with firstirrigation) has been found beneficial in increasing grainyield and N uptake of wheat, and it is a generalrecommendation for wheat over a vast area in the Indo-Gangetic Plain (Meelu et al. 1987). Nitrogen uptake ofirrigated wheat proceeds very slowly until tillering begins,and N flux (kg N ha−1 day−1) increases to a maximumaround Feekes 6 stage (Doerge et al. 1991). Also, Nmanagement in irrigated wheat should not only considercrop demand but also the specific irrigation schedule that isfollowed. Fertilizer N applied at a time when crop needs arehigh, reduces the chances of losses of N from the soil-plantsystem, thus, improving N-use efficiency. Reduction inlosses of 15N applied as urea to wheat in the Indo-GangeticPlain through synchronization with irrigation events hasbeen reported by Katyal et al. (1987). Therefore, a numberof prescriptive N management scenarios consisting ofapplying 60 to 120 kg Nha−1 either at planting or in twosplit doses at planting and the crown root initiation stagecombined with corrective N management scenarios asguided by GreenSeeker optical sensor at Feekes 5–6(second irrigation) or Feekes 7–8 (third irrigation) stagewere tested at the three locations in the western Indo-Gangetic Plain. Since at planting of wheat there are noplants and at crown root initiation stage (about 3 weeksafter planting) biomass is too little, optical sensor cannot beused for guiding fertilizer N application at these stages.
Data from the four experiments conducted during 2005–2006 and 2006–2007 seasons at Ludhiana, Karnal, andModipuram as listed in Tables 4, 5, 6, and 7 reveal thatGreenSeeker optical sensor can be successfully used toguide fertilizer N applications to irrigated wheat in thewestern Indo-Gangetic Plain at Feekes 5–6 and Feekes7–8 stages coinciding with 2nd and 3rd irrigation eventsprovided an appropriate prescriptive N management strat-
egy is adopted. Optical sensor-guided fertilizer N applica-tions were tested both with single (at planting only) and twodoses (at planting and crown root initiation stage) ofprescriptive N management scenarios. Applying a singleprescriptive dose of fertilizer N at planting before applyinga sensor-guided fertilizer N dose was tried because manyfarmers will not like to switch to application of fertilizers towheat in 3 split doses from the blanket recommendation ofapplying fertilizer in two doses. When 60 kg N ha-1 wasapplied at planting and no N was applied at crown rootinitiation stage of wheat, optical sensor-guided fertilizer Napplications at Feekes 5–6 or Feekes 7–8 stage were neveradequate to produce optimum wheat yields. Both atLudhiana and Modipuram (Tables 4, 6, and 7), the grainyield of wheat was significantly less than that produced byfollowing the blanket recommendation. It was due to thefact that total fertilizer N application (prescriptive+sensorguided) ranged from 77 to 90 kg N ha-1 as compared withthe 120 and 150 kg Nha−1 in the blanket recommendation.This scenario is developed because low YP0 are recordedwhen low levels of fertilizer N are applied at planting ofwheat. Even with the application of 80 kg N ha-1 at plantingand no N at crown root initiation stage at Karnal during2006–2007 and at Ludhiana during 2005–2006, similartrend was observed (Tables 4 and 5). At Modipuram too,the grain yield obtained by applying 80 kg N ha-1 atplanting along with an optical sensor-guided dose at 2nd or3 rd irrigation stage resulted in lower yields than producedby applying the blanket recommendation of 150 kg N ha-1,though the differences were not statistically significant. Itsuggests that application of one optical sensor-guided Ndose at 2nd or 3rd irrigation event will not work when onlyone prescriptive N dose of 80 kg N ha-1 or less is applied atplanting. Application of at least 90 kg N ha-1 at planting ofwheat resulted in YP0 values high enough to obtain wheatyields equivalent to those recorded with blanket fertilizer Nrecommendation provided these are supplemented withapplication of corrective N doses as guided by GreenSeekeroptical sensor at 2nd or 3rd irrigation stages.
Prescriptive N management scenarios consisting ofapplying fertilizer N dose of 45 or 50 kg N ha-1 both atplanting and at crown root initiation stage work better withoptical sensor-guided corrective N management at Feekes5–6 or Feekes 7–8 stages. But application of 80 kg N ha-1
or less did not work well even when the total amount wasapplied in two equal split doses at planting and at crownroot initiation stage. For example, in Ludhiana 2005–2006and Modipuram 2006–2007 experiments (Tables 4 and 6)the prescriptive dose of 80 kg N ha-1 along with sensor-guided N application at Feekes 5–6 stage resulted inproduction of significantly less grain yield of wheat thanin the treatment receiving the blanket recommendation. AtModipuram (Table 6) the strategy of applying 40 kg N ha-1
600 Bijay-Singh et al.
Author's personal copy
both at planting and crown root initiation stage did notwork even when optical sensor-guided dose was applied atFeekes 7–8 stage. A perusal of the data in all the fourevaluation experiments (Tables 4, 5, 6, and 7), revealed thatat 45 to 50 kg N ha-1 must be applied both at planting andat crown root initiation stage before applying an opticalsensor-guided dose at Feekes 5–6 or Feekes 7–8 stage ofwheat. This observation is in line with already publishedresearch on N nutrition of wheat. In a field study inMexico, Ortiz-Monasterio et al. (1994) observed that athree-way-split application of fertilizer N to wheat with onethird at planting, one third at Feekes 6 stage (Zadok’s scaleZ31) and one third at Feekes 8 (flag leaf just visible, Z37)resulted in optimum grain yield of wheat. These experimentswere conducted in heavy clay soils. It is expected that inlighter textured soils, with potentially higher leaching prob-lems, the three- or four-way split could be more efficient thanthe two-way split (Chaudhary and Katoch 1981). In a studycarried out by International Atomic Energy Agency (IAEA)on irrigated wheat in ten countries, it was found that Nrecovery in wheat was higher with fertilizer N application atFeekes 6 stage rather than at planting (IAEA 2000). Thestudy concluded that most of the N should be applied byFeekes 6 stage to maximize grain yield and N applicationshould not be delayed beyond Feekes 8 stage.
Data listed in Tables 4, 5, 6, and 7 suggest that increasedfertilizer N-use efficiency at optimum yield levels wasobserved due to lower rates of total N application ascompared with blanket recommendations when appropriateprescriptive fertilizer N applications strategies are combinedwith a GreenSeeker optical sensor-guided fertilizer Napplication at 2nd or 3rd irrigation stages. However, thisreduction in total N application cannot be used as a clue forformulating another blanket recommendation consisting ofmoderate doses of N at planting and first irrigation stagesand a small dose of N during Feekes 5 to 8 stages. A look atdata pertaining to corrective N doses worked out by usingGreenSeeker optical sensor and the grain yields of wheat(Tables 4, 5, 6, and 7) reveals that for different variants ofmoderate prescriptive N doses, the corrective N dose forobtaining high yield levels was determined by the timing ofprescriptive N doses as well as time of application ofcorrective N dose. Thus, a new blanket recommendationcan be formulated and gadgets like GreenSeeker opticalsensor will have to be employed for field-specific manage-ment of N in irrigated wheat in the Indo-Gangetic Plains ofSouth Asia. Recently, Li et al. (2009) reported theusefulness of GreenSeeker optical sensor in significantlyimproving the N-use efficiency of winter wheat in China.As compared to farmers’ practice of applying more than300 kg N ha-1, mean optical sensor-guided N application at30 on-farm locations turned out to be only 61 kg N ha-1 butwith similar yield level.
In the present investigation, removal of N by wheat wasgenerally determined by the total quantity of fertilizer Napplied in different treatment plots (Tables 4, 5, 6, and 7).High fertilizer N-use efficiency parameters such as recoveryefficiency and agronomic efficiency were observed in allthose treatments (Tables 4, 5, 6, and 7) where high yieldswere recorded by applying moderate amount of fertilizer Nat planting and at crown root initiation stages as prescrip-tive doses and application of need based fertilizer N dosesas guided by GreenSeeker optical sensor followed.
4 Conclusions
For irrigated wheat grown in the Indo-Gangetic Plain ofSouth Asia GreenSeeker optical sensor can reliably predictthe yield potential of the crop through in-season measure-ment of the NDVI at Feekes 5–6 or Feekes 7–8 stage Usingyield potential and response index worked out fromin-season NDVI measurements of the test field and anN-rich strip, fertilizer N dose to be applied at Feekes 5–6 or7–8 stage of wheat can be computed as per need of the cropin a particular field and season. However, innovativefertilizer management practices aimed at efficiently manag-ing N in irrigated wheat must integrate both prescriptiveand corrective strategies because adequate amount offertilizer N needs to be applied at planting and/or crownroot initiation stage when optical sensor cannot be used.GreenSeeker-guided N dose can be applied at 2nd or 3rdirrigation event (Feekes 5–6 and Feekes 7–8 stages) inwheat but with carefully designed doses of fertilizerapplied at planting and crown root initiation stages ofwheat crop. A combination of moderate prescriptive doseof fertilizer N consisting of either applying 90 kg N ha-1
at planting or 45 to 50 kg N ha-1 both at planting and atcrown root initiation stages, and a corrective GreenSeeker-guided fertilizer N application at 2nd or 3rd irrigationevents can lead to improved fertilizer N-use efficiencywith no reduction in yield through savings in totalfertilizer N application as compared with prevalent blanketrecommendations.
Acknowledgments The financial and technical support receivedfrom the USDA and encouragement from Dr. Ryan Moore toundertake this study is gratefully acknowledged. The first authoracknowledges the financial support received from Indian Council ofAgricultural Research (ICAR), New Delhi in the form of NationalProfessor project to continue the work on GreenSeeker optical sensor.Thanks are due to Drs. James Schepers, Arnall Brain, and BramGovaerts for technical support at different times and useful discussionsduring the course of the studies. We take the opportunity to thankPunjab Agricultural University (Ludhiana), Directorate of WheatResearch-ICAR (Karnal) and Project Directorate for Cropping SystemResearch-ICAR (Modipuram) for providing the necessary facilitiesused in conducting the experiments.
Assessment of the nitrogen management strategy using an optical sensor for irrigated wheat 601
Author's personal copy
References
Adhikari C, Bronson KF, Panaullah GM, Regmi AP, Saha PK,Dobermann A, Olk DC, Hobbs PR, Pasuquin E (1999) On-farmN supply and N nutrition in the rice–wheat system of Nepal andBangladesh. Field Crops Res 64:273–286. doi:10.1016/S0378-4290(99)00063-5
Aparicio N, Villegas D, Araus JL, Casadesús J, Royo C (2002)Relationship between growth traits and spectral vegetationindices in durum wheat. Crop Sci 42:1547–1555. doi:10.2135/cropsci2002.1547
Báez-González AD, Chen P, Tiscareño-López M, Srinivasan R (2002)Using satellite and field data with crop growth modeling tomonitor and estimate maize yield in Mexico. Crop Sci 42:1943–1949. doi:10.2135/cropsci2002.1943
Baligar VC, Fageria NK, He ZL (2001) Nutrient use efficiency inplants. Commun Soil Sci Plant Anal 32:921–950. doi:10.1081/CSS-100104098
Bijay-Singh, Yadvinfrt-Singh (2003) Nitrogen management in rice–wheat system in the Indo-Gangetic Plain. In: Singh Y, Singh B,Nayyar VK, Jagmohan-Singh (eds) Nutrient management forsustainable rice–wheat cropping system. National AgriculturalTechnology Project, Indian Council of Agricultural Research,New Delhi, and Punjab Agricultural University, Ludhiana. pp99–114
Bremner JM (1965a) Total nitrogen. In: Black CA (ed) Methods ofsoil analysis, part 2. Agronomy monograph 9. American Societyof Agronomy, Madison, pp 1149–1178
Bremner JM (1965b) Inorganic forms of nitrogen. In: Black CA (ed)Methods of soil analysis, part 2. Agronomy monograph 9.American Society of Agronomy, Madison, pp 1179–1237
Campbell JB (2002) Introduction to remote sensing, 3rd edn. TheGuilford Press, New York
Chaudhary TN, Katoch KK (1981) Fertiliser-N management for wheatin coarse textured soils. Fert News 26(12):36–39
Dobermann A, Witt C, Abdulrachman S, Gines HC, Nagarajan R, SonTT, Tan PS, Wang GH, Chien NV, Thoa VTK, Phung CS, StalinP, Muthukrishanan P, Ravi V, Babu M, Sethanathan GC,Adviento MAA (2003) Soil fertility and indigenous nutrientsupply in irrigated domains of Asia. Agron J 95:913–927.doi:10.2134/agronj2003.0913
Doerge TA, Roth RI, Gardner BR (1991) Nitrogen fertilizermanagement in Arizona, College of Agriculture, The Universityof Arizona, Tucson. p 87
Fox RH, Roth GW, Iversen KV, Piekielek WP (1989) Soil and tissuenitrate tests compared for predicting soil nitrogen availability tocorn. Agron J 81:971–974. doi:10.2134/agronj1989.00021962008100060025x
Giller KE, Chalk P, Dobermann A, Hammond L, Heffer P, Ladha JK,Nyamudeza P, Maene L, Ssali H, Freney J (2004) Emergingtechnologies to increase the efficiency of use of fertilizer nitrogen.In:Mosier AR, Syers JK, Freney J (eds) Agriculture and the nitrogencycle: assessing the impacts of fertilizer use on food production andthe environment, SCOPE 65 (Scientific Committee on Problems ofthe Environment). Island Press, Washington, pp 35–51
Hong SD, Fox RH, Piekielek WP (1990) Field evaluation of severalchemical indexes of soil nitrogen availability. Plant Soil 123:83–88. doi:10.1007/BF00009929
IAEA (2000) Optimizing nitrogen fertilizer application in irrigatedwheat: Results of a co-ordinated research project organized bythe joint FAP/IAEA Division of Nuclear Techniques in Food andAgriculture 1994–1998, IAEA TECDOC-1164. InternationalAtomic Energy Agency, Vienna, p 245
Indian Agricultural Statistics Research Institute (2007) AgriculturalResearch Data Book, IASRI, Library Avenue, New Delhi. p. 333
Johnson GV, Raun WR (2003) Nitrogen response index as a guide tofertilizer management. J Plant Nutr 26:249–262. doi:10.1081/PLN-120017134
Justes E, Meynard JM, Mary B, Plénet D (1997) Management of Nnutrition: diagnosis using stem base extract: JUBIL method. In:Lemaire G (ed) Diagnosis of the Nitrogen Status in Crops.Springer, Berlin, pp 163–187
Katyal JC, Bijay-Singh, Vlek PLG, Buresh RJ (1987) Efficientnitrogen use as affected by urea application and irrigationsequence. Soil Sci Soc Am J 51:366–370. doi:10.2136/sssaj1987.03615 995005100020020x
Khosla R, Alley MM (1999) Soil-specific nitrogen management onmid-Atlantic coastal plain soils. Better Crops 83(3):6–7
Kranz WL, Kanwar RS (1995) Spatial distribution of leachate lossesdue to pre-plant tillage methods. In: Clean water–clean environ-ment—21st century. Proceedings of Conference Working Groupon Water Quality, vol 2. American Society of AgriculturalEngineering, St Joseph. pp 107–110
Ladha JK, Pathak H, Krupnik TJ, Six J, van Kessel C (2005)Efficiency of fertilizer nitrogen in cereal production: retrospectand prospects, Adv Agron 87:85–156. doi:10.1016/S0065-2113(05)87003-8
Large EC (1954) Growth stages in cereals. Plant Pathol 3:128–129Lemaire G, Gastal F (1997) N uptake and distribution in plant
canopies. In: Lemaire G (ed) Diagnosis of the nitrogen status incrops. Springer, Germany, pp 3–43
Li F, Miao Y, Zhang F, Cui Z, Li R, Chen X, Zhang H, Schrodner J,Raun WR, Jia L (2009) In-season optical sensing improvesnitrogen use efficiency for winter wheat. Soil Sci Soc Am J73:1566–1574. doi:10.2136/sssaj2008.0150
MaBL,MorrisonMJ, Dwyer L (1996) Canopy light reflectance and fieldgreenness to assess nitrogen fertilization and yield of maize. Agron J88:915–920. doi:10.2134/agronj1996.00021962003600060011x
Ma BL, Lianne LM, Dwyer M, Costa C, Cober ER, Morrison MJ(2001) Early prediction of soybean yield from canopy reflectancemeasurements. Agron J 93:1227–1234. doi:10.2134/agronj2001.1227
Magdoff FR, Jokela WE, Fox RH, Griffin GF (1990) A soil test fornitrogen availability in the northeastern United States. CommunSoil Sci Plant Anal 21:1103–1115. doi:10.1080/00103629009368293
Meelu OP, Saggar S, Maskina MS, Rekhi RS (1987) Time and sourceof nitrogen application in rice and wheat. J Agril Sci Camb109:387–391. doi:10.1017/S0021859600080813
Mullen RW, Freeman KW, Raun WR, Johnson GV, Stone ML, SolieJB (2003) Identifying an in-season response index and thepotential to increase wheat yield with nitrogen. Agron J 95:347–351. doi:10.2134/agronj2003.0347
Olsen SR, Cole CV, Watanabe FS, Dean LA (1954) Estimation ofavailable phosphorus in soils by extraction with sodiumbicarbonate, USDA Cir. 939, US Govt. Print Office, Washington
Ortiz-Monasterio JIR, Sayre KD, Pena J, Fischer RA (1994)Improving the nitrogen use efficiency of irrigated spring wheatin the Yaqui Valley of Mexico. Trans 15th World Cong Soil Sci5b:348–349
Peñuelas J, Gamon JA, Fredeen AL, Merino J, Field CB (1994)Reflectance indices associated with physiological changes innitrogen- and water-limited sunflower leaves. Remote SensEnviron 48:135–146. doi:10.1016/0034-4257(94)90136-8
Raun WR, Johnson GV, Stone ML, Solie JB, Lukina EV, ThomasonWE, Schepers JS (2001) In-season prediction of potential grainyield in winter wheat using canopy reflectance. Agron J 93:131–138. doi:10.2134/agronj2001.931131x
Raun WR, Solie JB, Johnson GV, Stone ML, Mullen RW, FreemanKW, Thomason WE, Lukina EV (2002) Improving nitrogen useefficiency in cereal grain production with optical sensing and
602 Bijay-Singh et al.
Author's personal copy

variable rate application. Agron J 94:815–820. doi:10.2134/agronj2002.0815
Schröder JJ, Neeteson JJ, Oenema O, Struik PC (2000) Does the cropor the soil indicate how to save nitrogen in maize production?Reviewing the state of the art. Field Crops Res 66:151–164.doi:10.1016/S0378-4290(00)00072-1
Thenkabail PS, Smith RB, DePauw E (2000) Hyperspectral vegetationindices and their relationships with agricultural crop character-istics. Remote Sens Environ 71:158–182. doi:10.1016/S0034-4257(99)00067-X
Walkley A (1947) A critical examination of a rapid method fordetermining organic carbon in soils: effect of variations in
digestion conditions and of inorganic soil constituents. Soil Sci63:251–263
Yadvinder-Singh, Bijay-Singh, Ladha JK, Singh JP, ChoudharyOP (2007) Enhancing nitrogen use efficiency for sustainablerice-wheat production system in the Indo-Gangetic Plains ofIndia. In: Abrol YP, Raghuram N, Sachdev MS (eds)Agricultural nitrogen use and its environmental implications.I.K. International Publishing House Pvt. Ltd., New Delhi, pp139–164
Yoshida S, Forno DA, Cock DH, Gomez KA (1976) Laboratorymanual for physiological studies of rice, 3rd edn. InternationalRice Research Institute, Los Baños
Assessment of the nitrogen management strategy using an optical sensor for irrigated wheat 603
Author's personal copy