
Manfreda Maculosa Leaf Extracts And Their Effects On Whole ...
70
University of Texas at El Paso University of Texas at El Paso ScholarWorks@UTEP ScholarWorks@UTEP Open Access Theses & Dissertations 2019-01-01 Manfreda Maculosa Leaf Extracts And Their Effects On Whole Manfreda Maculosa Leaf Extracts And Their Effects On Whole And Selected Myotoxic Components In Crotalid Venom And Selected Myotoxic Components In Crotalid Venom Charles Steven Gilbert University of Texas at El Paso Follow this and additional works at: https://digitalcommons.utep.edu/open_etd Part of the Botany Commons, and the Environmental Sciences Commons Recommended Citation Recommended Citation Gilbert, Charles Steven, "Manfreda Maculosa Leaf Extracts And Their Effects On Whole And Selected Myotoxic Components In Crotalid Venom" (2019). Open Access Theses & Dissertations. 2857. https://digitalcommons.utep.edu/open_etd/2857 This is brought to you for free and open access by ScholarWorks@UTEP. It has been accepted for inclusion in Open Access Theses & Dissertations by an authorized administrator of ScholarWorks@UTEP. For more information, please contact [email protected].
Transcript of Manfreda Maculosa Leaf Extracts And Their Effects On Whole ...

University of Texas at El Paso University of Texas at El Paso
ScholarWorks@UTEP ScholarWorks@UTEP
Open Access Theses & Dissertations
2019-01-01
Manfreda Maculosa Leaf Extracts And Their Effects On Whole Manfreda Maculosa Leaf Extracts And Their Effects On Whole
And Selected Myotoxic Components In Crotalid Venom And Selected Myotoxic Components In Crotalid Venom
Charles Steven Gilbert University of Texas at El Paso
Follow this and additional works at: https://digitalcommons.utep.edu/open_etd
Part of the Botany Commons, and the Environmental Sciences Commons
Recommended Citation Recommended Citation Gilbert, Charles Steven, "Manfreda Maculosa Leaf Extracts And Their Effects On Whole And Selected Myotoxic Components In Crotalid Venom" (2019). Open Access Theses & Dissertations. 2857. https://digitalcommons.utep.edu/open_etd/2857
This is brought to you for free and open access by ScholarWorks@UTEP. It has been accepted for inclusion in Open Access Theses & Dissertations by an authorized administrator of ScholarWorks@UTEP. For more information, please contact [email protected].

MANFREDA MACULOSA LEAF EXTRACTS AND THEIR EFFECT ON
WHOLE AND SELECTED MYOTOXIC COMPONENTS IN
CROTALID VENOM
CHARLES STEVEN GILBERT
Master’s Program in Environmental Science
APPROVED:
Carl S. Lieb, Ph.D., Chair
Robert A. Kirken, Ph.D.
Chuan Xiao, Ph.D.
Stephen L. Crites., Ph.D. Dean of the Graduate School

Copyright
by
Charles Steven Gilbert
2019

Dedication
As I have become older, I have come to realize that none of us have really achieved everything we have without having learned something from other people. It is said we stand on the shoulders of giants. I want to thank the "giants" that have helped me get to where I am today: To my wife, Debbie for lessons about loyalty, stubbornness, and especially love. To my boys: Michael, Jared, and Jorel for patience. To my mother, 'Joni' (of Blessed Memory) for teaching me responsibility, 'social decorum', and especially how to accept 'no' as an answer. To my father, Stan (of Blessed Memory) for the ideas that you can learn things from a book and you can learn anything. To my step-father, Chuck who led by example and taught me how to listen to my children and to be aware of what's going on around me. To my sister, Lisa. To my 'Uncle Dick' (of Blessed Memory) and his wife Pat who helped me learn the bonds of family. To Stanley and Myra who also helped me learn the bonds of family. To my cousins Sally, Marty, and Marsha who have kept me in the family. To my friend, 'Ron' for a long-term friendship and early lessons about dancing, what to wear, and that loyalty is part of friendship and that forgiveness isn't about changing the past but deciding the path for the future. To a neighbor, Roebert 'Roe' (of Blessed Memory) who taught me about carpentry, mechanics, and "Too much oil is just as bad as not enough." To my extended family: Matt and Bess Ostiech (of Blessed Memory) Harold and Nettie Goldberg (of Blessed Memory) Sol and Barbara Goldberg (of Blessed Memory) To my friends and family friends: Nancy and Emily, John (of Blessed Memory), Howard and Diane, Mom's Sorority Sisters (Delta Theta Tau; Epsilon Iota Chapter), and Bob, Sue, Janet, & Paula. Everyone here, and many, many more, have taught me things not because it was necessarily their intention. I think it was because it was who they are. They taught me invaluable lessons about family, community, and our obligations to one another. These people are my heroes and the giants on whose shoulder's I stand. In deepest gratitude, I give thanks, and I offer the only thing worthy of such legacy: I promise to pay it forward. Shalom, Charles 'Chuck' Gilbert
MANFREDA MACULOSA LEAF EXTRACTS AND THEIR EFFECTS ON
WHOLE AND SELECTED MYOTOXIC COMPONENTS IN
CROTALID VENOM
by
CHARLES STEVEN GILBERT, B.S.
THESIS
Presented to the Faculty of the Graduate School of
The University of Texas at El Paso
in Partial Fulfillment
of the Requirements
for the Degree of
MASTER OF SCIENCE
Department of Geological Sciences
THE UNIVERSITY OF TEXAS AT EL PASO
December 2019

v
Acknowledgements
I would like to thank the members of my committee for their help and guidance. Without
them this work would not have come to full fruition. I am also deeply indebted to Carolina
Lema, Ph.D., for without her help and guidance much of this work would not have started or
advanced. Additional thanks go to Elizabeth Walsh, Ph.D. for her help with alternative plant
extract guidance.
Additional thanks go to the staff of the: Statistical Consulting Laboratory, Biomolecule
Analysis Core Facility, Genomic Analysis Core Facility, and Cytometry, Screening and Imaging
(CSI) Core Facility for services and facilities provided. These core facilities are supported by
grant National Institutes on Minority Health and Health Disparities (NIMHD) grant number
8G12MD007592. The contents of this work are solely the responsibility of the authors and do
not necessarily represent the official views of granting institutions.

vi
Abstract
Manfreda spp have been used for the treatment of snakebite by several cultures in North
and Central America (Austin & Honychurch, 2004, Johnson, 1999, Moerman, 2008, Verhoek,
1978a). There has been no systematic study of the genus Manfreda for its usefulness in the
treatment of snakebite.
While the annual incidence of snakebite in the United States is relatively low
(approximately 8,000 - 10,000), with a low mortality rate of 5 – 6 cases per year, there is still
significant morbidity associated with snakebite (CDC - NIOSH, 2018, Springhouse Corp (eds),
2005). Worldwide numbers of the cases of snakebite can only be estimated and run as high as
1,841,000 cases with fatalities as high as 94,000 (Kasturiratne et al., 2008). Currently the only
treatment for snakebite consists of antivenom administration in a hospital setting due to the
possibility of an anaphylactic response. A plant-based treatment could have fewer reactions and
provide onsite treatment for snakebite injuries thus possibly lowering the morbidity of the local
tissue effects (Houghton, 1994).
An aqueous extract of Manfreda maculosa leaves was examined to see if it could mitigate
the effects of whole venom obtained from Crotalus viridus viridus in an in vitro study using
human skeletal muscle cells. Experiments measuring cell death using differential nuclear
staining and experiments examining cell proliferation using human skeletal myoblasts or
differentiated myocytes (myotubes) were performed. While the clinical picture of envenomation
shows tissue necrosis, this study found no cell death, neither necrosis nor apoptosis, occurring in
venom-treated HuSKM myoblasts and myocytes or necrosis with the myotoxins in the same cells
using the methods employed.
The aqueous extract of Manfreda maculosa leaves was not reliably found to offer any
protection from rattlesnake evenomation. However, previous research had not used human
skeletal muscle cells or a cell proliferation assay within the setting of venom toxicity studies.
The further use of these technologies may prove useful in elucidating venom toxicity.

vii
Table of Contents
Acknowledgements ..................................................................................................v
Abstract .................................................................................................................. vi
Table of Contents .................................................................................................. vii
List of Tables ......................................................................................................... ix
List of Figures ..........................................................................................................x
Introduction ..............................................................................................................1
The Cultural Uses of Manfreda Species ..................................................................4 The Taxonomic History of Manfreda .............................................................4 The Uses of the Manfreda sp. Plants ..............................................................5
Overview of Methods 11
Specific Methods 14 Cell Lines ......................................................................................................14 Cell Counts....................................................................................................14 Crotalid Toxin Preparation ...........................................................................14
HeLa-Green Fluorescent Protein (HeLa-GFP) ......................................................16 HeLa-GFP Cell Expansion ...........................................................................16 HeLa-GFP Cell Passaging ............................................................................16 HeLa-GFP Plate Preparation.........................................................................16
Cryopreserved Human Skeletal Muscle Cells (HuSKM) ......................................18 HuSKM Cell Expansion ...............................................................................18 HuSKM Passaging ........................................................................................18 HuSKM Plate Preparation.............................................................................18 Assay Test Controls ......................................................................................19
Cell Death Endpoint Studies ..................................................................................20 Differential Nuclear Staining – Annexin (DNS-A) Assay ...........................20

viii
Cell Proliferation (MTS) Assay .............................................................................22
Plant Extract I (MMPE: Manfreda maculosa plant extract) ..................................22
Plant Extract II (PEII: Manfreda maculosa plant extract) .....................................24
Data analysis ..........................................................................................................24
Results 25
Discussion 47
References ..............................................................................................................49
Glossary .................................................................................................................53
Appendix ................................................................................................................54 Formulary:.....................................................................................................54 Sample R-Code: ............................................................................................57
Curriculum Vita .....................................................................................................59

ix
List of Tables
Table 1: Verhoek’s summary of genus Manfreda characteristics .................................................. 8 Table 2: Summary of the uses of the plants of the genus Manfreda............................................... 8 Table 3: Growth Media for HeLa-GFP Cells ............................................................................... 54 Table 4: Human Skeletal Muscle Cell Growth Medium (HuSKM-M) ........................................ 54 Table 5: Human Skeletal Muscle Cell Differentiation Medium (HuSKM-D) ............................. 55 Table 6: Hoechst and Propidium iodide ........................................................................................ 55 Table 7: Fluorophore Colors ......................................................................................................... 55 Table 8: 0.25% Trypsin Working Solution [0.25% Trypsin; 0.7 mM EDTA] ............................. 56 Table 9: Trypan Blue for cell counts ............................................................................................ 56 Table 10: Positive control H2O2 .................................................................................................. 56 Table 11: DNS-A Procedure staining solution/well ..................................................................... 56

x
List of Figures
Figure 1: Myotoxins - Hela-GFP - Cellular Death ....................................................................... 25 Figure 2: Whole Venom - HuSKM - Myoblasts - Cell Death - Viability..................................... 26 Figure 3: Whole Venom - HuSKM - Myoblasts - Cell Death - Cell Count ................................. 27 Figure 4: Whole Venom - HuSKM - Myoblasts - Cell Death - Viability..................................... 28 Figure 5: Whole Venom - HuSKM - Myoblasts - Cell Death - Cell Count ................................. 29 Figure 6: Myotoxins - HuSKM - Myoblasts/Myocytes - Cell Death - Viability .......................... 30 Figure 7: Myotoxins - Additional Cell Type - Cell Proliferation ................................................. 31 Figure 8: Myotoxins - HuSKM - Myoblasts/Myocytes - Cell Proliferation MTS1 ..................... 32 Figure 9: Myotoxins - HuSKM - Myoblasts/Myocytes - Cell Proliferation MTS1 ..................... 33 Figure 10: Myotoxins - HuSKM - Myoblasts/Myocytes - Cell Proliferation MTS2 ................... 34 Figure 11: Whole Venom - HuSKM - Myoblasts - Cell Proliferation MTS2 .............................. 35 Figure 12: CvvV and MMPE - HuSKM - Myoblasts - Cell Proliferation MTS1........................ 36 Figure 13: CvvV and MMPE - HuSKM - Myoblasts - Cell Proliferation MTS1........................ 37 Figure 14: CvvV with PEII - HuSKM - Myoblasts - Cell Proliferation MTS2 ........................... 38 Figure 15: CvvV with PEII - HuSKM - Myocytes - Cell Proliferation MTS2............................ 39 Figure 16: CvvV with PEII - HuSKM - Myoblasts/Myocytes - Cell Proliferation MTS2 .......... 40 Figure 17: CvvV - HuSKM - Myoblasts/Myocytes - Cell Proliferation MTS2 .......................... 41 Figure 18: PEII - HuSKM - Myoblasts/Myocytes - Cell Proliferation MTS2 ............................ 42 Figure 19: CvvV/PEII - Non-Specific Background - Cell Proliferation MTS2 ........................... 43 Figure 20. MTS Assay Morphology; Whole Venom (Cvv) for 48 h: Myoblasts and Myocytes. 46 Figure 21. DNS-A Myoblasts with 48-hour treatment of whole venom. ..................................... 46

1
Introduction
In the United States there are approximately 8,000 – 10,000 snakebites annually resulting
in significant morbidity even if only 5 - 6 bites result in death (Blackman & Dillon, 1992,
Kurecki, III & Brownlee, Jr., 1987, O'Neil et al., 2007, Springhouse Corp (eds), 2005).
However, the worldwide estimates are much higher and range from 421,000 to 1,841,000
venomous snakebites annually with fatalities in the range between 20,000 to 94,000 (Chippaux,
2008, Kasturiratne et al., 2008). High morbidity (Blackman & Dillon, 1992, Gold et al., 2004,
Gutiérrez et al., 2006, Juckett & Hancox, 2002, Springhouse Corp (eds), 2005, Warrell, 2007) is
generally associated with local tissue effects, such as myonecrosis, which was one focus of the
present study.
Snake venom is a complex mix of proteins and peptides (Harvey, 1991, Markland, 1998)
that affect multiple systems, i.e., coagulation (Markland, 1998), proteases (Wagner & Prescott,
1966), neurotoxins (Juckett & Hancox, 2002), and others (Camey et al., 2002). Snake venom
differs between species and even the venom from two different snakes of the same species can
differ significantly from each other. The treatment of snakebite and the development of
antivenoms [also cited as ‘antivenins’ (Blackman & Dillon, 1992, Castro et al., 2003, Gold et al.,
2004, Juckett & Hancox, 2002)] is thus very difficult (Galan et al., 2004).
Currently the only treatment for snakebite consists of the administration of antivenom,
administered in the hospital setting due to the possibility of anaphylactic responses. Antivenom
is developed now in sheep (Ovine sources) because there are fewer anaphylactic reactions than
from equine sources (Juckett & Hancox, 2002). Since the lag time between the envenomation
event and the administration of antivenom is always greater than zero, serious local effects can
occur in proportion to the lag time (Ownby et al., 1985). In addition, antivenom preservatives,
such as phenol, cause additional undesired side-effects (Zychar et al., 2008). A plant-based
treatment could have fewer reactions and provide for onsite treatment of snakebite injuries
(Houghton, 1994).
2
Choosing plants that have an ethnobotanical application in the treatment of various
diseases and injuries has proven a useful starting point for finding bioactive substances (Castro et
al., 2003, Gurib-Fakim, 2006, Pereda-Miranda, 1995). The genus Manfreda has a list of cultural
uses that span more than four centuries of recorded history. This finding provides an
ethnobotanical basis for studying Manfreda spp for their effects in snakebite (Cox & Balick,
1994). Manfreda spp have been used for the treatment of snakebite by several cultures in North
and Central America (Austin & Honychurch, 2004, Johnson, 1999, Moerman, 2008, Verhoek,
1978a). Aqueous extractions of leaf and root pulp have been used externally and internally for
the treatment of snakebite (Moerman, 2008, Verhoek, 1978a). Some Manfreda spp bear the
common name of “rattlesnake master” indicative of their use in the treatment of snakebite
(Austin & Honychurch, 2004). Several Manfreda spp, as well as the species in general, have
been listed in ethnobotanic literature to include M. brunnea, M. maculata, M. variegata, and M.
virginica (Johnson, 1999). It is reported that several Native American groups (Catawba,
Cherokee, Creek, and Seminole) used M. virginica for snakebite (Moerman, 2008). Verheok
(1978a) reported on the usage of Manfreda spp for snakebite in Mexico. At present, there has
been no scientific evaluation of the genus Manfreda for its usefulness in the treatment of
snakebite (Gurib-Fakim, 2006, Heinrich et al., 1998, Houghton, 1994, Houghton & Osibogun,
1993, Martz, 1992, Soares et al., 2005).
The actual phytochemical components responsible for any anti-ophidian venom effects
are not known. Saponins, which fall in the class of glycosides, are prevalent in the genus
Manfreda (Verhoek, 1978a). There was an early attempt to classify steroidal sapogenins in
Manfreda (Marker & Lopez, 1947). “Catequines, flavones, anthocyanines and condensated
tannins” have been identified in other plant species as active ingredients in plant extracts with
antivenom properties (Castro et al., 1999). In more recent work, steroidal sapogenins in Agave
utahensis have been shown to have cytotoxic effects (Yokosuka & Mimaki, 2009); however, no
study has been made of the genus Manfreda (Alonso-Castro et al., 2011).
3
For this study, an aqueous extract of Manfreda maculosa leaves was examined to see if it
could mitigate the effects of rattlesnake whole venom obtained from Crotalus viridus viridus.
Experiments measuring cell death using differential nuclear staining and experiments examining
cell proliferation using human skeletal myoblasts or differentiated myocytes (myotubes) were
performed. Additionally, two myotoxic polypeptides from Crotalus viridus concolor were
examined for toxicity both in cell death and cell proliferation, unfortunately the supply of these
agents become unavailable commercially during the course of experimentation and these
components could not be evaluated with the plant extract.

4
The Cultural Uses of Manfreda Species
The Taxonomic History of Manfreda
Plants of the genus Manfreda are of New World origin and range from Virginia to
Florida and Texas down through Mexico to Honduras (Verhoek-Williams, 1975) and currently
number about 33 species (Cruz, 2009, The Plant List, 2013), They are placed in the family
Asparageceae (The Plant List, 2013). This modern classification is based on a phylogenetic
plant systematic analysis by the Angiosperm Phylogeny Group (APG III) system (The
Angiosperm Phylogeny Group, 2009, The Plant List, 2013). The older taxonomy was to place
the genus Manfreda in the family Agavaceae, a family-level taxon no longer recognized in the
APG III system (The Angiosperm Phylogeny Group, 2009).
The first species in the current genus Manfreda was originally described by Carolus
Linnaeus (aka, Carl von Linné) as Agave virginica L. (Linnaeus, 1753); it would remain under
this name for over a century until allocated to Manfreda virginica (L.) Salisb. by Richard
Salisbury (Salisbury, 1866). Several decades later J. N. Rose, rearranging the suborder Agaveae,
supported using the genus Manfreda for M. virginica (L.) Salisb. ex Rose (Rose, 1899). Later
work by Rose allocated the genus Manfreda in the family Amarillidaceae (Rose, 1903). In 1966
work by Lloyd Shinners, based on specimens derived from Texas and a view that emphasized
vegetative over floral characters, placed Manfreda entirely into the genus Polianthes (Shinners,
1966). Later work by Susan Verhoek reviewed specimens of all species within Polianthes
(Verhoek-Williams, 1975); she concluded that there was sufficient reason not to ignore floral
characteristics and revived the recognition of the genus Manfreda as a separate lineage (Verhoek,
1978b). The relevant comparisons based on Verhoek’s description are summarized in the Table
1. While there is still some remaining controversy over whether the genus Manfreda should be
recognized (Wynn Anderson, personal communication) the APG III classification does so (The
Plant List, 2013).
5
Based on the botanic literature, allocation of this genus is to three possible families:
Agavaceae, Amarillidaceae, and Asparagaceae. There are also potentially three genera in use:
Agave, Manfreda, and Polianthes depending on whose classification is used. Furthermore,
knowledge of the common names of plants is necessary in the ethnographic literature and the
genus Manfreda is know by many names, such as, aloe, American aloe, false aloe, rattlesnake
master, huaco, amole, and barbasco (see Table 2). Also, these common names can and do refer
to more than one plant species. The references and meanings to these names will be cited as I
explore the specific uses of these plants of the genus Manfreda.
While there are 33 accepted species of Manfreda in the New World (Cruz, 2009, The
Plant List, 2013) there are five listed as growing in the United States (USDA & NRCS, 2019).
These are:
• Manfreda longiflora (Rose) Verh-Will.
• Manfreda maculosa (Hook.) Rose
• Manfreda sileri Verh-Will.
• Manfreda variegata (Jacobi) Rose
• Manfreda virginica (L.) Salisb. ex Rose
Endemic to the eastern United States, the principal species is Manfreda virginica (L.) Salisb. ex
Rose and ranges from east Texas to northern Florida and north to North Carolina and the western
tip of Virginia and then west as far as the Ohio river (Verhoek-Williams, 1975).
The Uses of the Manfreda sp. Plants
The use by Native Americans of the genus Manfreda, while principally medicinal, did
include several other types of uses. For the purposes of simplifying this study of Manfreda and
it’s cultural uses, I have categorized the usages of Manfreda into three basic groups: medicinal,
soap, and other. I have also sorted the uses by the people or culture that is using the plant and
the geographic location where this use was determined. Using this schema, I have created a table
to summarize the uses of Manfreda spp. (see Table 2).

6
T. N. Campbell’s work in 1951 was compiled from the medical herbarium and notes of
Gideon Lincecum who studied the Choctaw, Chickasaw, and Creek Indians of Mississippi and
Georgia. Lincecum’s work was amassed in the early 19th century and reported to be at The
University of Texas at Austin’s Library; not seen by author (Campbell, 1951). John Witthoft
(Witthoft, 1947) quoted from the previously published notes and herbarium samples made by
Anna Rosina Gambold on the Cherokee Indians in the area of the Conasauga River (now in
northwestern Georgia) in the early 19th century. These plant lists reported by both Campbell and
Witthoft are important because they predate the removal of the Indian populations to reservations
(aka, “Trail of Tears”) which occurred around 1830-1850 (Campbell, 1951). Reports on
medicinal plant use from the Native Americans in Oklahoma may be from the period after the
“Trail of Tears” relocation of native peoples.
The reports on the use of Manfreda for snakebite show that either the leaves or the roots
were ingested or used as an external wash (see Table 2). In some instances, the medicine-man
would chew the plant then suck the poison out of the wound (no incision was made) while
singing a medicine song (Sturtevant, 1954, Swanton, 2000). They would extract some venom
and sing, then extract a little more venom and sing some more, etc. An example of a song of the
Creek medicine-man is offered here (Swanton, 2000):
“O, spirit of the white fox, come
O, spirit of the white fox, come
O, spirit of the white fox, come
O, hater of snakes, come
Snakes [who] have hurt this man, come
Come, O white fox, and kill this snake.
O, spirit of the red fox, come, etc.
O, spirit of the black fox, come, etc.”
7
A note was included to indicate that a verse regarding a blue or yellow fox was lost
(Swanton, 2000). There was one comment on the Creek Indian usage of Manfreda in "sweet
milk;" this comment was likely made after the introduction of the Old World bovines (Campbell,
1951).
In Mexico, the plants of the genus Manfreda commonly were called “amole” and used for
soap. According to Rose (Rose, 1903), “the root is always to be found in great quantities in
every Mexican marketplace.” Verhoek (Verhoek, 1978a) quotes from a mid-16th century Aztec
document translated by the Spanish chronicler Sahagún (in the Florentine Codex):
“It is long and narrow like reeds. It has a shoot; its flower is white. It is a cleanser. The
large, the thick roots remove one's hair, make one bald; the small, the slender ones are
cleansers, a soap, they wash, they cleanse, they remove the filth.
I use amolli; I soap myself.
The animals which are not strong, such as small fish, die from it; for therewith are the
small fish taken. He who swallows a leech, this one drinks [ an infusion of ] amolli to kill
the leech which is within.”
The rise of modern soaps and detergent has decreased the use of plants as a source of
soap (Verhoek, 1978a). Outside of Mexico, Taylor reports that the Creek Indians used Manfreda
as a soap (Taylor, 1940).
Other medicinal usage regards a host of digestive disorders, i.e., colic, dyspepsia, and
diarrhea, and act as a carminative, antispasmodic, and a stomachic (Austin & Honychurch, 2004,
Hamel & Chiltoskey, 1975, Taylor, 1940, Verhoek, 1978a). Manfreda was also called for at
those unfortunate times when the patient had swallowed a leech or had worms (Hamel &
Chiltoskey, 1975, Verhoek, 1978a). There are reports of Manfreda spp being used as a liver
tonic (Hamel & Chiltoskey, 1975), for dropsy (Taylor, 1940, Verhoek, 1978a), and for
headaches (Hernández-Sandoval et al., 2008, Verhoek, 1978a).

8
Miscellaneous or other uses include the plants being used as fish poisons (Hernández-
Sandoval et al., 2008, Verhoek, 1978a, Verhoek-Williams, 1975). Manfreda plants were also
prized as ornamentals because of their striking floral displays (Rose, 1903, Verhoek, 1978a,
Verhoek-Williams, 1975). The dried flower stalks were also used as arrow shafts (Verhoek,
1978a).
Table 1: Verhoek’s summary of genus Manfreda characteristics
Characteristic Manfreda Polianthes
Flowers Green or Brown; solitary at nodes White or Red; usually paired
Stamens Long-exserted Included
Styles Long-exserted Included or shortly-exserted
Stigma Clavate Lobed
Table 1: Comparison between two genera that continues to be a question today; should
the plants all be classified under the older name of Polianthes?
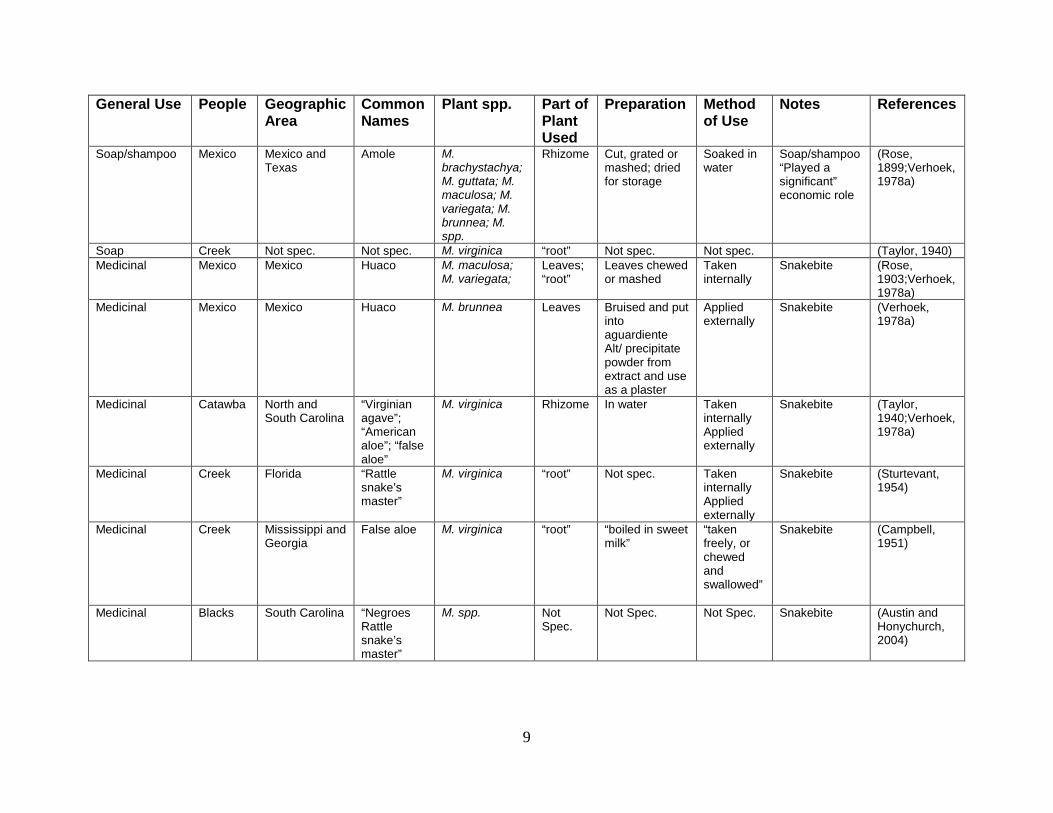
Table 2: Summary of the uses of the plants of the genus Manfreda.
(see Table 2 next two pages).
Not Spec. = Not Specified
9
General Use People Geographic Area
Common Names
Plant spp. Part of Plant Used
Preparation Method of Use
Notes References
Soap/shampoo Mexico Mexico and Texas
Amole M. brachystachya; M. guttata; M. maculosa; M. variegata; M. brunnea; M. spp.
Rhizome Cut, grated or mashed; dried for storage
Soaked in water
Soap/shampoo “Played a significant” economic role
(Rose, 1899;Verhoek, 1978a)
Soap Creek Not spec. Not spec. M. virginica “root” Not spec. Not spec. (Taylor, 1940) Medicinal Mexico Mexico Huaco M. maculosa;
M. variegata; Leaves; “root”
Leaves chewed or mashed
Taken internally
Snakebite (Rose, 1903;Verhoek, 1978a)
Medicinal Mexico Mexico Huaco M. brunnea Leaves Bruised and put into aguardiente Alt/ precipitate powder from extract and use as a plaster
Applied externally
Snakebite (Verhoek, 1978a)
Medicinal Catawba North and South Carolina
“Virginian agave”; “American aloe”; “false aloe”
M. virginica Rhizome In water Taken internally Applied externally
Snakebite (Taylor, 1940;Verhoek, 1978a)
Medicinal Creek Florida “Rattle snake’s master”
M. virginica “root” Not spec. Taken internally Applied externally
Snakebite (Sturtevant, 1954)
Medicinal Creek Mississippi and Georgia
False aloe M. virginica “root” “boiled in sweet milk”
“taken freely, or chewed and swallowed”
Snakebite (Campbell, 1951)
Medicinal Blacks South Carolina “Negroes Rattle snake’s master”
M. spp. Not Spec.
Not Spec. Not Spec. Snakebite (Austin and Honychurch, 2004)

10
General Use
People Geographic Area
Common Names
Plant spp. Part of Plant Used
Preparation Method of Use
Notes References
Medicinal Creek Oklahoma “abi-tcåpko” (“long stem” in Creek)
M. virginica “root” Decoction Applied externally
Snake or centipede bite
(Swanton, 2000) [reprinted, originally published in 1928.]
Medicinal Mexico Mexico Amole M. spp. “root” Infusion Taken internally
Swallowed leeches
(Verhoek, 1978a)
Medicinal Catawba North and South Carolina
Not spec. M. virginica Rhizome In water and a tsp. of whiskey
Taken internally
Dropsy (Taylor, 1940;Verhoek, 1978a)
Medicinal Not Spec.
Southern US False aloe; “rattlesnake master”
M. virginica “root” In water Taken internally
Colic, dyspepsia, stomachic, carminative, antispasmodic
(Taylor, 1940;Verhoek, 1978a;Austin and Honychurch, 2004)
Medicinal Mexico Yucatan M. variegata; M. paniculata; M. petskinil
Leaves Leaves applied to forehead
Applied externally
Headache (Verhoek, 1978a;Hernández-Sandoval et al., 2008)
Medicinal Cherokee Northwestern Georgia
False aloe M. virginica “root” Chewed Taken internally
“Diarrhoea” [sic] “Strong medicine”
(Witthoft, 1947)
Medicinal Cherokee North Carolina False aloe; aloe
M. virginica “root” Chewed Taken internally
“Diarrhea”; liver tonic; worms “Strong medicine”
(Hamel and Chiltoskey, 1975)
Other: Mexico Mexico Amole M. spp. “root” Not spec. Fish poison (“barbasco”); “aporaka” (Tarahumara)
(Verhoek-Williams, 1975;Verhoek, 1978a;Hernández-Sandoval et al., 2008)
Other: Mexico Mexico Not spec. M. maculosa; M. longiflora; M. variegata
Plant / flowers
Ornamentals (Rose, 1903;Verhoek-Williams, 1975;Verhoek, 1978a)
Other: Mexico Honduras “cebolla de cerro”
M. brachystachya
Flower stalk
Arrows (Verhoek, 1978a)

11
Overview of Methods
Envenomation yields two kinds of effects, systemic and local. Systemic effects are well-
controlled through the administration of antivenom. Local effects on tissue post-envenomation
include hemorrhagic, neurotoxic, and myotoxic effects. This research focused on the Manfreda
extract effects in neutralizing whole venom myotoxic components. These experiments employed
both whole rattlesnake venom (CvvV) from Crotalus viridus viridus (Sigma-Aldrich, St Louis,
MO), commonly known as the Prairie rattlesnake, and Myotoxin I (MTI) and Myotoxin II
(MTII) from Crotalus viridis concolor (Sigma-Aldrich, St Louis, MO), the Midget faded
rattlesnake. Myotoxin I and II are basic polypeptides with no enzymatic activity and are one of
three classes of myotoxic components found in snake venoms (Ownby, 1998).
The leaves of Manfreda maculosa were extracted and tested. The plants acquired were
grown in garden and greenhouse settings. The original plant extract (designated MMPE for
Manfreda maculosa Plant Extract) was prepared after the method of Biondo, et al (2003). In
brief, this method calls for the leaves to be clipped and washed using deionized water, patted dry,
and weighed. Leaves were homogenized using de-ionized water (500 g/L) in a blender at room
temperature. After maceration they were filtered through a fine filter. The aqueous extracts were
centrifuged at 10,000 × g for 10 minutes. Supernatants were freeze-dried and stored at –20 °C.
Leaf extracts were weighed and dissolved in phosphate buffered saline. Stock solutions were
stored at –20°C. They used a 1:50 w/w ratio of toxin to extract for their testing (Biondo et al.,
2003). During the processing, extreme foaming became problematic and the changes to this
procedure are noted in the subsequent "specific methods" that follow. Also, the procedure was
modified to substitute a liquid nitrogen step and to grind the frozen material with mortar and
pestle (courtesy of Dr. Elizabeth Walsh, Biology).
I obtained commercially available primary human myoblasts, and differentiated them into
myotubes, herein called myocytes. Differentiated and undifferentiated cells were tested against
the commercially available purified venom components Myotoxin I (MTI) and Myotoxin II
12
(MTII) and whole venom (Sigma-Aldrich, St Louis, MO). Several concentrations of Manfreda
extract were tested. Suggested guidelines for the standardization of venom assays (Gutiérrez et
al., 1990, Ownby, 1990, Theakston, 1990) stress the importance of controls and a systematic
approach. Tween 20 was used as a positive control for 100% inactivation and as a proxy for
necrosis. The venom component alone was used as the basic control for venom activity.
Manfreda extract alone was used as a control for effects from the plant extract itself. Growth
media with cells by itself was used as a background blank.
Cell death, using fluorescent microscopy, was initially considered a reasonable endpoint.
A literature review indicated that Myotoxin II (C. v. concolor) would be the best agent (Engle et
al., 1983). The myoblast (uninucleate) cells can be differentiated into myocytes (a fusion of cells
that are multinucleate). Myocytes have been indicated to be more sensitive to myotoxins, at least
of the PLA2 variety, than undifferentiated myoblasts (Lomonte et al., 1999). Human myocytes
have also been shown to have more of the muscle proteins present (Serena et al., 2010).
Therefore, I indirectly modelled cellular death as a percentage of dead nuclei.
I used a Promega Cell Proliferation Assay which is a colorimetric test of cell metabolism.
It measures the reduction of tetrazolium salts by mitochondrial metabolism; the abbreviation
MTS is used for this assay in this study. This protocol was used with both myoblast and
myocyte cells. Our knowledge of the toxin effects on mitochondria is limited to a note on MTI
that indicated mild swelling and MTII that showed normal mitochondria (Engle et al., 1983).
Cell data from cell proliferation assays was used to examine the responses to the various toxins
and controls.
Solution preparations have been included in the Appendix.
Pseudoreplication was an issue here because the cell samples are considered auto-
correlated, that is, not completely independent. Also, statistical analysis was problematic since
the sample sizes are small. Treated and untreated undifferentiated myoblasts, and differentiated
myotubes, were graphically compared looking at trends in the distribution of responses, effects,
and effect sizes. Morphological comparisons were made to make sure that the myoblasts and

13
myocytes actually differentiated, and to observe the effects of the toxin treatments at the level of
light microscopy.
14
Specific Methods
Cell Lines
HeLa-Green Flourescent Protein (HeLa-GFP) cells (Aguilera et al., 2006) were initially
tested using cell death as the tested outcome. This cell line was obtained from the Cytometry,
Screening and Imaging (CSI) Core Facility.
In addition, three other cell lines: HaCaT is a Human keratinocyte cell line; Hs27 is a
Human foreskin fibroblast cell line; and Jurkat is an Acute T Cell Leukemia cell line that were
observed using the MTS protocol, courtesy of C. Lema.
Cryopreserved human skeletal muscle myoblasts (HuSKM) were obtained commercially
(Zenbio, Inc., Research Triangle Park, NC) and were cultured and/or differentiated according to
vendor guidelines. A description of how the cells were handled is below.
Cell Counts
Cell counts were performed using an Improved Neubauer Hemacytometer. Cells were
diluted 1:10 with trypan blue (see Appendix). The cells were counted in 5 square millimeters on
each side of the hemacytometer, the 4 corners and one more centrally located. The cell counts
from each side of the hemacytometer were then averaged and the average used to determine the
number of cells/mm3 which is equivalent to cells/µL.
Crotalid Toxin Preparation
Myotoxin I & II (Sigma-Aldrich, St Louis, MO) derived from Crotalus viridus concolor
(MTI and MTII, respectively) were obtained commercially. Whole venom (Sigma-Aldrich, St
Louis, MO) obtained from Crotalus viridus viridus (CvvV) was also obtained commercially.
Contents of a vial were diluted in 1 mL of Dulbecco’s Phosphate Buffered Saline
(DPBS); vial sizes were 1 g, 5 g, or 10 g. Aliquots of 50 µL of the stock solution were pipetted
into microcentrifuge tubes for storage at -20°C. On use, the sufficient aliquots for the
experiment were thawed in a 37°C water bath, mixed, and centrifuged in a microcentrifuge for 1

15
minute. The stock evaluated for cloudiness or precipitates. These stock solutions were diluted in
cell media to a working solution of 2x the final dose in a 100 µL volume for the MTS1 procedure
with a final reaction volume is 200 µL. For the modified MTS2 procedure the stock would be
diluted to a working dilution of 10x the final dilution in media.
16
HeLa-Green Fluorescent Protein (HeLa-GFP)
HeLa-GFP Cell Expansion
The cell expansion protocol used was the laboratory standard protocol which is
summarized here. An aliquot of HeLa-GFP cells was obtained from cell storage and thawed in a
37°C water bath. The cells were then added 10-15 mL of the HeLa-GFP growth media (see
Formulary in the Appendix for the formulation in a standard lab stocked 15 mL conical
centrifuge tube. Cells were mixed and centrifuged at 1200 rpm for 7 minutes. Media was
decanted and a fresh 10-15 mL of cell growth media was added. Cells were then transferred to a
T-75 flask (TPP 90076) and incubated at 37°C with a 5% CO2 concentration. Cells were
checked at regular intervals and the growth media was exchanged as needed until adequate
growth was achieved.
HeLa-GFP Cell Passaging
Cells in the T-75 culture flask were checked under the fluorescent scope for fluorescence;
a check on this cell lines viability. The media was aspirated and then 2 mL of 0.25% Trypsin
working solution (see Appendix) was added. The cells were then incubated for 5 minutes until
cell release. After cell release, 10 mL of cell growth media was added. One mL of the cell
solution was kept for cell counts.
HeLa-GFP Plate Preparation
In order to prepare the Falcon 96-well plates (BD Biosciences, Bedford, MA) cell death
bioassay, the cells in the culture flask were checked for proper growth on an inverted cell culture
microscope. The grown cells were trypsinized in the cell flask to release the cells from the flask
surface. A 5 mL aliquot cells were transferred to a 15 mL conical centrifuge tube and
centrifuged at 1200 rpm for 7 minutes. The growth media was decanted and resuspended in 5
mL of fresh cell growth media. An aliquot was loaded into the hemocytometer and the cell
concentration was determined. Calculations were made and the cells were seeded in the 96-well

17
plate at 20000 cells/well in a final volume of 100 µL of cell growth media. The cell suspension
was mixed as it was loaded into the plate using 2 aliquots of 50 µL each to insure homogeneity.
Each treatment was allocated a minimum of 3 replicates each. Plate diagrams were drawn in the
lab notebook to facilitate plate set-up during the experiments to include: Test wells, positive
controls, negative control of media only, and media blanks with no cells. Initial pilot tests used
one replicate to extend the time variable if necessary. In the HeLa-GFP study one well was
extended to 96 hours. Cells were incubated at 37°C with a 5% CO2 concentration during the
experiment. Cells are checked daily and media is replaced as needed. Experimental incubations
were performed at 24, 28, 72, and 96 hours.

18
Cryopreserved Human Skeletal Muscle Cells (HuSKM)
HuSKM Cell Expansion
A cell vial was retrieved from storage and thawed in a 37°C water bath. The cells were
transferred and rinsed from the cryotube into a 15 ml conical tube using 10 mL of cell growth
media (SKM-M). The cells were centrifuged at 280 x g at 20°C for 5 minutes and the media
decanted. Cells were transferred to a 75 cm2 tissue culture flask (Corning) using 20 mL of
media. Cells were incubated at 37°C with a 5% CO2 concentration. Cells were ready for
passage at a confluence of 60-70%.
HuSKM Passaging
The cells were rinses two times using 10 mL of Dulbecco's Phosphate Buffered Saline
(DPBS). Two mL of Trypsin-EDTA solution was added to the culture flask for 5 minutes until
the cells released from the flask. This is the point at which we considered that the cells were
passaged and we added 10 mL of the cell growth media (SKM-M). The cells were transferred to
a 15 mL conical tube and centrifuged at 280 x g at 20°C for 5 minutes and the media decanted.
A fresh 10 mL of SKM-M was added and a cell aliquot was withdrawn for a cell count. Cells
were mixed to a cell density of 5000 – 15000 cells/cm2 for continued growth in the T-75 cm2 and
the previous sets repeated as necessary.
HuSKM Plate Preparation
In order to prepare the Falcon 96-well plates (BD Biosciences, Bedford, MA) for the
MTS bioassay, the cells in the culture flask were checked for proper growth on an inverted cell
culture microscope. Cells were counted and seeded at 10000 cells/well into a Falcon 96-well
plate. The outer row of wells is filled with 200 µL of DPBS to slow desiccation. Plate diagrams
were drawn in the lab notebook to facilitate plate set-up during the experiments to include: Test
wells, positive controls, negative control of media only, and media blanks with no cells. The cell
suspension was mixed as it was loaded into the plate using 2 aliquots of 50 µL each to insure

19
homogeneity. Each treatment was allocated a minimum of 3 replicates each. Cells were
incubated at 37°C with a 5% CO2 concentration during the experiment. Cells are checked daily
and media is replaced as needed. Experimental incubations were performed at 24, 28, 72, and 96
hours.
Assay Test Controls
Tween 20 was used as a positive control in selected experiments at concentrations of
0.1%, 0.05%, and 0.025%. Tween 20 at 0.1% was the final choice as the positive control. H2O2
(see Appendix) was also utilized as a positive control with a 1mM (~ 0.003%) final
concentration. The H2O2 positive control was increased in later experiments to 10 mM because
of the wide variability of action that was observed in an effort to finalize a positive control for
general use in this assay.

20
Cell Death Endpoint Studies
Stock solutions of Hoechst 33342 (Hoechst; Invitrogen, Eugene, OR); and Propidium
iodide (PI; MP Biomedicals, Solon, OH) were diluted in cell media and added to each well for a
final concentration of the fluorophores was 20 µg/mL for this part of the study. Cells were
incubated at 37°C with a 5% CO2 concentration during the experiment. Experimental
incubations were performed at 24, 28, 72, and 96 hours.
The cells in the plate wells were analyzed for fluorophore activity using a BD Pathway
855 BioImager system and its AttoVision v.1.6.2.02 Image Analysis Software (BD Biosciences,
Rockville, MD).
Differential Nuclear Staining – Annexin (DNS-A) Assay
This study was performed with the Annexin V-FITC Kit (Beckman Coulter). The wells
were seeded with 10000 cells/well. The 96-well plates were setup to include: Test replicates,
positive control (Tween20 - 0.1%), and negative controls (DMSO and untreated). Added
compounds so that the final DMSO concentration did not to exceed 1% of final concentration.
Cells were incubated at 37°C with a 5% CO2 concentration during the experiment. Myoblasts
were exposed to Crotalus viridus viridus whole venom (CvvV) at 100 µg/mL for 24, 48 and 96
hours using a reaction volume of 100 µL. At the end of the incubation period 100 µL of staining
solution was added per well in darkness. Stock solutions of Hoechst 33342 (Hoechst; Invitrogen,
Eugene, OR); and Propidium iodide (pI; MP Biomedicals, Solon, OH) were diluted in cell media
and added to each well for a final concentration of Hoechst at 2 μg/mL and pI at 1 μg/mL. The
plate was then incubated at 37°C with 5% CO2 for one hour and read in the BioImager. Cells
were analyzed using a BD Pathway 855 Bioimager system and its AttoVision v.1.6.2 software
(BD Biosciences, Rockville, MD).
When setting up the BioImager, the bottom of the plate was first cleaned with ethanol and
then placed on the BioImager and oriented per standard protocol. The 10x objective was used.
The BioImager was setup per protocol and each dye was focused, the exposure was adjusted to

21
dark background, and an autofocus test was performed to insure minimal to no movement. The
imager settings were recorded per session and differed between sessions

22
Cell Proliferation (MTS) Assay
The CellTiter 96® AQueous One Solution Cell Proliferation Assay (MTS) (Promega,
Madison, WI) was used and the optical density obtained by the use of a SpectraMax Plate Reader
with SoftMax Pro v5.4.1 software (Molecular Devices, LLC., Sunnyvale, CA) at 490 nm with a
reference wavelength of 650 nm.
Myoblasts and/or myocytes were exposed to whole venom (in a range from 5 – 1000
µg/mL) at 24, 48, 72, or 96 hours using a reaction volume of depending on the MTS procedure.
Method One (MTS1) – Working solutions were made from the stock solution in a 2x of
the final concentration using the appropriate cell medium. For the final reaction volume of 200
µL, 100 µL of the 2x toxin was added to 100 µL of medium in the 96-well plate.
To perform the MTS1 assay 100 µL of media was removed from the well without
disrupting the cells and 20 µL of the MTS reagent was added. The plate was incubated at 37°C,
5% CO2 for 2 hours. The plate was read in the plate reader mentioned above with the lid
removed.
Method Two (MTS2) – Working solutions were made from the stock solution in a 10x of
the final concentration using the appropriate cell medium. For a final reaction volume of
approximately 100 µL, 10 µL of the 10x toxin was added to 100 µL of medium in the 96-well
plate.
To perform the MTS1 assay 20 µL of the MTS reagent was added. The plate was
incubated at 37°C, 5% CO2 for 2 hours. The plates were read in the plate reader mentioned
above with the lid removed.
Plant Extract I (MMPE: Manfreda maculosa plant extract)
The plant, Manfreda maculosa (Mountain States Wholesale Nursery, Phoenix, AZ), was
obtained and leaf material was collected. The process called for a ratio of 2 mL of de-ionized
water (dI-H2O) per gram of plant material. Approximately 169.3 grams of plant material was
23
collected and added about 350 mL dI-H2O. The leaf material was added to a counter-top blender
(Sears) for one minute on high. The liquid was filtered through a GF/C (Whatman) filter using a
Millipore Vacuum filter apparatus. The blended material was very foamy and that made further
processing quite problematic. Before continued filtering the extract was centrifuged at 3000
rpm, 1348 x g for 10 minutes. The extract was filtered using a 0.45 µm filter which was too slow
so it was changed back to a GF/C filter. The filter was again changed half way through.
Approximately 250 mL of liquid extract was collected and then frozen and stored at -20°C. The
plant extract material was lyophilized in a LabConco Free Dry System/Freezone 45 for 5 days at
133 x 10-3 mbar at -48°C. The free-dried residue was mixed as a 30 mg/mL stock in DPBS.

24
Plant Extract II (PEII: Manfreda maculosa plant extract)
Manfreda maculosa was processed and 53 g of leaf material obtained. The leaves were
rinsed in de-ionized water and frozen at -20°C. The frozen leaves were placed in a mortar with
liquid nitrogen and ground with a pestle. The powder and bits were placed in a 250 mL beaker.
The plant material was extracted with 200 mL of dI-H2O by placing the material on ice and
extracted over-night. The extract was divided into four 50 mL centrifuge tubes and centrifuged
for 5.5 minutes at 300 x g at room temperature. The clear fluid middle layer was aspirated out
and 126 mL of clear yellow solution was recovered. The extract was placed on ice and then
filtered through a Whatman GF/C filter in a Millipore Vacuum filter apparatus. The collected
fluid was split into two T-75 flasks (Corning). The flasks were laid flat and frozen at -20°C and
lyophilized as previously described. The resulting powder was stored at -20°C. A quantity of
40.2 mg was recovered was made into a 40000 µg/mL stock solution and designated PEII.
Data analysis
This document was produced using Microsoft Word. Data processing and visualization
were done using Microsoft Excel, R version 3.6.1 (2019-07-05) (R Core Team, 2019), the
Tidyverse 1.2.1 package (Wickham, 2017), and the R readxl package (Wickham & Bryan, 2019).
A 2x2 factorial ANOVA was used to analyze the DNS data (in Figures 4 & 5). An
ANOVA followed by a Tukey’s test was used with the MTS data. Statistics were calculated
using SAS v 9.3.

25
Results
Figure 1 shows a pilot test analysis of Myotoxin I and Myotoxin II with the HeLa-GFP
human cancer cell line (Aguilera, et al., 2006). This test involved a 24 hr toxin incubation. A cell
in the third column was held initially unfinalized to continue an incubation to test if more time
would have aided the finding of cell death. That well showed continued growth and no toxicity
after 5 days, suggesting that time does not appear to be a factor for the lack of cell death found
here. Our positive control for cell death was Tween 20 at 0.1%; this result of 0% live cells
confirmed the use of this concentration. The 10x objective on the BioImager was used for this
analysis.
Figure 1: Myotoxins - Hela-GFP - Cellular Death
MTI = Myotoxin I; MTII = Myotoxin II

26
Figure 2 describes the results of experiment to examine cell death using the differential
nuclear staining approach with the Annexin (DNS-A) fluorophore. I used a concentration range
for the whole venom that included a range from non-toxic to toxic for the cells as shown in the
cell proliferation experiments. This profile shows very low level of cell death, both apoptotic and
necrotic. The Tween 20 control showed the highest level of cell death, as was expected, but also
showed high variability in the results. This particular problem plagued many of the experiments.
The Camptothecin is an agent to promote apoptosis; however, it didn’t seem to have that effect
here with this cell line. This experiment was also analyzed in terms of cell count (see Figure 3).
This experiment was repeated for extended time and at the highest whole venom concentration of
100 µg/mL (see Figures 4 & 5).
Figure 2: Whole Venom - HuSKM - Myoblasts - Cell Death - Viability
CvvV = Crotalus viridus viridus whole venom
27
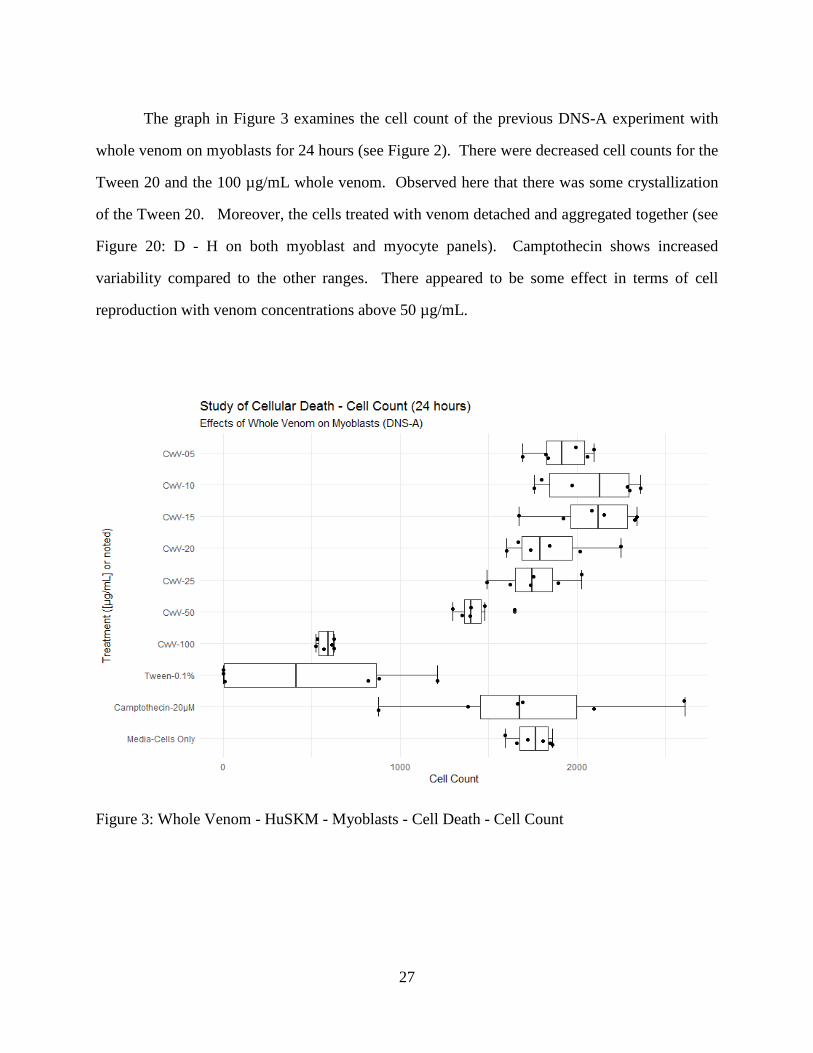
The graph in Figure 3 examines the cell count of the previous DNS-A experiment with
whole venom on myoblasts for 24 hours (see Figure 2). There were decreased cell counts for the
Tween 20 and the 100 µg/mL whole venom. Observed here that there was some crystallization
of the Tween 20. Moreover, the cells treated with venom detached and aggregated together (see
Figure 20: D - H on both myoblast and myocyte panels). Camptothecin shows increased
variability compared to the other ranges. There appeared to be some effect in terms of cell
reproduction with venom concentrations above 50 µg/mL.
Figure 3: Whole Venom - HuSKM - Myoblasts - Cell Death - Cell Count
28
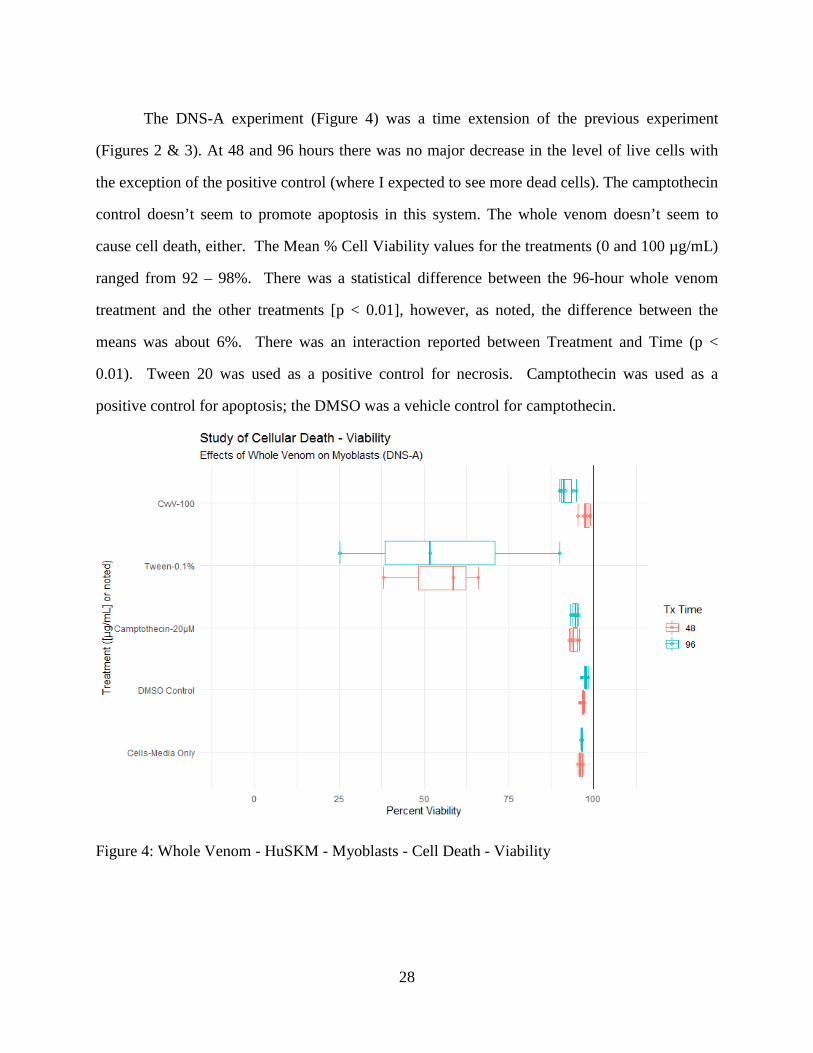
The DNS-A experiment (Figure 4) was a time extension of the previous experiment
(Figures 2 & 3). At 48 and 96 hours there was no major decrease in the level of live cells with
the exception of the positive control (where I expected to see more dead cells). The camptothecin
control doesn’t seem to promote apoptosis in this system. The whole venom doesn’t seem to
cause cell death, either. The Mean % Cell Viability values for the treatments (0 and 100 µg/mL)
ranged from 92 – 98%. There was a statistical difference between the 96-hour whole venom
treatment and the other treatments [p < 0.01], however, as noted, the difference between the
means was about 6%. There was an interaction reported between Treatment and Time (p <
0.01). Tween 20 was used as a positive control for necrosis. Camptothecin was used as a
positive control for apoptosis; the DMSO was a vehicle control for camptothecin.
Figure 4: Whole Venom - HuSKM - Myoblasts - Cell Death - Viability
29
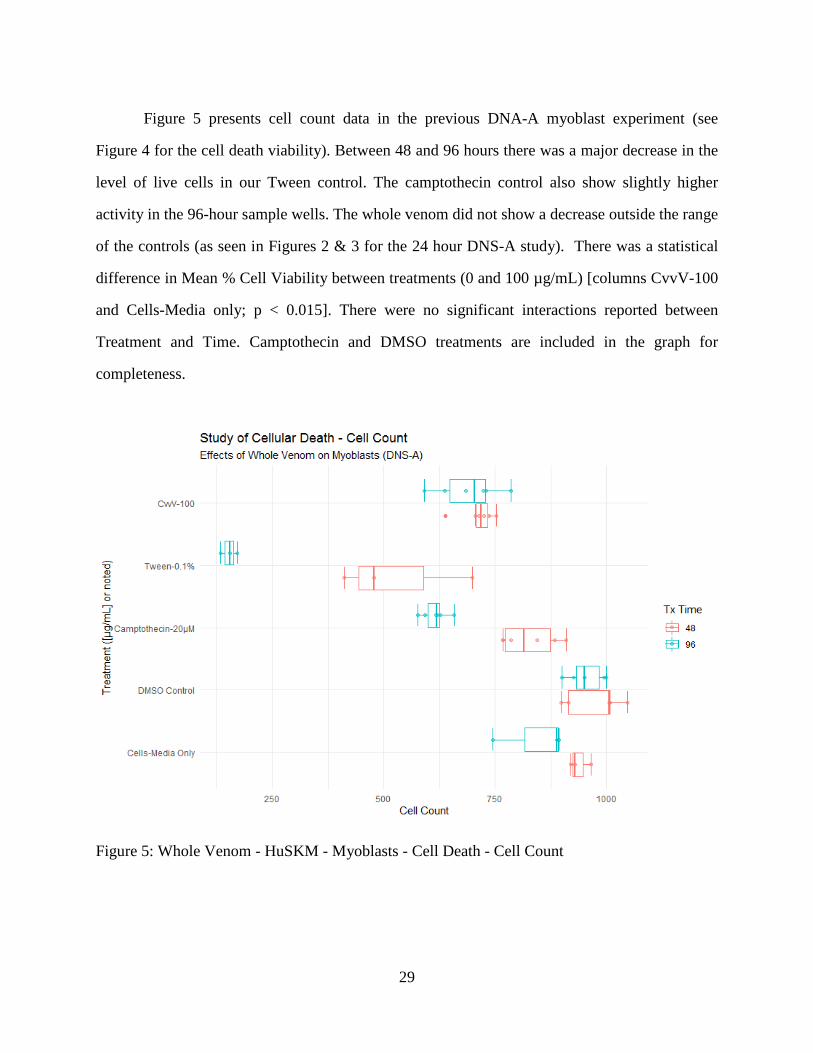
Figure 5 presents cell count data in the previous DNA-A myoblast experiment (see
Figure 4 for the cell death viability). Between 48 and 96 hours there was a major decrease in the
level of live cells in our Tween control. The camptothecin control also show slightly higher
activity in the 96-hour sample wells. The whole venom did not show a decrease outside the range
of the controls (as seen in Figures 2 & 3 for the 24 hour DNS-A study). There was a statistical
difference in Mean % Cell Viability between treatments (0 and 100 µg/mL) [columns CvvV-100
and Cells-Media only; p < 0.015]. There were no significant interactions reported between
Treatment and Time. Camptothecin and DMSO treatments are included in the graph for
completeness.
Figure 5: Whole Venom - HuSKM - Myoblasts - Cell Death - Cell Count

30
The results in Figure 6 depict an experiment to compare myoblasts and myocytes treated
with the myotoxins and stained with propidium iodide (pI) and Hoechst. This treatment indicates
no necrotic effect of the myotoxins on the myoblast cells. The myocytes show the same finding
if you compare the level of the media control with all the toxin concentrations; they appear
broadly equivalent. Some failure of the hydrogen peroxide positive control with the myocytes is
notable. This experiment can be paired with the MTS1 study in Figure 8 which is of similar
design.
Figure 6: Myotoxins - HuSKM - Myoblasts/Myocytes - Cell Death - Viability

31
Additional cell lines were tested as possible candidates because they were readily
available (Figure 7). HaCaT is a Human keratinocyte cell line; Hs27 is a Human foreskin
fibroblast cell line; and Jurkat is an Acute T Cell Leukemia cell line. None of these additional
cell lines appeared to show any sensitivity to the tested myotoxins at these concentrations. This
line of inquiry was subsequently dropped. (Courtesy of C. Lema).
Figure 7: Myotoxins - Additional Cell Type - Cell Proliferation
32
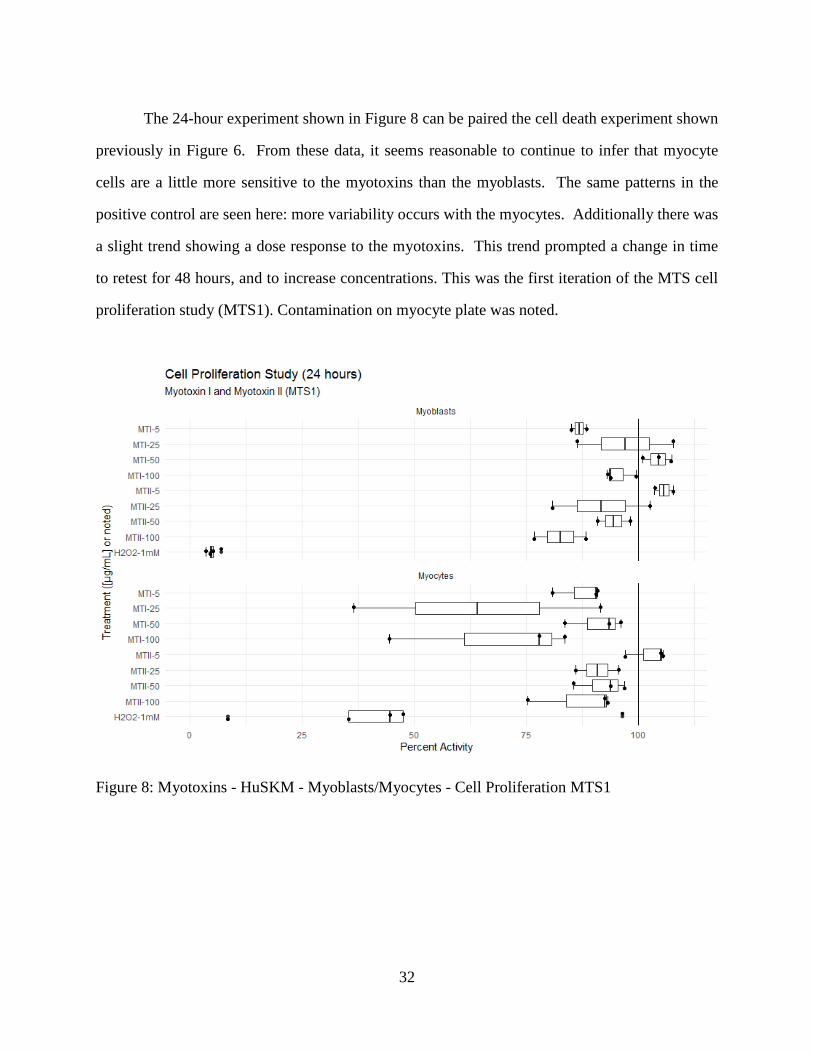
The 24-hour experiment shown in Figure 8 can be paired the cell death experiment shown
previously in Figure 6. From these data, it seems reasonable to continue to infer that myocyte
cells are a little more sensitive to the myotoxins than the myoblasts. The same patterns in the
positive control are seen here: more variability occurs with the myocytes. Additionally there was
a slight trend showing a dose response to the myotoxins. This trend prompted a change in time
to retest for 48 hours, and to increase concentrations. This was the first iteration of the MTS cell
proliferation study (MTS1). Contamination on myocyte plate was noted.
Figure 8: Myotoxins - HuSKM - Myoblasts/Myocytes - Cell Proliferation MTS1

33
Figure 9 plots the data from a 48-hour experiment that can be paired with Figure 8, a cell
proliferation experiment shown previously. This 48-hour test (50% - 100%) shows a decrease in
the Percent Activity compared to the 24-hour test (75% - 100%). It is not as clear here that
myocyte cells are more sensitive to the myotoxins than the myoblasts. The same pattern appears
in the positive control here, as noted previously, i.e., it is more variable with the myocytes. The
myoblast data here represents two experimental plates combined together. 500 µg/mL dose of
myotoxins gave us a near LC50.
Figure 9: Myotoxins - HuSKM - Myoblasts/Myocytes - Cell Proliferation MTS1

34
In Figure 10 are the results of the experiment testing the effects of the two myotoxins at
48 and 72 hours in the concentration range of 100 µg/mL to 1000 µg/mL. It appeared that the
time of incubation may have been a factor for decreased activity; however, comparison of
equivalent concentrations with the findings in Figure 8 for 48 hours appear contradictory. The
concentration of 500 µg/mL appeared to be optimal in this series. Here the positive control
functioned as expected; it showed low cell activity. Due to unavailability of further myotoxins
from SIGMA and limited stock the MYS cell proliferation protocol was changed to MTS2. LC50
shows up at 72 hours at 1000 µg/mL (MTI at 50.6% and MTII at 49.0%, mean values), however,
due to unavailability of further myotoxins from SIGMA and limited stock this could not be
pursued further.
Figure 10: Myotoxins - HuSKM - Myoblasts/Myocytes - Cell Proliferation MTS2

35
Figure 11 shows the results of an experiment with whole venom. The effect of whole
venom on myoblasts over time appears to show that whole venom has a greater decrease in
activity over 24 hours than over 72 hours: a graded response over time for concentrations over 25
µg/mL. At 5 µg/mL of whole venom the response starts at about 85% for 24 hours, but longer
exposure at 48 and 72 hours yields less activity (just below 60% for both). The effect size of this
system is between 50% - 75%. The hydrogen peroxide control didn’t function as expected in
this system, as it completely failed to inactivate the cells.
Figure 11: Whole Venom - HuSKM - Myoblasts - Cell Proliferation MTS2
36
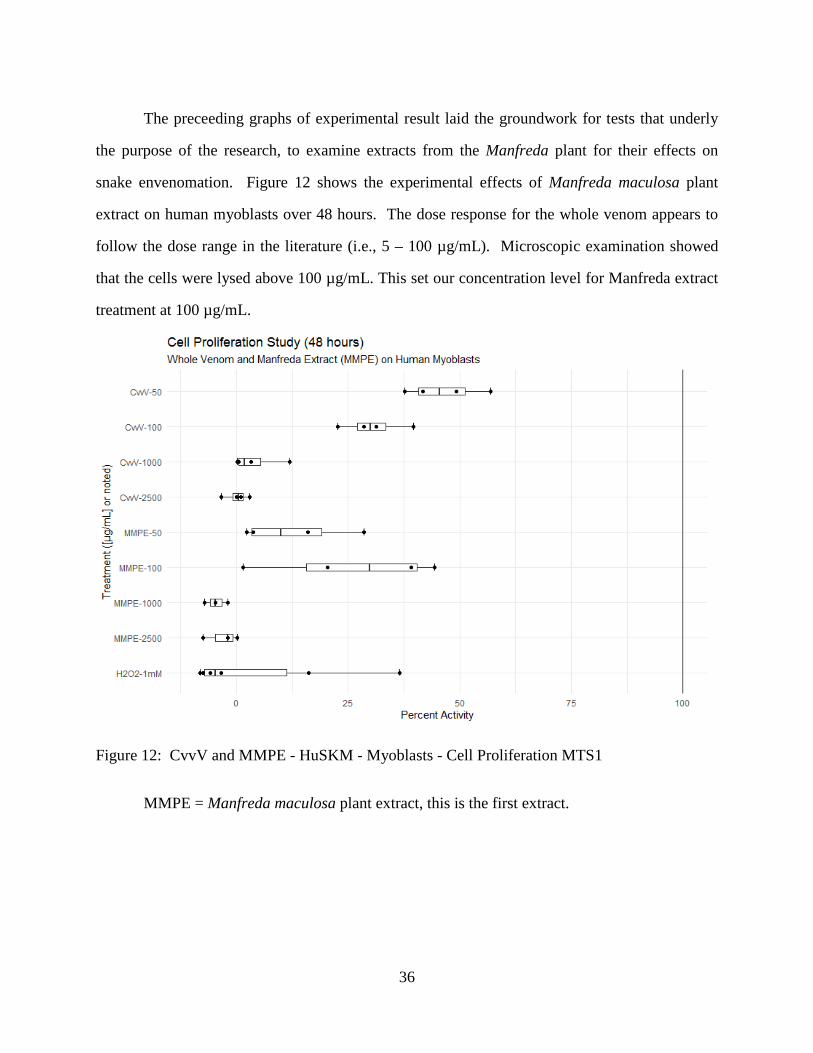
The preceeding graphs of experimental result laid the groundwork for tests that underly
the purpose of the research, to examine extracts from the Manfreda plant for their effects on
snake envenomation. Figure 12 shows the experimental effects of Manfreda maculosa plant
extract on human myoblasts over 48 hours. The dose response for the whole venom appears to
follow the dose range in the literature (i.e., 5 – 100 µg/mL). Microscopic examination showed
that the cells were lysed above 100 µg/mL. This set our concentration level for Manfreda extract
treatment at 100 µg/mL.
Figure 12: CvvV and MMPE - HuSKM - Myoblasts - Cell Proliferation MTS1
MMPE = Manfreda maculosa plant extract, this is the first extract.

37
In Figure 13 are the results of an experiment replicating whole venom and the Manfreda
extract effects on myoblasts for 48 and 72 hours. The whole venom effect size is showing
activity in the range of 50% - 75%. The effect size of plant extract lies in the range of 60% -
100%. The positive control concentration was increased in this experiment and still shows wide
variability and didn’t work consistently. The dose response for whole venom noted previously
(see Figure 13) has disappeared.
Figure 13: CvvV and MMPE - HuSKM - Myoblasts - Cell Proliferation MTS1
This experiment (Figure 14) looked at the effects of whole venom and plant extract
combined in myoblasts. The treatment line shows the whole venom concentration, then “ra”
(removed venom added media and plant extract to appropriate volume), or “a” (added plant
extract), followed by the time that elapsed before the plant extract was added (at 1 hr or 3 hr),
then the incubation continued on to 48 hours whereupon the activity was measured. PEII was

38
dosed at 100 µg/mL. The concentration groupings from 5 µg/mL to 100 µg/mL appeared
generally (with two exceptions one at 25 µg/mL and another at 50 µg/mL that were outliers to
this observation) at the same levels, especially at the 100 µg/mL group. The approximate
equivalent levels indicate that the plant extract had no effect. The pattern changes above 500
µg/mL where it looks like when the whole venom remains with the plant extract the activity
levels are higher but in these grouping the whole venom with no plant extract matched with the
higher activity levels. When the venom remains with the cells, plant extract or not, the cells have
a higher activity.
Figure 14: CvvV with PEII - HuSKM - Myoblasts - Cell Proliferation MTS2
Two groups have been outlined on the Figure 14 graph: the 5 µg/mL and the 100 µg/mL
groups. If the plant extract had on effect, I expected that the venom only sample would have
lower activity than the samples treated with the plant extract. PEII = Plant Extract II

39
The experiment displayed in Figure 15 looked at the effects of whole venom and plant
extract combined in myocytes. As in Figure 14, the treatment line shows the whole venom
concentration, then “ra” (removed venom added media and plant extract to appropriate volume),
or “a” (added plant extract) then the time that elapsed before the plant extract was added (at 1 hr
or 3 hr), then the incubation continued on to 48 hours when the activity was measured. PEII was
dosed at 100 µg/mL. The concentration groupings appear generally at the same levels. There is
still variability in one to two observations in some groups. The approximate equivalent levels
within groupings indicate that the plant extract had no effect. The pattern changes at 100 µg/mL
where, when the whole venom is not removed, the activity levels are higher. However, the
whole venom with no plant extract matched with the higher activity levels, suggesting that it may
be an artifact. When the venom remains with the cells, plant extract or not, the cells have a
higher activity.
Figure 15: CvvV with PEII - HuSKM - Myocytes - Cell Proliferation MTS2

40
The same two groups have been outlined on the Figure 15 graph: the 5 µg/mL and the
100 µg/mL groups. If the plant extract had on affect, I would have expected that the venom only
sample would have lower activity than the samples treated with the plant extract, instead in this
figure (15) in the 100 µg/mL group some of the plant extract tests showed lower activity.
This experiment (Figure 16) involved a 1-hour pre-treatment incubation with plant
extract II. Adjacent measures show that there appeared to be no effect of the plant extract on the
whole venom. PEII by itself did not decrease activity. The Tween 20 positive control worked in
this experiment, but the camptothecin treatment didn’t give consistent results. The DMSO
negative control produced the expected results in that it didn't decrease activity.
Figure 16: CvvV with PEII - HuSKM - Myoblasts/Myocytes - Cell Proliferation MTS2
41
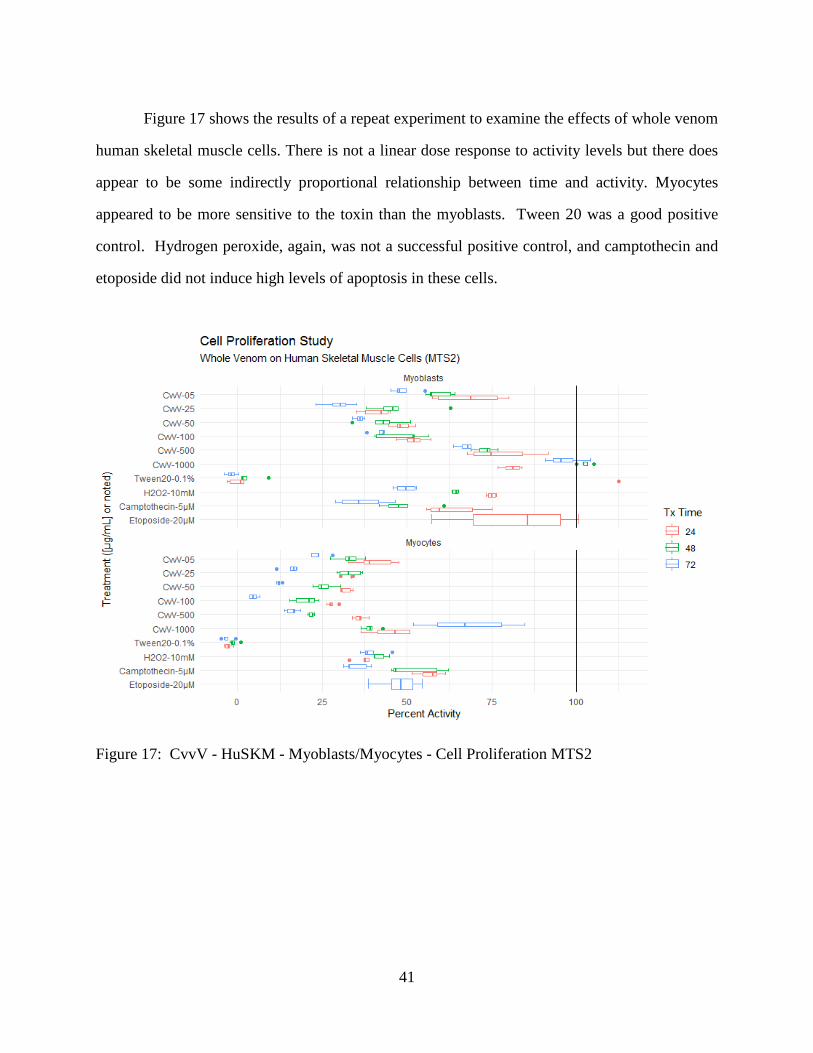
Figure 17 shows the results of a repeat experiment to examine the effects of whole venom
human skeletal muscle cells. There is not a linear dose response to activity levels but there does
appear to be some indirectly proportional relationship between time and activity. Myocytes
appeared to be more sensitive to the toxin than the myoblasts. Tween 20 was a good positive
control. Hydrogen peroxide, again, was not a successful positive control, and camptothecin and
etoposide did not induce high levels of apoptosis in these cells.
Figure 17: CvvV - HuSKM - Myoblasts/Myocytes - Cell Proliferation MTS2

42
Figure 18 is a repeat experiment examining the effects of plant extract II on human
skeletal muscle cells. There is decreased activity of cells when plant extract II is at levels above
100 µg/mL. However, it did not appear to have a dose response or time dependent relationship
to activity levels. Tween 20 was a good positive control. Hydrogen peroxide was not a successful
control, and camptothecin and etoposide do not induce high levels of apoptosis in these cells.
Figure 18: PEII - HuSKM - Myoblasts/Myocytes - Cell Proliferation MTS2

43
Figure 19 represents a non-specific background experiment that served as a check of
background levels caused by the reagents in the bioassay system used for the MTS assay in these
experiments. These were incubated without cells to examine the effects of the CvvV and PEII
alone on the MTS methodology outcomes. No levels were above 50%. Background values with
the whole venom appear consistent with concentration and time and do not vary overmuch. The
values of background with the plant extract II appear to vary with concentration and time; they
appear to decrease as length of incubation increases and are higher at lower concentrations.
Figure 19: CvvV/PEII - Non-Specific Background - Cell Proliferation MTS2
Figure 20 is a light microscopy morphological comparison of HuSKM myoblasts and
myocytes. Cell detachment and aggregation were seen at a slightly higher whole venom
concentration in myoblasts (Figure 20F, 100 µg/mL) than myocytes (Figure 20D, 25 µg/mL).
Some "crystallization" appeared with Tween 20 at 0.1% (Figure 20, Myocytes 20B) and this was
a likely cause of cell count errors.

44
G H
A B
D
F E
Myoblasts
C

45
A B
C D
F E
G H
Myocytes

46
Figure 20. MTS Assay Morphology; Whole Venom (Cvv) for 48 h: Myoblasts and Myocytes.
Set up as two panels: Myoblasts and Myocytes.
A. No Treatment Control; B. Tween 20 - 0.1% (Positive Control); C. 5 µg/mL CvvV; D.
25 µg/mL CvvV; E. 50 µg/mL CvvV; F. 100 µg/mL CvvV; G. 500 µg/mL CvvV; H. 1000
µg/mL CvvV.
The micrograph in Figure 21 is from the DNS-A experiment shown in the graph in Figure
4. Myoblasts and myocytes are adherent to the surface and treatment with venom detaches and
aggregates the cells (Figure 20); although apparently they still remain viable as indicated by not
being permeable to Propidium Iodide (pI). Viable cells are shown in blue (Hoechst) while pI-
permeable necrotic cells are shown in magenta. Image capture and analysis were performed with
the BD Pathway Bioimager and Attovision v.1.6.2 software.
Figure 21. DNS-A Myoblasts with 48-hour treatment of whole venom.
A. Untreated control. B. Whole Venom at 100 µg/mL.
A B

47
Discussion
Problems with the positive controls continued and were not completely resolved
throughout this study. The myocytes appeared to be more resistant to the hydrogen peroxide that
the myoblasts. Since the myocytes are multinucleated and much larger than the myoblasts, it
may be that their different metabolisms are the source of this difference. The problem of
resistance was also seen with the Tween 20, but the crystallization formed prevented employing
higher concentrations of Tween.
Another feature of the MTS testing was that it presents several values for cell activity
above 100%. This finding is problematic in two ways: 1), it is not possible that there could be
values above 100% theoretically and 2), the baseline is set with an average of the media blanks
included in the testing. Increasing the number of blanks did not improve the problem. These
values remain un-interpretable in terms of the results and made the combining of results across
the experiments questionable.
The results of this in vitro study showed that venom-induced necrosis of human skeletal
myoblasts and myocytes (see Figures 2-6, 21) was limited. The clinical picture of snakebite
shows that myonecrosis is a local symptom of envenomation. The results seen here of no cell
death are different from what is seen in the clinical picture. These results indicate that the
mechanism of whole venom myotoxicity may be more complicated than originally appreciated,
especially since cellular necrosis was not observed. It may be that the cell death seen at the
tissue level in vivo is an emergent property that doesn't exist at the in vitro cell level studied here.
Another possible explanation is that there is binding occurring with the serum proteins that are in
the cell media and that these proteins are inactivating venom components. In the case of the
myotoxins, higher concentrations need to be checked since there were some dosage issues noted
and the myotoxins became unavailable. In the initial study in Figure 6, the concentration may
have been too low to elicit a cell death response. More experiments are needed to elucidate the

48
mechanisms underlying the myotoxic effects that occur during snakebite envenomation.
Myoblasts exposed to whole venom up to 96 hours showed negligible cytotoxic effect as
assessed by the DNS assay at 100 µg/mL of CvvV concentration. Cell aggregation associated
with venom treatment and Tween 20 background crystal formation, were issues that may be
responsible for cell count differences seen (Figures 3 & 5) and for results seen in the DNS assay
(Figures 1 - 6). Further experimentation is required to resolve these issues.
The HuSKM myoblasts and myocytes were not as resistant to venom treatment as
measured by the loss of cell membrane permeability in the MTS experiments. In fact, this
bioassay showed that differences due to envenomation between venom-treated cells and non-
treated cells could be measured. Nevertheless, there is not any clear picture of a dose-response
in cell activity observed using the MTS assay over any time period in either myoblasts or
myocytes.
Information derived from the whole venom treated cells with plant extract in Figures 14 -
16 do not show any patterns in the data visualization suggestive of interactions indicative of
extract effects that actually mitigate the affects of whole snake venom. A much larger set of
repeat experiments would be needed to have the power to resolve and quantify the small effect
size, if any, that exists in a treatment group defined by the venom concentration.
In summary, this study found no necrosis or apoptosis occurring in venom-treated
HuSKM myoblasts and myocytes (Figures 2 - 5), or necrosis with the myotoxins in the same
cells (Figure 6) using the methods employed. Previous research had not used HuSKM cells or
the MTS cell proliferation assay within the setting of venom toxicity studies. The further use of
these technologies may prove useful in elucidating venom toxicity.
49
References
Aguilera RJ, Montoya J, Primm TP, and Varela-Ramirez A. 2006. Green Fluorescent Protein as a Biosensor for Toxic Compounds. Reviews in Fluorescence 3: 463-476.
Alonso-Castro AJ, Villarreal ML, Salazar-Olivo LA, Gomez-Sanchez M, Dominguez F, and Garcia-Carranca A. 2011. Mexican medicinal plants used for cancer treatment: Pharmacological, phytochemical and ethnobotanical studies. Journal of Ethnopharmacology 133 (3): 945-972.
Austin DF, and Honychurch PN. 2004. Florida Ethnobotany.: CRC Press, Boca Raton, FL. Biondo R, Pereira AM, Marcussi S, Pereira PS, França SC, and Soares AM. 2003. Inhibition of
enzymatic and pharmacological activities of some snake venoms and toxins by Mandevilla velutina (Apocynaceae) aqueous extract. Biochimie 85 (10): 1017-1025.
Blackman JR, and Dillon S. 1992. Venomous snakebite: past, present, and future treatment options. Journal of the American Board of Family Practice 5 (4): 399-405.
Camey KU, Velarde DT, and Sanchez EF. 2002. Pharmacological characterization and neutralization of the venoms used in the production of Bothropic antivenom in Brazil. Toxicon 40 (5): 501-509.
Campbell TN. 1951. Medicinal Plants Used by Choctaw, Chickasaw, and Creek Indians in the Early Nineteenth Century. Journal of the Washington Academy of Sciences 41 (9): 285-290.
Castro KNC, Carvalho ALO, Almeida AP, Oliveira DB, Borba HR, Costa SS, and Zingali RB. 2003. Preliminary in vitro studies on the Marsypianthes chamaedrys (boia-caá) extracts at fibrinoclotting induced by snake venoms. Toxicon 41 (7): 929-932.
Castro O, Gutiérrez JM, and Barrios M. 1999. Neutralización del efecto hemorrágico inducido por veneno de Bothrops asper (Serpentes: Viperidae) por extractos de plantas tropicales. Revista de Biología Tropical 47 (3): 605-616.
CDC - NIOSH. 2018. "Venemous Snakes." 2019. Available from https://www.cdc.gov/niosh/topics/snakes/default.html.
Chippaux J-P. 2008. Estimating the Global Burden of Snakebite Can Help To Improve Management. PLoS Medicine 5 (11): 1-2.
Cox PA, and Balick MJ. 1994. The ethnobotanical approach to drug discovery. Scientific American 270 (6): 82-87.
Cruz CC. 2009. Systemática del Genéro Manfreda Salisb. (Agavaceae). D.Sc. Tesis, Colegio de Postgraduados, Montecillo, Mexico.
Engle CM, Becker RR, Bailey T, and Bieber AL. 1983. Characterization of Two Myotoxic Proteins from Venom of Crotalus viridis concolor. Toxin Reviews 2 (2): 267-283.
Galan JA, Sanchez EE, Rodriguez-Acosta A, and Perez JC. 2004. Neutralization of venoms from two Southern Pacific Rattlesnakes (Crotalus helleri) with commercial antivenoms and endothermic animal sera. Toxicon 43 (7): 791-799.

50
Gold BS, Barish RA, and Dart RC. 2004. North American snake envenomation: diagnosis, treatment, and management. Emergency Medical Clinics of North America 22 (2): 423-43, ix.
Gurib-Fakim A. 2006. Medicinal Plants: Traditions of Yesterday and Drugs of Tomorrow. Molecular Aspects of Medicine 27: 1-93.
Gutiérrez JM, Rojas G, Lomonte B, Gené JA, Chaves F, Alvarado J, and Rojas E. 1990. Standardization of assays for testing the neutralizing ability of antivenoms. Toxicon 28 (10): 1127-1129.
Gutiérrez JM, Theakston RDG, and Warrell DA. 2006. Confronting the Neglected Problem of Snake Bite Envenoming: The Need for a Global Partnership. PLoS Medicine 3 (6): 727-731.
Hamel PB, and Chiltoskey MU. 1975. Cherokee plants and their uses: a 400 year history.: Herald Pub. Co., Sylva, NC.
Harvey AL, editor. 1991. Snake Toxins. Pergamon Press, Inc., New York. Heinrich M, Ankli A, Frei B, Weimann C, and Sticher O. 1998. Medicinal plants in Mexico:
healers' consensus and cultural importance. Social Science & Medicine 47 (11): 1859-1871.
Hernández-Sandoval L, Orellana R, and Carnevali G. 2008. Two new species of Manfreda Salisb. (Agavaceae) from the Yucatán Peninsula, Mexico. The Journal of the Torrey Botanical Society 135 (2): 168-177.
Houghton PJ. 1994. Treatment of Snakebite with Plants. Journal of Wilderness Medicine 5 (4): 451-452.
Houghton PJ, and Osibogun IM. 1993. Flowering plants used against snakebite. Journal of Ethnopharmacology 39 (1): 1-29.
Johnson T. 1999. CRC Ethnobotany Desk Reference. CRC Press, Boca Raton, FL. Juckett G, and Hancox JG. 2002. Venomous snakebites in the United States: management review
and update. American Family Physician 65 (7): 1367-1374. Kasturiratne A, Wickremasinghe AR, de Silva N, Gunawardena NK, Pathmeswaran A,
Premaratna R, Savioli L, Lalloo DG, and de Silva HJ. 2008. The Global Burden of Snakebite: A Literature Analysis and Modelling Based on Regional Estimates of Envenoming and Deaths. PLoS Medicine 5 (11): 1-14.
Kurecki BA, III, and Brownlee HJ, Jr. 1987. Venomous snakebites in the United States. Journal of Family Practice 25 (4): 386-392.
Linnaeus C. 1753. Species Plantarum. Laurentius Salvius, Stockholm. Lomonte B, Angulo Y, Rufini S, Cho W, Giglio JR, Ohno M, Daniele JJ, Geoghegan P, and
Gutiérrez JM. 1999. Comparative study of the cytolytic activity of myotoxic phospholipases A2 on mouse endothelial (tEnd) and skeletal muscle (C2C12) cells in vitro. Toxicon 37 (1): 145-158.

51
Marker RE, and Lopez J. 1947. Steroidal Sapogenins. No. 171. Biogenesis of the Steroidal Sapogenins in Agaves, Manfreda and Hesperaloe. Journal of the American Chemical Society 69 (10): 2403-2404.
Markland FS. 1998. Snake venoms and the hemostatic system. Toxicon 36 (12): 1749-1800. Martz W. 1992. Plants with a reputation against snakebite. Toxicon 30 (10): 1131-1142. Moerman DE. 2008. Native American Ethnobotany.: Timber Press, Portland, OR. O'Neil ME, Mack KA, Gilchrist J, and Wozniak EJ. 2007. Snakebite injuries treated in United
States emergency departments, 2001-2004. Wilderness Environmental Medicine 18 (4): 281-287.
Ownby CL. 1998. Structure, Function and Biophysical Aspects of the Myotoxins from Snake Venoms. Toxin Reviews 17 (2): 213-238.
Ownby CL. 1990. Comments on letter to the editor--Standardization of assays for testing the neutralizing ability of antivenoms. Toxicon 28 (10): 1129-1130.
Ownby CL, Colberg TR, and Odell GV. 1985. Response to letter to the editor by Russell, Ruzic and Gonzalez. Toxicon 23 (2): 205-208.
Pereda-Miranda R. 1995. Bioactive Natural Products from Traditionally Used Mexican Plants. In Phytochemistry of Medicinal Plants, eds JT Arnason, R Mata and JT Romeo, 83-112. Plenum Press, New York.
R Core Team. 2019. R: A language and environment for statistical computing. R Foundation for Statistical Computing, Vienna, Austria. URL https://www.R-project.org/.
Rose JN. 1899. A Proposed Rearrangement of the Suborder Agaveae. Contributions of the United States National Herbarium 5: 151-157.
-----. 1903. Amarillidaceae. Contributions of the United States National Herbarium 8: 8-23. Salisbury RA. 1866. The Genera of Plants. J. Van Voorst, London. Serena E, Zatti S, Reghelin E, Pasut A, Cimetta E, and Elvassore N. 2010. Soft substrates drive
optimal differentiation of human healthy and dystrophic myotubes. Integrative Biology 24(10): 193-201.
Shinners LH. 1966. Texas Polianthes, Including Manfreda (Agave Subgenus Manfreda) and Runyonia (Agavaceae). SIDA 2 (3): 333-338.
Soares AM, Ticli FK, Marcussi S, Lourenço MV, Januário AH, Sampaio SV, Giglio JR, Lomonte B, and Pereira PS. 2005. Medicinal plants with inhibitory properties against snake venoms. Current Medicinal Chemistry 12 (22): 2625-2641.
Springhouse Corp (eds). 2005. 8th ed. Professional Guide to Diseases.: Lippincott Williams & Wilkins, Philadelphia, PA.
Sturtevant W. 1954. The Mikasuki Seminole: Medical Beliefs and Practices. PhD Thesis, Yale University, New Haven, CT.
Swanton JR. 2000. Creek Religion and Medicine.: University of Nebraska Press.
52
Taylor LA. 1940. Plants Used as Curatives by Certain Southeastern Tribes.: Botanical Museum of Harvard University, Cambridge, MA.
The Angiosperm Phylogeny Group. 2009. An update of the Angiosperm Phylogeny Group classification for the orders and families of flowering plants: APG III. Botanical Journal of the Linnean Society 161: 105-121.
The Plant List. 2013. "The Plant List." 2019. Available from http://www.theplantlist.org/. Theakston RDG. 1990. Comments on letter of Gutiérrez et al. on standardization of assays for
testing the neutralizing activity of antivenoms. Toxicon 28 (10): 1131-1132. USDA, and NRCS. 2019. "The PLANTS Database." 2019. Available from
http://plants.usda.gov. Verhoek S. 1978a. Huaco and Amole: A Survey of the Uses of Manfreda and Prochnyanthes.
Economic Botany 32 (2): 124-130. -----. 1978b. Two New Species and a New Combination in Manfreda (Agavaceae). Britonnia 30
(2): 165-171. Verhoek-Williams SE. 1975. A Study of the Tribe Poliantheae (including Manfreda) and
Revisions of Manfreda and Prochnyanthes (Agavaceae). Ph. D. Thesis, Cornell University, Ithaca, NY.
Wagner FW, and Prescott JM. 1966. A comparative study of proteolytic activities in the venoms of some North American snakes. Comparative Biochemistry and Physiology 17 (1): 191-201.
Warrell DA. 2007. Venomous Animals. Medicine 35 (12): 659-662. Wickham H. 2017. tidyverse: Easily Install and Load the 'Tidyverse'. R package version 1.2.1.
https://CRAN.R-project.org/package=tidyverse Wickham H and Bryan J. 2019. readxl: Read Excel Files. R package version 1.3.1. Witthoft J. 1947. An Early Cherokee Ethnobotanical Note. Journal of the Washington Academy
of Sciences 37(3): 73-75. Yokosuka A, and Mimaki Y. 2009. Steroidal saponins from the whole plants of Agave utahensis
and their cytotoxic activity. Phytochemistry 70 (6): 807-815. Zychar BC, Castro Jr NC, Marcelino JR, and Gonçalves LR. 2008. Phenol used as a preservative
in Bothrops antivenom induces impairment in leukocyte-endothelial interactions. Toxicon 51 (7): 1151-1157.

53
Glossary
CvvV = Crotalus viridus viridus whole venom
Hela-GFP = HeLa- Green Flourescent Protein cells
HuSKM = Human Skeletal Muscle cells
MMPE = Manfreda maculosa plant extract
MTI = Myotoxin I
MTII = Myotoxin II
Not Spec. = Not Specified
PEII = Plant Extract II (Manfreda maculosa)

54
Appendix
Formulary:
Table 3: Growth Media for HeLa-GFP Cells
Dulbecco's Modified Eagle's Medium (DMEM)
10% Cosmic Calf Serum (Hyclone)
1x Penicillin-Streptomycin-Amphotericin B Antibiotic-Antimycotic Solution (Sigma
Chemical Co.) – 100x Stock [Penicillin; 10
mg Streptomycin; 25 µg Amphotericin B]
1x Kanamycin Sulfate (GIBCO/BRL) Diluted from original 100x
Table 4: Human Skeletal Muscle Cell Growth Medium (HuSKM-M)
Skeletal Muscle Cell Growth Medium (cat # SKM-M)
DMEM
Fetal bovine serum
Bovine Serum Albumin
Fetuin
Human Epidermal Growth Factor
Dexamethasone
Human Insulin
Penicillin
Streptomycin
Amphotericin B
1.0 g/L D-glucose

55
Table 5: Human Skeletal Muscle Cell Differentiation Medium (HuSKM-D)
Skeletal Muscle Cell Differentiation Medium (cat # SKM-D)
DMEM
Horse serum
Bovine Serum Albumin
Fetuin
Penicillin
Streptomycin
Amphotericin B
1.0 g/L D-glucose
Table 6: Hoechst and Propidium iodide
240 µL Cell medium
5 µL Hoechst (stock 1 mg/mL = 1 µg/µL)
5 µL Propidium iodide (PI) (stock 1 mg/mL)
Table 7: Fluorophore Colors
Fluorophore Color Stains Target
FITC Green All cells
Hoechst Blue All cells
Propidium iodide Red Dead cells
Annexin

56
Table 8: 0.25% Trypsin Working Solution [0.25% Trypsin; 0.7 mM EDTA]
5 mL Trypsin-Versene (GIBCO/BRL) 2.5% Trypsin (10x)
45 mL DMEM (without Sodium pyruvate) without Calf serum and supplements.
Table 9: Trypan Blue for cell counts
50 µL Trypan Blue (Cell laboratory stock)
400 µL Hank's Balanced Salt Solution
50 µL Cell solution to count
Table 10: Positive control H2O2
30% H2O2 (8.82 M) 10 µL : 990 µL = 0.3% (0.0882 M)
0.3% 2 µL into 200 µL ~ 0.003% final concentration (0.000882 M) ~1 mM
Table 11: DNS-A Procedure staining solution/well
100 µL 2x binding buffer (from the Annexin Kit)
10 µL Hoechst for a final concentration of 2 µg/mL
10 µL Propidium iodide for a final concentration of 1 µg/mL
10 µL Annexin for a final concentration of 0.25 µg/mL

57
Sample R-Code: ## Set libraries ---- library(tidyverse) library(readxl) library(ggplot2) ##Import data ---- ## Cell Lines ---- # 20110520_HelaGFP Myotoxin FITC_pI Hoeckst_pI ---- pI_HelaGFP <- read_xls("C:/Users/Owner/Documents/20180415_ThesisReGraphReImage/2.
Prepared Data/20110520_HelaGFP.xls", sheet = 1) # 20111028_MTS_HaCaT_Hs27_Jurkat_Myotoxins Cell Screen ---- MTS_20111028_MyotoxinCellScreen <-
read_xls("C:/Users/Owner/Documents/20180415_ThesisReGraphReImage/2. Prepared Data/20111028_MTS_HaCaT_Hs27_Jurkat_Myotoxins.xls", sheet = 1)
# 20111018_Myob_pIH_ManfredaProjLabs MyoB MyoC ---- pIH_MyoB_MyoC <-
read_xls("C:/Users/Owner/Documents/20180415_ThesisReGraphReImage/2. Prepared Data/20111018_Myob_pIH_ManfredaProjLabs.xls", sheet = 2)
## Data Processing ---- ## Cell Lines # 20110520_HelaGFP Myotoxin FITC_pI Hoeckst_pI ---- pI_HelaGFP <- pI_HelaGFP %>% mutate(Treatment = Treatment %>% as.factor()) # levels(pI_HelaGFP$Treatment) # [1] "Media-Cell Only" "MTI-25" "MTI-5" "MTI-50" "MTII-25" # [6] "MTII-5" "MTII-50" "Tween-0.05%" "Tween-0.1%" ## Graphic analysis pI_HelaGFP %>% filter(TxClass != "NoTx Control") %>% mutate(TxSort = fct_reorder(Treatment, Sort, .desc = TRUE)) %>% mutate(NegativePercent = NegativePercent * 100) %>%

58
ggplot(aes(y = NegativePercent, x = TxSort)) + geom_jitter(aes(color = ExpTx), width = 0.2, na.rm = TRUE) + scale_color_manual(breaks = c("FITC_pI", "Hoechst_pI"), values=c("green", "blue")) + scale_y_continuous(breaks = c(0, 25, 50, 75, 100), limits = c(-10, 100)) + geom_hline(yintercept = 100) + theme_minimal() + labs(title = "Study of Cell Death (24 hours)", subtitle = "Effects of Myotoxin I and Myotoxin II HeLa-GFP", x = "Treatment ([µg/mL] or noted)", y = "Percent Viability") + coord_flip()
59
Curriculum Vita
Charles Steven Gilbert
Upon graduation from Montebello Sr. High School in 1971, I attended The University of California at Los Angeles for one year before enlisting in the US Army. After basic training I was assigned to the 82nd Airborne Division, Ft. Bragg, North Carolina. After two year I changed my military occupational specialty to the medical laboratory. During the training, I obtained credit hours through the Baylor University (Waco, Texas) Extension at the Academy of Health Sciences, Ft. Sam Houston, Texas. The next four years I worked in the clinical laboratory and medical research at the US Army Institute of Surgical Research, Brook Army Medical Center, Ft. Sam Houston, Texas co-authoring my first research paper. After leaving the military I worked various jobs and went back to school to finish a degree in biology obtaining credit hours at San Antonio Community College and transferring to The University of Texas at San Antonio to graduate with my Bachelor of Science degree in biology in 1982. I continued another two years at The University of Texas at San Antonio obtaining a Composite Science Secondary Teaching Certification. In 1984, I continued at The University of Texas Health Science Center at San Antonio, Department of Pediatrics, Division of Hematology/Oncology in medical research. During this time, I supervised a laboratory and trained post-doctoral physicians in ultrastructural immuno- and cyto-histochemistry. Additional research papers were co-authored while I was at the Health Science Center. After ten years, I moved with my mentor to Carolinas Medical Center, Charlotte, North Carolina where I published my second first author paper. During my time in medical research, I expanded my training to include computer science, data management, and statistics. My family moved to El Paso, Texas in 2002. It was at this time that I worked as a contract computer technician. In 2003, I attended the Texas Master Naturalist training and embarked on what was to be my fourth career in the environmental sciences. In 2006, I began working as a groundskeeper at the Centennial Museum on The University of Texas At El Paso campus. I started working to be a native plant specialist for the desert southwest. In 2008 I entered into the Master’s Program in Environmental Science. In this program I leveraged my medical research experience to study a plant that had reported ethnobotanic effects for the treatment of snakebite. Publications as first author: Gilbert CS, Parmley RT. 1998. The morphology of human neutrophils: A comparison of cryofixation, routine glutaraldehyde fixation, and the effects of dimethylsulfoxide. Anat Rec 252: 254-263. Gilbert CS, Parmley RT, Rice WG, Kinkade JM,Jr. 1993. Heterogeneity of peroxidase-positive granules in normal human and Chédiak-Higashi neutrophils. J Histochem Cytochem 41 (6): 837-849. Additional publications available on request. Email address: [email protected] This thesis/dissertation was typed by Charles Gilbert


![SPECIES: Centaurea maculosa - Invasive.Org · The scientific name for spotted knapweed is Centaurea maculosa Lam. (Asteraceae) [45,67,217,233]. Oschmann [137] suggests that in North](https://static.fdocuments.in/doc/165x107/5b9a569a09d3f20b318b6b05/species-centaurea-maculosa-the-scientific-name-for-spotted-knapweed-is-centaurea.jpg)


