shareholders? long-term benefits to Does mandatory CSR provide
Mandatory CSR Disclosure and Information Asymmetry: Evidence from a Quasi-natural Experiment in China
Mingyi Hung* Jing Shi† Yongxiang Wang∞
February 2015
ABSTRACT
Using a quasi-natural experiment that mandates a subset of listed firms to issue corporate social responsibility (CSR) reports, this paper examines the effect of mandatory CSR disclosure on market information asymmetry in China, where we estimate information asymmetry using high-frequency trade and quote data. We find that contrary to the criticism that mandatory CSR disclosure lacks credibility and relevance in emerging markets, mandatory CSR reporting firms experience a decrease in information asymmetry subsequent to the mandate. In addition, the decrease in information asymmetry is more pronounced among firms with greater political/social risks, poorer information environments, and better CSR reporting quality. Additional analyses suggest that relative to mandatory CSR disclosure, voluntary CSR disclosure is part of a firm’s political/social strategy and has higher CSR reporting quality. However, the effect of voluntary CSR disclosure on information asymmetry is limited unless CSR reporting is widespread. * The Hong Kong University of Science and Technology, email: [email protected] † Australian National University, email: [email protected] ∞ University of Southern California, email: [email protected]
Keywords: Mandatory CSR Disclosure, Information Asymmetry, Political/Social Risk, China. JEL classification: G15; M14; M48
Acknowledgments: We thank Harry DeAngelo, Raymond Fisman, Paul Gao, Ning Gong, Harrison Hong, Roger Loh, John Matsusaka, Dylan Minor, and T.J. Wong, and workshop participants at Nanjing University, Nanyang Technology University, Renmin University of China, University of Southern California, the Asian Finance Association 2013 Conference, the second Symposium on China’s Financial Market, and the 13th Annual Strategy and the Business Environment Conference at UT Austin for their insightful comments and constructive suggestions. All errors are our own.

1
Mandatory CSR Disclosure and Information Asymmetry: Evidence from a Quasi-
natural Experiment in China
1. Introduction
Corporate social responsibility (CSR) has become a key business practice, with its disclosure
now one of the most important reporting issues in global business environments (KPMG and
UNEP, 2010). Notably, a growing number of regulators worldwide begin to mandate CSR
reporting. 1 The CSR disclosure mandate, especially in emerging economies, has received
considerable attention because of the severity of their social, environmental, and governance
problems. The existing literature on CSR disclosure, however, mainly focuses on voluntary CSR
disclosure in developed markets. Thus, the effect of mandatory CSR disclosure in emerging
markets remains an unanswered question. Our study attempts to fulfill this void by examining
the impact of mandatory CSR disclosure on market information asymmetry in China.
Furthermore, by taking advantage of our setting, we aim to provide fresh insights into the
differences between voluntary and mandatory CSR disclosure.
Prior theoretical work suggests that voluntary disclosure and mandatory disclosure differ in
several important ways (Farrell and Saloner, 1985; Dye, 1990; Zhang, 2001; Fishman and
Hagerty, 2003). First, voluntary disclosure is an endogenous choice of the firm and mandatory
disclosure is an exogenous shock to the firm. Voluntary adopters self select into the disclosure
choice based on their own firm-specific factors, but mandatory adopters are forced to switch
1 Countries that mandate CSR-related disclosure include Australia, Belgium, China, Denmark, France, Malaysia,
Sweden, the U.K., and the U.S. The scope of the mandate has generally changed from the disclosure of a particular CSR issue (such as the 1986 Toxic Release Inventory in the U.S.) in earlier years to a broad-based CSR disclosure (such as the CSR mandate in Malaysia in 2007, and in China, Denmark, and Sweden in 2008) in recent periods. In 2013, the European Commission adopted a proposal for a directive enhancing the transparency of certain large companies on social and environmental matters.

2
under a ’one-size-fits-all’ regulation. Thus, the predicted relations can be different.2 Second,
voluntary disclosure allows firms to use the disclosure choice to communicate their type, but
mandatory disclosure suppresses this mechanism. Third, the value of voluntary disclosure (or the
propensity to provide voluntary disclosure) can be low when investors are not knowledgeable
enough to understand the information. In contrast, firms may benefit from the positive
information externality generated by mandatory disclosure due to the network effect. Consistent
with these arguments, a large body of empirical work examines both voluntary and mandatory
adoption of financial disclosure such as IFRS.3 This literature generally finds that the effect of
mandatory adoption tends to be weaker and depends on the underlying economics and
institutions, but mandatory adoption generates greater information externality such as
comparability (Daske et al., 2008; Li, 2010; DeFond et al., 2011; Wang, 2014). Thus, the effects
of voluntary and mandatory disclosure are distinct and it is important to examine both.
Proponents of mandatory CSR reporting argue that CSR disclosure is critical to achieve
stakeholder engagement and corporate accountability. Regulation is justified because
information is a public good and companies may not have sufficient incentives to voluntarily
disclose such information (Admati and Pfleiderer, 2000). Critics, in contrast, argue that
mandatory CSR disclosure lacks credibility and relevance, and is just another regulatory burden
on firms (Lin, 2010). Consequently, mandatory CSR reporting likely results in empty rhetoric
and biased information that may actually work against corporate accountability (Owen et al.,
2 For example, firms may provide more voluntary disclosure in response to increases in institutional ownership or
analyst following that in turn correlates with a decrease in information asymmetry, thereby leading to a negative relation between voluntary disclosure and information asymmetry. However, such an effect may not hold in a mandatory setting.
3 For example, see the review article by Hail et al. (2010, p. 363-366, sections “Evidence from voluntary IFRS adoption around the world” and “Evidence from mandatory IFRS adoption around the world”).
3
2001; Hess, 2007). Thus, it is an empirical question whether CSR mandate will increase or
decrease information asymmetry.
China offers a unique setting to test the effect of mandatory CSR disclosure on market
information asymmetry for several reasons. First, the Shanghai and Shenzhen stock exchanges
required a subset of listed Chinese firms to issue CSR reports as of the end of 2008, which
provides a quasi-natural experimental research setting that allows us to use a difference-in-
differences research design by comparing changes in the treatment group with changes in the
control group subsequent to mandatory CSR disclosure. Second, the CSR mandate in China
requires publication of a stand-alone CSR report on economic, environmental, social, and
governance performance and has implications on shareholders and various stakeholders. As the
world’s second largest economy, China is economically significant and provides rich market
depth for our empirical tests to explore cross-sectional variations in the effect of this disclosure
reform. Third, CSR-related activities are viewed by the Chinese government as a significant
force that can contribute to “building a harmonious society” because of the severity of the social
and environmental issues they address (Fisman and Wang, 2012). 4 Thus, in China CSR
performance is important for gaining support from the government, and its disclosure is
important for investors to assess political and social risks facing the firm in the future. However,
like the other emerging economies, China is commonly viewed as a country with weak legal
institutions and its disclosure regulation is subject to much skepticism due to concerns over
implementation credibility. By providing evidence from the Chinese capital markets, we
4 Examples of social and environmental issues include toxic products, labor abuse, chemical leaks, and
environmental disasters (Fisman and Wang, 2012). For example, the 2008 Great Sichuan Earthquake, which left more than 86,000 dead or missing and millions homeless, triggered a tidal wave of corporate donations and unprecedented demand for public disclosure on these activities (see ‘The Sichuan earthquake-salt in their wounds,’ Economist, May 14, 2009). Also in 2008, the melamine-laced milk scandal that sickened thousands of Chinese babies focused public attention on firms’ social responsibilities (see ‘Tainting of milk is open secret in China,’ Wall Street Journal, November 3, 2008).

4
contribute to this debate and improve our understanding of the importance of nonfinancial
disclosure in emerging markets.
We focus on market information asymmetry effects of mandatory CSR disclosure because
this is a fundamental question of disclosure. Market information asymmetry arises when some
investors possess private information about the firm’s value while other uninformed investors
only have access to public information. Disclosure essentially turns private information into
public information and may therefore reduce information asymmetry. Information asymmetry is
also an important topic on its own because a large body of literature suggests that the presence of
information asymmetry creates an adverse selection problem, deters efficient resource allocation,
reduces market liquidity, and increases a firm’s required rate of returns (Akerlof, 1970; Diamond
and Verrecchia, 1991; Healy and Palepu, 2001; Easley and O’Hara, 2004). Thus, an investigation
of the effect of mandatory CSR disclosure on information asymmetry is central to assess
potential effects of such disclosure on other economic consequences such as corporate
governance, liquidity, and the cost of capital.
We test the effect of mandatory CSR disclosure on information asymmetry using a sample of
A-share listed firms in China over the 2006 through 2010 period.5 We use high-frequency trade
and quote data to construct two proxies for information asymmetry based on microstructure
models of the bid-ask spread. Following the theoretical models of Kyle (1985) and Easley and
O’Hara (1987) and the empirical analysis of Glosten and Harris (1988), Sadka (2006), and Chan
et al. (2008), our first measure of information asymmetry captures the price impact of a trade and
our second measure captures the adverse selection component of the bid-ask spread. A higher
value indicates greater information asymmetry. The intuition behind these measures is that when
5 We exclude voluntary CSR reporting firms in our primary analysis testing the effect of mandatory CSR
disclosure on information asymmetry. We add back voluntary CSR reporting firms in additional analyses testing CSR reporting quality and the effect of voluntary disclosure on information asymmetry.

5
information asymmetry exists, informed traders submit order to profit from future price changes.
In response, market makers would widen the spread to recover their loss to the informed traders
from the uninformed investors.
Our research design combines a difference-in-differences (DID) method with a propensity-
score-matched (PSM) procedure, which we term “DID-PSM method.” The DID method
compares the changes in a firm’s information asymmetry measures for firms that are mandated
to release CSR reports (i.e., treatment firms) with the changes for firms that are not subject to the
mandate (i.e., benchmark firms). This comparison helps control for other concurrent macro-
economic shocks that may affect information asymmetry but are unrelated to the mandate. We
then further restrict the DID analysis to a PSM sample. Thus, our DID-PSM method addresses
the concern that our treatment firms are not randomly selected (i.e., they tend to be larger and
have better performance) by making non-CSR reporting firms more comparable with the
mandatory CSR reporting firms.
Our analysis shows that compared to benchmark firms not subject to the mandate, treatment
firms experience a decrease in information asymmetry subsequent to the CSR mandate. Thus,
contrary to the common criticism that mandatory CSR disclosure is simply window dressing or
greenwashing, our results suggest that mandatory CSR disclosure is informative and therefore
leads to a decrease in information asymmetry among investors in China.
To further understand our results, we perform various cross-sectional analyses to explore the
mechanisms through which mandatory CSR disclosure reduces information asymmetry. We
posit that CSR disclosure reduces information asymmetry by helping investors assess a firm’s
political or social risk.6 Since the Chinese government retains tight control over the corporate
6 Political risk generally involves execution of political power that threatens a company’s value. Social risk often
refers to challenges by stakeholders due to negative perceptions of business practices (Bekefi and Epstein, 2006).

6
sector with an eye toward maintaining social stability, firms with greater political or social risk
are more likely to incur large penalties and jeopardize their operation when they are involved in
social and environmental scandals (Calomiris et al., 2010; Chen et al., 2011). Thus, mandatory
CSR disclosure should be more valuable to the market and therefore lead to a larger reduction in
information asymmetry for firms with greater political or social risk. In addition, we predict that
firms in poorer information environments experience a greater decrease in information
asymmetry because these firms stand to benefit more from increased disclosure. Finally, all else
being equal, we predict that firms with better CSR reporting quality experience a greater
decrease in information asymmetry because the improvement in transparency, and therefore its
benefits, should be higher for these firms.
Consistent with our predictions, we find that the effect of mandatory CSR disclosure on
information asymmetry is more pronounced among treatment firms with greater political or
social risk (i.e., firms that have lower government ownership and are not politically connected),
poorer information environments (i.e., firms with fewer analyst following and smaller size), and
better CSR reporting quality (i.e., firms with more substantive disclosure content of CSR
reports). 7 Our analysis also finds that the effects of political/social risk and information
environments interact with CSR reporting quality, which in turn jointly drives the decrease of
information asymmetry.
We next expand our analysis to provide insights into the differences between voluntary and
mandatory CSR disclosure. Our findings suggest that voluntary CSR disclosure is part of firms’
We do not separate because the distinction between political and social risk is often blurred in China.
7 Our additional analysis (untabulated) finds no evidence that the decrease in information asymmetry differs across firms in provinces with high versus low legal development. This finding is consistent with the notion that the effect of mandatory CSR disclosure mainly comes from stakeholder monitoring, not legal enforcement. Consistent with this finding, our additional analysis finds that CSR reporting quality is positively associated with government ownership, but not associated with legal development.

7
political/social strategy and has higher CSR reporting quality. These findings provide support to
the notion that voluntary reporting firms self select into communicating their type and have
greater reporting incentives (Dye 1990; Zhang 2001). In addition, for firms not subject to the
CSR mandate, most firms voluntarily release CSR reports on or after the CSR mandate (i.e., late
voluntary reporting firms), and the effect of voluntary CSR disclosure on information asymmetry
is significant only for late voluntary CSR reporting firms. This finding is consistent with the
network effect and highlights the importance of externality in a disclosure setting (Farrell and
Saloner, 1985; Katz and Shapiro, 1985; Fishman and Hagerty, 2003).
Finally, our additional analysis of analyst coverage finds that treatment firms experience an
increase in analyst following subsequent to the CSR mandate. This finding suggests that
increased analyst coverage is a mechanism through which mandatory CSR disclosure reduces
information asymmetry.8 We also find that our conclusions continue to hold when we use a full
sample without PSM matching, run a placebo test, delete observations in 2008, control for
internal control reporting and time trend, and use bid-ask spread as an alternative information
asymmetry proxy.
Our findings make several contributions to the literature. First, our study adds to prior CSR
disclosure literature by being the first to document the effect of mandatory CSR disclosure on
information asymmetry. Using U.S. data, Dhaliwal et al. (2011) find that voluntary CSR
disclosure with superior social responsibility performance is associated with a reduction in firms’
cost of equity capital and improvement in analyst forecast accuracy. More related to our setting,
8 However, we find no evidence that mandatory CSR disclosure improves analysts’ earnings forecast accuracy.
One possible reason for this finding is that analyst forecasts in China, an emerging economy, are subject to greater noises or biases (Hope 2003; Ding et al., 2014). Another reason is that annual reports and CSR reports are simultaneously released in China so analysts are unable to incorporate information contained in CSR reports of the current year when making earnings forecasts of the current year. It is possible that analysts help reduce information asymmetry by incorporating the information in CSR disclosure through other communication channels such as brokerage presentations and client meetings.
8
Dhaliwal et al. (2012) use international data and find that CSR disclosure is positively associated
with analyst forecast accuracy and the relation is stronger in countries that are more stakeholder-
oriented. There are, however, important differences that distinguish our study from Dhaliwal et
al. (2012). The most important one is that we each investigate the effect of CSR reporting under
different reporting regimes. We focus on the mandatory reporting regime, whereas Dhaliwal et
al. (2012) focus on the voluntary regime. As discussed previously, the extant theoretical and
empirical work suggests that these settings are distinct and the predicted relations can be
different. Another difference is that our study examines the effect of CSR disclosure on
information asymmetry, whereas Dhaliwal et al. (2012) investigate the effect of CSR disclosure
on analyst forecast accuracy. While analyst forecasts are an important source of information for
market participants, their usefulness in emerging economies is an open question.9 Thus, evidence
based on analyst forecasts does not speak directly to the effect of disclosure on information
asymmetry. By using proxies based on high-frequency trade and quote data that are commonly
used in literature (Chan et al. 2008), we are able to more directly measure the impact of CSR
disclosure on information asymmetry between informed and uninformed investors. A third
difference is that we investigate how mandatory CSR disclosure differs from voluntary CSR
disclosure. We add to Dhaliwal et al. (2012) by showing that relatively to mandatory CSR
disclosure, voluntary CSR disclosure is associated with firms’ political/social strategy and higher
CSR reporting quality. However, the effect of voluntary CSR disclosure is limited when such
disclosure practices are not yet widely adopted.
9 Dhaliwal et al. (2012) find that the effect of voluntary CSR disclosure on forecast accuracy is generally
insignificant in their sample emerging economies. Specifically, Table 5 of Dhaliwal et al. (2012) indicates that, among the eight emerging economies examined in the study (Brazil, Chile, India, Malaysia, Mexico, Philippines, South Africa, and Thailand), the relation between CSR reporting and forecast accuracy is significant only in Brazil and Chile. While this finding is consistent with prior literature that shows that mandatory financial disclosure has little economic consequence in countries with weak institutional quality, it is also consistent with the notion that analyst forecasts are relatively noisy in such countries (Hope, 2003).

9
Second, by providing insights into the economic consequences of an important aspect of
CSR-related activities (namely, mandatory CSR disclosure), our study complements prior work
that examines the effects of CSR-related activities on stock returns, institutional investors’
portfolio choices, analyst forecast properties, and firm practices (Teoh et al., 1999; Hong and
Kacperczyk, 2009; Eccles et al., 2014). Compared to prior work, our quasi-natural experimental
setting also allows us to better identify the effect of mandatory CSR-related activities. Further,
despite the push for government-mandated CSR disclosure worldwide, there is limited evidence
on the effects of mandatory CSR disclosure.10 Our study improves our understanding of the
implications of mandatory CSR reporting by being the first to document its effect on a firm’s
information environments.
Finally, our study highlights the importance of political and social factors on the effect of
mandatory CSR disclosure. Our findings suggest that nonfinancial disclosure associated with the
CSR mandate in China reduces information asymmetry by helping investors assess political or
social risk. These results complement prior research that finds that political affiliations affect
CSR-related activities (Hong and Kostovetsky, 2012; DiGuili and Kostovetsky, 2012).
Section 2 discusses the institutional background, related literature, and our empirical
predictions. Section 3 presents our sample and data. Section 4 describes empirical results for the
average effect of mandatory CSR disclosure on information asymmetry. Section 5 reports cross-
sectional analyses and Section 6 reports analyses of voluntary CSR disclosure. Section 7 presents
additional analyses on analyst following and sensitivity tests. Section 8 concludes.
10 One exception is Ioannou and Serafeim (2014), who examine the effect of mandatory CSR reporting on
corporate disclosure practices in China, Denmark, Malaysia, and South Africa.
10
2. Institutional Background, Related Literature, and Empirical Predictions 2.1. Background on China’s CSR initiatives
While worsening working and environmental conditions in China were largely tolerated
during the rapid economic growth in the 1990s, they have taken a heavy toll in recent years and
have become an alarming issue. For example, according to a special report by China’s State
Environmental Protection Administration (SEPA) and the World Bank in 2007, the combined
health and non-health costs of outdoor air and water pollution in China amount to roughly
US$ 100 billion a year (5.8% of China’s GDP).11 In addition, due to weak legal institutions in
China, unresolved labor and environmental disputes often lead to protests and threaten social
instability. As a result of growing concerns about social and environmental problems in China
(Locke and Romis, 2007; Lin, 2010), anti-sweatshop and anti-pollution movements in the global
supply chain, and the view that CSR can contribute to “building a harmonious society” (the long-
term goal of the Chinese Communist Party), the Chinese government and stock exchange
regulators have launched an unprecedented number of CSR initiatives in recent years.
For example, the amended PRC Company Law, effective since January 2006, explicitly
refers to CSR.12 In addition, in December 2008 the Shanghai Stock Exchange (hereafter SHSE)
and the Shenzhen Stock Exchange (hereafter SZSE) issued “Notice Concerning Listed
Companies’ Preparation for 2008 Annual Reports” that mandated – for the first time – a subset
of listed firms to issue CSR reports along with annual reports starting from fiscal year 2008
(Noronha et al., 2012). The SHSE imposed the requirement on three types of its listed companies:
11 See ‘Cost of pollution in China’ by the World Bank. According to the article, the calculation of premature
deaths was removed from the final report for fear of provoking “social unrest” (see ‘750,000 a year killed by Chinese pollution,’ Financial Times, July 2, 2007).
12 Article 5 states that “In conducting business operations, a company shall comply with the laws and administrative regulations, social morality, and business morality. It shall act in good faith, accept the supervision of the government and general public, and bear social responsibilities”.

11
firms included in the SHSE “Corporate Governance Index,” financial firms, and firms with
overseas listed shares; the SZSE imposed the requirement on firms included in the SZSE 100
index. According to the relevant regulations (SZSE, Social Responsibility Instructions to Listed
Companies), the CSR report shall include, but not be limited to, the following: (1)
implementation of social responsibility activities related to employee protection, impact on the
environment, product quality, and community relationships; (2) assessment of implementation of
the Social Responsibility Instructions and reasons for the gap, if any; and (3) measures for
improvement and timetable. These requirements provide a unique research setting that allows us
to compare changes in information asymmetry for the treatment group (i.e., firms subject to the
CSR mandate) with changes in information asymmetry for the benchmark group (i.e., firms not
subject to the mandate) subsequent to 2008.
We note that our treatment firms are not randomly selected – they are constituents of key
stock exchange indexes and are typically large in size. Specifically, the SZSE 100 Index is
designed to represent the performance of top 100 A-share listed companies ranked by total
market capitalization, free-float market capitalization, and share turnover. The SHSE Corporate
Governance Index is designed to represent the listed companies with best governance practices
and is formed through voluntary application of listed companies, public opinion solicitation, and
expert assessment. Appendix A presents the membership criteria for these indexes. Because the
policy reform may not be viewed as a purely natural experiment for a standard DID research
design, we mitigate this concern by implementing a DID-PSM method that attempts to make our
treatment and benchmark groups more comparable based on the evaluation criteria of the index
membership. We caveat, however, the PSM procedure is based on observable variables. If our
treatment firms and control firms differ on unobservable dimensions, our DID-PSM method will

12
not be able to address such a concern. Thus, we provide further corroborating evidence to our
main argument using cross-sectional analyses and perform various robustness checks to mitigate
this concern.
The 2008 SHSE notice also requires companies to disclose the directors' self-assessment of
the internal control. However, this requirement mainly specifies the format guideline for internal
control reports because firms were already required to provide information on internal control by
SHSE and SZSE in 2006 and formally by the China Securities Regulation Commission in
2007.13 During our sample period, China also mandated the adoption of IFRS as of January 1,
2007. Since China mandates IFRS adoption for all listed Chinese firms in 2007, not just a subset
of listed companies, our DID design should mitigate the influence of IFRS adoption. In addition,
our use of PSM should also address the concern that mandatory IFRS adoption may affect our
treatment and control firms differently. Nonetheless, we perform a placebo test using a pseudo
adoption year of 2007 to further alleviate the concern that our treatment and control firms may
not be comparable. As discussed in Section 7, we find that our treatment and benchmark firms
exhibit a similar trend in information asymmetry prior to the CSR mandate. Thus, our results are
unlikely to be driven by other concurrent regulatory changes or time trend.
2.2. Related literature and empirical predictions
CSR reporting typically involves disclosure on a company’s economic, environmental, social,
and governance performance. CSR disclosures can help investors assess potential environmental
and social liabilities of the firm. In addition, since socially responsible firms appeal to socially
aware consumers and investors (Hong and Kacperczyk, 2009), CSR disclosure also serves as an
important way to communicate with stakeholders and investors. Consistent with the notion that
13 As reported in Section 7.2, we perform additional analysis controlling for internal control disclosure and find
our results continue to hold.
13
CSR disclosure is informative, prior studies find that CSR disclosure is associated with a
reduction in a firm’s cost of capital and analysts’ earnings forecast errors (Dhaliwal et al., 2011,
2012). However, due to data constraint, this literature generally focuses on voluntary disclosure,
where firms self select to provide information, in developed economies, where legal institutions
are generally strong. Since voluntary disclosure is an endogenous choice of the firm but
mandatory disclosure is an exogenous shock to the firm, prior literature suggests that their effects
can be different (Zhang, 2001). Further, the effect of mandatory disclosure critically depends on
the underlying economics and legal institutions (Hail et al., 2010). Thus, the informativeness of
mandatory CSR disclosure in emerging markets cannot be inferred from the prior CSR literature.
Mandatory CSR disclosure may not be informative and thus have a negligible effect on
market information asymmetry in China for at least two reasons. First, despite its impressive
economic growth, China is commonly viewed as having weak legal institutions and poor
protection of property rights, and its capital market is characterized by prevalent earnings
manipulation and high stock return synchronicity (Morck et al., 2000; Chen and Yuan, 2004).
Prior research therefore finds that the benefits of financial disclosure regulation tend to be
limited in China. For example, DeFond et al. (2012) and He et al. (2012) suggest that mandatory
IFRS adoption does not increase earnings’ usefulness in China. Second, CSR reports in China
typically are not audited and the quality of CSR disclosure tends to be low. According to a recent
report by CSR consulting firm SynTao, only 5% of the 535 CSR reports surveyed in 2009 were
independently audited and over 50% of the reports counted no more than ten pages (SynTao,
2009). Critics argue that a CSR report without a third-party inspection is no more than a
company brochure, and they urge companies to invite third-parties to supervise their CSR reports
(“China’s CSR reports need improvement,” Global Times, November 25, 2010). Not surprisingly,

14
there is much skepticism about the usefulness of mandatory CSR disclosure in China, with the
common concern being that these reports are simply window dressing (SRI, 2010).
One the other hand, there are reasons to believe that mandatory CSR disclosure may be
informative, and in turn reduce market information asymmetry, in China. First, increased
disclosure may help uninformed investors reduce their information disadvantage relative to more
informed investors (Diamond and Verrecchia, 1991). In our setting, when CSR reports are not
publically available and some investors (such as institutional investors) are better informed about
companies’ CSR activities due to lower information acquisition costs, there is high information
asymmetry in the market. Mandatory CSR disclosure makes it easier for less informed investors
to acquire information on companies’ CSR activities, thereby reducing their information
disadvantage and decreasing information asymmetry among different types of investors.14
Second, as a practical matter, CSR performance is important to gain support from
government and non-governmental organizations due to the severity of pollution and worker
safety problems in China (Fisman and Wang, 2012). Consequently, CSR disclosure is critical in
assessing a firm’s future social and political risks, and thus should help reduce information
asymmetry in the capital market. For example, coal mine accidents are common in China,
resulting in thousands of deaths each year.15 Nonfinancial disclosures such as the mortality rate
and spending on safety controls are therefore important in assessing the future prospects of
mining firms. Similarly, due to the heavy toll of worsening environmental conditions, disclosures
14 This empirical prediction is based on evidence from extant literature that increased disclosure reduces
information asymmetry. We note, however, that from a purely theoretical perspective, increased disclosure may exacerbate information asymmetry. Specifically, prior theoretical models suggest that to the extent that sophisticated investors have lower information processing costs and better ability to help interpret CSR disclosures, increased disclosure may actually increase the extent of information asymmetry between sophisticated and unsophisticated investors (Indjejkian, 1991; Kim and Verrecchia, 1994, 1997). Furthermore, a recent study by Kondor (2012) suggests that public disclosure might increase disagreement among agents in higher-order expectations when investors have different trading horizons and when they collect private information on different dimensions of the fundamentals.
15 See “Management blamed in China mine blast that kills 104,” CNN World, November 23, 2009.

15
on wastewater discharge and environmental protection projects are important in evaluating the
growth prospects of industrial firms in China. The 2010 toxic waste leakages of Zijin Mining
Group, China's leading gold and copper producer, illustrate this point. The two leakages from its
mine not only poisoned a river and devastated the surrounding area, but also resulted in a
significant decline in share price and a substantial loss of firm value. In addition, the leakages
prompted a government probe into the timing of the accident disclosures, and led to various
enforcement actions including imprisonment of several senior executives. 16 The company’s
expansion plan was also stalled due to deteriorating relations with the government. Not
surprisingly, in its 2010 sustainability report (29 pages long, in Chinese), Zijin Mining provides
extensive disclosure on both the incidents and corrective measures taken.
Last but not least, while mandatory CSR reports typically are not independently audited or
inspected, they are often subject to intense monitoring from stakeholders and can be verified
from various public sources (such as the inspection results from environmental protection
bureaus and media coverage of fraudulent business practices). Thus, stakeholder monitoring of
CSR disclosure may substitute for third-party verification and increase the credibility of the
reports.
3. Sample Selection and Descriptive Statistics
3.1. Data sources and sample selection
To select our sample, we begin with all Chinese firms listed on SHSE and SZSE from 2006
to 2010. We code 2006-2008 as the pre-adoption period and 2009-2010 as the post-adoption
period because mandatory CSR reports typically did not become publicly available until April
16 See “Zijin mining pollution draws Beijing’s Ire,” BusinessWeek, July 22, 2010.
16
2009. 17 We obtain stock trading data from GTA and financial information from its China
Security Market and Accounting Research (CSMAR) database. Our initial sample includes all
1,967 A-share (local shares) listed firms after excluding 23 financial firms and 106 firms with B-
shares (foreign shares) because they are subject to different regulatory oversight and market
trading mechanisms, respectively. We require firm-years to have necessary financial and trading
data for variables used in our analysis and exclude 107 firms that voluntarily issue CSR reports
during our sample period.18 These criteria result in a full sample of 1,516 firms (6,469 firm-
years), including 287 treatment firms (1,367 treatment firm-years) and 1,229 benchmark firms
(5,102 control firm-years).
To ensure that our control firms are reasonably comparable to our treatment firms, we
compile the benchmark sample used in our primary analysis by matching each treatment firm to
one control firm (with replacement) using a PSM approach. The PSM approach involves pairing
treatment and control firms based on similar observable characteristics (Dehejia and Wahba,
2002). We implement this procedure by first estimating a logit regression to model the
probability of being a treatment firm using the pre-shock period data. Following the guidelines of
the SZSE 100 index and SHSE Corporate Governance Index, as reported in Appendix A, the
logit model includes: (1) firm size (LogMV), share turnover (Turnover), stock returns (Return),
and return on assets (ROA), to capture market capitalization, liquidity, and performance, (2)
government ownership (Government ownership), controlling shareholders’ cash rights (Cash
17 All Chinese firms are required to have their fiscal years ended on December 31. Additional analysis finds that
our result is not sensitive to excluding the transition year, 2008. 18 We exclude voluntary CSR reporting firms in our primary sample because they confound the identification of
the treatment effect of mandatory CSR disclosure. Among the 107 voluntary reporting firms, 35 (72) firms voluntarily release CSR reports prior to the 2008 mandate (on and after the 2008 mandate). The reasons that firms may not voluntarily release CSR reports include concerns of direct costs and proprietary costs. The disclosure of CSR activities typically requires that various reporting mechanisms be put in place, which is a non-trivial task. In addition, CSR reports may attract pressure from various interested groups and allow competitors to infer operating efficiency and strategic plans of a firm.
17
flow rights), political connections (Political connection), and donation (Log(1+Donation)), to
capture governance characteristics and political/social strategies, and (3) analyst following
(Log(1+Analysts)) and information asymmetry (LogPI) prior to the mandate, to capture
information environment characteristics.19 We report variable definitions in Appendix B.
Appendix C reports the results of the logit model for the PSM procedure. Consistent with the
index membership selection criteria and implementation guidelines, we find that the likelihood
of being a treated firm is positively associated with market value of equity, share turnover, ROA,
government ownership, and analyst following. In addition, the results indicate that the extent of
information asymmetry prior to the mandate is not related to the likelihood of being a treated
firm. Next, we obtain the propensity score from the logit estimation and match each treatment
firm to the control firms using the nearest neighbor matching technique (with replacement, and
caliper set at 0.25*standard error of propensity score). This procedure results in our primary
sample, which we term “PSM sample,” of 712 firms (3,555 firm-years), including 230 treatment
firms (1,147 treatment firm years) and 482 control firms (2,408 control firm years).
3.2. Measures of information asymmetry
We use high-frequency trade and quote data to construct two proxies for information
asymmetry based on market microstructure models. These measures are more direct measures of
information asymmetry than bid-ask spreads because spread is a sum of at least three
components: information asymmetry, inventory costs, and order-processing costs that are not
necessarily positively correlated with each other (Lee et al., 1994; O’Hara, 1995; Brown and
19 Since the selection of SHSE corporate governance sector is mainly based on expert evaluation of governance
quality, and does not specify specific governance characteristics, we include ownership variables, such as cash flow rights and government ownership, that prior studies find important in explaining corporate governance outcomes in emerging economies (Claessens et al., 2002; Hung et al., 2012). In addition, we include variables such as analyst coverage and information asymmetry because the evaluation committee primarily consists of financial intermediaries (e.g., securities companies, fund management companies, and rating agencies).

18
Hillegeist, 2007). Our first proxy captures the price impact of a trade based on the theoretical
model in Kyle (1985)’s seminar paper. Specifically, Kyle (1985) proposes a linear relation
between order flows and price changes (i.e., price impact), with a higher price impact indicating
greater information asymmetry. Following Glosten and Harris (1988) and Chan et al. (2008), we
estimate the price impact measure using the following structural model:
(1)
Where P is transaction price, V is trade size, and Q is trade sign (i.e., +1 for a buyer-initiated
transaction and -1 for a seller-initiated transaction).20 is the price impact coefficient that
captures the degree of information asymmetry. Chan et al. (2008) document that for their sample
of 76 Chinese firms with A- and B- shares the mean estimate of is 9.66x10⁻⁷ Yuan per share
for the A-share market from January to December 2000. Given the small value of , we
calculate our price impact measure by taking a natural logarithm of multiplied by 10^7.
Specifically, we define our price impact measure, LogPI, as follows:
LogPI = Log (×107) (2)
Our second proxy for information asymmetry captures the adverse selection component of
the bid-ask spread, which is based on an extension of the price impact parameter as estimated in
equation (1). Following prior studies (Easley and O’Hara, 1987; Glosten and Harris, 1988; Lin et
al., 1995), we decompose the bid-ask spread to calculate its adverse selection component using
the following structural model:
(3)
20 Following prior studies (Lee and Ready, 1991; Chan et al., 2008), we use the following rule to classify trades as
buyer- or seller-initiated: (1) if a transaction occurs above the prevailing quote midpoint, we classify it as a purchase and vice versa, and (2) if a transaction occurs exactly at the quote midpoint, we sign it using the previous transaction price according to the tick test (i.e., a purchase if the sign of the last nonzero price change is positive and vice versa).
1( )t t t t t tP QV Q Q e
0 1 1 1 1 0 1( ) ( )t t t t t t t t t t tP c Q Q c QV Q V z Q z QV e
19
In this model, reflect the adverse selection component of the bid-ask spread,
where is the median order size. Sadka (2006) simplifies the calculation by using directly
as a measure of information asymmetry. We therefore follow Sadka to ease the calculation
before applying a logarithm transformation of multiplied by 10^8. Thus, we define our
adverse selection component of the bid-ask spread, LogAS, as follows:
LogAS=log(z1×108)
(4)
3.3. Descriptive statistics
Table 1 presents descriptive statistics of the variables used in our primary analysis. Panel A
of the table reports the summary statistics for the PSM sample. Panel B of the table reports the
mean values of the variables and their differences between our treatment group and benchmark
group. It shows that compared to the benchmark firms, the treatment firms on average have less
information asymmetry, are larger and less liquid, have better stock performance, and greater
state ownership during our sample period.21
Table 2 presents the correlations among variables used in our analysis. Consistent with prior
studies (Chan et al., 2008), the table shows that our two measures of information asymmetry are
highly correlated, with a correlation coefficient of 0.929. In addition, consistent with the view
that larger firms have less information asymmetry in the stock markets, we find that the
correlation is -0.167 between LogPI and LogMV and is -0.071 between LogAS and LogMV.
21 We match firms based on pre-adoption period so the difference between our treatment and benchmark firms
during the entire sample period can result from the effect of mandatory adoption. Our analysis also controls for differences in these firm characteristics by including them in the multivariate regression, thus mitigating the concern that the treatment and benchmark firms are not perfectly matched along every dimension. Our regression analysis in Table 3 indicates that the information asymmetry measure of our treatment firms is insignificantly different from that of the benchmark firms in the pre-adoption period.
*0 1 tz z QV
*V 1z
1z

20
4. Empirical Results
Our analysis regresses measures of information asymmetry on a dummy variable indicating
whether the period is post mandatory CSR reporting (Post), a dummy variable indicating
whether the firm is mandated to provide CSR reports (Treatment firms), their interaction term,
and control variables. Our baseline regression model is as follows:
LogPI/LogAS = β0+ β1(Post)+ β2(Treatment firms)+β3(Post×Treatment firms)+
βj(Controlsj) (5)
Of interest is the coefficient on the interaction term, β3, which captures the change in
information asymmetry for treatment firms relative to the change for benchmark firms
subsequent to the CSR mandate. A negative coefficient on β3 is consistent with a decrease in
information asymmetry and a positive coefficient on β3 is consistent with an increase in
information asymmetry. The coefficient on Post, β1, reflects the change in information
asymmetry for the benchmark group. The coefficient on Treatment firms, β2, represents the
difference in information asymmetry between the treatment group and the benchmark group in
the pre-period. We control for several firm characteristics that are likely correlated with
measures of information asymmetry: firm size, share turnover, stock returns, accounting
profitability, and government ownership. To mitigate the concern of correlated omitted variables,
we also estimate a full regression model with firm and year fixed effects (after suppressing the
coefficients on Post and Treatment firms).22 Appendix B reports variable definitions. We use
robust standard errors clustered by firm throughout our analyses.
Table 3 presents results of the regression analysis. Columns (1)-(2) show results using LogPI
as the dependent variable, with Column (1) reporting the results of our baseline regression model
22 We do not include Post and Treatment firms in this model because these variables are a linear combination of
year and firm fixed effects, respectively.
21
and Column (2) reporting the results of our full regression model. Columns (3)-(4) follow the
same pattern and show results using LogAS as the dependent variable. The table shows that the
coefficient on Post×Treatment firms is significantly negative at p ≤ 10% (two-tailed) throughout
various specifications, indicating that mandatory CSR reporting firms experience a decrease in
information asymmetry subsequent to the CSR mandate. 23 The decrease in information
asymmetry associated with mandatory CSR reporting is also economically significant.
Specifically, the coefficients in Columns (2) and (4), -0.136 and -0.217, indicate that relative to
the control firms, treatment firms experience a decrease of 12.7 percent and 19.5 percent in
information asymmetry, measured as LogPI and LogAS, respectively.24
As for the control variables, the coefficient on Treatment firms is insignificant at
conventional levels in Columns (1) and (3), indicating that information asymmetry of mandatory
CSR reporting firms does not differ significantly from that of the benchmark group in the pre-
period. This result suggests that the PSM matches are effective in narrowing the difference
between treatment and control firms in our variables of interest prior to the CSR mandate. We
also find that firm size (LogMV) and share turnover (Turnover) are negatively associated with
information asymmetry, consistent with our expectation that large firms and firms with higher
stock liquidity are associated with less information asymmetry. In addition, profitability (ROA) is
positively associated with information asymmetry, possibly because the incentives for private
information acquisition increase with profitability.25
23 Our additional analysis finds that 21 (one) treatment firms do not have 2008 (2009) CSR reports. Thus, we also
perform a robustness check after recoding the Post variable for treatment firm-years with missing CSR reports as zero. The analysis (untabulated) finds that our result remains qualitatively the same.
24 -12.7% = exp(-0.136)-1 and -19.5% = exp(-0.217)-1, because our dependent variable is a log-transformed variable.
25 Since loss firms are likely to have greater information asymmetry, we also perform additional analysis after further controlling for a dummy variable indicating reported loss. Consistent with this expectation, our analysis (untabulated) finds that the coefficient on the loss dummy is significantly positive. Importantly, the coefficient on Post×Treatment firms remains significantly negative with a similar magnitude of 0.13, as in Column (2) of Table 3.
22
In summary, the results of our analysis suggest that mandatory CSR reporting firms
experience a decrease in information asymmetry subsequent to the CSR mandate. Thus, contrary
to the common criticism that mandatory CSR disclosure is simply window dressing, our result
suggests that mandatory CSR disclosure in China is informative and helps improve a firm’s
information environments. This finding supports the view that social and environmental
disclosure, while lacking mature reporting framework, remains an important information source
to investors in an environment that is characterized by frequent social/environmental disasters
and large political/social penalties associated with these disasters.
5. Analyses Conditional on Political/social Risk, Information Environments, and CSR
Reporting Quality
5.1. The effect of mandatory CSR disclosure conditional on firms’ political/social risk
We propose that an important mechanism through which CSR disclosure reduces information
asymmetry in China is that investors find such disclosure useful in assessing a source of risk that
is critical for companies in emerging economies – political/social risk. Since the government
retains a tight control over the corporate sector and emphasizes social stability, firms with greater
political or social risk (e.g., those without strong political ties) not only are less likely to enjoy
favorable regulatory treatments and government support, but also are more likely to incur larger
penalties when violating labor and environmental standards (Calomiris et al., 2010; Chen et al.,
2011; Hung et al., 2012).26 Uninformed investors should therefore find CSR disclosure of firms
Finally, we note that the effects of firm characteristics are estimated imprecisely in our full regression models in Columns (2) and (4) of Table 3 because the firm fixed effects absorb most of the variation across firms. This concern is especially important when interpreting certain variables that are fairly stable over time, such as government ownership.
26 For example, Chen et al. (2011) find that compared to private companies, state-owned enterprises are punished less severely when violating government regulation. Calomiris et al. (2010, p.400) discuss similar cases.

23
with greater political or social risk to be more useful because such disclosure informs them about
what the firm has done to avoid negative CSR-related shocks. Consequently, we expect that
mandatory CSR disclosure of firms with greater political or social risk results in a greater
decrease in information asymmetry.
To test this prediction, we perform analysis conditional on a firm’s political/social risk. We
use two variables to capture political/social risk: government ownership and political
connections. The notion underlying these measures is that greater government ownership, and
stronger political connections can help firms mitigate unfavorable government intervention and
tension between the firm and its stakeholders (Ma and Parish, 2006). Following Calomiris et al.
(2010), we define a firm as politically connected if one of its top executives ever worked as a
(deputy) chief office in the city-level (and above) government, i.e., Chuji and above. We classify
a firm as having greater political/social risk if its government ownership is below the sample
firm-level median, or it is not politically connected. We then estimate our full model in Table 3
in each of these political/social risk partitions and test whether the coefficient on Post×Treatment
firms differs across the partitions. For parsimony, we only report results based on LogPI in this
and the remaining analyses. Results based on LogAS are qualitatively the same, which is not
surprising because these two measures are highly correlated as indicated in Table 2.
Table 4 summarizes the results of this analysis. Consistent with our expectation, the table
shows that the coefficient on Post×Treatment firms is more negative in the partition indicating
greater political/social risk (i.e., firms that have lower government ownership and are not
politically connected). Thus, the findings indicate that mandatory CSR reporting firms with
greater political or social risk experience a greater reduction in information asymmetry following
the CSR mandate.

24
5.2. The effect of mandatory CSR disclosure conditional on firms’ information environments
If mandatory CSR disclosure decreases information asymmetry, we expect the effects to be
more pronounced among firms in poorer information environments. This is because firms in
poorer information environments are likely to be more opaque prior to the disclosure mandate.
Thus, they are likely to experience greater improvements in transparency, which in turn results in
a larger decrease in information asymmetry after the CSR mandate.
To test this prediction, we perform analysis conditional on a firm’s information environment.
We use two variables to capture information environments: analyst following and firm size. We
classify a firm as having poorer information environment if its number of analyst following and
firm size is below the sample firm-level median. We then estimate our full model in Table 3 in
each of these information environment partitions and test whether the coefficient on
Post×Treatment firms differs across the partitions.
Table 5 summarizes the results of this analysis. Consistent with our expectation, we find that
the coefficient on Post×Treatment firms is more negative in the partition indicating poorer
information environments (i.e., firms that have a lower number of analyst following and smaller
size). Thus, the findings indicate that mandatory CSR reporting firms with poorer information
environments experience a greater reduction in information asymmetry following the CSR
mandate.
5.3. The effect of mandatory CSR disclosure conditional on CSR reporting quality
Since the effect of disclosure regulation depends on its implementation credibility, we expect
that firms with higher CSR reporting quality experience a greater reduction in information
asymmetry subsequent to the CSR mandate. To test this prediction, we first obtain CSR rating
information from RKS, a firm specializing in ranking CSR reports for listed Chinese companies.

25
RKS rates a CSR report by three categories: (1) content score, an evaluation score based on
specific CSR metrics for economic, environmental, and social performance, (2) macrocosm score,
an evaluation score based on CSR strategic effectiveness, stakeholder participation, and
information comparability, and (3) technique score, an evaluation score based on clarity,
consistency, and presentation formats. 27 While we report the results using all three CSR
disclosure scores for completeness, we are most interested in the content score because it reflects
the substance of a firm’s CSR activities and includes specific metrics such as pollution and toxic
waste indexes, product safety records, and labor protection measures.
We perform the analysis conditional on a firm’s CSR reporting quality by classifying a
treatment firm into a high CSR reporting quality subsample if its disclosure score is above the
sample median. Since the score is not applicable to control firms (because they do not have CSR
reports to be rated), we include all control firms in each partition. We then estimate our full
model in Table 3 in each of these partitions and test whether the coefficient on Post×Treatment
firms differs across the partitions.
Table 6 reports results of this analysis. Panel A of the table reports the descriptive statistics
on the content, macrocosm, and technique scores of CSR reports. Panel B reports the regression
results. We find that the coefficient on Post×Treatment firms is more negative in the subsample
of higher CSR content scores. This finding is consist with our expectation and suggests that
mandatory CSR reporting firms with more substantive CSR reporting experience a greater
reduction in information asymmetry following the CSR mandate. We do not find the coefficient
on Post×Treatment firms to differ between subsamples of firms with high and low macrocosm
27 See www.rksratings.com. The maximum content, macrocosm, and technique scores are 50, 30, and 20,
respectively. RKS provides ratings for CSR reports with fiscal years ended in 2008 or later.
26
and technique scores, suggesting that discussion of overall CSR strategies and presentation
format of CSR reports play a less important role in reducing information asymmetry.
5.4. Potential dominance of CSR reporting quality over firms’ political/social risk and
information environments
Since our analyses conditional on political/social risks and information environments do not
consider CSR reporting quality, it is possible that the effect of political/social risk or information
environment simply reflects the effect of reporting quality. To explore this issue, we examine the
coefficients on Post×Treatment firms across the subsamples that are first split by CSR content
score, then by government ownership or by analyst following.28
Table 7 reports the results of this analysis. For parsimony, we only report the coefficient on
Post×Treatment firms and its significance in a two-by-two analysis. Columns (1)-(3) report the
results partitioning the sample by CSR reporting quality and government ownership. We find
that government ownership is important in reducing information asymmetry only when CSR
reporting quality is high. In addition, CSR reporting quality is important in reducing information
asymmetry only when government ownership is low. These results suggest both low government
ownership and high reporting quality play a role in the decrease of information asymmetry
subsequent to the CSR mandate.
Columns (4)-(6) of Table 7 report the results partitioning the samples by CSR reporting
quality and analyst following. Similar to the results in Columns (1)-(3), we find that analyst
following is important in reducing information asymmetry only when CSR reporting quality is
high. In addition, CSR reporting quality is important in reducing information asymmetry only
28 We focus on government ownership and analyst following because we view these variables as our primary
measures of political/social risks and information environments. Using government ownership as a partitioning variable also yields a more balanced sample distribution across the partitions. We find our conclusions remain similar in additional analyses (untabulated) conditional on CSR reporting quality and political connections, and on CSR reporting quality and firm size.
27
when analyst following is low. These findings suggest that both low analyst coverage and high
reporting quality play a role in the decrease of information asymmetry subsequent to the CSR
mandate. Together, our results suggest that the effect of CSR reporting quality interacts with
political/social risk and information environments, which in turn jointly drives the decrease of
information asymmetry.
6. Analyses of Voluntary CSR Disclosure
6.1. Determinants and reporting quality of voluntary CSR disclosure
An important difference between a mandatory reporting setting and voluntary reporting
setting is that under a voluntary reporting regime, firms self select into the disclosure choice after
assessing their own costs and benefits (Dye, 1990; Zhang, 2001). To provide insights into this
difference, this section examines the determinants and reporting quality of voluntary CSR
disclosure.
To test the determinants of voluntary CSR disclosure, we first expand our sample by adding
back voluntary CSR reporting firms. We then perform a logit analysis regressing a dummy
variable indicating voluntary CSR reporting firms on the same set of variables used in our logit
model of Appendix C to facilitate the comparison with the selection of mandatory reporting
firms. In addition, we restrict this analysis to the pre-mandatory CSR reporting years, 2006-2008,
to avoid the confounding effect of mandatory CSR disclosure.
Panel A of Table 8 reports the results of this analysis. Column (1) shows that voluntary CSR
disclosure is positively associated with political connections, donation, analyst following,
information asymmetry, and negatively associated with government ownership. Column (2) uses
an alternative sample period, 2008, and finds that the results remain similar, except that the
28
coefficient on donation becomes insignificant. Overall, these results suggest that voluntary CSR
reporting is likely to be part of a firm’s strategies, combined with having politically connected
top executives and making larger donation, to increase its political/social power.29 In addition,
firms are motivated to voluntarily provide CSR reports in response to the demand from analysts
and to improve their information environments. In contrast, since government ownership is by
heritage, state-owned firms have less a need to voluntarily provide CSR disclosure to
communicate their political standing.
We assess the reporting quality of voluntary CSR disclosure by regressing the CSR
disclosure scores on a dummy variable indicating voluntary CSR reporting firms. In addition to
including the same firm-level control variables used in our main analysis in Table 3 and industry
fixed effects, we also include variables controlling for a firm’s provincial legal and market
development because prior studies suggest that the economic consequences of financial
disclosure depend on institutional quality. Since the RKS CSR ratings data begin with the 2008
CSR reports, we use all firm-years with 2008-2010 CSR reports in this analysis.
Panel B of Table 8 reports the results. Columns (1)-(3) present the results for the content,
macrocosm, and technique scores, respectively. We find that the coefficient on Voluntary
reporting firms is significantly positive in all columns, consistent with notion that voluntary CSR
reporting firms have greater reporting incentives than mandatory CSR reporting firms. Columns
(4)-(6) further examine whether the reporting quality of voluntary and mandatory CSR reporting
firms improves over time by adding a year variable (relative to the base year 2008) and its
interaction term with the dummy variable indicating voluntary reporting firms. We find that the
coefficient on Year is significantly positive in Column (4) but insignificant in Columns (5) and
29 In China, private non-profit organizations cannot raise money from public. Thus, donations mainly go to the
government controlled agents like the Red Cross Society of China, where the senior officials of the organization are appointed by the government.

29
(6), indicating that mandatory CSR reporting firms show an improvement in the CSR disclosure
content score over time, but no changes in the macrocosm and technique scores. These results
provide further support that the content score is more meaningful than the macrocosm and
technique scores. Furthermore, we find that the sum of the coefficients on Year and
Year×Voluntary reporting firms is insignificant in Column (4), suggesting that the CSR
reporting quality for voluntary reporting firms is fairly stable during 2008-2010.
In terms of control variables, Panel B of Table 8 finds that CSR disclosure score is positively
associated with firm size and government ownership, indicating that large firms and firms with
greater government ownership have more substantive CSR reporting. This finding is consistent
with the notion that CSR reporting quality is driven by stakeholder monitoring. In contrast, CSR
disclosure score is not associated with a firm’s provincial legal and market development. This
finding suggests that unlike mandatory financial disclosure whose effect depends on
implementation credibility via the legal system to ensure compliance with GAAP and constrain
earnings manipulation, the effect of mandatory CSR disclosure is less subject to legal
environments (likely because there is no specific measurement principles).
6.2. The effect of voluntary CSR disclosure on information asymmetry
Prior literature suggests that the value of voluntary disclosure can be low when investors are
not knowledgeable enough to understand the information (Fishman and Hagerty 2003). In
addition, firms may benefit from positive information externality generated by mandatory
disclosure due to the network effect (Farrell and Saloner, 1985; Katz and Shapiro, 1985; Wang,
2014). To shed light into this issue, this section tests the effect of voluntary CSR disclosure on
information asymmetry, both surrounding the voluntary switch and the CSR mandate.
30
We perform this test using a DID design by regressing our information asymmetry measure
(LogPI) on a variable indicating firm-years subsequent to voluntary CSR reporting
(Post_voluntary reporting). In addition, we separate voluntary reporting firms into (1) early
voluntary reporting firms (35 firms) that voluntarily release CSR reports prior to the 2008
mandate, and (2) late voluntary reporting firms (72 firms) that voluntarily release CSR reports on
or after the 2008 mandate (i.e., firms that release CSR reports for fiscal years ended in 2008 or
later). We then code two dummy variables, Post_early voluntary reporting and Post_late
voluntary reporting to indicate the periods subsequent to the voluntary switch for early voluntary
reporting firms and late voluntary reporting firms, respectively. Because this setting involves
multiple treatment groups and time periods (Wooldridge, 2007), our DID estimation includes a
full set of group effects (i.e., firm fixed effects) and a full set of time effects (i.e., year fixed
effects). In addition, we include firms not subject to the CSR mandate as our benchmark group.30
Table 9 reports the results of this analysis. Column (1) shows that the coefficient on
Post_voluntary reporting is significantly negative, indicating that voluntary CSR reporting firms
on average experience a decrease in information asymmetry subsequent to the voluntary switch.
Column (2) shows that the coefficient on Post_early voluntary reporting is insignificant, but the
coefficient on Post_late voluntary reporting is significantly negative. This finding suggests that
the effect of voluntary switch on information asymmetry becomes significant on and after the
CSR mandate.31 Overall, our results suggest that the impact of voluntary CSR disclosure on
market information asymmetry is limited unless such reporting is widespread.
30 The PSM procedure yields no matched firms, suggesting that voluntary CSR reporting firms are distinctly
different. 31 We note that the effect of early voluntary switch includes the potential spillover effect from the CSR mandate.
Additional analysis (untabulated) restricting the analysis to early voluntary reporting firms in the pre-period finds that the coefficient on Post_early voluntary reporting remains insignificant but becomes positive.

31
7. Other Additional Analyses and Sensitivity Tests
7.1. The effect of mandatory CSR disclosure on analyst following and forecast accuracy
A potential mechanism through which mandatory CSR disclosure reduces a firm’s market
information asymmetry is increased analyst coverage. Analysts are important information
intermediaries and prior literature suggests that firms with better disclosure quality attract greater
analyst following because increased disclosure reduces analysts’ information acquisition costs
(Lang and Lundholm, 1996). If our inference is correct that mandatory CSR disclosure provides
useful information to the market, we expect the releases of CSR reports to increase analyst
following, which in turn help reduce information asymmetry in the market.
We perform analysis examining the impact of mandatory CSR disclosure on analyst
following by replacing our dependent variable in Table 3 with analyst coverage, Log(1+
Analysts). Table 10 presents the results of this analysis. Panel A presents the descriptive statistics
for the additional variables and Panel B shows the regression results. Column (1) of Panel B
shows that the interaction term Post×Treatment firms is significantly positive at p ≤ 10% (two-
tailed), suggesting that treatment firms experience a greater increase in the number of analyst
following. Thus, the finding is consistent with our expectation that mandatory CSR reporting
reduces information asymmetry through increased analyst coverage.
Following Dhaliwal et al. (2012), we explore whether analysts use the information contained
in CSR disclosure to improve their forecast accuracy in our setting. Specifically, we examine
analyst earnings forecast accuracy for current-year earnings forecasts, one-year-ahead earnings
forecasts, and two-year-ahead earnings forecasts, measured as -1 multiplied by the absolute value
of analyst earnings forecast errors for year t, year t+1, and year t+2. We multiply the absolute
forecast error by -1 so a higher value indicates greater forecast accuracy. We calculate forecast
32
errors as actual earnings minus and consensus forecasted earnings, scaled by stock price at the
end of year t. For example, forecast errors for the first post-period, 2009, is calculated as actual
earnings for 2009 minus the consensus forecasted earnings, scaled by stock price at the end of
2009. We note, however, it is an open question whether the issuance of CSR reports may affect
analysts’ earnings forecast accuracy in China. One reason is that analyst forecasts in emerging
economies such as China may be subject to greater noises and biases (Hope, 2003; Ding et al.,
2014). Consistent with this reasoning, Dhaliwal et al. (2012) find that issuance of CSR reports is
largely unrelated to forecast accuracy in emerging economies in their sample. Another reason is
that CSR reports of year t cannot have any effects (and CSR reports of prior years have little
effects) on analyst current and long-term forecasts made in year t because annual reports and
CSR reports are simultaneously released in China.
Columns (2), (3), and (4) of Table 10, Panel B present the results of the impact of mandatory
CSR disclosure on forecast accuracy for current-year earnings forecasts, one-year-ahead earnings
forecasts, and two-year-ahead earnings forecasts, respectively. We find that the interaction term
Post×Treatment firms is insignificantly at the conventional levels across these three Columns,
suggesting that our treatment firms do not experience a change in analyst earnings forecast
accuracy in China. We note, however, it is possible that analysts help reduce information
asymmetry by incorporating the information in CSR disclosure through other communication
channels such as brokerage presentations and client meetings.
7.2. Robustness tests
We perform several sensitivity checks for alternative sample firms, alternative sample
periods, additional control variables, and alternative information asymmetry measures for our

33
primary results in Table 3. Table 11 reports the results. In the interest of parsimony, we do not
report the coefficients on firm-level controls in the sensitivity tests.
7.2.1. Alternative sample firms. Our primary analyses use the DID-PSM sample to mitigate the
concern that our treatment sample may not be comparable to the benchmark sample. To assess
the robustness of our results, we repeat our analysis after using the (unmatched) full sample. We
find that the coefficient on Post×Treatment firms is larger when using the full sample, perhaps
because the unmatched control firms is less comparable to the treatment firms. This finding also
suggests that the result based on the PSM sample in our primary analyses is more conservative
than the result based on the full sample.
7.2.2. Alternative sample periods. During our sample period, China also mandated the adoption
of IFRS as of January 1, 2007. Since the IFRS mandate applies to all listed firms, our
comparison of changes in information asymmetry for the treatment versus benchmark firms
mitigates the influence of possible confounding factors associated with mandatory IFRS
adoption. In addition, we do not expect IFRS to significantly affect Chinese firms’ information
asymmetry because prior studies suggest that mandatory IFRS adoption has little capital market
consequences in countries with weak legal enforcement (Daske et al., 2008; DeFond et al., 2011).
Nonetheless, to assess whether mandatory IFRS adoption may affect our treatment and
benchmark firms differentially, we perform a placebo test ending our sample period in 2008 (the
year before mandatory CSR reports are released). We then rerun our analysis by recoding the
post dummy variable from indicating the period 2009-2010 to indicating the period 2007-2008.
Unlike our result in Table 3, we find that the coefficient on Post×Treatment firms becomes
insignificant. Thus, our placebo test suggests that our treatment and benchmark firms exhibit a
34
similar trend in information asymmetry prior to the CSR mandate, which alleviates the concern
that our result may be influenced by mandatory IFRS adoption in China.
In addition, since 2008 is the peak of financial crisis and there is a lot of turbulence in global
financial markets in that year, we perform an analysis after deleting all observations in 2008. We
find that our results are qualitatively identical to those reported in Table 3.32
7.2.3. Additional controls. As noted earlier, the 2008 SHSE notice also requires companies to
disclose the directors' self-evaluation reports of the internal control, but this requirement mainly
specifies the format guideline for internal control reports because firms were already required to
provide information on internal control by SHSE and SZSE in 2006. To explore whether our
results are sensitive to controlling for internal control disclosure, we manually collect data on the
issuance of internal control reports for our sample firms. We then add an interaction term
between a dummy variable indicating firms that release internal control reports and a dummy
variable indicating years subsequent to the release of the internal control report.33 This analysis
shows that our results remain qualitatively unchanged after controlling for internal control
reporting.
Our DID estimation includes year dummies to control for year fixed effects. To explore
whether our results are sensitive to controlling for different time trends across the treatment and
benchmark groups, we further include another interaction term: Year×Treatment firms. We find
that our results are qualitatively identical to those reported in Table 3.
32 By ”qualitatively identical to those reported in Table 3,” we mean that the coefficient Post×Treatment firms is
negative and significant at p ≤ 10% (two-tailed) in Column (2) of Table 3, our full regression model using logPI as the dependent variable.
33 In additional analysis, we recode the dummy variable to indicate firms that release directors’ self evaluation of the internal control. This analysis (untabulated) finds our results remain qualitatively identical to those reported in Table 3.
35
7.2.4. Alternative information asymmetry proxy. Our primary analyses use price impact and the
adverse selection component of the bid-ask spread to capture information asymmetry because
bid-ask spread is an indirect proxy of information asymmetry and suffers from numerous
econometric and interpretation difficulties (Brown and Hillegeist, 2007). Nonetheless, we assess
the robustness of our results after repeating our analysis in Table 3 using bid-ask spread as an
alternative measure of information asymmetry. We find that our results are qualitatively identical
to those reported in Table 3.
8. Conclusion This paper examines the effect of mandatory CSR disclosure on firms’ market information
asymmetry in China. Following the market microstructure literature, we construct two measures
of information asymmetry: the price impact of a trade and the adverse selection component of
the bid-ask spread. In addition, we use a DID research design by taking advantages of the unique
regulatory setting that mandates a subset of listed Chinese firms to issue CSR reports from fiscal
year 2008. To mitigate the concern that our treatment firms are not random, we also combine the
DID design with a PSM procedure that attempts to make our treatment and benchmark groups
more comparable.
We find that contrary to common criticism that mandatory CSR disclosure lacks credibility
and is simply window dressing in emerging markets such as China, mandatory CSR reporting
firms experience a decrease in information asymmetry subsequent to the mandate, especially
among firms with greater political/social risk, poorer information environments, and better CSR
reporting quality. To shed light into the differences between mandatory and voluntary disclosure,
we also examine the determinants, reporting quality, and changes in information asymmetry for

36
voluntary CSR disclosure. Our analyses suggest that voluntary CSR disclosure is part of a firm’s
strategy to increase its political/social standing and has higher reporting quality. Further, the
effect of voluntary CSR disclosure on market information asymmetry is limited unless CSR
reporting is widespread. Overall, our study is the first to document the effect of mandatory
nonfinancial disclosure on information asymmetry. By taking advantage of our setting, we also
provide fresh insights into the determinants and economic consequences of voluntary versus
mandatory nonfinancial disclosure.
37
REFERENCES Admati, A., Pfleiderer, P., 2000. Forcing firms to talk: Financial disclosure regulation and
externalities. Review of Financial Studies 13, 479–515. Akerlof, G., 1970. The market for ‘lemons’: quality uncertainty and the market mechanism.
Quarterly Journal of Economics 90, 629–650. Bekefi, T., Epstein, M., 2006. Management Accounting Guideline: Integrating Social and
Political Risk into Management-decision Making. CMA-Canada and AICPA. Brown, S., Hillegeist, S., 2007. How disclosure quality affects the level of information
asymmetry. Review of Accounting Studies 12, 443–477. Calomiris, C., Fisman, R., Wang, Y., 2010. Profiting from government stakes in a command
economy: Evidence from Chinese asset sales. Journal of Financial Economics 96, 399–412. Chan, K., Menkveld, A., Yang, Z., 2008. Information asymmetry and asset prices: Evidence
from the China foreign share discount. The Journal of Finance 63, 159–196. Chaney, P.K., Faccio, M., Parsley, D., 2011. The quality of accounting information in politically
connected firms. Journal of Accounting and Economics 51, 58–76. Chen, D., Jiang, D., Liang, S., Wang, F., 2011. Selective enforcement of regulation. China
Journal of Accounting Research 4, 9–27. Chen, C.W.K., Yuan, H.Q., 2004. Earnings management and resource allocation: Evidence from
China’saccounting-based regulation of rights issues. The Accounting Review 79, 645–665. Claessens, S., Djankov, S., Fan, J., Lang, L., 2002. Disentangling the incentive and entrenchment
effects of large shareholdings. Journal of Finance 57, 2741–2771. Daske, H., Hail, L., Leuz, C., Verdi, R., 2008. Mandatory IFRS reporting around the world:
Early evidence on the economic consequences. Journal of Accounting Research 46, 1085–1142.
DeFond, M., Hu, X., Hung, M., Li, S., 2011. The impact of mandatory IFRS adoption on foreign
mutual fund ownership: the role of comparability. Journal of Accounting and Economics 51, 240–258.
DeFond, M., Gao, X., Li, O., Xia, L., 2012. Did China’s adoption of IFRS attract more foreign
institutional investment? Working paper, University of Southern California and National University of Singapore.
Dehejia, R. H., Wahba, S., 2002. Propensity score matching methods for non-experimental
causal studies. Review of Economics and Statistics 84, 151–161.
38
Dhaliwal, D., Li, O, Tsang, A., Yang, Y., 2011. Voluntary nonfinancial disclosure and the cost of equity capital: The initiation of corporate social responsibility reporting. The Accounting Review 86, 59–100.
Dhaliwal, D., Radhakrishnan, S., Tsang, A., Yang, Y., 2012. Nonfinancial disclosure and analyst
forecast accuracy: International evidence on corporate social responsibility disclosure. The Accounting Review 87, 723–759.
Diamond, D., Verrecchia, R., 1991. Disclosure, liquidity, and the cost of capital. Journal of
Finance 46, 1325–1360. DiGuili, A., Kostovetsky, L., 2012. Are Red or Blue companies more likely to go green? Politics
and corporate social responsibility. Working papers, University of Rochester.
Ding, F., Chen, M., Wu, Z., 2014. Do institutional investors use earnings forecasts from financial analysts? Evidence from China’s stock market. Emerging Markets Finance & Trade 50, 134–147.
Dye, R. A., 1990. Mandatory versus voluntary disclosures: The case of financial and real
externalities. The Accounting Review 65, 1–24. Du, X., 2012. Local protectionism and corruption lead to food safety issues. Legal Daily, July 6. Easley, D., O'Hara, M., 1987. Price, trade size, and information in securities markets. Journal of
Financial Economics 19, 69–90. Easley. D., O’Hara, M., 2004. Information and the cost of capital. The Journal of Finance 59,
1553–1583. Eccles, R. G., Ioannou, I., Serafeim, G., 2014. The impact of corporate sustainability on
organizational processes and performance. Management Science 60, 2835–2857. Fan, J., Rui, O., Zhao, M., 2008. Public governance and corporate finance: Evidence from
corruption cases. Journal of Comparative Economics 36, 343–364. Fan, J., Wong, T.J., Zhang, T., 2007. Politically connected CEOs, corporate governance, and
Post-IPO performance of China’s newly partially privatized firms. Journal of Financial Economics 84, 330–357.
Farrell, J., Saloner, G., 1985. Standardization, compatibility, and innovation. The Rand Journal
of Economics 16, 70–83. Fishman, M. J., Hagerty, K., 2003. Mandatory vs. voluntary disclosure in markets with informed
and uninformed customers. Journal of Law, Economics, & Organization 19, 45–63. Fisman R., Wang, Y.X., 2012. The mortality cost of political connections. Working paper,
Columbia University and University of Southern California.
39
Glosten, L. R., Harris, L.E., 1988. Estimating the components of the bid-ask spread. Journal of
Financial Economics 21, 123–142. Hail, L., Leuz, C., Wysocki, P., 2010. Global accounting convergence and the potential adoption
of IFRS by the U.S. (Part I): Conceptual underpinnings and economic analysis. Accounting Horizons 24, 355–394.
He, X., Wong, T.J., Young, D., 2012. Challenges for implementation of fair value accounting in
emerging markets: Evidence from IFRS adoption in China. Contemporary Accounting Research 29, 538–562.
Healy, P., Palepu, K., 2001. Information asymmetry, corporate disclosure, and the capital
markets: A review of the empirical disclosure literature. Journal of Accounting and Economics 31, 405–440.
Hess, D., 2007. Social reporting and new governance regulation: the prospects of achieving
corporate accountability through transparency. Business Ethics Quarterly 17, 453–476. Holmstrom, B., Tirole, J., 1993. Market liquidity and performance monitoring. Journal of
Political Economy 101, 678–709 Hong, H., Kacperczyk, M., 2009. The price of sin: The effects of social norms on markets.
Journal of Financial Economics 93, 15–36. Hong, H., Kostovetsky, L., 2012. Red and blue investing: Values and finance. Journal of
Financial Economics 103, 1–19. Hong, H., Kubik, J., Scheinkman, J., 2011. Financial constraints on corporate goodness.
Working paper, Princeton University and Syracuse University. Hope, O.-K. 2003. Disclosure practices, enforcement of accounting standards, and analysts'
forecast accuracy: An international study. Journal of Accounting Research 41, 235–272. Hung, M., Wong, T.J., Zhang, T., 2012. Political considerations in the decision of Chinese SOEs
to list in Hong Kong. Journal of Accounting and Economics 53, 435–449. Indjejikian, R.J., 1991. The impact of costly information interpretation on firm disclosure
decisions. Journal of Accounting Research 29, 277–301. Ioannou, I., Serafeim, G., 2014. The consequences of mandatory corporate sustainability
reporting: Evidence from four countries. Working paper. Harvard Business School. Katz, M., Shapiro, C., 1985. Network externalities, competition, and compatibility. The
American Economic Review 75, 424–440.

40
Kim, O., Verrecchia, R.E., 1994. Market liquidity and volume around earnings announcements. Journal of Accounting and Economics 17, 41–67.
Kim, O., Verrecchia, R.E., 1997. Pre-announcement and event-period private information.
Journal of Accounting and Economics 24, 395–419. Kondo, P., 2012. The more we know about the fundamental, the less we agree on the price.
Review of Economic Studies 79, 1175–1207. KPMG, 2011. KPMG International Survey of Corporate Responsibility Reporting. KPMG. KPMG, UNEP, 2010. Carrots and Sticks – Promoting Transparency and Sustainability. KPMG
and United Nations. Kyle, A. S., 1985. Continuous auctions and insider trading. Econometrica 53, 1315–1335. Lang, M., Lundholm, R., 1996. Corporate disclosure policy and analyst behavior. The
Accounting Review 71, 467–492. Lee, C. M. C., Mucklow, B., and Ready, M., 1994. Spreads, depths, and the impact of earnings information: An intraday analysis. Review of Financial Studies 6, 345–374. Lee, C., Ready, M.J., 1991. Inferring trade direction from intraday data. Journal of Finance 46,
733–746. Li, S., 2010. Does mandatory adoption of International Financial Reporting Standards in the
European Union reduce the cost of equity capital? The Accounting Review 85, 607–636. Lin, L., 2010. Corporate social responsibility in China: Window dressing or structural change?
Berkeley Journal of International Law 28, 64–100. Lin, J., Sanger, G.C., Booth, G., 1995. Trade size and components of the bid- ask spread. Review
of Financial Studies 8, 1153–1183. Lin, Y.F., Tan, G., 1999. Policy burdens, accountability, and the soft budget constraint.
American Economic Review P&P 89, 426–431. Locke, R., Romis, M., 2007. Improving work conditions in a global supply chain. MIT Sloan
Management Review 48, 54–63. Ma, D., Parish, W. L., 2006. Tocquevillian moments: Charitable contributions by Chinese
private entrepreneurs. Social Forces 85, 943–964. Margolis, J., Elfenbein, H., Walsh, J., 2007. Does it pay to be good? A meta-analysis and
redirection of the relationship between corporate social and financial performance. Working paper, Harvard Business School.
41
Morck, R., Yeung, B., Yu, W., 2000. The information content of stock markets: Why do
emerging markets have synchronous stock price movement? Journal of Financial Economics 58, 215–260.
Noronha, C., Tou, S., Cynthia, M.I., Guan, J., 2012. Corporate social responsibility reporting in
China: An overview and comparison with major trends. Corporate Social Responsibility and Environmental Management doi: 10.1002/csr.1276
O’Hara, M. 1995. Market Microstructure Theory. Blackwell Publishers. MA. Owen, D.L., Swift, T., Hunt, K., 2001. Questioning the role of stakeholder engagement in social
and ethical accounting, auditing, and reporting. Accounting Forum 25, 264–282. Sadka, R., 2006. Momentum and post-earnings-announcement drift anomalies: The role of
liquidity risk. Journal of Financial Economics 80, 309–349. SRI, 2001. Road to transparency: Status, trends, and challenges of CSR reporting in China.
Social Resources Institute, Beijing, China. SynTao, 2007. 2009. A Journey to Discover Values: A Study of Sustainability Reporting in
China. SynTao. Teoh, S. H., Welch, I., Wazzan, C. P., 1999. The effect of socially activist investment policies on
the financial markets: Evidence from the South African boycott. Journal of Business 72, 35–89.
Wang, C., 2014. Accounting standards harmonization and financial statement comparability:
Evidence from transnational information transfer. Journal of Accounting Research 54, 955–992.
Wooldridge, J., 2007. Difference-in-differences Estimation. NBER. Zhang, G. 2001. Private information production, public disclosure, and the cost of capital:
Theory and implications. Contemporary Accounting Research 18, 363–384

42
Appendix A Membership criteria for the SZSE 100 and SHSE corporate governance indexes
Excerpts from “Ground Rules for the SZSE 100 Index,” Shenzhen Securities Information Co., May 2014 1.2 SZSE 100 Index is designed to represent the performance of top 100 A-share listed companies in Shenzhen Stock Exchange ranked by total market capitalization, free-float market capitalization and turnovers.
Excerpts from “Notice issued SSE Corporate Governance Sector selection approach,” October 9, 2007 (original text in Mandarin and translated into English with highlight added). I. Basic Principles 1. Voluntary application. Voluntary application of listed companies to join the corporate governance section. 2. Fair and transparent. Based on company self-assessment, public comments, and expert assessment. II. Implementation The application materials are evaluated by securities companies, fund management companies, insurance companies, rating agencies and specialized research institutions. Annex I. SSE Corporate Governance Sector application requirements 1. The company’s controlling shareholders strictly follow state laws and regulations and
Shanghai Stock Exchange listing rules; 2. Company directors, supervisors, and senior management comply with state laws and
regulations and the Shanghai Stock Exchange Listing rules, are honest, trustworthy, and diligent;
3. The company has established a sound General Meeting, the Board of Directors, and Board of Supervisors;
4. The company has established a sound internal control system, has effectively implemented complete and timely disclosure of information, and its financial statements give a true and reliable view of business activities;
5. The company has established a sound high level management and employee incentive system; 6. The company has no major illegal activities in the most recent three years; the company and
its directors, supervisors and senior management personnel are not subject to administrative penalties imposed by China Securities Regulatory Commission and publicly condemned by the Exchange in the last thirty months.
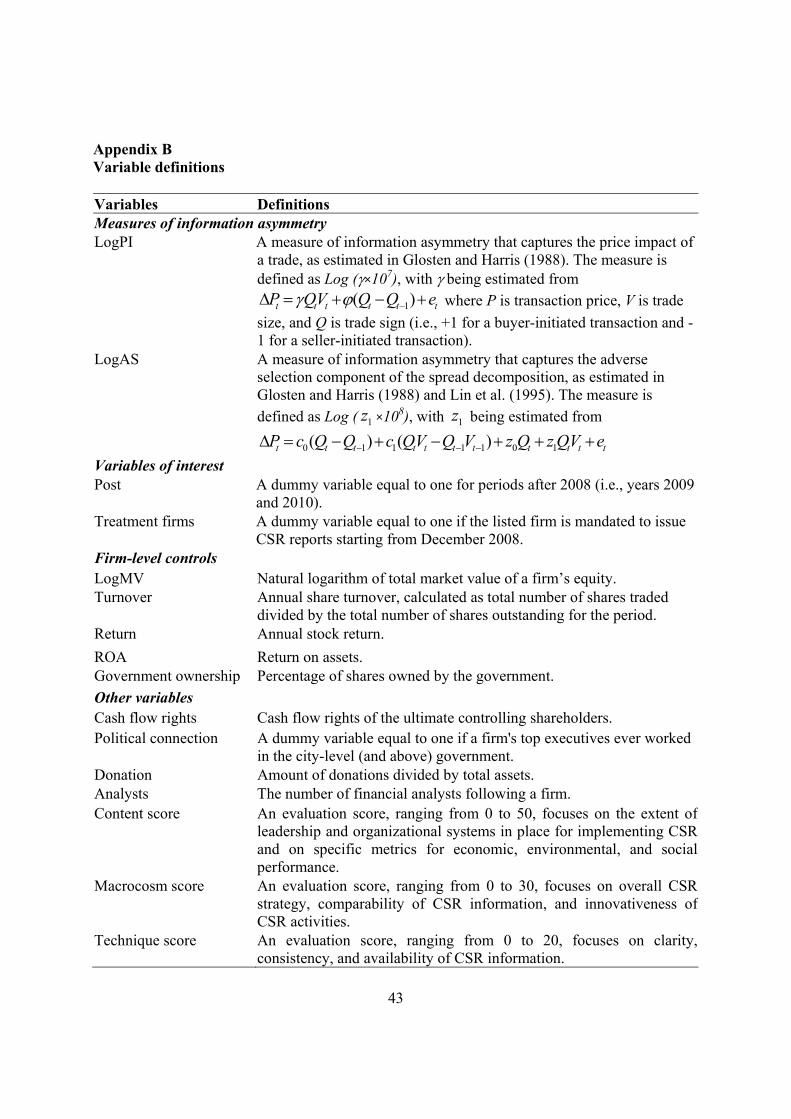
43
Appendix B Variable definitions Variables Definitions Measures of information asymmetry LogPI A measure of information asymmetry that captures the price impact of
a trade, as estimated in Glosten and Harris (1988). The measure is defined as Log (×107), with being estimated from
where P is transaction price, V is trade
size, and Q is trade sign (i.e., +1 for a buyer-initiated transaction and -1 for a seller-initiated transaction).
LogAS A measure of information asymmetry that captures the adverse selection component of the spread decomposition, as estimated in Glosten and Harris (1988) and Lin et al. (1995). The measure is
defined as Log ( ×108), with being estimated from
Variables of interest Post A dummy variable equal to one for periods after 2008 (i.e., years 2009
and 2010). Treatment firms A dummy variable equal to one if the listed firm is mandated to issue
CSR reports starting from December 2008. Firm-level controls LogMV Natural logarithm of total market value of a firm’s equity. Turnover Annual share turnover, calculated as total number of shares traded
divided by the total number of shares outstanding for the period. Return Annual stock return.
ROA Return on assets. Government ownership Percentage of shares owned by the government.
Other variables Cash flow rights Cash flow rights of the ultimate controlling shareholders. Political connection A dummy variable equal to one if a firm's top executives ever worked
in the city-level (and above) government. Donation Amount of donations divided by total assets. Analysts The number of financial analysts following a firm. Content score An evaluation score, ranging from 0 to 50, focuses on the extent of
leadership and organizational systems in place for implementing CSR and on specific metrics for economic, environmental, and social performance.
Macrocosm score An evaluation score, ranging from 0 to 30, focuses on overall CSR strategy, comparability of CSR information, and innovativeness of CSR activities.
Technique score An evaluation score, ranging from 0 to 20, focuses on clarity, consistency, and availability of CSR information.
1( )t t t t t tP QV Q Q e
1z 1z
0 1 1 1 1 0 1( ) ( )t t t t t t t t t t tP c Q Q c QV Q V z Q z QV e

44
Appendix B, continued Legal development The legal environment index for a firm’s province, based on the
2008 National Economic Research Institute (NERI) Index of Marketization of China’s provinces.
Market development The market development index for a firm’s province, based on the 2008 National Economic Research Institute (NERI) Index of Marketization of China’s provinces.
Voluntary reporting firms A dummy variable equal to one if a firm voluntarily issues CSR reports.
Year Number of years relative to 2008.
Post_voluntary reporting A dummy variable equal to one for a firm-year subsequent to voluntary CSR reporting.
Post_early voluntary reporting
A dummy variable equal to one for a firm-year subsequent to voluntary CSR reporting for early voluntary reporting firms, defined as firms that voluntarily release CSR reports prior to the 2008 mandate.
Post_late voluntary reporting
A dummy variable equal to one for a firm-year subsequent to voluntary CSR reporting for late voluntary reporting firms, defined as firms that voluntarily release CSR reports on or after the 2008 mandate.
Forecast accuracyt, t+1, t+2 (-1) multiplied by the absolute value of analyst earnings forecast errors for year t, year t+1, and year t+2. Forecast errors for year t are calculated as actual earnings minus and consensus forecasted earnings for year t, scaled by stock price at the end of year t.
IC reporting firm A dummy variable equal to one if a firm issues an internal control report.

45
Appendix C The procedure to develop propensity-score-matching samples This table describes the propensity-score-matching approach. We implement this procedure by first estimating a logit regression to model the probability of being a treatment firm using the pre-shock period data. We then match each treatment firm to the control firms using the nearest neighbor matching technique (with replacement, and caliper set at 0.25*standard error of propensity score). The estimation result for the logit regression follows:
Variable Dep. var. = Mandatory CSR
reporting firms LogMV 1.243*** (0.168) Turnover 0.043** (0.019) Return -0.093 (0.062) ROA 2.576* (1.358) Government ownership 1.391*** (0.470) Cash flow rights -0.009 (0.007) Political connection 0.596 (0.390) Log(1+Donation) 0.010 (0.013) Log(1+Analysts) 1.558*** (0.307) LogPI 0.024 (0.116) Constant -38.911 (0.000) N 3,187 Pseudo R-squared 0.379

46
Table 1 Summary statistics, PSM sample This table provides descriptive statistics for the variables used in our analysis. See Appendix B for variable definitions. Panel A: Descriptive statistics (N=3,555) Variable Mean Std. dev. Median Min Max LogPI 0.460 1.056 0.431 -2.263 3.921 LogAS 1.503 1.244 1.547 -4.871 5.153 Post 0.411 0.492 0.000 0.000 1.000 Treatment firms 0.323 0.468 0.000 0.000 1.000 LogMV 14.900 1.145 14.846 11.415 18.972 Turnover 6.577 3.683 5.877 0.768 21.270 Return 0.800 1.184 0.654 -0.782 4.845 ROA 0.040 0.068 0.037 -0.339 0.226 Government ownership 0.222 0.231 0.166 0.000 0.971
Panel B: Mean value of treatment versus benchmark groups
Variable Treatment Group
(N=1,147) Benchmark Group
(N=2,408) Diff.
(Treatment-benchmark) LogPI 0.338 0.517 -0.179*** LogAS 1.385 1.560 -0.174*** LogMV 15.528 14.601 0.927*** Turnover 5.688 7.000 -1.312*** Return 0.830 0.785 0.045*** ROA 0.057 0.031 0.026 Government ownership 0.258 0.205 0.053***

47
Table 2 Correlation analysis, PSM sample This table reports Pearson correlation coefficients (N=3,555). See Appendix A for variable definitions. * indicates that the correlation is significant at least at the 10% level.
LogPI LogAS Post Treatment
firms LogMV Turnover Return ROA Government ownership
(1) (2) (3) (4) (5) (6) (7) (8) (9)(1) 1 (2) 0.929* 1 (3) -0.146* 0.019 1 (4) -0.079* -0.066* -0.009 1 (5) -0.167* -0.071* 0.429* 0.378* 1 (6) -0.064* -0.085* -0.157* -0.167* -0.370* 1 (7) 0.011 0.012 -0.017 0.018 0.206* -0.143* 1 (8) 0.284* 0.277* 0.006 0.180* 0.304* -0.225* 0.112* 1 (9) -0.007 -0.065* -0.353* 0.108* -0.144* 0.112* 0.054* 0.017 1

48
Table 3 The impact of mandatory CSR disclosure on information asymmetry, PSM sample This table presents the results of the impact of mandatory CSR disclosure on information asymmetry based on the PSM sample. See Appendix B for variable definitions. Robust standard errors clustered by firm are reported in parentheses. *,**,*** indicate significance at the 10%, 5%, and 1% levels (two-tailed), respectively.
Dep. var. = LogPI Dep. var. = LogAS Variable (1) (2) (3) (4) Post -0.097** n.a. 0.279*** n.a. (0.045) (0.055) Treatment firms -0.060 n.a. -0.034 n.a. (0.074) (0.085) Post×Treatment firms -0.132** -0.136** -0.205*** -0.217***
(0.051) (0.053) (0.067) (0.069) LogMV -0.258*** 0.072 -0.260*** 0.241***
(0.036) (0.046) (0.042) (0.059) Turnover -0.026*** -0.044*** -0.026*** -0.032***
(0.006) (0.004) (0.007) (0.007) Return 0.012 -0.019 0.013 -0.061**
(0.014) (0.018) (0.017) (0.026) ROA 5.953*** 0.932*** 6.639*** 0.709**
(0.429) (0.269) (0.496) (0.349) Government ownership -0.284** 0.205** -0.346** 0.214
(0.121) (0.103) (0.144) (0.136) Fixed effects No Firm&Year No Firm&Year N 3,555 3,555 3,555 3,555 Adjusted R-squared 0.173 0.820 0.131 0.725

49
Table 4 The effect of mandatory CSR disclosure on information asymmetry, conditional on political/social risk This table presents the results of the impact of mandatory CSR disclosure on information asymmetry, conditional on a firm’s political/social risk. See Appendix B for variable definitions. Robust standard errors clustered by firm are reported in parentheses. *,**,*** indicate significance at the 10%, 5%, and 1% levels (two-tailed), respectively. Dep. var. = LogPI Government ownership Political connection
High government
ownership Low government
ownership Politically connected
Non-Politically connected
Post× Treatment firms (β1) -0.005 -0.239** 0.285 -0.159*** (0.086) (0.107) (0.198) (0.055) Test of difference in β1,
High-low
0.234*** 0.444*** LogMV 0.167** 0.002 0.059 0.072 (0.070) (0.072) (0.131) (0.047) Turnover -0.039*** -0.053*** -0.065*** -0.042*** (0.006) (0.007) (0.013) (0.005) Return -0.042 -0.025 -0.023 -0.020 (0.026) (0.031) (0.047) (0.019) ROA 0.435 0.948* 1.801 0.903*** (0.388) (0.485) (1.568) (0.273) Government ownership 1.200*** -1.204* 0.617* 0.200* (0.263) (0.651) (0.326) (0.108) Fixed effects Firm&Year N 1,769 1,786 196 3,359 Adjusted R-squared 0.853 0.835 0.874 0.816

50
Table 5 The effect of mandatory CSR disclosure on information asymmetry, conditional on information environments This table presents the results of the impact of mandatory CSR disclosure on information asymmetry, conditional on a firm’s information environment. See Appendix A for variable definitions. Robust standard errors clustered by firm are reported in parentheses. *,**,*** indicate significance at the 10%, 5%, and 1% levels (two-tailed), respectively.
Dep. var. = LogPI
Analyst following Firm size High analyst following Low analyst following Large firm Small firm
Post×Treatment firms (β1) 0.036 -0.267*** -0.047 -0.229*** (0.068) (0.100) (0.074) (0.085) Test of difference in β1,
High-low 0.303*** 0.182** LogMV -0.064 0.205*** 0.035 0.096
(0.051) (0.073) (0.071) (0.065) Turnover -0.054*** -0.028*** -0.041*** -0.042***
(0.006) (0.006) (0.007) (0.006) Return 0.009 -0.057** -0.005 -0.052*
(0.022) (0.029) (0.024) (0.027) ROA 2.694*** 0.227 1.709*** 0.608**
(0.524) (0.257) (0.538) (0.294) Government ownership 0.155 0.198 0.157 0.153
(0.143) (0.140) (0.170) (0.147) Fixed effects Firm&Year N 1,825 1,730 1,801 1,754 Adjusted R-squared 0.837 0.801 0.818 0.828

51
Table 6 The effect of mandatory CSR disclosure on information asymmetry, conditional on CSR reporting quality This table presents the results of the impact of mandatory CSR disclosure on information asymmetry, conditional on a firm’s CSR reporting quality. See Appendix B for variable definitions. Robust standard errors clustered by firm are reported in parentheses. *,**,*** indicate significance at the 10%, 5%, and 1% levels (two-tailed), respectively.
Panel A: Descriptive statistics on additional variables Variable N Mean Std. dev. Median Min Max Content score 1,027 11.689 3.753 11.090 5.540 28.040 Macrocosm score 1,027 10.067 3.207 9.380 4.370 25.420 Technique score 1,022 6.880 1.637 6.530 4.440 16.110
Panel B: Regression analysis conditional on CSR reporting quality
Dep. var. = LogPI Content score Macrocosm score Technique score
High Low High Low High Low
Post×Treatment firms (β1) -0.209*** -0.084 -0.161** -0.112* -0.109 -0.193*** (0.079) (0.061) (0.072) (0.064) (0.067) (0.072) Test of difference in β1,
High-low -0.125** -0.049 0.084 LogMV 0.061 0.119** 0.069 0.111** 0.059 0.125**
(0.052) (0.047) (0.050) (0.048) (0.050) (0.049) Turnover -0.042*** -0.038*** -0.041*** -0.039*** -0.042*** -0.038***
(0.005) (0.004) (0.005) (0.004) (0.005) (0.004) Return -0.017 -0.034* -0.010 -0.041** -0.018 -0.032*
(0.021) (0.018) (0.020) (0.019) (0.020) (0.019) ROA 0.764*** 0.700*** 0.773*** 0.688*** 0.747*** 0.712***
(0.247) (0.252) (0.250) (0.248) (0.245) (0.254) Government ownership 0.216* 0.099 0.180 0.132 0.151 0.165
(0.115) (0.105) (0.114) (0.106) (0.113) (0.108) Fixed effects Firm&Year N 2,923 3,040 3,049 2,914 3,108 2,855 Adjusted R-squared 0.817 0.824 0.818 0.822 0.822 0.817

52
Table 7 Potential dominance of CSR reporting quality over firms’ political/social risk and information environments This table reports the analysis of mandatory CSR disclosure on information asymmetry, conditional on CSR reporting quality and government ownership, or on CSR reporting quality and analyst following. See Appendix B for variable definitions. Robust standard errors clustered by firm are reported in parentheses. *,**,*** indicate significance at the 10%, 5%, and 1% levels (two-tailed), respectively.
Samples split by Coeff. on
POST×Treatment firms Government ownership Analyst following CSR reporting quality
High Low Diff. High Low Diff. (1) (2) (3) (4) (5) (6)
Content score
High -0.015
(N=1,360) -0.387***
(N=1,449) 0.372***0.019
(N=1,236) -0.680***
(N=1,573) 0.699***
Low -0.024
(N=1,547) -0.155
(N=1,607) 0.131 -0.011
(N=1,398) -0.152
(N=1,756) 0.141
Diff. 0.009 -0.232** 0.030 -0.528***
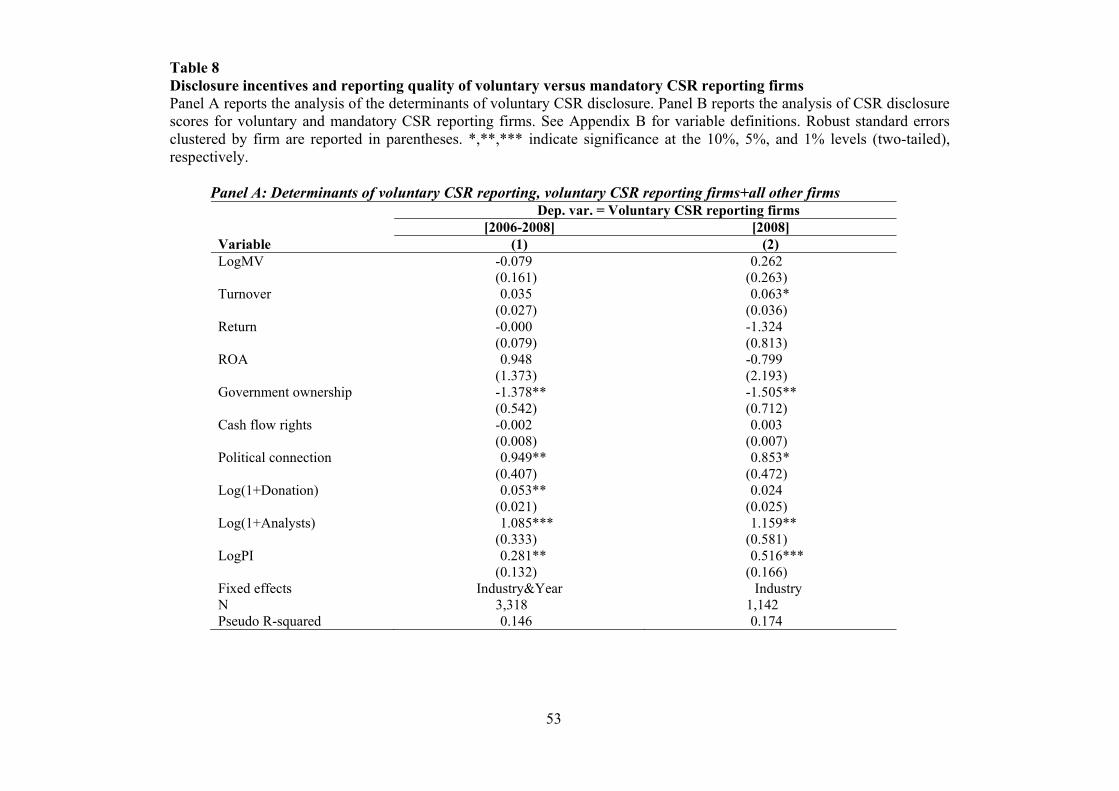
53
Table 8 Disclosure incentives and reporting quality of voluntary versus mandatory CSR reporting firms Panel A reports the analysis of the determinants of voluntary CSR disclosure. Panel B reports the analysis of CSR disclosure scores for voluntary and mandatory CSR reporting firms. See Appendix B for variable definitions. Robust standard errors clustered by firm are reported in parentheses. *,**,*** indicate significance at the 10%, 5%, and 1% levels (two-tailed), respectively.
Panel A: Determinants of voluntary CSR reporting, voluntary CSR reporting firms+all other firms Dep. var. = Voluntary CSR reporting firms [2006-2008] [2008] Variable (1) (2) LogMV -0.079 0.262 (0.161) (0.263) Turnover 0.035 0.063* (0.027) (0.036) Return -0.000 -1.324 (0.079) (0.813) ROA 0.948 -0.799 (1.373) (2.193) Government ownership -1.378** -1.505** (0.542) (0.712) Cash flow rights -0.002 0.003 (0.008) (0.007) Political connection 0.949** 0.853* (0.407) (0.472) Log(1+Donation) 0.053** 0.024 (0.021) (0.025) Log(1+Analysts) 1.085*** 1.159** (0.333) (0.581) LogPI 0.281** 0.516*** (0.132) (0.166) Fixed effects Industry&Year Industry N 3,318 1,142 Pseudo R-squared 0.146 0.174

54
Table 8, continued Panel B: Regression analysis of CSR disclosure scores based on 2008-2010 CSR reports Dependent variable = Content Macrocosm Technique Content Macrocosm Technique
(1) (2) (3) (4) (5) (6)
Voluntary reporting firms 1.205** 1.111*** 0.692*** 1.650*** 1.541*** 0.958***
(0.583) (0.405) (0.259) (0.619) (0.472) (0.282)
Year (β1) n.a. n.a. n.a. 0.867*** 0.167 -0.078
(0.203) (0.149) (0.077)
Year×Voluntary reporting firms (β2) n.a. n.a. n.a. -0.506 -0.436* -0.256*
(0.307) (0.234) (0.143)
β1+β2 0.361 -0.269 0.334**
LogMV 2.196*** 1.186*** 0.535*** 2.062*** 1.194*** 0.577***
(0.221) (0.161) (0.106) (0.239) (0.174) (0.114)
Turnover -0.008 -0.001 0.009 0.013 0.003 0.007
(0.054) (0.036) (0.021) (0.054) (0.036) (0.021)
Return 1.105*** -1.344*** -0.436*** 1.001*** -1.355*** -0.419***
(0.145) (0.103) (0.067) (0.140) (0.101) (0.064)
ROA -9.535** -2.216 -0.363 -8.876** -2.200 -0.524
(3.808) (2.566) (1.467) (3.784) (2.592) (1.488)
Government ownership 2.936*** 1.770** 0.905** 3.472*** 1.823** 0.812*
(1.092) (0.700) (0.436) (1.125) (0.721) (0.445)
Legal development 0.158 0.043 0.045 0.176 0.040 0.038
(0.171) (0.121) (0.077) (0.172) (0.121) (0.077)
Market development -0.040 0.060 -0.004 -0.068 0.066 0.008
(0.334) (0.227) (0.142) (0.334) (0.227) (0.142)
Fixed effects Industry
N 1,014 1,013 1,013 1,014 1,013 1,013
Adjusted R-squared 0.410 0.322 0.400 0.417 0.400 0.324

55
Table 9 The effect of voluntary CSR disclosure on information asymmetry The table reports the analysis on the effect of voluntary CSR disclosure on information asymmetry, using firms not subject to the CSR mandate as benchmark. The sample period is from 2005-2010. See Appendix B for variable definitions. Robust standard errors clustered by firm are reported in parentheses. *,**,*** indicate significance at the 10%, 5%, and 1% levels (two-tailed), respectively. Dep. var. = LogPI
(1) (2) Post_voluntary reporting -0.156** (0.072) Post_early voluntary reporting -0.118 (0.118) Post_late voluntary reporting -0.151* (0.086) LogMV 0.087 0.086
(0.060) (0.060) Turnover -0.006* -0.006*
(0.003) (0.003) Return 0.109*** 0.110***
(0.019) (0.019) ROA 0.639*** 0.640***
(0.148) (0.149) Government ownership -0.116 -0.115
(0.082) (0.082) Fixed effects Firm&Year N 5,279 5,279 Adjusted R-squared 0.803 0.804

56
Table 10 The effect of mandatory CSR disclosure on analyst following and forecast accuracy This table reports the analysis on the effect of mandatory CSR disclosure on analyst following and forecast accuracy. See Appendix B for variable definitions. Robust standard errors clustered by firm are reported in parentheses. *,**,*** indicate significance at the 10%, 5%, and 1% levels (two-tailed), respectively. Panel A: Descriptive statistics on additional variables Variable N Mean Std. dev. Median Min Max Log(1+Analysts) 3,555 1.941 1.236 1.946 0.000 4.682 Forecast accuracyt 2,732 -0.020 0.035 -0.008 -0.000 -0.228 Forecast accuracyt+1 2,697 -0.035 0.044 -0.020 -0.001 -0.262 Forecast accuracyt+2 2,406 -0.047 0.049 -0.031 -0.002 -0.270
Panel B: Regression analysis
Dependent variable = Log(1+Analysts) Forecast accuracyt Forecast accuracyt+1 Forecast accuracyt+2 (1) (2) (3) (4)
Post×Treatment firms 0.077* 0.003 -0.001 0.002 (0.046) (0.003) (0.003) (0.004) LogMV 0.505*** -0.003 0.001 0.007**
(0.038) (0.002) (0.003) (0.003) Turnover 0.018*** -0.002*** -0.002*** -0.001*
(0.004) (0.000) (0.000) (0.001) Return -0.142*** 0.004*** 0.005*** 0.009***
(0.015) (0.001) (0.001) (0.001) ROA 1.063*** 0.326*** 0.003 -0.086**
(0.262) (0.033) (0.030) (0.040) Government ownership 0.339*** 0.006 0.005 0.023***
(0.102) (0.005) (0.007) (0.008) Fixed effects Firm&Year N 3,555 2,732 2,695 2,406 Adjusted R-squared 0.869 0.467 0.419 0.479

57
Table 11 Robustness tests This table presents results of sensitivity tests. The dependent variable is LogPI. See Appendix B for variable definitions. Robust standard errors clustered by firm are reported in parentheses. *,**,*** indicate significance at the 10%, 5%, and 1% levels (two-tailed), respectively.
Coefficient on
Post×Treatment firms Obs. Adj. R2
Alternative sample firms 1. Using full sample -0.202*** 6,469 0.822 (0.047) Alternative sample periods 2. A placebo test using sample period 2006-2008 0.180 2,095 0.866 (0.131) 3. Deleting 2008 -0.129** 2,843 0.809 (0.065) Additional controls 4. Further controlling for Post_IC×IC reporting firm -0.150*** 3,555 0.820 (0.053) 5. Further controlling for Year×Treatment firms -0.180*** 3,555 0.82 (0.059) Alternative information asymmetry proxies 6. Using bid-ask spread as a proxy for information asymmetry -0.002** 3,555 0.677 (0.001) Firm-level controls Included Fixed effects Firm&Year