Managing the dioxin problem in the Baltic region with ... · project BalticPOPs – Managing the...
133
Managing the dioxin problem in the Baltic region with focus on sources to air and fish Final report from the research project BalticPOPs REPORT 6566 • may 2013 Karin Wiberg, anteneh t. assefa, Kristina L. sundqvist, ian t. Cousins, Jana Johansson, miChaeL s. mCLaChLan, anna sobeK, gerard CorneLissen, aroha miLLer, Jenny hedman, anders bignert, heiKKi PeLtonen, miKKo KiLJunen, viCtor shataLov and ingemar Cato
Transcript of Managing the dioxin problem in the Baltic region with ... · project BalticPOPs – Managing the...

Managing the dioxin problem in the Baltic region with focus
on sources to air and fishFinal report from the research project BalticPOPs
report 6566 • may 2013
Karin Wiberg, anteneh t. assefa, Kristina L. sundqvist,
ian t. Cousins, Jana Johansson, miChaeL s. mCLaChLan,
anna sobeK, gerard CorneLissen, aroha miLLer,
Jenny hedman, anders bignert, heiKKi PeLtonen,
miKKo KiLJunen, viCtor shataLov and ingemar Cato

SWEDISH ENVIRONMENTAL PROTECTION AGENCY
Managing the dioxin problem in the Baltic region with focus on sources to air and
fish
Authors:
Karin Wiberg,
Department of Aquatic Sciences and Assessment, Swedish University of Agricul-
tural Sciences (SLU)
Anteneh T. Assefa, Kristina L. Sundqvist,
Department of Chemistry, Umeå University
Ian T. Cousins, Jana Johansson, Michael S. McLachlan,
Anna Sobek, Gerard Cornelissen,
Department of Applied Environmental Science (ITM), Stockholm University
Aroha Miller, Jenny Hedman, Anders Bignert,
Swedish Museum of Natural History
Heikki Peltonen,
Finnish Environment Institute (SYKE)
Mikko Kiljunen,
Department of Biological and Environmental Science, University of Jyväskylä
Victor Shatalov,
Meteorological Synthesizing Centre-East (MSC-East), EMEP
Ingemar Cato,
Geological Survey of Sweden and Department of Earth Sciences, University of
Gothenburg

3
Orders Phone: + 46 (0)8-505 933 40
Fax: + 46 (0)8-505 933 99 E-mail: [email protected]
Address: CM Gruppen AB, Box 110 93, SE-161 11 Bromma, Sweden Internet: www.naturvardsverket.se/publikationer
The Swedish Environmental Protection Agency Phone: +46 (0)10-698 10 00 Fax: +46 (0)10-698 10 99
E-mail: [email protected] Address: Naturvårdsverket, SE-106 48 Stockholm, Sweden
Internet: www.naturvardsverket.se
ISBN 978-91-620-6566-9 ISSN 0282-7298
© Naturvårdsverket 2013
Print: CM Gruppen AB, Bromma 2013
Cover photo: Eva-Maria Diehl och Kristina L. Sundqvist

SWEDISH ENVIRONMENTAL PROTECTION AGENCY REPORT 6566 Managing the dioxin problem in the Baltic region with focus on sources to air and fish
3
Preface During the years 2009-2012, the Swedish Environmental Protection Agency has funded the research project BalticPOPs – Managing the dioxin problem in the Baltic Sea. Baltic herring and other oil-rich fish contain levels of dioxins that exceed the limit set by the EU for sale of fish for consumption. The aim of this project was to increase our knowledge about the causes and the emission sources of the high levels of dioxins in oil-rich fish in the Baltic Sea. The knowledge is needed to establish a basis that would enable us to implement the most efficient measures for reduc-ing emissions of dioxins from both Swedish and foreign sources. The research project has been led by Professor Karin Wiberg at the Swedish University of Agricultural Sciences. Researchers from eight universities and research organizations in Sweden, Finland and Rus-sia have participated. The views expressed in this report are those of the authors and do not necessarily represent the views of the Swedish EPA. A summary of the results and policy briefs are available in separate publications both in English (ISBN 978-91-620-8652-7) and in Swedish (ISBN 978-91-620-8651-0). The project has been funded by the Swedish EPA´s Environmental Research Grant. The Swedish Environmental Protection Agency, May 2013

SWEDISH ENVIRONMENTAL PROTECTION AGENCY REPORT 6566 Managing the dioxin problem in the Baltic region with focus on sources to air and fish
4
Förord Naturvårdsverket har under åren 2009-2012 finansierat forskningsprogrammet BalticPOPs – Hur ska dioxinproblemet i Östersjön hanteras? Halterna av dioxiner i strömming och annan fet fisk i Östersjön är så höga att de ofta överskrider EU:s gränsvärde för försäljning av konsumtionsfisk. Syftet med satsningen på forskningsprogrammet var att ta fram mer kunskap om orsakerna och källorna till de höga dioxinhalterna i fet fisk i Östersjön. Kun-skapen behövs för att kunna verka för att de mest effektiva åtgärderna vidtas för att minska utsläppen och tillförsel av dioxiner från såväl svenska som utländska källor. Programmet har letts av Professor Karin Wiberg, Sveriges lantbruksuniversitet. Forskare från åtta lärosäten och forskningsorganisationer i Sverige, Finland och Ryssland har deltagit. Författarna svarar för innehållet i rapporten. En sammanfattning av resultaten och förslag till åtgärder finns i separata publikationer både på svenska (ISBN 978-91-620-8651-0) och på engelska (ISBN 978-91-620-8652-7). Forskningsprogrammet har finansierats med medel från Naturvårdsverkets miljöforskningsanslag. Naturvårdsverket, maj 2013

SWEDISH ENVIRONMENTAL PROTECTION AGENCY REPORT 6566 Managing the dioxin problem in the Baltic region with focus on sources to air and fish
5
Contents Preface 3
Förord 4
1 Sammanfattning 8
2 Summary 10
3 Abbreviations 13
4 Introduction 15
4.1 Background 15
4.2 Organization of the BalticPOPs project 17
5 Long-term temporal trends in dioxins and dioxin-like PCBs in herring within
the Baltic Sea 20
5.1 Introduction 20
5.2 Methods 20
5.2.1 Sampling sites and matrices 20
5.2.2 Dioxin and dl-PCB analytical methods 21
5.2.3 Calculation of TEQs 22
5.2.4 Statistical treatment of biological variables and contaminant data 23
5.2.5 Stable isotope analysis to investigate potential shifts in herring diet 23
5.2.6 Modelling to investigate the impacts of decreased herring growth rates 23
5.3 Results and discussion 24
5.3.1 Biological variables 24
5.3.2 Congener patterns 24
5.3.3 Temporal trends in total TEQ and in dominant congener concentrations 25
5.3.4 Potential shifts in herring diet at Ängskärsklubb 31
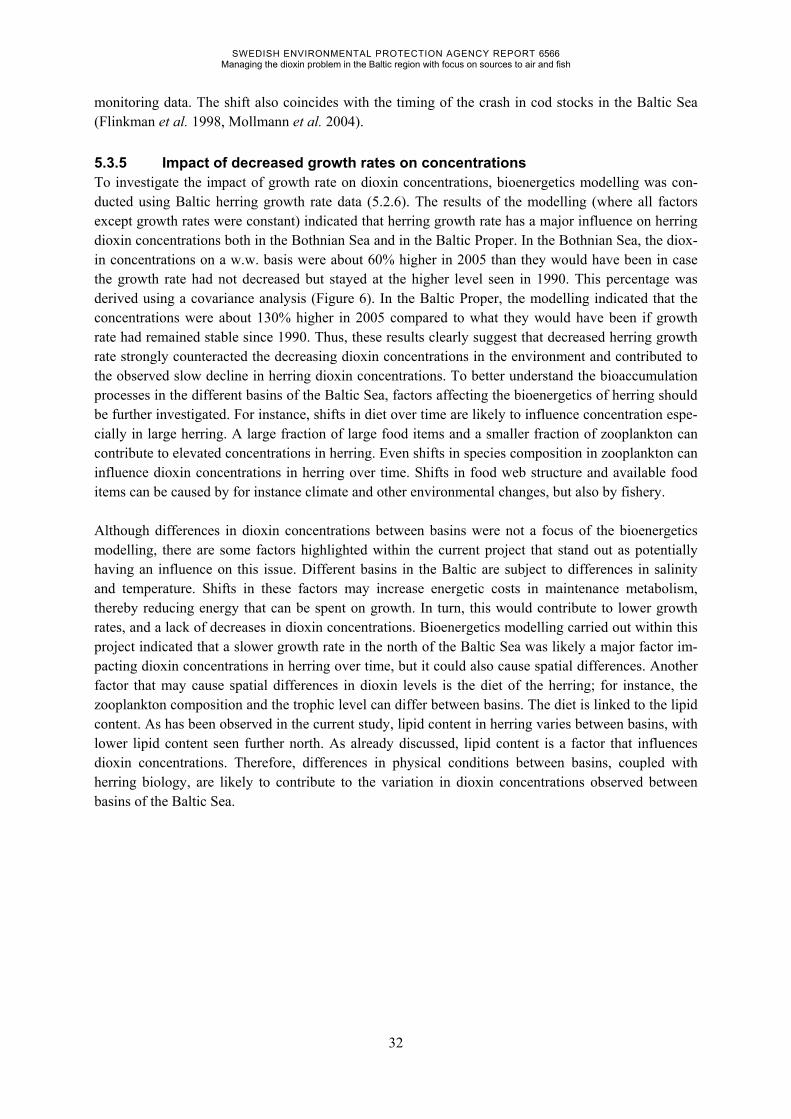
5.3.5 Impact of decreased growth rates on concentrations 32
5.4 Conclusions 33
6 Seasonal variation in dioxins in herring from the Bothnian Sea 35
6.1 Introduction 35
6.2 Methods 35
6.3 Results 36
6.4 Discussion 39
6.5 Conclusions 41
7 Spatial variation in dioxins and dioxin-like PCBs in herring from the Bothnian
Sea 42
7.1 Introduction 42
7.2 Methods 42

SWEDISH ENVIRONMENTAL PROTECTION AGENCY REPORT 6566 Managing the dioxin problem in the Baltic region with focus on sources to air and fish
6
7.2.1 Sampling sites and matrices 42
7.2.2 Dioxin analytical methods 44
7.2.3 Stomach content analysis 44
7.2.4 Stable isotope analysis 44
7.2.5 Statistical treatment of the data 45
7.3 Results 45
7.3.1 Biological variables of herring at coastal and offshore sites 46
7.3.2 Congener patterns and concentrations 46
7.3.3 Congener influence on offshore and coastal herring 53
7.3.4 Zooplankton composition 54
7.3.5 Herring stomach content 54
7.3.6 Stable isotope analysis 54
7.4 Discussion 55
7.5 Conclusions 57
8 Pollution time trends in sediments 58
8.1 Introduction 58
8.2 Method 59
8.2.1 Sampling of offshore sediment cores 59
8.2.2 Dating of offshore sediment cores 60
8.2.3 Quantification 60
8.2.4 Pollution fingerprints and source tracing 60
8.3 Results and discussion 62
8.3.1 Concentration time trends in offshore areas 62
8.3.2 Dioxin time trends in coastal areas 69
8.3.3 PCDD/F source tracing for sediment cores of the Baltic Sea 70
8.3.4 Dioxins in preindustrial sediment layers 78
8.4 Conclusions 78
9 Aerosol-water distribution of dioxins and PCBs in the Baltic Sea region 79
9.1 Introduction 79
9.2 Methods 79
9.3 Dioxin and PCB concentrations in aerosols 80
9.4 Aerosol TOC and BC content 80
9.5 Comparison of aerosol-water and sediment-water distribution ratios 81
9.6 Conclusions 82
10 Tracing the origin of dioxins in Baltic air using an atmospheric modelling
approach 83
10.1 Introduction 83
10.2 Methods 83
10.2.1 Selected congeners 83
SWEDISH ENVIRONMENTAL PROTECTION AGENCY REPORT 6566 Managing the dioxin problem in the Baltic region with focus on sources to air and fish
7
10.2.2 The MSCE-POP model 83
10.2.3 Model parameterisation 84
10.2.4 Emission data used for model simulations 84
10.2.5 Monitoring data for comparison with model predictions 85
10.2.6 Generating adjusted emission scenarios 86
10.3 Results and discussion 89
10.3.1 First emission scenario 89
10.3.2 Adjusted emission scenarios 91
10.4 Conclusions 93
11 Sources and source regions for atmospheric emissions of dioxins and other
POPs affecting the Baltic Sea environment 94
11.1 Introduction 94
11.2 Methodology 94
11.3 Results and discussion 95
11.3.1 Levels of PCDD/Fs 95
11.3.2 Levels of PCBs and HCB 95
11.3.3 PCDD/F and metal level correlation studies and possible sources 96
11.4 Conclusions 103
12 Synthesis 105
12.1 Introduction 105
12.2 Re-evaluation of POPCYCLING-Baltic modelling 105
12.2.1 Were temporal trends in air and thus atmospheric deposition between 1986
and 2006 correctly defined in previous modelling work? 105
12.2.2 Was the parameterisation of sedimentation, resuspension and burial rates
in the POPCYCLING-Baltic model correct in the previous modelling work? 107
12.2.3 Is soil volatilisation of dioxins an important source of dioxins to atmospheric
deposition to the Baltic Sea? 108
12.2.4 Were riverine inputs and land-based industrial inputs of dioxins to the Baltic
Sea underestimated in previous modelling work? 111
12.2.5 Concluding remarks concerning the lack of necessity for new
POPCYCLING-Baltic model simulations 112
12.3 Main conclusions 113
12.3.1 Temporal and spatial trends in herring 113
12.3.2 Temporal and spatial trends in sediment cores and source tracing 114
12.3.3 Strong sorption and the effect on availability of dioxins 115
12.3.4 Tracing the origin of dioxins in Baltic air 115
12.3.5 Suggested answers to the main questions posed in the project 116
12.4 Recommended action by regulatory authorities and further research 118
13 References 121

SWEDISH ENVIRONMENTAL PROTECTION AGENCY REPORT 6566 Managing the dioxin problem in the Baltic region with focus on sources to air and fish
8
1 Sammanfattning BalticPOPs är ett forskningsprogram som genomförts på uppdrag av Naturvårdsverket med syfte att i) undersöka tidstrender och geografiska trender av persistenta organiska miljöföreningar (POPs) i biota i Östersjön (framför allt i fet fisk såsom strömming) samt ii) spåra källorna till luftförorening av POPs. BalticPOPs har framför allt fokuserat på dioxiner, eftersom dioxinförorening är särskilt problematiskt i Östersjöregionen. BalticPOPs bygger vidare på forskningsresultat publicerade av Wiberg et al. (2009). Ett viktigt syfte är att använda de nya forskningsresultaten för att diskutera strategier att minska ut-släpp, något som bör leda till minskade dioxinhalter i fet Östersjöfisk. BalticPOPs har varit tvärveten-skapligt med experter från ett flertal olika forskningsområden. Projektets huvudsakliga slutsatser summeras nedan: i) Varför är halterna av dioxiner i fet fisk från Östersjön så höga? De huvudsakliga anledningar-na till att strömming i Östersjön är mer förorenad än fisk från omgivande hav anses vara att uppehålls-tiden för vatten i Östersjön är lång och att tillväxthastigheten för strömming i vissa bassänger är låg. Det är möjligt att de höga dioxinhalterna i strömming från vissa populationer kan bero på påverkan från kustnära källor, men eftersom strömming är en migrerande fisk (som endast tillbringar en begrän-sad tid vid kusten under lek) och det inte finns tydliga skillnader i dioxinförorening mellan strömming provtagen i kustområden respektive på öppet vatten, framstår detta som en osannolik förklaring. ii) Vilka är de huvudsakliga källorna till dioxiner i Östersjöströmming? De forskningsresultat som tagits fram inom BalticPOPs bekräftar slutsatsen från en tidigare studie (Wiberg et al. 2009)nämligen att atmosfärisk deposition är den huvudsakliga källan till förorening av dioxiner i Ös-tersjön. Detta kan styrkas bland annat med hjälp av: spridningsmodeller (Armitage et al. 2009, Wiberg et al. 2009); källspårning med hjälp av receptormodellering och sedimentdata (Sundqvist et al. 2010, As-
sefa et al., 2011 samt denna studie); mätningar av dioxinkoncentrationer i Umeåälven (Josefsson et al., manuskript) och i luft i
Östersjöområdet (Sellström et al. 2009), vilka indikerade att bidrag från floder är låga i förhål-lande till bidrag från atmosfärisk deposition;
att bidrag av utsläpp från industri och avloppsvatten är relativt låga i förhållande till bidrag från atmosfärisk deposition (Andersson et al. 2012, Fridmanis et al. 2012, Laht och Volkov 2012);
att föroreningsnivåer i strömmingspopulationer inte skiljer sig åt mellan fisk provtagna i kust-nära områden och fisk från utsjöområden (denna studie).
iii) Vilka är de huvudsakliga källorna till förorening av luft i Östersjöregionen? Det är svårt att exakt fastställa vilka typer av källor som dominerar, men mätning och modellering som genomförts inom BalticPOPs indikerar att icke-industriell förbränning är viktigare än industriella utsläpp. Enligt europeiska emissionsdatabaser utgör hushållens utsläpp mer än en tredjedel av de totala europeiska utsläppen av dioxiner idag. I vissa regioner kan de bidra med så mycket som 70 % av de totala utsläp-pen. De huvudsakliga källorna till utsläpp av dioxiner från europeiska hushåll har uppskattats vara uppvärmning och matlagning med fast bränsle samt avfallsförbränning. iv) Är dessa utsläpp (ii och iii) resultat av primära eller sekundära utsläpp? Att halterna av dioxi-ner är högre på vintern och mestadels ej kvantifierbara under sommaren tyder på att direkta källor

SWEDISH ENVIRONMENTAL PROTECTION AGENCY REPORT 6566 Managing the dioxin problem in the Baltic region with focus on sources to air and fish
9
snarare än temperaturstyrd avdunstning från jord (ibland kallade sekundära utsläpp) styr halterna av dioxiner i luft. Simuleringar med modellen POPCYCLING-Baltic visar också att avdunstning från jord är en relativt obetydlig källa av dioxiner till luft. v) Sker dessa utsläpp (ii och iii) huvudsakligen i Sverige eller internationellt? Det är inte möjligt att identifiera specifika regioner vars dioxinutsläpp är avgörande för föroreningen av luft i Europa. Man har dock, med hjälp av mätningar och modeller, kunnat sluta sig till att de dioxiner som uppmätts i Östersjöområdets luft huvudsakligen har sitt ursprung på den europeiska kontinenten, och att bidraget från Östeuropa är stort. Svenska källor står endast för ett mindre bidrag till halterna av dioxiner i Ös-tersjöområdets luft. vi) Hur har situationen förändrats över tid? De senaste decennierna har emissioner av dioxiner minskat som följd av införandet av nya regelverk. Forskning som genomförts inom BalticPOPs har visat att detta resulterat i långsiktiga nedgångar av dioxinhalter i Östersjösediment, men bara i vissa av de strömmingspopulationer i Östersjöns som studerats under senare år. Möjligen har långsammare tillväxthastigheter och förändringar i diet hämmat nedåtgående tidstrender av dioxiner och dioxinlika PCB:er i strömming och på så vis motverkat effekten av sänkta utsläpp. vii) Hur lång tid kommer det att ta innan halterna av dioxiner i strömming sjunker till nivåer som säkert ligger under EU:s riktlinjer, förutsatt att utsläppen till Östersjön minskar? I och med att halterna av dioxiner i Östersjöströmming överstiger EU:s riktlinjer och att den europeiska befolkningens all-männa exponering för dioxiner är hög, behövs fler åtgärder för att begränsa utsläppen till luft i Europa. Det är dock oklart huruvida halterna av dioxiner i strömming kommer att fortsätta att sjunka, i och med att framtida utsläpp av dioxiner och framtida förändringar i strömmingens ekologi är svåra att förutspå. viii) Finns kostnadseffektiva åtgärder som inom kort tid skulle kunna minska halterna av dioxiner i Östersjöströmming till nivåer under EU:s riktlinjer? De forskningsresultat som tagits fram i det här projektet visar att en minskning av den atmosfäriska depositionen av dioxiner till Östersjön skulle vara det mest effektiva sättet att sänka halterna av dioxiner i strömming, även om halterna skulle gå ner långsamt. Införandet av nya regelverk har gjort att industrins utsläpp av dioxiner minskat med upp till 90 %, medan utsläppen av dioxiner från hushåll inte minskat särskilt mycket. Således utgör hushållens utsläpp nu huvuddelen av de totala utsläppen av dioxiner i vissa regioner. På grund av ekologiska faktorer (såsom tillväxthastighet) och svårigheten att reglera diffusa utsläpp, finns inga garantier för att en snabb nedgång av dioxinnivåerna i Östersjöströmming kan åstadkommas genom ny lagstiftning. Ytterligare ett sätt att minska halterna av dioxiner i strömming kunde vara att styra fiskeriet i Östersjön så att strömmingens tillväxthastighet ökar. Detta rör komplexa ekologiska samband, och en sådan åtgärds biologiska konsekvenser och eventuella framgång har inte undersökts inom BalticPOPs. Det skulle därför behöva undersökas vidare i samarbete med forskare inom fiskekologi. ix) Sanering av förorenade sediment i Östersjöns kustområden skulle kunna ha betydande positiv lokal påverkan, och kunna förbättra vattenkvaliteten samt minska dioxinnivåerna i de arter som lever i dessa förorenade områden. Det skulle dock troligtvis inte ha någon inverkan på halterna av dioxiner i migrerande fisk (såsom strömming), vilken tillbringar huvudelen av sin tid på öppet vatten och endast tar sig till kustregioner för att leka under några få veckor sommartid.

SWEDISH ENVIRONMENTAL PROTECTION AGENCY REPORT 6566 Managing the dioxin problem in the Baltic region with focus on sources to air and fish
10
2 Summary The BalticPOPs project was commissioned by the Swedish Environmental Protection Agency (Swe-dish EPA) to i) investigate spatial and temporal trends of persistent organic pollutants (POPs) in Baltic biota (especially fatty fish such as herring), and to ii) trace the sources of these pollutants to the at-mosphere. BalticPOPs was focused on polychlorinated dibenzo-p-dioxins (PCDDs) and polychlorinat-ed dibenzofurans (PCDFs; collectively termed PCDD/F or “dioxins” in this report), which are of par-ticular concern in the Baltic region. BalticPOPs builds on the results of previous research in Wiberg et al. (2009). An important aim was to use the findings of this research to develop recommendations for the Swedish EPA on emission reduction strategies for dioxins, in order to achieve reductions in dioxin levels in Baltic fatty fish such as herring. A multidisciplinary approach was implemented, and the project consortium therefore included experts from many different research fields. The main questions posed in the project proposal and the answers provided from the research undertaken in the project are listed below: i) Why are dioxin levels in fatty fish from the Baltic Sea so high? The slow growth of herring in some Baltic sub-basins combined with the long residence time of Baltic Sea water are considered the main reasons why Baltic herring have higher dioxin concentrations than in surrounding seas. It is pos-sible that some herring populations could have been impacted by coastal sources resulting in high concentrations, but the migratory nature of herring (they spend limited time at the coast during spawn-ing) and the lack of clear spatial variation in dioxin contamination between different herring popula-tions in the Bothnian Sea makes this seem an unlikely explanation. ii) What are the main sources of the dioxins in Baltic herring? Research undertaken in the Bal-ticPOPs project confirms the conclusion of previous work (Wiberg et al. 2009) that the atmosphere is, and will continue to be, the major external source of dioxin pollution to the Baltic Sea, and thus dioxin contamination in herring populations. Key evidence for the dominance of atmospheric sources in-cludes: Environmental fate modelling (Armitage et al. 2009, Wiberg et al. 2009); Sediment source tracing modelling (Sundqvist et al. 2010, Assefa and this study); Measurements of dioxins in the Umeå River (Josefsson et al., manuscript in preparation) and
in air in the Baltic region (Sellström et al. 2009), indicating relatively low contribution of riv-erine inputs in comparison to atmospheric deposition;
The relatively low contribution of inputs from wastewater/industrial discharges (Andersson et al. 2012, Fridmanis et al. 2012, Laht and Volkov 2012);
The general lack of observed spatial differences in dioxin concentrations in herring between the coast and open sea within the Bothnian Sea (this study).
iii) What are the main sources of dioxins and other POPs to Baltic air? Air monitoring combined with receptor modelling was not able to pinpoint the sources responsible for dioxins and other POPs in Baltic air, but indicated a dominance of diffuse combustion sources. Emission databases for the Euro-pean region suggest that domestic combustion sources now account for more than one third of total dioxin emissions and this fraction can be as high as 70% in some regions. The main domestic sources of dioxins have been estimated to be heating and cooking with solid fuels and burning of waste. The project did not address question iii for other POPs due to limited resources.

SWEDISH ENVIRONMENTAL PROTECTION AGENCY REPORT 6566 Managing the dioxin problem in the Baltic region with focus on sources to air and fish
11
iv) Are these sources (ii and iii) the result of on-going primary emissions or of recirculation from environmental reservoirs? Seasonal air concentrations of dioxins with peaks during winter months indicate that primary emission sources of dioxins rather than temperature-driven re-volatilisation from soils (sometimes called secondary emissions) control dioxin levels in air. The POPCYCLING-Baltic model simulations also indicate that re-volatilisation from soils is a relatively minor source of dioxins to air. v) Are these sources (ii and iii) mainly national or international? It is not possible to accurately pinpoint the geographical regions which are the dominant sources of dioxin emissions to air in Europe, but it is known, based on monitoring and modelling, that continental Europe and especially Eastern Europe make the largest contribution to atmospheric deposition in most Baltic basins. Swedish sources make only a minor contribution to levels of dioxins in Baltic air. vi) How has the pollution situation changed over time? Emissions of dioxins have declined in recent decades as a result of active abatement policies, and research undertaken in BalticPOPs has shown that this has resulted in long-term declines in concentrations in Baltic sediment and in some herring populations. Bioenergetics modelling undertaken in BalticPOPs has shown that slower growth rates of herring and changes in feeding ecology may be slowing downward temporal trends of dioxin concentrations in herring and potentially counteracting emission reduction measures. vii) Assuming dioxin inputs to the Baltic Sea are reduced – how long will it take until the concen-trations in herring decrease to levels safely below threshold values? More action is needed to reduce the emissions of dioxins to air and thus atmospheric deposition to the Baltic Sea, because levels of dioxins in herring remain above EU threshold values and the general intake of dioxins of the European population is high. It is uncertain if the downward time trend in herring will continue because we do not know the future time trends of emissions/atmospheric deposition as well as future changes in her-ring feeding ecology and growth rates. viii) Are there cost-effective measures that can reduce dioxin levels in Baltic herring below the regulatory thresholds within a relatively short time period? Based on the findings of this project, the main way to decrease concentrations in herring is to reduce atmospheric deposition of dioxins to the Baltic Sea, even if the time response in herring may be slow. Although active abatement policies have reduced dioxin emissions from industry by up to 90%, reduction of dioxin emissions from domestic sources has been much lower, and consequently domestic combustion sources now dominate total estimated emissions in some regions. Policy actions have to provide a means of reducing these diffuse domestic combustion sources of dioxins to the atmosphere. It cannot be guaranteed that policy actions to reduce emissions will result in rapid reduction of dioxin levels in herring to below EU threshold values. Although reductions in dioxin emissions will ultimately reduce levels of dioxins in Baltic sea-water, observed changes in herring ecology (e.g., slowing growth rates and/or feeding ecology) in some herring populations could cause dioxin levels in herring to respond more slowly than seawater to emission reductions. An additional way to decrease herring dioxin concentrations, suggested by Pel-tonen et al. (2007), is to reduce the number of herring individuals through fishing so that feeding con-ditions for the remaining herring are improved. This is a complex ecological issue, and the biological implications and potential success of such a management alternative were not addressed in Bal-ticPOPs. Hence, if considered, this alternative would need to be further investigated in collaboration with fish ecology researchers.

SWEDISH ENVIRONMENTAL PROTECTION AGENCY REPORT 6566 Managing the dioxin problem in the Baltic region with focus on sources to air and fish
12
ix) Clean-up of dioxin-contaminated sediments in coastal regions of the Baltic will have im-portant local benefits such as improvement of water quality and lowering of contamination levels in species which reside mainly in the contaminated regions. These clean-up actions are not likely to have much impact on the levels of dioxins in migratory fish (e.g., herring), which spend most of their time in the open sea and only move into coastal regions to spawn during a few weeks in the spring/summer.

SWEDISH ENVIRONMENTAL PROTECTION AGENCY REPORT 6566 Managing the dioxin problem in the Baltic region with focus on sources to air and fish
13
3 Abbreviations BC black carbon CB chlorobiphenyl. The PCBs are referred to with their IUPAC
numbers, i.e. CB 28, CB 52 etc. dl-PCBs dioxin-like PCBs (the PCBs with no chlorines (non-ortho) or one
chlorine (mono-ortho) in the ortho position, i.e., CBs 77, 81, 126, 169 and 105, 114, 118, 123, 156, 157, 167, 189)
d.w. dry weight EMEP European Monitoring and Evaluation Program (Co-operative
programme for monitoring and evaluation of the long-range transmission of air pollutants in Europe)
EPA Environmental Protection Agency fg femtogram (1 fg = 0.001 pg) HCB hexachlorobenzene HpCDD heptachlorinated dibenzo-p-dioxin HpCDF heptachlorinated dibenzofuran HRGC/HRMS high resolution gas chromatography/high resolution mass spec-
trometry HxCDD hexachlorinated dibenzo-p-dioxin HxCDF hexachlorinated dibenzofuran I-TEF toxic equivalency factors according to NATO/CCMS 1988 I-TEQ toxic equivalents according to I-TEFs Kaer-water aerosol-water distribution ratio Ksed-water sediment-water distribution ratio Kaer-water, OC aerosol-water distribution ratio on an OC basis Ksed-water, OC sediment-water distribution ratio on an OC basis Kow octanol-water partition coefficient LOD limit of detection LOI loss on ignition LOQ limit of quantification l.w. lipid weight mg milligram (1 mg = 0.001 g) MSWI municipal solid waste incineration ng nanogram (1 ng = 0.001 μg) OC organic carbon OCDD octachlorinated dibenzo-p-dioxin OCDF octachlorinated dibenzofuran OM organic matter PAH(s) polycyclic aromatic hydrocarbon(s) PCA principal component analysis PCB(s) polychlorinated biphenyl(s) PCDD(s) polychlorinated dibenzo-p-dioxin(s) PCDD/F(s) polychlorinated dibenzo-p-dioxin(s) and polychlorinated diben-
zofuran(s); commonly known as dioxins PCDF(s) polychlorinated dibenzofurans(s) PCP pentachlorophenol PeCDD pentachlorinated dibenzo-p-dioxin PeCDF pentachlorinated dibenzofuran pg picogram (1 pg = 0.001 ng) PMF positive matrix factorization POM polyoxymethylene (material used for passive sampling) POP(s) persistent organic pollutant(s) PUF polyurethane foam

SWEDISH ENVIRONMENTAL PROTECTION AGENCY REPORT 6566 Managing the dioxin problem in the Baltic region with focus on sources to air and fish
14
PVC polyvinyl chloride SIA stable isotope analysis SPM settling (or suspended) particulate matter TCDD tetrachlorinated dibenzo-p-dioxin TCDF tetrachlorinated dibenzofuran TEF toxic equivalency factor; factor indicating the estimated toxic
potency of an individual DD, DF or dioxin-like compound as compared to 2,3,7,8-TCDD. Note that many different sets of TEFs have been proposed since the 1980s.
TEQ toxic equivalent; concept developed to express the overall toxici-ty of a mixture of dioxins and dioxin-like compounds as a single value. The TEQ value is obtained by adding the product of the concentration or amount and the TEF for each toxic compound.
TOC total organic carbon WHO World Health Organization WHO-TEF toxic equivalency factor according to WHO; two sets issued, in
1998 and 2005 WHO-TEQ toxic equivalents according to one of the WHO-TEF sets w.w. wet weight μg microgram (1 μg = 0.001 mg) ΣPCB7 sum of the PCB congeners 28, 52, 101, 118, 138, 153 and 180 2,3,7,8-chlorinated dioxins the 17 congeners with chlorines at position 2,3,7 and 8 (2,3,7,8-
TCDD, 1,2,3,7,8-PeCDD, 1,2,3,4,7,8-HxCDD, 1,2,3,6,7,8-HxCDD, 1,2,3,7,8,9-HxCDD, 1,2,3,4,6,7,8-HpCDD, OCDD, 2,3,7,8-TCDF, 1,2,3,7,8-PeCDF, 2,3,4,7,8- PeCDF, 1,2,3,4,7,8-HxCDF, 1,2,3,6,7,8-HxCDF, 1,2,3,7,8,9-HxCDF, 2,3,4,6,7,8-HxCDF, 1,2,3,4,6,7,8-HpCDF, 1,2,3,4,7,8,9-HpCDF, OCDF)

SWEDISH ENVIRONMENTAL PROTECTION AGENCY REPORT 6566 Managing the dioxin problem in the Baltic region with focus on sources to air and fish
15
4 Introduction 4.1 Background The Swedish Environmental Protection Agency (Swedish EPA) commissioned a consortium of re-searchers to i) investigate spatial and temporal trends of persistent organic pollutants (POPs) in Baltic biota and ii) trace the sources of these pollutants to the atmosphere. Although the original idea was to investigate a wide range of POPs, it was realised that to successfully reach the aim of the project it would only be possible to focus on a limited subset of POPs. This Swedish EPA project (BalticPOPs) therefore focuses mainly on the polychlorinated dibenzo-p-dioxins (PCDDs) and polychlorinated dibenzofurans (PCDFs; collectively termed PCDD/F or “dioxins”), which are of particular concern in the Baltic region. Additional pollutants are included in some of the project’s components, but the main focus throughout is on dioxins. The BalticPOPs project was undertaken between December 2009 and August 2012 by a research con-sortium consisting of: Karin Wiberg (project coordinator; Swedish University of Agricultural Sciences and previously Umeå University); Kristina L. Sundqvist and Anteneh T. Assefa (Umeå University); Ian T. Cousins, Jana Johansson, Gerard Cornelissen, Michael S. McLachlan, Ulla Sellström, and Anna Sobek (Stockholm University); Aroha Miller, Jenny Hedman and Anders Bignert (Swedish Museum of Natural History); Heikki Peltonen (Finnish Environment Institute, SYKE); Mikko Kiljunen (Uni-versity of Jyväskylä, Finland); Victor Shatalov (Meteorological Synthesizing Centre-East (MSC-East), EMEP, Moscow, Russia); and Ingemar Cato (Geological Survey of Sweden and University of Gothenburg). Eva-Maria Diehl (Umeå University) was the project’s communication officer. The BalticPOPs project follows on from a recent Swedish EPA project (Report 5912), which evaluated the mass flows of dioxins, polychlorinated biphenyls (PCBs) and hexachlorobenzene (HCB) to the Baltic Sea as a whole (Wiberg et al. 2009). The conclusion of this previous work was that atmospheric deposition is the primary external source of these POPs, and that a reduction of atmospheric levels would expedite the decline of POP levels in the water. The current project builds on the results of this previous study, but the scope is directed towards understanding POP levels in Baltic biota and the atmospheric sources of these contaminants. As mentioned previously, there is a strong focus on diox-ins in this project. The aim of the BalticPOPs project was to answer the following questions: i) Why are dioxin levels in fatty fish from the Baltic Sea so high? ii) What are the main sources of the dioxins in Baltic herring? iii) What are the main sources of dioxins and other POPs in Baltic air? iv) Are these sources (ii and iii) the result of on-going primary emissions or of recirculation of
chemical stored in environmental reservoirs? v) Are these sources (ii and iii) mainly national or international? vi) How has the pollution situation changed over time? vii) Assuming dioxin inputs to the Baltic Sea are reduced – how long will it take until the concentra-
tions in herring decrease? viii) Are there cost-effective measures that can reduce dioxin levels in Baltic herring below the regu-
latory thresholds within a relatively short time period? These questions are answered in turn in Chapter 12. It is worth providing some background information to explain why the above listed research questions were considered to be important. Previous research had shown that Baltic Sea fish were considerably
SWEDISH ENVIRONMENTAL PROTECTION AGENCY REPORT 6566 Managing the dioxin problem in the Baltic region with focus on sources to air and fish
16
more contaminated with dioxins compared to nearby seas, and the reasons for this were not fully elu-cidated (Wiberg et al. 2009). The toxic equivalent (TEQ) levels of dioxins in Baltic fatty fish still exceeded the European Union (EU) limits for food and feed, restricting the fish to domestic markets only. It was known that levels of dioxins in herring have generally declined since the 1980s, but levels appeared to have stopped declining and have remained above EU threshold values in the last decade (Wiberg et al. 2009). Prior to the BalticPOPs project, little was known about the spatial variation of dioxins in herring within and between Baltic basins, the short-term seasonal variation in dioxin levels in herring and the temporal trends of dioxins in herring in the last decade. These different pieces of data are vital for properly interpreting the spatial and temporal trends of dioxins in herring and reliably determining whether the pollution situation is improving, or if it is static or even worsening. Previous research pointed towards the dominant importance of the atmosphere as a dioxin source to the Baltic Sea (Armitage et al. 2009, Sundqvist 2009, Sundqvist et al. 2010, Verta et al. 2007, Wiberg et al. 2009). The contribution of coastal sources to the total dioxin inventories in the Baltic Sea was estimated to be small compared to atmospheric deposition (Wiberg et al. 2009). It was hypothesised that highly contaminated sediments mainly occurred in coastal regions near industrialised/urbanised areas (Sundqvist et al. 2009a, Sundqvist et al. 2009b, Verta et al. 2007) and that the pollution problem is largely a local one. Coastal sources were therefore expected to have important local impacts on Baltic biota that remain in close proximity to a contaminated area during their lifetime. EMEP modelling performed prior to the BalticPOPs project suggested a decrease of ~60% in atmos-pheric deposition to the Baltic Sea from 1990 to 2006 (Gusev 2008). Previous modelling work also predicted that the declines in atmospheric deposition would lead to declines in levels of dioxins in the abiotic environment and a similar downward trend in fatty fish such as herring (Armitage et al. 2009, Wiberg et al. 2009). Little was known, however, about the temporal trends of dioxins in the different abiotic components of the Baltic Sea sub-basins and it was previously noted (Armitage et al. 2009, Wiberg et al. 2009) that the rates of declines in the abiotic environment are critical in determining the rates of decline in biota. A further complication is that although there may have been long-term de-clines in abiotic concentrations, including dissolved water concentrations in Baltic sub-basins, the levels in biota may not have followed this trend due to changes in ecological factors (e.g., the observed declining growth rates of herring; Peltonen et al. 2007). Before the BalticPOPs project started, there was good understanding of the bioaccumulation of diox-ins. For example, Peltonen et al. (2007) predicted the dioxin concentrations in herring of various ages from the Bothnian Sea using a bioenergetics accumulation model and obtained very good agreement with measured data on a TEQ-basis. There was thus no need to further improve understanding of these processes. Instead, there was a need for studying how current sources, such as contaminated sediment hotspots and atmospheric emissions, affect levels in fish, and if emission reductions have led to reduc-tions in fish levels. Given that levels of dioxins in fatty fish still exceeded EU threshold values, it was also important to determine the best management strategy to ensure future reductions in fish levels. As already mentioned, previous work demonstrated that atmospheric deposition is the dominant source of dioxins to the Baltic Sea. We knew little, however, about the origin of the dioxins in atmospheric deposition. In our previous work (Sellström et al. 2009, Wiberg et al. 2009), we aimed to identify the compass sectors from which the dioxins in ambient air over the Baltic Sea originated, using air mass back trajectory analysis on measurements undertaken in this region during the winter half of the year (November 2006 to April 2007). Air masses originating from the European continent and the former Soviet Union (the south-southwest, south-southeast and east compass sectors) were shown to represent

SWEDISH ENVIRONMENTAL PROTECTION AGENCY REPORT 6566 Managing the dioxin problem in the Baltic region with focus on sources to air and fish
17
65% of the PCDD contamination and 75% of the PCDF contamination over the Baltic Sea (TEQ-basis; Sellström et al. 2009). Although this earlier work was useful in identifying the main geograph-ical regions in Europe contributing to dioxins in atmospheric deposition over the Baltic Sea, we did not know if current source emission estimates of dioxins in the European region could account for dioxin levels in the air and deposition. If the main source areas and source types could be reliably identified, then it would facilitate effective management to reduce levels of dioxins in Baltic atmos-pheric deposition and thus in Baltic fatty fish.
4.2 Organization of the BalticPOPs project The Baltic Sea pollution problem is linked to a multitude of current and historical activities, and the processes governing POP fate and bioaccumulation are complex. To manage the POP pollution prob-lem, including the dioxin problem which is the focus of this project, a better understanding of the complex interactions of the different processes is required. We therefore implemented a multidiscipli-nary approach, with experts from many research fields. The work was organised into three work pack-ages (WPs):
WP1 - Why are dioxin levels of fatty fish from the Baltic Sea so high?
WP2 - Inventory of atmospheric emission sources for dioxins and other POPs.
WP3 - Synthesis of the results of WP1 and WP2, including other knowledge. These three work packages are briefly summarised below:
WP1: WHY ARE DIOXIN LEVELS OF FATTY FISH FROM THE BALTIC SEA SO HIGH?
Prior to of the BalticPOPs project, we knew the following:
The dioxin levels in Baltic fatty fish were high in relation to levels in nearby seas. Levels of dioxins in herring had remained above the EU threshold values for food and feed despite long-term declines in atmospheric deposition.
A spatial and seasonal variation of dioxin levels in Baltic herring had been observed, but more data were required for a clearer picture of spatiotemporal trends.
The relationships between dioxin levels in Baltic herring and corresponding levels in water could be described using our existing understanding of bioaccumulation and bioenergetics.
The following research questions were unresolved prior to the BalticPOPs project:
Is it possible to describe and interpret the between-basin and within-basin dioxin levels of Bal-tic biota?
Is it possible to describe the seasonal variability in dioxin levels in herring?
How bioavailable are dioxins that reach the sea attached to atmospheric particles?
How has the dioxin contamination in the abiotic Baltic media changed over the last 20 years and how does this relate to the time trends of dioxin levels in emissions, atmospheric levels and herring?
These questions were addressed in four interrelated project tasks (1A-1D):
Task 1A: Understanding the spatial variation of dioxin levels in the Baltic herring
Task 1B: Understanding the seasonal variation and time trends of dioxin levels in Baltic herring
Task 1C: Are dioxins that reach the Baltic Sea via the atmosphere bioavailable?
Task 1D: How has the pollution situation in the Baltic region changed over time?

SWEDISH ENVIRONMENTAL PROTECTION AGENCY REPORT 6566 Managing the dioxin problem in the Baltic region with focus on sources to air and fish
18
The results of these research tasks are reported in chapters 5, 6, 7, 8 and 9.
WP2: INVENTORY OF ATMOSPHERIC EMISSION SOURCES FOR DIOXINS AND OTHER POPs
Prior to the BalticPOPs project, we knew the following:
Atmospheric deposition was estimated to be the most important external source of dioxins and some other POPs to the Baltic Sea.
The following research questions were unresolved prior to the BalticPOPs project:
What are the main emission sources contributing to the atmospheric deposition of dioxins and other POPs to the Baltic Sea?
Do existing dioxin and other POP emission inventories account for all major sources to at-mospheric deposition to the Baltic Sea?
What fraction of the atmospheric deposition of dioxins and other POPs to the Baltic Sea origi-nates from emissions in Sweden?
How important is volatilization of dioxins from soil as a (secondary) source of dioxins to at-mospheric deposition to the Baltic Sea?
These questions were addressed in two interrelated project tasks (2A and 2B):
Task 2A: Atmospheric emission and deposition of dioxins
Task 2B: Tracing atmospheric sources for dioxins and other POPs The results of these research tasks are reported in chapters 10 and 11.
WP3: SYNTHESIS
In WP3, previous and new knowledge gained from WP1 and WP2 was combined and evaluated in a system synthesis. The aim of the work was to employ the multimedia fate and transport model POPCYCLING-Baltic as a knowledge synthesizing tool, building on the work and experience gained in a recent Swedish EPA project (Report 5912; Wiberg et al. 2009). In this previous study, POPCYCLING-Baltic was used to calculate mass balances for dioxins and other selected POPs in sub-basins of the Baltic Sea. A bioaccumulation model was used to predict the concentrations in herring from the output from POPCYCLING-Baltic. Some potential limitations in the models were identified and addressed in the research undertaken in WP1 and WP2. The various research tasks that were ad-dressed as part of the project synthesis in WP3 were as follows:
A literature search for new research results of relevance was conducted. This information was incorporated in the results and discussion of many of the chapters.
POPCYCLING-Baltic was used to determine if volatilization/resuspension is an important source of dioxins to atmospheric deposition to the Baltic Sea.
The information from the review of sediment burial rates in Task 1D was used to check the parameterization of the POPCYCLING-Baltic model.
The predicted concentrations in surface sediment over time were compared with the sediment core data from Task 1D.
It was determined if riverine inputs and land-based industrial inputs of dioxins to the Baltic Sea were underestimated in previous modelling work.
Recommendations were developed for emission reduction strategies.

SWEDISH ENVIRONMENTAL PROTECTION AGENCY REPORT 6566 Managing the dioxin problem in the Baltic region with focus on sources to air and fish
19
A proposed monitoring strategy that can be applied to follow up different emission reduction strategies was developed.
Recommendations were developed, based on the experience in the Baltic Sea, on how envi-ronmental contamination with dioxins and other POPs could be evaluated in an international context.
The results of these synthesis tasks are reported mainly in Chapter 12.

SWEDISH ENVIRONMENTAL PROTECTION AGENCY REPORT 6566 Managing the dioxin problem in the Baltic region with focus on sources to air and fish
20
5 Long-term temporal trends in dioxins and dioxin-like PCBs in herring within the Baltic Sea 5.1 Introduction Levels of dioxins in fatty fish from the Gulf of Bothnia, the two northernmost sub-basins of the Baltic Sea, still occasionally exceed threshold values for human consumption within EU countries. Before the mid-80s, a clear decrease in dioxins was observed both in guillemot eggs and in herring from Äng-skärsklubb in the southern Bothnian Sea. Long-term national monitoring of dioxins within the national monitoring programmes has shown that the decrease of dioxin concentrations in Baltic herring has slowed over the last 20 years, and in guillemot eggs over the last 25 years, in contrast to other organic contaminants that show continuous decreases, e.g., PCBs (Bignert et al. 2011). In the present report, some years of dioxin analyses performed using a simplified method have been excluded and the time-series are not altogether comparable with the time-series reports from the national monitoring. During the last three decades, substantial decreases in herring weight-at-age have occurred in the Bal-tic Sea (Cardinale and Arrhenius 2000, ICES 2011, Persson 2010, Vuorinen et al. 2004). A number of hypotheses have been given to explain this decreasing herring weight-at-age. In particular the crash in cod stocks caused a decrease in predation pressure on herring and sprat (Cardinale and Arrhenius 2000, Casini et al. 2010, Flinkman et al. 1998, Mollmann et al. 2004, Peltonen et al. 2007), resulting in a population explosion of sprat in particular and increased competition for food between and within sprat and herring stocks (Flinkman et al. 1998). This phenomenon has also been attributed to lower salinity due to greater fresh water input in this area affecting for instance zooplankton composition and abundance (Flinkman et al. 1998), and thus herring diet. Periods of high growth are hypothesized to cause a corresponding decrease in dioxin concentrations (w.w.) in fish, and vice versa. This kind of phenomenon is known as growth dilution (Berntssen et al. 2005).
Here, we examine if the observed temporal trends in dioxin concentrations in herring can be attributed to i) fish biological traits, such as length, weight, age, and lipid content; ii) a reduced growth rate of herring, which could have masked the impacts of dioxin mitigation measures; and/or iii) shifts in her-ring diet.
5.2 Methods 5.2.1 Sampling sites and matrices Baltic herring (Clupea harengus) have been collected in a national monitoring program for more than 20 years at four sites along the Swedish coast – Harufjärden in the Bothnian Bay, Ängskärsklubb in the Bothnian Sea, Utlängan in the southern Baltic Proper, and Fladen in the Kattegat (Table 1, Figure 1). All sites are reference sites, with no known local source points; however, several important pa-per/pulp mills are located along the coast close to Gävle, near Ängskärsklubb. Near Harufjärden, there is considerable fresh water input from streams and rivers. All data presented here originate from sam-ples collected in autumn (September-December), unless otherwise stated. The number of herrings sampled has varied over the years. In some years, 7-15 individuals were pooled at each site, while in other years 8-10 individual fish were analysed from each site. Geometric means have been calculated to give a single concentration for each congener in each year for each site.

SWEDISH ENVIRONMENTAL PROTECTION AGENCY REPORT 6566 Managing the dioxin problem in the Baltic region with focus on sources to air and fish
21
Biological measurements were taken from all fish used for analysis – age (determined via scale read-ing), weight, total fish length, and reproductive phase. Fishing date was recorded each year, and lipid content was determined. To minimise between-year variation in dioxin concentrations due to differ-ences in gender and age of the sampled herring, and as sexual maturation occurs anywhere between 2 and 4 years of age depending on site, female herring of 2-5 years of age were selected for analysis as often as possible. At Ängskärsklubb, mean herring age from pooled samples were within this age range in 12 of the 26 years sampled; mean herring age exceeded 5 years in the other years. Poor age determination of herring from this site, in particular in earlier years of sampling, may be partly respon-sible for the overall higher herring age at Ängskärsklubb. At both Harufjärden and Fladen, herring age was always within the 2-5 year range, while at Utlängan, herring age was within the 2-5 year range in 18 of 20 years sampled. To minimise the between-year and spatial variation in concentrations of lipid-soluble contaminants due to differences in the amount of subcutaneous fat, pure muscle tissue without subcutaneous fat was analysed. Dorso-lateral herring muscle tissue of approximately 10 g per specimen or pool was re-moved under strict laboratory protocols, and sent for analysis. Generally, if the skin is included the lipid content increases by a factor of 1.64 compared to pure muscle (Bignert et al. 2005). However, this ratio is not fixed and can vary over time. Within the current research, temporal changes in this fat ratio have not been analysed.
Table 1. Sites, season and years when sampling occurred. For site location, see Figure 1.
Site, location Season Years sampled (Missing years)
Harufjärden, Bothnian Bay Autumn 1990, (1991), 1992-1995, (1996-2000), 2001-2009
Ängskärsklubb, Bothnian Sea Autumn 1979-1987, (1988),1989, (1990), 1991-1993, (1994), 1995-2003, (2004), 2005-2007, (2008), 2009
Utlängan, southern Baltic Proper Autumn 1988, (1989), 1990, (1991), 1992-1995, (1996-2000), 2001-2009
Fladen, Kattegat Autumn 1990, (1991), 1992-1995, (1996-2000), 2001-2009
5.2.2 Dioxin and dl-PCB analytical methods The analyses of dioxins and dl-PCBs were carried out at the Department of Chemistry, Umeå Univer-sity. The extraction method is described by Wiberg et al. (1998), the clean-up method by Danielsson et al. (2005), and the instrumental analysis (high resolution gas chromatography/high resolution mass spectrometry; HRGC/HRMS) by Liljelind et al. (2003). The laboratory is accredited for these anal-yses, participates in the annual FOOD intercalibration rounds, and includes laboratory reference mate-rial (salmon tissue) with each set of samples.

SWEDISH ENVIRONMENTAL PROTECTION AGENCY REPORT 6566 Managing the dioxin problem in the Baltic region with focus on sources to air and fish
22
Figure 1. Map of Scandinavia showing the Baltic Sea and surrounding countries. Red dots indicate the location of the four sites of the national monitoring sampling: From top of map – 1. Harufjärden (Bothnian Bay), 2. Ängskärsklubb (Bothnian Sea), 3. Utlängan (southern Baltic Proper), and 4. Fladen (Kattegat).
5.2.3 Calculation of TEQs TEQs were calculated using the individual congener concentrations and the WHO 2005 TEFs pub-lished by the World Health Organisation (Van den Berg et al. 2006). Unless otherwise stated, TEQ
1. Harufjärden
2. Ängskärsklubb
B h i S
3. Utlängan
southern Baltic
4. Fladen

SWEDISH ENVIRONMENTAL PROTECTION AGENCY REPORT 6566 Managing the dioxin problem in the Baltic region with focus on sources to air and fish
23
values referred to are the sum of the TEQ concentrations for each year i.e., the TEQ values for each individual congener summed.
5.2.4 Statistical treatment of biological variables and contaminant data Data quality control was conducted for all sites. Any values below the limit of quantification (LOQ) were replaced with LOQ divided by the square root of two. Herring from Ängskärsklubb were gener-ally older than at the other three sites. However, age-adjusted log-linear regression values showed a poorer relationship compared to unadjusted log-linear regression values for all of the examined data. Therefore, age-adjusted data were not used in the following analyses. Correlation coefficients between TEQPCDD/F + dl-PCB values and biological variables were calculated and p values reported if <0.05. Time trends in TEQ values on a lipid weight (l.w.) and wet weight (w.w.) basis for each site are shown using scatterplots, with log-linear regression indicating relationships between concentration and time. To assess whether the temporal trends for TEQ or dominant congener (2,3,7,8-TCDD, 1,2,3,7,8-PeCDD, 2,3,7,8-TCDF, 2,3,4,7,8-PeCDF, CB105, CB 118, absolute basis, l.w. only) concentrations were statistically significant at p<0.05, Mann-Kendall trend tests were used (Statistica v10). This is a non-parametric alternative of the Pearson’s correlation coefficient. It is robust against outliers and does not rely on assumptions of the distributions of x and y. Mann-Kendall trend tests were conducted for each site for the entire time series.
5.2.5 Stable isotope analysis to investigate potential shifts in herring diet Muscle samples, i.e., no skin or subcutaneous fat included, were taken from the same individuals/ pooled herring samples that were analysed each year for dioxins. Stable isotope analysis (SIA) was performed at the University of Jyväskylä, Finland, using a Carlo Erba Flash EA1112 elemental ana-lyser connected to a mass spectrometer (CF-IRMS), via methods outlined in Kiljunen et al. (2006). All samples were freeze-dried to a constant weight and ground to a fine powder before analysis. The inter-national standards of Vienna Pee Dee belemnite (for carbon) and atmospheric N2 (for nitrogen) were used as reference materials, and dried pike muscle was used as an internal working standard. Results are expressed using the δ notation as parts per thousand (‰) difference from the international stand-ards. Lipid normalisation was carried out for the δ13C values using calculations presented in Kiljunen et al. (2006), as lipids are known to be 13C depleted relative to other major tissues (Bodin et al. 2007, Ehrich et al. 2011). No baseline data were available for comparison. Baseline data refers to stable isotope ratios for the basal resources within a food web e.g., planktonic or benthic primary consumers, which can vary over time (Solomon et al. 2008) and thus affect the stable isotope ratios of organisms feeding at higher trophic levels within the same food web. These results should therefore be interpret-ed with caution.
5.2.6 Modelling to investigate the impacts of decreased herring growth rates Modelling of the feeding rates and the associated bioaccumulation of persistent pollutants was applied to explore the hypothesis that the reduced growth rate of herring (e.g., ICES, 2011) has masked the impacts of dioxin mitigation measures. The bioenergetics bioaccumulation model is a modified ver-sion (Peltonen et al. 2007) of the Hanson et al. (1997) model, which has previously been evaluated for Baltic Sea herring (Kiljunen et al. 2007, Peltonen et al. 2007). The mode parameter set for the Baltic herring was from Rudstam (1988) using modifications described by Peltonen et al. (2007). Data on dynamic shifts in weight-at-age of the Baltic Proper and the Bothnian Sea herring were from the mate-rial which national fisheries agencies collect from the commercial herring catches and the Baltic Sea

SWEDISH ENVIRONMENTAL PROTECTION AGENCY REPORT 6566 Managing the dioxin problem in the Baltic region with focus on sources to air and fish
24
Fishery Assessment Working Group annually compiles (ICES 2011). The data on temperature regime was from the oceanographic database of the ICES.
5.3 Results and discussion The temporal data series begin in different years for the different sites. At Ängskärsklubb, retrospec-tive analyses were carried out on freeze-stored fish from 1979 and onwards; at Fladen and Harufjärden, data collection began in 1990; and at Utlängan, in 1988 (Table 1). All temporal series for all sites are presented until 2009. Gaps are present between 1996 and 2000 for Fladen, Harufjärden and Utlängan due to the fact that a simplified, non-congener specific analytical method was used dur-ing these years. All results are presented on a l.w. basis, unless otherwise stated.
5.3.1 Biological variables Herring age ranged from 2 to 3 years at Fladen, 3 to 4 years at Harufjärden, 3 to 7 years at Utlängan, and 3 to 9 years at Ängskärsklubb. Herring age increased significantly over time at Harufjärden (n=20, d.f.=18, p<0.05) and decreased significantly over time at Fladen (n=20, d.f.=18, p<0.05). Fish length across all four sites ranged from 14.2 to 22.9 cm and fish weight across all four sites ranged from 20.8 to 91.9 g. Herring from Fladen were the largest, and herring from Harufjärden the smallest. Lipid con-tent decreased significantly over time at both Harufjärden and Utlängan (n=20, d.f.=18, p<0.05; n=21, d.f.=19, p<0.05, respectively), whereas at Fladen a significant increase was seen over time (n=20, d.f.=18, p<0.05). To explore the relationship between each biological variable and the TEQPCDD/F + dl-PCB values at each site, log-linear regression analyses were conducted (Table 2). For the whole time series, the strongest overall relationship was seen between lipid content and TEQPCDD/F + dl-PCB value at Fladen. This was a significant negative relationship. At the other three sites, age showed the strongest relationship (all positive, although only significant at Harufjärden and Ängskärsklubb). However, most of the relation-ships between any one biological variable and TEQPCDD/F + dl-PCB values were non-significant (Table 2).
5.3.2 Congener patterns The congener patterns for PCDDs, PCDFs and dl-PCBs are similar between each site. The two most dominant PCDD congeners are 2,3,7,8-TCDD and 1,2,3,7,8-PeCDD for the majority of the time se-ries, both on a TEQ and an absolute concentration basis. For the PCDFs, 2,3,7,8-TCDF and 2,3,4,7,8-PeCDF are the dominant congeners for all sites on an absolute concentration basis, whereas on a TEQ basis, 2,3,4,7,8-PeCDF is dominant. For the dl-PCBs, CB105 and CB118 are the dominant congeners at all sites on an absolute concentration basis. However, CB126 is the dominant congener on a TEQ basis

SWEDISH ENVIRONMENTAL PROTECTION AGENCY REPORT 6566 Managing the dioxin problem in the Baltic region with focus on sources to air and fish
25
Table 2. Regression (log-linear) value (r2) for each biological variable and for fishing date, with the summed TEQPCDD/F+dl-PCB concentration for each site. Significant correlations are indicated by * (p<0.05).
n (years) Fat % Weight Length Fishing date Reproductive phase1 Age
Harufjärden 18 0.05 0.09 0.36* 0.09 0.02 0.55*
Ängskärsklubb 26 0.01 0.06 0.05 0.05 0.10 0.20* 0.53*,2
Utlängan 18 0.25* 0.17* 0.27* 0.03 0.04 0.29
Fladen 18 0.47* 0.12 0.10 0.05 0.03 0.03 1Herring reproductive phase is equivalent to no detectable development (1), developing reproductive follicle (2), mature reproductive follicle (3), post-spawning reproductive follicle (4), and resorbing reproductive follicle (5) (Elston et al. 1997). Herring reproductive phase varied between sites. 2Log-linear regression for the first 10 years (1979 - 1988) of age data at Ängskärsklubb.
Over time, a general decrease is seen for TEQPCDD, TEQPCDF and TEQdl-PCB. This trend is seen most clearly at Ängskärsklubb, most likely because this station has been monitored longer (since the late 1970s). In almost every year at every site, PCDDs contributed the least to total TEQ. In some years and sites TEQPCDD contribute less than 20% to total TEQ. TEQPCDF make up the greatest relative con-tribution of dioxins at Ängskärsklubb since 1996, while pre-1996, TEQdl-PCB dominated. At Harufjärden, TEQPCDF and TEQdl-PCB alternate in dominating contribution from 2001 onwards. TE-Qdl-PCB contributed the most in every year at Utlängan and Fladen, often between 40 and 60% of total toxicity. Over time, congener patterns in herring were similar at each site, indicating similar exposure sources. Certain congeners dominating over others can be due to a number of reasons, and may include source strength, differences in mobility and elimination rates for different congeners (Aberg et al. 2010, Asse-fa et al. 2011, Muir and Yarechewski 1988), distance from source points (Parmanne et al. 2006), dif-ferences in exposure and/or bioaccumulation of different congeners, related to differences in herring diet between areas (Kiviranta et al. 2003).
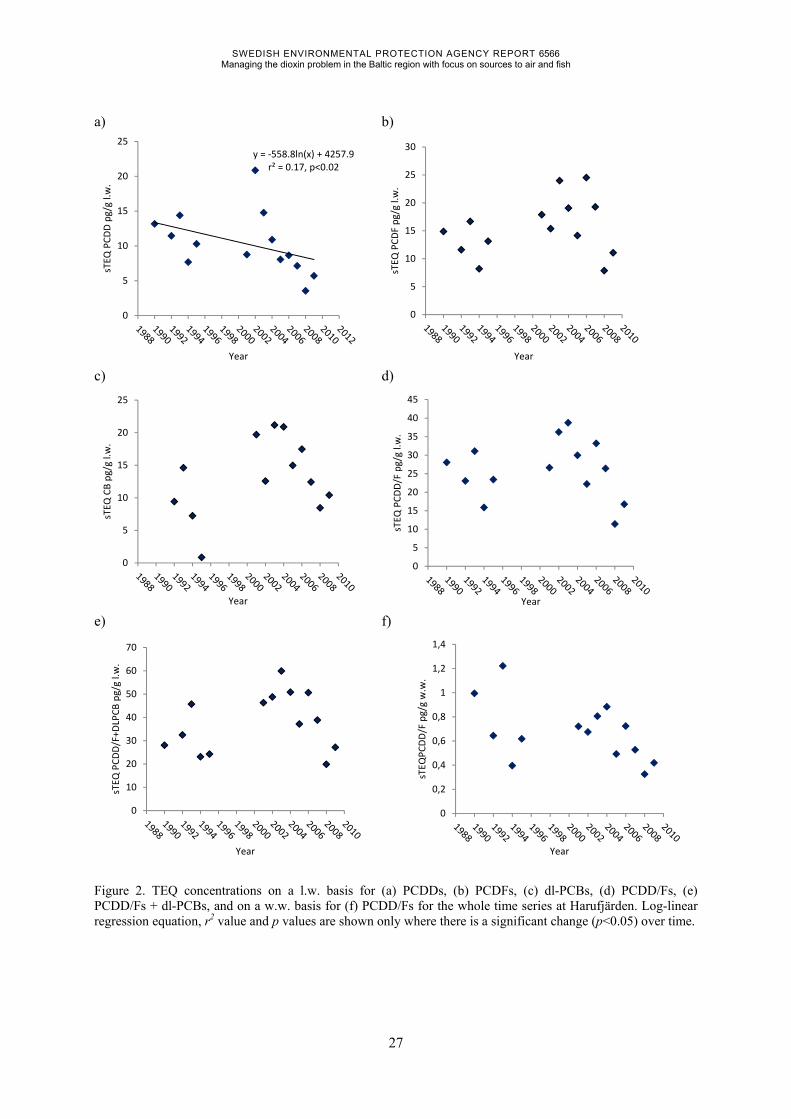
5.3.3 Temporal trends in total TEQ and in dominant congener concentrations Below, graphs showing temporal trends in TEQ values are presented on a l.w. basis. For comparison, graphs for TEQPCDD/F values are also presented on a w.w. basis for each site. Temporal trends of domi-nant congeners are not presented in figures. At Harufjärden, only 2,3,7,8-TCDD and TEQPCDD showed a significant decreasing trend over time (Figure 2a, l.w.). The other dominant congeners (absolute concentration) and TEQ concentrations did not show any significant trends (Figure 2b-e, l.w.). Similarly, on a wet weight basis TEQPCDD was the only TEQ value to show any significant trend, while TEQPCDD/F did not show any significant trend (Figure 2f). Over time, herring age increased significantly and lipid content decreased significantly at this site. These are two biological parameters that would have a strong influence on dioxin concentra-tions in herring. At Ängskärsklubb, all six dominant congeners (2,3,7,8-TCDD, 1,2,3,7,8-PeCDD, 2,3,7,8-TCDF, 2,3,4,7,8-PeCDF, CB105, CB118; absolute concentration, l.w.) showed significant decreases when the whole time series was examined. A significant decrease over the whole time series was also observed for all TEQ values, both on a l.w. and w.w. basis (Figure 3a-f). None of the biological parameters

SWEDISH ENVIRONMENTAL PROTECTION AGENCY REPORT 6566 Managing the dioxin problem in the Baltic region with focus on sources to air and fish
26
measured from herring at this site showed any change over time. Dioxin concentrations are slightly elevated at this site compared to the other sites, which is probably connected to the higher herring age observed at this site, among other factors. At Utlängan, only two dominant congeners showed significant decreases over time - 2,3,7,8-TCDD and 1,2,3,7,8-PeCDD. However, TEQPCDD, TEQdl-PCB and TEQPCDD/F+dl-PCB all showed significant de-creases over time (4a, c, e; l.w.) while TEQPCDF, and the TEQPCDD/F on a l.w. or w.w. basis did not (Figure 4b, d, f). A particularly high concentration was measured in 1988 for PCDDs and PCDFs (Figure 4a, b, d, f); however, examination of the data with this value removed did not change the out-come of the regression. CB105 was close to a significant decrease (p=0.051). The significant decrease seen for TEQdl-PCB was largely caused by significant decreases in the non-dominant congeners. At Fladen, as at Ängskärsklubb, all dominant congeners showed significant decreases in concentration (l.w.) over the whole time series. This was also the case for TEQPCDD, TEQPCDF, TEQPCDD/F and TE-Qdl-PCB (Figure 5a-d), whereas TEQPCDD/F + dl-PCB (Figure 5e) did not show a significant decreasing trend. This lack of significant trend is most likely because dl-PCBs were not analysed in 1990 at this site, and therefore, the summed TEQ value for this year is low. By contrast, no TEQ values showed any significant changes over time on a wet weight basis (TEQPCDD/F, Figure 5f). Since dioxins partition to lipids in fish and the lipid content of herring at Fladen increased significantly over time, it is not surprising that the dioxin concentrations on a w.w. basis did not decrease over time at this site. Overall, PCDDs showed significant decreases at all sites (both l.w. and w.w., except for w.w. in Fladen). PCDFs and dl-PCBs showed significant decreases at Ängskärsklubb, Utlängan and Fladen. However, some of these decreases were only seen on a l.w. or on a w.w. basis, not both. Consistency in the decreases is generally lacking, with some TEQ values decreasing at all sites (TEQPCDD) and others decreasing at only some sites, and varying depending on whether they are on l.w. or w.w. basis. Dioxin concentrations are not showing such large decreases in recent years as they were at the begin-ning of the monitoring period. Changes in biological parameters, such as age, lipid content, and slower growth rate (see section 5.3.5), are playing a role in the lack of decreases, and where decreases have slowed in recent years.
Absolute concentrations (l.w.) of PCDD/Fs, dl-PCBs, and all TEQ concentrations at Ängskärsklubb were considerably higher than at the other three sites, especially in the earlier years of monitoring. In more recent years, e.g., 2005 and later, dioxin concentrations at Ängskärsklubb have become more in line with concentrations observed in herring at Harufjärden and Utlängan, although continue to be higher than concentrations observed in herring from Fladen. A number of reasons, for instance higher average herring age and emissions from local industry, probably contributed to the high dioxin con-centrations seen in herring at Ängskärsklubb in the early years of monitoring, while emission reduc-tions undoubtedly contributed to the observed concentration decreases. Several important paper/pulp mills are located along the coast in this area (close to Gävle). Therefore, the higher dioxin concentra-tions in herring observed at Ängskärsklubb may be partially explained by local environmental impacts caused by industrial usage and discharge at the coast near Ängskärsklubb (Gävle) compared to the other three sites. However, the higher age of herring from this site, in particular in the earlier years of monitoring (Bignert et al. 2011; this report), may also be a reason. Increasing lipid content in herring in the last 6 – 7 years at Fladen, younger age of herring, and overall efforts to reduce dioxin emissions seem to be the most likely explanations for the decreases seen here on a l.w. basis. The lack of de-creases seen on a w.w. basis is probably due to changes in lipid content over time.
SWEDISH ENVIRONMENTAL PROTECTION AGENCY REPORT 6566 Managing the dioxin problem in the Baltic region with focus on sources to air and fish
27
a) b)
c) d)
e) f)
Figure 2. TEQ concentrations on a l.w. basis for (a) PCDDs, (b) PCDFs, (c) dl-PCBs, (d) PCDD/Fs, (e) PCDD/Fs + dl-PCBs, and on a w.w. basis for (f) PCDD/Fs for the whole time series at Harufjärden. Log-linear regression equation, r2 value and p values are shown only where there is a significant change (p<0.05) over time.
y = -558.8ln(x) + 4257.9r² = 0.17, p<0.02
0
5
10
15
20
25
sTEQ
PC
DD
pg/
g l.w
.
Year
0
5
10
15
20
25
30
sTEQ
PC
DF
pg/
g l.w
.
Year
0
5
10
15
20
25
sTEQ
CB
pg/
g l.w
.
Year
0
5
10
15
20
25
30
35
40
45sT
EQ P
CD
D/F
pg/
g l.w
.
Year
0
10
20
30
40
50
60
70
sTEQ
PC
DD
/F+D
LPC
B p
g/g
l.w.
Year
0
0,2
0,4
0,6
0,8
1
1,2
1,4
sTEQ
PC
DD
/F p
g/g
w.w
.
Year

SWEDISH ENVIRONMENTAL PROTECTION AGENCY REPORT 6566 Managing the dioxin problem in the Baltic region with focus on sources to air and fish
28
a) b)
c) d)
e) f)
Figure 3. TEQ concentrations on a l.w. basis for (a) PCDDs, (b) PCDFs, (c) dl-PCBs, (d) PCDD/Fs, (e) PCDD/Fs + dl-PCBs, and on a w.w. basis for (f) PCDD/Fs for the whole time series at Ängskärsklubb. Log-linear regression equation, r2 and p values are shown only when there is a significant change (p<0.05) over time.
y = 5E+75e-0.086x
r² = 0.76, p<0.01
0
10
20
30
40
50
60
70
80
90
100
sTEQ
PC
DD
pg
g-1l.w
.
Year
y = 7E+42e-0.048x
r² = 0.54, p<0.01
0
10
20
30
40
50
60
70
80
sTEQ
PC
DF
pg
g-1l.w
.
Year
y = 1E+48e-0.054x
r² = 0.69, p<0.01
0
10
20
30
40
50
60
70
80
90
sTEQ
DL
PC
B p
g g-1
l.w.
Year
y = 2E+58e-0.065x
r² = 0.68, p<0.01
0
20
40
60
80
100
120
140
160sT
EQ P
CD
D/F
pg
g-1l.w
.
Year
y = 3E+54e-0.061x
r² = 0.69, p<0.01
0
50
100
150
200
250
sTEQ
PC
DD
/F +
DL
PC
B p
g g-1
l.w.
Year
y = 1E+59e-0.068x
r² = 0.69, p>0.001
0
1
2
3
4
5
6
sTEQ
PC
DD
/F p
g g-1
w.w
.
Year

SWEDISH ENVIRONMENTAL PROTECTION AGENCY REPORT 6566 Managing the dioxin problem in the Baltic region with focus on sources to air and fish
29
a) b)
c) d)
e) f)
Figure 4. TEQ concentrations on a l.w. basis for (a) PCDDs, (b) PCDFs, (c) dl-PCBs, (d) PCDD/Fs, (e) PCDD/Fs + dl-PCBs, and on a w.w. basis for (f) PCDD/Fs for the whole time series at Utlängan. Log-linear regression equation, r2 and p value are shown only where there is a significant change over time.
y = 6E+23e-0.026x
r² = 0.27, p<0.05
0
5
10
15
20
25
sTEQ
PC
DD
pg/
g l.w
.
Year
0
5
10
15
20
25
30
35
sTEQ
PC
DF
pg/
g l.w
.
Year
y = 9E+40e-0.046x
r² = 0.64, p<0.01
0
5
10
15
20
25
30
35
40
45
50
sTEQ
CB
pg/
g l.w
.
Year
0
10
20
30
40
50
60
sTEQ
PC
DD
/F p
g/ g
l.w
.
Year
y = 7E+19e-0.021x
r² = 0.17, p<0.02
0
10
20
30
40
50
60
70
80
90
sTEQ
PC
DD
/F+D
LPC
B p
g/g
l.w.
Year
y = 2E+54e-0.063x
r² = 0.47, p<0.01
0
1
2
3
4
5
6
sTEQ
PC
DD
/F p
g/g
w.w
.
Year

SWEDISH ENVIRONMENTAL PROTECTION AGENCY REPORT 6566 Managing the dioxin problem in the Baltic region with focus on sources to air and fish
30
a) b)
c) d)
e) f)
Figure 5. TEQ concentrations on a l.w. basis for (a) PCDDs, (b) PCDFs, (c) dl-PCB, (d) PCDD/Fs, (e) PCDD/Fs + dl-PCBs, and on a w.w. basis for (f) PCDD/Fs for the whole time series at Fladen. Log-linear regression equa-tion, r2 and p values are shown only where there is a significant change over time.
y = 3E+25e-0.029x
r² = 0.23, p<0.04
0
1
2
3
4
5
6
7
8
sTEQ
PC
DD
pg/
g l.w
.
Year
y = 1E+19e-0.021x
r² = 0.35, p<0.02
0
1
2
3
4
5
6
sTEQ
PC
DF
pg/
g l.w
.
Year
y = 2E+38e-0.043x
r² = 0.35, p<0.03
0
2
4
6
8
10
12
14
16
sTEQ
CB
pg/
g l.w
.
Year
y = 1E+22e-0.024x
r² = 0.29, p<0.01
0
2
4
6
8
10
12
14sT
EQ P
CD
D/F
pg/
g l.w
.
Year
0
5
10
15
20
25
30
sTEQ
PC
DD
/F+D
LPC
B p
g/g
l.w.
Year
0
0,1
0,2
0,3
0,4
0,5
sTEQ
PC
DD
/F p
g/g
w.w
.
Year

SWEDISH ENVIRONMENTAL PROTECTION AGENCY REPORT 6566 Managing the dioxin problem in the Baltic region with focus on sources to air and fish
31
Decreases in PCDDs, but not PCDFs, at Harufjärden and Utlängan (l.w. basis only) or dl-PCBs at Harufjärden, may be related to source strength, reduced exposure, changes in diet over time that would impact on lipid content, increasing herring age over time at Harufjärden, and varying environmental factors over time e.g., salinity and net water turnover time. Elimination rates are not examined here, but as dioxins are very stable chemicals (OSPAR 2007) with slow rates of degradation (HELCOM 2004), this is unlikely to be a primary mechanism driving concentration decreases.
5.3.4 Potential shifts in herring diet at Ängskärsklubb Stable isotope analysis is used to examine diet: where the energy is sourced from, in this context, ma-rine, brackish, freshwater, or terrestrial; and at what level in the trophic web an organism is feeding. Stable isotope data was analysed to investigate if there has been a shift in the Baltic Sea herring diet that could possibly explain the observed temporal decline in dioxin levels. Stable isotope data for both spring- and autumn-caught herring from Ängskärsklubb were examined. Stable isotope data from spring-caught herring were available for 1991-2004, while data from autumn-caught herring were available for 1979-2007. Ängskärsklubb temporal data analysed for dioxins and dl-PCBs presented above are from autumn-caught herring. The δ13C values for both spring and autumn data indicate that all energy sources are Baltic, meaning that they are neither fully marine nor of a fully fresh-water origin. The δ15N for the spring-caught her-ring increased by approximately 1.5‰ over the examined period, whereas an increase of almost 3‰ was observed for the autumn-caught herring. Fractionation of 3.2‰ is generally accepted as a change in trophic feeding level (Michener and Schell 1994). Therefore, autumn-caught herring appear to have shifted upward by close to one trophic level over time, a change that was observed from the mid-late 1980s, continuing until the most recent data reported. However, these results must be interpreted with caution, and cannot be considered definitive until baseline data on the isotopic composition of zoo-plankton over time are made available. An upward shift in diet means that the dominant food source for the autumn-caught herring sampled at Ängskärsklubb has changed, from being e.g., predominantly zooplankton to e.g., predominantly my-sids. As stomach content analysis was not carried out on these particular herring, it cannot be said that this is the exact shift that has occurred, but it is possible based on literature published on herring diet (Arrhenius and Hansson 1993, Casini et al. 2004, Flinkman et al. 1992, Mollmann et al. 2004, Par-manne et al. 2006). There are various hypotheses to explain such a shift in diet, however, reasons driving a shift in herring diet will not be discussed in detail here as they are outside the scope of this research. However, increased inter-specific competition with sprat for food resources following release from predator (cod) pressure when the cod fishery collapsed is one likely driver of a change in herring diet. At higher levels in the trophic food web, dioxin concentrations become higher because of bioaccumu-lation and biomagnification, and since many dioxins are very persistent chemicals (HELCOM 2004, OSPAR 2007). Therefore, an upward shift in trophic feeding level of the herring would result in a greater dioxin concentration caused by biomagnification. As dioxin emissions have decreased over time, an increase in trophic level in herring diet might rather be observed as a stabilisation of dioxin concentrations. Results here showed that this upward shift in trophic level occurred over a number of years, but the largest change occurred between the late 1980s, and the late 1990s/early 2000s. Such a shift occurring over this period could explain the smaller reductions in dioxin concentrations in herring observed from Ängskärsklubb over the same period (Bignert et al. 2011) as compared to earlier in the
SWEDISH ENVIRONMENTAL PROTECTION AGENCY REPORT 6566 Managing the dioxin problem in the Baltic region with focus on sources to air and fish
32
monitoring data. The shift also coincides with the timing of the crash in cod stocks in the Baltic Sea (Flinkman et al. 1998, Mollmann et al. 2004).
5.3.5 Impact of decreased growth rates on concentrations To investigate the impact of growth rate on dioxin concentrations, bioenergetics modelling was con-ducted using Baltic herring growth rate data (5.2.6). The results of the modelling (where all factors except growth rates were constant) indicated that herring growth rate has a major influence on herring dioxin concentrations both in the Bothnian Sea and in the Baltic Proper. In the Bothnian Sea, the diox-in concentrations on a w.w. basis were about 60% higher in 2005 than they would have been in case the growth rate had not decreased but stayed at the higher level seen in 1990. This percentage was derived using a covariance analysis (Figure 6). In the Baltic Proper, the modelling indicated that the concentrations were about 130% higher in 2005 compared to what they would have been if growth rate had remained stable since 1990. Thus, these results clearly suggest that decreased herring growth rate strongly counteracted the decreasing dioxin concentrations in the environment and contributed to the observed slow decline in herring dioxin concentrations. To better understand the bioaccumulation processes in the different basins of the Baltic Sea, factors affecting the bioenergetics of herring should be further investigated. For instance, shifts in diet over time are likely to influence concentration espe-cially in large herring. A large fraction of large food items and a smaller fraction of zooplankton can contribute to elevated concentrations in herring. Even shifts in species composition in zooplankton can influence dioxin concentrations in herring over time. Shifts in food web structure and available food items can be caused by for instance climate and other environmental changes, but also by fishery. Although differences in dioxin concentrations between basins were not a focus of the bioenergetics modelling, there are some factors highlighted within the current project that stand out as potentially having an influence on this issue. Different basins in the Baltic are subject to differences in salinity and temperature. Shifts in these factors may increase energetic costs in maintenance metabolism, thereby reducing energy that can be spent on growth. In turn, this would contribute to lower growth rates, and a lack of decreases in dioxin concentrations. Bioenergetics modelling carried out within this project indicated that a slower growth rate in the north of the Baltic Sea was likely a major factor im-pacting dioxin concentrations in herring over time, but it could also cause spatial differences. Another factor that may cause spatial differences in dioxin levels is the diet of the herring; for instance, the zooplankton composition and the trophic level can differ between basins. The diet is linked to the lipid content. As has been observed in the current study, lipid content in herring varies between basins, with lower lipid content seen further north. As already discussed, lipid content is a factor that influences dioxin concentrations. Therefore, differences in physical conditions between basins, coupled with herring biology, are likely to contribute to the variation in dioxin concentrations observed between basins of the Baltic Sea.

SWEDISH ENVIRONMENTAL PROTECTION AGENCY REPORT 6566 Managing the dioxin problem in the Baltic region with focus on sources to air and fish
33
Figure 6. Model-based estimates of the impact of decreased growth rate between 1990 and 2005 on PCDD/F concentrations (sum of the 2,3,7,8-TCDD, 1,2,3,7,8-PeCDD and 2,3,4,7,8-PeCDF concentrations in w.w.) in herring in the Baltic Proper (upper graph) and Bothnian Sea (lower graph). The concentrations were estimated with the growth rates of 1990 and 2005. All other factors were held constant. The intersections of the dashed line with the curves indicate the difference in concentrations of a 30 g fish in case the growth rate had in 2005 been as high as in 1990. The points along the curves represent fish of ages 1 to 9 years.
5.4 Conclusions At Harufjärden, significant decreases were only observed for 2,3,7,8-TCDD (l.w.) and
TEQPCDD (l.w. and w.w.), whereas no significant trends were observed for any other dominant congener (l.w.) or TEQ values (l.w. or w.w.). Over time, herring from Harufjärden showed a significant increase in age and a significant decrease in lipid content, but no change in length or weight. These biological changes indicate that a slower growth rate and decreased lipid content are masking other decreases in dioxins. The lack of significant decreases in PCDFs and dl-PCBs at this site are supported by the findings of the growth rate modelling. However, it is uncertain why PCDDs decrease significantly, while PCDFs and dl-PCBs do not, and may be related to changes in dioxin input from different sources.
0
1
2
3
4
5
6
7
8
9
0 20 40 60 80
Con
cent
rati
on (p
g/g
)
Weight (g)
Year 1990 growth
Year 2005 growth
0
1
2
3
4
5
6
7
8
9
0 20 40 60 80
Co
nce
ntra
tio
n (p
g/g
)
Weight (g)
Year 1990 growth
Year 2005 growth

SWEDISH ENVIRONMENTAL PROTECTION AGENCY REPORT 6566 Managing the dioxin problem in the Baltic region with focus on sources to air and fish
34
At Ängskärsklubb, all six dominant PCDD/F and dl-PCB congeners (l.w.) and TEQ values (l.w. and w.w.) showed significant decreases over time. These decreases can be related to the relatively long time series at this site, and probably to reduced emissions over time. No biolog-ical parameters showed any change over time in herring from this site. However, herring age at this site continues to be slightly higher than herring from other sites, which may explain the slightly elevated dioxin concentrations here.
At Utlängan only two dominant congeners showed significant decreases over time (l.w.), but significant decreases were observed for TEQPCDD, TEQdl-PCB and TEQPCDD/F+dl-PCB values on a l.w. basis, and for all TEQ values on a w.w. basis. A significant decrease in lipid content over time was observed here, which is most likely due to changes in diet. On a l.w. basis, leaner fish would indicate dioxin concentrations are higher than they would be otherwise. Therefore, even though significant decreases are seen at this site, changes in herring ecology could drive further decreases in concentrations.
At Fladen, all six dominant PCDD/F and dl-PCB congeners and all TEQ values except TEQPCDD/F + dl-PCB showed statistically significant decreases in concentrations on a l.w. basis; however, no significant trends were seen in TEQ values on a w.w. basis. The significant de-crease in age and increase in lipid content observed in herring from this site would explain the significant decreases seen on a l.w. basis, and the changing lipid content over time would in-crease variation and result in a lack of significant decreases.
PCDDs decreased significantly at Harufjärden, Ängskärsklubb and Utlängan on both a lipid and wet weight basis, but only on a lipid weight basis at Fladen. Some decreases in PCDFs were also seen, but not at all sites. Biological parameters are exerting a strong influence on observed concentrations, and, in the Bothnian Bay in particular, a decrease in lipid content and an increase in age are masking dioxin changes.
Bioenergetics modelling indicates that decreased herring growth rate counteracted the decreas-ing dioxin concentrations in the environment, and contributed to the observed slower decline in dioxin levels in herring. Slower growth rates of herring in the Baltic Sea were shown to strongly affect downward temporal trends of dioxin concentrations in herring, and could po-tentially counteract emission reduction measures.
Stable isotope analysis was used to investigate if there has been a temporal shift in herring diet at Ängskärsklubb over the last few decades, which could potentially impact on temporal trends of POP concentrations in herring. SIA data indicates that the Bothnian Sea herring have gradually shifted up one trophic level from where they fed in the past. However, a lack of baseline SIA data means these results are not yet verified and should be interpreted with cau-tion. The bioenergetics modelling confirms that shifts in diet could counteract emission reduc-tions.
Although it is positive that PCDD concentrations have declined over the long-term in herring, there are some causes for concern, namely: i) the slower growth rates and dietary shifts caus-ing herring to feed at higher trophic levels can counteract emission reductions and potentially cause concentrations to stabilise at concentrations above the EU thresholds, and ii) PCDF and dl-PCB concentrations in herring, while decreasing at some sites, do not appear to be declin-ing as markedly as PCDDs at other sites.
SWEDISH ENVIRONMENTAL PROTECTION AGENCY REPORT 6566 Managing the dioxin problem in the Baltic region with focus on sources to air and fish
35
6 Seasonal variation in dioxins in her-ring from the Bothnian Sea 6.1 Introduction Previous research has shown evidence for seasonal variation in dioxin concentrations in Baltic herring (Bignert et al. 2009a, Bignert et al. 2009b) and other POPs in fish species at other locations (e.g., Larsson et al. 1993, Stapleton et al. 2002). Seasonal variation in dioxin concentrations could be im-portant in regards to the timing of herring sampling for monitoring of dioxins used for setting envi-ronmental target levels and safe food consumption levels. A number of biological and ecological pa-rameters can influence dioxin concentration in herring e.g., lipid content of sampled individuals, di-et/trophic feeding level, spawning, fishing date, age and habitat (Larsson et al. 1993), and thus should be considered when investigating dioxin concentrations in herring. Here, we investigate whether annual variations in dioxin concentrations in Baltic herring (Clupea harengus) are i) due to seasonal changes in dioxin concentrations, and ii) if so, are they related to bio-logical parameters.
6.2 Methods Herring was caught between November 2005 and October 2006 at two sites, one in the northern and one in the southern Bothnian Sea (11 months sampled in southern Bothnian Sea, 9 months sampled in the northern Bothnian Sea; Bignert et al. 2009b; Figure 7). Herring size was representative of that usually taken for human consumption – approximately 20 cm length, corresponding to an age of be-tween 5 and 10 years. A total of 15 individual herring were collected at each site on each sampling occasion. Biological measurements were taken, but age and sex were not determined. Muscle tissue from each individual fish was sampled by removing skin and subcutaneous fat and sampling the dorso-lateral muscle. Muscle was then pooled for each group of 15 individuals. Pooled muscle sam-ples were sent to the Department of Chemistry, Umeå University, for analysis of PCDD/Fs (see sec-tion 5.2.2). Results for seasonal data are presented in pg g-1 l.w., and also on a w.w. basis where specified. TEQ concentrations were calculated using WHO 2005 TEF values, and congeners were summed for each site and month within the PCDD and PCDF group to give total TEQPCDD, TEQPCDF, and TEQPCDD/F concentrations. Simple regression analysis and correlation coefficients were run on lipid content and TEQPCDD/F. Principal component analyses (PCA) were used to investigate patterns in PCDDs, PCDFs and PCDD/Fs at each site over the sampled time period using PIA Plot and Image Analysis (Bignert et al. 2007).
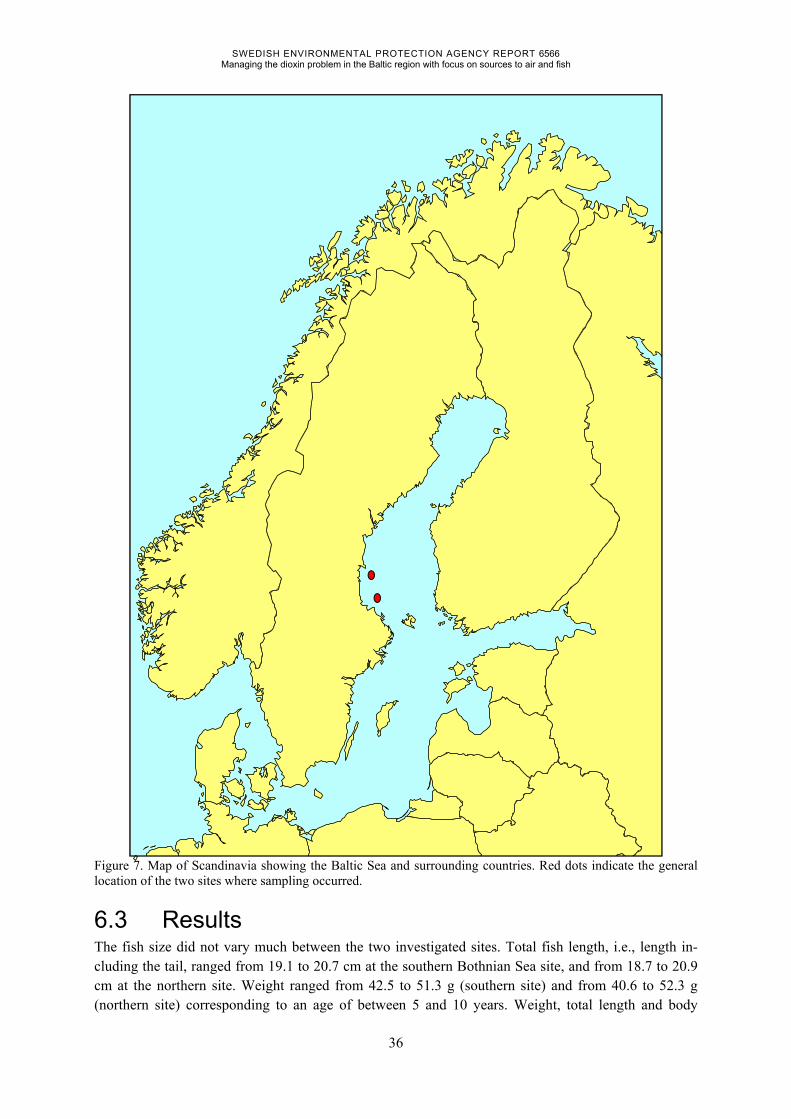
SWEDISH ENVIRONMENTAL PROTECTION AGENCY REPORT 6566 Managing the dioxin problem in the Baltic region with focus on sources to air and fish
36
Figure 7. Map of Scandinavia showing the Baltic Sea and surrounding countries. Red dots indicate the general location of the two sites where sampling occurred.
6.3 Results The fish size did not vary much between the two investigated sites. Total fish length, i.e., length in-cluding the tail, ranged from 19.1 to 20.7 cm at the southern Bothnian Sea site, and from 18.7 to 20.9 cm at the northern site. Weight ranged from 42.5 to 51.3 g (southern site) and from 40.6 to 52.3 g (northern site) corresponding to an age of between 5 and 10 years. Weight, total length and body

SWEDISH ENVIRONMENTAL PROTECTION AGENCY REPORT 6566 Managing the dioxin problem in the Baltic region with focus on sources to air and fish
37
length (i.e., length not including the tail) did not show any obvious pattern with TEQPCDD/F concentra-tions on either a l.w. or w.w. basis (Figures 8 and 9; only l.w. presented). For lipid content, a pattern of increased TEQPCDD/F concentrations when lipid concentration decreased, and vice versa, could be dis-cerned (Figure 10). The highest TEQPCDD/F concentrations on a l.w. basis were observed in January for the southern Both-nian Sea and in May for the northern Bothnian Sea, while on a w.w. basis, the highest concentrations were observed in January for both sites. An increase in lipid corresponds to a decrease in TEQPCDD/F (l.w.) concentration, and vice versa (Figure 10, top). This trend is also seen on a w.w. basis, although not as pronounced (Figure 10, bottom). Lipid content showed a significant negative correlation with TEQPCDD/F concentrations for both sites on a l.w. basis (n = 11, d.f. = 9, p<0.01, r2 = 0.79 (southern); n = 9, d.f. = 7, p<0.01, r2 = 0.90 (northern)). On a w.w. basis, only the southern site showed a significant negative correlation between lipid content and TEQPCDD/F (n = 11, d.f. = 9, p<0.05; r2 = 0.39). The northern site showed a non-significant negative relationship (r2 = 0.39).
Figure 8. TEQPCDD/F (l.w. basis) and herring weight for the southern (left) and northern (right) Bothnian Sea sites over the 12 months data were collected. Numbers on the x axis correspond to month (1 = January, 2 = February, etc.).
Figure 9. TEQPCDD/F (l.w. basis), body length and total length for the southern (left) and northern (right) Bothnian Sea sites over the 12 months data were collected. Numbers on the x axis correspond to month (1 = January, 2 = February, etc.).
0
10
20
30
40
50
60
0
40
80
120
160
200
1 2 3 4 5 6 7 8 9 10 11 12
wei
ght
(g)
pg/
g lw
Months
Total TEQ PCDD/FWeight
0
10
20
30
40
50
60
0
40
80
120
160
200
1 2 3 4 5 6 7 8 9 10 11 12
wei
ght
(g)
pg/
g lw
Months
Total TEQ PCDD/F
Weight
0
5
10
15
20
25
0
40
80
120
160
200
1 2 3 4 5 6 7 8 9 10 11 12
len
gth
(cm
)
pg/
g lw
Months
Total TEQ PCDD/FTotal lengthBody length
0
5
10
15
20
25
0
40
80
120
160
200
1 2 3 4 5 6 7 8 9 10 11 12
len
gth
(cm
)
pg/
g lw
Months
Total TEQ PCDD/FTotal lengthBody length

SWEDISH ENVIRONMENTAL PROTECTION AGENCY REPORT 6566 Managing the dioxin problem in the Baltic region with focus on sources to air and fish
38
Figure 10. TEQPCDD/F on a lipid weight (top) and wet weight basis (bottom), and lipid content (fat %) for the southern (left) and northern (right) Bothnian Sea sites for the 12 months of sampling. Numbers on the x axis correspond to month (1 = January, 2 = February, etc.).
The PCA examining TEQPCDD congener concentrations shows that samples from the southern Both-nian Sea site have formed two groups – June to September and December to April (Figure 11). The June to September group is near the centre of the PCA and therefore no congener is exerting a particu-larly strong influence. The group formed by the December to April samples form a group close to OCDD. This indicates a change in dominant congeners between summer and winter/spring. A similar pattern can be seen for the northern Bothnian Sea site, although the groups are not as tightly clustered as for the southern site. November samples from both sites sit near 1,2,3,4,7,8-HxCDD, separate from all other samples. When examining TEQPCDF congener concentrations (l.w.) over the sampled months using PCA, no seasonal pattern is apparent for either site (Figure 12).
0
1
2
3
4
5
6
0
40
80
120
160
200
1 2 3 4 5 6 7 8 9 10 11 12
Fat
%
pg/
g l.w
.
Months
TEQ PCDD/FFat %
0
1
2
3
4
5
6
0
40
80
120
160
200
1 2 3 4 5 6 7 8 9 10 11 12
Fat
%
pg/
g l.w
.
Months
TEQ PCDD/F
Fat %
0
1
2
3
4
5
6
0
1
2
3
4
5
1 2 3 4 5 6 7 8 9 10 11 12
Fat
%
pg/
g w
.w.
Month
TEQ PCDD/FFat %
0
1
2
3
4
5
6
0
1
2
3
4
5
1 2 3 4 5 6 7 8 9 10 11 12
Fat
%
pg/
g w
.w.
Month
TEQ PCDD/FFat %

SWEDISH ENVIRONMENTAL PROTECTION AGENCY REPORT 6566 Managing the dioxin problem in the Baltic region with focus on sources to air and fish
39
Figure 11. Principal component analysis (PCA) showing TEQPCDD congener loadings (l.w.) over the sampled months for both sites. S = southern Bothnian Sea, N = northern Bothnian Sea. Numbers indicate months, e.g., 1 = January. Congener names are abbreviated: TD = 2,3,7,8-TCDD, PD = 1,2,3,7,8-PeCDD, HxD1 = 1,2,3,4,7,8-HxCDD1, HxD2 = 1,2,3,6,7,8-HxCDD2, HxD3 = 1,2,3,7,8,9-HxCDD3, HpD = 1,2,3,4,6,7,8-HpCDD,OD = OCDD.
Figure 12. Principal component analysis (PCA) showing TEQPCDF congener loadings (l.w.) over the sampled months for both sites. S = southern Bothnian Sea, N = northern Bothnian Sea. Numbers indicate months, e.g., 1 = January. Congener names are abbreviated: TF = 2,3,7,8-TCDF, PF1 = 1,2,3,7,8-PeCDF1, PF2 = 2,3,4,7,8-PeCDF2, HxF1 = 1,2,3,4,7,8-HxCDF1, HxF2 = 1,2,3,6,7,8-HxCDF2, HxF3 = 1,2,3,7,8,9-HxCDF3, HxF4 = 2,3,4,6,7,8-HxCDF4, HpF1 = 1,2,3,4,6,7,8-HpCDF1.
6.4 Discussion Seasonal changes in dioxin concentrations in Baltic herring were observed on a lipid weight basis. On a wet weight basis, seasonal changes in dioxins were not as apparent. There are a number of chemical, biological and ecological factors that could contribute to seasonal variation, but as lipid content was
PC1, 69%
PC
2, 2
6%
TDPD
HxD1
HxD2
HxD3
HpD
OD
1
1
2 2
4 5
5
6
6
7
8 8 9
9
10
10
11
11
12
12
SN
Source: NRM 13.01.28 16:55, PCDD_3
PC1, 67%
PC
2, 1
3% TF
PF1
PF2
HxF1
HxF2HxF3
HxF4
HpF1
1 1
2
2
4
5 5
6
6
7 8
8
9
9
10
1011
1112 12
SN
Source: NRM 13.01.28 16:55, PCDF_3

SWEDISH ENVIRONMENTAL PROTECTION AGENCY REPORT 6566 Managing the dioxin problem in the Baltic region with focus on sources to air and fish
40
the biological parameter most strongly aligned with dioxin concentrations, it seems likely that factors affecting lipid content e.g., spawning and seasonal changes in diet, are the drivers of the observed dioxin changes. A strong negative correlation exists between organochlorine concentration expressed on a lipid weight basis and fat content in spring-caught herring (Bignert et al. 1993). A low fat content due to e.g., scar-city of food can cause elevated concentrations of organochlorines on a l.w. basis, and vice versa (Big-nert et al. 2011). A likely explanation for this phenomenon is that as lipids are consumed, dioxins are redistributed to other tissues in the body rather than being excreted from the body, which affects the lipid-normalised concentrations. Lipid content is closely related to spawning. Significant depletion of lipids due to spawning has been observed in Pacific herring (Clupea harengus pallasi; Huynh et al. 2007). Changes seen in dioxin concentration here are possibly influenced by spawning activity and related lipid depletion, followed by lipid restoration after spawning, causing fat dilution of dioxins. High concentrations of dioxins and corresponding lower lipid content in the first few months of the year for both sites indicate the sam-pled herring could be spring spawners. Egg production has been reported as acting as a vector of depu-ration in female fish (Larsson et al. 1993, Miller 1993, Stapleton et al. 2002), which could also explain some of the observed dioxin fluctuations, although sex was not determined for these fish. It seems very likely that diet plays a large role in influencing seasonal lipid content and therefore diox-in concentration. Seasonal fluctuations in prey source availability, shifts in dominant food source, inter- and intra-specific competition, and/or environmental conditions can all influence dioxin concen-trations. Different dominant food items have been identified from Baltic herring diet during different seasons (Popiel 1951, Parmanne et al. 2004, both in Parmanne et al. 2006; Arrhenius and Hansson 1993; Mollmann et al. 2004), leading to changes in bioaccumulation rate depending upon trophic lev-el, dioxin concentration, and lipid content in the dominant prey source at the time. Herring diet from the Baltic Sea is usually dominated by zooplankton and mysids (Arrhenius and Hansson 1993, Mollmann et al. 2004). Consumption of zooplankton varies with season and peaks between July and October (Arrhenius and Hansson 1993). The highest feeding activity for herring has been reported as occurring in spring and summer, which is the main reproductive period for calanoid copepods, one of the dominant zooplankton sources for herring (Mollmann et al. 2004). Thus, large amounts of food from a low trophic level would be available at this time. This relates well to results reported here, with lower dioxin concentration and higher lipid content seen in this same period. In late autumn and winter, herring food consumption decreases and a shift in diet to prey with higher energy values e.g., mysids, occurs (Arrhenius and Hansson 1993). As mysids are higher trophic level organisms than zooplankton, they bioaccumulate more dioxins (Strandberg et al. 1998) leading to greater dioxin bioaccumulation in herring as well. OCDD was a dominant congener in mysids and zooplankton sampled within the Bothnian Bay (see chapter 7), and here, appeared to have a stronger influence on herring during the winter months. A change in diet, along with the potentially slower metabolism/excretion of heavier PCDD/F congeners during winter when fat content in herring was lower, is one explanation for the observed grouping of herring in the PCA.

SWEDISH ENVIRONMENTAL PROTECTION AGENCY REPORT 6566 Managing the dioxin problem in the Baltic region with focus on sources to air and fish
41
6.5 Conclusions Seasonal variations in concentrations of dioxins in Baltic herring were observed on a lipid weight
basis but to a lesser extent on a wet weight basis. These variations in concentrations are negative-ly correlated with seasonal cycles in lipid content due to spring/summer spawning and seasonal dietary changes. The seasonal dioxin changes are most likely due to the re-distribution of dioxins to other tissues when lipid content decreases, and a dilution when lipid content increases.
The highest TEQPCDD/F concentrations (w.w. basis) were observed in January for both the southern and northern Bothnian Sea sites. On a l.w. basis, the highest TEQPCDD/F concentrations were ob-served in January for the southern and in May for the northern Bothnian Sea site.

SWEDISH ENVIRONMENTAL PROTECTION AGENCY REPORT 6566 Managing the dioxin problem in the Baltic region with focus on sources to air and fish
42
7 Spatial variation in dioxins and dioxin-like PCBs in herring from the Bothnian Sea 7.1 Introduction Spatial variations in dioxin concentrations in Baltic herring has previously been observed, for instance along the coast of the Bothnian Sea and between sub-basins (Bignert et al. 2011, Bignert et al. 2007, Karl and Ruoff 2007). Concentrations in herring from the Bothnian Sea and Bothnian Bay are often elevated (Bignert et al. 2011, Isosaari et al. 2006). Reasons for the spatial differences in dioxin con-centrations in herring from within the Bothnian Sea are not clear. Various hypotheses exist, such as differences in exposure from local sources, contaminated sediments acting as secondary dioxin sources, ecological factors, fish growth rate, metabolism or prey availability (Arrhenius and Hansson 1993, Peltonen et al. 2007). As herring is a key-stone species within the Baltic ecosystem, and are popular for human consumption within the Baltic countries, improving knowledge about causes of spatial differences in dioxins is important from both an ecological and a human health perspective. Here, we examine spatial variation of dioxin concentrations in herring, mysids, zooplankton, sediment and water data, as well as stable isotope analysis from herring, mysids and zooplankton, from four sites within the Bothnian Sea, to investigate whether herring diet, biological variables or sedi-ment/water concentrations can explain the observed spatial variations in dioxin concentrations in her-ring.
7.2 Methods 7.2.1 Sampling sites and matrices Five sites were sampled along the coast of the Bothnian Sea in September 2009 – Köpmanholmen, Lörudden, Hornslandet, Norrsundet and Skutskär (Figure 13); however, at Köpmanholmen only zoo-plankton was sampled. Based on previous observations (Bignert et al. 2007), Hornslandet can be used as a reference area, and concentrations of dioxins and dl-PCBs in herring from this site were expected to be more similar to herring caught offshore, while the other coastal sites are considered contaminated areas. From each site, Baltic herring (Clupea harengus), mysids and zooplankton were sampled. Her-ring were collected by trawling and kept frozen (-20 °C) until further analysis. For comparison, her-ring were also sampled from four offshore sites by the Swedish Board of Fisheries (Figure 13). It must be noted that two of these sites, Utsjö 3 and 4, are located within the Baltic Proper, and it is known that dioxin levels in herring from this region differ from herring in the Bothnian Sea region. Therefore, herring from these two sites are not directly comparable with the rest of the data. From each coastal site, 36 individual herring were sampled, except at Hornslandet where only 18 indi-viduals were sampled, and Köpmanholmen where no herring was collected. From each offshore site, 24 individual herring were sampled. These were divided into three even pools for sampling (n = 12x3 at Skutskär, Norrsundet and Lörudden, n = 6x3 for Hornslandet, n = 8x3 for all offshore sites).

SWEDISH ENVIRONMENTAL PROTECTION AGENCY REPORT 6566 Managing the dioxin problem in the Baltic region with focus on sources to air and fish
43
Figure 13. Map of Scandinavia showing the Baltic Sea and surrounding countries. The sampled coastal sites within the Bothnian Sea are indicated by red dots, offshore sites by green dots.
Herring biological measurements were taken for each individual (sex, age, weight, body length, total length, liver weight, gonad weight, stomach weight). Scales were used for age determination.

SWEDISH ENVIRONMENTAL PROTECTION AGENCY REPORT 6566 Managing the dioxin problem in the Baltic region with focus on sources to air and fish
44
Mysids from coastal sites were collected using a 90 µm plankton net at depths generally >40 m. Two species (Mysis relicta and M. mixta) were identified and frozen separately. Zooplankton from coastal sites were sampled using a 90 µm plankton net dragged behind a boat at a depth of 1-5 m, concentrat-ed, and stored frozen in glass jars. A sub-sample of zooplankton from each coastal site was fixed in 95% ethanol to determine the relative taxonomic composition. Mysids and zooplankton were collected from offshore areas by dragging a plankton net (mesh size 200 mm) from the bottom to the surface. These offshore sampled areas differed to the offshore sites as they were collected within another pro-ject, but were still within the Bothnian Sea. For dioxin analysis, three pooled samples of 30 g w.w. of herring fillet (muscle including subcutane-ous fat and skin) were sampled for each site. Muscle only (skin and subcutaneous fat removed) were simultaneously sampled from the same individuals from two coastal (Lörudden, Skutskär) and two offshore (2, 4) sites. There was only enough biomass of M. relicta and M. mixta for dioxin analysis from Lörudden and Skutskär. Bulk zooplankton samples from all coastal (excluding Köpmanholmen) and offshore sites were analysed for dioxins. For stable isotope analysis, dorso-lateral herring muscle tissue of approximately 0.5 g w.w. from each individual was sampled from coastal samples only. Five individual M. relicta and 3 M. mixta from each coastal and offshore site were analysed for stable isotopes. Bulk zooplankton samples from all coastal and offshore sites were analysed for stable isotopes.
7.2.2 Dioxin analytical methods The analyses of dioxins and dl-PCBs from herring fillet, muscle, mysids and zooplankton were carried out at Eurofins Ökometri laboratory in Bayreuth, using dioxin analysis standard method EPA 1613 B with HRGC/HRMS. Fat extraction was done via column extraction using hexane:dichloromethane 1:1 in accordance with the German extraction method ASU L00.00-12; ASU L00.00-38.
7.2.3 Stomach content analysis Herring stomachs from each coastal site were removed and preserved in glass jars with 95% ethanol. Following laboratory protocols, each stomach was cut open, and contents were removed and examined under a binocular microscope. Contents were divided into groups (e.g., zooplankton, mysids, and fish) and the number in each group was recorded.
7.2.4 Stable isotope analysis Stable isotope analysis (SIA) was conducted for muscle samples at the University of Jyväskylä, Fin-land, using a Carlo Erba Flash EA1112 elemental analyser connected to a mass spectrometer (CF-IRMS), via methods outlined in Kiljunen et al. (2006). All samples were freeze-dried to a constant weight and ground to fine powder before analysis. The international standards of Vienna Pee Dee belemnite (for carbon) and atmospheric N2 (for nitrogen) were used as reference materials and dried pike muscle as an internal working standard. Results are expressed using the standard δ notation as parts per thousand (‰) difference from the international standards. Lipid normalisation was carried out for the δ13C values for herring, mysids and zooplankton, using calculations presented in Kiljunen et al. (2006), as lipids are known to be 13C depleted relative to other major tissues (Bodin et al. 2007, Ehrich et al. 2011) i.e., fatty tissues can have lower δ13C values than lean tissues (Ehrich et al. 2011).

SWEDISH ENVIRONMENTAL PROTECTION AGENCY REPORT 6566 Managing the dioxin problem in the Baltic region with focus on sources to air and fish
45
7.2.5 Statistical treatment of the data Data quality control was conducted for all sites. Any values below limit of quantification (LOQ) were replaced with the LOQ divided by the square root of two. Herring biological variables were compared between coastal and offshore sites using Student’s t-tests (Excel 2010); differences between coastal sites, and between offshore sites, were examined using one-way analysis of variance (ANOVA) and Tukey’s post-hoc tests (Statistica v10). As there were significant differences (p<0.05) seen in herring biological variables between coastal and offshore sites, with coastal herring being older, dioxin data were age-adjusted. Age was chosen as both length and weight are closely related to age, and because dioxin levels are known to be related to age, with older fish having higher concentrations compared to younger fish (Isosaari et al. 2006, Karl and Ruoff 2007, Pandelova et al. 2008). As there was some spread in the age data, the median age of the offshore fish was chosen as the age to correct coastal fish age to. Dioxin data from coastal-caught herring were age adjusted using the following equation: Congeneradjusted = Congenerobserved + β* (Agemedian – Ageobserved) where β is the beta value from the regression equations (herring age vs. the absolute concentration (l.w.) for the dominant congeners for PCDDs, PCDFs and dl-PCBs), and Agemedian was 5, based on herring age from the offshore sites. Muscle samples were only taken at four of the eight sites where herring was caught, resulting in half as many muscle samples compared to fillet. This led to a poor fit when age and TEQ values were regressed together, and therefore age-adjustment of herring muscle data was poor compared to the adjustment for herring fillet. It is indicated throughout the results sec-tion where adjusted and/or unadjusted data have been used. Student’s t-tests were used to examine differences in absolute concentration of the dominant congeners (1,2,3,6,7,8-HxCDD, OCDD, 2,3,7,8-TCDF, 2,3,4,7,8-PeCDF, CB105, CB 118) between coastal and offshore herring, and one-way ANOVAs with Tukey’s post hoc tests (Statistica v10) were used to examine differences in absolute concentration of the dominant congeners between coastal sites, and between offshore sites, using age-adjusted fillet data. Pearson’s correlation coefficients were used to attempt to establish a link between dioxin concentrations in sediment and herring fillet. A conversion factor between congener concentration in herring fillet and muscle was calculated. Principal compo-nent analysis (PCA) with Hotelling’s tests were used to examine any patterns in congener groups be-tween coastal and offshore herring, and between coastal sites, using normalised data (each congener divided by the sum of all congeners for each of PCDD, PCDF and dl-PCBs, with values below LOQ removed; Bignert 2010). Graphs of zooplankton composition from each coastal site, and herring stom-ach content were compiled. Stable isotope data were used to determine dietary proportion of herring at the four coastal sites where herring was sampled. Bi-plots and correlation coefficients were calculated and graphed using SIAR (2011), an R statistical package developed specifically for stable isotope data analysis.
7.3 Results As only zooplankton was caught at Köpmanholmen, this site was removed from all but the zooplank-ton graphs in the following analyses. All results are presented in pg g-1 l.w. unless otherwise specified. Skutskär, Lörudden, Utsjö 2 and Utsjö 4 had both fillet and muscle sampled from herring. At all other sites, only fillet samples were taken from herring. Mysids were only caught from Skutskär and Lörud-den.
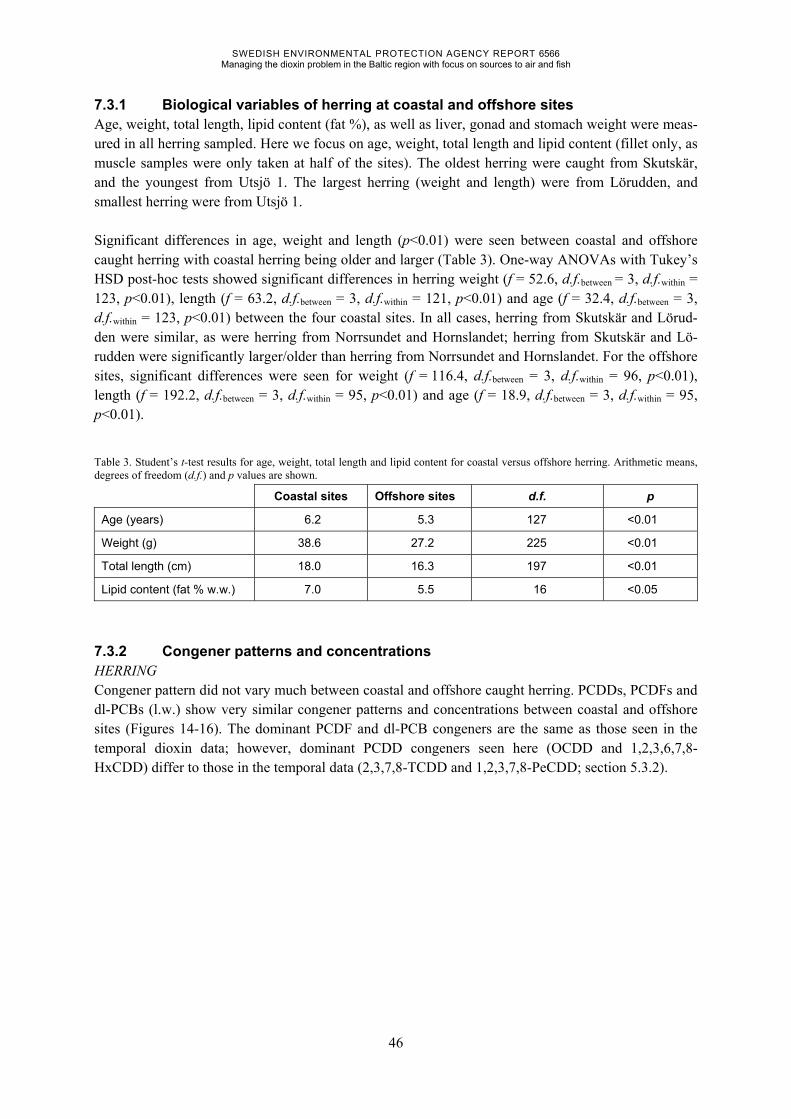
SWEDISH ENVIRONMENTAL PROTECTION AGENCY REPORT 6566 Managing the dioxin problem in the Baltic region with focus on sources to air and fish
46
7.3.1 Biological variables of herring at coastal and offshore sites Age, weight, total length, lipid content (fat %), as well as liver, gonad and stomach weight were meas-ured in all herring sampled. Here we focus on age, weight, total length and lipid content (fillet only, as muscle samples were only taken at half of the sites). The oldest herring were caught from Skutskär, and the youngest from Utsjö 1. The largest herring (weight and length) were from Lörudden, and smallest herring were from Utsjö 1. Significant differences in age, weight and length (p<0.01) were seen between coastal and offshore caught herring with coastal herring being older and larger (Table 3). One-way ANOVAs with Tukey’s HSD post-hoc tests showed significant differences in herring weight (f = 52.6, d.f.between = 3, d.f.within = 123, p<0.01), length (f = 63.2, d.f.between = 3, d.f.within = 121, p<0.01) and age (f = 32.4, d.f.between = 3, d.f.within = 123, p<0.01) between the four coastal sites. In all cases, herring from Skutskär and Lörud-den were similar, as were herring from Norrsundet and Hornslandet; herring from Skutskär and Lö-rudden were significantly larger/older than herring from Norrsundet and Hornslandet. For the offshore sites, significant differences were seen for weight (f = 116.4, d.f.between = 3, d.f.within = 96, p<0.01), length (f = 192.2, d.f.between = 3, d.f.within = 95, p<0.01) and age (f = 18.9, d.f.between = 3, d.f.within = 95, p<0.01).
Table 3. Student’s t-test results for age, weight, total length and lipid content for coastal versus offshore herring. Arithmetic means, degrees of freedom (d.f.) and p values are shown.
Coastal sites Offshore sites d.f. p
Age (years) 6.2 5.3 127 <0.01
Weight (g) 38.6 27.2 225 <0.01
Total length (cm) 18.0 16.3 197 <0.01
Lipid content (fat % w.w.) 7.0 5.5 16 <0.05
7.3.2 Congener patterns and concentrations HERRING Congener pattern did not vary much between coastal and offshore caught herring. PCDDs, PCDFs and dl-PCBs (l.w.) show very similar congener patterns and concentrations between coastal and offshore sites (Figures 14-16). The dominant PCDF and dl-PCB congeners are the same as those seen in the temporal dioxin data; however, dominant PCDD congeners seen here (OCDD and 1,2,3,6,7,8-HxCDD) differ to those in the temporal data (2,3,7,8-TCDD and 1,2,3,7,8-PeCDD; section 5.3.2).
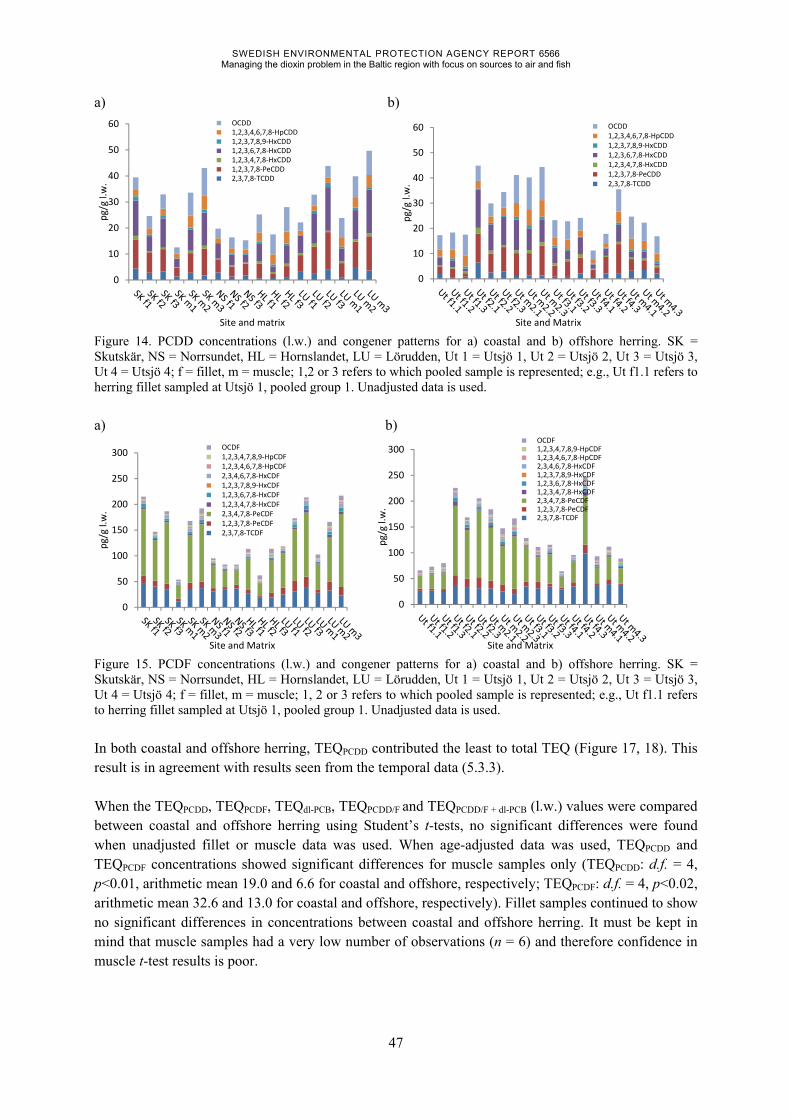
SWEDISH ENVIRONMENTAL PROTECTION AGENCY REPORT 6566 Managing the dioxin problem in the Baltic region with focus on sources to air and fish
47
a) b)
Figure 14. PCDD concentrations (l.w.) and congener patterns for a) coastal and b) offshore herring. SK = Skutskär, NS = Norrsundet, HL = Hornslandet, LU = Lörudden, Ut 1 = Utsjö 1, Ut 2 = Utsjö 2, Ut 3 = Utsjö 3, Ut 4 = Utsjö 4; f = fillet, m = muscle; 1,2 or 3 refers to which pooled sample is represented; e.g., Ut f1.1 refers to herring fillet sampled at Utsjö 1, pooled group 1. Unadjusted data is used.
a) b)
Figure 15. PCDF concentrations (l.w.) and congener patterns for a) coastal and b) offshore herring. SK = Skutskär, NS = Norrsundet, HL = Hornslandet, LU = Lörudden, Ut 1 = Utsjö 1, Ut 2 = Utsjö 2, Ut 3 = Utsjö 3, Ut 4 = Utsjö 4; f = fillet, m = muscle; 1, 2 or 3 refers to which pooled sample is represented; e.g., Ut f1.1 refers to herring fillet sampled at Utsjö 1, pooled group 1. Unadjusted data is used.
In both coastal and offshore herring, TEQPCDD contributed the least to total TEQ (Figure 17, 18). This result is in agreement with results seen from the temporal data (5.3.3). When the TEQPCDD, TEQPCDF, TEQdl-PCB, TEQPCDD/F and TEQPCDD/F + dl-PCB (l.w.) values were compared between coastal and offshore herring using Student’s t-tests, no significant differences were found when unadjusted fillet or muscle data was used. When age-adjusted data was used, TEQPCDD and TEQPCDF concentrations showed significant differences for muscle samples only (TEQPCDD: d.f. = 4, p<0.01, arithmetic mean 19.0 and 6.6 for coastal and offshore, respectively; TEQPCDF: d.f. = 4, p<0.02, arithmetic mean 32.6 and 13.0 for coastal and offshore, respectively). Fillet samples continued to show no significant differences in concentrations between coastal and offshore herring. It must be kept in mind that muscle samples had a very low number of observations (n = 6) and therefore confidence in muscle t-test results is poor.
0
10
20
30
40
50
60
pg/
g l.w
.
Site and matrix
OCDD 1,2,3,4,6,7,8-HpCDD 1,2,3,7,8,9-HxCDD 1,2,3,6,7,8-HxCDD 1,2,3,4,7,8-HxCDD 1,2,3,7,8-PeCDD 2,3,7,8-TCDD
0
10
20
30
40
50
60
pg/
g l.w
.
Site and Matrix
OCDD 1,2,3,4,6,7,8-HpCDD 1,2,3,7,8,9-HxCDD 1,2,3,6,7,8-HxCDD 1,2,3,4,7,8-HxCDD 1,2,3,7,8-PeCDD 2,3,7,8-TCDD
0
50
100
150
200
250
300
pg/
g l.w
.
Site and Matrix
OCDF 1,2,3,4,7,8,9-HpCDF 1,2,3,4,6,7,8-HpCDF 2,3,4,6,7,8-HxCDF 1,2,3,7,8,9-HxCDF 1,2,3,6,7,8-HxCDF 1,2,3,4,7,8-HxCDF 2,3,4,7,8-PeCDF 1,2,3,7,8-PeCDF 2,3,7,8-TCDF
0
50
100
150
200
250
300
pg/
g l.w
.
Site and Matrix
OCDF 1,2,3,4,7,8,9-HpCDF 1,2,3,4,6,7,8-HpCDF 2,3,4,6,7,8-HxCDF 1,2,3,7,8,9-HxCDF 1,2,3,6,7,8-HxCDF 1,2,3,4,7,8-HxCDF 2,3,4,7,8-PeCDF 1,2,3,7,8-PeCDF 2,3,7,8-TCDF

SWEDISH ENVIRONMENTAL PROTECTION AGENCY REPORT 6566 Managing the dioxin problem in the Baltic region with focus on sources to air and fish
48
a) b)
Figure 16. dl-PCB concentrations (l.w.) and congener patterns for a) coastal and b) offshore herring. SK = Skutskär, NS = Norrsundet, HL = Hornslandet, LU = Lörudden, Ut 1 = Utsjö 1, Ut 2 = Utsjö 2, Ut 3 = Utsjö 3, Ut 4 = Utsjö 4; f = fillet, m = muscle; 1,2 or 3 refers to which pooled sample is represented; e.g., Ut f1.1 refers to herring fillet sampled at Utsjö 1, pooled group 1. Unadjusted data is used.
a) b)
Figure 17. TEQ concentrations (l.w.) for PCDD, PCDF and dl-PCBs for a) coastal and b) offshore herring. SK = Skutskär, NS = Norrsundet, HL = Hornslandet, LU = Lörudden, Ut 1 = Utsjö 1, Ut 2 = Utsjö 2, Ut 3 = Utsjö 3, Ut 4 = Utsjö 4; f = fillet, m = muscle; 1,2 or 3 refers to which pooled sample is represented; e.g., Ut f1.1 refers to herring fillet sampled at Utsjö 1, pooled group 1. Unadjusted data is used. Student’s t-tests were repeated using both unadjusted and age-adjusted fillet data on a wet weight basis, but not muscle data, because of the low number of muscle observations. No significant differ-ences were seen between any TEQ values from coastal or offshore herring for the unadjusted data. However, when the age-adjusted data was examined, a significant difference between coastal and offshore sites was seen, but only for TEQPCDD/F values (d.f. = 14, p<0.04, arithmetic mean 2.7 and 1.7 for coastal and offshore, respectively).
0
20000
40000
60000
80000
100000
120000
140000
160000
pg/
g l.w
.
Site and Matrix
CB 189 CB 167 CB 157 CB 156 CB 123 CB 118 CB 114 CB 105 CB 169 CB 126 CB 81 CB 77
0
20000
40000
60000
80000
100000
120000
140000
160000
pg/
g l.w
.
Site and Matrix
CB 189 CB 167 CB 157 CB 156 CB 123 CB 118 CB 114 CB 105 CB 169 CB 126 CB 81 CB 77
0
20
40
60
80
100
120
pg/
g l.w
.
Site and Matrix
TEQ DLPCB
TEQ PCDF
TEQ PCDD
0
20
40
60
80
100
120
pg/
g l.w
.
Site and Matrix
TEQ DLPCB
TEQ PCDF
TEQ PCDD

SWEDISH ENVIRONMENTAL PROTECTION AGENCY REPORT 6566 Managing the dioxin problem in the Baltic region with focus on sources to air and fish
49
a) b)
Figure 18. Relative proportion to total TEQ contributed by TEQPCDD, TEQPCDF and TEQdl-PCB (unadjusted data) for a) coastal and b) offshore herring.
When the four coastal sites were compared for differences in TEQPCDD, TEQPCDF, TEQPCDD/F and TE-Qdl-PCB concentrations (l.w.), and dominant congeners (l.w.) using one-way ANOVAs (age-adjusted fillet data), a significant difference was only seen for TEQdl-PCB (f = 9.05, d.f. = 3, p<0.01). Skutskär and Lörudden had significantly higher values compared to Hornslandet and Norrsundet. However, as Hornslandet is a reference site, it is expected that herring from this site would have lower concentra-tions than herring from the other three sites. When the offshore sites were examined in the same way, no significant differences in dominant congener concentrations or TEQ concentrations were seen. By contrast, when one-way ANOVAs were carried out using age-adjusted w.w. data, significant dif-ferences were seen between all sites for TEQPCDD, TEQPCDF, TEQPCDD/F and TEQdl-PCB (f = 7.24, d.f. = 3, p<0.02; f = 4.45, d.f. = 3, p<0.05; f = 16.99, d.f. = 3, p<0.01; f = 4.41, d.f. = 3, p<0.05 respectively). Tukey’s post hoc tests showed that Hornslandet had significantly lower values compared to Lörudden for all TEQ values. Norrsundet did not differ from any of the other three sites, except in the case of TEQPCDD/F, when Norrsundet had a significantly lower value compared to Lörudden. Skutskär had significantly lower TEQPCDD value compared to Lörudden, and significantly higher TEQPCDD/F value compared to Hornslandet. For the offshore sites, no significant differences were seen. MYSIDS AND ZOOPLANKTON OCDD was highly dominant in both mysids and zooplankton from all sites (Figure 19a). 2,3,7,8-TCDF was dominant in mysids from Skutskär, while OCDF dominated in zooplankton from Skutskär and Norrsundet, and mysids from Lörudden (Figure 19b). For PCDFs and dl-PCBs, but not for PCDDs, mysids tended to have higher concentrations than zooplankton. The relative proportion that TEQPCDD, TEQPCDF and TEQdl-PCB contributed to total TEQ in mysids (Fig-ure 20a) and zooplankton (Figure 20b) is similar to that seen in herring. The main difference is that TEQdl-PCB contributes far more to total TEQ in zooplankton than it contributes in herring (coastal or offshore) and mysids.
17%
42%
41%TEQ PCDD
TEQ PCDF
TEQ DL-PCB
15%
40%
45%TEQ PCDD
TEQ PCDF
TEQ DL-PCB

SWEDISH ENVIRONMENTAL PROTECTION AGENCY REPORT 6566 Managing the dioxin problem in the Baltic region with focus on sources to air and fish
50
a) b)
c)
Figure 19 a) PCDD, b) PCDF and c) dl-PCBs (l.w.) in mysids and zooplankton. Sk = Skutskär, NO = Norrsun-det, HO = Hornslandet, LO = Lörudden, Zp = zooplankton.
a) b)
Figure 20. Relative proportion to total TEQ contributed by TEQPCDD, TEQPCDF and TEQdl-PCB (l.w., unadjusted data) for a) mysids and b) zooplankton, coastal sites.
SEDIMENT AND WATER Sediment data are from Sundqvist et al. (2009a), and the chosen sites were in close proximity to where coastal herring were sampled (Figure 21). Sediment congener patterns were dominated by OCDD (Figure 22a), OCDF (Figure 22b), and CB118 and CB105 (Figure 22c). The water pattern was differ-ent from the sediment pattern for the PCDFs (Figure 22b), but not for the PCDDs (Figure 22a). This similarity between the sediment and water pattern (truly dissolved concentrations) for PCDDs is, how-ever, not in accordance to other studies (Josefsson and Wiberg, unpublished data). The relative propor-tion of the TEQ concentrations from each group for sediment shows that dl-PCBs contribute the least, and PCDDs contribute the most to total TEQ (Figure 23a-d). Although dl-PCBs are shown as contrib-
0
20
40
60
80
100
120
140
160
180
pg/
g l.w
.
Site and Matrix
OCDD 1,2,3,4,6,7,8-HpCDD 1,2,3,7,8,9-HxCDD 1,2,3,6,7,8-HxCDD 1,2,3,4,7,8-HxCDD 1,2,3,7,8-PeCDD 2,3,7,8-TCDD
0102030405060708090
100
pg/
g l.w
.
Site and Matrix
OCDF 1,2,3,4,7,8,9-HpCDF 1,2,3,4,6,7,8-HpCDF 2,3,4,6,7,8-HxCDF 1,2,3,7,8,9-HxCDF 1,2,3,6,7,8-HxCDF 1,2,3,4,7,8-HxCDF 2,3,4,7,8-PeCDF 1,2,3,7,8-PeCDF 2,3,7,8-TCDF
02000400060008000
100001200014000160001800020000
pg/
g l.w
.
Site and Matrix
CB189CB167CB157CB156CB123CB118CB 114CB 105CB 169CB 126CB 81CB 77
17%
40%
43%TEQ PCDD
TEQ PCDF
TEQ DL-PCB
11%
30%59%
TEQ PCDD
TEQ PCDF
TEQ DL-PCB

SWEDISH ENVIRONMENTAL PROTECTION AGENCY REPORT 6566 Managing the dioxin problem in the Baltic region with focus on sources to air and fish
51
uting 0% at Norrsundet (Figure 23b), in fact, this is 0.5%. Of the four sites, PCDDs contribute the least to total TEQ at Lörudden (50%; Figure 23d).
Figure 21. Green and blue half circles represent herring, red half circles represent the closest sediment site to the coastal sampling sites, and small orange dots indicate the cluster of closest sediment sites.
COMPARISON BETWEEN COMPARTMENTS Pearson’s correlation coefficients were used to try to establish a statistical link between dioxin concen-trations in the sediment and in herring. The TEQPCDD/F values for the sediment sites closest to the coastal sampling sites for herring were examined; however, no significant correlations between sedi-ment TEQ and herring TEQ were found, probably due to the low number of sites (n=4; Figure 21). Overall, congeners in herring did not differ much in concentration or pattern between coastal or off-shore sites. Mysids and zooplankton had patterns similar to each other. Sediment patterns were more similar to the zooplankton pattern, which may indicate some suspended particulate matter was sam-pled with the zooplankton, while the water pattern was different again, in line with previous investiga-tions (Wiberg et al. 2009). Contributions to total TEQ of the three groups of dioxins varied – in all biota, PCDDs contributed the least, while PCDF and dl-PCBs contributed the most; in sediment, PCDDs contributed the most and dl-PCBs contributed the least.

SWEDISH ENVIRONMENTAL PROTECTION AGENCY REPORT 6566 Managing the dioxin problem in the Baltic region with focus on sources to air and fish
52
a) b)
c)
Figure 22. Congener patterns as a fraction of each congener in relation to the total concentration for sediment and water for a) PCDD, and b) PCDF; and for sediment only for c) dl-PCBs. Sk = Skutskär, NO = Norrsundet, HO = Hornslandet, LO = Lörudden. Coeluted dl-PCB congeners are indicated in the figure legends. Water data is from Cornelissen et al. (2008), and is based on the median congener concentration of the truly dissolved frac-tion from six sites sampled within the Bothnian Sea and Baltic Proper. dl-PCB data was not available for water within this data set. a) b)
c) d)
Figure 23. Relative proportion to total TEQ contributed by TEQPCDD, TEQPCDF and TEQdl-PCB for sediment from a) Korsnäs (near Skutskär), b) Norrsundet, c) Hornslandet and d) Lörudden.
0%
20%
40%
60%
80%
100%
pg/
g d
.w. (
sed
imen
t), m
3(w
ater
)
Site and Matrix
OCDD
1,2,3,4,6,7,8-HpCDD
1,2,3,7,8,9-HxCDD
1,2,3,6,7,8-HxCDD
1,2,3,4,7,8-HxCDD
1,2,3,7,8-PeCDD
2,3,7,8-TCDD
0%
20%
40%
60%
80%
100%
pg/
g d
.w. (
sed
imen
t), m
3(w
ater
)
Site and Matrix
OCDF 1,2,3,4,7,8,9-HpCDF 1,2,3,4,6,7,8-HpCDF 2,3,4,6,7,8-HxCDF 1,2,3,7,8,9-HxCDF 1,2,3,6,7,8-HxCDF 1,2,3,4,7,8-HxCDF 2,3,4,7,8-PeCDF 1,2,3,7,8-PeCDF 2,3,7,8-TCDF
0%
20%
40%
60%
80%
100%
pg/
g d
.w.
Site and Matrix
CB189
CB167 (+128)
CB157
CB156
CB123
CB118 (+106)
CB 114
CB 105 (+127)
CB 169
CB 126
CB 81
CB 77
63%
34%
3%
TEQ PCDD
TEQ PCDF
TEQ DL-PCB71%
29%
0%
TEQ PCDD
TEQ PCDF
TEQ DL-PCB
65%
32%
3%
TEQ PCDD
TEQ PCDF
TEQ DL-PCB
50%
46%
4%
TEQ PCDD
TEQ PCDF
TEQ DL-PCB

SWEDISH ENVIRONMENTAL PROTECTION AGENCY REPORT 6566 Managing the dioxin problem in the Baltic region with focus on sources to air and fish
53
7.3.3 Congener influence on offshore and coastal herring Principal component analysis (PCA) was carried out to investigate what, if any, congener exerts the greatest influence on herring contamination load between coastal and offshore sites. As muscle sam-ples were taken from only half of the sites, muscle was removed from the analyses, making a total of three pooled herring fillet samples at each site. As no significant differences were found in TEQ con-centrations between coastal and offshore herring for fillet samples for either adjusted or unadjusted data, the PCAs are presented using unadjusted data. For PCDDs and PCDFs, there is no clear pattern discernible in the data (Figure 24a, b), although for PCDFs, coastal herring appear to group more closely towards 1,2,3,7,8-PeCDF and 2,3,4,7,8-PeCDF (Figure 24b). For dl-PCBs, coastal and offshore herring form two groups (Figure 24c), which are sig-nificantly different (Hotelling’s t-squared test, f = 5.8, d.f. = 12, p<0.02); however, there is still some scatter and overlap. Overall, there does not seem to be much difference in congeners influencing con-centrations in herring caught from coastal and offshore sites. a) b)
c)
Figure 24. Principal component analysis for a) PCDDs, b) PCDFs and c) dl-PCBs in herring for coastal (red dots) and offshore (green dots) sites. The large red and green ovals are the Hotelling’s 95% confidence ellipses. Numbers are equivalent to sites, where 1,2,3 = Skutskär; 4,5,6 = Norrsundet; 7,8,9 = Hornslandet; 10,11,12 = Lörudden; 13,14,15 = Utsjö 1; 16,17,18 = Utsjö 2; 19,20,21 = Utsjö 3; 22,23,24 = Utsjö 4.
Coastal vs Offshore, PCDD
PC1, 55%
PC
2,
45%
TCDD
PeCDD
HxCDD2 1
2
3
4
5
6
7
8 9
10
11
12
1314
15
16CoastalOffshore
Source: NRM 12.03.22 15:06, C_O_4
Coastal vs Offshore, PCDF
PC1, 38%
PC
2, 2
6%
TCDFPeCDF1
PeCDF2
HxCDF1
HxCDF2HxCDF3
1
2
3
4
5
6
7
8
9
10
11
12
13
14
15
16
17
18
19
CoastalOffshore
Source: NRM 12.03.22 15:06, C_O_2
Coastal vs Offshore, PCBs
PC1, 52%
PC
2,
19%
CB-77CB-81
CB-126
CB-169
CB-105CB-114CB-118
CB-123
CB-156
CB-157CB-167
CB-189 1
2
3
4
5
6 7 8
9
1011
12
13
14
15
16
17
18
19
20CoastalOffshore
Source: NRM 12.03.22 15:06, C_O_3
SWEDISH ENVIRONMENTAL PROTECTION AGENCY REPORT 6566 Managing the dioxin problem in the Baltic region with focus on sources to air and fish
54
7.3.4 Zooplankton composition At Skutskär and Norrsundet, copepods were the dominant zooplankton, comprising 67 and 50% of total zooplankton composition, respectively. At Hornslandet, Lörudden and Köpmanholmen, Bosmina species were the dominant zooplankton, comprising 63, 50 and 60% respectively, of total zooplankton, with copepods being the secondary dominant group. Skutskär and Norrsundet are situated in the southern Bothnian Sea, while Köpmanholmen, Lörudden and Hornslandet are located in the central to northern Bothnian Sea (see Figure 13). Zooplankton community structure is largely regulated by the environment e.g., hydrography and stratification within the Baltic Sea (Flinkman et al. 1998 and refer-ences therein). Therefore, distances and different environmental conditions between sites could ex-plain the observed differences in zooplankton composition.
7.3.5 Herring stomach content The stomach contents of herring from the four coastal sites varied somewhat between sites. Zooplank-ton dominated at Norrsundet, both zooplankton and mysids occurred in most stomachs from Lörud-den, while mysids and other food items e.g., chironomid pupae, fish, and Gammarus, dominated at Hornslandet and Skutskär. Skutskär had the highest percentage of empty stomachs (25%).
7.3.6 Stable isotope analysis From the SIA analysis conducted, it was estimated that herring from Skutskär and Lörudden have a higher proportion of coastal mysids in their diet compared to offshore mysids and zooplankton (Figure 25). The diet of herring from Norrsundet is dominated by offshore mysids, with coastal mysids and zooplankton making up a smaller proportion of the diet. Herring diet at Hornslandet is dominated firstly by offshore mysids, and then by coastal mysids and zooplankton. While zooplankton plays a small role in the diet of herring at any site, offshore zooplankton features more prominently than coastal zooplankton in herring diet from Norrsundet and Hornslandet. In the previous section on stom-ach content analyses, mysids were only found from herring at Skutskär and Lörudden. However, un-like SIA, stomach content analysis only gives a snapshot overview of diet. The proportion of coastal-sourced food resources in the herring diet is greater at Skutskär and Lörud-den than at Norrsundet and Hornslandet (Figure 25). When herring biological parameters were meas-ured and compared between these four sites (section 7.3.1), herring from Norrsundet and Hornslandet were similar to each other and differed significantly in weight, length and age to herring from Skutskär and Lörudden. These biological differences may be a reflection of herring diet.

SWEDISH ENVIRONMENTAL PROTECTION AGENCY REPORT 6566 Managing the dioxin problem in the Baltic region with focus on sources to air and fish
55
Figure 25. Proportion of coastal and offshore prey items in coastal herring diet estimated with the SIAR model for Skutskär (top left), Norrsundet (top right), Hornslandet (bottom left), and Lörudden (bottom right). The light grey boxes represent 95%, medium grey represents 75% and darker grey represents the 25% credibility interval.
7.4 Discussion Investigation of herring from coastal and offshore sites from the Bothnian Sea revealed little variation in congener patterns, absolute congener and TEQ concentrations (l.w. basis). However, on a wet weight basis and using age-adjusted data, a difference between coastal and offshore herring was seen, but only for TEQPCDD/F (higher in coastal than in offshore herring). This difference was not seen when unadjusted data was used. The relative contributions of TEQPCDD, TEQPCDF and TEQdl-PCB to total TEQ did not differ between coastal and offshore caught herring. Some populations of herring are known to feed offshore, and migrate to coastal areas for spawning (Lundin 2011). This phenomenon may have influenced results seen here. The overall lack of differences may also be because a limited geograph-ical range was examined here. By contrast, comparisons between the different coastal sites showed significant differences in TEQdl-PCB (l.w. basis). TEQdl-PCB values in herring from Skutskär and Lörudden were significantly higher than in herring from Hornslandet and Norrsundet. The pattern of these differences, with two sites grouping together, is the same as seen for the biological differences. On a w.w. basis and using age-adjusted data, all TEQ values differed significantly between coastal sites. In general, Hornslandet had lower TEQ values compared to the other sites, while Lörudden had higher values. Age-adjusting the data removes age, and consequently size, as potential confounding factors. Therefore, there are perceptible differences between herring sampled at different sites within the one basin on a wet weight basis. Depending on how far these fish travel/migrate, variable local sources of dioxin, or variation in herring diet and consequently lipid content, may be responsible for the observed differences.

SWEDISH ENVIRONMENTAL PROTECTION AGENCY REPORT 6566 Managing the dioxin problem in the Baltic region with focus on sources to air and fish
56
SIA results support the observed differences between coastal sites seen on a w.w. basis. Herring caught at Skutskär and Lörudden had a higher proportion of coastal mysids present in their diet, whereas Hornslandet and Norrsundet had a greater proportion of offshore mysids in their diet. It ap-pears that differences in diet (predominantly coastal verse offshore) explain much of the variation seen between the four sites. Congener patterns and congener absolute concentrations (l.w. basis) in mysids and zooplankton dif-fered somewhat from herring. Different dominant congeners as well as lower concentrations for both PCDDs and PCDFs, but not for dl-PCBs, were observed. Reasons for differences in dominant conge-ners between herring and mysids/zooplankton are likely related to differences in biotransformation ability and differential accumulation efficiencies between species (Armitage et al. 2009, HELCOM 2004), or suspended particulate matter sampled with the zooplankton. No significant correlation could be established between PCDD/F and dl-PCB concentrations in sedi-ment and herring, indicating a lack of influence of local environmental contamination on these herring; however, this lack of significant result could be due to a low number of samples, so a link between local sources from sediment to herring contaminant loads cannot be ruled out. Bignert et al. (2007) were also unable to establish a link between PCDD/F patterns in sediment and herring from the south-ern Bothnian Sea. It is unsurprising that sediment patterns differ to herring, as dioxins have low water solubility and therefore settle in the sediments close to the source point. Sediments in these areas would therefore receive the full spectrum of locally produced pollutants, whereas herring only receive what they accumulate through diet and/or diffusion across the gills (Wiberg et al. 2009). Only one data set for water was available, which did not include dl-PCBs. It is difficult to make any inference about similarities or otherwise with the biota or sediment patterns. For this reason, water was not included on any PCA. Contribution of TEQPCDD, TEQPCDF and TEQdl-PCB to total TEQ differed considerably between sedi-ment and biota. In herring, mysids, and zooplankton, TEQPCDF and TEQdl-PCB contributed the most, and TEQPCDD the least, with this trend being even more pronounced in zooplankton. However, in sediment, TEQdl-PCB contributed negligible amounts, while TEQPCDD contributed the most to total TEQ, the com-plete opposite to biota. Results from biota are similar to Isosaari et al. (2006), where the contribution of dl-PCBs to the WHO-TEQ was equal to or greater than the contribution of PCDD/Fs. As mentioned above, dioxins have low water solubility and tend to sorb to sediments in the vicinity of the local source. Over time, small amounts of dioxins are released from sediment and suspended particulate matter to become biologically available for uptake in the food web. Biota are then exposed to these small amounts, but at the same time, biological organisms are often able to biotransform the accumu-lated pollutants creating species-specific congener patterns. Thus the differing water solubility of the congeners and biotransformation explains the difference in contribution to total TEQ seen between biota and sediment. Differences in dioxin concentrations previously observed in herring between Baltic Sea basins (Big-nert et al. 2011, Bignert et al. 2007, Karl and Ruoff 2007) may be caused in part by variations in her-ring diet between basins. Herring diet from the Baltic Sea is usually dominated by zooplankton and mysids, however, different dominant food items have been identified from Baltic herring diet during different seasons (Popiel 1951, Parmanne et al. 2004, both in Parmanne et al. 2006; Arrhenius and Hansson 1993, Mollman et al. 2004). In the Bothnian Sea, a large proportion of mysids are often seen in herring diet (Parmanne et al. 2006), whereas in the Baltic Sea Proper, herring feed predominantly on zooplankton (Arrhenius and Hansson 1993). Feeding at different trophic levels can influence bio-

SWEDISH ENVIRONMENTAL PROTECTION AGENCY REPORT 6566 Managing the dioxin problem in the Baltic region with focus on sources to air and fish
57
accumulation of dioxins (Kiviranta et al. 2003), and may contribute to differences between basins in dioxin concentrations in herring. Generally, coastal and offshore herring did not differ from each other in congener pattern or concen-trations levels, indicating that the sampled herring may not be strictly coastal/offshore populations. Coastally caught herring differed between sites for all TEQ values on a w.w. basis, but only in TEQdl-PCB value on a l.w. basis. Mysids and zooplankton congener patterns show a slight shift away from the herring pattern, while sediment is even further removed, although showing similarities to mysids and zooplankton. SIA results indicate that herring diet from Hornslandet and Norrsundet in-cludes a greater proportion of offshore food resources while coastal dietary resources predominate in herring from Skutskär and Lörudden. These differences likely explain the differences observed in TEQ values between sites on a w.w. basis. Coastal caught herring appear little influenced by dioxins in coastal sediments, as seen from the lack of significant correlation between sediment and herring dioxin concentrations, although the low number of sites included here may have influenced the outcome.
7.5 Conclusions The spatial variation of dioxin concentrations was examined within the Bothnian Sea by compar-
ing concentrations in herring at coastal and offshore sites. Congener pattern and absolute concen-trations did not differ between coastal and offshore sites (l.w.), but on a w.w. basis TEQPCDD/F dis-played higher values in coastal herring than in offshore herring. The overall lack of differences can be attributed to the migratory nature of herring populations within the Bothnian Sea, feeding mainly offshore and migrating to coastal areas for spawning for only a few weeks in the spring/summer (Lundin, 2011).
Stable isotope analysis of herring was used to examine the origin of herring diet from the four coastal locations sampled in the Bothnian Sea. A higher proportion of coastally sourced food was apparent in herring from two of the four sites, while herring diet from the other two sites was comprised mainly of offshore food sources. These results supported the differences seen on a wet weight basis between the four coastal sites, indicating that variations in diet were overall a large contributor to dioxin levels in herring in this basin.

SWEDISH ENVIRONMENTAL PROTECTION AGENCY REPORT 6566 Managing the dioxin problem in the Baltic region with focus on sources to air and fish
58
8 Pollution time trends in sediments 8.1 Introduction Changes in the pollution concentration in the water column are closely linked to changes in surface sediment concentrations. Sediment time trends can thus be used as an indicator when estimating the rate at which pollutants are entering the water body. However, due to the time lag effect caused by particle transport from erosion areas to accumulation bottoms, the pollution records in sediments show a stretched and delayed time trend compared to actual emissions. The hypotheses for the current study was that the pollution sources have changed over time, and that emission reductions of these known sources are reflected as declines in the sediments over time. In order to probe geographical and temporal variations, sediment cores were sampled at five offshore sites of the Baltic Sea (Figure 26). In addition, seven coastal sediment cores were provided from a project managed by the County Board of Gävleborg (financed by Swedish EPA through Havsmiljöanslaget), and data from two coastal cores were provided by the County Board of Uppsala.
Figure 26. Selected offshore sampling sites within the BalticPOPs project (marked in black) and coastal stations from the county board projects (marked in red). At the Lövsta Bay, two cores were sampled.

SWEDISH ENVIRONMENTAL PROTECTION AGENCY REPORT 6566 Managing the dioxin problem in the Baltic region with focus on sources to air and fish
59
The chemical characterization was combined with a multivariate source tracing technique known as Positive Matrix Factorization. This method uses statistics to explore the contamination composition of the samples in order to identify sources and apportion their contributions.
8.2 Method 8.2.1 Sampling of offshore sediment cores The five offshore sampling stations were selected to represent a north-to-south gradient in the Baltic Sea (Figure 26). Sampling was conducted by the Geological Survey of Sweden (SGU) within the framework of the Swedish Status and Trend Monitoring Program (SSTMP). Table 4 shows details of the sampling locations.
Table 4. The sampling sites for the offshore cores.
Station SGU site
Sample ID SGU
X (RT90) Y (RT 90) Sampling
date Water
depth (m) Sed. rate (mm yr-1)
N Bothnian Bay SE-17 08_0170 7253357 1854916 2008 88 0.32
N Bothnian Sea SE-2 08_0156 6956506 1663306 2008 200 0.91
S Bothnian Sea SE-3 08_0149 6796985 1625135 2008 79 0.76
Baltic Proper SE-7 05k-0001 6326299 1714352 2003 177 0.62
Arkona basin SE-12 08_0039 6098014 1381802 2008 47 0.47
In addition, three sediment layers from very old cores (>1000 years) sampled in the northern Bothnian Sea and in the Arkona Basin (Table 5) were analysed. The cores were sub-sampled in the oldest part of the postglacial strata at depths varying from 300 to 550 cm. These fine-grained sediment layers were deposited during the recession of the Weichselian land ice (last ice age), thus they were formed well before the industrial era. More details can be found in Cato et al. (2012). Table 5. Sampling data for very old sediment layers (>1000 years).
Station Sample ID
SGU
Subsample core length
(cm)
Type of sediment
Latitude N WGS84
(m)
Latitude E WGS84
(m)
Water depth
(m)
LOI1
(%)
N Bothnian Sea 11-0258 520-530 Postglacial gyttja clay
631558.1 184331.6 16 2.6
N Bothnian Sea 11-0419 540-550 Postglacial clay gyttja
622817.8 172023.2 18 2.1
Arkona Basin 01d_0014 300-305 Postglacial
clay 551347.5 134004.0 42 6.2
1 LOI: Loss on ignition
To ensure undisturbed sediment, accumulation bottoms were located using hydro-acoustic methods (side-scan sonar and sub-bottom profiler) and inspected with a video camera prior to sampling. All sampling was performed using a Gemini corer (a twin-barrel Niemistö Corer). The physical quality of the sediment cores was additionally examined using X-ray technique by a digital sediment scanner (Cato et al. 2000) on board the vessel. The samples were visually inspected prior to subsampling for any signs of sediment disturbance. The subsamples were kept frozen (-18°C) in glass jars until analy-sis.

SWEDISH ENVIRONMENTAL PROTECTION AGENCY REPORT 6566 Managing the dioxin problem in the Baltic region with focus on sources to air and fish
60
8.2.2 Dating of offshore sediment cores The sedimentation rates were calculated based on 137Cs-dating by the Swedish Radiation Safety Au-thority (SSM). The sedimentation rate at each sampling site was determined by first measuring the activity of the isotope 137Cs in each 1-cm thick subsample cut out from the sediment core, and then identifying the activity peak caused by the Chernobyl accident in April 1986. The average sedimenta-tion rate was then calculated from the quota sediment depth/sampling year. Based on 137Cs-dating, sedimentation rates were determined to be between 0.32 and 0.91 mm yr-1 at the different stations (Table 4). Reported years are based on Ge-Li-detector dating performed in 2003 (the previous sam-pling round at the same sampling sites as in 2008).
8.2.3 Quantification All tetra-octa-CDD/Fs, tri-deca CBs and HCB were determined in the five sediment cores using meth-ods described by Sundqvist et al. (2009a). Unlike the previous chapters in this report, where only the seventeen 2,3,7,8-substituted PCDD/Fs were analysed, all congeners were determined here to enable the multivariate source tracing. Analyses were performed at the Department of Chemistry, Umeå Uni-versity. TEQs were calculated using the WHO 2005 TEFs. The concentration of ΣPCB7 refers to the sum level of the PCB congeners 28, 52, 101, 118, 138, 153 and 180. In the Arkona Basin core, the layer corresponding to 1961-1965 showed disproportionately high con-centrations as compared to adjacent levels. The same trend was noted for all the analysed compound groups (Figure 28, 31 and 37). Although natural causes cannot be ruled out, contamination or misla-belling during sampling, handling or analysis appears more likely. This layer was disregarded in the discussions.
8.2.4 Pollution fingerprints and source tracing The composition of pollutants (such as the relative abundance of congeners) in emissions from anthro-pogenic and natural processes is often relatively constant over time. Such stable and source-specific compositions, fingerprints, can be used to investigate from which type of emission sources pollutants origin. Sometimes, a simple fingerprint consisting of the ratio of two substances can be used, but usu-ally a much more detailed fingerprint is required to distinguish between different emission types. When dealing with complex source fingerprints, sophisticated statistical methods are required due to the large amount of data. This report uses two kinds of multivariate techniques to explore the data, the non-quantitative method Principal Component Analysis (PCA) and the quantitative method Positive Matrix Factorization (PMF). In multivariate source tracking, the following general assumptions are made: - the pollution composition of the emissions are constant over the study period, - the studied compounds do not react with each other (i.e., they can be added linearly) and, - the pollution composition is not affected during transport from the source to the environmental
sample (receptor). The chemical fingerprints in this report are not individual in the sense that specific industries can be identified. Instead, the fingerprint can be used to identify a type of industrial activity or natural pro-cess. In some instances, industrial processes with large similarities cannot be separated and thus only a source category can be identified instead of a specific activity or process.
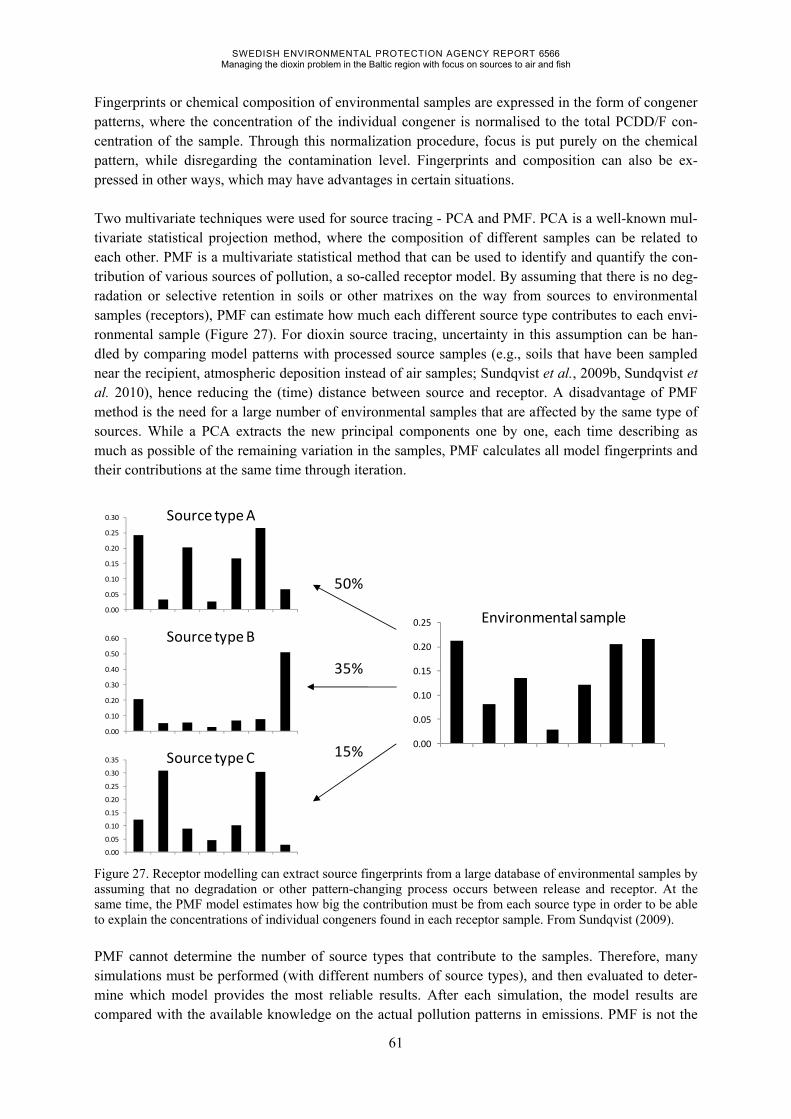
SWEDISH ENVIRONMENTAL PROTECTION AGENCY REPORT 6566 Managing the dioxin problem in the Baltic region with focus on sources to air and fish
61
Fingerprints or chemical composition of environmental samples are expressed in the form of congener patterns, where the concentration of the individual congener is normalised to the total PCDD/F con-centration of the sample. Through this normalization procedure, focus is put purely on the chemical pattern, while disregarding the contamination level. Fingerprints and composition can also be ex-pressed in other ways, which may have advantages in certain situations. Two multivariate techniques were used for source tracing - PCA and PMF. PCA is a well-known mul-tivariate statistical projection method, where the composition of different samples can be related to each other. PMF is a multivariate statistical method that can be used to identify and quantify the con-tribution of various sources of pollution, a so-called receptor model. By assuming that there is no deg-radation or selective retention in soils or other matrixes on the way from sources to environmental samples (receptors), PMF can estimate how much each different source type contributes to each envi-ronmental sample (Figure 27). For dioxin source tracing, uncertainty in this assumption can be han-dled by comparing model patterns with processed source samples (e.g., soils that have been sampled near the recipient, atmospheric deposition instead of air samples; Sundqvist et al., 2009b, Sundqvist et al. 2010), hence reducing the (time) distance between source and receptor. A disadvantage of PMF method is the need for a large number of environmental samples that are affected by the same type of sources. While a PCA extracts the new principal components one by one, each time describing as much as possible of the remaining variation in the samples, PMF calculates all model fingerprints and their contributions at the same time through iteration.
Figure 27. Receptor modelling can extract source fingerprints from a large database of environmental samples by assuming that no degradation or other pattern-changing process occurs between release and receptor. At the same time, the PMF model estimates how big the contribution must be from each source type in order to be able to explain the concentrations of individual congeners found in each receptor sample. From Sundqvist (2009).
PMF cannot determine the number of source types that contribute to the samples. Therefore, many simulations must be performed (with different numbers of source types), and then evaluated to deter-mine which model provides the most reliable results. After each simulation, the model results are compared with the available knowledge on the actual pollution patterns in emissions. PMF is not the
0.00
0.05
0.10
0.15
0.20
0.25
0.30
0.00
0.10
0.20
0.30
0.40
0.50
0.60
0.00
0.05
0.10
0.15
0.20
0.25
0.30
0.35
0.00
0.05
0.10
0.15
0.20
0.25
50%
35%
15%
Source type A
Source type B
Source type C
Environmental sample

SWEDISH ENVIRONMENTAL PROTECTION AGENCY REPORT 6566 Managing the dioxin problem in the Baltic region with focus on sources to air and fish
62
only multivariate receptor modelling method, but it has an advantage over many others because the model can take into account the uncertainty in the measurement data (i.e., the measured concentrations in environmental samples). In that way, higher uncertainty can be given to values close to the chemical detection or quantification limit, as these values are significantly more uncertain than values well above the limit.
8.3 Results and discussion 8.3.1 Concentration time trends in offshore areas DIOXINS The total tetra-octa-CDD/F concentrations in the surface sediments were fairly similar at the three northernmost stations, ranging from 430 to 530 pg g-1 d.w. (Figure 28). By far the highest surface concentration was noted in the Baltic Proper, 1 700 pg g-1 d.w. The surface sediments of the Arkona station showed an intermediate concentration of 910 pg g-1 d.w. Based on the calculated sedimentation rates, the peak concentrations were found in material deposited in the late 1980s and early 1990s in all cores. Previously published time trend studies in the Baltic Sea are scarce, but Kjeller and Rappe (1995) reported total concentrations of tetra-octa-CDD/Fs in a core sample from the Baltic Proper (station P18, between the island of Gotland and the Swedish mainland) corresponding to the time period 1878-1988. The highest concentration was noted in the 1978 layer (1800 pg g-1 d.w.); however, the concen-tration in the surface sediments remained high (1 500 pg g-1 d.w.). Despite the somewhat earlier peak concentration noted by Kjeller and Rappe, the shape of the time trend noted in the core from 1988 corresponds well with those reported here (Figure 29). All of the investigated cores show a rather steep increase during a period of approximately 20 years prior to the peak concentrations. However, the decreasing trends are more varied with a sharper initial trend in the northern sites. Koistinen et al. (1997) showed decreasing concentrations of 2,3,7,8-substituted PCDD/Fs in the Gulf of Finland, an area polluted by chlorophenol and PVC production, as well as in the Gotland deep in the Baltic Proper based on analysis of the top 3 cm of the sediments sampled in 1993. Furthermore, previous measurements in the Bothnian Sea have indicated decreasing time trend based on 2,3,7,8-PCDD/F congeners (station SR5, in the southern Bothnian Sea; Verta et al. 2007). A core sampled in 2002-2003 showed a maximum concentration at approximately 8 to 16 cm depth depend-ing on the congener, which is roughly in line with the present study.
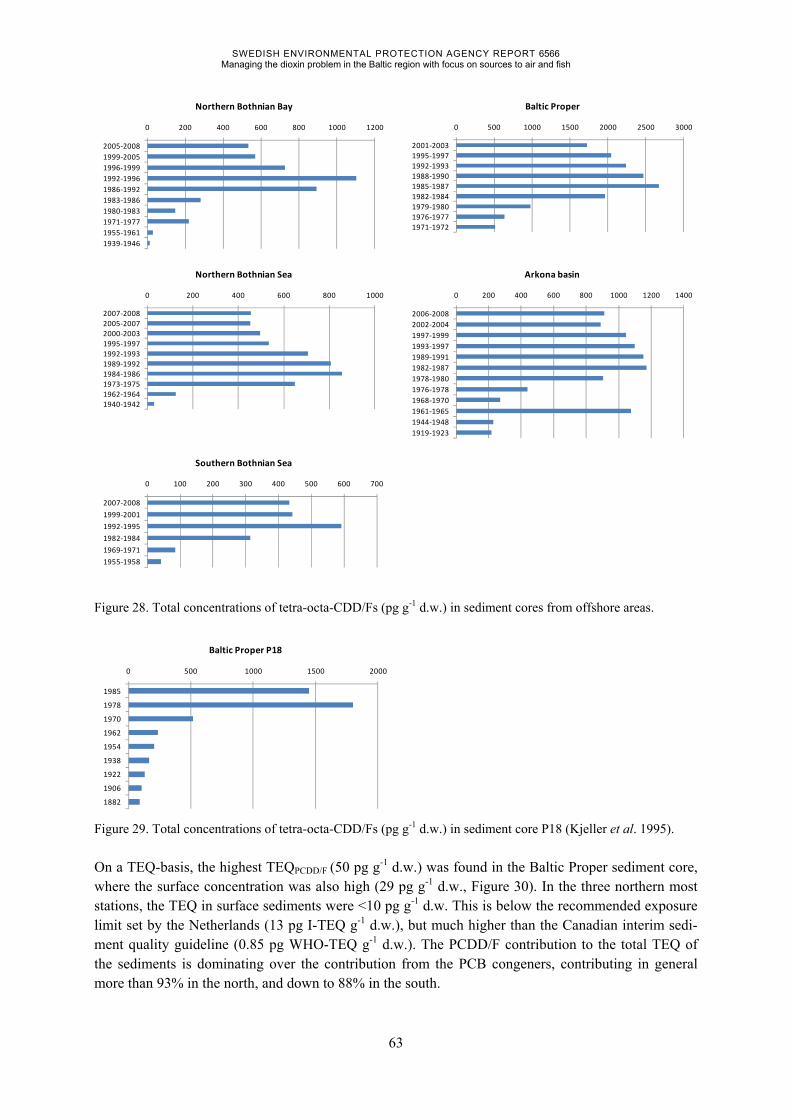
SWEDISH ENVIRONMENTAL PROTECTION AGENCY REPORT 6566 Managing the dioxin problem in the Baltic region with focus on sources to air and fish
63
Figure 28. Total concentrations of tetra-octa-CDD/Fs (pg g-1 d.w.) in sediment cores from offshore areas.
Figure 29. Total concentrations of tetra-octa-CDD/Fs (pg g-1 d.w.) in sediment core P18 (Kjeller et al. 1995).
On a TEQ-basis, the highest TEQPCDD/F (50 pg g-1 d.w.) was found in the Baltic Proper sediment core, where the surface concentration was also high (29 pg g-1 d.w., Figure 30). In the three northern most stations, the TEQ in surface sediments were <10 pg g-1 d.w. This is below the recommended exposure limit set by the Netherlands (13 pg I-TEQ g-1 d.w.), but much higher than the Canadian interim sedi-ment quality guideline (0.85 pg WHO-TEQ g-1 d.w.). The PCDD/F contribution to the total TEQ of the sediments is dominating over the contribution from the PCB congeners, contributing in general more than 93% in the north, and down to 88% in the south.
0 200 400 600 800 1000 1200
2005-2008
1999-2005
1996-1999
1992-1996
1986-1992
1983-1986
1980-1983
1971-1977
1955-1961
1939-1946
Northern Bothnian Bay
0 500 1000 1500 2000 2500 3000
2001-2003
1995-1997
1992-1993
1988-1990
1985-1987
1982-1984
1979-1980
1976-1977
1971-1972
Baltic Proper
0 200 400 600 800 1000
2007-2008
2005-2007
2000-2003
1995-1997
1992-1993
1989-1992
1984-1986
1973-1975
1962-1964
1940-1942
Northern Bothnian Sea
0 200 400 600 800 1000 1200 1400
2006-2008
2002-2004
1997-1999
1993-1997
1989-1991
1982-1987
1978-1980
1976-1978
1968-1970
1961-1965
1944-1948
1919-1923
Arkona basin
0 100 200 300 400 500 600 700
2007-2008
1999-2001
1992-1995
1982-1984
1969-1971
1955-1958
Southern Bothnian Sea
0 500 1000 1500 2000
1985
1978
1970
1962
1954
1938
1922
1906
1882
Baltic Proper P18

SWEDISH ENVIRONMENTAL PROTECTION AGENCY REPORT 6566 Managing the dioxin problem in the Baltic region with focus on sources to air and fish
64
Figure 30. Concentrations of TEQ PCDD/F (pg g-1 d.w.) in sediment cores from offshore areas and the relative contribution to TEQ from different PCDD/F congeners.
0 5 10 15 20
2005-2008
1999-2005
1996-1999
1992-1996
1986-1992
1983-1986
1980-1983
1971-1977
1955-1961
1939-1946
Northern Bothnian Bay
0% 20% 40% 60% 80% 100%
2005-2008
1999-2005
1996-1999
1992-1996
1986-1992
1983-1986
1980-1983
1971-1977
1955-1961
1939-1946
Northern Bothnian Bay
0 2 4 6 8 10 12 14
2007-2008
2005-2007
2000-2003
1995-1997
1992-1993
1989-1992
1984-1986
1973-1975
1962-1964
1940-1942
Northern Bothnian Sea
0% 20% 40% 60% 80% 100%
2007-2008
2005-2007
2000-2003
1995-1997
1992-1993
1989-1992
1984-1986
1973-1975
1962-1964
1940-1942
Northern Bothnian Sea
0 2 4 6 8 10 12 14
2007-2008
1999-2001
1992-1995
1982-1984
1969-1971
1955-1958
Southern Bothnian Sea
0% 20% 40% 60% 80% 100%
2007-2008
1999-2001
1992-1995
1982-1984
1969-1971
1955-1958
Southern Bothnian Sea
0 10 20 30 40 50 60
2001-2003
1995-1997
1992-1993
1988-1990
1985-1987
1982-1984
1979-1980
1976-1977
1971-1972
Baltic Proper
0% 20% 40% 60% 80% 100%
2001-2003
1995-1997
1992-1993
1988-1990
1985-1987
1982-1984
1979-1980
1976-1977
1971-1972
Baltic Proper
0 5 10 15 20
2006-2008
2002-2004
1997-1999
1993-1997
1989-1991
1982-1987
1978-1980
1976-1978
1968-1970
1961-1965
1944-1948
1919-1923
Arkona basin
0% 20% 40% 60% 80% 100%
2006-2008
2002-2004
1997-1999
1993-1997
1989-1991
1982-1987
1978-1980
1976-1978
1968-1970
1961-1965
1944-1948
1919-1923
Arkona basin
2378-TCDF 12378-PeCDF 23478-PeCDF 123478-HxCDF 123678/123479-HxCDF
234678-HxCDF 123789/123489-HxCDF 1234678-HpCDF 1234789-HpCDF OCDF
2378-TCDD 12378-PeCDD 123478-HxCDD 123678-HxCDD 123789-HxCDD
1234678-HpCDD OCDD

SWEDISH ENVIRONMENTAL PROTECTION AGENCY REPORT 6566 Managing the dioxin problem in the Baltic region with focus on sources to air and fish
65
The time trends of TEQPCDD/F followed those of the total tetra-octa-CDD/F concentrations. The relative contributions from individual congeners were fairly constant over time, except in the oldest layers. This may in part be due to the low concentrations in the deepest layers, with several congeners below the LOQ. Generally, 2,3,4,7,8-PeCDF contributed the most to the TEQPCDD/F, but 2,3,7,8-TCDF, 1,2,3,4,7,8-HxCDF and 1,2,3,7,8-PeCDD were also important, and in some cases contributed equally, or even higher than 2,3,4,7,8-PeCDF. PCBs The total tri-deca-CB concentrations in surface sediments showed similar spatial and temporal trends as PCDD/Fs. The peak concentrations at the three northern stations ranged from 5 800 to 7 100 pg g-1 d.w. (Figure 31), while the peak concentration in the Baltic Proper sediment core was more than 10 times higher (94 000 pg g-1 d.w.). Again, the Arkona Basin site showed an intermediate concentration compared to the other sites, with a peak of 18 000 pg g-1 d.w., and a surface concentration of 14 000 pg g-1 d.w.
Figure 31. Concentrations of tri-deca-CBs (pg g-1 d.w.) in sediment cores from offshore areas. In most cores, the homologue composition was fairly constant down to layers corresponding to the early 1970s, but deeper layer showed a clearly increased proportion of the tri- and tetra-chlorinated homologues (Figure 32). Looking at the homologue concentrations, tri- and tetra-CBs are actually much more constant over the studied time period than the higher chlorinated homologues. The highest relative increases over time were noted for penta- to octa-CBs (up to over 10 000 times). One reason for the time trend seen in the composition may be changes in emissions, but differences in environ-
0 2000 4000 6000 8000 10000
2005-2008
1999-2005
1996-1999
1992-1996
1986-1992
1983-1986
1980-1983
1971-1977
1955-1961
1939-1946
Northern Bothnian Bay
0 20000 40000 60000 80000 100000
2001-2003
1995-1997
1992-1993
1988-1990
1985-1987
1982-1984
1979-1980
1976-1977
1971-1972
Baltic Proper
0 1000 2000 3000 4000 5000 6000 7000 8000
2007-2008
2005-2007
2000-2003
1995-1997
1992-1993
1989-1992
1984-1986
1973-1975
1962-1964
1940-1942
Northern Bothnian Sea0 5000 10000 15000 20000
2006-2008
2002-2004
1997-1999
1993-1997
1989-1991
1982-1987
1978-1980
1976-1978
1968-1970
1961-1965
1944-1948
1919-1923
Arkona basin
0 1000 2000 3000 4000 5000 6000 7000
2007-2008
1999-2001
1992-1995
1982-1984
1969-1971
1955-1958
Southern Bothnian Sea

SWEDISH ENVIRONMENTAL PROTECTION AGENCY REPORT 6566 Managing the dioxin problem in the Baltic region with focus on sources to air and fish
66
mental behaviour because of differences in physical-chemical properties, environmental persistence, and formation through degradation of other congeners may also be influential.
Figure 32. Contributions of PCB homologue groups in sediment cores from offshore areas (NBB=northern Bothnian Bay, NBS=northern Bothnian Sea, SBS=northern Bothnian Sea, BP=Baltic Proper and AB=Arkona Basin) for a) the surface layer and b) the deepest layer.
The ΣPCB7 shows the same time trends as the total tri-deca-PCB concentrations. The composition within each core was relatively stable, although there was a tendency for a higher proportion of low-chlorinated congeners in the deeper layers, as noted for the homologues (Figures 32, 33). ΣPCB7 in a core sample from the Baltic Proper (station P18, between Gotland and the Swedish main-land) corresponding to a time period between 1880 and 1988 shows concentrations ranging between 180 and 11 000 pg g-1 d.w. (Figure 34; Kjeller and Rappe 1995). The highest concentration was noted in the 1978 layer, similar to PCDD/F. The concentration in the surface layer was drastically lower (2 600 pg g-1 d.w.) than the concentration measured in the corresponding layer in the Baltic Proper in the current study. Thus, the older study suggests a lower peak concentration with a much sharper decrease in overlying sediments. The discrepancy noted between the concentrations in the two studies may be caused by the distance between the sampling locations. The time trends of TEQdl-PCB were similar to total tri-deca-CB and ΣPCB7 (Figure 35). Again, the Bal-tic Proper core showed the highest surface concentration (2.9 pg TEQPCB g-1 d.w.) and overall maxi-mum concentration (6.1 pg TEQPCB g-1 d.w.). The main contributors to TEQPCB were PCB 126 and 169, while PCB 118 (+106) shows the highest concentrations among the PCB congeners (Figure 36).
0%
10%
20%
30%
40%
50%
60%
70%
80%
90%
100%N
BB
20
05
-20
08
NB
S 2
00
7-2
00
8
SBS
20
07
-20
08
BP
20
01
-20
03
AB
20
06
-20
08
0%
10%
20%
30%
40%
50%
60%
70%
80%
90%
100%
NB
B 1
93
9-1
94
6
NB
S 1
94
0-1
94
2
SBS
19
55
-19
58
BP
19
71
-19
72
AB
19
19
-19
23
Tri Tetra Penta Hexa Hepta Octa Nona Deca
a b

SWEDISH ENVIRONMENTAL PROTECTION AGENCY REPORT 6566 Managing the dioxin problem in the Baltic region with focus on sources to air and fish
67
Figure 33. Concentrations of ΣPCB7 (pg g-1 d.w.), in sediment cores from offshore areas.
Figure 34. Concentrations of ΣPCB7 (pg g-1 d.w.) in sediment core P18 (Kjeller et al. 1995).
0 500 1000 1500 2000 2500 3000 3500
2005-2008
1999-2005
1996-1999
1992-1996
1986-1992
1983-1986
1980-1983
1971-1977
1955-1961
1939-1946
Northern Bothnian Bay
0 5000 10000 15000 20000 25000 30000
2001-2003
1995-1997
1992-1993
1988-1990
1985-1987
1982-1984
1979-1980
1976-1977
1971-1972
Baltic Proper
0 500 1000 1500 2000 2500 3000
2007-2008
2005-2007
2000-2003
1995-1997
1992-1993
1989-1992
1984-1986
1973-1975
1962-1964
1940-1942
Northern Bothnian Sea
0 1000 2000 3000 4000 5000 6000 7000 8000
2006-2008
2002-2004
1997-1999
1993-1997
1989-1991
1982-1987
1978-1980
1976-1978
1968-1970
1961-1965
1944-1948
1919-1923
Arkona basin
0 500 1000 1500 2000 2500
2007-2008
1999-2001
1992-1995
1982-1984
1969-1971
1955-1958
Southern Bothnian SeaPCB28
PCB69+73+52
PCB84+89+90+101
PCB106+118
PCB153
PCB138+164+163
PCB180
0 2000 4000 6000 8000 10000 12000
1985
1978
1970
1962
1954
1938
1922
1906
1882
Baltic Proper P18

SWEDISH ENVIRONMENTAL PROTECTION AGENCY REPORT 6566 Managing the dioxin problem in the Baltic region with focus on sources to air and fish
68
0.0 0.5 1.0 1.5 2.0 2.5
2006 -2008
2002 -2004
1997 -1999
1993 -1997
1989 -1991
1982 -1987
1978 -1980
1976 -1978
1968 -1970
1961 -1965
1944 -1948
1919 -1923
Arkona Basin
Figure 35. Concentrations of TEQdl-PCB (pg g-1 d.w.) in sediment cores from offshore areas.
Figure 36. Average congener contributions to TEQdl-PCB concentration and congener pattern in sediment cores from offshore areas.
0.0 0.2 0.4 0.6 0.8 1.0 1.2
2005-2008
1999-2005
1996-1999
1992-1996
1986-1992
1983-1986
1980-1983
1971-1977
1955-1961
1939-1946
Northern Bothnian Bay
0.0 1.0 2.0 3.0 4.0 5.0 6.0 7.0
2001-2003
1995-1997
1992-1993
1988-1990
1985-1987
1982-1984
1979-1980
1976-1977
1971-1972
Baltic Proper
0.0 0.2 0.4 0.6 0.8
2007-2008
2005-2007
2000-2003
1995-1997
1992-1993
1989-1992
1984-1986
1973-1975
1962-1964
1940-1942
Northern Bothnian Sea
0.0 0.2 0.4 0.6 0.8
2007-2008
1999-2001
1992-1995
1982-1984
1969-1971
1955-1958
Southern Bothnian Sea
0%
10%
20%
30%
40%
50%
60%
70%
80%
90%
100%
Contribution to TEQ Congener pattern
PCB189
PCB169
PCB157
PCB156
PCB128+167
PCB126
PCB105+127
PCB114
PCB106+118
PCB123
PCB77
PCB81

SWEDISH ENVIRONMENTAL PROTECTION AGENCY REPORT 6566 Managing the dioxin problem in the Baltic region with focus on sources to air and fish
69
HEXACHLOROBENZENE The time trends of HCB were clearly different from the time trends of dioxins and PCB. After a de-crease, starting in the early to mid-1990s, increasing levels from around 2000 were seen, and the peak level was detected at the surface layer (Figure 37). The Baltic Proper core was an exception, with lowest concentrations observed in the surface layer. The peak concentration was generally between 400 and 500 pg g-1 d.w., but for the Baltic Proper, a concentration of 1 400 pg g-1 d.w. was noted. HCB was banned in Sweden in 1980, thus emissions are expected to have decreased since then. The increas-ing trend opposes the general decreasing trends seen in many other sediment core studies around the world (Barber et al. 2005), and trends in Baltic biota (Bignert et al. 2010). These observations may not be alarming, but continuous monitoring within the framework of the Swedish Status and Trend Moni-toring Program is advisable.
Figure 37. Concentrations of HCB (pg g-1 d.w.) in sediment cores from offshore areas.
8.3.2 Dioxin time trends in coastal areas Results obtained from two studies run by Swedish County Boards present information on dioxin con-centration time trends in coastal areas. The coastal sampling locations were not chosen to represent the most contaminated spots, but rather to reflect different industrial activity or locations where the con-tamination source is unknown. In total, nine coastal sediment cores were investigated; three from the Bothnian Bay and six from the Bothnian Sea. This study is published separately, but is presented here in short for comparison to the offshore data (Assefa et al. 2012, Sobek et al. 2012).
0 100 200 300 400 500
2005-2008
1999-2005
1996-1999
1992-1996
1986-1992
1983-1986
1980-1983
1971-1977
1955-1961
1939-1946
Northern Bothnian Bay
0 200 400 600 800 1000 1200 1400 1600
2001-2003
1995-1997
1992-1993
1988-1990
1985-1987
1982-1984
1979-1980
1976-1977
1971-1972
Baltic Proper
0 100 200 300 400 500
2007-2008
2005-2007
2000-2003
1995-1997
1992-1993
1989-1992
1984-1986
1973-1975
1962-1964
1940-1942
Northern Bothnian Sea 0 50 100 150 200 250 300 350 400
2006-2008
2002-2004
1997-1999
1993-1997
1989-1991
1982-1987
1978-1980
1976-1978
1968-1970
1961-1965
1944-1948
1919-1923
Arkona basin
0 100 200 300 400 500 600
2007-2008
1999-2001
1992-1995
1982-1984
1969-1971
1955-1958
Southern Bothnian Sea

SWEDISH ENVIRONMENTAL PROTECTION AGENCY REPORT 6566 Managing the dioxin problem in the Baltic region with focus on sources to air and fish
70
The time trends in coastal areas varied more than in offshore areas, and the decrease from peak con-centrations were generally more dramatic (Figure 38). The largest decrease in coastal areas was no-ticed for Seskarö Bay, where the surface concentration has decreased to 6% of the peak concentration. Most of the investigated coastal locations showed maximum concentrations in layers corresponding to an earlier time period than for the offshore cores.
8.3.3 PCDD/F source tracing for sediment cores of the Baltic Sea The sediment core data were first explored using PCA to get an initial view of the compositional varia-tion and major source types. PCA can also be used as an indicator as to the maximum number of sources that contributes to the samples. The PCA results are not presented or discussed here, because the receptor modelling using PMF gave results in line with the PCA, and additionally gives the quanti-tative source contributions. PMF modelling was carried out for scenarios with three to eight source types. Samples and congeners with many values below detection limits were removed because they mainly add uncertainty in the model, or add little or no relevant information from a tracking standpoint. In order to achieve reliable results, it is important to include many samples with high pattern variation. Therefore, PCDD/F data from a previous study was included in the modelling (Sundqvist et al. 2010). The final data matrix contained 56 chromatographic peaks (each corresponding to one or more congeners) and 269 samples. Using the diagnostic tools available, it was concluded that six source types could explain the composi-tion of PCDD/F in the studied samples in a satisfactory manner. Three of the estimated model patterns could be linked to diffuse atmospheric sources, including combustion and other high-temperature sources, while the other three could be related to sources of point source character. The model patterns were very similar to those obtained in Sundqvist et al. (2010), and the source identification process is described in detail in that publication. Below is a short description on how the source identification was carried out in this study. IDENTIFICATION OF MAJOR SOURCE TYPES The three model patterns associated with diffuse atmospheric sources are presented in Figure 39. The first pattern is essentially identical to that seen in the background atmospheric deposition at a research station in Vindeln in northern Sweden (Figure 40a), whereas the other two have characteristics similar to patterns from combustion (Figure 40b). Incineration and other high temperature processes are diffi-cult to characterise and differentiate from each other because the emission pattern depends on combus-tion conditions and the fuel composition. These emission patterns can therefore vary over time, and the pollution pattern in Figure 40b should only be seen as an example and not necessarily as a typical combustion source pattern. Despite the known variability, certain characteristic congeners were noted, and the composition within each homologue tended to be relatively stable, although the congener pat-tern varied. It is important to note that the model pattern referred to as Atmospheric background also shows large similarities with the pollution patterns in wood preservatives of PCP type. An assessment must be made in each sample based on what is known about the sampling area, as well as the other pollutants present in the sample. PCP has, in contrast to the atmospheric background, been shown to contain three highly chlorinated PCDFs. These congeners can be used as additional markers to identify chlo-rophenol use.

SWEDISH ENVIRONMENTAL PROTECTION AGENCY REPORT 6566 Managing the dioxin problem in the Baltic region with focus on sources to air and fish
71
Figure 38. Total concentrations of tetra-octa-CDD/Fs (pg g-1 d.w.) in sediment cores from coastal areas. For dated cores, the given year is an average for the time span that the sediment layer represents.
0 500 1000 1500 2000 2500 3000 3500 4000
0-2 cm
4-6 cm
8-10 cm
12-14 cm
16-18 cm
22-24 cm
28-30 cm
34-36 cm
42-44 cm
52-54 cm
Total tetra-octa-CDD/F (pg g-1 d.w.)
Seskarö Bay
0 100 200 300 400 500 600 700
0-2 cm
4-6 cm
8-10 cm
12-14 cm
18-20 cm
24-26 cm
30-32 cm
38-40 cm
Total tetra-octa-CDD/F (pg g-1 d.w.)
Gussö Bay
0 1000 2000 3000 4000 5000 6000
0-2 cm
4-6 cm
8-10 cm
12-14 cm
16-18 cm
22-24 cm
28-30 cm
34-36 cm
40-42 cm
Total tetra-octa-CDD/F (pg g-1 d.w.)
Skelleftehamn Bay
0 5000 10000 15000 20000
0-2 cm
4-6 cm
10-12 cm
15-17 cm
22-24 cm
26-28 cm
33-35 cm
38-40 cm
45-47 cm
Total tetra-octa-CDD/F (pg g-1 d.w.)
Lövsta Bay 6
0 10000 20000 30000 40000 50000
0-2 cm
4-6 cm
9-11 cm
13-15 cm
17-19 cm
21-23 cm
25-27 cm
30-32 cm
34-36 cm
38-40 cm
Total tetra-octa-CDD/F (pg g-1 d.w.)
Lövsta Bay 4

SWEDISH ENVIRONMENTAL PROTECTION AGENCY REPORT 6566 Managing the dioxin problem in the Baltic region with focus on sources to air and fish
72
Figure 39. PMF model patterns related to atmospheric sources, including combustion and other high temperature processes.
Figure 40. a) Atmospheric deposition pattern from a background station at Vindeln in northern Sweden, and b) an example of emission patterns from waste combustion. Note that combustion patterns vary with fuel composi-tion and combustion conditions.
Among the three model patterns that are connected to the direct point sources, one pattern was virtual-ly identical to the pollution patterns that have been measured at some sawmills areas where chlorophe-nols have been used in wood treatment (Figure 41). This pattern was dominated by three highly chlo-
0.00
0.10
0.20
0.30
0.40
0.50
0.60
0.70
0.80
Frac
tio
n o
f to
tal c
onc
Model pattern - Atmospheric background
0.00
0.02
0.04
0.06
0.08
0.10
0.12
0.14
0.16
Frac
tio
n o
f to
tal c
onc
Model pattern - Combustion 1
0.00
0.02
0.04
0.06
0.08
0.10
0.12
13
68
-TF
14
68
-TF
24
68
-TF
13
78
-TF*
13
48
-TF*
14
78
-TF*
12
37
-TF*
24
67
-TF*
12
78
-TF
12
67
-TF*
23
78
-TF*
23
67
-TF
12
69
-TF*
12
47
8-P
eF*
14
67
8-P
eF*
13
46
9-P
eF*
12
37
8-P
eF*
12
36
7-P
eF
12
67
8-P
eF*
23
47
8-P
eF*
23
46
7-P
eF
12
34
68-
HxF
13
46
78-
HxF
*
12
46
79-
HxF
12
46
89-
HxF
12
34
78-
HxF
*
12
36
78-
HxF
*
12
34
69-
HxF
*
23
46
78-
HxF
*
12
37
89-
HxF
*
12
34
678
-HpF
12
34
679
-HpF
12
34
689
-HpF
12
34
789
-HpF OF
13
68
-TD
13
79
-TD
13
69
-TD
13
78
-TD
*
12
68
-TD
*
23
78
-TD
*
12
78
-TD
12
46
8-P
eD*
12
36
8-P
eD
12
47
8-P
eD
12
37
9-P
eD
12
34
7-P
eD
12
37
8-P
eD
12
36
7-P
eD
12
38
9-P
eD
12
34
68-
HxD
12
36
79-
HxD
*
12
34
78-
HxD
*
12
34
679
-HpD
12
34
678
-HpD
OC
DD
Frac
tio
n o
f to
tal c
onc
Model pattern- Combustion 2
0.000.050.100.150.200.250.300.350.400.45
Frac
tio
n o
f to
tal c
onc
Atmospheric background deposition, Vindeln average 2007
0.00
0.01
0.02
0.03
0.04
0.05
0.06
0.07
0.08
13
68
-TF
14
68
-TF
24
68
-TF
13
78
-TF*
13
48
-TF*
14
78
-TF*
12
37
-TF*
24
67
-TF*
12
78
-TF
12
67
-TF*
23
78
-TF*
23
67
-TF
12
69
-TF*
12
47
8-P
eF*
14
67
8-P
eF*
13
46
9-P
eF*
12
37
8-P
eF*
12
36
7-P
eF
12
67
8-P
eF*
23
47
8-P
eF*
23
46
7-P
eF
12
34
68-
HxF
13
46
78-
HxF
*
12
46
79-
HxF
12
46
89-
HxF
12
34
78-
HxF
*
12
36
78-
HxF
*
12
34
69-
HxF
*
23
46
78-
HxF
*
12
37
89-
HxF
*
12
34
678
-HpF
12
34
679
-HpF
12
34
689
-HpF
12
34
789
-HpF OF
13
68
-TD
13
79
-TD
13
69
-TD
13
78
-TD
*
12
68
-TD
*
23
78
-TD
*
12
78
-TD
12
46
8-P
eD*
12
36
8-P
eD
12
47
8-P
eD
12
37
9-P
eD
12
34
7-P
eD
12
37
8-P
eD
12
36
7-P
eD
12
38
9-P
eD
12
34
68-
HxD
12
36
79-
HxD
*
12
34
78-
HxD
*
12
34
679
-HpD
12
34
678
-HpD
OC
DD
Frac
tio
n o
f to
tal c
onc
Example of MSWI
A
B

SWEDISH ENVIRONMENTAL PROTECTION AGENCY REPORT 6566 Managing the dioxin problem in the Baltic region with focus on sources to air and fish
73
rinated PCDF, which also dominate in chlorophenol formulations where tetrachlorophenol constitutes a significant component (as opposed to pure PCP products; Sundqvist et al. 2010). As mentioned above, the model pattern known as Atmospheric background may also reflect chlorophenol prepara-tions. Two different model patterns could thus potentially represent the use of chlorophenol. The rela-tive abundance of its two model patterns were used as an indicator to determine whether Atmospheric background in the individual samples should be interpreted as background pollution or as PCP use.
Figure 41. PMF model pattern identified as related to tetrachlorophenol.
The second model pattern that was assumed to represent point sources was totally dominated by two HxCDD congeners (1,2,3,6,7,9/1,2,3,6,8,9-HxCDD; Figure 42). These congeners were identified in several different products in the early 1990s: pulp, paper, ink, pine resin and tall oil fatty acid (Bichlmaier et al. 1992, Kitunen and Salkinoja-Salonen 1990, Rappe et al. 1990a, Rappe et al. 1990b, Santl et al. 1994a, Santl et al. 1994b, Sundqvist et al. 2010). Experiments reported by Luthe et al. (1993) showed that these congeners were formed during the kraft pulp process when specific chemical precursors were available. The precursors were identified as hepta-phenoxyphenols, which have been found in large quantities in certain chlorophenol preparations (Luthe et al. 1993, Persson et al. 2007). This pollution pattern may thus be indirectly linked to the use of chlorophenol. The reasons for why this pattern was also seen in, for example pine resin and tall oil, is likely due to the fact that these products are produced via distillation of residues from the kraft pulp process.
Figure 42. PMF model pattern identified as being related to kraft pulp production and related industries.
The last model pattern shows a clear dominance of 2,3,7,8-TCDF (Figure 43). The pattern also in-cludes 1278-TCDF and 2,3,7,8-TCDD, indicating that this pattern may reflect emissions from chlorine bleaching of pulp and the production of chlorine gas using graphite electrodes in the mercury method. The use of graphite electrodes continued until the mid-1970s in Sweden, when titanium electrodes were introduced as a replacement. Measurements showed that although the changed electrodes greatly reduced the emissions of PCDD/Fs, emissions still occurred when titanium electrodes were used.
0.00
0.05
0.10
0.15
0.20
0.25
0.30
0.35
13
68
-TF
14
68
-TF
24
68
-TF
13
78
-TF*
13
48
-TF*
14
78
-TF*
12
37
-TF*
24
67
-TF*
12
78
-TF
12
67
-TF*
23
78
-TF*
23
67
-TF
12
69
-TF*
12
47
8-P
eF*
14
67
8-P
eF*
13
46
9-P
eF*
12
37
8-P
eF*
12
36
7-P
eF
12
67
8-P
eF*
23
47
8-P
eF*
23
46
7-P
eF
12
34
68-
HxF
13
46
78-
HxF
*
12
46
79-
HxF
12
46
89-
HxF
12
34
78-
HxF
*
12
36
78-
HxF
*
12
34
69-
HxF
*
23
46
78-
HxF
*
12
37
89-
HxF
*
12
34
678
-HpF
12
34
679
-HpF
12
34
689
-HpF
12
34
789
-HpF OF
13
68
-TD
13
79
-TD
13
69
-TD
13
78
-TD
*
12
68
-TD
*
23
78
-TD
*
12
78
-TD
12
46
8-P
eD*
12
36
8-P
eD
12
47
8-P
eD
12
37
9-P
eD
12
34
7-P
eD
12
37
8-P
eD
12
36
7-P
eD
12
38
9-P
eD
12
34
68-
HxD
12
36
79-
HxD
*
12
34
78-
HxD
*
12
34
679
-HpD
12
34
678
-HpD
OC
DD
Frac
tio
n o
f to
tal c
onc
Model pattern - Chlorophenol
0.00
0.05
0.10
0.15
0.20
0.25
0.30
0.35
0.40
13
68
-TF
14
68
-TF
24
68
-TF
13
78
-TF*
13
48
-TF*
14
78
-TF*
12
37
-TF*
24
67
-TF*
12
78
-TF
12
67
-TF*
23
78
-TF*
23
67
-TF
12
69
-TF*
12
47
8-P
eF*
14
67
8-P
eF*
13
46
9-P
eF*
12
37
8-P
eF*
12
36
7-P
eF
12
67
8-P
eF*
23
47
8-P
eF*
23
46
7-P
eF
12
34
68-
HxF
13
46
78-
HxF
*
12
46
79-
HxF
12
46
89-
HxF
12
34
78-
HxF
*
12
36
78-
HxF
*
12
34
69-
HxF
*
23
46
78-
HxF
*
12
37
89-
HxF
*
12
34
678
-HpF
12
34
679
-HpF
12
34
689
-HpF
12
34
789
-HpF OF
13
68
-TD
13
79
-TD
13
69
-TD
13
78
-TD
*
12
68
-TD
*
23
78
-TD
*
12
78
-TD
12
46
8-P
eD*
12
36
8-P
eD
12
47
8-P
eD
12
37
9-P
eD
12
34
7-P
eD
12
37
8-P
eD
12
36
7-P
eD
12
38
9-P
eD
12
34
68-
HxD
12
36
79-
HxD
*
12
34
78-
HxD
*
12
34
679
-HpD
12
34
678
-HpD
OC
DD
Frac
tio
n o
f to
tal c
onc
Model pattern - HxCDD/Kraft

SWEDISH ENVIRONMENTAL PROTECTION AGENCY REPORT 6566 Managing the dioxin problem in the Baltic region with focus on sources to air and fish
74
Graphite electrodes were also used in chlorate production and are expected to have resulted in similar contamination at those facilities.
Figure 43. PMF model pattern identified as chlorine-related. The pattern is assumed to reflect the chlorine bleaching of pulp and the production of chloralkali by graphite electrodes in the mercury method.
SOURCE APPORTIONMENT For source apportionment, relative contributions from the modelled source types are calculated. They were assigned in accordance to the reasoning in the previous section, but it is important to keep in mind that these are our best estimates and that they represent source types. In the following, the con-tribution from the source types are given only as capitalised key-words, i.e., Chlorine, HxCDD, etc. SOURCE CONTRIBUTIONS FOR COASTAL STATIONS As noted above, the time trends in coastal areas varied more than in offshore areas. Receptor model-ling also revealed that source apportionment showed large variation at coastal stations. In most cases, the candidate sources could be linked to industrial activity that had taken place at or near the sampling area. Source apportionment for these stations is given in a report to be published by the County Board of Gävleborg (Sobek et al. 2012). SOURCE CONTRIBUTIONS FOR OFFSHORE STATIONS Compared to the costal stations, the offshore stations showed less variation in the source contributions, which was expected due to the larger distance from point sources. However, in the two northern most stations, a high proportion was estimated to originate from HxCDD/Kraft and Chlorophenol, respec-tively. In several cores, there appears to be a minor influence from the Chlorine pattern. However, the large fraction of low-chlorinated PCDFs in this source candidate pattern may, in particular, cause con-tributions from combustion processes to be interpreted as Chlorine. This makes it challenging to draw conclusions regarding the possible influence of the chlorine bleach/chloralkali production in offshore areas. In the northern Bothnian Bay sediment core, HxCDD/Kraft pulp appeared to be an important contribu-tor (Figure 44). In addition, Chlorophenol also contributed to the PCDD/F pollution. The increase in contributions from the Kraft pulp pattern happened in the late-1980s to early-1990s, and a slow de-crease can be seen from the mid- to late-1990s.
0.00
0.05
0.10
0.15
0.20
0.25
13
68
-TF
14
68
-TF
24
68
-TF
13
78
-TF*
13
48
-TF*
14
78
-TF*
12
37
-TF*
24
67
-TF*
12
78
-TF
12
67
-TF*
23
78
-TF*
23
67
-TF
12
69
-TF*
12
47
8-P
eF*
14
67
8-P
eF*
13
46
9-P
eF*
12
37
8-P
eF*
12
36
7-P
eF
12
67
8-P
eF*
23
47
8-P
eF*
23
46
7-P
eF
12
34
68-
HxF
13
46
78-
HxF
*
12
46
79-
HxF
12
46
89-
HxF
12
34
78-
HxF
*
12
36
78-
HxF
*
12
34
69-
HxF
*
23
46
78-
HxF
*
12
37
89-
HxF
*
12
34
678
-HpF
12
34
679
-HpF
12
34
689
-HpF
12
34
789
-HpF OF
13
68
-TD
13
79
-TD
13
69
-TD
13
78
-TD
*
12
68
-TD
*
23
78
-TD
*
12
78
-TD
12
46
8-P
eD*
12
36
8-P
eD
12
47
8-P
eD
12
37
9-P
eD
12
34
7-P
eD
12
37
8-P
eD
12
36
7-P
eD
12
38
9-P
eD
12
34
68-
HxD
12
36
79-
HxD
*
12
34
78-
HxD
*
12
34
679
-HpD
12
34
678
-HpD
OC
DD
Frac
tio
n o
f to
tal c
onc
Model pattern - Chlorine

SWEDISH ENVIRONMENTAL PROTECTION AGENCY REPORT 6566 Managing the dioxin problem in the Baltic region with focus on sources to air and fish
75
Figure 44. PCDD/F source contributions in the offshore sediment core of the northern Bothnian Bay according to the PMF model.
In the northern Bothnian Sea sediment core, a clear influence from chlorophenol use was identified starting during late 1960s or early 1970s (Figure 45). It is even clearer in the offshore areas than in the coastal areas that chlorophenol use has had a large influence even after the ban in 1978. In fact, the time trend in the offshore areas suggests a significant time lag for point source emissions directly to the water. However, for chlorophenol use, emissions to the water may be direct (primary) by dumping of leftover chemicals and surface water runoff from areas with drying lumber, but emissions may also be stretched over a longer period of time with leakage from contaminated soils (secondary sources).
Figure 45. PCDD/F source contributions in the offshore sediment core of the northern Bothnian Sea according to the PMF model.
0 200 400 600 800 1000 1200
2005-2008
1999-2005
1996-1999
1992-1996
1986-1992
1983-1986
1980-1983
1971-1977
1955-1961
Total tetra-octa-CDD/F (pg g-1 d.w.)
N Bothnian Bay
Atmospheric background
Combustion 1
Combustion 2
Chlorophenol
HxCDD
Chlorine
Model residual
0 200 400 600 800 1000
2007-2008
2005-2007
2000-2003
1995-1997
1992-1993
1989-1992
1984-1986
1973-1975
1962-1964
1940-1942
Total tetra-octa-CDD/F (pg g-1 d.w.)
N Bothnian Sea
Atmospheric background
Combustion 1
Combustion 2
Chlorophenol
HxCDD
Chlorine
Model residual

SWEDISH ENVIRONMENTAL PROTECTION AGENCY REPORT 6566 Managing the dioxin problem in the Baltic region with focus on sources to air and fish
76
The relative proportion of Combustion 1 compared to the other atmospheric patterns is lower in the northern Bothnian Sea sediment core than in the northern Bothnian Bay, but it increases again in off-shore areas further south. In the sediment core from the southern Bothnian Sea, only a few of the deeper layers were available for analysis, which limits the retrospective information gained. The large time gaps make it impossible to evaluate the shape of the peak and compare it to other areas. However, the source contributions indicate an increased importance of Chlorophenol between the early 1970s and early 1980s (Figure 46).
Figure 46. PCDD/F source contributions in the offshore sediment core of the southern Bothnian Sea according to the PMF model.
In the Baltic Proper (Figure 47) and the Arkona Basin (Figure 48), atmospheric sources were indicated as more important than in more northern cores. Measurements of PCDD/F in air have shown that when the sampled air masses have travelled over the European continent, the levels were higher than when air arrived at the Baltic Sea from the north or west (Sellström et al. 2009). Air measurements by Sell-ström et al. (2009) did not show a consistent pollutant pattern in air masses from high concentration regions, but the sediment cores indicate that Combustion 1 was more important in the southern Baltic Sea than further north. This could possibly be the result of combustion-related sources on the Europe-an continent contributing to the Baltic Sea. The three northernmost offshore cores (N Bothnian Bay, N Bothnian Sea and S Bothnian Sea; Figure 44-46) show relatively constant proportions between the Chlorophenol pattern and Atmospheric back-ground, except during the Chlorophenol peak in the northern Bothnian Sea. The Arkona Basin sedi-ment core did show a bit more variation over time in contributions from Atmospheric background and Chlorophenol (even when excluding the layer corresponding to 1961-1965, Figure 46). This variation may be the result of a poor fit between the model and the measurement. However, a detailed study of the congener patterns throughout the core suggests that there are in fact clear variations in the compo-sition between layers.
0 100 200 300 400 500 600 700
2007-2008
1999-2001
1992-1995
1982-1984
1969-1971
1955-1958
Total tetra-octa-CDD/F (pg g-1 d.w.)
S Bothnian Sea
Atmospheric background
Combustion 1
Combustion 2
Chlorophenol
HxCDD
Chlorine
Model residual

SWEDISH ENVIRONMENTAL PROTECTION AGENCY REPORT 6566 Managing the dioxin problem in the Baltic region with focus on sources to air and fish
77
Figure 47. PCDD/F source contributions in the offshore sediment core of the Baltic Proper according to the PMF model.
Figure 48. PCDD/F source contributions in the offshore sediment core of the Arkona Basin according to the PMF model.
0 500 1000 1500 2000 2500 3000
2001-2003
1995-1997
1992-1993
1988-1990
1985-1987
1982-1984
1979-1980
1976-1977
1971-1972
Total tetra-octa-CDD/F (pg g-1 d.w.)
Baltic Proper
Atmospheric background
Combustion 1
Combustion 2
Chlorophenol
HxCDD
Chlorine
Model residual
0 200 400 600 800 1000 1200 1400
2006-2008
2002-2004
1997-1999
1993-1997
1989-1991
1982-1987
1978-1980
1976-1978
1968-1970
1961-1965
1944-1948
1919-1923
Total tetra-octa-CDD/F (pg g-1 d.w.)
Arkona basin
Atmospheric background
Combustion 1
Combustion 2
Chlorophenol
HxCDD
Chlorine
Model residual

SWEDISH ENVIRONMENTAL PROTECTION AGENCY REPORT 6566 Managing the dioxin problem in the Baltic region with focus on sources to air and fish
78
8.3.4 Dioxins in preindustrial sediment layers The analyses of the very old (>1000 years) fine-grained sediment layers showed very low concentra-tions of PCDD/Fs with TEQs ranging from 0.2 to 1.5 pg g-1 d.w. (non-detect congeners included with concentration set to half of the LOQ). These levels are comparable to those found in layers pre-1925 (the oldest layer from Arkona Sea, Nordmaling and Sandarne), which ranged from 0.5 to 5.5 pg TEQ g-1 d.w. These values should be compared to current levels of top layers in offshore areas of the Baltic Sea, which ranged from 8 to 29 pg TEQ g-1 d.w. (mean 14 pg TEQ g-1 d.w.) in the current study, im-plying that Baltic offshore areas are still elevated compared to natural background levels.
8.4 Conclusions Clear decreasing time trends for both PCBs and PCDD/F was demonstrated in sediment cores in
all investigated areas of the Baltic Sea. For dioxins, which were measured both in coastal and off-shore areas, the decline was slower in offshore areas. The levels of PCDD/Fs in coastal sediments declined by a factor of approximately 2 between the mid-1980s and today, whereas the offshore sediments mostly declined by less than a factor of 2 between the mid-1980s and today. The con-sistent decreasing time trend throughout the Baltic shows that emission reduction measures for these pollutants have been effective. By contrast, increasing concentration time trends for HCB were shown for all sampling sites, except for the Baltic Proper.
Peak concentrations of PCDD/Fs generally appeared earlier in coastal areas than in offshore are-as, particularly if only the typical point source areas in the coastal category were included (mid-1960s to late-1970s versus mid-1980s to late-1990s). These findings indicate that terrestrial sources will eventually affect the open sea after some time lag, and that the declining levels in the Baltic Sea can be attributed to reductions in air emissions as well as in direct emissions.
Source tracing for PCDD/Fs showed that for the Baltic Sea as a whole, air emissions are and have been the most important external sources. This is particularly true for offshore areas in the south.
Direct emissions were shown to be an important contributor to PCDD/F levels in sediment cores. Although little influence of the chlorine bleaching and its related industry was seen in the sedi-ments, impact from typical land-based sources, such as chlorophenol use and kraft pulp emis-sions, were shown to be of importance in the northern sub-basins, both in coastal and offshore ar-eas.
Analysis of preindustrial sediment layers showed TEQ-levels of approx. 1 pg TEQ g-1 d.w., sig-nificantly lower than levels in offshore top sediments of today (8-29 pg TEQ g-1 d.w.). The input of dioxins to the sea has changed over time with both changing concentrations and clear congener pattern changes following the increase of pollution. It should, however, be noted that the pollution composition is showing slow fingerprint changes. Thus, although the concentrations have de-creased as a result of measures taken, the pollution patterns of the sediment in these remote areas are still affected by previous emissions. These observations suggest a slow system recovery, which may be one reason for the lack of decline or slow decline in Baltic herring dioxin concen-trations.
The previously predicted sediment time trends from the model in Wiberg et al. (2009) are likely slightly too fast. The model predicted a decline of a factor of 3 between 1986 and 2006, whereas data in this chapter indicates a decline of a factor of 2 or less depending on location. The most plausible explanation for the discrepancy between model estimated declines in sediments and the sediment time trends data from this chapter is the oversimplification of sediment dynamics in the model.

SWEDISH ENVIRONMENTAL PROTECTION AGENCY REPORT 6566 Managing the dioxin problem in the Baltic region with focus on sources to air and fish
79
9 Aerosol-water distribution of dioxins and PCBs in the Baltic Sea region 9.1 Introduction Several studies have indicated that atmospheric deposition is the major input pathway for dioxins to the Baltic Sea (Armitage et al. 2009, Sundqvist et al. 2010, Verta et al. 2007). For dioxins, deposition with aerosols is the dominating pathway from the atmosphere to water whereas gaseous air-water exchange seems to be more important for PCBs, as suggested by a previous study in the Atlantic Ocean (Jurado et al. 2004). Hence, knowledge about the availability of these compounds after they are deposited to the water will have implications for future actions to be taken to reduce levels of dioxins in fish of the Baltic Sea. To investigate the availability of dioxins and PCBs sorbed to aerosols, aero-sol-water distribution ratios were determined for aerosols collected in Stockholm, close to the Baltic Sea. These were compared to previously reported sediment-pore water distribution ratios in Baltic Sea surface sediments (Cornelissen et al. 2008). A more complete description of the work is available in a separate publication (Sobek et al., 2013).
9.2 Methods A high-volume air sampler was deployed at 10 m height at Stockholm University, around 1 km from the shore of the Baltic Sea (59°37’N, 18°06’E). Aerosols were sampled on GFF filters once a month from February through November 2010. In total, 261 000 m3 of air and 5.0 g of aerosol were sampled. The average aerosol content of the air was 18±11 µg m-3. The filters were carefully cut into eight piec-es to allow parallel exhaustive extraction (Soxhlet) and passive sampler extraction (POM) from the same filter. In addition to the individual samples, triplicates of an integrated nine-month sample (a pool of all the individual monthly samples) were also extracted. Extraction of total PCDD/F and PCB content in the aerosol particulate matter was carried out using Soxhlet-Dean-Stark by refluxing with toluene. In order to assess the available fraction of dioxins and PCB in the aerosols, filter samples were shaken with distilled water, polyoxymethylene (POM-17), NaN3 and NaCl (concentrations similar to Baltic Sea water, 6 g L-1) continuously for 180 days. The seventeen 2,3,7,8-substituted PCDD/F congeners, the dl-PCBs (non-ortho and mono-ortho PCBs), and the indicator PCBs (28, 52, 101, 118, 138, 153 and 180) were analysed. The sum of the latter are referred to as ΣPCB7. TEQs for PCDD/Fs and PCBs were calculated using the WHO 2005 TEFs. Field, laboratory and POM blanks were analysed for PCDD/Fs and PCBs in parallel with the samples. The total organic carbon (TOC) and black carbon (BC) content of the aerosol samples were determined following procedures outlined by Gustafsson et al. (2001). To assess the availability of dioxins and PCBs sorbed to aerosols once they have entered the water column, aerosol OC-water distribution ratios (Kaer-water,OC) were calculated from total concentrations on aerosols and the freely dissolved aqueous concentrations determined in the POM experiments. The equilibrium aerosol-water distribution ratios, normalised to the mass fraction of organic carbon (fOC), is defined as: Kaer-water,OC (Lwater/kgTOC) = Caerosol / (Cwater x fOC) where the contaminant in the aerosols, Caerosol, and water, Cw, are at equilibrium.

SWEDISH ENVIRONMENTAL PROTECTION AGENCY REPORT 6566 Managing the dioxin problem in the Baltic region with focus on sources to air and fish
80
To assess the relative sorption strength and thus the availability of the dioxins and PCBs entering the Baltic Sea via aerosols, measured Kaer-water,OC was compared to sediment OC-water distribution ratios (Ksed-water,OC) reported in a previous Baltic Sea study (Cornelissen et al. 2008). The Ksed-water,OC were determined in the same way as Kaer-water using extraction with POM.
9.3 Dioxin and PCB concentrations in aerosols Dioxin and PCB aerosol contents ranged from 65 to 1300 pg g-1 d.w. TEQ and from 5 to 44 pg g-1 d.w. TEQ (values <LOQ excluded), respectively, with the highest concentrations observed in the winter months (Table 6). Aerosol concentrations of ΣPCB7 ranged between 22 and 100 ng g-1 d.w. Concentra-tions normalised to air volume (0.3 to 1.4 fg TEQ m-3) agreed well with concentrations previously reported for air samples collected in Sweden (Sellström et al. 2009). The nine-month average aerosol dioxin concentrations (d.w. basis) were a factor 11 higher than the concentrations reported for the Baltic Sea sediment top layer in a previous study (Cornelissen et al. 2008), whereas the PCB concentrations in aerosols were a factor 7 higher than in the sediment top layer (Table 6). The relatively high concentrations in aerosols compared to sediment suggest that aero-sols form an important pathway of dioxins and PCBs into the Baltic Sea. The difference in sediment and aerosol concentrations was smaller on an OC-normalised basis com-pared to total concentrations (Table 6). Thus, dioxins and PCBs associated with OC apparently be-come diluted during settlement in the water column, not only by co-sedimentation of autochthonous OC, but also by terrestrial particulate matter.
9.4 Aerosol TOC and BC content Aerosol TOC content varied from 6 to 21%, without any clear seasonal trend. BC content varied from 0.3 - 1.4%, with the highest BC content in February and March (no data available for December and January). The fraction of BC in TOC (BC/TOC) varied between 1 and 10 % with a nine-month aver-age of 4.6%. Baltic Sea offshore sediments have reported BC/TOC ratios of 3.1 - 4.9% (Cornelissen et al. 2008) and 4.6 - 47% (Sanchez-Garcia et al. 2010).
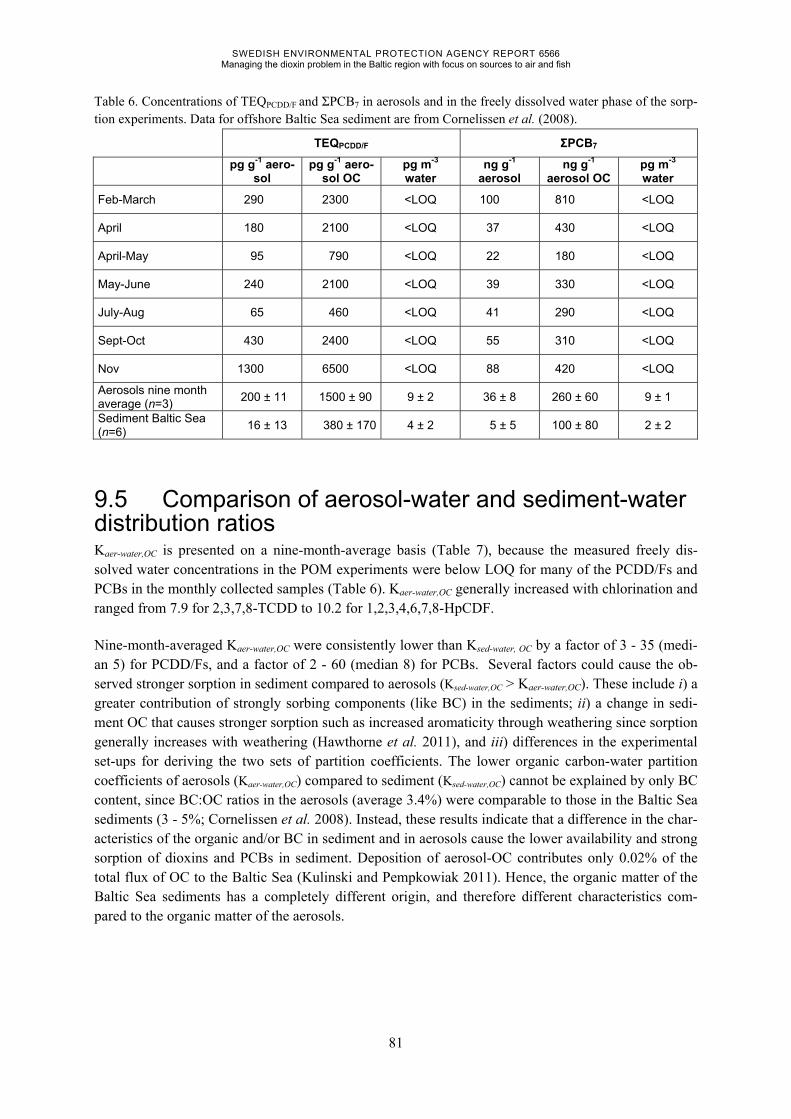
SWEDISH ENVIRONMENTAL PROTECTION AGENCY REPORT 6566 Managing the dioxin problem in the Baltic region with focus on sources to air and fish
81
Table 6. Concentrations of TEQPCDD/F and ΣPCB7 in aerosols and in the freely dissolved water phase of the sorp-tion experiments. Data for offshore Baltic Sea sediment are from Cornelissen et al. (2008).
TEQPCDD/F ΣPCB7
pg g-1 aero-
sol pg g-1 aero-
sol OC pg m-3
water ng g-1
aerosol ng g-1
aerosol OC pg m-3
water
Feb-March 290 2300 <LOQ 100 810 <LOQ
April 180 2100 <LOQ 37 430 <LOQ
April-May 95 790 <LOQ 22 180 <LOQ
May-June 240 2100 <LOQ 39 330 <LOQ
July-Aug 65 460 <LOQ 41 290 <LOQ
Sept-Oct 430 2400 <LOQ 55 310 <LOQ
Nov 1300 6500 <LOQ 88 420 <LOQ
Aerosols nine month average (n=3)
200 ± 11 1500 ± 90 9 ± 2 36 ± 8 260 ± 60 9 ± 1
Sediment Baltic Sea (n=6)
16 ± 13 380 ± 170 4 ± 2 5 ± 5 100 ± 80 2 ± 2
9.5 Comparison of aerosol-water and sediment-water distribution ratios Kaer-water,OC is presented on a nine-month-average basis (Table 7), because the measured freely dis-solved water concentrations in the POM experiments were below LOQ for many of the PCDD/Fs and PCBs in the monthly collected samples (Table 6). Kaer-water,OC generally increased with chlorination and ranged from 7.9 for 2,3,7,8-TCDD to 10.2 for 1,2,3,4,6,7,8-HpCDF.
Nine-month-averaged Kaer-water,OC were consistently lower than Ksed-water, OC by a factor of 3 - 35 (medi-an 5) for PCDD/Fs, and a factor of 2 - 60 (median 8) for PCBs. Several factors could cause the ob-served stronger sorption in sediment compared to aerosols (Ksed-water,OC > Kaer-water,OC). These include i) a greater contribution of strongly sorbing components (like BC) in the sediments; ii) a change in sedi-ment OC that causes stronger sorption such as increased aromaticity through weathering since sorption generally increases with weathering (Hawthorne et al. 2011), and iii) differences in the experimental set-ups for deriving the two sets of partition coefficients. The lower organic carbon-water partition coefficients of aerosols (Kaer-water,OC) compared to sediment (Ksed-water,OC) cannot be explained by only BC content, since BC:OC ratios in the aerosols (average 3.4%) were comparable to those in the Baltic Sea sediments (3 - 5%; Cornelissen et al. 2008). Instead, these results indicate that a difference in the char-acteristics of the organic and/or BC in sediment and in aerosols cause the lower availability and strong sorption of dioxins and PCBs in sediment. Deposition of aerosol-OC contributes only 0.02% of the total flux of OC to the Baltic Sea (Kulinski and Pempkowiak 2011). Hence, the organic matter of the Baltic Sea sediments has a completely different origin, and therefore different characteristics com-pared to the organic matter of the aerosols.

SWEDISH ENVIRONMENTAL PROTECTION AGENCY REPORT 6566 Managing the dioxin problem in the Baltic region with focus on sources to air and fish
82
Table 7. Aerosol-water distribution ratios measured in this study and sediment-water distribution ratios reported by Cornelissen et al. (2008), both on an OC basis.
Compound Log Ksed-water,OC
(L kgTOC-1)
Log Kaer-water,OC
(L kgTOC-1)
2378 TCDD 8.9 ± 0.13 7.9 ± 0.12
12378 PeCDD 9.1 ± 0.07 8.2 ± 0.14
123478 HxCDD 10.0 ± 0.13 9.1 ± 0.00
123678 HxCDD 10.1 ± 0.12 9.5 ± 0.03
123789 HxCDD 10.1 ± 0.16 9.1 ± 0.46
1234678 HpCDD 10.8 ± 0.18 10.4 ± 0.11
OCDD 11.6 ± 0.25 <LOQ
2378 TCDF 8.3 ± 0.15 7.7 ± 0.08
12378 PeCDF 9.0 ± 0.18 8.0 ± 0.09
23478 PeCDF 9.0 ± 0.10 8.0 ± 0.04
123478 HxCDF 9.8 ± 0.12 9.2 ± 0.01
123678 HxCDF 9.9 ± 0.13 9.2 ± 0.07
234678 HxCDF 9.5 ± 0.12 9.0 ± 0.04
123789 HxCDF 9.8 ± 0.17 <LOQ
1234678 HpCDF 10.6 ± 0.24 10.2 ± 0.08
1234789 HpCDF 10.4 ± 0.17 <LOQ
OCDF 11.4 ± 0.21 <LOQ
9.6 Conclusions The measured aerosol-water distribution ratios indicate that dioxins and PCBs that enter the
Baltic Sea via aerosols are less strongly bound and therefore presumably more bioavailable than dioxins and PCBs sorbed to organic matter in Baltic Sea surface sediments (Cornelissen et al. 2008).
Sorption of dioxins and PCBs to the organic matter fraction of aerosols is, however, about a factor 5 stronger than predicted from the equilibrium partitioning model (Seth et al. 1999), which is an empirical model that can be used to predict the distribution of pollutants between organic carbon and water. This large sorption capacity may indicate that soot (black) carbon present in the aerosols, and in sediments, enhances sorption of dioxins and PCBs to the aero-sols.
Since atmospheric deposition is a significant pathway of especially PCDD/Fs to the Baltic Sea, these findings have implications for the bioaccumulation and potential ecotoxicity of these toxic chemicals.

SWEDISH ENVIRONMENTAL PROTECTION AGENCY REPORT 6566 Managing the dioxin problem in the Baltic region with focus on sources to air and fish
83
10 Tracing the origin of dioxins in Baltic air using an atmospheric modelling ap-proach 10.1 Introduction Here we aim to trace the origin of dioxins in Baltic air using a spatially and temporally resolved at-mospheric model. The primary objective is to investigate whether the levels of measured concentra-tions in air and deposition flux samples at three monitoring stations in Sweden and Finland can be reproduced using state-of-the-knowledge emission estimates. In a similar study (Zhang et al. 2009), total atmospheric concentrations of PCDD/Fs over the North American continent were reproduced using a modified version of the CMAQ model. The factor of agreement ranged from 1 to about 12. Over- and underestimations were attributed to uncertainty in the official emission estimates used as model input. If the model predictions and measurements are in good agreement, the model can be used to determine the approximate source regions contributing to dioxins in Baltic air and deposition, and thus Baltic Sea levels. A secondary objective was to identify deficiencies in the emission database by determining the degree of disagreement between model predictions and measurements when emissions originated from different source regions. Adjusted emission scenarios were constructed and new model simulations undertaken to try to optimise agreement between model predictions and measure-ments. A more complete description of the work is available in a separate publication (Shatalov et al., 2012).
10.2 Methods 10.2.1 Selected congeners In previous air and deposition flux monitoring campaigns conducted by scientists from Stockholm and Umeå Universities, the 17 most toxic 2,3,7,8-substituted PCDD/Fs were measured. We selected a subset of four congeners for model evaluation. One of the most important criteria for selecting these four congeners was a low inter-correlation between the concentrations of each congener in the moni-toring data set. A low correlation is an indication that the congeners originate from distinct source types. Air data from the monitoring site at Svartberget and Aspvreten (Bergknut et al. 2011, Sellström et al. 2009) were statistically analysed, and the congeners 2,3,4,7,8-PeCDF, OCDF, 1,2,3,7,8,9-HxCDD and OCDD were proposed. In addition to relatively low inter-correlation, these four conge-ners also had a high detection frequency and represent a range of chlorination level, i.e. a range of physical-chemical properties and partitioning behaviour. The selected congeners are representative of the full range of physical-chemical properties for the 2,3,7,8-substituted PCDD/F congeners. For ex-ample, the range of the log octanol-water partition coefficient (log Kow) is 6.2-8.2 for all of the 2,3,7,8-substituted PCDD/F congeners and 6.8-8.2 for the four congeners selected here (Aberg et al. 2008).
10.2.2 The MSCE-POP model The model selected for this study was the MSCE-POP model (Gusev et al. 2005a, Malanichev et al. 2004), which is a three-dimensional Eulerian multi-compartment model operating with a spatial reso-lution of 50 × 50 km2. It includes environmental compartments to represent the troposphere, surface soils, seawater and vegetation as well as basic processes describing emissions, long-range atmospheric transport, deposition flux, degradation and gaseous exchange between the atmosphere and the underly-ing surfaces. Meteorological data reported for the timespan of interest is used as model input. The

SWEDISH ENVIRONMENTAL PROTECTION AGENCY REPORT 6566 Managing the dioxin problem in the Baltic region with focus on sources to air and fish
84
horizontal dimensions of the model domain are confined by the EMEP grid and described by Ilyin and Travnikov (2005). Figure 49 provides a map of the EMEP domain, which includes the entire European continent and some surrounding areas. A full description of the MSCE-POP model is given in EMEP/MSC-E Technical Report 5/2005 (Gusev et al. 2005a). The model outputs used for this study are total (sums of gaseous and particulate) air concentrations in fg I-TEQ m-3, deposition rates (monthly sums of dry particulate deposition and wet deposition fluxes in pg I-TEQ m-2 month) and contributions of “source regions” (explained further in 10.2.4) to annual concentrations and deposition rates. The TEQs were calculated using the international toxicity equiva-lency factors I-TEFs adopted by NATO/CCMS (1988). In order to evaluate the contribution of an emission source region to concentrations and deposition fluxes in each model grid cell, the model calculates the transport of a pollutant from each emission source region separately.
10.2.3 Model parameterisation The physical-chemical property data are compiled in Annex A of EMEP/MSC-E Technical Report 5/2005 (Gusev et al. 2005a). The MSCE-POP model uses chemical-specific dry deposition velocities over land, sea and forest as well as chemical-specific washout ratios for particle-bound scavenging by precipitation (also described in Annex A in Gusev et al. 2005a). The MSCE-POP model requires environmental input data on soil and vegetation properties, water currents, meteorology etc. The environmental data sets were the default values used in the MSCE-POP model. The model uses real meteorological data for parameterising atmospheric transport. The details of the environmental inputs and meteorological parameterisation are described in EMEP/MSC-E Technical Report 5/2005 (Gusev et al. 2005a). To account for long-term accumulation in the environmental media and for dioxins advecting into the EMEP region from background air, a hemispheric model (Gusev et al. 2005b) was run for the period 1970-2007. Levels of dioxins advecting into the EMEP region were estimated using all emission sources for the Northern Hemisphere except for those within the EMEP grid as model input. The diox-in emissions in the Asian part of Russia were estimated using numbers for the European part of the country and data on population density. The dioxin emissions of Tajikistan, Turkmenistan and Uzbek-istan were taken from the unofficial inventory of dioxin emissions in the Central Asian countries made in the framework of the global International POPs Elimination Project (IPEP) (Hodjamberdiev 2006). The latest available information on dioxin emission in the USA was taken from the dioxin inventories prepared by UNEP for 1995 (UNEP 1999). The spatial distribution of dioxin emissions in the Central Asian countries and the Asian part of Russia was constructed on the basis of population density data (Li 1996).
10.2.4 Emission data used for model simulations The official emission data reported by EMEP countries as I-TEQs to the United Nations Economic Commission for Europe (UNECE) were used as model input in the base emission scenario. The emis-sion data were divided into different “source regions”. All source regions comprised a country/region or a group of countries. National emissions considered likely to affect dioxin deposition fluxes over the Baltic Sea (Belarus, Denmark, Estonia, Finland, France, Germany, Latvia, Lithuania, Norway, Poland, and Sweden) were assigned to individual source regions. The Russian Federation was treated as two source regions - the north-western part (Russian north-west) and the remaining part. The final three source regions were the Black Triangle region (the area where the borders of Poland, Germany and the Czech Republic intersect), the rest of the European countries together, and shipping emissions

SWEDISH ENVIRONMENTAL PROTECTION AGENCY REPORT 6566 Managing the dioxin problem in the Baltic region with focus on sources to air and fish
85
in the Baltic Sea region. The last two “source regions” are the only ones that are not concentrated in a single geographical area. Some countries reported a spatial distribution of dioxin emissions, whereas others did not. In cases where spatial emissions were not reported, estimates of spatial emission distribution were made fol-lowing guidelines made by the Netherlands Organization for Applied Scientific Research (TNO; De-nier van der Gon et al. 2005). In order to obtain data for specific PCDD/F congeners, estimates of congener profiles in European emissions produced in the POPCYCLING-Baltic project (Pacyna et al. 2003) were applied. Expert estimates made by TNO (Denier van der Gon et al. 2005) were applied if there were no officially reported data for a specific region and year. In addition, emission data for the north-western part of the Russian Federation were updated using official information on ben-zo[a]pyrene (B[a]P) emissions in this region and regression relationships between B[a]P and dioxin emissions obtained using data from the Russian Federation (national totals) and from the Ukraine (r2 ≥ 0.65). Shipping emissions (including their spatial distribution) were produced using available data on NOx emissions (Bartnicki et al. 2009) and data from the EMEP/EEA emission inventory guidebook (EMEP/EEA 2009). Seasonal variations of dioxin emissions were constructed based on the available measurements (Umlauf et al. 2010, Vikelsøe et al. 2005) and variations of other pollutants, particularly B[a]P (Ilyin et al. 2010), which are emitted by a similar group of emission sources. From examination of the reported EMEP emissions, it is evident that data for some regions and sectors are missing (Table 8). It is clear, for example, that the contributions of the transport sector to the emis-sions of dioxins in Latvia and Poland are not taken into account. In Poland, waste incineration is a significant source of dioxins whereas in other countries the contribution of this sector is minimal or absent. The range of contributions from industrial processes is rather large and for the Russian Federa-tion no official information on emission sectors is available. The major uncertainties in emission esti-mation are due to infrequent testing and an inherently high variability in emissions (Cohen et al. 2002). The variability at a single plant can vary by an order of magnitude between different sampling periods (Parma et al. 1995). Because many of the sources are not well characterised there is great uncertainty associated with the congener composition of the emissions.
10.2.5 Monitoring data for comparison with model predictions Air concentrations (annual averages, monthly averages, daily averages, here recalculated in fg I-TEQ m-3) have been measured at two well established atmospheric monitoring stations: Aspvreten (58°80′N, 17°40′E) and Pallas (68°00′N, 24°14′E) (Sellström et al. 2009). Aspvreten monitoring sta-tion is situated in a rural area south of Stockholm. This site provides information on air masses impact-ing the southern and central parts of the Baltic Sea. Pallas monitoring station is situated in a remote area in the Finnish Arctic. Results from this site represent air masses impacting the northern part of the Baltic Sea. Deposition data were obtained from a study conducted at Svartberget (64°14′N, 19°46′E) field station (Bergknut et al. 2011), which is situated in a rural boreal area approximately 70 km from Umeå in northern Sweden.

SWEDISH ENVIRONMENTAL PROTECTION AGENCY REPORT 6566 Managing the dioxin problem in the Baltic region with focus on sources to air and fish
86
Table 8. PCDD/F emissions in 2006 as reported to UNECE (EMEP 2012). The emissions of the main emission sectors in the countries surrounding or located close to the Baltic Sea are given in g I-TEQ. Their percentage contributions to total emissions for each country are given in brackets (percentages do not always add up to 100% because they have been rounded to the nearest whole number). DK – Denmark, EE – Estonia, FI – Fin-land, DE – Germany, LV – Latvia, LT - Lithuania, NO – Norway, PL – Poland, SE – Sweden, RF – the Russian Federation.
DK EE FI DE LV LT NO PL SE RF
Combustion in power plants and industry
2.3 (8)
1.26 (47)
5.1 (36)
6.0 (8)
12.6 (42)
1.5 (13)
3.1 (13)
44.9 (10)
27.2 (72)
–
Transport 0.28 (1)
0.05 (2)
2.7 (19)
3.0 (4)
0
0.2 (2)
3.3 (14)
0
0.8 (2)
–
Commercial, residential and other stationary com-bustion
19 (67)
1.34 (50)
1.1 (8)
21.2 (28)
14.1 (47)
9.5 (85)
9.2 (39)
202 (45)
3.0 (8)
–
Industrial processes 7.1
(25) 0
5.0 (35)
43.1 (57)
0.6 (2)
0
4.0 (17)
13.5 (3)
6.0 (16)
–
Agriculture 0
0
0
0
2.4 (8)
0
1.7 (7)
0
0
–
Waste incineration 0
0.05 (2)
0.1 (1)
0
0
0
2.1 (9)
184 (41)
1.1 (3)
–
10.2.6 Generating adjusted emission scenarios Using the base scenario, we could determine the degree of disagreement between model predictions and measurements when the air arrived to the monitoring sites from different compass sectors. In con-structing the adjusted emission scenarios, we attempted to identify deficiencies in the emission data-base by determining the degree of disagreement when emissions originated from different source groups. Two new emission scenarios were constructed using upward adjustment of total I-TEQ emis-sions in selected source regions suspected of having underestimated reported emissions as well as adjustment of congener composition in all source regions. An attempt to identify source regions likely to give rise to underestimation of emissions and thus modelled levels in the Baltic region was under-taken by making statistical correlations (Kcorr) between the contributions of the considered source re-gion to the average air concentrations at the Aspvreten monitoring station, and the “calculation defi-ciency”. The calculation deficiencies are a measure of the model error. These are calculated by sub-tracting the modelled concentration from the measured concentration (fg I-TEQ m-3). A correlation coefficient (Kcorr) close to one implies a strong correlation i.e., that upward adjustment of the source region’s emissions has a significant impact on calculation deficiency. Thus, in order to improve agreement between modelled and measured values, the emissions of source regions that display high correlation coefficients (Kcorr), combined with large contributions to overall concentrations at the mon-itoring stations (Fract, %), can be increased in the construction of adjusted emission scenarios. This statistical correlation approach failed to unequivocally identify deficits in the emission database, reflecting the complexity of dioxin emissions. Poland was somewhat of an exception, because it was identified as the only region with high correlation coefficients (Kcorr) as well as large contributions (Fract, %) to the monitoring stations. In other words, Poland is the only region with both large contri-bution and at the same time a strong candidate for having large underestimations. This finding is con-sistent with Sellström et al. (2009) who show that air masses originating from the European continent

SWEDISH ENVIRONMENTAL PROTECTION AGENCY REPORT 6566 Managing the dioxin problem in the Baltic region with focus on sources to air and fish
87
and the former Soviet Union contributed 65% of PCDD contamination and 75% of PCDF contamina-tion over the Baltic Sea. Further regions were also identified as contributing to the “calculation deficiencies” in the first scenar-io from consideration of Kcorr and Fract, namely; the Black Triangle, Germany, and France. These source regions were chosen based on the fact that they have correlations (Kcorr) >0.2 for two of the selected congeners. These regions do not necessarily have high contributions (Fract, %) for those con-geners showing relatively high correlations, but do have relatively high contributions (around 3%) for at least one congener. In spite of the difficulty in identifying specific source regions where emissions were underestimated, we proceeded to make some adjustments for a second and third emission scenario based on the above analysis combined with expert judgment (note the first emission scenario uses the reported EMEP emissions in their unadjusted form). The two adjusted emission scenarios were constructed by multi-plication of the emission data reported by the EMEP countries with two types of coefficients: the con-gener-specific coefficients represent emission inventory errors related to emission congener composi-tion; and the source region-specific coefficients represent emission inventory errors related to emission totals reported for the different source regions. Coefficients for the two scenarios are displayed in Table 9. Congener-specific coefficients for the two scenarios were chosen after comparison of the congener composition of reported emissions with the congener profiles of air concentrations measured at Aspvreten. In addition, congener patterns obtained from measurements at three sites near the Great Lakes (Venier et al. 2009) were also considered. Given the similar congener patterns observed in air monitoring stations for PCDD/Fs, we believe that the congener pattern measured in background air in the Baltic should roughly correspond to the congener pattern in source regions in Europe. The fraction of 2,3,4,7,8-PeCDF in the emission inventory used for calculations, corresponds approximately to its fraction in air concentrations. The fractions of the remaining congeners are lower in the emission esti-mates used as input in the first emission scenario than in the measured air concentrations. The frac-tions of these congeners in the emission estimates were therefore adjusted upwards for the second and third emission scenarios to match the fractions observed in air concentrations (Table 9). The source-specific coefficients are increased in the second scenario relative to the first (default) sce-nario to simulate increased emissions, but only for Poland and the Russian north-west by a factor of two (Table 9). An increase of a factor of two in emission estimates seems arbitrary, but was selected by systematically varying the emissions upwards in these two source regions by different factors until the best fit with measured data was achieved. As mentioned, Poland was identified from the statistical correlation to be a region which may under-report emissions; however, the Russian north-west was not identified from the statistical correlation approach, which failed to provide strong evidence of under-prediction for all other source regions. We motivate our decision to increase the emissions in the Rus-sian north-west in the second emission scenario based on evidence from Sellström et al. (2009) that this region strongly contributes to PCDD/F air pollution over the Baltic and knowledge that emissions in this region are poorly reported (see Table 8 and associated discussion). In the third scenario, emissions for Poland, France, Germany and the Black Triangle were increased by a factor of 10 relative to the first scenario. The adjustment factors (Table 9) in some regions may be artificially high. Under-reporting of emissions by a factor of 10 in France and Germany is unlikely. However, as a good fit was found for all compass sectors in the second scenario, except for south-

SWEDISH ENVIRONMENTAL PROTECTION AGENCY REPORT 6566 Managing the dioxin problem in the Baltic region with focus on sources to air and fish
88
southeast (SSE) and south-southwest (SSW), the main purpose of the third scenario was to attempt to reduce the deficiencies for these two remaining compass sectors. Table 9. Coefficients for adjustments of emission input data for the second and the third emission scenarios. PL – Poland, DE - Germany, FR – France, BT –Black Triangle region, RW – Russian West.
Scenario Congener Congener-specific coef-
ficient
Source-specific coefficients*
PL DE FR BT RW
Second
2,3,4,7,8-PeCDF 1.5
2 1 1 1 2 1,2,3,7,8,9-HxCDD 3
OCDD 6
OCDF 5
Third
2,3,4,7,8-PeCDF 1.5
10 10 10 10 2 1,2,3,7,8,9-HxCDD 3
OCDD 5
OCDF 5
* The remaining source groups’ coefficients are equal to 1.

SWEDISH ENVIRONMENTAL PROTECTION AGENCY REPORT 6566 Managing the dioxin problem in the Baltic region with focus on sources to air and fish
89
10.3 Results and discussion 10.3.1 First emission scenario According to the model results, the central, eastern and southern parts of Europe have the highest air dioxin pollution levels. Figure 49 displays spatial distributions of air concentrations of the four select-ed congeners. The spatial distribution in air concentrations is similar to the spatial emission distribu-tion (not shown). The levels of dioxins in the western part of Europe are considerably lower, and northern Europe is relatively uncontaminated. Annual averages of modelled air concentrations over the Baltic area are 0.2 - 2 fg I-TEQ m-3 for 2,3,4,7,8-PeCDF; 0.01 - 0.1 fg I-TEQ m-3 for 1,2,3,7,8,9-HxCDD; 0.001 - 0.01 fg I-TEQ m-3 for OCDD; and 0.0005 - 0.005 fg I-TEQ m-3 for OCDF.
2,3,4,7,8-PeCDF 1,2,3,7,8,9-HxCDD
OCDD OCDF
Figure 49. Spatial distributions of annual averages of air concentrations (fg I-TEQ m-3) for the four selected congeners for 2006, for the first scenario.
For the first (default) emission scenario, which uses the official emission data reported by EMEP countries, the comparison of modelling results and field data shows significant underestimation of calculated air concentrations by about a factor of 5 for 2,3,4,7,8-PeCDF (Figure 50), a factor of 10 for 1,2,3,7,8,9-HxCDD, a factor of 20-30 for OCDD, and a factor of 15-20 for OCDF. The agreement between calculations and measurements strongly depends on the compass sectors from which air

SWEDISH ENVIRONMENTAL PROTECTION AGENCY REPORT 6566 Managing the dioxin problem in the Baltic region with focus on sources to air and fish
90
masses have arrived. The agreement is particularly poor for the south-southeast (SSE) and south-southwest (SSW) compass sectors. a)
b)
Figure 50. a) Comparison of values of 2,3,4,7,8-PeCDF calculated using the first emission scenario and air con-centrations measured at Aspvreten and Pallas for 2006 and 2007 in fg I-TEQ m-3 and b) unit less measured-to-modelled concentration ratios. In both figures the x-axis displays the compass sector from which air masses originated on each sampling event. The compass sectors are defined according to Sellström et al. (2009). The vertical line marks the division of values based on measurements conducted in Aspvreten and Pallas. The bold horizontal line in (b) intersecting the x-axis at 1.0 indicates perfect agreement between measured and modelled air concentrations.
The comparison of the first scenario model estimates to the monthly sums of dry particulate deposition and wet deposition fluxes reported from the Svartberget site showed that while the measured levels were underestimated to an extent that was similar to the air concentrations, the model captures the observed seasonal variations of deposition fluxes (Figure 51).

SWEDISH ENVIRONMENTAL PROTECTION AGENCY REPORT 6566 Managing the dioxin problem in the Baltic region with focus on sources to air and fish
91
a b c
Figure 51. Comparison of modelled values of total deposition flux with measurements made at Svartberget be-tween December 2006 and November 2007 for the first scenario: a) 1,2,3,7,8,9-HxCDD, b) OCDD, and с) OCDF. Please observe that the scales for model predictions and measurements differ.
According to a sensitivity study performed on the MSCE-POP model using CB-153, the uncertainty in physical-chemical input parameters can give rise to a 20% uncertainty in model output (Shatalov et al. 2005). In a model intercomparison study, air concentrations produced using the MSCE-POP model agreed to a precision of 50% with concentrations produced using other models (Shatalov et al. 2005). For CB153 the log Kow is 6.9 (Schenker et al. 2005) and the atmospheric degradation rate is 3 * 10-7 s-1 (global and seasonal average extrapolated from Anderson and Hites 1996). The ranges of these proper-ties used as model input in the present study are 6.8-8.2 and 2.7 * 10-9 - 6 * 10-7 s-1, respectively. Evi-dently, the atmospheric fates of dioxins and PCB-153 are not governed by the exact same properties and a model comparison will give different results depending on the chemical and the scenario stud-ied. Hence, the analogy is not ideal. However, it indicates that model error is small and cannot solely account for the discrepancies between measurements and model predictions. The probable cause of the discrepancy is therefore underestimation of the emissions used as model input (Baker and Hites 2000, Cohen et al. 2002, Harrad and Jones 1992, Wintermeyer and Rotard 1994), as is indicated in 10.2.4. However, there is a risk that adjusting emissions up in the following emission scenarios might com-pensate for model errors that are not related to errors in emission estimation. Estimates of the various regions’ contributions to annual deposition fluxes to individual Baltic Sea sub-basins are displayed in Figure 52. Estimates displayed were produced using the first emission scenario. The results indicate that many different countries – not just the adjacent countries – are con-tributing to dioxin pollution in the Baltic Sea.
10.3.2 Adjusted emission scenarios The second emission scenario improves the agreement between modelled results and field data for almost all measurements, except for those corresponding to dates when air masses came from SSE and SSW. For 2,3,4,7,8-PeCDF, about 60% of the modelled concentrations agree with measurements with-in a factor of three. 100% of the modelled concentrations agree with measurements within a factor of ten. Similar results are obtained for 1,2,3,7,8,9-HxCDD and OCDF. However, the second emission scenario leads to underestimation of OCDD for the southwest (SW) and northwest (NW) compass sectors and to overestimation for the east (E) compass sector.
0
0.1
0.2
0.3
0.4
0.5
0.6
0.7
0.8
0.9
1D
ec Jan
Feb Mar
Apr
May
Jun
Jul
Aug
Sep Oct
Nov
Mea
sure
men
ts, p
g T
EQ
/m2/m
onth
0
0.05
0.1
0.15
0.2
0.25
0.3
Cal
cula
tions
, pg
TE
Q/m
2/m
onth
Measurements
Direct deposition
0
0.1
0.2
0.3
0.4
0.5
0.6
0.7
Dec Ja
n
Feb Mar
Apr
May
Jun
Jul
Aug
Sep Oct
Nov
Mea
sure
men
ts, p
g T
EQ
/m2/m
onth
0
0.005
0.01
0.015
0.02
0.025
0.03
0.035
0.04
0.045
Cal
cula
tions
, pg
TE
Q/m
2/m
onth
Measurements
Direct deposition
0
0.01
0.02
0.03
0.04
0.05
0.06
0.07
0.08
Dec Ja
n
Feb Mar
Apr
May
Jun
Jul
Aug
Sep Oct
Nov
Mea
sure
men
ts, p
g T
EQ
/m2/m
onth
0
0.001
0.002
0.003
0.004
0.005
0.006
0.007
0.008
Cal
cula
tions
, pg
TE
Q/m
2/m
onth
Measurements
Direct deposition

SWEDISH ENVIRONMENTAL PROTECTION AGENCY REPORT 6566 Managing the dioxin problem in the Baltic region with focus on sources to air and fish
92
Figure 52. Contributions of various source groups to the deposition flux of 2,3,4,7,8-PeCDF to the sub-basins of the Baltic Sea calculated using the first scenario. DK – Denmark, EE – Estonia, FI – Finland, DE – Germany, LV – Latvia, PL – Poland, SE – Sweden, RU – the Eastern part of the Russian Federation, RW –- the north-western part of the Russian Federation, OT – the rest of the European countries altogether, SH – emissions from shipping within the Baltic Sea, Rest – all other sources.

SWEDISH ENVIRONMENTAL PROTECTION AGENCY REPORT 6566 Managing the dioxin problem in the Baltic region with focus on sources to air and fish
93
The application of the third emission scenario leads to an improvement by a factor of 0.5 - 4.5 in the agreement between measured and modelled air concentrations corresponding to days when air masses came from the SSE and the SSW. However, the disagreement between measurements and calculations for air coming from other compass sectors is larger than in the second scenario, and can reach as high as 10 times or more. Thus, adjusting emissions up in regions other than the ones included in the sec-ond scenario made the agreement between model predictions and measurements better in the SSE and SSW, but worse in other compass sectors. It should be noted that the adjustments are only two examples of many possible upward adjustments that could be made to the emission inventory, resulting in an improved comparison between model predictions and measurements. Even if an improved model comparison with measurements is observed as a result of the upward adjustments, this does not necessarily imply that emissions in these source regions are underreported. In future work, it will be important to improve the emission adjustment procedure. This can only be achieved using a combination of improved emission inventories and more high quality monitoring data from different sites around the Baltic region. We believe that given enough quality input data, the approach presented here can be used to identify contributors to emission inventory uncertainty and to Baltic Sea air pollution with high accuracy. The statistical correlation, carried out in order to investigate how the contributions of various source regions to Baltic air levels correlated to calculation deficiencies, demonstrated that different source regions are important for different congeners (e.g., Finland for HxCDD, and shipping for PeCDF), but no source region is consistently important for all four congeners. This may be indicative of different source sectors being important in different regions, but also that different countries are focusing their monitoring on different source sectors. A more sophisticated emission adjustment procedure would adjust emissions from different regions on a congener-specific basis for a wider range of congeners.
10.4 Conclusions The modelling work undertaken in Chapter 10 demonstrates that there is currently a poor quanti-
tative understanding of dioxin emissions contributing to the Baltic region. Besides, there is a lack of dioxin monitoring data particularly reporting congener composition of PCDD/Fs in the atmos-phere and precipitation. Both these factors hamper accurate tracing of emissions using modelling tools.
Current emission databases for dioxins are not accurate and cannot be used confidently to esti-mate either total TEQ emissions in a region or the dominant emission sectors.
The modelling tool and emission adjustment approach presented here can potentially be used to identify the source regions for which the emission estimates are most in error. The use of the modelling tool for dioxins is limited though by the poor quality of emission databases.
The emission adjustment demonstrated that by adjusting congener composition and by elevating emissions by a factor of two in two source regions, the agreement between modelled and meas-ured values improved for air masses originating from almost all compass sectors. However, in-creasing the emissions with a factor of 10 in several source regions did not improve the agree-ment between model predictions and measurements. This indicates the approximate magnitude of error in the European emission estimates, which is valuable information.

SWEDISH ENVIRONMENTAL PROTECTION AGENCY REPORT 6566 Managing the dioxin problem in the Baltic region with focus on sources to air and fish
94
11 Sources and source regions for at-mospheric emissions of dioxins and other POPs affecting the Baltic Sea environment 11.1 Introduction In a previous study, monitoring of PCDD/Fs in Baltic air revealed that winter air originating from central and eastern directions contained the highest levels of PCDD/Fs (Sellström et al. 2009). Here, we hypothesised that the metal concentrations in air could give guidance as to which source types are important for PCDD/F air emissions. We repeated the study by Sellström et al. (2009), but extended the sampling to also include metals, HCB and PCB. The aim was to investigate trends for PCDD/Fs, PCBs and HCB, and to identify important source types for PCDD/Fs by using metals as source mark-ers for co-emission with PCDD/Fs.
11.2 Methodology Air samples were collected at Aspvreten monitoring station, a rural site near the shore of the Baltic Proper (see also 10.2.5). Sampling was conducted during the summer season 2010 (August-September) and winter season 2010/11 (November-February). Because air mass origin was of interest for this project, high volume (HiVol) samplers were run continuously on a 24-h basis with only a few breaks for technical maintenance. The total number of samples was 45 for the summer and 58 for the winter season. The samplers were equipped with glass fibre filters to collect POPs associated with atmospheric particles, and PUFs to collect POPs in gaseous phase following the methodology de-scribed in Sellström et al. (2009). In parallel, air sampling for metal analysis was conducted using a Derenda PNS 16T sampler (Comde-Derenda GmbH, Germany). This sampling device is a reference device according to the European Guidelines CEN 12341 (PM10) and CEN 14907 (PM2.5). Air mass back trajectory analyses were conducted for all collected samples by using the NOAA HYSPLIT model (http://www.arl.noaa.gov/ready.html), including three different heights (20, 100 and 500 m). At the 20 m height, 48 h was used with measurements every 4th hour, and for 100 m and 500 m heights 96 h with measurements every 6th hour. The criterion for a stable air mass back trajectory was that the three heights should agree. Samples that had stable air mass back trajectories were select-ed and analysed for 2,3,7,8-PCDD/Fs, ΣPCB7, and HCB by Ökometric GmbH (Bayreuth, Germany) and metals (As, Cd, Co, Cr, Cu, Fe, Hg, K, Mn, Ni, Pb, Sb, Se, Tl, V, Zn) by ALS Scandinavia AB (Luleå, Sweden). The samples were divided into seven compass sectors depending on air mass origin: SW (southwest), SSW (south-southwest), SSE (south-southeast), E (east), NNE (north-northeast), NNW (north-northwest), and NW (northwest). In total, 18 summer samples and 19 winter samples were analysed: 6 (3+3) SW, 4 SSW (4+0), 3 SSE (0+3), 11 E (5+6), 7 NNE (3+4), 4 NNW (1+3), and 2 (2+0) NW. Plots of concentrations for compass sectors and correlation matrix studies were made on the data, together with the metals, in order to i) identify possible sources of the air emissions by using metals as markers, and ii) observe the pollutant contributions of the compass sectors Samples and variables for which more than 40% of the data were missing or below LOQ were elimi-nated from data analysis. As most of the PCDD/F data for the summer samplings were <LOQ (>80%), the data analysis and interpretation were done for the winter samples only. In all data analysis, remain-
SWEDISH ENVIRONMENTAL PROTECTION AGENCY REPORT 6566 Managing the dioxin problem in the Baltic region with focus on sources to air and fish
95
ing <LOQs were replaced by half of the LOQ. The following abbreviations are used: PCDD/Fs repre-sents the sum of the seventeen 2,3,7,8-PCDD/F congeners; PCDDs is the sum of the seven 2,3,7,8-PCDDs; PCDFs is the sum of the ten 2,3,7,8-PCDFs; ΣPCB7 is the sum of CBs 28, 52, 101, 118, 138, 153, 180, HxCDD-1 represents 1,2,3,4,7,8-HxCDD; HxCDD-2 is 1,2,3,6,7,8-HxCDD; HxCDD-3 is 1,2,3,7,8,9-HxCDD; PeCDF-1 is 1,2,3,7,8-PeCDF; PeCDF-2 is 2,3,4,7,8-PeCDF; HxCDF-1 is 1,2,3,4,7,8-HxCDF; HxCDF-2 is 1,2,3,6,7,8-HxCDF; HxCDF-4 is 2,3,4,6,7,8-HxCDF; HpCDF-1 is 1,2,3,4,6,7,8-HpCDF; HpCDF-2 is 1,2,3,4,7,8,9-HpCDF. TEQs were calculated using the WHO 2005 TEFs (Van den Berg et al. 2006).
11.3 Results and discussion 11.3.1 Levels of PCDD/Fs The levels of PCDD/Fs during the summer season were generally below LOQ, with an average of approx. 1 fg TEQ m-3 (values below the LOQ replaced with LOQ/2 and included in the average). There were no significant differences in TEQ levels among compass sectors for the summer season, as seen in Figure 53a and based on significance tests. It was also observed that PCDDs contributed more to the total TEQ than PCDFs. During the winter season, there was a significant increase in TEQ levels in air arriving from all directions. The increase was particularly pronounced for air arriving from the southern and eastern compass sectors (Figure 53b), in line with Sellström et al. (2009). The average concentration during winter was 6.0 ± 4.7 fg TEQ m-3. This average concentration is similar to the
average found previously by Sellström et al. (2009) (10 fg TEQ m-3). Similarly to the previous study, PCDFs contributed more than PCDDs to the total TEQ in air from the SSE, E and NNE compass sec-tors. Because the air that had travelled from the SSE and E compass sectors showed the highest TEQ levels, special focus should be given to these regions in order to identify important PCDD/F air emis-sion sources.
11.3.2 Levels of PCBs and HCB In contrast to the PCDD/F air concentrations, PCBs in Baltic air were significantly higher during summer than winter (average ± stdv 19 ± 7 pg m-3 vs. 5.8 ± 2.5 pg m-3; Figure 54). This indicates that emissions from secondary sources, such as volatilisation from buildings and waste sites during the warm summer season, are of significant importance for these contaminants. It also demonstrates that PCBs and PCDD/Fs have distinctly different sources. As for the PCDD/Fs, there were significant differences between compass sectors during the high level season (in this case the summer season) with higher levels from highly populated sectors (SW: 18 ± 1.1, SSW: 26 ± 1.7, E: 21 ± 1.7, NNE: 13 ± 1.1, NW: 11± 0.83), but not during the winter season. In contrast, there were no significant differ-ences observed in the HCB levels among compass sectors for both seasons. However, similar to the PCDD/Fs, the winter air levels of HCB were significantly higher (79 ± 22 pg m-3) than the summer levels (43 ± 14 pg m-3), although the difference between summer and winter was not at all as marked as for the PCDD/Fs. The reason for the higher HCB winter levels is not known but could be due to breakthrough through the sampling media, which has been shown to occur particularly during the warmer summer months (Halsall et al. 1998).

SWEDISH ENVIRONMENTAL PROTECTION AGENCY REPORT 6566 Managing the dioxin problem in the Baltic region with focus on sources to air and fish
96
Figure 53. Average concentration of PCDDs (blue bars) and PCDFs (red bars) in Aspvreten air (fg TEQ m-3) during a) summer 2010 (current study), and b) winter season 2006/2007 (Sellström et al. 2009) and 2010/11 (current study), divided into seven compass sectors based on air mass origin.
Figure 54. ΣPCB7 (blue bars) and HCB (red bars) in Aspvreten air during a) summer season 2010, and b) winter season 2010/2011.
11.3.3 PCDD/F and metal level correlation studies and possible sources Because we hypothesised that the metal concentrations in air could indicate which source types are important for PCDD/F air emissions, we searched for metals that showed similar air concentration trends as the PCDD/Fs. A correlation matrix study analysis was conducted for all compounds and elements except TCDD, PeCDD, HxCDF-2, As, Hg, Se and Tl, which were excluded because of a high fraction of missing data (>70% below LOQ). Because of a low number of samples per sector, the air mass directions were divided into four compass sectors in this data evaluation stage: a) SW-SSW (southwest and south-southwest directions), b) SSE-E, c) NNE, and d) NNW-NW. We knew from previous work (Sellström et al. 2009), and the work reported here that the winter air from SSE-E (compass sector b) is clearly the most important for air mass transport of PCDD/Fs to Baltic air. The total sum of PCDD/Fs (labelled ’Total’) was highly correlated to PCDFs (r>0.86). PCDFs are also the most important contributors to TEQ during the winter season, the season with the highest air lev-els. The furans (PCDFs) should therefore receive special attention in the source tracing.

SWEDISH ENVIRONMENTAL PROTECTION AGENCY REPORT 6566 Managing the dioxin problem in the Baltic region with focus on sources to air and fish
97
For the SSE-E sector, K, Se, Pb, Sb, Cd, Zn, and V were enhanced compared to the other sectors (Fig-ure 55). Thus, our data indicates that activities related to these metals may be related to emissions of PCDD/Fs from SSE-E regions in winter. Enhanced concentrations in the same sector are not evidence for a similar origin; however, a strong correlation between PCDFs and metals should strengthen a co-emission relation. Among the six can-didate metals, V showed a very weak correlation with PCDFs (r from 0.25 to 0.40) in the SSE-E re-gion (Figure 56). The other five metals (Cd, K, Pb, Sb and Zn) correlated well with PCDFs and can be considered as key elements. These correlations were not specific for SSE-E, although the correlations were slightly stronger for this sector (Table 10, Figure 56). In the search for literature dealing with metals as markers for specific activities, it was concluded that it was a challenging task to find up-to-date studies. A discussion on the metals as indicators for source types follows later in this chapter. It is also worth to noting that higher winter levels may be related to variation in atmospheric mixing height, i.e., a non-emission related factor may affect the concentration of pollutants in air. In general, lower mixing heights in winter have been observed, potentially resulting in higher pollution concentra-tions, as the volume of air in which the pollutant is diluted is lower. The decrease in mixing height during winter has been reported to vary from 15% (Robinson 1966) up to 66% (Seinfeld 1986) of the mixing height during the summer season. The increases in the PCDD/F concentrations at Aspvreten were significantly larger, particularly in air from the SSE-E sector (Table 11). Since Aspvreten is a rural field station (see section 10.2.5), this indicates that the increased PCDD/F winter concentrations observed at Aspvreten is due to inputs from emissions that were transported long-range and not pri-marily to seasonal mixing height variation. The marked winter season increase of PCDD/Fs thus indicates that non-industrial related winter activi-ties, such as combustion for heating, are accountable. To elaborate further, a comparison was made for the average summer and winter congener pattern of the E and SSE sectors (Figure 57), and the patterns of municipal solid waste incinerators (MSWI; Lee et al. 2004, Lin et al. 2010) and stack flue gas of coal-fired power plants (Lin et al. 2007; Figure 58). As can be seen, there is a good match between the Aspvreten air and the two combustion sources. A similar match could not be found for other source types such as electric furnaces, aluminium smelters, unleaded gas-fuelled vehicles and diesel-fuelled vehicles (Lee et al. 2004). Emission from domestic burning may also be one of the important sources, but no good reference could be obtained for comparison of congener profiles.

SWEDISH ENVIRONMENTAL PROTECTION AGENCY REPORT 6566 Managing the dioxin problem in the Baltic region with focus on sources to air and fish
98
Figure 55. Metal concentrations (pg m-3) in Aspvreten air in winter 2010/11 SW-SSW SSE-E NNE NNW-NW
Table 10. Correlation coefficients (r) for PCDFs and selected metals in Baltic air during winter 2010/2011. The range refers to correlation with various PCDF congeners.
Pb Sb Zn Cd K
Winter overall 0.78-0.90 0.84-0.91 0.69-0.85 0.78-0.90 0.69-0.82
SSE-E 0.83-0.94 0.87-0.96 0.85-0.93 0.83-0.95 0.71-0.79
Non-SSE-E 0.63-0.95 0.54-0.92 0.57-0.95 0.55-0.90 0.52-0.91
0
1000
2000
3000
4000
5000
Pb
0
50
100
150
200
250
Sb
0
500
1000
1500
2000
2500
V
0
4000
8000
12000
16000
Zn
0
40
80
120
160
Cd
0
30000
60000
90000
120000
150000
K

SWEDISH ENVIRONMENTAL PROTECTION AGENCY REPORT 6566 Managing the dioxin problem in the Baltic region with focus on sources to air and fish
99
b
a

SWEDISH ENVIRONMENTAL PROTECTION AGENCY REPORT 6566 Managing the dioxin problem in the Baltic region with focus on sources to air and fish
100
c
Figure 56. Correlation matrices of winter season data for a) all air measurements at Aspvreten b) SSE-E compass sector only, and c) all except the SSE-E region.
Table 11. Average ratio of PCDD/Fs concentrations in winter as compared to summer (Cwinter/Csummer) at Aspvreten for the SSE-E sector and remaining sectors (SW-SSW, NNE and NNW-NW).
SSE-E
Remaining sectors
PCDFs
TCDF 6.1 5.1
PeCDF-1 12 7.1
PeCDF-2 16 9.0
HxCDF-1 12 8.6
HxCDF-2 13 9.6
HxCDF-4 12 7.4
HpCDF-1 7.2 6.4
HpCDF-2 4.2 1.9
OCDF 5.9 3.2
PCDDs
HxCDD-1 4.8 3.9
HxCDD-2 8.4 4.2
HxCDD-3 9.9 4.8
HpCDD 2.9 1.1
OCDD 3.2 1.2
Cd, Pb, Zn and Sb showed strong correlations among each other (r>0.93, p<0.01), indicating a com-mon emission source. The relative abundance of these key elements in the Aspvreten air and the com-bustion sources could be a good indicator of whether a source-receptor relationship exists. In Table 12, available data for coal-fired power stations has been compiled. These ratios agree well with what was

SWEDISH ENVIRONMENTAL PROTECTION AGENCY REPORT 6566 Managing the dioxin problem in the Baltic region with focus on sources to air and fish
101
observed in Aspvreten air. Corresponding ratios for MSWI and biomass burning could not be found in the literature.
According to Pacyna (1986), emissions from wood combustion are dominated mainly by Zn, Pb and Cu. Potassium (K) is also associated with biomass burning (Hopke P, pers. communication), indicat-ing that combustion of biofuel may play a role. However, biofuel is no longer a primary source of heat and energy in developed countries. It is still possible that domestic biofuel heating including fractions of waste is common in Europe. This kind of combustion generating diffuse pollution is poorly charac-terised in terms of emission factors for PCDD/Fs and trace elements. Open burning of agricultural wastes could also result in PCDF and K emissions because of the use of K in fertilizers. In summary, although this study could not provide clear evidence for dominating sources types, there are indices that point towards a dominance of combustion sources, such as MSWI, coal combustion, and domestic combustion for heating.
Figure 57. The 2,3,7,8-PCDD/F congener pattern in Aspvreten air during summer (this study) and winter (this study and Sellström et al. 2009).
Figure 58. The PCDD/F congener pattern in flue gases from MSWI (green: Lee et al. 2004; blue: Lin et al. 2007), and coal-fired power plant (red: Lin et al. 2007).
0,00
0,10
0,20
0,30
0,40
0,50
SSE-E Aspvreten
summer
winter
0,00
0,10
0,20
0,30
0,40
0,50

SWEDISH ENVIRONMENTAL PROTECTION AGENCY REPORT 6566 Managing the dioxin problem in the Baltic region with focus on sources to air and fish
102
Table 12. Ratios between metals in fly ashes and flue gases from coal-fired power stations and in Aspvreten air.
Coal-fired power stations Aspvreten air
López-Antón et al. (2011) Meij and Winkel (2007) SSE E
Zn/Pb 1.6 (plant A)
3.0 2.9 3.3 1.0 (plant B)
Pb/Sb 30 (plant A)
N/A 21 29 37 (plant B)
N/A – not available
No correlation between the air concentrations of ΣPCB7 and metals during the winter season could be observed (Figure 59a). However, relatively strong correlations could be seen for summer (Figure 59b), e.g., between Cu and ΣPCB7 (r=0.49-0.67). HCB generally showed no or negative correlations with metals in summer and winter, with correlation coefficients (r) varying from -0.07 to -0.68 for summer, and from -0.16 to 0.60 for winter samples. These observations together with the seasonal and compass sector studies, support previous studies which suggest that elevation of PCBs in air is closely linked to urbanised and industrialised areas where it was previously used (Harner et al. 2004), while HCB is more globally distributed and not highly associated to areas with high anthropogenic activities (Barber et al. 2005).
a

SWEDISH ENVIRONMENTAL PROTECTION AGENCY REPORT 6566 Managing the dioxin problem in the Baltic region with focus on sources to air and fish
103
Figure 59. Correlation matrix for Aspvreten air concentrations (all compass sectors) of ΣPCB7, HCB and metals during a) winter season and b) summer season.
11.4 Conclusions For the summer season, there were no significant differences in levels of TEQPCDD/F in air sampled
at Aspvreten among compass sectors, and it was also observed that PCDDs contributed more to the total TEQ than PCDFs. During the winter season, PCDFs dominated and there was a signifi-cant increase in TEQ levels in air arriving from all directions. The increase was particularly pro-nounced for air arriving from the southern and eastern compass sectors (Figure 53), in line with the earlier study by Sellström et al. (2009). PCBs showed an opposing pattern to PCDD/Fs with higher concentrations during summer, but as for the PCDD/Fs, there were significant differences between compass sectors during the high level season (in this case the summer season). HCB showed the same seasonal pattern as PCDD/Fs, but no differences related to compass sectors.
The high PCDD/F levels during the winter season indicate a dominance of non-industry related combustion sources, presuming that there is no seasonal trend in industrial production.
The PCDFs are the main contributors to the total (and TEQ) concentration of PCDD/Fs in the Aspvreten winter air.
It was hypothesised that metal concentrations in air could be used as indicators of which source types are important for PCDD/F air emissions. Correlations were observed between PCDF con-centrations and Cd, K, Pb, Sb and Zn concentrations in air sampled during the winter months. K, Pb, Sb and Zn are associated with combustion of wood (Pacyna 1986, Hopke, personal communi-cation) and other biofuels, and the Aspvreten air showed similar ratios of Zn/Pb and Pb/Sb as flue gases from coal-fired power stations.
The general PCDD/F congener pattern of Aspvreten air matched well with municipal solid waste incinerators (MSWI) and coal-fired power plants combustion patterns, in contrast to emission pat-terns from electric furnaces, aluminium smelters, unleaded gas-fuelled vehicles and diesel-fuelled vehicle (Lee et al. 2004, Lin et al. 2007).
b
SWEDISH ENVIRONMENTAL PROTECTION AGENCY REPORT 6566 Managing the dioxin problem in the Baltic region with focus on sources to air and fish
104
In summary, there are several indications that combustion is responsible for the high PCDD/F levels in Aspvreten winter air. However, our PCDD/F and metal data could not be used to pin-point one combustion source category as more important than others.
SWEDISH ENVIRONMENTAL PROTECTION AGENCY REPORT 6566 Managing the dioxin problem in the Baltic region with focus on sources to air and fish
105
12 Synthesis 12.1 Introduction In this chapter the new knowledge gained from the preceding chapters is integrated and evaluated in a system synthesis. In a preceding study undertaken for the Swedish EPA (Wiberg et al. 2009), the POPCYCLING-Baltic model (Wania et al. 2000) was used as a tool to aid the synthesis work by cal-culating mass balances for dioxins and other selected POPs in the whole Baltic Sea as well as in the separate basins. Some potential limitations in the inputs and parameterisation of the POPCYCLING-Baltic model were identified (Wiberg et al. 2009) and were addressed in research undertaken in WP1, WP2 and WP3 in the present study. One of the main aims of WP3 was to identify, based on this new research, if the POPCYCLING-Baltic model required to be re-parameterised. Potentially, new simula-tions with a re-parameterised POPCYCLING-Baltic model could lead to different conclusions than those reached in Wiberg et al. (2009). In this chapter we systematically address the various issues of concern with the previous parameterisation and model runs of the POPCYCLING-Baltic model in Wiberg et al. (2009), namely:
Were temporal trends of dioxins in air and thus atmospheric deposition between 1986 and 2006 correctly defined in the previous modelling work?
Was the parameterisation of sedimentation, resuspension and burial rates in the POPCYCLING-Baltic model correct in the previous modelling work?
Is soil volatilisation/resuspension of dioxins an important source of dioxins to atmospheric deposition to the Baltic Sea?
Were riverine inputs and land-based industrial inputs of dioxins to the Baltic Sea underesti-mated in previous modelling work?
We consider these issues in turn below in sections 12.2.1-12.2.4. The chapter then continues by identi-fying the main conclusions reached in the BalticPOPs project (section 12.3) and finally recommends actions by authorities as well as further research areas (section 12.4).
12.2 Re-evaluation of POPCYCLING-Baltic modelling 12.2.1 Were temporal trends in air and thus atmospheric deposition between 1986 and 2006 correctly defined in previous modelling work? In Wiberg et al. (2009), the POPCYCLING-BALTIC model used air concentrations of dioxins as the model input, rather than using primary emissions of dioxins. The contemporary air and deposition measurements made in the Wiberg et al. (2009) and in this project (see Chapter 11) are of high quality, so current estimates of atmospheric deposition to the Baltic Sea are judged reliable. For the retrospec-tive simulations, however, the atmospheric concentrations were assumed to have decreased in a linear manner between 1986 and 2006 by a factor of 4. This assumption was based on estimates of the time trends of dioxin emissions during this period (Quaß et al. 2004) and on time trends of dioxin concen-trations in tree foliage from Germany (Rappolder et al. 2007). What was lacking at the time of writing the previous report (Wiberg et al. 2009) were any time trend data for the Baltic region, although it should be noted that most of the dioxins in the air over the Baltic originate from the European conti-nent and thus using time trends in German tree foliage can be considered a reasonable approach. The model simulations undertaken in Wiberg et al. (2009) suggested that the concentrations in Baltic sediments decreased approximately by a factor of 3 between 1986 and 2006, whereas air concentra-tions were assumed to have decreased by approximately a factor of 4 in the same period. It is expected

SWEDISH ENVIRONMENTAL PROTECTION AGENCY REPORT 6566 Managing the dioxin problem in the Baltic region with focus on sources to air and fish
106
that sediments respond relatively slower than air to changes in emissions given the higher storage capacity of sediments and the slower loss rates in sediment compared to air. However, it is important to evaluate if the model is predicting the time response of sediments correctly because this will have large implications for the time response of other compartments, notably the water compartments where the fatty fish (e.g., herring) reside. Measurements of PCDD/Fs in surface sediments collected between 1986 and 1988 (Kjeller and Rappe 1995, Rappe et al. 1989) indicated that concentrations at that time were similar to the concentrations today (Sundqvist et al. 2009a), but as noted in Wiberg et al. (2009) these limited and fragmented data did not provide a reliable temporal trend in Baltic sediments. In Chapter 8 of this report temporal trend data for Baltic sediments are presented for several separate locations and these data can be used to re-evaluate the assumed time trends in the modelling in Wiberg et al. (2009). To recap, the time trends in Chapter 8 varied depending on where the sediment cores were collected with slower declines observed in offshore areas. The levels of PCDD/Fs in coastal sediments declined by a factor of approximately 2 between the mid-1980s and the current day. The offshore sediments mostly declined by less than a factor of 2 between the mid-1980s and the current day. The previous POPCYCLING-Baltic model simulations undertaken in Wiberg et al. (2009) appear to overestimate the time response of dioxins in sediments to reductions in atmospheric deposition (the model predicted a decline of a factor of 3 be-tween 1986 and 2006, whereas data in Chapter 8 indicates a decline of a factor of 2 or less depending on location). There are a few possible explanations for the discrepancy between model-estimated de-clines in sediments and the sediment time trends data from Chapter 8: i) the temporal trends in air and atmospheric deposition were wrongly defined in the model simulations (i.e., a decline of a factor of 4 between 1986 and 2006 was too extreme); ii) the actual recovery time of the Baltic sediments follow-ing reduction of dioxin inputs may be different from the model estimated recovery time; and iii) other on-going (e.g., coastal, riverine and industrial) sources of dioxins have contributed to a slower decline. We address each of these hypotheses in turn below:
i) The temporal trends in air and atmospheric deposition were wrongly defined in the model simulations. In addition to time trends in emissions (Quaß et al. 2004) and tree foliage from Germany (Rappolder et al. 2007) cited in Wiberg et al. (2009), we have identified further studies which report relevant time trends in the region, namely: time trends in UK air (Katsoy-iannis et al. 2010), UK herbage (Hassanin et al. 2006) and also in European emissions (Gusev et al. 2011). These additional time trend studies agree reasonably well with assumptions used in modelling in that they suggest a fall in air concentrations of about a factor of 3-4 from the mid-1980s until the current day. The number of studies reporting temporal trend data in Euro-pean PCCD/F emissions to air, Baltic air concentrations and Baltic atmospheric deposition are scarce, but without stronger empirical evidence we do not have a justification to refine the temporal trends in the air data used in the previous modelling work. Indeed, the few existing data agree reasonably well with the assumed air time trends.
ii) The actual recovery time of the Baltic sediments following reduction of dioxin inputs may be different from the model estimated recovery time. Wiberg et al. (2009) recommended that an improved understanding of surface sediment accumulation and mixing is needed to produce more reliable estimates of the response time of the Baltic Sea to changes in dioxin inputs. We undertook a re-evaluation of the parameterisation of sedimentation rates in the POPCYCLING-Baltic model (see section 12.2.2) and came to the conclusion that newer esti-mations of sedimentation were in fact comparable to the estimates used to parameterise the POPCYCLING-Baltic model. We therefore do not have any empirical basis for performing a

SWEDISH ENVIRONMENTAL PROTECTION AGENCY REPORT 6566 Managing the dioxin problem in the Baltic region with focus on sources to air and fish
107
re-parameterisation of the sedimentation, resuspension and burial rates in the POPCYCLING-Baltic model. As discussed in more detail in section 12.2.2, we believe that a potentially big-ger problem than the parameterisation of the model, is the simple one-dimensional and steady-state description of sediment dynamics used in the POPCYCLING-Baltic model. Rather than a simple re-parameterisation of the existing simplified model an improved model framework is probably required to accurately describe the time response of sediments to changes in atmos-pheric deposition.
iii) Other on-going (e.g., coastal, riverine and industrial) sources of dioxins have contributed to a slower decline. In Chapter 8, the source tracing for the offshore sites, where sediment levels declined less dramatically between the mid-1980s and the present day, concluded that atmos-pheric sources were the dominant source contributing to sediment levels of dioxins, although coastal-based industrial sources did make an important, but still minor, contribution. Sedi-ments nearer the coast were impacted to a higher extent by coastal-based sources, and dioxin levels in the coastal sediments demonstrated a more rapid decline than in offshore sediments between the mid-1980s and current day. Furthermore, peak concentrations of dioxins general-ly appeared earlier in coastal areas than in offshore areas (mid-1960s to late-1970s versus mid-1980s to late-1990s). These findings indicate that terrestrial sources will eventually affect the open sea after some time lag, which is evidence that sediment contamination is moving hori-zontally from coastal areas to open sea areas. Horizontal movement of contamination through sediment transport is not described by the POPCYCLING-Baltic model.
The observation that dioxins are decreasing in sediments in all areas of the Baltic Sea shows that emis-sion reduction measures in the last decades for these pollutants have been effective in reducing sources and thus levels in Baltic environmental media. The POPCYCLING-Baltic model, however, is estimat-ing a more rapid decline in sediment concentrations than has actually occurred. The most plausible explanation appears to be the simplification of sediment dynamics in the POPCYCLING-Baltic mod-el. Since the sediment response time is incorrectly estimated in the POPCYCLING-Baltic model, it can be expected that model predicted declines in other media (notably dissolved water concentrations) will also be estimated to be more rapid than they are in reality. This model error is one contributing factor to over-prediction of declines in dioxin concentrations in Baltic herring (Wiberg et al. 2009).
12.2.2 Was the parameterisation of sedimentation, resuspension and burial rates in the POPCYCLING-Baltic model correct in the previous modelling work? As pointed out in Wiberg et al. (2009), the POPCYCLING-Baltic model predicted rate of decrease of dioxins in surface water in the Baltic Sea is linked to the model assumptions regarding the surface area and mixing depth of the surface sediments as well as the sediment burial rates. The rate of decrease of surface water concentrations of dioxins was suspected to be overestimated in the POPCYCLING-Baltic model due to its oversimplified model structure (Wiberg et al. 2009). This suspicion was sup-ported by the model overestimation of declines in Baltic sediment cores (see above). It was recom-mended that an improved understanding of surface sediment accumulation and mixing is required to produce more reliable estimates of the response time of the Baltic Sea to changes in dioxin inputs. In this project we undertook a re-evaluation of the parameterisation of sedimentation rates in the POPCYCLING-Baltic model. New data on sediment accumulation rates in the Baltic Sea has been made available since Report 5912 (Wiberg et al. 2009) was published. To investigate whether the parameterisation of the POPCYCLING-Baltic in the previous study was reasonable, the model input was compared to new sedimentation data collected by the Geological Survey of Sweden (SGU). The

SWEDISH ENVIRONMENTAL PROTECTION AGENCY REPORT 6566 Managing the dioxin problem in the Baltic region with focus on sources to air and fish
108
sediment accumulation rates were measured using dating with Cs-137 according to a method described by Cato and Apler (2011). The Cs-137 isotope is produced anthropogenically in nuclear fission pro-cesses. It does not occur naturally in the environment, but can only have reached Baltic Sea sediments with fallout from the Chernobyl catastrophe in 1986. Thus, the isotope can be used as a marker of time. In the Cato and Apler method, the volume of sediment that has deposited since the Cs-137 iso-tope first occurs in a sediment core is simply divided with the number of years that has passed since the Chernobyl catastrophe to obtain the sediment accumulation rate. Traditionally, the accumulation rates have been determined by dividing the number of laminae (thin layers) visible in the radiography image of the sediment core by the length of the studied segment. Each laminae is assumed to represent one year. These methods are only suitable for use on sediments whose laminae can be clearly distinguished. They are therefore not successful on bioturbated sediment bottoms and bottoms where bubbles of methane gas are released in the degradation of organic materi-al. Cato and Apler (2011) found that the agreement between their method and the traditional one is very good. They reported an r2 of 0,88 for a regression between accumulation rates measured using the two methods. For the evaluation of the POPCYCLING-Baltic parameterisation, basin-specific accumulation rates in tonnes/year were calculated using data on accumulation bottom surface areas provided by SGU (Cato 2012). These surface areas were assumed to be equal to the bottom areas covered by postglacial clay. In reality, the accumulation bottom areas are likely 15-20% smaller. A comparison of the sediment accumulation rates is displayed in Table 13. The SGU data exceeds the data used in the previous study by a factor of 2.2 for the Baltic Proper, while for the Bothnian Sea and the Bothnian Bay the SGU data is a factor of 2.5 lower than in the previous study. Considering that the two independent estimates employed different methods for determining sedimentation rates, the agreement is good. We see no need to re-parameterise the POPCYCLING-Baltic model because it is uncertain which estimate of the percentage of accumulation bottoms is most correct and as both esti-mates of percentages covered by accumulation bottoms are similar a reparameterisation would have little influence on model outputs. Table 13. Comparison of the sediment accumulation rates (tonnes/year) in three Baltic Sea basins (coastal areas not included) obtained from SGU and used as model input by Wiberg et al. (2009).
Baltic Proper Bothnian Sea Bothnian Bay
SGU data 81 700 000 13 500 000 2 710 000
Previous study 37 200 0001 37 900 0002 6 720 0002
1. Compiled from analyses of dated cores in Jonsson et al. (1990) and Perttilä et al. (2003). 2. Compiled from analyses in (Algesten et al. 2005, Borg and Jonsson 1996, Jonsson unpublished data, Jonsson
et al. 1990), and assuming the same deposition rate and TOC content in the Archipelago Sea as in 17 bays from Stockholm archipelago (Jonsson et al. 2003).
12.2.3 Is soil volatilisation of dioxins an important source of dioxins to atmospheric deposition to the Baltic Sea? Soils are the most important reservoirs for dioxins in the terrestrial environment (Cousins et al. 1999, Duarte-Davidson et al. 1996). This is due to the fact that they have high organic carbon content and that they constitute large surfaces for atmospheric deposition. A report from the European Monitoring
SWEDISH ENVIRONMENTAL PROTECTION AGENCY REPORT 6566 Managing the dioxin problem in the Baltic region with focus on sources to air and fish
109
and Evaluation Programme (EMEP) stated that about 47% of the dioxins emitted within the EMEP region are deposited to soil and vegetation in this area (EMEP 2004). During plant decay, soils receive additional input of dioxins. Dioxins are mainly removed from soils by volatilisation (Cousins et al. 1999). This is a very slow process in comparison to atmospheric deposition. Thus, as primary emissions are on-going the input to soil will be much faster than the removal, leading to disequilibrium between soil and air. It has been hypothesised that when primary emissions are reduced the large amounts of dioxins that have been accumulated in soil will gradually be released to the environment and soil will become an important secondary source of dioxins to the air (Duarte-Davidson et al. 1996). Previous studies have shown that for other semi-volatile organic compounds, such as PCBs and lighter PAHs, soil can be a significant source to the atmosphere (Cousins and Jones 1998, Shatalov et al. 2001). Soil was not taken into account as a source of dioxins when Wiberg et al. (2009) investigated temporal trends of dioxin concentrations in the marine Baltic Sea environment. Here we investigate whether the soil in the Baltic Sea region is or will in the future become a source of dioxins to the atmosphere using the same approach and input parameters as Wiberg et al. (2009), but focusing on air-soil fluxes. The version of the POPCYCLING-Baltic model used in Wiberg et al. (2009) was re-coded so that it would give simulated data on the exchange of POPs between air and soil. Figure 60 displays the mod-elled net flux of the seventeen 2,3,7,8-substituted dioxins between soil and air in the Baltic Proper catchment area. All of the congeners have negative net fluxes (i.e. fluxes from air to soil) that are de-creasing over time. The decreasing negative fluxes can be attributed to the fact that the input to soil from atmospheric deposition has decreased due to decreasing air concentrations (set in the model in-put). For most congeners the fluxes are approaching zero towards the end of the model simulation period. In the future it may be possible to observe a positive net flux from soil to air due to gaseous diffusion (volatilisation) of dioxins, but volatilisation will only dominate soil-air exchange if ambient air concentrations are reduced to such an extent that the atmospheric deposition is substantially dimin-ished. Figures 61 and 62 display modelled gaseous fluxes of the seventeen 2,3,7,8-substituted dioxins be-tween soil and air in the Baltic Proper catchment area between 1986 and 2006. The tetra- and penta-congeners generally have positive fluxes that increase over the studied period. The fluxes are increas-ing because the concentration disequilibrium between air and soil is becoming larger over time. For the heavier congeners the net gaseous fluxes are close to zero or slightly negative. The slow transport across the soil/air interface means that the soil-air flux of the heavy congeners will be low even if there is a strong driving force for transport (i.e. a high soil-to-air concentration gradient). There are very few studies on the volatilization of dioxins in soils, probably because it is not practically possible to meas-ure the extremely low dioxin volatilization fluxes. The only evidence of the slow transport across the air-soil interface of 2,3,7,8-substituted dioxins can be found in Jones and Duarte-Davidson (1997). In this study approximately 200 m3 of clean air was pumped through soil columns containing soils that were highly contaminated with dioxins. Exhaust air from the soil columns was sampled using polyure-thane foam plugs and all 2,3,7,8-substituted dioxins analysed on the PUF-plugs were below detection limits. In summary, we are approaching a point in time when the primary emissions of dioxins have been reduced so that soils in the Baltic Sea catchment area will start acting as secondary sources of dioxins to the atmosphere. However, gaseous fluxes may still be relatively low compared to other sources of

SWEDISH ENVIRONMENTAL PROTECTION AGENCY REPORT 6566 Managing the dioxin problem in the Baltic region with focus on sources to air and fish
110
dioxins because the resistance to transport across the soil-air boundary layer is very high. From Fig-ures 61 and 62 it can be observed that the total gaseous flux of dioxins from the soil in the Baltic Proper catchment area in the POPCYCLING-Baltic model is 56 µg WHO-TEQ/h at the end of the model simulation period in 2005. Assuming that the gaseous flux of dioxins does not vary much be-tween Swedish regions, the total gaseous flux from soil to air in Sweden in 2005 is estimated to be 3.43 g WHO-TEQ. This model estimate compares to the reported emissions of dioxins to air in Swe-den of 43 g I-TEQ in 2010 (EMEP 2012). Although soil volatilisation fluxes of dioxins are estimated to be less than 10% of current estimated primary emissions in Sweden, it should be noted that if pri-mary emissions are cut significantly then volatilisation from soils could become an important (second-ary) source of dioxins to Baltic air.
Figure 60. Modelled net fluxes (µg WHO-TEQ h-1) of the seventeen 2,3,7,8-substituted dioxins between soil and air in the Baltic Proper catchment area 1986-2006. Positive values correspond to fluxes from soil to air.
-350
-300
-250
-200
-150
-100
-50
0
50
1986 1988 1990 1992 1994 1996 1998 2000 2002 2004
µg
TEQ
/h
TCDD
PECDD
123478-HXCDD
123678-HXCDD
123789-HXCDD
HPCDD
OCDD
TCDF
12378-PECDF
23478-PECDF
123478-HXCDF
123678-HXCDF
123789-HXCDF
234678-HXCDF
1234678-HPCDF
1234789-HPCDF
OCDF

SWEDISH ENVIRONMENTAL PROTECTION AGENCY REPORT 6566 Managing the dioxin problem in the Baltic region with focus on sources to air and fish
111
Figure 61. Modelled gaseous fluxes (µg WHO-TEQ h-1) of the hexa- to octa-chlorinated PCDD/Fs between soil and air in the Baltic Proper catchment area 1986-2006. Positive values correspond to fluxes from soil to air.
Figure 62. Modelled gaseous fluxes (µg WHO-TEQ h-1) of the tetra- and penta-chlorinated PCDD/Fs between soil and air in the Baltic Proper catchment area 1986-2006. Positive values correspond to fluxes from soil to air.
12.2.4 Were riverine inputs and land-based industrial inputs of dioxins to the Baltic Sea underestimated in previous modelling work? In the previous study of Wiberg et al. (2009), a major conclusion was that the atmosphere is the major source of dioxins to the Bothnian Sea and Baltic Proper (and the Baltic Sea as a whole). Riverine in-puts and direct land-based industrial effluent inputs to the Baltic Sea were considered to be relatively
-2
-1,5
-1
-0,5
0
0,5
1986 1988 1990 1992 1994 1996 1998 2000 2002 2004
µg
TEQ
/h
123478-HXCDD
123678-HXCDD
123789-HXCDD
HPCDD
OCDD
123478-HXCDF
123678-HXCDF
123789-HXCDF
234678-HXCDF
1234678-HPCDF
1234789-HPCDF
OCDF
-10
-5
0
5
10
15
20
25
1986 1988 1990 1992 1994 1996 1998 2000 2002 2004
µg
TEQ
/h
TCDD
PECDD
TCDF
12378-PECDF
23478-PECDF

SWEDISH ENVIRONMENTAL PROTECTION AGENCY REPORT 6566 Managing the dioxin problem in the Baltic region with focus on sources to air and fish
112
minor sources in comparison to atmospheric deposition. The modelling results were convincing in providing a mass balance between atmospheric inputs and inventories of dioxins. Estimates of inputs from other known sources were small compared to atmospheric deposition. There was, however, a paucity of data on riverine and industrial inputs to totally exclude the possibility that they could make an important contribution, so newly available data have been used to make a re-evaluation of the pre-vious report’s conclusions. Within the scope of the COHIBA project, the inputs of dioxins and dl-PCBs to the Baltic Sea were quantified using substance flow analysis and chemical fate modelling. Data on riverine input of diox-ins to the Baltic Sea are not available, but for some countries COHIBA reports estimates of direct emissions to inland surface waters. In Sweden 1.0-20 g I-TEQ PCDD/Fs and dl-PCBs are emitted to surface waters each year (Andersson et al. 2012). For Estonia and Latvia the corresponding estimates takes only one source sector into account. The Latvian industry releases 0.0053 g I-TEQ/year PCDD/Fs and dl-PCBs to surface waters (Fridmanis et al. 2012). In Estonia 0.03 g I-TEQ/year is re-leased from waste water treatment plants (Laht and Volkov 2012). Although these estimates do not make out a sufficient foundation for a Baltic Sea mass balance, they indicate that the riverine input of dioxins originating from direct sources is very low in relation to the input from atmospheric deposition (133 g WHO-TEQ/year to the Bothnian Sea and the Baltic Proper, according to Wiberg et al. (2009). Newly available average PCDD/F water concentrations measured at six occasions between November 2007 and May 2009 in the Umeå river (Josefsson et al., manuscript in preparation) were also used to make a rough estimate of the total riverine input to the Bothnian Sea for comparison with our previous model estimates (Wiberg et al. 2009). It is assumed that the water concentration in the Umeå River is a good approximation for the average riverine water concentrations in the Bothnian Sea basin. Accord-ing to our calculations, which estimate the entire riverine discharge to the Bothnian Sea and assume that it has the same concentration as the Umeå River, the yearly riverine input to the basin is 0.88 g WHO-TEQ. According to the modelling study by Wiberg et al. (2009), the input from direct atmos-pheric deposition to this basin is 27.3 g WHO-TEQ yr-1. The riverine input is 11.1 g WHO- TEQ yr-
1.This estimate of the riverine input does not include direct emissions, but only indirect transfer via the atmosphere.
12.2.5 Concluding remarks concerning the lack of necessity for new POPCYCLING-Baltic model simulations The plan in the project proposal was to undertake reruns of a re-parameterised POPCYCLING-Baltic model if necessary. We did undertake some additional model runs using the version of the POPCYCLING-Baltic model form the previous work (Wiberg et al. 2009) to assess if volatilisa-tion/resuspension could significantly contribute to atmospheric deposition of dioxins to the Baltic Sea (see section 12.2.3), but we did not alter the parameterisation of the model in these simulations. After careful consideration (see above discussion), we did not believe that there was any justification for a re-parameterisation of the POPCYCLING-Baltic model based on the new knowledge generated within and outside this project in the last 3 years. In our opinion, the main conclusions from the previous modelling undertaken by Wiberg et al. (2009) are correct. The atmosphere is the dominant external source of dioxins to the Baltic Sea and there-fore reducing atmospheric deposition will lead to a reduction in Baltic water concentrations. There is evidence from Chapter 8, however, that the model slightly overestimated the decline in concentra-tions in the Baltic Sea sediments. Although this is suspected to be due to an oversimplification of the sediment dynamics, as discussed above, it would be a major modelling effort to correctly describe the
SWEDISH ENVIRONMENTAL PROTECTION AGENCY REPORT 6566 Managing the dioxin problem in the Baltic region with focus on sources to air and fish
113
sediment dynamics in the model. Furthermore there is no evidence that the parameterisation is incor-rect based on the latest information. The parameterisation of sedimentation rates in the POPCYCLING-Baltic model agrees fairly well with new sedimentation data collected by the Geologi-cal Survey of Sweden (see 12.2.2) so a simple re-parameterisation based on these new data would not markedly change the modelling results. We predict, according to the modelling in (Wiberg et al. 2009) that further future reductions in atmos-pheric deposition will result in declines in water and fatty fish concentrations, but the exact magnitude of this decline in concentrations is likely to be slightly slower than predicted in the previous POPCYCLING-Baltic model simulations.
12.3 Main conclusions At the end of each of the chapters 5-11 there are overall conclusions related to that specific chapter. We will not repeat all of those conclusions here but instead try to draw some overall conclusions from the BalticPOPs project. We will also specifically address the main questions that we aimed to address in this project and that are listed in the introduction in 4.1.
12.3.1 Temporal and spatial trends in herring Temporal trends for PCDD/Fs and dl-PCBs in Baltic herring were monitored at three coastal sites
in the Baltic Sea for different time periods: Ängskärsklubb (1979-2009), Harufjärden (1990-2009), and Utlängan (1988-2009), and one site in the Kattegat Sea; Fladen (1990-2009). The con-clusions were as follows: - At Ängskärsklubb and Fladen, all six dominant PCDD/F and dl-PCB congeners showed sta-
tistically significant decreases in concentrations. Significant decreases were also observed for TEQPCDD, TEQPCDF and TEQdl-PCB.
- At Harufjärden significant decreases were only observed for 2378-TCDD and TEQPCDD, whereas no significant trends were observed for all other dominant congeners and TEQ val-ues.
- At Utlängan only two dominant congeners showed significant decreases over time, but sig-nificant decreases were observed for TEQ values.
- At all sites, PCDDs showed a significant decrease, whereas PCDFs and dl-PCBs only dis-played significant decreases in herring sampled at Ängskärsklubb and Fladen. This could suggest a temporal shift in the composition of PCCD/F sources.
The strong statistical decreases in PCDD/Fs, dl-PCBs and TEQ values at Ängskärsklubb and Fladen demonstrate that reductions in emissions in recent decades have resulted in significant de-clines in PCDD/F and dl-PCB concentrations in Baltic herring in some locations of the Bothnian Sea.
The lack of a statistically significant decrease at some sites could be attributed to several factors: - A lack of a reduction in pollutant emissions over time. However, evidence suggests that
there has been a long-term decrease in dioxin and PCB emissions as well as levels in the Baltic environment. It is possible that some herring populations could be impacted by coastal sources which have not declined, but this is not a convincing explanation given the lack of clear spatial variation in dioxin contamination between different herring populations in the same Baltic sub-basin (see below).
- A shorter time series which reduces statistical power. On other words, there may be a time trend, but it is not possible to observe it due to lack of data.

SWEDISH ENVIRONMENTAL PROTECTION AGENCY REPORT 6566 Managing the dioxin problem in the Baltic region with focus on sources to air and fish
114
- The slower observed growth rates of herring in the Bothnian Sea and Baltic Proper. Bioen-ergetics modelling demonstrated that slower growth rates strongly affect downward tem-poral trends of dioxin concentrations in herring and potentially counteract emission reduc-tion measures.
- A temporal shift in the Baltic herring diet in herring over the last few decades, which is inter-related to the slower growth rates. Stable isotope analysis indicates that the Baltic herring in the Bothnian Sea has gradually shifted to feeding at one trophic level higher than in the past. The bioenergetics modelling confirms that these shifts in diet could also counteract emission reductions by increasing bioaccumulation through the food web.
- With the slow improvement of cod populations currently observed in the Baltic Sea, we can only speculate that processes that occurred when the cod population collapsed, for instance decreased predation of herring and sprat causing increased inter- and intra-specific competi-tion for resources, will slowly reverse themselves in time. Such a reverse in ecological inter-actions could contribute to decreasing dioxin levels in herring, however, at the present time, not enough is known to give a conclusive answer.
Seasonal variations in dioxin concentrations on a l.w. basis in Baltic herring, caused by seasonal changes in herring feeding ecology, were observed with a factor of approximately 3 times higher concentrations observed in winter months compared to summer months. The strong seasonal vari-ation in herring concentrations has important implications for monitoring of POPs in herring pop-ulations.
Spatial variation of dioxin concentrations was examined within the Bothnian Sea. Herring did not differ in congener pattern or absolute concentrations (l.w.) between coastal and offshore sampling sites, but TEQPCDD/F (w.w.) did differ, with values in coastal herring being higher than offshore herring. The lack of clear spatial variation in herring concentrations is attributed to the migratory nature of herring populations within the Bothnian Sea. Herring only move into potentially con-taminated coastal areas for spawning during a few weeks in the spring/summer each year. Be-cause herring are pelagic offshore fish, they will be primarily impacted by dioxins delivered to the water column via atmospheric deposition.
Stable isotope analysis of herring stomach contents was used to examine the origin of the diet of herring sampled at 4 coastal locations in the Bothnian Sea. A higher proportion of the diet at two of the four sites was comprised of coastal-sourced food indicating that the herring populations had been feeding close to the coast prior to sampling. A high proportion of coastal sourced food in the diet did not, however, result in herring sampled near the coast to have higher dioxin con-centrations than herring sampled from the open sea.
12.3.2 Temporal and spatial trends in sediment cores and source tracing A clear decreasing time trend for both PCBs and PCDD/Fs was demonstrated in sediment cores in
all areas of the Baltic Sea, although a slower decline is seen in offshore areas (Assefa et al. 2012). The decline in PCB and PCDD/F concentrations is consistent with reported reductions in emis-sion in recent decades. For HCB, on the other hand, increasing concentration time trends were shown for all sampling sites, except for the Baltic Proper.
The source tracing for PCDD/Fs showed that for the Baltic Sea as a whole, air emissions are, and have been, the most important external sources (Assefa et al. 2011).
Direct emissions were also shown to be an important additional contributor to PCDD/F levels in sediment cores. Although little influence of the chlorine bleaching and its related industry was seen in the sediments, impact from typical land-based sources, such as chlorophenol use and kraft pulp emissions, were shown to be of importance in the northern sub-basins.

SWEDISH ENVIRONMENTAL PROTECTION AGENCY REPORT 6566 Managing the dioxin problem in the Baltic region with focus on sources to air and fish
115
The pollution composition of sediments is only showing slow fingerprint changes with time, indi-cating a slow system recovery from past pollution.
The POPCYCLING-Baltic model predicted a decline in sediment levels of PCDD/F of a factor of 3 between 1986 and 2006 (on total TEQ basis), whereas sediment core data indicated a decline of a factor of 2 or less depending on location. The model therefore predicts that the abiotic environ-ment in the Baltic will respond faster to emission reductions than is observed in reality. The plau-sible explanation for the discrepancy between model estimated declines in sediments and the sed-iment core time trends is the oversimplification of sedimentation/re-suspension/burial dynamics in the model.
12.3.3 Strong sorption and the effect on availability of dioxins Native dioxins and PCBs that enter Baltic Sea via aerosols are more strongly bound to aerosol
organic carbon than would be predicted using models which estimate particulate organic carbon-water partitioning (e.g., Seth et al. 1999). Nevertheless, the measured aerosol-water partition co-efficients indicate that the dioxins are less strongly bound than the same pollutants sorbed to or-ganic matter in top layer sediments (Sobek et al. 2013) from a previous study (Cornelissen et al. 2008).
Since atmospheric deposition is a significant pathway of especially PCDD/Fs to the Baltic Sea, the strong sorption of these pollutants to aerosols has implications for their availability and poten-tial ecotoxicity.
12.3.4 Tracing the origin of dioxins in Baltic air Air masses from the SSE-E compass sector sampled at the Aspvreten monitoring station in Swe-
den during the winter season showed the highest concentrations of PCDD/Fs. PCBs showed an opposite pattern with higher concentrations during summer, and no distinction between compass sectors, while HCB showed the same seasonal pattern as PCDD/Fs, but similar to the PCBs, with no differences related to compass sectors.
The PCDFs correlated highly with the total sum of PCDD/Fs (r>0.86). The PCDFs are also the most important contributors to the TEQ during the winter season, the season with highest air lev-els. This compound group should therefore receive special attention in the source tracing.
It was hypothesised that metal concentrations in air could be used as indicators of source types also important for PCDD/F air emissions. Correlations were observed between PCDF concentra-tions and Cd, K, Pb, Sb and Zn concentrations in air sampled during the winter months. The met-als K, Pb, Sb and Zn are associated with combustion of wood and other biofuels.
The general PCDD/F congener pattern of Aspvreten air matched well with municipal solid waste incinerator (MSWI) and coal-fired power plant combustion patterns, in contrast to emission pat-terns from electric furnaces, aluminium smelters, unleaded gas-fuelled vehicles and diesel-fuelled vehicle (Lee et al. 2004, Lin et al. 2007).
The higher PCDD/F concentrations during winter season and the mostly non-quantifiable concen-trations during summer season indicate that primary emission sources of PCDD/Fs rather than temperature-driven re-volatilisation from soils (secondary emissions) control dioxin levels in air. The POPCYCLING-Baltic model simulations (see 12.2.3) also indicate that re-volatilisation from soils is a relatively minor source of PCDD/Fs to air (contributing with less than 10% of the esti-mated TEQ emissions in Sweden).
Emission databases for the European region suggest that industrial emissions of dioxins peaked in the 1980s and that active abatement policies have now reduced emissions from industry by up to 90%. On the other hand, reduction of dioxin emissions from domestic sources has been much

SWEDISH ENVIRONMENTAL PROTECTION AGENCY REPORT 6566 Managing the dioxin problem in the Baltic region with focus on sources to air and fish
116
lower and consequently domestic sources now account for more than one third of total dioxin emissions, a fraction that can be as high as 70% in some regions. The main domestic sources of dioxins have been estimated to be heating and cooking with solid fuels and burning of waste.
An evaluation of current emission databases for dioxins concluded that they cannot currently provide reliable spatially-resolved emissions or be used to reliably estimate total TEQ emissions in a region. As atmospheric transport modelling tools rely very much on good quality spatially-resolved emission estimates, it is therefore not possible to accurately trace the origin of dioxins in Baltic air using these tools.
The atmospheric transport model estimated that the origin of PCDD/Fs in Baltic air is mainly from continental Europe, with Eastern Europe making a strong contribution, which is consistent with air-mass back trajectories calculated from air monitoring data.
An emission adjustment procedure was attempted with an atmospheric transport model to identify the source regions for which the emission estimates are most in error (Shatalov et al. 2012). The utility of the emission adjustment procedure was limited, however, by the lack of emission reports for several European regions and the lack of knowledge concerning the congener composition of the emissions. Total TEQ emissions were largely underestimated (by a factor of 2-10 in some re-gions), and the congener composition in emission databases did not match the congener pattern in air samples.
12.3.5 Suggested answers to the main questions posed in the project In the proposal and introduction we set out to answer the following questions. Brief answers based on the research undertaken are given after each question.
i) Why are dioxin levels in fatty fish from the Baltic Sea so high? The slow growth of herring in some Baltic sub-basins combined with the long residence time of Baltic Sea water are consid-ered the main reasons why Baltic herring have higher dioxin concentrations than in surround-ing seas. It is possible that some herring populations could have been impacted by coastal sources resulting in high concentrations, but the migratory nature of herring (they spend lim-ited time at the coast during spawning) and the lack of spatial variation in dioxin contamina-tion between different herring populations in the Bothnian Sea makes this seem an unlikely explanation.
ii) What are the main sources of the dioxins in Baltic herring? Research undertaken in the Bal-
ticPOPs project confirms the conclusion of previous work (Wiberg et al. 2009) that the atmos-phere is, and will continue to be, the major external source of dioxin pollution in the Baltic Sea and thus dioxin contamination in herring populations. Key evidence for the dominance of at-mospheric sources includes:
Environmental fate modelling (Armitage et al. 2009, Wiberg et al. 2009);
Sediment source tracing modelling (Sundqvist et al. 2010, Assefa et al. 2011, and this study);
Measurements of dioxins in the Umeå River (Josefsson et al., manuscript in preparation) and in air in the Baltic region (Sellström et al. 2009), indicating relatively low contribu-tion of riverine inputs in comparison to atmospheric deposition;
The relatively low contribution of inputs from wastewater/industrial discharges (Anders-son et al. 2012, Fridmanis et al. 2012, Laht and Volkov 2012);
The general lack of observed spatial differences in dioxin concentrations in herring be-tween the coast and open sea within the Bothnian Sea (this study).
SWEDISH ENVIRONMENTAL PROTECTION AGENCY REPORT 6566 Managing the dioxin problem in the Baltic region with focus on sources to air and fish
117
iii) What are the main sources of dioxins and other POPs in Baltic air? Air monitoring combined
with receptor modelling was not able to pinpoint the sources responsible for dioxins and other POPs in Baltic air, but indicated a dominance of diffuse combustion sources. Emission data-bases for the European region suggest that domestic combustion sources now account for more than one third of total dioxin emissions and this fraction can be as high as 70% in some re-gions. The main domestic sources of dioxins have been estimated to be heating and cooking with solid fuels and burning of waste. The project did not address question iii) for other POPs due to limited resources.
iv) Are these sources (ii and iii) the result of on-going primary emissions or of recirculation of
chemical stored in environmental reservoirs? Seasonal air concentrations of dioxins with peaks during winter months indicate that primary emission sources of dioxins rather than tempera-ture-driven re-volatilisation from soils (secondary emissions) control dioxin levels in air. The POPCYCLING-Baltic model simulations also indicate that re-volatilisation from soils is a rel-atively minor source of dioxins to air.
v) Are these sources (ii and iii) mainly national or international? It is not possible to accurately
pinpoint the geographical regions which are most likely to be responsible for dioxin emissions to air in Europe, but it is known, based on monitoring and modelling, that continental Europe and especially Eastern Europe makes the largest contribution to atmospheric deposition in most Baltic basins. Swedish sources make only a minor contribution to levels of dioxins in Baltic air.
vi) How has the pollution situation changed over time? Emissions of dioxins have declined in re-
cent decades as a result of active abatement policies, and research undertaken in BalticPOPs has shown that this has resulted in long-term declines in concentrations in Baltic sediment and in some herring populations. Bioenergetics modelling undertaken in BalticPOPs has shown that slower growth rates of herring and changes in feeding ecology may be slowing downward temporal trends of dioxin concentrations in herring and potentially counteracting emission re-duction measures.
vii) Assuming dioxin inputs to the Baltic Sea are reduced – how long will it take until the concen-
trations in herring decrease to levels safely below EU threshold values? More action is needed to reduce the emissions of dioxins to air and thus atmospheric deposition to the Baltic Sea, be-cause levels of dioxins in herring remain above EU threshold values. It is uncertain if the ob-served long-term downward decreasing time trend in herring will continue because we are un-able to predict the future of the key factors affecting these future trends. We are not able to predict if emissions will continue to decrease or will level off in the future. Furthermore, we are not able to predict how herring ecology (growth rates and feeding behaviour) will change in the future. Slowing growth rates and changing feeding ecology have previously been identi-fied in this report as factors which can affect the levels and trends of dioxins in herring popu-lations.
viii) Are there cost-effective measures that can reduce dioxin levels in Baltic herring below the
regulatory thresholds within a relatively short time period? Based on the findings of this pro-ject, the main way to decrease herring concentrations is to reduce atmospheric deposition of dioxins to the Baltic Sea, even if the response in herring may be slow. Although active abate-
SWEDISH ENVIRONMENTAL PROTECTION AGENCY REPORT 6566 Managing the dioxin problem in the Baltic region with focus on sources to air and fish
118
ment policies have reduced dioxin emissions from industry by up to 90%, reduction of dioxin emissions from domestic sources has been much lower and consequently domestic combustion sources now dominate total estimated emissions in some regions. Policy actions have to ad-dress reducing these diffuse domestic combustion sources of dioxins to the atmosphere. It cannot be guaranteed that policy actions to reduce emissions will result in rapid reduction of dioxin levels in herring below EU threshold values. Although reductions in dioxin emissions will ultimately reduce levels of dioxins in Baltic seawater, observed changes in herring ecolo-gy (e.g., slowing growth rates and/or feeding ecology) in some herring populations could cause dioxin levels in herring to respond more slowly than seawater to emission reductions.
ix) Clean-up of dioxin-contaminated sediments in coastal regions of the Baltic will have im-portant local benefits such as improvement of water quality and lowering of contamination levels in species which reside mainly in the contaminated regions. These clean-up actions are not likely to have much impact on the levels of PCDD/Fs in migratory fish (e.g., herring) which spend most of their time in the open sea and only move into coastal regions to spawn during a few weeks in the spring/summer.
12.4 Recommended action by regulatory authorities and further research To reduce atmospheric deposition and thus levels in herring, it would be necessary to introduce a
pan-European reduction in dioxin emissions by wide-scale introduction of best available tech-niques for pollution control. European industry has already been effective in reducing point source dioxin emissions. There is, however, an indication from this study that reductions of diox-in emissions in Eastern Europe may have been less effective and that further work may be re-quired in this area.
Although it is challenging to pinpoint the most important dioxin source categories contributing to the dioxin pollution in the Baltic Sea, there is evidence that non-industrial combustion sources are important relative to the legacy industrial sources. An earlier study (BiPRO 2009) suggested that heating, cooking and waste disposal are becoming relatively more important dioxin sources in Europe as a whole. The previous study states that, in order to further reduce dioxin emissions from combustion sources, action is needed which include: - continued efforts to reduce illegal waste burning (domestic and back-yard) with the aid of
education campaigns to inform on the ban as well as strengthened control - a ban on domestic heating using solid fuels - improvements in industrial and household energy efficiency to reduce emissions from power
generation - improvements of insulation and temperature regulation in households - replacement of old heating appliances with new equipment that is more efficient and/or use
greener technologies (e.g., solar and geothermal); and - promotion of centralised district heating schemes which are especially effective in urban are-
as and can also utilise green technologies.
Increasing shipping activities are expected to contribute significantly to air and sea pollution in the Baltic Sea region (Cooper 2004). These emissions are currently not well-quantified for diox-ins, and thus their importance cannot be properly compared to other emission sources. In the Bal-ticPOPs modelling work we made rough estimates of dioxin emissions from ships which could have potentially affected the conclusions. It is recommended that i) emissions of POPs from ships

SWEDISH ENVIRONMENTAL PROTECTION AGENCY REPORT 6566 Managing the dioxin problem in the Baltic region with focus on sources to air and fish
119
are quantified through monitoring activities and ii) if possible, shipping emission are reduced by fitting ships with pollution control equipment.
A general reduction in combustion sources would, as well as reducing dioxin emissions, have the co-benefit of reducing emissions of other pollutants such as PAHs, black carbon, metals and even carbon dioxide, the most well-known greenhouse gas. Other policies such as those related to cli-mate change and clean air thus contribute to the reduction of dioxin emissions. A key considera-tion for regulators is if they can fully rely on existing legislation to take care of the dioxin prob-lem in the Baltic Sea. A more responsible course of action, in our opinion, is to continue to sup-port research that aims to pinpoint the specific sources of dioxins to air. Such research would support the introduction of more targeted and effective policy for reduction of dioxin emissions.
Any additional emission reduction strategy should be closely monitored to determine its effec-tiveness. We recommend, for example, extending and improving monitoring programmes that provide data on long-term temporal trends in PCDD/F levels in air, atmospheric deposition and biota. It would also be advisable to co-monitor other pollutants which could be markers of dioxin sources (e.g., metals and black carbon).
Education campaigns on the potential adverse effects of dioxins on human health and the envi-ronment is vital for public acceptance of measures that reduce dioxin emissions. These education campaigns could also emphasise the co-benefits of reducing diffuse combustion sources (as men-tioned above).
Any monitoring programme should implement state-of-the-art methods for the sampling and analysis of POPs, and the same methods should be used at each monitoring station to ensure con-sistency. There is evidence to suggest that the two existing methods currently used in Sweden for sampling atmospheric deposition do not provide comparable measurements for particle-sorbed pollutants. The PUF plugs used as adsorbents in the standard deposition POP sampler in Sweden are not efficient for collecting very hydrophobic (particle-sorbed) pollutants such as dioxins. Two other samplers have been tested based on other POP adsorbent principles (Bergknut et al. 2011). Both types sampled dioxins with significantly higher efficiency than the standard sampler (Wi-berg et al. unpublished), although they also showed some discrepancies between each other (Bergknut et al. 2011).
Pinpointing the important contributing dioxin point sources in the European region is a challeng-ing exercise. It has been demonstrated here that existing emission databases are deficient. It is therefore recommended to support efforts to improve international reporting of emissions for POPs. Information exchange, coordination and harmonisation of emission data in estimating na-tional dioxin emissions are necessary to obtain more reliable and comparable inventories.
A promising approach to identifying important contributing emission sources is to use cost-effective spatial air-monitoring strategies such as long-term spatial passive air sampling cam-paigns to simultaneously monitor POPs together with other useful markers of different types of combustion sources. There have been large advances in the passive air sampling technology in re-cent years, as well as in the establishment of large spatial monitoring programmes in Europe and globally.
We recommend the following research, using various monitoring and modelling approaches for understanding source and fate of dioxins: - An approach for estimating emissions of POPs from large urban areas has recently been de-
veloped (e.g., Gasic et al. 2010, Gasic et al. 2009, Moeckel et al. 2010). The approach uses a combination of atmospheric modelling and urban air monitoring to back-calculate emissions for urban areas.

SWEDISH ENVIRONMENTAL PROTECTION AGENCY REPORT 6566 Managing the dioxin problem in the Baltic region with focus on sources to air and fish
120
- Current modelling tools (e.g., the POPCYCLING-Baltic model) for estimating the fate of POPs in the Baltic region are over-simplified in their description of, for example, atmospher-ic transport and sediment dynamics. New, more advanced, modelling tools with improved descriptions of the physical environment are required to support decision making processes.
- The atmospheric modelling tool used in this project (MSCE-POP model) is useful for identi-fying sources of dioxins and other POPs in air. However, improved pollutant emission and monitoring data are needed for further model evaluation. Multiple measurement sites with a more homogenous distribution than were available in the current study (only Scandinavian sites: Aspvreten, Pallas and Vindeln) within the region are desired for a better evaluation of model results. The aforementioned passive sampling networks would provide a cost-effective approach for model evaluation in the future.
An additional way to decrease herring dioxin concentrations, suggested by Peltonen et al. (2007), is to reduce the number of herring individuals through fishing so that feeding conditions for the remaining herring are improved. This is a complex ecological issue, and the biological implica-tions and potential success of such a management alternative was not addressed in BalticPOPs. Hence, if considered, it would need to be further investigated in collaboration with fish ecology researchers.

SWEDISH ENVIRONMENTAL PROTECTION AGENCY REPORT 6566 Managing the dioxin problem in the Baltic region with focus on sources to air and fish
121
13 References Aberg A, Macleod M, Wiberg K. 2008. Physical-chemical property data for dibenzo-p-dioxin (DD), dibenzofuran (DF), and chlorinated DD/Fs: a critical review and recommended values. Journal of Physical and Chemical Reference Data 37: 1997-2008.
Aberg A, Tysklind M, Nilsson T, Macleod M, Hanberg A, et al. 2010. Exposure assessment at a PCDD/F contaminated site in Sweden-field measurements of exposure media and blood serum analy-sis. Environmental Science and Pollution Research 17: 26-39.
Algesten G, Sobek S, Bergstrom AK, Jonsson A, Tranvik LJ, Jansson M. 2005. Contribution of sediment respiration to summer CO2 emission from low productive boreal and subarctic lakes. Micro-bial Ecology 50: 529-535.
Anderson PN, Hites RA. 1996. OH radical reactions: The major removal pathway for polychlorinated biphenyls from the atmosphere. Environmental Science & Technology 30: 1756-1763.
Andersson H, Palm Cousins A, Brorström-Lundén E, Wickman T, Pettersson M, et al. 2012. COHIBA summary report Sweden - Work package 4: Identification of sources and estimation of in-puts/impacts on the Baltic Sea. IVL (Swedish Environmental Research Institute). [www.cohiba-project.net/publications].
Armitage JM, McLachlan MS, Wiberg K, Jonsson P. 2009. A model assessment of polychlorinated dibenzo-p-dioxin and dibenzofuran sources and fate in the Baltic Sea. Science of the Total Environ-ment 407: 3784-3792.
Arrhenius F, Hansson S. 1993. Food-consumption of larval, young and adult herring and sprat in the Baltic Sea. Marine Ecology-Progress Series 96: 125-137.
Assefa AT, Sundqvist KL, Cato I, Wiberg K. 2011. Time trends of PCDD/F levels and source con-tributions in Baltic Sea sediments. Organohalogen Compounds 73:142-145.
Assefa AT, Sundqvist KL, Cato I, Jonsson P, Sobek A, Wiberg K. 2012. Trends of PCDD/Fs in coastal and offshore Baltic Sea sediment cores covering the 20th century. Organohalogen Compounds 74: 328-331.
Baker JI, Hites RA. 2000. Is combustion the major source of polychlorinated dibenzo-p-dioxins and dibenzofurans to the environment? A mass balance investigation. Environmental Science & Technolo-gy 34: 2879-2886.
Barber JL, Sweetman AJ, Van Wijk D, Jones KC. 2005. Hexachlorobenzene in the global envi-ronment: Emissions, levels, distribution, trends and processes. Science of the Total Environment 349: 1-44.
Bartnicki J, Gusev A, Aas W, Valiyaveetil S. 2009. Atmospheric supply of nitrogen, lead, cadmium, mercury and dioxins/furans to the Baltic Sea in 2007. EMEP/MSC-W Technical Report 2/2009.
Bergknut M, Laudon H, Jansson S, Larsson A, Gocht T, Wiberg K. 2011. Atmospheric deposi-tion, retention, and stream export of dioxins and PCBs in a pristine boreal catchment. Environmental Pollution 159: 1592-1598.

SWEDISH ENVIRONMENTAL PROTECTION AGENCY REPORT 6566 Managing the dioxin problem in the Baltic region with focus on sources to air and fish
122
Berntssen MHG, Lundebye AK, Torstensen BE. 2005. Reducing the levels of dioxins and dioxin-like PCBs in farmed Atlantic salmon by substitution of fish oil with vegetable oil in the feed. Aquacul-ture Nutrition 11: 219-231.
Bichlmaier A, Tillmann O, Gruber L, Santl H, Stöhrer E. 1992. PCDD/F mass balance of a recy-cling paper mill. Organohalogen Compounds 9:25-28.
Bignert A. 2010. PIA statistical application developed for use by the Arctic Monitoring and Assess-ment Programme [www.amap.no] .
Bignert A, Boalt E, Danielsson S, Hedman J, Johansson AK, et al. 2011. Comments concerning the national Swedish contaminant monitoring programme in marine biota. Swedish Museum of Natural History, Report 7:2011.
Bignert A, Danielsson S, Bergek S. 2009a. Seasonal variation in concentration of dioxins, dibenzofu-rans and dioxin-like PCBs in herring from the Bothnian Sea. Organohalogen Compounds 71:2057-2061.
Bignert A, Danielsson S, Greyerz E, Bergek S. 2009b. Säsongsvariation och geografisk variation i koncentrationer av dioxiner, dibensofuraner och dioxinlika PCB:er i strömming från Bottenhavet. Länsstyrelsen i Gävleborgs län, Rapport 2009:7.
Bignert A, Danielsson S, Nyberg E, Asplund L, Eriksson U, et al. 2010. Comments concerning the national Swedish contaminant monitoring programme in marine biota. Swedish Museum of Natural History, Report 1:2010.
Bignert A, Greyerz E, Nyberg E, Sundqvist K, Wiberg K. 2005. Geografisk variation i koncentrat-ioner av dioxiner och PCB i strömming från Bottniska viken och norra egentliga Östersjön. Naturhi-storiska Riksmuseet, Rapport 2005:23.
Bignert A, Gothberg A, Jensen S, Litzen K, Odsjo T, et al. 1993. The need for adequate biological sampling in ecotoxicological investigations – a retrospective study of 20 years pollution monitoring. Science of the Total Environment 128: 121-139.
Bignert A, Nyberg E, Sundqvist KL, Wiberg K. 2007. Spatial variation in concentrations and pat-terns of the PCDD/F and dioxin-like-PCB content in herring from the northern Baltic Sea. Journal of Environmental Monitoring 9: 550-556.
BiPRO. 2009. Information exchange on reduction of dioxin emissions from domestic sources. Report 070307/2007/481007/MAR/C4 [http://ec.europa.eu/environment/dioxin/pdf/report09].
Bodin N, Le Loc'h F, Hily C. 2007. Effect of lipid removal on carbon and nitrogen stable isotope ratios in crustacean tissues. Journal of Experimental Marine Biology and Ecology 341: 168-175.
Borg H, Jonsson P. 1996. Large-scale metal distribution in Baltic Sea sediments. Marine Pollution Bulletin 32: 8-21.
Cardinale M, Arrhenius F. 2000. Decreasing weight-at-age of Atlantic herring (Clupea harengus) from the Baltic Sea between 1986 and 1996: a statistical analysis. ICES Journal of Marine Science 57: 882-893.

SWEDISH ENVIRONMENTAL PROTECTION AGENCY REPORT 6566 Managing the dioxin problem in the Baltic region with focus on sources to air and fish
123
Casini M, Bartolino V, Molinero JC, Kornilovs G. 2010. Linking fisheries, trophic interactions and climate: threshold dynamics drive herring Clupea harengus growth in the central Baltic Sea. Marine Ecology-Progress Series 413: 241-252.
Casini M, Cardinale M, Arrhenius F. 2004. Feeding preferences of herring (Clupea harengus) and sprat (Sprattus sprattus) in the southern Baltic Sea. ICES Journal of Marine Science 61: 1267-1277.
Cato I. 2012. Ackumulationshastigheter i svenska havsområden. Swedish Geological Survey (SGU). PM 2012-03-07.
Cato I, Apler A. 2011. Metaller och miljögifter i sediment – inom Stockholms stad och Stockholms län 2007. Länsstyrelsen i Stockholms län, Rapport 2011:19.
Cato I, Assefa AT, Wiberg K. 2012. Background paper on concentrations of polychlorinated diben-zo-p-dioxins and polychlorinated dibenzofurans (PCDD/Fs) in post-glacial clays of the Baltic Sea. Annex 6 in Report of the Working Group on Marine Sediments in Relation to Pollution (WGMS), International Council for the Exploration of the Sea (ICES), WGMS report 2012, SCICOM steering group on human interactions on ecosystems, ICES CM 2012/SSGHIE:06.
Cato I, Rindby A, Rudolfsson J. 2000. Unik sedimentscanner utvecklad. Geologiskt Forum 25: 13-15.
Cohen MD, Draxler RR, Artz R, Commoner B, Bartlett P, et al. 2002. Modeling the atmospheric transport and deposition of PCDD/F to the Great Lakes. Environmental Science & Technology 36: 4831-4845.
Cooper D. 2004. HCB, PCB, PCDD and PCDF emissions from ships. IVL (Swedish Environmental Research Institute), Report B1620.
Cornelissen G, Wiberg K, Broman D, Arp HPH, Persson Y, et al. 2008. Freely dissolved concen-trations and sediment-water activity ratios of PCDD/Fs and PCBs in the open Baltic Sea. Environmen-tal Science & Technology 42: 8733-8739.
Cousins IT, Beck AJ, Jones KC. 1999. A review of the processes involved in the exchange of semi-volatile organic compounds (SVOC) across the air-soil interface. Science of the Total Environment 228: 5-24.
Cousins IT, Jones KC. 1998. Air-soil exchange of semi-volatile organic compounds (SOCs) in the UK. Environmental Pollution 102: 105-118.
Danielsson C, Wiberg K, Korytar P, Bergek S, Brinkman U, Haglund P. 2005. Trace analysis of polychlorinated dibenzo-p-dioxins, dibenzofurans and WHO polychlorinated biphenyls in food using comprehensive two-dimensional gas chromatography with electron-capture detection. Journal of Chromatography A 1086: 61-70.
Denier Van Der Gon HAC, Van Het Bolscher M, Visschedijk AJH, Zandveld PYJ. 2005. Study to the effectiveness of the UNECE POP Protocol and costs of possible additional measures. Phase 1: Estimation of emission reduction resulting from the implementation of the POP Protocol. TNO report B&O-A R2005/194.
Duarte-Davidson R, Sewart A, Alcock RE, Cousins IT, Jones KC. 1996. Exploring the balance between sources, deposition, and the environmental burden of PCDD/Fs in the U.K. terrestrial envi-

SWEDISH ENVIRONMENTAL PROTECTION AGENCY REPORT 6566 Managing the dioxin problem in the Baltic region with focus on sources to air and fish
124
ronment: an aid to identifying uncertainties and research needs. Environmental Science & Technology 31: 1-11.
Ehrich D, Tarroux A, Stien J, Lecomte N, Killengreen S, et al. 2011. Stable isotope analysis: mod-elling lipid normalization for muscle and eggs from arctic mammals and birds. Methods in Ecology and Evolution 2: 66-76.
Elston RA, Drum, AS, Pearson WH, Parker K. 1997. Health and condition of pacific herring Clu-pea pallasi from Prince William Sound, Alaska, 1994. Diseases of Aquatic Organisms 31: 109-126
EMEP. 2004. Persistent organic pollutants in the environment. EMEP Status Report 3/2004.
EMEP. 2012. WebDab search - Emissions as used in EMEP models [http://www.ceip.at/webdab-emission-database].
EMEP/EEA. 2009. EMEP/EEA air pollutant emission inventory guidebook 2009. EEA Technical report 9/2009.
Flinkman J, Aro E, Vuorinen I, Viitasalo M. 1998. Changes in northern Baltic zooplankton and herring nutrition from 1980s to 1990s: top-down and bottom-up processes at work. Marine Ecology-Progress Series 165: 127-136.
Flinkman J, Vuorinen I, Aro E. 1992. Planktivorous Baltic herring (Culpea harengus) prey selec-tively on reproducing copepods and cladocerans. Canadian Journal of Fisheries and Aquatic Sciences 49: 73-77.
Fridmanis J, Toropovs V, Linde A. 2012. COHIBA summary report Latvia - Work package 4: Iden-tification of sources and estimation of inputs/impacts on the Baltic Sea. Baltic Environmental Forum. [www.cohiba-project.net/publications].
Gasic B, Macleod M, Klanova J, Scheringer M, Ilic P, et al. 2010. Quantification of sources of PCBs to the atmosphere in urban areas: A comparison of cities in North America, Western Europe and former Yugoslavia. Environmental Pollution 158: 3230-3235.
Gasic B, Moeckel C, Macleod M, Brunner J, Scheringer M, et al. 2009. Measuring and modeling short-term variability of PCBs in air and characterization of urban source strength in Zurich, Switzer-land. Environmental Science & Technology 43: 769-776.
Gusev A. 2008. Atmospheric depositions of PCDD/Fs on the Baltic Sea. HELCOM Indicator Fact Sheets 2008. [http://www.helcom.fi/BSAP_assessment/ifs/archive/ifs2008/en_GB/Pcddfdepositions/ ?u4.highlight=gusev pcdd].
Gusev A, Dutchak S, Rozovskaya O, Shatalov V, Sokovykh V, et al. 2011. Persistent organic pollu-tants in the environment. EMEP Status Report 3/2011.
Gusev A, Mantseva E, Shatalov V, Strukov B. 2005a. Regional multicompartment model MSCE-POP. EMEP/MSC-E Technical Report 5/2005.
Gusev A, Mantseva E, Shatalov V, Travnikov O. 2005b. Hemispheric model (MSCE-Hem) of per-sistent toxic substances dispersion in the environment. EMEP/MSC-E Technical Note 11/2005 .

SWEDISH ENVIRONMENTAL PROTECTION AGENCY REPORT 6566 Managing the dioxin problem in the Baltic region with focus on sources to air and fish
125
Gustafsson O, Bucheli TD, Kukulska Z, Andersson M, Largeau C, et al. 2001. Evaluation of a protocol for the quantification of black carbon in sediments. Global Biogeochemical Cycles 15: 881-890.
Halsall CJ, Bailey R, Stern GA, Barrie LA, Fellin P, et al. 1998. Multi-year observations of orga-nohalogen pesticides in the Arctic atmosphere. Environmental Pollution 102: 51-62.
Hanson P, Johnson T, Schindler D, Kitchell J. 1997. Fish Bioenergetics 3.0. Technical Report WISCU-T-97-001. University of Wisconsin Sea Grant Institute, Madison, WI.
Harner T, Shoeib M, Diamond M, Stern G, Rosenberg B. 2004. Using passive air samplers to as-sess urban - rural trends for persistent organic pollutants. 1. Polychlorinated biphenyls and organochlo-rine pesticides. Environmental Science & Technology 38: 4474-4483.
Harrad SJ, Jones KC. 1992. A source inventory and budget for chlorinated dioxins and furans in the United Kingdom environment. Science of the Total Environment 126: 89-107.
Hassanin A, Lee RGM, Johnston AE, Jones KC. 2006. Reductions and changing patterns of ambi-ent PCDD/Fs in the UK: Evidence and implications. Chemosphere 65: 530-539.
Hawthorne SB, Grabanski CB, Miller DJ, Arp HPH. 2011. Improving predictability of sediment-pore-water partitioning models using trends observed with PCB-contaminated field sediments. Envi-ronmental Science & Technology 45: 7365-7371.
HELCOM. 2004. Dioxins in the Baltic Sea. Helsinki Commission, Helsinki, Finland. [http://www.helcom.fi/stc/files/Publications/OtherPublications/Dioxins_in_BS-2004.pdf].
Hodjamberdiev I. 2006. Determination of dioxins, furans, PCB sources and anti-POPs campaign in Central Asia. Eco-Accord Center for Environment and Sustainable Development. [http://www. ecoaccord.org/pop/ipep/hodjamberdiev.htm].
Hopke P. Personal communication. Department of Chemical and Biomolecular Engineering and Cen-ter for Air Resources Engineering and Science, Clarkson University.
Huynh MD, Kitts DD, Hu C, Trites AW. 2007. Comparison of fatty acid profiles of spawning and non-spawning Pacific herring, Clupea harengus pallasi. Comparative Biochemistry and Physiology B-Biochemistry & Molecular Biology 146: 504-511.
ICES. 2011. Report of the Baltic Fisheries Assessment Working Group (WGBFAS), ICES Advisory Committee ICES CM 2011/ACOM: 1.
Ilyin I, Gusev A, Rozvskaya O, Shatalov V, Sokovykh V, Travnikov O. 2010. Modelling of heavy metals and persistent organic pollutants: new developments. EMEP/MSC-E Technical Report 1/2010.
Ilyin I, Travnikov O. 2005. Modelling of heavy metal airborne pollution in Europe: evaluation of the model performance. EMEP/MSC-E Technical Report 8/2005.
Isosaari P, Hallikainen A, Kiviranta H, Vuorinen PJ, Parmanne R, et al. 2006. Polychlorinated dibenzo-p-dioxins, dibenzofurans, biphenyls, naphthalenes and polybrominated diphenyl ethers in the edible fish caught from the Baltic Sea and lakes in Finland. Environmental Pollution 141: 213-225.
Jones KC, Duarte-Davidson, R. 1997. Transfers of airborne PCDD/Fs to bulk deposition collectors and herbage. Environmental Science & Technology 31: 2937-2943.

SWEDISH ENVIRONMENTAL PROTECTION AGENCY REPORT 6566 Managing the dioxin problem in the Baltic region with focus on sources to air and fish
126
Jonsson P. Unpublished data. Department of Applied Environmental Science, Stockholm University
Jonsson P, Carman R, Wulff F. 1990. Laminated sediments in the Baltic – A tool for evaluating nutrient mass balances. Ambio 19:152-158
Jonsson P, Persson J, Holmberg P. 2003. Skärgårdens bottnar. Naturvårdsverket, Rapport 5212.
Josefsson S, Bergknut M, Wiberg K. Manuscript in preparation. Influence of landscape type, stream order and hydrological conditions on terrestrial export of POPs.
Josefsson S, Wiberg K. Department of Aquatic Sciences and Assessment, Swedish University of Agricultural Sciences (SLU). Unpublished data.
Jurado E, Jaward FM, Lohmann R, Jones KC, Simo R, Dachs J. 2004. Atmospheric dry deposi-tion of persistent organic pollutants to the Atlantic and inferences for the global oceans. Environmental Science & Technology 38: 5505-5513.
Karl H, Ruoff U. 2007. Dioxins, dioxin-like PCBs and chloroorganic contaminants in herring, Clupea harengus, from different fishing grounds of the Baltic Sea. Chemosphere 67: S90-S95.
Katsoyiannis A, Gioia R, Sweetman AJ, Jones KC. 2010. Continuous Monitoring of PCDD/Fs in the UK Atmosphere: 1991-2008. Environmental Science & Technology 44: 5735-5740.
Kiljunen M, Grey J, Sinisalo T, Harrod C, Immonen H, Jones RI. 2006. A revised model for lipid-normalizing δ13C values from aquatic organisms, with implications for isotope mixing models. Jour-nal of Applied Ecology 43: 1213-1222.
Kiljunen M, Vanhatalo M, Mantyniemi S, Peltonen H, Kuikka S, et al. 2007. Human dietary in-take of organochlorines from Baltic herring: Implications of individual fish variability and fisheries management. Ambio 36: 257-264.
Kitunen V, Salkinoja-Salonen M. 1990. Distribution of PCDDs/PCDFs in bleached paperboard an explanation for the migration of PCDDs/PCDFs from paper and board products. Organohalogen Compounds 3: 251-254.
Kiviranta H, Vartiainen T, Parmanne R, Hallikainen A, Koistinen J. 2003. PCDD/Fs and PCBs in Baltic herring during the 1990s. Chemosphere 50: 1201-1216.
Kjeller LO, Rappe C. 1995. Time trends in levels, patterns, and profiles for polychlorinated dibenzo-p-dioxins, dibenzofurans, and biphenyls in a sediment core from the Baltic Proper. Environmental Science & Technology 29: 346-355.
Koistinen J, Stenman O, Haahti H, Suonpera M, Paasivirta J. 1997. Polychlorinated diphenyl ethers, dibenzo-p-dioxins, dibenzofurans and biphenyls in seals and sediment from the Gulf of Fin-land. Chemosphere 35: 1249-1269.
Kulinski K, Pempkowiak J. 2011. The carbon budget of the Baltic Sea. Biogeosciences 8: 3219-3230.
Laht M, Volkov E. 2012. COHIBA summary report Estonia - Work package 4: Identification of sources and estimation of inputs/impacts on the Baltic Sea. Estonian Environmental Research Centre. [www.cohiba-project.net/publications].

SWEDISH ENVIRONMENTAL PROTECTION AGENCY REPORT 6566 Managing the dioxin problem in the Baltic region with focus on sources to air and fish
127
Larsson P, Okla L, Collvin L. 1993. Reproductive status and lipid content as factors in PCB, DDT and HCH contamination of a population of pike (Esox lucius L.). Environmental Toxicology and Chemistry 12: 855-861.
Lee W-S, Chang-Chien G-P, Wang L-C, Lee W-J, Tsai P-J, et al. 2004. Source identification of PCDD/Fs for various atmospheric environments in a highly industrialized city. Environmental Science & Technology 38: 4937-4944.
Li Y-F. 1996. Global population distribution database, A report to the United Nations environment programme, under UNEP sub-Project FP/1205-95-12.
Liljelind P, Soderstrom G, Hedman B, Karlsson S, Lundin L, Marklund S. 2003. Method for multiresidue determination of halogenated aromatics and PAHs in combustion-related samples. Envi-ronmental Science & Technology 37: 3680-3686.
Lin L-F, Lee W-J, Li H-W, Wang M-S, Chang-Chien G-P. 2007. Characterization and inventory of PCDD/F emissions from coal-fired power plants and other sources in Taiwan. Chemosphere 68: 1642-1649.
Lin W, Wu Y, Tu L, Wang L, Lu X. 2010. The emission and distribution of PCDD/Fs in municipal solid waste incinerators and coal-fired power plant. Aerosol and Air Quality Research 10: 519–532.
López-Antón MA, Díaz-Somoano M, Ochoa-González R, Martínez-Tarazona MR. 2011. Distri-bution of Trace Elements from a Coal Burned in Two Different Spanish Power Stations. Industrial & Engineering Chemistry Research 50: 12208-12216.
Lundin M. 2011. Herring (Clupea harengus membras) in the Baltic and Bothnian Sea: biology, be-haviour and a sustainable, viable fishery. Introductory Research Essay, Dept. of Wildlife, Fish and Environmental Studies, Swedish University of Agriculture, Umeå.
Luthe CE, Berry RM, Voss RH. 1993. Formation of chlorinated dioxins during reproduction of bleached kraft pulp from sawmill chips contaminated with polychlorinated phenols. Tappi Journal 76: 63-69.
Malanichev A, Mantseva E, Shatalov V, Strukov B, Vulykh N. 2004. Numerical evaluation of the PCBs transport over the Northern Hemisphere. Environmental Pollution 128: 279-289.
Meij R, Winkel HT. 2007. The emissions of heavy metals and persistent organic pollutants from modern coal-fired power stations. Atmospheric Environment 41: 9262-9272.
Michener R, Schell D. 1994. Chapter 7section: Stable isotope ratios as tracers in marine aquatic food webs In Methods in Ecology. Stable isotopes in Ecology and Environmental Science., ed. K Lajtha, R Michener, pp. 138-157: Blackwell Scientific Publications, Oxford.
Miller MA. 1993. Maternal transfer of organochlorine compounds in salmonines to their eggs. Cana-dian Journal of Fisheries and Aquatic Sciences 50: 1405-1413.
Moeckel C, Gasic B, Macleod M, Scheringer M, Jones KC, Hungerbuhler K. 2010. Estimation of the source strength of polybrominated diphenyl ethers based on their diel variability in air in Zurich, Switzerland. Environmental Science & Technology 44: 4225-4231.
Mollmann C, Kornilovs G, Fetter M, Koster FW. 2004. Feeding ecology of central Baltic Sea her-ring and sprat. Journal of Fish Biology 65: 1563-1581.

SWEDISH ENVIRONMENTAL PROTECTION AGENCY REPORT 6566 Managing the dioxin problem in the Baltic region with focus on sources to air and fish
128
Muir DCG, Yarechewski AL. 1988. Dietary accumulation of 4 chlorinated dioxin congeners by rain-bow-trout and fathead minnows. Environmental Toxicology and Chemistry 7: 227-236.
NATO/CCMS. 1988. Scientific basis for the development of the International Toxicity Equivalency Factor (I-TEF) method of risk assessment for complex mixtures of dioxins and related compounds. North Atlantic Treaty Organization, Committee on the Challenges of Modern Society.
OSPAR Commission. 2007. Dioxins. Publication Number: 308/2007.
Pacyna J. 1986. Emission factors of atmospheric elements, In Toxic metals in the atmosphere, 1-32, ed. J Nriagu, I Davidson: John Wiley & Sons, New York, NY.
Pacyna JM, Breivik K, Munch J, Fudala J. 2003. European atmospheric emissions of selected per-sistent organic pollutants, 1970-1995. Atmospheric Environment 37: S119-S131.
Pandelova M, Henkelmann B, Roots O, Simm M, Jaerv L, et al. 2008. Levels of PCDD/F and dioxin-like PCB in Baltic fish of different age and gender. Chemosphere 71: 369-378.
Parma Z, Vosta J, Horejs J, Pacyna JM, Thomas D. 1995. Atmospheric emission inventory guide-lines for persistent organic pollutants (POPs). Report for External Affairs Canada. AXYS Ltd, Sidney, Canada/Prague CR.
Parmanne R, Hallikainen A, Isosaari P, Kiviranta H, Koistinen J, et al. 2006. The dependence of organohalogen compound concentrations on herring age and size in the Bothnian Sea, northern Baltic. Marine Pollution Bulletin 52: 149-161.
Peltonen H, Kiljunen M, Kiviranta H, Vuorinen PJ, Verta M, Karjalainen J. 2007. Predicting effects of exploitation rate on weight-at-age, population dynamics, and bioaccumulation of PCDD/Fs and PCBs in herring (Clupea harengus L.) in the Northern Baltic Sea. Environmental Science & Tech-nology 41: 1849-1855.
Persson M. 2010. Changes in condition of herring (Clupea harengus) in Swedish coastal waters. Un-published Bachelor thesis. Södertörns Högskola, 30 pp.
Persson Y, Lundstedt S, Öberg L, Tysklind M. 2007. Levels of chlorinated compounds (CPs, PCPPs, PCDEs, PCDFs and PCDDs) in soils at contaminated sawmill sites in Sweden. Chemosphere 66: 234-242.
Perttilä M, Jonsson P, Larsen B, Niemistö L, Winterhalter B, Axelsson V. 2003. The 1993 HELCOM/ICES Baltic Sea Sediment Baseline Study, In Contaminants in the Baltic Sea Sediments: results of the 1993 HELCOM/ICES Baltic Sea Sediment Baseline Study, pp. 9–20.
Quaß U, Fermann M, Bröker G. 2004. The European dioxin air emission inventory project – final results. Chemosphere 54: 1319-1327.
Rappe C, Andersson R, Lundström K, Wiberg K. 1990a. Levels of polychlorinated dioxins and dibenzofurans in commercial detergents and related products. Chemosphere 21: 43-50.
Rappe C, Bergqvist PA, Kjeller LO. 1989. Levels, trends, and patterns of PCDDs and PCDFs in Scandinavian environmental samples. Chemosphere 18: 651-658.
Rappe C, Glas B, Wiberg K. 1990b. Solved and remaining PCDD and PCDF problems in the pulp industry. Organohalogen Compounds 3: 287-290.

SWEDISH ENVIRONMENTAL PROTECTION AGENCY REPORT 6566 Managing the dioxin problem in the Baltic region with focus on sources to air and fish
129
Rappolder M, Schröter-Kermani C, Schädel S, Waller U, Körner W. 2007. Temporal trends and spatial distribution of PCDD, PCDF, and PCB in pine and spruce shoots. Chemosphere 67: 1887-1896.
Robinson N. 1966. Solar Radiation. Elsevier, Amsterdam.
Rudstam LG. 1988. Exploring the dynamics of herring consumption in the Baltic: applications of an energetic model of fish growth. Kieler Meeresforschung Sonderheft 6:312-322.
Sanchez-Garcia L, Cato I, Gustafsson O. 2010. Evaluation of the influence of black carbon on the distribution of PAHs in sediments from along the entire Swedish continental shelf. Marine Chemistry 119: 44-51.
Santl H, Gruber L, Stohrer E. 1994a. Investigation on the input, formation and fate of polychlorin-ated dibenzodioxins (PCDDs) and dibenzofurans (PCDFs) in the pulp and paper industry. Chemo-sphere 29: 1987-1994.
Santl H, Gruber L, Stohrer E. 1994b. Some new sources of polychlorinated dibenzodioxins (PCDDs) and dibenzofurans (PCDFs) in waste papers and recycled pulps. Chemosphere 29: 1995-2003.
Schenker U, Macleod M, Scheringer M, Hungerbuhler K. 2005. Improving data quality for envi-ronmental fate models: A least-squares adjustment procedure for harmonizing physicochemical prop-erties of organic compounds. Environmental Science & Technology 39: 8434-8441.
Seinfeld J. 1986. Atmospheric Chemistry and Physics of Air Pollution. Wiley and Sons, New York.
Sellström U, Egebäck AL, McLachlan MS. 2009. Identifying source regions for the atmospheric input of PCDD/Fs to the Baltic Sea. Atmospheric Environment 43: 1730-1736.
Shatalov V, Gusev A, Dutchak S, Holoubek I, Mantseva E, et al. 2005. Modelling of POP contam-ination in European region: evaluation of the model performance, EMEP/MSC-E Technical Report 7/2005.
Shatalov V, Johansson JH, Wiberg K, Cousins IT. 2012. Tracing the origin of dioxins in Baltic air using an atmospheric modeling approach. Atmospheric Pollution Research 3: 408-416.
Shatalov V, Malanichev A, Vulykh N, Berg T, Manø S. 2001. Assessment of POP transport and accumulation in the environment. EMEP Report 4/2001.
Sobek A, Wiberg K, Sundqvist K, Cornelissen G, Jonsson P. 2012. Dioxiner i Bottenhavet och Bottenviken – pågående utsläpp eller historiska synder. Länsstyrelsen Gävleborg, Rapport 2012:7.
Sobek A, Arp HPH, Wiberg K, Hedman J, Cornelissen G. 2013. Aerosol-water partitioning of PCDD/Fs and PCBs in the Baltic Sea region. Environmental Science & Technology 47(2):781-789.
Solomon CT, Carpenter SR, Rusak JA, Vander Zanden MJ. 2008. Long-term variation in isotopic baselines and implications for estimating consumer trophic niches. Canadian Journal of Fisheries and Aquatic Sciences 65: 2191-2200.
Stapleton HM, Skubinna J, Baker JE. 2002. Seasonal dynamics of PCB and toxaphene bioaccumu-lation within a Lake Michigan food web. Journal of Great Lakes Research 28: 52-64.

SWEDISH ENVIRONMENTAL PROTECTION AGENCY REPORT 6566 Managing the dioxin problem in the Baltic region with focus on sources to air and fish
130
Strandberg B, Bandh C, Van Bavel B, Bergqvist PA, Broman D, et al. 1998. Concentrations, bio-magnification and spatial variation of organochlorine compounds in a pelagic food web in the northern part of the Baltic Sea. Science of the Total Environment 217: 143-154.
Sundqvist K. 2009. Sources of dioxins and other POPs to the marine environment. Identification and apportionment using pattern analysis and receptor modeling. PhD Thesis, Department of Chemistry, Umeå University.
Sundqvist K, Tysklind M, Cato I, Bignert A, Wiberg K. 2009a. Levels and homologue profiles of PCDD/Fs in sediments along the Swedish coast of the Baltic Sea. Environmental Science and Pollu-tion Research 16: 396-409.
Sundqvist KL, Tysklind M, Geladi P, Cato I, Wiberg K. 2009b. Congener fingerprints of tetra- through octa-chlorinated dibenzo-p-dioxins and dibenzofurans in Baltic surface sediments and their relations to potential sources. Chemosphere 77: 612-620.
Sundqvist KL, Tysklind M, Geladi P, Hopke PK, Wiberg K. 2010. PCDD/F Source Apportion-ment in the Baltic Sea Using Positive Matrix Factorization. Environmental Science & Technology 44: 1690-1697.
Umlauf G, Christoph EH, Eisenreich SJ, Mariani G, Paradiz B, Vives I. 2010. Seasonality of PCDD/Fs in the ambient air of Malopolska Region, southern Poland. Environmental Science and Pol-lution Research 17: 462-469.
UNEP. 1999. Dioxin and furan inventories. National and regional emissions of PCDD/PCDF. UNEP Chemicals [http://www.chem.unep.ch/pops/pcdd_activities/inventories/difurpt.pdf].
Van Den Berg M, Birnbaum LS, Denison M, De Vito M, Farland W, et al. 2006. The 2005 World Health Organization re-evaluation of human and mammalian toxic equivalency factors for dioxins and dioxin-like compounds. Toxicological Sciences 93: 223-241.
Wania F, Persson J, Di Guardo A, McLachlan M. 2000. The POPCYCLING-Baltic Model. A non-steady state multicompartment mass balance model for the fate of persistent organic pollutants in the Baltic Sea environment. NILU (Norwegian Institute for Air Research), Report OR 10/2000.
Venier M, Ferrario J, Hites RA. 2009. Polychlorinated dibenzo-p-dioxins and dibenzofurans in the atmosphere around the Great Lakes. Environmental Science & Technology 43: 1036-1041.
Verta M, Salo S, Korhonen M, Assmuth T, Kiviranta H, et al. 2007. Dioxin concentrations in sed-iments of the Baltic Sea - a survey of existing data. Chemosphere 67: 1762-1775.
Wiberg K, McLachlan MS, Jonsson P, Johansson N, Josefsson S, et al. 2009. Sources, transport, reservoirs and fate of dioxins, PCBs and HCB in the Baltic Sea environment. Swedish EPA, Report 5912
Wiberg K, Oehme M, Haglund P, Karlsson H, Olsson M, Rappe C. 1998. Enantioselective analy-sis of organochlorine pesticides in herring and seal from the Swedish marine environment. Marine Pollution Bulletin 36: 345-353.
Vikelsøe J, Andersen HV, Bossi R, Johansen E, Chrillesen M-A. 2005. Dioxin in the atmosphere of Denmark. NERI Technical Report No. 565, National Environmental Research Institute, Denmark.

SWEDISH ENVIRONMENTAL PROTECTION AGENCY REPORT 6566 Managing the dioxin problem in the Baltic region with focus on sources to air and fish
131
Wintermeyer D, Rotard W. 1994. Emission and deposition of dioxins in West-Germany – an attempt to strike a balance. Staub Reinhaltung Der Luft 54: 81-86.
Vuorinen P, Parmanne R, Kiviranta H, Isosaari P, Hallikainen A, Vartiainen T. 2004. Differ-ences in PCDD/F concentrations and patterns in herring (Clupea harengus) from southern and north-ern Baltic Sea. Organohalogen Compounds 66: 1882-1887.
Zhang BN, Meng F, Shi CN, Yang FQ, Wen DY, et al. 2009. Modeling the atmospheric transport and deposition of polychlorinated dibenzo-p-dioxins and dibenzofurans in North America. Atmospher-ic Environment 43: 2204-2212.

the authors assume sole responsibility for the con-tents of this report, which therefore cannot be cited as representing the views
of the swedish ePa.
Swedish epA se-106 48 stockholm. visiting address: stockholm - valhallavägen 195, Östersund - forskarens väg 5 hus ub, tel: +46 10 698 10 00, fax: +46 10 698 10 99, e-mail: [email protected] internet: www.swedishepa.se orders ordertel: +46 8 505 933 40, orderfax: +46 8 505 933 99, e-mail: [email protected] address: arkitektkopia ab, box 110 93, se-161 11 bromma. internet: www.swedishepa.se/publications
Managing the dioxin problem in the Baltic region with focus on sources to air and fishFinal report from the research project BalticPOPs
Baltic herring and other oil-rich fish contain levels
of dioxins that exceed the limit set by the EU for sale
of fish for consumption. The levels vary along the Baltic
Sea coast. What are the causes of high levels of dioxins
in oil-rich fish in the Baltic Sea? What are the emission
sources of dioxins and other organic environmental toxins
that reach the Baltic Sea? These two questions have been
examined by the BalticPOPs research project, financed by
the Swedish Environmental Protection Agency.
report 6566
naturvårdsverKet
isbn 978-91-620-6566-9
issn 0282-7298
KunsKaP driver milJÖarbetet framåt