Managing the Company Information Systems using Project...
47
Managing the Company Information Systems using Project Management Techniques A Project Report Presented to The Faculty of the Department of General Engineering San José State University In Partial Fulfillment of the Requirements for the Degree Master of Science in Engineering By Rajani Malkapur Venu Madhav Nanenuganti Keerthi Jyothirmayi Tatavarthi May 2011
Transcript of Managing the Company Information Systems using Project...
Managing the Company Information Systems using Project Management
Techniques
A Project Report
Presented to
The Faculty of the Department of General Engineering
San José State University
In Partial Fulfillment
of the Requirements for the Degree
Master of Science in Engineering
By
Rajani Malkapur
Venu Madhav Nanenuganti
Keerthi Jyothirmayi Tatavarthi
May 2011

© 2011
Malkapur Rajani Reddy
Nanenuganti Venu Madhav
Tatavarthi Keerthi Jyothirmayi
ALL RIGHTS RESERVED

SAN JOSÉ STATE UNIVERSITY
The Undersigned Project Committee Approves the Project Titled
Managing the development of Company Information Systems using Project Management
techniques
By
Malkapur Rajani Reddy
Nanenuganti Venu Madhav
Tatavarthi Keerthi Jyothirmayi
APPROVED FOR THE DEPARTMENT OF MASTER OF SCIENCE IN ENGINEERING
_____________________________________________________________________________
Dr. Leonard Wesley, MSE Director General Engineering, Date
Associate Prof. Computer Engineering
Dr. Maryam Mobed Miremadi, Department of General Engineering, Date
Mr. Jay Kalra, Vice President of Operations, Catalyst Business Partners Date

ABSTRACT
Managing the development of Company Information Systems using Project Management
techniques
By
Malkapur Rajani Reddy
Nanenuganti Venu Madhav
Tatavarthi Keerthi Jyothirmayi
Company Information Systems is a web-based application that will help the employees
of Catalyst Business Partners to enter their time, travel and expense requests online from any
Catalyst office's located worldwide. This web application will minimize the number of steps
Catalyst employees have to follow in order to submit their request forms to their respective
managers. The project management model that is being followed to execute this project is the
ADDIE (Analysis, Design, Develop, Implement and Evaluate) model which is further illustrated
in the Project Management Model section.

ACKNOWLEDGEMENT
We are extremely grateful to Mr. Jay Kalra, Industrial Advisor, for giving us the
opportunity to work as a part of a real time project at Catalyst Business Partners. We are really
thankful for his unwavering support and guidance throughout the semester. We express our deep
gratitude to Dr. Maryam Mobed Miremadi for her continuous participation and enormous help
that made us understand our project goal better.
We would like to convey our great respect and appreciation to Dr. Leonard Wesley for his
tremendous contribution in coordinating the course throughout the semester.

CONTENTS
1. INTRODUCTION………………………………………………………………………1
1.1 Introduction of Catalyst Business Partners…………………………………………..1
1.2 Problem Statement…………………………………………………………………...1
1.3 Problem Solution……………………………………………………………………..3
1.4 Project Scope…………………………………………………………………………4
1.5 Project Hypothesis……………………………………………………………………5
1.6 Project Goals………………………………………………………………………….5
1.7 Project Justification and Testing Methods …………………………………………..6
1.8 Market Research……………………………………………………………………...6
1.9 Initial Designs of User Interface……………………………………………………..7
2. WORKFLOW DIAGRAMS……………………………………………………………….8
2.1 Timesheet Workflow………………………………………………………………….8
2.2 Expenses Workflow…………………………………………………………………..9
3. PROJECT MANAGEMENT MODEL………………………………………………….10
3.1 Introduction …………………………………………………………………………10
3.2 Analysis and Techniques……………………………………………………………..10
3.3 Conclusion……………………………………………………………………………14
4. ECONOMIC JUSTIFICATION…………………………………………………………...14
4.1 Components Required………………………………………………………………..14
4.2 Operating Cost………………………………………………………………………..15
4.3 Revenue Generation…………………………………………………………………..16
4.4 Return of Investment…………………………………………………………………18

4.5 Norden-Rayleigh Analysis……………………………………………………………20
5. PROJECT JUSTIFICATION……………………………………………………………..24
6. INTELLECTUAL PROPERTY…………………………………………………………..27
7. SWOT ANALYSIS……………………………………………………………………….30
8. PROJECT SCHEDULE…………………………………………………………………..31
9. SCREENSHOTS OF USER INTERFACE……………………………………………….32
10. CONCLUSION………………………………………………………………………….36
REFERENCES………………………………………………………………………………37
LIST OF FIGURES
Figure 1: Timesheet Excel Document ………………………………………………………….2
Figure 2: Travel Approval Excel Document …………………………………………………...2
Figure 3: Expense Sheet Excel Document ……………………………………………………..2
Figure 4: Approval Process- Before Automation ………………………………………………3
Figure 5: Graphical User Interface of Company Information System ………………………...4
Figure 6: Approval Process- After Automation ………………………………………………..4
Figure 7: Timesheet User Interface …………………………………………………………….7
Figure 8: Travel User Interface …………………………………………………………………7
Figure 9: Expenses User Interface ……………………………………………………………...7
Figure 10: Timesheet Workflow ………………………………………………………………..8
Figure 11: Expenses Workflow …………………………………………………………………9
Figure 12: Addie Model ………………………………………………………………………..10
Figure 13: Initial Break-Down Cost ……………………………………………………………13
Figure 14: Total Cost Break-Down …………………………………………………………….15
Figure 15: Break Even Graph …………………………………………………………………...17
Figure 16: Cumulative Funding Over Time……………………………………………………………...21
Figure 17: Funding Profile over Time …………………………………………………………………...23
Figure 18: Project Schedule …………………………………………………………………….27
Figure 19: Enter Timesheet ……………………………………………………………………...31
Figure 20: Track Timesheet ……………………………………………………………………..31
Figure 21: Submit Timesheet ……………………………………………………………………32
Figure 22: Enter Travel Request ………………………………………………………………...32
Figure 23: Track Travel Request ………………………………………………………………..33
Figure 24: Enter Expenses……………………………………………………………………….33

LIST OF TABLES
Table 1: Applications available in the market…………………………………………………….6
Table 2: Comparison with other applications …………………………………………………..12
Table 3: Hardware Components ………………………………………………………………...14
Table 4: Software Components ………………………………………………………………….14
Table 5: Equipment Cost ………………………………………………………………………..16
Table 6: Labor Cost ……………………………………………………………………………..17
Table 7: Maintenance Cost ……………………………………………………………………...18
Table 8: Total Cost ………………………………………………………………………………23
Table 9: Revenue Generation ……………………………………………………………………24
Table 10: Cost Analysis …………………………………………………………………………26
Table 11: Revenue Analysis …………………………………………………………………….27
Table 12: Norden-Rayleigh Analysis ……………………………………………………………29
Table 13: SWOT Analysis……………………………………………………………………….30

1. INTRODUCTION
1.1 Introduction of Catalyst Business Partners
Catalyst Business Partners, founded in 2002 is an IT consulting company
headquartered in San Jose, United States. Catalyst offers expertise in implementing, upgrading,
maintaining and training of Oracle products. Catalyst is partnered with Oracle and it is a global
company consisting of more than 200 employees. It has offices located in Cameroon, Dubai,
India, Ivory Coast, Mali, Morocco, Nigeria, Senegal and San Jose. Catalyst comprises of five
departments namely: Sales, Marketing, Delivery, Finance, and Operations. The sales department
is responsible for maintaining public relations and helping Catalyst win new contracts from
different regions. The Marketing department is involved in maintaining Catalyst image
consistently. Delivery department is accountable for customizing the oracle products and
delivering the customized products to the clients directly. Finance is responsible for managing
Catalyst funds and the Operations department is mainly involved in providing support for all the
other departments of Catalyst.
1.2 Problem Statement
The delivery and sales teams of Catalyst are using an Excel document to record
their time, to enter their travel requests, to enter their expenses and to capture the client contracts.
The employees need to get the signature of their managers on these Excel sheets. This is a very
time consuming process since most of time, the employees have to fax the Excel sheets to their
offshore manager's and wait for the approved forms to return.
Shown below are the three Excel sheets that Catalyst employees are presently using to capture
time, travel and expense requests:
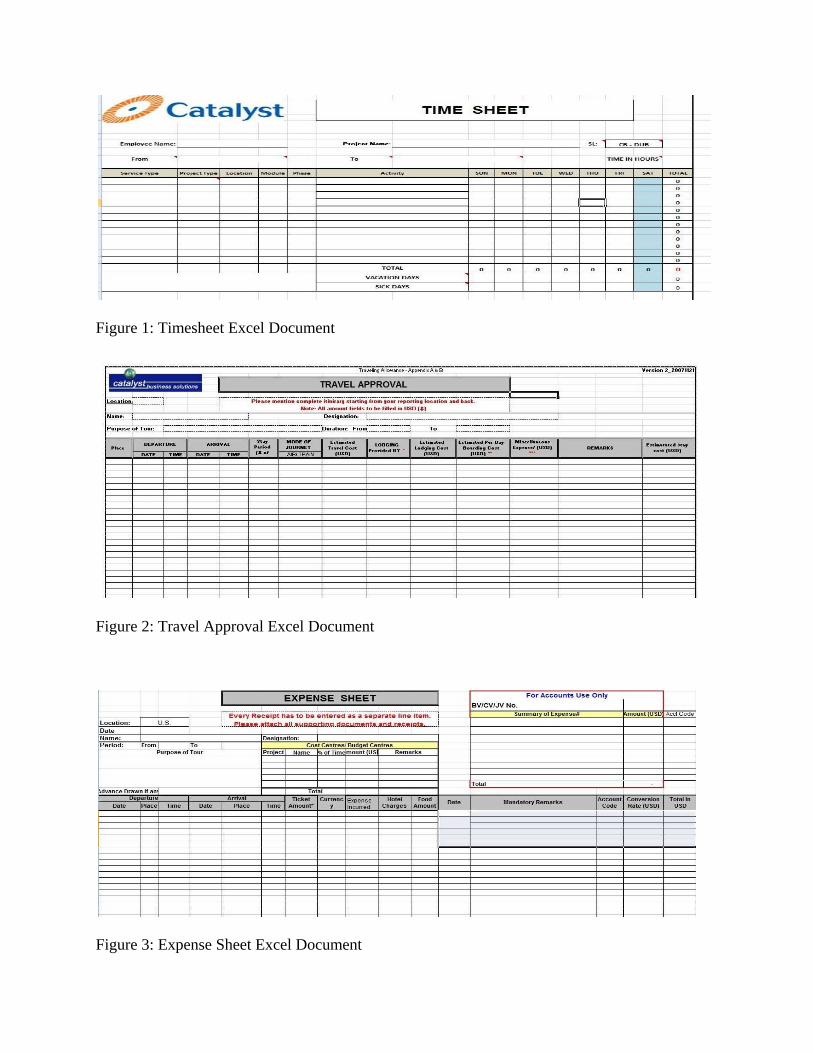
Figure 1: Timesheet Excel Document
Figure 2: Travel Approval Excel Document
Figure 3: Expense Sheet Excel Document
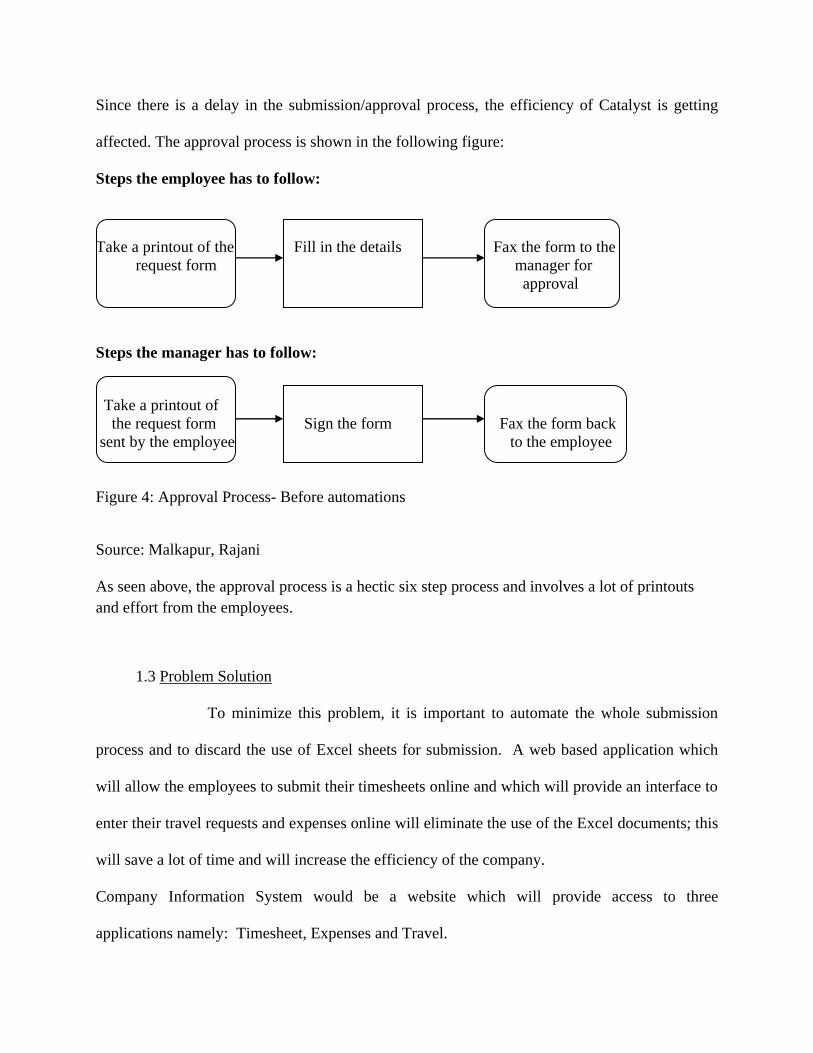
Since there is a delay in the submission/approval process, the efficiency of Catalyst is getting
affected. The approval process is shown in the following figure:
Steps the employee has to follow:
Take a printout of the Fill in the details Fax the form to the
request form manager for
approval
Steps the manager has to follow:
Take a printout of
the request form Sign the form Fax the form back
sent by the employee to the employee
Figure 4: Approval Process- Before automations
Source: Malkapur, Rajani
As seen above, the approval process is a hectic six step process and involves a lot of printouts
and effort from the employees.
1.3 Problem Solution
To minimize this problem, it is important to automate the whole submission
process and to discard the use of Excel sheets for submission. A web based application which
will allow the employees to submit their timesheets online and which will provide an interface to
enter their travel requests and expenses online will eliminate the use of the Excel documents; this
will save a lot of time and will increase the efficiency of the company.
Company Information System would be a website which will provide access to three
applications namely: Timesheet, Expenses and Travel.
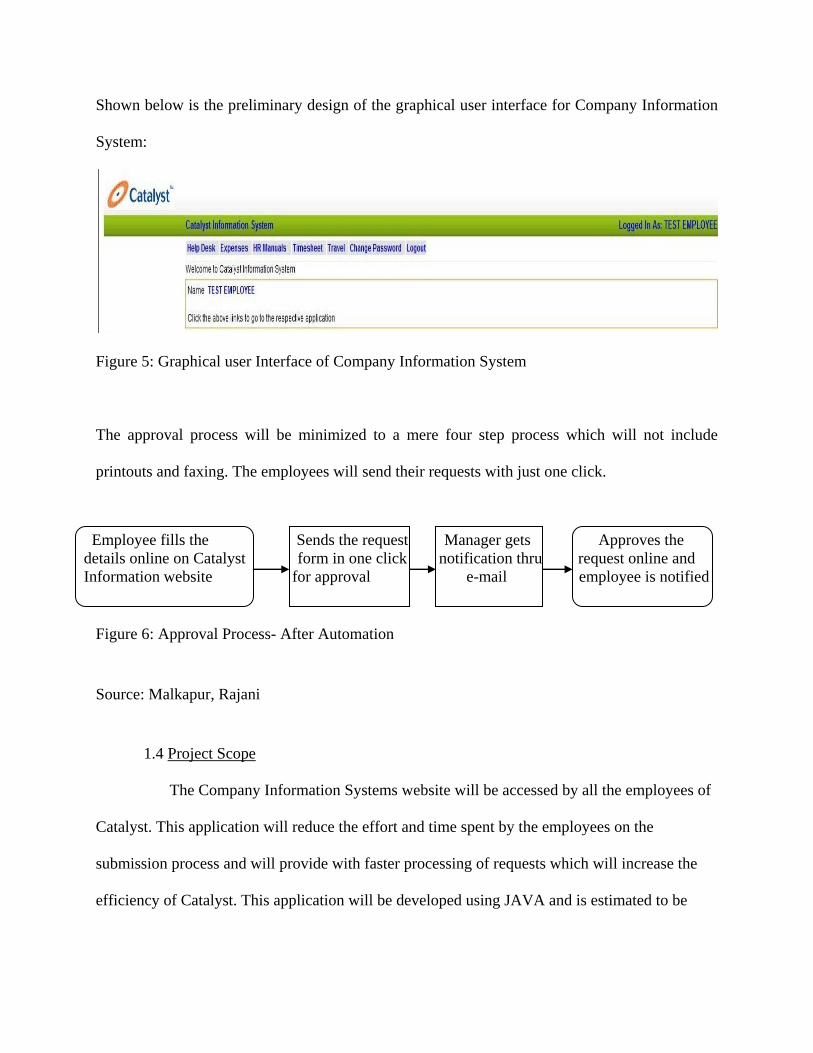
Shown below is the preliminary design of the graphical user interface for Company Information
System:
Figure 5: Graphical user Interface of Company Information System
The approval process will be minimized to a mere four step process which will not include
printouts and faxing. The employees will send their requests with just one click.
Employee fills the Sends the request Manager gets Approves the
details online on Catalyst form in one click notification thru request online and
Information website for approval e-mail employee is notified
Figure 6: Approval Process- After Automation
Source: Malkapur, Rajani
1.4 Project Scope
The Company Information Systems website will be accessed by all the employees of
Catalyst. This application will reduce the effort and time spent by the employees on the
submission process and will provide with faster processing of requests which will increase the
efficiency of Catalyst. This application will be developed using JAVA and is estimated to be

finished in six to eight months. The project management model that is being used is ADDIE
(Analysis, Design, Develop, Implement and Evaluate).
1.5 Project Hypothesis
To increase the efficiency of Catalyst Business Partners by 40%. This will be
done by managing the development of an application called Company Information System using
the Project Management Techniques.
1.6 Project Goals
Project goals are listed below:
To eliminate the use of Excel documents for the submission of requests
To increase efficiency of Catalyst which will in turn increase the revenue
To save the time spent by the employees
To reduce the use of paper by more than 70%
To make tracking of requests more easier
To calculate the business profitability
1.7 Project Justification and Testing Methods
The project justification will be shown by calculating the cost benefits, the time
saved by the employees and by showing the percentage increase in the efficiency of catalyst. All
of these goals will be achieved by providing an online interface to the employees for submitting
the time, travel and expenses, these requests will be approved online by their respective
managers. Testing Method: The application will be tested by entering simulated data into the fields and

by getting the expected result. This application named Company Information System will allow the
employees to enter their time, travel, and expenses details online.
1.8 Market Research
There are a few applications available in the market namely: Replicon,
Analyzer and clicktime software. These software's are entitled to do one function and do
not provide all the features that the Company Integrated Systems will provide. There is
no proper software in the market with all the functionalities in one place that is
specifically designed for consulting companies like Catalyst.
A list of products that have a few similarities:
Table 1: Applications available in the market
Replicon- Timesheet
Replicon-Expenses
Expense Analyzer
Clicktime
Comparison of Company Information Systems to other applications available in the market:
Table 2: Comparison with other applications
Application Feature Replicon Clicktime Expense Analyzer Company
information
system
Travel Approval
Expenses
Time sheet
1.9 Initial Designs of User Interface
Shown below are a few graphical interfaces of the website:
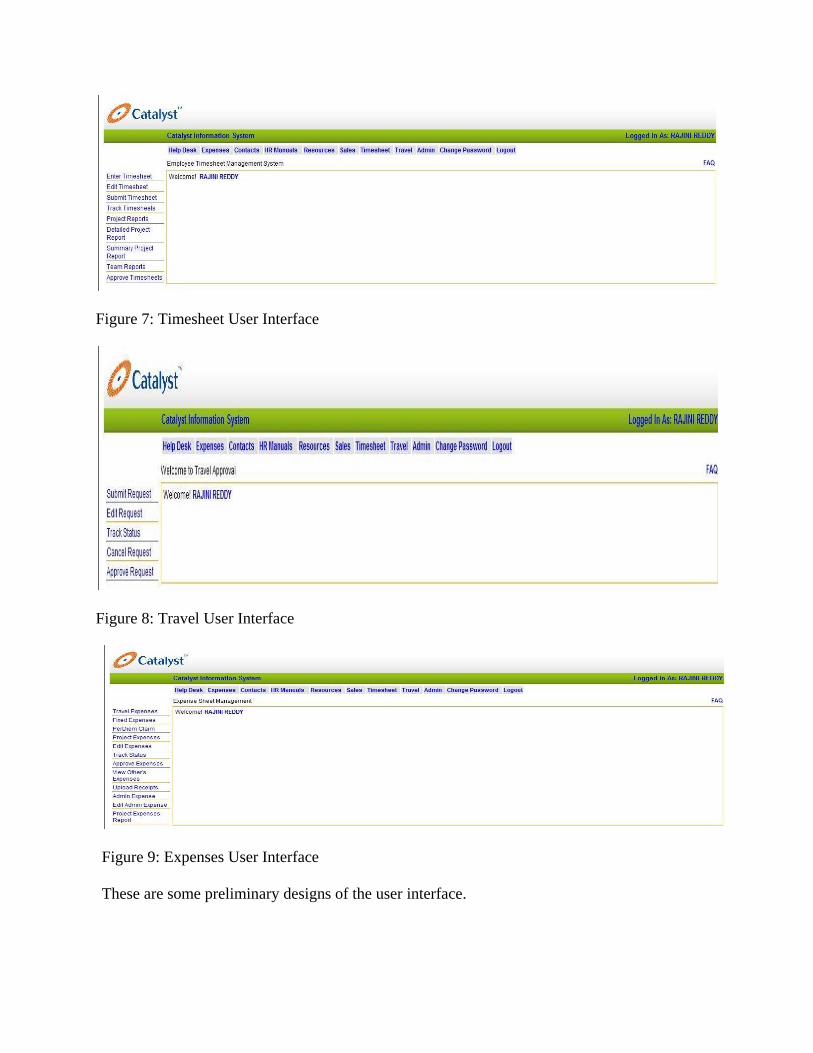
Figure 7: Timesheet User Interface
Figure 8: Travel User Interface
Figure 9: Expenses User Interface
These are some preliminary designs of the user interface.
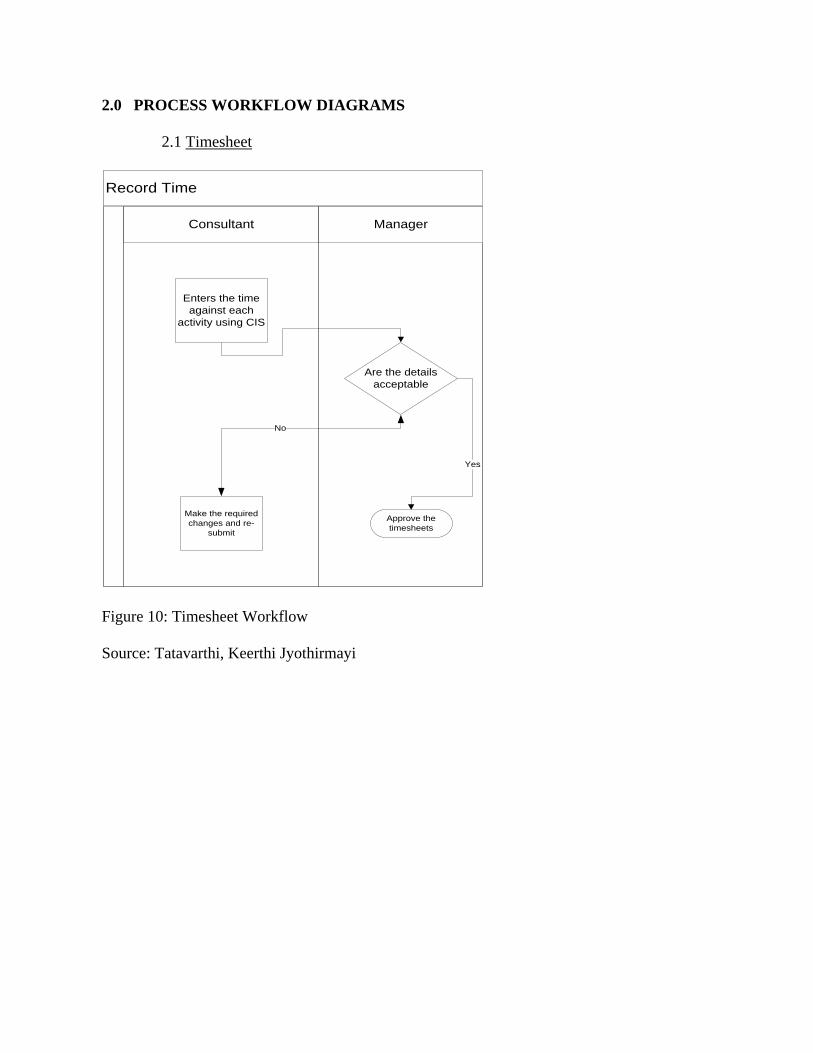
2.0 PROCESS WORKFLOW DIAGRAMS
2.1 Timesheet
Record Time
Consultant Manager
Enters the time
against each
activity using CIS
Are the details
acceptable
No
Make the required
changes and re-
submit
Approve the
timesheets
Yes
Figure 10: Timesheet Workflow
Source: Tatavarthi, Keerthi Jyothirmayi
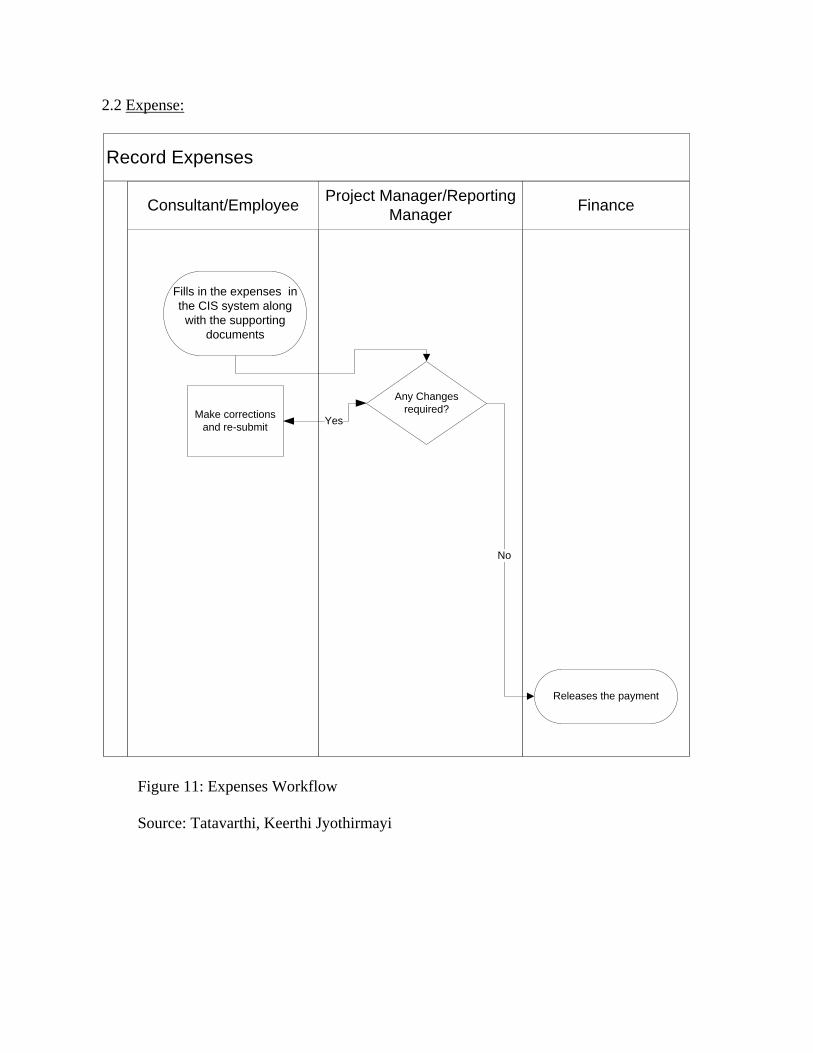
2.2 Expense:
Record Expenses
Project Manager/Reporting
ManagerFinanceConsultant/Employee
Fills in the expenses in
the CIS system along
with the supporting
documents
Any Changes
required?Make corrections
and re-submitYes
Releases the payment
No
Figure 11: Expenses Workflow
Source: Tatavarthi, Keerthi Jyothirmayi

3.0 PROJECT MANAGEMENT MODEL
3.1 Introduction:
The aim was to research and read as many articles related to the project, these articles will help
the project team build a strong foundation and will lead to improved results. The benefits of following a
project management model are:
(1) Command over the concepts which would drive the project forward
(2) Knowledge on how to deal with all the phases of Project Life-Cycle
(3) Knowledge on Project Management Techniques which will guide the team towards the goal
3.2 Analysis and Techniques
ADDIE MODEL:
ADDIE is an instructional design model generally used by designers and training
developers. ADDIE is abbreviation for Analysis, Design, Development, Implementation and
Evaluation. This ADDIE model represents guidelines which a flexible to build good performance
and training tools. ADDIE model is also used in Instructional Design Model (ISD). ADDIE is
commonly used in other instructional design models and this also uses an additional feature
called rapid prototyping. This model is time saving and also saves money by detecting problems
and fixing them soon.
Figure 12: ADDIE Model Source: edweb.sdsu.edu/courses/edtec700/ETP/addie.htm
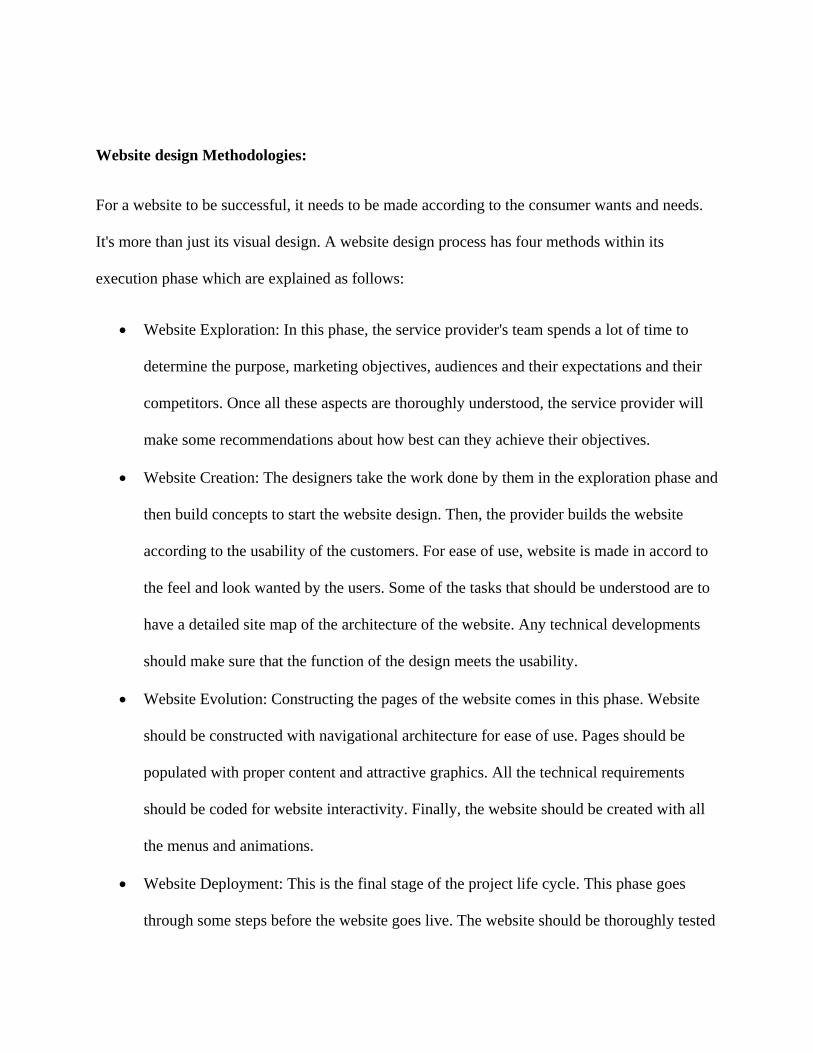
Website design Methodologies:
For a website to be successful, it needs to be made according to the consumer wants and needs.
It's more than just its visual design. A website design process has four methods within its
execution phase which are explained as follows:
Website Exploration: In this phase, the service provider's team spends a lot of time to
determine the purpose, marketing objectives, audiences and their expectations and their
competitors. Once all these aspects are thoroughly understood, the service provider will
make some recommendations about how best can they achieve their objectives.
Website Creation: The designers take the work done by them in the exploration phase and
then build concepts to start the website design. Then, the provider builds the website
according to the usability of the customers. For ease of use, website is made in accord to
the feel and look wanted by the users. Some of the tasks that should be understood are to
have a detailed site map of the architecture of the website. Any technical developments
should make sure that the function of the design meets the usability.
Website Evolution: Constructing the pages of the website comes in this phase. Website
should be constructed with navigational architecture for ease of use. Pages should be
populated with proper content and attractive graphics. All the technical requirements
should be coded for website interactivity. Finally, the website should be created with all
the menus and animations.
Website Deployment: This is the final stage of the project life cycle. This phase goes
through some steps before the website goes live. The website should be thoroughly tested

before releasing. A launch plan should be made, such as emails, newsletters etc for
awareness.
Project Life Cycle:
Project life cycle is another look for website designing. Once a web
development project proposal is agreed a sequence of steps take place which include
designing the interface, programming, text and sign off. For regular view about the
updates and progresses being done, virtual viewing tools will help us.
Design Phase:
This is build according to the project scope provided in the beginning of the proposal.
Here the project manager will brief the developers of the website to give the initial mock
up page of the website and then goes deeply into the pages where the actual accessing
part takes place. These inner key pages are developed according to the requirements of
the users which will be provided by the project manager. The detailed site map of the
website should be given by the project manager.
Programming Phase:
This is a crucial phase where the actual development of code takes place. The
construction of the list of pages of the website works out in this phase. The programming
should be done in such a way that the content to content incorporation occurs. In short,
there should be a link between content to content. After programming is done,
implementation takes place and checks whether the required elements of the site are
provided and the website databases and forms are stored.
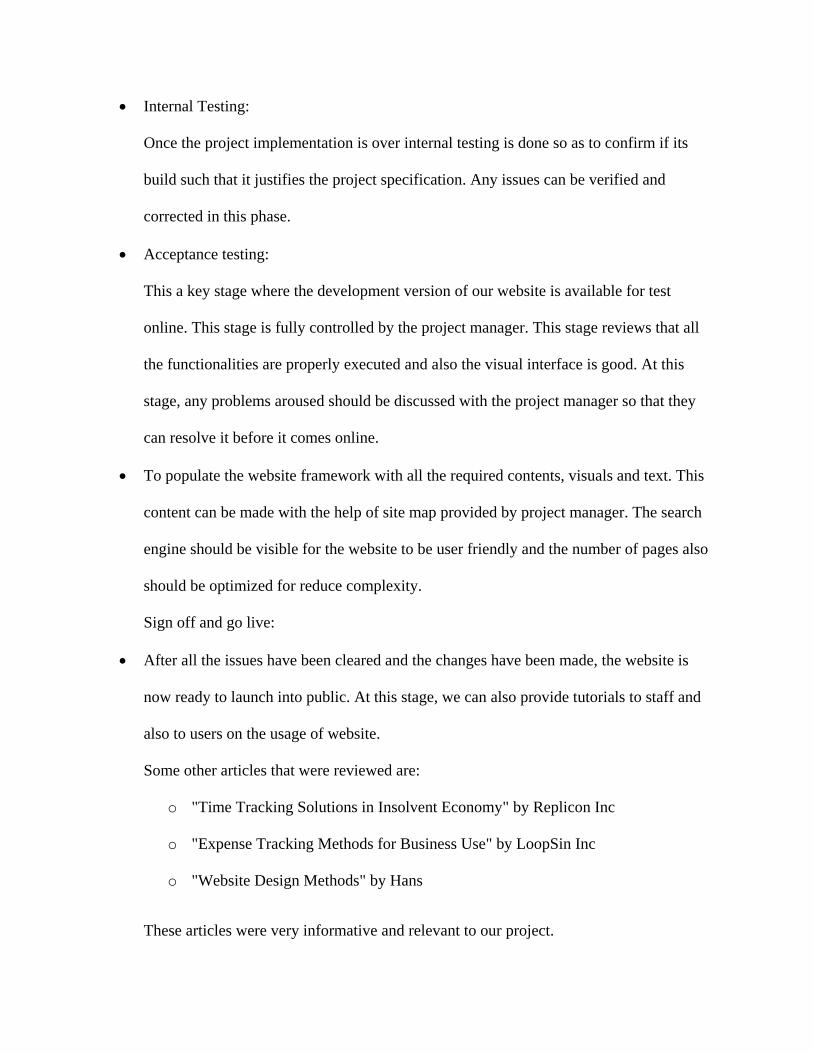
Internal Testing:
Once the project implementation is over internal testing is done so as to confirm if its
build such that it justifies the project specification. Any issues can be verified and
corrected in this phase.
Acceptance testing:
This a key stage where the development version of our website is available for test
online. This stage is fully controlled by the project manager. This stage reviews that all
the functionalities are properly executed and also the visual interface is good. At this
stage, any problems aroused should be discussed with the project manager so that they
can resolve it before it comes online.
To populate the website framework with all the required contents, visuals and text. This
content can be made with the help of site map provided by project manager. The search
engine should be visible for the website to be user friendly and the number of pages also
should be optimized for reduce complexity.
Sign off and go live:
After all the issues have been cleared and the changes have been made, the website is
now ready to launch into public. At this stage, we can also provide tutorials to staff and
also to users on the usage of website.
Some other articles that were reviewed are:
o "Time Tracking Solutions in Insolvent Economy" by Replicon Inc
o "Expense Tracking Methods for Business Use" by LoopSin Inc
o "Website Design Methods" by Hans
These articles were very informative and relevant to our project.
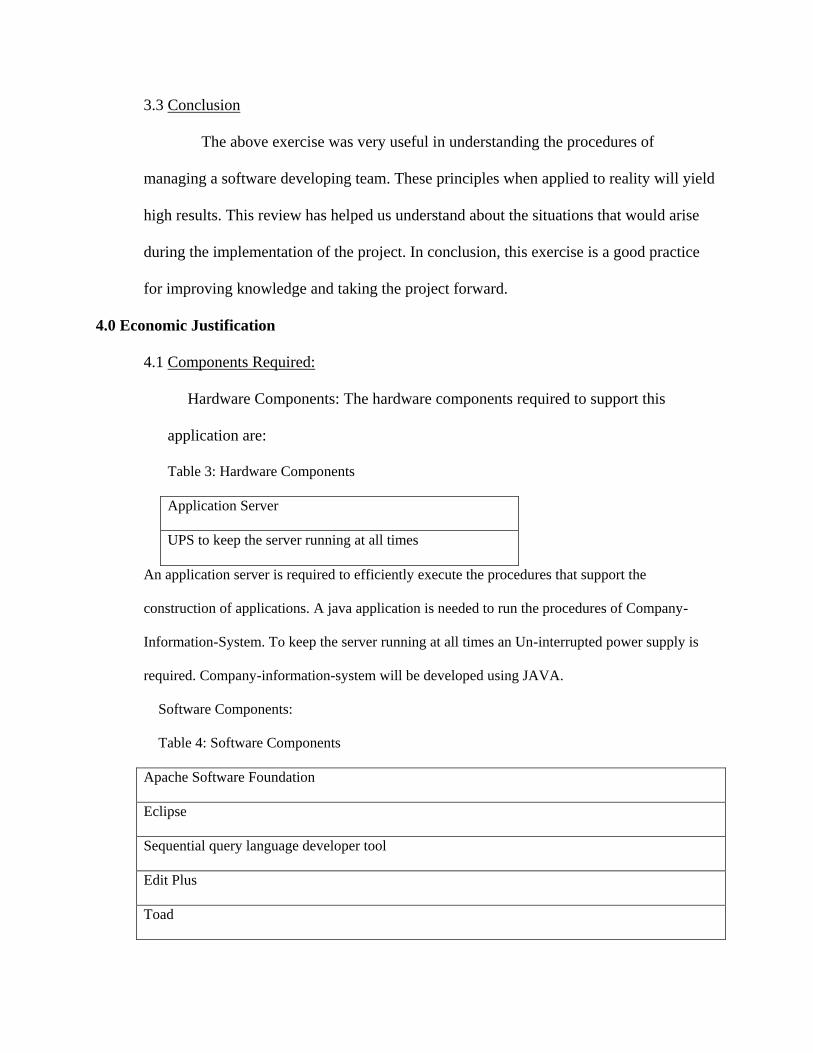
3.3 Conclusion
The above exercise was very useful in understanding the procedures of
managing a software developing team. These principles when applied to reality will yield
high results. This review has helped us understand about the situations that would arise
during the implementation of the project. In conclusion, this exercise is a good practice
for improving knowledge and taking the project forward.
4.0 Economic Justification
4.1 Components Required:
Hardware Components: The hardware components required to support this
application are:
Table 3: Hardware Components
Application Server
UPS to keep the server running at all times
An application server is required to efficiently execute the procedures that support the
construction of applications. A java application is needed to run the procedures of Company-
Information-System. To keep the server running at all times an Un-interrupted power supply is
required. Company-information-system will be developed using JAVA.
Software Components:
Table 4: Software Components
Apache Software Foundation
Eclipse
Sequential query language developer tool
Edit Plus
Toad

Apache Software foundation is an open source servlet container that supports java server pages.
Java server pages are the website interface pages coded in Java. Eclipse and Edit plus are java
tools that are used to generating the code, these tools provide an environment to see the code
results from time to time. Oracle is used to talk to the database, so the SQL developer and Toad
are the two tools that support the creation of tables in oracle.
4.2 Operating Cost:
Equipment Cost:
Table 5: Equipment Cost
COMPONENT QUANTITY PRICE
Dell Server 1 $3000
UPS 1 $1000
Dell server was a onetime investment which cost $3000 and the UPS was $1000 to support the server.
Figure 13: Initial break-down cost
Dell Server, $3,000 , 75%
UPS, $1,000 , 25%
Break-Down one time cost
Dell Server
UPS
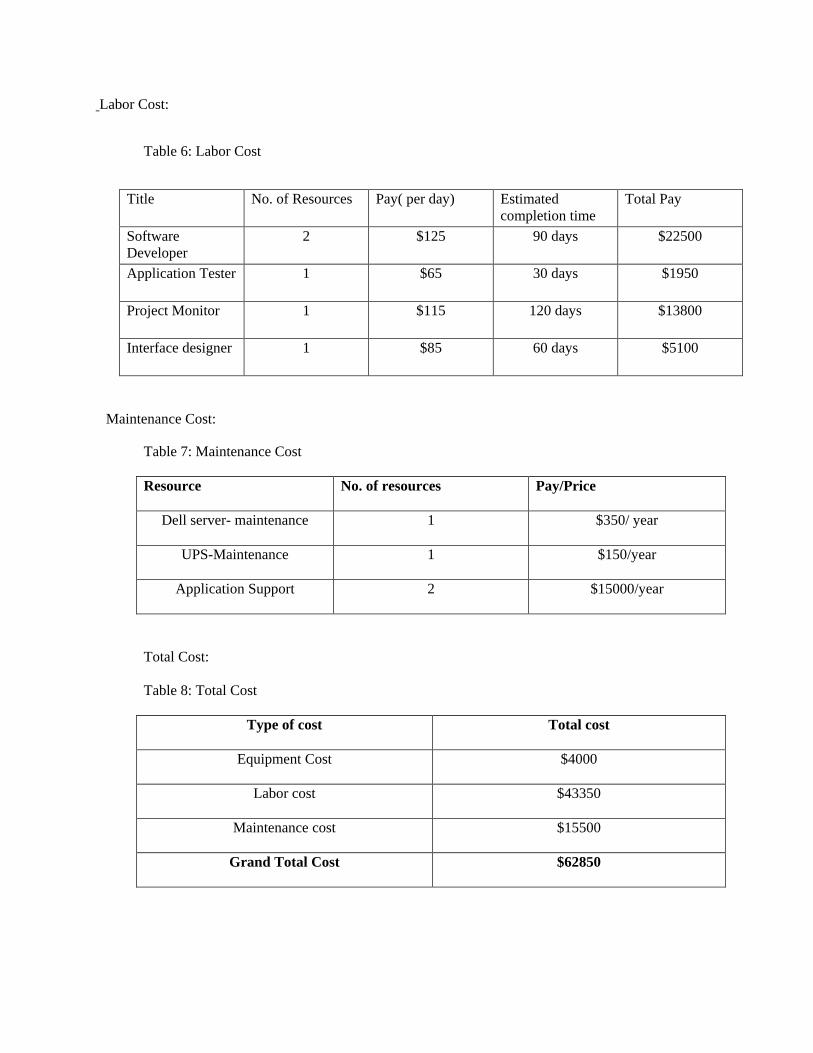
Labor Cost:
Table 6: Labor Cost
Title No. of Resources Pay( per day) Estimated
completion time
Total Pay
Software
Developer
2 $125 90 days
$22500
Application Tester 1 $65 30 days
$1950
Project Monitor 1 $115 120 days $13800
Interface designer 1 $85 60 days
$5100
Maintenance Cost:
Table 7: Maintenance Cost
Resource No. of resources Pay/Price
Dell server- maintenance 1 $350/ year
UPS-Maintenance 1 $150/year
Application Support 2 $15000/year
Total Cost:
Table 8: Total Cost
Type of cost Total cost
Equipment Cost $4000
Labor cost $43350
Maintenance cost $15500
Grand Total Cost $62850
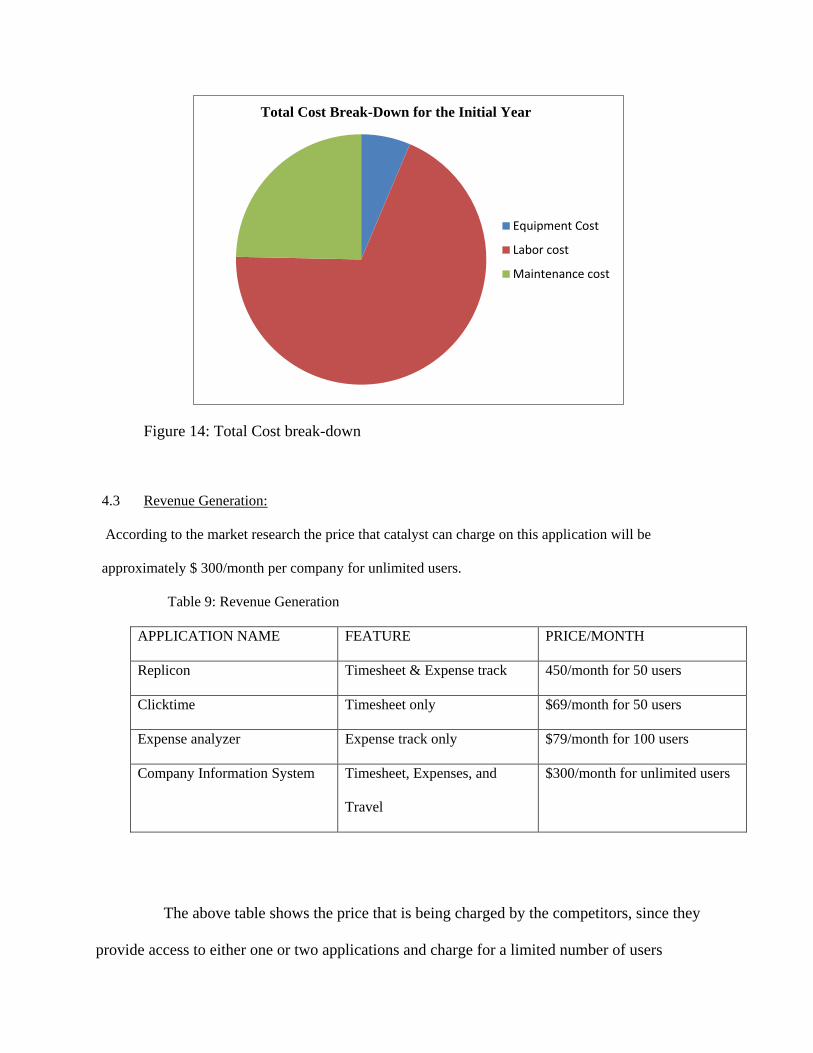
Figure 14: Total Cost break-down
4.3 Revenue Generation:
According to the market research the price that catalyst can charge on this application will be
approximately $ 300/month per company for unlimited users.
Table 9: Revenue Generation
APPLICATION NAME FEATURE PRICE/MONTH
Replicon Timesheet & Expense track 450/month for 50 users
Clicktime Timesheet only $69/month for 50 users
Expense analyzer Expense track only $79/month for 100 users
Company Information System Timesheet, Expenses, and
Travel
$300/month for unlimited users
The above table shows the price that is being charged by the competitors, since they
provide access to either one or two applications and charge for a limited number of users
Equipment Cost
Labor cost
Maintenance cost
Total Cost Break-Down for the Initial Year
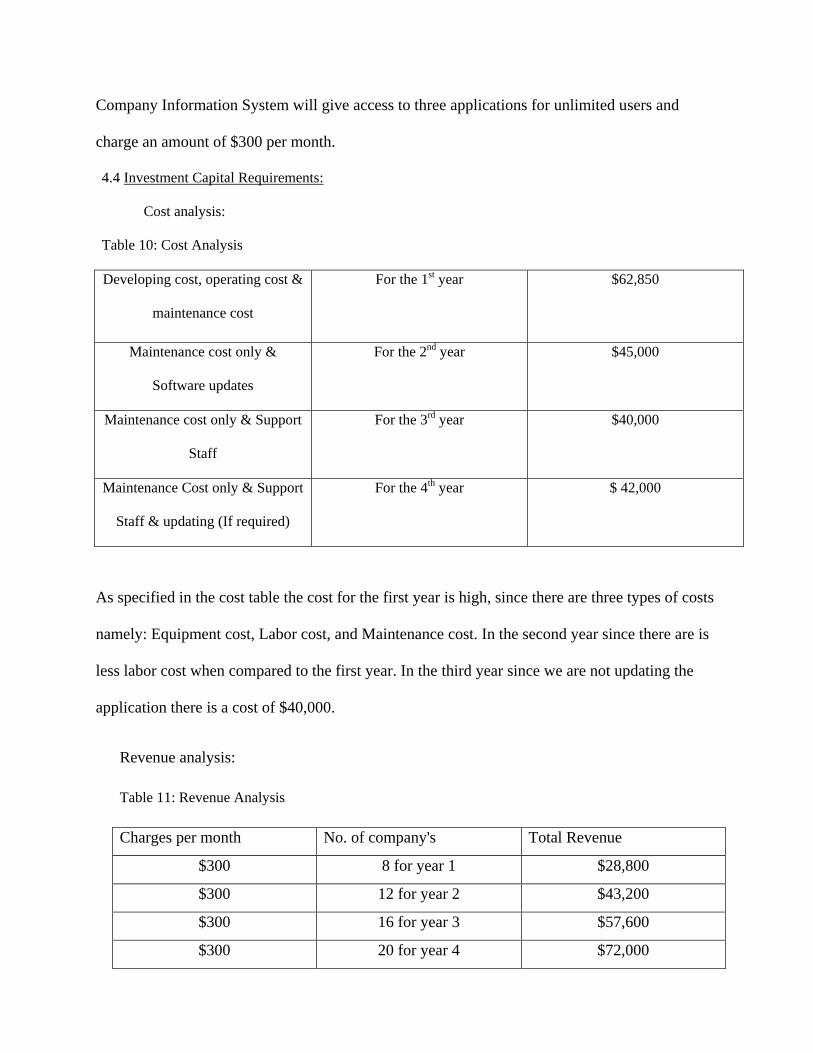
Company Information System will give access to three applications for unlimited users and
charge an amount of $300 per month.
4.4 Investment Capital Requirements:
Cost analysis:
Table 10: Cost Analysis
Developing cost, operating cost &
maintenance cost
For the 1st year $62,850
Maintenance cost only &
Software updates
For the 2nd year $45,000
Maintenance cost only & Support
Staff
For the 3rd year $40,000
Maintenance Cost only & Support
Staff & updating (If required)
For the 4th year $ 42,000
As specified in the cost table the cost for the first year is high, since there are three types of costs
namely: Equipment cost, Labor cost, and Maintenance cost. In the second year since there are is
less labor cost when compared to the first year. In the third year since we are not updating the
application there is a cost of $40,000.
Revenue analysis:
Table 11: Revenue Analysis
Charges per month No. of company's Total Revenue
$300 8 for year 1 $28,800
$300 12 for year 2 $43,200
$300 16 for year 3 $57,600
$300 20 for year 4 $72,000
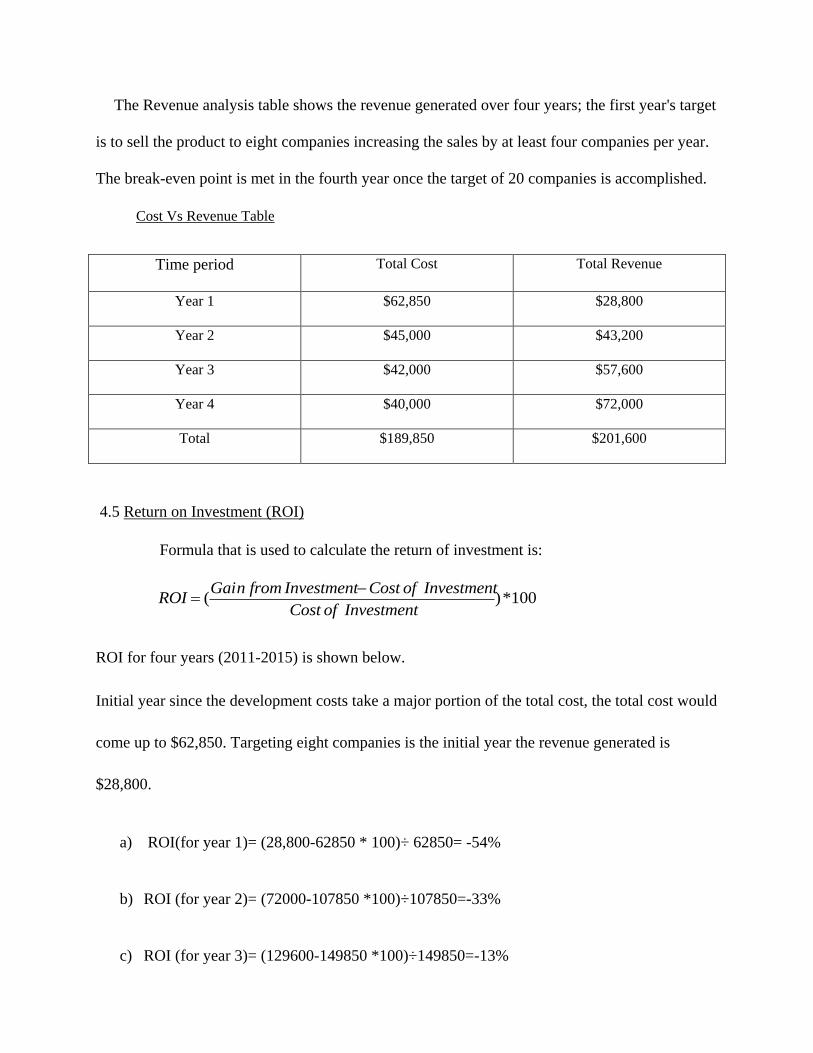
The Revenue analysis table shows the revenue generated over four years; the first year's target
is to sell the product to eight companies increasing the sales by at least four companies per year.
The break-even point is met in the fourth year once the target of 20 companies is accomplished.
Cost Vs Revenue Table
Time period Total Cost Total Revenue
Year 1 $62,850 $28,800
Year 2 $45,000 $43,200
Year 3 $42,000 $57,600
Year 4 $40,000 $72,000
Total $189,850 $201,600
4.5 Return on Investment (ROI)
Formula that is used to calculate the return of investment is:
100*)(InvestmentofCost
InvestmentofCostInvestmentfromGainROI
ROI for four years (2011-2015) is shown below.
Initial year since the development costs take a major portion of the total cost, the total cost would
come up to $62,850. Targeting eight companies is the initial year the revenue generated is
$28,800.
a) ROI(for year 1)= (28,800-62850 * 100)÷ 62850= -54%
b) ROI (for year 2)= (72000-107850 *100)÷107850=-33%
c) ROI (for year 3)= (129600-149850 *100)÷149850=-13%

d) ROI (for year 4)= (201600-189850 *100)÷189850=6%
Cumulative cost Vs revenue:
Time period Total Cost Total Revenue
Year 1 $62,850 $28,800
Year 2 $107850 $72000
Year 3 $149850 $129600
Year 4 $189850 $201600
Year 5 $229,850 $288,000
Break –Even Analysis:
Figure 15: Break-Even Graph
The Cost versus Revenue table shows the total cost and the total revenue generated for that
corresponding year. The break-even point is met in the fourth year, and Catalyst will generate
$0
$50,000
$100,000
$150,000
$200,000
$250,000
$300,000
$350,000
1 2 3 4 5
Cumulative cost
Cumulative revenue
Number of Years
Dollars, $
Break- Even Anaylsis
profit in the subsequent years, since the cost will decrease, as shown in the graph. The revenue
will increase depending upon the number of customers. Target is to sell the product to 20
companies by the end of the fourth year.
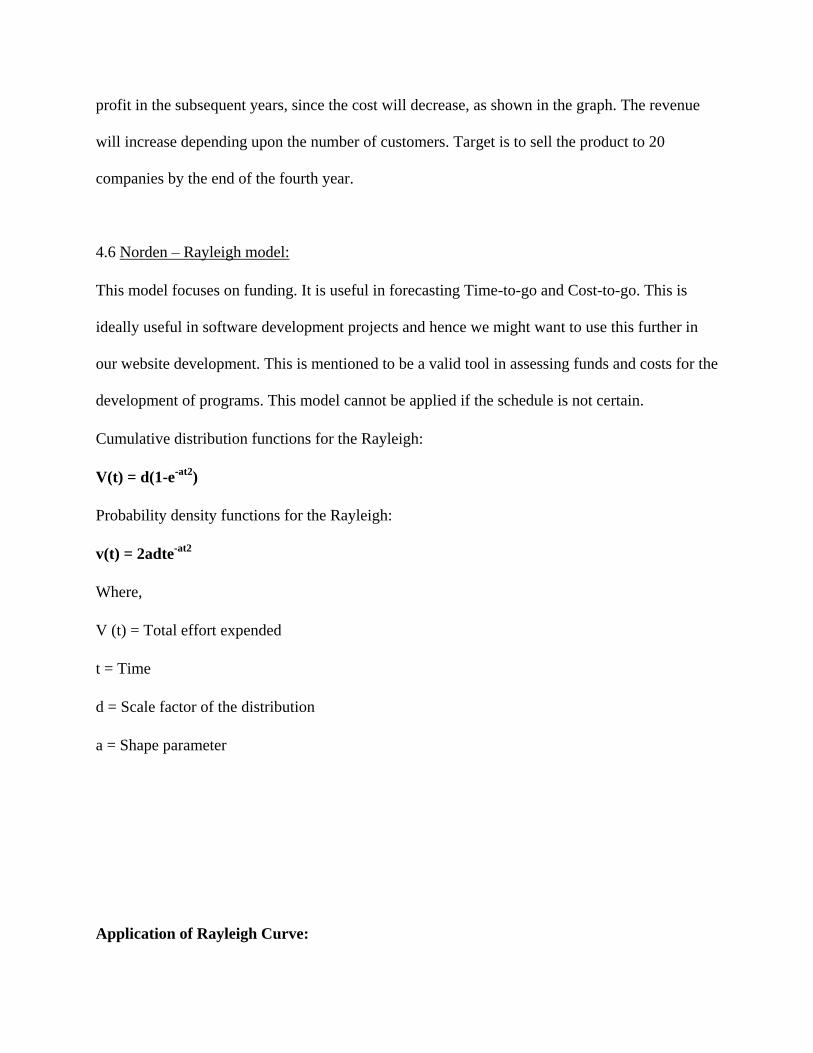
4.6 Norden – Rayleigh model:
This model focuses on funding. It is useful in forecasting Time-to-go and Cost-to-go. This is
ideally useful in software development projects and hence we might want to use this further in
our website development. This is mentioned to be a valid tool in assessing funds and costs for the
development of programs. This model cannot be applied if the schedule is not certain.
Cumulative distribution functions for the Rayleigh:
V(t) = d(1-e-at2
)
Probability density functions for the Rayleigh:
v(t) = 2adte-at2
Where,
V (t) = Total effort expended
t = Time
d = Scale factor of the distribution
a = Shape parameter
Application of Rayleigh Curve:
Rayleigh Curve is called a valid tool which is capable to assess funding and the cost of
development programs. This model offers a proper reason and comparison at a project's funding
phase. Scale (d) and shape factor (a) are the values which help in building a profile.
There are some situations where the Rayleigh curve cannot be applied. When the details of a
schedule are not certain this curve cannot be applied. When a program has different sub
programs with starts and stops. For example, if a company funds more than one project within
the same funding profile.
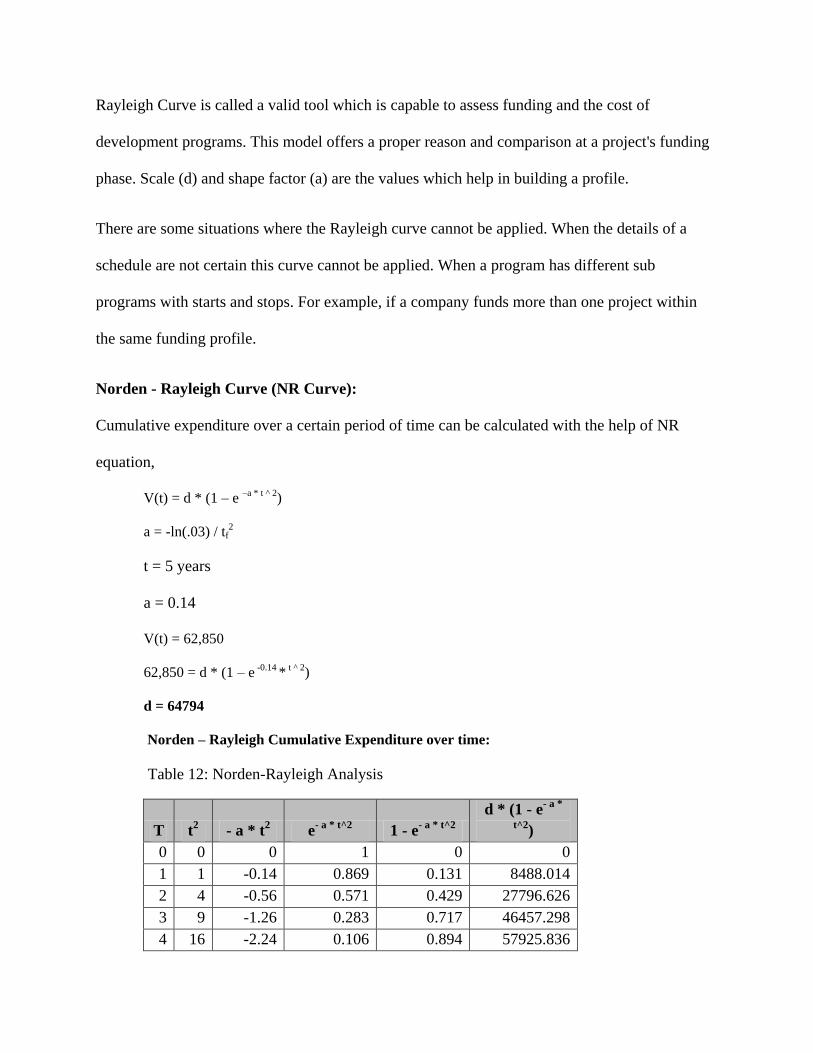
Norden - Rayleigh Curve (NR Curve):
Cumulative expenditure over a certain period of time can be calculated with the help of NR
equation,
V(t) = d * (1 – e –a * t ^ 2)
a = -ln(.03) / tf2
t = 5 years
a = 0.14
V(t) = 62,850
62,850 = d * (1 – e -0.14 * t ^ 2)
d = 64794
Norden – Rayleigh Cumulative Expenditure over time:
Table 12: Norden-Rayleigh Analysis
T t2 - a * t
2 e
- a * t^2 1 - e
- a * t^2
d * (1 - e- a *
t^2)
0 0 0 1 0 0
1 1 -0.14 0.869 0.131 8488.014
2 4 -0.56 0.571 0.429 27796.626
3 9 -1.26 0.283 0.717 46457.298
4 16 -2.24 0.106 0.894 57925.836

5 25 -3.5 0.030 0.97 62850.18
6 36 -5.04 6.473E-3 0.986 63886.884
7 49 -6.86 1.048E-3 0.988 64016.472
8 64 -8.96 1.284E-4 0.999 64729.206
9 81 -11.34 1.188E-5 1 64794
10 100 -14 8.315E-7 1 64794
11 121 -16.94 4.395E-8 1 64794
12 144 -20.16 1.756E-9 1 64794
13 169 -23.66 5.303E-11 1 64794
14 196 -27.44 1.210E-12 1 64794
15 225 -31.5 2.087E-14 1 64794
16 256 -35.84 2.721E-16 1 64794
17 289 -40.46 2.681E-18 1 64794
18 324 -45.36
1.997E-
20 1
64794
19 361 -50.54 1.123E-22 1 64794
20 400 -56 4.780E-25 1 64794
We can see that our company's cumulative expenditure remains constant and the estimated cost
at completion (EAC) comes to $64,794 as soon as our product is released into the market.
Figure 16: Cumulative Funding Over Time:
0
10000
20000
30000
40000
50000
60000
70000
0 5 10 15 20 25
Do
llars
Time
Norden-Rayleigh Cumulative Funding Over Time
Norden-RayleighCumulativeExpenditure Over Time

Norden – Rayleigh Expenditure over Time:
The probability density function (pdf) for the Rayleigh is calculated as follows,
V(t) = 2adte- a * t^2
62,850 = 2 * 0.14 * d * 5 * e- 0.14 * 5^2
d = 1,496,428.571
t t2 - a * t
2 e
- a * t^2 2adte
- a * t^2
0 0 0 1 0
1 1 -0.14 0.869 364110.131
2 4 -0.56 0.571 478496.858
3 9 -1.26 0.283 355730.151
4 16 -2.24 0.106 177655.576
5 25 -3.5 0.030 62849.85
6 36 -5.04 6.473E-3 16273.083
7 49 -6.86 1.048E-3 3073.77
8 64 -8.96 1.284E-4 430.3957
9 81 -11.34 1.188E-5 44.79937
10 100 -14 8.315E-7 3.4839766
11 121 -16.94 4.395E-8 0.202565
12 144 -20.16 1.756E-9 8.829146E-3
13 169 -23.66 5.303E-11 2.88853E-4
14 196 -27.44 1.210E-12 7.09784E-6
15 225 -31.5 2.087E-14 1.31167E-7
16 256 -35.84 2.721E-16 1.82415E-9
17 289 -40.46 2.681E-18 1.90967E-11
18 324 -45.36
1.997E-
20 1.50613E-13
19 361 -50.54 1.123E-22 8.94018E-16
20 400 -56 4.780E-25 4.00563E-18

Figure 17: Funding Profile over Time
Financial Cost Drivers
The drivers affecting cost can be determined from the variables 'a' &'d'. From the above section
we have calculated these variables and their values are as follows,
a = 0.14
d = 64,794 (cumulative expenditure over time)
d = 1496428.571 (expenditure over time)
Where a = cumulative assessment of financial cost drivers
d = actual/ estimated total budget
5.0 PROJECT JUSTIFICATION
Costs-Savings Analysis
To demonstrate the savings made, a statistical analysis was conducted on the paper usage by
each office of Catalyst. Local Administrators of each office were consulted and were given a
survey. The survey details are shown in the table below:
-100000
0
100000
200000
300000
400000
500000
600000
0 10 20 30
US
$
Time
Norden Rayleigh Expenditure
Norden RayleighExpenditure
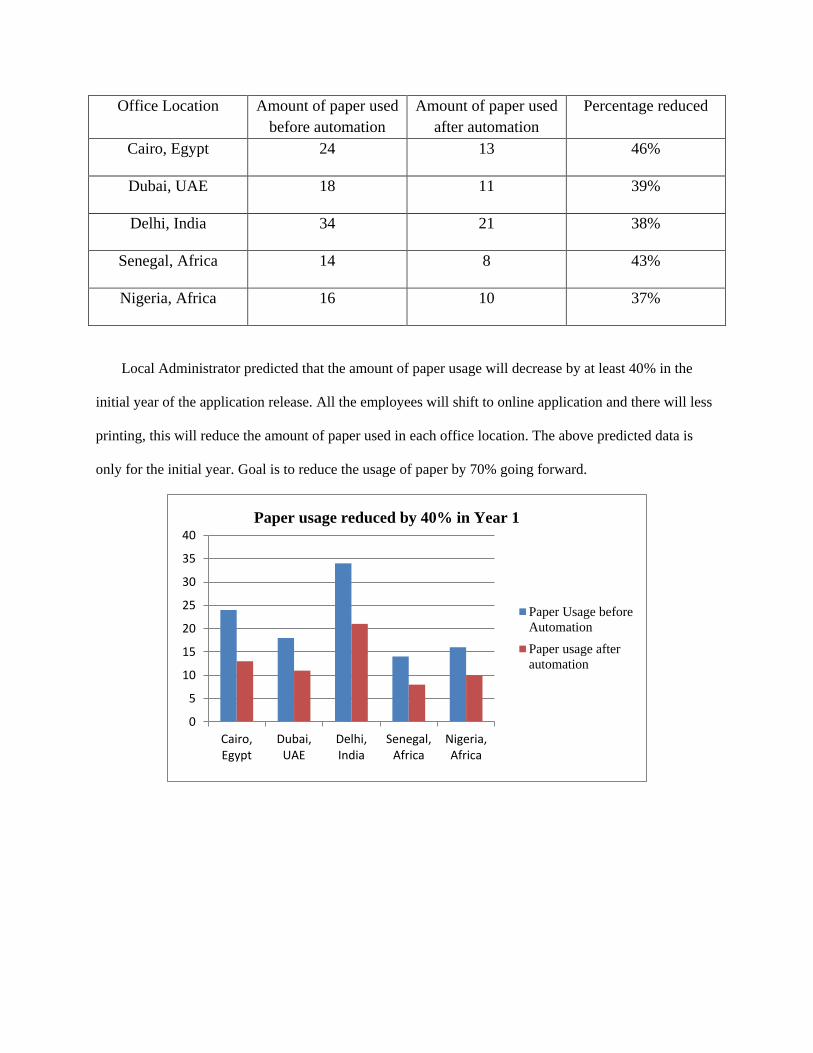
Office Location Amount of paper used
before automation
Amount of paper used
after automation
Percentage reduced
Cairo, Egypt 24 13 46%
Dubai, UAE 18 11 39%
Delhi, India 34 21 38%
Senegal, Africa 14 8 43%
Nigeria, Africa 16 10 37%
Local Administrator predicted that the amount of paper usage will decrease by at least 40% in the
initial year of the application release. All the employees will shift to online application and there will less
printing, this will reduce the amount of paper used in each office location. The above predicted data is
only for the initial year. Goal is to reduce the usage of paper by 70% going forward.
0
5
10
15
20
25
30
35
40
Cairo,Egypt
Dubai,UAE
Delhi,India
Senegal,Africa
Nigeria,Africa
Paper Usage before
Automation
Paper usage after
automation
Paper usage reduced by 40% in Year 1

Timesheet Approval Process Speeds up by 90%
Each employee of Catalyst is required to submit five timesheets for a week, showing all the work
completed on that particular day. Before automation, employees were very irregular in
submitting timesheets. According to the records noted in Catalyst Senegal, the following table
shows the frequency of submission, the date of submission and the date of approval for five
employees of Catalyst:
Name of the consultant Number of timesheets
submitted in a week
Date of submission Date of approval
Ibrahim Gueye 5 03/12/2010 03/27/2010
Khadija 1 03/12/2010 04/09/2010
Mahmoud Naushad 3 03/12/2010 04/01/2010
Mamadou Drame 3 03/12/2010 04/04/2010
Mary Baye 2 03/12/2010 03/29/2010
As seen in the above table, the minimum lag between submission and approval is at least two
weeks. Submission of timesheets is done by the employees to their respective department heads
or projects managers. Employees are complaining less since the release of the timesheet
application. The submission process no longer takes two long weeks. Below table shows the data
taken from the database, after the employees started using timesheet.
Name of the
consultant
Number of timesheets
submitted in a week
Date of submission Date of approval
Ibrahim Gueye 5 04/8/2011 04/9/2011

Khadija 5 04/8/2011 04/8/2011
Mahmoud Naushad 5 04/8/2011 04/9/2011
Mamadou Drame 5 04/8/2011 04/8/2011
Mary Baye 5 04/8/2011 04/8/2011
From the above table it can be inferred that the approval now takes one or two days. An e-mail
notification is sent to the manager after the employee submits timesheets. Hence, the approval
process speeds up by 90%.
Applying T – Test :
A t-test is a hypothesis test, which is supported by null hypothesis. Steps in doing a t-test are:
Mention the research hypothesis
Mention the null hypothesis
Select the probability of alpha level
Calculate statistical significance
Find the results
By definition,
Months Recording hours using CIS Recording hours using Excel
1 164 162

2 170 168
3 169 166
4 155 154
5 161 159
6 175 173
7 168 166
Mean 166 164
Variance 17.33 16.26
Standard Deviation 4.16 4.03
Step 1: Subtract second group mean form first group mean
166 – 164 = 2
Step 2: 17.33/ (7-1) = 2.8
16.26/ (7-1) = 2.71
Step 3: Add the results got in step 2
2.8 + 2.71 = 5.51
Step 4: Take the square root of result from step 3
Square root of 5.51 = 2.34
Step 5: Divide the results of step 1 by step 4
2/ 2.34 = 0.85
Hence the obtained t value is 0.85.
By definition,

If n1 equals n2 and (s1)^2 is not equal to (s2)^2 then the value of df = n1 – 1 or n2 – 1.
Here n1 = n2 = 7
(s1)^2 = 17.33
(s2)^2 = 16.26
Hence our df will be 6.
Since 0.85 < 6, we accept the null hypothesis concluding the mean difference between the
two samples is not greater than the expected.
6.0 INTELLECTUAL PROPERTY (IP)
Copyright:
The main reason to copyright the web pages is because most of the pages have their own
commercial value. They need to be protected as we do not want others to profit from our hard
work without even paying us. Money is not an important reason to copyright. We copyright to
these web pages as they are product of a mind. Copyrighting helps to save the pages from being
changed or being republished by other people who steal the original ideas and claim authorship.
One way to reserve our website or web pages is to copyright it. A copyright controls and
prevents corruption. The page should be marked with © symbol. By giving copyrights to our
website, we can electronically prohibit outsiders from using our code of the website. This
copyright will not allow users to copy any HTML of any web page. If anyone wants to copy
the pages of the site, they first need to mail their identity and the purpose of their request. If the
request is genuine, then the owner of the website will send a mail with his/her digital signature.
All the matter including the tables and figures are protected from being copied, by giving
copyrights. If there is any quoted material in any of the web pages, is not copyrighted. That must
have already been protected by the original author. If we get any request for the usage of the
commercial web pages, they can be considered only if an appropriate is being paid. In general,
requests such as printing, recite, display and capturing the images can be made for a page if the
copyright notice appears in the images.
Catalyst has copyrighted the application, but it is very easy to add some features and claim it as a
whole different application. The only way to beat the competitors would be to win a huge
market share, before the competitors come up with something similar as the Company-
Information- System.
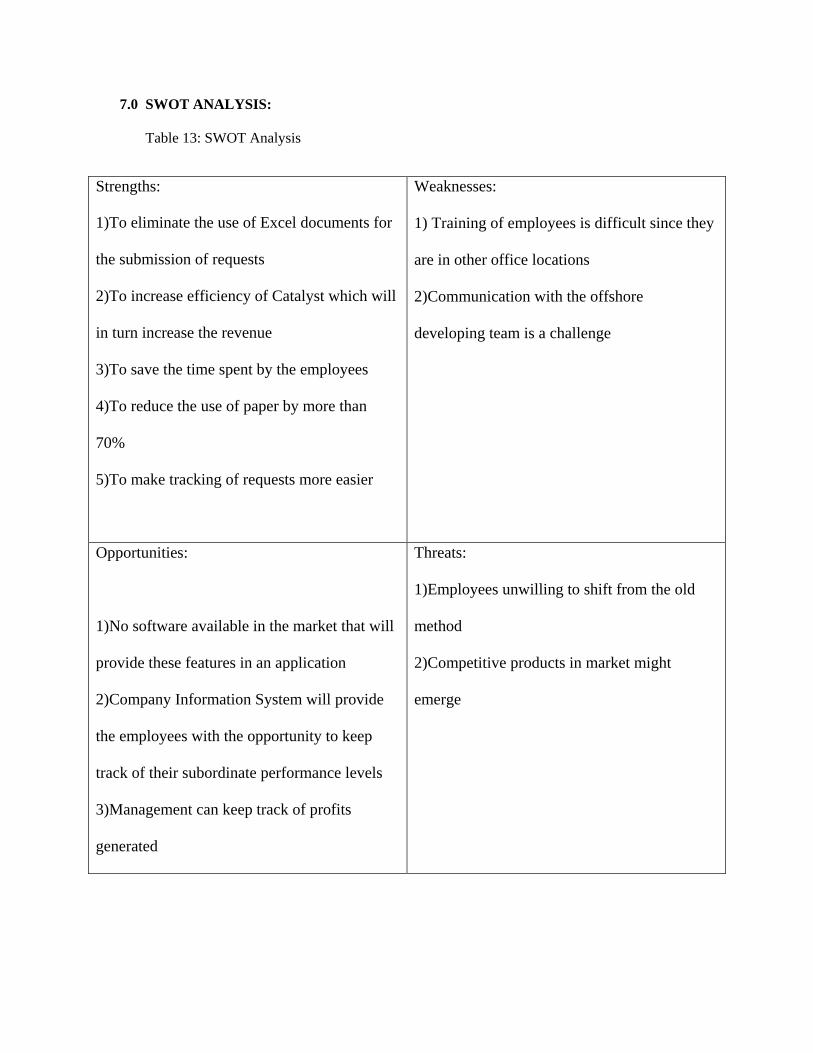
7.0 SWOT ANALYSIS:
Table 13: SWOT Analysis
Strengths:
1)To eliminate the use of Excel documents for
the submission of requests
2)To increase efficiency of Catalyst which will
in turn increase the revenue
3)To save the time spent by the employees
4)To reduce the use of paper by more than
70%
5)To make tracking of requests more easier
Weaknesses:
1) Training of employees is difficult since they
are in other office locations
2)Communication with the offshore
developing team is a challenge
Opportunities:
1)No software available in the market that will
provide these features in an application
2)Company Information System will provide
the employees with the opportunity to keep
track of their subordinate performance levels
3)Management can keep track of profits
generated
Threats:
1)Employees unwilling to shift from the old
method
2)Competitive products in market might
emerge
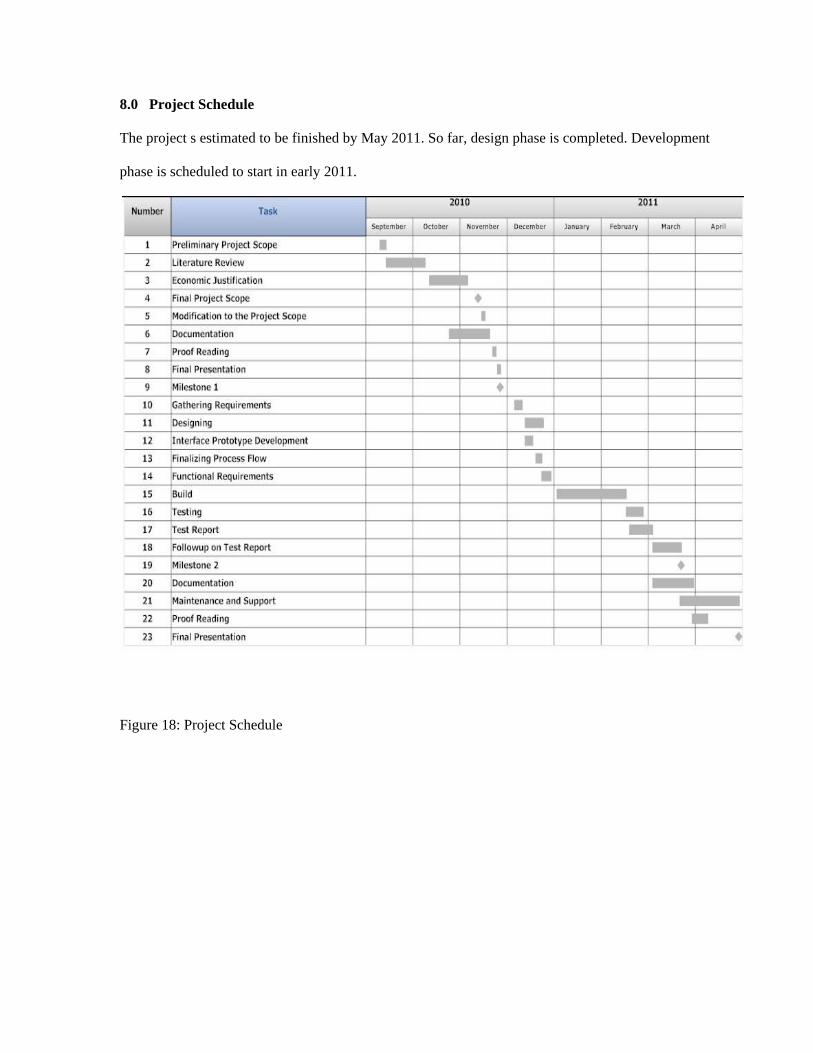
8.0 Project Schedule
The project s estimated to be finished by May 2011. So far, design phase is completed. Development
phase is scheduled to start in early 2011.
Figure 18: Project Schedule

9.0 Screenshots of the User Interface
Figure 19: Enter Timesheet
Figure 20: Track Timesheet
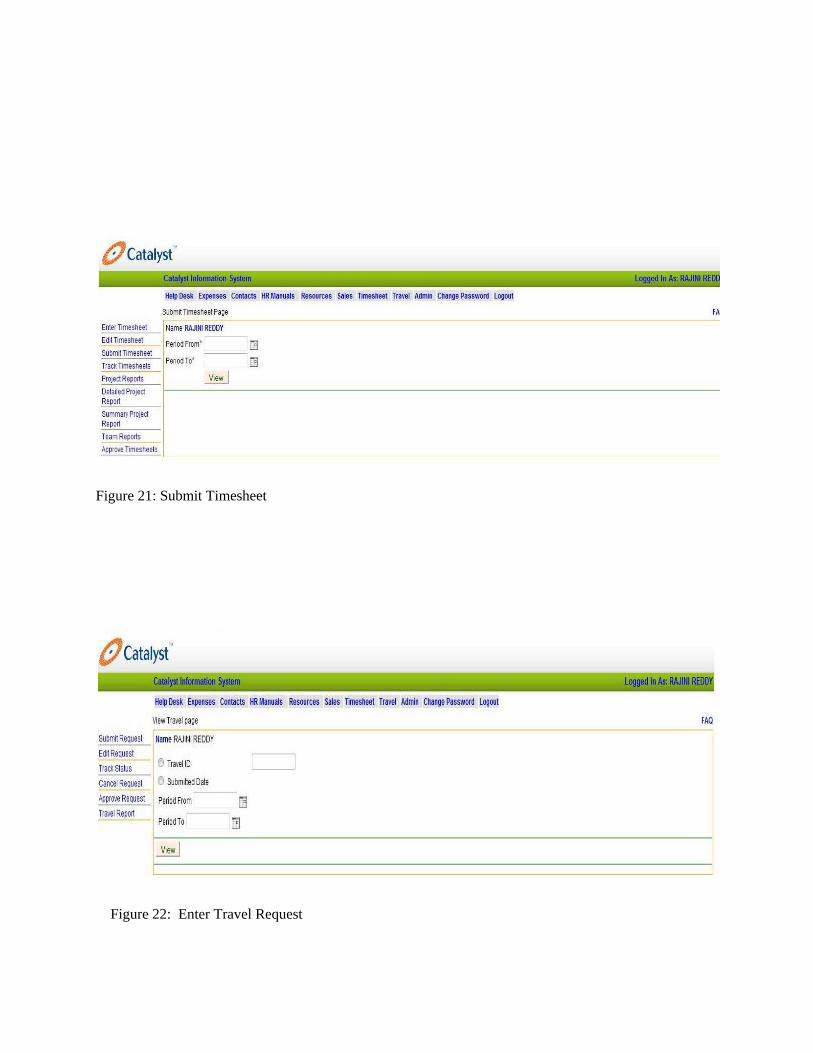
Figure 21: Submit Timesheet
Figure 22: Enter Travel Request

Figure 23: Track travel request
Figure 24: Enter Expenses

10.0 Conclusion
Automation of the request forms helped Catalyst increase its efficiency by 40%. Since the
delivery time is reduced by a great amount and also the paper costs are eliminated, these
savings will benefit the company as well as the environment. We have completed the
Planning, Design and Testing phases of the project and are entering the Maintenance phase
of the project. This application will be available in the market by end of 2011.

References:
Blogspot, Project manager (n.d). Retrieved on November, 2010 from
http://projectmanager-dip.blogspot.com/
Article, SWOT analysis (n.d). Retrieved on November, 2010 from http://www.mindtools.com/pages/article/newTMC_05.htm
Anderson, L.(May, 2010) Top three causes of failure. Retrieved on October, 2010 from
http://www.projectsmart.co.uk/top-three-causes-of-project-failure.html
Catalyst, User login, Retrieved on April, 2011 from
http://cis.catalyst-us.com
Catalyst Business Partners, About us (n.d.). Retrieved on September, 2010 from
www.catalyst-us.com
Information Technology Services, Project Management- Project Lifecycle (n.d.). Retrieved on
September, 2010 from
http://www.usask.ca/its/services/itproject_services/managing_projects/life_cycle.php
Intulogy, ADDIE MODEL (n.d). Retrieved on October, 2010 from
www.intulogy.com/addie