Managing the ASEAN Economic Integration Process in the … · Managing the ASEAN Economic...
21
Philippine Journal of Development Number 71, First and Second Semesters 2012 Volume XXXIX, Numbers 1 & 2 Managing the ASEAN Economic Integration Process in the Philippines: An Assessment of Progress in Trade Liberalization and Facilitation Erlinda M. Medalla 1 ABSTRACT This paper is part of the Philippine study for the Mid-Term Review (MTR) of the ASEAN Economic Community (AEC) Blueprint, a project of the Economic Research Institute for ASEAN and East Asia (ERIA). A milestone in ASEAN economic cooperation is the Cebu Declaration on the Acceleration of the Establishment of an ASEAN Community by 2015 during the 12th ASEAN Summit in 2007, and subsequently the passing of the ASEAN Charter. A midterm review of where the member-countries are in moving toward the AEC is thus timely. At the core of ASEAN integration is the free flow of trade in goods. Accordingly, an essential part of the midterm review is an assessment of progress in the area of trade liberalization and facilitation. Toward this end, two sets of surveys were undertaken: (1) the MTR Questionnaire for Government Officials, and (2) the Firm MTR Survey on Import/Export and Customs Clearance. The questionnaire for government officials gathered information on aspects of ASEAN customs development and integration and the implementation of the national single window (NSW) and the ASEAN Single Window. The survey of firms provided the view from users, particularly their experiences on the customs clearance and permit release process in other government agencies. This yielded a number of recommendations on the ways forward. 1 Senior research fellow, Philippine Institute for Development Studies. Email for correspondence: emedalla@ mail.pids.gov.ph. The usual disclaimer applies.
Transcript of Managing the ASEAN Economic Integration Process in the … · Managing the ASEAN Economic...

Philippine Journal of DevelopmentNumber 71, First and Second Semesters 2012
Volume XXXIX, Numbers 1 & 2
Managing the ASEAN Economic Integration Process in the Philippines: An Assessment of Progress in Trade Liberalization and Facilitation
Erlinda M. Medalla1
ABSTRACTThis paper is part of the Philippine study for the Mid-Term Review (MTR) of the ASEAN Economic Community (AEC) Blueprint, a project of the Economic Research Institute for ASEAN and East Asia (ERIA). A milestone in ASEAN economic cooperation is the Cebu Declaration on the Acceleration of the Establishment of an ASEAN Community by 2015 during the 12th ASEAN Summit in 2007, and subsequently the passing of the ASEAN Charter. A midterm review of where the member-countries are in moving toward the AEC is thus timely. At the core of ASEAN integration is the free flow of trade in goods. Accordingly, an essential part of the midterm review is an assessment of progress in the area of trade liberalization and facilitation. Toward this end, two sets of surveys were undertaken: (1) the MTR Questionnaire for Government Officials, and (2) the Firm MTR Survey on Import/Export and Customs Clearance. The questionnaire for government officials gathered information on aspects of ASEAN customs development and integration and the implementation of the national single window (NSW) and the ASEAN Single Window. The survey of firms provided the view from users, particularly their experiences on the customs clearance and permit release process in other government agencies. This yielded a number of recommendations on the ways forward.
1 Senior research fellow, Philippine Institute for Development Studies. Email for correspondence: [email protected]. The usual disclaimer applies.
2 PhiliPPine Journal of DeveloPment 2012
The Philippines’ first and primary free trade agreement is with the Association of Southeast Asian Nations (ASEAN), initiated in 1992 with the signing of the ASEAN Free Trade Agreement (AFTA). Originally, six countries became part of ASEAN—Brunei Darussalam, Indonesia, Malaysia, the Philippines, Singapore, and Thailand. Other countries joined later: Viet Nam in 1995, Laos and Myanmar in 1997, and Cambodia in 1999.
To enable the free flow of goods in the region, AFTA first adopted the Common Effective Preferential Tariff (CEPT) Scheme, which entered into force on January 1, 1993. The CEPT scheme was complicated by its semibilateral nature, wherein eligibility for tariff concessions was limited to goods where the member-country had also provided tariff concessions. In 2009, the commitments were consolidated (“multilateralized” within ASEAN), accelerated, and further enhanced (with the sensitive list of products trimmed down) under the ASEAN Trade in Goods Agreement (ATIGA), along with measures simplifying the rules of origin and its administration.
The ASEAN vision is to create an ASEAN Economic Community, with a single market and a competitive production base that would enable the region to take advantage of economies of scale, and make it more attractive to investments. A milestone in ASEAN economic cooperation is the Cebu Declaration on the Acceleration of the Establishment of an ASEAN Community by 2015 during the 12th ASEAN Summit in 2007, and subsequently the passage of the ASEAN Charter. A midterm review of where the member-countries are in moving toward the ASEAN Economic Community is thus timely. At the core of ASEAN integration is the free flow of trade in goods. Accordingly, an essential part of the midterm review is an assessment of progress in the area of trade liberalization and facilitation.
Toward this end, two sets of surveys were undertaken: (1) the Mid-Term Review (MTR) Questionnaire for Government Officials, and (2) the Firm MTR Survey on Import/Export and Customs Clearance. The questionnaire for government officials sought to gather information on aspects of ASEAN customs development and integration and the implementation of the national single window (NSW) and the ASEAN Single Window (ASW). The survey of firms provided the view from users, particularly their experience on the customs clearance and permit release process in other government agencies.
The paper starts with an overview of Philippine trade liberalization and facilitation, followed by some trade indicators to provide the setting for discussion. The key findings from the two sets of questionnaires are presented and recommendations on the ways forward are then suggested in the succeeding sections.

3Medalla
BRIEF OVERVIEW OF PHILIPPINE TRADE POLICYComing from more than three decades of protectionism, the Philippines started to undertake comprehensive, unilateral trade reforms starting in the 1980s that significantly opened up the economy (Box 1). First was the Tariff Reform Program I (TRP 1) implemented from 1981 to 1985, which narrowed down the tariff band to 10 percent–50 percent from 10 percent–100 percent. This was followed by the extensive removal of import restrictions (mainly in the form of import bans or import license requirements) on a host of products. Unilateral trade reforms continued in 1991 with the passage of the Tariff Reform Program II (TRP 2). The third phase of the Tariff Reform Program (TRP 3) was staged for another
Postwar–1970s Import substitution (1950s–1970s)Export promotion starting in 1973
Period of import controlsand high tariffs
1980–1985 Tariff Reform Program I (TRP 1)• Brought down tariff band to 10%–50%
Start of unilateral trade liberalization
1983–1986 Economic crisis in 1983 and change in government in 1986
Trade reform interruption
1986–1988 Comprehensive removal of import license requirements
Continuation of unilateral trade liberalization
1991–1995 Tariff Reform Program II (TRP 2)• Brought down tariff band to 0–30%AFTA-CEPT in 1993Accession to WTO in 1995
1996–2000 Tariff Reform Program III (TRP 3)• Further reduction in tariffs and quantitative restrictions in agriculture replaced by tariffs, except for "sensitive" productsAPEC membership (1996)
2001–2004 Tariff Reform Program IV (TRP 4) • Executive Order No. 334 (January 1, 2001) – provided for the implementation of a tariff band of 0%–5% by 2004
– Implementation frozen, then shelved• Selective increases in tariff rates (up to 1998 levels) in 2002
Stalling of unilateral trade reforms and “tariff readjustment”
2000s Preferential trading agreements: AFTA and ASEAN+1 FTAs
Philippine-Japan Economic Partnership Agreement (December 2008)
Regional and preferential trade agreements
Box 1. Philippine trade policy timeline
Source: Author's compilation

4 PhiliPPine Journal of DeveloPment 2012
five years from 1996 to 2000, mainly replacing the quantitative restrictions in agriculture with tariffs.
In 1998, the Tariff Commission was tasked to review and evaluate the impact of the pace of tariff reductions on the ability of local industries to compete, especially in the light of the Asian financial crisis. This resulted in “tariff recalibration” wherein a 3%-5%-7%-10%-15%-20%-25%-30% structure was put in place of the 3%-10%-20%-30% structure, though retaining most of the liberalization already in place.
The fourth phase of the Tariff Reform Program (TRP 4) was subsequently scheduled in 2001, which would have reduced the tariff band further to 0–5 percent by 2004 (except for a limited range of sensitive agricultural products with a 2004 tariff rate of 30%). However, implementation was frozen during the Arroyo administration. Furthermore, a tariff relief package for industries was implemented, with tariff rollbacks for a number of selected products.
The series of tariff reform programs, despite the interruption in the mid-1980s and the stalling in the 2000s, brought down the average (MFN applied) tariff rate to only around 7 percent in 2012 from 42 percent in 1980. Some fluctuation in tariff levels arose during the “tariff readjustment” period in the early 2000s, but the average tariff level remained relatively low, as the tariff increases were capped, not to exceed the 1998 levels (Table 1).
The most favored nation (MFN) tariff structure has remained basically unchanged during the past decade. In effect, trade liberalization proceeded as part of the country’s commitments in its various trade agreements. The AFTA is the primary trade agreement for the Philippines. The Philippine engagement in preferential agreement has mainly been as member of ASEAN, with Japan as its lone bilateral free trade agreement (FTA) partner. Being part of ASEAN has helped keep the country open, especially at the time when the tendency to waver became intense following the 1997 Asian financial crisis.
As part of its commitments to ASEAN, Executive Order (EO) No. 850 was approved in December 2009, removing tariffs on imports from ASEAN in 2010, except for a short “sensitive” list of products. The Philippine sensitive list includes swine, poultry, cassava, sweet potatoes, corn, grain sorghum, and sugar. Rice is the only item in the highly sensitive list. Even within the sensitive list, the CEPT rates are down to 5 percent for most products (e.g., poultry and swine). The few remaining products with rates higher than 5 percent cover rice and sugar (Table 2).
Perhaps even more significant in liberalizing trade was the substantial removal of quantitative restrictions after 1986, especially within the two years that followed. Prior to reforms, import prohibitions and import licensing requirements used to be imposed on more than 23 percent of total Philippine Standard Commodity Classification (PSCC) lines. In the two years from 1986, the

5Medalla
Year Agriculture Mining Manufacturing Overall
1981 43.23 16.46 33.74 34.6
1985 34.61 15.34 27.09 27.6
1990 34.77 13.97 27.49 27.84
1995 27.99 6.31 13.96 15.87
2000 14.4 3.27 6.91 7.95
2005 11.85 2.47 7.29 7.81
2010 11.94 2.28 6.18 7.02
Simple Average Nominal Tariff (%)
Table 1. Philippine average nominal tariff, 1981–2010
Source: Philippine Tariff Commission (2011)
Table 2. Remaining products with PH-CEPT tariffs > 5 percent
AHTN Product Description 2010 CEPT (%)
1006.10.00 Rice in husk - suitable for sowing 40
1006.20.10 Husked brown rice - Thai Hom Mali rice 40
1006.20.90 --- other 40
1006.30.15 Fragrant rice - Thai Hom Mali 40
1006.30.19 Other semi or wholly milled rice 40
1006.30.20 Parboiled rice 40
1006.30.30 Glutinous rice 40
1006.30.90 --- other 40
1006.40.00 Broken rice 40
1701.11.00 Cane sugar 38
1701.12.00 Beet sugar 38
1701.99.11 --- Containing over 65 percent by dry weight of sugar 38
1701.99.19 --- Containing o0ver 65 percent by dry weight of sugar 38
1701.99.90 --- other 38
Source: Philippine Tariff Commission (2011)
percentage was more than halved. The percentage was trimmed down further to less than 3 percent by 1996 (Table 3). Existing quantitative restrictions are mainly on weapons and arms and a few “sensitive” goods (e.g., rice and sugar), possibly constituting less than 1 percent of the total number of similar PSCC lines.
Of course, as in other countries, there are remaining nontariff measures (NTMs) imposed for health and safety (including environmental protection)

6 PhiliPPine Journal of DeveloPment 2012
reasons. The main NTMs are in the form of technical barriers to trade (TBTs) and sanitary and phytosanitary (SPS) requirements. Such measures complicate cross-border flows of goods on the whole. In this regard, trade facilitation efforts become the crucial element of reforms. The challenge is how related procedures and administration could be facilitated, and how ASEAN member-countries could put in place a more transparent and harmonized system.2
BRIEF REVIEW OF TRADE FACILITATION MEASURES3 Reforms and modernization efforts in the customs administration system date back to as early as the 1970s, with the installation of a mainframe computer system for the purpose of capturing transactions data and generating databases of customs bonds, orders of payment, and customs declarations. It was during the period of 1992–1998 when a genuine Customs Reform and Modernization Program was achieved (Parayno 2004). Its success has earned praises and recognition from local and foreign organizations including the World Customs Organization
2 A separate paper in this volume by V. Ledda discusses progress in standards and conformance.3 Drawn heavily from Chapter 3 of Aldaba et al. (2010), with portions directly lifted.
Year Number of PSCC Lines Subjectto Import Restrictions
Percent Regulated (as to total no. of PSCC lines)
Total number of PSCC lines 5,632 100.0
1970 1,307 23.2
1980 1,820 32.3
1985 1,802 32.0
1986 827 14.7
1987 653 11.6
1988 598 10.6
1989 470 8.3
1990 463 8.2
1991 439 7.8
1992 160 2.8
1993 253 4.5
1994 246 4.4
1995 222 3.9
1996 161 2.9
Table 3. Number of regulated commodities, 1980–1996
Source: De Dios (1997) as cited in Medalla (2002)

7Medalla
(WCO), the United Nations (UN), the International Monetary Fund (IMF), and foreign visitors from all over the world.4
Continuous modernization efforts are being introduced to sustain these improvements. In 2005, a computerization improvement program was introduced with 33 major components that include software upgrades such as the Automated System for Customs Data (ASYCUDA-World). ASYCUDA-World is an Internet-based lodgment system of customs information that integrates all agencies’ processes. The components are import and assessment system, automated export documentation system (AEDS), automated bonds management system (ABMS), raw materials liquidation system (RMLS), import and export support system, the Bureau of Customs (BOC) Portal, exports processing system, funds monitoring system, and resource and operations management system. The bureau also initiated the Electronic to Mobile (e2m) Customs Project in 2005. It is an initiative supported by a PHP 500-million e-government presidential budget. The e2m Customs Project aims for the development of a dynamic and faster end-to-end cargo clearance process, eventually through the use of mobile broadcasting and Internet/electronic data interchange connectivity. It makes use of advanced technology, including electronic signatures, to provide government officials, specifically customs administrators, with new tools for the better implementation of security, trade efficiency, and anticorruption measures (see Box 2 for the e2m
4 A UN report stated: “the Review team was greatly impressed with the progress achieved in modernizing the cargo clearance operations”. While an UNCTAD Audit Team said: “among the developing countries, you rank no. 1 in computerization” (Maniego 1999).
Box 2. e2m Customs
Process e2m Customs Target Improvement
Accreditation/registration from paper to electronic
Manifest submission from five days after arrival to 12 hours before arrival of vessel/shipment
Assessment from self-assessment by importer to final assessment by BOC appraiser
Lodgment from filing at BOC to Internet filing
Import processing from disjointed subsystems to a seamless system
Payment from cash and checks to electronic debit only
Risk management/selectivity from transaction-based to account/company rating-based
Entry track-and-trace from manual to Internet or cellphone-based
Information Online resource access through BOC website on issuances, processes, policies, guidelines, and other related information
Source: Philippine Bureau of Customs
8 PhiliPPine Journal of DeveloPment 2012
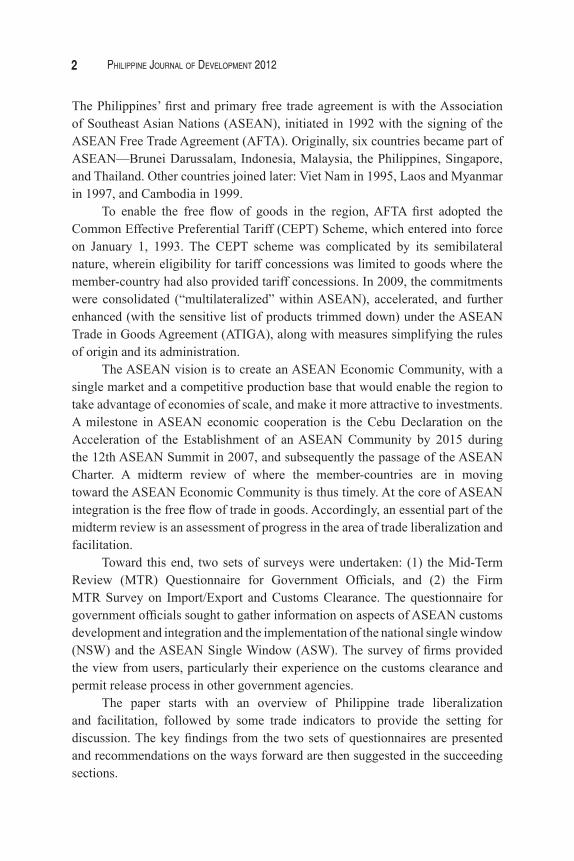
Customs features). It is expected to support the implementation of the national and ASEAN single windows. Some major changes effected by the e2m Customs to allow import processing within 30 minutes (ASEAN target) include, notably: (1) the One-Stop Shop Export Documentation Center (OSEDC), and (2) reforms and automation in economic zones. For example, the BOC and the Philippine Economic Zone Authority (PEZA) introduced the automated import cargo transfer system (AICTS), electronic import permit system, and the AEDS. Compared with manual processing, AEDS has reduced clearing time and lowered the cost of business (e.g., PEZA and customs overtime charges and filing fees) by 83 percent and 78 percent, respectively. Several similar initiatives are being introduced in other economic zones not covered by PEZA. These include trade automation and facilitation system (TAFS) implemented by the Subic Bay Metropolitan Authority (SBMA), and the electronic transit admission permit system (e-TAPS, which is like the PEZA e-IPS) and enhanced automated cargo transfer system (E-ACTS) implemented by both the SBMA and Clark Development Corp. (CDC).
BOC is also engaged in other initiatives albeit at a very early stage, including development and adoption of a customs transit system, authorized economic operators (AEOs), and the establishment of one-stop customs-immigration-quarantine-security agencies (CIQS) facilities at the Brunei Darussalam-Indonesia-Malaysia-Philippines East ASEAN Growth Area (BIMP-EAGA) border crossings. There is also the BOC-led NSW project.
To implement NSW in the Philippines, President Arroyo issued on December 27, 2005 EO 482 which formed the National Single Window Task Force for Cargo Clearance. This aims to ensure a coherent and effective formulation, coordination, implementation, and monitoring of the NSW. The members of the task force are relevant national government agencies that have the direct mandate to regulate internationally traded goods. The task force has a steering committee directing and ensuring the effective implementation of the plan to establish the NSW, and the Technical Working Group (TWG) which attends to the day-to-day implementation of the plan.5 The BOC chairs both levels of the task force. The government departments and agencies involved in cargo clearance release are mandated to cooperate with each other to provide the BOC with the automated electronic system required for the establishment, implementation, and operation of the NSW, and eventually linkage with the ASW. Also, the Philippine NSW is to be developed in line with recognized international standards to enable interoperability while ensuring seamless integration with the NSWs of other countries and the ASW.
5 An orientation and workshop planning for the Philippine NSW was conducted to discuss and formulate the National Work Plan for NSW (Clarete and Brucal 2007).

9Medalla
Implementation of the NSW is planned in two phases. Phase 1 initially targets 10 agencies, selected on the basis of the occurrences of permits and when combined account for around 70 percent–80 percent of all import permits. The NSW application at the 10 agencies will cover a single set of licenses, permits, or clearances per agency. It features electronic submission of application form, status of application viewable in the dash board, notification via email of application status, and final approval via electronic means. Agencies included in Phase 1 are the Sugar Regulatory Administration, Bureau of Animal Industry, Bureau of Plant Industry, National Food Authority, Bureau of Internal Revenue, the Food and Drug Administration, Philippine Economic Zone Authority, Bureau of Customs, Board of Investments, and Bureau of Product Standards. The Philippines is now planning the second phase of implementation of the NSW. Aside from the 10 core agencies, 27 other government agencies (OGA) are now covered.
As of the moment, there are no changes in paper document forms as each agency will process applications according to its existing procedures. Documents may be printed for review and circulated for approvals. Such documents will be identical to existing forms, with the addition of a printed bar code to easily identify the document and treat it as a unique application. The agency, upon completion of its review, returns to the NSW to record its required response. This may include the capture of limited data and the registration of either approval or denial of the application. The document bar code can be scanned to recall the electronic entry, thereby simplifying the identification of a document that has been processed. Documentation can be scanned and attached to the electronic folder for any application. The agency’s decisions are to be transmitted to the trader simultaneously with its transmittal to the BOC e2m system (BOC 2010). The basic approach is to have two independent but integrated systems (i.e., NSW and e2m customs) working simultaneously and exchanging information electronically.
SOME TRADE PERFORMANCE INDICATORSAmid this setting and global developments, trade in proportion to gross domestic product (GDP) has grown steadily over the years, although the Philippines is trailing behind many of its ASEAN neighbors. The exports-to-GDP ratio peaked in 2000, rising from 18.5 percent in 1990 to 50 percent, and thereafter falling to around 24 percent in 2009, which is still considerably higher than the ratio in 1990. On the other hand, the imports-to-GDP ratio peaked in 2005, thereafter falling to around 28 percent, close to its level in 1990. The trade intensity is similar to Indonesia, but much lower compared with Thailand, Malaysia, and Viet Nam (Table 4).
The direction of Philippine trade has shifted away from the United States (US) and the European Union (EU) to Asia during the past 30 years. In particular,

10 PhiliPPine Journal of DeveloPment 2012
the share of Philippine trade with ASEAN has increased very significantly. The share of Philippine exports going to ASEAN has grown dramatically, from only 2.7 percent in 1975 to almost 10 times at 22.4 percent in 2010. A similar trend is observed for imports, with the share increasing to 28 percent from 5 percent over the same period for imports from ASEAN (Table 5).
Hence, AFTA appears to have had a positive impact on the Philippines’ direction of trade. Indeed, a concurrent study by Yap and Associates (2012), using a gravity model, confirms this positive impact of AFTA on increasing intraregional trade.
It is also interesting to note the findings on the AFTA utilization rate. According to the ASEAN Secretariat, the Philippines, whose utilization rate could be as high as 41 percent in 2010, joined Cambodia, Indonesia, and Thailand as
Table 4. Trade/GDP ratio of selected countries
1990 1995 2000 2005 2006 2007 2008 2009
Indonesia 22.4 22.5 37.6 30.0 27.6 26.4 27.3 22.1
Malaysia 66.9 83.2 104.7 102.2 102.5 94.6 90.1 82.3
Philippines 18.5 23.5 50.2 41.7 40.3 35.0 29.3 23.9
Thailand 27.0 33.6 56.3 62.6 63.0 61.7 65.3 57.8
Viet Nam 37.1 26.3 46.5 61.3 65.4 68.4 69.2 61.3
China 15.9 20.4 20.8 34.1 36.5 36.0 32.4 24.1
Japan 9.4 8.4 10.3 13.1 14.8 16.3 16.0 11.5
Korea 24.6 24.2 32.3 33.7 34.2 35.4 45.3 43.7
Indonesia 19.1 20.1 20.3 20.2 16.8 17.2 24.9 16.7
Malaysia 66.4 87.4 87.4 83.1 83.7 78.9 70.9 64.7
Philippines 29.4 38.4 44.5 50.1 46.0 40.3 36.1 28.6
Thailand 38.7 42.1 50.7 67.0 63.0 57.3 65.8 50.7
Viet Nam 42.5 39.3 50.2 69.5 73.7 88.4 89.0 75.1
China 13.7 18.1 18.8 29.5 29.8 28.3 25.6 20.2
Japan 7.7 6.4 8.1 11.4 13.3 14.2 15.6 10.9
Korea 26.5 26.1 30.1 30.9 32.5 34.0 46.7 38.8
Imports/GDP (at current prices) ratio
Exports/GDP (at current prices) ratio
Source of basic data: 1990–2007 - Key indicators for Asia and the Pacific (ADB 2009);2008–2009 - Statistical yearbook of Asia and the Pacific (UNESCAP 2011) (only minor differences noted in 2008 from the two sources)

11Medalla
Imports: Direction of tradeShare to total importsPhilippine imports by country source
Exports: Direction of tradeShare to total exportsPhilippine exports by destination
Table 5. Philippine direction of trade
Country 1975 1980 1985 1990 1995 2000 2005 2009 2010
Total 100.0 100.0 100.0 100.0 100.0 100.0 100.0 100.0 100.0
North America 28.9 27.4 35.7 37.8 36.7 31.5 18.9 18.6 15.8
United States 28.9 27.4 35.7 37.8 35.3 29.8 18.0 17.7 14.7
Europe 16.6 20.3 14.3 17.9 18.0 18.4 17.3 21.1 14.8
Asia 45.2 41.5 38.5 34.8 41.3 48.1 61.1 56.3 66.0
ASEAN 2.7 6.6 11.5 7.1 13.6 15.7 17.3 15.2 22.4
Japan 37.7 26.5 18.9 19.7 15.7 14.7 17.5 16.2 15.2
Oceania 1.4 1.8 2.1 1.3 1.0 0.9 1.3 1.7 1.2
Middle East 2.2 2.0 1.5 1.6 1.3 0.5 0.7 1.2 1.1
Others 5.6 7.0 7.9 6.6 1.7 0.7 0.7 1.1 1.0
Country 1975 1980 1985 1990 1995 2000 2005 2009 2010
Total 100.0 100.0 100.0 100.0 100.0 100.0 100.0 100.0 100.0
North America 21.8 23.1 25.1 19.4 19.5 19.3 19.7 12.2 12.3
United States 21.8 23.1 25.1 19.4 18.4 18.6 19.2 11.6 11.4
Europe 12.5 11.0 8.6 11.5 13.3 10.8 9.5 9.1 9.4
Asia 37.4 34.2 42.7 40.2 52.9 55.4 59.2 63.9 71.1
ASEAN 5.0 7.0 14.8 9.7 11.9 15.5 18.7 25.4 28.2
Japan 27.9 19.8 14.4 18.3 22.6 18.9 17.0 12.1 13.1
Oceania 4.6 3.8 3.6 3.7 3.7 3.0 2.0 2.9 3.0
Middle East 17.5 21.1 12.4 11.5 8.5 10.5 8.2 7.5 9.0
Others 6.2 6.8 7.5 13.7 2.1 1.0 1.4 2.1 1.7
Source of basic data: 1990–2007 - Key indicators for Asia and the Pacific (ADB 2009);2009–2010 - Statistical yearbook of Asia and the Pacific (UNESCAP 2011) (only minor differences noted in 2008 from the two sources)
the ASEAN member-states with the highest utilization rates. This is also indicated by the available information on the number of Certificates of Origin (CO) issued from 2008 to 2010 (Table 6). These trends highlight the importance of AEC measures promoting trade liberalization and facilitation.

12 PhiliPPine Journal of DeveloPment 2012
WAYS FORWARD FOR THE PHILIPPINES AND ASEAN
Summary of findingsWith respect to tariffs, the Philippines has delivered its AFTA commitment to bring down tariffs on imports from ASEAN to zero in 2010 except for a short sensitive list. Even for goods in the sensitive list, the CEPT rates are down to 5 percent for most products (e.g., poultry and swine). The only remaining items with rates higher than 5 percent are rice and sugar.
Core NTMs (in some form of quantitative restrictions) are also down to a few commodities, covering mainly weapons and arms and a few “sensitive” goods (e.g., rice and sugar). As in the case of most countries, there are nontariff measures imposed for health and safety (including environmental protection) reasons, which are deemed to be WTO-consistent. These NTMs are mainly in the form of TBTs and SPS requirements (Pasadilla 2009). Thus, in the case of NTMs, the crucial areas for reforms would be in trade facilitation measures. In particular, these measures should address transparency, standardization and harmonization, and electronic processing. Indeed, these are embedded features in customs modernization (e-customs) and the implementation of the NSW.
In 2011, the ERIA study on the AEC Scorecard Monitoring System and Mechanism (Phase II)6 developed a scoring system to assess the status of member-countries in core measures for ASEAN integration, including trade facilitation. The Philippines scored high at 88 percent in customs modernization and integration based on the formulated scoring system. This reflects the reforms the Philippines has been undertaking in customs administration during the past decades. The major gaps for improvement are found in the postclearance system, AEO management, and the cargo profiling and tracking system.
6 ERIA (2011).
Number of COs Issued
Table 6. Philippines’ Certificate of Origin (CO) issuance: 2008–2010
CO Form 2008 2009 2010
ASEAN Form D 13,650 12,749 15,117
ACFTA Form E 678 972 2,633
JPEPA Form JP 0 7,382 8,214
AKFTA Form AK 1,970 2,082 2,415
AANZFTA Form AANZ 0 0 2,559
Source of basic data: Adviento (2011), Export Division, Port of Manila

13Medalla
The Philippines also scored well with regard to the Philippine NSW, at 82 percent. Phase 1 of the NSW has been completed, including NSW system implementation for core government agencies, featuring electronic submission of application form, status of application viewable in the dashboard, notification via email of application status, and final approval via electronic means. This assessment was consistent with the results from World Bank Doing Business Indicators for 2012, which noted an improvement in the Philippines’ performance, which moved up three places in ranking in the area of “Trading Across Borders”.
This midterm review in the area of trade facilitation took another (and updated) look at government processes involved and obtained feedback from the firms themselves. Two sets of surveys were undertaken: (1) the MTR Questionnaire for Government Officials, and (2) the Firm MTR Survey on Import/Export and Customs Clearance. The questionnaire for government officials, which included BOC officials, sought to gather information on aspects of ASEAN customs development and integration and the implementation of the NSW and ASW. The survey of firms provided the view from users, in particular their experience on the customs clearance and permit release process in other government agencies.
E-customs (where major customs-related processes are automated and submissions and verifications are done electronically) is at the core of customs modernization. In the MTR survey for government officials, responses of BOC officials7 to questions on customs modernization revealed that the Philippines had implemented electronic transactions in most key customs processes. The exceptions were in electronic export declarations and electronic certificates of origin. Electronic transactions in these processes were expected to be ready in 2012 (Table 7).
The responses also indicate that the Philippine BOC has implemented e-customs for all the major seaports and airports and targets coverage of all by 2015. Around 80 percent of its basic customs operation is now electronic, covering around 95 percent of imports, at least 25 percent of exports, and 75 percent of firms. Full coverage is targeted by 2015.
In the case of NSW implementation, based on the BOC’s response, there are 26 government agencies in the NSW providing electronic licenses, permits, and certificates. They are connected to the NSW portal where people can submit applications and necessary papers, verify the status of applications online on the NSW dashboard, and obtain decisions regarding their transactions.
7 In the case of the Philippines, the BOC is the primary agency in charge of implementation of the NSW and customs reforms. The concerned BOC officials were thus selected as respondents. Interviews were conducted with the commissioner, two deputy commissioners, the director of the management information system and technology group, and the export division chief of the Port of Manila.

14 PhiliPPine Journal of DeveloPment 2012
Examples of clearance services done through the NSW portal include:- trader registration- submission of application for permits, licenses, clearances- approval processes/workflow by agencies- transmission of approved permits, licenses, clearances- information-sharing, reporting, statistics- e-payment of feesAccording to BOC, the NSW portal is implemented in the major seaports
and airports and coverage for all is targeted by 2015. There are 38 OGAs linked to the NSW. A total of 50 OGAs are envisioned by the BOC to be linked to the NSW by 2015. Registration is a requirement to lodge a customs declaration (whether manual or electronic). Of around 10,000 registered, around 25 percent use the NSW portal. In sum, the customs reforms are being undertaken toward achieving the ASEAN target of 30-minute turnaround time in customs processing.
To help assess the progress made in trade facilitation efforts of the government, the MTR also included a survey of private sector firms to determine if they had perceived improvements in customs procedures and processes. A total of 34 responses were collected, which represented 16 large firms and 18 micro, small, and medium-sized firms. Twenty of the respondent firms were fully domestic-owned; nine were fully owned multinationals; two were fully foreign-owned; and three were joint-venture firms. All the firms in the survey had dealings with customs, either as exporter/importer, or brokerage/forwarder. Majority of the firms across size had trade with ASEAN. Overall, customs reforms were validated by the results of the survey.
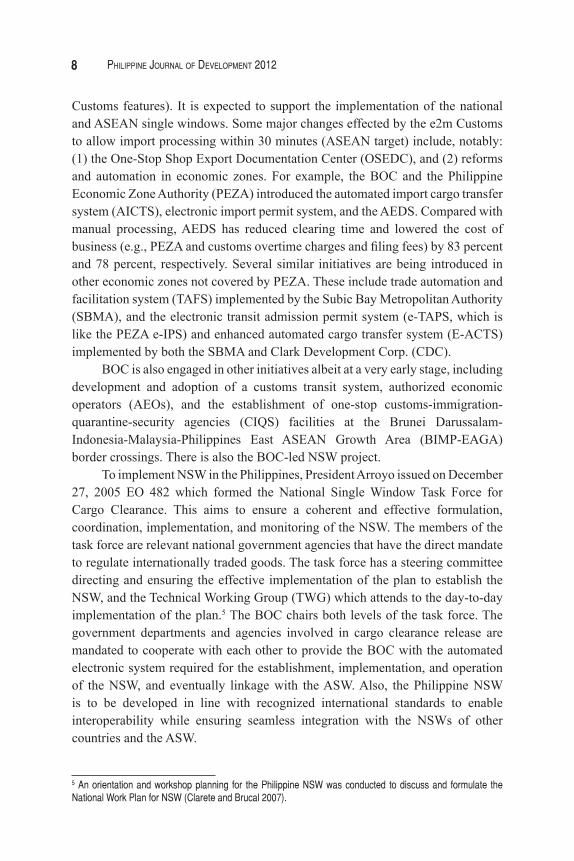
Perception of customs procedures becoming fully automated rose by more than 50 percent for all customs procedures in 2011 compared with the previous year for main customs processes. The highest perception was in payments of taxes and duties (22 out of 28 who answered), followed by import declarations (16 out of 34). The highest perception of non-automation is in support documentations
Table 7. Availability of E-customs processes
E-customs Processes Availability
Electronic import declarations Yes
Electronic export declarations in 2012
Electronic submission of manifests Yes
Electronic payment Yes
Electronic certificate of origin in 1st half of 2012
Automated import license issuance Yes
Source: Author’s compilation
15Medalla
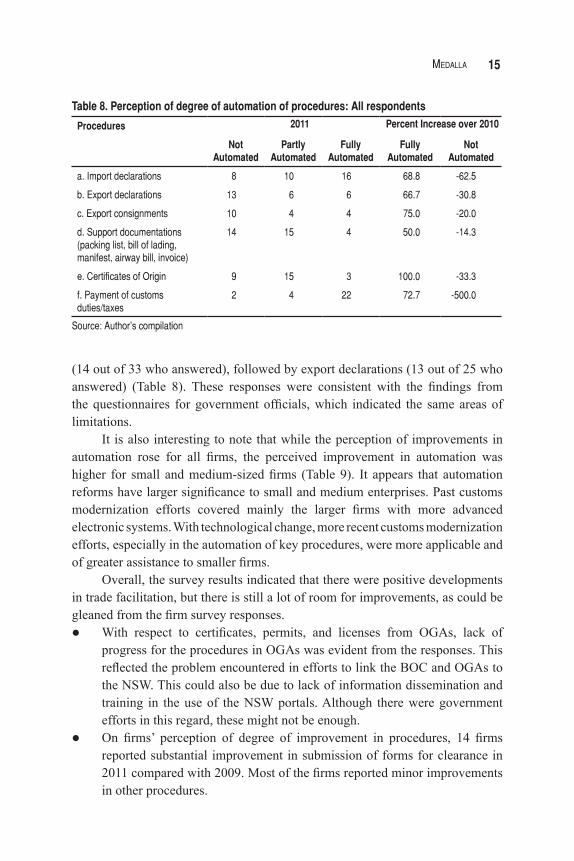
(14 out of 33 who answered), followed by export declarations (13 out of 25 who answered) (Table 8). These responses were consistent with the findings from the questionnaires for government officials, which indicated the same areas of limitations.
It is also interesting to note that while the perception of improvements in automation rose for all firms, the perceived improvement in automation was higher for small and medium-sized firms (Table 9). It appears that automation reforms have larger significance to small and medium enterprises. Past customs modernization efforts covered mainly the larger firms with more advanced electronic systems. With technological change, more recent customs modernization efforts, especially in the automation of key procedures, were more applicable and of greater assistance to smaller firms.
Overall, the survey results indicated that there were positive developments in trade facilitation, but there is still a lot of room for improvements, as could be gleaned from the firm survey responses.l With respect to certificates, permits, and licenses from OGAs, lack of
progress for the procedures in OGAs was evident from the responses. This reflected the problem encountered in efforts to link the BOC and OGAs to the NSW. This could also be due to lack of information dissemination and training in the use of the NSW portals. Although there were government efforts in this regard, these might not be enough.
l On firms’ perception of degree of improvement in procedures, 14 firms reported substantial improvement in submission of forms for clearance in 2011 compared with 2009. Most of the firms reported minor improvements in other procedures.
Percent Increase over 20102011
Table 8. Perception of degree of automation of procedures: All respondents
Procedures
Not Automated
Partly Automated
Fully Automated
Fully Automated
Not Automated
a. Import declarations 8 10 16 68.8 -62.5
b. Export declarations 13 6 6 66.7 -30.8
c. Export consignments 10 4 4 75.0 -20.0
d. Support documentations (packing list, bill of lading, manifest, airway bill, invoice)
14 15 4 50.0 -14.3
e. Certificates of Origin 9 15 3 100.0 -33.3
f. Payment of customs duties/taxes
2 4 22 72.7 -500.0
Source: Author’s compilation

16 PhiliPPine Journal of DeveloPment 2012
Table 9. Perception of degree of automation of procedures: Large, medium, and small firms
Procedures
Not Automated
Partly Automated
Fully Automated
Fully Automated
Not Automated
Large firms
a. Import declarations 2 3 11 54.5 -100.0
b. Export declarations 7 1 5 60.0 -42.9
c. Export consignments 5 3 66.7 -20.0
d. Support documentations (packing list, bill of lading, manifest, airway bill, invoice)
7 6 3 33.3 0.0
e. Certificates of Origin 7 2 2 100.0 -14.3
f. Payment of customs duties/taxes
2 2 8 75.0 -150.0
Medium-sized firms
a. Import declarations 5 2 2 100.0 -60.0
b. Export declarations 5 2 -40.0
c. Export consignments 4 2 -50.0
d. Support documentations (packing list, bill of lading, manifest, airway bill, invoice)
4 2 2 100.0 -75.0
e. Certificates of Origin 8 1 100.0
f. Payment of customs duties/taxes
9 88.9
Small firms
a. Import declarations 1 5 3 100.0 -100.0
b. Export declarations 1 4 1 100.0 0.0
c. Export consignments 1 3 1 100.0 0.0
d. Support documentations (packing list, bill of lading, manifest, airway bill, invoice)
2 7 -50.0
e. Certificates of Origin 2 6 -100.0
f. Payment of customs duties/taxes
2 6 66.7
Source: Author’s compilation
Percent Increase over 20102011
l Majority of respondents rated specified features (e.g., ability to track and trace customs clearance electronically, electronic payment, ability to download forms, etc.) in local import and customs systems or the NSW to be very important, if not critical. The results also indicated a significant

17Medalla
increase in the availability of these features in 2011 compared with 2010. This was especially remarkable in “electronic payment on customs duties/taxes”, where the yes/no response greatly improved to 29/2 in 2011 from 9/19 in 2010.
l There was also some degree of satisfaction in most imports and customs services. However, most dissatisfaction was registered in “inspection and release of goods”, “customs valuation”, and “tariff classification”, which are key elements of customs and import services.Nevertheless, the benefits, while substantial, were still severely limited by
unresolved issues in the relationship between the BOC, NSW, and the value-added service providers (VASPs). In particular, the link between the e2m process of the BOC and the NSW has yet to be established.
Lessons learned from the Philippine experienceThe basic approach taken by the Philippines is to have two independent but integrated systems (i.e., NSW and e2m customs) working simultaneously and exchanging information electronically. This made embarking on the NSW program more feasible and doable for the Philippines. This could be a model for other countries facing difficulties in launching their own NSW systems. At the same time, a potential problem in this approach is that it could later on become a major stumbling block toward full and more efficient implementation of the NSW. Such problem is becoming more apparent in the latter stages of the NSW implementation, where migration to a full-blown single window is hampered by rigidities in transition (e.g., transfer of database, software IPRs). Hopefully, a critical mass in NSW utilization and demonstration effects of a working system will eventually resolve remaining issues of coordination and linkages within the whole NSW system.
The underlying problem is also manifested in the problems encountered in the green lane system of the BOC, wherein imports that do not require import licenses and permits should be able to pass through without inspection, except in cases where random checks are applied. There are anecdotal reports that some importers would rather “pay” to be excluded in the green lane as the resulting “random” checks could be more costly. They would prefer the predictable inspection system. The green lane system is hampered by lack of coordination, information, and an efficient risk management system.
Based on responses from both the government questionnaire and firm survey, import declaration is now filed electronically, while export declaration is still done manually. It appears that export declaration was not prioritized in the customs modernization and NSW reforms. This might have been an oversight, as

18 PhiliPPine Journal of DeveloPment 2012
trade facilitation is not just for importers. A major objective in joining regional partnerships is to enable exporters to take advantage of the bigger regional market. Hopefully, the targeted inclusion of exports will push through sooner than later.
Ways forwardThe ideal scenario is for customs and related processes and stages to be fully automated. After the lodgment of import or export entry, several processes are involved (including verification of manifest, valuation, and processing of permit or certificate requirements), after which payment of duties can be made. Then, the customs clearance is sent to the port operator/contractor and port authority, and the cargo is finally released.
As noted above, there are still large gaps in many important areas, notably, in export declaration, support documentations (packing list, bill of lading, manifest, airway bill, invoice), and inspection and release of goods
In bridging this gap, there is a key role for an efficient risk management system. Such a system will spare legitimate exporters and importers from undue procedures and potential harassment. An improved system of selection for inspection will have a large impact on speeding up the process, limiting corruption, and limiting transaction costs in general. A major requirement in establishing such a system will be access to necessary information. This means that key offices of the BOC (e.g., the assessment and operations office, and the information technology [IT] department) should coordinate and provide the necessary inputs to the risk management system. It is important for the risk management department to develop not just the software but a good data warehouse, directly linked to key departments of the BOC, particularly its Assessment and Operation and IT departments. This office should also be directly under the commissioner’s office, for transparency and accountability.
Even in the most advanced systems, certain segments (including technical difficulties) still require some interruption in automation. This can arise, especially, in problems related to classification, valuation, and inspection procedures. Again, an efficient risk management system integrated in e-customs and NSW will help minimize such interruption.
In addition to improving and strengthening the risk management system that links directly with the information and database of the NSW and BOC, more needs to be done in the following areas to implement a seamless and sustainable NSW, which were also identified in the ERIA Scorecard project.(i) The automation and harmonization efforts of some OGAs well ahead or at
the same time as the NSW initiative, should merge with the implementation of the NSW. The experience of these OGAs (e.g., first wave of customs modernization efforts, DTI’s one-stop shop export documentation center,

19Medalla
or PEZA’s electronic permit and AEDS) which had combined the use of information and communications technology (ICT) and implementation of business process reforms, can serve as benchmark of good practices. However, it is crucial to have systems compatibility and avoid duplicate or multiple lodging of trade-related transactions which defeats the very purpose of the NSW. Follow-up technical consultations in terms of the procedure and specific data requirements or forms of agencies (e.g., DTI’s conditional release) may be considered in the NSW enhancement.
(ii) While other agencies have achieved modernization and computerization, some are still lagging behind. As the success of the NSW relies on the speed of the slowest agency involved, government funds must be allocated to the agencies lacking physical infrastructure as well as technical staff.
(iii) The step-by-step procedure in the use of the NSW must be disseminated to all concerned stakeholders in the soonest possible time. The agencies involved or at least the members of the NSW Steering Committee should immediately issue joint implementing rules and regulations. Posting of implementing rules must be done electronically and physically. Furthermore, each agency must disseminate agency-specific information (through frequently asked questions or FAQs and changes of procedures, if any) to all potential users.
(iv) While the Philippines’ centralized funding of the NSW assures implementation of this project for its first two years of implementation, the succeeding plans to sustain the project are unclear, particularly among OGAs. The government needs to address this sustainability issue.
(v) Ownership and leadership is the key to successful implementation of the Philippine government’s NSW program. The plan must be more than just beating the deadline for implementation of the NSW and toward long-term and serious reforms in business processes and change management. The NSW project must be implemented as part of good governance and not a mere ICT project.
(vi) In addition, the e2m process of the BOC is not yet electronically linked to the NSW. This represents a significant hurdle that needs to be overcome.
(vii) The NSW system or any trade facilitation initiative should be adaptable to changes in legislation and developments. Effective implementation of trade facilitation initiatives and other pipeline measures must also be supported and implemented. This includes legislation to comply with the country’s commitment to the Revised Kyoto Conventions, updating of some protocols for imports in some commodities, immediate implementation of the Customs Transit System or multipurpose declaration within Clark to Subic, and provision of modern facilities and port laboratories for testing and adequate technical staff. At the very least, well-informed help-desk officers in the
20 PhiliPPine Journal of DeveloPment 2012
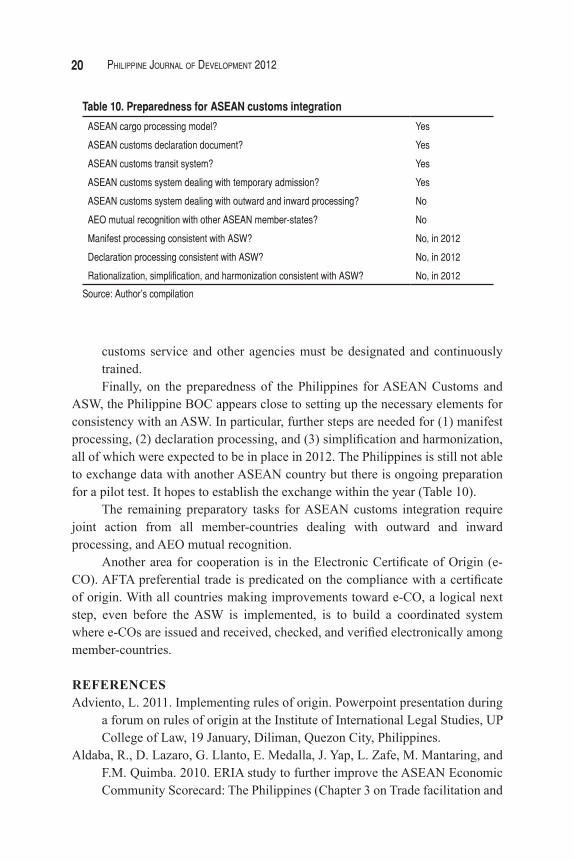
customs service and other agencies must be designated and continuously trained. Finally, on the preparedness of the Philippines for ASEAN Customs and
ASW, the Philippine BOC appears close to setting up the necessary elements for consistency with an ASW. In particular, further steps are needed for (1) manifest processing, (2) declaration processing, and (3) simplification and harmonization, all of which were expected to be in place in 2012. The Philippines is still not able to exchange data with another ASEAN country but there is ongoing preparation for a pilot test. It hopes to establish the exchange within the year (Table 10).
The remaining preparatory tasks for ASEAN customs integration require joint action from all member-countries dealing with outward and inward processing, and AEO mutual recognition.
Another area for cooperation is in the Electronic Certificate of Origin (e-CO). AFTA preferential trade is predicated on the compliance with a certificate of origin. With all countries making improvements toward e-CO, a logical next step, even before the ASW is implemented, is to build a coordinated system where e-COs are issued and received, checked, and verified electronically among member-countries.
REFERENCESAdviento, L. 2011. Implementing rules of origin. Powerpoint presentation during
a forum on rules of origin at the Institute of International Legal Studies, UP College of Law, 19 January, Diliman, Quezon City, Philippines.
Aldaba, R., D. Lazaro, G. Llanto, E. Medalla, J. Yap, L. Zafe, M. Mantaring, and F.M. Quimba. 2010. ERIA study to further improve the ASEAN Economic Community Scorecard: The Philippines (Chapter 3 on Trade facilitation and
Table 10. Preparedness for ASEAN customs integration
ASEAN cargo processing model? Yes
ASEAN customs declaration document? Yes
ASEAN customs transit system? Yes
ASEAN customs system dealing with temporary admission? Yes
ASEAN customs system dealing with outward and inward processing? No
AEO mutual recognition with other ASEAN member-states? No
Manifest processing consistent with ASW? No, in 2012
Declaration processing consistent with ASW? No, in 2012
Rationalization, simplification, and harmonization consistent with ASW? No, in 2012
Source: Author’s compilation

21Medalla
national single window: The Philippine experience). PIDS Discussion Paper No. 2010-24. Makati City: Philippine Institute for Development Studies.
Asian Development Bank (ADB). 2009. Key indicators for Asia and the Pacific. Manila: ADB.
Bureau of Customs (BOC). 2010. Unpublished write-up on the national single window. Manila: BOC.
Clarete, R. and A. Brucal. 2007. Proceedings of the Orientation and Workshop for the Philippine National Single Window. Makati: United States Agency for International Development/Philippines Office of Economic Development and Governance.
Economic Research Institute for ASEAN and East Asia (ERIA). 2012. Philippine Country Report: The Mid-term review of the implementation of the ASEAN Economic Community Blueprint. Unpublished report. Jakarta: ERIA.
———. 2011. Philippine Country Report: Toward a more effective ASEAN Economic Community Scorecard monitoring system and mechanism (ERIA Phase II study). Unpublished report. Jakarta: ERIA.
Maniego, B. 1999. The role of information technology in customs modernization. In Simplification of customs procedures reducing transaction costs for efficiency, integrity, and trade facilitation. Asia-Europe Meeting on Simplification and Harmonization of Customs Procedures. Manila: Asian Development Bank.
Medalla, E.M. 2002. Trade and industrial policy beyond 2000: An assessment of the Philippine economy. In The Philippines beyond 2000: An economic assessment, edited by J. Yap. Makati City: Philippine Institute for Development Studies.
Parayno, G. 2004. Philippines. In Customs modernization initiatives: Case studies, edited by L. de Wulf and J.B. Sokol. Washington, D.C.: World Bank.
Pasadilla, G. 2009. Philippine case study. In Nontariff measures: Evidence from selected developing countries and future research agenda. New York and Geneva: United Nations Conference on Trade and Development.
Philippine Tariff Commission. 2011. MFN tariff structure [online]. http://www .tariffcommission.gov.ph/MFN Tariff Structure 2010.pdf (accessed January 2011).
United Nations Economic and Social Commission for Asia and the Pacific (UNESCAP). 2011. Statistical yearbook of Asia and the Pacific. Bangkok: UNESCAP.
Yap, J.T. and Associates. 2012. Ex-post evaluation of free trade agreements: The Philippine perspective. Unpublished report submitted to EU Trade Related Technical Assistance Project.