Managing Risk Within the HTS
27
Managing Risk Within the Highway Transportation System HED 302s – Driver Task Analysis Dale O. Ritzel, Ph.D., FAASE
Transcript of Managing Risk Within the HTS

Managing Risk Within the Highway Transportation
System
HED 302s – Driver Task AnalysisDale O. Ritzel, Ph.D., FAASE

Managing Risk Within the HTS
• Risk/Threat/Hazard
• Risk Management
• Assessing Probability,
Manageability, and Consequences

Managing Visibility, Time and Space with Attention to Traction (Adhesion)
Overview• Characteristics of Risk• Judgment Functions• Kinds of Judgments Required of Users • Factors Influencing Judgment.• Dynamic and Static Judgments• Predicting the Actions of Other Users• Evaluating Objects and Conditions

RISKThe Chance of Injury, Damage, or LossThe Chance of Injury, Damage, or Loss• Questions:
– How might a crash occur?– How great is the chance that an undesired
event might occur?
• Factors for Evaluation:– The probability of a dangerous event occurring– The opportunity to manage a dangerous event if it should
occur.– The consequence of alternative actions
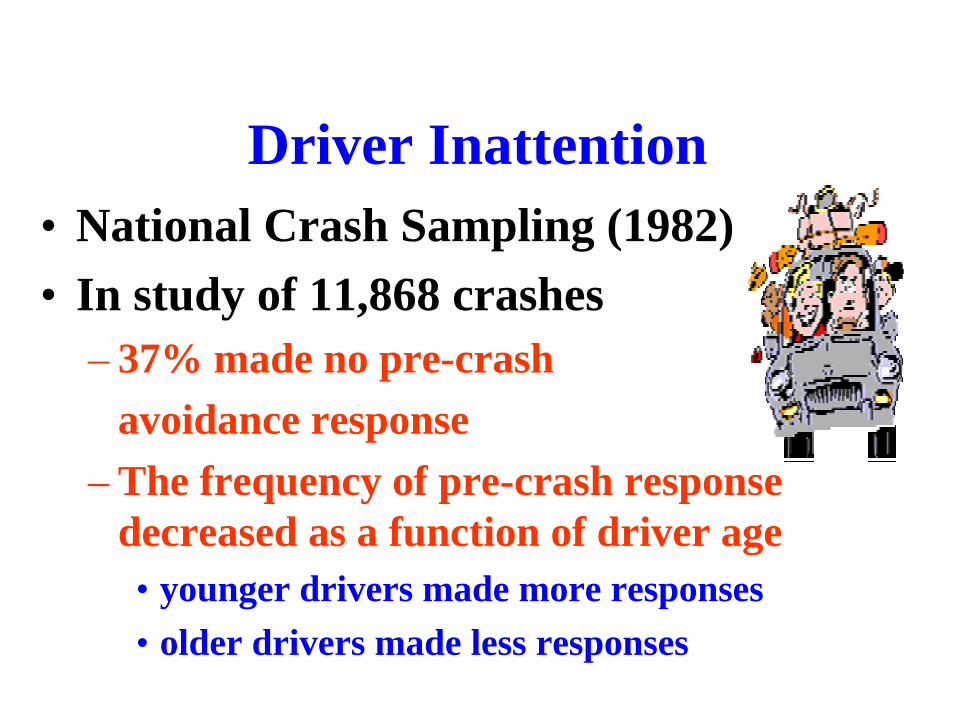
Driver Inattention• National Crash Sampling (1982)• In study of 11,868 crashes
– 37% made no pre-crash avoidance response
– The frequency of pre-crash response decreased as a function of driver age• younger drivers made more responses• older drivers made less responses

Public Perceptions on RiskPERCEPTION OF RISK
LIKELIHOOD OF CRASH N %
1 IN 5 169 10.9
1 IN 10 183 12.2
1 IN 50 201 13.4
1 IN 100 247 16.5
1 IN 500 173 11.5
1 IN 1000 456 30.4
Don’t Know 77 5.177% have no idea of the level of risk when drivingUnless a driver perceives highway driving as a high risk
activity, it is difficult to motivate any change in behavior

Perception of ControlAmount of Control N % Perceived over the Crash– Almost Total Control 561 37.4– A Lot of Control 678 45.2– Some Control 277 15.1– Very Little Control 26 1.7
83% Think They Have
Control
When drivers feel they have a lot of control in preventing collisions, it follows that they neither see themselves at risk nor see a need to follow safety precautions. 83% of the drivers above see themselves at minimal risk in a collision.
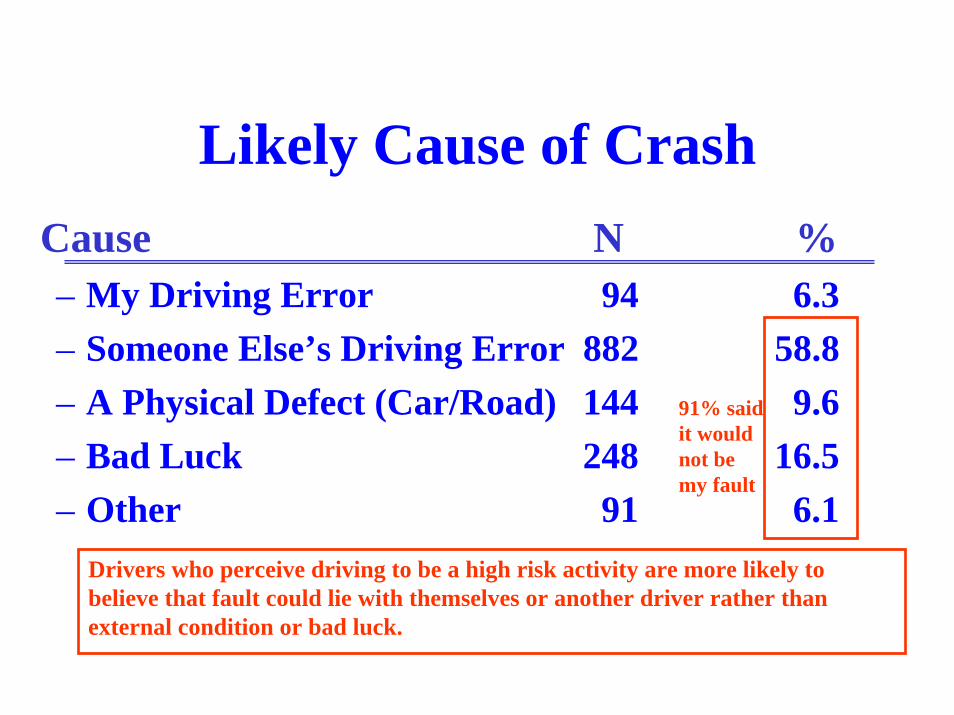
Likely Cause of CrashCause N %– My Driving Error 94 6.3– Someone Else’s Driving Error 882 58.8– A Physical Defect (Car/Road) 144 9.6– Bad Luck 248 16.5– Other 91 6.1
91% said it would not be my fault
Drivers who perceive driving to be a high risk activity are more likely to believe that fault could lie with themselves or another driver rather than external condition or bad luck.

Assessing Risk
PROBABILITY
MANAGEABILITY
CONSEQUENCES
Characteristics of Risk
• Always present• Perceived risk differs
from actual risk• Shared• Can be altered• Can be analyzed on a comparative basis

Reduced Risk BehaviorRisk is Reduced When
– The Probability Of A Dangerous Event Is Reduced
– The Individual’s Ability or Opportunity To Manage Or Cope With A Dangerous Event Is Increased
– The Consequences Of A Crash Or Undesired Result Are Reduced

Judgment
To Perceive Risk– Judgment of Spatial Relationships
– Estimation of Speed and Time Intervals
– Evaluation of Roadway Conditions
– Prediction of Other User Actions
– Evaluation of Risk

Kinds of Judgments Required of Users
• Visibility• Time• Space• Traction (adhesion)• Movement

Risk Management
Preparatory Response Requires– Increasing Response Time
• Vehicle Placement• Speed Adjustment
– Increased Vehicle Control• Vehicle Placement• Speed Adjustment

Level Of Risk
• Separating Elements Important• The Level of Risk Depends On
– Number of Elements– Quality of Elements
• Combinations Influence Level Of Risk– Probability Can Change– Manageability Can Change– Consequences Can Change
• Can Be Altered By Adjusting To– Highway– Traffic Controls– Motor Vehicles/Drivers– Non-motorized Users

Predicting and Influencing the Actions of Other HTS Users
• Pedestrians• Bicyclists• Motorcyclists• Animals
– Domestic– Wild
• Motor Vehicle Operators– Youth– Aging Population– Heavy Equipment– Special Vehicles

Factors Affecting Judgment
• Law of Learning– Recency– Level of Training– Use of Techniques
• Transfer of Learning– Knowledge to Vehicle Control– Vehicle Differences– Environments

Factors Affecting Judgment• Sensory Modalities
– Auditory– Olfactory– Kinesthetic– Visual– Tactile
• Motivation– Attitudes– Emotions– Needs
Factors Affecting Judgment• Level of Awareness
– Fatigue• Mental• Physical
– Physical Wellness• Temporary• Permanent
• Drugs– Alcohol– Prescription– Over-the- Counter– Illegal/Illicit

Dynamic/Static Judgments
• Visibility• Traction/Adhesion• Time needs – time available• Crash avoidance/selection

Reduced-Risk Driving
• Collecting and Selecting Data
• Interpreting Probability
• Developing Manageable Options
• Determining Consequences

Evaluating Objects and Conditions
• Weather• Illumination• Vehicle condition – own and others• Vehicles – types and density• Highway – type, condition, and
maintenance

Reducing The Probability• Direct Influence
Manipulative CompetenceMaximizing VisibilityVehicle Performance
• Indirect InfluenceSignaling Use of HornObeying Laws Doing the ExpectedSmooth Vehicle Operation Using Headlights AlwaysMaking Eye Contact Using FlashersAvoiding Blind Spots Reducing Time Involvement

Communication Tools
Turn Signals Lane Changer
Hand Signals Headlights
Brake Lights Horn
Flashers Warning Triangles

Controlling Consequences• Avoid Head On Collisions
• Drive Off Road Rather Than Skid Off Road
• Hit Something Soft Before Something Hard
• Hit Something Going Your Way Rather Than Stationary

Controlling Consequences
• Hit Stationary Object With Glancing Blow
• Hit a Stationary Object Rather Than An
Approaching Object
• Steer to Avoid Approaching Traffic Flow

Assignment
• Prepare a 2-3 page paper on one of the following as they influence decision making and control of one’s vehicle– Inclement weather, level of illumination, driver
condition, traffic density, highway type, highway maintenance.
– Characteristics of pedestrians that underlie the differential crash, injury, fatality rate of various age groups with attention to time of occurrence, gender and activity.