
Managing Public Investment Funds: Best Practices and New ...
50
Managing Public Investment Funds: Best Practices and New Questions Olivia S. Mitchell, John Piggott, and Cagri Kumru* July 30, 2008 Abstract Large publicly-held pools of assets are playing an increasingly prominent role in the global investment arena. We compare three distinct forms of such public funds, namely foreign exchange reserve funds, sovereign wealth funds, and public pension funds, to highlight their differences and similarities. We review previous studies on ways to better secure prudent and economically sound public fund management practices in these funds, as well as how to evaluate their governance and investment policies and how to better protect the assets from political interference. Drawing from the pension and corporate finance literature, we also link their management to governance practices and country-specific characteristics, and contrast those with empirical findings on linkages with corporate governance. *Mitchell is a Research Associate at the NBER and International Foundation of Employee Benefit Plans Professor of Insurance and Risk Management, and Executive Director of the Pension Research Council, at the Wharton School of the University of Pennsylvania. Piggott is Professor of Economics and Director of the Australian Institute for Population Ageing Research, University of New South Wales. Kumru is Post-doctoral Fellow, Australian School for Business, University of New South Wales. Funding for this research was provided by the Economic and Social Research Institute, Cabinet Level-Government of Japan, the Pension Research Council, and the Australian Research Council. We are grateful to Eric Hou for his research assistance and for comments from Hideaki Tanaka, Yoshibumi Aso, Junichi Sakamato and participants at the 2008 ESRI meetings. Opinions expressed herein are those of the authors alone, and not those of any institution with which the authors are affiliated. ©2008 Mitchell, Piggott and Kumru. All Rights Reserved.
-
Upload
trinhnguyet -
Category
Documents
-
view
221 -
download
1
Transcript of Managing Public Investment Funds: Best Practices and New ...

Managing Public Investment Funds:
Best Practices and New Questions
Olivia S. Mitchell, John Piggott, and Cagri Kumru*
July 30, 2008
Abstract
Large publicly-held pools of assets are playing an increasingly prominent role in the global investment arena. We compare three distinct forms of such public funds, namely foreign exchange reserve funds, sovereign wealth funds, and public pension funds, to highlight their differences and similarities. We review previous studies on ways to better secure prudent and economically sound public fund management practices in these funds, as well as how to evaluate their governance and investment policies and how to better protect the assets from political interference. Drawing from the pension and corporate finance literature, we also link their management to governance practices and country-specific characteristics, and contrast those with empirical findings on linkages with corporate governance.
*Mitchell is a Research Associate at the NBER and International Foundation of Employee Benefit Plans Professor of Insurance and Risk Management, and Executive Director of the Pension Research Council, at the Wharton School of the University of Pennsylvania. Piggott is Professor of Economics and Director of the Australian Institute for Population Ageing Research, University of New South Wales. Kumru is Post-doctoral Fellow, Australian School for Business, University of New South Wales. Funding for this research was provided by the Economic and Social Research Institute, Cabinet Level-Government of Japan, the Pension Research Council, and the Australian Research Council. We are grateful to Eric Hou for his research assistance and for comments from Hideaki Tanaka, Yoshibumi Aso, Junichi Sakamato and participants at the 2008 ESRI meetings. Opinions expressed herein are those of the authors alone, and not those of any institution with which the authors are affiliated. ©2008 Mitchell, Piggott and Kumru. All Rights Reserved.
1
Managing Public Investment Funds: Best Practices and New Questions
Olivia S. Mitchell, John Piggott, and Cagri Kumru
Governments everywhere are amassing large pools of resources held by and managed for the
public sector. The media calls these asset pools variously “future funds,” “sovereign wealth funds,”
and “government investment funds,” and these entities afford their sponsoring nations both
opportunities and risks depending on how these national endowments are managed. As these
publicly-held wealth funds grow, they are assuming an increasingly prominent role in news-making
international investments, including providing support to some of the world’s most important and
often-troubled financial institutions (Scheherazade and Blitz 2007). Analysts regularly comment on
the size and potential international clout of these financial behemoths (Morgan Stanley Global
2007), and some of the investment choices made by these funds have prompted policymakers
including the governments of France and Germany to worry publicly about the potential economic
impact of these funds’ global reach (Economist 2008). In parallel, international agencies including
the OECD and the International Monetary Fund have begun to ask questions publicly about what
these funds are and how they should be managed.1
Our paper analyzes new information about ‘best practice’ management techniques for such
publicly-managed investment pools, focusing particularly on governance and reporting patterns
along with how one might seek to protect the assets from political interference. We do so to glean
lessons on which governance and accountability approaches appear to be well suited in the case of
these publicly-held wealth funds, and we also draw out policy inferences regarding governance
reform. We show that these publicly-managed investment funds have many different historical
roots, including a purposeful buildup of fiscal surplus against future economic shocks (e.g. 1 See also Musalem and Palacios (2004).
2
Australia, New Zealand); a focused effort to mitigate the effects of demographic disequilibrium on
the social security balance (e.g., Japan); or a desire to set aside some portion of revenue associated
with the exploitation of natural resources (e.g. Norway). In value terms, the Japanese public
pension reserve is among the largest, with some US$912 billion in accumulated funds (Matsui and
Suzuki 2007). Other large funds include that of the United Arab Emirates (US$875B), Singapore’s
GIC fund ($330B), and Norway’s Pension Fund (US$300B); see the Economist (2007).
In what follows, we take up several questions of key importance to public investment funds.
First, we ask what constitutes “good management practice,” by which we mean the protocols and
practices regarding fund governance, accountability, and investment policies (below we outline
what we mean by each of these). Second, we ask how good management of public investment funds
affects fund performance. In order to do so, it is necessary to evaluate what types of performance
metrics exist and whether they might depend on the type of fund. We also review the literature
regarding the effect of management practice on performance of public investment funds. Third, we
explore whether good management practices for public investment funds for governance,
accountability, and investment policies appears to be linked to key aspects of a nation’s economic,
political, and social conditions. In particular, we evaluate the association between a nation’s
publicly-run asset pools and its management practices, economic environment, political/legal
structure, and practice regarding transparency/ reporting/accountability. We also assess whether the
size of future calls on resources, measured here by the aged dependency ratio, influences
management practices. As nations become aware of promises made in the form of aged-care
benefits, and as financial market upheaval provides these public investment pools with new
opportunities and challenges, there will surely be stronger calls for better public fund investment
performance.

3
The Nature and Variety of Public Investment Pools
In this paper we refer to public investment funds as those investible assets under the control
of the public sector. In practice, these take three main forms: foreign exchange reserve funds held
for stabilization purposes; sovereign wealth funds accumulated from natural resource taxes or fiscal
surpluses; and public pension funds built up either through an explicit funded arrangement or the
result of an excess of contributions over benefits during a demographic transition.
From the perspective of investment discretion, we place currency stabilization funds at one
end of the spectrum. These assets must be liquid and are usually held in the form of short term
paper or commodities. Moving along the spectrum, sovereign wealth funds (SWFs) are government
investment vehicles that manage their assets separately from official foreign exchange reserves. As
a rule, their assets tend to be invested internationally, though sometimes they have been used for
domestic investments (e.g. infrastructure). Some analysts are quite specific in what they refer to as
SWFs: for example, Jen (2007) specifies that the pool must be managed by a government
(sovereign entity); it must have high foreign currency exposure; it must have no explicit liabilities;
it must have high risk tolerance; and it must have a long investment horizon. In what follows, we
take a broader view in encompassing investible publicly managed funds more generally.
A third type of publicly managed money consists of reserves built up for public pension
purposes. Due to their long term nature of their liabilities, these funds are typically less constrained
by the need for immediate liquidity. Nevertheless, also because of their liability profile, the asset
allocations in these funds are often weighted toward domestic currency assets as this is the currency
of the pension promises. In particular, public pension funds are often concentrated in government
bonds as a result of explicit policy or institutional tradition. For instance, the US Social Security

4
Trust Fund of almost US$2 trillion is held entirely in special-issue nonnegotiable US government
bonds.
Of the three types of public investment funds, sovereign wealth funds seem to be growing
most rapidly and have been permitted the greatest investment flexibility. Some SWFs were
established to manage the intertemporal allocation of resources generated by the discovery and
exploitation of a non-renewable natural resource, while others were set up to absorb government
fiscal surpluses expected to be spent in the future. One way or another, both pension funds and
SWFs have an inter-temporal or even an intergenerational dimension in their objectives. We explore
the form and function of each, in what follows.
Currency Stabilization Funds. Though currency stabilization funds are not the central focus of the
present paper, it is worth noting that they are the largest of the three categories of public investment
funds. Available estimates place the total at around US$4.5 trillion (see Table 1). These have been
rationalized by perhaps the oldest and most conventional explanation for government-held funds,
namely the central monetary authority’s desire to smooth currency fluctuations. In practice, it is
often stated that three months’ of reserves is a prudent cushion for exchange rate shocks (Rietveld
and Pringle 2007). In point of fact, many nations hold far more than the minimum level of assets
required to manage currency stabilization, giving rise to more aggressive investments via sovereign
wealth funds. For example, in China, Russia, and Singapore, SWFs are responsible for both foreign
exchange reserves and fiscal surpluses. An important stimulus behind the recent growth in SWFs
has been the rising central bank reserves in rapidly growing countries such as South Korea and
Taiwan. Official reserves in such funds have expanded at US$600 billion per year over the past
half-decade (Patelis 2007), and reserves held for currency stabilization are expected to rise in the
5
future. Nevertheless, as our present concern is with asset pools held for the long run, we do not
further consider stabilization pools below.
Table 1 here
Sovereign Wealth Funds. Despite substantial media and policymaker interest in SWFs of late,
their precise magnitude is unknown for reasons to be discussed below. One estimate suggests they
hold between US$1.5-$3.1 trillion (Kern 2007; Patelis 2007). Truman (2007a,b) identifies around
two dozen SWFs which he contends control around US$2 trillion in assets; he also separately lists
foreign exchange reserves held by governments totalling about US$4 trillion and he includes
Japan’s approximately US$800 billion pension fund. Conservative estimates from Watson Wyatt
(2006, 2007) suggest that SWFs and public pensions together hold about US$4 trillion. Figure 1
provides a comparison of assets held by both public and private funds, and it indicates that currency
stabilization and pension funds are far larger than SWFs, while SWFs in turn are larger than hedge
funds in the global capital market.
Figure 1 here
Many of the early SWFs were set up in countries holding natural resources (e.g. petroleum)
which then became exposed to unpredictable revenues due to commodity price volatility. As an
example, if a country's oil revenue represented 20 percent of its gross domestic product, then a one
standard deviation shock to oil prices would create a revenue decrease equivalent to six percent of
GDP (Hausmann and Rigobon, cited in Devlin and Titman 2004). Chile’s Economic and Social
Stabilization Fund and the Venezuela Macroeconomic Stabilization Fund are examples of
stabilization funds designed to offset such commodity price fluctuations. One way that governments
might seek to handle commodity price risk could be to transfer risk to international capital markets
so as to smooth economic performance over the relatively short term (Arrau and Claessens 1992).

6
But the thinness of international insurance markets and apparent borrowing constraints are believed
to make self-insurance a more natural choice for oil-producers to protect themselves against such
price volatility. Indeed, self-insurance is recommended by Shabsigh and Ilahi (2007) who contend
that the benefits from public expenditures on lumpy investments when oil prices are high exceed the
costs of shutting them down when oil prices are low. Commodity-exporting countries may self-
insure against volatile commodity prices either by diversifying their export structure or
accumulating financial assets. Since diversifying export structure requires long-term structural
reform and may reduce comparative advantage, financial asset accumulation can be a better choice
given available alternatives.2
There is some controversy about the economic rationale for such stabilization funds. For
instance Davis et al. (2001) find that fiscal stabilization funds may be less efficient than sound fiscal
policy in protecting against commodity price volatility. On the other hand, Shabsigh and Ilahi
(2007) analyze the effects of stabilization funds not only in terms of fiscal but also in terms of
macroeconomic stability. The latter study concludes that inflation and price volatility prove to be
lower when countries keep stabilization funds, and it weakly supports the proposition that
commodity funds could be useful macroeconomic stabilizers. On the whole, the economics
literature suggests that commodity funds will be small when motivated by commodity price
fluctuations, since larger funds distort the domestic economy and can trigger suspicions about the
fund's activities in international financial markets (Devlin and Titman 2004).
A separate justification for SWFs is that they permit nations to set aside money for future
generations derived from exploiting exhaustible resources today. For instance, the first commodity
SWF was the oil fund established by the Kuwait Government in 1953; shortly thereafter the nation
2 See Arrau and Claessens (1992), Shabsigh and Ilahi (2007), and Fasono (2000) for a more detailed discussion on the necessity of fiscal stabilization funds.

7
of Kiribati established a commodity fund in 1956 in order to manage revenues from phosphate
deposits (Petelis 2007; Truman 2007b). More recent examples include the state of Alaska which has
put 2.5 percent of its oil royalties into its Alaska Fund. This practice is thought to improve
intergenerational equity, smoothing the time path of revenues generated by nonrenewable resources
(Olters 2007).
A theoretical grounding for this conclusion is offered by Gerlagh and Keyzer (2001) who
use a model of a government-run “trust fund" that pays future generations claims for revenues
generated by the natural resource. They construct a simple pure exchange overlapping generations
(OLG) setup with an exhaustible resource. Exhaustibility is the irreversible degeneration of the
resource, while the resource’s “amenity value” refers to the services provided by exploiting it.
Inasmuch as natural resource extraction today reduces the resource’s amenity value tomorrow, a
regulatory mechanism is required to promote intergenerational equity. Agents maximize lifetime
utility by selecting consumption levels of private and public goods, and aggregate welfare is the
summation of individual lifetime utilities. The model considers three alternative regulatory
scenarios. In a first, there is zero extraction preventing the use of natural resources for all
generations, akin to keeping an oil field idle. The second scenario, termed ‘grandfathering,’ leaves
the ownership of the natural resource to the first generation, while future generations pay to mitigate
pollution. This is equivalent to the distribution of all oil or mineral revenues to the first generation.
The third scenario introduces a trust fund which entitles all generations to an equal claim over the
natural resource. The authors consider the trust fund as an independent institution that can ensure
future generations receive their claims; it is like a saving fund to keep some of the revenues
generated by an exhaustible resource for future generations. A comparison of the three scenarios in
terms of social welfare indicates that grandfathering improves efficiency compared to the zero

8
extraction policy, but it favors the first generation over others. By comparison, establishing the trust
fund improves welfare for subsequent generations.
An alternative, though related, model of a SWF fund has been termed a financing fund, built
up when a government has a budget surplus that it wishes to dedicate to investment instead of
current spending. Some argue that this sort of investment pool is more likely to constitute true
“saving,” as compared to a stabilization fund, because the latter tends to be paid for via borrowing
(often implicitly; c.f. Fasono 2000). Of course, such financing funds are often seen as promoting
intergenerational equity and fiscal stability; examples include the Norway Government Pension
Fund-Global (GPFG), the Kuwait General Reserve Fund, and the Timor-Leste Petroleum Fund.
Table 2 provides a listing of the major SWFs and their asset holdings, as well as their stated
objectives and sources assembled from a variety of recent sources.
Table 2 here
There is also much interest regarding SWF investments, a topic of particular salience of late
as key global financial institutions receive massive inflows from important Asian funds including
the Singaporean Government Investment Corporation and the Chinese government investment fund.
One reason these transactions have garnered so much public comment is that public investment
pools have traditionally not revealed much about their holdings or governance structure. Such
nontransparency has been justified on grounds that it preserves investment flexibility and protects
business opportunities, but of course this also means that one cannot obtain much useful
information regarding the majority of SWF funds’ asset allocation patterns. Furthermore, inasmuch
as most SWFs do not acknowledge specific liability profiles, they rarely to finance any specific
time path of benefits or cashflows denominated in domestic currency.
9
How SWF asset managers tend to invest their government-managed pools is difficult to
ascertain. Some information for four of the more transparent funds is reported in Table 3. Here we
see that Norway’s SWF has a 100 percent global portfolio with a roughly 40-60 split between
equities and bonds. New Zealand’s fund holds about half its assets in international equities; it holds
no foreign bonds but has nearly a quarter of its portfolio in “other investments” which may include
domestic real estate. Ireland’s SWF holds nearly 90% of its assets in international securities, mostly
equities. Australia’s very new public investment pool is unique in holding mainly domestic
securities but this is changing as procedures are established for global diversification.
Table 3 here
Sovereign Pension Funds. The third category of government-controlled asset pools we scrutinize
here consists of the reserves held by government-run public pension funds where, in principle at
least, the assets are earmarked for the payment of current and future retiree benefits. These reserves
might be generated through an intentionally-funded pension scheme, or they can alternatively be
built up as ‘transitional’ reserves generated by population aging where contributions from a large
cohort of workers result in a temporary flow of funds in excess of current benefits payouts. A
number of countries have well-funded national pension schemes, and several of them have
accumulated substantial assets associated in their future fund accounts. According to Watson Wyatt
(2007), public pension funds around the world are 1.7 times as large as the total estimated size of
SWFs. Iglesias and Palacios (2000) document most of the publicly-mandated pension funds and the
amount of assets held by these funds as a percentage of GDP. Table 4 lists the major sovereign
pension funds and their asset holdings.
Table 4 here

10
What usually characterizes public pensions is that contributions and payouts tend to be
linked through some implicit or explicit contractual arrangement to pay old-age benefits.3 In such a
circumstance, a public pension fund may build up assets to cover future pension liabilities without
necessarily changing the fundamental tax and benefit structure of a pay-as-you-go (PAYG) system.
Many economists see a pure PAYG system as welfare-reducing, since it tends to decrease an
economy’s capital stock by taxing the young generation with a high propensity to save, so as to pay
retiree pensions to those with a high propensity to consume (Kumru and Thanopoulos 2007). By
contrast, a funded public pension can invest excess contributions for future generations which can
prove useful in the face of demographic aging (Abel 2001). Building up ‘future funds’ in this
context can mitigate the negative welfare effects of a pure PAYG system, though they can also
increase intergenerational inequality in a closed economy by benefiting one cohort over another
(Lucas, 2001; Oshio 2004; Auerbach and Lee, 2008). In other words, saving excess contributions in
a future fund may still be less desirable from a welfare standpoint, to lowering taxes on younger
generations.
Recognizing that public pension pools of assets do exist in many nations, it is of interest to
examine how such schemes invest their assets. Economists look at this issue in various ways. Some
use actuarial or asset liability management (ALM) perspectives to link fund assets and liabilities,
while others employ a general equilibrium framework to consider the effects of an investment
change on the whole economy. For instance, MaCurdy and Shoven (2001) adopt an actuarial
framework to explore the consequences of an asset reallocation from bonds to stocks in the U.S.
Social Security Trust Fund. Specifically they examine whether selling government bonds and
buying corporate stocks would improve the finances of the mainly PAYGO old-age system. The
3 A further distinction in these funds relates to the form of payout. Defined benefit (DB) plans promise a payout defined in terms of salary achieved; defined contribution (DC) arrangements rely on investment performance of accumulated contributions. See United Nations (2007).
11
conclude, using historical return data, that such a reallocation would carry significant risk to
participants (that is, the relocation might yield lower returns than expected). Using a general
equilibrium framework, Abel (2001) analyzes the effects of asset reallocation in Social Security on
the equilibrium equity premium and the equilibrium growth rate of the capital stock. He concludes
that when a national pension fund moves into equities, the expected income of the trust fund will
rise but the welfare consequences are ambiguous.4 Similarly, Bohn (1999; 2002) shows that welfare
effects of the asset reallocation depend largely on the specific pattern of macroeconomic shocks, the
risk characteristics of equities, and individual preferences. In general, it is not assured that
intergenerational equity results from increasing assets held by the public pension.5
Various empirical studies have analyzed publicly-managed pension fund performance and
governance structures (Iglesias and Palacios 2000; Carmichael and Palacios 2003; Mitchell and
Useem 2000), and there are also several empirical studies analyzing the investment performance of
public pension funds (Mitchell and Hsin 1997; Mitchell and Hustead 2000; Mitchell and Smith
1994; Useem and Mitchell 2000). Nonetheless, relatively little has been written on how one might
link public sector pension investments to the specific structure of pension obligations that the funds
face. Table 5 provides a comparison of the asset allocations of four publicly-held pension funds that
do report their data in a public manner. The first two of these, the Canadian and Swedish plans, are
essentially funded add-ons to national social security programs; this drives their relatively heavy
portfolio concentration in foreign equities. The Korean and Japanese funds, by contrast, represent a
4 In a defined-contribution system, the gains from increased pension fund earnings are distributed to retirees. Hence, young individuals start to save less since they expect higher pension benefits in the future. This, in turn, reduces the current capital stock and social welfare. In a defined-benefit system, increased pension fund earnings reduce payroll taxes. In response to increased current income, young individuals increase their savings, and hence, the current capital stock increases (Abel 2001). 5 Some researchers (Barro 1979) view such a “demographic dividend” as the natural result of optimal tax smoothing. Yet the timing is critical: because social security taxes are tied to benefits payable far into the future, these tax collections generate large current financial reserves in the control of the public sector making them potentially at risk for spending on other purposes.

12
demographically-driven temporary accumulation of contributions held mainly in domestic
securities. This latter pattern is consistent with the fact that these funds’ liabilities are also
denominated in domestic currencies though it is unclear whether a formal portfolio optimization
reflecting this aspect of the liability profile has been undertaken. In the case of Japan, publicly-held
pension resources amount to about 30% of GDP, a substantial amount responsive to the rapid aging
of the Japanese population. Yet the fund falls far short of what is needed to pay future liabilities:
KNH system liabilities of 550 trillion yen are several times larger than the government’s old-age
system reserve fund of around 179 trillion yen (Takayama 2006). Also, estimates suggest that the
future shortfall might be substantially reduced through superior investment of these resources.6
Table 5 here
Public Pension Fund Asset/Liability Considerations. Many analysts who work on private-sector
pensions have concluded that some form of asset-liability joint management works best if one links
investment policy and payout promises (c.f. Blake 2006). It is striking, therefore, that the vast
majority of discussions of SWFs as well as publicly-managed pensions are silent about the need to
link portfolio management goals to any particular obligation stream. One recent study by Maurer et
al. (2008) investigates how a tax-sponsored public pension fund might invest pension contributions
to relieve government budgets taking into account the risk and rewards from capital market
diversification. While the analysis is a case study of a German civil servant pension, the more
general contribution of the work is that it explicitly models the pension fund manager’s appetite for
risk and reward.
An outcome of that study is that it provides recommendations for portfolio investments
which control the expected economic costs of providing the promised pensions, while at the same
6 Lu et al. (2007) suggests that a 1 percentage point increase in returns, from 3% to 4%, might bolster by 11 times the system’s reserves in the year 2100.

13
time controlling investment risk. Both the expectation and the Conditional Value-at-Risk of
economic pension costs are simulated using a stochastic simulation process for pension plan assets,
allowing the authors to simultaneously set both the optimal contribution rate and the optimal capital
market allocation. Of key importance is the fact that the plan sponsor may occasionally be forced to
make supplementary contributions, which, as in the real world, brings with it a penalty.
Conversely, the authors also prohibit the public pension from being used as a hedge fund, so excess
assets are withdrawn according to a pre-set rule. In the German case, the authors demonstrate that
the optimal pension fund investment strategy given a 20 percent of salary contribution rate requires
investing the public fund 30 percent equities and 70 percent in bonds.7
Naturally specific portfolio allocations must vary with capital market parameters, but the
general approach is useful in making explicit a public fund manager’s performance objectives when
developing fund investment policies. Furthermore, given the nature of publicly-managed funds,
when managers make their portfolio allocation decisions, the objective function must surely include
intergenerational considerations (Weinberger and Golub 2007).8 Just as in the case of corporate
pensions, this will require developing dynamic multi-period simulation models which take into
account both the risks and returns associated with risky investment including Value-at -Risk
models.9
Good Management Practice in Public Investment Funds
7 Current taxpayers only have to pay regular contributions of 15 percent but the portfolio is invested 43 percent in equities. In this way future generations may benefit from contribution holidays and withdrawals, while providing an acceptable level of risk of supplementary contributions resulting from under-funding. For a related model see Haberman et al. (2000) 8 In the US of late, the question of how to value public pension liabilities has become quite fraught (Pension Research Council 2008), particularly regarding whether these should be ‘marked to market’ using risk-free discount rates. 9 In an interesting extension, Gray (2007) proposes that governments should move to using value at risk for all macroeconomic risks, by building a comprehensive national balance sheet and simulating national assets, liabilities, and contingent claims.

14
The literature on what constitutes good management in public investment funds has thus far
focused primarily on public sector pensions rather than publicly-managed asset pools more
generally. One reason is that, until fairly recently, public pensions were the main form of publicly-
managed funds. For instance, Palacios (2002) estimated that such reserves amounted to around
one-quarter of world GDP, mainly held in the US. Another reason is that there is a paucity of data
on sovereign wealth funds, which we will discuss in greater detail below. In any event, we will
argue in this section that many of the same governance principles apply to all forms of publicly-
managed investment pools (Impavido 2005).
Management practice in the public sector context can be described using three sets of
standards initially proposed by the World Bank: Governance, Accountability, and Investment
practices, referred to here as the GAI scores. Of these three components, governance refers to “the
systems and processes by which [an entity] manages its affairs with the objective of maximizing the
welfare of and resolving the conflicts of interest among its stakeholders” (Carmichael and Palacios
2003:7). Accountability refers to the process by which governance outcomes and decisions are
reported and disclosed to stakeholders. For instance, a public pool invested in this way would
provide access to information about funding shortfalls, conduct publicly-reported audits, and
disclose consultancies and contractual arrangements. Investment practices refer to the process of
developing investment profiles that balance risk and return, taking into account liabilities where
these have been made explicit. Naturally in the case of pension reserves, benefit promises constitute
the liability profile as noted above.
The literature on corporate governance serves as a useful point of departure in framing the
discussion of public fund management, beginning with Jensen and Meckling (1976) and recently
surveyed by Shleifer and Vishny (1997). Generally speaking, the problem is cast in a principal-

15
agent framework where stakeholders must be protected against possible strategic actions by
managers who may act in their own best interest unless they are constrained. Empirical evidence
has demonstrated the key role of good management practices in corporate performance: for
example, Gompers et al. (2003), using a US database of some 1500 firms through the 1990s, shows
that firms with stronger shareholder rights have higher market value, higher profits, and higher sales
growth, as well as lower capital expenditure and fewer corporate acquisitions. In the emerging
market context, Klapper and Love (2004) analyze firm level data across 14 emerging markets and
find that better corporate governance is associated with better operating performance and market
valuation. Importantly in the present context, they also find that governance provisions matter more
in countries having weak legal environments.
In the corporate sector, controls to handle the principal-agent conflict revolve around clarity
of objective, appropriate rules about conflict of interest, clear incentives/accountability for each
player, and disclosure of decisions and performance. By contrast in the public sector, the challenge
is that there is frequently no agreed-on metric by which agents (taxpayers, public sector employees)
can readily measure the long-term performance of the principals acting on their behalf
(policymakers). However if fund manager objectives are clear, corporate-type governance,
accounting, and investment principles can still be applied and will go a long way to providing
adequate information about performance. On the other hand, experience shows that government
involvement in the financial sector is also susceptible to conflicts of interest and therefore, from a
governance perspective, in need of special attention. Such conflicts can arise from the extensive
participation of government in financial systems through its role as regulator and owner of financial
institutions; as a (non-atomistic) market participant and fiduciary agent; and through direct
interventions in the operations of the market.
16
Public Pension Plan Management. To illustrate how good management practices apply to
publicly-managed asset pools, Panel A of Table 6 reports a World Bank-developed checklist for
GAI criteria pertinent to public pension managers (Carmichael and Palacios 2003). The governance
questions are designed to avoid undisclosed conflicts of interest, ensure autonomy from political
intervention, secure staff competence, and in general make the criteria comparable with private
sector rules. The accountability scoresheet focuses on information communication, information
credibility, and process transparency. And the investment criteria focus on potential conflict of
interest issues, along with the dilemmas created by market dominance in particular sectors, or
overall in a country. It is also worth nothing that, though this GAI checklist was developed
specifically for public pension funds, it makes no explicit mention of the public plan’s liability
profile.10
Table 6 here
An alternative set of guidelines devised by the OECD (2005, 2006, and 2007) for pension
managers is also summarized in Panel B of Table 6, reorganized here under our three GAI headings
to emphasize the commonalities and differences. Clearly-defined responsibilities for various
members of management, suitability of personnel, and control over conflict of interest, appear on
both lists, while the OECD offers some useful additional performance benchmarks that do not
appear in the World Bank guidelines. One relates to redress, or what happens when promises made
are not kept. A second pertains to “self-investment,” which the OECD sees as contrary to sensible
diversification of investment risk.11 Thirdly, the OECD explicitly recognizes the importance of a
10 Liabilities are mentioned in the Accountability checklist, in terms of open reporting. 11In the public pension context, “self investment” could be interpreted as purchase of own domestic government bonds. Whereas many countries do require their public pension reserves to be heavily invested in this asset class, it must be questioned when, for instance, Japan’s GPIF recently suffered when the investment quality of national government bonds was downgraded. This may explain recent reports indicating that the Japanese may begin investing some portion of the nation’s reserves as a soon-to-be created sovereign wealth fund (Lewis 2008; Pesek 2008).

17
fund’s liability profile in developing investment strategies and fund objectives. In this sense these
guidelines bring together the purpose and conduct of the fund, more in keeping with the advice
offered in the corporate sector. 12
Sovereign Wealth Fund Management Principles. The need for strong public sector governance
in SWFs arises from the same sources that call for strong corporate governance (Carmichael 2002).
Of particular note is recent research by the Peterson Institute (PI) on public fund management which
proposes a “scoreboard” for comparing management practices of Sovereign Wealth Funds (Truman
2008a, b). This approach identifies four categories of SWF management practice focusing on fund
(1) structure, (2) governance, (3) transparency/accountability, and (4) behavior. The structure and
transparency/accountability categories are further divided into subcategories, such that in total, there
is a total of 33 yes/no questions where either a 1 0.50, or 0.75). Using this formulation the author
ranks SWFs across 31 countries. This tally shows that New Zealand’s Superannuation Fund tops the
list followed by Alaska’s Permanent Fund, while at the bottom are the Abu Dhabi Investment
Authority and Corporation of U.A.E. and the Qatar Investment Authority of Qatar.
This approach offers a useful way to systematize thinking about this relatively new corpus
of public sector activity (a full list of variables and funds by name appears in Appendix I and II).
To elaborate somewhat on how the scoring works, under the heading structure, the rubric identifies
SWF clarity of objective, source of funding, and investment strategy. Topics addressed cover
communication of the fund’s objective, the specification of both sources and uses of funds, whether
there is frequent intervention in source and use (presumably an indicator of multiple or expedient
objectives in fund use), and the fund’s relationship with the broader government budget. Clarity of
12 Alternatively, SWF outcomes could be developed using the proposed voluntary guidelines for private equity firms recently drawn up by The Walker Group (Walker 2007). This group, however, seeks to emphasize communication of decisions and outcomes, rather than to implement decision-making structures or measure suitability of investment outcomes.

18
investment strategy and separation from international reserves are also considered. From these
elements, the picture that emerges has a “good” SWF being the public investment fund that has long
term objectives other than strictly currency stabilization, explicitly or implicitly linked to some
intertemporal allocation and/or distributional objective. Relating this to the elements of good
management we have already identified, structure in the PI terminology encompasses some
elements of governance along with investment strategy. The question of the fund’s objective, and its
scoring, is subject to caveat. This is because most funds examined in the PI study scored positively
on this, but there was no attempt to link the stated objective with any other practice. Therefore the
tally gives credit to a fund that explicitly lists its objectives, but it does not then additionally credit
funds where other aspects of management practice support the stated objective, nor does it penalize
funds where they do not.
In the PI formulation, the second heading, governance, speaks to the independence of the
fund’s investment strategy and the independence of the role of manager in executing investment
strategy. Also under this rubric indicators for the existence of corporate responsibility and ethical
guidelines are included, as well as indicators of whether the policies are publicly announced and
followed. The notion of governance falls somewhat short of what might be expected given the
corporate governance literature. For instance, there is no inquiry about the role of the governing
board, or about the incentives available to operational roles in the organization.
The third major category proposed in the PI index pertains to how the SWF behaves in terms
of transparency/accountability. Matters considered include reporting on activities and performance,
public disclosure of investment portfolios, geographic location of direct investments, specific
investments, currency of investments, and the identity of investment agents. The category also
includes information about audits, regularity, public availability, and independence. The final PI
19
category, behavior, asks about the nature and speed of adjustment of the SWF portfolio, and this is
the least clearly explained. It should be noted that of the 33 PI questions, 14 fall under the
transparency heading, and several of the questions listed under the structure heading could also
plausibly be placed there as well. While this is an important component of overall fund
management, the fact that only five items are included under the governance heading is rather
arbitrary and most likely incomplete.
Below we will use these scoreboard measures as a way to begin to link SWF performance
measures to factors that might drive these outcomes. It must be noted again here that the PI
scoreboard is again silent on the links between management of assets and liabilities, which could be
deleterious to fund performance inasmuch as investment policy is likely to vary depending on the
objectives of the funds. This is generally because most SWFs funds do not explicitly state their
objectives, whereas for public pensions, the benefit streams that consist of the funds’ liabilities can
be (more or less) valued cleanly. Even then, it is often the case that pension system liabilities tend
not to be well-integrated into investment policy.
Do Public Management Practices Affect Performance?
Next we turn to a review of studies seeking to show how public fund management practices
shape key outcomes. Inasmuch as most of the work on management practices focuses on corporate
performance, we begin with an overview of this topic, and then we turn to a discussion of what is
known about management of public sector funds.
Empirical research tying corporate management practices to firm-level outcomes is
extensive. Much of the research through the mid-1990’s is reviewed by Schleifer and Vishny
(1997); since then, additional studies have emerged in response to the 2002 Sarbanes-Oxley Act
20
(SOX) requiring US public companies to institute a range of procedural and structural reforms
intended to enhance stakeholder confidence in the post-Enron era. The range of outcomes addressed
in this literature is vast, including the corporation’s return on assets, market valuation, stock returns,
success at making acquisitions, and Tobin’s Q (or the firm’s market value of assets as a proportion
of the replacement value of its assets), among others.13 The measures of ‘good managerial practice’
used by empirical analysts are several, and include most prominently key metrics of corporate
governance. This, per Schliefer and Vishny (1997: 737), refers to the “ways in which suppliers of
finance to corporations assure themselves of getting a return.” In particular, the literature
emphasizes how investors may gain power through legal protection (e.g. via protection of minority
rights and limits on managerial self-dealing), and also via large investor blocks which control
managerial behavior directly. Accordingly, the literature has found important relationships between
countries’ legal efficacy scores, which indicate whether an enterprise is founded on common or civil
law, and variables indicative of shareholder control rights. Many studies also examine policies
regarding transparency and accountability, on the argument that rules enhancing financial reporting
are likely to result in better protection for the investor.
The literature on public enterprise management builds on this private sector foundation in
seeking to craft indicators of good-quality management and relate them to successful public firm
outcomes. One problem is that public entities often do not conform to private-sector accounting and
reporting standards, and another is that output measures used in the private sector frequently have
no counterpart in the public sector. Nevertheless analysts have found it natural to use for public
sector entities the same principal-agent framework mentioned above and popularized in the
13 For a recent review of the empirical governance literature see Michaud and Magaram (2006); among the most cited studies are Gompers et al. (2003) and Schliefer and Vishny (1997). There are also numerous examinations of the links between good management practices and executive compensation which are beyond the scope of the present study; a recent review includes Gerakos (2007).

21
corporate world. In this context, the taxpayer and other members of the public represent the
principals, while the agents are the government managers guiding the public enterprise (c.f.
Ambachtsheer 2007b; Coronado et al. 2003). Thus in theory it would be feasible to evaluate
whether particular management practices can shape outcomes of public sector enterprises, though
with some adaptations depending on the type of public firm in question.
In the specific case of public entities of key interest here - namely public pension plans and
sovereign wealth funds - the conventional measures of corporate outcomes such as shareholder
wealth, firm profitability, and market share do not readily apply. For this reason, analysts have
turned to other metrics to determine whether public sector enterprise performance is enhanced as a
result of particular management practices. For instance one outcome of interest might be
investment-related. In the simplest case, for instance, public pension funds which hold some assets
can report their target annual return (e.g. 3.2% in the case of the Japanese GPIF). More elaborately
perhaps, some public plan managers may indicate their risk-adjusted returns vis a vis some
benchmark. Relatively few focus on the dynamic path of liabilities as well as assets, about which
we say more below.
The few existing studies linking public pension plan investment strategies and investment
returns tend to show that these are often influenced by governance factors such as board
composition (Mitchell and Hsin 1997). For instance, having more retirees tends to lower
performance due to greater weighting toward a fixed income portfolio. Again in public pensions,
Useem and Mitchell (2000) show that governance variables account for over 20 percent of the
cross-pension plan variation in investment strategies, which in turn are positively associated with
subsequent investment return performance on the pension fund assets. Yang and Mitchell (2008)
examine how pension plans’ funded status (or the ratio of plan assets to liabilities) and investment

22
returns respond to measures of pension board composition, management practice, reporting
practice, and investment practice. They show that many pension boards have political appointees as
well as active and/or retired workers on the roster, both of which can be problematic when these
board members may not be particularly financially expert.
Another issue is that sometimes public entity trustees have used fund assets to further their
own (or their party’s) political/social objectives. Hsin and Mitchell (1997) find that several pension
management factors are statistically significant and economically important. For instance, ceteris
paribus, having more plan participants on the pension board, whether retired or active, reduces plan
funding levels and the point estimates imply that adding an additional active member reduced stock
funding by 0.7 percentage points, while adding one more retired member decreases funding by 1.7
percentage points. Further, investment yields on the public pension plan assets appear significantly
lower when retiree representation increases, perhaps due to lack of investment expertise. Enhanced
pension reporting, including making annual reports on financial, actuarial, statistical, and
investment information to stakeholders, can improve returns by 2.1 percentage points annually.
Research on public pensions and mutual funds by Ambachtsheer (2007a, b) uses as the
dependent variable “net value added” or the fund’s gross investment return minus its benchmark
return and the fund’s total expenses. This outcome proves statistically related to a lengthy list of 45
measures of governance quality obtained by interviewing public fund CEOs. Ambachtsheer (2005:
196-7) reports that of the entire lengthy list of indicators, six governance-related and five
management-related measures in his CEO survey are significant. In that author’s words,
“statistically significant governance statements (are)…related mainly to effective fiduciary behavior
and selection processes, clarity in delegation of authority, and a high level of trust between the
governing and managing fiduciaries. The statistically significant management statements (are)
23
related mainly to clear strategic positioning and to the effective development and execution of the
fund’s strategic plan.”
How Can Fund Objectives Be Incorporated? The studies of public funds mentioned above focus
primarily on asset-related outcomes such as returns and funding patterns.14 Yet as we have argued
above, one should also consider integrating the asset/investment management effort with the
evolution of plan liabilities. For instance, in the case of a public pension system, the goal is
generally agreed to ensure that retiree benefits can be paid without large and unexpected increases
in the cost of maintaining the solvency of the system. Nevertheless, as Ambachtsheer (2005:198)
emphasizes, “fund managers of late have made no measurable effort to take into account the
financial characteristics of their liabilities when structuring their fund policy portfolios.” Indeed, a
reason that managers may have found it difficult to do so is that it may be troublesome to convert
the broad objective of “paying pension benefits” into specific fund management rules and
performance criteria. Sometimes the liability path will be difficult to model and simulate. Or public
pension plan investment policy may be set independently of liability paths on purpose; for instance
this is the case for the US Social Security Trust Fund which is permitted to hold only special issue
government bonds.15 Still an additional reason that asset-liability management is not undertaken in
a concerted, coherent form may be because policymakers may not wish to make explicit what their
risk appetite is in terms of shortfalls and surpluses.
Nevertheless, in the last several decades, great strides have been made in analysts’ ability to
model and solve for ways to implement asset-liability models, and this could be even more useful in
the future. Of course, to select an appropriate investment strategy in the face of these stochastic
14 Insofar as we are aware, there are very few studies that report investment performance for the SWFs that are not pension related, much less risk adjusted or benchmark-linked returns. One of the view reporting public pension returns by country and time period is that of Carmichael and Palacios (2002). 15 For a discussion of investment practices of 15 other publicly-managed pension fund systems see UN (2007).

24
liability patterns, policymakers must make explicit their risk budgets, or how they balance the
unavoidable and dynamic tensions between investment returns, benefit payments, and contribution
requirements. Such risk budgets must take into account both the uncertainty of system revenues,
including investment returns earned on pension fund assets, and stochastic pension liabilities as
discussed above. Recent discussion on these points includes including Moore (2007) and Boender et
al. (2001), the latter of whom implement this approach for Dutch pension funds. Maurer et al.
(2007) examine public sector employee pensions in Germany. In general, these evaluations must
specify how plan outlays will depend on projections of earnings, patterns of labor market
attachment, retirement trends, longevity forecasts, and many other factors.16 In turn, investment
portfolios can be optimized to take liability variations into the decision of how to structure the asset
mix given capital market trends. Other examples of asset-liability management in the public pension
fund arena include the work of Bogentoft et al. (2001) and several of the excellent papers in Ziemba
and Mulvey (2001).
One of the most clearly exposited papers in this vein is by Merton (2001), who implements
this approach in the case of a university endowment fund. His model is relevant to the present
research as it recognizes that such entities draw not only on their endowment pools but may also
count on other cash flows including contributions from donors, tuition and other business income,
and grants. He makes the crucial point that these revenue flows are also volatile and so should be
modeled as part of the plan’s resources. This approach has a logical parallel in the case of public
pension funds and SWFs which may receive contributions from a variety of sources, while they can
also draw down their investment pools to meet specific obligations. Insofar as some of the
16 Other examples of this in the US include efforts by the Congressional Budget Office (CBO 2004) to build a stochastic model to evaluate the impacts of possible changes in the national old-age benefits program. The US Social Security Administration (US SSA 2008) has also developed a stochastic model used to project probability distributions for future outcomes of the system’s financial status.

25
contribution sources have the same risk characteristics as equities, for instance, the entity may
decide to invest less in stock. In its simplest form, the Board’s preference structure for the
university is taken to be a lifetime utility function of the form:
(1) ⎥⎦⎤
⎢⎣⎡∫
∞
0 10 ),,...( dttQQMaxE m
where Qj(t) is the quantity of the preferred activity j (e.g. education, research, etc) in which the firm
engages at time t, and the utility function is well behaved. The entity is assumed to be indefinitely
lived, making the upper limit on the integral infinity. (Other more complex formulations can be
permitted). The remainder of the model specifies cost functions for producing the firm’s outputs,
and dynamics for cash flows for contributions and investment earnings. Over time the university
selects a vector of activities Q, and a portfolio allocation in its endowment fund, to achieve
maximum utility (1). Similarly, a pension fund can also be modeled as seeking to pay benefits,
subject to constraints over revenue, investment patterns, and perhaps some risk aversion regarding
extreme cash shortfalls that would otherwise require massive transfusions of new cash. To the
extent that a university (in Merton’s case) or a pension fund (in our case) faces different risk
profiles for its revenue streams and different cost profiles, this will produce different optimal
investment strategies for the endowment pools.
The important lesson that emerges from these analyses is that good management practice has
a material positive impact on corporate performance, but this cannot yet be shown for publicly-
managed funds in view of the dearth of data on this topic.17 Furthermore, most studies of public
fund management have emphasized only financial or actuarial outcomes such as net returns,
funding, or investment expenses. Only a handful have constructed clearly-formulated models that
17 In Ambachtsheer’s (2005) words, the research is suggestive of “a noteworthy convergence between what are deemed to be generally good governance and management practices in the for-profit and not-for-profit sectors as a whole and what we now find is important in the governance and management of pension funds.”

26
link fund contributions and investments to measures of anticipated future benefits that these funds
seek to deliver. So the challenge is to “determine a jointly optimal dynamic strategy for the asset
and liability instruments which balances the interests and requirements of all agents involved”
(Boender et al. 2001:564). In particular, public fund managers must take into account the ability of
the fund to meet other objectives (e.g. not raising taxes too sharply on any given generation in the
event of a revenue shortfall).
Empirical Analysis of Determinants of Public Investment Fund Management
Next we turn to a brief empirical examination of key factors associated with variation in
observed SWF management attributes. We focus on the measures of governance, accountability,
and investment (GAI) described above and explore what might influence how these asset pools
function along these dimensions. A first implementation step requires us to group the multiplicity of
scores reported on SWFs in the PI scoreboard into our three preferred headings. We do so by
computing the G, A, and I scores by summing the subcomponents for each of the SWFs, and then
we add these to form an aggregate GAI index.18 Next, we link the GAI indicator using multivariate
regression models to factors descriptive of the national environments in which these publicly
managed funds are found, following the empirical strategy outlined in the corporate governance
literature described above. Our particular focus is on indicators of country-specific governance and
political participation, human capital and the business environment, and demographic controls to be
18 Appendix I and II indicate how we reallocate the PI scoreboard items into our three GAI categories. Accountability is quantitatively the most important of the three components, comprising 15 of the 33 questions on the PI list. We omit the PI indicator of whether a SWF is integrated within the overall government budget. In analysis not reported here in detail, we conducted principal components analysis on the entire vector of underlying scores to determine whether any subset of factors is particularly useful in summarizing larger set of analysis. However this exercise does not return a few key factors that explain most of the variability, so we use GAI and its subcomponents as our independent variables. Not surprisingly, Appendix IV shows that the governance, accountability, and investment measures of fund success are strongly positively correlated.

27
described in more detail below. We report OLS regression coefficients for the aggregate GAI scores
using the following framework:
GAI score = f (National governance and political participation indicators; Indicators of human capital and business environment; Demographic controls).
The national governance and political participation variables employed in this formulation
are derived from the World Bank Governance Indicators (WBGI; see Kauffman et al. 2007) which
include six factors relating to different aspects of governance: Voice and Accountability; Political
Stability; Government Effectiveness; Regulatory Quality; Rule of Law, and Control of Corruption.
Country-specific measures of the quality of human capital and the efficacy of the business
environment are taken from World Economic Forum indices of global competitiveness (GCI; see
Sala-i-Martin et al. 2007). The GCI indicators focus on economic performance including
macroeconomic stability, as well as education and business sophistication. To render the many
World Bank and GCI indices more tractable, we use Principal Component Analysis (Hamilton
2006) to combine them into a Modified World Bank Governance Index (MWBGI) and Modified
Global Competitive Index (MGCI). In alternative models, we substitute some of the underlying
factors indicative of the political environment for the overall indexes; these include “Voice and
Accountability” measuring participation in government and freedom of expression, and
“Government Effectiveness” which measures civil service quality. The rationale is that freedom of
expression should enhance all dimensions of the GAI score because of the greater risk of public
exposure for incompetence or fraud. Similarly, high quality public service should be able to deliver
better public sector management. Market efficiency can be proxied by a business sophistication
metric, on the grounds that this would be positively associated with public investment fund
accountability. A nation’s legal environment can be represented by regulatory quality (by which we
mean policies that enhance private sector performance) or rule of law (by which we mean a strong

28
judicial system), following Klapper and Love (2004) and Shleifer and Vishny (1997) who show that
better legal systems help protect shareholder rights.
To this reasonably conventional list of control variables we add a measure of a nation’s old-
age dependency ratio, to test whether the performance indicators are related to intertemporal
objectives even if these are implied rather than explicit. In a few cases, some countries had multiple
SWFs with differing GAI scores. To handle this, we compute an asset-weighted average of the GAI
scores to come up with a single combined fund metric for that country. Also a few small countries
had exceptionally high GAI scores along with very low GCI and Governance scores.19 Inasmuch as
these developing/emerging market funds are probably influenced by international organizations’
views of good fund management practice, we control on the log of SWF assets to reflect this
diversity. Variable definitions and descriptive statistics on our empirical variables are reported in
Appendix III.
The multivariate coefficient estimates for the GAI model appear in Table 7. As there are
only 26 SWFs for which full data are available, we are parsimonious in selecting which explanatory
variables to include. We see that larger funds tend to score lower on the GAI ranking when
statistically significant. We also see that better governance is associated with a higher old-age
dependency ratio in columns 1-3, suggesting that when the elderly grow relatively more numerous,
their voice tends to be reflected in larger economic claims driving better SWF management.
Curiously, however, only the current dependency ratio is statistically significant, while projected
old-age ratios tend not to be.
Turning next to the governance and economic variables, Column 1 indicates that the World
Bank governance index is positive and significant at only the 10% level, while the GCI index is not
significant and negative. Columns 2-4 further explore the relationship between relevant national 19 This list includes Azerbaijan, Botswana, Timor Leste and Trinidad and Tobago.
29
characteristics and the GAI scores, where we see not much statistical association between good
SWF governance and business sophistication, regulatory quality, and rule of law. Only the Voice
and Accountability factor is positively associated with good fund governance.
Table 7 here
Our results thus differ from one recent study on private pension funds by Servaes and
Khorana (2007), who argue that more efficient mutual funds are found in countries with better-
functioning judicial systems and more educated populations. Overall we find little evidence that
national characteristics strongly shape the governance, accountability, and investment structures of
national sovereign wealth funds.
Conclusions
We have examined management practices for publicly-managed asset pools, seeking to draw
lessons about how these institutions might better manage their funds. Our review of the main types
of public investment pools having long-term objectives indicates that pension fund and SWFs share
many commonalities with regard to their objectives and rationales. Nevertheless, empirical
evidence on these outcomes for publicly-managed asset pools is scarce, and what there is tends to
be silent on the structure of liabilities implicitly or explicitly associated with these funds. Building
on prior studies, we devise performance criteria regarding fund governance, accountability, and
investment policies. When we relate these GAI measures for sovereign wealth funds to a range of
national governance and political participation indicators, measures of human capital and business
environment, and demographic controls, we find that the current aged dependency ratio appears to
be a consistently important explanatory factor associated with good management. This suggests that

30
nations subject to the most pressure from population ageing tend to be more careful with SWF
governance.
Policy analysts would benefit from better understanding of what constitutes best practice for
the management of the substantial global reserves held in SWFs and public pensions. To this end,
information is needed linking performance indicators to goals, presumably including good measures
of intertemporal and intergenerational objectives. Unfortunately, as SWFs have grown, they appear
to be demonstrating an increasing risk appetite with little transparency, and virtually no clarity of
objectives. As a result, their growth is spurring debate in recipient countries and among financial
market intermediaries, along with calls for regulatory reform in the international sphere and a move
toward financial protectionism or even the explicit prohibition of SWF investments. For instance,
the European Commission is drafting a plan to prohibit non-European Union members from
investing in the European energy business. German Chancellor Angela Merkel has mentioned
designing a system similar to that implemented in the US where a governmental Committee on
Foreign Investment must review and approve foreign-based investments that might be deemed a
threat to national security (EurActive.com 2007). Such financial protectionism might be avoided if
these publicly-managed investment pools were made more transparent, clearer in their objectives,
and more accountable to the many stakeholders in these funds.

31
References
Abel, Andrew. 2001. “The Social Security and Trust Fund, the Riskless Interest Rate and Capital Accumulation.” Risk Aspects of Investment-based Social Security Reform. Eds. J.Y. Campbell and M. Feldstein. Chicago: The University of Chicago Press: 153- 93
Ambachtsheer, Keith. 2007a. “The Ideal Pension Delivery Organization.” Presented at the Conference on “Exploring the Future of Pension Finance and the Dynamics of Institutional Pension Reform” sponsored by De Nederlandsche Bank, Netspar, and the International Organization for Pension Supervision, March 22-23 2007, Amsterdam.
Ambachtsheer, Keith. 2007b. Pension Revolution: A Solution to the Pensions Crisis. John Wiley & Sons.
Ambachtsheer, Keith. 2005. “Why Pension Fund Management Needs a Paradigm Shift.” In Reinventing the Retirement Paradigm. Eds. Olivia S. Mitchell and Robert L. Clark. Oxford: Oxford University Press: 188-205.
Arrau, P. and S. Claessens. 1992. “Commodity Stabilization Funds.” World Bank Policy Research Working Paper. Washington DC: World Bank.
Auerbach, Alan J. and Ronald Lee. 2008. “Welfare and Generational Equity in Sustainable Unfunded Pension Systems.” Presented at the NBER Summer Institute, Cambridge, MA.
Australia Future Fund. 2008. Annual Report. www.futurefund.gov.au/
Barro, R. J. 1979. “On the Optimal Level of Public Debt.” Journal of Political Economy, 87 (5): 940-971.
Blake, D. 2006. Pension Finance. London: Wiley.
Boender, CGE, PC van Aaslst, and F. Heernserk. 2001. “Modeling and Management of Assets and Liabilities of Pension Plans in The Netherlands.” In Worldwide Asset and Liability Modeling. Eds. William Ziema and John Mulvey. Cambridge: Cambridge University Press: 561-580.
Bogentoft, E., H. E. Romeijn, and S. Uryasev. 2001. “Asset/Liability Management for Pension Funds Using CVaR Constraints.” Journal of Risk Finance 2(3): 57-71.
Bohn, Henning. 2002. “Government Asset and Liability Management in an Era of Vanishing Public Debt” Journal of Money, Credit and Banking 34(3): 887-933.
Bohn, Henning. 1999. “Should the Social Security Trust Fund Hold Equities? An Intergenerational Welfare Analysis.” Review of Economic Dynamics 2: 666-697.
Canada Pension Plan Investment Board. 2008. Annual Report. www.cppib.ca
Carmichael, Jeffrey and Robert J. Palacios. 2003. “Managing Public Pension Funds: A Framework.” Paper presented to 2nd Public Pension Fund Management Conference. World Bank, Washington DC, May 2003.
Congressional Budget Office (CBO). 2004. The Outlook for Social Security. US Congress. June. http://www.cbo.gov/ftpdocs/55xx/doc5530/06-14-SocialSecurity.pdf
32
Coronado, Julia L., Eric M. Engen and Brian Knight. 2003. “Public Funds and Private Capital Markets: The Investment Practices and Performance of State and Local Pension Funds.” National Tax Journal 56(3): 579–94.
Das, U. S. 2007. “Sovereign Wealth Funds.” IMF Global Financial Stability Report: 45-50.
Davis, Jeffery M., Rolando Ossowski, James Daniel, and Steven Barnett. 2001. “Stabilization and Savings Funds for Non-renewable Resources: Experience and Fiscal Policy Implications.” IMF Occasional Paper 205. International Monetary Fund, Washington, D.C.
Devlin, Julia and Sheridan Titman. 2004. “Managing Oil Price Risk in Developing Countries.” World Bank Research Observer 19: 120 - 139.
Economist. 2007. “The World’s Most Expensive Club.” May 26.
Economist. 2008. “The Invasion of the Sovereign Wealth Funds.” January 19.
EurActiv.com. 2007. “EU to Consider Protection from State-funded Foreign Takeovers.” 24 July. www.euractiv.com/en/innovation/eu-consider-protection-state-funded-foreign-takeovers/article-165798?_print
Gerakos, Joseph. 2007. “CEO Pensions: Disclosure, Rent Extraction, and Incentive Contracting.” Pension Research Council Working Paper WP2007-05. The Wharton School.
Gerlagh, Reyer and Michiel A. Keyzer. 2001. “Sustainability and the Intergenerational Distribution of Natural Resource Entitlements.” Journal of Public Economics 79: 315–341
Gompers, Paul A., Joy L. Ishii, and Andrew Metrick.2003. “Corporate Governance and Equity Prices.” Quarterly Journal of Economics 118(1):107-155.
Gray, Dale. (2007). “A New Framework for Risk and Sovereign Wealth Management.” In Sovereign Wealth Management. Eds. J. Johnson-Calari and M. Rietveld. London: Central Banking Publications: 117-138.
Haberman, Steve, Z. Butt, and Ch. Megaloudi. 2000. “Contribution and Solvency Risk in a Defined Benefit Pension Scheme.” Insurance: Mathematics and Economics 27: 237-259.
Hamilton, Lawrence C. 2006. Statistics with Stata (Updated for Version 9). Brooks/Cole.
Hsin, Ping-Lung and Olivia S. Mitchell. 1997. “The Political Economy of Public Pensions: Pension Funding, Governance, and Fiscal Stress.” Revista de Analisis Economico. Eds. P. Arrau & K. Schmidt-Hebbel. 9 (1): 151-168.
Iglesias, Augusto and Robert J. Palacios. 2000. “Managing Public Pension Reserves. Part I: Evidence from the International Experience.” Social Protection Discussion Paper 3. Washington, D.C.: World Bank.
Impavido, Gregorio. 2005. “Governance of Public Pension Plans: The Importance of Residual Claimants.” Working Paper. The World Bank. info.worldbank.org/etools/docs/library/153011/6-Impavido(2004)04-02-13.pdf
India Employees' Provident Fund Organisation. 2008. Annual Report. http://epfindia.nic.in/epfbrief.htm
Ireland National Pension Reserve Fund Commission. 2006. Annual Reports and Financial Statements 2006. www.nprf.ie/Publications/NPRF_Annual_Report_2006.pdf
33
Japan Government Pension Investment Fund. 2008. Annual Report. www.gpif.go.jp/eng/index.html
Jensen, William and Michael Meckling. 1976. “Theory of the Firm: Managerial Behavior, Agency Costs and Ownership Structure.” Journal of Financial Economics.
Kern, S. 2007. SWFs: State Investments on the Rise. Deutsche Bank Research. September.
Klapper, Leora and Inessa Love. 2004. “Corporate Governance, Investor Protection and Performance in Emerging Markets.” Journal of Corporate Finance, November.
Korea National Pension Fund. 2008. Annual Report. www.nps.or.kr
Kumru, C. S. and Athanasios C. Thanopoulos. Forthcoming."Social Security and Self Control Preferences." Journal of Economic Dynamics and Control.
Kuwait International Social Security Review. 1998. “Social Security in Kuwait.” International Social Security Review 51 (2): 57-61.
Lewis, Leo. 2008. “Japan to create £25bn sovereign fund as fears mount on global sub-prime loss.” The Times. January 26. business.timesonline.co.uk/tol/business/industry_sectors/banking_and_finance/article3254209.ece
Lu, Bei, Olivia S. Mitchell, and John Piggott. 2008. “Notional Defined Contribution Pension and Public Reserve Funds in Ageing Economies.” International Social Security Review. Forthcoming.
Lucas, Deborah. 2001. “Investing Public Pensions in the Stock Market: Implications for Risk Sharing, Capital Formation and Public Policy in the Developed and Developing World.”International Review of Finance. 2(3) September: 179-202.
MaCurdy, T. E. and John Shoven. 2001. “Asset Allocation and Risk Allocation: Can Social Security Improve Its Solvency Problem by Investing in Private Securities?” In Risk Aspects of Investment-based Social Security Reform. Eds. J.Y. Campbell and M. Feldstein. Chicago: The University of Chicago Press.
Malaysia Employees' Provident Fund. 2008. Annual Report. www.kwsp.gov.my/index.php?ch=p2corporateinfo&pg=en_p2corporateinfo_geninfo&ac=1856
Matsui, Akira and Makiko Suzuki. “Japan's Public Pension Fund to Invest in Small Stocks.” Bloomberg June 13, 2007. www.bloomberg.com/apps/news?pid=20601101&sid=af16cLNcW3a0&refer=japan#
Maurer, Raimond, Olivia S. Mitchell and Ralph Rogalla. 2008. “The Victory of Hope over Angst? Funding, Asset Allocation, and Risk-Taking in German Public Sector Pension Reform.” In Frontiers in Pension Finance. Eds. D. Broeders, S. Eijffinger, and A. Houben. Cheltenham: Edward Elgar.
Merrill Lynch. 2007. The Overflowing Bathtub, the Running Tap, and SWFs in Global Economy. Merrill Lynch.
Merton, Robert. 2001. “Optimal Investment Strategies for University Endowment Funds.” In Worldwide Asset and Liability Modeling. Eds. William Ziema and John Mulvey. Cambridge: Cambridge University Press: 371-396.
Jen, Steven. 2007. “The Definition of a Sovereign Wealth Fund.” Morgan Stanley. October 26. http://www.morganstanley.com/views/gef/archive/2007/20071026-Fri.html
34
Michaud, Dennis Wright and Magaram, Kate A. 2006. “Recent Technical Papers on Corporate Governance.” April. http://ssrn.com/abstract=895520
Mitchell, Olivia S. and Ping-Lung Hsin. 1997. “Managing Public Sector Pensions.” In Public Policy Toward Pensions, Eds. J. Shoven and S. Schieber. 20th Century Fund. Cambridge, MA: MIT Press: 247-266.
Mitchell, Olivia S. and Ping-Lung Hsin. 1997. ‘Public Sector Pension Governance and Performance.’ In The Economics of Pensions: Principles, Policies and International Experience. Ed. Salvador Valdes Prieto. Cambridge University Press: Cambridge: 92–126.
Mitchell, Olivia S. and Hustead, Edwin.2000. Pensions for the Public Sector. Pension Research Council. Philadelphia, PA: University of Pennsylvania Press.
Mitchell, S. Olivia and Robert Smith. 1994. “Pension Funding in the Public Sector.” Review of Economics and Statistics 76(5): 278–90.
Morgan Stanley Global. 2007. “How Big Could Sovereign Wealth Funds Be By 2015?” May 3.
Moore, James F. 2007. Changing Paradigms in Asset Allocation for Pension Plans. PIMCO.
Musalem, Alberto and Robert Palacios, eds. 2004. Public Pension Fund Management. Washington DC: World Bank.
New Zealand Superannuation Fund. 2008. Annual Report. http://www.nzsuperfund.co.nz
Norges Bank Investment Management. 2006. Government Pension Fund-Global Annual Report 2006. http://www.norges-bank.no/Pages/Report 65332.aspx
OECD. 2005. OECD Guidelines for Pension Fund Governance.
OECD. 2006. OECD Guidelines on Pension Fund Asset Management.
OECD. 2007. Pension Markets in Focus. November (4).
Olters, Jan-Peter. 2007. “Old Cures, New Approaches? Fiscal Benchmarks for Oil Producing Countries in Sub-Saharan Africa.” IMF Working Paper.
Oshio, Takashi. 2004. “Social Security and Trust Fund Management.” Journal of the Japanese and International Economies, 18 (4): 528–550.
Palacios, Robert. 2002. “Managing Public Pension Reserves part II: Lessons from Five Recent OECD initiatives.” Social Protection Discussion Paper Series, Social Protection Discussion Paper no. 0219, World Bank. www.worldbank.org/sp.
Patelis, A. 2007. “The Overflowing Bathtub, the Running Tap and SWFs.” Merrill Lynch Global Economics.
Pension Research Council. 2008. “The Future of Public Employee Retirement Systems.” Working Paper 2008-08, Wharton School. http://www.pensionresearchcouncil.org/publications/document.php?file=434
Pesek, William. 2008. “Japan's Economy Needs a Sovereign Wealth Fund.” Bloomberg.com. January 28. www.bloomberg.com/apps/news?pid=20601039&sid=aAODASRjKLA8&refer=home#
35
Rietveld, Malan and Robert Pringle. 2007. “The Evolution of Sovereign Wealth Management.” In Sovereign Wealth Management. Eds. J. Johnson-Calari and M. Rietveld. London: Central Banking Publication: 1-11.
Sala-i-Martin, X., J. Blanke, M. D. Hanouz, T. Geiger, I. Mia, and F. Paua. 2007. “The Global Competitveness Index: Measuring the Productive Potential of Nations.” The Global Competitveness Report 2007-2008. Hampshire: Palgrave Macmillian: 3-51.
Scheherazade, Daneshkhu and James Blitz. 2007. “UK Warns Over Push for State Protection.” Financial Times. 25 July.
Servaes, Henri and Ajay Khorana. 2007. “Competition and Conflicts of Interest in the in the U.S. Mutual Fund Industry. LBS Working Paper. May.
Shabsigh, Ghiath and Nadeem Ilahi. 2007. “Looking Beyond the Fiscal: Do Oil Funds Bring Macroeconomic Stability?” IMF Working Paper.
Shleifer, Andrei and Robert W. Vishny. 1997. “A Survey of Corporate Governance” The Journal of Finance 52 (2): 737-783.
Singapore Central Provident Fund. 2008. Annual Report. mycpf.cpf.gov.sg/Members/home.htm
Sweden First AP Fund. 2008. Annual Report. www.ap1.se/en/About-AP1/
Takayama, N. 2006. “Reforming Social Security Pensions in Japan: Is NDC the Answer?” In Pension Reform-Issues and Prospects for Non-Financial Defined Contribution (NDC) Schemes. Eds. R. Holzmann and E. Palmer. Washington, D.C.: World Bank: 639-648.
Truman, Edwin. 2008(a). "A Blueprint for Sovereign Wealth Fund Best Practices." Peterson Institute Policy Review. Washington DC: Peterson Institute for International Economics. Truman, Edwin. 2008(b). “The Rise of Sovereign Wealth Funds: Impact on US Foreign Policy and Economic Interests." Testimony before the Committee on Foreign Affairs, US House of Representatives. May 21. Truman, Edwin. 2007(a). Sovereign Wealth Funds: The Need for Greater Transparency and Accountability.
Washington, DC: Peterson Institute for International Economics.
Truman, Edwin. 2007(b). “Sovereign Wealth Fund Acquisitions and Other Foreign Government Investments in the United States: Assessing the Economic and National Security Implications.” Testimony before the Committee on Banking, Housing, and Urban Affairs, United States Senate. November 14.
United Nations (UN). 2008. World Population Prospects: The 2006 Revision Population Database. Population Division. esa.un.org/unpp/index.asp?panel=2
United Nations (UN). 2007. Responsible Investment in Focus: How leading public pension funds are meeting the challenge. Environment Programme Finance Initiative Asset Management Working Group and UK Social Investment Forum Sustainable Pensions Project 2007 Report.
US Social Security Administration (US SSA). 2008. “Stochastic Projections.” Social Security Online. Office of the Chief Actuary. http://www.ssa.gov/OACT/stochastic/.

36
Useem, Michael, and Olivia S. Mitchell. 2000. “Holders of the Purse Strings: Governance and Performance of Public Retirement Systems.” Social Science Quarterly 81(2): 489–506.
Walker, David. (2007). “Guidelines for Disclosure and Transparency in Private Equity.” The Walker Working Group, London. www.walkerworkinggroup.com.
Watson Wyatt Worldwide. 2006. The World's 300 Largest Pension Funds. Washington, DC: Watson Wyatt Worldwide.
Watson Wyatt Worldwide. 2007. “The World's Sovereign Wealth Funds.” Washington, DC: Watson Wyatt Worldwide.
Weinberger, Fred and Bennett Golub. 2007. “Asset Allocation and Risk Management for Sovereign Wealth Funds.” In Sovereign Wealth Management. Eds. J. Johnson-Calari and M. Rietveld. London: Central Banking Publication: 71-102.
World Bank. 2008. Key Development Data and Statistics. http://go.worldbank.org/1SF48T40L0
Yang, Tongxuan (Stella) and Olivia S. Mitchell. (2008). “Public Pension Governance, Funding, and Performance: A Longitudinal Appraisal.” In Pension Fund Governance: A Global Perspective. Eds. John Evans and John Piggott. London: Edward Elgar: 179-199.
Ziemba, William and John J. Mulvey, eds. 2001. Worldwide Asset and Liability Modeling. Cambridge: Cambridge University Press.

37
Table 1. List of Currency Stabilization Funds by Nationality and Size
Country Assets (US$M' 2007) Assets as % of GDP Algeria 83,000 63.1 Australia 67,166 7.4 Brazil 155,617 11.8 China 1,334,590 41.1 Hong Kong 136,267 65.9 India 220,223 20.0 Indonesia 49,406 11.4 Japan 907,346 20.7 Korea 250,667 26.2 Libya 64,000 112.2 Malaysia 91,240 48.9 Mexico 78,172 8.8 Norway 56,658 14.5 Poland 52,286 12.4 Russia 407,495 31.6 Singapore 144,056 89.3 Taiwan 266,287 69.5 Thailand 69,000 28.1 Turkey 67,000 10.1 UK 42,000 1.5 US 55,086 0.4 Sources: Merrill Lynch (2007), Truman (2007a, b), and World Bank (2008).

38
Table 2. Sovereign Wealth Funds by Name, Year of Inception, Source, Stated Objective, and Size
Country Fund Name Year of
Inception Sources Objectives Assets
(USM$'2007)
Assets as % of
GDP
UAE Abu Dhabi Investment Authority and Council 1976 Oil revenues Savings 875,000 454.3
Singapore Government of Singapore Investment Corporation 1981 Trade surpluses Savings 330,000 204.5
Singapore Temasek Holding 1974 Fiscal surpluses Savings 110,000 68.2
Norway Government Pension Fund - Global 1990 Oil revenues Savings & stabilization 375,000 95.8
China State Foreign Exchange Investment Corporation 2007 Trade surpluses Savings 200,000 6.2
China Central Hujin Investment Corporation 2003 Trade surpluses Savings 100,000 3.1
Kuwait Kuwait Investment Authority 1953 Oil revenues Savings & stabilization 213,000 191.3
Russia Stabilization Fund of the Russian Federation 2003 Oil revenues Stabilization 128,000 9.9
Russia Future Generation Fund of the Russian Federation 2008 Oil revenues Savings 32,000 2.5 U.S. Alaska Permanent Reserve Fund Co. 1976 Oil revenues Savings 37,000 0.3 U.S. New Mexico State Investment Office Trust Funds 1958 Royalties on State lands Savings 5,000 0.04
U.S. Permanent Wyoming Mineral Trust Fund 1974 Mineral revenues Savings 4,000 0.03
Australia Future Fund 2006 Fiscal surpluses Savings 53,000 5.8
Brunei Brunei Investment Authority General Reserve Fund 1983 Oil revenues Savings 35,000 282.6
Ireland National Pension Reserve Fund 2001 Fiscal surpluses Savings 31,000 12.0 New Zealand Superannuation Fund 2001 Fiscal surpluses Savings 10,000 7.8 Total 2,538,000 Sources: Das (2007), Kern (2007), Truman (2008a, b), Watson Wyatt (2007), Ireland National Pension Reserve (2006), and World Bank (2008).

39
Table 3. Reported Asset Allocation and Return for Four Sovereign Wealth Funds
Fund Name Country Reported Asset Allocation (%) Return (%)
Domestic Fixed Income
Domestic Equities
Foreign Fixed Income
Foreign Equities
Other Investments
Government Pension Fund - Global (GPF-G) Norway 0 0 59.4 40.6 0 7.9 New Zealand Superannuation Fund (NZSF) New Zealand 17.3 7.3 0 52.6 22.8 14.6 National Pension Reserve Fund (NPRF) Ireland 0 0 12.6 76 11.4 12.4 Future Fund Australia 74 3.5 0 3.9 18.6 7.39 Sources: Australia Future Fund (2008), Norges Bank Investment Management (2006), New Zealand Superannuation Fund (2008), and Ireland National Pension Reserve Fund Commission (2006). Notes: 1. In Norway, the GPF-G invests only in global markets. The other wealth fund of the Norwegian government GPF-Norway invests only in local markets. The table reports the nominal return from the whole portfolio in 2006. The portfolio real return (adjusted for inflation) in 2006 was 5.65%. Nominal returns from equities and fixed income instruments in 2006 were 17.04% and 1.93% respectively. The annualized nominal return from the portfolio between 1997 and 2006 was 6.49%. The actual asset allocation refers to the situation at the end of 2006. 2. In New Zealand, the NZSF annual reports do not separately report the portfolio share of domestic and foreign fixed income securities, and hence, the portfolio share of domestic bonds (both in benchmark and actual assert allocation cases) includes the portfolio share of the foreign bonds. The remainder of the NZSF portfolio is held in other asset classes such as local and global property, commodities, and private markets. The table reports the nominal return (adjusted for fees but not for inflation) between June 2006 and June 2007. The annualized nominal return from the whole portfolio was 14.81% between 2003 and 2007. The actual asset allocation refers to end June 2006. 3. In Ireland, the NPRF does not hold Irish government bonds. The portfolio is heavy in alternative asset classes such as property and commodity investments. Foreign bonds consist of only Eurozone bonds and Eurozone equities (including Irish equities); the latter total about 45% of the portfolio. Since Ireland is a member of the European Union, one might consider Eurozone bonds and equities as domestic for Ireland. The table presents the 2006 nominal rate of return; annualized it was 6.5%. The asset allocation refers to end 2006. 4. Australia's Future Fund investment program started in June 2007; the benchmark portfolio has not yet been declared and to date the majority of the portfolio has been kept in cash (the table reports the portfolio share of the cash in the cell of domestic fixed income securities) and Telstra shares (this is an Australian telecommunication company). The portfolio share of Telstra Corporation, which is 18.6%, is not reported in the table. The nominal return from the portfolio from June 2006 to June 2007 is reported in the table. The real return (the nominal return after the price inflation adjustment) is 5.29 in the same period. Actual asset allocation is as of June 2007.

40
Table 4. Publicly-Managed Pension Asset Pools by Size
Rank Fund Name Country Inception
year Assets
(US$M’ 2006) Assets as
% of GDP
1 Social Security Trust Fund U.S. 1940 2,048,112 15.5
2 Government Pension Investment Japan 2001 935,569 21.6
3 National Pension Fund Korea 1988 190,842 21.5
4 GEPF South Africa n.d. 177,559 69.6
5 Postal Savings Fund Taiwan n.d. 128,194 18.8
6 National Pension Funds (AP1, AP2, AP3, AP4, AP6) Sweden 2000 117,468 30.5
7 National Social Security Fund and Social Insurance Funds China 2001/1951 104,350 3.9
8 Canada Pension Plan Canada 1997 86,392 6.9
9 Employees Provident Fund Malaysia 1991 82,256 55.2
10 Central Provident Fund Singapore 1955 70,468 53.3
11 Fondo de Reserva de la Seguridad Social Spain 1997 44,875 3.7
12 Public Institute/Social Security Kuwait 1977 40,482 50.1
13 Fond de Reserve des Retraites France 2000 39,140 1.8
14 Employees Provident Fund India 1952 31,581 3.5
15 The State Pension Fund Finland 1990 12,929 6.2
16 Social Security Fund Thailand 1990 9,074 4.4
17 General Organization for Social Insurance Saudi Arabia 1973 8,622 2.8
18 Social Security Financial Stabilization Fund Portugal 1989 8,330 4.3
19 IMSS Reserve Mexico n.d. 7,392 0.9
20 Social Security Corporation Jordan 1980 6,023 42.5
21 Employees' Old-Age Benefits Pakistan 1976 1,822 1.4
22 Demographic Reserve Fund Poland n.d. 1,760 0.5
23 Social Security Fund Denmark 1964 659 0.2
Total 4,153,899 Sources: OECD (2007), Canada Pension Plan Board (2008), Watson Wyatt Worldwide (2006), World Bank (2008), India Employees’ Provident Fund Organization (2008), Singapore Central Provident Fund (2008), Malaysia Employees’ Provident Fund (2008), and Kuwait International Social Security Review (1998). Note: n.d. = no date
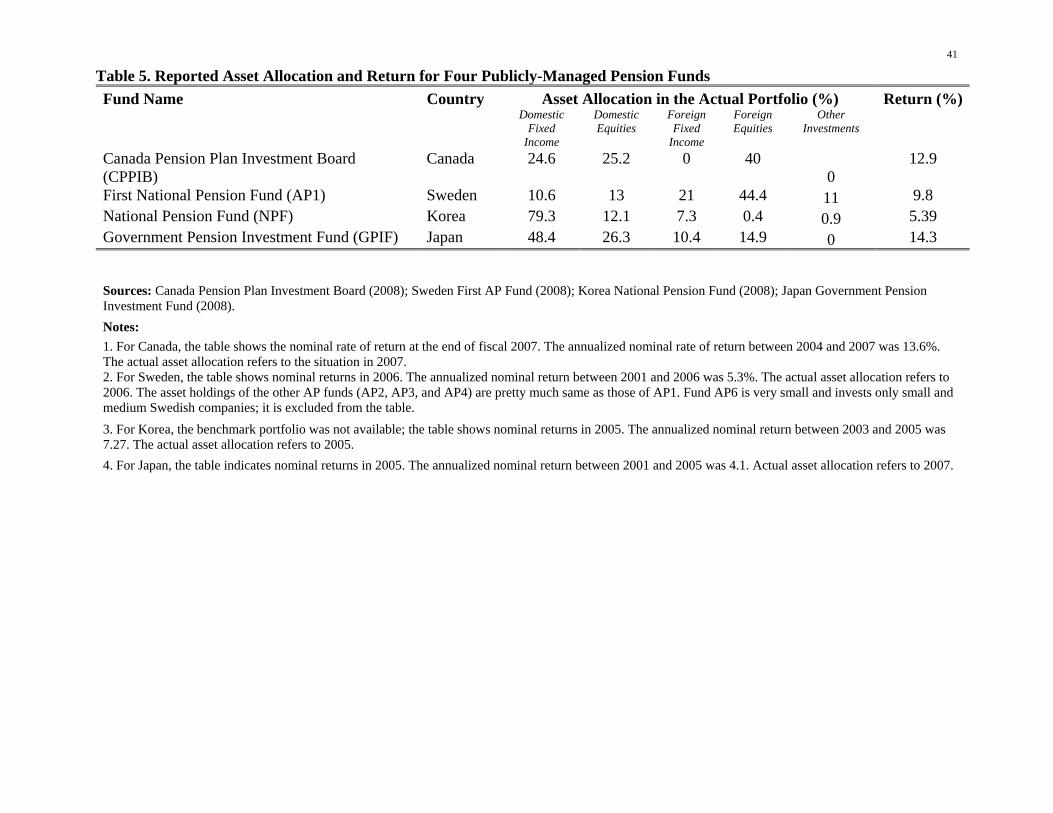
41
Table 5. Reported Asset Allocation and Return for Four Publicly-Managed Pension Funds Fund Name Country Asset Allocation in the Actual Portfolio (%) Return (%) Domestic
Fixed Income
Domestic Equities
Foreign Fixed
Income
Foreign Equities
Other Investments
Canada Pension Plan Investment Board (CPPIB)
Canada 24.6 25.2 0 40 0
12.9
First National Pension Fund (AP1) Sweden 10.6 13 21 44.4 11 9.8 National Pension Fund (NPF) Korea 79.3 12.1 7.3 0.4 0.9 5.39 Government Pension Investment Fund (GPIF) Japan 48.4 26.3 10.4 14.9 0 14.3
Sources: Canada Pension Plan Investment Board (2008); Sweden First AP Fund (2008); Korea National Pension Fund (2008); Japan Government Pension Investment Fund (2008). Notes: 1. For Canada, the table shows the nominal rate of return at the end of fiscal 2007. The annualized nominal rate of return between 2004 and 2007 was 13.6%. The actual asset allocation refers to the situation in 2007. 2. For Sweden, the table shows nominal returns in 2006. The annualized nominal return between 2001 and 2006 was 5.3%. The actual asset allocation refers to 2006. The asset holdings of the other AP funds (AP2, AP3, and AP4) are pretty much same as those of AP1. Fund AP6 is very small and invests only small and medium Swedish companies; it is excluded from the table. 3. For Korea, the benchmark portfolio was not available; the table shows nominal returns in 2005. The annualized nominal return between 2003 and 2005 was 7.27. The actual asset allocation refers to 2005. 4. For Japan, the table indicates nominal returns in 2005. The annualized nominal return between 2001 and 2005 was 4.1. Actual asset allocation refers to 2007.

42
Table 6. International Guidelines for Public Pension Fund Management
Panel A: World Bank Checklist Panel B: OECD ChecklistGOVERNANCE GOVERNANCE Are the roles of the respective parties in the public pension scheme clear? Are the terms under which the managing agency and its governing members appointed and terminated well understood? Are there adequate fit and proper person protections to prevent the agency from being deliberately manipulated by the government or the Board of the agency? Is the management agency open and transparent about its governance structures? Is the scheme open to periodic review; do the government and/or the managing agency welcome constructive criticism? How well does the agency’s internal and/or external governance systems compare with those imposed by the regulator of private pensions?
Identification of responsibilities; Governing body; Expert advice; Custodian; Suitability; Redress; Self-investment.
ACCOUNTABILITY ACCOUNTABILITY Does the public have access to adequate information about the governance structures of the public pensions scheme and its managing agency, either through explicit laws, annual reports, publications and/or web sites? Is disclosure of potential conflicts of interest of Board members required and imposed? Is the scheme subject to regular independent audit for both governance and performance? Are the financial performance and financial state of the scheme revealed publicly on a regular basis based on sound accounting standards? Is the scheme’s financial performance reported against established benchmarks?
Is the government open about its liabilities under the scheme and subject to independent actuarial reviews?
Are the incentive structures within the scheme transparent to the public, linked to delegated responsibilities and risk based?
Auditor; Actuary; Accountability; Internal controls; Reporting; Disclosure; Rigorous process for investment; Publicly available investment policy; Identification of investors; Procedures for investment policy review; Transparent and market based valuation and accounting.
INVESTMENT INVESTMENT
Is the investment policy fully documented and publicly available? Is the stated purpose of the scheme to benefit the members of the scheme and, if not, are there potential conflicts between stated objectives? Does the policy permit lending to government and/or members and, if so, are there transparent guidelines identifying the issues involved and governing how such investments will take place? Is the target rate of return based on a long-term funding ratio objective and is it consistent with this objective? Does the investment policy identify how it will deal with actual or potential market dominance? Have all major risks been identified and taken into consideration in forming the investment policy? Has the tolerable level of risk been defined by the Board. Are the processes involved in delegating the implementation of the investment policy to managers clearly defined? Are benchmark criteria for hiring and firing managers clear and the information needed by the Board to act on them available? Are the investment parameters defined in terms of restrictions and prohibitions or in terms of modern portfolio concepts?
Retirement income objective and prudential principles; Prudent person standard; Fiduciary duty; Clear investment objectives (liabilities); Strategic asset allocation; Risk management; Investment options; Portfolio limits; International investment; Regular assessment of limits and controls.
Source: Carmichael and Palacios (2003). Source: OECD (2005).

43
Table 7. Empirical Estimates of Aggregate GAI Scores
1 2 3 4
Log assets -1.61 ** -1.34 -1.25 -2.41 ** Current old-age dependency ratio 0.96 ** 0.78 ** 0.77 ** Future old-age dependency ratio 0.16 MWBI 1.62 * MGCI -0.75 Business sophistication -0.76 -0.37 -0.54 Regulatory quality 0.74 Voice and accountability 2.49 2.92 * Rule of law 0.69 Government effectiveness 3.45 R-squared 0.68 0.68 0.68 0.41 N 26 26 26 26
Note:* significant at 10% level; **significant at 5% level. For data sources see Appendix I and II, and for variable definitions see Appendix III.
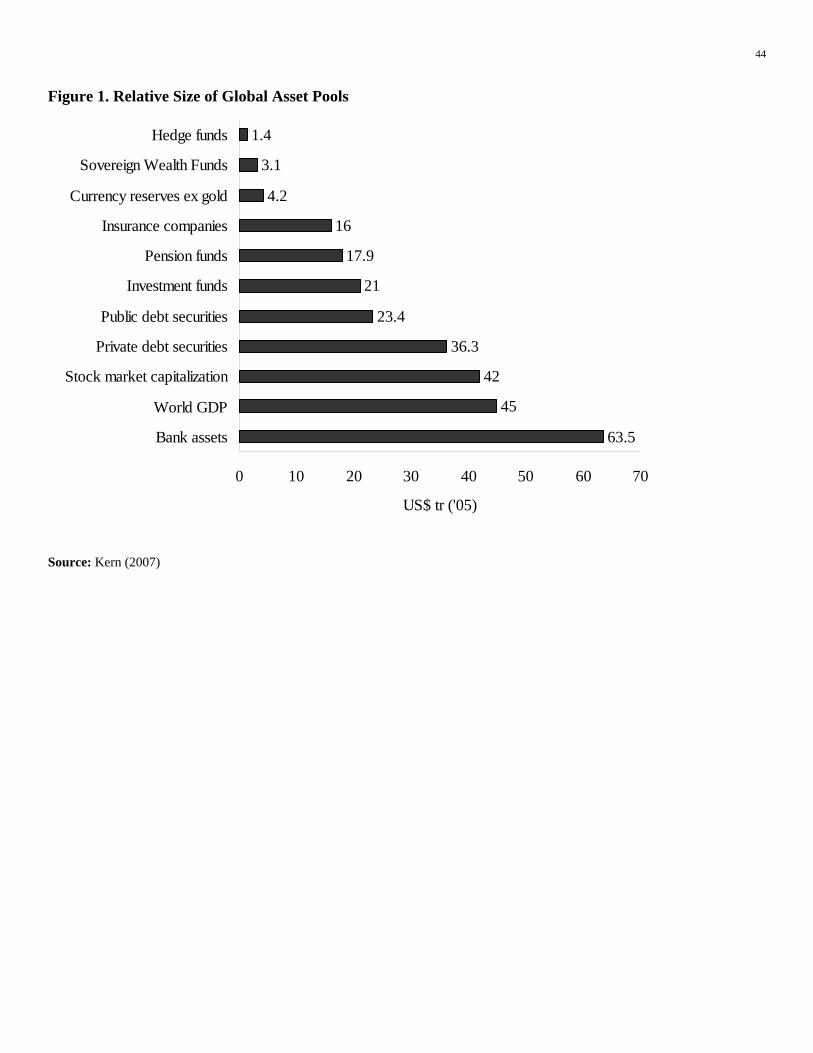
44
Figure 1. Relative Size of Global Asset Pools
63.5
45
42
36.3
23.4
21
17.9
16
4.2
3.1
1.4
0 10 20 30 40 50 60 70
Bank assets
World GDP
Stock market capitalization
Private debt securities
Public debt securities
Investment funds
Pension funds
Insurance companies
Currency reserves ex gold
Sovereign Wealth Funds
Hedge funds
US$ tr ('05)
Source: Kern (2007)

45
Appendix I: Governance, Accountability, and Investment (GAI) Scores Country Fund Governance Accountability Investment Total SWFs Algeria Revenue Regulation Fund 1 4 4 9 Australia Future Fund 4 11 10.5 25.5 Azerbaijan State Oil Fund 4 12 8.5 24.5 Botswana Pula Fund 3 7 7 17 Brunei Brunei Investment Agency 1 4 1 6 Canada (Alberta) Alberta Heritage Savings Trust Fund 3.5 11.5 8.5 23.5 Chile Economic and Social Stabilization Fund 3.5 12.5 6 22 China Central Huijin Investment Company 1 4 4.5 9.5 Hong Kong Exchange Fund 2 11 8 21 Iran Oil Stabilization Fund 1 5 1.5 7.5 Ireland National Pension Reserve Fund 5 14 8.5 27.5 Kazakhstan National Oil Fund 3.5 9 7.5 20 Kiribati Revenue Equalization Reserve Fund 1 4 3.5 8.5 Korea Korea Investment Corporation 3 5.75 7 15.75 Kuwait Kuwait Investment Authority 4 5.25 5.5 14.75 Malaysia Khazanah Nasional 1.5 8 3 12.5 Mexico Oil Income Stabilization Fund 2 7.5 5 14.5 New Zealand Superannuation Fund 5 15 10.5 30.5 Nigeria Excess Crude Account 0 5 3.5 8.5 Norway Government Pension Fund - Global 4.5 15 10 29.5 Oman State General Reserve Fund 2 3.5 0.5 6 Qatar Qatar Investment Authority 1 1.25 0.75 3 Russia Stabilization Fund 1 8.5 6.25 15.75 Sao Tome and Principe National Oil Account 4 6 5 15 Singapore Government of Singapore Investment Corporation 3 5.5 4 12.5 Singapore Temasek Holdings 3 9.5 2.5 15 Sudan Oil Revenue Stabilization Fund 1.5 4 0 5.5 Timor-Leste Petroleum Fund 3 14 8.5 25.5 Trinand&Tobago Heritage and Stabilization Fund 4 8 4.5 16.5 UAE (Abu Dhabi) Abu Dhabi Investment Authority and Council 1 0.75 1.25 3 UAE (Abu Dhabi) Mubadala Development Company 1 1.5 2.5 5 UAE (Dubai) Istithmar World 1 2.5 1 4.5 US (Alaska) Alaska Permanent Fund 4 15 11 30 US (New Mexico) Severance Tax Permanent Fund 3.5 12 12 27.5 US (Wyoming) Permanent Mineral Trust Fund 5 12 12 29 Venezuela Macro Stabilization Fund 1 4.5 2 7.5
Venezuela National Development Fund 1 4.75 1 6.75 Average 2.5 7.7 5.4 15.6
Sources: Truman (2008a, b) and authors' calculations; see Appendix II.

46
Appendix II. Criteria for Sovereign Wealth Fund Management Practices Governance (G)
Are the guidelines for fiscal treatment generally followed without frequent adjustment? (Structure)
Is the SWF separate from the country's international reserves? (Structure)
Does the SWF ethical guidelines that it follows? (Governance)
Is the audit independent? (Transparency and Accountability)
Are decisions on specific investments made by the managers? (Governance)
Accountability (A)
Is the SWF's objective clearly communicated? (Structure)
Is the source of the SWF's funding clearly specified? (Structure)
Is nature of the subsequent use of the principal and earnings in the fund clearly stated? (Structure)
Does the SWF have in place and publicly available guidelines for corporate responsibility that it follows? (Governance)
Does the SWF provide at least an report on its activities and results? (Transparency and Accountability)
Does the SWF provide quarterly report on its activities? (Transparency and Accountability)
Do regular reports on the investments by the SWF include the size of the fund? (Transparency and Accountability)
Do regular reports on the investments by the SWF include information on the return it earns? (Transparency and Accountability)
Do regular reports on the investments by the SWF include information on the types of investments? (Transparency and Accountability)
Do regular reports on the investments by the SWF include information on the geographic location of investments? (Transparency and Accountability)
Do regular reports on the investments by the SWF include information on the specific investments? (Transparency and Accountability)
Do regular reports on the investments by the SWF include information on the currency composition of investments? (Transparency and Accountability)
Are the holders of investment mandates identified? (Transparency and Accountability)
Is the SWF subjected to a regular audit? (Transparency and Accountability)
Is the audit published? (Transparency and Accountability)
Investment (I)
Is the overall investment strategy clearly communicated? (Structure)
Is the procedure for the changing the structure clear? (Structure)
Is the role of the government in the setting the investment strategy of the SWF clearly established? (Governance)
Is the role of the manager in executing the investment strategy clearly established? (Governance)
Does the SWF indicate the nature and speed of adjustment in its portfolio? (Behaviour)
Does the strategy use benchmarks? (Transparency and Accountability)
Does the strategy limit investments based on credit ratings? (Transparency and Accountability)
Does the SWF have limits on the size of its stakes? (Behaviour)
Does the SWF not take controlling stakes? (Behaviour)
Does the SWF have a policy on the use of leverage? (Behaviour)
Does the SWF have a policy on the use of derivatives? (Behaviour)
Are derivatives used primarily for hedging?

47
Notes: Authors' re-classification of Truman's (2008a, b) PI scores for SWF structure, governance, transparency and accountability, and behaviour variables into our measures of governance, accountability, and transparency. The PI scoreboard question is shown in italics.
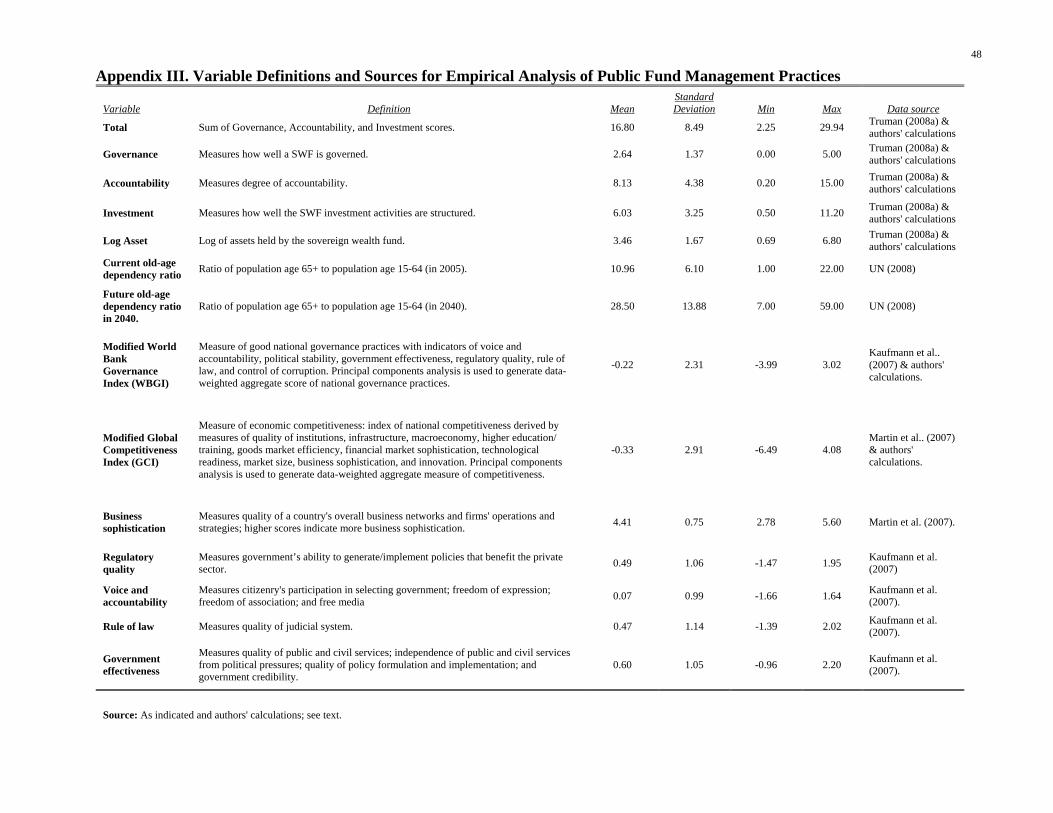
48
Appendix III. Variable Definitions and Sources for Empirical Analysis of Public Fund Management Practices
Variable Definition MeanStandard Deviation Min Max Data source
Total Sum of Governance, Accountability, and Investment scores. 16.80 8.49 2.25 29.94 Truman (2008a) & authors' calculations
Governance Measures how well a SWF is governed. 2.64 1.37 0.00 5.00 Truman (2008a) & authors' calculations
Accountability Measures degree of accountability. 8.13 4.38 0.20 15.00 Truman (2008a) & authors' calculations
Investment Measures how well the SWF investment activities are structured. 6.03 3.25 0.50 11.20 Truman (2008a) & authors' calculations
Log Asset Log of assets held by the sovereign wealth fund. 3.46 1.67 0.69 6.80 Truman (2008a) & authors' calculations
Current old-age dependency ratio Ratio of population age 65+ to population age 15-64 (in 2005). 10.96 6.10 1.00 22.00 UN (2008)
Future old-age dependency ratio in 2040.
Ratio of population age 65+ to population age 15-64 (in 2040). 28.50 13.88 7.00 59.00 UN (2008)
Modified World Bank Governance Index (WBGI)
Measure of good national governance practices with indicators of voice and accountability, political stability, government effectiveness, regulatory quality, rule of law, and control of corruption. Principal components analysis is used to generate data-weighted aggregate score of national governance practices.
-0.22 2.31 -3.99 3.02 Kaufmann et al.. (2007) & authors' calculations.
Modified Global Competitiveness Index (GCI)
Measure of economic competitiveness: index of national competitiveness derived by measures of quality of institutions, infrastructure, macroeconomy, higher education/ training, goods market efficiency, financial market sophistication, technological readiness, market size, business sophistication, and innovation. Principal components analysis is used to generate data-weighted aggregate measure of competitiveness.
-0.33 2.91 -6.49 4.08 Martin et al.. (2007) & authors' calculations.
Business sophistication
Measures quality of a country's overall business networks and firms' operations and strategies; higher scores indicate more business sophistication. 4.41 0.75 2.78 5.60 Martin et al. (2007).
Regulatory quality
Measures government’s ability to generate/implement policies that benefit the private sector. 0.49 1.06 -1.47 1.95 Kaufmann et al.
(2007)
Voice and accountability
Measures citizenry's participation in selecting government; freedom of expression; freedom of association; and free media 0.07 0.99 -1.66 1.64 Kaufmann et al.
(2007).
Rule of law Measures quality of judicial system. 0.47 1.14 -1.39 2.02 Kaufmann et al. (2007).
Government effectiveness
Measures quality of public and civil services; independence of public and civil services from political pressures; quality of policy formulation and implementation; and government credibility.
0.60 1.05 -0.96 2.20 Kaufmann et al. (2007).
Source: As indicated and authors' calculations; see text.
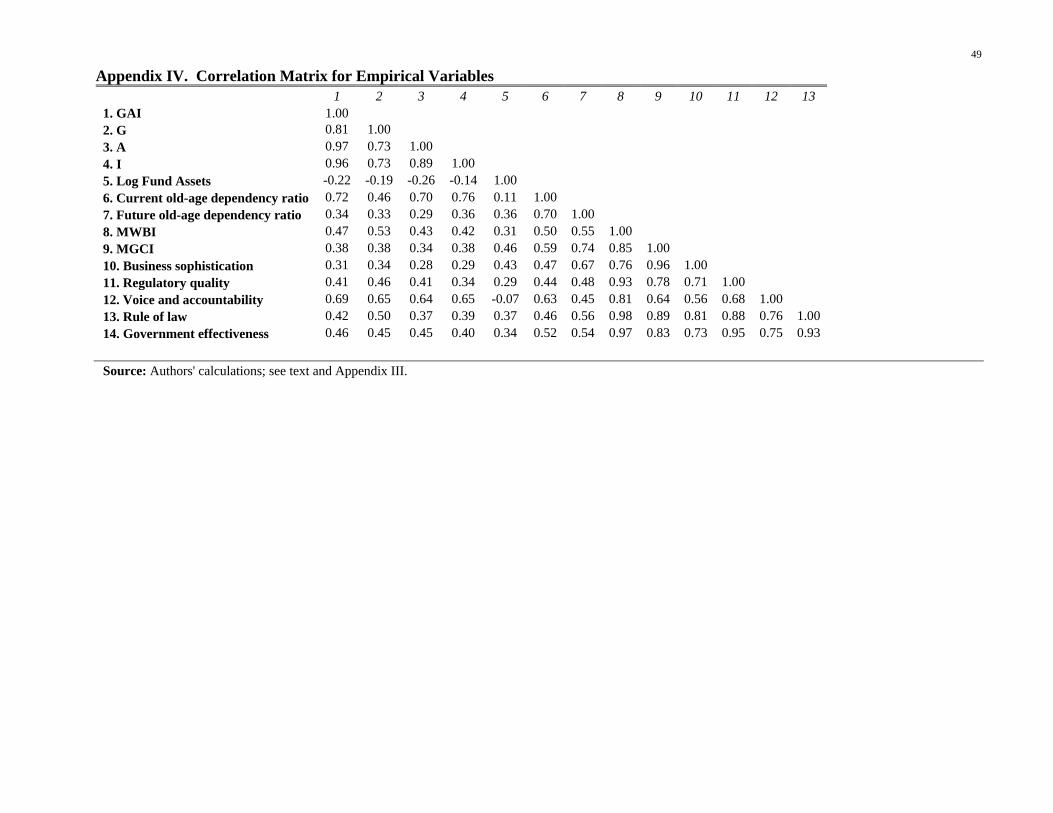
49
Appendix IV. Correlation Matrix for Empirical Variables 1 2 3 4 5 6 7 8 9 10 11 12 13 1. GAI 1.00 2. G 0.81 1.00 3. A 0.97 0.73 1.00 4. I 0.96 0.73 0.89 1.00 5. Log Fund Assets -0.22 -0.19 -0.26 -0.14 1.00 6. Current old-age dependency ratio 0.72 0.46 0.70 0.76 0.11 1.00 7. Future old-age dependency ratio 0.34 0.33 0.29 0.36 0.36 0.70 1.00 8. MWBI 0.47 0.53 0.43 0.42 0.31 0.50 0.55 1.00 9. MGCI 0.38 0.38 0.34 0.38 0.46 0.59 0.74 0.85 1.00 10. Business sophistication 0.31 0.34 0.28 0.29 0.43 0.47 0.67 0.76 0.96 1.00 11. Regulatory quality 0.41 0.46 0.41 0.34 0.29 0.44 0.48 0.93 0.78 0.71 1.00 12. Voice and accountability 0.69 0.65 0.64 0.65 -0.07 0.63 0.45 0.81 0.64 0.56 0.68 1.00 13. Rule of law 0.42 0.50 0.37 0.39 0.37 0.46 0.56 0.98 0.89 0.81 0.88 0.76 1.00 14. Government effectiveness 0.46 0.45 0.45 0.40 0.34 0.52 0.54 0.97 0.83 0.73 0.95 0.75 0.93
Source: Authors' calculations; see text and Appendix III.