Managing Frost Risk - GRDC · Science, Brett Masters of PIRSA Rural ... Fred and Peter Maynard...
78
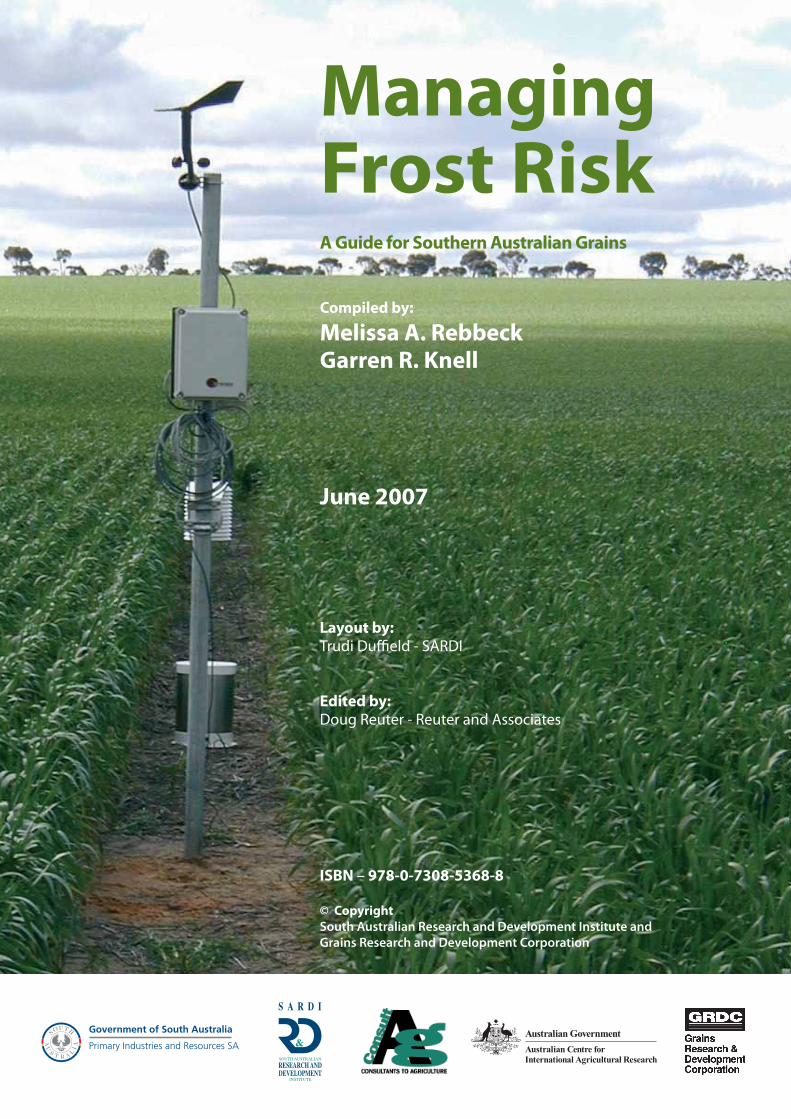
Managing Frost Risk A Guide for Southern Australian Grains Melissa A. Rebbeck Garren R. Knell
Transcript of Managing Frost Risk - GRDC · Science, Brett Masters of PIRSA Rural ... Fred and Peter Maynard...

Managing Frost RiskA Guide for Southern Australian Grains
Melissa A. RebbeckGarren R. Knell

Disclaimer
Although SARDI, ConsultAg and GRDC have taken all reasonable care in preparing this guide, SARDI, ConsultAg, GRDC nor their offi cers accept any liability resulting from the interpretation or use of the information set out in this document. Information contained in this document is subject to change without notice.
No person should act on the basis of the contents of this publication without fi rst obtaining specifi c, independent professional advice. SARDI, ConsultAg and GRDC will not be liable for any loss, damage, cost or expense incurred or arising by reason of any person using or relying on the information in this publication.
Climate Applications Unit
Phone: 08 8303 9400
Grains Research & DevelopmentCorporation
Phone: 02 6272 5525
ConsultAg
Phone: 08 9475 0311
To obtain a copy/copies contact:
Ground Cover DirectFreephone: 1800 11 00 44Email: [email protected]: Ground Cover DirectPO Box 7456Canberra MC ACT 2610
Cost: $20.00 plus postage and handling
Garren Knell and Lawrence Gusta
Peter Hayman, Bronya Alex-ander, Melissa Rebbeck, Gar-ren Knell
Melissa Rebbeck, Garren Knell, Chris Lynch, Mick Faulkner
Managing Frost RiskA Guide for Southern Australian Grains
Compiled by:
Melissa A. RebbeckGarren R. Knell
June 2007
Layout by:Trudi Duffi eld - SARDI
Edited by:Doug Reuter - Reuter and Associates
ISBN – 978-0-7308-5368-8
© CopyrightSouth Australian Research and Development Institute and Grains Research and Development Corporation

ii
Details
Melissa A. RebbeckSenior Research Offi cer Climate Applications UnitSouth Australian Research and Development Institute E-mail: [email protected] www.sardi.sa.gov.au
Garren R. KnellAgricultural ConsultantConsult Ag, Narragin, WAE-mail [email protected] www.consultag.com.au
Dr Peter T. HaymanPrincipal ScientistClimate Applications UnitSouth Australian Research and Development Institute E-mail: [email protected]
Christopher W. LynchResearch Offi cerClimate Applications UnitSouth Australian Research and Development InstituteE-mail: [email protected]
Bronya M. AlexanderResearch Offi cerClimate Applications UnitSouth Australian Research and Development Institute E-mail: [email protected]
Mick FaulknerAgricultural ConsultantAgrilink, Watervale, SAE-mail: [email protected]
Dr Lawrence V. Gusta ProfessorUniversity of Saskatchewan, CanadaE-mail: [email protected]
Trudi K. Duffi eldResearch/Extension Offi cerClimate ApplicationsSouth Australian Research and Development InstituteE-mail: duffi [email protected]
Steve Curtin and David FalconerAgricultural ConsultantsConsult Ag, WAE-mail [email protected]
AUTHORS

iii
Many organisations and individuals have contributed to the development and publication of this guide for managing frost risk. In particular we thank the following for their support and contributions:
The Grains Research and Development Corporation (GRDC) for the funding toward the main component of the information in this book - ‘agronomic practices to reduce frost risk’ in Chapter 3. In particular thank you to Dr Martin Blumenthal and Dr Bob Belford for their direction and support in this work. Thank you to Maureen Cribb for organising the printing and marketing support from GRDC.
The Australian Centre for International Agricultural Research also contributed funding toward chapter 2 through the project- ‘Bridging the Gap Between Seasonal Climate Forecasts and Decision Makers’.
A special thanks to Dr Peter Hayman (author of Chapter 2) and Dr Victor Sadras (contributer to chapter 3) from the South Australian Research and Development Institute (SARDI) Climate Applications Unit, whom were also both on the steering committee and provided major contributions toward this work.
Thank you to Franky Charman-Green, Chris Lynch and Bronya Alexander from the SARDI Climate Applications Unit for technical support.
Thank you very much to Trudi Duffi eld from the SARDI Climate Applications Unit for her dedication and commitment to this book and her work on the layout and design of this document and helping to get it to the printers on time.
Thank you to the ConsultAg frost research team Garren Knell, Steve Curtin, Wade Longmuir and David Sermon for the management of frost trials in Western Australia and for providing input and direction to the overall project.
Thanks to the steering committee formulated to drive the research for this project and their input including Mick Faulkner Consultant Agrilink, SA, Jim Egan of the SARDI, Craig White of Elders at Merredin, WA, Harm Van Rees agricultural consultant Victoria, Daniel Rodriguez of APSRU and formerly Victorian Institute Agricultural Science, Brett Masters of PIRSA Rural Solutions, Richard Leech, Jason Eglington and Jason Alexander and Nigel Long of the of the University of Adelaide, Ian Foster and Miles Dracup of the Department of Agriculture Food.
Thank you to the Birchip Cropping Group for their support in 2002 when we conducted a research trial at Minyip in Victoria.
Thank you to Dr Chris Dyson for the statistical analyses of results incorporated into this work. Thank you to Bruce Brooks from the SA Bureau of Meteorology for
information provided in chapter 1.
Thank you to Dr Doug Reuter, Director of Agricultural Technology Services for the editing work in this book.
Thank you to the Department of Agriculture WA for the frost pictures and some information used in chapter 1 and 3.
Thanks to all of the farmers who have provided their land, machinery and time for major frost trials. This includes John & Chris Faulkner (Mintaro), John Mitchell (Mintaro) Trevor and Tricia Menz (Keith), Darryl & Faye McNeilly (Parilla) and Fred and Peter Maynard (Lameroo), plus Chris & Evelyn Henderson (Varley), John & Alison Stone (Borden), John and Anne Hicks (Pingrup), Lyell & Trish Edmonds (Ongerup), Graeme & Nat Manton (Yealering), Geoff & Rosemary Cugley (Newdegate).
Thanks also to the farmers that sowed farmer demonstration trials including Myles Hannemann and Graham Baldock (Keith), Fred & Peter Maynard (Lameroo) Neil Schilling, and Leighton Huxtable (Lameroo), Michael Schaefer and David Wolford (Buckleboo), Rob Smyth (Cooke Plains), Richard Howard (Geranium), Lester and Kay Cattle (Netherton).
Thank you also to Roger Groocock at Bordertown for his advice and enthusiasm and support for the delving work and our frost research.
ACKNOWLEDGEMENTS

iv

v
INTRODUCTION A Guide to Frost Risk - Southern Australian Grains 1
CHAPTER 1 What is Frost and How Does Frost Damage Cereals? 2
1.1 Frost Damage to Cereal Crops 2 1.1.1 Frost risk 2 1.1.2 Why some plants survive frost? 3
1.2 Frost Events 4
1.2.1 Frost types 4 1.2.2 Atmospheric events leading up to a frost 4 1.2.3 Atmospheric events during a frost 5 1.2.4 Atmospheric inhibitors of frost 6
1.3 Frost Watch 7
1.3.1 Criteria for risk warnings 7 1.3.2 Frost watch in Western Australia 10
CHAPTER 2 The Balancing Act of Managing Frost Risk 12
2.1 The Risk of Frost 12 2.1.1 Yield penalties from delayed sowing 12 2.1.2 Economic costs of delayed sowing 13 2.1.3 Estimating fl owering date 15 2.1.4 Last date of minimum temperature 16
2.2 Spatial Variability in Temperature 17 2.2.1 Variations within landscapes and localities 17
Melissa A. Rebbeck Steve CurtinDr Lawrence V. Gusta
Dr Peter T. Hayman Bronya M. AlexanderGarren R. Knell Melissa A. Rebbeck
TABLE OF CONTENTS

vi
2.3 Activities for Workshops 18 2.3.1 Calculating the economic trade-off of delayed sowing
for frost risk 18 2.3.2 Quantifying your frost risk 19
CHAPTER 3 Agronomic Practices to Reduce Frost Risk 20
3.1 Minimising Frost Risk 20 3.1.1 Importance of soil moisture 21 3.1.2 Use of agronomic practices 21 3.2 Manipulating Soil Heat Bank 23
3.2.1 Delving and clay spreading 23 3.2.2 Rolling 26 3.2.3 Minimal stubble retention 27 3.3 Manipulating Airfl ow Through the Canopy 29 3.3.1 Using diff erent varieties or blends of varieties to
manipulate airfl ow through the canopy 29 3.3.2 Cross sowing 31 3.3.3 Wide row spacing 32 3.3.4 Sowing rates 33
3.4 Frost Tolerant Strategies 34 3.4.1 Minimising nitrogen supply 34 3.4.2 Matching inputs to target yields 35
3.5 Frost Avoidance Strategy 37
3.5.1 Growing hay on frost prone paddocks 37
3.6 Conclusions for Agronomic Practices 38 3.6.1 Manipulating soil heat 38 3.6.2 Manipulating crop canopy 38 3.6.3 Frost tolerant strategies 38
CHAPTER 4 Identifying Frost Damage in Wheat Crops 39
4.1 When are Crops most Vulnerable to Frost Damage? 39 4.1.1 Frost damage vulnerability 39 4.1.2 Which crops are most susceptible to frost damage? 40 4.1.3 How is frost damage assessed in cereals? 40
4.2 What Frost Symptoms are Exhibited at Diff erent Growth Stages? 40 4.2.1 Other crop disorders 44 4.2.2 Glossary 45
CHAPTER 5 Options for Dealing with Frosted Wheat 46
5.1 Damage Assessment 46
5.2 Stubble Management Options 48 5.2.1 Harvesting the crop 48 5.2.2 Hay cutting 48 5.2.3 Silage 49 5.2.4 Cutting and swathing operations 49
Melissa A. Rebbeck Garren R. KnellChris W. LynchMick Faulkner
Melissa A. Rebbeck Garren R. KnellTrudi K. Duffi eld
Garren R. KnellMelissa A. Rebbeck

vii
5.2.5 Desiccation or hay freezing 50 5.2.6 Green manuring 50 5.2.7 Standing crops 50 5.2.8 Burning 51
5.3 Agronomic Considerations 51 5.3.1 Water storage 51 5.3.2 Disease 51 5.3.3 Returning nitrogen to the soil 51
5.4 Cropping Issues for Next Season 51 5.4.1 Planning for the next year 51 5.4.2 Stubble preparation 52 5.4.3 Source new seed varieties 52 5.4.4 Soil test and modify the fertiliser program 52 5.4.5 Control summer weeds 52 5.4.6 Plan the crop program early 52
CHAPTER 6 Recovering from Frost – Business and People 53
6.1 Financial Impact of a Major Frost Event 53 6.1.1 Starting position 53
6.1.2 Dealing with your fi nancier 55 6.1.3 Categories of borrowing 55 6.1.4 Financial issues for the following year 56
6.2 Dealing with Personal Stress 59 6.2.1 Stress symptoms 59
6.2.2 Preventing stress build up 59 6.2.3 Stages in response to stress 60
6.2.4 Sources of help 60
REFERENCES 61
David Falconer

viii
LIST OF FIGURES Figure 1.1a: MSL pressure hPa 4pm, 8th October 2006 5Figure 1.1b: MSL pressure hPa 10am, 9th October 2006 5Figure 1.1c: MSL pressure hPa 4am, 10th October 2006 5Figure 1.2: Minimum temperature for 9th October 2006 6
Figure 1.3: Phantom frost at Keith, SA in 2002 6Figure 1.4: Temperature variations on 16th October 2004 8
Figure 1.5: Satellite images from NOAA for temperatures on 8th October 2006 9
Figure 1.6: Land surface temperatures on 4th October 2006 10
Figure 1.7: Farm scale map highlighting intensity of frost in Western Australia 11
Figure 2.1:Relationship between monthly minimum temperatures and monthly rainfall at Snowtown, SA showing period of frost risk 13
Figure 2.2: Eff ect of delayed sowing on grain yields at Minnipa, South Australia 13
Figure 2.3:Blend of Yitpi and Wyalkatchem with healthy green Yitpi heads and frosted Wyalkatchem heads and 100% frosted Wyalkatchem 15
Figure 2.4:Observed days to fl owering comparison to APSIM modelled days to fl owering at Roseworthy, SA over a ten year period 15
Figure 2.5:Cumulative distribution of frost events at Corrigin, WA from 1957 to 2005, with estimated fl owering time of two wheat varieties, Wyalkatchem and Yitpi 16
Figure 2.6:Climatic data to show the latest date when air temperatures < 2OC each year from 1900 to 2005 at Snowtown, South Australia 16
Figure 2.7:
Diff erences in minimum temperature from crop canopy height, an Automatic Weather Station (AWS) in the fi eld, and the offi cial Bureau of Meteorology recording station for Keith, South Australia 17
Figure 2.8: Applying your frost risk importance and impact 19
Figure 3.1: Temperature dynamics in a crop canopy and canopy interactions 21
Figure 3.2: Various manufactured delvers and their impact on soil 24
Figure 3.3: Relationships between wheat grain yield and frost damage at Keith, SA in 2003 and 2004 25
Figure 3.4: Relationship between frost damage and lowest canopy - height temperature in the four weeks around fl owering for Crops at Keith, SA in 2003 and 2004 25
Figure 3.5: Fred Maynard with his roller at Lameroo, SA 26
Figure 3.6: More open and erect Buckley canopy vs thicker Tamaroi durum canopy 29
Figure 3.7: Comparison of yield, frost damage and protein between Krichauff , Yitpi and a blend of both wheat varieties 31

ix
Figure 3.8:Comparison of conventional and cross sowing treatments at three sowing rates on grain yield and percentage frost damage 32
Figure 3.9Diff erences in canopy structure with 177 mm row spacing and more open canopy at 355 mm row spacing 33
Figure 3.10:
Eff ects of late applied nitrogen rates on grain yield, number of frost distorted grains and net profi t for Wyalkatchem wheat grown at Yealering, Western Australia in 2005 35
Figure 3.11: Production economics for Borden frost trials in 2003, 2004 and 2005. 36
Figure 4.1: Wheat susceptibility to frost damage 40Figure 4.2: Parts of the wheat plant 41Figure 4.3: Vegetative frost damage 42Figure 4.4: Frost aff ected stems 42Figure 4.5: Frosted banana shaped anther 42Figure 4.6: Frosted anther 42Figure 4.7: Emerging wheat head 42Figure 4.8: Frosted fl oret 42Figure 4.9: Partially frosted heads 43Figure 4.10: Healthy and frosted heads 43Figure 4.11: Healthy and frosted grains 43Figure 4.12: Healthy developing wheat grain 43Figure 4.13: Healthy endosperm and frosted endosperm 43Figure 4.14: Moisture stress 44Figure 4.15: Crown rot 44Figure 4.16: Nutrient defi ciency 44Figure 4.17: Herbicide damage 44Figure 6.1: Stages in response to stress 59

x
LIST OF TABLES Table 1.1: Atmospheric conditions leading up to a frost event 4
Table 1.2: Minimum temperature criteria to issue frost risk warnings in South Australia 7
Table 2.1: Estimated cost of delayed sowing of wheat to minimise impact of frost 14
Table 2.2: Eff ect of sowing date and wheat variety on grain yields and gross margins 14
Table2.3: Investigating the eff ect of sowing date on frost risk and wheat yields for Keith, SA 18
Table 3.1 Agronomic practices to reduce frost risk ranked in order of importance 22
Table 3.2: Strategies to minimise and avoid frost damage 23
Table 3.3: Results of rolling trials at various locations around South Australia 27
Table 3.4:Outcomes of frost damage and yield for wheat after rolling and claying treatments applied to sandy soil at Keith, South Australia 27
Table 3.5: Diff erences in air temperatures experienced in orchards with diff erent soil management techniques 28
Table 3.6: Eff ect of stubble load on frost damage to wheat at Cooke Plains, SA in 2005. 28
Table 3.7: Yield Results of Yitpi, Wyalkatchem and a blend of both varieties sown in Western Australia 30
Table 3.8: Varieties sown separately and as a blend at Keith, South Australia on sand or clay delved soil 30
Table 3.9:
Frost damage percent and grain yield of Yitpi and Krichauff wheat compared to a blend of the two varieties and the average yield of the two varieties at Keith, SA 31
Table 3.10: Nitrogen fertiliser rates (kg N/ha) and timing of application to wheat at Yealering, WA in 2005 35
Table 3.11: Target yield and corresponding seed and fertiliser rates for trials at Borden, Western Australia in 2003, 2004 and 2005 36
Table 3.12: Hay gross margin sensitivity analysis showing fi nan-cial ramifi cations from fl uctuations in hay price and yield 37
Table 4.1: Summarised frost symptoms in wheat at diff erent stages of crop growth 41
Table 5.1: Summary of advantages and disadvantages of options for frosted crops 47
Table 5.2: Amount of harvested grain required to break-even on operating the harvester for a range of crops 48
Table 5.3: Feasibility of diff erent options for stubble handling 52
Table 6.1: The eff ects of various levels of income loss and starting equity percentages on fi nal equity percentages 54
Table 6.2: Estimates of wheat and canola production levels (tonnes) at diff erent times within a growing season 55

xi
Table 6.3: Possible income streams to be considered for increasing business income 56
Table 6.4:Possible business items that need to be examined for reducing expenditure 57

xii
Frost in cereals can be more devastating than drought as it is a sudden impact. This book is the fi nal outcome of 5 years of Grains Research and Development Corporation (GRDC) funded frost agronomy research in southern Australia to provide grain growers with a risk decision guide on preparing for and dealing with frost.
We trust that this book will be read and utilised by southern Australian grain growers, as a guide to plan for the next major frost. Until now grain growers have not had a comprehensive practical guide to support their preparation for frost or to support them with dealing with frost once it has occurred.
The book provides both paddock management and whole farm decisions that can be made. The practices growers may employ range from variety selection, delaying sowing and paddock management such as clay spreading.
This book will help grain growers to recognise when a frost has occurred in the paddock by examining temperature records as well as their crop. And once the level of impact has been determined follow the step-by-step guide for what options there
are for dealing with frosted crops and how to access further support.
The aim is to deliver this book in workshops across southern Australia and work through the decision making process on frost with grain growers. However, this book can also be used as a stand-alone resource.
Whilst there is no 100% protection against frost we trust this book will provide support, guidance and comfort to reduce the impact of frost on grain growers properties in southern Australia.
PREFACE

1
Grain growers have implemented new developments in technology to improve water use effi ciency by better managing rainfall variability and drought. As a result, average yield has increased over time as has the average area sown to wheat. Unfortunately, while yields and cropping area have increased, frost remains a signifi cant risk.
High frost risk areas in southern Australia include the Eyre Peninsula, Murray-Mallee and the Mid-North of South Australia, the Wimmerra-Mallee region of Victoria and Western Australia’s southern wheatbelt. Over the last few years, the worst aff ected areas have had crop production losses close to 100%.
Crop losses due to frost are estimated to average more than $33 million a year in SA and Victoria and over the whole of Australia may cost the grains industry on average more than $100 million a year (Olsen 2005). WA grain growers alone lost 700,000 tonnes to frost in 2005, worth around $90 million.
This book will allow cereal producers to:
• Develop a better understanding of how frost damages wheat;
• Understand and estimate their exposure to frost risk;
• Understand the best economic options for sowing time, based on their exposure to frost risk;
• Know the best agronomic strategies to employ for minimising frost risk;
• Know how to make early assessments of frost damaged wheat;
• Implement management options for frost damaged wheat; and
• Know where to fi nd support for the future in the aftermath of suff ering a serious frost.
INTRODUCTION
Managing Frost RiskManaging Frost Risk- A Guide for Southern - A Guide for Southern Australian GrainsAustralian Grains

2
CHAPTER ONE
What is Frost and How Does What is Frost and How Does Frost Damage Cereals? Frost Damage Cereals?
1
This chapter summarises contemporary knowledge on crop factors, atmospheric conditions and processes that cause or inhibit the occurrence of frost on wheat crops. The technology that the Bureau of Meteorology uses to generate frost risk warnings daily in South Australia at sub-regional scales is described. Frost prediction services in Western Australia are also described.
1.1 Frost Damage to Cereal Crops
1.1.1 Frost riskCereal crops are most susceptible to frost injury during and after fl owering, and may also be susceptible at booting (see Chapter 4). Losses in grain yield and quality from frost primarily occurs between stem elongation and late grain fi lling (Potter 2000).
Frost risk is monitored by measuring air temperature in a Stevenson Screen located at a height of 1.5 m above ground level. Stevenson Screen is a standard weather station in a temperature sensoring enclosure. A standard criterion of 2.2oC is known to cause frost damage in fl owering crops, as temperatures at crop canopy height are invariably much lower than measured at Stevenson Screen height (Stanley 2001). It only takes one or two frost events at a critical time to cause widespread
and serious crop damage.
Two diff erent types of cold temperature processes are now known to damage cereals.
Chilling InjuryThis type of injury occurs when plants are exposed to temperatures less than 10oC down to 0oC. Injury is not related to the formation of ice in plant tissues. It is plausible that this type of injury is related to a metabolic dysfunction that causes injury to either the pollen/ovule or embryo. This injury occurs when there is disruption to the plant membranes, plant metabolism or photosynthesis, that in turn causes either a few or all the fl orets to be sterile. Some evidence suggests that pollen grains in wheat may be sensitive to chilling and this results in sterility (Gusta, pers comm, 2006).
Melissa Rebbeck, Steve Curtin and Lawrence Gusta
3
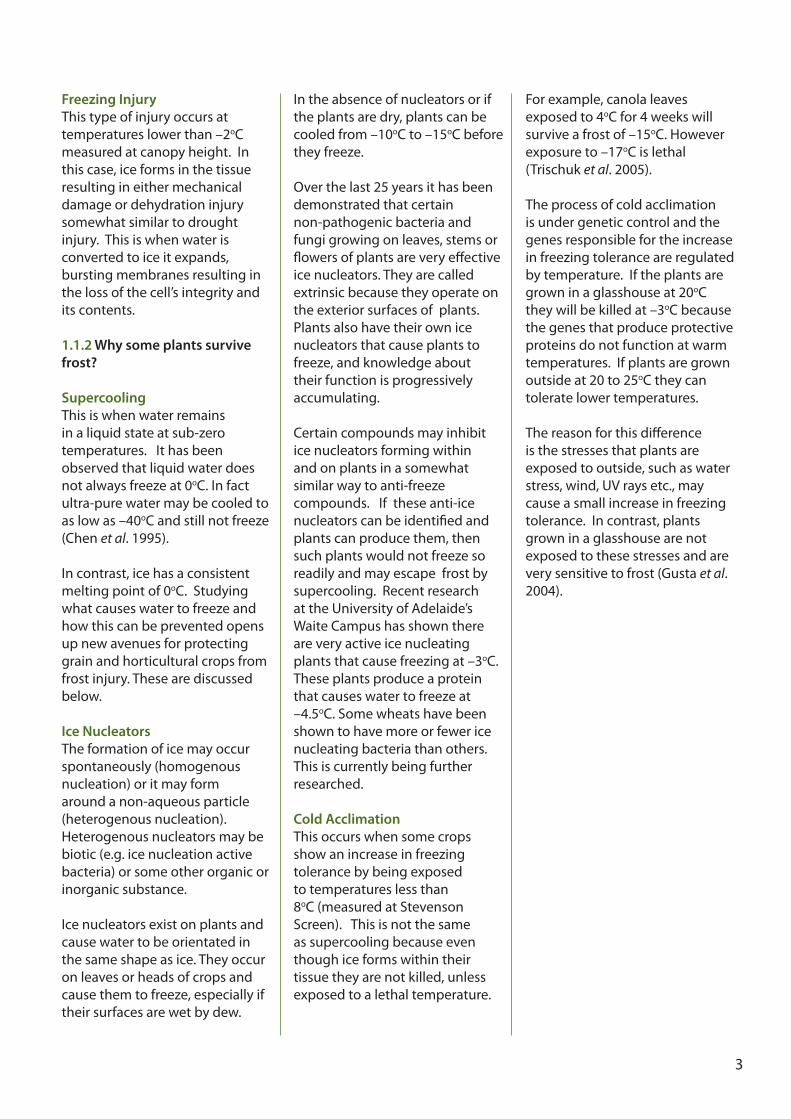
Freezing InjuryThis type of injury occurs at temperatures lower than –2oC measured at canopy height. In this case, ice forms in the tissue resulting in either mechanical damage or dehydration injury somewhat similar to drought injury. This is when water is converted to ice it expands, bursting membranes resulting in the loss of the cell’s integrity and its contents.
1.1.2 Why some plants survive frost?
Supercooling This is when water remains in a liquid state at sub-zero temperatures. It has been observed that liquid water does not always freeze at 0oC. In fact ultra-pure water may be cooled to as low as –40oC and still not freeze (Chen et al. 1995).
In contrast, ice has a consistent melting point of 0oC. Studying what causes water to freeze and how this can be prevented opens up new avenues for protecting grain and horticultural crops from frost injury. These are discussed below.
Ice Nucleators The formation of ice may occur spontaneously (homogenous nucleation) or it may form around a non-aqueous particle (heterogenous nucleation). Heterogenous nucleators may be biotic (e.g. ice nucleation active bacteria) or some other organic or inorganic substance.
Ice nucleators exist on plants and cause water to be orientated in the same shape as ice. They occur on leaves or heads of crops and cause them to freeze, especially if their surfaces are wet by dew.
In the absence of nucleators or if the plants are dry, plants can be cooled from –10oC to –15oC before they freeze.
Over the last 25 years it has been demonstrated that certain non-pathogenic bacteria and fungi growing on leaves, stems or fl owers of plants are very eff ective ice nucleators. They are called extrinsic because they operate on the exterior surfaces of plants. Plants also have their own ice nucleators that cause plants to freeze, and knowledge about their function is progressively accumulating.
Certain compounds may inhibit ice nucleators forming within and on plants in a somewhat similar way to anti-freeze compounds. If these anti-ice nucleators can be identifi ed and plants can produce them, then such plants would not freeze so readily and may escape frost by supercooling. Recent research at the University of Adelaide’s Waite Campus has shown there are very active ice nucleating plants that cause freezing at –3oC. These plants produce a protein that causes water to freeze at –4.5oC. Some wheats have been shown to have more or fewer ice nucleating bacteria than others. This is currently being further researched.
Cold AcclimationThis occurs when some crops show an increase in freezing tolerance by being exposed to temperatures less than 8oC (measured at Stevenson Screen). This is not the same as supercooling because even though ice forms within their tissue they are not killed, unless exposed to a lethal temperature.
For example, canola leaves exposed to 4oC for 4 weeks will survive a frost of –15oC. However exposure to –17oC is lethal (Trischuk et al. 2005).
The process of cold acclimation is under genetic control and the genes responsible for the increase in freezing tolerance are regulated by temperature. If the plants are grown in a glasshouse at 20oC they will be killed at –3oC because the genes that produce protective proteins do not function at warm temperatures. If plants are grown outside at 20 to 25oC they can tolerate lower temperatures.
The reason for this diff erence is the stresses that plants are exposed to outside, such as water stress, wind, UV rays etc., may cause a small increase in freezing tolerance. In contrast, plants grown in a glasshouse are not exposed to these stresses and are very sensitive to frost (Gusta et al. 2004).

4
1.2 Frost Events
1.2.1 Frost typesThere are two major types of frost:
Radiation FrostThis is the most common type of frost in southern Australia and it occurs where heat is lost (or radiated) from the ground to the sky resulting in rapid cooling of the ground and surrounding air. Radiation frosts occur under calm conditions when the atmosphere is relatively dry. Overnight temperatures at ground level (where heat is being lost) can be up to 5°C lower than those measured in a Stevenson screen. Diff erences of 10°C have been recorded.
As a general rule, air temperatures will drop by about 1°C per hour during the night when conditions favour the development of a radiation frost. Radiation frosts are the main cause of frost damage to cereal crops, fruit, grapes and pasture plants.
Figure 1.1a shows a high pressure system moving slowly into SA causing a radiation frost event in the southern and lower south-east regions. The corresponding temperatures recorded at Bureau of Meterology (BOM) weather stations were –3oC in the lower south east and below 0oC in the south east.
Advection FrostThese are rare in southern Australia. They are caused by very cold and often extremely dry air being advected or blown into an area by the wind. For example, on a clear still night if a high pressure system moves in quickly and the air mass is cold and dry, conditions are ideal for this type of frost.
White Frost If the air is moist at the time of the frost, dew will form on the ground before the temperature falls to 0oC. When this temperature is reached, the dew freezes to give a coating of whitish ice crystals on exposed surfaces: hence the name white frost.
Black FrostThis develops when the dewpoint (the temperature at which dew forms) is below 0oC. In this case, the frost develops without any visible sign of white ice appearing on exposed surfaces. These frost events are more common in dry or drought years where moisture levels are low.
1.2.2 Atmospheric events leading up to a frost Atmospheric events most likely to cause a frost include:
• A slow moving high pressure system centered to the east of SA, directing an overland air stream from a dry air mass, with light wind speed and no cloud cover overnight.
• A cold outbreak with quite strong winds moves through during the afternoon. A high pressure system rapidly follows the depression. The very cold air mass “decouples” the wind in low atmospheric levels and very often the still unstable nature of the airmass allows fairly clear skies.
Frost can form in the period just before dawn.
• A cold, cloudy day followed by a calm night where all the cloud cover disappears.
• A rapid drop in air temperature after 3 PM (with temperatures starting around 16°C and dropping to 1.5°C within 30 minutes with no air movement.
• A gradual drop in the “dew point” (the parameter that measures atmospheric moisture). As the air mass dries during the evening, frost can develop as long as light winds and clear skies prevail.
Trial observations conducted by Ian Foster from the Department of Agriculture and Food, WA, found that certain atmospheric conditions in Western Australia are almost always present leading up to a frost event. These are summarised in Table 1.1 below.
Table 1.1: Atmospheric conditions leading up to a frost event
Measurement 3 pm - 6 pm 6 pm - 9 pm Frost
Temperature at Screen Height 16�8oC 12�6oC <2oCCloud Cover very low low nilWind Speed <3 m/s <1 m/s 0 m/sBarometric Pressure 1008-1009 1008-1009 1004-1008

5
Synoptic Charts Figures 1a, b and c are synoptic charts leading up to a radiation frost on the morning of the 9th of October. The high caused cold dry still air to be brought in from Antarctica, as air moves in an anti-clockwise direction.
Figure 1.2 shows the minimum temperatures recorded at BOM weather stations on the morning of the 9th of October. Source: www.bom.gov.au
1.2.3 Atmospheric events during a frostAtmospheric conditions during a frost are diff erent from those leading up to a frost. They include:
• Atmospheric humidity must be low.
• Low dew point of less than 2.2oC (dry air) leads to a rapid fall in temperature.
Figure 1.1c: MSL pressure hPa 4am, 10th October 2006 * MSL means Mean Sea Level Pressure
Figure 1.1a: MSL pressure hPa 4pm, 8th October 2006
Figure 1.1b: MSL pressure hPa 10am, 9th October 2006

6
1.2.4 Atmospheric inhibitors of frost
Moist Air MassesThese have a higher dewpoint and inhibit frost. If moisture content is high, condensation will occur as dew or fog. As moisture changes from a vapour to a liquid, a further drop in temperature is inhibited by
the release of latent heat.
WindA wind speed even as low as 3 to 5 km/hr will enter the atmosphere and prevent layering of cold dense air and hence frost formation. Cold air moves like water and fi lls hollows and low-lying ground.
Figure 1.3 shows how a frost could have developed but did not due to wind at Keith in 2002. Temperature around the crop heads decreased below 0OC at 3.30 am, however at the same time wind gusts occurred mixing cold air with warmer air and the temperature rose. This is termed a ‘phantom frost’.
Figure 1.2: Minimum temperature for 9th October 2006
Minimum Temperature (oC)9th October 2006
Product of the National Climate Centre
45OC42OC39OC36OC33OC30OC27OC24OC21OC18OC15OC12OC9OC6OC3OC0OC-3OC-6OC
http://www.bom.gov.au© Commonwealth of Australia 2006 Australian Bureau of Meteorology
Figure 1.3: Phantom frost at Keith, SA in 2002
Tem
pera
ture
(OC)
or G
ust S
peed
(kph
)
Date & Time 10pm 12am 2am 3am 4am 5am 6am 7am
Temperature

7
Table 1.2: Minimum temperature criteria to issue frost risk warnings in South Australia
LocationFrost Risk Rating (oC)
Nil Slight Moderate HighRenmark Airport ≥4 2 to <4 -1 to <2 <-1
Murray Bridge ≥7 5 to <7 2 to <5 <2
Adelaide Airport
(Western suburbs)≥5 3 to <5 1 to <3 <1
Adelaide Airport
(Salisbury, Virginia & Two Wells)≥7 3 to <7 1 to <3 <1
Virginia
(Salisbury, Virginia & Two Wells)≥6 4 to <6 1 to <4 <1
Nuriootpa
(Barossa)≥5 3 to <5 1 to <3 <1
Coonawarra ≥5 3 to <5 1 to <3 <1
High Dew PointGenerally if dewpoint in the evening exceeds 5.5oC then there will be suffi cient radiation returned by the atmosphere from ground heat-loss to retard the rate of cooling. This process limits frost development.
Cloud CoverAll cloud, but especially low cloud, acts as a blanket trapping in radiation heat. This reduces the cooling rate of the earth’s surface and lower atmosphere, thereby inhibiting frost formation.
HumidityA dryness of the air mass and soil are important in the formation of frost. If the air mass is humid and cools to below the dew point, the release of latent heat slows the rate of fall of the air temperature.
Similarly if the soil is moist, latent heat released near the ground will slow the rate of temperature decrease. Most horticulturists are familiar with the use of sprinklers to ease frost risk.
Frost Frequency and OccurrenceThe severity of frost damage depends on landscape factors such as location, topography, soil moisture, soil type, vegetative cover, crop species and variety, duration at the minimum temperatures, and rate of thawing. For more information see Chapter 3 or visit: www.agronomy.psu.edu
Frost commonly occurs in valleys because cold dense air drains into lower-lying areas during the night. Air temperature decreases with height and frosts occur more frequently at higher elevation.
1.3 Frost Watch
1.3.1 Criteria for risk warningsThe criteria for high, moderate, low or nil frost-risk varies from region to region and is based upon temperature and dew point as well as the types of crop grown in the region and their stages of growth (see chapter 4 for more on stages of growth).
The Bureau of Meteorology in South Australia uses minimum temperature forecasts, shown in Table 1.2, as a guide for issuing frost risk warnings each afternoon for the areas listed. At frost risk times of the year, the Bureau of Meteorology distributes frost warnings at 4pm daily to the media for public dissemination and publishes these warnings on their website.
While frost forecasts are not available for the next night, at many centres minimum temperature outlooks are available and this may give further guidance.
Source: Bureau of Meteorology

8
Automatically generated temperature outlooks are produced by the BOM and can be accessed at their website:http://australianweathernews.com/OCF/OCF_024.HTM
There are also a number of websites where historical records of frosts are recorded. These can usually be checked on the morning of the frost depending on when the temperatures were recorded or the satellite image was taken.
Figure 1.4 shows temperature variations in SA for a frost that occurred on the 16th of October 2004.
Other images can be found for diff erent areas in Australia such as in Figure 1.5 which shows satellite images from National Oceanic and Atmospheric Administration (NOAA) for temperatures at given times. Access is restricted to certain areas and may be limited depending upon where NOAA Satellite is at the time.
Figure 1.4: Temperature variations on 16th October 2004
6420
-2-4
Minimum Temperature (OC)

9
Figure 1.5: Satellite images from NOAA for temperatures on 8th October 2006
Keith
1
0
-1
-2
-3
-4
Temperature (OC)
1
0
-1
-2
-3
-4
Temperature (OC)
Keith

10
1.3.2 Frost watch in Western Australia A number of live weather stations are run by the Department of Agriculture and Food, Western Australian (DAFWA). These record up to the minute information on climatic conditions and can be readily accessed.
Major frost events are recorded by satellites which provide land surface temperatures. Frost maps are then generated by the Department of Land Information (DLI) and can be viewed at their website www.rss.dola.wa.gov.auBoth current and historical maps are available.
Figure 1.6 is an example taken from the DLI website.
It shows a typical frost incidence with the blue colouration representing coldest temperatures.
The maps are usually rescaled to -7°C during the peak frost period so that the coldest temperatures show up clearly in deeper blue.
Note:
• Pixel size represents 100 ha or 1 square kilometre.
• The positional accuracy of the pixels is plus or minus half a kilometre.
• Within each pixel, temperature is an average surface temperature within that area.
• The image represents a snapshot of the surface temperature some time between 4:00 to 6:00am.
• Converting from a surface temperature to screen temperature is diffi cult because the relationship between the two can vary from site to site.
Figure 1.6: Land surface temperatures on 4th October 2006

11
Figure 1.7: Farm scale map highlighting intensity of frost in Western Australia
The DLI web site can also produce farm scale maps which highlight the intensity of frost over parts of the farm or localised areas. They include local features such as roads to make farm location easier. They are not reliable for paddock scale verifi cation. A typical map highlighting the intensity of frost is shown in Figure 1.7 (low temperature areas are in blue). Cost depends on farm size and area selected but usually starts at $120.
On the DAFWA website, farmers can access real-time and historical weather data. This includes daily and monthly precipitation, air and soil temperatures (40 mm underground), humidity, wind speed and direction.
Go to www.agric.wa.gov.au and click on “Climate” under Topics and then follow the links to ‘Real time and historical weather data’.
There are a number of stations located at key locations through the Western Australian wheatbelt.
This website also has links to long-term frost risk maps. These maps show the average monthly occurrence of low temperature events over the agricultural region of Western Australia during July, August, September and October.
The maps use a combination of BOM and DAFWA climate data over the past 16 years. This gives an indication of recent climate and improves the spatial coverage of the map.
These maps do not show actual observations of frost, but use the occurrence of minimum temperature of ≤2oC as an indicator of frost risk potential.

12
This chapter covers the balancing act of wheat fl owering early enough to avoid hot dry spring conditions and late enough to avoid frost. Wheat variety selection, sowing time and fl owering time interact to provide strategies for minimising the risk of frost. For each variety and locality, optimum sowing time is dictated/adjusted by the time it takes the variety to fl ower which must avoid the most likely frost events. New predictive models for frost are showing promise.
‘The fear of frost does more damage than frost itself’Dr Bill Single (pioneering Australian frost researcher)
In frost prone areas, wheat is often fl owering and developing grain much later in spring than would be ideal. Managing frost risk is a balancing act between the crop fl owering too early and possibly suff ering frost damage and fl owering later, when sowing is delayed, but yielding less because the crop suff ers moisture and heat stress from fl owering through to grain maturity (see Figure 2.1).
With perfect knowledge, grain farmers would aim for their wheat crop to fl ower immediately after the last frost in spring. However, the date of last frost can only be estimated with probabilistic forecasts.
2.1 The Risk of Frost
Some growers and agronomists work on the rule of thumb that a 10% frost damage means that crop development was about right for that year. However, with just a degree colder conditions, frost
damage in crops might escalate to over 90% and the ideal time that just touches the frost window in one year is unlikely to be the same for the following year. This is why risk management must be practiced.
Producers often miss sowing opportunities in late April or early May to reduce the risk of their wheat fl owering when the probability of frost events are high. Seasons with early sowing opportunities can account for up to 80% of long-term farm income, and hence the impact of later sowings on farm returns can be signifi cant.
2.1.1 Yield penalties from delayed sowingA common rule of thumb is that a yield loss of about 5% occurs for each week that sowing is delayed after the optimum.
The Balancing Act of The Balancing Act of Managing Frost RiskManaging Frost Risk
2
Peter Hayman, Bronya Alexander, Garren Knell and Melissa Rebbeck
CHAPTER TWO

13
Figure 2.2: Eff ect of delayed sowing on grain yields at Minnipa, South Australia
The Balancing Act of Managing Frost Risk
In Western Australia, the general rule is that delayed sowing incurs an average grain yield penalty of 20 kg/ha/day (this is equivalent to about 5% per week after optimum sowing date of a 3 t/ha crop). However, while true on average, it is highly variable from season to season.
Research by Fisher et al. (2006) has shown that the yield decline per day from delayed sowing varied from 0 to 50 kg/ha/day depending
on spring rainfall.
Although there are some years when later sown crops happened to get some November rain and yielded higher than the earlier sown crops, this is the exception rather than the rule. Indeed, most farmers would agree that if there was no frost concern, earlier sowing is generally preferable (see Figure 2.2).
2.1.2 Economic costs of delayed sowingThe cost of lower yields associated with delaying sowing is estimated to be as high as $18.4 million per annum for WA alone. In years where early sowing opportunities are missed in order to minimise risks of frost damage to wheat, the opportunity cost is estimated to be large ($53/ha). On average, the yield penalty for delayed sowing of wheat is $12 per ha per week (Consult Ag 2002).
Figure 2.1: Relationship between monthly minimum temperatures and monthly rainfall at Snowtown, SA showing period of frost risk
Gra
in Y
ield
(t/h
a)
Sowing Date
29-Apr 13-May 27-May 10-Jun 24-Jun 08-Jul 22-Jul
3
2.5
2
1.5
1
0.5
0
1989 Spear
1989 L93
1990 Spear
1990 L93
Minimum Temperature
Rainfall
Frost Risk
FloweringSowing
Min
imum
Tem
pera
ture
(OC)
16
14
12
10
8
6
4
2
0
60
50
40
30
20
10
0
10-Dec 9-Jan 08-Feb 10-Mar 09-Apr 09-May 08-Jun 08-Jul 07-Aug 06-Sep 08-Oct 05-Nov 05-Dec 04-Jan
Rain
fall
(mm
)

14
Table 2.1 is an estimate of the likely loss of yield and income from delayed sowing at four locations, two in South Australia and two in Western Australia. For example, at Geranium (a frost-prone area in SA), if a sowing opportunity is missed in the second half of April because of concerns about frost risk, on average farmers will have to wait a further 26 days for a follow up rainfall event of 15 mm over 3 days to provide another sowing opportunity. This delayed sowing reduces grain yield potential by approximately 520 kg/ha.
In many situations the yield loss associated with delayed sowing of a whole program will out-weigh the average loss from frost damage. Thus, it is important to delay sowing only on paddocks identifi ed as having high frost risk.
Assumptions for calculations in Table 2.1:
• Farm Gate Price (FGP) for wheat of $220/T and penalty for delayed sowing 20 kg/ha/day.
• SA needs 20 mm over 3 days in April to begin wheat sowing.
• SA needs only 15mm in May/June over 3 days for wheat sowing to begin.
• WA needs 15 mm in April/May over 3 days to begin sowing wheat.
• WA needs only 10 mm in May/June over 3 days for wheat sowing to begin.
Table 2.2 shows data from a 2004 frost trial at Varley, WA. The trial was severely frosted on the 11th of September when it was below 0oC for 12 hours and reached –4oC.This shows that in the presence of frost, later sown crops can avoid the frost and out yield the early sown frosted wheat.
The short season wheat (Wyalkatchem) that was sown on the 9th of May, was fl owering at the time of the frost event and became severely frosted. When harvested there was no grain and the plot had a negative gross margin (–$213/ha).
The 50-50 blend of the long and short season varieties yielded 500 kg/ha and had a gross margin of –$133/ha. The short season wheat in this mix did not contribute to grain yield. The long season wheat (Yitpi) although severely stem frosted at late booting had a higher grain yield (900 kg/ha) and a gross margin of –$69/ha. The plots can be seen in Figure 2.3.
Stiletto wheat, also a long season variety, was sown 10 days after initial sowing. These plots were at early booting at the time of the frost event and the site yielded 2.14 t/ha and resulted in a gross margin of $129/ha.
This trial demonstrated how delayed sowing of a long season variety may avoid frost damage. It also indicates that having a mix of sowing times and variety maturities across frost prone paddocks may be a useful strategy for hedging bets against early or late frost risks.
Table 2.1 Estimated cost of delayed sowing of wheat to minimise impact of frost Days delay
Loss (kg/ha)
Loss ($/ha)
Years of early rain (%)
AverageLoss ($/ha)
Merredin, WA 18 360 $79 20% $16
Narrogin, WA 10 200 $44 31% $14
Geranium, SA 26 520 $114 21% $24
Booleroo, SA 21 420 $92 17% $16Rainfall probabilities derived from Rainman
Table 2.2: Eff ect of sowing date and wheat variety on grain yields and gross marginsWyalkatchem
(Short Season) 50-50 Blend Yitpi(Long Season)
Stiletto(Long Season)
Sowing Date 9th May 9th May 9th May 19th May
Yield (t/ha) 0 0.5 0.9 2.14
Gross Margin ($/ha) –$213 –$133 –$69 $129

15
2.1.3 Estimating fl owering dateOptimum sowing time is important. However, two varieties sown on the same day will not fl ower on the same day. Also, the same variety sown on the same day, in two diff erent years, will fl ower on a diff erent number of days from sowing because of the seasonal temperature diff erences. This is because plants measure time by temperature (thermal time) or a combination of thermal time and day length:
• The warmer the days the faster the plant goes through developmental stages.
Growth rates of diff erent varieties are geared to thermal time in a similar manner and are aff ected diff erently by day-length (photoperiod) and chilling (vernalisation).
For frost prone paddocks, variety choice and therefore time of fl owering is one of the most useful strategies for avoiding frost. Consult Ag trials in WA indicate
that on frost prone sites, in 3 yearsout of 4, long-season wheat varieties were better at avoiding frost damage and generated higher returns than short-season varieties (see more on this in Chapter 4).
In almost all crop growing locations in southern Australia, the probability of receiving a damaging frost event in early
spring is signifi cantly higher than in late spring. Thus, by selecting varieties that fl ower later the chance of severe frost damage can be reduced.
Agricultural Production Systems sIMulator (APSIM) APSIM can calculate the fl owering date for diff erent plant varieties. SARDI Climate Applications Unit have compared APSIM simulated yields with real data collected over 10 years at Roseworthy by wheat breeder Dr Gill Hollamby. There is quite a range of days to fl owering for the mid-season variety Frame. Figure 2.4 shows that over a ten year period there is a wide range of days to fl owering, from 90 to 160 days. Most of this variability has been captured by APSIM.
Figure 2.4: Observed days to fl owering vs. APSIM Modelled days to fl owering at Roseworthy, SA over a 10 year period
Observed
APS
IM O
utpu
t
160
140
120
100
90
80 100 120 140 160
Figure 2.3: Blend of Yitpi and Wyalkatchem with healthy green Yitpi heads and frosted Wyalkatchem heads (Left) and 100% frosted Wyalkatchem (Right)

16
Figure 2.6: Climatic data to show the latest date when air temperatures were < 2OC each year from 1900 to 2005 at Snowtown, South Australia
Dat
e
26 Nov
5 Nov
15 Oct
24 Sep
3 Sep
13 Aug
23 Jul
2 Jul
11Jul
21 May
1900 1920 1940 1960 1980 2000
Flowering Calculator (FlowerCalc) FlowerCalc, produced by Department of Agriculture and Food WA (DAFWA) and adapted by SARDI for SA conditions, is a program that provides a graphic interpretation of fl owering time and the chance of frost or heat stress for a range of varieties. FlowerCalc allows you to choose the crop you sow, the sowing time and a location. The graphic output is similar to Figure 2.5 which illustrates when the chosen crop fl owers, and the frost risk or heat risk window. You can then determine if you should alter the sowing time to fl ower outside
those risky windows. To order a copy phone DAFWA on 08 9368 3333 or to gain outputs phone SARDI on 08 8303 9718.
Figure 2.5 shows Wyalkatchem wheat sown on May 10th will be at more risk from frost damage compared with Yitpi wheat sown on the same day. Yitpi will fl ower later in the season when the probability of frost is considerably less. Season length is only one component of variety choice. Yield performance over time, grain quality and income are other important factors. It is important for farmers to have fl exibility with
diff erent season length wheats so that they can play the season in early and late break years without increasing frost risk or risk of end of season drought.
2.1.4 Last date of minimum temperatureFigure 2.6 shows the last date of a minimum temperature less than 2OC in the Stevenson Screen for 1900 to 2005 at Snowtown, SA. This graph highlights the challenge of managing frost as the date of the last frost ranges from mid-July to mid-November.
Figure 2.5: Cumulative distribution of frost events at Corrigin, WA from 1957 to 2005, with estimated fl owering time of two wheat varieties, Wyalkatchem and Yitpi
Days
Chan
ce o
f fro
st e
vent
s (%
)19
57 -2
005
50
40
30
20
10
0
1 A
pr
12 A
pr
23 A
pr
4 M
ay
15 M
ay
26 M
ay
6 Ju
n
28 Ju
n
9 Ju
l
20 Ju
l
20 Ju
l
31 Ju
l
11 A
ug
22 A
ug
2 Se
p
13 S
ep
24 S
ep
5 O
ct
16 O
ct
27 O
ct
7 N
ov
18 N
ov
29 N
ov
Sowing
Wyalkatchemfl owering
Yitpi fl owering

17
2.2 Spatial Variability in Temperature
2.2.1 Variations within landscapes and localities
LandscapesAcross many farms, even in relatively fl at terrain, a diff erence of up to 4oC has been recorded. Cold air is heavy and will fl ow into any landscape hollows, providing there is no wind. Some farmers have used minimum temperature thermometers mounted on stakes in paddocks to record data for frost risk purposes. More recently, farmers have used low-cost data loggers.
LocalitiesFor frost risk warnings, it is also important to determine how much warmer or cooler diff erent paddocks are than the nearest meteorological station. Minimum temperatures are the climatic parameter that is most sensitive to location and frost risk prediction.
For example, in the town of Coonabarabran in central NSW, the Bureau of Meteorology moved the station from the town centre to the airport but still kept the old station open for comparison. They found diff erences as high as 90C on some cold, still nights.
Figure 2.7 shows diff erences in minimum temperatures recorded in 2004 at three diff erent positions with respect to a crop grown at Keith, SA. These include temperatures recorded by the Bureau of Meteorology at Keith township (retrieved through the Silo data set), from an Automatic Weather Station (AWS) set up in the fi eld at 1.5 m above ground level and at crop canopy height.
These last two recordings were obtained through the SARDI frost research trials. The data show that the crop canopy sensor is colder than the AWS recordings, which in turn are colder than the offi cial Bureau of Meteorology township data.
While the diff erences between crop canopy height and the Keith BOM weather station data were relatively constant, the greatest relative diff erences occurred on very cold frosty nights.
For frost risk management, consideration must also be given to the relationship between the crop in a paddock (not a single head or small plot) and temperature at screen height (not the temperature measured at head height). The situation in the fi eld is complex fi rstly because there are many cereal heads at diff erent stages of development and secondly air temperatures at diff erent points in the fi eld and canopy can be quite diff erent.
Figure 2.7: Diff erences in minimum temperature from crop canopy height, an Automatic Weather Station (AWS) in the fi eld, and the offi cial Bureau of Meteorology recording station for Keith, South Australia
Tem
pera
ture
Date
28 Jul 7 Aug 17 Aug 27 Aug 6 Sep 16 Sep 26 Sep 6 Oct 16 Oct 25 Oct 5 Nov 15 Nov 25 Nov
20
15
10
5
0
-5
-10

18
2.3 Activities for Workshops
The following training package aligns with National Accreditation Standards for learning.
2.3.1 Calculating the economic trade-off of delayed sowing for frost risk There are four key relationships that need to be estimated to characterise economic trade-off of delayed sowing, for a given variety, soil type, locality and starting soil moisture level. They are:
• Yield - for a range of sowing times. This can be derived either from experience, by a simulation model such as APSIM or using a rule such as 5% per week that sowing is delayed after optimum.
• Flowering date - for a range of sowing times, these can be derived from local trial data
or simulation models such as FlowerCalc or APSIM.
• Minimum temperatures - experienced during the fl owering window. This has to be based on historical data from the nearest meteorological station. But it is important to estimate whether a given paddock is colder or warmer than the station on a frosty night, and, if so, by how many degrees.
• Damage - from the minimum temperatures. As discussed earlier, the damage from a given minimum temperature event is not easy to determine. Some published studies exist and rules have been developed for programs such as WHEATMAN.
Table 2.3 is a simple spreadsheet model calculating the chance of minimum temperature for each
sowing date, using long-term records (in this case the Bureau of Meteorology site at Keith). The pie charts show that the chance of getting some frost damage (colours other than yellow) and the chance of getting <00C (light blue with black border) decrease as the crop is sown later. However the change in the risk is not dramatic and damaging frosts remain a low frequency-high consequence event.
The calculated long-term yield loss is simply the chance of a frost event occurring multiplied by the damage estimate from that event. For example, the fi rst column 61.2% x 0% loss + 18.4% x 10% loss + 14.3% x 20% loss + 4.1% x 25% loss + 2% x 80% loss equates to a long term average loss of 7.6%.
NOTE: It is important to note that results of this spreadsheet are very sensitive to assumptions. The purpose of this spreadsheet is for farmers and advisers in a workshop to vary some of the key assumptions.
Table 2.3: Investigating the eff ect of sowing date on frost risk and wheat yields for Keith, SASowing Date 15-May 01-Jun 15-Jun 30-JunWeeks delay 2.4 4.4 6.6
Penalty 12% 22% 33%
Yield 2.7 2.4 2.1 1.8
Days to Flower 117 114 111 106
Flowering Date 09-Sep 23-Sep 04-Oct 14-Oct
Chance of Minimum Temperature (Met Station) and Estimated Damage in the Field
>2 OC (assume no loss) 61.2% 61.2% 73.5% 73.5%
2 to 1OC (assume 10% loss) 18.4% 20.4% 10.2% 14.3%
1 to 0OC (assume 20% loss) 14.3% 12.2% 10.2% 8.2%
0 to -1OC (assume 25% loss) 4.1% 4.1% 4.1% 2.0%
-1 to -2OC (assume 80% loss) 2.0% 2.0% 2.0% 2.0%
-2 to -3OC (assume 90% loss) 0.0% 0.0% 0.0% 0.0%
-3 to -4OC (assume 100% loss) 0.0% 0.0% 0.0% 0.0%
Calculated Long-term Average Yield Loss from Frost 7.3% 7.1% 5.7% 5.2%
19
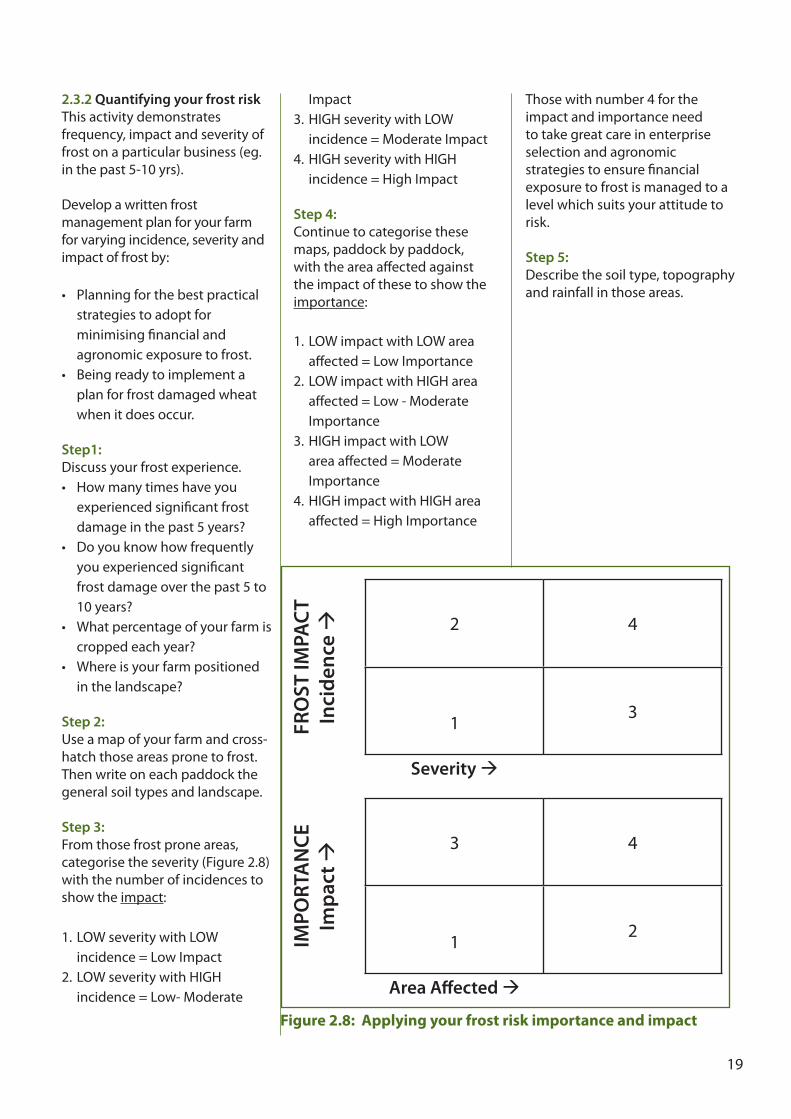
2.3.2 Quantifying your frost risk This activity demonstrates frequency, impact and severity of frost on a particular business (eg. in the past 5-10 yrs).
Develop a written frost management plan for your farm for varying incidence, severity and impact of frost by:
• Planning for the best practical strategies to adopt for minimising fi nancial and agronomic exposure to frost.
• Being ready to implement a plan for frost damaged wheat when it does occur.
Step1:Discuss your frost experience.• How many times have you
experienced signifi cant frost damage in the past 5 years?
• Do you know how frequently you experienced signifi cant frost damage over the past 5 to 10 years?
• What percentage of your farm is cropped each year?
• Where is your farm positioned in the landscape?
Step 2:Use a map of your farm and cross-hatch those areas prone to frost. Then write on each paddock the general soil types and landscape.
Step 3:From those frost prone areas, categorise the severity (Figure 2.8) with the number of incidences to show the impact:
1. LOW severity with LOW incidence = Low Impact
2. LOW severity with HIGH incidence = Low- Moderate
Impact3. HIGH severity with LOW
incidence = Moderate Impact4. HIGH severity with HIGH
incidence = High Impact
Step 4:Continue to categorise these maps, paddock by paddock, with the area aff ected against the impact of these to show the importance:
1. LOW impact with LOW area aff ected = Low Importance
2. LOW impact with HIGH area aff ected = Low - Moderate Importance
3. HIGH impact with LOW area aff ected = Moderate Importance
4. HIGH impact with HIGH area aff ected = High Importance
Those with number 4 for the impact and importance need to take great care in enterprise selection and agronomic strategies to ensure fi nancial exposure to frost is managed to a level which suits your attitude to risk.
Step 5:Describe the soil type, topography and rainfall in those areas.
FRO
ST IM
PACT
Inci
denc
e � 2 4
1 3
Severity �
Figure 2.8: Applying your frost risk importance and impact
IMPO
RTA
NCE
Im
pact
�
3 4
1 2
Area Aff ected �

20
Agronomic Practices to Agronomic Practices to Reduce Frost Risk Reduce Frost Risk
3
This chapter provides research results, from South Australia and Western Australia, on how various agronomic practices might reduce frost damage in crops. This can occur fi rstly by increasing radiant heat to soil surfaces during the daytime and then by manipulating crop canopy cover to increase heat transfer from the soil to reproductive organs during a frosty night. Some practices were shown to be benefi cial, and others were not.
3.1 Minimising Frost Risk
The main strategy used to minimise frost risk in broadacre cropping has been to sow crops later. Chapter 2 estimated the trade-off between delayed sowing and the resultant yield penalty. Risks exist with delayed sowing, even though this practice can reduce the probability of crops fl owering in a frost risk period. Crops sown later can still be aff ected by frost.
Manipulation of the soil heat bank to release heat, and manipulation of air fl ow within the crop, have both proven to be valuable agronomic options for reducing frost risk. They can be used in conjunction with delayed sowing or operate independently.
This section reports on a fi ve-year research project funded by GRDC, that examined the eff ects of agronomic practices on frost risk in broadacre agriculture in South
Australia and Western Australia. The research identifi ed strategies that could signifi cantly reduce the impact of frost.
Figure 3.1 shows that the main principles behind the research were to manipulate the soil heat bank to store heat during the day and release heat into the canopy of the crop at night. The research examined how the crop canopy could be manipulated to allow for warm air from the soil to rise and increase the temperature at crop head height.
Melissa Rebbeck, Garren Knell, Chris Lynch, Mick Faulkner
CHAPTER THREE

21
Figure 3.1: Temperature dynamics in a crop canopy and canopy interactions
DAYTIME NIGHT TIME
Maximise interception of incoming radiation
Outgoing radiation Outgoing radiation
MAXIMISE STORAGE OF HEAT
SoilALLOW HEAT TO BE RELEASED FROM SOIL
AT NIGHT AND REACH CROP HEADS
Soil surface
3.1.1 Importance of soil moistureSoil moisture is the most important factor for storing soil heat that will be released to and through the crop canopy at night. Because water has a high specifi c heat, radiation cooling overnight will be reduced when moisture is present in the soil (Truscott and Egan 2000). On a daily basis, heat is transferred into and out of approximately the top 300 mm of soil. When the soil is wet, heat transfer and storage in the upper soil layer is higher, so more heat is stored during daytime for release during the night (Schnyder 2001). There is also some evidence that moist soils can retain their warming properties for more than 24 hours, allowing some scope for an accumulation of heat from sunlight for more than one day.
Heavier textured soils hold more moisture (and therefore heat) than lighter textured soils.
A more dense soil can hold more moisture within the soil surface for heat absorption and subsequent release. Darker soils also absorb more light energy than lighter soils.
Water-repellent sandy soils are usually drier at the surface than normal soils, and are therefore more frost prone. Frost studies in SA by Fairbrother (1971) and Braunak-Mayer (2002) found that crops were likely to be more damaged on lighter soil types because the soil temperature is lower as a result of lower soil moisture and the more refl ective nature of these soils . On such soils, clay spreading or delving may be an option for reducing frost risk.
3.1.2 Use of agronomic practicesTable 3.1 shows the rankings of agronomic practices, adopted in both WA and SA, in order of importance. The table shows the paddock management strategies that manipulate the soil heat bank or manipulate the canopy air fl ow within the paddock, followed by paddock management strategies that also may assist crops to better tolerate frost. The fi nal column in the table shows the reduction in frost damage from adopting these various practices in frost prone regions (derived from project trials).
The frost avoidance strategies, described in Table 3.2, are whole farm approaches to reduce or spread risks of frost injury. The target yield component is discussed in more detail in Chapter 3.
Agronomic Practices to Reduce Frost Risk

22
Table 3.1: Agronomic practices to reduce frost risk ranked in order of importance
Soil Heat Bank Manipulation Ranking Description
Increased temp. at canopy height (ave)
Reduction in frost damage
1. Clay delving or clay spreading
In sandy surfaced soils, clay delving increases heat storage, nutrient availability and infi ltration rate. Reducing frost risk by increasing the clay content of sandy surfaced soils is the strongest fi nding in South Australia. For more information on delving contact SARDI.
1oC Up to 80 %
2. Rolling Rolling sandy soil and loamy clay soil after seeding has reduced frost damage, although the results were not statistically signifi cant.
0.5OC Up to 18%
3. Removing stubble Removing stubble had a negligible eff ect on yield and frost risk. The role stubble plays in retaining soil moisture could be more important.
0.5oC Minimal
Manipulation of the Crop Canopy Ranking Description
Increased temp. at canopy height (ave)
Reduction in frost damage
1. Blending varieties and variety selection
Blending long and short season wheat varieties is a way to hedge your bets against frost or end of season drought within the 1 paddock. A similar risk profi le occurs when sowing 1 paddock with each variety at the same time . Successful results have been achieved in SA & WA blending Krichauff or Wyalkatchem with Yitpi. Certain varieties, such as Yitpi, Stiletto and Camm, fl ower later.
Long-season varieties frequently avoid frost by fl owering later in the growing season, when frost incidence is less. To further reduce frost risk, these varieties should be sown towards the middle or end of a wheat sowing program rather than fi rst.
0
Yitpi 12% less
damaged than
Krichauff
2. Cross sowing Crops sown twice with half the seed sown in each run gives an even plant density and has been found to more slowly release the soil heat so that it can have an impact on air temperature at head height in early morning when frosts are most severe. This practice will incur an increased sowing cost. This result is based on 2 trials in WA.
0.6OC 13%
3. Wide row spacing Wide row sowing (e.g. 230-460 mm spacings) were ineff ective for reducing frost damage. Wide row crops consistently yield 10-15% less than the standard sowings with or without frost. In the presence of minor or severe frost, frost damage was similar for normal and wide row spacings.
0.2oC 0
4. Lower sowing rate A lower sowing rate (35–50 kg/ha) on frost prone paddocks has not yet been proven to minimise frost damage. In WA, the plants in thinner crops appear more robust and able to better withstand frost events. The extra tillers formed per plant spread fl owering time over a longer window. However, the crop is less competitive with weeds.
0 0

23
3.2 Manipulating Soil Heat Bank
Agronomic practices that may assist with storing radiant heat during the day and releasing heat into the crop canopy at night are described below.
3.2.1 Delving and clay spreading
DelvingDelving involves using wide bladed tynes to bring up deep clay subsoil for mixing with sandy topsoil. The blades are around 150 mm wide, 480-720 mm deep and about 1.4 metres apart. This type of machine brings up about 60-75 tonnes per hectare of clay, providing the clay is within reach of the tynes. Once clay is brought to the surface, it is broken up and some incorporation is still needed (Figure 3.2). Delving costs about $75 to $110 per hectare.
Delving diff ers from deep ripping which uses smaller blades (75-
80 mm wide) to disturb the clay beneath a sandy surface. We have not quantifi ed the interaction of deep ripping and frost on deep sandy soils. However delving is likely to be more eff ective for frost minimisation because it brings up clay through the profi le and to the surface. The more clay the more moisture and the more moisture the more heat.
Clay Spreading Clay spreading is the only option where clay is too deep in the profi le to be accessed by a delver. This involves fi nding a source of clay close to the soil in question. If suitable clay is located within 400 metres of where it is to be spread, then spreading 50-250t/ha ofclay will cost around about $225-$330 per hectare. Once the clay is spread it needs to be well incorporated into the topsoil. The aim is to gain between 6-9% of clay in the top 200 mm. Poor incorporation of the clay can
result in reduced crop yields in dry seasons because the clay absorbs moisture, restricting rainfall entering the soil profi le.
Advantages of delving and clay spreading:
• Increases topsoil water holding capacity thus increasing the potential for storage and release of heat and potential decrease in the eff ects of radiation frost.
• Delving can reduce frost risk by 80%.
• Reduces light refl ection from the soil, attracting more heat from the sun to store.
• Overcomes non-wetting properties permitting better crop establishment which also allows weeds to germinate and be treated before sowing.
• Improves crop growth and grain yield.
Table 3.2: Strategies to minimise and avoid frost damageFrost Minimising Strategies Description
1. Target yield
Some farmers and agronomists have observed that high input crops in frost prone areas are frequently more severely frosted than lower input crops with a lower target yield. WA trials have demonstrated that reducing N, P, K fertiliser and sowing rates reduced fi nancial risk. Returns and gross margins were competitive in absence of frost and signifi cantly better when frost damage occurred.
2. Conservative nitrogen application
WA trials found crops supplied with late and high applications of nitrogen (organic or inorganic) tended to receive more frost damage than crops with a lower supply. This may be due to changes in crop canopy or due to the chemical makeup of the cells. There is potential for large opportunity cost with this strategy in the absence of frost, so the practice is restricted to high-risk paddocks.
3. Delaying sowing
Delaying sowing on frost prone paddocks while sowing early on low risk paddocks is a sound frost avoidance strategy. While delaying sowing reduces frost risk it also increases the risk of end of season drought, on average the penalty for delaying sowing is estimated to be between 20-40kg/ha/day. See chapter 2 for more detail.
4. Low risk rotations
Growing more oats (approx 40C more tolerant) and long season Barley (approx 20C more tolerant) signifi cantly reduces losses from frost compared to wheat. Also consider having pasture based rotations on frost prone paddocks and avoid growing high risk crops such as fi eld peas, canola and Durum wheat.
Frost Avoidance Strategy Description
1. Grow hay or convert to permanent pasture
Growing hay on high frost risk paddocks is a good frost avoidance strategy. However, quality hay production can be a risky enterprise. Awnless varieties increase the opportunities to cut a cereal crop for hay. Some farmers have decided to convert highly frost prone paddocks to pasture based rotation.

24
Figure 3.2: Various manufactured delvers and their impact on soil
a) Delver machine is 7 m long
e) Delver blade has gone 550 mm into the soil
c) The delver blades go 480-720 mm deep
b) Delver blades are around 150 mm wide
d) Delver blades are ~1.4 m apart
f) 60-75 t/ha of clay brought up by the delverSource: Roger Groocock, Bordertown, SA

25
• Reduces wind erosion.• Enhances water and nutrient
availability. • Alleviates sub-soil compaction,
enabling better root growth and nutrient uptake.
Disadvantages of delving and clay spreading:
• The cost of clay spreading is expensive ($225-$330/ha) compared with delving ($75-$110/ha).
• Crop yield can be reduced in the fi rst year, after claying, if the clay is poorly incorporated in a dry year.
• A large amount of clay on the soil surface absorbs small rainfall amounts restricting water entry into the crop root zone.
• Both clay spreading and delving increases the amount of water that is held by the soil and not available to plants. This can be a problem in low rainfall years.
Trial Results:
Clay SpreadingAt Ongerup, WA Consult Ag found that adding clay to sandy surface soils increased the temperature of the soil surface by an average of 0.33oC (Knell et al. 2002). They could not comment on the eff ectiveness of reducing frost damage as there was no frost at the sensitive times.
DelvingThe 2003 and 2004 trials at Keith, SA experienced severe frosts around fl owering, which reduced grain yield. Figure 3.3 shows crops grown in delved soil consistently out-yielded untreated soil.
Figure 3.3: Relationships between wheat grain yield and frost damage at Keith, SA in 2003 and 2004 (Solid line is a fi tted regression)
Figure 3.4: Relationship between frost damage and lowest canopy-height temperature in the four weeks around fl owering for crops at Keith, South Australia in 2003 and 2004
Frost damage (%)0 20 40 60 80 100
100
80
60
40
20
0Gra
in y
ield
(% o
f max
imum
)
control 2003delved 2003control 2004delved 2004
R2 = 0.83P < 0.0001
y = 100 - x93.4 - 1.44 x + 0.006 x2
2003
ControlDelved
r2 = 0.47P < 0.0001
Lowest temperature in 4 weeks around fl owering (oC)-4.5 -3.5 -2.5
60
40
20
0
Fros
t dam
age
(%)
2004
ControlDelved
r2 = 0.82P< 0.0001
Lowest temperature in 4 weeks around fl owering (oC)-6 -5 -4
100
80
60
40
20
0
Fros
t dam
age
(%)

26
This demonstrates the benefi cial eff ect of delving soil on reducing frost damage. Pooled data from both seasons shows frost damage accounted for 83% of the variation in grain yield, with grain size aff ected where frost damage exceeded 50%.
Conclusion:
Soil and canopy temperatures were consistently higher in the delved soil treatment. There was a signifi cant correlation between percentage frost damage in wheat and the lowest temperature at canopy height in the critical period of four weeks around fl owering (Figure 3.4).
Frost damage has accounted for 80% of the variation in grain yield, with a clear discrimination between delved and undelved controls in the relationship between frost damage and yield. Three factors may account for the yield benefi ts from delving sandy soil where clay is available to the delver:
• Reduced frost damage.• Increased water and nutrient
availability in topsoil.• Reduced mechanical
impendence due to soil ripping.
Reduced frost damage accounted for a substantial part of the delving eff ect in these experiments (Rebbeck et al. 2007).
3.2.2 RollingRolling consolidates moist soil providing a reduced surface area. This enables more radiant heat to be trapped and stored during the day compared with dry, loose soil. Moist and fi rm soil is a better conductor of heat and will cool slowly because heat removed at the surface by radiation is replaced
in part by heat conducted upwards from the warmer soil below. Accordingly, frost risk is greater on dry, loose soils. A fi rm soil surface and fl attened ground can be achieved by rolling the soil during sowing or post-emergence. This is achieved by towing a roller behind a seeder. Moisture must be present in the surface soil to achieve soil consolidation.
Rolling of sand dunes should be avoided unless there is adequate surface cover to prevent erosion and sand blasting of crops (Maynard 2002 pers. comm.). The Maynard family at Lameroo in SA have experienced best results from rolling sandy loams and our research has also achieved benefi ts on rolling clay spread soils.
Rollers can be made or purchased by the farmer (see Figure 3.5). Trial results indicate that diff erences in the weight or type of roller (rubber tyred or cement) has little eff ect, however a fl at soil surface needs to be achieved by the rolling equipment.
Press wheels are not as eff ective. The extra cost of fuel from towing a roller costs about $2.00/ha.
Advantages:
• Reduces but does not eliminate frost.
• Encourages moisture at the soil surface and therefore heat storage.
• Easier to harvest short crops.
Disadvantages:
• The rolling benefi ts of storing heat and facilitating heat exchange may be less pronounced when the soil is dry as there is reduced ability to store heat in the surface soil.
• Rolling may encourage inter-row weed germination.
• Post sowing pre-emergent rolling can increase wind erosion risks on susceptible soil types.
• Only roll post-emergence pre-jointing and when the crop is not under stress.
Figure 3.5: Fred Maynard with his roller at Lameroo, SA

27
Trial results:
Rolling showed increased temperatures at canopy height by up to 1oC and increased yield by up to 20%. In some years, up to 18% reduction in frost damage was measured in SA trials (Table 3.3). In all comparisons, yields on rolled ground were never worse than unrolled ground.
The rolling treatments at Keith, South Australia were conducted on clayed and untreated soil. The rolling treatment resulted in warmer temperatures, less frost damage and higher yields of Wyalkatchem wheat sown at 8” (203 mm) row spacings on both clayed and untreated ground. However, the results were not statistically signifi cant (Table 3.4).
Despite a general lack of signifi cant yield results, rolling seemed to increase temperatures at canopy height from 0.2oC to 1oC. In some years, this resulted in up to 18% reduction in frost damage and a 20% increase in yield. Temperatures of rolled clay-delved land were increased by up to 1oC. In all comparisons, yields on rolled ground were never worse than
those on unrolled ground and rolling is a sound technique for frost reduction on light textured and clay amended light textured soils.
3.2.3 Minimal stubble retentionThere are various crop stubble practices. Stubble can be cut high or low and may be burnt, slashed, left standing, or incorporated into the soil. Stubble decomposes faster where good levels of soil moisture exist.
The temperature of the air above stubble is more likely to be colder because materials, such as straw and other mulches, act as an insulator. They refl ect light during the day, and do not hold much moisture or conduct heat. Depending upon the type of stubble cover, the temperature below stubble is likely to be warmer, as thick stubble holds heat in the soil, preventing it from escaping.
Table 3.3: Results of rolling trials at various locations around South Australia
Year Soil type Location Yield Increase
Reduced Frost
Average Temperature
Increase
Temperature Diff erence on Coldest Night
2000 Sand Lameroo 18% NM NM NM2002 Sand Lameroo 20% NM NM NM2003 Sand Lameroo 16% NM 1oC 1 OC2004 Sand Lameroo 0.12t/ha No frost 0.2oC 0.74 OC2004 Sand Parilla NS No frost 0.1oC 0.14 OC2004 Sand and Clay Keith 10% 11-15% NS 0.29 OC2005 Sand Lameroo NS No frost 0.2oC 0.32 OC2005 Loamy mix Buckleboo NM No frost 0.5oC 0.52 OC2005 Sand Geranium 14.5% No frost NS 0.96OC2005 Sand Netherton NM No frost 0.02 OC 0.31 OC2005 Sand Buckleboo (S) NS No frost 0.55 OC 0.51 OC
NS = No Signifi cant eff ect, NM = Not Measured
Table 3.4: Outcomes of frost damage and yield for wheat after rolling and claying treatments applied to sandy soil at Keith, South Australia
Treatment
Ave Minimum Temperature at Crop Head
Height on 16tOctober
Ave % Frost
Induced Sterility
Ave % Frost
Distorted Grain
Ave Grain Yield
- Rolling- Clay -5.44oC 84% 17% 0.45 t/ha
+ Rolling- Clay -5.15oC 61% 18% 0.61 t/ha
- Rolling+ Clay -4.48oC 21% 1% 1.42 t/ha
+ Rolling+ Clay -4.37oC 7% 1% 1.56 t/ha

28
Advantages:
• Bare soil may increase the temperature of the crop at canopy height.
Disadvantages:
• Reduced soil moisture therefore less heat accumulates in the soil.
Trial Results:
Bare ground has been shown to be 0.5 to 1oC warmer than a closely mowed cover crop in horticultural situations (Lipman 2000; O’Connell & Schnyder 1999). This is shown in Table 3.5.
Experiment results at Mintaro, South Australia showed that on one particularly frosty occasion air temperatures above mulch were more than 2oC colder than above adjacent bare ground (Truscott & Lynch 2002).
In 2003, oat stubble applied to plots at Parilla, SA resulted in the temperature at crop head height being cooler by up to 1oC than where no stubble was added.
At Karoonda, South Australia in 2004, comparisons were made between standing stubble, slashed stubble or bare soil. No temperature diff erences were detected at crop head height and frost damage was similar between the treatments.
Added slashed stubble (applied to represent a normal stubble load) was 0.38oC colder on average than where stubble had been burnt. However, frost damage (somewhat variable across replicates) between these treatments were similar (Table 3.6).
At Hallett, Bute and Mintaro, South Australia in 2002 signifi cant juvenile crop damage from frost was observed in barley, pea and canola crops sown into heavy wheat stubbles resulting in up to 80% plant deaths in the fi rst four weeks after emergence. Where there was no stubble there were no plant deaths.
Stubble comparison trials at Keith in 2005 detected no signifi cant diff erence in temperature at canopy height, but bare soil was slightly warmer.
At Varley, Western Australia the addition of 4 t/ha of barley stubble under the crop canopy in 2004 resulted in 0.5oC colder air temperature at head height compared to the nil stubble treatment. During a severe frost event, below zero for 12 hours and minimum temperature of -4.4oC, this diff erence in head temperature made no diff erence to frost damage as all plots were 100% frosted.
Table 3.5: Diff erences in air temperatures experienced in orchards with diff erent soil management techniques
Ground PreparationCooler than Bare,
Firm, Moist Ground (oC)
Slashed cover crop, moist ground 0.5
Dry, fi rm ground 1.0
Low-growing cover crop, moist ground 0.5–1.5
Freshly cultivated, fl uff y ground 1.0–1.5
High cover crop 1.0–2.0
High cover crop, restricted air drainage 3.5–4.0
Table 3.6: Eff ect of stubble load on frost damage to wheat at Cooke Plains, SA in 2005 Data is for Treatment Replicates.
Average % Frost Damage Summary
Block Burnt Standing Slashed
1 24% 29% 37%
2 40% 32% 34%
3 29% 42% 39%
Average 31% 34% 37%

29
Conclusion:
Stubble loads used in the trials refl ected district practice, with some bare soil still being visible.
Although stubble retention is a very desirable farming system practice, lower minimum temperature at crop head height was detected in some trials.
The presence of stubble in these trial plots did not appear to increase or reduce frost risk in spring, regardless of whether it was slashed or left standing. It may be that stubble plays an important role in maintaining soil moisture, which in turn plays a much larger role in releasing heat to the crop canopy at night. There may also be a threshold of stubble over which moisture conservation benefi ts no longer apply and frost risk increases. It is possible that this threshold is rarely reached in much of the grain growing areas of SA and WA.
3.3 Manipulating Airfl ow Through the Canopy
Agronomic practices that facilitate warm air fl ow from the soil to canopy height to reduce frost risk, are described below.
3.3.1 Using diff erent varieties or blends of varieties to manipulate airfl ow through the canopy
At this stage there is no experimental evidence of superior frost tolerance of any commercially available varieties.
As discussed in Chapter 2, varietyselection is important to avoid crops fl owering in a period of frost risk. Later fl owering varieties are generally a better choice for avoiding frost risk.
It is theoretically possible that thearchitecture of certain varieties or types of cereals (wheat, durum or barley) may better facilitate airfl ow through the crop canopy and thereby allow heat to rise upto crop heads during frost susceptible times.
In an experiment at Mintaro in South Australia, at head emergence (after the 13th October), Buckley plots wereon average 0.13oC warmer thanTamaroi durum. This may be due to the broader fl oppy fl ag leaf in Tamaroi durum canopy compared to the more open canopy with erect leaves and a narrow fl ag leaf in Buckley, as shown inFigure 3.6.
Some farmers and agronomists have suggested blending varitieties in the same paddock as a means of managing frost risk.
Blending varieties involves the mixing of two or more diff erent varieties with diff erent agronomic characteristics such as height and maturity.
Maturity:
Diff erent maturities facilitate the varieties fl owering at diff erent times, so one variety may escape frost conditions.
Height:
Diff erent heights of crops encourages heat to rise from the soil to the heads of crops and also reduces a fl at surface, facilitating ponding of cold air on the top of the canopy.
Figure 3.6: More open and erect Buckley canopy (Left) vs thicker Tamaroi durum canopy (Right)

30
Advantages:
• Specifi c frost prone areas can be targeted with this blending variety option.
• The period of fl owering is broadened thus minimising frost risk.
• Diff erent height and plant growth habit (crop architecture) creates a more undulating canopy, that may assist the emission of warm air from the soil to reach and buff er cold temperatures around the crop heads on frosty nights.
• Large grain size in the non-aff ected variety can provide a suitable market sample if the other variety suff ers from shrivelled grain.
• Varieties of diff erent maturities, grown in separate paddocks, may result in high yield losses if two separate frost events occur. However, if the varieties were blended losses may be reduced.
• Trial blended yields were never lower than the lower yielding variety and never higher than the higher yielding variety.
Disadvantages:
• Frosted or shrivelled grain in one variety will downgrade quality of the non-frosted variety.
• If each variety would normally be segregated on delivery, then blended mixtures will be downgraded to the quality of the lower classifi cation.
• The trial results indicate the yield of the blend will not be as high as the yield of the highest yielding individual.
Yitpi vs. Wyalkatchem Trial Results:
Western AustraliaIn Western Australia the trial results, using Yitpi as the taller, long season variety and Wyalkatchem as the shorter, short season variety show that the blended plots yielded half way between the two varieties assessed separately (Table 3.7).
In the blended mixture, the two varieties behaved in the same way as they did when grown in a mono culture. The Yitpi fl owered after the frost event and was not damaged by frost. However, the short-season Wyalkatchem, either in the blend or mono culture, was frosted to the same extent. The taller, longer maturing Yitpi off ered no additional protection for the short season Wyalkatchem. There were also no large diff erences in temperature in the blended crop canopy and at head height compared with the two varieties sown separately.
South AustraliaIn South Australia, Yitpi and Wyalcatchem were also compared. As in Western Australia, Yitpi tended to suff er less frost damage and was higher yielding than Wyalkatchem (Table 3.8). However, this was not statistically signifi cant. The blend of these varieties did not appear to off er any frost tolerance advantage on sand. The blend performed better than the average of the parent varieties on clay delved land.
These trial results suggest that growing blended variety mixtures does not appear to be very useful in managing frost risk within a paddock but may be a useful strategy on a whole farm basis. The same frost risk management may just as easily be achieved across a farm by simply cropping diff erent paddocks with diff erent varieties if there is a single damaging frost. However if two separate frost events occur then a blend may be a useful tool in reducing losses.
Table 3.8: Varieties sown separately and as a blend at Keith, SA on sand or clay delved soil
Wyalkatchem (sand) Yitpi (sand) Blended Mix
(sand)
Frost damage (%) 84 74 76
Grain yield (t/ha) 0.45 0.56 0.44
Wyalkatchem(clay delved)
Yitpi(clay delved)
Blended Mix (clay delved)
Frost damage (%) 21 6 8
Grain yield (t/ha) 1.42 1.65 1.7
Table 3.7: Yield results of Yitpi, Wyalkatchem and a blend of both varieties sown in Western Australia
Wyalkatchem Yitpi Blended Mix
Yield (t/ha) 3.15 4.05 3.5
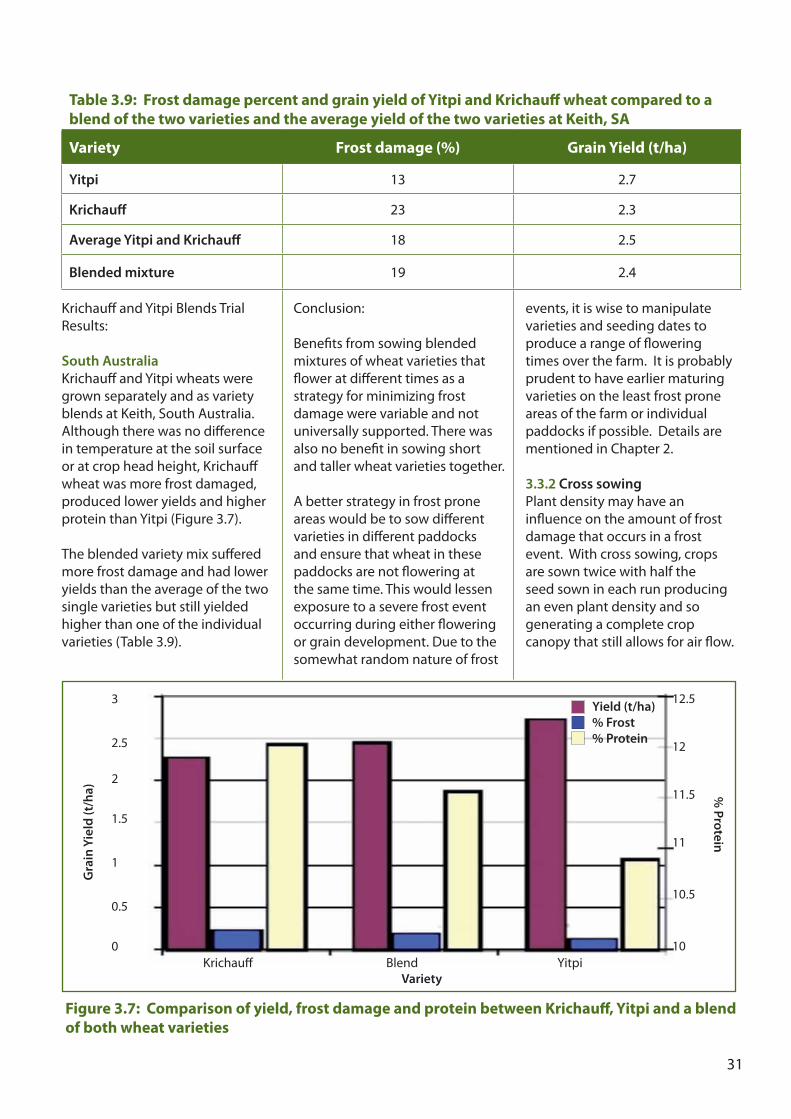
31
Krichauff and Yitpi Blends Trial Results:
South AustraliaKrichauff and Yitpi wheats were grown separately and as variety blends at Keith, South Australia. Although there was no diff erence in temperature at the soil surface or at crop head height, Krichauff wheat was more frost damaged, produced lower yields and higher protein than Yitpi (Figure 3.7).
The blended variety mix suff ered more frost damage and had lower yields than the average of the two single varieties but still yielded higher than one of the individual varieties (Table 3.9).
Conclusion:
Benefi ts from sowing blendedmixtures of wheat varieties thatfl ower at diff erent times as astrategy for minimizing frostdamage were variable and notuniversally supported. There wasalso no benefi t in sowing shortand taller wheat varieties together.
A better strategy in frost proneareas would be to sow diff erentvarieties in diff erent paddocksand ensure that wheat in thesepaddocks are not fl owering atthe same time. This would lessenexposure to a severe frost eventoccurring during either fl oweringor grain development. Due to the somewhat random nature of frost
events, it is wise to manipulate varieties and seeding dates to produce a range of fl owering times over the farm. It is probably prudent to have earlier maturing varieties on the least frost prone areas of the farm or individual paddocks if possible. Details are mentioned in Chapter 2.
3.3.2 Cross sowingPlant density may have an infl uence on the amount of frost damage that occurs in a frost event. With cross sowing, crops are sown twice with half the seed sown in each run producing an even plant density and so generating a complete crop canopy that still allows for air fl ow.
% Protein
12.5
12
11.5
11
10.5
10
Yield (t/ha) % Frost % Protein
Gra
in Y
ield
(t/h
a)
3
2.5
2
1.5
1
0.5
0
Figure 3.7: Comparison of yield, frost damage and protein between Krichauff , Yitpi and a blend of both wheat varieties
Table 3.9: Frost damage percent and grain yield of Yitpi and Krichauff wheat compared to a blend of the two varieties and the average yield of the two varieties at Keith, SA
Variety Frost damage (%) Grain Yield (t/ha)
Yitpi 13 2.7
Krichauff 23 2.3
Average Yitpi and Krichauff 18 2.5
Blended mixture 19 2.4
Krichauff Blend Yitpi Variety

32
Advantages:
• Lower frost damage.• Better weed competition
compared to low seeding rates or wide row spacing.
• No loss in yield compared to low seeding rate and wide row spacing.
Disadvantages:
• Additional cost ($15-20/ha) and time taken to sow the paddock twice.
Trial Results:
In 2005 in Western Australia, a single trial compared conventionally sown and cross-sown wheat crops at the sowing rates of 35, 65 and 95 kg/ha. The trials received a late frost that severely damaged the grain (Figure 3.8).
During these trials, conventionally sown crops were more frost damaged and lower yielding at all seeding rates compared to cross-sown crops. Cross sown crops kept more heat in the canopy and were always warmer at head height at the peak of the frost compared to conventionally sown crop rows.
The low density sowing rate on cross sown crops was also warmer, less frost damaged and higher yielding than conventionally grown crops at low sowing rate. This supports the premise that the cover does not need to be dense, just even. In the lower density crops, cross sowing was warmer than conventionally sown crops by 0.9 – 1.3oC. In the higher density crops, cross sowing was warmer by only 0.4 - 0.6oC.
Figure 3.8: Comparison of conventional and cross sowing treatments at three sowing rates on grain yield and percentage frost damage
Cross Sowing
Conventional
100%
80%
60%
40%
20%
0%
35kg/ha 65kg/ha 95kg/ha
Sowing rate
% fr
oste
d gr
ains
in h
eads
% Frost damage
Cross Sowing
Conventional
Yield Conventional vs Cross Sowing
2000
1500
1000
500
0
Yiel
d (k
g/ha
)
35kg/ha 65kg/ha 95kg/ha
Sowing rate
Conclusion:
Cross sowing on white sandy surfaced soils at all seeding rates, is another means of manipulating the crop canopy to make small increases in temperature at head height thus reducing frost damage and yield. Similar results have been observed in two trials over two seasons in Western Australia.
3.3.3 Wide row spacingWide row spacing may allow more airfl ow through crops, thus allowing soil heat to rise up to canopy height during frosts. However wide row spacings wereineff ective in reducing frostdamage to crops grown on bothsandy and heavy textured soil types in WA and SA. With the adoption of no-till technology, standard row spacings are around 220-250 mm (9-10”) compared to

33
conventional sowing systems of 180 mm (7”). The wide row spacings investigated in WA trials were 440–500 mm and in SA at Mintaro were 355 mm, shown in Figure 3.9, and 500 mm at Parilla.
Advantages:
• Fewer problems with stubble retention farming systems.
• Less soil disturbance and more moisture retention in drier seasons.
• Less repair costs on machinery. Disadvantages:
• Lower yields.• Weed control can be
compromised. • No reduction in frost damage
found to date.
Variations in row spacings compared on sandy soils in South Australia at Parilla (2003), Keith (2004) and Western Australian sites (2003-2005) had no eff ect on crop temperature, the amount of frost damage or crop yield. Similar results occurred on clay-delved soil at Keith in 2004.
In WA trials, narrow row crops were 0.3 - 0.5°C colder at head height than wide rows, but this diff erence did not persist in peak frosts. Temperature measurements throughout the canopy showed that narrow rows were warmer at soil level and 200 mm height.
Conclusion:
Wider row spacings were ineff ective in reducing frost damage to crops grown on both sandy and heavy textured soil types. It is suggested that wide rows receive more heat during the day
but lose it more readily at night, providing no benefi t in early
and early mornings when temperatures are coldest.
3.3.4 Sowing ratesA low sowing rate allows a more open canopy to develop and increases crop tillering. It also allows any heat in the soil to transfer to canopy height, thus reducing frost damage.
Advantages:
• Lower sowing rates gives rise to a less dense canopy that may allow more heating of the ground during the day and then allow this heat to transfer to around the crop heads at night.
Figure 3.9: Diff erences in canopy structure with 177 mm row spacing (Top) and more open canopy at 355 mm row spacing (Bottom)

34
• Increased tillering causes increased variation in fl owering
on a single crop plant.
Disadvantages:
• More weed competition at low sowing rates.
• Low sowing rates may also limit crop yield potential, especially in high yielding situations.
Trial Results:
The trials compared low sowing rates (~ 45 kg/ha) with higher sowing rate or district practice (~ 95 kg/ha).
Variations in sowing rates did not aff ect temperatures, frost damage, grain yields, screenings or protein levels in trials conducted at Keith, Mintaro and Parilla in 2003.
In 2004 at Keith, the lower sowing rates yielded higher on clay and corresponded with less frost damage. This is more likely attributed to the soil type than sowing rate.
On a sandy soil at Parilla in 2004, variations in sowing rate had no eff ect on minimum temperatures or the amount of frost damage in wheat. Grain yield from the high sowing rate was 0.22 t/ha higher than the low sowing rate treatment.
At Mintaro, during 2004 and 2005, on heavy soils sowing rate did not signifi cantly aff ect minimum temperatures at canopy height, the amount of frost damage or grain yield of wheat.
Conclusion:
Generally, low sowing rates did not reduce frost damage in crops, but increased weed competition.
3.4 Frost Tolerant Strategies
3.4.1 Minimising nitrogen supplyA survey of Mallee grain growers, after the severe 2000 and 2001 frosts, indicated that more frost damage in cereal crops occurred following a year when grain legumes were sown or where large quantities of urea were applied (Braunack-Mayer 2002). In WA, nitrogen fertiliser applied late in crop development is becoming more common to increase grain protein in wheat. Such applications may raise the freezing point of wheat tissue and increase potential for frost damage.
Increased biomass from high rates of nitrogen may dilute concentrations of water-soluble carbohydrates and other materials that in turn act as antifreeze agents by lowering the freezing point of plants (Karow 1999). Also, total water-soluble and fructan contents in tissues increase with cold treatment, and wheat genotypes with higher contents have greater frost tolerance (Vagujfalvi et al. 1999). There is also some evidence to suggest wheat plants take up late applications of nitrogen at the fl owering growth stage (Z31-39), as carbohydrates stored in the stems are translocated to the roots to encourage root growth. The store of carbohydrate in the stems increases osmotic potential of cells and lowers the freezing point of plants.
The highest temperature at which freezing can occur within plant tissues is partly determined by its moisture status (or water potential). The freezing point drops about 1oC for each 12 bar drop in water potential in the range of 0 to 10oC (Maylands and Cary 1970).
According to Loss (1987), cells with high concentrations of solutes have depressed water potential. If temperature diff erences at crop head height are not detected, but diff erences in the amount of frost damage are detected, then this may indicate that nitrogen has made the plants more susceptible to freezing damage at any given temperature.
Advantages:
• There is anecdotal evidence that applied nitrogen can increase frost risk and low nitrogen supply can reduce risk.
• Reduced nitrogen rates lowers cost of production if a frost event occurs.
Disadvantages: • In the absence of frost, lower
grain yield and/or protein may be achieved where soil nitrogen supply is sub-optimal.
Trial Results:
In Yealering, WA Wyalkatchem wheat was sown into lupin stubble on the 11th May 2005. The soil surface was sandy and the site had a history of being frosted. All treatments received 32 kg N/ha at sowing. Table 3.10 shows the results of low, medium and high nitrogen treatments, respectively as 10, 20 and 30 kg of N/ha applied as FlexiN in split applications at stages Z31 and Z39. The trial was damaged by a severe frost on10th of October, when the wheat was at the soft dough stage. Although grain yield was increased by late application of nitrogen, signifi cantly less frost-distorted grains were present in the lower nitrogen treatments (Figure 3.10).

35
The damage caused grain from the higher nitrogen treatments to be downgraded to feed quality. The nil nitrogen treatment was graded to general purpose and returned the highest net margin ($84/ha). This produced the lowest yields but highest gross margin due to lower expenditure on production and a higher grain price.
On a soil with relatively high soil nitrogen at Mintaro in 2003, variations in nitrogen fertiliser rates did not aff ect crop temperature, yield or the amount of frost damage.
At Mintaro, in 2004, the addition of nitrogen caused 4% more frost damage. In 2005 at Mintaro high nitrgoen rates (100 kg N/ha) were
applied on August 18th which did not aff ect yield or temperature at canopy height. However, a frost did not occur at fl owering. At Parilla in 2003, the applied nitrogen fertiliser did not aff ect frost damage.
Conclusion:
In WA, late application of nitrogen increased frost damage. While in SA, applied nitrogen increased frost damage in only one wheat crop.
In several of these trials, either poor seasonal conditions limited canopy development, carbohydrate metabolism and fi bre deposition or frost events had relatively minor impacts.While it is important to supply
adequate nitrogen to crops, in frost prone areas conservative rates of applied nitrogen fertiliser should be considered to minimise frost risk and fi nancial exposure.
3.4.2 Matching inputs to target yieldsFrost prone paddocks can be high yielding areas on a farm when frosts do not occur. Targeting fertiliser (N, P, K) and seed rates to achieve realistic yield targets should minimise fi nancial exposure, reduce frost damage and increase whole paddock profi tability over time. One successful farmer in a highly frost prone environment targets 80% of water use effi ciency and less than 10% protein in his frost prone paddocks or parts of paddocks and increases his expectations for less frost prone areas.
Other farmers minimise inputs into highly frost prone areas by utilising them for grazing or hay, and avoiding large scale exposure to highly susceptible crops like peas, or expensive crops like canola. Inputs saved on frost prone paddocks are better invested on lower risk paddocks.
Table 3.10: Nitrogen fertiliser rates (kg N/ha) and timing of application to wheat at Yealering, WA in 2005
N TreatmentNitrogen
kg/ha 11/5/05
Nitrogen kg/ha Z31
18/7/05
Nitrogen kg/ha Z39
23/8/05
Total N Supply
(kg N/ha)
Nil 32 0 0 32Low 32 5 5 42Medium 32 10 10 52High 32 15 15 62
Figure 3.10: Eff ects of late applied nitrogen rates on grain yield, number of frost distorted grains and net profi t for Wyalkatchem wheat grown at Yealering, Western Australia in 2005
3000
2800
2600
2400
2200
2000
1800
1600
1400
1200
1000
90
80
70
60
50
40
30
20
10
0
Yiel
d (k
g/ha
)
Nitrogen treatment by frosted grains and yieldNet profi t $/ha
Yield (kg/ha)Frosted grain
$84/ha
$43/ha
$28/ha$37/ha
Nil L M H

36
Advantages:
• Less fi nancial exposure.• Low input crops are frequently
less frosted than high input crops in areas of similar risk.
• Saved inputs can be invested in other areas of the farm where frost risk is low.
Disadvantages:
• Potential for lower yield in a frost free season.
Trial Results:
Trials have been conducted at Borden, Western Australia for 3
seasons. Treatments are given in Table 3.11. Fertiliser and seed rates were based on soil test results and were matched to target yields of 2, 3 and 4 t/ha (termed low, medium and high input treatments).
The soil types were typically 400-500 mm of sand over loamy clay and contained sound phosphate levels with a low phosphate retention index. The results are summarised below:
• In 2003, the high input treatment had 10% frost damage while the low and medium suff ered no damage.
• In 2004, an early October frost resulted in fl ower abortion causing a 20-30% yield loss in the high input treatment and only 5-10% yield loss in medium and low input treatments.
• In 2005, frost events occurred throughout the spring with temperatures below 0OC recorded on 15 diff erent occasions between August 29th and November 2nd. All plots were severely frosted, both at fl owering and during grain fi ll. The low input treatment lost the least amount of money (Figure 3.11).
Figure 3.11: Production economics for Borden frost trials in 2003, 2004 and 2005The red bars indicate input costs, the blue bars indicate gross margin low input strategy, and green bars indicate gross margin for medium inputs and yellow bars for high input. Average plot yields (t/ha) are listed above the bars.
$600
$500
$400
$300
$200
$100
$0
-$100
-$200
Yiel
d - I
nput
Cos
ts ($
/ha)
2003 2004
Low
Medium
High
Input costs
$600
$500
$400
$300
$200
$100
$0
-$100
-$200
Input Costs ($/ha)
2005
3.81 t/ha 3.79 t/ha 3.27 t/ha 3.26 t/ha 3.10 t/ha 2.99 t/ha
0.65 t/ha 0.36 t/ha 0.75 t/ha
Table 3.11: Target yield and corresponding seed and fertiliser rates (kg) for trials at Borden, Western Australia in 2003, 2004 and 2005
Target Yield 2003 2004 2005
T/ha Seed N P K Seed N P K Seed N P K
Low 2.0 55 28 8 0 30 16 4 5 35 18 8 10
Medium 3.0 55 56 12 26 60 44 15 15 55 42 12 15
High 4.0 90 83 21 38 90 80 21 23 95 75 17 20

37
Conclusion:
Aim to maximise profi t not yield on frost prone paddocks. Sow later, use lower sowing rates in addition to conservative phosphate and nitrogen rates. On frost prone paddocks, inputs should be matched to average actual yield from these areas. Using conservative inputs on these paddocks minimises fi nancial exposure and increases profi t. 3.5 Frost Avoidance Strategy
3.5.1 Growing hay on frost prone paddocksGrowing hay on frost-prone paddocks is a sound strategy to reduce farm business exposure to frost. Hay avoids the frost risk, as it is mown soon after fl owering, avoiding the frost sensitive period.
Oats are also much more tolerant than other cereals to frost events that occur during vegetative growth and fl owering.Advantages: • Exposure to frost damage in
cereals is reduced. • Enterprises are diversifi ed.• Frost prone paddocks usually
have soils that are highly productive in frost-free seasons.
Growing hay on these soils allows farmers to capitalize on the production potential while minimizing frost risk.
• Hay production provides good weed control.
• Hay does not require late fi nishing rains to maximise yield.
Disadvantages:
• Hay is a high risk enterprise, where timing of mowing and baling is critical for maintaining hay quality and price.
• Hay is a capital intensive enterprise and signifi cant capital can be absorbed by a hay growing enterprise.
• Late spring rains, which benefi t grain crops, can be devastating to hay quality and price.
• Freighting hay from farm to market can be prohibitive in some locations (average cost to transport a 6’x 4’ square bale $0.1/bale/km).
• The price of hay is notoriously volatile depending on supply and quality of hay each season.
• Hay removes 12 kg of potassium per tonne. Sandy, frost prone soils are often
marginal for potassium and the removed potassium must be replaced. At current prices 1 t of hay removes $20 worth of nutrients (N, P, K, S , trace elements and lime).
Economics: Hay can be an expensive commodity to produce and can achieve high profi ts or large losses depending on price, yield and cost of production, as shown in the gross margin sensitivity analysis in Table 3.12. The sensitivity analysis is based on a target hay yield of 8 t/ha. Realistic fertiliser inputs were included to achieve this yield. For example, a target yield of 8 t/ha and a farm gate price of $140/t, there is a gross margin of $395/ha. Signifi cant increases or decreases in gross margins can occur with small changes in hay yield or price.
It is assumed that the hay is grown 100 km from the point of sale and all mowing, baling, stacking and carting was priced at contract rates. The economics of producing hay will vary from location to location so it is important to understand your cost of production and likely returns before venturing into a hay enterprise.
Table 3.12: Hay gross margin sensitivity analysis showing fi nancial ramifi cations from fl uctuations in hay price and yield
Hay $/t -40% -30% -20% 0% 20% 30% 40%
YIELD PRICE 4.8 t/ha 5.6 t/ha 6.4 t/ha 8.0 t/ha 9.6 t/ha 10.4 t/ha 11.2 t/ha
-30% $98 -200 -135 -70 59 189 254 318-20% $112 -133 -57 19 171 323 399 475-10% $126 -66 22 109 283 458 545 632
0% $140 2 100 198 395 592 690 78910% $154 69 178 288 507 726 836 94620% $168 136 257 378 619 861 982 1,10230% $182 203 335 467 731 995 1,127 1,259

Conclusion:
Hay is a potentially lucrative option for frost prone paddocks compared with other crops. The enterprise depends on attitude to risk, distance to market and the cost of production.
3.6 Conclusions for Agronomic Practices
The main objective of the GRDC fi ve year research project was to study agronomic practices that may reduce frost risk. The research found that there are opportunities for reducing frost risk by modifying the properties of a sandy soil surface via rolling, delving or clay spreading. These strategies increase temperatures at crop head height during radiation frosts, and have reduced frost damage and achieved higher crop yields.
3.6.1 Manipulating soil heatSoil moisture is the key component for manipulating soil heat, as water can store a vast amount of heat due to its high specifi c heat.
The practice of delving subsoil clay into sandy soils reduced frost damage and increased crop yields by up to 80% because temperatures were 2oC warmer at canopy height. Rolling and clay spreading results were less conclusive and not always statistically signifi cant.
Removing large amounts of stubble can also provide benefi ts.Retaining light stubble loads achieves only small improvements in frost risk. Stubble retains moisture and therefore heat in the soil and this induces a secondary smaller eff ect of conducting heat through the crop canopy.
3.6.2 Manipulating crop canopyManipulating the soil’s capacity to store and conduct heat, allows for management of the canopy to better intercept and transmit this additional heat to head height, thus minimising frost damage in crops. Variety choice was shown to be important. Warmer temperatures and less frost damage were found in the less bulky wheat varieties, such as Buckley, due to it’s ability to retain heat through canopy structure.
Cross sowing has shown promising results in WA for protection against minor frosts. Warmer temperatures were recorded at head height compared with conventional sowing, and 19% less frost damage occurred with higher yields.
Sowing crops on wide row spacing did not increase frost protection. Trial results in SA and WA have also shown that low sowing rates provide little benefi t in reducing frost risk.
Blending mixtures of wheat with diff erent maturities may be a way of hedging bets against frost and end-of-season drought in any one paddock. A better level of protection could be achieved by sowing diff erent varieties in paddocks with diff erent degrees of frost risk. However, the main benefi t observed was by sowing a long-season variety to lessen the likelihood of frost damage.
3.6.3 Frost tolerant strategiesHigh nitrogen fertiliser inputs applied late in crop development increased frost damage in one trial in Western Australia. Lower inputs equate with lower fi nancial risk. Conservative levels of inputs in high frost areas should be part of the overall frost risk management
plan. Although in a non-frost year higher potential returns may be sacrifi ced.
It is important to recognise that while these agronomic practices may primarily reduce frost risk, they do not entirely remove the risk. Indeed, no single strategy will provide total frost protection. Chapter 2 indicates that modifying crop fl owering date to avoid known frost-risk periods should be part of an integrated program for minimising frost damage.
Farmers of frost prone land should develop a frost management plan, incorporating a range of frost minimisation strategies that can be undertaken in any given season. Such strategies will vary from farm to farm and possibly even between zones within paddocks. Frost strategies will also vary with fi nancial position of the business and individual farmer’s attitude to risk.
38

39
This chapter explains when fi eld crops are most vulnerable to frost damage and identifi es frost symptoms at diff erent stages of crop growth.
4.1 When are Crops Most Vulnerable to Frost Damage?
4.1.1 Frost damage vulnerabilityFrost damage to crops can occur when night air temperature (recorded 1.2 m above ground level) falls below 2oC.
Although frost damage can occur throughout crop development, greatest losses in grain yield and quality are observed when frosts occur between the booting and grain ripening stages of growth (see Figure 4.1 for wheat).
This is because during vegetative stages of growth, growing points of plants are protected by the warmer soil conditions. When plants begin stem elongation, the growing points of plants (the developing heads) move vertically and so become exposed to the aerial environment.
The exposed developing heads become progressively more susceptible to frost injury.
The most vulnerable stage is at crop fl owering when injury to the developing fl oral structures can decimate grain yield.
It is most important that frost damage is recognised early and not confused with other crop disorders exhibiting similar symptoms to those displayed by frosted crops (see later discussion). Correct diagnosis will allow crop salvage options to be implemented where necessary, and more informed whole farm business decisions.
The presence of white frost on the ground is not a reliable indicator, since a black frost can occur when soil moisture levels are low. An explanation of this is on page 4.
Identifying Frost Damage in Identifying Frost Damage in Wheat CropsWheat Crops
4
Melissa Rebbeck, Garren Knell and Trudi Duffi eld
CHAPTER FOUR

40
4.1.2 Which crops are most susceptible to frost damage?Frost risk is infl uenced by a variety of factors including:
• crop type and variety.• fl owering time.• soil type and condition.• atmospheric and soil moisture
levels.• crop nutrition and stress level.
For example, a late sown crop may be aff ected more than an earlier sown crop simply because
fl owering may coincide with a severe frost event (see Chapter 2).
Triticale is the most susceptible cereal crop to frost damage followed by wheat, barley, cereal rye and then oats. Field peas are the most susceptible pulse crop followed by faba beans and lupins.
4.1.3 How is frost damage assessed in cereals?Crop frost damage may be sporadic within a paddock. Not all plants will show obvious symptoms.
Symptoms may not be obvious until 5–7 days after the frost event has occurred.
Low-lying areas and light coloured soil types are normally most at risk and should be checked fi rst for damage. Then check other areas.
Crop inspection soon after the frost event is the only way to determine the level of frost damage. The eff ects on head development should be assessed by opening glumes to expose the fl owers and developing grains (see Figure 4.2). A magnifying glass, and tweezers or fi ne needle may be useful tools.
A second inspection should be repeated 5 to 10 days later when the damage will be more readily apparent. In frosted heads, no further development may have occurred and, in some cases, the young grain will be pinched. The heads will feel soft and spongy when squeezed between thumb and forefi nger.
Partly killed heads may look and feel lumpy because some of the fl owers have survived and grains are continuing to develop.
Frost damage is easier to pick in barley crops. The heads will usually change colour from green to silvery white within four to fi ve days of the frost.
4.2 What Frost Symptoms are Exhibited at Diff erent Growth Stages?
These have been summarised in Table 4.1, with reference to photos, displayed on the given page numbers.
Figure 4.1: Wheat susceptibility to frost damageSource: DAFWA ‘Cereals Frost ID - The Back Pocket Guide’
Z0 - Germination
Z1 - Seedling
Z2 - Tillering
Z3 - Stem elongation
Z4 - Booting
Z5 - Ear emergence
Z6 - Anthesis (fl owering)
Z7 - Milk development
Z8 - Dough development
Z9 - Ripening
Maturity
LOW HIGH
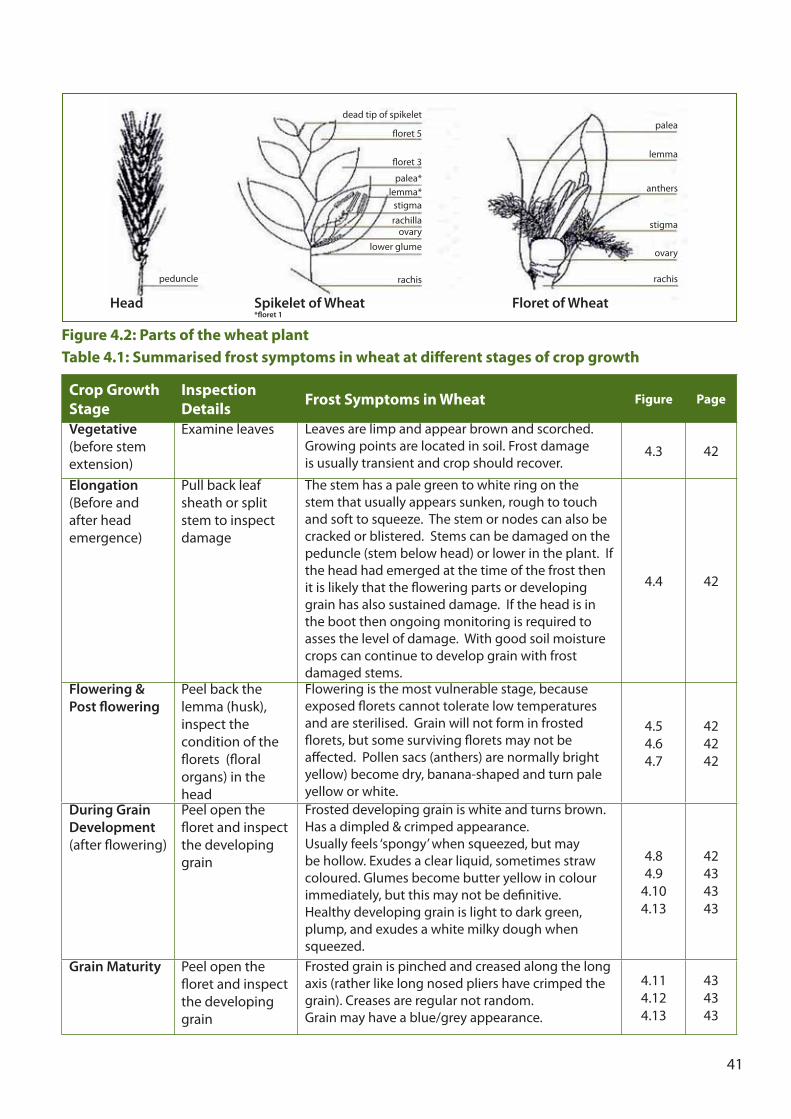
41
Table 4.1: Summarised frost symptoms in wheat at diff erent stages of crop growth
Crop Growth Stage
Inspection Details Frost Symptoms in Wheat Figure Page
Vegetative (before stem extension)
Examine leaves Leaves are limp and appear brown and scorched. Growing points are located in soil. Frost damageis usually transient and crop should recover.
4.3 42
Elongation(Before and after head emergence)
Pull back leaf sheath or split stem to inspectdamage
The stem has a pale green to white ring on the stem that usually appears sunken, rough to touch and soft to squeeze. The stem or nodes can also be cracked or blistered. Stems can be damaged on the peduncle (stem below head) or lower in the plant. If the head had emerged at the time of the frost then it is likely that the fl owering parts or developing grain has also sustained damage. If the head is in the boot then ongoing monitoring is required to asses the level of damage. With good soil moisture crops can continue to develop grain with frost damaged stems.
4.4 42
Flowering & Post fl owering
Peel back the lemma (husk), inspect the condition of the fl orets (fl oral organs) in the head
Flowering is the most vulnerable stage, because exposed fl orets cannot tolerate low temperatures and are sterilised. Grain will not form in frosted fl orets, but some surviving fl orets may not be aff ected. Pollen sacs (anthers) are normally bright yellow) become dry, banana-shaped and turn pale yellow or white.
4.54.64.7
424242
During Grain Development(after fl owering)
Peel open the fl oret and inspect the developing grain
Frosted developing grain is white and turns brown. Has a dimpled & crimped appearance.Usually feels ‘spongy’ when squeezed, but may be hollow. Exudes a clear liquid, sometimes straw coloured. Glumes become butter yellow in colour immediately, but this may not be defi nitive.Healthy developing grain is light to dark green, plump, and exudes a white milky dough when squeezed.
4.84.9
4.104.13
42434343
Grain Maturity Peel open the fl oret and inspect the developing grain
Frosted grain is pinched and creased along the long axis (rather like long nosed pliers have crimped the grain). Creases are regular not random.Grain may have a blue/grey appearance.
4.114.124.13
434343
Figure 4.2: Parts of the wheat plant
peduncle
lower glumeovary
rachilla
stigmalemma*
palea*
fl oret 3
fl oret 5
dead tip of spikelet
rachis
ovary
stigma
anthers
lemma
palea
rachis
Head Spikelet of Wheat *fl oret 1
Floret of Wheat

42
Figure 4.3: Vegetative frost damage
Figure 4.4: Frost aff ected stems
Figure 4.6: Frosted anther
Figure 4.5: Frosted banana shaped anther
Figure 4.7: Emerging wheat head
Frosted fl oret
Healthy developing grain
Figure 4.8: Frosted fl oret
Frost damaged fl oret
Frost damaged stems
Healthy stem

43
Figure 4.10: Healthy and frosted heads
Figure 4.9: Partially frosted heads
Fros
ted
Hea
lthy
Fros
ted
Hea
lthy
Figure 4.12: Healthy developing wheat grain
Figure 4.13: Healthy endosperm (above) and frosted endosperm (below)Figure 4.11: Healthy and frosted grain

44
Figure 4.14: Moisture stress
Figure 4.15: Crown rot Figure 4.17: Herbicide damage
Figure 4.16: Nutrient defi ciency
4.2.1 Other crop disorders Management and recent environmental conditions should be taken into account whendiagnosing any crop disorder. Other similar symptoms to frost damage are:
Moisture StressThe tips of ears are shrivelled and bleached. All heads are aff ected (see Figure 4.14).
Diseases These cause white heads. Aff ected plants contain grain that has formed but has not fi lled properly (see Figure 4.15). Aff ected plants often follow seeder rows.
Nutrient Defi ciencies These, such as copper defi ciencies, produce ‘rat-tail’ and droopy head symptoms (see Figure 4.16). Aff ected plants often occur in patches.
Herbicide Damage This damage causes distortion of heads and onion leaf type rolling of the fl ag leaf (see Figure 4.17).

45
4.2.2 GlossaryA glossary has been included to help understand the parts of the plant referred to in the text:
Awn: whiskerAnther: reproductive organ that contains pollenEar/head: A collection of fl orets (spikelet)Floret: fl ower of a cereal plantLemma: outer shell that contains the reproductive organsOvary: reproductive organ that when fertilized by pollen develops into grainPeduncle: stem attached directly to the wheat headStigma: small feathery organ below the anthers that receives and transmits pollen to the ovary

46
This chapter assesses options that farmers have for salvaging some fi nancial returns from crops that have either failed or incurred frost damage. The costs, potential benefi ts and risks for each option are summarised. A practical procedure for estimating grain yield losses in frosted cereals is also presented.
5.1 Damage Assessment
Step 1: Determining the extent and severity of frost damage Once a frost event (especially at or after fl owering) has occurred, the fi rst step is to obtain an estimate of the yield loss suff ered by inspecting the aff ected crop (see Chapter 4) and randomly collecting a sample of heads to estimate the yield loss incurred.
It is suggested that depending on paddock size and uniformity, a minimum of 3 transects should be sampled, each being 100 m apart in a paddock. Along each transect, two tillers should be collected randomly every 10 paces. The head and stems of each tiller are then inspected for frost damage.
The damage is assessed by recording the proportion of heads that are frost-aff ected (i.e. the proportion of heads where grain failed to form or fi ll).
The next step is to estimate from experience what the crop might have yielded if it had not been frost aff ected – its ‘potential yield’.
For example, if the potential crop yield was estimated to be 2 t/ha (2000 kg/ha), and four half-fi lled damaged wheat heads were found in 20 heads collected in a single transect (20% of heads), then the estimate of yield loss is:
20/100 x 1/2 x 2000 = 200 kg/ha
Thus, in this area of the paddock the crop may yield about 1.8 t/ha.
Options for Dealing with Options for Dealing with Frosted Wheat Frosted Wheat
5
Garren Knell and Melissa Rebbeck
CHAPTER FIVE

47
Options for Dealing with Frosted Wheat
Table 5.1: Summary of advantages and disadvantages of options for frosted cropsOptions Potential Advantages Potential Disadvantages
Harvest - Salvage remaining grain- More time for stubble to break down before sowing - Machinery available
- Costs may be greater than return- Need to implement weed control- Threshing problems- Removal of organic matter
Hay/Silage - Stubble removed- Additional weed control
-Costs $35-50/t to make hay- Quality may be poor- Nutrient removal
Chain/Rake - Retains some stubble (reduces erosion risk)- Allows better stubble handling
- Costs $5/ha raking- Time taken
Graze - Feed value - Inadequate stock to utilise feed- Remaining grain may cause acidosis- Stubble may be diffi cult to sow into
Spray - Stops weeds seeding- Preserves feed quality for grazing- Gives time for fi nal decisions- Retains feed - Retains organic matter
- Diffi culty getting chemicals onto all of the weeds with a thick crop - May not be as eff ective as burning- Boom height limitation- Expense $5/ha plus cost of herbicide- Some grain still in crop
Plough(Cultivate)
- Recycles nutrients and retains organic matter - Stop weed seed set- Green manure eff ect
- Requires off set disc to cut straw- Soil moisture needed for breakdown and incorporation of stubble
Swath - Stops weed seed set- Windrow can be baled- Regrowth can be grazed- Weed regrowth can be sprayed
- Relocation of nutrients to windrow- Low market value for straw- Poor weed control under swath- Expense – swathing ($20/ha)- Spraying ($5/ha + herbicide)
Burn - Recycles some nutrients- Controls surface weed seeds- Permits re-cropping with disease control- Can be done after rain
- Potential soil and nutrient losses- Fire hazard- Organic matter loss
STEP 2: Canvassing the optionsHaving estimated the yield of a frost damaged crop, the next step is to consider the best options for achieving a fi nancial return or benefi t from the aff ected crop.
Clearly, if crop yield losses are estimated to be relatively minor, then the decision would normally be to harvest the remaining grain.
However, if the damage is severe, other options need to be evaluated to achieve some income or future benefi t from the paddock. This will involve evaluating some key alternatives:
1. Harvestable grain – the proportion of wheat that covers the cost of harvesting may be around 120–160 kg wheat/ha.
2. Hay – What is the demand and opportunity for marketing hay from the frosted crop?
What are the likely costs and returns from haymaking?
3. Livestock – Can the aff ected crop be grazed by livestock to achieve a return? Do livestock need to be purchased? Is a livestock system in place?
4. Following crop – What is planned to be grown on the
paddock next year?
5. Weeds – What is the density and spectrum of weeds in the frosted crop?
6. Machinery – Is machinery or contract labour available for the required tasks?
7. Soil erosion (water and wind) - Will the paddock become more susceptible to erosion if some of the above options are adopted?
The respective benefi ts for alternative options, such as costs and agronomic considerations are summarised in Table 5.1.

48
Table 5.2: Amount of harvested grain required to break-even on operating the harvester for a range of crops
Harvest Cost
Farm Gate Price $17/ha $25/haWheat Feed - $125/t
APW10.5t - $165/t135 kg/ha115 kg/ha
200 kg/ha150 kg/ha
Barley Feed - $130/tMalt - $165/t
130 kg/ha115 kg/ha
190 kg/ha150 kg/ha
Canola $370/t 45 kg/ha 70 kg/ha
Lupins Pool - $150/t Private - $170/t
110 kg/ha100 kg/ha
170 kg/ha150 kg/ha
Peas $180/t 95 kg/ha 140 kg/ha
By taking a ‘wait and see’ approach, the best decision may ultimately be made.
Costs:
Harvesting costs range from $17-$25 /ha to own, maintain and operate a header. The price range varies depending on the capital cost of the header and the area harvested (see example in Table 5.2). Contract harvesting usually costs $25/ha.
Components of harvesting costs per hectare are commonly estimated to be:
• Depreciation ($60/hr, 7.5 ha/hr) $8.00/ha
• Fuel (2000 ha) $3.50/ha
• Repairs (2000 ha) $3.00/ha
• Labour ($19/hr, 7.5 ha/hr) $2.50/ha
Total cost $17.00/ha
Very little grain is required per hectare to cover the costs of the harvesting operations (Table 5.2).
Other considerations:
• Harvesting frost-aff ected crops can be complicated because of diffi culty in threshing empty heads during harvest.
• Frosted stubble can be diffi cult to seed in to, so it is important to harvest low and keep stubble short.
• High nutrient levels of frosted stubble cause root rotting and poor anchorage in the soil. This can lead to machine blockages at sowing time.
5.2.2 Hay cuttingWhile cutting hay for use on the farm is a sound strategy, harvesting hay for sale can be an expensive, high-risk exercise. Experience is required to enter this market.
Benefi ts:
High returns can be achieved for those close to a market or those who act early in securing a price and market for the hay. With wide scale frost events it is common for the hay market to be fl ooded and the demand and price for hay to drop sharply.
5.2 Stubble Management Options
5.2.1 Harvesting the cropBefore deciding to forego harvesting a frost damaged crop for an alternative option it is important to ensure that this option will provide greater overall benefi ts. This decision will be largely based on the estimated level and scale of frost damage (see earlier discussion).
The opportunity costs of other options must be estimated and compared against the estimated income to be generated from harvesting. Many farmers may opt to harvest frost-damaged crops as a cheap way to deal with the crop residue, allowing the paddocks to be effi ciently re-sown the next season.
Benefi ts:
Harvesting may still be the most appropriate option if the crop is not too severely damaged. Harvesting has the advantage that machinery is available for the operation.
The harvesting operation assists in preparing the paddock for sowing the following season and residual stubble and straw ensures that some crop residue nutrients are returned to improve soil fertility.
Sometimes crops are not as badly aff ected as fi rst thought. Also sometimes ‘compensatory’ late tillers form and may contribute to grain yield where soil moisture reserves are high, but they can take 4 to 6 additional weeks to mature.

49
It is important that hay cutting is done as soon as possible to prevent any decrease in feed quality and hay colour. Cutting hay is also a useful strategy for removing weeds and most of the stubble. This will usually allow the paddock to be re-cropped the next season to help with a fi nancial recovery after frost.
Costs:
Costs will vary from region to region, but the following rates can be used as a guide:
• Mow and conditioning = $40-$45/ha• Baling = $25/t• Freight =10c/bale/km
(6’x 4’ square bales).Long distance freight prohibitive for round bales.
Risks:
Removing large amounts of crop biomass also removes nutrients from paddocks. It has been estimated that 1 t of wheaten hay will remove approximately $25 worth of nutrients (Bill Bowden, DAFWA), predominantly nitrogen (16 kg), potassium (12 kg) and phosphate (2 kg).
5.2.3 SilageProducing silage or baleage (plastic wrapped bales of silage) is more expensive than cutting and baling hay, but it has better feed quality and longer storage life making it worth considering if contractors are available. Silage is diffi cult to freight so it is advisable to cut only enough for on-farm use. This option is especially viable where the grower is equipped to produce silage.
Benefi ts:
Frosted crops may be suitable for silage if they are still relatively green with plenty of leaf material. If so, the resultant feed should have a greater nutritive value and storage life than if the crop were cut for hay. Producing silage will ensure that stubble is managed in readiness for the next season. If weeds have not set seed this option helps reduce the weed burden in paddocks.
Costs:
Cereals, especially wheat, produce low quality silage compared with other crops. If the skills and machinery required are not readily available then the production of silage becomes expensive. Silage making also removes nutrients and may be less attractive than green manuring and some cutting or grazing options.
5.2.4 Cutting and swathing operations
Benefi ts:
Cutting and swathing frosted crops can preserve some of the nutritive value of the crop without the expense of applying desiccant herbicides. Cutting retains nutrients either through fodder conservation or recycling of plant material. This option also has weed control benefi ts.
Slashing or mowing, compared with green manuring, is especially suited to lighter textured soils where erosion may pose a problem because the remaining stubble acts as a mulch protecting the soil. Once cut down, the crop can be grazed or left to degrade.
Degradation and return of nutrients to the soil will be more rapid if the cut plant material is reduced to the smallest possible size, although some stubble should be retained on erosion-prone soils.
Burning of stubble is not recommended on fragile soils due to erosion risk and the loss of organic matter and nutrients. However, if necessary, windrowing makes a night burn possible in situations where the paddock must be managed to suit available seeding equipment for next season’s sowing operations.
Cutting can be performed with harvesting machines, slashers and windrowers. Harvesters and windrowers have the advantage of performing the cutting operation faster than slashers. Cutting operations should be performed when plant material is still relatively green to stimulate more rapid degradation of plant material and to reduce the fi re hazard. Herbicide resistant weeds should be trimmed before seed set - therefore swath, slash or harvest as low as possible.
Costs:
Contract swathing normally costs $25/ha, but discounts may be available for out-of-season work. Contract slashing usually costs $15 to $18/ha.
There is an accumulation of nutrients along windrows, and the continued growth of thin strips of crop that can occur when machinery tyres lay plants fl at so they are not incised by slashing equipment. Cutting may also leave long straw that hinders sowing next season.

50
5.2.5 Desiccation or hay freezing
Benefi ts:
Herbicides can be used to halt crop development, promptly and dessicate hay. This also helps to retain the nutritive value of the crop for grazing for up to three months (depending on seasonal conditions). Hay dessication facilitates fodder conservation. The practice also helps control herbicide resistant weeds reducing the requirement for weed control in the next season. You will need to check herbicide withholding periods. Hay-making operations may need to take precedence over other operations if the crop is to be cut for hay.
Costs:
Hay freezing is a relatively inexpensive option (eg 2-3 L/ha glyphosate $8 to $12 + application costs of $5/ha = $13 to $17/ha). It is most suited to crops with a high weed burden and low biomass.
This option also results in a stubble management issue that needs to be addressed before next seeding. If quicker ‘brown-out’ is required to prevent weed seed set, then high rates of Gramoxone (paraquat) or SpraySeed can also be used. For best results always use high water rates (50-100 L/ha).
5.2.6 Green manuring
Benefi ts:
Returning plant material to the soil facilitates the retention of the incorporated crop nutrients in the soil, thereby reducing the requirement for fertiliser for future crops. For example, a wheat crop with a biomass of 5 t/ha contains around 80 kg/ha of nitrogen.
Green manuring pulse crops have a greater nitrogen benefi t because of their higher nitrogen content. Soil structure, microbial activity and nutrient cycling will also be improved.
Green manuring can be performed with off set discs or scalloped disc harrows. It is important that not all plant material is turned into the soil. Aim to leave around 20-30% of the plant material on the surface to act as mulch for retaining soil and plant moisture. This also results in a more rapid and effi cient microbial breakdown of buried crop material.
Green manuring should be performed as soon as possible to initiate residue decomposition when the incorporated crop still contains moisture.
Costs:
It will cost $25-30/ha to green manure a frosted wheat crop using a contractor or approximately $18/ha to hire an off -set disc machine.
Risks:
The biggest risk of green manuring is not having adequate soil moisture at the time of incorporation or over summer to allow the crop residue to break down.
Large amounts of un-decomposed crop residue will cause problems at sowing and during crop establishment in the following year.
On light textured soils, adequate stubble cover (30% cover) must be left on the soil surface to prevent erosion.
The availability of suitable machinery to undertake this operation may also pose a problem to some growers.
Decomposing cereal residue at the time of crop establishment may compete with the newly sown crop for available nitrogen, especially if the incorporated crop residue has not fully decomposed. Thus, the newly sown cereal crop may require applied nitrogen early in the season. Once the residue has decomposed, the soil will have a higher soil nitrogen status.
5.2.7 Standing crops
Benefi ts:
Leaving a crop standing may be viable when going into pasture the next season or where an agistment opportunity arises. If the standing crop is to be grazed, an appropriate grazing pressure must be considered.
This option also allows time for frosted crops to send up compensatory tillers that may contribute to crop yield and make harvesting more viable.
Risks:
Frosted stubbles left standing can cause problems at sowing for up to two seasons after the event if the crop residue is not carefully managed.
Grazing standing crops may result in scouring and other animal health problems.
51
5.2.8 Burning
Benefi ts:
Burning frosted crops is a cheap and easy method to remove residues before sowing next year. It may also provide some weed seed control if burnt early when seeds are still in the canopy or on the soil surface. Removing the stubble will also reduce cereal leaf disease risk if the paddock is to be sown back to cereal.
Risks:
Burning will result in nutrient and organic matter losses but in the short term it will prevent competition for nitrogen between the decomposing stubble and next season’s cereal crop.
Burning large amounts of bulk can be a potential fi re hazard and will leave the paddock vulnerable to wind and water erosion. Erosion risks are worse if the paddock is grazed before or after burning.
5.3 Agronomic Considerations
5.3.1 Water storageCrop water use will vary depending on when the salvage operations are implemented. In a normal crop, water use after fl owering could be as high as 30% - 40% of rainfall received. Most of this water use will occur immediately after fl owering. In frosted crops, unused water will be stored in the subsoil and will be used by next year’s crop.
5.3.2 DiseaseFrosted crops still allow leaf and root disease levels to build up. There will be no decrease in the amount of disease carryover from a frosted crop compared with a non- frosted crop. Therefore,
normal considerations of disease implications in relation to cropping sequences of frosted crops apply:
• A well grown frosted crop in a good season is likely to have higher levels of root and leaf disease carryover compared with a frosted crop grown in a drier season. This aff ects what crop should be grown the following year. It is advisable to do a PredictaB soil test to evaluate the levels of root disease in a paddock before you replant it back to cereal.
• Where wheat after wheat is a normal cropping sequence, cropping a second wheat crop the next year will carry normal disease risks.
• It is advisable to maintain normal cropping sequences in areas where crop rotations are well established.
5.3.3 Returning nitrogen to the soilMany of the options posed will return the frosted crop to the soil either directly or indirectly. Some nitrogen and organic matter will therefore be returned to the soil over time.
Cereals and canola contain approximately 14 - 18 kg of nitrogen per tonne of dry matter. Pulse crops contain 25 - 30 kg of nitrogen per tonne of dry matter.
As a guide, a wheat crop that would normally yield 3 t/ha of grain would have about 5 t/ha of dry matter at fl owering and contain 70 - 90 kg/ha of nitrogen.
Breakdown of plant biomass should be ‘nitrogen neutral’ - the nitrogen in the decomposing plant is suffi cient to supply soil microbes that need nitrogen to break down plant carbon. Incorporated crop residues need to be decomposed by sowing time to make a good seed bed and prevent competition for nitrogen. Residues retained on the surface will degrade more slowly and thus are less likely to compete with the crop for nitrogen.
5.4 Cropping Issues for Next Season
5.4.1 Planning for the next year Despite a frost, there are still many decisions to be made and jobs to be done to make the most of the remaining crops and also set up for next year’s crops. Some of these include:
• Assess frost damage paddock by paddock to estimate possible yields and yield losses.
• Assess canola crops and decide whether to swath or direct head.
• Control budworm in legume crops and canola. Pea weevils also need controlling.
• Crop top and spray top to prepare for next year.
• At harvest, make the most of any protein advantage.

52
5.4.2 Stubble preparation Stubble preparation is important. You need to determine the best way to handle stubble. The issues to keep in mind when handling stubble are:
• Stubble levels need to be <40% ground cover for eff ective trifl uralin use.
• If burning is intended, then remember fresh ash can interfere with some pre-emergent herbicides (simazine, atrazine, trefl an). After burning stubble, 10 mm of rain are required to deactivate the ash before sowing.
Table 5.3 shows the feasibility of diff erent options for stubble handling after wheat and canola crop.
5.4.3 Source new seed varietiesIf farmers have lost new seed varieties, then it is better to spend the extra money and buy the varieties that are best suited to your farming system rather than opting for cheaper lower yielding varieties. You can aff ord to pay $600/t extra for a variety that yields 5% better than an alternative variety (where the crop is likely to yield 2 t/ha).
5.4.4 Soil test and modify fertiliser programTo cut costs consider not top-dressing pastures and only apply phosphate for the needs of the current crop. Soil testing will identify those soils that have good phosphate levels. Soil tests taken in the past two years are also useful. There is scope to reduce phosphorus application, but nitrogen levels must be matched to the season.
5.4.5 Control summer weedsControl summer weeds such as melons, wireweed and self sown cereals with appropriate knockdowns herbicides. Weed control conserves soil moisture and mineralised nitrogen, and reduces disease risk, thus setting crops up for a high yield potential.
5.4.6 Plan the crop program earlyPlan the next season’s cropping program early. Review the available fi nances for the cropping program and use the best predicted prices to generate likely returns with limited fi nances.
Sowing date and correct variety selection are the two important management decisions for maximising yield. Optimising yields next season will generate funds to regain previous losses.
Also, if sowing date and variety selection are optimal, then the crop is in a better position to respond to other inputs, such as nitrogen, sowing rate and rainfall. See Chapter 2 for more detail.
Table 5.3: Feasibility of diff erent options for stubble handling This Year
Next Year Harvest Hay Chain Graze Spray Plough Swath Burn
Cereal Cereal X X X X X X XCanola X X X X X XLupins X X X X XPasture X X X X X
Canola Cereal X X XLupins X XPasture X X

53
Recovering from Frost – Recovering from Frost – Business and People Business and People
6
This chapter describes steps that farmers should undertake to develop a logical plan for the future in the aftermath of suff ering a serious frost. The plan must encompass analyzing the fi nancial impacts and future options, how to discuss these with fi nancial institutions and how to deal with personal stress.
6.1 Financial Impact of a Major Frost Event
Each farm and individual within the business is diff erent. Farmers should assess their own situation and not rely on comments from others within the district. The two main factors determining the fi nancial impact on a business are:
• Health of the business – the ‘starting position’.
• Level of actual income loss.
6.1.1 Starting positionThe ability of a business to absorb a loss and adjust is determined by many factors. These include:
• Equity.• Debt structure (seasonal, term
and plant debt). • Other resources (off -farm assets
and other income).• Management issues. • Fixed commitments.
EquityEquity is one measure of the ability of a business to withstand shocks. Debt to income, debt per hectare, operating surplus per hectare and income per family are all additional measures which can be calculated.
Farm equity percentage is calculated as follows:
• Farm equity percentage = [1 – Total Farm Liabilities ($)][Total Farm Assets ($) * 100]
If farm liabilities are $200k and farm assets are $2m then the equity percentage is:
• Equity percentage = (1 – 200/2000) * 100 = 0.9 * 100 = 90 %
David Falconer
CHAPTER SIX

54
The higher the starting equity the better the business will be able to cope with an income loss. The level of income loss should be compared to the budgeted level of income and not the potential income lost because sometimes price increases lessen the impact of the fi nancial loss.
• Income loss = (Budget income – Actual income)
Budget income
Table 6.1 links the fi nal equity percentage for diff erent starting equities and income losses.
Levels of equity may be classifi ed as:
• Comfortable > 90%; • Safe 80 – 90%; • Farm needs to perform 70 – 80%; • Tight 60 – 70%; • Need to restructure < 60%.
From Table 6.1 it is apparent that if a business starting equity is greater than 80% and the total income loss is less than 60%, then the business will survive without a major restructure. At a 70% starting equity and a 60% income loss, consideration should be given to a major restructuring of debt.
Equity is only one measure and several other factors will determine the fi nal result.
Type of BorrowingThe mix of borrowings will determine how easily rearrangements can be made. Increases in seasonal fi nance requirements may be converted to term debt if term borrowings are low. Similarly, chattel mortgage or lease debt on machinery may provide more fl exibility for deferral than large term debt.
Income from Off -Farm AssetsThe earning capacity of off -farm assets may be available to service increased borrowings on the farm. Off -farm assets might be used as security for farm loans. The sale of off -farm assets should be carefully evaluated and considered as a last resort and part of a long plan to restore the business to health. Simply selling off -farm assets for the farm to survive may be a poor business decision.
Management IssuesManagement ability (physical, fi nancial and personal) will largely determine your success. A positive attitude will override a tight fi nancial situation.
Conducting a Strength, Weakness, Opportunity and Threats (SWOT) analysis of each individual, in the business, may provide some insight into the personnel component. The reaction of people under stress is discussed later in this chapter.
Fixed CommitmentsThe level of fi xed commitments such as drawings (e.g. living expenses), education, parent support and loan repayments will determine how fl exible the business is in absorbing a large fi nancial loss. While there may be ability to reduce fi xed commitments, a reasoned approach should be adopted, and consideration of the longer-term eff ect of changes evaluated. Education of children should not be disrupted and discussion with the school on a fee payment plan over time is generally acceptable.
The frost event may simply highlight a structural problem within the business and it may be useful to seek a “second opinion” from an agricultural consultant with good analytical skills.
Level of LossFor a crop-dominant property, the level of loss can be categorised into tonnes and dollars and compared with the budget using potential fi gures. Table 6.2 shows yield estimates in total tonnes for wheat and canola at various times in the year.
The initial budget estimated wheat tonnage of 2000 t was increased to 2400 t in July and 3000 t on September 15th. Following the frost in September, the yield was estimated to be 1700 t, which is 85% of the budget yield and 56% of the estimated potential.
Each farm has a diff erent mix of enterprises. If the farm only grows grain, then a reduction of 50% tonnage will have a far greater impact than if the farm business had 60% grain income, 30% livestock income and 10% off -farm revenue.
Table 6.1: The eff ects of various levels of income loss and starting equity percentages on fi nal equity percentages
Income Loss Starting Equity90% 80% 70%
10% 87% 77% 67%
30% 82% 72% 62%
60% 75% 65% 55%

55
Table 6.2: Estimates of wheat and canola production levels (tonnes) at diff erent times within a growing season
Timing of Crop Estimate Budget
Area January July September October
Wheat 1000 ha 2000 t 2400 t 3000 t 1700 t
Canola 300 ha 300 t 420 t 450 t 360 t
Action needed:
Assess your own situation, as many factors will determine the overall impact on your business income:
• Quantify expected yields by inspecting all paddocks on the farm for frost damage.
• Estimate the dollar position for the revised budget to determine the actual impact.
• Develop a draft budget for the following year.
• Develop plans to reduce the impact of future frosts.
6.1.2 Dealing with your fi nancierBanks will adopt the same approach in handling each situation:
• They are unlikely to establish a special policy.
• They will examine each borrower on a case-by-case basis.
It is therefore important to understand where banks are coming from. You need to understand the position from the banker’s side of the table.
Banker’s PerspectivePut yourself in your banker’s shoes. Financiers are in the business of lending money and credit. However, they have an obligation to depositors and shareholders to lend prudently.
They cannot (will not) put their capital at risk.
For a fi nancier to write-off a loan of say $100,000 means that at an average margin of 2.5%, the lender must write $4 million in new business to recoup that loss.Bank manager’s measures are on loan volumes, average margins and credit quality. The credit and lending staff , who make the fi nal decisions, are measured on the quality of their loan book, that in turn is based on the information supplied by the borrower.
Unlike a commercial borrower in the city who can be sold up within weeks, farmers have access to a debt mediation process, that can last years. Some rural bank managers may be inexperienced at handling a fi nancial ‘crisis’. As the review period is often hectic, they will not have the time to personally develop a case for every customer. It is up to you (the borrower) to ensure they have all the information required.
Credit and lending people cannot easily gauge an individual borrower’s level of commitment and integrity with respect to repayment of the loan. Some banks base their approach to lending policy on ability to make repayments (0.1%) – which explains all the documentation and procedures the other 99.9% must endure.
6.1.3 Categories of borrowingThe impact of a sudden drop in farm income and negative cash fl ow creates three broad categories of borrowings:
• Borrow more – for those farm businesses that can accommodate more debt provided the lender is prepared to increase its exposure.
• Renew existing limits only – viability is questioned. The lender is prepared to defer principal payments, renew carry-on funds for the next season, but will not meet any request for increased funding. Increased funding will have to be sourced elsewhere or cash fl ow adjusted.
• Nail in the coffi n – where debt load is now beyond the ability of the business to repay from cash fl ow. Assets must be sold.
These categories are not always clear cut. Many will be borderline in the eyes of the lender and there will certainly be disagreement between some lenders and borrowers on future prospects.
It is therefore up to the borrower to present the case – to show that debt can be repaid from cash fl ow, or in the worst case, be commited to sale of assets.

56
Table 6.3: Possible income streams to be considered for increasing business income
Income source Possible scenarios for consideration
Carry-over Grain With reduced income, should grain be sold early and carried forward to save tax?
Wool in-store Re-check holding costs if costs of debt and storage are increasing. May be able to make 20% by investing within the farm business
Off -farm Assets Can off -farm assets be rearranged to provide more income relative to growth?Compare rates of returns on off -farm assets with debt costs.
Forward Prices Evaluate risk and consider forward pricing if profi t needs to be locked in.
Assistance With lower incomes, check all assistance that may be available, such as consulting grants, family assistance, medical rebate, education rebate.
Presenting your case to lendersIf your position is serious do not be negative. Be pro-active and communicate with your banker sooner rather than later, preferably before February/March. Go fully armed with fi nancial information and future plans.
The bigger the loan the greater the ability of the lender to reduce the margin and still achieve a satisfactory return on equity. For example, $250,000 loan at 9.5% compared with $1 million at 8.25% where management time and risk grade are the same. This has obvious implications for those farmers who choose to spread their business around.
6.1.4 Financial issues for the following yearGood fi nancial planning for the next year is needed following a serious frost. Radical changes should not be made until a full objective assessment has been made and alternative options have been examined.
The process should involve:
• Estimating this year’s fi nancial returns;
• Preparing estimates of assets and liabilities;
• Developing a physical plan for the farm assuming no future fi nancial impact from frost occurs;
• Preparing a draft budget based on the physical plan; and
• Fine tuning fi nances and the physical plan to meet known constraints (see issues in Tables 6.3 and 6.4).
Summary
• Do not rely on fi nancial assistance from government. Funds may not be available in time for sowing next year’s crop.
• Act early if frost damage has had a serious fi nancial impact.
• Prepare a future business plan and where necessary seek advice on tactics from other farmers, consultants and rural counsellors.
• Communicate and discuss the plan with your banker.
• Contact another lender (that is prepared to accept a higher level of risk), if discussions with your bank become unsatisfactory.
• Access the physical, fi nancial and people situation factually so that decisions are based on the best information.
• Develop alternate strategies for dealing with frosted crops in future programs and how fi nances may need to be adjusted.
• Prepare a draft budget and physical plans for next year. Provide information to business partners and fi nanciers.
• Develop a written plan of your proposed action and review it as information and circumstances change.

57
Tabl
e 6.
4: P
ossi
ble
busi
ness
item
s th
at n
eed
to b
e ex
amin
ed fo
r red
ucin
g ex
pend
itur
e
Expe
ndit
ure
item
Scen
ario
s fo
r con
side
rati
on
Wag
esCo
nsid
er p
erm
anen
t lab
our a
s a
long
-ter
m a
sset
. May
be s
hare
som
e co
st w
ith a
nei
ghbo
ur in
the
off -s
easo
n. E
mpl
oy c
asua
l lab
our a
s ne
eded
and
redu
ce ‘im
prov
emen
t typ
e jo
bs’.
Cont
ract
Is it
pro
fi t d
riven
or c
onve
nien
ce e
ncou
rage
d by
pro
fi tab
ility
in p
ast s
easo
ns?
Rate
sRe
ques
t the
shi
re/c
ounc
il to
def
er ra
tes
from
Sep
tem
ber u
ntil
afte
r har
vest
, as
they
sho
uld
be a
ble
to b
orro
w a
t low
er ra
tes.
Lice
nces
Chec
k th
at a
ll ve
hicl
es n
eed
to b
e lic
ense
d.
Acc
ount
ing
fees
Pr
epar
e in
form
atio
n in
an
orde
rly m
anne
r so
you
are
payi
ng fo
r pro
fess
iona
l wor
k no
t for
a b
ook-
kee
ping
ser
vice
.
Cons
ultin
g fe
esEn
sure
you
r con
sulta
nt k
now
s yo
ur n
eeds
and
pro
vide
s go
od p
rofe
ssio
nal a
dvic
e.
Tele
phon
eIs
the
mob
ile n
eces
sary
and
can
the
bill
be re
duce
d?
Are
you
on
the
best
sav
ing
plan
for a
ll ca
lls?
Subs
crip
tions
Onl
y co
ntin
ue w
ith p
ublic
atio
ns y
ou re
ad a
nd b
enefi
t fr
om.
Bank
fees
Chec
k yo
ur a
ccou
nt ty
pe is
the
best
for y
our n
umbe
r and
siz
e of
tran
sact
ions
.
Insu
ranc
eAd
just
cro
p in
sura
nce
for e
xpec
ted
yiel
ds a
nd p
rices
. Get
com
petit
ive
quot
es.
Cart
age
cost
sM
axim
ise
load
siz
es a
nd re
duce
use
of o
vern
ight
cou
riers
.
Fert
ilise
r So
il te
st a
nd m
atch
nut
rient
requ
irem
ent t
o pa
ddoc
k an
d ro
tatio
n. A
djus
t for
stu
bble
val
ue a
nd p
ast f
ertil
iser
his
tory
.
Seed
Sele
ct v
arie
ty w
ith g
reat
est i
mpa
ct o
n pr
ofi t.
Ens
ure
seed
is o
f goo
d qu
ality
.
Fuel
Redu
ce u
nnec
essa
ry fu
el u
se b
ut c
ontin
ue s
ocia
l and
tow
n co
ntac
t.
Spra
ysPr
epar
e es
timat
e of
her
bici
de p
rogr
am a
nd u
se c
heap
er e
ff ect
ive
alte
rnat
ives
if a
vaila
ble.
Exa
min
e gr
oup
purc
hasi
ng a
nd
defe
rred
pay
men
t.
Stoc
k fe
edRe
duce
to p
rofi t
able
leve
ls a
nd d
o no
t ove
r fee
d.
Stoc
k ex
pens
esCh
eck
need
for t
reat
ing
stoc
k.
Shea
ring
Prov
ide
labo
ur (i
f ava
ilabl
e) to
redu
ce c
ost o
r sha
re w
ith n
eigh
bour
.
Stoc
k pu
rcha
ses
Cons
ider
hiri
ng o
f ram
s an
d/or
kee
p ra
ms
for a
yea
r lon
ger.
Repa
irs
Do
on a
nee
d-fo
r-pr
ofi t
(yie
ld) b
asis
. Co
st it
ems
befo
re o
rder
ing
or e
mba
rkin
g on
a re
pair
proj
ect.

58
Expe
ndit
ure
item
Scen
ario
s fo
r con
side
rati
on
Cons
erva
tion
Fund
onl
y fr
om p
rofi t
.
Cash
with
draw
als
Mai
ntai
n a
real
istic
leve
l. M
any
exp
ense
s ca
n be
redu
ced
and
som
e ex
cess
es c
an b
e tr
imm
ed.
Med
ical
Clai
m a
reba
te if
inco
me
is lo
w.
Educ
atio
nEv
alua
te lo
ng-t
erm
con
sequ
ence
s an
d ch
eck
all s
ubsi
dies
ava
ilabl
e be
fore
dis
rupt
ing
edu
catio
n of
chi
ldre
n. C
onsi
der p
art-
time
jobs
for t
ertia
ry s
tude
nts.
Life
insu
ranc
eM
aint
ain,
as
it is
oft
en d
iffi c
ult t
o ge
t new
cov
er.
Supe
rann
uatio
nZe
ro if
no
tax
paya
ble,
but
mai
ntai
n lif
e in
sura
nce
com
pone
nt.
Taxa
tion
PAYG
tax
can
be a
djus
ted
with
a d
rop
in in
com
e bu
t prim
ary
tax
need
s to
be
paid
. Pay
men
t arr
ange
men
ts c
an b
e ne
gotia
ted
with
the
ATO
.
Loan
sN
egot
iate
to h
ave
prin
cipl
e re
paym
ent d
efer
red
and
pay
inte
rest
onl
y. C
onsi
der l
ocki
ng in
rat
es if
att
ract
ive
or s
ervi
ceab
le.
Inte
rest
rate
sRe
stru
ctur
e pa
ymen
ts fr
om m
onth
ly to
ann
ual o
r six
mon
thly
in a
rrea
rs if
rate
is c
ompe
titiv
e in
ord
er to
redu
ce p
eak
borr
owin
g.
Chat
tel M
ortg
age/
Leas
eD
efer
pay
men
ts if
ther
e is
equ
ity in
the
mac
hine
ry, b
ut c
heck
any
pen
alty
inte
rest
.
Plan
tO
nly
purc
hase
ess
entia
l ite
ms.
Impr
ovem
ents
Nil,
unl
ess
addi
ng to
sho
rt te
rm p
rofi t
or f
unde
d w
ithin
cas
hfl o
w.

59
Figure 6.1: Stages in response to stress
PanicCannot thinkCannot do usual tasks
Dif� culty PlanningMaking decisions
Hope and Con� denceRenewed strength and energy
�
Loss Income & LifestylePlansAn idealA treasured possession etcExpectations
�DenialInability to believe Shock
�IsolationAlienationWithdrawl
�
�
AcceptanceOf situation and ability to make new plans
�
Acceptance
�
AngerHostilityResentment
�
6.2 Dealing with Personal Stress
There are no magic solutions in times of rural diffi culty. You need to fi nd positive ways to work your way through the problems encounted.
6.2.1 Stress symptomsThis section describes how men and women feel in crisis situations, how to better control their future lives and how to avoid some pitfalls in making future decisions.In any crisis it is normal to have a variety of strong feelings that may change over time. These feelings are absolutely normal, usually last for a limited period and then give way to other feelings. Such emotions should not be bottled up.
They should be expressed to relieve further stress.
The emotions include:
• anger, helplessness, fear, disappointment, blame for failing, guilt, shame, sadness, longing for better times, need to be isolated from others, mental numbness, and a general lack of enthusiasm or hope for the future.
6.2.2 Preventing stress build up
Awareness You need to respond to your body’s messages. Take time out to relax, before its too late.
Relaxation Seek a technique that suits you.
Reality Confront reality and try to think things through. Get outside assistance. Talking to others can help by providing a more objective view that puts issues in perspective.
Coming to terms Concentrate on things you may be able to control. Do not dwell on problems that can not be prevented.
Privacy To deal with feelings, you will fi nd it necessary at times to be alone, or just with family and close friends. DO NOT isolate yourself or your family from contact with others, as this will only make things worse in the long term.

60
Activity and recreation Be active. Helping and giving to others may give some relief.
But do not divert attention from the help you may need yourself. Do not neglect normal sport and recreation. Regular exercise promotes health and well- being and will help you cope with stress.
6.2.3 Stages in response to stressPeople greatly vary in their response to loss. Most come to terms with it by working through a number of stages. The process outlined in Figure 6.1 highlights the sorts of stages that occur as part of the healing process, but not necessarily in this exact order.
6.2.4 Sources of help
South AustraliaRural Community Support ServicesBeyond Blue 1300 224 636Drought Link Support Worker1800 619 532
Financial ServicesRural Financial Counselling1800 836 211
Western AustraliaRural Community Support ServicesUpper Great Southern 08 9881 0790Central Great Southern08 9821 6280Lower Great Southern08 9892 2440
Financial ServicesRural Financial Counselling1800 612 004

61
AWB website (as at April 2007) Classifi cation Chart for Frost Distorted Grains. http://www.awb.com.au/NR/rdonlyres/65809C42-8333-4A96-A6D6-F6E88369B217/0/Frosted.pdf
Braunack-Mayer E (2002) Survey of frosted grain growers in the Southern Mallee of South Australia. Private consultant, supported by Ausbulk. Results presented at a frost workshop in Geranium, Feb 2002.
Bowden B (2004) Pers Com. Department of Agriculture and Food WA.
Cawood R (1996) Climate, Temperature and Crop Production in South Eastern Australia. Victorian Institute for Dryland Agriculture, Agriculture Victoria.
Consult Ag Fact Sheet (2002) Economics of Delayed Seeding.
Chen THH, Burke M.J, Gusta L (1995) Biological ice nucleation and its applcations (eds Lee J, Warren G and Gusta L) pp. 115-136. American Phytopathological Society. St Paul, Minnesota.
Fairbrother PD (1971) Frost damage in cereals, 1970 (unpublished). Dept Ag. South Australia.
Fisher J, Abrecht D and D’Antuono M, Dept of Agriculture, Agribusiness Crop Updates 2006.
Foster I (2007) Not yet published results from research on synoptic situations leading up to a frost. Department of Agriculture and Food, WA.
Gusta LV, Wisniewski M, Nesbitt NT, Gusta ML (2004) The Eff ect of Water, Sugars, and Proteins on the Pattern of Ice Nucleation and Propagation in Acclimated and Nonacclimated Canola Leaves. Plant Physiology, 10.1104/
pp.103.028308
Gusta LV (2006) Discussion at national frost conference, Waite Campus, [email protected]
Karow R (1999) Cereals. Crop and Soil News/Notes (January) 13(1).
Kelleher FM, Rollings NM, Poulton DM, Cornish PS (2001) Temperature variation and frost risk in undulating cropland. Proceedings of the 10th Australian Agronomy Conference, Hobart 2001. Knell G (2001) Financial Impact of Frost On the WA Grains Industry. GRDC report CAG1. Consult Ag Narrogin.
Knell G, Sermon D, Curtin S (2002) Best bet agronomic strategies for minimising frost. Consult Ag Narrogin. Fact Sheet.
REFERENCES

62
Lipman A (2000) Citrus Frost Control. Fact Sheet. Primary Industries and Resources South Australia, Loxton.
Lynch CW, Rebbeck MA and Hayman P (2004) Broadacre Frost Trial Report 2003. GRDC project DAS00017 – Milestone 4 (unpubl.).
Lynch CW, Rebbeck MA and Hayman P (2005) Broadacre Frost Trial Report 2004. GRDC project DAS00017 – Milestone 4 (unpubl.).
Loss SP (1987) Factors aff ecting frost damage to wheat in Western Australia. Division of Plant Research, Western Australian Dept. of Ag. Technical Report No. 6. February 1987.
Marcellos H, Single WV (1975) Temperatures in wheat during radiation frost. Australian. Journal of Experimental Agriculture and Animal Husbandry. 15: 818–822.
Marcellos H and Single WV (1984) Frost injury in wheat ears after ear emergence. Australian journal of plant physiology: 11: 7–15.
Maylands HF, Cary JW (1970) Frost and chilling injury to growing plants.
Maynard F (2002) Farmer at Lameroo, Southern Mallee, South Australia. (Pers. comm.).
O’Connell NV, Snyder RL (1999) Cover Crops, mulch lower night temperatures in citrus. California Agriculture (September-October): 37–40.
Olsen H (2005) GRDC Fact Sheet on Frost.
Potter M (2000) Reducing economic losses from frost. Grains Research and Development Corporation. Grains industry advice sheet.
Rebbeck MA, Lynch CW, Hayman PT and Sadras VO (2007) Delving of sandy surfaced soils reduces frost damage in wheat crops. Australian Journal of Agricultural Research, 58: 1-8.
Sadras VO and Monzon JP (2006) Modelled wheat phenololgy captures rising temperature trends: shortened time to fl owering and maturity in Australia and Argentina. Field Crops Research 99: 136-146.
Single WV (1985) Frost injury and the physiology of the wheat plant. The Journal of the Australian Institute of Agricultural Science: Volume 51, Number 2, pp 128-134.
Schnyder RL (2001) Principles of frost protection. University of California, Atmospheric Science.
Stanley M (2001) Frost damage in crops and pastures. Primary Industries and Resources South Australia, Fact Sheet.
Trischuk R, Gusta LV and Weiser CJ (2005) Plant Cold Acclimation: The Role of Abscisic Acid. Journal of Plant Growth Regulation. Volume 24 No 4. pp308-318.
Tennant S, Tennant D (2000) Flowering Calculator computer program. An Ag WA and GRDC funded project.
Truscott M, Egan J (2000) Climate Risk Management Resource Manual. South Australian Research and Development Institute.
Truscott MA and Lynch CW (2002) Broadacre Frost Trial Report 2002. GRDC project DAS00017 ‘Reducing the impact of climate variability’. South Australian Research and Development Institute, Adelaide, South Australia.
Truscott MA, Lynch CW (2003) A Review of Frost-minimisation Techniques for Application in Broadacre Agricultural Cropping. GRDC project DAS00017 ‘Reducing the impact of climate variability’. South Australian Research and Development Institute, Adelaide, South Australia.
Truscott M, Lynch C and Faulkner M (2003) Report on 2002 Frost Trials in South Australia. A report for Milestone 4 of GRDC Project DAS 00017, Reducing the Impact of Climate Variability. South Australian Research and Development Institute.
Vagujfalvi A, Kerepese I, Galiba G, Tischner T and Sutka J (1999) Frost hardiness depending on carbohydrate changes during cold acclimation in wheat. Journal of Plant Science: 144: 85–92.
White C (2000) Reducing economic losses from frost. GRDC Advice Sheet, Southern Region, June 2000.
Woodruff DR, Douglas N and French V (1997) The cold hard facts about frost. Australian Grain (August-September): 14–15.
White C, Faulkner M, Condon G (2000) Reducing economic losses from frost. Grains Research and Development Corporation, Advice Sheet – Southern 3.7 Managing Risk (DAW493).

63
Notes:

64
Notes: