Managing Business Process Flows - Northwestern · PDF fileThird Edition Managing Business...
18
Managing Business Process Flows
Transcript of Managing Business Process Flows - Northwestern · PDF fileThird Edition Managing Business...

Managing Business Process Flows
A01_ANUP6371_03_SE_FM.qxd 6/18/11 9:31 PM Page i

A01_ANUP6371_03_SE_FM.qxd 6/18/11 9:32 PM Page ii

Third Edition
Managing Business Process FlowsPRINCIPLES OF OPERATIONS MANAGEMENT
Ravi AnupindiUniversity of Michigan
Sunil ChopraNorthwestern University
Sudhakar D. DeshmukhNorthwestern University
Jan A. Van MieghemNorthwestern University
Eitan ZemelNew York University
Prentice HallBoston Columbus Indianapolis New York San Francisco Upper Saddle River
Amsterdam Cape Town Dubai London Madrid Milan Munich Paris Montreal TorontoDelhi Mexico City São Paulo Sydney Hong Kong Seoul Singapore Taipei Tokyo
A01_ANUP6371_03_SE_FM.qxd 6/18/11 9:32 PM Page iii

Editorial Director: Sally YaganEditor in Chief: Eric SvendsenSenior Acquisitions Editor: Chuck SynovecSenior Project Manager: Mary Kate MurrayEditorial Assistant: Ashlee BradburyDirector of Marketing: Patrice Lumumba JonesExecutive Marketing Manager: Anne FahlgrenProduction Project Manager: Clara BartunekCreative Art Director: Jayne ConteCover Designer: Suzanne DudaCover Art: FotoliaManager, Rights and Permissions: Hessa AlbaderMedia Project Manager: John CassarMedia Product Manager: Sarah PetersonFull-Service Project Management: Mohinder Singh/Aptara®, Inc.Printer/Binder: Edwards Brothers IncorporatedCover Printer: Lehigh-Phoenix Color/HagerstownText Font: Palatino
Credits and acknowledgments borrowed from other sources and reproduced, with permission, in thistextbook appear on appropriate page within text.
Copyright © 2012, 2006, 1999 Pearson Education, Inc., publishing as Prentice Hall, One Lake Street,Upper Saddle River, New Jersey 07458. All rights reserved. Manufactured in the United States of America.This publication is protected by Copyright, and permission should be obtained from the publisher prior toany prohibited reproduction, storage in a retrieval system, or transmission in any form or by any means,electronic, mechanical, photocopying, recording, or likewise. To obtain permission(s) to use material fromthis work, please submit a written request to Pearson Education, Inc., Permissions Department, One LakeStreet, Upper Saddle River, New Jersey 07458.
Many of the designations by manufacturers and seller to distinguish their products are claimed astrademarks. Where those designations appear in this book, and the publisher was aware of a trademarkclaim, the designations have been printed in initial caps or all caps.
Library of Congress Cataloging-in-Publication Data
Managing business process flows : principles of operations management / Ravi Anupindi . . . [et al.].—3rd ed.p. cm.
Includes index.ISBN-13: 978-0-13-603637-1ISBN-10: 0-13-603637-61. Production management. 2. Process control. I. Anupindi, Ravi. TS155.M33217 2012658.5—dc23
2011023366
10 9 8 7 6 5 4 3 2 1
ISBN 10: 0-13-603637-6ISBN 13: 978-0-13-603637-1
A01_ANUP6371_03_SE_FM.qxd 6/23/11 12:11 PM Page iv
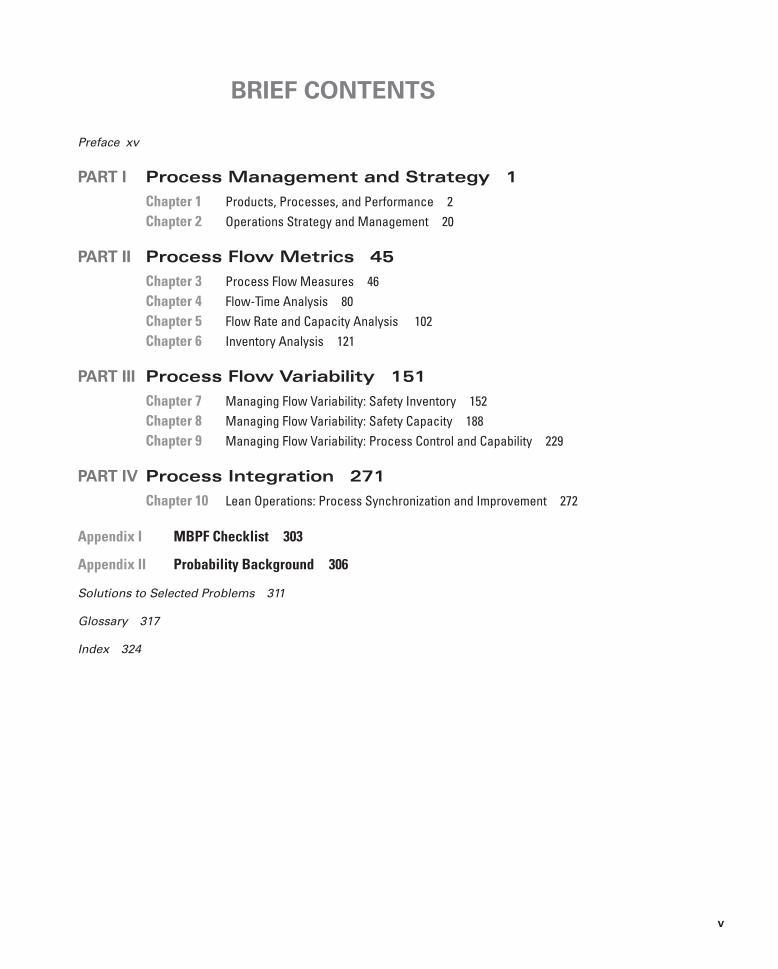
BRIEF CONTENTS
Preface xv
PART I Process Management and Strategy 1
Chapter 1 Products, Processes, and Performance 2Chapter 2 Operations Strategy and Management 20
PART II Process Flow Metrics 45
Chapter 3 Process Flow Measures 46Chapter 4 Flow-Time Analysis 80Chapter 5 Flow Rate and Capacity Analysis 102Chapter 6 Inventory Analysis 121
PART III Process Flow Variability 151
Chapter 7 Managing Flow Variability: Safety Inventory 152Chapter 8 Managing Flow Variability: Safety Capacity 188Chapter 9 Managing Flow Variability: Process Control and Capability 229
PART IV Process Integration 271
Chapter 10 Lean Operations: Process Synchronization and Improvement 272
Appendix I MBPF Checklist 303
Appendix II Probability Background 306
Solutions to Selected Problems 311
Glossary 317
Index 324
v
A01_ANUP6371_03_SE_FM.qxd 6/18/11 9:32 PM Page v

A01_ANUP6371_03_SE_FM.qxd 6/18/11 9:32 PM Page vi

CONTENTS
Preface xv
PART I Process Management and Strategy 1
Chapter 1 Products, Processes, and Performance 2Introduction 2
1.1 The Process View of Organizations 3
1.2 Performance Measures 7
1.2.1 The Importance of Measurement: Management by Fact 7
1.2.2 Types of Measures: Financial, External, and Internal 7
1.3 Products and Product Attributes 10
1.4 Processes and Process Competencies 13
1.5 Enabling Process Success 14
1.6 Some Basic Process Architectures 15
1.7 The Plan of the Book 17
Summary 18
Key Terms 18
Discussion Questions 18
Selected Bibliography 19
Chapter 2 Operations Strategy and Management 20Introduction 20
2.1 Strategic Positioning and Operational Effectiveness 21
2.2 The Strategy Hierarchy 23
2.3 Strategic Fit 25
2.4 Focused Operations 27
2.5 Matching Products and Processes 30
2.6 The Operations Frontier and Trade-Offs 31
2.7 The Evolution of Strategy and Operations Management 37
2.8 The Opportunity Today in Service Operations 40
Summary 41
Key Terms 42
Discussion Questions 42
Selected Bibliography 43
PART II Process Flow Metrics 45
Chapter 3 Process Flow Measures 46Introduction 46
3.1 The Essence of Process Flow 47
3.2 Three Key Process Measures 48
vii
A01_ANUP6371_03_SE_FM.qxd 6/18/11 9:32 PM Page vii

viii Contents
3.3 Flow Time, Flow Rate, and Inventory Dynamics 50
3.4 Throughput in a Stable Process 55
3.5 Little’s Law: Relating Average Flow Time, Throughput, andAverage Inventory 55
3.5.1 Material Flow 57
3.5.2 Customer Flow 57
3.5.3 Job Flow 58
3.5.4 Cash Flow 58
3.5.5 Cash Flow (Accounts Receivable) 58
3.5.6 Service Flow (Financing Applications at Auto-Moto) 59
3.6 Analyzing Financial Flows through Financial Statements 63
3.6.1 Assessing Financial Flow Performance 63
3.6.2 Cash-to-Cash Cycle Performance 67
3.6.3 Targeting Improvement with Detailed Financial Flow Analysis 67
3.7 Two Related Process Measures: Takt Time and Inventory Turns(Turnover Ratio) 70
3.7.1 Takt Time 70
3.7.2 Inventory Turns 70
3.8 Linking Operational to Financial Metrics: Valuing an Improvement 71
3.8.1 Linking Operational Improvements to NPV 71
3.8.2 Linking Operational Improvements to Financial Ratios 73
Summary 75
Key Equations and Symbols 75
Key Terms 76
Discussion Questions 76
Exercises 76
Selected Bibliography 79
Chapter 4 Flow-Time Analysis 80Introduction 80
4.1 Flow-Time Measurement 81
4.2 The Process Flowchart 83
4.3 Flow Time and Critical Paths 84
4.4 Theoretical Flow Time and the Role of Waiting 86
4.4.1 Flow-Time Efficiency 87
4.5 Levers for Managing Theoretical Flow Time 90
4.5.1 Moving Work Off the Critical Path 91
4.5.2 Reduce Non-Value-Adding Activities 91
4.5.3 Reduce the Amount of Rework 92
4.5.4 Modifying the Product Mix 92
4.4.5 Increase the Speed of Operations 92
4.4.6 Zhang & Associates Revisited 93
A01_ANUP6371_03_SE_FM.qxd 6/18/11 9:32 PM Page viii

Contents ix
Summary 94
Key Equations and Symbols 95
Key Terms 95
Discussion Questions 95
Exercises 96
Selected Bibliography 97
Appendix 4.1 Subprocesses and Cascading 98
Appendix 4.2 The Critical Path Method 99
Appendix 4.3 Rework and Visits 101
Chapter 5 Flow Rate and Capacity Analysis 102Introduction 102
5.1 Flow Rate Measurements 103
5.2 Resources and Effective Capacity 103
5.2.1 Resources and Resource Pools 103
5.2.2 Effective Capacity 104
5.2.3 Capacity Utilization 105
5.2.4 Extensions: Other Factors Affecting Effective Capacity 106
5.3 Effect of Product Mix on Effective Capacity and Profitability of a Process 106
5.3.1 Effective Capacity for Product Mix 107
5.3.2 Optimizing Profitability 108
5.4 Capacity Waste and Theoretical Capacity 109
5.4.1 Theoretical Capacity 109
5.4.2 Theoretical Capacity Utilization 110
5.5 Levers for Managing Throughput 110
5.5.1 Throughput Improvement Mapping 111
5.5.2 Increasing Resource Levels 112
5.5.3 Reducing Resource Capacity Waste 112
5.5.4 Shifting Bottlenecks and the Improvement Spiral 113
Summary 114
Key Equations and Symbols 114
Key Terms 114
Discussion Questions 115
Exercises 115
Selected Bibliography 116
Appendix 5.1 Other Factors Affecting Effective Capacity: LoadBatches, Scheduled Availability, and Setups 117
Appendix 5.2 Optimizing Product Mix with Linear Programming 119
Chapter 6 Inventory Analysis 121Introduction 121
6.1 Inventory Classification 122
A01_ANUP6371_03_SE_FM.qxd 6/18/11 9:32 PM Page ix
x Contents
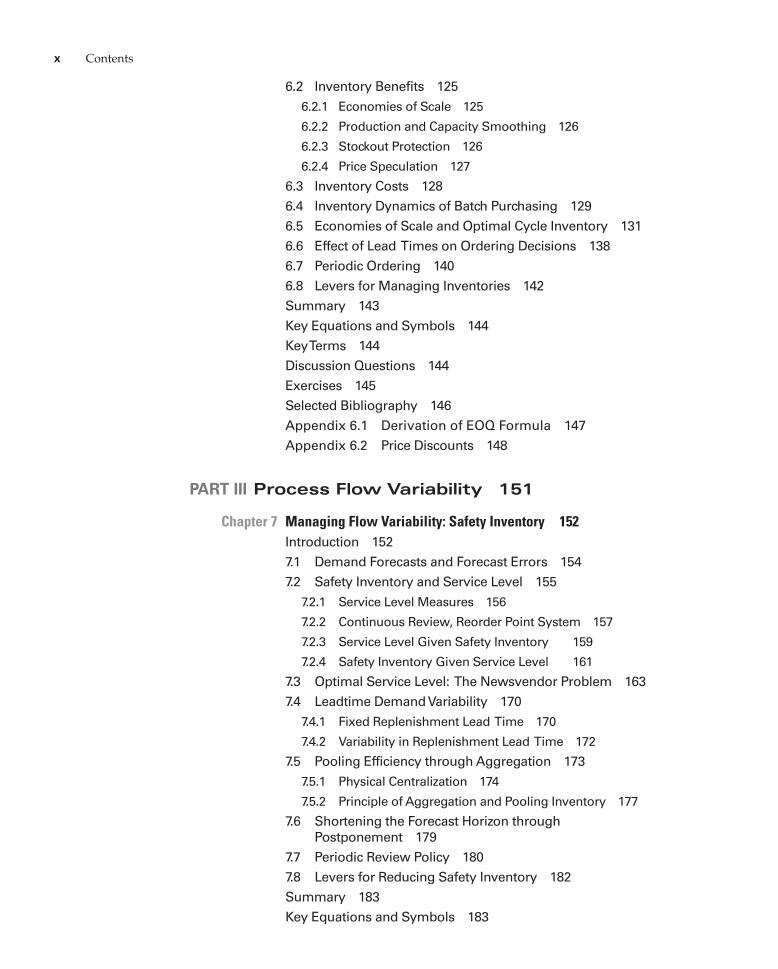
6.2 Inventory Benefits 125
6.2.1 Economies of Scale 125
6.2.2 Production and Capacity Smoothing 126
6.2.3 Stockout Protection 126
6.2.4 Price Speculation 127
6.3 Inventory Costs 128
6.4 Inventory Dynamics of Batch Purchasing 129
6.5 Economies of Scale and Optimal Cycle Inventory 131
6.6 Effect of Lead Times on Ordering Decisions 138
6.7 Periodic Ordering 140
6.8 Levers for Managing Inventories 142
Summary 143
Key Equations and Symbols 144
Key Terms 144
Discussion Questions 144
Exercises 145
Selected Bibliography 146
Appendix 6.1 Derivation of EOQ Formula 147
Appendix 6.2 Price Discounts 148
PART III Process Flow Variability 151
Chapter 7 Managing Flow Variability: Safety Inventory 152Introduction 152
7.1 Demand Forecasts and Forecast Errors 154
7.2 Safety Inventory and Service Level 155
7.2.1 Service Level Measures 156
7.2.2 Continuous Review, Reorder Point System 157
7.2.3 Service Level Given Safety Inventory 159
7.2.4 Safety Inventory Given Service Level 161
7.3 Optimal Service Level: The Newsvendor Problem 163
7.4 Leadtime Demand Variability 170
7.4.1 Fixed Replenishment Lead Time 170
7.4.2 Variability in Replenishment Lead Time 172
7.5 Pooling Efficiency through Aggregation 173
7.5.1 Physical Centralization 174
7.5.2 Principle of Aggregation and Pooling Inventory 177
7.6 Shortening the Forecast Horizon through Postponement 179
7.7 Periodic Review Policy 180
7.8 Levers for Reducing Safety Inventory 182
Summary 183
Key Equations and Symbols 183
A01_ANUP6371_03_SE_FM.qxd 6/18/11 9:32 PM Page x

Key Terms 184
Discussion Questions 184
Exercises 184
Selected Bibliography 186
Appendix Calculating Service Level for a Given SafetyInventory 187
Chapter 8 Managing Flow Variability: Safety Capacity 188Introduction 188
8.1 Service Process and Its Performance 190
8.1.1 Service Processes 190
8.1.2 Service Process Attributes 192
8.1.3 Service Process Performance 192
8.1.4 Relationships between Performance Measures 196
8.2 Effect of Variability on Process Performance 197
8.3 Drivers of Process Performance 200
8.3.1 The Queue Length Formula 200
8.3.2 The Exponential Model 202
8.4 Process Capacity Decisions 205
8.5 Buffer Capacity, Blocking, and Abandonment 206
8.5.1 Effect of Buffer Capacity on Process Performance 207
8.5.2 The Buffer Capacity Decision 208
8.5.3 Joint Processing Capacity and Buffer Capacity Decisions 210
8.6 Performance Variability and Promise 211
8.7 Customer Pooling and Segregation 213
8.7.1 Pooling Arrivals with Flexible Resources 213
8.7.2 Segregating Arrivals with Specialized Resources 215
8.8 Performance Improvement Levers 216
8.8.1 Capacity Utilization Levers 217
8.8.2 Variability Reduction Levers 218
8.8.3 Capacity Synchronization Levers 219
8.8.4 Buffer Capacity Levers 220
8.8.5 Pooling and Segregation Levers 220
8.9 Managing Customer Perceptions and Expectations 221
Summary 222
Key Equations and Symbols 223
Key Terms 223
Discussion Questions 224
Exercises 224
Selected Bibliography 227
Appendix The Exponential Model with Finite Buffer Capacity 228
Contents xi
A01_ANUP6371_03_SE_FM.qxd 6/18/11 9:32 PM Page xi

xii Contents
Chapter 9 Managing Flow Variability: Process Control and Capability 229Introduction 229
9.1 Performance Variability 231
9.2 Analysis of Variability 233
9.2.1 Check Sheets 233
9.2.2 Pareto Charts 234
9.2.3 Histograms 235
9.2.4 Run Charts 237
9.2.5 Multi-Vari Charts 238
9.3 Process Control 240
9.3.1 The Feedback Control Principle 240
9.3.2 Types and Causes of Variability 241
9.3.3 Control Limit Policy 243
9.3.4 Control Charts 244
9.3.5 Cause–Effect Diagrams 252
9.3.6 Scatter Plots 253
9.4 Process Capability 254
9.4.1 Fraction of Output within Specifications 255
9.4.2 Process Capability Ratios (Cpk and Cp) 256
9.4.3 Six-Sigma Quality 257
9.4.4 Capability and Control 260
9.5 Process Capability Improvement 260
9.5.1 Mean Shift 260
9.5.2 Variability Reduction 261
9.5.3 Effect of Process Improvement on Process Control 262
9.6 Product and Process Design 263
9.6.1 Design for Producibility 263
9.6.2 Robust Design 265
9.6.3 Integrated Design 265
Summary 226
Key Equations and Symbols 267
Key Terms 267
Discussion Questions 268
Exercises 268
Selected Bibliography 270
PART IV Process Integration 271
Chapter 10 Lean Operations: Process Synchronization and Improvement 272Introduction 272
10.1 Processing Networks 273
10.2 The Process Ideal: Synchronization and Efficiency 274
A01_ANUP6371_03_SE_FM.qxd 6/18/11 9:32 PM Page xii

Contents xiii
10.3 Waste and Its Sources 275
10.4 Improving Flows in a Plant: Basic Principles of Lean Operations 278
10.4.1 Improving Process Architecture: Cellular Layouts 280
10.4.2 Improving Information and Material Flow: Demand Pull 281
10.4.3 Improving Process Flexibility: Batch-Size Reduction 284
10.4.4 Quality at Source: Defect Prevention and Early Detection 285
10.4.5 Reducing Processing Variability: Standardization of Work,Maintenance, and Safety Capacity 286
10.4.6 Visibility of Performance 287
10.4.7 Managing Human Resources: Employee Involvement 287
10.4.8 Supplier Management: Partnerships 288
10.5 Improving Flows in a Supply Chain 289
10.5.1 Lack of Synchronization: The Bullwhip Effect 290
10.5.2 Causes of the Bullwhip Effect 291
10.5.3 Levers to Counteract the Bullwhip Effect 293
10.6 The Improvement Process 295
10.6.1 Process Stabilization: Standardizing and Controlling the Process 295
10.6.2 Continuous Improvement: Management by Sight and Stress 296
10.6.3 Business Process Reengineering: Process Innovation 297
10.6.4 Benchmarking: Heeding the Voices of the Best 298
10.6.5 Managing Change 298
Summary 299
Key Terms 300
Discussion Questions 300
Selected Bibliography 300
Appendix I MBPF Checklist 303
Appendix II Probability Background 306
Solutions to Selected Problems 311
Glossary 317
Index 324
A01_ANUP6371_03_SE_FM.qxd 6/18/11 9:32 PM Page xiii

A01_ANUP6371_03_SE_FM.qxd 6/18/11 9:32 PM Page xiv

PREFACE
In this book, we present a novel approach to studying the core concepts in operations,which is one of the three major functional fields in business management, along withfinance and marketing. We view the task, and the raison d’être, of operations manage-ment as structuring (designing), managing, and improving organizational processesand use the process view as the unifying paradigm to study operations. We addressmanufacturing as well as service operations in make-to-stock as well as make-to-orderenvironments.
We employ a structured data-driven approach to discuss the core operations man-agement concepts in three steps:
• Model and understand a business process and its flows.• Study causal relationships between the process structure and operational and
financial performance metrics.• Formulate implications for managerial actions by filtering out managerial
“levers” (process drivers) and their impact on operational and financial measuresof process performance.
NEW TO THIS EDITION
The first edition of this book was published in 1999 and reflected our experiences fromteaching the core Operations Management course at the Kellogg School of Managementof Northwestern University. The second edition, published in 2006, improved exposi-tion and clarified the link between theory and practice. While this third edition retainsthe general process-view paradigm, we have striven to sharpen the development ofthe ideas in each chapter, illustrate with contemporary examples from practice, andeliminated some content to make room for some new content, such as:
• Opening vignettes and real-life examples of how the theory can be applied inpractice have been made current. In addition, exposition of material in the chap-ters has been further improved with technical derivations details and other tan-gential ideas relegated to chapter appendices.
• Chapter 4 has been completely revised, with an emphasis on measurement, analy-sis of critical path, and management approaches to leadtime improvements.Technical analysis has been shifted to appendices.
• Chapter 5 has been substantially revised with emphasis on effective capacity andbottleneck management, on the effects of product mix on capacity, and on reduc-tion of capacity waste.
• Chapter 6 now includes discussion of quantity discount policies. Discussions ofperiodic review policies have been added to Chapters 6 and 7.
• Chapter 8 has undergone a complete revision and reorganization to improve flowof concepts; we have also added some discussion on priority processing.
• Chapter 9 has more details on control charts, includes fraction defective chart,recent applications, discussion of integrated design, and total quality management.
• Answers to selected exercises from Chapters 3 to 9 appear at the end of the book.• The end-of-chapter and end-of-book features have been updated.
Finally, we have removed iGrafx simulation (both the software and the associated sam-ple models) from this edition.
xv
A01_ANUP6371_03_SE_FM.qxd 6/18/11 9:32 PM Page xv

OVERVIEW
Our objective is to show how managers can design and manage process structure andprocess drivers to improve the performance of any business process. The book consistsof four parts.
In Part I, “Process Management and Strategy,” we introduce the basic concepts ofbusiness processes and management strategy. Processes are the core technologies of anyorganization to design, produce and deliver products and services that satisfy externaland internal customer needs. Processes involve transforming inputs into outputs bymeans of capital and labor resources that carry out a set of interrelated activities. Theexistence of trade-offs in process competencies implies that world-class operationsmust align their competencies with the desired product attributes and overall competi-tive priorities as formulated by the competitive strategy.
In Part II, “Process Flow Metrics,” we examine key process measures, their interre-lationships, and managerial levers for controlling them. In particular, process flow time,flow rate or throughput, and inventory are three fundamental operational measuresthat affect the financial measures of process performance. Flow time can be improvedby restructuring and shortening the time-critical path of activities; throughput can beimproved by increasing the bottleneck capacity, and inventory can be decreased byreducing the batch sizes, streamlining the process, or reducing variability. Yet, through-out this part, the focus is on the average values, ignoring for now the impact of variabil-ity in process performance.
In Part III, “Process Flow Variability,” we study the effect of variability in flowsand processing on the process performance and the managerial levers to plan for andcontrol it. Safety inventory is used to maintain the availability of inputs and outputsin spite of variability in inflows and demands in the make-to-stock environment.Safety capacity is used to minimize waiting times due to variability in inflows andprocessing times in the make-to-order environment. Safety time is used to provide areliable estimate of the response time to serve a customer. Finally, feedback control is used to monitor and respond to variability in process performance dynamicallyover time.
In Part IV, “Process Integration,” we conclude with principles of synchronizationof flows of materials and information through a network of processes most economi-cally. The ideal is to eliminate waste in the form of excess costs, defects, delays, andinventories. Instead of responding to the economies of scale and variability in flows, thelong-term approach is to eliminate the need for such responses by making processeslean, flexible, and predictable. It requires continual exposure and elimination of sourcesof inefficiency, rigidity, and variability and use of information technology to integratevarious subprocesses. The goal is to design and control the process for continuous flowswithout waits, inventories, and defects. We close with the different philosophies ofprocess improvement toward achieving this goal.
In Appendix I, we give a summary of the “levers” to manage business processes.We hope that this checklist will be useful to the practitioner. We assume that our readershave knowledge of some basic concepts in probability and statistics; for completeness,we summarize these as background material in Appendix II.
INSTRUCTOR RESOURCES
• Instructor Resource Center: The Instructor Resource Center contains the elec-tronic files for the test bank, PowerPoint slides, and the Solutions Manual. (www.pearsonhighered.com/anupindi).
xvi Preface
A01_ANUP6371_03_SE_FM.qxd 6/18/11 9:32 PM Page xvi

• Register, Redeem, Login: At www.pearsonhighered.com/irc, instructors canaccess a variety of print, media, and presentation resources that are available withthis text in downloadable, digital format. For most texts, resources are also avail-able for course management platforms such as Blackboard, WebCT, and CourseCompass.
• Need help? Our dedicated technical support team is ready to assist instructorswith questions about the media supplements that accompany this text. Visithttp://247.pearsoned.com/ for answers to frequently asked questions and toll-free user support phone numbers. The supplements are available to adoptinginstructors. Detailed descriptions are provided on the Instructor ResourceCenter.
Instructor’s Solutions ManualThe Instructor’s Solutions Manual, updated by the authors, is available to adopters as adownload from the Instructor Resource Center.
Test Item FileThe test item file, updated by the authors, is available to adopters as a downloadedfrom the Instructor Resource Center.
PowerPoint PresentationsThe PowerPoint presentations, updated by the authors, are available to adopters as adownloaded from the Instructor Resource Center.
ACKNOWLEDGMENTS
We gratefully acknowledge the feedback from our full-time, part-time, and executivemanagement students at our respective institutions and numerous adopters of the text-book at other institutions. Our colleagues Krishnan Anand (now at David Eccles Schoolof Business, University of Utah), Sarang Deo, Martin (Marty) Lariviere, Andy King(now at Dartmouth College), and Matt Tuite (now retired) have, over time, given usmany suggestions for improvement. In particular, Anand suggested the original LoanApplication Flow example in Chapter 3, while Marty offered us several new exercises.(Instructors know that good problem sets are golden.) Andy pointed out the need toexplicitly account for setup times in determining flow rate more accurately. In addition,we also benefited from the suggestions by several colleagues at other universities. Weare particularly indebted to Larry Robinson at Cornell University, George Monahan atthe University of Illinois at Urbana–Champaign, Kevin Gue and Ken Doerr of the NavalPostgraduate School at Monterey, and Marty Puterman at the University of BritishColumbia.
The manuscript has benefited significantly from extensive and meticulousreviews from Amy Whitaker, developmental editor at Pearson Prentice Hall. We arethankful to her for suggesting, among other things, the idea of a glossary of terms andhelping us prepare this list. Several people from the staff at Pearson Prentice Hall havereally worked hard in patiently coordinating the entire project. In particular, we arethankful to Mary Kate Murray, Senior Project Manager; Chuck Synovec, SeniorAcquisition Editor; Anne Fahlgren, Executive Marketing Manager; Clara Bartunek,Production Project Manager. We also thank Mohinder Singh of Aptara Incorporation forhis assistance with the production of the book.
Preface xvii
A01_ANUP6371_03_SE_FM.qxd 6/18/11 9:32 PM Page xvii

Finally, all of us have been influenced in various ways by the way we were taughtoperations at our respective alma maters. Parts of the book reflect what each of usimbibed from the various classes we took. So we thank our mentors and other faculty atCarnegie Mellon University, Stanford University, the State University of New York atStony Brook, and the University of California at Berkeley. Last, but not least, we wouldlike to thank our families for their support during this effort.
Ravi AnupindiStephen M. Ross School of BusinessUniversity of Michigan, Ann Arbor
Sunil Chopra,Sudhakar D. Deshmukh,and Jan A. Van Mieghem
J.L. Kellogg School of ManagementNorthwestern University
Eitan ZemelLeonard N. Stern School of Business
New York University
xviii Preface
A01_ANUP6371_03_SE_FM.qxd 6/18/11 9:32 PM Page xviii