Manager's Handbook for Software Development Revision...
79
SEL-84-101 Manager's Handbook for Software Development Revision 1 NOVEMBER 1990 National Aeronautics and Space Administration Goddard Space Flight Center Greenbelt, Maryland 20771 SOFTWARE ENGINEERING LABORATORY SERIES
Transcript of Manager's Handbook for Software Development Revision...

SEL-84-101
Manager's Handbook forSoftware Development
Revision 1
NOVEMBER 1990
National Aeronautics andSpace Administration
Goddard Space Flight CenterGreenbelt, Maryland 20771
SOFTWARE ENGINEERING LABORATORY SERIES

iii
FOREWORD
The Software Engineering Laboratory (SEL) is an organization sponsored by the NationalAeronautics and Space Administration/Goddard Space Flight Center (NASA/GSFC) and created forthe purpose of investigating the effectiveness of software engineering technologies when applied tothe development of applications software. The SEL was created in 1977 and has three primaryorganizational members: NASA/GSFC, Systems Development Branch; University of Maryland,Computer Sciences Department; Computer Sciences Corporation, Flight Dynamics TechnologyGroup.
The goals of the SEL are (1) to understand the software development process in the GSFCenvironment; (2) to measure the effect of various methodologies, tools, and models on this process;and (3) to identify and then to apply successful development practices. The activities, findings, andrecommendations of the SEL are recorded in the Software Engineering Laboratory Series, acontinuing series of reports that includes this document.
The Manager's Handbook for Software Development was originally published in April 1984.Contributors to the original version included
William Agresti, Computer Sciences CorporationFrank McGarry, Goddard Space Flight CenterDavid Card, Computer Sciences CorporationJerry Page, Computer Sciences CorporationVictor Church, Computer Sciences CorporationRoger Werking, Goddard Space Flight Center
The new edition contains updated material and constitutes a major revision. The primarycontributors to the current edition are
Linda Landis, Editor, Computer Sciences CorporationFrank McGarry, Goddard Space Flight CenterSharon Waligora, Computer Sciences CorporationRose Pajerski, Goddard Space Flight CenterMike Stark, Goddard Space Flight CenterRush Kester, Computer Sciences CorporationTim McDermott, Computer Sciences CorporationJohn Miller, Computer Sciences Corporation
Single copies of this document can be obtained by writing to
Systems Development BranchCode 552Goddard Space Flight CenterGreenbelt, Maryland 20771

v
ABSTRACT
Methods and aids for the management of software development projects are presented. Therecommendations are based on analyses and experiences of the Software Engineering Laboratory(SEL) with flight dynamics software development. The management aspects of the followingsubjects are described: organizing the project, producing a development plan, estimating costs,scheduling, staffing, preparing deliverable documents, using management tools, monitoring theproject, conducting reviews, auditing, testing, and certifying.

vii
TABLE OF CONTENTS
Section 1 — Introduction 1-1Handbook Overview 1-1Intended Audience 1-2Software Life Cycle 1-3Activities Spanning Phases 1-5
Section 2 — Organizing and Planning 2-1Organizing the Project 2-1Producing the Software Development/Management Plan 2-2Executing the Software Development/Management Plan 2-5
Section 3 — Cost Estimating, Scheduling, and Staffing 3-1Estimating Development Cost and Schedule 3-1Project Staffing 3-4Other Software Development Costs 3-5
Cost of Computer Utilization 3-5Cost of System Documentation 3-7Cost of Rehosting Software 3-7Cost of Reusing Software 3-7Cost of Software Maintenance 3-8
Section 4 — Key Documents and Deliverables 4-1Suggested Document Contents 4-1Guidelines for Evaluating Completed Documents 4-11
Section 5 — Verification, Testing, and Certification 5-1Code Reading 5-1Unit Testing 5-1Integration Testing 5-2Build/Release Testing 5-2System Testing 5-3Acceptance Testing 5-3Test Management Guidelines 5-4Certification 5-5
Section 6 — Metrics and Key Management Aids 6-1Metrics 6-1Management Metrics and Their Use 6-2
Source Code Growth Rate 6-3Effort Data 6-4System Size Estimates 6-6Computer Usage 6-7
viii
TABLE OF CONTENTS (Cont'd)
Section 6 — Metrics and Key Management Aids (Cont'd)Error Rates 6-8Reported/Corrected Software Discrepancies 6-9Rate of Software Change 6-10Development Activity Status 6-11
Additional Management Metrics 6-12Data Collection 6-13Automating Metrics Analysis 6-13General Indicators of Project Status 6-15Warning Signals and Corrective Actions 6-16Basic Set of Corrective Actions 6-18
Section 7 — Reviews and Audits 7-1Reviews 7-1
System Requirements Review 7-2Software Specifications Review 7-4Preliminary Design Review 7-6Critical Design Review 7-8Operational Readiness Review 7-10
Audits 7-13
Appendix A — SEL Software Development Environment
Glossary
References
Standard Bibliography of SEL Literature

ix
LIST OF ILLUSTRATIONS
Figure Page
1-1 Activities by Percentage of Total Development Staff Effort 1-31-2 Reuse and Prototyping Activities Within the Life Cycle 1-52-1 Software Development/Management Plan Contents 2-33-1 Cost Estimation Schedule 3-23-2 Typical Computer Utilization Profile (FORTRAN Projects) 3-63-3 Typical Computer Utilization Profile (Ada Projects) 3-64-1 Key Documents and Deliverables by Phase 4-14-2 Requirements and Functional Specifications Contents 4-24-3 Operations Concept Document Contents 4-34-4 Requirements Analysis Report Contents 4-44-5 Preliminary Design Report Contents 4-54-6 Detailed Design Document Contents 4-64-7 Contents of Test Plans 4-74-8 User's Guide Contents 4-84-9 System Description Contents 4-94-10 Software Development History Contents 4-105-1 Example of Unit Design Certification 5-66-1 Management Through Measurement 6-26-2 SEL Software Growth Profile 6-36-3 Example of Code Growth — GRO AGSS 6-36-4 SEL Staffing Profile Model 6-46-5 SEL Effort Distribution Models 6-46-6 Effort Data Example — ERBS AGSS 6-56-7 SEL Size Estimates Model 6-66-8 Sample Size Estimates — UARS AGSS 6-66-9 SEL Computer Usage Model 6-76-10 Example of Computer Usage — ERBS AGSS 6-76-11 SEL Error Rate Model 6-86-12 Sample Error Rates — COBE AGSS 6-86-13 SEL Software Discrepancy Status Model 6-96-14 Example of Discrepancy Tracking — TCOPS 6-96-15 SEL Change Rate Model 6-106-16 Change Rate Example — GOES AGSS 6-106-17 SEL Development Status Model for a Single Build 6-116-18 Development Profile Example — GOADA 6-116-19 Example SME Output 6-146-20 Build Corporate Memory Into a Tool 6-157-1 Scheduling of Formal Reviews 7-17-2 SRR Hardcopy Material 7-37-3 SSR Hardcopy Material 7-57-4 PDR Hardcopy Material 7-77-5 CDR Hardcopy Material 7-97-6 ORR Hardcopy Material 7-11

x
LIST OF TABLES
Table Page
3-1 Distribution of Time Schedule and Effort Over Phases 3-13-2 Procedures for Reestimating Size, Cost, and Schedule
During Development 3-33-3 Complexity Guideline 3-33-4 Development Team Experience Guideline 3-43-5 Team Size Guideline 3-53-6 Guideline for Development Team Composition 3-53-7 Cost of Rehosting Software 3-73-8 Cost of Reusing Software 3-85-1 Expected Percentage of Tests Executed That Pass 5-56-1 SEL Recommended Metrics 6-12

1-1
SECTION 1 — INTRODUCTION
This handbook is intended to be a convenient reference on software management methods and aids.The approach is to offer concise information describing
• What the methods and aids can accomplish• When they can be applied• How they are applied• Where the manager can find more background or explanatory material
The management methods and aids included here are those that have proved effective in theexperiences of the Software Engineering Laboratory (SEL) (Reference 1). The characteristics ofsoftware projects in the flight dynamics environment monitored by the SEL appear in the appendixto this document. The applications include attitude determination and control, orbit adjustment,maneuver planning, and general mission analysis.
HANDBOOK OVERVIEW
This document consists of seven sections organized by specific management topics:
Section 1 presents the handbook's purpose, organization, and intended audience. The softwarelife cycle and key development activities are summarized.
Section 2 discusses the basic management concerns of organizing and planning in the context ofsoftware management. The production of the software development management plan is covered indetail.
Section 3 describes resource estimation and allocation. Techniques are presented for estimatingsize, costs, and effort. Guidelines are given for project scheduling and for staff allocation andcomposition.
Section 4 outlines contents, timing, and evaluation of key documents and deliverables in a softwareproject.
Section 5 discusses the management aspects of software verification, testing, and certification.
Section 6 summarizes management measures and aids used in monitoring and controlling asoftware project. Key indicators of progress are listed along with warning signals and correspondingcorrective measures.
Section 7 presents both the general function of project reviews and the specific implementation ofthe five major reviews. Guidelines for auditing a project are also introduced.
An appendix, glossary, references, and a bibliography of SEL literature conclude thehandbook.

1-2
INTENDED AUDIENCE
The intended audience of this document is the software manager, who, as defined in this handbook,serves as either an administrative or technical manager. The positions overlap somewhat in theirinformation needs.
The administrative manager has overall responsibility for developing software that meetsrequirements and is delivered on time and within budget. In the SEL environment, a GovernmentTechnical Officer or Assistant Technical Representative (ATR) generally serves in this capacity.Typically, this manager is not involved with the day-to-day technical supervision of the programmersand analysts who are developing the software. The administrative manager will be involved in theactivities listed below; the corresponding handbook sections are listed alongside.
• Organizing the project Section 2• Estimating resources required Section 3• Estimating costs Section 3• Evaluating documents and deliverables Section 4• Monitoring progress Section 6• Evaluating results of reviews and audits Section 7• Certifying the final product Section 5
The technical manager is responsible for direct supervision of the developers. The position isfrequently filled by a contractor manager in the SEL environment; although, on some projects, aGovernment manager will fill this role instead. This person shares some of the activities listed for theadministrative manager, especially with regard to monitoring development progress. The technicalmanager's activities and the corresponding handbook references are presented below.
• Producing and executing the software development/management plan Section 2
• Estimating costs Section 3• Scheduling the project Section 3• Staffing the project Section 3• Directing the production of documents
and deliverables Section 4• Using automated management aids Section 6• Monitoring development progress Section 6• Supervising technical staff Section 6• Ensuring software quality Section 5• Preparing for reviews Section 7
A secondary audience for the handbook consists of those who serve a particular peripheral functionbut do not act in either of the two managerial capacities. Two examples of such specific functions areparticipating as an external reviewer at a scheduled review and conducting an audit of the project.
Government managers should note that there is no identifiable conflict between the materialpresented in this handbook and major NASA/GSFC standards.

1-3
SOFTWARE LIFE CYCLEThe process of software development is often modeled as a series of stages that define the softwarelife cycle. In the flight dynamics environment, the life cycle is defined by the following phases:
• Requirements definition• Requirements analysis• Preliminary design• Detailed design• lmplementation• System testing• Acceptance testing• Maintenance and operation
As shown in Figure 1-1, the phases divide the software life cycle into sequential time periods that donot overlap. However, the activities characteristic of one phase may be performed in other phases.For example, although most of the staff effort in analyzing requirements occurs during therequirements analysis phase, some of that activity continues at lower levels in later phases.
PE
RC
EN
TA
GE
OF
TO
TA
L S
TA
FF
EF
FO
RT
SYSTEM TEST
PHASE
IMPLEMENTATION PHASEREQUIREMENTS DEFINITION
PHASE
ORRSRR SSR PDR CDR
CALENDAR TIME
DESIGN
IMPLEMENTATION
SYSTEM TESTING
ACCEPTANCETESTING
PRELIMINARY DESIGN PHASE
REQUIREMENTS ANALYSIS PHASE
ACCEPTANCETEST PHASE
MAINTENANCE AND
OPERATION PHASE
DETAILEDDESIGN PHASE
REQUIREMENTS ANALYSIS
Figure 1-1. Activities by Percentage of Total Development Staff Effort
Example: At the end of the implementation phase (4th dashed line), approximately 46% of thestaff are involved in system testing; approximately 15% are preparing for acceptance testing;approximately 7% are addressing requirements changes or problems; approximately 12% aredesigning modifications; and approximately 20% are coding, code reading, unit testing, andintegrating changes. Data are shown only for the phases of the software life cycle for which theSEL has a representative sample.

1-4
The life cycle phases are important reference points for the software manager. For example, inmonitoring a project, the manager may find that the key indicators of project condition at one phaseare not available at other phases. Milestones in the progress of a software project are keyed to thereviews, documents, and deliverables that mark the transitions between phases. Management aids andresource estimates can be applied only at certain phases because their use depends on the availabilityof specific information.
In the requirements definition phase, a working group of analysts and developers identifiespreviously developed subsystems that can be reused on the current project and submits a reuseproposal. Guided by this proposal , a requirements definition team prepares the requirementsdocument and completes a draft of the functional specifications for the system. The conclusion ofthis phase is marked by the system requirements review (SRR) at which the requirements for thesystem are evaluated.
During the next phase, requirements analysis, the development team classifies each specification andperforms functional or object-oriented analysis. Working with the requirements definition team,developers resolve ambiguities, discrepancies, and to-be-determined (TBD) specifications, producinga final version of the functional specifications document and a requirements analysis report. Thisphase is concluded with a software specifications review (SSR) at which the results of the analysis arepresented for evaluation.
The baselined functional specifications form a contract between the requirements definition team andthe software development team and are the starting point for preliminary design. During this thirdphase, members of the development team produce a preliminary design report in which they definethe software system architecture and specify the major subsystems, input/output (I/O) interfaces, andprocessing modes. The preliminary design review (PDR), conducted at the end of this phase,provides an opportunity for evaluating the design presented by the development team.
In the fourth phase, detailed design, the system architecture defined during the previous phase iselaborated in successively greater detail, to the level of subroutines. The development team fullydescribes user input, system output, I/O files, and intermodule interfaces. An implementation plan isproduced, describing a series of builds and releases that culminate with the delivered software system.The corresponding documentation, including complete baseline diagrams, makes up the detaileddesign document. At the critical design review (CDR), the detailed design is evaluated to determine ifthe levels of detail and completeness are sufficient for coding to begin.
During the implementation (code, unit testing, and integration) phase, the development team codesthe required modules using the detailed design document. The system grows as new modules arecoded, tested, and integrated. The developers also revise and test reused modules and integrate theminto the evolving system. Implementation is complete when all code is integrated and whensupporting documents (system test plan and draft user's guide) are written.
The sixth phase, system testing, involves the functional testing of the end-to-end system capabilitiesaccording to the system test plan. The development team validates the completely integrated systemand produces a preliminary system description document. Successful completion of the tests requiredby the system test plan marks the end of this phase.
During the seventh phase, acceptance testing, an acceptance test team that is independent of thesoftware development team examines the completed system to determine if the original requirementshave been met. Acceptance testing is complete when all tests specified in the acceptance test plan

1-5
have been run successfully. Final versions of the user's guide and system description are published,and an operational readiness review (ORR) is conducted to evaluate the system's readiness to beginoperational support.
The eighth and final phase, maintenance and operation, begins when acceptance testing ends. Thesystem becomes the responsibility of the maintenance and operation group. The nature and extent ofactivity during this phase depends on the type of software developed. For some support software, themaintenance and operation phase may be very active due to the changing needs of the users.
ACTIVITIES SPANNING PHASES
In the flight dynamics environment, reuse and prototyping are key activities in several phases of thelife cycle.
In the requirements definition and requirements analysis phases, reuse analysis is performed todetermine which major segments (subsystems) of existing software can be utilized in the system to bedeveloped. In the design phases, developers conduct a verification of this analysis by examiningeach reusable element individually. During the preliminary design phase, developers study majorcomponents to determine if they can be reused verbatim or modified. Extraction of individual unitsfrom a reusable software library (RSL) is conducted during the detailed design phase. A final reuseactivity occurs at the end of the system test phase, at which time developers select pieces of thedeveloped software as candidates for inclusion in the RSL.
Prototyping activities are usually begun during requirements analysis and completed by the end ofdetailed design. A protoype is an early experimental model of a system, system component, orsystem function that contains enough capabilities for it to be used to establish or refine requirementsor to validate critical design concepts. In the flight dynamics environment, prototypes are generallyused to mitigate risks by resolving unknowns related to new technology.
Figure 1-2 shows the span of these two categories of activity in the SEL environment.
REQUIREMENTSDEFINITION
PHASE
SRR SSR PDR CDR
REQUIREMENTS ANALYSIS PHASE
PRELIMINARYDESIGN PHASE
DETAILEDDESIGN PHASE
IMPLEMENTATIONPHASE
ACCEPTANCE TESTING PHASE
SYSTEMTESTINGPHASE
ORR
REUSE ANALYSIS(subsystem level)
EXTRACTIONOF RSL
CANDIDATES
PROTOTYPING
MAINTENANCEAND OPERATION
PHASE
CALENDAR TIME
REUSE VERIFICATION(component & unit level)
Figure 1-2. Reuse and Prototyping Activities Within the Life Cycle
The management methods and aids in this handbook are associated with the phases fromrequirements definition through acceptance testing. Reference 2 contains a more detailedexplanation of life cycle phases and activities.

2-1
SECTION 2 — ORGANIZING AND PLANNING
The key to successful software management is to generate a realistic, usable plan and then followit. The critical early stages of organizing and planning lay the foundation for effective projectmanagement and control.
ORGANIZING THE PROJECT
To get started, the manager must gain a clear understanding of the scope of the project and mustestablish the basis for control. The major initial concerns relate to clarifying the requirements, thedeliverables, and the organizational framework. By addressing the four sets of questions below,the manager will acquire an understanding of the key elements that will affect project planning.
Identifying the Requirements
What functions must the system perform?How will the system be operated?Are the boundaries of the system visible?In what form does the job definition exist?Is the current job definition understandable?Does the project depend on external events or activities?
Identifying the Products and Deliverables
What documents, programs, and files are specified as deliverable products?When must they be delivered?In what form are the deliverables, e.g., draft copies or on tape?Who will receive the deliverables and accept the final product?What criteria will be used to judge the acceptability of the final product?
Preparing for Control
Is there a timetable for periodic reporting of project status?What is the procedure for incorporating requirements changes that affect the scope of the
work?What reviews will be necessary to mark the transitions between phases?Are there technical or managerial risks to successful completion of the project?What measures will be used to assess project health?
Establishing an Organizational Identity
Who will be the key contact people from the customer, developer, and support groups?Do the different groups understand their areas of project responsibility?Where will the development work be done?Which development computers will be used?What level of access to the computers will be required?

2-2
PRODUCING THE SOFTWARE DEVELOPMENT/MANAGEMENT PLANIn many environments, the software management plan and the software development plan areseparate policy documents with different orientations. The management plan is directed toward thebroader aspects of administration and control, e.g., project-level monitoring of resourceexpenditures and the functioning of the configuration control board (CCB). The developmentplan focuses more on methods and approaches to software production, e.g., testing strategies andprogramming methodologies. Although these differences exist between the two plans, there isgenerally some material in common.
ln the flight dynamics environment of the SEL, the two plans are combined into a singledocument, the software development/management plan. Although the remainder of this sectiondescribes the contents of a single combined plan, the reader is encouraged to separate the contentsinto two plans if that is more appropriate to the needs of his/her environment. In either case, theitems in this section must be formally addressed for a project to be successful.
The software development/management plan provides a disciplined approach to organizing andmanaging the software project. A successful plan serves as
• A structured checklist of important questions• Consistent documentation for project organization• A baseline reference with which to compare actual project performance and experiences• A detailed clarification of the management approach to be used
By completing the plan early in the life cycle, the manager becomes familiar with the essentialsteps of organizing the development effort:
• Estimating resources• Establishing schedules• Assembling a staff• Setting milestones
The plan should concentrate on information that is unique or tailored to the project at hand. Ifstandard policies, guidelines, or procedures will be applied to an aspect of the project, the planshould reference the documents in which these are defined rather than restating them in detail.Writing the plan can begin as soon as any information about the project definition and scopebecomes available. The plan should be completed by the end of the requirements analysis phase,except for information available only at later phases. If items in the software development/management plan are missing for any reason, the manager should indicate who will supply theinformation and when it will be supplied.
Copies of the plan should be provided to all levels of project management and the project'stechnical staff.
Figure 2-l presents the suggested format and contents for the software development/managementplan, including several references to sections of this handbook for detailed descriptions. Theformat is intended as a guide. Depending on the application environment, a different arrangementof items or the addition of new material may be appropriate.

2-3
SOFTWARE DEVELOPMENT/MANAGEMENT PLANSections in italics describe material that is to be regularly added to the plan during the life of the
project. Other sections should be revised and reissued if circumstances require significant changes in
approach.
TITLE PAGE — document number, project and task names, report title, and report date.
LEAD SHEET — document identification numbers, project and task names, report title, customer
name, preparers, contract and task identifiers, and report date.
TABLE OF CONTENTS — list of subsection titles and page numbers.
1. INTRODUCTION1.1 Purpose — brief statement of the project's purpose.
1.2 Background — brief description that shows where the software products produced
by the project fit in the overall system.
1.3 Organization and Responsibilities1.3.1 Project Personnel — explanation and diagram of how the development team
will organize activities and personnel to carry out the project: types and numbers
of personnel assigned, reporting relationships, and team members' authorities and
responsibilities (see Section 3 for guidelines on team composition).
1.3.2 Interfacing Groups — list of interfacing groups, points of contact, and group
responsibilities.
2. STATEMENT OF PROBLEM — brief elaboration of the key requirements, the steps to
be done, the steps (numbered) necessary to do it, and the relation (if any) to other
projects.
3. TECHNICAL APPROACH3.1 Reuse Strategy — description of the current plan for reusing software from
existing systems.
3.2 Assumptions and Constraints — that govern the manner in which the work
will be performed.
3.3 Anticipated and Unresolved Problems — that may affect the work and the
expected effect on each phase.
3.4 Development Environment — target development machine and programming
languages.
3.5 Activities, Tools, and Products — for each phase, a matrix showing: a) the
major activities to be performed, b) the development methodologies and tools to be
applied, and c) the products of the phase (see Section 4). Includes discussion of
any unique approaches or activities.
3.6 Build Strategy — what portions of the system will be implemented in which
builds and the rationale. Updated at the end of detailed design and after each build.
4. MANAGEMENT APPROACH4.1 Assumptions and Constraints — that affect the management approach,
including project priorities.
4.2 Resource Requirements — tabular lists of estimated levels of resources
required, including estimates of system size (new and reused LOC and modules), staff
effort (managerial, programmer, and support) by phase, training requirements, and
computer resources (see Section 3). Includes estimation methods or rationale used.
Updated estimates are added at the end of each phase.
Figure 2-1. Software Development/Management Plan Contents (1 of 2)

2-6
4.3 Milestones and Schedules — list of work to be done, who will do it, and when it will be completed. Includes development life cycle (phase start and finish dates); build/release dates; delivery dates of required external interfaces; schedule for integration of externally developed software and hardware; list of data, information,documents, software, hardware, and support to be supplied by external sources and delivery dates; list of data, information, documents, software, and support to be delivered to the customer and delivery dates; and schedule for reviews (internal andexternal). Updated schedules are added at the end of each phase.
4.4 Metrics — a table showing, by phase, which metrics will be collected to capture project data for historical analysis and which will be used by management to monitor progress and product quality (see Section 6 and Reference 3). If standard metrics will be collected, references to the relevant standards and procedures will suffice. Describes any measures or data collection methods unique to the project.
4.5 Risk Management — statements of each technical and managerial risk or concern and how it is to be mitigated. Updated at the end of each phase to incorporate any new concerns.
5. PRODUCT ASSURANCE
5.1 Assumptions and Constraints — that affect the type and degree of quality control and configuration management to be employed.
5.2 Quality Assurance (QA) — table of methods and standards used to ensure the quality of the development process and products (by phase). Where these do not deviate from published methods and standards, the table references the appropriatedocumentation. Means of ensuring or promoting quality that are innovative or unique to the project are described explicitly. Identifies the person(s) responsible forQA on the project, and defines his/her functions and products by phase.
5.3 Configuration Management (CM) — table showing products controlled, tools andprocedures used to ensure the integrity of the system configuration: when the system is under control, how changes are requested, who makes the changes, etc. Unique procedures are discussed in detail. If standard CM practices are to be applied, references to the appropriate documents are sufficient. Identifies the person responsible for CM and describes this role. Updated before the beginning of each new phase with detailed CM procedures for the phase, including naming conventions, CM directory designations, reuse libraries, etc.
6. REFERENCES
7. PLAN UPDATE HISTORY — development plan lead sheets from each update indicating which sections were updated.
Figure 2-1. Software Development/Management Plan Contents (2 of 2)
2-5
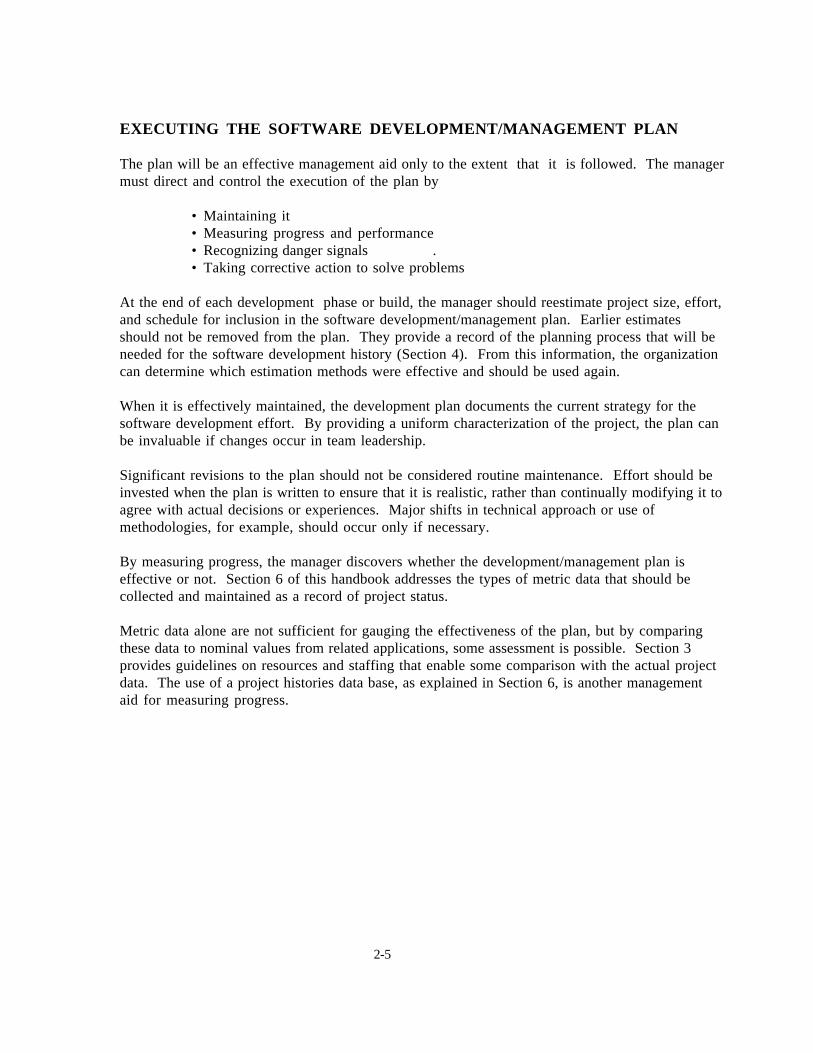
EXECUTING THE SOFTWARE DEVELOPMENT/MANAGEMENT PLAN
The plan will be an effective management aid only to the extent that it is followed. The managermust direct and control the execution of the plan by
• Maintaining it• Measuring progress and performance• Recognizing danger signals .• Taking corrective action to solve problems
At the end of each development phase or build, the manager should reestimate project size, effort,and schedule for inclusion in the software development/management plan. Earlier estimatesshould not be removed from the plan. They provide a record of the planning process that will beneeded for the software development history (Section 4). From this information, the organizationcan determine which estimation methods were effective and should be used again.
When it is effectively maintained, the development plan documents the current strategy for thesoftware development effort. By providing a uniform characterization of the project, the plan canbe invaluable if changes occur in team leadership.
Significant revisions to the plan should not be considered routine maintenance. Effort should beinvested when the plan is written to ensure that it is realistic, rather than continually modifying it toagree with actual decisions or experiences. Major shifts in technical approach or use ofmethodologies, for example, should occur only if necessary.
By measuring progress, the manager discovers whether the development/management plan iseffective or not. Section 6 of this handbook addresses the types of metric data that should becollected and maintained as a record of project status.
Metric data alone are not sufficient for gauging the effectiveness of the plan, but by comparingthese data to nominal values from related applications, some assessment is possible. Section 3provides guidelines on resources and staffing that enable some comparison with the actual projectdata. The use of a project histories data base, as explained in Section 6, is another managementaid for measuring progress.

3-1
SECTION 3 — COST ESTIMATING, SCHEDULING, ANDSTAFFING
This section presents methods for managing and estimating the resources required for the softwareproject. Two of the most critical resources are development staff and time. The softwaremanager is concerned with how much time will be required to complete the project and what staffinglevel will be necessary over the development cycle. Both staff and time are estimated using theprocedures discussed in this section. Issues of staff size and composition over the life cycle areconsidered. Guidelines are provided for estimating some additional important cost elements such ascomputer utilization and system documentation. Reference 4 provides the background and rationalefor software cost estimation.
A cautionary note applies to the cost factors throughout this section. The values summarized in theappendix to this document reflect SEL experiences in developing software for the flight dynamicsenvironment. Readers of this handbook should assess how well that summarymatches their own software development environment as an indication of the degree of confidenceto place in the particular cost values presented. A prudent plan is to use the values here as a firstapproximation and begin collecting data (see Reference 3) to obtain cost factors that arerepresentative of the reader's environment.
ESTIMATING DEVELOPMENT COST AND SCHEDULE
An understanding of the expected schedule consumption and effort expenditure in each phase of thelife cycle is essential to managers. Figure l-l and Table 3-l present these distributions as theyreflect projects monitored by the SEL. Because the cost of developing software is often expressed inunits of effort (e.g., staff-months) to avoid the effects of inflation and salary variation, cost andeffort will be used interchangeably in this section when accounting for the expenditure of staffresources.
Table 3-1. Distribution of Time Schedule and Effort Over Phases
PHASE
Requirements Analysis
Preliminary Design
Detailed Design
Implementation
System Testing
Acceptance Testing
12
8
15
30
20
15
6
8
16
40
20
10
PERCENTOF TIME
SCHEDULE
PERCENTOF EFFORT
Although it is the most uncertain, the initial estimate is, in many ways, the most important. Itoccurs at such an early stage (after the requirements definition activity) that the temptation is strongto ignore it; to do so is a mistake. Making the initial estimate has the welcome side effect of leadingthe manager to consider the various factors bearing on the size and complexity of the developmenttask. The initial estimate seeds the estimation process, serving as a reference value with which tocompare later estimates. In view of this singular role, the following steps are suggested forachieving an initial estimate

3-2
• Decompose the requirements as far as possible. The decomposition unit at this point willprobably be the subsystem.
• For each decomposition unit, identify similarities with functional units in previously developedsystems and use any historical size data available from these completed systems.
• For decomposition units not strongly related to those of previous projects, use personalexperience to estimate the size of units.
• Form the size estimate (in lines of code) for the entire project by adding the estimates for all thedecomposition units.
• From historical data and personal experience, estimate the work rate (in lines of code per staff-month).
• Divide the size estimate by the work rate to obtain an estimate of the effort in staff-months.
• Apply the uncertainty proportion of l.0 to the size and effort estimates to obtain a range ofpossible values (See Figure 3-1 and Table 3-2).
After the initial estimate is made, a minimum of five reestimates (numbered 2 through 6 inFigure3-l) are prescribed. These reestimates are detailed in Table 3-2. They are based on theincreasing granularity in the representation of the system during the life cycle. The uncertaintiesfrom Figure 3-1 are repeated in Table 3-2 because of their importance in transforming the individualestimates into ranges of estimated values.
The estimation factors in Table 3-2 represent average values for typical development projectsmonitored by the SEL. The estimates should be adjusted (before the uncertainty proportion isapplied) when the manager identifies certain aspects of the problem, process, or environment thatvary significantly from customary development conditions. For example, when many moduleswithin the system will be unusually large or small due to their specialized function (e.g., in generatinggraphics), their estimated size should be based on previously developed modules with similarfunctions. In addition, any of the following conditions may strongly affect the effort necessary tocomplete the project: use of a new and dissimilar programming language, development by acompletely inexperienced team, or the use of a new and dissimilar computer system.
The effects of some of these conditions have been estimated by the SEL. Table 3-3 provides therecommended percentage adjustment to the effort estimate due to the complexity of the problem.Table 3-4 provides an adjustment to the effort estimate for the effect of different team experiencelevels.
LIFE CYCLEPHASES
REQUIREMENTSDEFINITION ANDSPECIFICATION
REQUIREMENTSANALYSIS
DETAILED DESIGN IMPLEMENTATION
SYSTEM TEST
ACCEPT-ANCETEST
PRELIMINARYDESIGN
1
1.00
2
0.75
3
0.40
4
0.25
5
0.10
6
0.05
a
ESTIMATES
aReestimates should also be made at the end of each build or release of a staged implementation.
UNCERTAINTY (PROPORTION)
Figure 3-1. Cost Estimation Schedule

3-3
Table 3-2. Procedures for Reestimating Size, Cost, and Schedule During Development
ESTIMATIONPOINT
DATAREQUIRED SIZE ESTIMATE COST (EFFORT)
ESTIMATE
end ofRequirements Analysis
end ofPreliminary Design
end ofDetailed Design
end ofImplementation
end ofSystem Testing
Number of subsystems
Number of units
Number of new and extensively modified units (N)
Number of reused units (R) (slightly modified and verbatim
Current size in SLOC
Effort expended to date
Time schedule expended to date
Effort expended to date
Use 11000 SLOC per subsystem
Use 190 SLOC per unit
Compute number of developed units =N + 0.2R
Use developed SLOC = 200 x number of developed units
Add 26% to current size (for growth during testing)
Final product size has been reached
Use 3000 hours per subsystem
Use 52 hours per unit
Use 0.31 hours per developed SLOC
Add 43% to effort already expended (for effort to complete)
Add 11% to effort already expended (for effort to complete)
UNCERTAINTY (PROPORTION) b
Use 83 weeks per subsystem per staff member
Use 1.45 weeks per unit per staff member
Use .0087 weeks per developed SLOC per staff member
Add 54% to time scheduleexpended (for time to complete)
Add 18% to time scheduleexpended (for time to complete)
0.75
0.40
0.25
0.10
0.05
e
c d
NOTE: Parameter values are derived from three attitude ground support systems (AGSSs): GOES, GRO, and COBE.
Schedule/staffing values are based on a full-time employee's average work week, with adjustments for holidays, leave, etc. (1864 hours annually). The values provided can be used to determine either schedule or staff level, depending on which parameter is given.Of size and effort estimates: Upper limit = (size or effort estimate) x (1.0 + uncertainty). Lower limit = (size or effort estimate)/(1.0 + uncertainty). To allow for TBD requirements, staff turnover, etc., conservative management practice dictates the use of estimates that lie between the estimated value and the upper bound. SEL managers, for example, generally plan for a 40% increase in estimated system size from PDR to project end due to changing requirements.Source line of code: a single line of executable or nonexecutable source code (including comments and embedded blank lines).Estimates of total effort (or time). Subtract effort (or time) already expended to get effort (or time) to complete.Unit: a named software element that is independently compilable, e.g., a subroutine, subprogram, or function.
a
b
cde
SCHEDULE/ STAFFING ESTIMATEa
d
c dd
d
d

3-4
Table 3-3. Complexity Guideline
Application, e.g., orbit determination, simulator. The project (or portion of the project) type is old when the organization has more than 2 years experience with it.Computing environment, e.g., IBM 4341, VAX 8810. The environment type is old when the organization has more than 2 years of experience with it on average.
a
b
OldOldNewNew
OldNewOldNew
ENVIRONMENTTYPEb
1.01.41.42.3
EFFORTMULTIPLIER
PROJECTTYPEa
Table 3-4. Development Team Experience Guideline
Average of team member's years of application experience weighted by member's participation on the team. Application experience is defined as prior work on similar applications, e.g., attitude and orbit determination. Member's participation is defined as time spent working on the project as a proportion of total project effort.
a
EFFORT MULTIPLIER
1086421
TEAM YEARS OF APPLICATION EXPERIENCEa
0.50.60.81.01.42.6
PROJECT STAFFING
Although the average level of staff is provided by the effort estimate, more specific guidelines areavailable for three aspects of staffing — team size, staffing pattern, and teamcomposition. Typical staffing profiles are provided in Section 6. Table 3-5 presents guidelinesfor team size in terms of the team leader's experience. Table 3-6 addresses team composition,listing recommended percentages of senior personnel and analysts.

3-5
Table 3-5. Team Size Guideline
Applicable
MAXIMUM TEAM SIZE EXCLUDING
TEAM LEADER
654
310
432
7 ± 24 ± 22 ± 1
TEAM LEADER: MINIMUM YEARS OF EXPERIENCE a
Organization Leadership
Applicable
OrganizationLeadership
= Applicable experience (requirements definition, analysis, development, maintenance, and operation).= Experience with the organization and its development methodology.= Experience as a team leader or manager.
a
Examples: A team leader with no leadership experience should not be asked to manage a team with greater than three members. A team of seven to nine members should be provided with a leader who has six years or more of experience with the application, primarily within the organization.
Table 3-6. Guideline for Development Team Composition
PERCENTAGE OF ANALYSTSc
25-3333-5033-5050-67
PERCENTAGE OF SENIOR PERSONNELb
OldOldNewNew
OldNewOldNew
PROJECTTYPE a
ENVIRONMENTTYPEa
25-3325-3333-5033-50
The project and environment types are old when the development team has, on average, more than 2 years experience with them.Senior personnel are those with more than 5 years of experience in development-related activities.Analysts are those personnel who have training and an educational background in problem definition and solution with the application (project type).
a
bc
OTHER SOFTWARE DEVELOPMENT COSTS
Estimates and guidelines are presented for other software cost elements: computer utilization, systemdocumentation, software rehosting, software reuse, and software maintenance.
Cost of Computer Utilization
This cost may be expressed in terms of system size. The estimate of total hours of CPU time, H, in aNAS 8040 environment is H = 0.0008L, where L is the number of lines of source code in thesystem. (The NAS 8040 is comparable to an IBM 3033). The estimated number of runs, R, in thesame SEL environment is R = 0.29L. Figures 3-2 and 3-3 show computer utilization over the lifecycles of recent projects monitored by the SEL.

3-7
RequirementsAnalysis
PreliminaryDesign
DetailedDesign Implementation
System Test
AcceptanceTest
CO
MP
UT
ER
US
E (P
ER
CE
NT
OF
AV
ER
AG
E W
EE
KLY
US
E)
100%
200%
0 25 50 75 100
PERCENT OF DEVELOPMENT SCHEDULE
AVERAGE WEEKLY COMPUTER USE
Figure 3-2. Typical Computer Utilization Profile (FORTRAN Projects)
•
•
•
In comparison to FORTRAN,Ada projects utilize a largerpercentage of CPU early inthe life cycle
PDL and prolog are compiledduring the design phases
Integration testing isconducted throughout theimplementation phase
100%
Require-ments
Analysis
Pre-liminaryDesign
DetailedDesign
ImplementationSystem
TestAcceptance
Test
200%
CO
MP
UT
ER
US
E (P
ER
CE
NT
OF
AV
ER
AG
E W
EE
KLY
US
E)
0 25 50 75 100
PERCENT OF DEVELOPMENT SCHEDULE
AVERAGE WEEKLY COMPUTER USE
Figure 3-3. Typical Computer Utilization Profile (Ada Projects)

3-7
Cost of System Documentation
Documentation cost is included in the cost estimates of Table 3-2. The average quantity ofdocumentation for a given software development project can be estimated using the formulaP = 120 + 0.026 L,where P is pages of documentation and L is source lines of code. This costcovers a requirements analysis report, design documents, system description, and user's guide.For a separate documentation task, 4 staff-hours per page may be used to estimate the total cost ofsystem documentation.
Cost of Rehosting Software
Rehosting means modifying existing software to operate on a new computer system. Testing willrequire a high percentage of the total effort of any rehost project. Table 3-7 provides the cost ofrehosting high-level language software as a percentage of the original development cost in staff-hours.
Table 3-7. Cost of Rehosting Software
Percent of original development cost.Percent of total rehosting cost.Percent of code that must be newly developed or extensively modified.Compatible: Systems designed to be plug compatible, (e.g., IBM S/360 and 4341).Similar: Some key architectural characteristics, (e.g., word size) are shared and some are different (e.g., IBM 4341 and VAX 8810).Data extracted from Reference 5.Dissimilar: Differences in most characteristics of architecture and organization (e.g., IBM S/360 and PDP 11/70).
abcde
fg
CompatibleSimilarDissimilar
10-1615-1820-40
SYSTEM'S RELATIONSHIP FORTRAN ADA
aRELATIVE COST
55-7045-5540-50
FORTRAN ADA
bTESTING EFFORTS
5-1110-1518-30
36-4030-3525-30
0-34-1415-32
d
e
CODEcNEW
gf f f
Cost of Reusing Software
Reusable modules should be identified during the design stage. As shown in Table 3-8, theestimated cost to reuse a module depends on the extent of the changes.

3-8
Table 3-8. Cost of Reusing Software
Cost as a percent of the cost to develop a new module.a
NewExtensively ModifiedSlightly ModifiedOld
MODULE CLASSIFICATION
PERCENT OF MODULE'S CODE
MODIFIED OR ADDEDa
RELATIVECOST
100>251-25
0
1001002020
Cost of Software Maintenance
Software maintenance refers to three types of activities occurring after the software is delivered —correcting defects detected during operational use, making enhancements that improve or increasefunctionality, and adapting the software to changes in the operational environment, such as a newoperating system or compiler.
Expected maintenance costs vary widely, depending on the quality of the delivered software and thestability of the operational environment. In the environment monitored by the SEL, a largepercentage of the maintenance effort of FORTRAN systems is expended in enhancing the system.This includes modifying existing components, retesting, regenerating, and recertifying the software.Few new components are added, and new documentation is generally not produced.Average annual maintenance effort ranges from 1 to 23% of the total development cost (in staff-hours) of the original system. Total maintenance over the life of the project costs from 1.5 to 24staff-years per million LOC (see Reference 6).
Because maintenance effort varies so widely, the SEL recommends that estimates of the annual cost ofmaintenance be adjusted based on project type. The SEL uses 5% of total development cost as theestimate of annual maintenance of stable systems with a short life expectancy (less than 4years). Annual maintenance of larger, longer lived systems is estimated at 15% of developmentcost.

4-1
SECTION 4—KEY DOCUMENTS AND DELIVERABLES
Documents and deliverables provide an ongoing system description and serve as key indicators ofprogress. They are a central concern of software managers because they mark the transitionsbetween life cycle phases. The following documents and deliverables are of specific interest to thesoftware manager:
• Requirements and functional specifications • Test plans• Operations concept document • User's guide• Software development/management plan • System description• Requirements analysis report • Software development history• Preliminary design report • System delivery tape — software• Detailed design document product and supporting files and tools
The documents and deliverables associated with a software development project are keyed to lifecycle phases. Figure 4-l shows the phases when they should be completed. In some instances,preliminary versions are prepared, followed by updates. For any point in the life cycle, thesoftware manager can determine what documents and deliverables should be in preparation. Thissection presents the recommended document contents as well as management guidelines forevaluating completed documents.
REQUIREMENTSANALYSISREPORT
USER'S GUIDE(DRAFT)
(UPDATE)
(FINAL)
REQUIREMENTSDEFINITION
AT END OFPHASE BELOW DOCUMENTS AND DELIVERABLES
SYSTEMTEST PLAN
RESULTS
BUILD TESTPLANS
OPERATIONSCONCEPT
DOCUMENT
REQUIREMENTSAND FUNCTIONALSPECIFICATIONS(PRELIMINARY)
(BASELINED)
(SPEC MODS)
(SPEC MODS)
(FINAL)
PRELIMINARYDESIGN REPORT
DETAILEDDESIGN DOCUMENT
SYSTEMDESCRIPTION
(DRAFT)
(FINAL)
a
CODE AND SUPPORTING
FILES
(UPDATE)
FINAL SYSTEMDELIVERY TAPE
RESULTS
(FINAL)
(UPDATE)
ACCEPTANCETEST
REQUIREMENTSANALYSIS
PRELIMINARYDESIGN
DETAILEDDESIGN
IMPLEMENTATION
SYSTEMTEST
aThe preliminary design report evolves into the detailed design document. Descriptive material in the detailed design document provides the basis for the system description. Updated prologs and program design language (PDL) from the detailed design are delivered with the final system and operations scenarios and performance information are included in the user's guide.
ANALYTICALTEST PLAN
ACCEPTANCETEST PLAN
(DRAFT)
SOFTWAREDEVELOPMENT/MANAGEMENT
PLAN
(UPDATE)
(UPDATE)
(UPDATE)
(FINAL)
SOFTWAREDEVELOPMENT
HISTORY(DRAFT)
(UPDATE)
(UPDATE)
(UPDATE)
(UPDATE)
(FINAL)
RESULTS
Figure 4-1. Key Documents and Deliverables by Phase
SUGGESTED DOCUMENT CONTENTS
For each document, a suggested format and contents are given (see Figures 4-2 through 4-10), withthe exception of the software development/management plan, which was covered separately inSection 2. The actual contents of the documents may vary from the outlines presented here.Specific features of the application environment may lead the manager to exercise judgment inselecting the material that is most appropriate and effective. This allowance for flexibility should beunderstood when examining the following figures.

4-2
REQUIREMENTS AND FUNCTIONAL SPECIFICATIONSThis document is produced by the requirements definition team as the key product of therequirements definition phase. It is often published in multiple volumes: volume 1 defines therequirements, volume 2 contains the functional specifications, and volume 3 provides mathematicalspecifications. The document is distributed prior to the SRR. Functional specifications are updatedduring requirements analysis and baselined following the SSR.
1. Introductiona. Purpose and background of the projectb. Document organization
2. System overviewa. Overall system conceptb. Expected operational environment (hardware, peripherals, etc.)c. High-level diagrams of the system showing the external interfaces and data flowsd. Overview of high-level requirements
3. Requirements — functional, operational (interface, resource, performance, etc.), and data requirementsa. Numbered list of high-level requirements with their respective derived requirements
(derived requirements are not explicitly called out in the requirements document but represent constraints, Iimitations, or implications that must be satisfied to achieve the explicitly stated requirements)
b. For each requirement:(1) Requirement number and name(2) Description of the requirement(3) Reference source for the requirement, distinguishing derived from explicit
requirements(4) Interfaces to other major functions or external entities(5) Performance specifications — frequency, response time, accuracy, etc.
4. Functional specificationsa. Discussion and diagrams showing the functional hierarchy of the systemb. Description and data flow diagrams of the basic functions of each major subsystemc. Description of general conventions used (mathematical symbols, units of measure, etc.)d. Description of each basic function
(1) Input(2) Process — detailed description on how this function should work(3) Output(4) Identification of candidate reusable software(5) Acceptance criteria for verifying satisfaction of related requirements(6) Data dictionary — indicating name of item, definition, structural composition of the
item, item range, item type5. Mapping of functional specifications to requirements — also distinguishes project-
unique requirements from standard requirements for the project type (AGSS, dynamics simulator, etc.)
6. Mathematical specifications — formulae and algorithm descriptions to be used in implementing the computational functions of the systema. Overview of each major algorithmb. Detailed formulae for each major algorithm
Figure 4-2. Requirements and Functional Specifications Contents

4-3
OPERATIONS CONCEPT DOCUMENT
This document provides a top-down view of the system from the user’s perspective by describing thebehavior of the system in terms of operational methods and scenarios. It should be provided byanalysts to the development team by the end of the requirements definition phase. The suggestedcontents are as follows:
1. Introduction, including purpose and background of the systema. Overall system conceptb. System overview with high-level diagrams showing the external interfaces and data flowc. Discussion and diagrams showing the functional hierarchy of the systemd. Document organization
2. Operational environment, description and high-level diagrams of the environment in which the system will be operateda. Overview of operating scenariosb. Description and diagrams of the system configuration (hardware and software)c. Description of the responsibilities of the operations personnel
3. Operational modesa. Discussion of the system's modes of operation (e.g., critical vs. normal, launch vs. on-orbit
operations)b. Volume and frequency of data to be processed in each modec. Order, frequency, and type (e.g., batch or interactive) of operations in each mode
4. Operational description of each major function or object in the systema. Description and high-level diagrams of each major operational scenario showing all input,
output, and critical control sequencesb. Description of the input data, including the format and limitations of the input. Sample
screens (i.e., displays, menus, popup windows, etc.) depicting the state of the function before receiving the input data should also be included
c. Process — high-level description on how this function will workd. Description of the output data, including the format and limitations of the output.
Samples (i.e., displays, reports, screens, plots, etc) showing the results after processing the input should also be included
e. Description of status and prompt messages generated during processing, including guidelines for user responses to any critical messages
5. Requirements traceability matrix mapping each operational scenario to requirements
Figure 4-3. Operations Concept Document Contents

4-4
REQUIREMENTS ANALYSIS REPORT
This report is prepared by the development team at the conclusion of the requirements analysisphase. It summarizes the results of requirements analysis and establishes a basis for beginningpreliminary design. The suggested contents are as follows:
1. Introduction — purpose and background of the project, overall system concepts, and document overview
2. Reuse proposal — key reuse candidates and overall architectural concept for the system
3. Operations overview — updates to operations concepts resulting from work performed during the requirements analysis phasea. Updated operations scenariosb. Operational modes — including volume and frequency of data to be processed in each
mode, order and type of operations, etc.c. Updated descriptions of input, output, and messages
4. Specification analysisa. Summary of classifications (mandatory, derived, "wish list", information only, or TBD)
assigned to requirements and functional specificationsb. Problematic specifications — identification and discussion of conflicting, ambiguous,
infeasible, untestable, and TBD requirements and specificationsc. Unresolved requirements/operations issues, including the dates by which resolutions are
neededd. Analysis of mathematical algorithms
5. System constraintsa. Hardware availability — execution, storage, peripheralsb. Operating system limitationsc. Support software limitations
6. Development assumptions
7. Risks, both to costs and schedules. These should include risks related to TBD or changing requirements, as well as technical risks
8. Prototyping efforts needed to resolve technical risks, including the goals and schedule for each prototyping effort
9. Data flow or object-oriented diagrams — results of all functional decomposition or object-oriented analysis of the requirements performed during the requirements analysis phase
10. Data dictionary — for the updated processes, data flows, and objects shown in the diagrams
Figure 4-4. Requirements Analysis Report Contents

4-5
PRELIMINARY DESIGN REPORTThis report is prepared by the development team as t he pr imary product of the preliminary design phase. Itpresents the functional descript ion of t he syst em and forms the basis f or the detailed design document. Thesuggested content s are as f ollows:
1. Introduction — purpose and background of t he project, overall system concepts, and document overview
2. Design overviewa. Design drivers and their order of import ance (e.g., performance, reliabil ity, hardware,
memory considerations, operating syst em limit at ions, language considerations,etc.)b. Results of reuse tradeoff analyses; the reuse strategyc. Critique of alternative designsd. Discussion and high-Ievel diagrams of the selected system design, showing hardware
interfaces, external dat a interfaces, interconnect ions among subsyst ems, and data flowe. A t raceabil ity matrix of the subsystems against t he requirementsf. Design status
(1) List of const raints, concerns, and problem areas and their effects on the design(2) List of assumpt ions and possible effects on design if they are wrong(3) List of TBD requirements and an assessment of their ef fect on system size, required effort, cost, and schedule(4) ICD st at us(5) Status of prototyping efforts
g. Development environment (i .e., hardware, peripheral devices, etc.)3. Operations overview
a. Operations scenarios/scr ipts (one for each major product that is generat ed). Includes the form and volume of the product and the frequency of generat ion. Panels and displays should be annotated to show what various selections will do and should be traced to a subsystem
b. System perf ormance considerations4. Design description f or each subsystem or major functional breakdown:
a. Discussion and high-level diagrams of subsystem, including interf aces, data flow , and communications for each processing mode
b. High-Ievel descr iption of input and outputc. High-level descr iption of processing keyed t o operat or-specified input and act ions in
terms of points of control, funct ions performed, and results obtained (both normal andabnormal, i .e., error processing and recovery)
d. Struct ure charts or object -oriented diagrams expanded t o two levels below t he subsystem driver
e. Prologs (specifying the module's purpose, operation, call ing sequence arguments,external references, etc; Ada project s should provide package specifications for theprinciple object s in the system) and program design language (PD L) f or each modulethrough t he first Ievel below subsyst em driver. (Prologs and PDL are normally published in a separate volume because of size.)
5. Data interfaces for each internal and external interf ace:a. Description, including name, function, frequency, coordinates, units, and computer type,
lengt h, and represent at ionb. Format
(1) Organization and description of fi les (i.e. , data files, t ape, etc.)(2) Layout of frames, samples, records, blocks, and/or transmissions(3) Storage requirements
Figure 4-5. Preliminary Design Report Contents
4-6
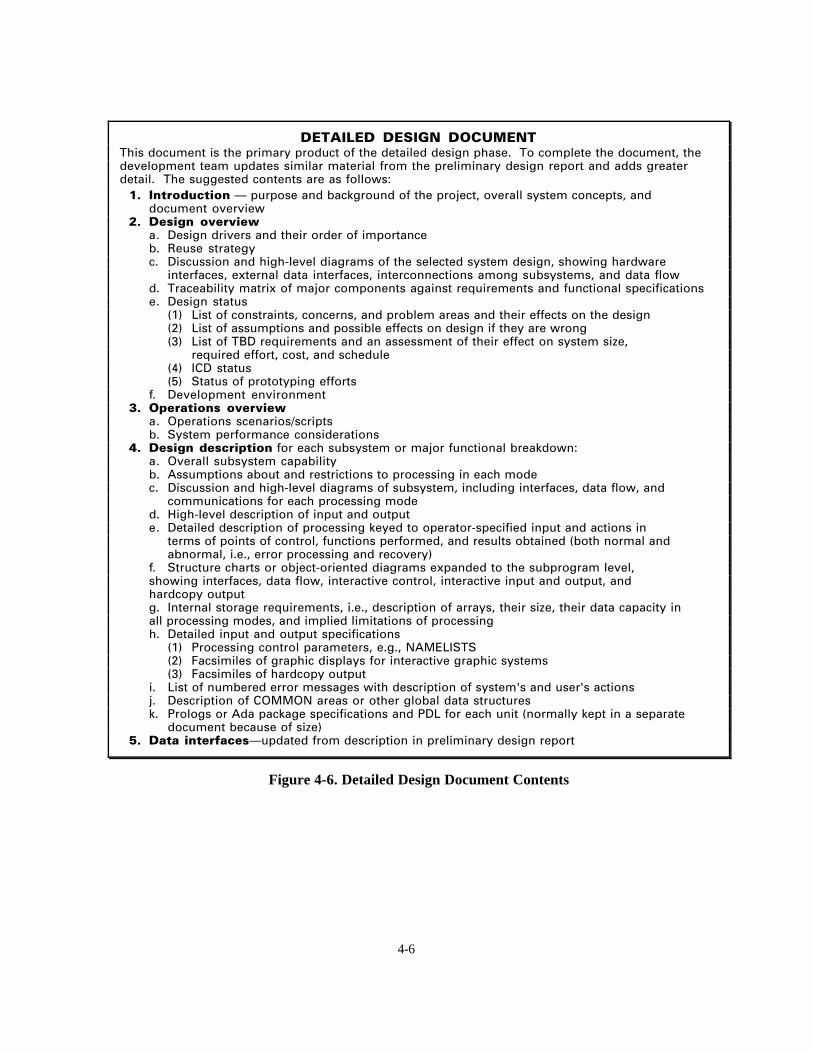
DETAILED DESIGN DOCUMENTThis document is the primary product of the detailed design phase. To complete the document, thedevelopment team updates similar material from the preliminary design report and adds greaterdetail. The suggested contents are as follows:
1. Introduction — purpose and background of the project, overall system concepts, and document overview
2. Design overviewa. Design drivers and their order of importanceb. Reuse strategyc. Discussion and high-Ievel diagrams of the selected system design, showing hardware
interfaces, external data interfaces, interconnections among subsystems, and data flowd. Traceability matrix of major components against requirements and functional specificationse. Design status
(1) List of constraints, concerns, and problem areas and their effects on the design(2) List of assumptions and possible effects on design if they are wrong(3) List of TBD requirements and an assessment of their effect on system size,
required effort, cost, and schedule(4) ICD status(5) Status of prototyping efforts
f. Development environment3. Operations overview
a. Operations scenarios/scriptsb. System performance considerations
4. Design description for each subsystem or major functional breakdown:a. Overall subsystem capabilityb. Assumptions about and restrictions to processing in each modec. Discussion and high-Ievel diagrams of subsystem, including interfaces, data flow, and
communications for each processing moded. High-Ievel description of input and outpute. Detailed description of processing keyed to operator-specified input and actions in
terms of points of control, functions performed, and results obtained (both normal andabnormal, i.e., error processing and recovery)
f. Structure charts or object-oriented diagrams expanded to the subprogram Ievel, showing interfaces, data flow, interactive control, interactive input and output, and hardcopy outputg. Internal storage requirements, i.e., description of arrays, their size, their data capacity in all processing modes, and implied Iimitations of processingh. Detailed input and output specifications
(1) Processing control parameters, e.g., NAMELISTS(2) Facsimiles of graphic displays for interactive graphic systems(3) Facsimiles of hardcopy output
i. List of numbered error messages with description of system's and user's actionsj. Description of COMMON areas or other global data structuresk. Prologs or Ada package specifications and PDL for each unit (normally kept in a separate
document because of size)5. Data interfaces—updated from description in preliminary design report
Figure 4-6. Detailed Design Document Contents

4-7
TEST PLANSBUILD/RELEASE TEST PLAN
• Prepared by the system test team during the detailed design phase• Designed to test the functional capability of each build or release (functional subsets
of the complete software system) as defined in the software development/management plan and to identify limitations
• Executed during the implementation phase by the system test team as soon as unittesting and integration of each build/release is complete
ANALYTICAL TEST PLAN
• Prepared prior to the implementation phase by the analysts who will use the system• Designed to assist developers in verifying the results of complex mathematical and
astronomical calculations performed by the system• Unit level tests are executed during the implementation phase by developers; end-to-end
tests are executed as a part of system testing
SYSTEM TEST PLAN
• Prepared by the system test team during the implementation phase• Designed to verify the system's end-to-end processing capability, as specified in the
requirements document, and to identify limitations• Executed during the system testing phase by the system test team
ACCEPTANCE TEST PLAN
• Drafted by the acceptance test team following the requirements definition phase, based on the requirements and functional specifications document
• Designed to demonstrate the system's compliance with the requirements and functional specifications
• Executed during the acceptance testing phase by the acceptance test team
TEST PLAN OUTLINE
1. Introduction, including purpose, type and Ievel of testing, and schedule2. Traceability matrix mapping each requirement and functional specification to one or more
test cases3. Test description (normally the Iength need not exceed 1 to 2 pages) for each test
a. Purpose of test, i.e., specific capabilities or requirements testedb. Detailed specification of inputc. Required environment, e.g., data sets required, computer hardware necessaryd. Operational procedure, i.e., how to do the teste. Detailed specification of output, i.e., the expected resultsf. Criteria for determining whether or not the test results are acceptableg. Section for discussion of results, i.e., for explaining deviations from expected results and
identifying the cause of the deviation or for justifying the deviation
Figure 4-7. Contents of Test Plans

4-8
USER'S GUIDEThe development team begins preparation of the user's guide during the implementation phase.Items 1 and 2, and portions of item 3, represent updated material from the detailed design document,although some rewriting is expected to make it more accessible to the user. A draft is completed bythe end of the implementation phase and is evaluated during system testing. At the beginning of theacceptance test phase, an updated version is supplied to the acceptance test team for evaluation.Corrections are incorporated, and a final revision is produced at the end of the phase. The suggestedcontents are as follows:
1. lntroductiona. Overview of the system, including purpose and backgroundb. Document organizationc. Discussion and high-level diagrams of system showing hardware interfaces, external
data interfaces, software architecture, and data flow2. Operations overview
a. Operations scenarios/scriptsb. Overview and hierarchy of displays, windows, menus, reports, etc.c. System performance considerations
3. Description for each subsystem or major functional capability:a. Overall subsystem capabilityb. Assumptions about and restrictions to processing in each modec. Discussion and high-Ievel diagrams of subsystems, including interfaces, data flow, and
communications for each processing moded. High-level description of input and outpute. Detailed description of processing keyed to operator-specified input and actions in terms
of points of control, functions performed, and results obtained (both normal and abnormal, i.e., error processing and recovery)
f. For interactive subsystems, facsimiles of displays in the order in which they are generatedg. Facsimiles of hardcopy output in the order in which it is produced, annotated to show
what parameters control ith. List of numbered messages with explanation of system's and user's actions annotated to
show the subroutines that issue the message4. Requirements for execution
a. Resources — discussion, high-level diagrams, and tables for system and subsystems(1) Hardware(2) Data definitions, i.e., data groupings and names(3) Peripheral space considerations — data storage and printout(4) Memory considerations — program storage, array storage, and data set buffers(5) Timing considerations
(a) Central processing unit (CPU) time in terms of samples and cycles processed
(b) I/O time in terms of data sets used and type of processing(c) Wall-clock time in terms of samples and cycles processed
b. Run information — control statements for various processing modesc. Control parameter information — by subsystem, detailed description of all control
parameters (e.g., NAMELISTS), including name, computer type, length, and representation, and description of parameter with valid values, default value, units, andrelationship to other parameters
Figure 4-8. User's Guide Contents

4-9
SYSTEM DESCRIPTION
During the implementation phase, the development team begins work on the system description by updating dataflow/object diagrams and structure charts from the detailed design. A draft of the document is completed duringthe system testing phase and a final version is produced by the end of acceptance testing. The suggestedcontents are as follows:
1. Introduction — purpose and background of the project, overall system concepts, and document overview
2. System overviewa. Overview of operations scenariosb. Design drivers (e.g., performance considerations) and their order of importancec. Reuse strategyd. Results of prototyping effortse. Discussion and high-Ievel diagrams of the selected system design, showing hardware interfaces,
external data interfaces, interconnections among subsystems, and data flowf. Traceability matrix of major components against requirements and functional specifications
3. Description of each subsystem or major functional breakdown:a. Overall subsystem capabilityb. Assumptions about and restrictions to processing in each modec. Discussion and high-Ievel diagrams of subsystem, including interfaces, data flow, and
communications for each processing moded. High-Ievel description of input and outpute. Structure charts or object-oriented diagrams expanded to the subprogram Ievel, showing interfaces,
data flow, interactive control, interactive input and output, and hardcopy output4. Requirements for creation
a. Resources — discussion, high-Ievel diagrams, and tables for system and subsystems(1) Hardware(2) Support data sets(3) Peripheral space considerations — source code storage, scratch space, and printout(4) Memory considerations — program generation storage and data set buffers(5) Timing considerations
(a) CPU time in terms of compile, build, and execute benchmark test(b) I/O time in terms of the steps to create the system
b. Creation information — control statements for various stepsc. Program structure information — control statements for overlaying or loading
5. Detailed description of input and output by step — source code libraries for system and subsystems, object code libraries, execution code Iibraries, and support Iibraries
6. lnternal storage requirements — description of arrays, their size, their data capacity in all processing modes, and implied Iimitations of processing
7. Data interfaces for each internal and external interface:a. Description, including name, function, frequency, coordinates, units, computer type, Iength, and
representationb. Format — organization (e.g., indexed), transfer medium (e.g., disk), Iayout of frames
(samples, records, blocks, and/or transmissions), and storage requirements8. Description of COMMON blocks, including locations of any hard-coded physical constants9. Prologs/package specifications and PDL for each subroutine (separate volume)
10. Alphabetical Iist of subroutines from support data sets, including a description of each subroutine's function and a reference to the support data set from which it comes
Figure 4-9. System Description Contents

4-10
SOFTWARE DEVELOPMENT HISTORYMaterial for the development history is collected by the project leader throughout the life of the project. At the end ofthe requirements analysis phase, project data and early lessons learned are compiled into an initial draft. The draft isexpanded and refined at the end of each subsequent phase so that, by the end of the project, all relevant material hasbeen collected and recorded. The final version of the software development history is produced within 1 month ofsoftware acceptance. The suggested contents are as follows:
1 . Introducti on — purpose of system, customer of system, key requirements, development machines and language2 . Hi s tori cal overvi ew by phase — includes products produced, milestones and other key events, phase
duration, important approaches and decisions, staffing information, and special problemsa. Requirements definition — if requirements were produced by the software development team, this section
provides an historical overview of the requirements definition phase. Otherwise, it supplies information about the origin and documentation of the system's requirements and functional specifications
b. Requirements analysisc. Detailed designd. Implementation — coding through integration for each build/ releasee. System testingf. Acceptance testing
3 . Project dataa. Personnel and organizational structure — list of project participants, their roles, and
organizational affiliation. Includes a description of the duties of each role (e.g., analyst,developer, section manager) and a staffing profile over the life of the project
b. Schedule — table of key dates in the development of the project and a chart showing each estimate (original plus reestimates at each phase end) vs. actual schedule
c. Project characteristics(1) Standard tables of the following numbers: subsystems; total, new, and reused components; total, new,
adapted and reused (verbatim) SLOC, statements, andexecutables; total, managerial, programmer, and support effort; total productivity
(2) Standard graphs or charts of the following numbers: project growth and changehistories; development effort by phase; development effort by activity; CPU usage;system test profile; error rates; original size estimate plus each reestimate vs. final system size; originaleffort estimate plus each reestimate vs. actual effort required
(3) Subjective evaluation data for the project — copy of the SEL subjective evaluation form (SEF) or report of SEF data from the project data base (see Reference 7)
4 . Lessons l earned — descriptions of the major strengths and weaknesses of the development process and product, what was learned from them, and what specific recommendations can be made to improve future projectsa. Planning — development plan timeliness and usefulness, adherence to development
plan, personnel adequacy (number and quality), etc.b. Requirements — completeness and adequacy for design, change history and stability,
and clarity (i.e., were there misinterpretations?), etc.c. Development — lessons learned in design, code and unit testingd. Testing — lessons learned in system and acceptance testinge. Product assurance — adherence to standards and practices; QA and CM lessons learnedf. New technology — impact of any new technology used by the project on costs,
schedules, quality, etc. as viewed by both developers and managers, recommendationsfor future use of the technology
Figure 4-10. Software Development History Contents

4-11
GUIDELINES FOR EVALUATING COMPLETED DOCUMENTS
The software manager will be critically reviewing completed documents. The general guidelinespresented here involve checking the degree to which five basic attributes of a successfuldocument are present in the document under review:
Accuracy — Is the document correct? Are there obvious mistakes? Are assumptions aboutresources and environment valid? Is there evidence of a lack of understanding of importantaspects of the problem or process?
Clarity — Is the document expressed in a form that is accessible and understandable? Aretables and diagrams used where possible instead of text?
Completeness — Is the right information included, considering the purpose of the document?Have any necessary items been omitted? When the document reflects continuingdevelopment from a previous document, does it contain all the elements from the earlierdocument?
Consistency — Do passages in the document contradict other passages in the samedocument? Do all symbols conform to a standard notation?
Level of detail — Do the contents reflect a level of detail appropriate to the purpose of thedocument? Is more elaboration needed in a specific area?
The following questions can be used to analyze the document for the existence and quality ofessential features.
Requirements and Functional Specifications
Are all assumptions about requirements documented in the functional specifications?Are all requirements and functional specifications testable as written?Are performance requirements included?Is it clear which requirements and specifications are identical or closely similar to those in existing systems?
Operations Concept Document
Are operating scenarios realistic?Is it clear which operations concepts map to which requirements?
Requirements Analysis Report
Has the effect of TBD requirements been underestimated?Are there additional sources of reusable software?Are resources sufficient?

4-12
Preliminary Design Report
Have all functional specifications been allocated to subsystems?Are all interfaces understood?Is the rationale for the chosen design justifiable?Is the subsystem partitioning sensible?
Detailed Design Document
Are baseline diagrams provided to the subroutine level?Are all external files described in content and format (to the byte level)?Are all TBD requirements resolved?If the design is followed, will the system meet its requirements?Is there evidence of information-hiding, i.e., localizing the data usage and access?Is the coupling between modules low, and are the modules cohesive?
Test Plans
Do the tests describe expected results?Are the tests repeatable, i.e., do the test specifications adequately describe the setup and environment so that two different people would produce the same tests from the test
descriptions?How well do the tests cover the range of capabilities?Are there explicit criteria for determining whether test results are acceptable?Is the schedule reasonable in light of test resources?
User’s Guide
Will it be understandable to the users?Is it organized so that it can serve different user populations simultaneously?Are examples provided?Is input described in sufficient detail?Are status messages, error messages, and recovery explained?
System Description
Is the document structured to accommodate both those who want only a high-level view of the system and those who seek a detailed view?Is the scope of the system clear?Are the relationships to other systems explained?
Software Development History
Is there an update list that shows when estimates of system size, effort, schedule, and cost were made?Have all of the problem areas been discussed?

5-1
SECTION 5 — VERIFICATION, TESTING, ANDCERTIFICATION
This section summarizes recommended methods of verifying, validating, and certifying thesoftware development process and product. Both testing and non-testing verification techniquesare used to evaluate the software's function and performance so that problems can be repairedbefore their effects become too costly. Certification subjects the product and process toindependent inspection and evaluation.
CODE READINGCode reading is a systematic procedure for reading and understanding the operation of aprogram. Studies have shown that code reading detects more errors at a lower cost than eitherfunctional testing or structural testing alone (Reference 8). In the experience of the SEL, the mostpowerful verification combination is human inspection followed by functional testing.
Purpose — Code reading is designed to verify that the code of a program unit is correct withrespect to its intended function.
Participants — Code must be read by an experienced developer who is not the originalprogrammer. The SEL recommends that two code readers be assigned to each unit, sincestudies have shown that only one quarter of the total errors found in code reading are foundby both readers independently (Reference 9).
Activities — All developed code must be read. Unless the project is using cleanroommethodology (Reference 9), the code should be cleanly compiled beforehand. Each readerreviews the code independently. In addition to checking functionality, the reader ensures thecode is consistent with the design specified in the prolog and PDL and that it conforms tostandards and conventions. Detailed guidelines for code reading are provided in Section2 ofReference 10.
Monitoring — To measure progress, use total number of units coded versus numbersuccessfully read.
UNIT TESTING
Unit testing takes place only after the code has been read. All newly developed or extensivelymodified units must be verified via unit testing. (NOTE: Ongoing research efforts are examiningsignificantly different approaches to testing at the unit level; see Reference 9).
A spectrum of formality and rigor exists for unit testing and integration. Especially complex orcritical units may need to be tested in isolation, using test drivers and stubs. In other cases, it maybe more efficient to conduct unit testing on a collection of related units, such as an Ada package.The manager should select the level of formality and rigor that is most cost effective for theproject.
Purpose — Unit testing verifies the logic, computations/functionality, and error handling ofa unit.
Plan — Usually written by the unit developer, unit test plans are informal. Procedures fortesting complex algorithms at the unit level are contained in the analytical test plan.

5-2
Participants — The unit developer generally tests the unit, unless the cleanroom methodwith its separate test team is used (see Reference 9).
Activities — The tester prepares test data and any necessary drivers or stubs. He/shethen executes the test plan, verifying all logic paths, error conditions, and boundaryconditions. Test results are reviewed for accuracy and completeness by the taskleader or designated technical authority.
Monitoring — Use number of units planned versus number successfully unit tested tomeasure progress; track number of errors found to gauge software reliability.
INTEGRATION TESTING
Purpose — Integration testing verifies the internal integrity of a collection oflogically related units (called a module) and checks the module's external interfaceswith other modules, data files, external input and output, etc.
Plan — Although a formal test plan is generally not required, integration testing ismore carefully controlled than unit testing.
Participants — Integration testing is usually performed by the members of thedevelopment team responsible for the modules being integrated.
Activities — During integration testing, the software is slowly built up by adding a fewunits at a time to a core of modules that have already been integrated. Integration mayfollow a top-down approach, in which lower level modules are added to the top-leveldriver level by level. Alternatively, an end-to-end functional path, or thread, may beconstructed, to which other modules are then added.
Monitoring — Use number of units planned versus number successfully integrated tomeasure progress; track number of errors found to gauge software reliability.
BUILD/RELEASE TESTING
A build is a portion of a software system that satisfies, wholly or in part, a subset of therequirements. A build that is acceptance tested and subsequently delivered for operational useis called a release. Build/release testing is used when the size of the system dictates that it beimplemented in multiple stages.
Purpose — Build testing verifies that the integrated software fulfills a predeterminedsubset of functional or operational system requirements.
Plan — The tests to be executed are defined in a build/release test plan. Build tests areoften subsets of system tests (see Figure 4-7).
Participants — Build testing is generally performed and evaluated by members of thesystem test team.
Activities — The activities conducted during build testing are basically the same as thoseof system testing.

5-3
Monitoring — Use number of test cases identified versus number successfully tested tomeasure progress; formally track errors found to gauge reliability; track effort required tofix to predict maintainability.
SYSTEM TESTING
System testing verifies the full, end-to-end capabilities of the system. The system testing phasefollows the implementation test phase; it begins after the last build of the system has beensuccessfully completed.
Where high reliability software is required for a particular mission application (e.g., flight orsignificant real-time software), it is recommended that system testing be planned and performedby an independent verification and validation (IV&V) team. Experience within the SELenvironment has found the use of IV&V adds between 5 and 15 percent to total project costs.
Purpose — System testing verifies that the full system satisfies its functional and operationalrequirements. The system must be demonstrated to be both functionally complete androbust before it can be turned over to acceptance testers.
Plan — The test and verification approach is specified in the system test plan (Figure 4-7).A system test plan may be developed based on an analytical test plan (designed to show howthe computational accuracy of the system can be verified) or based on the acceptance testplan.
Participants — The system test team is composed of developers supported by one or moreanalysts and is led by a specialist in the developed application. In the flight dynamicsenvironment, mission critical applications are tested by an independent team.
Activity — Test execution follows the pattern prescribed in the system test plan.Discrepancies between system requirements and the test results are identified and assigned tomembers of the development team for correction. Each change to the system is handled inaccordance with established CM procedures. Regression tests are performed after repairshave been made to ensure that the changes have had no unintended side effects. Systemtesting continues until no more errors are identified.
Monitoring — Use number of test cases identified versus number successfully tested tomeasure progress; formally track errors found to gauge reliability; track effort required tofix to predict maintainability.
ACCEPTANCE TESTING
Acceptance testing is begun after system testing has been successfully completed. Completedrafts of the user's guide and system description are provided to acceptance testers by thebeginning of the acceptance test phase.
Purpose — Acceptance testing verifies that the system satisfies its requirements.
Plan — All acceptance tests executed are based on the acceptance test plan written byanalysts prior to the start of the phase (see Figure 4-7).

5-4
Participants — Tests are executed by the acceptance test team supported by membersof the development team. Testing may be observed by product assurancerepresentatives and the user.
Activity — After preparations for testing are completed, the test team attempts toexecute all tests in the plan, working around any errors they uncover. This ensuresthat major problems are discovered early in the phase. Only when execution of aload module (i.e., an executable image) is totally obstructed does testing cease until anew load module can be installed. Each new load module is regression tested toensure that previously demonstrated capabilities have not been adversely affected byerror corrections.
Monitoring — Use number of test cases identified versus number successfully testedto measure progress; track errors found to gauge reliability; track effort required tofix to predict maintainability.
TEST MANAGEMENT GUIDELINES
A summary of essential management guidelines on software testing is presented below. Theobservations about the planning and control of testing are derived from SEL experience.
Realize that testing is important — 30 percent of development effort in the flightdynamics environment is devoted to system and acceptance testing
Apply adequate resources
• Time — 35 percent of the time schedule• Staff — experienced, well-trained in defect detection• Computer — peak use in testing phases of FORTRAN projects (see Figure 3-2)
Plan for it early — as part of the software development/management plan
Plan for it explicitly — using formatted test plans (see Figure 4-7)
Test continually during the life cycle with five major types of testing (Reference 10)— unit, integration, build/release, system, and acceptance
Prepare for testing — use testability as a criterion for evaluating requirementsstatements, designs, and build/release plans
Apply testing aids (Reference 2)
• Requirements allocation matrices• Decision tables and test summary tables• Test library
Monitor testing costs (Reference 3) — collect data on
• Calendar time and staff effort spent testing and verifying software• Cost of diagnosis — finding the defect• Cost of repair — making all the necessary corrections to code and documentation

5-5
Measure testing progress
• Compare testing costs and number of defects with past projects• Record defect detection rate as testing effort is applied• Track number of tests identified, number executed, and number passed. The
percentage of executed tests that fail should be nearly halved for each subsequent load module tested (see Table 5-1)
Table 5-1. Expected Percentage of Tests Executed That Pass
Version 1Version 2Version 3Version 4
LOADMODULE
AVERAGEPASS RATE
PASS RATE RANGE
50%77%88%99%
35-70%75-80%85-90%95-100%
CERTIFICATION
Broadly defined, certification is a statement attesting to something. For example, anindividual may be charged with certifying that
• Coding standards were followed• Code agrees with PDL• CM procedures have been followed• Specific test cases were run• All contractual items have been delivered
Although there is considerable diversity in what is being certified, there are common aspectsas well. Certification is a binary decision — either the materials or activities are certified orthey are not. It is performed by individuals who can be objective about their certificationassignment. This objectivity is a key reason for introducing certification into the softwaredevelopment process. Certification contributes to quality assurance by providing anindependent check on development. Confidence in the final software product is enhanced ifboth the process and product are certified.
Essential management guidelines for certification are summarized below.
Determine the objective of the certification, e.g., to ensure that
• Design, code, or documentation is correct• Standards, procedures, or guidelines are being followed• System performance meets operational requirements
Define entry criteria — what materials must be submitted for certification?
• Establish procedures for obtaining documents or code that will be required• Identify the individuals responsible for certification

5-6
Define exit criteria — certification is a binary decision. How will submitted materials beevaluated to make the certification decision?
Specify the certification procedure, document it, and follow it
More detailed recommendations depend on the object of certification. For example, incertifying intermediate products like designs, test plans, or unit code, the materials submittedfor certification and the evaluation criteria will vary. Figure 5-1 shows the general guidelinesapplied to an example of unit design certification.
1. Certification Objectives:a. Ensure the design correctly provides the functionality required of the unitb. Check for conformance with standards and conventions regarding prolog and PDLc. Identify visible weaknesses in the design early so that defects can be repaired with
minimum costd. Encourage developers to thoroughly specify all unit interfaces — calling arguments,
parameter specifications, etc.
2. Entry Criteria — the following materials must be submitted:a. Source listing of prolog and PDLb. Structure chart or object-oriented diagram of the subsystem or major component to
which the unit belongsc. Design certification form, containing author's name, date submitted for certification, unit
name, and subsystem name
3. Exit Criteria — some questions will be specific to the design methodology used. Thefollowing are more general questions, typically used to evaluate submitted materials anddecide on certification:a. Do the prolog and PDL adhere to all prevailing standards and conventions?b. Are all necessary elements of the prolog complete, e.g., are all data elements described?c. Does the PDL describe a valid process for providing the function assigned to the unit?d. Is it clear from the PDL when the unit output will be generated?e. Is the dependency clear between each input parameter or external reference and the
processing described in the PDL?f. Does the PDL define enough error detection logic?g. Does the PDL account for the upper and lower bounds of unit input?
4. Certification Procedure — recommended steps for the certification:a. Meet with the development team leader to establish the position of unit design
certification in the project's life cycle; all units must have their design certified beforethey are implemented
b. Issue written descriptions of entry criteria, with examples of the required form forsubmitted materials
c. Prepare a unit design certification checklist, based on exit criteria, to record evaluationresults
d. Document the procedure for obtaining materials, completing the certification checklist,and presenting results to the development team
e. Implement the procedure, retaining certification results in the project library
Figure 5-1. Example of Unit Design Certification

6-1
SECTION 6 — METRICS ANDKEY MANAGEMENT AIDS
Effective software project management and control depends on an accurate assessment of aproject's health at any point in the life cycle. This assessment must be based on up-to-date metricsthat reflect the status of the project, both in relation to the project plan and in comparison tomodels of expected performance drawn from historical experience with similar projects.
This section presents useful metrics for project evaluation and control and discusses several toolsdesigned to aid managers in performing these critical functions.
METRICS
Software metrics/measures can provide the manager with key indicators of project performance,stability, and quality. Both objective and subjective measures are important to consider whenassessing the current state of a project. Objective data consist of actual counts of items (e.g., staff-hours, SLOC, components, test items, units coded, changes, errors, etc.) that can be independentlyverified. They are usually collected through a formal data collection process. Subjective data arebased on an individual's or a group's feeling or understanding of a certain characteristic orcondition (e.g., level of difficulty of the problem, degree of new technology involved, stability ofthe requirements, etc.). Together these data serve as a system of checks and balances throughoutthe project. The wise manager depends on both objective and subjective data to get an accuratepicture of project health. Subjective data provide critical information for interpreting andvalidating the objective data, while the objective data provide true counts that may cause themanager to question his subjective understanding and investigate further.
Because collecting, maintaining, and reporting metric data can be a significant undertaking, eachdata item must serve a well-defined purpose. The project software development plan shoulddefine which data will be collected and how each data item will be used. To achieve the maximumbenefit, metric data must be accurate, current, and accessible to the manager.
The availability of project metrics will be of no or little value unless the manager also has access tomodels or metrics that represent what should be expected. This information is normally in themind of the experienced software manager. Ideally, such historical data and experience shouldalso be stored in an "organizational memory" (data base) accessible to new managers. Usinginformation extracted from such a data base, managers can gauge whether measurement trends inthe current project differ from similar past projects and from the expected models for the localenvironment. The costs and benefits of such a data base are further discussed in References 3 and11, respectively.
The SEL project histories data base holds key characteristics and performance models of softwaredevelopment in the SEL environment, as well as three classes of data for each past project: cost,process, and product data. Cost data are confined to measures of effort. The use of effort dataremoves the effects of labor rates and hardware costs, allowing the manager to focus on the moreaccurately modeled costs of software development and system engineering. Process data includeinformation about the project (such as methodology, tools, and techniques used) and informationabout personnel experience and training. Product data include size, change, and errorinformation and the results of statistical analyses of the delivered code.

6-2
Figure 6-1 suggests the possibilities for useful comparison when a project histories data base isavailable. Models based on completed projects help the manager initiate and revise current plansand estimates. As performance data are gathered for a new project, the manager can comparethese values with those for related projects in the data base.
The comparisons in Figure 6-1 should be viewed collectively as one component of a feedbackand control system. Comparisons lead to revisions in development plans. To execute the revisedplans, the manager makes changes in the development process, which result in adjusted measuresfor the next round of comparisons.
CURRENTPROJECTMETRICS
REVISED PLAN AND
PROJECTADJUSTMENT
Compare withorganizational
memory
Compare withproject plan
(expectations)
Assess health
PLOTS PLOTS
CURRENTSUBJECTIVE
DATA
PROJECT HISTORIES
AND MODELS
CURRENTPROJECT
PLAN
Figure 6-1. Management Through Measurement
MANAGEMENT METRICS AND THEIR USE
An endless list of metrics can be proposed for management use, ranging from high-level effort andsoftware size measures to detailed requirements measures and personnel information. Quality, notquantity, should be the guiding factor in selecting metrics. It is best to choose a small, meaningfulset of metrics that have solid baselines in the local environment.
In the SEL, eight key metrics contribute to the successful management of software developmentprojects: 1) source code growth rate, 2) effort data, 3) system size estimates, 4) computer usage,5) error rates, 6) reported/corrected software discrepancies, 7) software change rate, and 8)development activity status data. Managers analyze the metrics individually and in sets to get anaccurate reading of the health of their projects with relation to cost, schedule, and quality. Many ofthese metrics provide critical insight into the stability of a project — insight that is lacking instandard performance measurement systems.
The following pages describe these eight key software management metrics. The models presentedhave been developed and refined based on the software heritage that is recorded in the SEL database. In each case, a real project example is presented that demonstrates the use of the metric.

6-3
SOURCE CODE GROWTH RATE – 1
•
•
•
Strong progress indicator duringimplementation
Key stability indicator during testingphases
Tracks amount of code (SLOC) inconfigured library
10 20 30 40 50 60 70 80 90 100
10
20
30
40
50
60
70
80
90
100
% O
F T
OT
AL
LOC
% OF SCHEDULE
DESIGN CODE/TESTSYSTEM
TESTACCEPTANCE
TEST
Deviation: Growth data above model boundsPossible Causes:a) Very experienced teamb) High reusec) Minimal QA
Deviation: Growth data fall below model boundsPossible Causes:a) Incomplete designb) Changing requirementsc) Smaller team than normal
NOTE: Overall trend is the same for both Ada and FORTRAN systems. Ada systems show more growth in the design phase as compiled PDL is produced.
Figure 6-2. SEL Software Growth Profile
The growth of source code in the configured library closely reflects requirements completeness and thesoftware development process. In the SEL environment, periods of sharp growth in SLOC are separated byperiods of more moderate growth (Figure 6-2). This is a reflection of the SEL practice of implementingsystems in builds. The model shows that, in response to requirements changes, 10 percent of the code istypically produced after the start of system testing.
A deviation from the growth model simply emphasizes that the project is doing something differently. Forexample, a project that is reusing a large amount of existing code may show a sharp jump early in the codephase when reused code is moved into the configured library.
Figure 6-3 shows an example from the SEL environment, where code growth occurs in a step-wise fashion,reflecting builds. The Gamma Ray Observatory (GRO) AGSS (250 KSLOC), developed from 1985 to1989, was impacted by the shuttle accident. Beginning with the implementation phase, the schedule wasstretched over 3 years and the staff reduced accordingly.
10 20 30 40 50 60 70 80 90 100
10
20
30
40
50
60
70
80
90
100
% O
F T
OT
AL
LOC
% OF SCHEDULE
DESIGN CODE/TESTSYSTEM
TEST
ACCEPTANCE
TEST
BUILD 1
BUILD 2
BUILD 3
Explanation: Build 1 shows earlyrapid growth due to a high level ofcode reuse. Build 3 shows a longdelay before completing code in themiddle of the system test phase.This was due to major specificationproblems in two of the threesubsystems involved.
Figure 6-3. Example of Code Growth — GRO AGSS

6-4
EFFORT DATA – 2
•
•
•
Staffing profiles should reflectthe environment and projecttype
Effort is a key indicatorof progress and quality
Effort data are criticalreplanning aids
DESIGN CODE/TESTSYSTEM
TESTACCEPTANCE
TEST
RAYLEIGH CURVE
EXPECTED SEL PROFILE
SEL PLANNING MODEL
Deviation: Less staff required to meet schedulesPossible causes: a) Very productive teamb) Poor quality product c) Easy problem
Deviation: More staff required to meet schedules Possible causes: a) More complex problem b) Unstable requirements causing extensive rework c) Inexperienced team
EF
FO
RT
TIME
Figure 6-4. SEL Staffing Profile Model
The typical staffing profile closely reflects the nature of the project environment and the type of problem beingsolved. In the SEL environment, where a substantial portion of requirements details are not known until mid-implementation, managers plan for a parabolic staffing profile instead of the traditional, widely used Rayleighcurve (see Figure 6-4). However, once a project is underway, they expect to see the doubly convex curve shownabove. The cause of this trend is not well-understood, but it occurs repeatedly on flight dynamics projects in thisenvironment and, therefore, is the SEL model.
Another important profile is the expected effort distribution among software development phases and amongsoftware development activities. The SEL effort distribution models (Figure 6-5) show some differences betweenFORTRAN and Ada projects.
DESIGN30%
CODE/TEST34%
ACCEPT- ANCE TEST20%
Effort Distribution by Phase (Date Dependent)
FORTRAN ADA
DESIGN32%
ACCEPT-ANCE TEST20%
SYSTEM TEST16%
Effort Distribution by Activity(Not Date Dependent)
FORTRAN
DESIGN19%
CODE16%
TEST35%
OTHER30%
ADA
DESIGN23%
CODE21%
OTHER26%
TEST30%
NOTE: The projects sampled for this figure were selected for the purpose of comparing FORTRAN to Ada and differ from those used to generate Tables 3-1 and 3-2.
CODE/TEST29%
SYSTEM TEST19%
Figure 6-5. SEL Effort Distribution Models

6-5
The SEL has found these metrics to be key factors in characterizing their environment. They arealso used as a yardstick for assessing the impact of new technology.
Utilizing the expected effort distributions and staffing profile, a manager can predict the total costand schedule based on effort spent to date. If more effort is required to complete the design of asystem than was planned, it is likely that the remaining phases will require proportionately moreeffort as well. After investigating why the deviation has occurred, the manager can make aninformed choice as to whether staff or schedule must be increased and can plan accordingly.
Deviations in effort expenditure can also raise quality flags. If all milestones are being met on anunderstaffed project, the team may appear to be highly productive, but product quality may besuffering. In this case, the manager should not automatically reduce future effort predictions but,based on an audit of the design and code, may need to add staff to compensate for work notthoroughly completed in earlier phases.
Figure 6-6 presents an example of the use of metrics data in both planning and monitoring aproject. The Earth Radiation Budget Satellite (ERBS) AGSS (160K SLOC), developed during the1982-1984 timeframe, is considered to be a highly successful project. Effort data were a keyfactor in management's detection and timely correction of several problems that would haveseriously jeopardized project progress.
SYSTEMDELIVERY
ACCEPT- ANCE
TESTING
SYSTEMTESTING
REQMTSANALYSIS
2
6
10
14
18
22
26
0 10 20 30 40 50 60 70 80 90 100 110 120
PDR CDR AUDIT
PRELIMDESIGN
DETAILEDDESIGN
BUILD 1
BUILD 2
BUILD 3
FU
LL-T
IME
-EQ
UIV
ALE
NT
(40
-HO
UR
S W
OR
K W
EE
KS
) O
F S
TA
FF
SECOND REPLAN
FIRST REPLAN
ACTUAL DATA
Explanation: The original staffing plan was based on an underestimate of the system size. Toward the end of the design phase, 40% more effort was required on a regular basis. This was one of many indicators that the system had grown, and the project was replanned accordingly. However, effort continued to grow when the second plan called for it to level off and decline. When it was clear that still more staff would be required to maintain progress, an audit was conducted. The audit revealed that the project was plagued with an unusually large number of unresolved TBDs and requirements changes that were causing an excessive amount of rework and that — as part of the corrective action — another replan was necessary.
Figure 6-6. Effort Data Example — ERBS AGSS

6-6
SYSTEM SIZE ESTIMATES – 3
•
•
•
•
•
Tracks change in estimates of finalsystem size (in SLOC)
Is a key indicator of system stability
Size will typically be up to 40%larger than PDR estimates
Estimates should be made monthlyby project manager
Metric used must be consistent —either executable, total, ornoncomment lines
-30
-20
-10
0
10
20
30
40
50
SIZ
E E
ST
IMA
TE
GR
OW
TH
(PE
RC
EN
TA
GE
)
DESIGN CODE/TESTSYSTEM
TESTACCEPTANCE
TEST
PDR
Deviation: Size estimate grows above rangePossible Causes: a) Incomplete designb) Substantially changing or new requirements
Deviation: Little or no growth following PDRPossible Causes:a) Very stable, well- understood requirementsb) Team very familiar with application
NOTE: Although Ada systems are usually larger than FORTRAN equivalents, no appreciable differences have been noted in the growth percentage.
Deviation: Sudden decrease in estimatePossible Cause: Requirements removed or negotiated out
Figure 6-7. SEL Size Estimates Model
The growth of software size estimates should reflect requirements stability and completeness withinthe environment. The profile must either be based on heritage or on a measure of requirementsclarity and completeness.
In the SEL environment, a large number of TBDs in the requirements and specifications, combinedwith a substantial number of requirements changes, typically cause a system to grow up to 40 percentlarger than is estimated at the time of PDR. As the details of the unknown portions of the systembecome clear, the size estimate grows more rapidly. The range of accepted growth narrows as thesystem is clearly defined (see Figure 6-7).
In the example shown in Figure 6-8, investigation revealed that the project requirements weregrowing substantially and that additional funding was needed to complete the work.
100000
140000
180000
220000
260000
300000
LIN
ES
OF
CO
DE
DESIGN CODE/TESTSYSTEM
TESTACCEPTANCE
TEST
Warning sign — size estimates wandering due to unstable requirements
1
2
Project follows model after replanning
Symptom: System size exceeds 40percent growth threshold midway throughimplementation (1).
Cause: Excessive requirements changes;entirely new capabilities (subsystems)added; and ineffective change controlmechanism.
Corrective Actions: Review cost forrequirements submitted since CDR on acase-by-case basis. Enforce changecontrol procedures on future specificationmodifications. Request more budget, andreplan based on resulting system size (2).
Figure 6-8. Sample Size Estimates — UARS AGSS

6-7
COMPUTER USAGE – 4
•
•
•
CPU is a key progress indicator for design andimplementation
Use of CPU should reflect environment andprocess phase
Either CPU time or number of runs may beused
0
PE
RC
EN
T O
F T
OT
AL
CO
MP
UT
ER
HO
UR
S
Deviation: Low hours at startPossible Causes: a) Team inadequately trained on the computerb) Too much rework.
Deviation: Cumulative hours flatter than model Possible Cause: Inadequate computer resources
Deviation: CPU hours increasing too earlyPossible Causes: a) Significant staffing increase above planb) Extensive overlap of design with coding
100
TIME
DESIGN CODE AND UNIT TEST
SYSTEM TEST
ACCEPTANCE TEST
NOTE: Ada systems require more CPU time throughout the development lifecycle. However, the overall trend (expressed as percent of the total) is the same for similar FORTRAN and Ada systems.
Figure 6-9. SEL Computer Usage Model
The use of CPU is directly related to the particular process being applied, but trends have been found to beheavily environment dependent. The profile must either be based on heritage or a specific project plan. Use ofa development methodology that calls for extensive desk work, such as the cleanroom methodology (Reference9), will inevitably create significant deviations.
On a typical SEL flight dynamics project, a small amount of CPU time is used during the design phase forprototyping and entering PDL (more time is used in Ada systems for which PDL is compiled). The steepupward trend early in the implementation phase reflects an increase in online development activities (see Figure6-9). System testing is CPU-intensive, continuing the trend. Further but slower increases during acceptancetesting are due to extensive numerical testing and analysis.
Figure 6-10 is an example of CPU metrics taken from the ERBS AGSS, developed from 1982 to 1984 (160KSLOC). This project deviated from the SEL model and raised a red flag. In this case, investigation showedthat the project was being adversely affected by unstable requirements.
WEEKS FROM SRR20 40 60 80 100
1200
1000
800
600
400
200
0
CP
U H
OU
RS
(360
/75)
1
2
0
DESIGN CODE/TESTSYS. TEST
ACC. TEST
Symptom: Computer usage zero midway throughimplementation (1).
Cause: Project doing redesign in response toexcessive requirements changes instead ofimplementation.
Corrective Action: Replan project based on newscope of work (2).
Figure 6-10. Example of Computer Usage — ERBS AGSS

6-8
ERROR RATES – 5
•
•
•
Track errors vs. total estimated size ofproject in developed SLOC
Error rates should continuallydecrease in subsequent phases. TheSEL has found the "halving" modelreasonable, in which rates are cut by50% each phase
Accounting for differences in codingstyle, rates are similar for FORTRANand Ada, although classes of errorsdiffer
ER
RO
RS
PE
R K
SLO
C
SCHEDULE
DESIGN CODE/TEST SYSTEM TEST ACCEPTANCETEST
1
2
3
4
5
6
7
0
Deviation: Project's error rate is above model boundsPossible causes:a) Unreliable softwareb) Misinterpreted requirementsc) Extremely complex software
Deviation: Project's error rate is below model boundsPossible causes:a) Reliable softwareb) "Easy" problemc) Inadequate testing
Figure 6-11. SEL Error Rate Model
There are two types of information in the error rate model shown in Figure 6-11. The first consistsof the absolute error rates expected in each phase. The rates shown here are based on projects fromthe mid-1980s. The SEL expects about four errors per thousand SLOC during implementation,two during system test, and one during acceptance testing. Analysis of more recent projects indi-cates that error rates are declining as the software development process and technology improve.
The second piece of information is that error detection rates reduce by 50 percent in eachsubsequent phase. This trend seems to be independent of the actual values of the error rates. It isstill true in recent projects where overall error rates are declining. However, if the error rate is lowand the detection rate does not decline from phase to phase, inadequate testing and a less reliablesystem are likely.
Figure 6-12 is an example from the Cosmic Background Explorer (COBE) AGSS softwaredeveloped from 1987 to 1988 (175 KSLOC).
ER
RO
RS
PE
R K
SLO
C
SCHEDULE
DESIGN CODE/TEST SYSTEM TEST ACCEPTANCETEST
1
2
3
4
5
6
7
0
Symptom: Lower error rate and lower errordetection rate.
Cause: Early indication of high quality. Smoothprogress observed in uncovering errors, evenbetween phases (well-planned testing).
Result: Proved to be one of the highest qualitysystems produced in this environment.
Figure 6-12. Sample Error Rates — COBE AGSS

6-9
REPORTED/CORRECTED SOFTWARE DISCREPANCIES – 6
•
•
•
•
Key information is in theslope of the "Open Reports"curve
Expect sharper error increases at start of each phase
Trends (rates) in each of thethree curves provideinformation
Model is similar for bothFORTRAN and Ada projects
Observation: Project's count of open discrepancy reports is growingPossible causes:a) Inadequate staffing to correct errorsb) Software very unreliablec) Ambiguous or volatile requirements
Start of Testing Phase End of Testing PhasTIME
100%
DiscrepanciesFound
Discrepancies Fixed
Observation: Project's count of open discrepancy reports is decreasingPossible causes:a) Stable developmentb) Testing/development progressingc) Reliable, well-designed software (easy to fix errors)
0
Open discrepancy reports
Figure 6-13. SEL Software Discrepancy Status Model
By consistently recording reported vs. fixed discrepancies, the manager will gain insight into soft-ware reliability, progress in attaining test completion, staffing weaknesses, and testing quality. The"open reports" should decline as testing progresses unless there are inadequate staff correctingpro-blems or the software is exceptionally "buggy". The point at which the "open" and "fixed"curves intersect is the point at which defects become corrected faster than they are reported. Atthis time, the manager can more confidently predict the completion of the testing phase (seeFigure 6-13).
This error data — combined with test executions and pass rates — will enable the manager topredict quality and completion dates. When the number of errors found is lower than expected,while the test rate is at or above normal, the software is of high quality.
The example shown in Figure 6-14 is from the Trajectory Computation and Orbital ProductsSystem (TCOPS) developed from 1983 to 1987. The total size of this system was 1.2 millionSLOC.
WEEKS OF TESTING
0 5 10 15 20 25 30 35 400
0.2
0.4
0.6
0.8
1
Found
Fixed
Open
NU
MB
ER
OF
FA
ILU
RE
RE
PO
RT
S(I
N T
HO
US
AN
DS
)
Symptom: Early in testing, errors werenot getting corrected (first 15 weeks).
Cause: Lower quality software. Errorswere not found during system testing.
Corrective Actions: Staffing wasincreased at week 20 to help addressopen errors.
Results: System attained stability atweek 35, with errors being correctedfaster than they were being reported.
Figure 6-14. Example of Discrepancy Tracking — TCOPS

6-10
RATE OF SOFTWARE CHANGE – 7
•
•
•
Reported changes include errors
Change rate is a key stabilityindicator
Both absolute rate and weeklyincrements are significant
CU
MU
LAT
IVE
CH
AN
GE
S P
ER
KS
LOC
DESIGN CODE/TEST SYSTEMTEST
ACCEPTANCETEST
0.00
Deviation: Actual change rates are above model upper boundsPossible Causes:a) Rapidly changing requirementsb) Inexperienced teamc) More thorough testing (high quality)d) Erroneous specifications
Deviation: Actual change rates fall below model boundsPossible Causes:a) Stable requirementsb) Complete designc) Inadequate testing
NOTE: No difference in change rate has been noted between similar FORTRAN and Ada systems when adjustments are made for differences in coding style.
8.00
6.00
5.00
4.00
3.00
2.00
1.00
7.00
9.00
Figure 6-15. SEL Change Rate Model
The rate at which the software is changing strongly reflects the software development process and stability ofproject requirements, so any model used for comparative analysis must be based on a solid understanding of theenvironment. Two key pieces of information are shown in the model: (a) the absolute value of the change rateand (b) the week-to-week trend.
In the SEL environment, the expected change rate has been determined through past project measurement. Themodel (Figure 6-15) reflects a steady, even growth of software changes from mid-implementation throughacceptance testing. Exaggerated flat spots (periods without change) or a large jump (many changes made at thesame time) in the data should raise flags. Some deviations of this nature may be normal (e.g., during thetesting phase, code CM procedures often cause changes to be held and recorded as a group). However, anydeviation is a warning sign that should spur investigation.
Figure 6-16 presents an example from the SEL environment of a project that experienced a higher than normalchange rate. The specifications for the Geostationary Operational Environmental Satellite (GOES) AGSS (129KSLOC), developed from 1987 to 1989, were unusually problematic. Many changes to the requirements weremade throughout the project, even after implementation had begun. Early recognition of the change rateallowed managers to compensate for this by tightening CM procedures.
CU
MU
LAT
IVE
CH
AN
GE
S P
ER
KS
LOC
DESIGN CODE/TESTSYSTEM
TEST
ACCEPTANCE
TEST
0.00
8.00
6.00
5.00
4.00
3.00
2.00
1.00
7.00
9.00
10.00
Symptom: Change rate higher than normal rangebeginning midway through implementation.
Cause: Unusually high number of specificationerrors and requirements changes.
Corrective Action: Strongly enforced CMprocedures to deal with changes.
Result: High-quality project delivered on schedule.
Figure 6-16. Change Rate Example — GOES AGSS
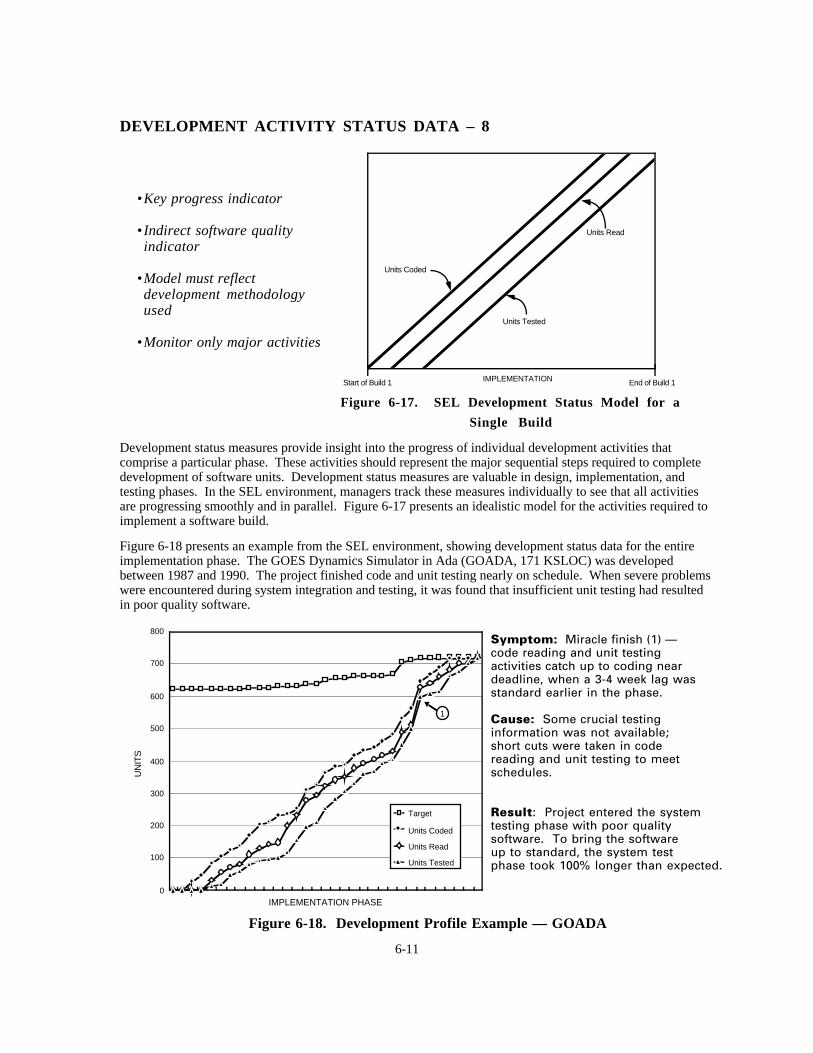
6-11
DEVELOPMENT ACTIVITY STATUS DATA – 8
•
•
•
•
Key progress indicator
Indirect software qualityindicator
Model must reflectdevelopment methodologyused
Monitor only major activities
Units Coded
Units Read
Units Tested
Start of Build 1 End of Build 1 IMPLEMENTATION
Figure 6-17. SEL Development Status Model for a
Single Build
Development status measures provide insight into the progress of individual development activities thatcomprise a particular phase. These activities should represent the major sequential steps required to completedevelopment of software units. Development status measures are valuable in design, implementation, andtesting phases. In the SEL environment, managers track these measures individually to see that all activitiesare progressing smoothly and in parallel. Figure 6-17 presents an idealistic model for the activities required toimplement a software build.
Figure 6-18 presents an example from the SEL environment, showing development status data for the entireimplementation phase. The GOES Dynamics Simulator in Ada (GOADA, 171 KSLOC) was developedbetween 1987 and 1990. The project finished code and unit testing nearly on schedule. When severe problemswere encountered during system integration and testing, it was found that insufficient unit testing had resultedin poor quality software.
UN
ITS
IMPLEMENTATION PHASE0
100
200
300
400
500
600
700
800
Target
Units Coded
Units Read
Units Tested
1
Symptom: Miracle finish (1) —code reading and unit testingactivities catch up to coding neardeadline, when a 3-4 week lag wasstandard earlier in the phase.
Cause: Some crucial testinginformation was not available;short cuts were taken in codereading and unit testing to meetschedules.
Result: Project entered the systemtesting phase with poor qualitysoftware. To bring the softwareup to standard, the system testphase took 100% longer than expected.
Figure 6-18. Development Profile Example — GOADA
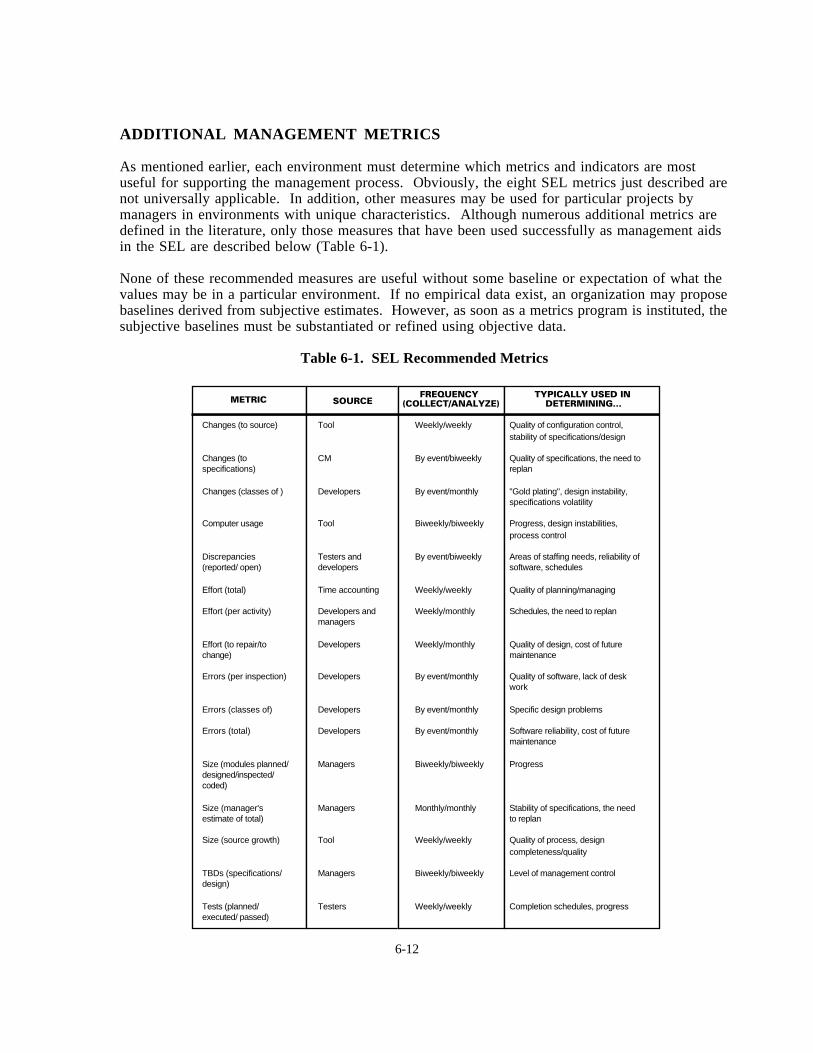
6-12
ADDITIONAL MANAGEMENT METRICS
As mentioned earlier, each environment must determine which metrics and indicators are mostuseful for supporting the management process. Obviously, the eight SEL metrics just described arenot universally applicable. In addition, other measures may be used for particular projects bymanagers in environments with unique characteristics. Although numerous additional metrics aredefined in the literature, only those measures that have been used successfully as management aidsin the SEL are described below (Table 6-1).
None of these recommended measures are useful without some baseline or expectation of what thevalues may be in a particular environment. If no empirical data exist, an organization may proposebaselines derived from subjective estimates. However, as soon as a metrics program is instituted, thesubjective baselines must be substantiated or refined using objective data.
Table 6-1. SEL Recommended Metrics
METRIC SOURCEFREQUENCY
(COLLECT/ANALYZE)TYPICALLY USED IN
DETERMINING…
Changes (to source)
Changes (to specifications)
Changes (classes of )
Computer usage
Discrepancies (reported/ open)
Effort (total)
Effort (per activity)
Effort (to repair/to change)
Errors (per inspection)
Errors (classes of)
Errors (total)
Size (modules planned/ designed/inspected/ coded)
Size (manager's estimate of total)
Size (source growth)
TBDs (specifications/ design)
Tests (planned/ executed/ passed)
Tool
CM
Developers
Tool
Testers and developers
Time accounting
Developers and managers
Developers
Developers
Developers
Developers
Managers
Managers
Tool
Managers
Testers
Weekly/weekly
By event/biweekly
By event/monthly
Biweekly/biweekly
By event/biweekly
Weekly/weekly
Weekly/monthly
Weekly/monthly
By event/monthly
By event/monthly
By event/monthly
Biweekly/biweekly
Monthly/monthly
Weekly/weekly
Biweekly/biweekly
Weekly/weekly
Quality of configuration control, stability of specifications/design
Quality of specifications, the need to replan
"Gold plating", design instability, specifications volatility
Progress, design instabilities, process control
Areas of staffing needs, reliability of software, schedules
Quality of planning/managing
Schedules, the need to replan
Quality of design, cost of future maintenance
Quality of software, lack of desk work
Specific design problems
Software reliability, cost of future maintenance
Progress
Stability of specifications, the need to replan
Quality of process, design completeness/quality
Level of management control
Completion schedules, progress

6-13
DATA COLLECTION
To produce the metrics described, accurate data must be extracted from the development project. Itis important to determine which management measures are going to be utilized during thedevelopment process so that effort is not expended in collecting extraneous data.
Table 6-1 includes the recommended frequency for which data used for the management measuresshould be collected. It also contains the recommended source of each of the required metrics.Once again, it should be noted that most projects would probably use only a subset of the measureslisted in the table. The cost in project overhead to define, collect, and utilize the metrics describedis relatively small, providing that only those metrics to be used in management activities are actuallycollected.
Normally, three categories of cost are associated with a "metrics" program:
– Overhead to a development project (filling out forms)
– Cost of processing the data (QA, data entry, storing, filing)
– Cost of analyzing the data (research and "process improvement" programs)
The overhead to the software development task itself for providing the listed metrics is minimal —well under 0.5% of the project cost — while the data processing cost for the management metricsprogram should be no more than 2% of the cost of the project in question. This includes dataentry, data processing, generating summary output, and routine QA. The third category (analyzingdata) is minimal for routine use in software development efforts and should be considered a normalmanagerial responsibility. The analysis function can be much more extensive in environments thatare involved with a full "process improvement" and/or software engineering research program. Inthese cases, analysis costs could run as high as 10 to 20 percent of the total development effort.
AUTOMATING METRICS ANALYSIS (THE "SOFTWARE MANAGEMENTENVIRONMENT")
As the corporate history of an environment grows and as the characteristics of the software processare better understood through the collection and application of metrics, an organization shouldevolve toward automating the structure, representation, and even analysis of these measures. TheSEL has built such a tool to aid in the use of relevant metrics toward improved managementawareness.
The Software Management Environment (SME, Reference 12) is an integrated set of software toolsdesigned to assist a manager in monitoring, analyzing, and controlling an ongoing software project.The major functions of the SME include the ability to track software project parameters; tocompare these factors to past projects; to analyze the differences between the current project'sdevelopment patterns and the expected development pattern within the environment; to predictcharacteristics such as milestones, cost, and reliability; and to assess the overall quality of theproject's development process. To provide these functions, the tool examines available develop-ment data from the project of interest including manpower, software changes, computer utilization,and completed milestones.
Figure 6-19 depicts the architecture and typical uses of an automated tool such as SME. The basisfor the models and information available to such a tool must come from the collection of data within

6-14
the development environment and should result in such summary information as effort distribution inthe life cycle, relationship equations, and the impact that varying technologies have on thedevelopment process. Examples are shown in Figure 6-20.
SystemSize
CT ST AT
Current Siz Final SysteSize
Time
CT ST AT
Final ErroRate
Time
Current ErroRate
Errors/1000
KSLOC
CTTime
EndEstimate
# ofErrors
Current Project
Model
Errors below normabecause of:1. Insufficient testin2. Experiencced te3. Problem less diff than expected
• Profiles of past performance• Definitions of key parameters• Model and rela- tionships
Models andMeasures
• Project charac- teristics• Project error data
Current Data
• Past project data• Product estimates
SEL Data Base
SME
• Rules of S/W development• Problem and project charac- teristics• Rules for eval- uating quality
Rule Base
Above
Norma
Below
Project Assessm
Reliabil Maintainabi Quality
Project will be very unreliable; to correct yo
CTTime
End
# ofErrors
Current Project
Model
1. Improve code reading 2. Tighten configuration c 3. Enforce coding standa
PREDICT
ASSESS
ANALYZE
GUIDANCE
Figure 6-19. Example SME Output

6-15
Design27%
Other20%
Testing28%
Code25%
• Knowledge of software development environment
Model of Measure
Current Project
CodeChanges
• Evaluation of strengths and weaknesses
'This trend meanstesting is notadequate'
34
26 2415
40
30
20
10
FORTRAN 1st Ada 2nd Ada 3rd Ada
• How do new techniques or methodologies impact software development?
Effort
Duration (months)
Number ofComputer Runs
Average Staff Size
= 1.48 (KSLOC )
= 4.6 (KSLOC )
= –108.27 + 150.88 (KSLOC)
= .24 Effort
.98
.26
.73
• Estimation of final project parameters
Comparison of Interface ErrorsAda vs. FORTRAN
%
Figure 6-20. Build Corporate Memory Into a Tool
GENERAL INDICATORS OF PROJECT STATUS
The metrics described thus far function as objective yardsticks against which the manager cangauge project progress and quality. The following is a list of general characteristics — somesubjective — that supplement these metrics as indicators of true project condition.
Frequency of schedule/milestone changesFrequency and magnitude of changes should be decreasing throughout the development
process.Consistency in organizational structure compared to original plans
Minor adjustments to the organization of the project team are expected, but major changes indicate problems.
Fluctuation in project staff level and system size estimatesFluctuations should be within uncertainty limits that become narrower as project development evolves.
Ease of access to information on project status, schedules, and plansRapid responses to questions about project status and schedules reflect well on the quality of the software development plan.
Number of overtime hours required or planned to attain certain objectivesRelying on overtime hours may indicate problems with the staff's qualifications or the team leadership.

6-16
Level of detail understood and controlled by the project manager and project leaderManagers' responses to questions about development progress indicate the degree of control exercised by leadership.
Discrepancies in staff level and workloadMajor differences between planned workload and actual workload may indicate lack of understanding.
Discrepancies in computer usageA decrease or slow start in using the computer may indicate incomplete design.
WARNING SIGNALS AND CORRECTIVE ACTIONS
When a project is in trouble, the manager must take immediate corrective measures to move it backon a successful course. The following lists of warning signals and corresponding correctiveactions itemize many of the common problems identified by the SEL.
Problems With Requirements and Specifications
Number of TBD requirements higher than norm or not decliningIf critical specifications are missing, design of the affected portions of the system should not proceed until the information is obtained. In noncritical cases, development may continue despite the incompleteness. Assess the effect of missing requirements/ specifications and determine whether relatively safe assumptions about the missing information can be made. Before starting the next phase, prepare a risk management plan. For all TBD specifications, assign due dates for resolution of TBDs and notify higher management if schedules are not met.
Number of requirements questions submitted vs. questions answered is high and increasingIndicates inconsistent or confusing specifications. Difficulties become compounded if development is permitted to continue. Stop development activity and resolve inconsistency or confusion in consultation with the user organization. Negotiate a reduction in the scope of the system by defining an understandable subset of the original system. Document all assumptions about requirements in the functional specification.
High number of specification modifications received vs. number completedIf major changes or additions to requirements are unavoidable, the design of the affected portion of the system must be postponed. Split development into two releases, with the late specifications included in the second release. Hold a separate CDR
for the second release.
Problems With System Design
Actual number of components designed is fewer than estimated at a particular point in thedetailed design phase
Lack of design growth may be due to poor direction from the team leader, inexperienced staff, use of new technology, or changing requirements. Determine the cause of the slow growth. Based on the cause, either replace junior personnel with senior personnel, provide training, decrease staff size to a manageable level, set up a prototyping effort to improve technical understanding, or decrease the scope of the system.
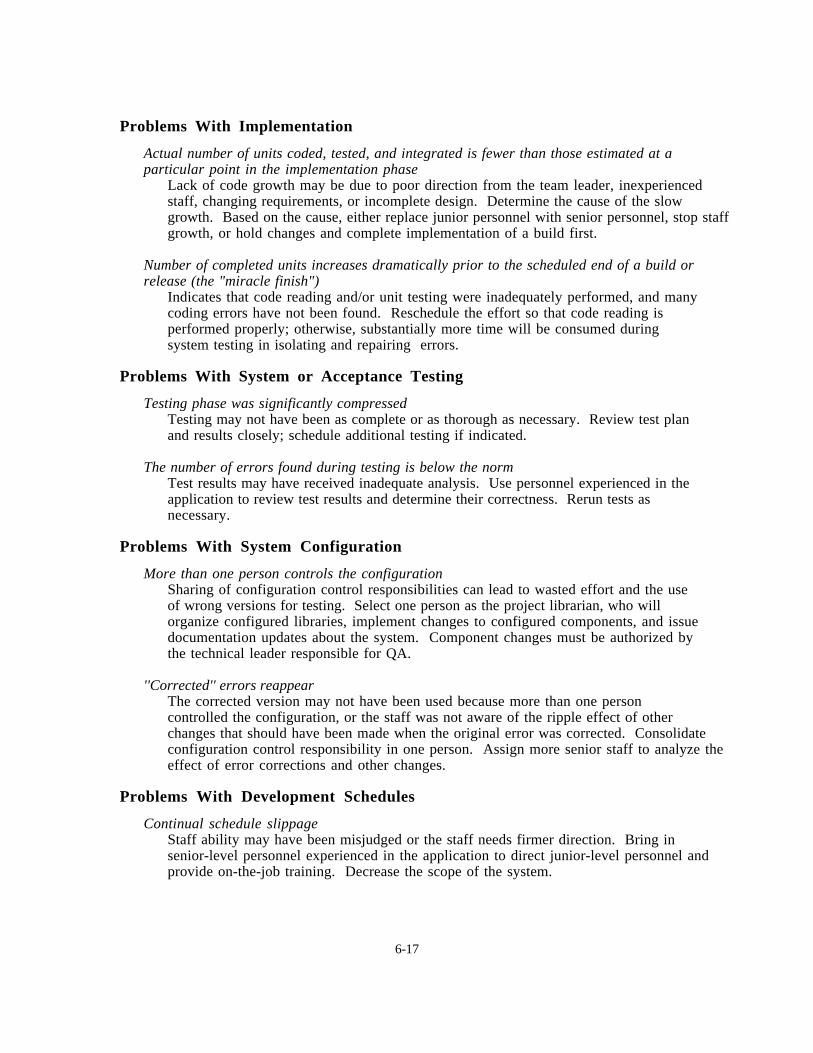
6-17
Problems With Implementation
Actual number of units coded, tested, and integrated is fewer than those estimated at aparticular point in the implementation phase
Lack of code growth may be due to poor direction from the team leader, inexperienced staff, changing requirements, or incomplete design. Determine the cause of the slow growth. Based on the cause, either replace junior personnel with senior personnel, stop staffgrowth, or hold changes and complete implementation of a build first.
Number of completed units increases dramatically prior to the scheduled end of a build orrelease (the "miracle finish")
Indicates that code reading and/or unit testing were inadequately performed, and many coding errors have not been found. Reschedule the effort so that code reading is performed properly; otherwise, substantially more time will be consumed during system testing in isolating and repairing errors.
Problems With System or Acceptance Testing
Testing phase was significantly compressedTesting may not have been as complete or as thorough as necessary. Review test plan and results closely; schedule additional testing if indicated.
The number of errors found during testing is below the normTest results may have received inadequate analysis. Use personnel experienced in the application to review test results and determine their correctness. Rerun tests as necessary.
Problems With System Configuration
More than one person controls the configurationSharing of configuration control responsibilities can lead to wasted effort and the use of wrong versions for testing. Select one person as the project librarian, who will organize configured libraries, implement changes to configured components, and issue documentation updates about the system. Component changes must be authorized by the technical leader responsible for QA.
''Corrected'' errors reappearThe corrected version may not have been used because more than one person controlled the configuration, or the staff was not aware of the ripple effect of other changes that should have been made when the original error was corrected. Consolidate configuration control responsibility in one person. Assign more senior staff to analyze theeffect of error corrections and other changes.
Problems With Development Schedules
Continual schedule slippageStaff ability may have been misjudged or the staff needs firmer direction. Bring in senior-level personnel experienced in the application to direct junior-level personnel and provide on-the-job training. Decrease the scope of the system.

6-18
Development activity is uneven and ragged; effort drops dramatically immediately after amilestone is reached
Personnel have been assigned to work part-time on too many projects. Staff will tend to concentrate on a single project at a time, sometimes to the detriment of other project schedules. Reassign personnel, preferably to one project, but never to more than two at a time.
Personnel turnover threatens to disrupt development scheduleThe effect of turnover is not directly proportional to the number of staff involved. For each key person who leaves a project, two experienced personnel should be added. A junior project member should be replaced by a person at least one level higher in experience. Only in this way can a manager balance the effects on the schedule of the training and familiarization time new staff will require.
Capabilities originally planned for one time period are moved to a later time periodIf a corresponding move of later capabilities to an earlier time period has not been made, the danger is that the development team will not be able to handle the additional work in the later period. Obtain justification for the change with detailed schedule information forthe new and old plans. If the shift of capabilities is extensive, stop development activity untilthe development/management plan can be revised, then proceed.
Change or decrease in planned use of methods or procedures occursThe methods or procedures had some use or expected benefit or they would not have been included in the development plan. Obtain justification for the change, to include showing how the expected benefit from the planned use of the method will be realized in light of the change.
BASIC SET OF CORRECTIVE ACTIONS
Some consistent themes appear in the lists of corrective actions, regardless of problem area. Theserecommendations constitute the SEL's basic approach to regaining control of the project whendanger signals arise:
• Stop current activities on the affected portion of the system and assess the problem
• Complete predecessor activities
• Decrease staff to manageable level
• Replace junior with senior personnel
• Increase and tighten management procedures
• Increase number of intermediate deliverables
• Decrease scope of work and define a manageable, doable thread of the system
• Audit project with independent personnel and act on their findings

7-1
SECTION 7—REVIEWS AND AUDITS
Reviews and audits are methods for assessing the condition of the project. Although bothtechniques address quality assurance by examining the plans, methods, and intermediate productsassociated with the development process, they are conducted for different reasons. Reviews areroutinely scheduled as part of the development process; they mark key phase transitions in thesoftware life cycle. Audits are generally not predetermined but are conducted when needed toevaluate the project's status.
REVIEWS
Reviews are designed to provide regularly scheduled monitoring of project status. The followingfour questions can serve as general guidelines, regardless of the type of review:
Is the development plan being followed?
Is the project making satisfactory progress?
Are there indications of future problems?
Is the team prepared to proceed with the next phase of development?
Reviews may be characterized in various ways, such as formality or timing. Informal reviews maybe held to brief higher level managers on the current state of the project. In the SEL environment,an informal review is generally held following completion of each build. It covers importantpoints that need to be assessed before the next phase of implementation is begun, such as changesto the design, schedules, and lessons learned.
A formal review generally involves a more detailed presentation and discussion and follows aprescribed agenda. Some reviews may resemble progress reports delivered at fixed intervals, e.g.,weekly or monthly. In the SEL environment, five formal reviews are recommended — systemrequirements review (SRR), software specifications review (SSR), preliminary design review(PDR), critical design review (CDR), and operational readiness review (ORR). These reviews arescheduled at key transition points between life cycle phases (see Figure 7-1).
LIFECYCLEPHASES
REQUIREMENTSDEFINITION ANDSPECIFICATION
REQUIREMENTSANALYSIS
DETAILED DESIGN IMPLEMENTATION
SYSTEM TEST
ACCEPT-ANCETEST
PRELIMINARYDESIGN
SRR SSR PDR CDR ORRREVIEWS
Figure 7-1. Scheduling of Formal Reviews
The remainder of this section examines the five reviews in order of occurrence and describes theformat of the review (presenters, participants, and agenda), key issues to be addressed at the review(in addition to the general questions above), and hardcopy material (outline and suggestedcontents). The hardcopy material will contain some of the same information found in thedocuments described in Section 4. For example, when preparing the hardcopy material for the

7-2
PDR, some of the contents from the completed preliminary design report can be used. Themanager should also keep in mind that, as with the documents in Section 4, there is someflexibility in selecting the most appropriate information to include in the hardcopy material. Thecontents suggested in this section are intended as a guideline.
SYSTEM REQUIREMENTS REVIEW
SRR FormatPresenters — requirements definition team
Participants
• Customer representatives
• User representatives
• CCB
• Senior development team representative(s)
• QA representatives
Time — after requirements definition is complete and before the requirements analysis phase begins
Agenda — selective presentation of system requirements, highlighting operations concepts and critical issues (e.g., TBD requirements)
Materials Distribution• The requirements and functional specifications document is distributed 1 to 2 weeks prior to
SRR
• Hardcopy material is distributed a minimum of 3 days before the SRR
Key Issues To Be AddressedWhat is the effect of the TBD items?
What timetable has been established for resolving TBD items?
Have all external interface requirements been defined?
Are operational methods and performance constraints understood (e.g., timing, accuracy)?
Is the project feasible, given the constraints on and assumptions about available resources?
SRR Hardcopy MaterialAn outline and suggested contents of the SRR hardcopy material are presented in Figure 7-2.

7-3
1. Agenda — outline of review material
2. lntroduction — purpose of system and background of the project
3. Requirements summary — review of top-level (basic) requirements developed to form the functional specificationsa. Background of requirements — overview of project characteristics and major eventsb. Derivation of requirements — identification of input from project office, support
organization, and system engineering organization used to formulate the requirements:support instrumentation requirements document (SIRD), memoranda of information (MOIs), and memoranda of understanding (MOUs)
c. Relationship of requirements to Ievel of support provided — typical support, critical support, and special or contingency support
d. Organizations that provide system and support input and receive system outpute. Data availability — frequency, volume, and formatf. Facilities — target computing hardware and environment characteristicsg. Requirements for computer storage, failure/recovery, operator interaction, system error
recovery, and diagnostic outputh. Requirements for support and test software — data simulators, test programs, and
utilitiesi. Overview of the requirements and functional specifications document — its evolution,
including draft dates and reviews and outline of contents
4. lnterface requirements — summary of human, special-purpose hardware, and automated system interfaces, including references to interface agreement documents (IADs) and interface control documents (ICDs)
5. Performance requirements — system processing speed, system response time, system failure recovery time, and output data availability
6. Environmental considerations — special computing capabilities, e.g., graphics, operating system Iimitations, computer facility operating procedures and policies, support software limitations, database constraints, resource limitations, etc.
7. Derived system requirements — Iist of those requirements not explicitly called out in the requirements document but representing constraints, Iimitations, or implications that must be satisfied to achieve the explicitly stated requirements
8. Operations conceptsa. High-level diagrams of operating scenarios showing intended system behavior from the
user's viewpointb. Sample input screens, menus, etc.; sample output displays, reports, plots, etc; critical
control sequences
9. Requirements management approacha. Description of controlled documents, including scheduled updatesb. Specifications/requirements change control proceduresc. System enhancement/maintenance procedures
10. Personnel organization and interfaces
11. Milestones and suggested development schedule
12. Issues, TBD items, and problems — a characterization of all outstanding requirements issues and TBDs, an assessment of their risks (including the effect on progress), and a course of action to resolve them, including required effort, schedule, and cost
Figure 7-2. SRR Hardcopy Material

7-4
SOFTWARE SPECIFICATIONS REVIEW
SSR FormatPresenters — software development team
Participants
• Requirements definition team
• Customer representatives
• User representatives
• QA representatives for both teams
• CCB
Time — after requirements analysis is completed and before preliminary design is begun
Agenda — selective presentation of the results of requirements analysis, directed primarily toward project management and the end-users of the system
Materials Distribution• The requirements analysis report and software development/management plan are
distributed 1 to 2 weeks prior to SSR
• Hardcopy material is distributed a minimum of 3 days before the SSR
Key Issues To Be AddressedHave all requirements and specifications been classified (as mandatory, derived, "wish list",
information only, or TBD)?
Is the reuse proposal realistic in view of software availability and cost drivers?
Is the selected system architecture an appropriate framework for satisfying the requirements?
Are the requirements and functional specifications testable as written?
Have all requirements issues and technical risks been addressed?
Is the foundation adequate to begin preliminary design?
SSR Hardcopy MaterialAn outline and suggested contents of the SSR hardcopy material are presented in Figure 7-3.

7-5
1. Agenda — outline of review material
2. Introduction — background of the project and purpose of system
3. Analysis overview — analysis approach, degree of innovation required in analysis, special studies, and results
4. Revisions since SRR — changes to operations concepts, requirements, and functional specifications effected following the SRR
5. Reusable software summarya. Key reuse candidates — identification of existing software components that satisfy
specific system functional specifications exactly or that will satisfy them after modification
b. Overall architectural concept for the systemc. Matrix of requirements to be fulfilled by reused components
6. Classification summarya. List of requirements and functional specifications with their assigned classifications
(mandatory, derived, "wish list", information only, or TBD)b. Problematic specifications — identification and discussion of conflicting, ambiguous, i nfeasible, and untestable requirements and specificationsc. Unresolved requirements/operations issues, including the dates by which resolutions to
TBDs are needed
7. Functional specificationsa. High-level data flow diagrams showing input, transforming processes, and outputb. Data set definitions for interfaces to the system
8. Development considerationsa. System constraints — hardware availability, operating system limitations, and support
software limitationsb. Utility, support, and test programs — Iist of auxiliary software required to support
development, e.g., data simulators, special test programs, software tools, etc.c. Testing requirementsd. Development assumptions
9. Risks, both to costs and schedules — includes risks related to TBD or changing requirements as well as technical risks
10. Summary of planned prototyping efforts needed to resolve technical risks, including the goals and schedule for each effort
11. Personnel organization and interfaces
12. Milestones and schedules — includes development life cycle (phase start and finish dates), schedule for reviews (internal and external), build/release dates, delivery dates of required external interfaces, schedule for integration of externally developed software and hardware
Figure 7-3. SSR Hardcopy Material

7-6
PRELIMINARY DESIGN REVIEW
PDR FormatPresenters — software development team
Participants
• Requirements definition team
• QA representatives from both groups
• Customer interfaces for both groups
• User representatives
• CCB
Time — after the functional design is complete and before the detailed design phase begins
Agenda — selective presentation of the preliminary design of the system. The materials presented at PDR do not necessarily show the technical depth that the development team has achieved during the preliminary design phase (e.g., presentation of operating scenarios shouldbe limited to the nominal operating and significant contingency cases). Full details of the technical effort are documented in the preliminary design report
Materials Distribution• The preliminary design report is distributed at least 1 week prior to PDR
• Hardcopy material is distributed a minimum of 3 days before PDR
Key Issues To Be AddressedHave alternative design approaches been examined?Are all requirements traceable to subsystems in the functional design?Is the subsystem partitioning sensible in view of the required processing?Are all interface descriptions complete at both the system and subsystem level?Are operational scenarios completely specified?Is the error handling and recovery strategy comprehensive?Is the estimate of resources realistic?Is the schedule reasonable?Have technical risks, including any remaining TBD requirements, been adequately addressed?Has the design been elaborated in baseline diagrams to a sufficient level of detail? (Reference2
presents information on level of detail)Does the design facilitate testing?
PDR Hardcopy MaterialAn outline and suggested contents of the PDR hardcopy material are presented in Figure 7-4.

7-7
1. Agenda — outline of review material
2. Introduction — background of the project and system objectives
3. Design overviewa. Design drivers and their order of importance (e.g., performance, reliability, hardware,
memory considerations, programming language, etc.)b. Results of reuse tradeoff analyses (at the level of subsystems and major components)c. Changes to the reuse proposal since the SSRd. Critique of design alternativese. Diagram of selected system design. Shows products generated, interconnections among
subsystems, external interfaces. Emphasis should be on the differences between the system to be developed and existing, similar systems
f. Mapping of external interfaces to ICDs and ICD status
4. System operationa. Operations scenarios/scripts — one for each major product that is generated. Includes
the form of the product and the frequency of generation. Panels and displays should be annotated to show what various selections will do and should be traced to a subsystem
b. System performance considerations
5. Major software components — one diagram per subsystem
6. Requirements traceability matrix mapping requirements to subsystems
7. Testing strategya. How test data are to be obtainedb. Drivers/simulators to be builtc. Special considerations for Ada testing
8. Design team assessment — technical risks and issues/problems internal to the software development effort; areas remaining to be prototyped
9. Software development/management plan — brief overview of how the development effort is conducted and managed
10. Software size estimates — one slide
11. Milestones and schedules — one slide
12. Issues, problems, TBD items beyond the control of the software development teama. Review of TBDs from SSRb. Dates by which TBDs/issues must be resolved
Figure 7-4. PDR Hardcopy Material

7-8
CRITICAL DESIGN REVIEW
CDR FormatPresenters — software development team
Participants
• Requirements definition team
• QA representatives from both groups
• Customer interfaces for both groups
• User representatives
• CCB
Attendees should be familiar with the project background, requirements, and design.
Time — after the detailed design is completed and before implementation is begun
Agenda — selective presentation of the detailed design of the system. Emphasis should be given to changes to the high-level design, system operations, development plan, etc. since PDR. Speakers should highlight these changes both on the slides and during their presentations, so that they become the focus of the review
Materials Distribution• The detailed design document should be distributed at least 10 days prior to CDR
• CDR hardcopy material is distributed a minimum of 3 days in advance
Key Issues To Be AddressedAre all baseline diagrams complete to the subroutine level?
Are all interfaces — external and internal — completely specified at the subroutine level?
Is there PDL or equivalent representation for each subroutine?
Will an implementation of this design provide all the required functions?
Does the build/release schedule provide for early testing of end-to-end system capabilities?
CDR Hardcopy MaterialAn outline and suggested contents of the CDR hardcopy material are presented in Figure 7-5.

7-9
1. Introduction — background of the project, purpose of the system, and an agenda outlining review materials to be presented
2. Design overview — major design changes since PDR (with justifications)a. Design diagrams, showing products generated, interconnections among subsystems,
external interfacesb. Mapping of external interfaces to ICDs and ICD status
3. Results of prototyping efforts
4. Changes to system operation since PDRa. Updated operations scenarios/scriptsb. System performance considerations
5. Changes to major software components since PDR (with justifications)
6. Requirements traceability matrix mapping requirements to major components
7. Software reuse strategya. Changes to the reuse proposal since PDRb. New/revised reuse tradeoff analysesc. Key points of the detailed reuse strategy, including software developed for reuse in
future projectsd. Summary of RSL use — what is used, what is not, reasons, statistics
8. Changes to testing strategya. How test data are to be obtainedb. Drivers/simulators to be builtc. Special considerations for Ada testing
9. Required Resources — hardware required, internal storage requirements, disk space, impact on current computer usage, impacts of compiler
10. Changes to the software development/management plan since PDR
11. Implementation dependencies (Ada Projects) — the order in which components should be implemented to optimize unit/package testing)
12. Updated software size estimates
13. Milestones and schedules including a well thought-out build plan
14. Issues, risks, problems, TBD itemsa. Review of TBDs from PDRb. Dates by which TBDs and other issues must be resolved
Figure 7-5. CDR Hardcopy Material

7-10
OPERATIONAL READINESS REVIEW
ORR FormatPresenters — operations support team and development team
Participants
• User acceptance test team
• Requirements definition, software development, and software maintenance representatives
• QA representatives from all groups
• Customer interfaces for all groups
• CCB
Time — after acceptance testing is complete and 90 days before operations start
Agenda — selective presentation of information from the hardcopy material, omitting details that are more effectively communicated in hardcopy form and highlighting critical issues
(e.g., items 7 and 8 from Figure 7-6)
Materials Distribution• ORR hardcopy material is distributed a minimum of 5 days before ORR
Key Issues To Be AddressedWhat is the status of required system documentation?
What is the status of external interface agreements?
Were the methods used in acceptance testing adequate for verifying that allrequirements have been met?
What is the status of the operations and support plan?
Is there sufficient access to necessary support hardware and software?
Are configuration control procedures established?
What contingency plans to provide operational support have been addressed?
ORR Hardcopy MaterialAn outline and suggested contents of the ORR hardcopy material are presented in Figure 7-6.

7-11
1. Introduction — purpose of the system and outline of review material
2. System requirements summary — review of top-level (basic) requirementsa. Background of requirements — overview of project characteristics, major events, and
supportb. Derived requirements (updated from SRR)c. Relationship of requirements to support provided — typical, critical, and special or
contingency supportd. Operational support scenariose. Relationship of requirements matrix, e.g., of top-level requirements to operational
support scenariosf. Organizational interfaces, e.g., that provide system and support input and receive
system outputg. Data availability for the operating scenarios — frequency, volume, and formath. Facilities — computing hardware, environment characteristics, communications
protocols, etc.i. General system considerations — high-level description of requirements for computer
storage, graphics,and failure/recovery; operator interaction; system error recovery and diagnostic output; etc.
j. Support and test software considerations — high-Ievel description of requirements for data simulators, test programs, and support utilities
3. Summary and status of IADs — status of all interface documents with external organizations
4. Support system overviewa. Major software components — purpose, general characteristics, and operating scenarios
supported by programs and subsystemsb. Testing philosophyc. Requirements verification philosophy — demonstration of methods used to ensure that
the software satisfies all system requirements; matrix showing relation between requirements and tests
d. Testing and performance evaluation results — summary of system integration and acceptance test results; evaluation of system performance measured against performance requirements
e. System software and documentation status — summary of completed work packages and list of incomplete work packages with scheduled completion dates and explanation of delays
5. Status of operations and support plana. Organizational interfaces — diagrams and tables indicating organizational interfaces,
points of contact, and responsibilities; data flow and media (forms, tapes, voice, Iog)b. Data availability — nominal schedule of input and output data by type, format,
frequency, volume, response tlme, turnaround timec. Facilities — nominal schedule of access to computers, support and special-purpose
hardware, operating systems, and support software for normal, critical, emergency, and contingency operations
d. Operating scenarios — top-level procedures, processing timelines, and estimated resources required
e. Documentation of operations procedures — operations and support handbooks and update procedures
Figure 7-6. ORR Hardcopy Material (1 of 2)

7-12
6. System management plana. Configuratlon control procedures — explanation of step-by-step procedures for
maintaining system integrity, recovering from loss, fixing faults, and enhancing systemb. Enhancement/maintenance procedures — initiation, forms, reviews, approval, and
authorizationc. Reporting/testing evaluation procedures — forms, reviews, approval, authorization,
distributiond. System performance evaluation procedures — for ongoing evaluation
7. lssues, TBD items, and problems—a characterization of all those items affecting normal operations as perceived by the developers and users; an assessment of their effect on operations; and a course of action to resolve them, including required effort, schedule, and cost
8. Contingency plans — a priority Iist of items that could prevent normal operations, including the steps necessary to work around the problems, the defined levels of operations during the workarounds, and the procedures to attempt to regain normal operations
9. Milestones and timeline of events — diagrams, tables, and scripts of events; operating scenarios; maintenance; enhancement; reviews; training
Figure 7-6. ORR Hardcopy Material (2 of 2)

7-13
AUDITS
The purpose of an audit is to provide an independent assessment of the software project — its condition, itsproblems, and its likelihood of reaching successful completion. The audit may be prompted by indicationsof problems or by lack of progress, or it may be fulfilling a routine contractual requirement. Occurrence ofone or more of the following conditions on a project should automatically trigger an audit:
• There are significant (> 25%) deviations from planned staffing, resources, or schedule after CDR
• There is a high turnover of staff (>30%)
• It is apparent that a delivery schedule will not be met
• The number of failed tests increases toward the end of system or acceptance testing
• It is determined that the system does not fulfill a critical capability
• There is evidence that system interfaces will not be met at delivery
An individual or, preferably, a group outside the development team is charged with conducting thisexamination. It is essential for the audit team to obtain a clear written statement of the specific objective ofthe audit at the start.
When preparing to conduct an audit, several key questions must be addressed:
What is the scope of the audit? Is the entire development effort being examined or only some particlar component of the project?
What is the final form the audit should take — a presentation, a written report, or both?
To whom will the results be presented?
What is the timetable for completing the audit?
What staff and support resources will be available for the audit work?
Have the development team and its management been informed that an audit is scheduled?
Have specific individuals on the development team been identified as principal contacts for the audit group?
What constraints exist on the work of the audit team regarding access to documents or individuals?
Where are the sources for documentation related to the project (requirements statements, plans, etc.)?
Are there specific auditing standards or guidelines that must be observed?
The answers to these questions will form the basis for planning the audit task. Sources of informationinclude personal interviews with managers, team members, and individuals who interact with thedevelopment team. Documentation must be reviewed to understand the origin of the requirements and theplans and intermediate products of the development team.
Four steps are involved in conducting the audit of a software development project:
• Determine the current status of the project
• Determine whether the development process is under control
• Identify key items that are endangering successful completion
• Identify specific actions to put the project onto a successful course

7-14
AUDIT STEP #1 — DETERMINE THE CURRENT STATUSOF THE PROJECT
Audit Question Audit Team's Checklist
Given the size and nature ofthe problem, where shouldthe project be?
• Consult Table 3-1 and project histories data base (see Section 6)for comparison data on similar projects:
— Percentage of effort and schedule consumed thus far— Percentage of effort by type of activity— Percentage of code developed thus far
According to the development/management plan, whereshould the project be?
• Refer to the software development/ management plan for the project:
— What activities should be current?— How should it be staffed?— What intermediate products should have been delivered?— What milestones should have occurred?
Where does the projectactually stand now?
• From interviews and documentation, identify the following:current phase, milestones reached, documents delivered,activity levels, staff composition, project budget, andactual expenditures
AUDIT STEP #2 — DETERMINE WHETHER THE DEVELOPMENT PROCESS IS UNDER CONTROL
Audit Question Audit Team's Checklist
Is the problem well understoodand stable?
• Refer to review hardcopy materials (Figs. 7-2, 7-3, 7-4, 7-5) andthe Requirements Analysis Report (Figure 4-4) for significanceof TBD items
• Determine the number of times project size has been reestimatedand the extent of these revisions
• From the technical manager, identify the number and extent ofspecification modifications received by the development team
Is the development/managementplan being followed?
• Compare the development/management plan to actualdevelopment to determine whether
— The schedule is being followed— Milestones have been met— The plan is being updated (see Section 2)— Actual and planned staffing levels agree
Is adequate direction beingprovided?
• Interview team leaders, technical managers, and administrativemanagers to determine whether there is agreement on
— Project scope and objectives— Expectations and responsibilities at each level— Progress of the development effort to date

7-15
AUDIT STEP #3 — IDENTIFY KEY ITEMS THAT ARE ENDANGERINGSUCCESSFUL COMPLETION
Audit Question Audit Team's Checklist
Are resources adequate? • Time — determine if lack of schedule time (regardless of staff) isa concern by comparison to past projects (Section 6) and by timeestimates (Section 3)
• Staff — compare actual with desired staffing characteristics as tolevel of effort (Section 3), staffing pattern (Figure 6-4), teamsize (Table 3-5), and composition (Table 3-6)
• Computer — compare actual with expected utilization(Figures3-2 and 3-3); from interviews and computer facilityschedules, determine degree of access to computer and level ofservice provided
• Support — compare actual level of support services to typicallevels
Is the development processadequate?
• Determine whether technical standards and guidelines are beingfollowed for design, coding, and testing
• Determine whether available tools and methodologies are beingused
• From interviews, determine the procedures for reporting andresolving problems
Are the organization andplanning adequate?
• From interviews, assess the reporting relationships that exist, theteam morale and turnover, and the pattern of delegating work
• Assess the quality, completeness, and practicality of the softwaredevelopment/management plan (see Section 2)
• From interviews and documentation (Sections 2 and 7), identifythe extent of contingency planning
AUDIT STEP #4 — IDENTIFY SPECIFIC ACTIONS TO PUT THEPROJECT ON A SUCCESSFUL COURSE
• Recommended actions must be based on results of audit steps 1, 2, and 3
• For general problem of inadequate progress, some options are as follows
– Stop development; generate a realistic plan before continuing– Replace junior personnel with senior staff– Increase visibility by improving identification and review of intermediate
products– Provide training

A-1
APPENDIX A — SEL SOFTWARE DEVELOPMENTENVIRONMENT
PROCESS CHARACTERISTICS AVG. HIGH LOW
Duration (months) 24 43 19
Effort (staff-years) 14 32 3
Size (1000 source lines of code) 107 246 31
Staff (full time equivalent)
Average 8 15 4
Peak 13 30 5
Individuals 22 44 6
Application Experience (years)
Managers 9 15 4
Technical Staff 4 7 2
Overall Experience (years)
Managers 14 19 10
Technical Staff 6 9 4
N O T E S : Type of software: Scientific, ground-based, interactive graphicMachines: IBM 4341 and DEC VAX 780, 8600, and 8810Sample: 10 FORTRAN (with 15% in Assembler) and 3 Ada projectsStaff-year = 1864 effort hours

G-1
AGSS attitude ground support system
ATR Assistant Technical Representative
CCB configuration control board
CDR critical design review
CM configuration management
COBE Cosmic Background Explorer
CPU central processing unit
ERBS Earth Radiation Budget Satellite
GOADA GOES Dynamics Simulator in Ada
GOES Geostationary Operational Environmental Satellite
GRO Gamma Ray Observatory
IAD interface agreement document
ICD interface control document
I/O input/output
IV&V independent verification and validation
LOC lines of code
MOI memorandum of information
MOU memorandum of understanding
ORR operational readiness review
PDL program design language (pseudocode)
PDR preliminary design review
QA quality assurance
RSL reusable software library
SEF subjective evaluation form
SEL Software Engineering Laboratory
SIRD support instrumentation requirements document
SLOC source lines of code
SME Software Management Environment
SRR system requirements review
SSR software specifications review
TBD to be determined
TCOPS Trajectory Computation and Orbital Products System
GLOSSARY

R-1
REFERENCES
l. Software Engineering Laboratory, SEL-81-104, The Software Engineering Laboratory,D. N. Card et al., February 1982
2. —, SEL-81-205, Recommended Approach to Software Development, F. E. McGarry,G. Page, S. Eslinger, et al., April 1983
3. —, SEL-81-101, Guide to Data Collection, V. E. Church, D. N. Card, and F. E. McGarry, August 1982
4. —, SEL-83-001, An Approach to Software Cost Estimation, F. E. McGarry, G. Page,D. N. Card, et al., February 1984
5. —, SEL-90-003, A Study of the Portability of an Ada System in the Software Engineering Laboratory, L.O. Jun, S.R.Valett, June 1990
6. H.D. Rombach, B.T. Ulery, "Measurement Based Improvement of Maintenance in the SEL,"Proceedings of the Fourteenth Annual Software Engineering Workshop, SEL-89-007,November 1989
7. Software Engineering Laboratory, SEL-87-008, Data Collection Procedures for the Rehosted SEL Database, G. Heller, October 1987
8. —, SEL-85-001, A Comparison of Software Verification Techniques, D. N. Card,R. W. Selby, Jr., F. E. McGarry, et al., April 1985
9. —, SEL-90-002, The Cleanroom Case Study in the Software Engineering Laboratory: Project Description and Early Analysis, S. Green et al., March 1990
10. —, SEL-85-005, Software Verification and Testing, D. N. Card, C. Antle, and E. Edwards, December 1985
11. F. E. McGarry, "What Have We Learned in 6 Years?", Proceedings of the Seventh Annual Software Engineering Workshop, SEL-82-007, December 1982
12. Software Engineering Laboratory, SEL-89-003, Software Management Environment (SME)Concepts and Architecture, W. Decker and J. Valett, August 1989