Managerial Succession and Firm...
40
Managerial Succession and Firm Performance * Mark R. Huson University of Alberta Paul H. Malatesta University of Washington Robert Parrino University of Texas July 17, 2002 Abstract: We examine CEO turnover and firm financial performance. Accounting measures of performance relative to other firms deteriorate prior to turnover, and improve subsequently. Relative performance improvements are positively related to institutional shareholdings and are greater when successor CEOs are hired from outside the firm than when they are insiders. We find also that turnover announcements are associated with significantly positive average abnormal stock returns. Moreover, turnover announcement abnormal stock returns are significantly positively related to subsequent changes in accounting measures of performance. This suggests that investors typically view turnover announcements as good news because they anticipate that turnover will prompt performance improvements, on average. * Huson is from the Department of Finance & Management Science, Faculty of Business, University of Alberta, Edmonton, Alberta T6G 2R6, Canada, (780) 492-2803, [email protected]. Malatesta is from the Department of Finance and Business Economics, School of Business Administration, University of Washington, Seattle, Washington, 98195-3200, USA, (206) 685-1987, [email protected]. Parrino is from the Department of Finance, M c Combs School of Business, University of Texas at Austin, Austin, Texas, 78712-1179, USA, (512) 471-5788, [email protected]. We would like to thank Jonathon Karpoff, Charles Kahn and seminar participants at Clemson University, the University of Alberta, Arizona State University, the University of Illinois, the University of Indiana, and the University of Texas for helpful comments. Huson acknowledges financial support from the Canadian Utilities Fellowship at the University of Alberta.
Transcript of Managerial Succession and Firm...
Managerial Succession and Firm Performance*
Mark R. Huson University of Alberta
Paul H. Malatesta
University of Washington
Robert Parrino University of Texas
July 17, 2002
Abstract: We examine CEO turnover and firm financial performance. Accounting measures of performance relative to other firms deteriorate prior to turnover, and improve subsequently. Relative performance improvements are positively related to institutional shareholdings and are greater when successor CEOs are hired from outside the firm than when they are insiders. We find also that turnover announcements are associated with significantly positive average abnormal stock returns. Moreover, turnover announcement abnormal stock returns are significantly positively related to subsequent changes in accounting measures of performance. This suggests that investors typically view turnover announcements as good news because they anticipate that turnover will prompt performance improvements, on average.
* Huson is from the Department of Finance & Management Science, Faculty of Business, University of Alberta, Edmonton, Alberta T6G 2R6, Canada, (780) 492-2803, [email protected]. Malatesta is from the Department of Finance and Business Economics, School of Business Administration, University of Washington, Seattle, Washington, 98195-3200, USA, (206) 685-1987, [email protected]. Parrino is from the Department of Finance, McCombs School of Business, University of Texas at Austin, Austin, Texas, 78712-1179, USA, (512) 471-5788, [email protected]. We would like to thank Jonathon Karpoff, Charles Kahn and seminar participants at Clemson University, the University of Alberta, Arizona State University, the University of Illinois, the University of Indiana, and the University of Texas for helpful comments. Huson acknowledges financial support from the Canadian Utilities Fellowship at the University of Alberta.

Managerial Succession and Firm Performance
Abstract
We examine CEO turnover and firm financial performance. Accounting measures of performance relative to other firms deteriorate prior to turnover, and improve subsequently. Relative performance improvements are positively related to institutional shareholdings and are greater when successor CEOs are hired from outside the firm than when they are insiders. We find also that turnover announcements are associated with significantly positive average abnormal stock returns. Moreover, turnover announcement abnormal stock returns are significantly positively related to subsequent changes in accounting measures of performance. This suggests that investors typically view turnover announcements as good news because they anticipate that turnover will prompt performance improvements, on average.
1
Managerial Succession and Firm Performance
1. Introduction In the year 2000 the largest 500 publicly traded companies in the United States had
combined revenues of $8.4 trillion. Their assets exceeded $21 trillion and they employed more
than 30 million people.1 Given the sheer size of these firms, there can be little doubt that
decisions made by their principal officers can create or destroy wealth on a vast scale. These
decisions also have considerable ramifications for millions of employees and billions of
customers. Moreover, the figures above only hint at the overall economic significance of the
public corporate sector and the importance of the decisions made by top managers of public
corporations.
Because of the key economic role played by top corporate managers there is a great deal
of interest in how the managerial labor market functions in general, and in the causes and
consequences of managerial succession in particular. An extensive scientific literature has
evolved on the determinants of top management turnover and stock price reactions to turnover
events. Much of this literature debates the effectiveness of corporate boards in monitoring
managerial behavior and in executing the critical functions of hiring and firing top managers. In
this paper, we contribute to the debate by examining the determinants of firm performance
changes ensuing from top management turnover.
There is a general consensus that the likelihood of management turnover is negatively
related to firm performance. Warner, Watts, and Wruck (1988), for example, find that firms with
low stock returns are more likely to change their CEO, President, or Board Chairman than are
other firms. Coughlan and Schmidt (1985) and Weisbach (1988) report similar results. Kim
(1996) derives a simple yet elegant model relating CEO turnover to performance and
demonstrates empirically that firm stock returns have a persistent negative effect on turnover
probability. Weisbach (1988) shows that a measure of industry-adjusted firm earnings is
negatively related to top management turnover, as well. Overall, previous results are consistent
with the proposition that boards of directors monitor corporate performance and act to replace
managers of poorly performing firms.
1 The figures on revenues, assets, and employment are fiscal year 2000 figures obtained from the Compustat Research Database.
2
The evidence on the consequences of the managerial succession decisions made by
directors is not so clear. Nearly all of this evidence comes from event studies of the stock market
reaction to news about top management turnover. Unfortunately, the underlying theory
pertaining to succession events lacks sufficient structure to provide unambiguous predictions
about stock price reaction to turnover news. One might argue, for example, that turnover
presages improved management and higher cash flow. Firm value, therefore, should increase on
the news of management turnover. It is also plausible, however, that turnover signals that recent
management decisions have proven unsound. To the extent that investors did not know about
management’s poor performance, firm value may fall on the news of management turnover.
This can occur even if investors believe that the incoming manager will be superior to the
outgoing manager. Hence, it is not surprising that the results of event studies on management
turnover are mixed. Though Bonnier and Bruner (1989) and Weisbach (1988) observe
significantly positive stock price reactions to turnover news, Khanna and Poulsen (1995) find
just the opposite result. Reinganum (1985) and Warner, Watts, and Wruck (1988) report small,
statistically insignificant price changes associated with the event. On balance, the event study
evidence suggests that investors believe that corporate boards promote beneficial changes
through their management succession decisions. This evidence is not, however, especially
compelling.
Despite the potential importance of managerial succession decisions made by corporate
boards, there is very little direct evidence regarding the subsequent outcomes of these decisions.
Stock price reactions around the time of management turnover reflect investors’ expectations
regarding these outcomes but do not reveal the outcomes themselves. Weisbach (1995) shows
that CEO turnover prompts firms to divest poorly performing business units. However, only
Hotchkiss (1995) and Denis and Denis (1995) examine the relation between turnover and
subsequent changes in operating performance measured using accounting numbers.
Hotchkiss analyzes 197 firms that emerge from Chapter 11 bankruptcy. She finds that
firms where the prebankruptcy management retains control are more likely to file for a second
bankruptcy, and to have negative operating income after reorganization. Her evidence indicates
that management turnover improves future performance. We can not draw general conclusions
about turnover from these results, however, because her sample includes only extremely poorly
performing firms.

3
Denis and Denis (1995) study 908 management succession events occurring between
1985 and 1988. For each event, they analyze the operating rate of return on total assets (OROA)
over the seven-year period centered on the year management changed. They find that average
and median industry-adjusted OROA increase over periods starting one year before, and ending
two or three years after, the management change. Performance improvements appear to be
somewhat larger in cases where directors force managers out than where managers retire under
normal circumstances. Performance, nevertheless, improves in both cases.
The results reported by Denis and Denis (1995) suggest that management turnover tends
to enhance corporate performance. Moreover, the results are consistent with the notion that
positive abnormal stock returns observed by some researchers around succession events reflect
rational anticipation by investors of subsequent firm performance improvements. Several issues,
however, remain unresolved. First, the time period spanned by the Denis and Denis (1995)
sample is very short and corresponds with a period of a very active takeover market (Comment
and Schwert (1995), Huson, Parrino, and Starks (2001)). It is unclear whether the relations they
find apply to other time periods. Second, Denis and Denis (1995) rely on unadjusted OROA and
industry-adjusted OROA to measure performance changes. Hence, performance improvements
they observe may be due to mean-reversion of the accounting performance time series rather
than management turnover.2 Finally, Denis and Denis (1995) contrast forced resignations and
normal retirement but do not further analyze the determinants of turnover-related firm
performance changes nor do they provide evidence on the relation between performance changes
and turnover announcement stock returns.
In this paper, we extend the research on post-turnover performance in several ways.
Denis and Denis (1995) discuss the importance of monitoring by influential shareholders and the
external takeover market in precipitating CEO turnover. In turn, we examine the actual
empirical relation between institutional shareholdings, firm-related takeover activity, successor
CEO origin, board composition, and post-turnover performance. We ask also if other publicly
available information helps to predict performance changes. We use the turnover announcement
abnormal stock return as a proxy for publicly available information about the turnover.
2 Denis and Denis (1995) comment on this possibility. They address it only indirectly, however. See page 1045 of their paper.

4
Modeling firm performance as a function of managerial quality and chance, we develop
predictions about the cross-sectional relation between performance improvements and firm or
succession characteristics such as board composition, ownership structure, and external takeover
activity. We test these predictions using several approaches, including cross-sectional
regression. In our empirical work, we study a longer time period than Denis and Denis (1995)
and report results using the performance-based control group matching method advocated by
Barber and Lyon (1996). This method controls for potential mean reversion of the accounting
performance time series, which may affect measures of performance change around management
turnover events. Moreover, using this method in conjunction with unadjusted and industry-
adjusted performance measures allows us to differentiate between post-turnover performance
changes attributable to firm- and industry-specific chance components and changes in
managerial quality. We are able to directly estimate the performance changes that are
attributable to changes in management quality. Finally, we employ econometric methods that
control for the survival bias encountered when examining determinants of post-CEO turnover
performance changes.
Our results support the view that deteriorating firm performance triggers management
turnover. On average, unadjusted, industry-adjusted, and control group-adjusted OROA exhibit
statistically significant declines from three years before through one year before the turnover
year. We find also that average control group-adjusted OROA increases significantly from one
year before to three years after the turnover year. This latter result tends to refute the notion that
observed firm performance improvements are attributable to mean reversion of accounting
performance time series. Instead, these improvements seem to stem from the management
turnover and improved managerial quality.
Our cross-sectional analyses indicate that post-turnover changes in firm OROA are
positively related to institutional ownership share and are greater when successor CEOs are firm
outsiders than when they are insiders. There is also some evidence that performance changes
may be positively influenced by external takeover pressure. We find no reliable difference
between post-turnover performance changes for forced and voluntary successions, however, nor
do we find a simple relationship between performance changes and board composition.

5
We examine also the connection between performance changes and turnover
announcement abnormal stock returns. The evidence shows that announcement date abnormal
returns are significantly positively related to subsequent changes in firm operating performance.
Indeed, in multiple regressions abnormal return is significant when included with the structural
variables we consider. This result suggests that investors use information beyond that contained
in the structural variables to forecast turnover-induced performance changes.
The rest of the paper proceeds as follows. Section 2 discusses the theories and
hypotheses that we examine. The data are described in Section 3 and the empirical evidence is
presented in Section 4. Finally, the conclusions and implications are discussed in Section 5.
2. Theory and hypotheses We model firm performance as a function of managerial quality and chance, as in Kim
(1996). Let πt and qt denote firm performance and manager quality, respectively, for some time
period t. Chance is represented by the zero mean random variable εt, which is independently
distributed through time. This implies that luck is transitory.
We assume that
E(πt|qt) = qt , and [1]
πt = qt + εt [2]
Expected performance is related positively to quality. Given quality, however, actual
performance outcomes are influenced by luck. Thus, changes in firm performance may result
from changes in manager quality, luck, or both. Formally,
(πt+1 - πt) = (qt+1 - qt) + (εt+1 - εt), and [3]
E(πt+1 - πt|qt+1, qt, εt) = (qt+1 - qt) - εt [4]
Hence, the performance change at time t+1 tends to be negatively related to luck at time t. The
chance-driven component of performance is mean-reverting.

6
2.1. Forced Turnovers 2.1.1. Forced Turnovers: Improved management hypothesis
The improved management hypothesis holds that forced management turnover tends to
increase managerial quality and therefore expected firm performance. Under this hypothesis,
quality, which is not directly observable, varies across managers. Firm directors attempt to infer
quality from realized performance. If performance is sufficiently poor, the board infers that the
incumbent manager is of low quality and that the expected benefit of replacing him exceeds the
expected cost. Another manager is installed whose expected quality exceeds that of his
predecessor. Moreover, poor performance tends to coincide with bad luck as well as low
manager quality. Thus, future performance is expected to increase following the change in
management for two reasons: the expected increment in manager quality is positive and manager
luck is expected to revert to normal.
2.1.2. Forced Turnovers: Scapegoat hypothesis The scapegoat hypothesis is based on the agency models of Hölmstrom (1979), Shavell
(1979), and Mirrlees (1976). The hypothesis holds, in contrast to the improved management
hypothesis, that quality does not vary across managers. Poor performance under the scapegoat
hypothesis arises from chance alone rather than low managerial quality. In other words, poor
performance results from bad luck, not bad management. Under the scapegoat hypothesis,
managers are all alike but supply quality as a function of effort, which is not directly observable.
Managers dislike effort so they must be threatened with dismissal if performance is low. In
equilibrium, all managers supply the same effort (quality) and only those who are unlucky are
fired. Boards of directors understand that all managers are alike, but must fire managers of
poorly performing firms to induce other managers to provide the desired level of effort.
Since replacement candidates only equal the quality of the outgoing manager, the
turnover itself does not increase managerial quality or expected firm performance.
Consequently, a manager who is fired for poor performance can be viewed as a scapegoat. Even
though turnover does not increase managerial quality, the expected change in firm performance
following turnover is positive. This is because turnover is triggered by improbably small
performance outcomes arising from chance. Subsequent performance should revert to mean
levels.

7
2.2. Voluntary Turnovers Voluntary turnovers may arise in the course of normal CEO retirement due to age or, for
example, when a CEO leaves to manage another firm or a government agency. Such turnovers
need not be associated with poor prior performance. We do not suppose that CEOs who leave
voluntarily are necessarily of low quality or recently ill fated. Moreover, the board may appoint
the highest expected quality candidate available to succeed a manager who departs voluntarily
but this does not ensure that expected managerial quality increases. It may decrease. For these
reasons, changes in expected firm performance after voluntary turnovers should be smaller than
those after forced turnovers.
2.3. Determinants of turnover related performance changes If quality does not vary across managers and CEOs are scapegoats, then the only
performance changes we expect to see following turnover arise solely from mean reversion.
Expected performance improvements for turnover firms should equal those for other firms with
similar past performance. Under the assumption that quality varies across managers, however,
we can extend our discussion to incorporate determinants of the magnitude of the performance
improvement that we might observe from voluntary and forced turnover.
Most top management appointees are selected from among firm insiders, those who are
already senior officers of the firm. However, this is not always the case. The decision to
promote an insider or hire an outsider depends on the abilities of inside and outside candidates.
Dalton and Kesner (1985) argue that outsiders will not be appointed unless an incremental
improvement relative to inside candidates is expected because it is more costly to appoint an
outsider.
Chan (1996) discusses the effects on insider incentives of including external candidates in
competition for high positions within a firm. He explains that increasing the number of
candidates in this way can reduce the incentives of lower level executives to exert effort. This is
because the marginal effect of effort on the probability of winning the competition is negatively
related to the number of contestants. Chan (1996) argues that, to mitigate the negative incentive
effect of open competition, the firm may award a competitive handicap to inside candidates.
Consequently, a greater increment to expected managerial quality would be required to induce
the appointment of an outsider than of an insider. This implies larger increases in expected firm

8
performance following the succession of an outsider than the succession of an insider.
Moreover, Borokovich, Parrino, and Trapani (1996) report that turnover announcement abnormal
stock returns are significantly positive for outside successions, and significantly negative for
inside successions around forced turnover. This suggests that the appointment of an executive
from outside the firm is perceived as more beneficial to stockholders than an inside appointment.
Takeover pressure may also affect manager replacement decisions. Internal monitoring
can be affected by external factors through the market for corporate control. For example,
Mikkelson and Partch (1997) show that management turnover rates are more sensitive to firm
performance during periods of heightened takeover activity. While other researchers (e.g.,
Huson, Parrino, and Starks (2001)) do not find a relation between turnover rates and takeover
activity, it remains possible that outside takeover pressure motivated by potential performance
improvements puts pressure on the board to make changes or risk the loss of their board
positions and damage to their labor market reputations. The high cost of the takeover market as
a disciplinary mechanism suggests that takeover pressure will only be observed when the
potential gains are substantial. Therefore, if takeover pressure influences board decisions we
expect to observe larger improvements following turnover associated with takeover pressure.
Characteristics that influence the effectiveness of internal monitoring mechanisms may
operate in two ways. Better monitoring may result in the appointment of superior replacement
CEOs. Other things equal, this would produce larger managerial quality increments and larger
expected performance improvements. Better monitoring, however, also may permit more rapid
and accurate assessments of incumbent manager quality. As a consequence, relatively small
managerial deficiencies may be detected and prompt turnover. In such cases, there would be
little room for quality increases and expected performance improvements would be small.
Conversely, weak monitors may allow a bad manager to perform very poorly before replacing
him, leading to a large quality increment and expected performance change. On balance,
therefore, the net effect of finer internal monitoring on expected performance improvements
following CEO turnover is ambiguous.
Evidence from prior studies indicates that internal monitoring is affected by board
composition. Weisbach (1988) and Borokhovich, Parrino, and Trapani (1996) report that outside
directors are more likely than inside directors to fire a poorly performing CEO and to replace

9
him with an executive who will increase firm value. Consequently, performance improvements
following management turnover may be related to the extent of outsider representation on the
board of directors.
Post-turnover performance changes may also depend on the structure of shareholdings.
As Shleifer and Vishny (1986) point out, large stockholders are likely to have greater incentives
to monitor management than do small stockholders. This is because the benefits that large
stockholders might receive from monitoring activities are more likely to exceed the costs that
they bear. Evidence consistent with this argument has been reported in several studies. For
example, Agrawal and Mandelker (1990, 1992) find a positive overall relation between stock
price reactions to announcements of antitakeover charter amendment proposals and the fraction
of firm equity held by outside block holders. Denis and Serano (1996) report evidence
suggesting that the outside block holders are instrumental in removing poorly performing
managers subsequent to failed takeover bids. Denis, Denis and Sarin (1997) show that the
probability of top executive turnover in general is positively related to the presence of such block
holders.
On the other hand, Demsetz and Lehn (1985) and Demsetz and Villalonga (2001) argue
that while agency costs may be greater with diffuse ownership there are benefits that can offset
these costs. They find no evidence of a systematic relation between ownership structure and firm
performance.
Many, including Black (1992) and Pound (1992), have contended that institutional
shareholders perform a monitoring function similar to that of blockholders. Assuming that
institutions increase the pressure on boards to make management replacement decisions that
serve stockholder interests, the quality of internal monitoring would be positively related to
institutional shareholdings. For the reasons noted above, however, the relation between
institutional shareholdings and turnover-related performance improvements is ambiguous.
3. Data 3.1. Sample
We begin by identifying all CEOs listed in the Forbes annual compensation surveys over
the 1971-95 period who have held their position for one year or less. This provides a list of

10
CEOs who recently entered office. From this list, we construct our turnover sample that consists
of 1,344 CEO successions at large public firms between 1971 and 1994 that satisfy the following
criteria:
1) the incumbent and successor were both profiled in the Forbes annual compensation surveys;3
2) the Wall Street Journal reported the succession announcement;
3) accounting data for the firm are available on the Standard and Poor’s Compustat database beginning in the year after the incumbent became CEO; and
4) the succession was not directly related to a takeover.
Information on the CEO’s age, tenure in office, and tenure with the firm was obtained
from the Forbes surveys and confirmed by the Wall Street Journal announcements, various
Marquis Who’s Who publications, and Dun and Bradstreet’s Reference Book of Corporate
Managements. Because the Forbes annual compensation surveys report the compensation of the
highest paid official, regardless of titles held, the Wall Street Journal announcements were used
to confirm the date that a change in the individual holding the CEO title was announced. The
reason for each succession was obtained from the Wall Street Journal announcement and a
review of the business and trade press.
Each succession is classified as either forced or voluntary. If the Wall Street Journal
(WSJ) reported that the CEO was fired, forced from the position, or departed due to policy
differences, the succession is classified as forced. If the departing CEO was under the age of 60,
we tentatively classified the succession as forced if the WSJ announcement did not report the
reason for the departure as death, poor health, or the acceptance of another position (elsewhere or
within the firm). Similarly, we tentatively classified the succession as forced if the departing
CEO was under 60 and the WSJ reported that he was retiring, but did not announce the
retirement at least six months in advance. Those cases tentatively classified as forced were
further investigated by searching the business and trade press for relevant articles to reduce the
incidence of classification errors. These successions are reclassified as voluntary if the
incumbent took a comparable position outside his former firm or departed for personal or
business reasons that were unrelated to the firm's activities.
3 This criterion is not strictly met in all cases. In several instances a CEO was appointed and relinquished the position before the next compensation survey was published. These CEOs were identified from the succession announcements published in the Wall Street Journal.

11
We also designate successor CEOs as being either insiders or outsiders to their firms.
New CEOs who had been with their firms for one year or less at the time of their appointments
are classified as outsiders. All other CEOs are classified as insiders.
In addition, successions are classified according to the extent of external takeover
pressure and corporate control market activity. We examined the Wall Street Journal Index for
evidence of events related to corporate control and takeovers at each firm during the 12 months
immediately preceding the turnover announcement. A succession is classified as subject to
takeover pressure if during this period there was a proxy fight, takeover bid, or rumors of a bid
involving the firm. If the firm adopted a poison pill or other takeover defense, if there was a
board shakeup or a stock acquisition requiring a 13D filing, or if some other similar event
occurred, the succession is classified as subject to takeover pressure, also.
The composition of the board of directors in the succession year was obtained from the
Dun and Bradstreet Million Dollar Directory, Moody’s Industrial, Banking and Financial,
Transportation, and Utilities manuals, and proxy statements. All directors who were employees
of the firm are classified as insiders. Two different classification schemes were used to identify
outside directors. In the first scheme, the proxy statement immediately preceding each
succession was used to identify non-employee directors who were former officers, consultants,
commercial bankers, investment bankers, lawyers, insurance company executives, or were
related to an officer of the firm. All non-employee directors falling into one of these categories
are classified as greys (potentially affiliated directors). All other non-employee directors are
classified as outsiders. This classification scheme is similar to those used in other studies such as
Weisbach (1988) and Byrd and Hickman (1992). Unfortunately, due to the difficulty of
obtaining corporate proxy statements for the time period prior to 1978, we were only able to
obtain data from proxy statements for a subset of 876 turnovers that took place in 1978 or later.
We employed a second, simpler classification system, using data from the Million Dollar
Directory, to obtain board composition estimates for the full 1971 to 1994 sample period. Under
this second approach, directors are classified as insiders if they were officers of the firm and
outsiders otherwise.
Information on the stock ownership of CEOs, Officers, and Directors also was taken from
proxy statements for 876 turnovers. In addition, the CDA/Spectrum database was used to

12
determine institutional ownership as of the end of the quarter immediately preceding the 737 of
the turnovers that occurred after 1979.
Financial data for the seven-year period centered on the turnover year were obtained from
Standard and Poor’s Compustat files. We collected accounting numbers for each full year that
an incumbent CEO was in office. These data are used to calculate several performance
measures: the ratios of operating income to book assets (OROA) and to sales (OROS). For some
of our tests we adjust the performance measures for industry effects. Both of the accounting
return measures also were analyzed using the performance-based control group matching method
described by Barber and Lyon (1996).
To control for industry effects, the accounting return measures are adjusted by
subtracting the median value of the corresponding measure for all firms in the primary two-digit
SIC industry in which the firm was active at the time of the succession. A two-digit industry
definition is used because Clarke (1989) has shown that the two-digit definition captures
similarities among firms as well as industry definitions based on three- or four-digit SIC
groupings.
For both OROA and OROS the Barber and Lyon (1996) matching method is performed
as follows. Each sample firm is matched to comparison firms with the same two-digit
Compustat SIC code whose performance measures over the year before the turnover are within
+/- 10% of the sample firm’s performance. If there are no firms with such similar performance
with the same two-digit SIC code, we match performance within the +/- 10% filter using all
firms with the same one-digit SIC code. For firms without matches after this procedure, we use
all firms with performance within the filter bounds regardless of SIC code.4 Each sample firms’
performance is adjusted by subtracting the median performance of its control group. Changes
over time in adjusted performance are then calculated. This procedure is intended to isolate the
4 In all but 1% of the cases for OROA, the comparison firms and sample firm have the same one-digit SIC code. Slightly over 91% of the cases are industry-matched at the two-digit level. For OROS, 98% match at the one-digit level and 81% at the two-digit level.

13
component of performance change due to management turnover from that attributable to mean
reversion of industry or firm specific factors.5
Our data span a longer time period and include a larger number of CEO turnover events
than the data used by Denis and Denis (1995). They study turnover events occurring from 1985
through 1988. Our sample covers the 24 years from 1971 through 1994. Denis and Denis
examine a sample of 908 “management changes,” defined to include turnover involving the
Chairman, CEO, or President, and 353 “top management changes,” where the top executive is
defined to be the CEO if there is one and the Chairman otherwise. Due to data limitations, the
numbers of observations in the sub-samples they actually use to estimate the changes in
operating income are smaller, including only 721 management changes and 296 top management
changes. In contrast, our sample includes 1,344 CEO changes and we have sufficient data to
estimate post-CEO turnover changes in OROA for 1,002 of these turnovers (see Table 2).
One other distinction between our sample and that used by Denis and Denis is that our
sample consists of firms that are large enough to merit inclusion in the Forbes compensation
surveys. Each year the Forbes compensation survey covers the 800 largest firms in the United
States. The Denis and Denis sample, on the other hand, includes smaller firms. We believe that
turnover at large firms is especially interesting because, as suggested at the beginning of this
paper, these firms represent the bulk of the market value of public corporations in the United
States. Turnover decisions at these firms potentially have the greatest impact on aggregate
wealth.
3.2. Methodology
This study uses the limited information maximum likelihood method described by
Heckman (1979) to control for potential selection bias in an analysis of determinants of post-
turnover performance. A potential selectivity problem arises in the estimation of an ordinary
least squares (OLS) regression with post-turnover operating performance as the dependent
variable and CEO and other firm characteristics as independent variables because the sample is
censored. Data are not available to estimate this regression for all CEO turnover observations
5 We also follow a similar procedure using groups of comparison firms approximately matching the average performance of sample firms over the three years prior to the turnover. We examine adjusted performance using these groups in some of the tests discussed in section 4. However, the results are similar to those using one-year performance matching so we do not report them in detail.
14
since some firms do not survive through the end of the post-turnover performance measurement
period. The characteristics of the surviving firms and their CEOs may differ systematically from
the characteristics at firms that do not survive.
Heckman characterizes the sample selection problem as a special case of the omitted
variable problem in which the inverse Mill’s ratio (IML) is the omitted variable in the OLS
regression. Use of the two-step Heckman procedure allows us to obtain consistent estimates for
determinants of post-turnover firm performance. A probit model, in which the dependent
variable equals one if the firm survived the entire post-turnover performance measurement
period and zero otherwise, is first used to estimate the IML where
( ( / ))IML .1 ( ( / ))
i
i
xx
φ β σβ σ
′−=′− Φ −
[5]
In equation [5], φ and Φ represent the density and cumulative density functions of the standard
normal distribution, respectively, ix′ is a vector that contains observations for the explanatory
variables predicting whether a firm that experiences CEO turnover will survive through the post-
turnover measurement period, β is the vector of coefficient estimates from the probit regression,
and σ is the standard deviation for the residuals from the probit regression. The second step of the
Heckman procedure is to simply estimate the OLS regression with the IML as an explanatory
variable.
4. Empirical Results Table 1 contains summary statistics for the sample of CEO successions occurring from
1971 through 1994. As the table shows, the median outgoing CEO is 63 years old and has held
his position for 7.5 years. Most often, he leaves voluntarily. Just 16% of the successions are
classified under our procedures as forced and in only 7% is takeover pressure apparent. The
median successor CEO is 53 years old and has been with the firm slightly over 19 years.
However, 19% of successors are outsiders.
Table 1 also shows that sample firms are typically quite large, with the median firm
having more than $1.7 billion in annual sales, $2.3 billion in assets, and 16,000 employees.
Outsider dominated boards are prevalent in this sample. Three quarters of the directors on the
15
median board are outsiders. Also, though not shown in the table, approximately 17% of the
sample firms have a board with fewer than 60% outsiders.
Institutional shareholders are prominently represented in the sample, as well. Institutions
hold over 46% of the typical sample firms' stock and at least 30% of the stock in more than 75%
of the firms. In most cases, however, individual institutions do not hold large blocks of stock. In
more than half of the firms, no institution holds as much as 5%.
Figures 1, 2, and 3 plot sample median operating return on assets (OROA) over the
period from three years before to three years after the CEO turnover. Figure 1 plots the median
unadjusted OROA series. Figures 2 and 3 show the median industry-adjusted and median
control group-adjusted series. Separate plots are shown for forced and voluntary turnovers, and
for the combined sample. The figures suggest that top management turnover follows a period of
deteriorating firm performance and that performance tends to improve subsequently. This is
most clearly apparent for forced turnovers and for the control group-adjusted measures.6
In Table 2 we report mean and median changes in OROA over the three-year periods
preceding and succeeding CEO turnover events.7 Panel A shows the mean and median
unadjusted changes while Panels B and C show mean and median changes in industry-adjusted
and control group-adjusted OROA, respectively. The results in the table confirm the impression
gained from the figures. Turnover follows declining performance. For all turnovers combined,
mean and median changes in OROA from year -3 through -1 are negative and significant at the
1% level. These changes are also negative and highly significant in all cases for forced
turnovers. For voluntary turnovers, the pre-turnover mean change in industry-adjusted OROA is
significant at only the 10% level. However, the mean changes in unadjusted and control group- 6 Plots of median operating return on sales display similar patterns. 7 In calculating the averages and related test statistics, we exclude extreme observations that differ in absolute value from the mean unadjusted, industry-adjusted, or control group-adjusted OROA by more than three times the standard deviation of the respective distribution. The screens are implemented as follows. First, raw, industry adjusted, and control group-adjusted OROA are computed for each turnover observation for years –3 to +3. All observations more than three standard deviations from the mean of its respective OROA distribution (outliers) are then excluded from the sample and performance changes are computed. Performance changes cannot be computed for all remaining observations because either 1) data are not available to calculate the adjusted performance changes or 2) data are not available to compute the unadjusted performance at both the beginning and end of the measurement period. The screens result in the loss of 19 (5 positive, 14 negative), 24 (10 positive, 14 negative), and 39 (13 positive, 26 negative) unadjusted, industry-adjusted, and control group-adjusted OROA observations for the –3 to −1 period, respectively. The corresponding losses for the –1 to +3 period are 15 (8 positive, 7 negative), 23 (13 positive, 10 negative), and 22 (14 positive, 8 negative) observations, respectively. Without these screens, the empirical evidence is qualitatively similar to that reported below.
16
adjusted OROA for this group are significantly negative at the 1% level. Furthermore, the pre-
turnover median changes are all negative and significant at the 5% level for voluntary turnovers.
The change in OROA from year -1 to +3 measures the performance change following the
turnover. Looking at all turnovers, we find no significant increase in mean or median unadjusted
OROA, but mean industry-adjusted and control group-adjusted performance increase by 0.3%
and 0.9% (t-statistics of 1.82 and 5.20, respectively). The corresponding median increases are
smaller, but are also positive and significant at the 5% level. Following voluntary turnovers the
mean change in unadjusted OROA from year -1 to year +3 is -0.5% (t-statistic = -2.25).
Industry-adjusted operating performance over the same period does not change significantly but
the increases in the mean and median control group-adjusted performance, of 0.9% and 0.3%,
respectively, are both significant at the 1% level. For forced turnovers, the mean unadjusted and
industry adjusted changes in OROA from year -1 to year +3 are both 1.1% while the control-
group adjusted performance change is 1.3%. All of these values are significant at the 10% level
(t-statistics of 1.86, 2.03, and 2.23, respectively). The median unadjusted and industry-adjusted
changes for forced turnovers are also positive and significant at the 5% level while the median
control group-adjusted change is insignificantly different from zero.
By comparing the unadjusted, industry-adjusted, and control group-adjusted OROA
changes we can separate the unadjusted performance change into constituent parts. Recall from
equation [2] that unadjusted performance πt is the sum of managerial quality qt, plus fortune εt.
Fortune, in turn, can be thought of as the sum of an industry shock and a firm (or manager)
specific shock. Let
εt = industry shock + firm shock = it + ft, where both it and ft are mean zero,
independently and identically distributed. [6]
It follows that change in unadjusted performance is given by
πt+1 - πt = ∆π = ( qt+1 - qt ) + ( it+1 - it ) + ( ft+1 - ft ) = ∆q + ∆i + ∆f. [7]
Let the superscript m denote the median industry firm and suppose median firm managerial
quality does not change over the comparison periods. We also assume that the median
performing firm has neutral firm-specific luck. Therefore
∆qm = fmt+1 = fm
t = 0 and [8]

17
∆πm = ∆i [9]
Under these assumptions, the industry-adjusted OROA measure approximately purges the
performance change of the change in industry shock
∆π - ∆πm = ∆q + ∆f. [10]
Similarly, the control group-adjusted measure removes changes in both shocks, leaving only the
change in quality. To see this, let superscript c denote the median performing firm in the
performance-matched control group. We assume again that the median control group firm
experiences no change in managerial quality over the interval. The control group is matched by
industry and performance to the subject firm, so the industry shocks and time t firm-specific luck
match as well. Therefore,
∆qc = 0, ∆ic = ∆i, and fc
t = ft. [11] Under these assumptions, the change in control group-adjusted performance is given by ∆π – ∆πc = ∆q + ( ft+1 - ft ) - ( fc
t+1 – fct ) = ∆q + ( ft+1 - fc
t+1 ) [12] and E( ∆π – ∆πc ) = ∆q [13]
Equations [7], [10], and [13] indicate that the unadjusted change, the industry-adjusted
change, and the expected value of the control group-adjusted change in OROA equal, ∆q + ∆i +
∆f, ∆q + ∆f, and ∆q, respectively. We can use these results to decompose the unadjusted
performance changes in Table 2 into quality changes, industry shocks, and firm-specific shocks.
For example, we observe that for all turnovers the mean change in control group-adjusted OROA
from year –1 to year +3 is 0.9%, which measures the average change in quality. The unadjusted
change is –0.3%, which includes the chance components. The difference, -1.2%, measures
changes in both the industry and firm specific shocks. We also observe that the mean industry-
adjusted change in OROA is 0.3%. The difference between this and the control group-adjusted
change can be attributed to the change in firm specific shock. This difference is –0.6%.
Therefore, the results indicate that turnovers are, on average, followed by increases in managerial
quality (0.9%), which are slightly more than offset by industry (-0.6%) and firm specific (-0.6%)

18
shocks. On average, forced turnovers appear to be followed by increased managerial quality
(1.3%) and smaller firm-specific (-0.2%) and industry (0.0%) shocks.
Overall, the evidence is consistent with worsening performance preceding turnovers and
managerial quality improvements following turnovers. The change in performance preceding
voluntary turnovers is, as expected, smaller in absolute value than that preceding forced turnover.
After voluntary turnovers, the evidence suggests further deterioration in performance (unadjusted
OROA), but improved managerial quality (control-group adjusted OROA). For forced
turnovers, the evidence is consistent with poor performance preceding turnovers and
performance improvements following turnovers for the three performance measures. These
results tend to reject the scapegoat hypothesis in favor of the improved management hypothesis.
In contrast to Denis and Denis (1995), we find only modest evidence that industry-
adjusted OROA increases after management turnover. We computed statistics for post-turnover
changes in unadjusted, industry-adjusted, and control group-adjusted OROA for the 1985-88
period examined by Denis and Denis (1995) and for all other years in our sample period to
investigate the differences between the evidence we report and that reported by Denis and Denis
(1995). Table 3 shows these statistics for all turnovers, and for voluntary and forced turnover
sub-samples.
The evidence in Table 3 shows that the changes in industry-adjusted OROA after CEO
turnover are significantly higher from 1985 to 1988 than during the other years in our sample
period. For all turnovers, the mean and median changes in industry-adjusted OROA are 1.2%
and 0.6%, respectively, and statistically significant for the 1985-88 period. In contrast, both the
mean and median changes in industry-adjusted OROA differ insignificantly from zero over the
rest of the sample period. Among forced turnovers industry-adjusted performance changes differ
insignificantly between the two time periods. The results for voluntary turnovers, however, are
very similar to those for the sample as a whole. This evidence suggests that the strong positive
overall changes in industry-adjusted performance reported by Denis and Denis (1995) may be
unique to the period they studied.
Examination of changes in the control group-adjusted performance measures indicates
that managerial quality improvements also were greater during the period studied by Denis and
Denis (1995). However, our results here are not driven entirely by the 1985-88 period. The
19
changes in the mean control group-adjusted performance for the other years covered by our
sample period are all positive and statistically significantly greater than zero.
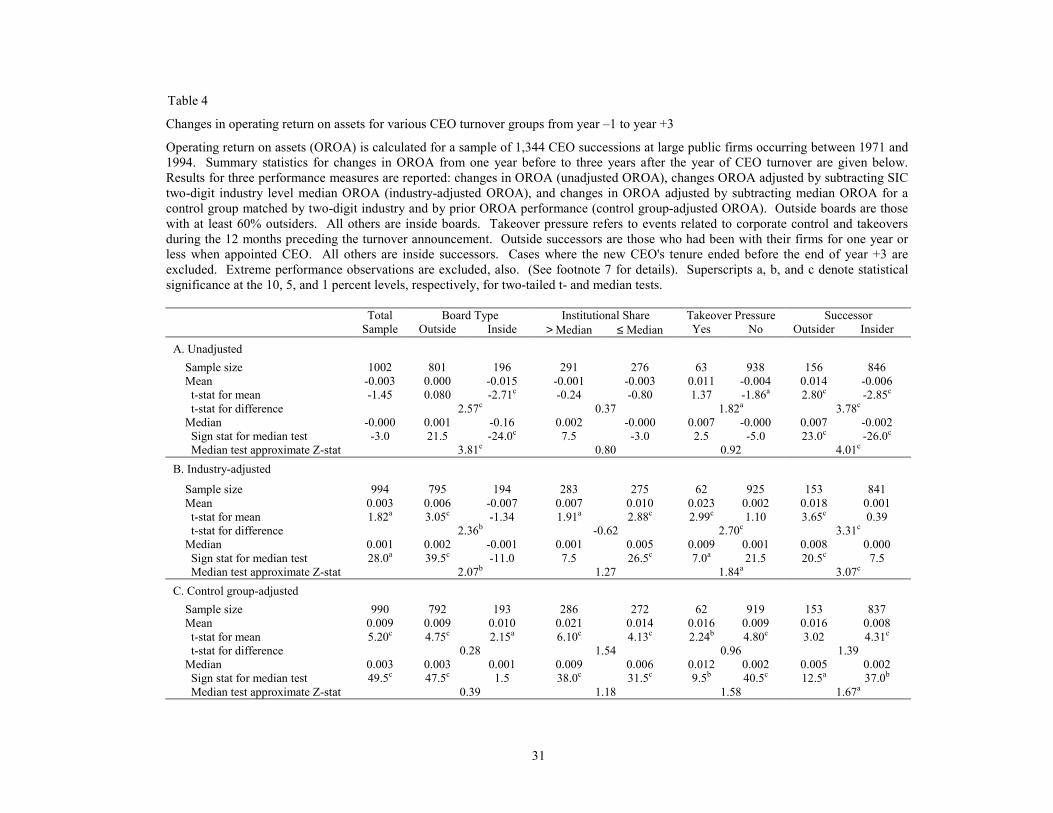
Table 4 presents evidence on the influence of board composition, institutional ownership,
external takeover activity, and successor origin on changes in OROA around CEO turnover
events. Simple paired comparisons of average changes in OROA from one year before to three
years after turnover are presented. Specifically, we compare mean and median changes at firms
with outsider-dominated boards to those at other firms. We define an outsider-dominated board
as one with at least 60% outsiders.8 We also compare changes at firms with greater than the
sample median level of total institutional share ownership (46.7%) to those with less. In
addition, we report mean and median OROA changes for firms subject to takeover pressure
during the 12 months preceding turnover and contrast them with mean and median changes for
firms not subject to such pressure. Finally, we examine the changes at firms where the successor
CEO is an outsider and compare them to changes where the successor is an insider.
Recall that the improved management hypothesis predicts that firm performance changes
should be greater where an outsider is appointed CEO and where takeover pressure is present.
The effects of board composition and institutional share ownership, however, are ambiguous.
Under the scapegoat hypothesis performance improvements are unrelated to board composition,
ownership structure, successor origin, or takeover pressure.
Panel A of Table 4 reports the comparisons for unadjusted performance changes. Panels
B and C contain the figures for industry-adjusted and control group-adjusted changes,
respectively. Mean and median unadjusted and industry-adjusted changes in OROA are
significantly greater for CEO successions where outsiders dominate the board than elsewhere.
Takeover pressure appears also to have a positive impact on mean and median unadjusted and
industry-adjusted changes in OROA following management turnover. Moreover, contrary to the
scapegoat hypothesis, changes in all three of the performance measures are greater where an
outsider is appointed CEO than where an insider is appointed. For the mean and median
unadjusted and industry-adjusted performance measures, the differences are statistically
8 The tables report results based on data from the Million Dollar Directory and the simple scheme for classifying directors described in section 3. We have also performed tests using proxy statement data and the alternative, more complex, classification scheme also described in the section. Our conclusions are the same for both methods of classifying directors.
20
significant at the 1% level. For the control group-adjusted measure, the difference in the median
change is significant at the 10% level. These results generally are consistent with the improved
management hypothesis.
Table 5 follows the same format as Table 4, but contains results for the sub-sample of
forced turnovers only. For this reason the sample sizes are much smaller than are those for the
comparisons in Table 4. None of the tests reported in Table 5 indicate statistically significant
differences between the average firm performance changes for the various groups based on board
composition, takeover pressure, and successor origin. However, the median differences for
institutional ownership are significant at the 10% level for the unadjusted and control group-
adjusted measures. This evidence is consistent with the improved management hypothesis.
Overall, Tables 4 and 5 contain only relatively weak evidence that there are reliable
relations between performance changes and the corporate governance characteristics (board
composition and institutional share). One possible explanation is that firms with superior
governance do not let performance deteriorate much before taking corrective action. Under this
scenario, the potential performance improvements for such firms would be small. Firms with
bad governance characteristics would have relatively worse pre-turnover performance but may
be unable to select good replacement CEOs. Consequently, their performance improvements
would also be small.
To test this explanation we examine the pre-turnover performance of our sample firms
based on the groupings in Tables 4 and 5. Consistent with the explanation, firms with
institutional holdings above the median have significantly higher unadjusted and industry-
adjusted OROA in the year prior to turnover. This holds in general and for the forced turnover
sub-sample. Firms with outsider-dominated boards, however, have significantly lower
unadjusted and industry-adjusted OROA prior to turnover. Hence, the evidence is mixed.
We use also a multivariate regression framework to investigate the cross-sectional
determinants of firm performance changes following CEO turnover events. The two-step
method described by Heckman (1979) is used to obtain consistent estimates. Results for both the
binomial probit and OLS regressions are reported in Table 6. The probit regressions provide
evidence on the predictors of post-CEO turnover survival, but are estimated principally to obtain
the IML values used in the OLS regressions. In the OLS regressions, changes in OROA from

21
the year preceding turnover through three years after turnover (OROA(-1, +3)) are regressed on
dummy variables distinguishing forced successions, outside successors, outsider-dominated
boards, and the presence of prior takeover activity and on the fraction of shares held by
institutional investors and the two-day abnormal return around the turnover announcement.9
Controls for contemporaneous industry (IOROA(-1, +3)) and control firm (COROA(-1, +3))
performance, industry- and control group-adjusted OROA during the year prior to turnover, and
the natural log of assets are included along with IML in various regressions.
In all of the OLS regressions shown in Table 6 (columns 2, 4, and 6), the estimated
coefficients of the forced turnover and outside successor variables, though statistically
insignificant at conventional levels of confidence, are positive. This is consistent with the
improved management hypothesis and with the results in Tables 2 and 4. The estimated
coefficients for the outsider-dominated board variable are also positive in all OLS regressions
and are significant when we do not control for contemporaneous changes in control firm
performance. The estimated coefficient of fractional institutional share ownership, however, is
positive and significant in all of the regressions. This, the only truly robust result obtained for
the governance variables in these regressions, tends to support the improved management
hypothesis.
We also find strong evidence that the announcement period abnormal stock returns help
to predict performance changes. In each OLS regression, the estimated coefficient of abnormal
return is positive and significant at the 5% level, or better. These results suggest that positive
abnormal returns around turnover events reflect rational anticipation by investors of later firm
performance improvements. Given this interpretation, positive stock price reactions to turnover
news tend to support the improved management hypothesis. Consistent with this hypothesis, the
average announcement period abnormal return for 1,302 cases in our sample is 0.344%. The
associated t-statistic is 2.55, which is significant at approximately the 1% level.
9 Abnormal stock returns are estimated using the market model and return data from the Center for Research in Security Prices (CRSP) tapes. We regressed firm daily returns over the period from 300 through 50 trading days before WSJ turnover announcements on the contemporaneous returns for the equally-weighted CRSP index. The resulting estimated market model was then used to generate stock return prediction errors for the day of and day before the announcement of the management turnover. We sum these two daily prediction errors to obtain the announcement period abnormal return used in the regressions. The results reported are robust to using windows of (+50 , +300) and (-50, -300: +50, +300).

22
The regression results show that the estimated coefficients for abnormal return are
significant in regressions that include board composition, fractional institutional ownership, and
the other structural variables derived from theory. This implies that investors use information
beyond that contained in these variables to forecast firm performance following turnover.
We estimated several regression models in addition to those of Table 6. For example, we
considered models containing subsets of the variables shown in Table 6 as well as models that do
not contain the logarithm of assets. We substituted the fraction of outside directors on the board
for the outsider-dominated board dummy variable. Unadjusted, industry-adjusted, and control
group-adjusted OROS measures were examined, as well as the OROA measures. For the control
group-adjusted measures, we tried performance matching over three years before management
turnover instead of one year before turnover. The results of these numerous experiments add
little to those reported in Table 6.
In addition, we estimated logistic models of the probability that performance improves
(i.e., that the change in OROA is positive) after turnover. We do not report the results in detail
because they are similar in most respects to those discussed above.10 The evidence of a positive
relationship between performance improvement and outsider-dominated boards, however, is
somewhat stronger within the logistic framework than with the ordinary linear model.
We analyze further the relations between abnormal return, board composition, ownership
structure, external takeover activity, successor origin, and firm performance changes following
CEO successions. To examine potentially nonlinear relations between the variables, we first
extract residuals from regressions of changes in OROA on firm size, lagged adjusted
performance, and changes in industry or control firm OROA. Firms are ranked by their residual
performance changes and grouped into quintiles. We then compare across quintiles the
distributions of abnormal returns, institutional shareholdings, and of the dummy variables
distinguishing forced successions, outside successors, the presence of prior takeover activity, and
outsider-dominated boards.
In Table 7 we present the comparisons for groups of firms ranked by changes in OROA
after controlling for firm size, lagged industry-adjusted performance, and industry changes in
OROA. Consistent with the results in Table 6, announcement period abnormal returns increase 10 The results are available from the authors on request.
23
monotonically over the performance change groups. There is no apparent relationship between
performance ranking and the incidences of takeover activity, forced succession, institutional
holdings, and outsider succession.
The evidence in Table 7 suggests that the relation between performance changes and
board composition is not monotonic. The proportion of firms with outsider-dominated boards is
significantly greater for the middle performance change group than for either the highest or
lowest performance change groups. Neither the improved management hypothesis nor the
scapegoat hypothesis predicts this result. Institutional ownership is also not monotonic across
the performance change groups, however institutional shareholdings are highest in the firms with
the largest performance changes.
Table 8 contains the results for comparisons of firms ranked by changes in OROA after
controlling for firm size, lagged control firm-adjusted performance, and control firm changes in
OROA. Again, we observe a positive monotone relation between performance rank and
announcement date abnormal returns. We also observe significantly higher concentrations of
institutional ownership and outside succession in the highest performance change quintile. This
indicates that the turnover-related change in managerial quality is positively related to these
variables and tends to reject the scapegoat hypothesis. The relation between board composition
and control-firm adjusted performance changes exhibits the same puzzling inverted U pattern
observed in Table 7.
5. Conclusions
We find that firm financial performance tends to deteriorate prior to top management
turnover. This result is statistically significant and quite robust in our sample. Hence, the
evidence is consistent with that of Warner, Watts, and Wruck (1988) and Weisbach (1988). It
indicates that boards of directors punish poor performance by replacing CEOs. Like Bonnier and
Bruner (1989) and Weisbach (1988), we find also that statistically significantly positive average
abnormal stock returns coincide with management turnover announcements. Moreover, we
show that turnover announcement abnormal stock returns are significantly positively related to
subsequent changes in operating performance that are measured using accounting numbers. This

24
suggests that investors view turnover announcements as good news because they expect that
turnover will prompt performance improvements on average.
Our results on post-turnover performance changes are sensitive to the performance
measure employed. Unlike Denis and Denis (1995), we find only weak evidence that mean
industry-adjusted OROA increases significantly after the turnover. In our sample, the change is
positive, but significant only at the 10% level. The average change in unadjusted OROA for the
entire sample is actually negative. Average changes in control group-adjusted performance
measures, however, are positive and highly significant. We believe that the control group-
adjusted measures provide the most reliable basis for assessing post-turnover changes in
managerial quality. Hence, we are led to conclude that quality and expected firm operating
performance do increase after top management turnover. This tends to reject the scapegoat
hypothesis in favor of the view that turnover increases managerial quality.
We also investigated the cross-sectional determinants of post-turnover performance
changes. Simple pair wise comparisons suggest that institutional share holdings and outside
successor CEOs positively affect expected performance changes. These results are consistent
with the improved management hypothesis. The latter result, in particular, is inconsistent with
the scapegoat hypothesis.
Our multivariate regression point estimates also indicate positive effects of outside
successors on performance changes after top management turnover. This is consistent with the
improved management hypothesis, though the coefficients are not significant. In addition, we
find that institutional share holdings are significantly positively related to performance changes,
which tends to support the hypothesis, also.
One piece of unexpected evidence involves outside directors. Outsider-dominated boards
are less common among firms in the lowest and highest post-turnover performance improvement
groups than in the middle group. It is possible that outside directors influence firm behavior in
more complex ways than anticipated.
25
References Agrawal, Anup and Gershon Mandelker, 1990, Large shareholders and the monitoring of
managers: The case of antitakeover charter amendments, Journal of Financial and Quantitative Analysis, 25, 143-161.
Agrawal, Anup and Gershon Mandelker, 1992, Shark repellents and the role of institutional
investors in corporate governance, Managerial and Decision Economics, 13, 15-22. Barber, Brad M. and John D. Lyon, 1996, Detecting abnormal operating performance: The
empirical power and specification of test statistics, Journal of Financial Economics, 41, 359-399.
Black, Bernard S., 1992, Institutional investors and corporate governance: The case for
institutional voice, Journal of Applied Corporate Finance, 5, 19-32. Bonnier, Karl-Adam and Robert F. Bruner, 1989, An analysis of stock price reaction to
management change in distressed firms, Journal of Accounting and Economics, 11, 95-106. Borokhovich, K. A., R. Parrino, and T. Trapani, 1996, Outside directors and CEO selection,
Journal of Financial and Quantitative Analysis, 31, 337-355. Byrd, J. W. and K. A. Hickman, 1992, Do outside directors monitor managers? Evidence form
tender offer bids, Journal of Financial Economics, 32, 195-221. Chan, William, 1996, External recruitment versus internal promotion, Journal of Labor
Economics, 14, 555-570. Clarke, R. N., 1989, SICs as delineators of economic markets, Journal of Business, 62, 17-31. Comment, Robert, and G. William Schwert, 1995, Poison or placebo? Evidence on the
deterrence and wealth effects of modern antitakeover measures, Journal of Financial Economics 39, 3-43.
Coughlan, Anne T. and Ronald M. Schmidt, 1985, Executive compensation, management
turnover, and firm performance, Journal of Accounting and Economics, 7,43-66. Dalton, D. R. and I. F. Kesner, 1985, Organizational performance as an antecedent of
inside/outside chief executive succession: An empirical assessment, Academy of Management Journal, 28, 749-762.
Demsetz, Harold and Kenneth Lehn, 1985, The structure of corporate ownership: Causes and
consequences, Journal of Political Economy 93, 1155-1177. Demsetz, Harold and Belén Villalonga, 2001, Ownership structure and corporate performance,
Journal of Corporate Finance 7, 209-233.

26
Denis, David J. and Diane K. Denis, 1995, Firm performance changes following top
management dismissals, Journal of Finance, 50, 1029-1057. Denis, David J., Diane K. Denis, and Atulya Sarin, 1997, Ownership structure and top executive
turnover, Journal of Financial Economics, 45, 193-221. Denis, David J. and Jan M. Serano, 1996, Active investors and management turnover following
unsuccessful control contests, Journal of Financial Economics, 40, 239-266. Harnett, Donald L., 1982, Statistical Methods, 3rd ed., Addison-Wesley Publishing Company,
Reading, MA. Heckman, James J., 1979, Sample selection bias as a specification error, Econometrica 47, 153-
161. Holmström, Bengt, 1979, Moral hazard and observability, The Bell Journal of Economics, 10,
74-91. Hotchkiss, Edith Shwalb, 1995, Postbankruptcy performance and management turnover, Journal
of Finance, 50, 3-21. Huson, Mark R., Robert Parrino, and Laura Starks, 2001, Internal monitoring mechanisms and
CEO turnover: A long term perspective, Journal of Finance 56, 2265-2297. Khanna, Naveen and Annette B. Poulsen, 1995, Managers of financially distressed firms:
Villains or scapegoats?, Journal of Finance, 50, 919-940. Kim, Yungsan, 1996, Long-term firm performance and chief executive turnover: An empirical
study of the dynamics, Journal of Law, Economics, & Organization, 12, 480-496. Mikkelson, Wayne H. and M. Megan Partch, 1997, The decline of takeovers and disciplinary
management turnover, Journal of Financial Economics, 44, 205-228. Mirrlees, James A., 1976, The optimal structure of incentives and authority within an
organization, The Bell Journal of Economics, 7, 105-131. Pound, John, 1992, Raiders, targets, and politics: The history and future of American corporate
control, Journal of Applied Corporate Finance, 5, 6-18. Reinganum, M. R., 1985, The effect of executive succession on stockholder wealth,
Administrative Science Quarterly, 30, 46-60. Shavell, Steven, 1979, Risk sharing and incentives in the principal and agent relationship, The
Bell Journal of Economics, 10, 55-73.

27
Shleifer, Andre and Robert W. Vishny, 1986, Large shareholders and corporate control, Journal of Political Economy, 94, 461-488.
Warner, Jerold B., Ross L. Watts, and Karen H. Wruck, 1988, Stock prices and top management
changes, Journal of Financial Economics, 20, 461-492. Weisbach, Michael S., 1988, Outside directors and CEO turnover, Journal of Financial
Economics, 20, 431-460. Weisbach, Michael S., 1995, CEO turnover and the firm's investment decisions, Journal of Financial Economics, 37, 159-188.

28
Table 1
Summary statistics for a sample of CEO turnover events
Summary statistics describe a sample of 1,344 CEO successions occurring between 1971 and 1994. Outsider is a dummy variable that equals one if the successor CEO is with the firm for one year or less at the time of appointment and zero otherwise. Forced equals one where the prior CEO is forced from his position and zero otherwise. Takeover equals one if the firm was subject to takeover pressure within 12 months of the succession and zero otherwise.
Mean Median Std. dev. Minimum Maximum Observations
Successor CEO:
Age (years) 53.03 53.00 6.31 34.00 73.00 1,344
Years with firm when appointed CEO
17.69 19.04 13.22 0.00 50.08 1,344
Outsider 0.19 1,344 Outgoing CEO:
Age (years) 61.60 63.00 5.85 37.00 91.00 1,343
CEO tenure (years) 8.82 7.50 6.27 0.08 46.92 1,343
Share ownership 1.02% 0.20% 3.37% 0.00% 45.32% 887 Firm:
Sales ($ millions) 4,298.92 1,707.26 9,762.44 0.20 124,993.90 1,281
Assets ($ millions) 7,258.72 2,347.35 17,177.25 68.23 184,325.50 1,294
Employees 36,660 16,144 74,754 386 853,000 1,268
Outside directors 72.31% 75.00% 14.25% 0.00% 100.00% 1,329
Institutional ownership 44.79% 46.68% 18.67% 0.31% 87.34% 737 Succession characteristics:
Forced 0.16 0 1,344
Takeover 0.07 0 1,330

29
Table 2
Changes in operating return on assets around CEO turnover events Operating return on assets (OROA) is calculated for a sample of 1,344 CEO successions at large public firms occurring between 1971 and 1994. Mean (median) changes in OROA from three years before to three years after the year of CEO turnover are given below. Results for three performance measures are reported: changes in OROA (unadjusted OROA), changes OROA adjusted by subtracting SIC two-digit industry level median OROA (industry-adjusted OROA), and changes in OROA adjusted by subtracting median OROA for a control group matched by two-digit industry and by prior OROA performance (control group-adjusted OROA). Cases where the new CEO's tenure ended before the end of year +3 are excluded. Extreme performance observations are excluded, also. (See footnote 7 for details). Sample sizes, t-statistics, and median sign-test statistics are reported in parentheses below the mean (median) changes in the OROA measures. Superscripts a, b, and c denote statistical significance at the 10, 5, and 1 percent levels for two-tailed tests.
Years All Turnovers
Voluntary Turnovers
Forced Turnovers
A. Unadjusted OROA
-3 to -1 -0.007 (-0.003) -0.005 (-0.001) -0.023 (-0.012) (1243, -4.95c, -75.5c) (1051, -2.81c, -38.5b) (192, -6.10c, -37.0c)
-1 to +3 -0.003 (0.000) -0.005 (-0.001) 0.011 (0.007) (1002, -1.45, -3.0) (883, -2.25b, -13.5) (119, 1.86a, 10.5b)
B. Industry-adjusted OROA
-3 to –1 -0.005 (-0.003) -0.002 (-0.001) -0.018 (-0.012) (1238, -3.58c, -71.0c) (1048, -1.67a, -39.0b) (190, -5.10c, -32.0c)
-1 to +3 0.003 (0.001) 0.002 (0.001) 0.011 (0.005) (994, 1.82a, 28.0b) (876, 1.19, 14.0) (118, 2.03b, 14.0b)
C. Control group-adjusted OROA
-3 to –1 -0.007 (-0.002) -0.005 (-0.001) -0.011 (-0.002) (1216, -4.88c, -52.5c) (1027, -3.86c, -38.5c) (189, -3.22c, 14.0b)
-1 to +3 0.009 (0.003) 0.009 (0.003) 0.013 (-0.001) (990, 5.20c, 49.5c) (872, 4.70c, 50.0c) (118, 2.23b, 0.5)

30
Table 3
Changes in operating return on assets from year -1 to year +3 by sub-period
Operating return on assets (OROA) is calculated for a sample of 1,344 CEO successions at large public firms occurring between 1971 and 1994. Summary statistics for changes in OROA from one year before to three years after the year of CEO turnover are given below. Results for three performance measures are reported: changes in OROA (unadjusted OROA), changes OROA adjusted by subtracting SIC two-digit industry level median OROA (industry-adjusted OROA), and changes in OROA adjusted by subtracting median OROA for a control group matched by two-digit industry and by prior OROA performance (control group-adjusted OROA). Cases where the new CEO's tenure ended before the end of year +3 are excluded. Extreme performance observations are excluded, also. (See footnote 7 for details). t-statistics and z-approximations for Brown-Mood tests that the mean and median changes are equal in the various sub-periods are also reported. Superscripts a, b, and c denote statistical significance at the 10, 5, and 1 percent levels (for two-tailed tests), respectively.
All Turnovers Voluntary Turnovers Forced Turnovers Sample Period N Mean Median N Mean Median N Mean Median
A. Unadjusted OROA
1985-88 185 -0.004 -0.008 161 -0.003 -0.010 24 -0.004 0.002 1971-84 and 1989-94 817 -0.003 0.000 722 -0.005b 0.000 95 0.015b 0.008a Statistic for test of difference (-0.14) (-0.89) (0.23) (-0.77) (-1.21) (-0.86)
B. Industry-adjusted OROA
1985-88 181 0.012b 0.006b 157 0.012b 0.006a 24 0.010 0.011 1971-84 and 1989-94 813 0.002 0.001 719 0.000 0.000 94 0.011a 0.004b Statistic for test of difference (1.86)a (1.89)a (1.94)a (1.67)a (-0.15) (0.46)
C. Control group-adjusted OROA
1985-88 181 0.021c 0.012c 158 0.022c 0.012c 23 0.018 0.007 1971-84 and 1989-94 809 0.006c 0.001 714 0.006c 0.001 95 0.012a -0.001 Statistic for test of difference (3.23)c (4.52)c (3.17)c (4.26)c (0.45) (0.69)
31
Table 4
Changes in operating return on assets for various CEO turnover groups from year –1 to year +3
Operating return on assets (OROA) is calculated for a sample of 1,344 CEO successions at large public firms occurring between 1971 and 1994. Summary statistics for changes in OROA from one year before to three years after the year of CEO turnover are given below. Results for three performance measures are reported: changes in OROA (unadjusted OROA), changes OROA adjusted by subtracting SIC two-digit industry level median OROA (industry-adjusted OROA), and changes in OROA adjusted by subtracting median OROA for a control group matched by two-digit industry and by prior OROA performance (control group-adjusted OROA). Outside boards are those with at least 60% outsiders. All others are inside boards. Takeover pressure refers to events related to corporate control and takeovers during the 12 months preceding the turnover announcement. Outside successors are those who had been with their firms for one year or less when appointed CEO. All others are inside successors. Cases where the new CEO's tenure ended before the end of year +3 are excluded. Extreme performance observations are excluded, also. (See footnote 7 for details). Superscripts a, b, and c denote statistical significance at the 10, 5, and 1 percent levels, respectively, for two-tailed t- and median tests.
Total Board Type Institutional Share Takeover Pressure Successor Sample Outside Inside > Median ≤ Median Yes No Outsider Insider
A. Unadjusted
Sample size 1002 801 196 291 276 63 938 156 846 Mean -0.003 0.000 -0.015 -0.001 -0.003 0.011 -0.004 0.014 -0.006 t-stat for mean -1.45 0.080 -2.71c -0.24 -0.80 1.37 -1.86a 2.80c -2.85c
t-stat for difference 2.57c 0.37 1.82a 3.78c Median -0.000 0.001 -0.16 0.002 -0.000 0.007 -0.000 0.007 -0.002 Sign stat for median test -3.0 21.5 -24.0c 7.5 -3.0 2.5 -5.0 23.0c -26.0c Median test approximate Z-stat 3.81c 0.80 0.92 4.01c
B. Industry-adjusted
Sample size 994 795 194 283 275 62 925 153 841 Mean 0.003 0.006 -0.007 0.007 0.010 0.023 0.002 0.018 0.001 t-stat for mean 1.82a 3.05c -1.34 1.91a 2.88c 2.99c 1.10 3.65c 0.39 t-stat for difference 2.36b -0.62 2.70c 3.31c Median 0.001 0.002 -0.001 0.001 0.005 0.009 0.001 0.008 0.000 Sign stat for median test 28.0a 39.5c -11.0 7.5 26.5c 7.0a 21.5 20.5c 7.5 Median test approximate Z-stat 2.07b 1.27 1.84a 3.07c
C. Control group-adjusted
Sample size 990 792 193 286 272 62 919 153 837 Mean 0.009 0.009 0.010 0.021 0.014 0.016 0.009 0.016 0.008 t-stat for mean 5.20c 4.75c 2.15a 6.10c 4.13c 2.24b 4.80c 3.02 4.31c
t-stat for difference 0.28 1.54 0.96 1.39 Median 0.003 0.003 0.001 0.009 0.006 0.012 0.002 0.005 0.002 Sign stat for median test 49.5c 47.5c 1.5 38.0c 31.5c 9.5b 40.5c 12.5a 37.0b Median test approximate Z-stat 0.39 1.18 1.58 1.67a

32
Table 5
Changes in operating return on assets for forced CEO turnover groups from year –1 to year +3
Operating return on assets (OROA) is calculated for a sample of 217 forced CEO successions at large public firms occurring between 1971 and 1994. Summary statistics for changes in OROA from one year before to three years after the year of CEO turnover are given below. Results for three performance measures are reported: changes in OROA (unadjusted OROA), changes OROA adjusted by subtracting SIC two-digit industry level median OROA (industry-adjusted OROA), and changes in OROA adjusted by subtracting median OROA for a control group matched by two-digit industry and by prior OROA performance (control group-adjusted OROA). Outside boards are those with at least 60% outsiders. All others are inside boards. Takeover pressure refers to events related to corporate control and takeovers during the 12 months preceding the turnover announcement. Outside successors are those who had been with their firms for one year or less when appointed CEO. All others are inside successors. Cases where the new CEO's tenure ended before the end of year +3 are excluded. Extreme performance observations are excluded, also. (See footnote 7 for details). Superscripts a, b, and c denote statistical significance at the 10, 5, and 1 percent levels, respectively, for two-tailed t- and median tests.
Total Board Type Institutional share Takeover pressure Successor Sample Outside Inside > Median ≤ Median Yes No Outsider Insider
A. Unadjusted
Sample size 119 104 14 31 39 15 104 62 56 Mean 0.011 0.007 0.038 0.017 0.013 0.015 0.010 0.017 0.004 t-stat for mean 1.86a 1.31 1.32 1.69 1.39 0.69 1.74a 2.27b 0.42 t-stat for difference -1.06 0.30 0.29 1.14 Median 0.007 0.006 0.047 0.030 0.007 -0.002 0.008 0.008 0.006 Sign stat for median test 10.5b 9.0a 1.0 6.5b 3.5 -1.5 12.0b 9.5b 1.0 Median test approximate Z-stat 0.57 2.15b -0.79 0.28
B. Industry-adjusted
Sample size 118 103 14 30 40 15 103 62 56 Mean 0.011 0.006 0.043 0.015 0.020 0.030 0.008 0.018 0.003 t-stat for mean 2.03b 1.22 1.90a 1.32 2.19b 1.56 1.50 2.60b 0.40 t-stat for difference -1.58 -0.42 1.31 1.36 Median 0.005 0.004 0.057 0.011 0.013 0.007 0.05 0.011 0.003 Sign stat for median test 14.0b 10.5b 3.0 3.0 9.0c 0.5 13.5c 10.0b 4.0 Median test approximate Z-stat -1.16 0.00 0.28 0.73
C. Control group-adjusted
Sample size 118 102 15 31 38 15 103 63 55 Mean 0.013 0.008 0.048 0.029 0.021 0.014 0.013 0.011 0.016 t-stat for mean 2.23b 1.28 2.04a 2.22b 1.70a 0.62 2.17b 1.38 1.75a t-stat for difference -1.67 0.44 0.01 -0.45 Median 0.001 -0.002 0.038 0.023 -0.001 0.000 -0.001 -0.001 0.000 Sign stat for median test 0.5 -3.5 2.5 4.5 -0.5 0.0 -0.5 -0.5 0.0 Median test approximate Z-stat -1.41 1.79a 0.28 -0.18

33
Table 6
Sample selection models of post-turnover performance
This table reports the results of sample selection models, estimated as described by Heckman (1979), in which the dependent variable for the first regression equals one if the firm survives as an independent entity for three years after the CEO turnover announcement and zero otherwise. The dependent variable for the second regression equals the change in operating performance over the period from one year before to three years after the year of CEO turnover (OROA (-1, +3)). The second regression is estimated using only data for firms that survived three years. The independent variables include dummy variables that equal one if the old CEO is forced from office (forced), if the new CEO is with the firm for one year or less at the time of turnover (Outsider), if the firm was subject to takeover pressure during the 12 month preceding turnover (Takeover), and if at least 60% of board members are outsiders (Outside Board), and zero otherwise, as well as the fraction of firm stock held by institutional investors (Institutional share), abnormal stock returns over the day before and the day of the WSJ announcement of the turnover (Abnormal return), changes in industry (IOROA (-1, +3)) or control (COROA (-1, +3)) firm OROA over the period from one year before to three years after the year of CEO turnover, firm industry-adjusted and control group-adjusted OROA in the year prior to turnover (OROA (-1)), and the natural log of assets. IML is the inverse Mills ratio. Cases where the new CEO's tenure was less than three years are excluded. Extreme performance observations are excluded, also. (See footnote 7 for details). T-statistics are reported in parentheses. Superscripts a, b, and c denote statistical significance at the 10, 5, and 1 percent levels (for two-tailed tests), respectively.
Model 1 Model 2 Model 3
Firm Remains Independent OROA (-1, +3)
Firm Remains Independent OROA (-1, +3)
Firm Remains Independent OROA (-1, +3)
Intercept 1.267 (2.32b)
0.056 (1.54)
1.334 (5.52b)
0.071 (2.603c)
1.412 (2.65c)
0.053 (1.89a)
Forced -0.569 (-2.79c)
0.024 (0.89)
-0.589 (-2.95a)
0.006 (0.24)
-0.565 (-2.74c)
0.008 (0.31)
Outsider -0.242 (-1.22)
0.006 (0.40)
-0.260 (-1.34)
0.003 (0.26)
-0.237 (-1.18)
0.007 (0.64)
Outside board -0.169 (-0.62)
0.022 (1.95a)
-0.105 (-0.42)
0.014 (1.78a)
-0.242 (-0.90)
0.011 (1.07)
Takeover 0.725 (1.91a)
-0.007 (-0.31)
0.729 (1.93b)
0.004 (0.17)
0.669 (1.80a)
0.007 (0.32)
Institutional share 0.033 (0.08)
0.046 (2.43b)
0.100 (0.24)
0.040 (3.08c)
0.166 (0.42)
0.0.25 (1.84a)
Abnormal return -0.171 (-0.12)
0.206 (2.32b)
-0.165 (-0.11)
0.167 (2.65c)
0.603 (0.40)
0.162 (2.46b)
IOROA (-1, +3) 0.595 (9.56c)
COROA (-1, +3) 0.668 (15.97c)
Industry-adjusted OROA (-1) 1.802 (1.53)
-0.507 (-6.81c)
0.320 (0.30)
-0.461 (-13.07c)
Control group-adjusted OROA (-1) 0.006 (0.13)
-0.743 (-1.40)
Ln(Assets) 0.036 (0.61)
-0.009 (-2.98c)
0.016 (0.27)
-0.010 (-5.21c)
0.021 (0.37)
-0.008 (-3.98c)
IML -0.098 (-0.74)
-0.038 (-0.32)
-0.017 (-0.13)
N – total 613 613 619 N – remain independent 556 552 551 Regression p-value 0.001 0.000 0.006 0.000 0.000 0.000

34
Table 7
Characteristic comparisons for all CEO turnover observations grouped by mean changes in industry-adjusted OROA
This table reports comparisons of firm characteristics for firms grouped by mean changes in operating return on assets (OROA) after controlling for lagged performance, firm size, and changes in industry performance around all CEO turnover events. Characteristics considered are the announcement date abnormal stock returns (Abnormal Return), the fraction of firm stock held by institutional investors (Institutional Share), and dummy variables distinguishing forced successions (Forced), outside successors (Outsider), successions where takeover activity occurred during the preceding 12 months (Takeover), and successions at firms where at least 60% of board members are outsiders (Outside board). Abnormal stock returns are summed over the day of and the day before the WSJ announcement of the turnover. Cases where the new CEO's tenure ended before the end of year +3 are excluded. Extreme performance observations are excluded, also. (See footnote 7 for details). P-values for differences across groups in the means of OROA, Abnormal Return, and Institutional Share are based on standard t-statistics. Median tests using median-sign (Brown-Mood) tests provide p-values similar to those reported in the table for the Abnormal Return and Institutional Share variables. For the dummy variables (Outside Board, Takeover, Forced, and Outsider), the p-values are based on tests of the differences in proportions. (See Harnett (1982), page 401.)
Industry-adjusted
OROA (-1,+3) Abnormal
Return Outside Board
Takeover Forced Institutional Share
Outsider
Panel A: Performance change quintiles
Quintile 1 Mean -6.21% -0.01% 74.36% 6.09% 12.18% 45.49% 14.21% (Lowest 20%) N {197} {192} {195} {197} {197} {93} {197} Quintiles 2 -4 Mean -0.41% 0.03% 84.43% 5.56% 11.78% 44.35% 14.81% (Middle 60%) N {594} {585} {591} {593} {594} {332} {594} Quintile 5 Mean 7.45% 1.08% 75.13% 8.63% 11.17% 46.94% 18.27% (Highest 20%) N {197} {196} {197} {197} {197} {132} {197}
Panel B: p-values for tests that performance change groups' characteristics are equal:
Tests that means are equal across quintiles 1 and 5:
<0.001 0.861 0.334 0.755 0.593 0.275
Tests that means are equal across quintiles 1 and 2-4:
0.917 0.002 0.781 0.880 0.526 0.836
Tests that means are equal across quintiles 5 and 2-4:
0.001 0.004 0.125 0.817 0.177 0.247

35
Table 8
Characteristic comparisons for all CEO turnover observations grouped by changes in control group-adjusted OROA
This table reports comparisons of firm characteristics for firms grouped by changes in operating return on assets (OROA) after controlling for lagged performance, firm size, and changes in control firm performance around all CEO turnover events. Characteristics considered are the announcement date abnormal stock returns (Abnormal Return), the fraction of firm stock held by institutional investors (Institutional share), and dummy variables distinguishing forced successions (Forced), outside successors (Outsider), successions where takeover activity occurred during the preceding 12 months (Takeover), and successions at firms where at least 60% of board members are outsiders (Outside Board). Abnormal stock returns are summed over the day of and the day before the WSJ announcement of the turnover. Cases where the new CEO's tenure ended before the end of year +3 are excluded. Extreme performance observations are excluded, also. (See footnote 7 for details). P-values for differences across groups in the means of Abnormal Return, and Institutional Share are based on standard t-statistics. Median tests using median-sign (Brown-Mood) tests provide p-values similar to those reported in the table for the Abnormal Return and Institutional Share variables. For the dummy variables (Outside Board, Takeover, Forced, and Outsider), the p-values are based on tests of the differences in proportions. (See Harnett (1982), page 401.)
Control Group-Adjusted
OROA (-1,+3) Abnormal
Return Outside Board
Takeover Forced Institutional Share
Outsider
Panel A: Performance change quintiles
Quintile 1 Mean -6.14% 0.29% 72.31% 6.12% 13.27% 43.59% 14.80% (Lowest 20%) N {196} {195} {195} {196} {196} {94} {196} Quintiles 2 -4 Mean -0.33% -0.02% 84.84% 6.11% 10.51% 44.33% 14.24% (Middle 60%) N {590} {575} {587} {589} {590} {330} {590} Quintile 5 Mean 7.14% 0.99% 75.90% 7.14% 14.29% 48.85% 19.39% (Highest 20%) N {196} {196} {195} {196} {196} {132} {196}
Panel B: p-values for tests that performance change groups' characteristics are equal:
Tests that means are equal across quintiles 1 and 5:
0.086 0.418 0.685 0.770 0.032 0.227
Tests that means are equal across quintiles 1 and 2-4:
0.337 0.000 0.999 0.722 0.730 0.941
Tests that means are equal across quintiles 5 and 2-4:
0.004 0.004 0.609 0.150 0.017 0.085
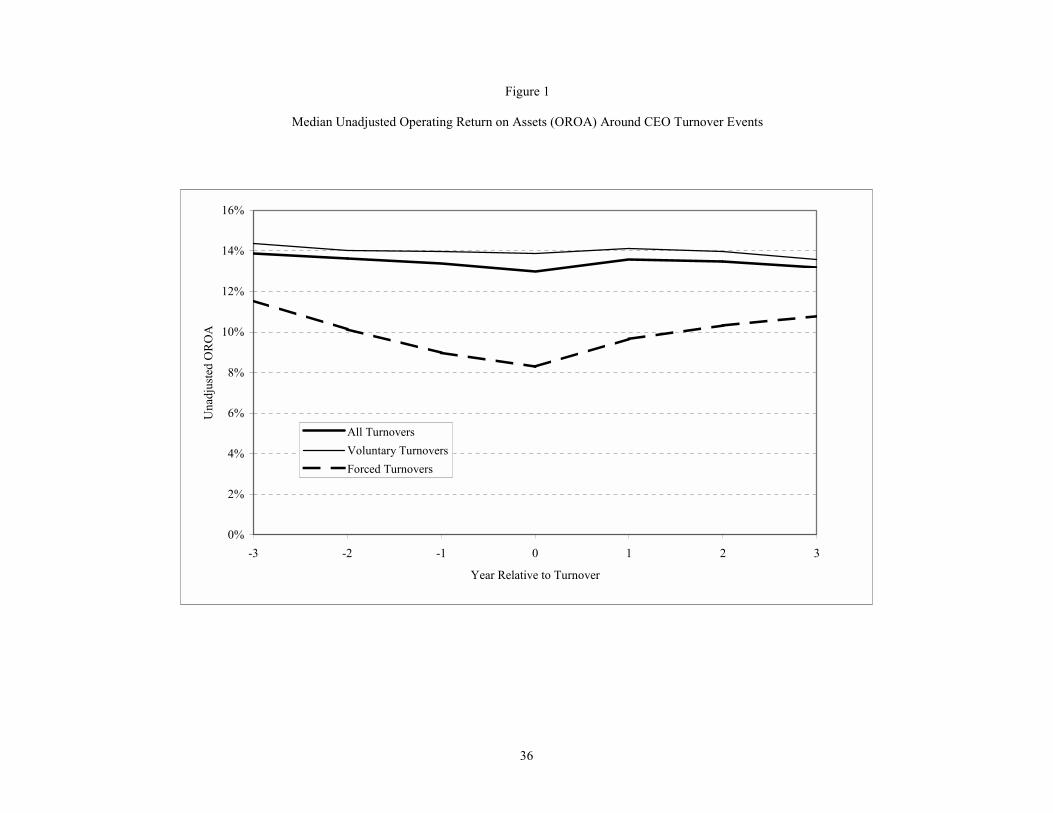
36
Figure 1
Median Unadjusted Operating Return on Assets (OROA) Around CEO Turnover Events
0%
2%
4%
6%
8%
10%
12%
14%
16%
-3 -2 -1 0 1 2 3
Year Relative to Turnover
Una
djus
ted
OR
OA
All TurnoversVoluntary TurnoversForced Turnovers
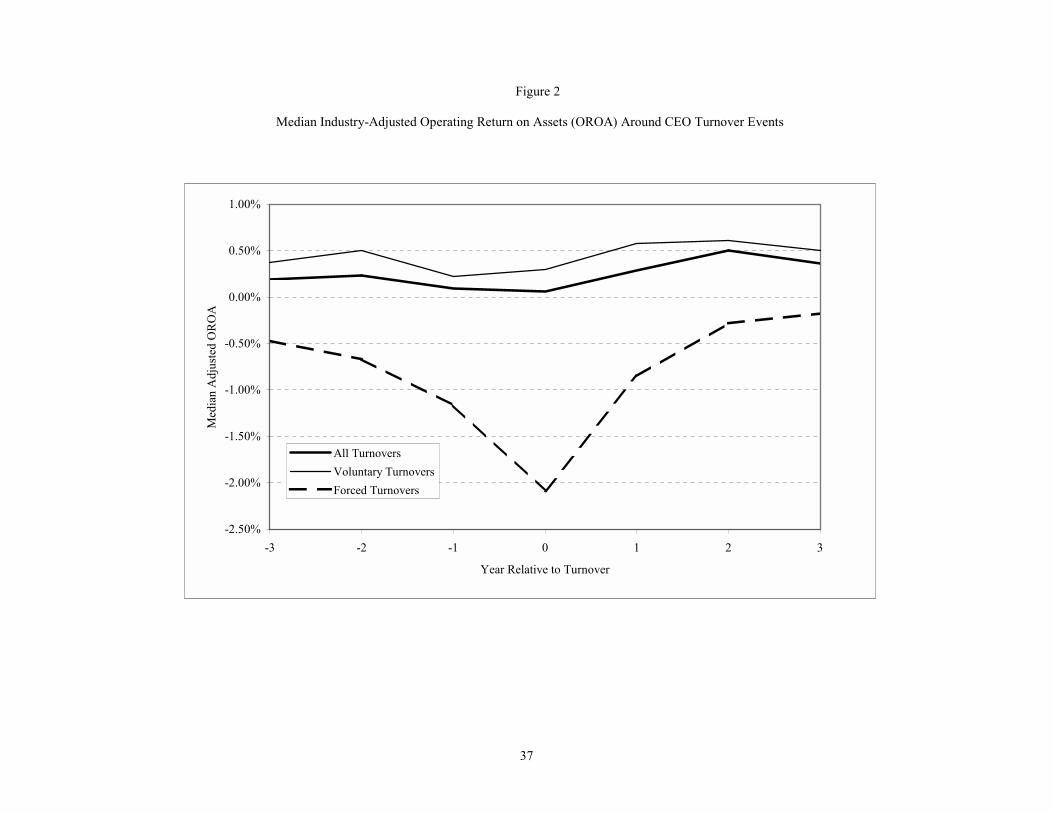
37
Figure 2
Median Industry-Adjusted Operating Return on Assets (OROA) Around CEO Turnover Events
-2.50%
-2.00%
-1.50%
-1.00%
-0.50%
0.00%
0.50%
1.00%
-3 -2 -1 0 1 2 3
Year Relative to Turnover
Med
ian
Adj
uste
d O
RO
A
All TurnoversVoluntary TurnoversForced Turnovers

38
Figure 3
Median Control Group-Adjusted Operating Return on Assets (OROA) Around CEO Turnover Events
-0.8%
-0.6%
-0.4%
-0.2%
0.0%
0.2%
0.4%
0.6%
-3 -2 -1 0 1 2 3
Year Relative to Turnover
Con
trol G
roup
Adj
uste
d O
RO
A
All TurnoversVoluntary TurnoversForced Turnovers