Managerial Economics) · (เศรษฐศาตร์เพื่อการจัดการ Managerial Economics)

M.Com.I - Semester
310 12
Directorate of Distance Education
MANAGERIAL ECONOMICS
ALAGAPPA UNIVERSITY[Accredited with ‘A+’ Grade by NAAC (CGPA:3.64) in the Third Cycle
and Graded as Category–I University by MHRD-UGC]
(A State University Established by the Government of Tamil Nadu)
KARAIKUDI – 630 003

Reviewer
Dr. R. GanapathiAssistant Professor,
Directorate of Distance Education,Alagappa University, Karaikudi
All rights reserved. No part of this publication which is material protected by this copyright notice may be reproduced or transmitted or utilized or stored in any form or by any means now known or hereinafter invented, electronic, digital or mechanical, including photocopying, scanning, recording or by any information storage or retrieval system, without prior written permission from the Alagappa University, Karaikudi, Tamil Nadu.
Information contained in this book has been published by VIKAS® Publishing House Pvt. Ltd. and has been obtained by its Authors from sources believed to be reliable and are correct to the best of their knowledge. However, the Alagappa University, Publisher and its Authors shall in no event be liable for any errors, omissions or damages arising out of use of this information and specifically disclaim any implied warranties or merchantability or fitness for any particular use.
Vikas® is the registered trademark of Vikas® Publishing House Pvt. Ltd.
VIKAS® PUBLISHING HOUSE PVT. LTD.E-28, Sector-8, Noida - 201301 (UP)Phone: 0120-4078900 • Fax: 0120-4078999Regd. Office: 7361, Ravindra Mansion, Ram Nagar, New Delhi 110 055• Website: www.vikaspublishing.com • Email: [email protected]
Work Order No. AU/DDE/DE1-238/Preparation and Printing of Course Materials/2018 Dated 30.08.2018 Copies - 500
Authors:Dr D.N. Dwivedi, Professor of Economics, Maharaja Agrasen Institute of Management Studies, DelhiUnits (1, 2, 3, 4, 5.2, 6, 7, 8, 9, 10, 11)H.L. Bhatia, Former Reader in Economics, Shri Ram College of Commerce, University of DelhiUnit (5.3, 5.4)Vikas® Publishing House: Units (5.0-5.1, 5.5-5.10, 12, 13, 14)
“The copyright shall be vested with Alagappa University”

SYLLABI-BOOK MAPPING TABLE Managerial Economics
BLOCK I: MANAGERIAL ECONOMICSUNIT - I: Nature and Scope of Managerial Economics – Concept of Managerial Economics - Role and Responsibilities of Managerial Economist – Goals of Corporate Enterprises: Maximization of profit - Value of enterprise.
UNIT - II: Demand Analysis - Elasticity of demand- Factors influencing elasticity of demand - Demand determinants – Demand distinctions – Types, methods – Applications - Demand forecasting for industrial goods – Consumer goods – Consumer durables.
UNIT - III: Cost and Production Analysis - Cost concepts – Cost and output relationship - cost control – Short run and Long run - cost functions - production functions – Break- even analysis – Economies of scale of production.
UNIT - IV: Pricing and output decisions in different market situations – Monopoly and Duopoly competition - Perfect and Imperfect competition - Pricing policies – Types - Factors affecting pricing policies.
UNIT - V: Business Cycles – National income, monetary and fiscal policy – Public finance - Government Institutions, State Governments, Local Self-Government, Central Government – Industrial Sickness – Causes – Remedies.
BLOCK II: MANAGERIAL DECISION MAKINGUNIT - VI: Theory and Nature of Profit – Theories of profit – Depreciation and Profit – Valuation of stock and profit – Profit policies – Planning and forecasting – Calculation of break even point.
UNIT - VII: Managerial Decision Making – Risk and uncertainty – Decision theory – Classification of managerial decision problems – Analysis of decisions – Probability theorems.
UNIT - VIII: Economic Planning and MRTP Act – Objectives of economic planning – Control of big business – Evil effects of economic concentration – Industrial policy – Features.
UNIT - IX: Consumer – Consumer’s sovereignty – Consumer’s surplus – Consumer’s surplus in a market – Assumption of consumer’s surplus.
UNIT - X: Business Cycle and Business Policy – Characteristics of business cycle – Phases of business cycle – Depression – Inflation – Characteristics of inflation – Types of inflation – Demand pull inflation – Cost push inflation – Control of deflation – Effects on business cycle.
Syllabi Mapping in Book
Unit 1: Nature and Scope of Managerial Economics
(Pages 1-11);Unit 2: Demand Analysis
(Pages 12-38);Unit 3: Cost and Production
Analysis (Pages 39-67);
Unit 4: Pricing-Output Decisions and Pricing Policies
(Pages 68-96);Unit 5: Business Cycles
(Pages 97-134)
Unit 6: Theories and Nature of Profit
(Pages 135-151);Unit 7: Managerial
Decision Making (Pages 152-163);
Unit 8: Economic Planning and MRTP Act
(Pages 164-180);Unit 9: Consumer (Pages 181-196);
Unit 10: Business Cycles and Business Policy
(Pages 197-213)
BLOCK III: ECONOMIC APPROACHESUNIT - XI: Product Line – Reasons required changing existing product mix – Factors determining the scope of product line – Product line pricing – Special order pricing – Pricing Complementary products.
UNIT - XII: Economic Concentration – Meaning of economic power – Domination of markets – Product-wise concentration – Country-wise concentration – Growth of Large industrial houses and concentration of economic power.
UNIT - XIII: Foreign Investment – Types of foreign investment – FDI in developing countries – Guidelines for foreign investments – FII investments – Euro issues – FDI inflow in India.
UNIT - XIV: Government and Business – Performance of public enterprises in India – Price policy in public utilities, government measures to control monopoly in India.
Unit 11: Product Line (Pages 214-225);
Unit 12: Economic Concentration
(Pages 226-233);Unit 13: Foreign
Investment (Pages 234-250);
Unit 14: Government and Business
(Pages 251-260)

CONTENTS
INTRODUCTION
BLOCK I: MANAGERIAL ECONOMICSUNIT 1 NATURE AND SCOPE OF MANAGERIAL ECONOMICS 1-11 1.0 Introduction 1.1 Objectives 1.2 Concept of Managerial Economics
1.2.1 Role and Responsibilities of a Mangerial Economist 1.3 Goals of Corporate Enterprises
1.3.1 Maximization of Profit 1.3.2 Value of Enterprise
1.4 Answers to Check Your Progress Questions 1.5 Summary 1.6 Key Words 1.7 Self Assessment Questions and Exercises 1.8 Further Readings
UNIT 2 DEMAND ANALYSIS 12-38 2.0 Introduction 2.1 Objectives 2.2 Elasticity of Demand 2.3 Factors Influencing Price Elasticity of Demand 2.4 Demand Determinants
2.4.1 Demand Distinctions 2.5 Types and Method 2.6 Application of Elasticities in Business Decision-Making 2.7 Demand Forecasting: An Overview
2.7.1 Demand Forecatsing for Industrial Goods, Consumer Goods and Consumer Durables 2.8 Answers to Check Your Progress Questions 2.9 Summary 2.10 Key Words 2.11 Self Assessment Questions and Exercises 2.12 Further Readings
UNIT 3 COST AND PRODUCTION ANALYSIS 39-67 3.0 Introduction 3.1 Objectives 3.2 Cost Concepts
3.2.1 Accounting Cost Concepts 3.2.2 Analytical Cost Concepts 3.2.3 Cost Control
3.3 Cost and Output Relationship 3.3.1 Short Run Cost Functions 3.3.2 Long Run Cost Functions 3.3.3 Break Even Analysis

3.4 Economies of Scale of Production 3.4.1 Economies of Scale 3.4.2 Diseconomies of Scale
3.5 Production Function 3.5.1 Laws of Production in the Short-Run 3.5.2 Concepts of Long-term Laws of Production
3.6 Answers to Check Your Progress Questions 3.7 Summary 3.8 Key Words 3.9 Self Assessment Questions and Exercises 3.10 Further Readings
UNIT 4 PRICING-OUTPUT DECISIONS AND PRICING POLICIES 68-96 4.0 Introduction 4.1 Objectives 4.2 Pricing and Output Decisions in Different Market Situations 4.3 Perfect Competition
4.3.1 Price Determination under Perfect Competition 4.3.2 Output Determination in Short Run: Short-run Equilibrium of the Firm 4.3.3 Determination of Output in Long Run
4.4 Imperfect Competition: Monopoly 4.4.1 Monopoly Pricing and Output Decision: Short-Run Analysis 4.4.2 Monopoly Pricing and Output Decision: Long-Run analysis
4.5 Imperfect Competition: Duopoly 4.6 Pricing Policies
4.6.1 Types and Factors Affecting Pricing Policies 4.6.2 Mark-up Pricing and Marginalist Rule Compared 4.6.3 Limitations of Mark-up Pricing Rule 4.6.4 Multiple Product Pricing 4.6.5 Pricing in the Life-cycle of A Product 4.6.6 Pricing a New Product 4.6.7 Pricing in Maturity Period 4.6.8 Pricing a Product in Decline 4.6.9 Pricing in Relation to Established Products 4.6.10 International Price Discrimination: Dumping
4.7 Answers to Check Your Progress Questions 4.8 Summary 4.9 Key Words 4.10 Self Assessment Questions and Exercises 4.11 Further Readings
UNIT 5 BUSINESS CYCLES 97-134 5.0 Introduction 5.1 Objectives 5.2 Business Cycles
5.2.1 National Income 5.2.2 Fiscal Policy 5.2.3 Monetary Policy
5.3 Public Finance 5.4 Government Institutions
5.4.1 Central Government

5.4.2 State Governments 5.4.3 Local Self-Government
5.5 Industrial Sickness, Causes and Remedies 5.5.1 Causes of Industrial Sickness 5.5.2 Remedial Measures
5.6 Answers to Check Your Progress Questions 5.7 Summary 5.8 Key Words 5.9 Self Assessment Questions and Exercises 5.10 Further Readings
BLOCK II: MANAGERIAL DECISION MAKINGUNIT 6 THEORIES AND NATURE OF PROFIT 135-151 6.0 Introduction 6.1 Objectives 6.2 Theories of Profit
6.2.1 Walker’s Theory of Profit: Profit as Rent of Ability 6.2.2 Clark’s Dynamic Theory of Profit 6.2.3 Hawley’s Risk Theory of Profit 6.2.4 Knight’s Theory of Profit 6.2.5 Schumpeter’s Innovation Theory of Profit 6.2.6 Monopoly Power as a Source of Profit
6.3 Depreciation and Profit 6.4 Valuation of Stock and Profit 6.5 Profit Policies 6.6 Planning and Forecasting
6.6.1 Calculation of Break Even Point 6.6.2 Meaning of Break-even Analysis 6.6.3 Linear Cost and Revenue Functions 6.6.4 Non-linear Cost and Revenue Functions 6.6.5 Contribution Analysis 6.6.6 Profit: Volume Ratio 6.6.7 Use of Break-Even Analysis 6.6.8 Limitations of Break-even Analysis
6.7 Answers to Check Your Progress Questions 6.8 Summary 6.9 Key Words 6.10 Self Assessment Questions and Exercises 6.11 Further Readings
UNIT 7 MANAGERIAL DECISION MAKING 152-163 7.0 Introduction 7.1 Objectives 7.2 Analysis of Decisions and Classification of Managerial Decision Problems
7.2.1 Microeconomic Theories Applied to Internal Issues 7.2.2 Macroeconomics Applied to Business Decisions 7.2.3 Macroeconomic Factors 7.2.4 Decision Theory
7.3 Risk and Uncertainty 7.3.1 Meaning of Risk

7.3.2 Meaning of Uncertainty 7.3.3 Probability Theorems
7.4 Answers to Check Your Progress Questions 7.5 Summary 7.6 Key Words 7.7 Self Assessment Questions and Exercises 7.8 Further Readings
UNIT 8 ECONOMIC PLANNING AND MRTP ACT 164-180 8.0 Introduction 8.1 Objectives 8.2 Objectives of Economic Planning 8.3 Control of Big Business
8.3.1 MRTP Act and the Evil Effects of Economic Concentration 8.3.2 Monopoly Inquiry Commission (1965)
8.4 Monopolies and Restrictive Trade Practices Act (1969) 8.5 Amendments in MRTP Act 8.6 Industrial Policy and its Features
8.6.1 Industrial Policies of Pre-1991 Period 8.6.2 The New Policy (1991)
8.7 Answers to Check Your Progress Questions 8.8 Summary 8.9 Key Words 8.10 Self Assessment Questions and Exercises 8.11 Further Readings
UNIT 9 CONSUMER 181-196 9.0 Introduction 9.1 Objectives 9.2 Consumer’s Surplus
9.2.1 Consumer’s Sovereignty 9.2.2 Consumer’s Surplus in a Market and Assumptions
9.3 The Marshallian Consumer’s Surplus 9.4 Hicksian Method of Measuring Consumer’s Surplus
9.4.1 Consumer’s Surplus with Constant MUm 9.4.2 Consumer’s Surplus with Variable MUm 9.4.3 Hicks’ Four Variations of Consumer’s Surplus
9.5 Some Uses of the Consumer’s Surplus Concept 9.6 Answers to Check Your Progress Questions 9.7 Summary 9.8 Key Words 9.9 Self Assessment Questions and Exercises 9.10 Further Readings
UNIT 10 BUSINESS CYCLES AND BUSINESS POLICY 197-213 10.0 Introduction 10.1 Objectives 10.2 Business Cycles
10.2.1 Characteristics of Business Cycles

10.2.2 Phases of Business Cycles 10.2.3 Business Policy
10.3 Inflation 10.3.1 Characteristics of Inflation 10.3.2 Types of Inflation 10.3.3 Demand Pull Inflation and Cost Push Inflation
10.4 Control of Deflation 10.4.1 Effects on Business Cycle
10.5 Answers to Check Your Progress Questions 10.6 Summary 10.7 Key Words 10.8 Self Assessment Questions and Exercises 10.9 Further Readings
BLOCK III: ECONOMIC APPROACHESUNIT 11 PRODUCT LINE 214-225 11.0 Introduction 11.1 Objectives 11.2 Reasons required for Changing Existing Product Mix
11.2.1 Significance of Elements of Product Mix 11.2.2 Product Mix Strategy 11.2.3 Product Mix Modifications 11.2.4 Factors Determining the Scope of Product Line 11.2.5 Product Line Pricing 11.2.6 Special Order Pricing 11.2.7 Pricing Complementary Products
11.3 Answers to Check Your Progress Questions 11.4 Summary 11.5 Key Words 11.6 Self Assessment Questions and Exercises 11.7 Further Readings
UNIT 12 ECONOMIC CONCENTRATION 226-233 12.0 Introduction 12.1 Objectives 12.2 Meaning of Economic Power
12.2.1 Forms of Concentration of Economic Power 12.2.2 Domination of Markets 12.2.3 Growth of Large Industrial Houses and Concentration of Economic Power
12.3 Answers to Check Your Progress Questions 12.4 Summary 12.5 Key Words 12.6 Self Assessment Questions and Exercises 12.7 Further Readings
UNIT 13 FOREIGN INVESTMENT 234-250 13.0 Introduction 13.1 Objectives 13.2 Types of Foreign Investment and FDI

13.2.1 Types of Foreign Direct Investment 13.2.2 Methods of Foreign Direct Investment 13.2.3 FDI Inflow in India 13.2.4 FDI in Developing Countries 13.2.5 Guidelines for Foreign Investments 13.2.6 FDI in Various Sectors and Euro Issues 13.2.7 FII
13.3 Answers to Check Your Progress Questions 13.4 Summary 13.5 Key Words 13.6 Self Assessment Questions and Exercises 13.7 Further Readings
UNIT 14 GOVERNMENT AND BUSINESS 251-260 14.0 Introduction 14.1 Objectives 14.2 Public Sector in India
14.2.1 Performance of Public Sector Enterprises in India 14.2.2 Price Policies in Public Utilities 14.2.3 Government Measures to Control Monopoly in India
14.3 Answers to Check Your Progress Questions 14.4 Summary 14.5 Key Words 14.6 Self Assessment Questions and Exercises 14.7 Further Readings

NOTES
Self-InstructionalMaterial
IntroductionINTRODUCTION
The natural curiosity of a student who begins to study a subject or science is to know its nature and scope. Such as it is, a student of economics would like to know ‘What is economics’ and ‘What is its subject matter’. Surprisingly, there is no precise answer to these questions. Attempts made by economists over the past 300 years to define economics have not yielded a precise and universally acceptable definition of economics. Economists right from Adam Smith—the ‘father of economics’—down to modern economists have defined economics differently, depending on their own perception of the subject matter of economics of their era. Thus, economics is fundamentally the study of choice-making behaviour of the people. The choice-making behaviour of the people is studied in a systematic or scientific manner. This gives economics the status of a social science.
However, the scope of economics, as it is known today, has expanded vastly in the post-World War II period. Modern economics is now divided into two major branches: Microeconomics and Macroeconomics. Microeconomics is concerned with the microscopic study of the various elements of the economic system and not with the system as a whole. As Lerner has put it, ‘Microeconomics consists of looking at the economy through a microscope, as it were, to see how the million of cells in body economic—the individuals or households as consumers and the individuals or firms as producers—play their part in the working of the whole economic organism.’ Macroeconomics is a relatively new branch of economics. Macroeconomics is the study of the nature, relationship and behaviour of aggregates and averages of economic variables. Therefore, technique and process of business decision-making has of late changed tremendously.
The basic functions of business managers is to take appropriate decisions on business matters, to manage and organize resources, and to make optimum use of the available resources with the objective of achieving the business goals. In today’s world, business decision-making has become an extremely complex task due to the ever-growing complexity of the business world and the business environment. It is in this context that modern economics – howsoever defined–contributes a great deal towards business decision-making and performance of managerial duties and responsibilities. Just as biology contributes to the medical profession and physics to engineering, economics contributes to the managerial profession.
This book, Managerial Economics aims at equipping management students with economic concepts, economic theories, tools and techniques of economic analysis applied to business decision-making.
The book has been written in keeping with the self-instructional mode or the SIM format wherein each Unit begins with an Introduction to the

Introduction
NOTES
Self-Instructional Material
topic, followed by an outline of the Objectives. The detailed content is then presented in a simple and organized manner, interspersed with Check Your Progress questions to test the student’s understanding of the topics covered. A Summary along with a list of Key Words and a set of Self-Assessment Questions and Exercises is provided at the end of each Unit for effective recapitulation.

NOTES
Self-InstructionalMaterial 1
Nature and Scope of Managerial EconomicsBLOCK - I
MANAGERIAL ECONOMICS
UNIT 1 NATURE AND SCOPE OF MANAGERIAL ECONOMICS
Structure 1.0 Introduction 1.1 Objectives 1.2 Concept of Managerial Economics
1.2.1 Role and Responsibilities of a Mangerial Economist 1.3 Goals of Corporate Enterprises
1.3.1 MaximizationofProfit 1.3.2 Value of Enterprise
1.4 Answers to Check Your Progress Questions 1.5 Summary 1.6 Key Words 1.7 Self Assessment Questions and Exercises 1.8 Further Readings
1.0 INTRODUCTION
Managerial Economics has emerged as a separate branch of economics. The emergence of managerial economics can be attributed to at least three factors: (i) growing complexity of the business environment and decision-making process; (ii) increasing application of economic logic, concepts, theories and tools of economic analysis in the process of business decision-making; and (iii) rapid increase in demand for professionally trained managerial manpower with good knowledge of economics. The growing complexity of the business world can be attributed to rapid growth of large scale industries, increasingnumberofbusinessfirms,quickinnovationandintroductionofnew products, globalization and growth of multinational corporations, merger andacquisitionofbusinessfirms,andlarge-scalediversificationofbusinessactivities.These factors have contributed a great deal to the inter-firm,inter-industry and inter-country business rivalry and competition, enhancing uncertainty and risk in the business world.
A systematic analysis of market conditions and business environment requirescollectinglarge-scaledataondemandandsupplyconditions,costofproduction, pricing system, and morphology of market, the nature and degree of competition and so on. It is in this context of the managerial function that economics contributes a great deal. It is for this reason that managerial economics has emerged as an important aspect of management studies.

Nature and Scope of Managerial Economics
NOTES
Self-Instructional 2 Material
1.1 OBJECTIVES
After going through this unit, you will be able to: •Definetheconceptofmanagerialeconomics • Discuss the role and responsibilities of managerial economist • Explain the goals of corporate enterprises
1.2 CONCEPT OF MANAGERIAL ECONOMICS
Managerial economics canbedefinedasthe study of economic theories, logic, concepts and tools of economic analysis applied in the process of business decision making.Ingeneralpractice,economictheoriesandtechniquesofeconomic analysis are applied to diagnose the business problems and to evaluatealternativeoptionsandopportunitiesopentothefirmforfindinganoptimumsolution to theproblems.Look at someother definitionsofmanagerial economics offered by some economists.Mansfield: “Managerial economics is concerned with the application of economic concepts and economics to the problem of formulating rational decision making’’.Spencer and Seigelman: “Managerial economics is the integration of economic theory with business practice for the purpose of facilitating decision making and forward planning by management.”Davis and Chang: “Managerial Economics applies the principles and methods of economics to analyse problems faced by management of a business, or othertypesoforganizations,andtohelpfindsolutionsthatadvancethebestof such organizations.”Douglas: “Managerial economics is concerned with the application of economic principles and methodologies to the decision making process within thefirmororganization.Itseekstoestablishrulesandprinciplestofacilitatethe attainment of the desired goal of management.”
Asthesedefinitionsreveal,managerialeconomicsisanintegrationofeconomic science with decision making process of business management. The integration of economic science with management has become inevitable becauseapplicationofeconomictheoriesandanalyticaltoolsmakesignificantcontribution to managerial decision-making.
As we know, the basic managerial functions are planning, organizing, staffing, leading and controlling business related factors.The ultimateobjective of these managerial functions is to ensure maximum return from the utilizationoffirm’sresources.Tothisend,managershavetotakedecisionsateach stage their functions in view of business issues and implement decisions

NOTES
Self-InstructionalMaterial 3
Nature and Scope of Managerial Economics
effectively to achieve the goals of the organization. As we will see later, almost all managerial decision issues involve economic analysis and analytical techniques.Therefore,economic theoriesandanalytical toolsareappliedasameans tofindsolution to thebusiness issue.This ishoweconomicsgets integrated to managerial functions and gives emergence of managerial economics. The integration of economics with business management is illustrated in Figure 1.1.
Figure 1.1 shows the major areas of business decisions making. Taking decision on all of these business problems involves economic consideration. For example, choice of the product requires assessment of demand andsupplyconditionsoftheperspectiveproducts.Thisrequiresapplicationoftheoriesofdemandandsupply.Similarly,allotherdecisionproblemsrequirethe application of relevant economic concepts, theories and analytical tools tofindwaysandmeanstoarriveatanappropriatesolutiontotheproblem.
Managerial Decision Areas• Choice of business area given the resources• Choice of product• Determining optimum output• Choice of technology—factor combination•Acquisitionofinputs—labourandcapital• Determining price of the product• Assessing economic environment and business scope
Economic Science Quantitative MethodsMicroeconomics and • Mathematical Tools Macroeconomics: • Statistical ToolsEconomic Principles, Theories, • Game TheoryConcepts and Tools of Analysis • Econometrics
Managerial Economics Applicationofeconomictheoriesandquantitative
methodstofindsolutiontobusinessproblem
Fig. 1.1 Integration of Economics with Managerial Decisions

Nature and Scope of Managerial Economics
NOTES
Self-Instructional 4 Material
However, application of economic concepts and theories alone is not sufficienttomakeaspecificdecision.Ithastobecombinedwithquantitative methods tofindanumericalsolutiontothedecisionsproblems.Forexample,oncethechoiceofproductisfinalized,nextquestionarises‘howmuchtoproduce’tooptimizetheoutput.Tofindanswertothisquestion,quantitativemethods have to be combined with the theories of production and cost. It means that to make a sound decision, economic concepts and theories have tobeintegratedwithquantitativemethodsandmodels.Theintegrationofeconomictheoriesandconceptswithquantitativemethodscreatesmanagerial economics.
It may be added at the end that economic science has a very wide perspective. All economic theories are neither applicable nor are applied to business decision-making. Most business management issues are of internalnatureandasignificantpartofmicroeconomicsdealswithinternaldecision-making issues of the businessfirms—what to produce, how toproduce, how much to produce, and what price to charge, etc. That is why most microeconomic theories and analytical tools are generally applied to managerial decision-making. Therefore, managerial economics is treated as applied microeconomics. Macroeconomics deals with environmental issues—how is the economic condition of the country; what is the likely trend; what are government’s economic policies; how government policies might affect business environment of the country; what kind of business policy will be required,andsoon.
1.2.1 Role and Responsibilities of a Mangerial Economist
The primary function of managers is to take appropriate decisions and implement them effectively to achieve the objective of the organization to maximum possible extent, given the resources. Application of economics contributes a great deal to managerial decision-making as it provides guidance infindinganappropriatesolutiontothebusinessproblem.Justasbiologycontributes to medical profession and physics to engineering, economics contributes to managerial functions. As such, a working knowledge of economics is essential for managers. Managers are, in fact, practicing economists.
Let us now see how economics contributes to managerial decisions. All the areas of managerial decisions, as noted in Figure 1.1, have economic perspective. Therefore, economic theories, concepts and tools of analysis areappliedasroadmaptofindsolutiontobusinessproblems.Ithasbeenfound empirically that application of economic theories and tools of analysis makessignificantcontributiontotheprocessofbusinessdecisionmakingin many ways.
According to Baumol, a Nobel laureate in economics, economic theory contributes to business decision making in three important ways.

NOTES
Self-InstructionalMaterial 5
Nature and Scope of Managerial Economics
First,‘oneofthemostimportantthingswhichtheeconomictheorycan contribute to management science’ is providing framework for building analytical models which can help recognize the structure of managerial problem, determine the important factors to be managed, and eliminate the minor factors that might obstruct decision making.
Secondly,economicsprovides‘asetofanalyticalmethods’whichmaynotbedirectlyapplicabletoanalysespecificbusinessproblemsbuttheydowiden the scope of business analysis and enhance the analytical capability of the business analyst in understanding the nature of the business problems.
Thirdly, various economic terms are used in common parlance, which are not applicable to business analysis and decision making. Economic theory offers clarity to various economic concepts used in business analysis, which enables the managers to avoid conceptual pitfalls. For example, in general sense,‘demand’meansquantitydemandedatapointoftime.But,ineconomicsense,‘demand’meansthequantitypeoplearewillingtobuyatagivenpriceand they have ability and willingness to pay.
Apart from providing analytical models and methods and conceptual clarity, economics contributes to business decision in many other ways also. Most business conditions are taken under the condition of risk and uncertainty. Risk and uncertainty arise in business because of continuous change in business conditions and environment, and unpredictable market behaviour.Economicsprovidesmodels,toolsandtechniquetopredictthefuture course of market conditions, ways and means to assess the risk and, thereby, helps in business decision making.
It is because of these important contributions of economics to business decision making that economics has been integrated with managerial decisions. Managerial decision making without applying economic logic, theory and analytical tools may not offer a reasonable solution.
1.3 GOALS OF CORPORATE ENTERPRISES
Whatistheobjectiveofbusinessfirms?Thequickanswertothisquestionis‘makingmaximumprofit,ofcourse!’However,economistsdonotagreewiththis answer. According to Baumol, a Nobel laureate in Economics and an authorityonbusinesseconomics,“Itismostfrequentlyassumedineconomicanalysisthatthefirmistryingtomaximizeitstotalprofit.However,thereisnoreasontobelievethatallbusinessfirmspursuethesameobjective”’.“Infact,itiscommonexperiencewheninterviewingexecutivestofindthatthey will agree to every plausible goal about which they are asked. They say theywanttomaximizesalesandalsotomaximizeprofits;thattheywish...to minimize cost; and so on”.

Nature and Scope of Managerial Economics
NOTES
Self-Instructional 6 Material
In fact, researches conducted by the economists over time reveal that businessfirmspursuedifferentobjectivesunderdifferentkindsofmarketconditions.Theconventionaltheoryoffirmisbasedontheassumptionsthattheobjectiveofbusinessfirmsistomaximizeprofits.However,economistshave found that business firms pursuemany other objectives, viz., (i) maximization of sales revenue (Baumol), (ii)maximizationoffirm’sgrowthrate (Marris), (iii) maximization of managerial utility function (Williamson), (iv)satisficingbehaviour(CyertandMarch),(v) long-run survival and market share goal, and (vi) entry-prevention and risk-avoidance. The economists have pointed out some other objectives such as achieving a target growth rate,makingatargetprofit,andmakingasatisfactoryorreasonableprofit.
Since it is the responsibility of business managers to achieve the objectiveofthefirm,theyneedtohaveaclearperceptionandunderstandingof the objective they have to achieve. Therefore, we begin the study of managerial economics with a brief discussion on the nature and purpose ofdifferentobjectivesofbusinessfirmsandwhyandwhatobjectiveofthefirmisdetermined.Thevariousobjectivesofbusinessfirmsaregenerallyclassifiedundertwocategories: (i)Profitmaximization,and (ii) Alternative objectives.
1.3.1 MaximizationofProfit
Theconventionaleconomictheoryassumesprofitmaximizationastheonlyobjectiveofbusinessfirms—profitmeasuredasTR–TC. Profitmaximizationastheobjectiveofbusinessfirmshasalonghistoryineconomicliterature.Itformsthebasisofconventionalpricetheory.Profitmaximizationisregardedas themost reasonable and analytically themost ‘productive’ businessobjective. The strength of this assumption lies in the fact that this assumption ‘hasneverbeenunambiguouslydisproved’.
Besides,profitmaximizationassumptionhasagreaterpredictivepower.Ithelpsinpredictingthebehaviourofbusinessfirmsintherealworldandalso the behaviour of price and output under different market conditions. Nootherhypothesisexplainsandpredictsthebehaviouroffirmsbetterthantheprofitmaximizationassumption.Nevertheless,theprofitmaximizationhas been questioned strongly by somemodern economists.This createda controversy on objectives of businessfirms.The controversyhas beendiscussed below in detail.
ControversyOnProfitMaximization:TheoryVs. Practice
As discussed above, the conventional theory of firm assumes profit maximization as the sole objective of the businessfirms.Somemoderneconomists,however,refutetheprofitmaximizationassumptionbecause,intheiropinion,itispracticallynon-achievable.Theirownfindingsrevealthatbusinessfirms,especiallybigcorporations,pursueseveralotherobjectives,

NOTES
Self-InstructionalMaterial 7
Nature and Scope of Managerial Economics
ratherthanprofitmaximization.However,somemoderneconomistshavestrongly defended the profitmaximization objective.This has created acontroversyontheprofitmaximizationobjectiveofthebusinessfirms.Inthissection,wediscussbrieflytheargumentsagainstandforprofitmaximizationobjective.
ArgumentsagainstProfit-MaximizationObjective
(i) The first argument against the profit maximization objective is based on the dichotomy between the ownership and management of businessfirms. It is argued that, in modern times, due to rapid growth oflargebusinesscorporations,managementofbusinessfirmshasgotseparated from the ownership. The separation of management from ownership gives managers an opportunity and also the discretion to set firm’s goals other than profitmaximization.The researchesconducted by the economists reveal that, in practice, business managers pursue such objectives as (a) maximization of sales revenue, (b) maximization of the value of the firm, i.e., the net worth of the firm, (c) maximization of managerial utility function, (d) maximization of firm’s growth rate, (e) making a target profit, (f) retaining and increasing market share, and so on.
(ii) Another argument against profit maximization objective is that traditionaltheoryoffirmassumesmanagerstohavefullandperfectknowledge of market conditions and of the possible future development inbusinessenvironmentoffirm.Thefirmisthussupposedtobefullyaware of its demand and cost conditions in both short and long runs. Briefly speaking under profitmaximization objective, a completecertainty about the market conditions is assumed. Some modern economistsquestionthevalidityofthisassumption.Theyarguethatthefirmsdonotpossesstheperfectknowledgeoftheircosts,revenueandfuture business environment. They operate in the world of uncertainty. Most price and output decisions are based on probabilities.Besides,itisfurtherarguedthattheequi-marginalprincipleofprofit
maximization,i.e.,equalizingMC and MR, has been claimed to be ignored inthedecision-makingprocessofthefirms.Empiricalstudiesofthepricingbehaviourof thefirmshaveshownthat themarginalruleofpricingdoesnotstandthetestofempiricalverification.HallandHitchhavefound,intheirstudyofpricingpracticesof38UKfirms,thatthefirmsdonotpursuetheobjectiveofprofitmaximizationandthattheydonotusethemarginalprinciple of equalizingMR and MC in their price and output decisions. Accordingtothem,mostfirmsaimatlong-runprofitmaximization.Intheshort-run, they set the price of their product on the basis of average cost principle, so as to cover AC = AVC + AFC (where AC = Average cost, AVC = Average variable cost, AFC =Averagefixedcost)andanormalmarginofprofit(usually10percent).

Nature and Scope of Managerial Economics
NOTES
Self-Instructional 8 Material
In a similar study, Gordon has found (i) that there is a marked deviation in the real business conditions from the assumptions of the traditional theory, and (ii) that pricing practices were notably different from the marginal theory of pricing. Gordon has concluded that the real business world is much more complex than the one postulated by the theorists. Because of the extreme complexity of the real business world and ever-changing conditions, the pastexperienceofthebusinessfirmsisoflittleuseinforecasting demand, priceandcosts.ThefirmsarenotawareoftheirMR and MC. The average-cost-principle ofpricingiswidelyusedbythefirms.Findingsofmanyotherstudies of the pricing practices lend support to the view that there is little link between pricing theory and pricing practices.
TheDefenceofProfitMaximization
Theargumentsagainstprofit-maximizationobjectiveshavebeenstronglyrejected by other economists. They argued strongly that pricing theory does haverelevancetotheactualpricingpolicyofthebusinessfirms.Asectionofeconomistshasstronglydefendedtheprofitmaximizationobjectiveand‘marginal principle’ of pricing and output decisions.The empirical andtheoreticalsupportputforwardbythemindefenceoftheprofitmaximizationobjective and marginal rule of pricing may be summed as follows.
In two empirical studies of 110 ‘excellentlymanaged companies’,J.S.Earleyhasconcludedthatthefirmsdoapplythemarginalrulesintheirpricing and output decisions. Fritz Maclup has argued in abstract theoretical terms that empirical studies by Hall and Hitch and by Lester do not provide conclusive evidence against the marginal rule and that these studies have their own weaknesses. He argues further that there has been a misunderstanding regarding the purpose of traditional theory of value. The traditional theory seeks to explain market mechanism, resource allocation through price mechanism and has a predictive value, rather than dealing with pricing practicesofindividualfirms.Therelevanceofmarginalrulesinactualpricingsystemoffirmscouldnotbeestablishedforlackofcommunicationbetweenthe businessmen and the researchers as they use different terminology. Researchers use technical terms like MR, MC and elasticities which are often abstract for businessmen. Besides, businessmen, even if they do understand economic concepts, would not admit that they are making abnormal profits onthebasisofmarginalrulesofpricing.Theywouldinsteadtalkofa‘fairprofit’.Also,Maclup is of theopinion that thepractices of settingprice equaltoaverage variable cost plus a profit margin is not incompatible with the marginal rule of pricing and that the assumptions of traditional theory are plausible.
While the controversy on profitmaximization objective remainsunresolved, the conventional theorists, the marginalists, continue to defend theprofitmaximizationobjective.

NOTES
Self-InstructionalMaterial 9
Nature and Scope of Managerial Economics
1.3.2 Value of Enterprise
Themodern theory of firmmakes a distinction between the ‘principal’(owner)andthe‘agent’(manager)ofthefirmandalsobetweentheobjectivesofownersandmanagers.Accordingtothemoderntheoryoffirm,owner’sobjective is the maximization of the value of the firm whereas objective of business managers is to maximize profitofthefirm.Theprofitmaximizationobjective is implicitlyassumed tobecurrentor short-runprofit,whereasmaximizationoffirm’svalueisalong-termobjective.Itimpliesthatownerspursue the long-term objective and managers pursue short-term objective. However, as we will see below, both objectives turn out to be the same. Let usfirstlookatthevaluemaximizationapproachofthemoderntheoryoffirm.
According to themodern theoryoffirm, owners of thefirmshavebeen found to pursue the objective of maximizing the value or the worth of thefirm.Tothisend,theyprefertosacrificetheshort-runobjectiveofprofitmaximization. Therefore, the recent development in the theoryofthefirm postulatesthattheobjectiveofbusinessfirmsistomaximizethevalue or the wealthofthefirms in the long run, i.e., the value at which can be sold out.
Thefuturevalueofthefirmisworkedoutbyestimatingthepresent valueoftheexpectedfutureprofitsofthefirmbydiscountingtheprofitbythe degree of risk. The formula for estimating the present value (PV) is given below.
PV 31 21 2 3 ...
(1 ) (1 ) (1 ) (1 )n
nr r r rπ ππ π= + + + +
+ + + +
1
1 (1 )
n
ni r=
π= ∑+
(where PV = sum of the presentvalueofexpectedfutureprofits;π1, π2, π3 …, πn representtheexpectedfutureprofitsfrom1ton years; r = rate of discount.
Notethatthepresentvalueofthefirm(PV), estimated by the formula givenabovedependsontheanticipatedrateofprofit(π).Since,therateofprofit isestimatedasTR –TC, the maximization of the value of the firm woulddependontherateofprofit(π).Itimpliesthatmaximizationofprofitwould maximize the present value of the firm–thehigherthevalueofπs,thehigherthevalueofthefirm.Itmaythusbeconcludedthattheobjectiveofmaximization of the value of thefirm is not different from the profitmaximizationobjectiveofthefirm.
Check Your Progress
1.Definemanagerialeconomics. 2.Whatdoesmacroeconomicsdealwith?

Nature and Scope of Managerial Economics
NOTES
Self-Instructional 10 Material
1.4 ANSWERS TO CHECK YOUR PROGRESS QUESTIONS
1.Managerialeconomicscanbedefinedasthestudyofeconomictheories,logic, concepts and tools of economic analysis applied in the process of business decision-making.
2. Macroeconomics deals with environmental issues— how is the economic condition of the country; what is the likely trend; what are government’s economic policies; how government policies might affect business environment of the country; what kind of business policy will berequired,andsoon.
1.5 SUMMARY
•Managerialeconomicscanbedefinedasthestudyofeconomictheories,logic, concepts and tools of economic analysis applied in the process of business decision-making.
• The primary function of managers is to take appropriate decisions and implement them effectively to achieve the objective of the organization to maximum possible extent, given the resources.
• It is because of these important contributions of economics to business decision making that economics has been integrated with managerial decisions. Managerial decision making without applying economic logic, theory and analytical tools may not offer a reasonable solution.
•Theconventionaleconomictheoryassumesprofitmaximizationastheonlyobjectiveofbusinessfirms—profitmeasuredasTR–TC.
•The arguments against profit-maximization objectives have beenstrongly rejected by other economists. They argued strongly that pricing theory does have relevance to the actual pricing policy of the business firms.
•Themoderntheoryoffirmmakesadistinctionbetweenthe‘principal’(owner)andthe‘agent’(manager)ofthefirmandalsobetweentheobjectives of owners and managers.
1.6 KEY WORDS
• Profit: It is afinancialbenefit that is realizedwhen theamountofrevenue gained from a business activity exceeds the expenses, costs and taxes needed to sustain the activity.

NOTES
Self-InstructionalMaterial 11
Nature and Scope of Managerial Economics
• Macroeconomics: It is the branch of economics that is concerned with the major, general features of a country’s economy, such as the level ofinflation,unemployment,orinterestrates.
1.7 SELF ASSESSMENT QUESTIONS AND EXERCISES
Short-Answer Questions
1. Write a short note on the concept of managerial economics. 2.Whatarethegoalsofcorporateenterprises? 3.Howdoesmanagerialeconomicsassistintakingbusinessdecisions?
Long-Answer Questions
1. Discuss the role and responsibilities of a managerial economist. 2.Analysetheargumentsforandagainstprofitmaximization. 3. Explain the value maximization approach of the modern theory of the
firm.
1.8 FURTHER READINGS
Dwivedi, D. N. 2008. Principles of Economics, Seventh Edition. New Delhi: Vikas Publishing House.
Weil. David N. 2004. Economic Growth. London: Addison Wesley.Thomas, Christopher R. and Maurice S. Charles. 2005. Managerial
Economics: Concepts and Applications, Eighth Edition. New Delhi: Tata McGraw-Hill Publishing Company Limited.
Mankiw, Gregory N. 2002. Principles of Economics, Second Edition. India: Thomson Press.

Demand Analysis
NOTES
Self-Instructional 12 Material
UNIT 2 DEMAND ANALYSISStructure 2.0 Introduction 2.1 Objectives 2.2 Elasticity of Demand 2.3 FactorsInfluencingPriceElasticityofDemand 2.4 Demand Determinants
2.4.1 Demand Distinctions 2.5 Types and Method 2.6 ApplicationofElasticitiesinBusinessDecision-Making 2.7 DemandForecasting:AnOverview
2.7.1 DemandForecatsingforIndustrialGoods,ConsumerGoodsandConsumerDurables
2.8 AnswerstoCheckYourProgressQuestions 2.9 Summary 2.10 Key Words 2.11 SelfAssessmentQuestionsandExercises 2.12 FurtherReadings
2.0 INTRODUCTION
Theanalysisofmarketdemandforafirm’sproductplaysacrucialroleinbusinessdecision-making.Themarketdemandorthesizeofthemarketatapointintimeatdifferentpricesgivestheoverallscopeofbusiness;itgivesprospectsforexpandingbusiness;anditplaysacrucialroleinplanningforfutureproduction,inventoriesofrawmaterials,advertisement,andsettingupsalesoutlets.Therefore,theinformationregardingthemagnitudeofthecurrent and future demand for the product is indispensable. Theory of demand providesaninsightandhelpsinanalysingtheseproblems.
2.1 OBJECTIVES
Aftergoingthroughthisunit,youwillbeableto: •Defineelasticityofdemand •Explainthefactorsinfluencingpriceelasticityofdemand • Identify the market demand determinants • Discuss the types of demands •Analyseapplicationofelasticitiesinbusinessdecision-making •Definedemandforecasting • State the demand forecastingmethods used for industrial goods,
consumergoodsandconsumerdurables

NOTES
Self-InstructionalMaterial 13
Demand Analysis2.2 ELASTICITY OF DEMAND
In general terms, the elasticity of demand is defined as the degree of responsiveness of demand for a product to change in its determinants.Themeasure of the degree of responsiveness of demand to change inits determinants gives themeasure of theextent of relationship between thedemandforaproductandanyofitsdeterminants.Intechnicalterms,themeasure of elasticity of demand is called elasticity coefficient measured by thefollowingformula:
Ed = PercentageChangeinQuantityDemandedofProductPercentageChangeinDemandDeterminantFactor
XY
Forinstance,supposeadeterminantofdemandforaproductchangesby10percentand,asaresult,demandchangesby15percent.Inthatcase,theelasticitycoefficientequals15/10=1.5.
Thegeneralformulaformeasuringtheelasticityofdemandcanbeexpressedasfollows.
Ed=//
Q Q Q YY Y F Q
∆ ∆= ×∆ ∆ …(2.1)
whereQ = quantity demanded initially;∆Q = change in demand,Y =theoriginalvalueofdemanddeterminantfactor;and∆Y=changeinthedeterminant factor.
Let us nowdiscuss the elasticity of demandwith reference to itsdifferent determinants.
2.2.1 Price Elasticity of Demand
Price elasticity of demand is generally defined as the responsiveness or sensitiveness of demand for a commodity to the changes in its price. More precisely,elasticity of demand is the percentage change in demand due to one per cent change in the price of the commodity.Aformaldefinitionofprice elasticity of demand (ep)isgivenas
ep = Percentage change in quantity demandedPercentage change in price
Ageneralformulaforcalculatingcoefficientofpriceelasticity,asgiveninEq.(8.1),isgivenasfollows:
ep =Q P Q P
Q P Q P∆ ∆ ∆÷ = ×
∆
=Q PP Q
∆ ×∆ …(2.2)
whereQ=originalquantitydemanded,P=originalprice,∆Q=changeinquantitydemandedand∆P=changeinprice.

Demand Analysis
NOTES
Self-Instructional 14 Material
Itisimportanttonoteherethataminussign(–)isgenerallyinsertedintheformulabeforethefractioninordertomaketheelasticitycoefficientanon-negativevalue.
Theprice elasticity canbemeasuredbetween any twopoints on ademand curve (called arc elasticity).
2.3 FACTORS INFLUENCING PRICE ELASTICITY OF DEMAND
Price-elasticityofdemandforaproductmayvarybetweenzeroandinfinity.However,price-elasticityofdemand,atagivenprice,variesfromproducttoproductdependingonthefollowingfactors. 1. Availability of Substitutes: One of the most important determinants
of elasticity of demand for a commodity is the availability of its close substitutes.Thehigherthedegreeofclosenessofthesubstitutes,thegreatertheelasticityofdemandforthecommodity.Forinstance,coffeeandtea,riceandwheat,andpetrolanddieselmaybeconsideredasclosesubstitutesforoneanother.Ifpriceofoneofthesegoodsincreases,theothercommoditybecomesrelativelycheaper.Therefore,consumersbuymoreoftherelativelycheapergoodandlessofthecostlierone,allotherthingsremainingthesame.Theelasticityofdemandforthesubstitutegoodswillbehigher.Besides, thewider therangeof thesubstitutes,thegreatertheelasticity.Forinstance,soaps,toothpastes,cigarettes,etc.,areavailableindifferentbrands,eachbrandbeingaclosesubstitutefortheother.Therefore,theprice-elasticityofdemandforeachbrandismuchgreaterthanthatforthegenericcommodity.Ontheotherhand,sugarandsaltdonothaveclosesubstitutesandhencetheirprice-elasticityislower.
2. Nature of Commodity: The nature of a commodity also affects the price-elasticityofitsdemand.Commoditiescanbegroupedasluxuries,comforts,andnecessities.Demandforluxurygoods(e.g.,high-pricerefrigerators,TVsets,cars,decorationitems,etc.)ismoreelasticthanthedemandfornecessitiesandcomfortsbecauseconsumptionofluxurygoodscanbedispensedwithorpostponedwhentheirpricesrise.Ontheotherhand,consumptionofnecessarygoods,(e.g.,sugar,clothes,vegetables)cannotbepostponedandhencetheirdemandisinelastic.Comfortshavemoreelasticdemandthannecessitiesandlesselasticthanluxuries.Commoditiesarealsocategorizedasdurablegoodsandperishableornon-durablegoods.Demandfordurablegoodsismoreelastic than that for non-durable goods, becausewhen the price oftheformerincreases,peopleeithergettheoldonerepairedinsteadofreplacingitorbuya‘secondhand’.

NOTES
Self-InstructionalMaterial 15
Demand Analysis 3. Weightage in the Total Consumption:Anotherfactorthatinfluencestheelasticityofdemandistheproportionofincomewhichconsumersspend on a particular commodity. If proportion of income spent on a commodityislarge,itsdemandwillbemoreelastic.Onthecontrary,iftheproportionofincomespentonacommodityissmall,itsdemandislessprice-elastic.Classicexamplesofsuchcommoditiesaresalt,matches,books,pens,toothpastes,etc.Thesegoodsclaimaverysmallproportionofincome.Demandforthesegoodsisgenerallyinelasticbecauseincreaseinthepriceofsuchgoodsdoesnotsubstantiallyaffecttheconsumer’sbudget.Therefore,peoplecontinuetopurchasealmostthesamequantityevenwhentheirpricesincrease.
4. Time Factor in Adjustment of Consumption Pattern:Price-elasticityof demand depends also on the time consumers need to adjust their consumption pattern to a new price:thelongerthetimeavailable,thegreatertheprice-elasticity.Thereasonisthatoveraperiodoftime,consumersareabletoadjusttheirexpenditurepatterntopricechanges.For instance, if the price of highquality cell phones is decreased,demandwillnotincreaseimmediatelyunlesspeoplepossessexcesspurchasingpower.Butovertime,peoplemaybeabletoadjusttheirexpenditurepatternsothattheycanbuyalaptopatalower(new)price.Consideranotherexample.Ifpriceofpetrolisreduced,thedemandforpetroldoesnotincreaseimmediatelyandsignificantly.Overtime,however,peoplegetincentivefromlowpetrolpricestobuyautomobilesresultinginasignificantriseindemandforpetrol.
5. Range of Commodity Use: The range of uses of a commodity also influencestheprice-elasticityofitsdemand.Thewidertherangeoftheusesofaproduct,thehighertheelasticityofdemandforthedecreaseinprice.Asthepriceofamulti-usecommoditydecreases,peopleextendtheirconsumptiontoitsotheruses.Therefore,thedemandforsuchacommoditygenerallyincreasesmorethantheproportionateincreaseinitsprice.Forinstance,milkcanbetakenasitisandintheformofcurd,cheese,gheeandbutter-milk.Thedemandformilkwillthereforebehighlyelasticfordecreaseinprice.Similarly,electricitycanbeusedforlighting,cooking,heatingandforindustrialpurposes.Therefore,withdecreaseinitsprice,demandforelectricityhasagreaterelasticity.However,fortheincreaseinprice,suchcommoditieshavealowerprice-elasticitybecausetheconsumptionofanormalgoodcannotbecutdownsubstantiallybeyondapointwhenthepriceofthecommodityincreases.
6. Proportion of Market Supplied: The elasticity of market demand also depends on the proportion of the market supplied at the ruling price. Iflessthanhalfofthemarketissuppliedattherulingprice,price-elasticityofdemandwillbehigherthan1andifmorethanhalfofthemarketissupplied,e < 1.

Demand Analysis
NOTES
Self-Instructional 16 Material
2.4 DEMAND DETERMINANTS
Market demand for a product depends on a number of factors, calleddeterminants of demand.Theknowledgeofthedeterminantsofmarketdemandforaproductandthenatureofrelationshipbetweenthedemandanditsdeterminantsprovesveryhelpfulinanalyzingandestimatingdemandforthe product. It may be noted at the very outset that a host of factors determine the market demand for a product.
Ingeneral,however,followingarethefactorsthatdeterminethemarketdemandforaproduct: • Priceoftheproduct, • Priceoftherelatedgoods—substitutes,complementsandsupplements, •Levelofconsumers’income, •Consumers’tasteandpreferences, •Advertisementoftheproduct, •Consumers’expectationsaboutfuturepriceandsupplyposition, • Demonstrationeffectand‘bandwagoneffect’, •Consumer-creditfacility, • Populationofthecountry(forthegoodsofmassconsumption), •Distributionpatternofnationalincome,etc.
Tothislist,onemayaddsuchfactorsasoff-seasondiscountsandgifts,numberofusesofacommodity,leveloftaxationandthegeneralsocialandpoliticalenvironmentofthecountry(especiallywithrespecttodemandforcapitalgoods).
Allthesefactorsare,however,notequallyimportant.Besides,someofthemarenotevenquantifiable.Forexample,consumer’spreferences,utility,demonstrationeffect,expectations,etc.,aredifficulttomeasure.Nevertheless,wewilldiscussherebothquantifiableandnon-quantifiabledeterminantsofthe demand for a product.1. Price of the Product: The price of a product is one of the most important determinantsofitsdemandinthelong-runandtheonlydeterminantintheshort-run.Thepriceofaproductanditsquantitydemandedareinverselyrelated. Thelawofdemandstatesthatthequantitydemandedofaproductwhichitsconsumers/userswouldliketobuyperunitoftime,increaseswhenitspricefallsanddecreaseswhenitspriceincreases,other factors remaining constant.The assumption ‘other factors remaining constant’ implies thatfactorsotherthanpriceremainconstant,particularlyincomeoftheconsumers,pricesof thesubstitutesandcomplementarygoods,consumer’s tasteandpreferences, andnumberof consumers, remainunchanged.Other factors

NOTES
Self-InstructionalMaterial 17
Demand Analysisremainingconstnat,priceisthemaindeterminantofmarketdemandespeciallyin short run.2. Price of the Related Goods: The demand for a commodity is also affected bythechangesinthepricesofitsrelatedgoods.Relatedgoodsareclassifiedundertwocategories:(i)substitutes, and (ii) complementary goods.(i) Substitutes:Two commodities are deemed to be substitutes for one anotheriftheysatisfythesamewantandchangeinthepriceofonechangesthedemandforitssubstituteinthesamedirection.Thatis,increaseinthepriceofagoodincreasesdemandforitssubstitutes.Forinstance,teaandcoffee,hamburgersandhot-dogs,petrolandCNG,alcoholanddrugsaresomecommonexamplesofsubstitutesinthecaseofconsumergoods.Whatisimportantfrommanagerialpointofviewisthatincreaseinthepriceofagood(say,X) causes increase in demand for its substitute (say Y).
The demand function for X and Ywithrespect to thepriceof theirsubstitutescanbewrittenasfollows.
Dx=f(Py),∆Dx/∆Py > 0 and Dy=f(Px),∆Dy/∆Px > 0
(b)
Fig. 2.1 Demand for Substitutes and Complements
Whenpriceofasubstitutegood(say,coffee)ofaproduct(tea)falls(orincreases),thedemandfortheproductfalls(orincreases).Thedemand-pricerelationshipofthisnatureisgiveninFig.2.1(a).(ii) Complements: A commodity is considered to be a complement for anotherwhenitcomplementstheuseoftheother.Incaseofcomplements,theuseofthetwogoodsgoestogether.Forexample,petrolisacomplementtocars,butterandjamtobread,milkandsugartoteaandcoffee,electricitytocomputer,chairtotable,etc.Ineconomicsense,twogoodsaretermedas complementary to one another if an increase in the price of one causes a decreaseindemandfortheother.Bydefinition,thereisaninverserelationbetweenthedemandforagoodandthepriceofitscomplement.Forinstance,an increase (or decrease) in the price of petrol causes a decrease (or an

Demand Analysis
NOTES
Self-Instructional 18 Material
increase)inthedemandforcarsandotherpetrol-runvehicles,otherthingsremainingthesame.Thedemandfunctionforcar(Dc) in relation to petrol price (Pp)canbewrittenas
Dc=f(Pp),DDc /DPp < 0Therelationshipbetweenthedemandforaproduct(car)andtheprice
ofitscomplement(petrol)isgiveninFig.2.1(b).3. Consumer’s Income: Incomeis thebasicdeterminantofquantityofaproductdemandedasitdeterminesthepurchasingpoweroftheconsumer.Thatiswhypeoplewithhighercurrentdisposableincomesspendalargeramount on consumer goods and services than thosewith lower income.Income-demandrelationshipisofamorevariednaturethanthatbetweendemandanditsotherdeterminants.Whileotherdeterminantsofdemand,e.g.,product’sownpriceandthepriceofitssubstitutesaremoresignificantintheshort-run,incomeasadeterminantofdemandisequallyimportantinbothshort-runandlong-run.
The relationshipbetween thedemand foracommodity, sayX, andthe household income (Y),assumingallotherfactorstoremainconstant,isexpressedbyademandfunctionsuchas
Dx=f(Y),DDx /DY > 0Beforeweproceed todiscuss income-demand relationships, itwill
be useful to note that consumergoodsof different nature havedifferentrelationshipswith incomes of different categories of consumers.Themanagersneed,therefore,tobefullyawareofthegoodstheyaredealingwithandtheirrelationshipwiththeincomeofconsumers,particularlyinregardtotheassessmentofbothexistingandprospectivedemandforaproduct.
For the purpose of income-demand analysis, consumer goods andservicesmay be grouped under four broad categories, viz. (a) essential consumergoods, (b) inferiorgoods, (c)normalgoods, and (d) luxuryorprestigegoods.Letusnowlookintotherelationshipbetweenincomeandthedifferentgoods.ThisrelationshipispresentedthroughEngelcurves.(a) Essential consumer goods (ECG):Thegoodsandservicesinthiscategoryarecalled‘basicneeds’andareconsumedbyallpersonsofasociety,e.g.,foodgrains,salt,vegetableoils,matches,cookingfuel,minimumclothingandhousing.Quantitydemandedofthiscategoryofgoodsincreaseswithincreaseinconsumer’sincomebutonlyuptoacertainlimit,eventhoughthetotalexpendituremayincreaseinaccordancewiththequalityofgoodsconsumed,otherfactorsremainingthesame.Therelationshipbetweengoodsofthiscategoryandconsumer’sincomeisshownbythecurveECGinFig.2.2. As the curve EGC shows, a consumer’sdemand for essentialgoodsincreases only until his income rises to OY2. It tends to saturate beyond this level of income.

NOTES
Self-InstructionalMaterial 19
Demand Analysis
Fig. 2.2 Income Demand Curves
(b) Inferior goods (IG):Inferiorandsuperiorgoodsarewidelyknowntobothconsumersandsellers.Forinstance,everyconsumerknowsthatmilletisinferiortowheatandrice;bidi(indigenouscigarette)isinferiortocigarette,cottonclothesare inferior to silkclothes,kerosene is inferior tocookinggas;bikeisinferiortocar;non-ACcarisinferiortoAC-car,andsoonandsoforth.Ineconomicsense,however,a commodity is deemed to be inferior if its demand decreases with the increase in consumer’s income beyond a certain level of income.ThenatureofrelationbetweenincomeanddemandforaninferiorgoodisshownbythecurveIGinFig.2.2undertheassumptionthatotherdeterminantsofdemandremainthesame.Demandforsuchgoodsrisesonlyuptoacertainlevelofincome(say,OY1) and declines as income increases beyond this level.(c) Normal goods (NG):Technically, normal goods are those that aredemanded in increasingquantities as consumers’ income rises.Clothing,house, furniture,andautomobilesaresomeof the importantexamplesofthiscategoryofgoods.ThenatureofrelationbetweenincomeanddemandforthegoodsofthiscategoryisshownbythecurveNGinFig.2.2.Asthecurveshows,demandforsuchgoodsincreaseswiththeincreaseinincomeoftheconsumer,butatdifferentratesatdifferentlevelsofincome.Demandfornormalgoodsincreasesrapidlywiththeincreaseintheconsumer’sincomebutslowsdownwithfurtherincreasesinincome.
ItmaybenotedfromFig.2.2thatuptoacertainlevelofincome(Y1) therelationbetweenincomeanddemandforalltypesofgoodsissimilar.Thedifferenceisonlyofdegree.Therelationbecomesdistinctlydifferentbeyond the Y1levelofincome.Fromamanagerialpointofview,therefore,itisimportanttoviewtheincome-demandrelationsinthelightofthenatureofproductandthelevelofconsumers’income.

Demand Analysis
NOTES
Self-Instructional 20 Material
(d) Luxury and prestige goods (LG):What is andwhat is not a luxurygood is amatterof consumer’sperceptionof theneed for a commodity.Conceptually,however,allsuchgoodsthataddtothepleasureandprestigeoftheconsumerwithoutenhancinghisearningcapacityorefficiencyfallinthecategoryofluxurygoods.Forexample,stone-studdedjewellery,costlybrandsofcosmetics,luxurycars,accommodationin5-starhotels,travelbyfirst-classrailwayACcars,businessclassairtravel,etc.,canbetreatedasluxurygoods.Aspecialcategoryofluxurygoodsisthatofprestigegoods,e.g.,preciousstones,ostentatiousdecorationofbuildings,rarepaintingsandantiques,diamond-studdedjewelleryandwatches,prestigiousschools,etc.Demandforsuchgoodsarisesbeyondacertainlevelofconsumer’sincome,i.e.,consumptionofluxurygoodsatacertainlevelhighlevelofincome.Producersofsuchitems,whileassessingthedemandfortheirproduct,shouldconsidertheincomechangeintherichersectionofthesociety,andnotmerelythe per capita income (see curve LGinFig.2.2).4. Consumer’s Taste and Preference:Consumer’s taste and preferenceplayanimportantroleindeterminingthedemandforaproduct.Tasteandpreferencegenerallydependonlife-style,socialcustoms,religiousvaluesattachedtoacommodity,habitofthepeople,thegenerallevelsoflivingofthesociety,andageandsexoftheconsumers.Changeinthesefactorschangesconsumers’tasteandpreferences.Asaresult,consumersreduceorgiveupthe consumptionof somegoods and addnewones to their consumptionpattern.Forexample,followingthechangeinfashion,peopleswitchtheirconsumptionpattern fromcheaper, old-fashionedgoodsover to costlier,moderngoods,solongaspricedifferentialsarecommensuratewiththeirpreferences.Consumersarepreparedtopayhigherpricesfor‘moderngoods’eveniftheirutilityisvirtuallythesameasthatofold-fashionedgoods,e.g.,newfashionsuitstoolddesignsuits,flatTVsetstoboxTVsets,andmodernshoestoolddesignshoes,etc.
Thispieceof information is useful for themanufacturersofgoodsand services subject to frequent changes in fashion and style, at least intwoways:(i)theycanmakequickprofitsbydesigningnewmodelsoftheirproductandpopularisingthemthroughadvertisement,and(ii) they can plan production better and can even avoid over-production if they keep an eye on thechangingfashions.5. Advertisement Expenditure: Productsareadvertisedwiththeobjectiveofpromotingsalesoftheproduct.Advertisementhelpsinincreasingdemandfortheproductinatleastfourways:(a)byinformingthepotentialconsumersabouttheavailabilityoftheproduct;(b)byshowingitssuperiorityovertherivalproduct;(c)byinfluencingconsumers’choiceagainsttherivalproducts;and (d)bysettingnewfashionsandchanging tastes.The impactofsucheffectsshiftsthedemandupwardtotheright.Inotherwords,otherfactorsremainingthesame,asexpenditureonadvertisementincreases,volumeofsalesincreasestoanextent.

NOTES
Self-InstructionalMaterial 21
Demand Analysis6. Consumers’ Expectations:Consumers’expectationsregardingthefutureprices,income,andsupplypositionofgoods,etc.playanimportantroleindeterminingthedemandforgoodsandservicesintheshort-run.Ifconsumersexpectahighriseinthepriceofastorablecommodity,theywouldbuymoreof itat itshighcurrentpricewithaviewtoavoidingthepinchofahighpriceriseinfuture.Onthecontrary,ifconsumersexpectafallinthepriceofcertaingoods,theypostponetheirpurchaseofsuchgoodswithaviewtotakingadvantageoflowerpricesinfuture,mainlyinthecaseofnon-essentialgoods.Thisbehaviourofconsumersreducesthecurrentdemandforgoodswhosepricesareexpectedtodecreaseinthefuture.
Similarly, an expected increase in income increases demand. Forexample,announcementof ‘dearnessallowance’,bonus, revisionofpay-scale, etc., induces increase in current purchases.Besides, if scarcity ofcertaingoodsisexpectedbytheconsumers/usersonaccountofareportedfallinfutureproduction,strikesonalargescale,diversionofcivilsuppliestowardsmilitaryuse,etc.,thecurrentdemandforsuchgoodstendstoincrease,moresoiftheirpricesshowanupwardtrend.Consumersdemandmoreforfutureconsumptionandprofiteersdemandmoretomakemoneyoutofanexpectedscarcity.7. Demonstration and Snob Effect:Whennewcommoditiesornewmodelsofexistingonesappearinthemarket,richpeoplebuythemfirst.Forinstance,whenanewmodelofacarappearsinthemarket,richpeoplewouldmostlybe thefirst buyers.ColourTV sets andVCRswerefirst seen in affluenthouseholds.Somepeoplebuygoodsornewmodelsofgoodsbecausetheyhaveagenuineneedforthemorhaveexcesspurchasingpower.Someothersdosobecause theywant toexhibit theiraffluence.According toa socialphilospher,WillSmith,“Toomanypeoplespendmoneytheyhaven’tearned,tobuythingstheydon’tneed,toimpresspeopletheydon’tlike.”.Butoncenewcommodities are in vogue,manyhouseholds buy themnot becausetheyhaveagenuineneedforthembutbecausetheirneighbourshaveboughtthesegoods.Thepurchasesmadebythelattercategoryofthebuyersariseoutofsuchfeelingsasjealousy,competitionandequalityinthepeergroup,socialinferiorityandthedesiretoraisetheirsocialstatus.Purchasesmadeonaccountofthesefactorsaretheresultofwhateconomistscall‘Demonstrationeffect’orthe‘Bandwagoneffect’.Thesefactorshaveapositiveeffectondemand.Onthecontrary,whenacommoditybecomesthethingofcommonuse,somepeople,mostlyrich,decreaseorgiveuptheconsumptionofsuchgoods.Thisisknownasthe‘Snobeffect’.Ithasanegativeeffectonthedemandfortherelatedgoods.8. Consumer-Credit Facility: Availability of credit to the consumers from thesellers,banks,relationsandfriends,orfromothersources,enducestheconsumerstobuymorethanwhattheywouldbuyintheabsenceofcreditfacility.Thatiswhyconsumerswhocanborrowmorecanconsumemore

Demand Analysis
NOTES
Self-Instructional 22 Material
thanthosewhocannotborrow.Creditfacilitymostlyaffectsthedemandfordurablegoods,particularlythosewhichrequirebulkpaymentat thetimeofpurchase.Thecar-loanfacilitymaybeonereasonwhyDelhihasmorecarsthanCalcutta,ChennaiandMumbaiallputtogether.RealtybusinessboomedinDelhi,NOIDAandGurgaonmainlybecauseofhousingloansmadeavailablebythebanks.Themanagerswhoareassessingtheprospectivedemandfortheirproductsshould,therefore,takeintoaccounttheavailabilityof credit to the consumers.9. Population of the Country: The total domestic demand for a product of massconsumptiondependsalsoonthesizeofthepopulation.Giventheprice,percapitaincome,tastesandpreferencesetc.,thelargerthepopulation,thelargerthedemandforaproduct.Withanincrease(ordecrease)inthesizeofpopulationandwiththeemploymentpercentageremainingthesame,demandfortheproducttendstoincrease(ordecrease).TheglobalperceptionthatIndiaoffersthelargestmarketintheworldisbasedonthefactthatshehasthesecondlargestpopulation–albeitwithalowpurchasingpower–intheworld.10. Distribution of National Income: The level of national income is the basic determinant of themarket demand for a product—the higher thenationalincome,thehigherthedemandforallnormalgoodsandservices.Apartfromitslevel,thedistributionpatternofnationalincomeisalsoanimportant determinant of the overall demand for a product. If national incomeisunevenlydistributed,i.e.,ifamajorityofthepopulationbelongstothelowerincomegroups,marketdemandforessentialgoods,includinginferiorones,willbethelargestwhereasthedemandforothergoodswillberelativelylower.
2.4.1 Demand Distinctions
Themanagersaresupposedtobeclearaboutthekindofdemandtheyaredealingwith.The demand for various goods and services are generallyclassifiedonthebasisoftheconsumersoftheproduct,suppliersoftheproduct,natureof theproduct,seasonalnatureof thedemand,interdependenceofdemandfortwoproducts,etc.Herewediscusssomemajorkindsofdemandsthatfigureinbusinessdecisions.(i) Individual Demand and Market Demand: Asnotedabove,individual demand referstothequantityofproductdemandedbyanindividualatapointintimeoroveraperiodoftimegiventhepriceoftheproduct,givenhis income, price of the related goods (substitutes and complements),consumer’stasteandpreferences,priceexpectations,andexternalinfluences(e.g.,bandwagonanddemonstrationeffects).
Asexplainedabove,market demandreferstothequantitythatalltheconsumersofacommodityarewillingtobuyatagivenpricepertimeunit,
NOTES
Self-InstructionalMaterial 23
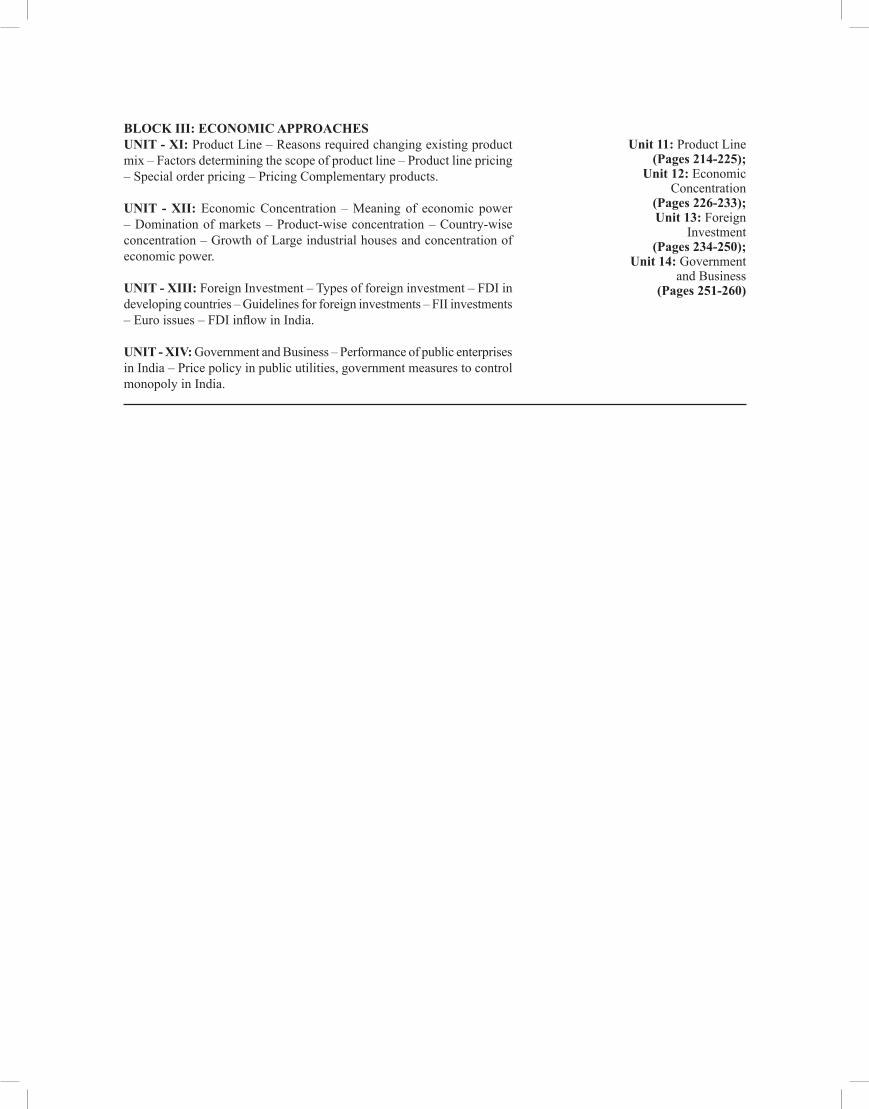
Demand Analysisgiventheirmoneyincome,tasteandpricesofothercommodities(mainlysubstitutes).Inotherwords,themarketdemandforacommodityisthesumofindividualdemandsbyalltheconsumers(orbuyers)ofthecommodity,overatimeperiodandatagivenprice,otherfactorsremainingthesame.(ii) Demand for Firm’s Product and Industry’s Product: Thequantitythatafirmdisposesofatagivenpriceoveratimeperiodconnotesthedemandforthefirm’sproduct.Theaggregateofdemandfortheproductofallthefirmsofanindustryisknownasthemarketdemandordemandforindustry’sproduct.Thisdistinctionbetweenthetwodemandsisnotofmuchuseinahighly competitive market, e.g.,thefruitandvegetablemarkets.Inthesemarkets,eachsellerhasaninsignificantshareinthemarket.Therefore,demandforfirm’sproductisnotofsignificance.
However,wheremarketstructureisoligopolistic,adistinctionbetweenthedemandforafirm’sproductandfortheindustry’sproductisusefulfromthemanagerialdecisionpointofview.For,insuchmarkets,productofeachfirmissodifferentiatedfromtheproductoftherivalfirmsthatconsumerstreateachproductasdifferentfromtheother.Thisgivesfirmsanopportunitytomanoeuvretheprice,capturealargermarketsharethroughadvertisementand,thereby,toenhancetheirownprofit.Forinstance,marketsformotorcars,radios,TVsets,refrigerators,scooters,toiletsoaps,toothpastes,etc.,belongtothiscategoryofmarkets.Forexamples,therewaspricecompetitionbetweenMULandothercarcompaniesin2005.
Incaseofmonopolyandperfectcompetition,thedistinctionbetweendemandforafirm’sproductandthatoftheindustryisnotofmuchusefrommanagerialpointofview.Incaseofmonopoly,theindustryisaone-firmindustryandthedemandfor thefirm’sproduct is thesameas thatof theindustry.Incaseofperfectcompetition,productsofallfirmsoftheindustryarehomogeneous;consumersdonotdistinguishbetweenproductsofdifferentfirms;andpriceforeachfirmisdeterminedbythemarketforces(i.e., demand andsupplyfortheindustryaswhole).Firmshaveonlylittleopportunitytomanoeuvre the prices permissible under local conditions and advertisement byafirmbecomeseffectiveforthewholeindustry.Therefore,conceptualdistinctionbetweendemandforafirm’sproductandforthatoftheindustryisnotofmuchuseinbusinessdecisions-making.(iii) Autonomous and Derived Demand: An autonomous demand or direct demandforacommodityisonethatarisesonitsownoutofanaturaldesireof the people to consume or possesses a commodity. An autonomous demand isindependentofthedemandforanyothercommodity.Forexample,considerthedemandforcommoditieswhicharisesdirectly fromthebiologicalorphysicalneedsofhumanbeings,e.g.,demandforfood,clothes,shelter,etc.Demandforthesegoodsandthelikeisautonomous demand. Autonomous demandmayalsoariseasaresultof‘demonstrationeffect’,ariseinincome,increaseinpopulationandadvertisementofnewproducts.

Demand Analysis
NOTES
Self-Instructional 24 Material
Ontheotherhand,thedemandforacommoditythatarisesbecauseofthedemandforsomeothercommodity,called‘parentproduct’,iscalledderived demand.Forinstance,demandforland,fertilizersandagriculturaltools and implements is a deriveddemandbecausethesegoodsaredemandedbecauseofdemandforfood.Similarly,demandforsteel,bricks,cementetc.is a deriveddemand–derivedfromthedemandforhousingandcommercialbuildings.Ingeneral,thedemandforproducergoodsorindustrialinputsisaderivedone.Alsothedemandforcomplementarygoods(whichcomplementtheuseofothergoods)orforsupplementarygoods(whichsupplementorprovideadditionalutilityfromtheuseofothergoods)isaderiveddemand.Forinstance,petrolisacomplementarygoodforautomobilesandachairisacomplementtoatable.Considersomeexamplesofsupplementary goods. Butterisasupplementtobread;mattressisasupplementtocot;andsugarisasupplementtotea—forsome,itisacomplement.Therefore,demandforpetrol,chairandsugarwouldbeconsideredasderived demand.
The conceptual distinction between autonomous demand (i.e.,demandfora‘parentproduct’)andderiveddemandwouldbeusefulfromabusinessman’spointofviewtotheextentthattheformercanserveasanindicator of the latter.(iv) Demand for Durable and Non-durable Goods: Demand is also often classifiedunderdemandfordurableandnon-durablegoods.Durable goods are thosewhose totalutilityorusefulness isnotexhausted inasingleorshort-runuse.Suchgoodscanbeusedrepeatedlyorcontinuouslyoveraperiodoftime.Durablegoodsmaybeconsumergoodsaswellasproducergoods.Durable consumer goods includeclothes,shoes,houses,furniture,utensils,refrigerators,scooters,cars,cellphones,etc.Thedurableproducergoodsincludemainlyitemsunder‘fixedassets’,suchasbuildings,plants,machinery,officefurnitureandfixturesetc.Thedurablegoods,bothconsumerandproducerdurablegoods,maybefurtherclassifiedas‘semi-durables’(e.g.,clothesandfurniture)and‘durables’(e.g.,residentialandfactorybuildings,cars,etc.).
Non-durable goods, ontheotherhand,arethosewhichcanbeusedorconsumedonlyonce(e.g.,fooditems)andtheirtotalutilityisexhaustedinasingleuse.Thegoodsofthiscategoryofgoodstoomaybegroupedundernon-durable consumer goods and non-durable producer goods.Allfooditems,drinks,soaps,cookingfuel,(gas,kerosene,coaletc.), lighting,cosmeticsetc.,fallintheformercategory.Inthelattercategory,fallsuchgoodsasrawmaterials,fuelandpower,finishingmaterialsandpackingitems,etc.
Thedemandfornon-durablegoodsdependslargelyontheircurrentprices,consumers’incomeandfashionandissubjecttofrequentchangeswhereasthedemandfordurablegoodsisinfluencedalsobytheirexpectedprice, income and change in technology.Thedemand for durable goodschangesoverarelativelylongerperiod.

NOTES
Self-InstructionalMaterial 25
Demand AnalysisThereisanotherpointofdistinctionbetweenthedemand for durable andnon-durablegoods.Durable goods create replacement demand whereas non-durable goods do not. Also, the demand for non-durable goods increases (or decreases) lineally whereas the demand for durable goods increases (or decreases) exponentially due to an increase in stock of durable goods and hence accelerated depreciation.(v) Short-term and Long-term Demand: From demand-analysis point of view, demand is classified also under short-termdemand and long-termdemand. Short-termdemandreferstothedemandforgoodsthatarerequiredoverashortperiodoftime.Inthiscategoryarefoundmostlyfashionconsumergoods,goodsofseasonaluse,inferiorsubstitutesduringthescarcityperiodofsuperiorgoods,etc.Forinstance,thedemandforfashionwearisashort-termdemandthoughthedemandforgenericgoods(trousers,shoes,ties,etc.)continuestoremainalong-termdemand.Similarlydemandforumbrellas,raincoats,gum-boots,cold-drinks,icecreamsetc.,isshort-termdemandofseasonalnature.Thedemandforsuchgoodslaststilltheseasonlasts.Somegoodsofthiscategoryaredemandedforaveryshortperiod(1–2weeks),e.g.,NewYeargreetingcards,candlesandcrackersontheoccasionofDiwali.
Althoughsomegoodsareusedonlyseasonally, theyareofdurablenature,e.g.,electricfans,woollengarments,etc.Thedemandforsuchgoodsisofadurablenaturebutitissubjecttoseasonalfluctuation.Sometimes,demandforcertaingoodssuddenly increasesbecauseofscarcityof theirsuperior substitutes.For example,when supplyof cookinggas suddenlydecreases,demandforkerosene,cookingcoalandcharcoalincreases.Insuchcases,additionaltemporaldemandisofashort-termnature.
The long-term demand,ontheotherhand,referstothedemandwhichexistsoveralongperiod.Thechangeinlong-termdemandisperceptibleonlyafteralongperiod.Mostgenericgoodshavelong-termdemand.Forexample,demandforconsumerandproducergoods,durableandnon-durablegoodsislong-termdemand,thoughtheirdifferentvarietiesorbrandsmayonly have a short-term demand.
Short-termdemanddepends,byandlarge,onthepriceofcommodities,price of their substitutes, current disposable income of the consumer,their ability to adjust their consumption pattern and their susceptibility to advertisementofanewproduct.The long-termdemanddepends,byandlarge,onthelong-termincometrends,availabilityofbettersubstitutes,salespromotion,consumercreditfacility,etc.
The short-term and long-term concepts of demand are useful indesigningnewproducts forestablishedproducersandchoiceofproductsfornewentrepreneurs,inpricingpolicy,andindeterminingandphasingtheadvertisementexpenditure.

Demand Analysis
NOTES
Self-Instructional 26 Material
2.5 TYPES AND METHODS
Let us discuss the different types and methods of demand.
Cross-Elasticity of DemandThe cross-elasticity is the measure of responsiveness of demand for a commodity to the changes in the price of its substitutes and complementary goods. Forinstance,cross-elasticityofdemandforteaisthepercentagechangeinitsquantitydemandedduetothechangeinthepriceofitssubstitute,coffee.Theformulaformeasuring cross-elasticity of demand is the same as that of the price elasticitywith a difference. For example, cross-elasticity of demand for tea (et, c) can be measuredby the formulagivenbelow.
et, c = Percentage change in demand for tea ( )Percentage change in price of coffee ( )
t
c
QP
Thecross-elasticityofdemandforteawithrespectpriceofcoffeecanbeexpressedtechnicallyasfollows.
= .c t
t c
P QQ P
∆∆ …(2.3)
Similarly,cross-elasticityofdemandforcoffeewithrespecttochangeinthepriceofteaismeasuredasfollows.
ec, t= .t c
c t
P QQ P
∆∆
…(2.4)
The same formula is used to measure the cross-elasticity of demand foragoodwithrespecttoachangeinthepriceofitscomplementarygoods.Electricitytoelectricalgadgets,petroltoautomobiles,buttertobread,sugartoteaandcoffee,aretheexamplesofcomplementarygoods.
It is important tonote thatwhen twogoodsare substitutes foroneanother,theirdemandhaspositivecross-elasticitybecauseincreaseinthepriceofonegoodincreasesthedemandforitssubstitute.And,thedemandforcomplementarygoodshasnegativecross-elasticity,becauseincreaseinthepriceofacomplementarygooddecreasesthedemandforthemaingood.
Income-Elasticity of Demand
Apart fromthepriceofaproductand itssubstitutes,consumer’s incomeisanotherbasicdeterminantofdemandforaproduct.Asnotedearlier,therelationshipbetweenquantitydemandedandconsumersincomeisofpositivenature,unlikethenegativeprice-demandrelationship.Thedemandformostgoodsandservicesincreaseswithincreaseinconsumer’sincomeandvice versa. The responsiveness of demand to the changes in income is known as income-elasticity of demand.

NOTES
Self-InstructionalMaterial 27
Demand AnalysisIncome-elasticityofdemand for aproduct, sayX, (i.e.,ey) may be measuredas:
ey=% change in demand for product% change in consumer’s income
q
q
XX YX YY
∆ ∆=
ey=q
q
XYX Y
∆⋅
∆ …(2.5)
(whereXq=quantityofXdemanded;Y=disposableincome;∆Xq=changeinquantityofXdemanded;and∆Y=changeinincome)
Obviously, the formula formeasuring income-elasticity of demandis thesameas that formeasuring theprice-elasticity.Theonlychangeintheformulaisthatthevariable‘income’(Y) is substituted for the variable ‘price’(P).Here,incomereferstothedisposableincome,i.e.,incomenetoftaxes.Allotherformulaeformeasuringprice-elasticitiesmaybyadoptedtomeasuretheincome-elasticities,keepinginmindthedifferencebetweentheindependentvariablesandthepurposeofmeasuringincome-elasticity.
Toestimate income-elasticity, letus suppose, for example, that thegovernmentannouncesa10percentdearnessallowancetoitsemployees.Asaresultaveragemonthlysalaryofgovernmentemployeesincreasesfrom`20,000to 22,000.Followingthepay-hike,monthlypetrolconsumptionofgovernmentemployeesincreasesfrom150litrepermonthto165litre.Theincome-elasticityofpetrolconsumptioncannowbeworkedoutasfollows.Inthiscase,∆Y=`22,000–`20,000=`2,000,and∆Q(oildemand)=165litre–150litre=15litre.BysubstitutingthosevaluesinEq.(2.5),weget
ey=20,000 15 1150 2,000
× =
Itmeansthatincomeelasticityofpetrolconsumptionbygovernmentemployeesequals1.Insimplewords,ey=1meansthataonepercentincreasein income results in a one per cent increase in petrol consumption.
Unlikeprice-elasticityofdemand,whichisalwaysnegative,income-elasticityofdemandisalwayspositivebecauseofapositiverelationshipbetweenincomeandquantitydemandedofaproduct.Butthereisanexception tothisrule.Income-elasticityofdemandforaninferiorgoodisnegative,becauseof the inversesubstitutioneffect.Thedemandfor inferiorgoodsdecreaseswith increase in consumer’s income.The reason is thatwhenincome increases,consumers switchover to theconsumptionof superiorsubstitutes,i.e.,theysubstitutesuperiorgoodsforinferiorones.Forinstance,whenincomerises,peopleprefertobuymoreofriceandwheatandlessofinferiorfoodgrains;non-vegetariansbuymoreofmeatandlessofpotato,and travellers travel more by plane and less by train.

Demand Analysis
NOTES
Self-Instructional 28 Material
Nature of Commodity and Income-Elasticity
For all normal goods, income-elasticity is positive though the degree ofelasticityvariesinaccordancewiththenatureofcommodities.Consumergoodsofthethreecategories,viz.,necessities,comfortsandluxurieshavedifferentelasticities.Thegeneralpatternofincome-elasticitiesofdifferentgoodsforincreaseinincomeandtheireffectonsalesaregiveninTable2.1.AsTable2.1shows,incomeelasticityofessentialgoodsinlessthan1.ItissobecauseofEnget’slawIncomeelasticityof‘comforts’equals1.And,incaseofluxurygoods,ey > 1.
Table 2.1 Income-Elasticities
Consumer goods Co-efficient of Effect on sales with change income-elasticity in income
1.Essentialgoods Lessthanone(ey < 1) Less than proportionate changeinsale2.Comforts Almostequaltounity Almostproportionate (ey ≅1) changeinsale3.Luxuries Greaterthanunity Morethanproportionate (ey > 1) increase in sale
Income-elasticityofdemand fordifferentcategoriesofgoodsmay,however,varyfromhouseholdtohouseholdandfromtimetotime,dependingonthechoiceandpreferenceoftheconsumers,levelsofconsumptionandincome,andtheirsusceptibilityto‘demonstrationeffect’.Theotherfactorwhichmaycausedeviationfromthegeneralpatternofincome-elasticitiesisthefrequencyofincreaseinincome.Iffrequencyofriseinincomeishigh,income-elasticitieswillconformtothegeneralpattern.
Uses of Income-Elasticity in Business Decisions
Whilepriceandcrosselasticitiesofdemandareofgreatersignificanceinpricemanagementaimedatmaximizingthetotalrevenueintheshortrun,income-elasticityofaproductisofagreatersignificanceinproductionplanningandmanagementinthelongrun,particularlyduringtheperiodofabusinesscycle.Theconceptofincome-elasticitycanbeusedinestimatingfuturedemandprovided that the rate of increase in income and income-elasticity of demand fortheproductsareknown.Theknowledgeofincomeelasticitycanthusbeusefulinforecastingdemand,whenachangeinpersonalincomesisexpected,otherthingsremainingthesame.Italsohelpsinavoidingover-productionor under-production.
Inforecastingdemand,however,onlytherelevantconceptofincomeanddatashouldbeused.Itisgenerallybelievedthatthedemandforgoodsandservices increaseswith increaseinGNP,depending onthemarginal

NOTES
Self-InstructionalMaterial 29
Demand Analysispropensitytoconsume.Thismaybetrueinthecontextofaggregatenationaldemand,butnotnecessarilyforeachproduct.ItisquitelikelythatincreaseinGNPflowstoasectionofconsumerswhodonotconsumetheproductinwhichabusinessmanisinterested.Forinstance,ifthemajorproportionofincrementalGNPgoestothosewhocanaffordacar,thegrowthrateinGNPshould not be used to calculate income-elasticity of demand for bicycles. Therefore,theincomeofonlyarelevantclassorincome-groupshouldbeused.Similarly,wheretheproduct isofaregionalnature,or if there isaregionaldivisionofmarketbetweentheproducers,theincomeofonlytherelevantregionshouldbeusedinforecastingthedemand.
Theconceptofincome-elasticitymayalsobeusedtodefinethe‘normal’and‘inferior’goods.Thegoodswhoseincome-elasticityispositiveforalllevelsofincomearetermed‘normalgoods’.Ontheotherhand,goodswhoseincome-elasticitiesarenegativebeyondacertainlevelofincomearetermed‘inferiorgoods’.
Advertisement or Promotional Elasticity of Sales
Theexpenditureonadvertisementandonothersales-promotionactivitiesdoeshelpinpromotingsales,butnot at the same degree at all levels of the total salesandtotalad-expenditure.Theconceptofadvertisement elasticity isuseful indeterminingtheoptimumlevelofadvertisementexpenditure.The concept of advertisement elasticity assumesagreater significance indecidingonadvertisementexpenditure,particularlywhenthereiscompetitiveadvertising by the rival firms.Advertisement elasticity (eA) of sales is measured as eA=
% change in sales% change in Ad-expenditure
eA=S / S S AA / A A S
∆ ∆= ⋅∆ ∆
…(2.6)whereS=sales;∆S=increaseinsales;A=initialadvertisementcost,and∆A=additionalexpenditureonadvertisement.
Suppose,forexample,acompanyincreasesitsadvertisingexpenditurefrom 10 million to 12million,andasaresult,itssalesincreasefrom5,000unitsto6,000units.Inthiscase ∆A=12million–10million=`2million,and∆S=6,000–5,000=1000units.Bysubstitutingthesevaluesinad-elasticityformula(2.6),weget
eA =1000 10 1
2 5000× =
Itmeansthataonepercentincreaseinad-expenditureincreasessalesby 1 per cent.
Interpretation of Advertisement Elasticity The advertisement elasticityofsalesvariesbetweeneA=0andeA= dependingonthenature

Demand Analysis
NOTES
Self-Instructional 30 Material
oftheproduct,thelevelofmarketsupplied,thetrendinconsumers’income,thecompatitivestrengthofthecompetitors,etc.Theinterpretationofsomemeasuresofadvertisingelasticityisgivenbelow.
Elasticities Interpretation eA=0 Salesdonotrespondtotheadvertisementexpenditure. eA > 0 but < 1 Increase in total sales is less than proportionate to the
increaseinadvertisementexpenditure. eA=1 Sales increase in proportion to the increase in
advertisementexpenditure. eA>1 Salesincreaseatahigherratethantherateofincrease
ofadvertisementexpenditure.
Elasticity of Price Expectations
Sometimes,mainly during the period of price fluctuations, consumer’spriceexpectationsplaya much more important role than any other factor in determiningthedemandforacommodity.Theconceptofprice-expectation-elasticitywasdevisedandpopularizedbyJ.R.Hicks in 1939. The price-expectation-elasticityreferstotheexpectedchangeinfuturepriceasaresultofchangeincurrentpricesofaproduct.Theelasticityofprice-expectationisdefinedandmeasuredbythegeneralformulagivenbelow.
ex=//
f f f c
c c c f
P P P PP P P P
∆ ∆= ⋅
∆ ∆ …(2.7)
Here,Pc=priceintherecentpast;∆Pc=thecurrentchangeinpresentprice;Pf=expectedfutureprice;and∆Pf=expectedchangeinfutureprice.
Forexample,supposecurrentpriceofastorablecommodityincreasesfrom 100 to 120.And,consumersofthecommodityanticipatepriceofthecommodity to increase in future from `120 to `150. In that cases.
ex =
150 120120
120 100100
−
−
=30 20 30 100/ 1.25
120 100 120 20= × =
Itmeans1%changeinpresentpricewillcause1.25%changeinfutureprice.
Thecoefficientexgivesthemeasureofexpectedpercentagechangeinfuturepriceasaresultof1percentchangeinpresentprice.Ifex>1,itindicatesthatfuturechangeinpricewillbegreaterthanthepresentchangeinprice,andvice versa. If ex=1,itindicatesthatthefuturechangeinpricewillbeproportionatelyequaltothechangeinthecurrentprice.
The concept of elasticity of price-expectation is very useful informulatingfuturepricingpolicy.Forexample,ifex>1,itindicatesthatsellers

NOTES
Self-InstructionalMaterial 31
Demand Analysiswillbeabletosellmoreinthefutureathigherprices.Thus,businessmenmayaccordinglydeterminetheirfuturepricingpolicy.
2.6 APPLICATION OF ELASTICITIES IN BUSINESS DECISION-MAKING
Inthissection,weshowhowdemandelasticitiescanbeusedinbusinessdecision-makingbyafirm,especiallyinregardtoestimatingthechangeinits totaldemandcausedbyasimultaneouschangeinmostoralldemanddeterminants,theindependentvariables.
The independent variables can be classified under two categories:(i) controllable variables, and (ii) uncontrollable variables. Controllable variablesincludepriceofthefirm’sownproduct,advertisingexpenses,andqualityoftheproduct.Uncontrollable variables include price of the substitute product,consumers’income,pricingstrategyofthecompetitors,competitors’advertisement expenditure and their sales promotion strategy, growth ofpopulation,buyers’priceexpectations,etc.However,inestimatingthefuturedemandforitsproduct,thefirmhastoidentifyallthemajordeterminantsofitsproduct,bothcontrollableanduncontrollable.Whilethefirmcanplantomakechangesinthecontrollablevariables,itcanonlyanticipatethechangesinuncontrollablevariablesorrelyonchangesreportedbyotheragencies.Inanycase,thefirmhastotakeintoaccounttheanticipatedchangeinthevariables beyond its control.
Letussupposethatacomputercompany,whileestimatingthedemandfunction for its PC, identifies the following variables asmost importantdeterminants of demand for its computers.
• Productprice(P),i.e.,priceofitsownPC• Consumers’income(I)• Priceofthesubstitutebrands(Ps) • Advertisement (A)Notethatonlytwoofthesedemanddeterminants,viz.,priceoffirm’s
ownPCandadvertisementexpenditure,areunderthecontrolofthefirmandothers are uncontrollable. Let us suppose also that the company has estimated thedemandfunctionforitsPCasgivenbelow. Qc =50–1.5Pc + 0.5 Y + 2.0 Ps + 0.8 A …(2.8)where Qc =numberof company’sPCdemandedper unit of time
Pc =priceofcompany’scomputer Y =computerbuyers’income Ps =priceofthesubstitutePCbrands

Demand Analysis
NOTES
Self-Instructional 32 Material
A =ad-expenditurebythecompany
Supposethat,atapointintime,thenumericalvalueofindependentvariables inEq. (2.8)aregivenas follows:Pc =40,Y= 60,Ps =30and A =25.Bysubstitutingthesevaluesinthedemandfunction,weget Qc=50–1.5(40)+0.5(60)+2.0(30)+0.8(25) ...(2.9)
=50–60+30+60+20=100thousand
Thus,giventhedemandfunctioninEq.(2.8),thecurrentannualdemandforcompany’sPCturnsouttobe100,000pertimeunit.
Giventhecurrentdemand,thecompanyisplanning,asamatterofbusinesspolicy,tomakethefollowingchanges.
• increaseitsPCpriceby10%and• increaseitsad-expenditureby20%.Thecompanyplans thesechanges inanticipationof an increase in
PC-users’income(Y)by8%perannumandnochangeincompetitors’price.Prior to implementing its plan, the companywould like to know
whetheritwouldbeadvisabletomaketheplannedchangesinitspriceandad-expenditure?AnanswertothisquestioncanbefoundbyassessingtheimpactofplannedandanticipatedchangesonthedemandforitsPC.Sincedemandfunctionforthecompany’sPCisknown[seeEq.(2.8)],theimpactofplannedandanticipatedchangesonthedemandforitsPCcanbeeasilyobtainedbyusingdemandelasticities.
Whatweneedthereforeistofirstworkoutprice elasticity (Ep), income elasticity (Ey), cross elasticity (Es) and advertisement elasticity (EA) of demand for company’sPC.These elasticities at point (i.e., point elasticities) areworkedoutasfollows.
Recall,forexample,the(price)elasticityformula.
EP=Q PP Q
∆ ×∆
In this Epformula,∆Q/∆P isgivenbytheestimatedparameter(–1.5)intheestimateddemandfunction(2.9).Sotofind(Ep), weneedtomultiply–1.5byP/Q. Notethatintheestimateddemandfunction,Pc =40andQc = 100.Thus,
Ep =–1.5(P/Q) =–1.5(40/100)=–0.6Byusingthesamemethod,income-elasticity(Ey), cross-elasticity (Es)
and advertisement-elasticity (Ey) canalsobeworkedout. Ey =0.5(Y/Q)=0.5(60/100)=0.3 Es =2.0(Ps /Q)=2(30/100)=0.6 Ea =0.8(A/Q)=0.8(25/100)=0.2

NOTES
Self-InstructionalMaterial 33
Demand AnalysisNow that elasticities aremeasured, the impact of planned andanticipatedchangesintheindependentvariablesoncompany’sPCdemandcanbeestimatedbyadjustingitsexistingdemandof100,000unitswitheffectsofchangesmadeinpriceandad-expenditure.TheanticipateddemandforPCcanbeestimatedasfollows. Qc=1,00,000–0.6(10)+0.3(8)+0.6(0)+0.2(20) =1,00,000–6+2.4+0+4=1,00,400
Thedemandestimateshowsthatifthecompanyimplementsitsplanofraisingthepriceandad-expenditure,thedemandforitsPCwouldincreaseonlyby100,400–100,000=400units.Thisisnotasignificantincreaseinthedemand.Thelowincreaseintotaldemandismainlybecauseofdeclineindemandby600duetoa10%increaseinPCprice.Thecompanywouldbetter be advised not to increase the price ofitsPCandrelyonincreaseinPCusers’incomeandonadvertisement.Inthatcase,thecompanywillnotloseamarketof600PC.Thatis,ifthecompanyrefrainsfromincreasingthepriceofitsPC,thetotalincreaseindemandforitsproductwillbeoftheorderof1000PC,whichis,ofcourse,aconsiderableincreaseindemand.
2.7 DEMAND FORECASTING: AN OVERVIEW
Letusstudythedemandforecastingforindustrialgoods,consumergoodsand consumer durables.
2.7.1 Demand Forecatsing for Industrial Goods, Consumer Goods and Consumer Durables
Therearevariousmethodsofdemandforecasting.Thechoiceofmethodforforecastingdemanddependsonthepurposeandkindofdemandforecastingandavailabilityofrequireddata.Thevariousmethodsofdemandforecastingare listed here. 1. Survey Methods (i)ConsumerSurvey–directinterview (ii)OpinionPollMethods 2. Statistical Methods (i)TrendProjection (ii) Barometric Methods (iii) Econometric Methods
All these methods have different kinds of sub-methods. A detailed list ofmethodsofdemandforecastingisgiveninaChartonthenextpage.
Demand Analysis
NOTES
Self-Instructional 34 Material
Cha
rt: T
echn
ique
s of D
eman
d Fo
reca
stin
g

NOTES
Self-InstructionalMaterial 35
Demand Analysis1. Survey Methods
Surveymethodsarethemostcommonandsimplemethodsofestimatingcurrentdemandandprojectingfuturedemandforaproduct.Surveymethodsaregenerallyusedwhenthepurposeistomakeshort-runforecastofdemandforaproduct.Undersurveymethods,therequiredinformationiscollectedthrough a survey of consumers/users.The survey seeks information ofconsumers’futureplantobuytheproductforwhichdemandhastobeforecast.Surveysareconductedbytwomethods. (i)ConsumerSurveyMethod—theDirectConsumerSurvey,and (ii)OpinionPollMethod.
The choice of any of these methods depends on the status of the availabilityofprimarydataandtimeandmoneythatfirmsarewillingtospend on the survey. If primary data on demand for a product is not available inanyformandmoneyandtimearenotconstraints,thendirect consumer surveyistheonlyoption.But,incasesomerelevantinformationisalreadyavailablewithexpertsandtimeandmoneyaretheconstraints,thefirmsmaygoforopinion poll of experts.
2. Statistical Methods
In the foregoing sections,we have described survey and experimentalmethodsofestimatingandforecastingdemandforaproductonthebasisof information supplied by the consumers themselves and on-the-spot observationofconsumerbehaviour.Inthissection,wewillexplainstatistical methods whichutilizehistorical(time-series)andcross-sectionaldataforestimating long-term demand. Statisticalmethods are considered to besuperiortechniquesofdemandestimationforthefollowingreasons. (i) Inthestatisticalmethods,theelementofsubjectivityisminimum, (ii)Methodof estimation is scientific as it is based on the theoretical
relationshipbetweenthedependentandindependentvariables, (iii) Estimates are relatively more reliable because forecasts are based on
observedfacts,and (iv) Estimation involves smaller time and money cost.Three kinds of statistical methods are used for demand projection. (1)TrendProjectionMethods, (2)BarometricMethods,and (3) Econometric Method.

Demand Analysis
NOTES
Self-Instructional 36 Material
Check Your Progress
1.Whatispriceelasticityofdemand? 2. List the determinants of market demand. 3. Definedemandforecasting.
2.8 ANSWERS TO CHECK YOUR PROGRESS QUESTIONS
1.Priceelasticityofdemandisgenerallydefinedastheresponsivenessor sensitiveness of demand for a commodity to the changes in itsprice.Moreprecisely,elasticityofdemandisthepercentagechangeindemandduetoonepercentchangeinthepriceofthecommodity.
2.Thedeterminantsofmarketdemandarethefollowing: • Priceoftheproduct, • Price of the related goods—substitutes, complements and
supplements, •Levelofconsumers’income, •Consumers’tasteandpreferences, •Advertisementoftheproduct, •Consumers’expectationsaboutfuturepriceandsupplyposition, •Demonstrationeffectand‘bandwagoneffect’, •Consumer-creditfacility, • Populationofthecountry(forthegoodsofmassconsumption), •Distributionpatternofnationalincome,etc. 3.Demandforecastingispredictingthefuturedemandforfirm’sproduct.
2.9 SUMMARY
• Ingeneralterms,theelasticityofdemandisdefinedasthedegreeofresponsivenessofdemandforaproducttochangeinitsdeterminants.
• Priceelasticityofdemandisgenerallydefinedastheresponsivenessorsensitivenessofdemandforacommoditytothechangesinitsprice.
•Marketdemandforaproductdependsonanumberoffactors,calleddeterminants of demand.
•Thedemandforacommodityisalsoaffectedbythechangesintheprices of its relatedgoods.Relatedgoods are classifiedunder twocategories:(i)substitutes,and(ii)complementarygoods.
NOTES
Self-InstructionalMaterial 37
Demand Analysis •Thedemandforvariousgoodsandservicesaregenerallyclassifiedonthebasisoftheconsumersoftheproduct,suppliersoftheproduct,natureoftheproduct,seasonalnatureofthedemand,interdependenceofdemandfortwoproducts,etc.
•Durablegoodscreatereplacementdemandwhereasnon-durablegoodsdonot.Also,thedemandfornon-durablegoodsincreases(ordecreases)lineallywhereasthedemandfordurablegoodsincreases(ordecreases)exponentiallyduetoanincreaseinstockofdurablegoodsandhenceaccelerated depreciation.
•Theresponsivenessofdemandtothechangesinincomeisknownasincome-elasticity of demand.
•Demandforecastingispredictingthefuturedemandforfirm’sproduct. •Therearevariousmethodsofdemandforecasting.Thechoiceofmethod
forforecastingdemanddependsonthepurposeandkindofdemandforecastingandavailabilityofrequireddata.
2.10 KEY WORDS
• Elasticity of demand:Itisdefinedasthe degree of responsiveness of demandforaproducttochangeinitsdeterminants.
• Direct demand:Thisdemandisonethatarisesonitsownoutofanatural desire of the people to consume or possesses a commodity.
• Cross-Elasticity of demand: It is the measure of responsiveness of demandforacommoditytothechangesinthepriceofitssubstitutesandcomplementarygoods.
2.11 SELF ASSESSMENT QUESTIONS AND EXERCISES
Short-Answer Questions
1.Mentionthemajorkindsofdemandsthatfigureinbusinessdecisions. 2.Whatarethetypesofdemands? 3.Statethemethodsusedforconductingdemandforecastingforindustrial
goods,consumergoodsandconsumerdurables.
Long-Answer Questions
1.Discussthefactorsinfluencingpriceelasticityofdemand. 2.Explainthedeterminantsofmarketdemand. 3.Analysetheapplicationofelasticitiesinbusinessdecision-making.
Demand Analysis
NOTES
Self-Instructional 38 Material
2.12 FURTHER READINGS
Dwivedi,D.N.2008.Principles of Economics,SeventhEdition.NewDelhi:VikasPublishingHouse.
Weil.DavidN.2004.Economic Growth.London:AddisonWesley.Thomas, Christopher R. andMaurice S. Charles. 2005.Managerial
Economics: Concepts and Applications,EighthEdition.NewDelhi:TataMcGraw-HillPublishingCompanyLimited.
Mankiw,GregoryN.2002.Principles of Economics,SecondEdition.India:ThomsonPress.

NOTES
Self-InstructionalMaterial 39
Cost and Production AnalysisUNIT 3 COST AND PRODUCTION
ANALYSISStructure 3.0 Introduction 3.1 Objectives 3.2 Cost Concepts
3.2.1 Accounting Cost Concepts 3.2.2 Analytical Cost Concepts 3.2.3 Cost Control
3.3 Cost and Output Relationship 3.3.1 Short Run Cost Functions 3.3.2 Long Run Cost Functions 3.3.3 Break Even Analysis
3.4 Economies of Scale of Production 3.4.1 Economies of Scale 3.4.2 Diseconomies of Scale
3.5 Production Function 3.5.1 Laws of Production in the Short-Run 3.5.2 Concepts of Long-term Laws of Production
3.6 Answers to Check Your Progress Questions 3.7 Summary 3.8 Key Words 3.9 Self Assessment Questions and Exercises 3.10 Further Readings
3.0 INTRODUCTION
The theory of cost provides conditions for minimizing the cost of production. In addition, analysis of cost of production is very important in almost all kinds of business decisions, especially those related to the weak points of production management; determining the output level for cost minimization; determining the price of the product and dealers’ margin; and estimating and projecting the cost of business operation. In this unit you will study about cost concepts, cost and output relationship, break even analysis, economies of scale of production and product function.
3.1 OBJECTIVES
After going through this unit, you will be able to: • Discuss the cost concepts • Discuss the cost and output relationship • State the importance of break-even analysis

Cost and Production Analysis
NOTES
Self-Instructional 40 Material
• Explain the economies of scale of production • Describe the production function
3.2 COST CONCEPTS
The cost concepts that are relevant to business operations and decisions can be grouped on the basis of their nature and purpose under two overlapping categories: (i) cost concepts used for accounting purposes, and (ii) analytical cost concepts used in economic analysis of business activities. We will discuss some important concepts of the two categories. It is important to note here that this classification of cost concepts is only a matter of analytical convenience.
3.2.1 Accounting Cost Concepts
1. Opportunity Cost and Actual Cost: Actual cost is all paid out costs of the business firms to take the advantage of the best opportunity available to them. The opportunity cost is the opportunity lost for lack of resources. An opportunity to make income is lost because of scarcity of resources like land, labour, capital, etc. We know that resources available to any person, firm or society are scarce but have alternative uses with different returns. Income maximizing resource owners put their scarce resources to their most productive use and thus, they forego the income expected from the second best use of the resources. Thus, the opportunity cost may be defined as the returns expected from the second best use of the resources foregone due to the scarcity of resources. The opportunity cost is also called alternative cost. Had the resource available to a person, a firm or a society been unlimited, there would be no opportunity cost.
To explain and illustrate the concept of opportunity cost, suppose a firm has a sum of `100,000 for which it has only two alternative uses. The firm can buy either a printing machine or a photo copier, both having a productive life of 10 years. The firm expects an annual income of `20,000 from the printing machine, and `15,000 from the photo copier. A profit maximizing firm would invest its money in the printing machine and forego the expected income from the photo copier. The opportunity cost of the income from printing machine is the foregone income expected from the photo copier, i.e., `15,000. In assessing the alternative cost, both explicit and implicit costs are taken into account.
Associated with the concept of opportunity cost is the concept of economic rent or economic profit. In our example of expected earnings firm printing machine, the economic rent of the printing machine is the excess of its earning over the income expected from the photo copier. That is, economic profit or economic rent of the printing machine equals `20,000 – `15,000 = `5,000. The implication of this concept for a businessman is that investing in the printing machine is preferable so long as its economic rent is greater than

NOTES
Self-InstructionalMaterial 41
Cost and Production Analysis
zero. Also, if firms know the economic rent of the various alternative uses of their resources, it will be helpful in choosing the best investment avenue.2. Business Costs and Full Costs: Business costs include all the expenses that are incurred to carry out a business. The concept of business costs is similar to the actual or real costs. Business costs “include all the payments and contractual obligations made by the firm together with the book cost of depreciation on plant and equipment.” Business costs are used for calculating business profits and losses and for filing returns for income-tax and also for other legal purposes.
The concept of full cost, includes business costs, opportunity cost and normal profit. The opportunity cost includes the foregone earning expected from the second best use of the resources, or the market rate of interest on the internal money capital and also the value of an entrepreneur’s own services that are not charged for in the current business. Normal profit is a necessary minimum earning in addition to the opportunity cost, which a firm must receive to remain in its present occupation.3. Actual or Explicit Costs and Implicit or Imputed Costs: The Actual or Explicit costs are those which are actually incurred by the firm in payment for labour, material, plant, building, machinery, equipment, travelling and transport, advertisement, etc. The total money expenses, recorded in the books of accounts are, for all practical purposes, the actual costs. Actual cost comes under the accounting cost concept.
In contrast to explicit costs, there are certain other costs that do not take the form of cash outlays, nor do they appear in the accounting system. Such costs are known as implicit or imputed costs. Opportunity cost is an important example of implicit cost. For example, suppose an entrepreneur does not utilize his services in his own business and works as a manager in some other firm on a salary basis. If he sets up his own business, he foregoes his salary as manager. This loss of salary is the opportunity cost of income from his own business. This is an implicit cost of his own business. Thus, implicit wages, rent, and implicit interest are the wages, rent and interest that an owner’s labour, building and capital respectively, can earn from their second best use.
Implicit costs are not taken into account while calculating the loss or gains of the business, but they form an important consideration in deciding whether or not to retain a factor in its present use. The explicit and implicit costs together make the economic cost.4. Out-of-Pocket and Book Costs: The items of expenditure that involve cash payments or cash transfers, both recurring and non-recurring, are known as out-of-pocket costs. All the explicit costs (e.g., wages, rent, interest, cost of materials and maintenance, transport expenditure, electricity and telephone expenses, etc.) fall in this category. On the contrary, there are certain actual business costs that do not involve cash payments, but a provision is therefore

Cost and Production Analysis
NOTES
Self-Instructional 42 Material
made in the books of account and they are taken into account while finalizing the profit and loss accounts. Such expenses are known as book costs. In a way, these are payments made by a firm to itself. Depreciation allowances and unpaid interest on the owner’s own funds are the example of book costs.
3.2.2 Analytical Cost Concepts
The analytical cost concepts refers to the different cost concepts that are used in analysing the cost-output relationship with increase in inputs and output and also the cost concepts that figure in analysing the effect of expansion of production on the society as a whole.1. Fixed and Variable Costs: Fixed costs are those that remain fixed in amount for a certain quantity of output. Fixed cost does not vary with variation in the output between zero and a certain level of output. In other words, costs that do not vary or remain constant for a certain level of output are treated as fixed costs. The fixed costs include (i) depreciation of machinery, building and other fixed assets, (ii) costs of managerial and administrative staff, (iii) maintenance of land, etc. The concept of fixed cost is associated with the short-run.
Variable costs are those which vary with the variation in the total output. Variable costs include cost of raw material, running cost of fixed capital, such as fuel, repairs, routine maintenance expenditure, direct labour charges associated with the level of output, and the costs of all other inputs that vary with output.2. Total, Average and Marginal Costs: Total cost (TC) refers to the total outlays of money expenditure, both explicit and implicit, on the resources used to produce a given level of output. It includes both fixed and variable costs. The total cost for a given output is measured as
TC = Total fixed cost + Total variable costAverage cost (AC) is of statistical nature—it is not actual cost. It is
obtained by dividing the total cost (TC) by the total output (Q), i.e.,
AC = T CQ
Marginal cost (MC) is defined as the addition to the total cost on account of producing one additional unit of the product. Or, marginal cost is the cost of the marginal unit produced. Marginal cost is calculated as TCn – TCn –1 where n is the number of units produced. Using cost function, MC is obtained as the first derivative of the cot function.
MC = 50 or 50KL Q K L= =
Total, average and marginal cost concepts are used in the economic analysis of firm’s production and in pricing decisions. These cost concepts are discussed in further detail in the following section.

NOTES
Self-InstructionalMaterial 43
Cost and Production Analysis
3. Short-Run and Long-Run Costs: Short-run and long-run cost concepts are related to variable and fixed costs, respectively, and often figure in economic analysis cost-output relationship.
Short-run refers to the time period during which scale of production remains unchanged. The costs incurred in the short-run are called short-run costs. It includes both the variable and the fixed costs. From analytical point of view, short-run costs are those that vary with the variation in output in short-run, the size of the firm remaining the same. Therefore, short-run costs are treated as variable costs.
Long-run costs, on the other hand, are those that are incurred to increase the scale of production in the long-run. The costs that are incurred on the fixed factors like plant, building, machinery, etc., are known as long-run costs. It is important to note that the running cost and depreciation of the capital assets are included in the short-run or variable costs.
Furthermore, long-run costs are by implication the costs that are incurred in the long-run. In the long run, however, even the fixed costs become variable costs as the size of the firm or scale of production increases. Broadly speaking, ‘the short-run costs are those associated with variables in the utilization of fixed plant or other facilities whereas long-run costs are associated with the changes in the size and kind of plant.’4. Incremental Costs and Sunk Costs: Conceptually, incremental costs are closely related to the concept of marginal cost but with a relatively wider connotation. While marginal cost refers to the cost of the marginal unit (generally one unit) of output, incremental cost refers to the total additional cost associated with the decisions to expand the output or to add a new variety of product, etc. The concept of incremental cost is based on the fact that in the real world, it is not practicable (for lack of perfect divisibility of inputs) to employ factors for each unit of output separately. Besides, in the long run, when firms expand their production, they hire more of men, materials, machinery and equipments. The expenditures of this nature are incremental costs — not the marginal cost (as defined earlier). Incremental costs arise also owing to the change in product lines, addition or introduction of a new product, replacement of worn out plant and machinery, replacement of old technique of production, etc.
The sunk costs are those which are made once and for all and cannot be altered, increased or decreased, by varying the rate of output, nor can they be recovered. For example, once it is decided to make incremental investment expenditure and the funds are allocated and spent, all the preceding costs are considered to be the sunk costs. The reason is, such costs are based on the prior commitment and cannot be revised or reversed or recovered when there is a change in market conditions or change in business decisions.

Cost and Production Analysis
NOTES
Self-Instructional 44 Material
5. Historical and Replacement Costs: Historical cost refers to the cost incurred in past on the acquisition of productive assets, e.g. land, building, machinery, etc., whereas replacement cost refers to the expenditure made for replacing an old asset. These concepts owe their significance to the unstable nature of input prices. Stable prices over time, other things given, keep historical and replacement costs on par with each other. Instability in asset prices makes the two costs differ from each other.
As regards their application, historical cost of assets is used for accounting purposes, in the assessment of the net worth of the firm whereas replacement cost figures in business decisions regarding the renovation of the plant.6. Private and Social Costs: We have so far discussed the cost concepts that are related to the working of the firm and that are used in the cost-benefit analysis of business decisions. In simple words, all costs incurred by the business firms to run the business with the objective of making profile. All such costs fall in the category of private costs. There are, however, certain other costs that arise due to the functioning of the firm but do not figure normally in the business decisions nor are such costs explicitly borne by the firms. The costs of this category are borne by the society. Thus, the total cost generated by a firm’s working may be divided into two categories: (i) costs paid out or provided for by the firms, and (ii) costs paid or borne by the society including the use of resources freely available plus the disutility created in the process of production. The costs of the category (i) are known as private costs and of category (ii) are known as external or social costs. To mention a few examples of social cost, Mathura Oil Refinery discharging its wastage in the Yamuna river causes water pollution. Mills and factories located in a city cause air pollution, environment pollution and so on. Such costs are termed as external costs from the firm’s point of view and social costs from the society’s point of view.
The relevance of the social costs lies in the social cost-benefit analysis of the overall impact of a firm’s operation on the society as a whole and in working out the social cost of private gains. A further distinction between private cost and social cost is, therefore, in order.
Private costs are those which are actually incurred or provided for by an individual or a firm on the purchase of goods and services from the market. For a firm, all the actual costs, both explicit and implicit, are private costs. Private costs are internalized costs that are incorporated in the firm’s total cost of production.
Social costs on the other hand, refer to the total cost borne by the society due to production of a commodity. Social costs include both private cost and the external cost. Social cost includes (a) the cost of resources for which the firm is not required to pay a price, i.e., atmosphere, rivers, lakes, etc., and also for the use of public utility services like roadways, drainage system, etc.,

NOTES
Self-InstructionalMaterial 45
Cost and Production Analysis
and (b) the cost in the form of ‘disutility’ created through air, water, noise and environment pollution, etc. The costs of category (b) are generally assumed to equal the total private and public expenditure incurred to safeguard the individual and public interest against the various kinds of health hazards and social tension created by the production system. The private and public expenditure, however, serve only as an indicator of ‘public disutility’—they do not give the exact measure of the public disutility or the social costs.
3.2.3 Cost Control
Cost control is one of the vital instruments used by the management of a business firm for economising the method of operation of the entire firm. This instrument/tool aims at reducing waste within the existing system of operation.
The ultimate objective of a business firm is to produce goods/services at a minimum cost. Also, this is necessary to accomplish the objective of profit maximisation of a business firm. This has led to the emergence and usage of cost accounting.
These cost accounting systems have developed their own standards or benchmarks against which the present system of operation of the firm is analysed. One of the objectives of cost control is to accomplish the target sales of the firm.
The cost accounting system takes into account any deviation in the actual performance of the firm by analysing it against the benchmarks and then accordingly corrective action is taken. Hence, it seeks to spend the minimum amount on expenditure for the production of goods/services. Thus, it can be said that cost control is a preventive function of the firm.
Cost control involves performing a chain of steps by the respective firm. This function involves the following steps: (i) Planning: The foremost step involved in cost control is the planning
aspect which takes place in the form of budgets, standards or benchmarks.
(ii) Communication: The next step is to communicate the plan or set of targets established to the team handling the cost control function of the firm.
(iii) Motivation: Once the plan is executed, the performance is evaluated as per the benchmarks or standards set. Accordingly, costs are ascertained and information is collected. The team handling the cost control function gets motivated from the fact that the cost of the operation is analysed and evaluated as per the standards set.

Cost and Production Analysis
NOTES
Self-Instructional 46 Material
(iv) Appraisal: At this step, the cost is compared with the target set and the actual performance of the firm. The shortcomings are noticed and recorded.
(v) Decision making: At this step, corrective measures and remedial action is taken depending upon the decisions taken by the team handling the cost control function.
Advantages of Cost Control
(i) The primary advantage of cost control function is that it helps the firm to enhance its profitability and competitiveness in the market.
(ii) The function is indispensable for achieving greater productivity of the firm.
(iii) It helps the firm to reduce its costs and thereby reduce its prices. (iv) With the effective implementation of this cost function, the labour
force can be kept employed at a steady pace.After taking into consideration the above discussion, one can
comprehend that cost control function has a regulatory effect on the performance of the firm. There are certain cost control techniques that have been evolved to achieve this objective.
Primarily, two kinds of standards have been established to control costs. These are: (a) Internal, (b) External.
Internal standards involve comparison of the usage of internal resources, labour, capital and so forth. The internal standards used for cost control are: (a) Budgetary control and (b) Standard costing
External standards involve comparing the performance of the firm with its competitive firms in the form of cost ratios.
3.3 COST AND OUTPUT RELATIONSHIP
The theory of cost deals with how cost of production changes with change in output. In other words, the cost theory deals with cost-output relations. The basic principle of the cost-output relationship is that the total cost increases with increase in output. This simple statement of an observed fact is of little theoretical and practical importance. What is important from a theoretical and managerial decision point of view is the rate of increase in total cost with increase in output and the direction of change in the average cost (AC) and the marginal cost (MC). The direction of change in AC and MC—whether AC and MC decrease or increase or remain constant—depends on the nature of the cost function. A cost function is a symbolic statement of the technological relationship between the cost and output. The general form of the cost function is written as:

NOTES
Self-InstructionalMaterial 47
Cost and Production Analysis TC = f (Q), with DTC/DQ > 0 …(3.1)
The actual form of cost function depends on whether the time framework chosen for cost analysis is short-run or long-run. It is important to recall here that some costs remain constant in the short-run while all costs are variable in the long-run. Thus, depending on whether cost analysis pertains to short-run or to long-run, there are two kinds of cost functions: (i) short-run cost functions, and (ii) long-run cost functions. Accordingly, the cost output relations are analyzed in short-run and long-run framework.
3.3.1 Short Run Cost functions
In this section, we will analyze the cost-output relations in the short-run. The long-run cost output relations discussed in the following section. Before we discuss the short-run cost-output relations, let us first look at the cost concepts and the components used to analyze the short-run cost-output relations.
The basic analytical cost concepts used in the analysis of cost behaviour are Total, Average and Marginal costs. The total cost (TC) is defined as the actual cost that are incurred to produce a given quantity of output. The short-run TC is composed of two major elements: (i) total fixed cost (TFC), and (ii) total variable cost (TVC). That is, in the short-run, TC = TFC + TVC ...(3.2)
As mentioned earlier, TFC (i.e., the cost of plant, building, etc.) remains fixed in the short run, whereas TVC (the labour cost) varies with the variation in the output.
For a given quantity of output (Q), the average cost (AC), average fixed cost (AFC) and average variable cot (VC) can be defined as follows.
AC = 50 2 5 158Q = = = AFC + AVC
Thus, AFC = 50 5 5 250Q = = and AVC = QL
∂∂
and AC = AFC + AVC ...(3.3)
Marginal cost (MC) can be defined as the change in the total cost due to change in the total output by one unit, i.e.,
MC = 3 215 10L L L
L− + + ...(3.4)
In case TC is expressed in functional form, MC is measured as the first
derivative of cost function, i.e., c p
c p
K K KMRTSL L L
− − ∆= =− ∆
.
It may be added here that since ∆TC = ∆TFC + ∆TVC and, in the short-run, ∆TFC = 0, therefore, ∆TC = ∆TVC. Furthermore, under the marginality

Cost and Production Analysis
NOTES
Self-Instructional 48 Material
concept, where ∆Q = 1, MC = ∆TVC. Now we turn to cost function and derivation of various cost curves.
Short-Run Cost Functions and Cost Curves
The cost-output relations are revealed by the cost function and are exhibited through cost curves. The shape of the cost curves depends on the nature of the cost function. Cost functions are derived from actual cost data of the firms. The nature of estimated cost function depends on the cost trend revealed by cost data. Given the cost data, cost functions may take a variety of forms, e.g., linear, quadratic or cubic, yielding different kinds of cost curves. The cost curves produced by linear, quadratic and cubic cost functions are illustrated subsequently on the next page.
Fig. 3.1 Linear Cost Functions
1. Linear Cost Function: When total cost increases at a constant rate with increase in production, it produces a linear cost function. A linear cost function takes the following form. TC = a + bQ …(3.5)where TC = total cost, Q = quantity produced, a = TFC, and b = Change in TVC due to change in Q.
Given the cost function [Eq. (3.5)] AC and MC can be obtaied as follows. AC = 31 2
1 2 3
KK KL L L
∆∆ ∆> >∆ ∆ ∆
+ b
and MC = l
k k
PTCP P
−
Note that since ‘b’ is a constant coefficient, MC remains constant, throughout in case of a linear cost function.

NOTES
Self-InstructionalMaterial 49
Cost and Production Analysis
To illustrate a linear cost function, let us suppose that an actual cost function is given as TC = 60 + 10Q …(3.6)
Given the cost function (3.6), one can easily work out TC, TFC, TVC, MC and AC for different levels of output (Q) and can present them in the form of a table as shown in Table 3.1.
Table 3.1 Tabular Cost Function
Output Q TFC = 60 TVC = 10Q TC = 60 + 10Q MC = b = 10 AC = 60/Q + 10
1 60 10 70 – 70.0 2 60 20 80 10 40.0 3 60 30 90 10 30.0 4 60 40 100 10 25.0 5 60 50 110 10 22.0 6 60 60 120 10 20.0 7 60 70 130 10 18.6 8 60 80 140 10 17.5 9 60 90 150 10 16.6 10 60 100 160 10 16.0
Table 3.1 presents a series of Q and corresponding TFC, TVC, TC, MC and AC for output Q from 1 to 10. The figures in Table 3.1, graphed in Fig. 3.1, shows the relationship between total costs (TC, TEC, and TVC) and output.
Figure 3.1 shows the behaviour of TC, TVC and TFC. The horizontal line shows TFC and the line TVC = 10Q shows the movement in TVC with change in Q. The total cost function is shown by TC = 60 + 10Q.
Fig. 3.2 AC and MC Curves Derived from Linear Cost Function

Cost and Production Analysis
NOTES
Self-Instructional 50 Material
More important is the behaviour of AC and MC curves in Fig. 3.2. Given the cost function (3.6), AC and MC can be worked out as follows.
k
l l
PTCP P
− and MC = 10
Note that, in case of a linear cost function, while MC remains constant, AC continues to decline with the increase in output. This is so simply because of the logic of the linear cost function.2. Quadratic Cost Function: When TC increases at increasing rate with constant increase in output (Q), the TC data produces a quadratic cost function expressed as TC = a + bQ + Q2 ....(3.7)where a and b are constants and TC and Q are total cost and total output, respectively.
Given the cost function (3.7), AC an MC can be obtained as folows.
AC = l
k k
PTCP P
− + b + Q ...(3.8)
MC = k
l l
PTCP P
− ⋅ = b + 2Q ...(3.9)
Let the actual (or estimated) cost function be given as TC = 50 + 5Q + Q2 …(3.10)Given the cot function (3.10),
AC = l
k
MPKL MP
−∆ =∆ + Q + 5 and MC = l l
k k
MP PMP P
= = 5 + 2Q
The cost curves that emerge from the cost function (3.10) are graphed in Fig. 3.3 (a) and (b). As shown in panel (a), while fixed cost remains constant at 50, TVC is increasing at an increasing rate. The rising TVC sets the trend in the total cost (TC). Panel (b) shows the behaviour of AC, MC and AVC in a quadratic cost function. Note that MC and AVC are rising at a constant rate whereas AC declines till output 8 and then begins to increase.3. Cubic Cost Function: When TC increases first at decreasing rate and then of increasing rate with increase in production, the TC data produces a cubic cost function. A cubic cost function is of the form TC = a + bQ – cQ2 + Q3 …(3.11)where a, b and c are the parametric constants.
From the cost function (3.11), ACand MC can e derived as follows.
AC = l k
l k
MP MPP P
=

NOTES
Self-InstructionalMaterial 51
Cost and Production Analysis =
( . )( . )
l l l
k k k
MP MP P MRPMP MP P MRP
= = + b – cQ + Q2
and MC = l l
k k
P MRPP MRP
= = b – 2 cQ + 3Q2
Fig. 3.3 Cost Curves Derived from a Quadratic Cost Function
Let us suppose that the cost function is empirically estimated as TC = 10 + 6Q – 0.9Q2 + 0.05Q3 …(3.12)
Note that fixed cost equals 10. TVC can be obtained by subtracting 10—the fixed cost—from TC-function (3.12).Thus, TVC = 6Q – 0.9Q2 + 0.05Q3 …(3.13)
The TC and TVC, based on Eqs. (3.12) and (3.13), respectively, have been calculated for Q = 1 to 16 and presented in Table 3.2. The TFC, TVC and TC have been graphically presented in Fig. 3.4. As the figure shows, TFC remains fixed for the whole range of output, and hence, takes the form of a horizontal line—TFC. The TVC curve shows two different trends with
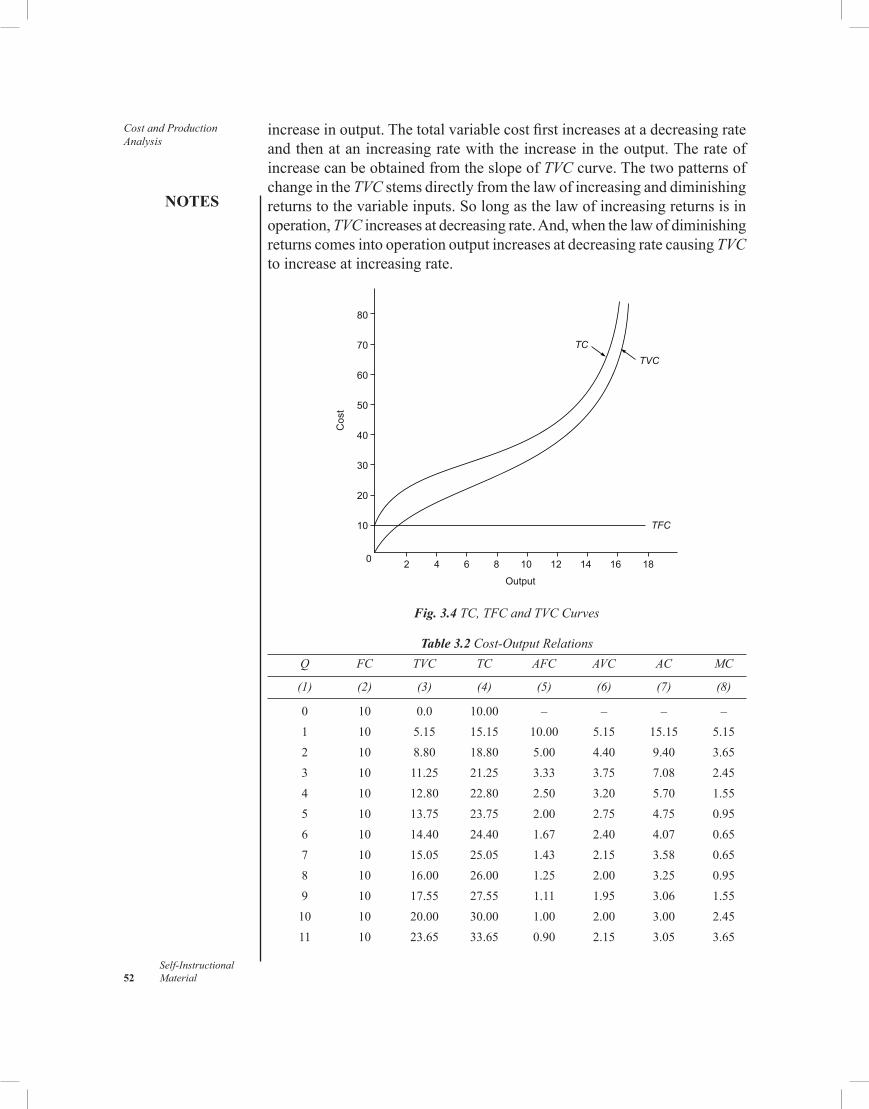
Cost and Production Analysis
NOTES
Self-Instructional 52 Material
increase in output. The total variable cost first increases at a decreasing rate and then at an increasing rate with the increase in the output. The rate of increase can be obtained from the slope of TVC curve. The two patterns of change in the TVC stems directly from the law of increasing and diminishing returns to the variable inputs. So long as the law of increasing returns is in operation, TVC increases at decreasing rate. And, when the law of diminishing returns comes into operation output increases at decreasing rate causing TVC to increase at increasing rate.
Fig. 3.4 TC, TFC and TVC Curves
Table 3.2 Cost-Output Relations Q FC TVC TC AFC AVC AC MC
(1) (2) (3) (4) (5) (6) (7) (8)
0 10 0.0 10.00 – – – – 1 10 5.15 15.15 10.00 5.15 15.15 5.15 2 10 8.80 18.80 5.00 4.40 9.40 3.65 3 10 11.25 21.25 3.33 3.75 7.08 2.45 4 10 12.80 22.80 2.50 3.20 5.70 1.55 5 10 13.75 23.75 2.00 2.75 4.75 0.95 6 10 14.40 24.40 1.67 2.40 4.07 0.65 7 10 15.05 25.05 1.43 2.15 3.58 0.65 8 10 16.00 26.00 1.25 2.00 3.25 0.95 9 10 17.55 27.55 1.11 1.95 3.06 1.55 10 10 20.00 30.00 1.00 2.00 3.00 2.45 11 10 23.65 33.65 0.90 2.15 3.05 3.65

NOTES
Self-InstructionalMaterial 53
Cost and Production Analysis
12 10 28.80 38.80 0.83 2.40 3.23 5.15 13 10 35.75 45.75 0.77 2.75 3.52 6.95 14 10 44.80 54.80 0.71 3.20 3.91 9.05 15 10 56.25 66.25 0.67 3.75 4.42 11.45
16 10 70.40 80.40 0.62 4.40 5.02 14.15
Some Important Relationships between Different Measures of Cost
Some important relationships between costs used in analyzing the short-run cost-behaviour may now be summed up as follows: (a) Over the range of output AFC and AVC fall, AC also falls. (b) When AFC falls but AVC increases, change in AC depends on the rate
of change in AFC and AVC. (i) if decrease in AFC > increase in AVC, then AC falls, (ii) if decrease in AFC = increase in AVC, AC remains constant and (iii) if decrease in AFC < increase in AVC, then AC increases. (c) AC and MC are related in following ways. (i) When MC falls, AC follows, over a certain range of output. When
MC is falling, the rate of fall in MC is greater than that of AC, because while MC is attributed to a single marginal unit, AC is distributed over the entire output. Therefore, AC decreases at a lower rate than MC.
(ii) Similarly, when MC increases, AC also increases but at a lower rate for the reason given in (i). There is, however, a range of output over which the relationship does not exist. Compare the behaviour of MC and AC over the range of output from 6 units to 10 units. Over this range of output, MC begins to increase while AC continues to decrease. The reason for this can be seen in Table 3.1 when MC starts increasing, it increases at a relatively lower rate that is sufficient only to reduce the rate of decrease in AC—not sufficient to push the AC up.
(iii) MC curve intersects AC curve at its minimum. The reason is, while AC continues to decrease, MC begins to rise at the same level of output. Therefore, they are bound to intersect. Also, when AC is at its minimum, it is neither increasing nor decreasing: it is constant. When AC is constant, AC = MC. That is the point of intersection.
3.3.2 Long Run Cost Functions
In the context of the production theory, long run refers to a period in which firms can use more of both the inputs – labour and capital – to increase their production. The long-run theory of cost deals with the long-run cost-output

Cost and Production Analysis
NOTES
Self-Instructional 54 Material
relationship. In other words, long-run theory of cost states the nature of relationship between output and cost with increase in scale of production.
To understand the long-run-cost-output relations and to derive long-run cost curves, it will be helpful to imagine that a long-run is composed of a series of short-run production decisions. As a corollary of this, long-run cost curve is composed of a series of short-run cost curves. With this perception of long-run-cost-out relationship, we may now show the derivation of the long-run cost curves and study their relationship with output.
Long-run Total Cost Curve (LTC)
In order to draw the long-run total cost curve, let us begin with a short-run situation. Suppose that a firm having only one plant has its short-run total cost curve as given by STC1, in panel (a) of Fig. 3.5. Let us now suppose that the firm decides to add two more plants over time, one after the other. As a result, two more short-run total cost curves are added to STC1, in the manner shown by STC2 and STC3 in Fig. 3.5 (a). The LTC can now be drawn through the minimum points of STC1, STC2 and STC3 as shown by the LTC curve corresponding to each STC.
Long-run Average Cost Curve (LAC)
Like LTC, long-run average cost curve (LAC) is derived by combining the short-run average cost curves (SACs). Note that there is one SAC associated with each STC. The curve SAC1 in panel (b) of Fig. 3.5 corresponds to STC1 in panel (a). Similarly, SAC2 and SAC3 in panel (b) correspond to STC2 and STC3 in panel (a), respectively. There are three corresponding SAC curves as given by SAC1, SAC2, and SAC3 curves in panel (b) of Fig. 3.5. Thus, the firm has a series of SAC curves, each having a bottom point showing the minimum SAC. For instance, C1Q1 is minimum AC when the firm has only one plant. The AC decreases to C2Q2 when the second plant is added and then rises to C3Q3 after the addition of the third plant. The LAC curve can be drawn through the SAC1, SAC2 and SAC3 as shown in Fig.3.5 (b). The LAC curve is also known as the ‘Envelope Curve’ or ‘Planning Curve’ as it serves as a guide to the entrepreneur in his plans to expand production.
The SAC curves can be derived from the data given in the STC schedule, from STC function or straightaway from the LTC curve. Similarly, LAC curve can be derived from LTC-schedule, LTC function or from LTC-curve.

NOTES
Self-InstructionalMaterial 55
Cost and Production Analysis
Fig. 3.5 Long-run Total and Average Cost Curves
The relationship between LTC and output, and between LAC and output can now be easily derived. It is obvious from the LTC that the long-run cost-output relationship is similar to the short-run cost-output relation. With the subsequent increases in the output, LTC first increases at a decreasing rate, and then at an increasing rate. As a result, LAC initially decreases until the optimum utilization of the second plant and then it begins to increase. These cost-output relations follow the ‘laws of returns to scale’. When the scale of the firm expands, LAC, i.e., unit cost of production, initially decreases, but ultimately increases as shown in Fig. 3.5 (b). The decrease in unit cost is attributed to the internal and external economies of scale and the eventual increase in cost, to the internal and external diseconomies of scale. The economies and diseconomies of scale are discussed in the following section.
Long-run Marginal Cost Curve (LMC)
The long-run marginal cost curve (LMC) is derived from the short-run marginal cost curves (SMCs). The derivation of LMC is illustrated in Fig. 3.6 in which SACs, SMCs and LAC are the same as in Fig.3.5 (b). To derive the LMC, consider the points of tangency between SACs and the LAC, i.e., points

Cost and Production Analysis
NOTES
Self-Instructional 56 Material
A, B and C. In the long-run production planning, these points determine the minimum LAC at the different levels of production. Each of these outputs has an SMC. For example, if we draw a perpendicular from point A, it intersects SMC1 at point M determining SMC at MQ1 at output Q1. The same process can be repeated for points B and C to find out SMC at outputs Q2 and Q3. Note that points B and C determine SMC at BQ2 and CQ3, respectively. A curve drawn through points M, B and N, as shown by the LMC, represents the behaviour of the marginal cost in the long-run. This curve is known as the long-run marginal cost curve, LMC. It shows the trends in the marginal cost in response to the changes in the scale of production.
Some important inferences may be drawn from Fig. 3.6. The LMC must be equal to SMC for the output at which the corresponding SAC is tangent to the LAC. At the point of tangency, LAC = SAC. Another important point to be noted is that LMC intersects LAC when the latter is at its minimum, i.e., point B. It indicates that there is one and only one short-run plant size whose minimum SAC coincides with the minimum LAC. This point is B where
SAC2 = SMC2 = LAC = LMC
Fig. 3.6 Derivation of LMC
3.3.3 Break Even Analysis
‘We will discuss the calculation of break even point in Unit 6’. The break-even analysis is an important analytical technique used to study the relationship between the total costs, total revenue and total profit and loss over the whole range of stipulated output. The break-even analysis is a technique of having a preview of profit prospects and a tool of profit planning. It integrates the cost and revenue estimates to ascertain the profits and losses associated with different levels of output. The relationship between cost and output and between price and output may be linear or non-linear in nature.

NOTES
Self-InstructionalMaterial 57
Cost and Production Analysis3.4 ECONOMIES OF SCALE OF PRODUCTION
Economies of scale result in cost saving and diseconomies lead to rise in cost. Economies and diseconomies of scale determine also the returns to scale. Increasing returns to scale operate till economies of scale are greater than the diseconomies of scale, and returns to scale decrease when diseconomies are greater than the economies of scale. When economies and diseconomies are in balance, returns to scale are constant. In this section, we briefly discuss the various kinds of economies and diseconomies of scale and their effect on cost of production.
3.4.1 Economies of Scale
The economies of scale are classified as (a) Internal or Real Economies, and (b) External or Pecuniary Economies.
A. Internal Economies
Internal economies, also called ‘real economies’, are those that arise within the firm with addition of new production plants. This means that internal economies are available exclusively to the expanding firm. Internal economies may be classified under the following categories. (i) Economies in production; (ii) Economies in marketing; (iii) Managerial economies, and (iv) Economies in transport and storage.(i) Economies in Production: Economies in production arise from two sources: (a) technological advantages, and (b) advantages of division of labour based on specialization and skill of labour.Technological advantages: Large-scale production provides an opportunity to the expanding firms to avail the advantages of technological advances. Modern technology is highly specialized. The advanced technology makes it possible to conceive the whole process of production of a commodity in one composite unit of production. For example, production of cloth in a textile mill may comprise such plants as (i) spinning; (ii) weaving; (iii) printing and pressing; and (iv) packing, etc. Likewise, a composite dairy scheme may consist of plants like (i) chilling; (ii) milk processing; and (iii) bottling. Under small-scale production, the firm may not find it economical to have all the plants under one roof. It would, therefore, not be in a position to take the full advantage of a composite technology. But, when scale of production expands and firms hire more capital and labour, their total output increases

Cost and Production Analysis
NOTES
Self-Instructional 58 Material
more than proportionately till the optimum size of the firm is reached. It results in lower cost of production.Advantages of division of labour and specialization: When a firm’s scale of production expands, more and more workers of varying skills and qualifications are employed. With the employment of larger number of workers, it becomes increasingly possible to divide the labour according to their qualifications, knowledge, experience, expertise and skills and to assign them the function to which they are best suited. This is known as division of labour. Division of labour leads to a greater specialization of manpower. It increases productivity of labour and, thereby, reduces cost of production. Besides, specialized workers develop more efficient tools and techniques and gain speed of work. These advantages of division of labour improve productivity of labour per unit of labour cost and time. Increase in labour productivity decreases to per unit cost of production.(ii) Economies in Purchase of Inputs: Economies in input purchases arise from the large-scale purchase of raw materials and other material inputs and large-scale selling of the firm’s own products. As to economies in the purchase of inputs, the large-size firms normally make bulk purchases of their inputs. The large scale purchase entitles the firm for certain discounts in input prices and other concessions that are not available on small purchases. As such, the growing firms gain economies on the cost of their material inputs.
The internal economies arise also in marketing the firm’s own product as (a) economies in advertisement cost; (b) economies in large-scale distribution through wholesalers, etc.; and (c) other large-sale economies. With the expansion of the firm, the total production increases. But the expenditure on advertising the product does not increase proportionately. Similarly, selling through the wholesale dealers reduces the cost of distribution of the firm’s production. The firm also gains on large scale distribution through better utilization of ‘sales force, distribution of sample, etc.’(iii) Managerial Economies: Managerial economies arise from (a) specialization in managerial activities, i.e., the use of specialized managerial personnel, and (b) systemization of managerial functions. For a large-size firm, it becomes possible to divide its management into specialized departments under specialized personnel, such as production manager, sales manager, HR manager, financial manager, etc. The management of different departments by speciallized managers increases the efficiency of management at all the levels of management because of the decentralization of decision-making. It increases production, given the cost. Large-scale firms have the opportunity to use advanced techniques of communication, telephones and telex machines, computers, and their own means of transport. All these lead to quick decision-making, help in saving valuable time of the management and, thereby, improve the managerial efficiency. For these reasons, managerial

NOTES
Self-InstructionalMaterial 59
Cost and Production Analysis
cost increases less than proportionately with the increase in production scale upto a certain level, of course.(iv) Economies in Transport and Storage: Economies in transportation and storage costs arise from fuller utilization of transport and storage facilities. Transportation costs are incurred both on production and sales sides. Similarly, storage costs are incurred on both raw materials and finished products. The large-size firms may acquire their own means of transport and they can, thereby, reduce the unit cost of transportation, at least to the extent of profit margin of the transport companies. Besides, own transport facility prevents delays in transporting goods. Some large-scale firms have their own railway tracks from the nearest railway point to the factory, and thus they reduce the cost of transporting goods in and out. For example, Bombay Port Trust has its own railway tracks, oil companies have their own fleet of tankers. Similarly, large-scale firms can create their own godowns in various centres of product distribution and can save on cost of storage.
B. External or Pecuniary Economies of Scale
External economies are those that arise outside the firm and accrue to the expanding firms. External economies appear in the form of money saving on inputs, called pecuniary economies. Pecuniary economies accrue to the large-size firms in the form of discounts and concessions on (i) large scale purchase of raw material, (ii) large scale acquisition of external finance, particularly from the commercial banks; (iii) massive advertisement campaigns; (iv) large scale hiring of means of transport and warehouses, etc. These benefits are available to all the firms of an industry but large scale firms benefit more than small firms.
Besides, expansion of an industry encourages the growth of ancillary industries that supply inputs. In the initial stages, such industries also enjoy the increasing returns to scale. In a competitive market, therefore, input prices go down. The benefit of decreasing input prices accrues to the expanding firms in addition to discounts and concessions. For example, growth of the automobile industry helps the development of tyre industry and other motor parts manufacturing units. The economies of scale reaped by such industries flow also to automobile industry. If Maruti Udyog Limited starts producing tyres for its own cars and ancillaries, cost of Maruti cars may go up. Consider another example: growth of computer industry encourages growth of firms that manufacture and supply computer chips and other software. Competition between such firms and law of increasing returns reduces the cost of inputs. Reduction in input costs is an important aspect of external economies.
3.4.2 Diseconomies of Scale
The economics of scale have their own limits, i.e., scale economies exist only up to a certain level of production scale. The expansion of scale of production
Cost and Production Analysis
NOTES
Self-Instructional 60 Material
beyond that limit creates condition for diseconomies of scale. Diseconomies of scale are disadvantages that arise due to the expansion of production scale beyond its optimum level and lead to rise in the cost of production. Like economies, diseconomies may be internal and external. Let us describe the nature of internal and external diseconomies in some detail.1. Internal Diseconomies: Internal diseconomies are those that are exclusive and internal to a firm as they arise within the firm. Like everything else, economies of scale have a limit too. This limit is reached when the advantages of division of labour and managerial staff have been fully exploited; excess capacity of plant, warehouses, transport and communication systems, etc., is fully used; and economy in advertisement cost tapers off. Although some economies may still exist, diseconomies begin to outweigh the economies and the costs begin to rise.Managerial Inefficiency: Diseconomies begin to appear first at the management level. Managerial inefficiencies arise, among other things, from the expansion of scale itself. With fast expansion of the production scale, personal contacts and communications between (i) owners and managers, (ii) managers and labour, and (iii) between the managers of different departments or sections get rapidly reduced. The lack of fast or quick communication causes delays in decision-making affecting production adversely.
Secondly, close control and supervision is replaced by remote control management. With the increase in managerial personnel, decision-making becomes complex and delays in decision-making become inevitable.
Thirdly, implementation of whatever decisions are taken is delayed due to coordination problem in large scale organisations.
Finally, with the expansion of the scale of production, management is professionalized beyond a point. As a result, the owner’s objective function of profit maximization is gradually replaced by managers’ utility function, like job security and high salary, standard or reasonable profit target, satisfying functions. All these lead to laxity in management and, hence to a rise in the cost of production.Labour Inefficiency: Increasing number of labour leads to a loss of control over labour management. This affects labour productivity adversely. Besides, increase in the number of workers encourages labour union activities that cause loss of output per unit of time and hence, rise in the cost of production.2. External Diseconomies: External diseconomies are the disadvantages that arise outside the firm, especially in the input markets, due to natural constraints, specially in agriculture and extractive industries. With the expansion of the firm, particularly when all the firms of the industry are expanding, the discounts and concessions that are available on bulk purchases of inputs and concessional finance come to an end. More than that, increasing
NOTES
Self-InstructionalMaterial 61
Cost and Production Analysis
demand for inputs puts pressure on the input markets and input prices begin to rise causing a rise in the cost of production. These are pecuniary diseconomies.
On the production side, the law of diminishing returns to scale come into force due to excessive use of fixed factors, more so in agriculture and extractive industries. For example, excessive use of cultivable land turns it into barren land; pumping out water on a large scale for irrigation causes the water table to go down resulting in rise in cost of irrigation; extraction of minerals on a large scale exhausts the mineral deposits on upper levels and mining further deep causes rise in cost of production; extensive fishing reduces the availability of fish and the catch, even when fishing boats and nets are increased. These kinds of diseconomies make the LAC move upward.
3.5 PRODUCTION FUNCTION
Production function is a mathematical presentation of input-output relationship. More specifically, a production function states the technological relationship between inputs and output in the form of an equation, a table or a graph. In its general form, it specifies the inputs required for the production of a commodity or service. In its specific form, it states the extent of quantitative relationships between inputs and output. Besides, the production function represents the technology of a firm or of an industry. For example, suppose production of a product, say X, depends on labour (L) and capital (K), then production function is expressed in equation form as
Qx = f (L, K)A real-life production function is generally very complex. It includes
a wide range of inputs, viz., (i) land and building; (ii) labour including manual labour, engineering staff and production manager, (iii) capital, (iv) raw material, (v) time, and (vi) technology. All these variables enter the actual production function of a firm. The long-run production function is generally expressed as
Q = f (LB, L, K, M, T, t)where LB = land and building L = labour, K = capital, M = raw materials,
T = technology and t = time.The economists have however reduced the number of variable inputs
used in a production function to only two, viz., labour (L) and capital (K), for the sake of convenience and simplicity in the analysis of input-output relations. It has logical reasoning also. A production function with two variable inputs, K and L, is expressed as
Q = f(K, L)The reasons for excluding other inputs are following.

Cost and Production Analysis
NOTES
Self-Instructional 62 Material
Land and building (LB), as inputs, are constant for the economy as a whole, and hence they do not enter into the aggregate production function. However, land and building are not a constant variable for an individual firm or industry. In the case of individual firms, land and building are lumped with ‘capital’.
In case of ‘raw materials’ it has been observed that this input ‘bears a constant relation to output at all levels of production’. For example, cloth size bears a constant relation to the number of garments. Similarly, for a given size of a house, the quantity of bricks, cement, steel, etc. remains constant, irrespective of number of houses constructed. To consider another example, in car manufacturing of a particular brand or size, the quantity of steel, number of the engine, and number of tyres and tubes are fixed per car. Since in case of ‘raw materials’ the relationship between inputs and output is fixed, the output can be easily estimated given the quantity of inputs. Therefore, raw materials are left out of production function.
So is the case, generally, with time and space. Also, technology (T) of production remains constant over a period of time. That is why, in most production functions, only labour and capital are included.
We will illustrate the tabular and graphic forms of a production function when we move on to explain the laws of production. Here, let us illustrate the mathematical form of a production function. It is this form of production function that is most commonly used in production analysis.
To illustrate the algebraic form of production function, let us suppose that a coal mining firm employs only two inputs—capital (K) and labour (L)—in its coal production activity. So the coal output depends on the number of labour and capital units employed to produce coal. As such, the general form of its production function may be expressed symbolically as QC = f (K, L) …(3.14)where QC = the quantity of coal produced per time unit; K = capital; and L = labour.
The production function (10.1) implies that quantity of coal produced depends on the quantity of capital (K) and labour (L) employed to produce coal. Increasing coal production will require increasing K and L. Whether the firm can increase both K and L or only L depends on the time period it takes into account for increasing production, i.e., whether the firm considers a short-run or a long-run.
By definition, as noted above, short-run is a period in which supply of capital is inelastic. In the short-run, therefore, the firm can increase coal production by increasing only labour since the supply of capital in the short run is fixed. Long-run is a period during which supply of both labour and capital becomes elastic, i.e., it increases over time. In the long-run, therefore,

NOTES
Self-InstructionalMaterial 63
Cost and Production Analysis
the firm can employ more of both capital and labour. Accordingly, there are two kinds of production functions: (i) Short-run production function; and (ii) Long-run production function.The two kinds of production functions are described here breifly.(i) Short-run Production Function: A short-run production function is a single variable function. The single variable factor is labour (L), capital (K) remaining constant, expressed as Q = f(L, K ), where K indicates constant capital. …(3.15)
An estimated short-run production function may take any of the following forms depending on input-output relationship. (a) Linear function: Q = a + bL (b) Quadratic function: Q = a + bL – cL2; (c) Cubic function: a + bL + cL2 – dL3; or (d) Power function: Q = aLb (b > 1).(ii) Long-run Production Function: In the long-term production function, both K and L are treated as variable factors and the function takes the following form.
Q = f (K, L)As mentioned above, a production function can be expressed in the
form of an equation, a graph or a table, though each of these forms can be converted into its other forms. We illustrate here how a production function in the form of an equation can be converted into its tabular form. Consider, for example, the Cobb-Douglas production function—the most famous and widely used production function—given in the form of an equation as Q = AKaLb …(3.16)(where K = Capital, L = Labour, and A, a and b are parameters, and b = 1 – a)
Production function (3.16) gives the general form of Cobb-Douglas production function. The numerical values of parameters A, a and b, can be estimated by using actual factory data on production, capital and labour. Suppose numerical values of parameters are estimated as A = 50, a = 0.5 and b = 0.5. Once numerical values are known, the Cobb-Douglas production function can be expressed in its specific emperical form as follows.
Q = 50 K0.5 L0.5
This production function can be used to obtain the maximum quantity (Q) that can be produced with different combinations of capital (K) and labour (L). The maximum quantity that can be produced from different combinations of K and L can be worked out by using the following formula.

Cost and Production Analysis
NOTES
Self-Instructional 64 Material
Q 50 or 50KL Q K L= =
For example, suppose K = 2 and L = 5. Then50 2 5 158Q = =
and if K = 5 and L = 5, then50 5 5 250Q = =
Similarly, by assigning different numerical values to K and L, the resulting output can be worked out for different combinations of K and L and a tabular form of production function can be prepared. Table 3.3 shows the maximum quantity of a commodity that can be produced by using different combinations of K and L, both varying between 1 and 10 units.
Table 3.3 Production Function in Tabular Form
Table 3.3 shows the units of output that can be produced with different combinations of capital and labour. The figures given in Table 10.1 can be graphed in a three-dimensional diagram.
Before we proceed, it is important to note here that four combinations of K and L given in Table 3.3—10K + 1L, 5K + 2L, 2K + 5L and 1K + 10L—produce the same output, i.e., 158 units. When these combinations of K and L producing the same output are joined by a line, it produces a curve as shown in the table. This curve is called ‘Isoquant’. An isoquant is a very important tool used to analyze input-output relationship.
3.5.1 Laws of Production in the Short-Run
The laws of production state the relationship between output and input. In the short-run, input-output relations are studied with one variable input (labour), other inputs (especially, capital) held constant. The laws of production under

NOTES
Self-InstructionalMaterial 65
Cost and Production Analysis
these conditions are called the ‘Laws of Variable Proportions’ or the ‘Laws of Returns to a Variable Input’.
3.5.2 Concepts of Long-term Laws of Production
In the preceding section, we have discussed the short-term laws of production, i.e., technological relationship between inputs and output assuming labour to be the only variable input, capital held constant. In this section, we proceed to discuss the long-term laws of production, i.e., the nature of relationship between inputs and output under the condition that both the inputs, capital and labour, are variable factors. In the long-run, supply of both the inputs is supposed to be elastic and, therefore, firms can use larger quantities of both labour and capital. With larger employment of capital labour, the scale of production increases. The nature of changing relationship between changing scale of inputs and output is refered to the laws of returns to scale. The laws of returns to scale are generally explained through the production function and isoquant curve technique. The most common and simple tool of analysis is isoquant curve technique.
Check Your Progress
1. Define marginal cost. 2. What is private cost? 3. What are diseconomies of scale?
3.6 ANSWERS TO CHECK YOUR PROGRESS QUESTIONS
1. Marginal cost is defined as the addition to the total cost on account of producing one additional unit of the product.
2. Private costs are those which are actually incurred or provided for by an individual or a firm on the purchase of goods and services from the market. For a firm, all the actual costs, both explicit and implicit, are private costs.
3. Diseconomies of scale are disadvantages that arise due to the expansion of production scale beyond its optimum level and lead to rise in the cost of production.
3.7 SUMMARY
• The cost concepts that are relevant to business operations and decisions can be grouped on the basis of their nature and purpose under two

Cost and Production Analysis
NOTES
Self-Instructional 66 Material
overlapping categories: (i) cost concepts used for accounting purposes, and (ii) analytical cost concepts used in economic analysis of business activities.
• In contrast to explicit costs, there are certain other costs that do not take the form of cash outlays, nor do they appear in the accounting system. Such costs are known as implicit or imputed costs.
• The analytical cost concepts refers to the different cost concepts that are used in analysing the cost-output relationship with increase in inputs and output and also the cost concepts that figure in analysing the effect of expansion of production on the society as a whole.
• Social costs on the other hand, refer to the total cost borne by the society due to production of a commodity. Social costs include both private cost and the external cost.
• The theory of cost deals with how cost of production changes with change in output. In other words, the cost theory deals with cost-output relations. The basic principle of the cost-output relationship is that the total cost increases with increase in output.
• In the context of the production theory, long run refers to a period in which firms can use more of both the inputs – labour and capital – to increase their production.
• The break-even analysis is a technique of having a preview of profit prospects and a tool of profit planning. It integrates the cost and revenue estimates to ascertain the profits and losses associated with different levels of output.
• Economies of scale result in cost saving and diseconomies lead to rise in cost. Economies and diseconomies of scale determine also the returns to scale.
• Managerial economies arise from (a) specialization in managerial activities, i.e., the use of specialized managerial personnel, and (b) systemization of managerial functions.
• Diseconomies of scale are disadvantages that arise due to the expansion of production scale beyond its optimum level and lead to rise in the cost of production.
• Production function is a mathematical presentation of input-output relationship. More specifically, a production function states the technological relationship between inputs and output in the form of an equation, a table or a graph.

NOTES
Self-InstructionalMaterial 67
Cost and Production Analysis3.8 KEY WORDS
• Actual cost: It is all paid out costs of the business firms to take the advantage of the best opportunity available to them.
• Business cost: It includes all the expenses that are incurred to carry out a business.
3.9 SELF ASSESSMENT QUESTIONS AND EXERCISES
Short-Answer Questions
1. Write short notes on the following: (a) Replacement cost (b) variable cost 2. Briefly mention the function of cost control. 3. What is the use of the break-even analysis technique?
Long-Answer Questions
1. Discuss the cost and output relationship. 2. Explain the production function with reference to cost and output
analysis. 3. Explain the economies of scale of production.
3.10 FURTHER READINGS
Dwivedi, D. N. 2008. Principles of Economics, Seventh Edition. New Delhi: Vikas Publishing House.
Weil. David N. 2004. Economic Growth. London: Addison Wesley.Thomas, Christopher R. and Maurice S. Charles. 2005. Managerial
Economics: Concepts and Applications, Eighth Edition. New Delhi: Tata McGraw-Hill Publishing Company Limited.
Mankiw, Gregory N. 2002. Principles of Economics, Second Edition. India: Thomson Press.

Pricing-Output Decisions and Pricing Policies
NOTES
Self-Instructional 68 Material
UNIT 4 PRICING-OUTPUT DECISIONS AND PRICING POLICIES
Structure 4.0 Introduction 4.1 Objectives 4.2 Pricing and Output Decisions in Different Market Situations 4.3 Perfect Competition
4.3.1 Price Determination under Perfect Competition 4.3.2 Output Determination in Short Run: Short-run Equilibrium of the Firm 4.3.3 Determination of Output in Long Run
4.4 Imperfect Competition: Monopoly 4.4.1 Monopoly Pricing and Output Decision: Short-Run Analysis 4.4.2 Monopoly Pricing and Output Decision: Long-Run analysis
4.5 Imperfect Competition: Duopoly 4.6 Pricing Policies
4.6.1 Types and Factors Affecting Pricing Policies 4.6.2 Mark-up Pricing and Marginalist Rule Compared 4.6.3 Limitations of Mark-up Pricing Rule 4.6.4 Multiple Product Pricing 4.6.5 Pricing in the Life-cycle of A Product 4.6.6 Pricing a New Product 4.6.7 Pricing in Maturity Period 4.6.8 Pricing a Product in Decline 4.6.9 Pricing in Relation to Established Products 4.6.10 International Price Discrimination: Dumping
4.7 Answers to Check Your Progress Questions 4.8 Summary 4.9 Key Words 4.10 Self Assessment Questions and Exercises 4.11 Further Readings
4.0 INTRODUCTION
The market structure determines a firm’s power to fix the price of its product a great deal. The degree of competition determines a firm’s degree of freedom in determining the price of its product. The degree of freedom implies the extent to which a firm is free or independent of the rival firms in taking its own pricing decisions. Depending on the market structure, the degree of competition varies between zero and one. And, a firm’s discretion or the degree of freedom in setting the price for its product varies between one and none in the reverse order of the degree of competition. As a matter of rule, the higher the degree of competition, the lower the firm’s degree of

NOTES
Self-InstructionalMaterial 69
Pricing-Output Decisions and Pricing Policies
freedom in pricing decision and control over the price of its own product and vice versa. In this unit you will study about pricing and output decisions in different market situations such as competition, monopoly and duopoly, and pricing policies.
4.1 OBJECTIVES
After going through this unit, you will be able to: • Explain price determination under perfect and imperfect competition • Discuss monopoly pricing and output decision • Describe the functioning of duopoly
4.2 PRICING AND OUTPUT DECISIONS IN DIFFERENT MARKET SITUATIONS
Let us see how the degree of competition affects pricing decisions in different kinds of market structures.
Under perfect competition, a large number of firms compete against each other for selling their product. Therefore, the degree of competition under perfect competition is close to one, i.e., the market is highly competitive. Consequently, firm’s discretion in determining the price of its product is close to none. In fact, in perfectly competitive market, price is determined by the market forces of demand and supply and a firm has to accept the price determined by the market forces. If a firm uses its discretion to fix the price of its product above or below its market level, it loses its revenue and profit in either case. For, if it fixes the price of its product above the ruling price, it will not be able to sell its product, and if it cuts the price down below its market level, it will not be able to cover its average cost. In a perfectly competitive market, therefore, firms have little or no choice in respect to price determination.
As the number of firms decreases, the degree of competition decreases. And, as a result, firm’s control over the price and its discretion in pricing decision increases. For example, under monopolistic competition, where degree of competition is high but less than one, the firms have some discretion in setting the price of their products. Under monopolistic competition, the degree of freedom depends largely on the number of firms and the level of product differentiation. Where product differentiation is real, firm’s discretion and control over the price is fairly high and where product differentiation is nominal or only notional, firm’s pricing decision is highly constrained by the prices of the rival products.
When the number of firms is few, the market takes the form of an oligopoly. Under oligopoly, the degree of competition is quite low, lower than

Pricing-Output Decisions and Pricing Policies
NOTES
Self-Instructional 70 Material
that under monopolistic competition. The firms, therefore, have a good deal of control over the price of their products and can exercise their discretion in pricing decisions, especially where product differentiation is prominent. However, the fewness of the firms gives them an opportunity to form a cartel or to make some settlement among themselves for fixation of price and non-price competition.
In case of a monopoly, the degree of competition is close to nil. An uncontrolled monopoly firm has full freedom to determine the price of its product. A monopoly, in the true sense of the term, is free to fix any price for its product, of course, under certain constraints, viz., (i) the objective of the firm, and (ii) demand conditions.
4.3 PERFECT COMPETITION
Perfect competition may be defined as a kind of market in which there are a large number of buyers and sellers each one buying and selling a homogeneous product and no buyer or seller has control over the price of the product. The number of buyers and sellers is so large that the quantity bought and sold by each buyer and seller is insignificant and no buyer or seller has the power to alter the market price. In a perfectly competitive market, there is complete absence of rivalry among the firms. In fact, in a perfectly competitive market, competition among the individual firms is so widely dispersed that it amounts to no competition.
It may be added at the outset that the concept of perfectly competitive market is an abstract concept. Perfect competition as conceived by the economists does not exist in reality, except in sporadic markets like auctions. However, analysis of price and output determination under perfect competition ‘lays the foundation of pricing theory’. That is why it has become a common practice to begin the analysis of price determination with price determination under perfect completion.
4.3.1 Price Determination under Perfect Competition
In a perfectly competitive market, price of a product is determined by the market forces – market demand and market supply – not by the individual firms. Price determined by the market forces is called market price. Once market price is determined, the only option open to individual firms is to determine their equilibrium output—the output that maximizes their profit. The system of market price determination is recalled here briefly with the purpose of showing the derivation of demand curve—demand line, in fact—faced by the individual firms under perfect competition.
The price determination under perfect competition is illustrated in Fig. 4.1. As shown in Panel (a) of Fig. 4.1, market demand is

NOTES
Self-InstructionalMaterial 71
Pricing-Output Decisions and Pricing Policies
shown by the demand curve, DD’ and market supply curve by SS′. Demand and supply curves intersect at point E determining the market equilibrium. At the equilibrium point E, market price is determined at OP = EQ and market size at total demand and supply at OQ.
Fig. 4.1 Determination of Market Price and Demand for Individual Firms
The analysis of market equilibrium provides the basis for deriving demand curve for individual firms. Once market price is determined, the price is determined for all individual firms. Individual firms have no power to change the price. The firms have the only option to sell their product at the given price. At market price OP, the firms can sell any quantity of their product. This condition implies that the demand curve for an individual firm is given by a straight line as shown by line PD in Panel (b) of Fig. 4.1. The line PD represents firm’s demand line, P = MR line, i.e., price (P) is equal to marginal revenue (MR). The same demand line will be used to show how firms determine their equilibrium output, i.e., the profit maximizing output.
4.3.2 Output Determination in Short Run: Short-run Equilibrium of the Firm
In the preceding section, we discussed the determination of price under perfect competition. Once market price is determined, the firms are left with option to find the output that can maximize their profit. In this section, we proceed to discuss how firms determine their profit-maximizing output, i.e., how they find their equilibrium given the market and cost conditions. In the long-run, however, market and cost conditions tend to change. Therefore, firm’s decision on output determinations is analyzed under (i) short-run conditions, and (ii) long-run conditions. In this section, firm’s short-run equilibrium is discussed under short-run conditions. Firm’s equilibrium under long-run conditions will be discussed in the next section.
Short-run Equilibrium. A short-run is, by definition, a period in which firm’s cost curves are given; price of the product is given; and the number of firms is also given. The determination of the short-run equilibrium of the firm is illustrated in Fig. 4.2. Market price determination in short-run is shown

Pricing-Output Decisions and Pricing Policies
NOTES
Self-Instructional 72 Material
in Panel (a) and firm’s equilibrium in Panel (b). Given the original demand and supply curves as DD and SS, respectively, market price is determined at the point of intersection of demand and supply curves at point E. At market equilibrium point E, market price is determined at OP1 = EQ.
Fig. 4.2 Pricing under Perfect Competition in the Short-run
Given the price EQ (= OP1), an individual firm can produce and sell any quantity at this price. But any quantity will not yield maximum profit. Given their cost curves, the firms are required to adjust their output to the price EQ so that they maximize their profit.
The process of firm’s output determination and its equilibrium are shown in Fig. 4.2(b). Profit is maximum at the level of output where MR = MC. Since price is fixed at EQ, firm’s AR = EQ. If AR is constant, MR = AR. The firm’s MR is shown by AR = MR line. Firm’s upward sloping MC curve intersects AR = MR at point E. At point E, MR = MC. Point E is, therefore, the firm’s equilibrium point. An ordinate drawn from point E to the output axis, as shown by the line EM, determines the profit-maxmizing output at OM. At this output the firm’s MR = MC. This satisfies the necessary condition for profit maximization. The total maximum profit has been shown by the area P1TNE in Fig. 4.2(b).
The total profit is calculated as Profit = (AR – AC) Q. In Fig. 4.2(b), AR = EM; AC = NM; and Q = OM. Substituting these values into the profit equation, we get Profit = (EM
– NM) OM. Since EM – NM = EN, Profit = EN × OM = P1TNE. This is the maximum
supernormal profit, given the price and cost curves, in the short run.Firms may make losses in the short-run While firms may make
supernormal profit, there may be conditions under which firms make losses in the short-run. For instance, suppose demand curve DD shifts downward for some reason to DD′, as shown in Fig. 4.2(a). As a result, market price

NOTES
Self-InstructionalMaterial 73
Pricing-Output Decisions and Pricing Policiesdecreases from EQ to EQ. This will force a process of output adjustments
till firms reach a new equilibrium at point E. At equilibrium point E, firm’s AR = MR = MC. But, as Fig. 4.2(b) shows, AR < AC. Therefore, the firms incur a loss. But, since in the short-run, it may not be desirable to close down the production, the firms try to minimize their loss, by adjusting their output downward to OM where it covers only its MC, i.e., EM. The firms survive in the short-run so long as they cover their MC, especially the variable cost of labour.
It may thus be concluded that, in a perfectly competitive market, a firm may make supernormal profit, normal profit or losses as well, in the short run depending on market conditions.
4.3.3 Determination of Output in Long Run
In the preceding section, we have discussed the short-run equilibrium of the firm, i.e., output determination by an individual firm in short run under perfect competition. We proceed now to discuss firm’s equilibrium in long run. By definition, long run is a period in which (i) firm’s cost and revenue curves are subject to change, (ii) firms can increase their scale of production by increasing their capital and output, (iii) existing firms can exit and new firms can enter the industry, and (iv) market conditions can change with change in market demand and supply conditions. Besides, production technology may change affecting the demand for labour and capital. In this section, we will analyse the determination of long-run equilibrium of the firm under perfect competition.
Equilibrium of the Firm
As noted above, market conditions change in the long run. The determination of long-run equilibrium of the firm is illustrated graphically in Fig. 4.3. To analyse the long-run equilibrium of the firm, let us begin by looking at short-run equilibrium of the firm. Suppose (i) short-run market price is given at OP1 and firm’s demand line as AR = MR, and (ii) firm’s short-run average and marginal cost curves are given as SAC1 and SMC1, respectively as shown in Panel (a) of Fig. 4.3. Given the firm’s cost and revenue curves, firm’s short-run equilibrium is determined at point E1 in panel (b) of Fig. 4.3 and firm’s short-run equilibrium output is OQ1. At this output, the firm makes abnormal profit equal to E1M = E1Q1 – MQ1, which is the same as AR – AC per unit. Abnormal profit brings about three major changes in market conditions.
First, abnormal profit motivates firms to increase the scale of their production. As a result, they gain from economies of scale and their cost curves shift downward as shown by SAC2 and SMC2. Consequently, firm’s long-run cost curves, LAC and LMC, tend to decline as shown in Fig. 4.3(b).

Pricing-Output Decisions and Pricing Policies
NOTES
Self-Instructional 74 Material
Second, attracted by abnormal profit new firms enter the industry. Consequently, market supply of the product increases as shown by the shift in supply curve from SS1 to SS2 in Fig. 4.3(a).
Third, as a result of the first two changes, the price of the product decreases from E1N1 to E2N2 or from OP1 to OP2, as shown in Fig. 4.3(a).
Fig. 4.3 Long-run Equilibrium of the Firm and Industry
Given the new market price, OP2, firms attain their equilibrium in the long run at point E2 where AR = MR = LMC = LAC = SMC = SAC as shown in Fig. 4.3(b). As the figure shows, the firms of industry reach their equilibrium in the long run where both short- and long-run equilibrium conditions are satisfied simultaneously. In a perfectly competitive market, the cost and revenue conditions are given for the firms by the market conditions. Therefore, when price goes down to OP2, what firms are required to do is to adjust their output to the given revenue and cost conditions in order to maximize their profit. Through this process of adjustment for output, the firms reach the equilibrium in the long run at point E2 in Panel (b). Point E2 is the point of equilibrium for all the firms in the long run.
In case market price falls below OP2, say, to OP3, all the firms make losses. This brings in a reverse process of adjustment. While some firms quit the industry, some firms cut down the size of the firm. As a result, total supply decreases, demand remaining the same. Consequently, price tends to rise. This process of output adjustment continues until industry reaches back to its equilibrium at point E2, where LAC is tangent to P = AR = MR for each firm in the industry. At point E2, the point of equilibrium, P = MR = LMC = LAC = SMC = SAC. Since P = LAC, the firms make only normal profits in the long run. If firms deviate from point E2, due to some short-run disturbances, the market forces will restore the equilibrium.

NOTES
Self-InstructionalMaterial 75
Pricing-Output Decisions and Pricing Policies4.4 IMPERFECT COMPETITION: MONOPOLY
The term pure monopoly means an absolute power of a firm to produce and sell a product that has no close substitute. In other words, a monopolized market is one in which there is only one seller of a product having no close substitute. The cross elasticity of demand for a monopoly product is either zero or negative. A monopolized industry is a single-firm industry. Firm and industry are identical in a monopoly setting. In a monopolized industry, equilibrium of the monopoly firm signifies the equilibrium of the industry.
However, the precise definition of monopoly has been a matter of opinion and purpose. For instance, in the opinion of Joel Deal, a noted authority on managerial economics, a monopoly market is one in which ‘a product of lasting distinctiveness is sold. The monopolized product has distinct physical properties recognized by its buyers and the distinctiveness lasts over many years.’ Such a definition is of practical importance if one recognizes the fact that most of the commodities have their substitutes varying in degree and it is entirely for the consumers/users to distinguish between them and to accept or reject a commodity as a substitute. Another concept of pure monopoly has been offered by E.H. Chamberlin who envisages monopoly as the control of all goods and services by the monopolist. But such a monopoly has hardly ever existed, hence his definition is questionable. In the opinion of some authors, any firm facing a sloping demand curve is a monopolist. This definition, however, includes all kinds of firms except those under perfect competition. For our purpose here, we use the general definition of pure monopoly, i.e., a firm that produces and sells a commodity which has no close substitute.
4.4.1 Monopoly Pricing and Output Decision: Short-Run Analysis
As under perfect competition, the theory of pricing and output determination under monopoly is based on profit maximization hypothesis, given the revenue and cost conditions. Although cost conditions, i.e., AC and MC curves, in a competitive and monopoly market are generally identical, revenue conditions, i.e., AR and MR curves, are different under monopoly. Unlike a competitive firm, a monopoly firm faces a downward sloping demand curve. The reason is a monopolist has the option and power to reduce the price and sell more and to raise the price and sell less. Therefore, given the price-demand relationship, demand curve under monopoly is a typical downward sloping demand curve.
In case of a demand curve is sloping downward, marginal revenue (MR) curve lies below the AR curve and, technically, the slope of the MR curve is twice that of AR curve.
The short-run revenue and cost conditions faced by a monopoly firm are presented in Fig. 4.4. Firm’s average and marginal revenue curves are

Pricing-Output Decisions and Pricing Policies
NOTES
Self-Instructional 76 Material
shown by the AR and MR curves, respectively, and its short-run average and marginal cost curves are shown by SAC and SMC curves, respectively. The price and output decision rule for profit maximizing monopoly is the same as for a firm in the competitive industry.
Fig. 4.4 Price Determination under Monopoly: Short-run
As noted earlier, profit is maximized at the level of output at which MC = MR. Given the profit maximization condition, a profit maximizing monopoly firm chooses a price-output combination at which MR = SMC. Given the monopoly firm’s cost and revenue curves in Fig. 4.4, its MR and SMC intersect at point N. An ordinate drawn from point N to X-axis, determines the profit maximizing output at OQ. The ordinate NQ extended to the demand curve (AR = D) gives the profit maximizing price PQ. It means that given the demand curve, the output OQ can be sold per time unit at only one price, i.e., PQ (= OP1). Thus, the determination of equilibrium output simultaneously determines the equilibrium price for the monopoly firm. Once price is fixed, the unit and total profits are also simultaneously determined. Hence, the monopoly firm is in a state of equilibrium.
At output OQ and price PQ, the monopoly firm maximizes its unit and total profits. Its per unit monopoly or economic profit (i.e., AR – SAC) equals PQ – MQ = PM. Its total profit, p = OQ × PM. Since OQ = P2M, p = P2M × PM = area P1PMP2 as shown by the shaded rectangle. Since cost and revenue conditions are not expected to change in the short-run, the equilibrium of the monopoly firm will remain stable.
Determination of Monopoly Price and Output: Algebraic Solution
The determination of price and output by a monopoly firm in the short-run is illustrated above graphically (see Fig. 4.4). Here, we present an algebraic solution to the problem of determination of equilibrium price and output under monopoly.

NOTES
Self-InstructionalMaterial 77
Pricing-Output Decisions and Pricing Policies
Suppose demand and total cost functions for a monopoly firm are given as follows.
Demand function : Q = 100 – 0.2 P …(4.1.1) Price function : P = 500 – 5Q ...(4.1.2) Cost function : TC = 50 + 20Q + Q2 ...(4.2)Given the demand and cost functions, the problem before the monopoly
firm is to find the profit maximizing output and price. The problem can be solved as follows.
We know that profit is maximum at output at which MR = MC. So the first step is to find MR and MC from the demand function and cost function, respectively. We have noted earlier that MR and MC are the first derivation of TR and TC functions, respectively. TC function is given, but TR function is not. So, let us find TR function first. We know that
TR = P.QSince P = 500 – 5Q, by substitution, we get
TR = (500 – 5Q) Q TR = 500Q – 5Q2 ...(4.3)
Given the TR function (4.3), MR can be obtained by differentiating the TR function.
MR = 1 1 12 2 4
= = 500 – 10Q
Likewise, MC can be obtained by differentiating the TC function (4.2).
MC = 1 1 312 4 8
− = = 20 + 2Q
Now that MR and MC function are known, profit maximizing output can be easily obtained. Recall that profit is maximum where MR = MC. As given above, MR = 500 – 10Qand MC = 20 + 2Q
By equalizing the MR and MC functions, we get profit maximizing output (Q) as follows. MR = MC 500 – 10Q = 20 + 2Q 480 = 12Q Q = 40
The output Q = 40 is the profit maximizing output.Now profit maximizing price can be obtained by substituting 40 for Q
in the price function (4.1.2). Thus, P = 500 – 5 (40) = 300. Profit maximizing price is `300.

Pricing-Output Decisions and Pricing Policies
NOTES
Self-Instructional 78 Material
Given the TR and TC functions, the total profit (p) can be obtained as follows.
p = TR – TCBy substitution, we get p = 500Q – 5Q2 – (50 + 20Q + Q2)
= 500Q – 5Q2 – 50 – 20Q – Q2
By substituting profit maximizing output (40) for Q, we get p = 500(40) – 5(40)(40) – 50 – 20(40) – (40 ×
40) = 20,000 – 8,000 – 50 – 800 – 1600 = 9,550
Thus, total maximum profit comes to `9,550.
Does a Monopoly Firm Always Earn Abnormal Profit?
There is no certainty that a monopoly firm will always earn an economic or abnormal profit. Whether a monopoly firm earns abnormal profit or normal profit or incurs loss depends on (i) its cost and revenue conditions; (ii) threat from potential competitors; and (iii) government policy in respect of monopoly.
If a monopoly firm operates at the level of output where MR = MC, its profit depends on the relative levels of AR and AC. Given the level of output, there are three possibilities. (i) if AR > AC, there is abnormal profit for the firm, (ii) if AR = AC, the firm earns only normal profit, and (iii) if AR < AC, though only a theoretical possibility, the firm makes losses.
4.4.2 Monopoly Pricing and Output Decision: Long-Run Analysis
The decision rules regarding optimal output and pricing in the long-run are the same as in the short-run. In the long-run, however, a monopolist gets an opportunity to expand the scale of its production with a view to enhancing its long-run profits. The expansion of the plant size may, however, be subject to such conditions as (a) size of the market, (b) expected economic profit, and (c) risk of inviting legal restrictions. Let us assume, for the time being, that none of these conditions limits the expansion of a monopoly firm and discuss the price and output determination in the long-run.
The equilibrium of monopoly firm and its price and output determination in the long-run is shown in Fig. 4.5. The AR and MR curves show the market demand and marginal revenue conditions faced by the monopoly firm. The

NOTES
Self-InstructionalMaterial 79
Pricing-Output Decisions and Pricing Policies
LAC and LMC show the long-run cost conditions. It can be seen in Fig. 4.5, that monopoly’s LMC and MR intersect at point P determining profit maximizing output at OQ2. Given the AR curve, the price at which the total output OQ2 can be sold is P2Q2. Thus, in the long-run, equilibrium output will be OQ2 and price P2Q2. This output-price combination maximizes monopolist’s long-run profit. The total long-run monopoly profit is shown by the rectangle LMSP2.
Comparison of Short-run and Long-run Equlibrium
It can be seen in Fig 4.5 that compared to short-run equilibrium, the monopolist produces a larger output and charges a lower price and makes a larger monopoly profit in the long-run. In the short-run, monopoly’s equilbirium is determined at point A, the point at which SMC1 intersects the MR curve. Thus, monopoly’s short-run equilibrium output is OQ1 which is less than long-run output OQ2. But the short-run equilibrium price P1Q1 is higher than the long-run equilibrium price P2Q2. The total short-run monopoly profit is shown by the rectangle JP1TK which is much smaller than the total long-run profit LP2SM. This, however, is not necessary: it all depends on the short-run and long-run cost and revenue conditions.
Fig. 4.5 Equilibrium of Monopoly in the Long-run
It may be noted at the end that if there are barriers to entry, the monopoly firm may not reach the optimal scale of production (OQ2) in the long-run, nor can it make full utilization of its existing capacity. The firm’s decision regarding plant expansion and full utilization of its capacity depends solely on the market conditions.
Price Discrimination Under Monopoly
The theory of price determination under monopoly, as discussed above, gives the impression that under monopoly only one price is fixed and the same

Pricing-Output Decisions and Pricing Policies
NOTES
Self-Instructional 80 Material
price is charged from all consumers of the product. This is, however, not the general case. Monopoly firms have been found to charge different prices from different class of consumers. This is called price discrimination. Price discrimination means selling the same or slightly differentiated product to different sections of consumers at different prices, not commensurate with the cost of differentiation. Consumers are discriminated on the basis of their income or purchasing power, geographical location, age, sex, colour, marital status, quantity purchased, time of purchase, etc. There is another kind of price discrimination. The same price is charged from the consumers of different areas while cost of production in two different plants located in different areas is not the same.
4.5 IMPERFECT COMPETITION: DUOPOLY
Augustin Cournot, a French economist, was the first to develop a formal oligopoly model in 1838 in the form of a duopoly model. Cournot developed his model with the example of two firms, each owning a well of mineral water and water being produced at zero cost. To illustrate his model, Cournot made the following assumptions. (a) There are two firms, each owning an artesian mineral water well; (b) Both the firms operate their wells at zero cost; (c) Both of them face a demand curve with constant negative slope; (d) Each seller acts on the assumption that his competitor will not react
to his decision to change his output and price. This is Cournot’s behavioural assumption.On the basis of this model, Cournot has concluded that each seller
ultimately supplies one-third of the market and both the firms charge the same price. And, one-third of the market remains unsupplied.
Cournot’s duopoly model is illustrated in Fig. 4.6. The demand curve for mineral water is given by the AR curve and their MR by the MR curve. To begin with, let us suppose that firm A is the only seller of mineral water in the market. By assumption, its MC = 0. Following the profit maximizing rule, it sells quantity OQ where its MC = 0 = MR, at price OP2. Its total profit is OP2PQ. This is the maximum profit seller A can make given the demand curve.

NOTES
Self-InstructionalMaterial 81
Pricing-Output Decisions and Pricing Policies
Fig. 4.6 Price and Output Determination under Duopoly: Cournot’s Model
Now let another firm B enter the market. The market open to B is the market unsupplied by A. This market equals QM which is half of the total market. That is, B can sell its product in the remaining half of the market. B assumes that A will not change its price and output because A is making maximum profit. In other words, B assumes that A will continue to sell OQ at prices OP2. Thus, the market available to firm B is QM and the relevant part of the demand curve is PM. The MR curve corresponding to B’s demand curve PM is given by PN. B’s MR curve, PN, it bisects QM at point N where QN = NM. In order to maximize its revenue, B sells QN at price OP1 = P′N. Its total revenue is maximum at QRP′N which equals its total profit. Note that B supplies only QN = (1/2)/2 = 1/4 of the market.
With the entry of firm B, price falls to OP1. Price falls becuase A’s customers will switch over to firm B. Therefore, firm A is forced to reduce its price. Faced with this situation, firm A adjusts its price and output to the changed conditions. Firm A assumes that firm B will not change its output QN and price OP1 as it is making maximum profit. Accordingly, firm A assumes that firm B will continue to supply QN = 1/4 of the market. Thus, firm A assumes that it has 3/4 (= 1 – 1/4) of the market available to it. To maximize its profit, firm A supplies 1/2 of the remaining 3/4 of the market, i.e., 1/2 × 3/4 = 3/8 of the market. It is noteworthy that A’s market share has fallen from 1/2 to 3/8.
Now it is firm B’s turn to react. Following Cournot’s assumption, firm B assumes that firm A will continue to supply only 3/8 of the market and the rest of the market is open to him, which equals 1 – 3/8 = 5/8. To maximize his profit under the new conditions, firm B supplies half of the remaining market, i.e., firm firm B supplies 1/2 × 5/8 = 5/16 of the market. It is now for firm A to reappraise the situation and adjust his price and output accordingly.
This process of action and reaction continues in successive periods. In the process, firm A continues to lose his market share and firm B continues

Pricing-Output Decisions and Pricing Policies
NOTES
Self-Instructional 82 Material
to gain. Eventually, a situation is reached when their market shares equal 1/3 each. Any further attempt to adjust output produces the same result. The firms, therefore, reach their equilibrium position where each one supplies one-third of the market and both charge the same price and one-third of the market remains unsupplied.
The actions and reactions and equilibrium of the firms A and B, according to Cournot’s model, are presented in Table 4.1.
Cournot’s equilibrium solution is stable. For, given the action and reaction, it is not possible for any of the two sellers to increase their market share beyond one-third of the market as shown in the last row of the table.
Table 4.1 Determination of Market Share
Period Frim A’s Market share Firm B’s Market share
I 1 1(1)2 2
= 1 1 12 2 4
=
II 1 1 312 4 8
− = 1 3 512 8 16
− =
III 1 5 1112 16 32
− = 1 11 211
2 32 64 − =
IV 1 21 4312 64 128
− =
1 43 8512 128 256
− =
N 1 1 112 3 3
− = 1 1 112 3 3
− =
Note: In the calculation of market share, number 1 represents the total market.
4.6 PRICING POLICIES
We have discussed the conventional theories of price determination under the conditions of different market structures, under the postulate that firms’ objective is to maximize profit. The alternative theories of firm offered by the next generation of economists have built their theories assuming different objectives of firms. A section of economists has built game theory and have shown its application to business decision-making. As noted in previous chapters, all these theories and strategic models have their own deficiencies and problems in application because of increasing complexity of the business world. The other economists have recognized the complexity of business world and have explained how firms formulate their strategic pricing policy and determine the price of their product.

NOTES
Self-InstructionalMaterial 83
Pricing-Output Decisions and Pricing Policies
4.6.1 Types and Factors Affecting Pricing Policies
Cost-plus pricing is also known as ‘mark-up pricing’, ‘average cost pricing’ and ‘full cost pricing’. The cost-plus pricing is the most common method of pricing used by the manufacturing firms. The general practice under this method is to add a ‘fair’ percentage of profit margin to the average variable cost (AVC). The formula for setting the price is given as P = AVC + AVC (m) …(4.4) where AVC = average variable cost, and m = mark-up percentage, and AVC (m) = gross profit margin (GPM).
The mark-up percentage (m) is fixed so as to cover average fixed cost (AFC) and a net profit margin (NPM). Thus, AVC (m) = AFC + NPM …(4.5)
The general procedure followed by the firms for arriving at AVC and price fixation may be summarized as follows.
The first step in price fixation is to estimate the average variable cost. For this, the firm has to ascertain the volume of its output for a given period of time, usually one accounting or fiscal year. To ascertain the output, the firm uses figures of its ‘planned’ or ‘budgeted’ output or takes into account its normal level of production. If the firm is in a position to compute its optimum level of output or the capacity output, the same is used as standard output in computing the average cost.
The next step is to compute the total variable cost (TVC) of the ‘standard output.’ The TVC includes direct cost, i.e., the cost of labour and raw material, and other variable costs e.g., electricity and transportation cost, etc. These costs added together give the total variable cost. The ‘Average Variable Cost’ (AVC) is then obtained by dividing the total variable cost (TVC) by the ‘standard output’ (Q), i.e.,
AVC = 1 1(1)2 2
=
After AVC is obtained, a ‘mark-up’ in the form of some percentage of AVC is added to it as profit margin and the price is fixed. While determining the mark-up, firms always take into account ‘what the market will bear’ and the degree of competition in the market.
4.6.2 Mark-up Pricing and Marginalist Rule Compared
The mark-up or average-cost pricing method appears to be a ‘rule of thumb’ totally different from the marginalist rule of pricing. Fritz Machlup has, however, shown that mark-up pricing is not incompatible with the marginalist rule of pricing. Rather, it is very much compatible with marginalist rule of pricing. According to Machlup, when we look into the logic of mark-up

Pricing-Output Decisions and Pricing Policies
NOTES
Self-Instructional 84 Material
pricing, it appears quite similar to the marginalist rule of pricing. Let us now compare the two rules of pricing.
Recall that, according to the marginalist rule, profit is maximum at the level of output where MC = MR and that the mark-up pricing method is given by P = AVC + AVC (m)or P = AVC (1 + m) …(4.6)
Let us now see how Machlup has proved that the mark-up pricing ultimately converges with the marginalist rule of pricing, at least under constant cost conditions.
Recall that profit is maximum at the level of output at which MC = MR …(4.7)
and, as shown earlier, MR = 1 1 12 2 4
=
or MR = 1 1 312 4 8
− = …(4.8)
where e is price elasticity of demand.By substituting Eq. (4.8) in Eq. (4.7), we may restate the necessary
condition of profit maximization as
MC = 1 3 512 8 16
− = …(4.9)
If MC is constant, MC = AVC. By substituting AVC for MC, Eq. (4.9) may be rewritten as,
AVC = 1 5 1112 16 32
− = …(4.10)
By rearranging the terms in Eq. (20.7), we get
P = 1 11 2112 32 64
− =
P = 1 21 4312 64 128
− = …(4.11)
Now, consider Eq. (4.9). If MC > 0, then 1 43 8512 128 256
− = must be greater than 0 For
to be greater than 0, e must be greater than 1. This implies
that profit can be maximized only when e > 1. The logic of this conclusion can be provided as follows.

NOTES
Self-InstructionalMaterial 85
Pricing-Output Decisions and Pricing Policies
Given the Eq. (4.8) and Eq. (4.9), if e = 1, MR = 0, and if e < 1, MR < 0, it means that if MR < 0 and MC > 0, or in other words, when MR π MC, then the rule of profit maximization breaks down. Thus, profit can be maximized only if e > 1, and MC > 0.
Now if e > 1, then the term e/(e – 1) will always be greater than 1. Let e be greater than 1 by an amount, say m. Then
1 1 112 3 3
− = = (1 + m) …(4.12)
By substituting term (1 + m) from Eq. (20.9) for e/(e – 1) in Eq. (4.11), we get P = AVC (1 + m) …(4.13)where m denotes the mark-up rate.
Note that Eq. (4.13) is exactly the same as Eq. (4.6). This means that the mark-up rule of pricing converges with the marginalist rule of pricing. In other words, it is proved that the mark-up pricing method leads to the marginalist rule of pricing. However, m in Eqs. (4.6) and in (4.12) need not be the same.
4.6.3 Limitations of Mark-up Pricing Rule
The cost-plus pricing has certain limitations, which should be borne in mind while using this method for price determination.
First, cost-plus pricing assumes that a firm’s resources are optimally allocated and the standard cost of production is comparable with the average cost of the industry. In reality, however, resources may not be optimally allocated. The cost estimates based on these assumptions may be an overestimate or an underestimate. Under these conditions, pricing may not be commensurate with the objective of the firm.
Secondly, in cost-plus pricing, generally, historical cost rather than current cost data are used. This may lead to under-pricing under increasing cost conditions and to over-pricing under decreasing cost conditions, which may go against the firm’s objective.
Thirdly, if variable cost fluctuates frequently and significantly, cost-plus pricing may not be an appropriate method of pricing on regular basis, as it may necessitate frequent change in price.
Finally, it is also alleged that cost-plus pricing ignores the demand side of the market and is solely based on supply conditions. This is, however, not true, because the firm determines the mark-up on the basis of ‘what the market can bear’ and it does take into account the elasticity aspect of the demand for the product, as shown above.

Pricing-Output Decisions and Pricing Policies
NOTES
Self-Instructional 86 Material
4.6.4 Multiple Product Pricing
Most microeconomic models of price determination are based on the assumption that a firm produces a single, homogeneous product. In actual practice, however, production of a single homogeneous product by a firm is an exception rather than a rule. Almost all firms have more than one product in their line of production. Even the most specialized firms produce a commodity in multiple models, styles and sizes, each so much differentiated from the other that every model or size of the product may be considered a different product. For example, the various models of refrigerators, TV sets, cell phones, computers and car models etc. produced by the same company may be treated as different products for at least pricing purpose. The various models are so differentiated that consumers view them as different products and, in some cases, as close substitutes for each other. It is for this reason that each model or product has different AR and MR curves and that one product of the firm competes against the other product. The pricing under these conditions is known as multi-product pricing or product-line pricing.
The major problem in pricing multiple products is that each product has a separate demand curve. But, since all the products are produced under one establishment by interchangeable production facilities, they have only one joint and one inseparable marginal cost curve (MC). That is, while revenue curves, AR and MR, are separate for each product, cost curves, AC and MC, are inseparable. Therefore, the marginal rule of pricing cannot be applied straightaway to fix the price of each product separately. The problem, however, has been provided with a solution by E.W. Clemens. The solution is similar to the technique employed to illustrate third degree price discrimination under profit maximization assumption. As a discriminating monopoly tries to maximize its revenue in all its markets, so does a multi-product firm in respect of each of its products.
To illustrate the multiple product pricing, let us suppose that a firm has four different products—A, B, C and D in its line of production. The AR and MR curves for the four branded products are shown in four segments of Fig. 4.7. The marginal cost for all the products taken together is shown by the curve MC, which is the factory marginal cost curve. Let us suppose that when the MRs for the individual products are horizontally summed up, the aggregate MR (not given in the figure) passes through point E on the MC curve. If a line parallel to the X-axis, is drawn from point E to the Y-axis through the MRs, the intersecting points will show the points where MC and MRs are equal for each product, as shown by the line EMR, the Equal Marginal Revenue line. The points of intersection between EMR and MRs determine the output level and price for each product. The output of the four products are given as OQa of product A; QaQb of B; QbQc of C; and QcQd of D. The respective prices for the four products are: PaQa for product A; PbQb for B; PcQc for C, and PdQd for D. These price and output combinations maximize the profit from each product and hence the overall profit of the firm.

NOTES
Self-InstructionalMaterial 87
Pricing-Output Decisions and Pricing Policies
Fig. 4.7 Multi-Product Pricing
4.6.5 Pricing in the Life-cycle of a Product
The life-cycle of a product is generally divided into five stages: (i) Introduction or initial stage, (ii) Growth, (iii) Maturity, (iv) Saturation, and (v) Decline. Fig. 4.8 presents the five stages of a product’s life-cycle through a curve showing the behaviour of the total sales over the life cycle. The introduction phase is the period taken to introduce the product to the market. The total sale during this period is limited to the quantity put on the market for trial with considerable advertisement. The sales during this period remain almost constant. Growth is the stage, after a successful trial, during which the product gains popularity among the consumers and sales increase at an increasing rate as a result of cumulative effect of advertisement over the initial stage. Maturity is the stage in which sales continue to increase but at a lower rate and the total sale eventually becomes constant. During the saturation period the total sale saturates—there is no considerable increase or decrease in the sales. After the saturation stage, comes the stage of decline in which total sales begin to decline for such reasons as (i) increase in the availability of substitutes, and (ii) the loss of distinctiveness of the product.
Fig. 4.8 Life-Cycle of a Product

Pricing-Output Decisions and Pricing Policies
NOTES
Self-Instructional 88 Material
The pricing strategy varies from stage to stage over the life-cycle of a product, depending on the market conditions. From the pricing strategy point of view, growth and maturity stages may be treated likewise. We have first discussed the pricing of a product in its initial stage as pricing of a new product and then the pricing method in the ‘maturity’ and ‘decline’ stage.
4.6.6 Pricing a New Product
A new product may be either a new brand name added to the existing ones or an altogether new product. Pricing a new brand for which there are many substitutes available in the market is not as big a problem as pricing a new product for which close substitutes are not available. For, in case of the new brand, market provides adequate information regarding cost, demand, and availability of market, etc. Pricing in this case depends on the nature of the market. However, problems arise in pricing a new product without close substitutes because, for lack of information, there is some degree of uncertainty.
Thus, pricing policy in respect of a new product depends on whether or not close substitutes are available. Depending on whether or not close substitutes are available, generally two kinds of pricing strategies are suggested in pricing a new product, viz., (i) skimming price policy, and (ii) penetration price policy.(i) Skimming price policy: The skimming price policy is adopted where close substitutes of a new product are not available. This pricing strategy is intended to skim the cream off the market, i.e., consumer’s surplus, by setting a high initial price, three or four times the ex-factory price, and a subsequent lowering of prices in a series of reduction, especially in case of consumer durables. The initial high price would generally be accompanied by heavy sales promoting expenditure. This policy succeeds for the following reasons.
First, in the initial stage of the introduction of the product, demand is relatively inelastic because of consumers’ desire for distinctiveness by the consumption of a new product.
Second, cross-elasticity is usually very low for lack of a close substitute.Third, step-by-step price-cuts help skimming consumers’ surplus
available at the lower segments of demand curve.Fourth, high initial prices are helpful in recovering the development
costs.The post-skimming strategy includes the decisions regarding the time
and size of price reduction. The appropriate occasion for price reduction is the time of saturation of the total sales or when strong competition is apprehended. As regards the rate of price reduction, when the product is on its way to losing its distinctiveness, the price-cut has to be appropriately

NOTES
Self-InstructionalMaterial 89
Pricing-Output Decisions and Pricing Policies
larger. But, if the product has retained its exclusiveness, a series of small and gradual price reductions would be more appropriate.
(ii) Penetration price policy: In contrast to skimming price policy, the penetration price policy involves a reverse strategy. This pricing policy is adopted generally in the case of new products for which substitutes are available. This policy requires fixing a lower initial price designed to penetrate the market as quickly as possible and is intended to maximize the profits in the long-run. Therefore, the firms pursuing the penetration price policy set a low price of the product in the initial stage. As the product catches the market, price is gradually raised up. The success of penetration price policy requires the existence of the following conditions.
First, the short-run demand for the product should have an elasticity greater than unity. It helps in capturing the market at lower prices.
Secondly, economies of large-scale production should be available to the firm with the increase in sales. Otherwise, increase in production would result in increase in costs which might reduce the competitiveness of the price.
Thirdly, the potential market for the product ought to be fairly large and have a good deal of future prospects.
Fourthly, the product should have a high cross-elasticity in relation to rival products for the initial lower price to be effective.
Finally, the product, by nature should be such that it can be easily accepted and adopted by the consumers.
The choice between the two strategic price policies depends on (i) the rate of market growth; (ii) the rate of erosion of distinctiveness; and (iii) the cost-structure of the producers. If the rate of market growth is slow for such reasons as lack of information, slow growth of purchasing power, consumers’ hesitation, etc., penetration price policy would be unsuitable. The reason is a low price will not mean a large sale. If the pioneer product is likely to lose its distinctiveness at a faster rate, skimming price policy would be unsuitable. Penetration pricing policy has to be followed when lead time, i.e., the period of distinctiveness, is fairly long. If cost-structure shows a decreasing trend over time, penetration price policy would be more suitable, since it enables the producer to reduce his cost and prevents potential competitors from entering the market in the short-run.
4.6.7 Pricing in Maturity Period
Maturity period is the second stage in the life-cycle of a product. It is a stage between the growth period and decline period of sales. Sometimes maturity period is bracketed with saturation period. Maturity period may also be defined as the period of decline in the growth rate of sales (not the total sales). It can be defined for all practical purposes as the period of zero growth rate. The concept of maturity period is useful to the extent it gives

Pricing-Output Decisions and Pricing Policies
NOTES
Self-Instructional 90 Material
out signals for taking precaution with regard to pricing policy. However, the concept itself does not provide guidelines for the pricing policy. Joel Dean suggests that the “first step for the manufacturer whose speciality is about to slip into the commodity category is to reduce real … prices as soon as the system of deterioration appears.” But he warns that “this does not mean that the manufacturer should declare open price war in the industry”. He should rather move in the direction of “product improvement and market segmentation”.
4.6.8 Pricing a Product in Decline
The product in decline is one that enters the post-maturity stage. During this stage, the total sale of the product starts declining. The first step in pricing strategy at this stage is obviously to reduce the price with the objective of retaining sales at some minimum level. The product should be reformulated and remodelled to suit the consumers’ preferences. It is a common practice in the book trade. When the sale of a hard-bound edition reaches saturation, paper-back edition is brought into the market. This facility is, however, limited to only a few commodities. As a final step in the strategy, the advertisement expenditure may be reduced drastically or withdrawn completely, and the residual market may be relied on. This, however, requires a strong will of the producer to retian the low market share.
4.6.9 Pricing in Relation to Established Products
Many producers enter the market often with a new brand of a commodity for which several substitutes are available. For example, cold drinks like Coke and Spot were quite popular in the market during 1980s when new brands like Limca, Thums Up, Double Seven, Mirinda, Pepsi, Teem, Campa, etc., were introduced in the market over time. Many other models of motor cars appeared in the market despite the popularity of Maruti cars. So has been the case with many consumer goods. Besides, a new entrant to the market faces the problem of pricing its product because of strong competition with established products. This problem of pricing of a new brand is known as pricing in relation to the established products.
Generally, the following three types of pricing strategies are adopted in pricing a product in relation to its well established substitutes. (i) Pricing below the ongoing price, (ii) Pricing at par with the prevailing market price, and (iii) Pricing above the existing market price.
Let us now see which of these strategies are adopted under what conditions.

NOTES
Self-InstructionalMaterial 91
Pricing-Output Decisions and Pricing Policies
Pricing Below the Market Price
Pricing below the prevailing market price of the substitutes is generally preferred under two conditions. First, if a firm wants to expand its product-mix by adding a new product to its line of production with the objective of utilizing its unused capacity. Also, when the firm expects to face tough competition with the established brands, the strategy of pricing below the market price is generally adopted. This strategy gives the new brand an opportunity to gain popularity and establish itself. For the success of this pricing method, however, a high cross-elasticity of demand between the substitute brands is necessary. This strategy may, however, not work if existing brands have earned a strong brand loyalty of the consumers. If so, the price incentive from the new producers must, therefore, overweigh the brand loyalty of the consumers of the established products, and must also be high enough to attract new consumers. This strategy is similar to the penetrating pricing. Second, this technique of pricing has been found to be more successful in the case of innovative products. When the innovative product gains popularity, the price may be gradually raised to the level of market price.
Pricing at Market Price
Pricing at par with the market price of the existing brands is considered to be the most reasonable pricing strategy for a product which is being sold in a strongly competitive market. In such a market, keeping the price below the market price is not of much avail because the product can be sold in any quantity at the existing market rate. This strategy is also adopted when the seller is not a ‘price leader’. It is rather a ‘price-taker’ in an oligopolistic market. This is, in fact, a very common pricing strategy, rather the most common practice.
Pricing Above the Prevailing Market Price
Sometimes some firms price their product above the on-going or prevailing market price of the competitive products. This strategy is adopted when a seller intends to achieve a prestigious position among the sellers in the locality. This is a more common practice in case of products considered to be a commodity of conspicuous consumption or a prestigious good or deemed to be a product of much superior quality. Consumers of such goods prefer shopping in shopping malls of a posh locality of the city. This is known as the ‘Veblen Effect’. Sellers of such goods rely on their customers’ high propensity to consume a prestigious commodity. After the seller achieves the distinction of selling high quality goods, though at a high price, they may sell even the ordinary goods at a price much higher than the market price. This practice is common among the sellers of readymade garments.
Besides, a firm may set a high price for its product if it pursues the ‘skimming price strategy’. This pricing strategy is more suitable for innovative

Pricing-Output Decisions and Pricing Policies
NOTES
Self-Instructional 92 Material
products especially when the firm is sure of the distinctiveness of its product. The demand for the commodity must have a low cross-elasticity in respect of competing goods.
Transfer Pricing
Large size firms often divide their production process into different product divisions or their subsidiaries. Also, growing firms add new divisions or departments to the existing ones. The firms then transfer some of their production activities to other divisions. The goods and services produced by the new divisions are used by the parent organization. In other words, the parent division buys the product of its subsidiaries. Such firms face the problem of determining an appropriate price for the product transferred from one division or subsidiary to the parent body. This problem becomes much more difficult when each division has a separate profit function to maximize. Pricing of intra-firm ‘transfer product’ is referred to as ‘transfer pricing’. One of the most systematic treatments of the transfer pricing technique has been provided by Hirshleifer. We will discuss here briefly his technique of transfer pricing.
To begin with, let us suppose that a refrigerator company established a decade ago used to produce and sell refrigerators fitted with compressors bought from a compressor manufacturing company. Now the refrigerator company decides to set up its own subsidiary to manufacture compressors. Now the problem for the company is how to price the product of its subsidiary under the following conditions. (i) Both parent and subsidiary companies have their own profit functions
to maximize, and (ii) The refrigerator company has the option of using all the compressors
produced by its subsidiary and/or to sell the compressors in a competitive market and its demand is given by a straight horizontal line.Given these condition of the model, transfer pricing is discussed under
two conditions. (i) The parent company uses the entire output of its subsidiary and there
is no external market for the compressors, and (ii) There does exist a competitive market for the compressor and
refrigerator company sells also in the open market. Let us begin our analysis of transfer pricing model by assuming that
there is no external market for the compressors. We will later drop this assumption and assume that there is an external market for the compressors and discuss the technique of transfer pricing under both the alternative conditions.

NOTES
Self-InstructionalMaterial 93
Pricing-Output Decisions and Pricing Policies
4.6.10 International Price Discrimination: Dumping
Price discrimination has already been discussed in case of price determination under monopoly. Price discrimination is practiced also in international trade by some countries. In this section, we discuss the method of international price discrimination called dumping.
What is Dumping?
Dumping is a practice of exporting goods at a price lower than the domestic price. In other words, when a country exports its product to other countries at a price lower than its domestic price, it is called dumping. Also, when a monopolist or a monopolistically competitive firm sells its product in the foreign market at a price lower than the price it charges in the domestic market, it is called dumping. Dumping amounts to international price discrimination or, more precisely, price discrimination between the domestic market and the foreign markets. There is nothing bad or unethical about dumping—it is a common practice in an imperfectly competitive business world. • The seller of a product has some monopolistic control over the domestic
market. • The product price in the foreign markets is higher because of high cost
of production. • The demand for foreign goods is more price elastic than the demand
for domestic goods. • Domestic and foreign markets are separated by distance and high cost
of transportation so that reverse export to the domestic market is not possible.
Check Your Progress
1. Define the term ‘price discrimination.’ 2. Mention the stages of the life-cycle of a product.
4.7 ANSWERS TO CHECK YOUR PROGRESS QUESTIONS
1. Price discrimination means selling the same or slightly differentiated product to different sections of consumers at different prices, not commensurate with the cost of differentiation.
2. The life-cycle of a product is generally divided into five stages: (i) Introduction or initial stage, (ii) Growth, (iii) Maturity, (iv) Saturation, and (v) Decline.

Pricing-Output Decisions and Pricing Policies
NOTES
Self-Instructional 94 Material
4.8 SUMMARY
• Under perfect competition, a large number of firms compete against each other for selling their product. Therefore, the degree of competition under perfect competition is close to one, i.e., the market is highly competitive.
• When the number of firms is few, the market takes the form of an oligopoly. Under oligopoly, the degree of competition is quite low, lower than that under monopolistic competition.
• In case of a monopoly, the degree of competition is close to nil. An uncontrolled monopoly firm has full freedom to determine the price of its product. A monopoly, in the true sense of the term, is free to fix any price for its product, of course, under certain constraints, viz., (i) the objective of the firm, and (ii) demand conditions.
• A short-run is, by definition, a period in which firm’s cost curves are given; price of the product is given; and the number of firms is also given.
• By definition, long run is a period in which (i) firm’s cost and revenue curves are subject to change, (ii) firms can increase their scale of production by increasing their capital and output, (iii) existing firms can exit and new firms can enter the industry, and (iv) market conditions can change with change in market demand and supply conditions.
• The term pure monopoly means an absolute power of a firm to produce and sell a product that has no close substitute. In other words, a monopolized market is one in which there is only one seller of a product having no close substitute.
• As under perfect competition, the theory of pricing and output determination under monopoly is based on profit maximization hypothesis, given the revenue and cost conditions.
• Price discrimination means selling the same or slightly differentiated product to different sections of consumers at different prices, not commensurate with the cost of differentiation.
• Augustin Cournot,a French economist, was the first to develop a formal oligopoly model in 1838 in the form of a duopoly model. Cournot developed his model with the example of two firms, each owning a well of mineral water and water being produced at zero cost.
• Cost-plus pricing is also known as ‘mark-up pricing’, ‘average cost pricing’ and ‘full cost pricing’. The cost-plus pricing is the most common method of pricing used by the manufacturing firms.

NOTES
Self-InstructionalMaterial 95
Pricing-Output Decisions and Pricing Policies
• The mark-up or average-cost pricing method appears to be a ‘rule of thumb’ totally different from the marginalist rule of pricing.
• Most microeconomic models of price determination are based on the assumption that a firm produces a single, homogeneous product. In actual practice, however, production of a single homogeneous product by a firm is an exception rather than a rule.
• Depending on whether or not close substitutes are available, generally two kinds of pricing strategies are suggested in pricing a new product, viz., (i) skimming price policy, and (ii) penetration price policy.
• Dumping is a practice of exporting goods at a price lower than the domestic price. In other words, when a country exports its product to other countries at a price lower than its domestic price, it is called dumping.
4.9 KEY WORDS
• Perfect competition: It may be defined as a kind of market in which there are a large number of buyers and sellers each one buying and selling a homogeneous product and no buyer or seller has control over the price of the product.
• Pure monopoly: It means an absolute power of a firm to produce and sell a product that has no close substitute.
4.10 SELF ASSESSMENT QUESTIONS AND EXERCISES
Short-Answer Questions
1. Briefly mention Cournot’s duopoly model. 2. Write short notes on the following: (a) Skimming price policy (b) Penetration price policy 3. Write a short note on dumping.
Long-Answer Questions
1. Analyse the determination of long-run equilibrium of the firm under perfect competition.
2. Graphically illustrate the determination of price and output by a monopoly firm in the short-run.
3. Discuss the various pricing policies which assist in taking decisions in the complex business scenario.

Pricing-Output Decisions and Pricing Policies
NOTES
Self-Instructional 96 Material
4.11 FURTHER READINGS
Dwivedi, D. N. 2008. Principles of Economics, Seventh Edition. New Delhi: Vikas Publishing House.
Weil. David N. 2004. Economic Growth. London: Addison Wesley.Thomas, Christopher R. and Maurice S. Charles. 2005. Managerial
Economics: Concepts and Applications, Eighth Edition. New Delhi: Tata McGraw-Hill Publishing Company Limited.
Mankiw, Gregory N. 2002. Principles of Economics, Second Edition. India: Thomson Press.

NOTES
Self-InstructionalMaterial 97
Business Cycles
UNIT 5 BUSINESS CYCLESStructure 5.0 Introduction 5.1 Objectives 5.2 Business Cycles
5.2.1 National Income 5.2.2 Fiscal Policy 5.2.3 Monetary Policy
5.3 Public Finance 5.4 Government Institutions
5.4.1 Central Government 5.4.2 State Governments 5.4.3 Local Self-Government
5.5 Industrial Sickness, Causes and Remedies 5.5.1 Causes of Industrial Sickness 5.5.2 Remedial Measures
5.6 Answers to Check Your Progress Questions 5.7 Summary 5.8 Key Words 5.9 Self Assessment Questions and Exercises 5.10 Further Readings
5.0 INTRODUCTION
In the preceding units, you studied how the concept of managerial economics covered the various areas of economic growth which attempt to explain the relationship between the national output and growth factors, and specifically the conditions under which an economy would steadily grow on the equilibrium path. This unit, will introduce you to the concept of national income and its basic concepts, monetary and fiscal policy, subject matter of public finance covering the state government, central government and local bodies, and finally, the causes of industrial sickness and the remedial measures for the same.
5.1 OBJECTIVES
After going through this unit, you will be able to: • Analyse the significance of business cycles • Define national income • List the basic concepts of national income • Discuss the subject matter of public finance • Identify the causes of industrial sickness and the remedies for the same

Business Cycles
NOTES
Self-Instructional 98 Material
5.2 BUSINESS CYCLES
A business cycle is a cycle of fluctuations in the gross domestic product (GDP) around its long term national growth rate. The economic history of various economies is, in fact, a history of ups and downs, booms and slumps, prosperity and depression. Briefly speaking, business cycles have characterized the free enterprise industrial world over the past one and a half century. Although, the Great Depression of 1930s has not repeated itself even after a period of 65 years, the global recession of 2007–10 is considered to be the second worst economic recession of the global economy.
The global inflation and world economic recession of the 1980s and the second worst economic recession of 2007–10 give a clear warning against any complacency towards the dangers of economic fluctuations. The corrective measures adopted by the government to control economic fluctua tions may prove inadequate and inefficient when destabilizing forces are deep-rooted. To quote E. Burns, “... men who wish to serve democracy faithfully must recognize that the roots of business cycles go deep in the economic organization, that the ability of government to control depressions adequately is not yet assured, that our power of forecasting is limited and true foresight requires policies for coping with numerous contingencies.”
Business cycles, i.e., repeated phases of economic booms and slumps are essentially a perpetual feature of the economic environment of a country. Business cycles influence business prospects tremendously and set the trend for future business. The period of prosperity opens up new and larger oppor tunities for investment, employment and production, and thereby promotes business. On the contrary, the period of depression reduces business opportunities. A profit maxi mizing entrepreneur must, therefore, analyze and take in view the economic environ ment of the period prior to making decisions, particularly those pertaining to forward planning.
5.2.1 National Income
National income can be defined as the sum of money value of all final goods and services produced in a country over a period of one year. Some terms used in the definition of national income need to be clarified. The term ‘money value’ means the value estimated at the current price of the goods and services. As regards the term ‘final goods and services’, productive activities create many goods and services. While some goods and services are final, some are used again in the process of production, and some take the form of capital. In all cases, while measuring national income only final goods and services are taken into account.
National income can be defined also as the sum of all factors incomes. Factors of production, viz., land, labour, capital and entrepreneurship, are

NOTES
Self-InstructionalMaterial 99
Business Cyclesused to produce goods and services. Use of factors of production generates factor incomes in the form of rent, wages, interest and profit. These factor incomes constitute the national income of a country. The sum of all these factor-incomes gives the estimate of national income.
Some Basic Concepts
Measuring national income is an extremely complex and complicated task as it involves both conceptual and practical problems. Therefore, before we discuss the methods of estimating national income, it is useful to understand the concepts used in estimating national income. In this section, we take the view of some concepts used in estimation of national income. 1. Gross Domestic Product (GDP): Gross domestic product (GDP) is
the measure of the total market value of all final goods and services produced in the domestic economy during a period of one year plus income earned by the foreigners in the country minus income earned by countrymen from abroad.
2. Gross National Product (GNP): GNP is the measure of the total market value of all final goods and services produced in the domestic economy during a period of one year plus incomes earned abroad by the citizens minus income earned by the foreigners in the country.
3. Economic and Non-economic Products: In estimating national income only economic products are included. Goods and services that are produced to be sold at market price and goods and services that are produced by the government and public organizations are treated as economic products. Thus, economic products include both marketable and non-marketable goods. And, non-economic products include services rendered to self, to family, to relations and to neighbours. Non-economic products are not included in national income.
4. Intermediate and Final Products: Products (goods and services) that are used in the process of further production are considered to be intermediate product and products that are consumed by the final consumers are considered to be final products. The same product may be an intermediate or a final product. For examples, when wheat produced by farmers are consumed by themselves, it is treated as final good, but when it is sold to bread companies, it is treated as intermediate product. Likewise, when services provided by the government, e.g., transport, telephonic, postal, railway services, etc. are used by the consumers, they are treated as final goods and when used in the process of production, then these services are treated as intermediate goods. In estimating national income, only final products are taken into account.
5. Transfer Payments: Payments made by the people to other people, organizations or to the government without any equal transfer in return are treated as transfer payment. For example, gifts paid to relatives
Business Cycles
NOTES
Self-Instructional 100 Material
and friends, donations given to social organization, and taxes paid to government authorities, etc., are transfer payments. Such payments are not taken into account in national income estimates.
National Income as Money Flow
We have defined national income from the angle of product flows. The same can be defined in terms of money flows. While economic activities generate flow of goods and services, on the one hand, they generate money flows, on the other, in the form of factor payments—wages, interest, rent, profits, and earnings of self-employed. Thus, national income may also be estimated by adding the factor earnings and adjusting the sum for indirect taxes and subsidies. The national income thus obtained is known as national income at factor cost. It is related to money income flows.
The concept of national income refers to the income of the society as a whole. It differs fundamentally from the concept of private income. Conceptually, national income refers to the money value of the entire volume of final goods and services resulting from all economic activities of the country. This is not true of private income. Also from the calculation point of view, there are certain receipts of money or of services and goods that are not ordinarily included in private incomes but are included in the national incomes, and vice versa. National income includes, for example, employer’s contribution to the social security and welfare funds for the benefit of employees, profits of public enterprises and services of owner occupied houses. But it excludes the interest on warloans, social security benefits and pensions. These items are, however, included in the private incomes. The national income is, therefore, not merely an aggregation of the private incomes.
5.2.2 Fiscal Policy
The ‘fiscal policy’ refers to the government policy of changing its taxation and public expenditure programmes intended to achieve certain predetermined objectives. Taxation is a meas ure of transferring funds from the private purses to the public coffers; it amounts to withdrawal of funds from the private use. Public expenditure, on the other hand, increases the flow of funds in the economy. Taxation reduces private disposable income and, thereby, the private expenditure. The public expenditure, on the other hand, increases private incomes and, thereby, the pri vate expenditure. Since tax-revenue and public expenditure form the two sides of the government budget, the taxation and public expenditure policies are also jointly called budgetary poli cy or fiscal policy.
Fiscal or budgetary policy is regarded as a powerful instru ment of economic stabilization. The importance of fiscal policy as an instrument of economic stabilization rests on the fact that government activities in modern

NOTES
Self-InstructionalMaterial 101
Business Cycleseconomies are greatly enlarged, and government tax-revenue and expenditure account for a consid erable proportion of GNP, ranging from 10 to 25 per cent. Therefore, the government may affect the private economic activities to the same extent through variations in taxation and public expendi ture. Besides, fiscal policy is considered by some economists to be more effective than monetary policy because the former directly affects the private decisions while the latter does so indirectly. If fiscal policy of the government is so formulated that it generates additional purchasing power during depression and it contracts purchasing power during the period of expansion, it is known as ‘counter-cyclical fiscal policy’.
Counter-Cyclical Fiscal Policy
The counter-cyclical fiscal policy is based on the relation of public expenditure and taxes to the national income, the GNP. The relationship between public expenditure and GNP and between tax and GNP may be expressed in the form of the following propo sitions.
Public Expenditure and GNP: An increase in public expenditure raises the level of GNP. The size of increase in the GNP as a result of additional public expenditure is determined by the multiplier. Public expenditure in the form of purchase of goods and services increases business incomes and household incomes—wage, interest, rent and business profit—which in turn increases government’s tax revenue. Marginal propensity to consume being greater than zero, households spend a part of additional income on consumption, and so do the people who earn additional income due to additional consumption expenditure by the households at the first instance. The process continues and GNP increases at the rate of multipli er.
Taxation and GNP: Direct taxes without an equivalent public expenditure have adverse effect on GNP. Direct taxes have, therefore, a deflationary impact on the economy. Increase in taxation either due to increase in the rates of existing taxes or due to imposition of new taxes, reduces GNP. The size of decrease in GNP as a result of increase in taxation depends on the tax-multiplier. The multiplier in case of taxation works in the reverse direction. For, taxation reduces disposable income and hence consumption expenditure cumulatively. It should be noted here that the negative multiplier will not be as high as in case of public expenditure because the payment of taxes at the first instance does not reduce GNP as it is only a transfer of income. Reverse multiplier or tax-multiplier will be one less than public-expenditure multiplier, even if mpc is same in both the cases. The implication of the expenditure multiplier being higher by one than tax-multiplier is that expenditure effect of a certain amount would more than neutralize the effect of taxation of an equal amount.

Business Cycles
NOTES
Self-Instructional 102 Material
5.2.3 Monetary Policy
Monetary policy refers to the central bank’s programme of changing monetary variables, viz., total demand for and supply of money, inter est rates and credit rationing, to achieve certain predetermined objectives. One of the primary objectives of monetary policy is to prevent inflation and to achieve economic stability. The following are the traditional monetary instruments through which a central bank carries out the monetary policies. (i) Open market operations, (ii) Changes in bank rate (or discount rate), (iii) Changes in the statutory reserve ratios, and (iv) Selective credit controls and Moral suasion.
All these instruments when operated by the central bank reduce (or enhance) directly and indirectly the credit creation capacity of the commercial banks and thereby reduce (or increase) the flow of funds from the banks to the public. The pattern of use and working of these instruments is described here briefly. 1. Open Market Operations: Open market operation by the central bank
refers to the sale and purchase of government bonds, treasury bills etc., to and from the public. The open market operation is carried out through scheduled commercial banks. During the period of expansion, the central bank sells the government bonds and securities to the public. The sale of securities reduces their price on the one hand, and results in withdrawal of money from the public, on the other. To the extent the government securities are purchased through the trans fer of bank deposits to the central bank account, it reduces the credit creation capacity of the commercial banks. Open market operation works successfully only if (a) govern ment securities are popular, (b) people have a good deal of banking habit and (c) banking system is fairly developed. Under these conditions, the sale of public bonds results in monetary contraction. During the period of depression, the central bank buys the government secu rities. Its impact on money supply with the public is just opposite to the impact of the sale of securities.
2. The Bank Rate or Rediscount Rate: Bank rate is the rate at which the central bank discounts banks ‘first class’ bills of exchange or grants short-term loans to banks. When the objective is to control inflation, the central bank raises the bank rate. A rise in the bank rate increases the cost of borrowing from the central bank. Following the increase in bank rate, commercial banks raise their own discount rates for the public. The increase in cost of borrowing discourages public borrowings from the commercial banks. Thus, the flow of money towards the private economy is re strained. But this method is effective only when

NOTES
Self-InstructionalMaterial 103
Business Cyclescommercial banks do not possess excess reserves. On the contrary, during depres sion, the bank rate is lowered with a view to facilitating and encouraging private borrowing, which leads to monetary expansion and works against the forces of depression. Monetary expansion pushes the aggregate demand up and, thereby, helps economic recovery. Bank rate is the most widely used method. The RBI used the interest rates directly to control inflation in India during April-May 2007. Now bank rate has been replaced by ‘Repo Rate’ (Repurchase operation rate). Repo rate is defined as the rate at which central banks (RBI in India) lend money to commercial bank as a short-term fund. Against repo rate, there is ‘reverse repo rate,’ the rate at which commercial banks deposit their surplus finds with the central bank. The RBI now uses the repo rate very frequently to control.
3. The Statutory Reserve Ratio (SRR): When the central bank wants to reduce the credit creation capacity of the commercial banks, it increases the ratio of their demand and time deposits to be held as reserve with the central bank, and vice versa. Therefore, an anti-inflationary monetary policy requires increas ing the liquidity ratios, and anti-deflationary policy requires lowering the liquidity ratios. When the central bank changes the SRR, the deposits which form the basis of credit creation are affected and it affects the capacity of banks to create credit.
Of the three instruments of monetary control, the open market operation is considered to be the most effective weapon available to the central bank, specially in the less developed countries having under-developed money markets. The open market operation is flexible and easily adjustable to the changing conditions. The other two instruments are effective only when (i) commercial banks do not possess excess cash reserves and (ii) in case of bank rate, borrowers are not highly optimistic about future business prospects.
4. Selective Credit Controls and Moral Suasion. In addition to the instruments discussed above, central banks often use various selective credit control measures and moral suasion. The selective credit controls are intended to control the credit flows to particular sectors without affecting the total credit, and also to change the composition of credit from an undesirable to a desirable pattern. Moral suasion is a persuasive method to convince the commercial banks to carry out their business in accordance with the demand of the time and in the interest of the nation.
5.3 PUBLIC FINANCE
The distinction between public and private goods and the concept of the public sector lead us to look into the subject matter of public finance. Quite

Business Cycles
NOTES
Self-Instructional 104 Material
obviously, public finance is related to the financing of State activities, and can be narrowly defined as a subject, which discusses financial operations of the fisc (or public treasury). Earlier writers on the subject tended to define public finance in such a narrow manner, though this is no longer the case now.
Boundaries of the subject of public finance have undergone repeated revisions in line with developments in State activities and its economic philosophy. Accordingly, with the passage of time, the boundaries of public finance have been extended to cover ever-widening areas. In early days of capitalism it was widely believed that private sector was always more efficient than the public one. It, therefore, provided a theoretical justification for laissez-faire. By implication, almost all economic decisions were to be guided by the “invisible hand” of unregulated market mechanism. The role of the government was not to interfere with the working of the market forces, but to limit its own activities to the barest minimum necessary.
One, it was to protect the society against internal disruption, and ensure an effective prevalence of law and order. For this, the State was to maintain itself and was to create the needed administrative, judicial and police set-ups.
Two, the society was to be protected against any foreign aggression that might take place. The State was to maintain armed forces to meet this objective.
Three, where private sector found itself unable to create and run social overheads (or infrastructural facilities) for reasons of their commercial non-viability and were otherwise essential for efficient working of the economy, the State was to step in and assume the responsibility of creation and maintenance of such social overheads. The argument for stepping in of the State was not that the public sector was more efficient than the private one. The basic argument was that in the absence of public sector, the economy would remain deprived of essential social overheads. In their case, the social marginal benefit usually far exceeds their social marginal cost. It, therefore, pays the society to expand social overheads. Their private marginal benefit, however, is much less compared with their private marginal cost. And as a result, the private sector is not ready to develop them. The State is accordingly expected to finance social overheads out of its own funds and run them, if need be, at a commercial loss.
It must be noted that the State, according to the laissez-faire philosophy, was considered as something extraneous to the economy which was more or less equated with its private sector only. By implication, the public sector was meant to supplement private sector and not replace it. It was believed that a planned economy was a pre-requisite even for ensuring accelerated growth rates of capital formation and economic growth.
Since activities of the State were to be tolerated only as a necessary evil and were to be reduced to the minimum necessary scale, the real question was

NOTES
Self-InstructionalMaterial 105
Business Cyclesnot to decide the basic allocation of economic activities between public and private sectors and to deal with the financial and allied problems that went with them, but rather to analyze the way the treasury should operate so as to pose minimum possible hurdles in the working of market mechanism. With this philosophy in background, the theory of public finance was obviously assigned a limited field. It was mainly considered a description of the way in which operations of the treasury interfere with the working of the private sector of the economy and the way in which such interference could be minimized. Taylor, for example, says: “Public finance deals with the finances of the public as an organized group under the institution of government. It thus deals only with the finances of the government. The finances of the government include the raising and disbursement of government funds. Public finance is concerned with the operation of the fisc, or public treasury. Hence, to the degree that it is a science, it is the fiscal science; its policies are fiscal policies, its problems are fiscal problems.” Similarly, Carl C. Plehm says that the term public finance “has come, by accepted usage, to be confined to a study of funds raised by governments to meet the costs of government.”
But the above-said stand is outdated. Growing complexities of a modern economy has thrown up a plethora of new issues and problems and a modern government is no longer expected to be a mute spectator of what is going on. It is expected to actively participate in the socio-economic evolution of the society, aim at maximization of aggregate social welfare, protect the economy and society from all possible ill-effects, and use all available fiscal and non-fiscal policy measures and weapons to this end. These days, the fact and need of interaction and interdependence between state and private sectors is duly recognized and therefore, in a modern economy, public sector is assigned a significant role, both in theory and in practice. This has meant a corresponding widening of the scope of public finance including, for example, measures for social security, checking trade cycles, reducing unemployment, improving distributive justice, helping capital accumulation and economic growth, and removing regional disparities, etc. Many governments also resort to formal planning and an extensive use of the public sector. In line with this new approach we, therefore, come across much wider definitions of public finance. Musgrave, for example, says: “The complex of problems that centre around the revenue expenditure process of government is referred to traditionally as Public finance ... While operations of the public household involve money flows of receipt and expenditure, the basic problems are not issues of finance (emphasis supplied) ... we must think of our task as an investigation ... into those aspects of economic policy that arise in the operation of the public budget”.Thus, the subject matter of public finance is logically, though not solely, concerned with the financial aspects of the business of government. Similarly, Buchanan say, “The government, considered as a unit, may be defined as the subject of the study of public finance. More specifically, public finance studies the economic activity of government as a unit.”

Business Cycles
NOTES
Self-Instructional 106 Material
The subject matter of public finance thus deals with not only the way in which public treasury operates, it also deals with the repercussions of alternative policies which the treasury might adopt and accordingly deals with questions covering choice of these policies and operations. Musgrave and Musgrave recommend an approach in which the state is viewed as manager of a public household. Such a public household has certain objectives which can be grouped into categories of: (i) allocation of resources; (ii) adjustments in the distribution of income and wealth; and (iii) stabilization of prices and employment followed by coordination of budgetary functions. We may add that the objectives covering capital formation and economic growth and the like should also be added to this list. In any case, a detailed study of public finance brings in various aspects connected with the formulation and execution of budgetary policies such as the effects of taxation. Relevant conclusions in the theory of public finance can be drawn by bringing in the detailed discussion of not only the way in which public household should itself operate (such as, in the field of public sector undertakings) but also the way in which private sector would react to alternative fiscal measures. Such fiscal measures would include, for example, those of taxation, expenditure and public debt. Accordingly, it may be emphasized that Musgrave’s approach, though very useful in focusing our attention upon basic objectives of the public household and normative aspects of its working, cannot help us much unless we are equipped with detailed knowledge of various components of fiscal policy and operations of the State and unless our analysis takes into account the relevant institutional factors.
A country is said to have a federal structure if its government is a multi-tiered (also termed multi-level or multi-layered) one, that is, its government exists at two or more layers. In other words, it has a government with a territorial jurisdiction over the entire country (variously known as the Union, Central, Federal, or National Government), and one or more layers of sub-national governments. Each sub-national layer comprises parallel governments with their respectively demarcated territorial jurisdictions. Governments at sub-national levels are variously known as state governments, regional governments, local governments and so on. The functional jurisdiction of sub-national governments at a given layer is significantly similar, but need not be identical to each other. In such a federal structure, inter-governmental relations have several components of which the component covering its financial dimensions is the subject matter of fiscal federalism. To elaborate: The field of federal finance (or fiscal federalism) comprises, (i) inter-governmental (both inter-tier and across every sub-national tier)
allocation of subjects (functions) having financial implications, (ii) inter-governmental (both inter-tier and across every sub-national
tier) allocation of subjects (functions) of financial receipts and disbursements, and

NOTES
Self-InstructionalMaterial 107
Business Cycles (iii) inter-governmental (both inter-tier and across every sub-national tier) financial relations including sharing and transfers of tax and non-tax receipts, grants, loans and other forms of disbursements, etc. For reasons of simplicity of presentation, it is conventional to consider
the financial issues of a federal set up with only two layers of government, namely, the national and a sub-national, the latter layer generally referred to as the state-level governments.
5.4 GOVERNMENT INSTITUTIONS
The Budget of the Government of India is a statement of its estimated financial receipts and disbursements for a given forthcoming period of time (normally one year) and is called its ‘Annual Financial Statement’. These receipts and disbursements are categorized into three parts (that is, sets of accounts), namely, (i) Consolidated Fund of India, (ii) Contingency Fund of India, and (iii) Public Account of India.
All tax and non-tax receipts, recoveries of loans, and other receipts which belong to it (that is, which are owned by it and, therefore, do not create corresponding repayment liabilities) are credited to the Consolidated Fund. In addition, all loans raised on the security of Consolidated Fund (that is, which are to be paid out of it) are also credited to it. Disbursements from this Fund (except those ‘charged’ upon it) can be made only under authorisation from Parliament. The Contingency Fund, on the other hand, is an imprest amount placed at the disposal of the President to meet urgent and unforeseen expenditure pending authorisation by Parliament. In the same way, there are several transactions which enter into Government accounts in respect of which the government acts (in its opinion) as a banker (such as transactions relating to provident funds, small saving collections, and other deposits etc.). All receipts and payments of this type are recorded in the Public Account of India. No Parliamentary authorisation is needed for payments from the Public Account.
5.4.1 Central Government
1. Revenue and Capital Accounts
The Concepts. Article 112(2) of our Constitution requires that the expenditure part of the GOI budget must meet the following two requirements. (Note that no such restriction has been imposed for the receipts part of the Budget.)
First, the sums required to meet expenditure which, according to the Constitutional provisions, is ‘charged’ upon the Consolidated Fund of India
Business Cycles
NOTES
Self-Instructional 108 Material
(that is, such Constitutionally committed expenditure for which specific sanction by Parliament is not required) are to be shown separately from rest of the expenditure sums. There are seven entries which describe the ‘charged’ expenditure items.
Second, the Constitution says that the Budget “shall distinguish expenditure on revenue account from other expenditure”, that is, expenditure is to be classified into ‘expenditure on revenue account’ and ‘expenditure on capital account’. In this context, the following facts are specifically noteworthy. •The Constitution does not provide any legal or other criteria as a basis
for distinction between expenditure on revenue account and expenditure on capital account.
• The budgetary classification of GOI expenditure into revenue and capital categories is based upon a combination of prevalent conventions and administrative discretion.
• The conceptual problem of this classification of receipts arises only in the case of borrowings and foreign grants, and not in the case of receipts from taxes, fees and fines, etc.
• To meet the above-said Constitutional obligation, both receipts and expenditure sides of GOI budget are split into ‘revenue account’ and ‘capital account’ components.
• Further, our Constitution permits presentation of Budget in parts to the Parliament. Using this provision, Railway Budget is presented separately, though the net receipts from and expenditure on Indian Railways are included in the main budget as well.
Capital Account
Items representing receipts and disbursements which meet the following criteria are classified under capital account, namely, those (i) which add to or subtract from Government’s financial claims and
liabilities to third parties (such as deposits, collections of small savings and other forms of loans but not, say, grants);
(ii) which result in variations in physical assets of the Government (that is, their acquisition, creation and disposal or additions, as also subtractions and alterations therein); and
(iii) which result in variations in financial claims upon or liabilities to third parties.It is clear that borrowing, lending, recovery and repayment of loans,
as also remissions of loans belong to capital account of the budget.

NOTES
Self-InstructionalMaterial 109
Business CyclesRevenue Account
The following items belong to the revenue account of the budget, namely, (i) variations in financial balances created or owned by the Centre (such
as through tax collections and their spending, receipts and payments of interest, dividends, profits, rents, fees and fines, grants, creation of currency, etc.),
(ii) expenditure on upkeep and maintenance of physical assets and schemes, and
(iii) cost of administration, police and judiciary, and the like.Broadly speaking, that expenditure which does not result in creation
of physical assets of the Centre or its financial claims upon others is treated as revenue expenditure. Grants given to state governments and other parties are also treated as revenue expenditure even when some of them may be meant for creation of assets by the recipients.
As regards defence expenditure, it can be argued that apart from current expenditure on salaries, rations and training etc. of the defence personnel, expenditure incurred on acquisition of defence equipment (including items like aeroplanes, tanks and ships etc.), should also be in the revenue account. These items are expected to be ‘consumed’ away, with at the most junk value left at the end. Expenditure on capital account is therefore only that portion of the total defence expenditure which is spent for acquisition of buildings and residential accommodation, etc.
Correspondingly, revenue receipts, while adding to its purchasing power, do not add to the financial claims upon the government. These receipts may be tax receipts, or non-tax receipts like interest receipts, grants, profits and dividends, etc.
It is noteworthy that the criteria narrated above are only general indicators. They are not precise enough to provide an objective, clear-cut and unambiguous basis for classification of every transaction into revenue and capital accounts of the budget. Consequently, the authorities tend to follow prevalent conventions till there is a compelling need for deviating therefrom.
Comparative Size: Revenue receipts have always been a large component of the total receipts, but have shown an uneven variation. From four fifths of the total receipts in 1950–51, this component declined to around 56% in the Third Plan, rose to 72% during 1997–02, and was budgeted at 62.8% in 2012–13. In contrast, expenditure on revenue account registered a fall till the Third Plan and then with a secular increase was budgeted at as high as 89.2% in 2008–09 and 86.3% in 2012–13. Clearly this leaves very little scope for capital expenditure and developmental orientation of the GOI budget.

Business Cycles
NOTES
Self-Instructional 110 Material
2. Growing Size
Post independence, the GOI budget has registered a continuous growth in its size. In recent years its growth rate has increased rather alarmingly. In an earlier chapter, a few forces were identified that tend to feed an inevitable uptrend in public expenditure. These forces are fully operative in our country as well. Administrative machinery of the government has recorded a disproportionate expansion coupled with deterioration in its efficiency. The authorities have followed a policy of uninterrupted expansion in their activities. It is noteworthy that inflationary price rise (to which government expenditure itself is an important contributory factor) is a high compelling force that pushes up both budgetary receipts and disbursements. Almost all taxes of GOI are based upon the monetary value of the tax base. In addition, the government is expanding and deepening its activities and thereby adding to its expenditure.
Tables 5.1 and 5.2 highlight the growing size of GOI budget and its share in our economy. For the period under consideration (1950–51 to 2012–13), aggregate receipts of GOI (net of states’ share in taxes) increased from `511 crore to `14,90,925 crore, that is by 2,918 times or at a p.a. compound rate which far exceeds the growth rate of our GDP at current market prices. The position with regard to aggregate expenditure is also more or less similar. Thus while total expenditure of GOI was only 5.14% of GDP at current market prices in 1950–51, in later years, its average level rose and started hovering between 15% and 20% of GDP. It was budgeted at around 14% of GDP in 2011–12. In this respect, the following points are particularly noteworthy. • The GOI has been persistently advised by several prominent economists
that it must increase its Tax/GDP ratio so that it can increase its expenditure without generating inflationary pressures. This advice, however, is seldom accompanied with a recommendation for improving productivity of its administration and expenditure.
•Inflationary forces generated by budgetary policies have also contributed to the growing size of the budget.
•The authorities have also found several means for increasing their receiptsboth tax and non-tax. In recent years, receipts of service tax have registered a record growth rate and is expected to perform still better in the coming years both on account of upward revision of the tax rate and extended coverage to all services except those in the negative list. In addition, the authorities have repeatedly resorted to heavy borrowing to finance their expenditure.
•It was expected that with the enactment of Fiscal Responsibility and Budget Management Act (2003), fiscal deficits of the Centre would be contained and substantially lowered, though the budget itself was expected to keep increasing in absolute size. In practice, however, achievement of FRBM targets have been missed by a wide margin.

NOTES
Self-InstructionalMaterial 111
Business Cycles
Tabl
e 5.
1 O
vera
ll Bu
dget
ary
Posi
tion—
Gov
ernm
ent o
f Ind
ia
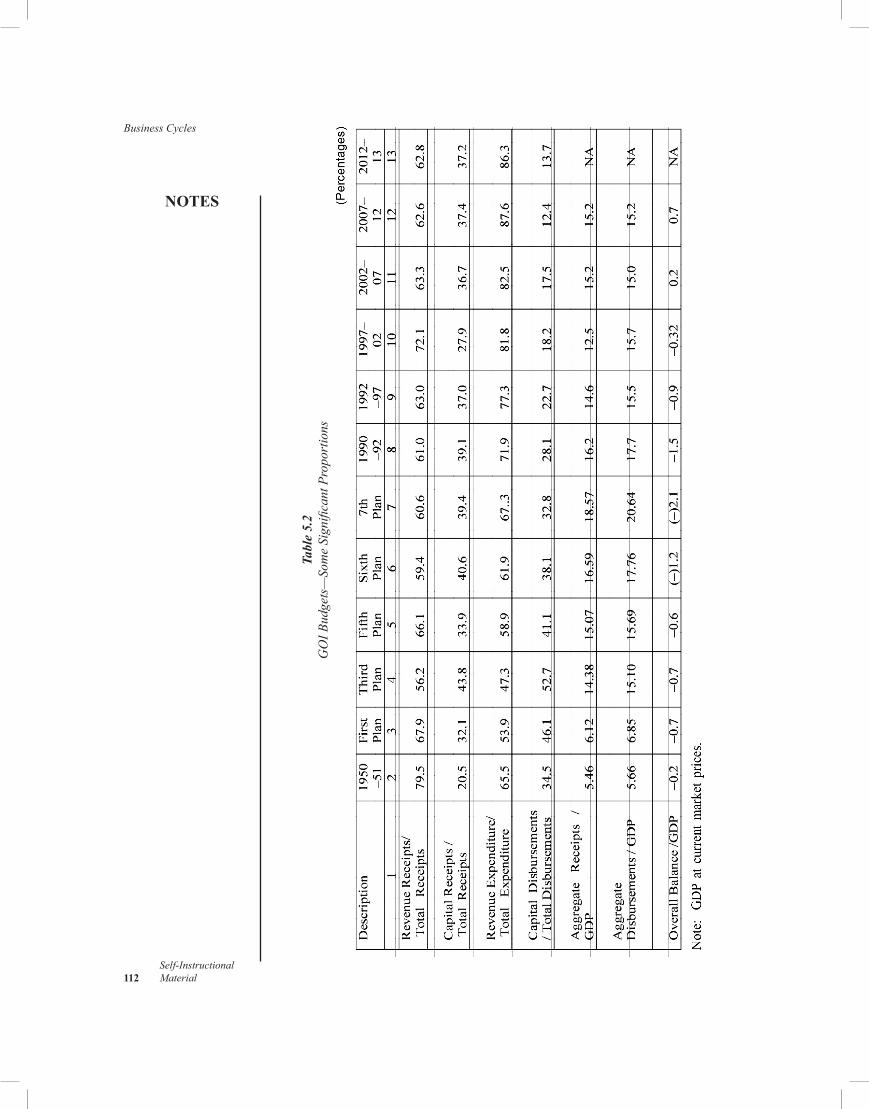
Business Cycles
NOTES
Self-Instructional 112 Material
Tabl
e 5.
2 G
OI B
udge
ts—
Som
e Si
gnifi
cant
Pro
port
ions

NOTES
Self-InstructionalMaterial 113
Business Cycles3. Deficit Spending
GOI budgets are also noteworthy for their persistent deficit spending. This is so even though in India, official definition of a budgetary deficit is not the same as that of the fiscal deficit (though throughout the world, the two terms are taken to mean the same thing) In India, while fiscal deficit of the Centre is defined as [its total expenditure less its total revenue receipts = total borrowings], budgetary deficit is narrowly defined as the sum of only two items, namely, (i) borrowings from RBI through 91-day ad hoc treasury bills, and (ii) drawing down of cash balances.
The practice of borrowing through 91-day ad hoc treasury bills was abandoned in 1997–98 and with that the concept of budgetary deficit also became irrelevant. Currently its estimate, if any, is equivalent to only drawing down of cash balances over the budgetary period. It is, therefore, no longer one of the budgetary figures as proposed by the Centre and passed by Parliament, but only as a post-facto figure in the revised estimates or actual accounts.
Till the end of 1970s, the overall deficit (that is, gross fiscal deficit) was accompanied by a surplus on revenue account so that a part of current revenues was available for capital expenditure. Since the beginning of 1980s, however, each revenue account has also registered a persistent deficit which means that the Government is meeting a part of even its current expenditure through borrowing. This, by any reckoning, is a manifestation of gross financial imprudence. In contrast, a shift of revenue account from a surplus to a deficit was accompanied by a shift from deficit to surplus in capital account. This has rapidly added to the indebtedness of GOI with all its associated drawbacks.
5.4.2 State Governments
Availability, in public domain, of information and data relating to state finances in India suffers from some serious limitations which militate against analytical quality of any coverage of this subject. In recent years, these problems and difficulties have multiplied due to several developments including the emergence of PPP mode of financing projects, and introduction of new mechanisms of implementation and new forms of resource transfers from the Centre to states and from states to local bodies. These limitations include, amongst others, the following: •Several states inordinately delay putting out information and data. • Several states do not reveal enough information relating to even
important policy initiatives, etc. At the most, only hints regarding such policy initiatives are provided in the budget speeches.
• There are rampant inter-state variations in formats of data coverage, data classification, data presentation, and methodology of estimating key data categories.

Business Cycles
NOTES
Self-Instructional 114 Material
• Budgets of several states are dotted with inconsistencies, such as, between GSDP data used to calculate key fiscal indicator ratios and GSDP estimates given in the budget documents.
• Many states do not publish complete data on their outstanding liabilities, contingent liabilities and off-budget borrowings in their budget documentsat least in comparable and useable form.
• With all states, including West Bengal and Sikkim, having enacted FRBM legislation, some of the above-mentioned limitations may get weakened but are not likely to be eliminated. There is still insufficient transparency regarding the initiatives taken under FRBM Acts. Unfortunately, this problem is not attracting serious attention of the authorities.
• Classification of expenditure into Plan and non-Plan categories poses its own problems. Over years, this distinction has made entire budgeting exercise highly complex. It also makes difficult to what we call ‘outcome budgeting’, that is, objectively assessing the productivity of public expenditure. The problem has become all the more serious because of the fact that, in recent years, greater attention has been paid to expenditure on ‘social objectives’. Outcomes of such expenditure categories are more ‘qualitative’ than ‘quantitative’ in nature.
• Substantial transfer of resources from states to Local Bodies has also brought up the need for a review of the classification of revenue expenditure and capital expenditure.
• Analysts feel that classification of expenditure items into ‘developmental’ and ‘non-developmental’ categories needs a fresh look.
• Similarly, transfer of resources from the Centre to states through various types of schemes and multiple modes of transfer do not fit in a pre-decided format and has created problems in obtaining a comprehensive overview of transfer to the states as also effective monitoring of expenditure. In addition, some funds are transferred directly to the implementing agencies and their accountability poses its own problems. For example, currently, apart from tax sharing and receiving a variety of grants covered by the recommendations of FC, states also receive from the Centre (a) Plan Loans, (b) Non-Plan loans, and (c) Grants for (i) State Plan Schemes, (ii) Central Plan Schemes, (iii) Centrally Sponsored Schemes, and (iv) NEC/Special Plan Schemes.
• In recent years, the growing usage of PPP route of financing various projects and schemes as also direct transfer of funds to implementing agencies has added to the data problems. Like the Centre, a state government is also under Constitutional
obligation to split its expenditure budget into revenue and capital accounts.

NOTES
Self-InstructionalMaterial 115
Business CyclesHowever, there is no pre-determined and unambiguous basis for this classification of budgetary items, and states follow conventional practices supplemented with their own discretion. Ordinarily, capital account of the budget comprises those items which do not arise out of the general administrative activities of the state; instead, they are associated with its transactions of tangible and financial assets and liabilities (such as loans, investments, etc.). In contrast, revenue account contains those budgetary items which are of ‘regular’ and ‘routine’ nature.
The figures given below pertain to the available data of state budgets (2011–12). And, though they are subject to year-to-year variation, they remain indicative of the comparative position of major segments of their budgetary receipts and disbursements.
Revenue Account
I. Revenue Receipts
Revenue receipts of states are broadly divided into two parts, namely, ‘tax revenue’ and ‘non-tax revenue’ with their respective shares of around 70.5% and 29.5% in total revenue receipts. These two proportions have been reasonably stable since the First Plan period and have varied over narrow ranges only.
Tax Revenue
Tax revenue itself comprises two parts, namely, (a) receipts of taxes levied by the states themselves, termed ‘states’ Own Tax Revenue’ (around 68%), and (b) share in Central tax revenue, termed ‘Shared Taxes’ (around 32%), with a long-term slow downtrend in the former and an uptrend in the latter.(a) Own Tax Revenue. States levy and collect a variety of taxes. The following facts are particularly noteworthy in this context. •Adoption of GST by both states and Centre is likely to change the entire
structure of indirect taxation. This would entail substantial revision of the description that follows.
• For various reasons, states are hesitant in taxing agricultural incomes. Only seven states levy this tax on the corporate sector engaged in plantation and similar activities. Some of these collect nothing or next to nothing from this source. Total tax receipts from this source in 2011–12 were budgeted at only `1.4 billion.
• Items like ‘Tax on Professions’ carry certain Constitutional restrictions like a ceiling on tax liability of an assessee. This tax is comparatively more popular with less developed states. Around eighteen states were budgeted to collect `41.5 billion from this tax in 2011–12.
• A number of state taxes have low elasticity and buoyancy.

Business Cycles
NOTES
Self-Instructional 116 Material
• Several taxes not only hinder economic growth but are also highly unpopular with the taxpayers.
• From the viewpoint of revenue receipts, sales tax (now in the VAT format) occupies the topmost position, followed by ‘State Excise Duties’ and ‘Stamps and Registration’.
• Other important revenue resources include ‘Motor Vehicles Tax’, ‘Electricity Duties’, ‘Taxes on Goods and Passengers’, and ‘Entertainment Tax’, etc.Leading Components. Sales tax contributes more than 62% of ‘States’
Own Tax Revenue’; and its share (as also its absolute amount) is expected to increase rapidly in the foreseeable future for a number of reasons, including reduction in tax evasion and phasing out of the Central Sales Tax.
Revenue from ‘Stamps and Registration’ is increasing for various reasons like growth of both financial and real sectors (more particularly the sector of urban properties), backed by inflationary price rise. This trend is indicative of an under-exploited but huge revenue potential. Experience shows that lowering of the stamp and registration duty rates cuts costs of legal transactions. It, therefore, encourages registration of a larger proportion of property and financial transactions and declaration of more realistic values thereof. A bye-product of this measure is an improvement in voluntary tax compliance and a reduction in tax evasion. Several states, having realized this fact, are lowering the duty rates.
Other important sources of state tax revenue include ‘State Excise Duties’ (about 13%), ‘Motor Vehicles Tax’ (around 5%), ‘State Electricity Duties’ (around 3%), and ‘Taxes on Goods and Passengers’ (around 2%). The bases of these taxes have an inherent tendency to widen with economic growth; and this also adds to their buoyancy. However, states are also saddled with some inelastic and non-buoyant taxes. Land taxes can be quoted as a classic example of this phenomenon; they not only hinder agricultural growth but generate political opposition as well. Similarly, it is noteworthy that ‘Taxes on Professions, Trades, Callings and Employment’, ‘octroi’ and similar other levies ought to be avoided because they hinder the development of an integrated country-wide market.
As of now, a clear picture is not available regarding the revenue potential of the service tax. A Constitutional Amendment for the imposition of GST, which incorporates service tax and its sharing with the states, was introduced in Parliament in March 2011 and a clearer picture would emerge only after the introduction of GST. However, the projected receipts are bound to increase in the coming years.
Direct taxes contribute only a small proportion of the States’ Own Tax Revenue. The explanation for this phenomenon lies in both their low yield potential and under-exploitation. Examples of such taxes include land

NOTES
Self-InstructionalMaterial 117
Business Cyclesrevenue and agricultural income tax. It is also noteworthy that some other direct taxes (such as tax on urban immovable property) are mostly assigned by the states to the local bodies. (b) Share in Central Taxes. It should be recalled that till 1999–2000, net proceeds of only a few Central taxes were transferable to the states either in full or in part. In 1999–2000 the share of states in (net) proceeds of Central taxes amounted to around 28.5% of the total. Since 2000–01, the states started receiving a fixed proportion of the entire ‘divisible pool’ of Central tax revenue which is, however, subject to revision under recommendations of the FC.
In addition, entire net proceeds of taxes levied under Article 269 of the Constitution have to be assigned to states. But, currently, the Centre is not levying any tax listed in this Article. In the past, the Centre did levy two taxes, namely, an estate duty and a tax on railway passenger fares. The latter was repealed in 1961 and the former in 1985–86. •Till 80th Amendment of the Constitution, only income tax was
compulsorily shared with states under Article 270 of the Constitution and contributed about 38.2% of the ‘shared’ tax revenue of states. Now it forms a part of the total divisible tax revenue of the Centre.
• Similarly, sharing of Union Excise Duties was permissible under Article 272 of the Constitution. Over time, all basic Union Excise Duties came to be shared with states. Also, all Additional Duties of Excise in Lieu of Sales Tax were wholly assigned to them. Excise duties contributed around 62% of the ‘shared’ tax revenue of states. Now excise duties also form a part of the divisible pool of Central tax revenue.
• Since 80th Amendment, net proceeds of all Union taxes, except those levied under Articles 268, 268A and 269 and cesses and surcharges, are shareable with the states and the latter get a fixed proportion thereof. In addition, they are entitled to collect and appropriate a part of tax on services as enacted by Parliament in this regard. However, with the adoption of GST, the states would start collecting a tax on services in their own right.
Non-tax Revenue
Share of non-tax revenue in total revenue receipts of states is around 30%. It comprises grants from the Centre and their own non-tax revenue. (i) Grants from the Centre constitute over two-thirds of total non-tax
revenue of states. (ii) States’ own non-tax revenue accounts for the remaining less than one-
third. Its main components include economic services, interest receipts, general services, social services and dividends and profits.

Business Cycles
NOTES
Self-Instructional 118 Material
II. Revenue Expenditure
Revenue expenditure is classified into three parts, namely, ‘Developmental Expenditure’, ‘Non-Developmental Expenditure’, and ‘Grants in aid and Contributions’ In 2011–12, their shares in total revenue expenditure were around 60.1%, 36.5%, and 2.5% respectively.
Capital Account
Meaning
Broadly speaking, capital account covers creation, acquisition and disposal of assets and their corresponding liabilities which are not on a continuous (that is, recurring or routine) basis. Expenditure on such heads is not charged to revenue account because it is basically meant for financing non-routine activities of the state.
Features
On account of the factors similar to those operating on the revenue side, capital accounts of state budgets have shown a rapid increase in size. The states are assuming, in an ever-increasing measure, the responsibility of socio-economic development of the country. In this context, there are some noteworthy facts. •Capital budget has always been a smaller component of the total budget,
its highest proportion being around 40% during the Second and Third Plan periods.
• Growth rate of capital budget has been smaller than that of the overall one.
• However, in view of acute shortage of infrastructure and basic facilities, capital budget ought to grow much faster than the revenue one.
Capital Receipts
It should be noted that with effect from 2003–04, in line with the accounting classification of the CAG, several changes were made in the presentation of budgetary data. Capital receipts now include receipts of the Public Accounts and the like. In addition, several items are on a gross basis, while some others are on net basis. This adds to the difficulties of assessing relative importance of different receipt items.
Loans from the Centre used to account for a dominant proportion of capital receipts of states. But in recent years, three significant developments have transformed this scenario. •On the recommendation of the Finance Commission, the Centre no
longer extends fresh loans to the states in ordinary course of things (except in the case of external loans meant for state projects).

NOTES
Self-InstructionalMaterial 119
Business Cycles • Consequently, the states have been persuaded to reduce their dependence upon Central loans and instead resort to market borrowings. They are continuously restructuring their borrowings programmes and terms and conditions of their loans in tune with market forces. Consequently, now market loans account for the biggest share of their total borrowings.
• Before NSSF came into existence on April 1, 1999, the Centre used to appropriate a wide array of small savings etc. in the form of its own borrowings for relending them to the states. But this practice changed when NSSF was constituted. Now, collections of some varieties of small savings are credited to NSSF and NSSF invests its net accretions in GOI and state securities. Prior to 2002–03, it was investing 80% of its net accretions in special state securities. In 2002–03, this share was increased to 100%, only to be reduced again to 80% since 2007–08.
• Investments of NSSF in state securities are recorded as a component of their ‘Internal Debt’. As a result of these institutional and accounting developments, the
proportion of ‘Internal Debt’ in total capital receipts of the states registered an uptrend and reached 78% in 2011–12.
However, even after these changes, loans from Centre continue to be an important component of capital receipts of states. It was budgeted at 6.5% of total capital receipts in 2011–12. This is because a major portion of Central assistance to states is still extended to them in the form of loans even when they are meant for non-income generating items like relief for natural calamities.
Other important components of capital receipts of the states include ‘Recovery of Loans and Advances’, ‘Reserve Funds’ and ‘Deposits and Advances’.
Capital Disbursements
Capital disbursements of states comprise developmental and non-developmental capital outlay (70.5%), repayment of internal debt (19.2%), repayment of loans to the Centre (2.9%), and loans and advances by the state governments to third parties (7.4%). It is noteworthy that in the near future, the proportionate share of repayment of loans to the Centre is likely to decline on account of a substantial reduction in fresh loans from the Centre and writing off the existing outstanding loans from it. Correspondingly, the component ‘repayment of internal debt’ is likely to increase further.
5.4.3 Local Self-Government
Unless the geographical area of a country is very small, it is likely to have, in addition to a national-level government, one or more sub-national levels

Business Cycles
NOTES
Self-Instructional 120 Material
as well. The term ‘local bodies’ refers to one such lowermost sub-national level of the government of a country. In countries with large geographical areas like India and the USA, the sub-national level/levels immediately below the national one is/are often not covered by the term ‘local bodies’ (LBs) and is/are variously known as state governments, regional governments, and regional councils, etc. It is also noteworthy that at each sub-national level, there are more than one parallel governments with their respective territorial jurisdictions.
The term ‘local finance’ covers fiscal theory, fiscal facts, fiscal policies and fiscal problems associated with the ‘local bodies’ and the functions assigned to them.In India, we have a multi-tier government at three levels, namely, •The Government of India (GOI), also known as the Central/Union
Government with a territorial jurisdiction over the entire country; • A government for each state/union territory with their respective
territorial jurisdictions and functions as laid down in the Constitution of India; and
• A wide variety of local bodies with their respective territorial jurisdictions and assigned functions.
Rationale for LBs
Local bodies are claimed to have several advantages and are recommended as an integral part of an ideal governmental structure, particularly for a geographically big country like India. There are several state functions which should answer the local needs and should be in conformity with ground realities. And for this reason, they are best assigned to the local authorities. Examples of such functions include public parks, street lights, scavenging, and draining. They need variations and adjustments from city to city, and within a large city, from locality to locality and even street to street. The local residents can also express their problems and preferences in these matters. In a welfare-oriented modern governance, it is desirable to accommodate their aspirations and needs. Moreover, local bodies provide a meaningful and responsible training ground for the citizens in matters of political, social and economic rights and obligations.
Thus, the justification for having local governments flows from the fundamentals of the theory of fiscal federalism. In a vast country like ours, there are several governmental and collective services which are best provided by separate levels of government. The guiding factors in the allocation of such services as between different governmental levels should be productive efficiency, economy of resources and uniformity of treatment. At the level of local governments, a close link can be established between many governmental services and their financing through taxation etc. It is far

NOTES
Self-InstructionalMaterial 121
Business Cycleseasier to devise local taxes on a judicious admixture of the benefits-received principle, cost-of-services principle and the principle of relative taxable capacity. While, it is quite difficult to determine relative taxable capacity of the members of society at national or even regional level, the task is much less difficult at the local level.
Constitutional Position
Till the 73rd and 74th Amendments (in 1993), our Constitution provided for only two levels of governmentat the Centre and at states. There was no Constitutional obligation to have local bodies. The only rationale for their existence was the belief that they could improve the quality of such state services which were characterized by inter-local dissimilarity. Guided by this belief, the Centre had also constituted port trusts and cantonment boards etc. Similarly, the other forms of local authorities, though of great variety and importance, were created by the states on their own volition with specified respective territorial jurisdictions and with assigned functions and resources to them out of the State List. There was no assured inter-state uniformity in such assigned resources and functions between local bodies of even the same type. In a union territory, local bodies derived their origin, functions and resources from the Centre.
The position after the above-mentioned 73rd and 74th Constitutional Amendments regarding LBs is as follows:
1. Obligatory Existence
Setting up of local bodies with specifically assigned subjects is now a Constitutional necessity, and they are now considered an essential form of local self government. Now, it is obligatory for each state to legislate for specified varieties of local bodies corresponding to the classification of local areas into villages, rural areas, areas in transition from rural to urban ones, and urban areas. However, some states and areas listed in Schedule VI are exempted from this obligation.
2. Two Categories
The above-mentioned Amendments of the Constitution primarily provide for two main categories of local governments, namely, •Rural local bodies (RLBs), and • Urban local bodies (ULBs).
However, the nomenclature of local bodies is not a standard and clear one. Thus, local bodies for rural areas are variously referred to as gram sabhas (at the village level), and panchayats etc. for bigger areas. The ‘generic’ term for referring to such bodies is ‘panchayats’ or panchayati raj institutions (PRIs) or rural local bodies (RLBs). Similarly, the generic name for local bodies for urban areas is ‘municipalities’ or urban local bodies (ULBs), though

Business Cycles
NOTES
Self-Instructional 122 Material
individually they are also known as panchayats, municipal committees, municipal councils, municipal corporations, etc. More specifically, there are three tiers of ‘primary rural institutes’ and three types of ‘urban local bodies’. In general, it is convenient to classify local bodies into RLBs and ULBs. In addition, other sub-state bodies like zila parishads are also there.
It is noteworthy that there is a need to clearly legislate and demarcate functions (out of 29 functions listed in Schedule XI for them) for each tier and kind of a local body. This has not been done.
Some areas in our country, as listed in Schedule VI of the Constitution, are exempted from the provisions of 73rd and 74th Constitutional amendments. It is felt that the provisions of these Amendments should be extended to these areas as well. In addition, institutions like the State Finance Commission should also cover these areas so as to strengthen their operational functions and financial resources. Also, for enhancing the effectiveness of local bodies, their functioning should be integrated with other agencies undertaking projects of socio-economic development in their respective areas.
Nominated local bodies. In addition to the above-mentioned RLBs and ULBs, we continue to have some other forms of local bodies like the port trusts and improvement trusts etc. Normally, these are nominated bodies with specially assigned functions. Their sources of finance are more or less determined by the statutes bringing them into existence, and they subsist primarily on grants from the state or Central Government. These bodies are meant for those areas from which sufficient revenue is not expected on account of predominance of government property, but for which local services are needed anyway.
According to latest available figures, there were 2,47,033 rural local bodies and 4,582 urban local bodies in India. It is also noteworthy that Indian population is getting rapidly urbanized and this is one of the aims of our planning. According to one projection, urbanized proportion of Indian population was projected to increase from 28% in 2001 to 38% in 2026. This implies a massive shift from rural to urban centres, a corresponding increase in requirement of civic amenities and services, as also financial needs of the local bodies.
3. Functions
The said Constitutional Amendments incorporated two Schedules to the Constitution. Eleventh Schedule contains a subject list of 29 entries for rural bodies while Twelfth Schedule contains a subject list of 18 entries for urban bodies. Both subject lists relate to economic and social reconstruction and uplift including planning at the local level.
The functions of RLBs include judicial services, social and community services and economic services, and their list can be quite a long one. For

NOTES
Self-InstructionalMaterial 123
Business Cyclesexample, community and social services include general vigilance, provision of watchmen, registration of births and deaths, being a general source of information, provision of education and health services and so on. Similarly, economic services include street lighting, scavenging, provision of drinking water and agricultural inputs, building and maintenance of minor irrigation works, drainage, bunding and terracing of lands, local roads, and the like. They may also take up activities in the fields of marketing, co-operative finance, godowns and warehousing, etc.
As noted above, the functions of local bodies are enlisted in Schedules XI and XII for RLBs and ULBs respectively. But as yet, there is no legislation which specifically allocates functions out of these Schedules to individual tiers and kinds of LBs. However, the functions and resources of local bodies tend to widen as we move from rural to urban level. A municipal corporation has generally more functions to perform than a municipal committee. For example, a municipal corporation provides sanitation, water supply, street lighting, scavenging, local roads, drainage, education up to the middle level, and the like. Quite often, it is also entrusted with local transport and medical services including dispensaries and hospitals. The execution of various social service schemes of the Centre and states also frequently becomes the responsibility of the local bodies. In addition, the concerned state or the Central Government frequently appoints an administrative officer as head of the executive wing of the corporation. It may also depute experts to a municipal corporation so as to contribute to its operational efficiency.
4. Resources
It is important to note that Schedules XI and XII do not contain subjects of ‘revenue resources’, except by way of incidental receipts. Therefore, in effect, as before, for each specified category of local bodies, the state legislature is to assign functions and resources out of the State List and in conformity with the relevant Schedule (XIth or XIIth, as the case be). The financial resources of the local bodies may comprise •assigned taxes, • shared taxes, • grants, • loans, and • income from remunerative activities.
It is expected that in providing for resources to local bodies, a state would be guided by the findings and recommendations of the State Finance Commission.

Business Cycles
NOTES
Self-Instructional 124 Material
5. State Finance Commissions
There is a provision for a State Finance Commission [SFC] to be constituted in each state every fifth year to cover the following: 1. To review the financial position of the local authorities and recommend
measures for improving it. 2. To make recommendations to the government of the state as to (a) the principles which should govern
(i) the distribution between the state and local authorities of the net proceeds of the taxes, duties, tolls and fees leviable by the by the state, which may be divided etween them;
(ii) the allocation between the local authorities of the collective shares of such proceeds;
(iii) the determination of taxes, tolls, duties and fees which may be assigned to, or appropriated by the local authorities;
(iv) grants-in-aid to the local authorities from the consolidated fund of the state; and
(b) any other matter referred to the Finance Commission by the government of the state in the interest of sound finance of the local authorities.
Working of SFCs: It is noteworthy that the role of SFCs in improving the financial position of LBs in an assured manner has not been very creditworthy. In this context, the following facts are specifically noteworthy. (i) As of now, the gap between two consecutive SFCs cannot be less than
five years. This legal restriction should be removed. Even the Thirteenth Finance Commission recommended that, if need be, a state should be allowed to appoint a SFC even before the expiry of five years.
(ii) SFCs are victims of the indifferent attitude of states towards their legitimacy and role. Working of SFCs suffers from the casual approach of the states in the selection of their personnel, scant attention paid to matters other than those which are needed for meeting Constitutional and legal obligations, and so on. SFCs are confronted with paucity of timely, sufficient and authentic data. The suppliers of data, namely the LBs, are themselves poorly managed. In several cases, a SFC is not provided with the working files of the preceding SFCs.
(iii) SFCs are also criticised for not taking their task seriously. In several cases, their reports are criticised for diversity in approach and poor quality of contents and analysis.However, the fact that the contribution of SFCs towards financial health
of LBs has been of limited value, does not imply that this institution should be scrapped. Instead, steps should be taken to strengthen this institution

NOTES
Self-InstructionalMaterial 125
Business Cyclesand enhance its effectiveness. This is because, in the ultimate analysis, an improvement in our quality of life is hinged upon the strength and efficiency of LBs.
6. Resource Transfers from State Governments
Every state government is expected to •assign some specific taxes, duties, tolls and fees to local bodies; • share the net proceeds of some specified taxes, duties, tolls and fees
to local bodies; and • give grants to local bodies out of its Consolidated Fund.
In practice, however, the states tend to accord a very low priority to the financial needs of the LBs and the problem is far more serious in the case of smaller LBs. (i) Resource flow from the states to LBs is characterized by inadequacy,
uncertainty and undue delays. As a result the LBs are not able to chalk out long term plans.
It is, however, heartening to note that not all state governments treat LBs in this manner. Thus, for example, the Government of Kerala has legislated that 33% of the state’s budget goes to local bodies. These days, a view is gaining ground that just as states get a pre-determined share of Central tax revenue, the LBs should also get a predetermined share of the state’s tax revenues. This percentage share and its distribution between different LBs should be a part of the recommendations of the SFC.
(ii) LBs have become accustomed to poor financial health and consequently inefficient and poor delivery system. Even the beneficiaries of their services do not expect LBs to perform well. This pathetic state of affairs can be remedied only by improving and sustaining financial health of LBs.
7. Resource Gap of LBs
As in the case of other tiers of the government, financial needs of LBs are increasing on account of widening and deepening of their functions while availability of financial resources to them is lagging behind. In other words, their fiscal space (that is, capacity of budgetary adjustments and changes) is shrinking.
Revenue resources of LBs are characteristically non-buoyant and inelastic and suffer from large scale revenue leakages. They have not able to revise their user charges in line with increasing costs. They have failed in optimal exploitation of property taxation and the Constitution prevents them from levying property tax on GOI property. Octroi has been abolished

Business Cycles
NOTES
Self-Instructional 126 Material
(as of 2012) in all states except Maharashtra. And the states have failed to adequately compensate them for this loss of revenue.
8. Related Facts
Financial resources of LBs may be divided into two categories, tax revenue and non-tax revenue. Non-tax revenue includes grants from the state governments, earnings from public undertakings like water supply and transport, earnings from certain remunerative activities like leasing out of lands, buildings and plots, etc. It also includes fees, fines and payaments for certain services.
Tax Revenue. The Scheduled Tax Rates framed under the Government of India Act, 1919 contained an exclusive list of taxes to be utilised by or for the local authorities. The Government of India Act, 1935 allocated every local tax to provincial governments. The same scheme was also incorporated in our Constitution whereby the tax resources are shared between the Centre and the states, and it is for the states to hand over specified tax resources to the local bodies out of their own list. But the record of states in this regard cannot be termed creditable. The tax resources of the local bodies vary from state to state and from one body to the other. There is no uniformity in this connection. And almost every tax which a local body can impose has a corresponding tax which the state government can also impose. The local bodies cannot protest if a state government encroaches upon the field in which local bodies are levying taxes or which is generally expected to be their privilege. Consequently, the local bodies inculcate an attitude of non-responsibility and are not keen to improve their administration
5.5 INDUSTRIAL SICKNESS, CAUSES AND REMEDIES
The problem of sickness in Industries has become very acute in India. It has adversely affected the health of the industrial sectors in particular and the economy in general. Sickness is easy to understand but difficult to define. In common idiom, a sick industry is one which is not healthy. A healthy unit is one which earns a reasonable return on capital employed and which build up reserves after providing reasonable depreciation. Different agencies have defined sikness differently. Reserve Bank of India and State Bank of India all defined sick industries as- A small scale industrial unit is considered as sick when any of its borrowable accounts has become a doubtful advance that is most important or interest in respect of any of its borrowable accounts has remained overdue for a period more than 2 and ½ year and there is wearing away in the new worth due to accumulated cash losses to the extent of 50 per cent of its climax net worth during the foregoing two accounting years. However, enactment of the Sick Industrial Companies Act 1985 settled the

NOTES
Self-InstructionalMaterial 127
Business Cyclesissue. According to SIC Act “an industrial company which has at the end of any financial year accumulated losses equal to or exceeding its entire net worth and has also suffered cash losses in such financial year and the financial year immediately preceding such financial year.” The 1992 amendment altered the criterion somewhat: firms only need to be registered for five years and the criterion of cash losses for two successive years was eliminated.
The small units were considered to be sick –(1) incurred a cash loss in the previous accounting year and was likely to continue with losses in the current accounting year and erosions on account of cumulative cash losses to the extent of 50 per cent or more of its peak net worth during the last five years. (2) Continuously defaulted in meeting four consecutive installments of interest of two half yearly installments, of principal on term loan and there were persistent irregularities in the operation of its credit limits with the bank. The Company Act 2002 changed the definition of a sick industrial company. According to Company Act 2002 “sick industrial company means an industrial company which has accumulated losses in any financial year which are equal to 50 per cent or more o its average net worth during four years immediately preceding such financial year, or failed to repay its debt within any three consecutive quarters on demand mad in writing for its repayment by a creditor or creditors of such company”This shows that a sick industrial company is that company which has: • 5 years existence is not required. • Accumulated losses exceeding 50 per cent of average net worth during
last four years. • Alternative criteria of falling to repay its debts to the creditor with in
9 months of the demand by him.Any one of the criterion, (2) Or (3) mentioned here is sufficient to
classify and industrial unit as a sick
5.5.1 Causes of Industrial Sickness
Causes of industrial sickness are usually divided into two categories- • External causes • Internal causes External causes: These causes of sickness originate outside of the company. Some external causes are as follows: • Power cuts: A large number of industrial units face power cut from
time to time. These power cuts are imposed by the government of state as the generation of power is considerably below its actual requirement. Acute power shortage resulted in frequent power cuts. Due to this production decline in these units and then they turn sick units.

Business Cycles
NOTES
Self-Instructional 128 Material
• Demand and credit restraints: At times, of recession in the market causes a steep decline in the demand resulting in unsold stock and losses to individual units. Products with high prices depend for their sustained demand on easy availability of credit to purchasers. If credit restraints are imposed so that the purchasers are not able to arrange finance, the demand for these products is bound to suffer. This is likely to leave the manufacturers with unsold stocks inflicting losses on them. This problem can emerge in a serious way for ancillary units. If demand of the principal buyer of the output of ancillary units fall due to any reason.
• Government Policy: Sudden change in government policy relating to export, to import, industrial licensing, taxation can make viable units sick overnight. For instance-
(i) The opening up of the internal market to foreign competition in recent years in line with India’s commitments to the World Trade Organization (WTO) is making it difficult for many industrial units to survive.
(ii) Liberal import policy for a particular product can impose serious damage on the domestic units producing similar or substitute products. The existence of domestic units becomes difficult when the imported product is cheaper and is of a better quality as compared to their products.
(iii) Granting liberal licences to big industrial houses in the production lines reserved exclusively for the small scale sector is bounded to affect the prospects of the units in the latter sector adversely. The most difficult problem faced by the small-scale industries that are facing tough competition from cheap imports on the one hand and from large scale industries on the other hand.
Internal causes: Such causes of sickness originate within the company. Some internal causes are as under: 1. Fault at the planning and construction stage: Faults can occur at
the planning and construction stage itself. The first fault can be wrong location of industrial unit. if the place where the unit has been set up lacks infrastructural facilities, the unit is likely face difficulties. Some small-scale entrepreneurs plunge into production without bothering to find out the market potential of their product thus wrong location of the unit pushes them into difficulties. Some small-scale units do not plan production properly, some units start with an unbalanced capital structure, under estimate the project cost and some units spend recklessly on unproductive assets. In all cases either the implementation of the small scale project is delayed or production is started under severe handicaps. A slight disturbance in the normal functioning turn them sick units.
NOTES
Self-InstructionalMaterial 129
Business Cycles 2. Management problem: The most of important internal cause of sickness is mismanagement. Faulty decisions in the field of marketing, finance, personnel and production management. Absence quality control system, lack of inventory and materials management is some example of mismanagement in the sphere of production. Insufficient sales promotion activities and improper price policies create problems in the field of marketing. Inefficient use of capital can cause financial mis-management. Lack of workforce and planning between top management and labour force, improper wage, increment and promotion policy are the subject of personnel management.
3. Defective plant and machinery: In small-scale units many entrepreneurs do not seek proper professional and technical guidance in choosing correct machinery. If they selected and installed the defective machinery, their units are bound to suffer losses and finally turn into sick units.
4. Labour problem: Labour problems are common in industrial units. In some cases acute labour problem have resulted lockout, strike, and even closure of industrial units. These problems may originate from differences with management over the issue of bonus, wage, suspension, inter-union rivalry and retrenchment etc. such problem can cause sickness.
5. Entrepreneurial incompetence: Many persons setting up small-scale units , do not possess technical knowledge of the product they intend manufacturing, have no knowledge of business accounts, lack good decision-making, lack of marketing decision, do not know the cost of their product and so on. No doubt the unit turn sick by this type of people
6. Financial problem: A number of units face the problem of finance from the stage of planning and construction to the stage of implementation and beyond often, small-scale units borrow from banks and financial institutions but are unable to meet the repayment schedules. The burden accumulates and they turn sick. The equity base of many small-scale units is very weak and slight disturbances in the market put them under acute financial strain. In some cases, lack of support from banks causes a failure of small units as the bank insist on proven performance either to restore working capital limits or to enhance existing limits.
5.5.2 Remedial Measures
The remedial measures undertaken are as follows:- (i) Grant of additional working capital facilities to overcome the shortage
of working capital faced by such unit (ii) Recovery of interest at reduced rate

Business Cycles
NOTES
Self-Instructional 130 Material
(iii) Suitable moratorium of payment of interestA number of steps were also undertaken on organizational front (i) Setting up a sick industrial undertakings cell in Reserve Bank of India
to function as a clearing house for information relating to sick unit and to act as a co-ordinating agency between the government, banks financial institutions and other agencies for tackling the various related issues.
(ii) Setting up of a special cell within the rehabilitation finance division of industrial development bank of India for attending to references from banks in respect of their sick and problem area.
(iii) Setting up state level inter-institutional committee at all the reaonsal offices of he department of banking operation and development of the Reserve Bank of India for ensuring for better coordination between banks, state government, central and state level financial institutional and other agencies.
Policy Frame Work of the Government: The policy framework in respect of measure to deal with the problem of industrial sickness was laid down in the guideline issued in October 1981 for guidance of administrative ministry of central government, state government and financial institutions. Under these guidelines, the administrative ministries in the government were given specific responsibilities for prevention and remedial action in relation to sickness in the industrial sector within their respective charge. The financial institutions were asked to strengthen the monitoring system so that timely corrective action could be taken to prevent incipient sickness. The government could also consider steps such as restructuring merger with healthy units etc. to rehabilitate the sick unit. Where the revival did not seem possible, the government could de-notify the unit resulting in its closure.Concessions by government: The government to assist revival of sick units without intervention also provided certain concessions. To reduce the sickness in the small scale sector the state government introduces a liberalized margin money scheme in June 1987. In October 1999, the government announced a scheme for grant of excise loan to sick/weak industrial units. Under this scheme selected sick units were eligible for excise loan not exceeding 50 per cent of the excise duty actually paid for 5 years.Steps for detecting sickness early: Importance of detecting sickness in initial stage is crucial as corrective steps can then be taken early and well in time. The Reserve Bank advised banks to take necessary remedial steps in respect of industrial units, which do not come under the purview of sick industrial companies Act 1985, at the stage of 50 per cent erosion of their net-worth. The Reserve Banks also closely mentioned certain specific industries where sickness is more widespread.

NOTES
Self-InstructionalMaterial 131
Business CyclesEstablished the Industrial Reconstruction Corporation of India (IRCI)
The Government Established the Industrial Reconstruction Corporation of India (IRCI) with a view to reviving and rehabilitation sick units. Function assigned to IRCI were- (i) to provide financial assistance to sick industrial units (ii) to provide managerial and technical assistance to sick industrial units. (iii) to secure assistance of other financial institution and government agencies for ensuring the revival and rehabilitation of sick industrial units, (iv) to provide merchant banking service amalgamation, (v) to provide consultancy service to banks in matter rating to sick industrial units.
Board for Industrial and Financial Reconstruction
In terms of sick industrial company act 1985, the government of India set up board for industrial and financial reconstruction in January 1987 for determining the preventive remedial and other measures, which were required to be taken in respect of sick industrial companies. The subject that could be covered was wide ranging and the power of the board extended to the framing of scheme of amalgamation and reconstruction.
Check Your Progress
1. Define national income. 2. What is a monetary policy?
5.6 ANSWERS TO CHECK YOUR PROGRESS QUESTIONS
1. National income can be defined as the sum of money value of all final goods and services produced in a country over a period of one year.
2. Monetary policy refers to the central bank’s programme of changing monetary variables, viz., total demand for and supply of money, interest rates and credit rationing, to achieve certain predetermined objectives.
5.7 SUMMARY
• The economic history of various economies is, in fact, a history of ups and downs, booms and slumps, prosperity and depression.
• National income can be defined as the sum of money value of all final goods and services produced in a country over a period of one year.

Business Cycles
NOTES
Self-Instructional 132 Material
• National income can be defined also as the sum of all factors incomes. Factors of production, viz., land, labour, capital and entrepreneurship, are used to produce goods and services.
• Measuring national income is an extremely complex and complicated task as it involves both conceptual and practical problems. Therefore, before we discuss the methods of estimating national income, it is useful to understand the concepts used in estimating national income.
• The concept of national income refers to the income of the society as a whole. It differs fundamentally from the concept of private income.
• The ‘fiscal policy’ refers to the government policy of changing its taxation and public expenditure programmes intended to achieve certain predetermined objectives.
• The counter-cyclical fiscal policy is based on the relation of public expenditure and taxes to the national income, the GNP.
• Monetary policy refers to the central bank’s programme of changing monetary variables, viz., total demand for and supply of money, interest rates and credit rationing, to achieve certain predetermined objectives.
• Boundaries of the subject of public finance have undergone repeated revisions in line with developments in State activities and its economic philosophy.
• The Budget of the Government of India is a statement of its estimated financial receipts and disbursements for a given forthcoming period of time (normally one year) and is called its ‘Annual Financial Statement’.
• Unless the geographical area of a country is very small, it is likely to have, in addition to a national-level government, one or more sub-national levels as well.
• The term ‘local finance’ covers fiscal theory, fiscal facts, fiscal policies and fiscal problems associated with the ‘local bodies’ and the functions assigned to them.
• Till the 73rd and 74th Amendments (in 1993), our Constitution provided for only two levels of government--at the Centre and at states.
• Some areas in our country, as listed in Schedule VI of the Constitution, are exempted from the provisions of 73rd and 74th Constitutional amendments. It is felt that the provisions of these Amendments should be extended to these areas as well.
• The Scheduled Tax Rates framed under the Government of India Act, 1919 contained an exclusive list of taxes to be utilised by or for the local authorities.

NOTES
Self-InstructionalMaterial 133
Business Cycles • The problem of sickness in Industries has become very acute in India. It has adversely affected the health of the industrial sectors in particular and the economy in general.
• Causes of industrial sickness are usually divided into two categories: ο External causes ο Internal causes • The policy framework in respect of measure to deal with the problem
of industrial sickness was laid down in the guideline issued in October 1981 for guidance of administrative ministry of central government, state government and financial institutions.
5.8 KEY WORDS
• Gross domestic product (GDP): It is the measure of the total market value of all final goods and services produced in the domestic economy during a period of one year plus income earned by the foreigners in the country minus income earned by countrymen from abroad.
• Non-economic product: These include services rendered to self, to family, to relations and to neighbours. Non-economic products are not included in national income.
• Fiscal policy: It refers to the government policy of changing its taxation and public expenditure programmes intended to achieve certain predetermined objectives.
5.9 SELF ASSESSMENT QUESTIONS AND EXERCISES
Short-Answer Questions
1. What is the significance of the fiscal policy? 2. Name the instruments through which a central bank carries out its
monetary policies. 3. Write a short note on the subject matter of public finance. 4. Identify the causes of industrial sickness.
Long-Answer Questions
1. Discuss the relationship between public expenditure and GNP. 2. Explain the areas of public finance covered under the central
government.

Business Cycles
NOTES
Self-Instructional 134 Material
3. Describe the functions and resources of the local bodies (LBs) after the introduction of the 73rd and 74th amendment (1993) in the Indian Constitution.
4. Evaluate the remedies to cure industrial sickness.
5.10 FURTHER READINGS
Dwivedi, D. N. 2008. Principles of Economics, Seventh Edition. New Delhi: Vikas Publishing House.
Weil. David N. 2004. Economic Growth. London: Addison Wesley.Thomas, Christopher R. and Maurice S. Charles. 2005. Managerial
Economics: Concepts and Applications, Eighth Edition. New Delhi: Tata McGraw-Hill Publishing Company Limited.
Mankiw, Gregory N. 2002. Principles of Economics, Second Edition. India: Thomson Press.

NOTES
Self-InstructionalMaterial 135
Theories and Nature of ProfitBLOCK - II
MANAGERIAL DECISION MAKING
UNIT 6 THEORIES AND NATURE OF PROFIT
Structure 6.0 Introduction 6.1 Objectives 6.2 TheoriesofProfit
6.2.1 Walker’sTheoryofProfit:ProfitasRentofAbility 6.2.2 Clark’sDynamicTheoryofProfit 6.2.3 Hawley’sRiskTheoryofProfit 6.2.4 Knight’sTheoryofProfit 6.2.5 Schumpeter’sInnovationTheoryofProfit 6.2.6 MonopolyPowerasaSourceofProfit
6.3 DepreciationandProfit 6.4 ValuationofStockandProfit 6.5 ProfitPolicies 6.6 Planning and Forecasting
6.6.1 Calculation of Break Even Point 6.6.2 MeaningofBreak-evenAnalysis 6.6.3 LinearCostandRevenueFunctions 6.6.4 Non-linearCostandRevenueFunctions 6.6.5 ContributionAnalysis 6.6.6 Profit:VolumeRatio 6.6.7 UseofBreak-EvenAnalysis 6.6.8 LimitationsofBreak-evenAnalysis
6.7 AnswerstoCheckYourProgressQuestions 6.8 Summary 6.9 Key Words 6.10 SelfAssessmentQuestionsandExercises 6.11 FurtherReadings
6.0 INTRODUCTION
Economists are not unanimous on this issue. It is in fact this question that has been a source of an unsettled controversy and has led to the emergence of various theories of profit. In this section,wediscuss briefly themaintheoriesofprofit.Inthisunityouwillstudyabouttheoriesofprofit,conceptofplanningandforecasting,depreciationandprofits,valuationofstockandprofitandprofitpolicies.

Theories and Nature of Profit
NOTES
Self-Instructional 136 Material
6.1 OBJECTIVES
Aftergoingthroughthisunit,youwillbeableto: •Discussthetheoriesofprofit •Explaintheconceptofvaluationofstockandprofit • Statetheprofitpolicies •Analysethesignificanceofplanningandforecasting •Giveexampleofcalculationofbreak-evenpoint
6.2 THEORIES OF PROFIT
Letusanalysethedifferenttheoriesofprofit.
6.2.1 Walker’s Theory of Profit: Profit as Rent of Ability
OneofthemostwidelyknowntheoriesofprofitwaspropoundedbyF.A.Walker.Accordingtohim,profitistherentof“exceptionalabilitiesthatanentrepreneur may possess” over others. Just as land rent is the difference betweentheyieldsoftheleastandthemostfertilelands,profitisthedifferencebetweentheearningsof theleastandthemostefficiententrepreneurs.Informulatinghisprofittheory,Walkerassumedastateofperfectcompetitioninwhichallfirmsarepresumedtopossessequalmanagerialability.Eachfirmwouldreceiveonlythewagesofmanagement.Thus,accordingtoWalker,underperfectlycompetitiveconditions,therewouldbenopureprofitandallfirmswouldearnonlymanagerialwages,popularlyknownas‘normal profit’.
6.2.2 Clark’s Dynamic Theory of Profit
AccordingtoJ.B.Clark,profitsariseinadynamiceconomy,notinastaticone.Astaticeconomyisoneinwhichthingsdonotchangesignificantly;populationandcapitalarestationary;productionprocessremainsunchangedovertime;goodscontinuetoremainhomogeneous;factorsenjoyfreedomofmobility but do not move because their marginal product in every industry is thesame;thereisnouncertaintyandhencenorisk;andifthereisanyrisk,itisinsurable.Inastaticeconomytherefore,allfirmsmakeonlythe‘normalprofit’,i.e.,thewagesofmanagement.
Ontheotherhand,adynamiceconomyischaracterizedbythefollowinggeneric changes: (i) increase in population, (ii) increase in capital, (iii) improvementinproductiontechnique,(iv) changes in the forms of business organization,and(v) increase in and multiplication of consumer wants. The major functions of entrepreneurs or managers in a dynamic world are to takeadvantageofthegenericchangesandpromotetheirbusiness,expandtheir sales and reduce their costs. The entrepreneurs who successfully take

NOTES
Self-InstructionalMaterial 137
Theories and Nature of Profit
advantage of changing conditions in a dynamic economy make pure profit,i.e.,profitinadditionto‘normalprofit’.
Pure profits, however, exist only in the short run. In the long run,competitionforcesotherfirmstoimitatethechangesmadebytheleadingfirms.Thisleadstoariseindemand for factors of production and therefore riseinfactorpricesandriseincostofproduction.Ontheotherhand,riseinoutputcausesadeclineinproductprices,giventhedemand.Theultimateresultisthatpureprofitdisappears.InClark’sownwords,“Profitisanelusivesumwhichentrepreneursgraspbutcannothold.Itslipsthroughtheirfingersandbestows itself on all members of the society”.
This,however,shouldnotmeanthatprofitsariseinadynamiceconomyonlyforashortperiodanddisappearforever.Infact,inadynamiceconomy,generic changes take place continuously and managers with foresight continue to take advantageof the changingmarket conditions andmakeprofit inexcessofnormalprofit.AccordingtoClark,emergence,disappearanceandre-emergenceofprofitisacontinuousprocess.
6.2.3 Hawley’s Risk Theory of Profit
TherisktheoryofprofitwaspropoundedbyF.B.Hawleyin1893.Riskinbusinessmayariseforsuchreasonsasobsolescenceofaproduct,suddenfall inprices,non-availabilityofcertaincrucialmaterials, introductionofabettersubstitutebyacompetitor,andrisksduetofire,war,etc.Hawleyregarded risk-taking as an inevitable accompaniment of dynamic production andthosewhotakeriskshaveasoundclaimtoanadditionalreward,knownas“profit”.AccordingtoHawley,profitissimplythepricepaidbysocietyforassumingbusinessrisks.Inhisopinion,businessmenwouldnotassumeriskwithoutexpectingadequatecompensationinexcessofactuarialvalue,i.e.,thepremiumoncalculablerisk.Theywouldalwayslookforareturninexcessofthewagesofmanagementforbearingrisk.Assumingriskgivestheentrepreneuraclaimtoarewardinexcessofactuarialvalueofrisk.Profit,accordingtoHawley,consistsoftwoparts:(i) compensation for actuarial or average loss incidental to the various classes of risks necessarily assumed by theentrepreneur;and(ii) an inducement to suffer the consequences of being exposedtoriskintheirentrepreneurialadventures.
6.2.4 Knight’s Theory of Profit
FrankH.Knighttreatedprofitasaresidualreturntouncertaintybearing,not to risk bearing.Obviously,Knightmade a distinction between riskand uncertainty. He divided risk into calculable and non-calculable risks. Calculable risks are those whose probability of occurrence can be statistically estimatedonthebasisofavailabledata.Forexample,riskduetofire,theft,accidents,etc.arecalculableandsuchrisksareinsurable.Thereremains,however, an areaof risk inwhichprobabilityof riskoccurrences cannot

Theories and Nature of Profit
NOTES
Self-Instructional 138 Material
be calculated.For instance, cost of eliminating competitorsmaynot beaccurately calculable and the strategies of the competitors may not be precisely assessable. The risk element of such incalculable events are not insurable. The area of incalculable risk is the area of uncertainty.
It is in the area of uncertainty that decision-making becomes a crucial function of an entrepreneur and a manager. If his decisions are proved to becorrectbythesubsequentevents,theentrepreneurmakesprofitandvice versa.Thus,accordingtoKnight,profitarisesfromthedecisionstakenandimplemented under the conditions of uncertainty.
6.2.5 Schumpeter’s Innovation Theory of Profit
The innovation theoryofprofitwasdevelopedbyJosephA.SchumpeterHis theoryofprofit is, in fact, the constituentofhis theory of economic development. According tohim,economicdevelopment takesplaceonlywhenthereareinnovationsingoodsandservice,manufacturingtechniques,and methods of supply. Innovations are made and introduced by the business firms tomakepure profit—profit inexcessofnormalprofit. Introductionof innovations creates conditions for additional investment and labour employment and this leads to economic development and generate new businessopportunitiesandalsoforprofit.
Schumpeter developed his theory of economic development by assuming a stationary economic condition in the country. Under the condition ofstationaryequilibrium,demandisequaltosupply,pricesareequaltocost,andtotalrevenueoffirmsisexactlyequaltototalcost.Undertheseconditions,firmsmakeonlynormalprofit,i.e.,managerial wages—there is no pure profit. Pureprofit,i.e.,profitinexcessofmanagement wages, can be made only by makinginnovationsingoodsandservice,manufacturingtechniquesandinthemethodsofsupplygoods.Accordingtohim,innovationsmayinclude: (i) introductionofnewproductsand/orbetterqualitygoodsandservices, (ii) introductionofanewproductiontechnology, (iii) creatingorfindingnewsourcesofrawmaterials, (iv) openingnewmarketsfortheinnovatedproducts,and (v) introductionofamoreefficientandinnovativemanagement.
Thesekindsofinnovationsprovideopportunitiestoinnovativefirmstofixapriceof theirproducthigher than thestaticequilibriumprice. Insimplewords,innovativefirmschargeapricehigherthanproductioncostand hence make a net profit. Thus,accordingtoSchumpeter,innovationisthesourceofprofit.
6.2.6 Monopoly Power as a Source of Profit
Monopolyissaidtobeanothersourceofpureprofit.Monopolycharacterizesa market situation in which there is a single seller of a commodity without a

NOTES
Self-InstructionalMaterial 139
Theories and Nature of Profit
closesubstitute.Monopolymayariseduetosuchfactorsas:(i) economies of scale,(ii)soleownershipofcertaincrucialrawmaterials,(iii) legal sanction andprotection,and(iv) mergers and takeovers.
Amonopolistmayearn‘pureprofit’orwhatisgenerallycalledinthiscase,‘monopolyprofit’,andmaintainitinthelongrunbyusingitsmonopolypowers.Monopolypowersinclude:(i)powerstocontrolsupplyandprice;(ii)powerstopreventtheentryofcompetitorsbypricecutting,and(iii) in somecases,monopolypowertoexercisecontrolovercertaininputmarkets.
Thesepowershelpamonopolyfirmtomakepureprofit(ormonopolyprofit).Insuchcases,monopolyisthesourceofpureprofit.
It may be added at the end that pure monopoly too is a rare phenomenon. Monopolies, wherever they exist, are in the government sector (e.g.,productionandsupplyofelectricity,water,transportservices,etc.)orcomeintoexistencebygovernmentalsanctionandareundergovernmentcontroland regulation.
6.3 DEPRECIATION AND PROFIT
Problems in measuring depreciation arise becuase of the different views and methods suggested by the economists and accountants. Economists view depreciation as capitalconsumption.Fromtheirpointofview,therearetwodistinctwaysofchargingfordepreciation:(i) the depreciation of an equipment must be equal to its opportunity cost,oralternatively,(ii) the depreciation must be equal to replacement cost that will produce comparable earning.
Opportunity cost ofanequipmentis‘themostprofitablealternativeuseofitthatisforegonebyputtingittoitspresentuse’.But,ifequipmenthasnoalternativeuse,theproblemisthenhowtomeasuretheopportunitycost.Onemethodofestimatingopportunitycost,suggestedbyJoeldean,isto measure the fall inthevalueoftheequipmentduringayear.Thismethod,however,cannotbeappliedwhenacapitalequipmenthasnoalternativeuse,likeaharvester,aprintingmachineandahydro-powerproject,etc.Insuchcases,replacement cost is the appropriate measure of depreciation.
From accountants points of view, there are differentmethods ofcharging depreciation over the lifetime of an equipment. The use of different methodsofchargingdepreciationresultsindifferentlevelsofprofitreportedbytheaccountants.Thefirmcanapplyanyofthefollowingfourmethodsofchargingdepreciation:(1)straightlinemethod(2)reducingbalancemethod,(3)annuitymethod,and(4)sum-of-the-year’sdigitapproach.Thesefourmethodsyieldfourdifferentmeasuresofannualdepreciationand,hence,thedifferentlevelsofprofit.Sotheproblemarises‘whatmethodtouse’?

Theories and Nature of Profit
NOTES
Self-Instructional 140 Material
6.4 VALUATION OF STOCK AND PROFIT
Capitalgainsandlossesareregardedas‘windfalls’.Fluctuationinthestockpricesisoneofthemostcommonsourcesof‘windfalls’.Inaprogressivesociety, according toDean, capital losses are, on balance, greater thancapitalgains.Manyofthecapitallossesareofinsurablenature,andwhenabusinessmanover-insures,theexcessinsurancepremiumbecomeseventuallya capital gain. Treatment of capital gains and losses is another problem in profitmeasurement.
Profit is affected by theway capital gains and losses are treatedin accounting.AsDean suggests, “A sound accounting policy to followconcerning windfalls is never to record them until they are turned into cash byapurchaseorsaleofassets,sinceitisneverclearuntilthenexactlyhowlargetheyare…”Inpractice,however,compoaniesfollowadiversemethod.Mostcompaniesdonot recordcapitalgainsuntil it is realized inmoneyterms,buttheydowriteoffcapitallossesfromthecurrentprofit.Itmeans,theytreatcapitalgainsandlossesdifferently.If‘soundaccountingpolicy’isfollowed,therewillbeoneprofit,andiftheothermethodisfollowed,therewillbeanotherfigureofprofit.Thatistheproblem.
Current vs. Historical Costs
Accountantsprepareincomestatementstypicallyintermsofhistoricalcosts,i.e.,theactualpurchaseprice,notintermsofcurrentprice.Thereasonsgivenforthispracticeare:(i) historical costs produce more accurate measurement ofincome,(ii) historical costs are less debatable and more objective than the presentreplacementvalue,and(iii) accountants’ job is to record historical costs whether or not they have relevance for future decision-making. The accountant’s approach ignores certain important changes in earnings and lossesof thefirms,e.g., (a) the value of assets presented in the books of accountsisunderstatedintimesofinflationandoverstatedatthetimeofdeflationand(b)depreciationisunderstatedduringdeflation.Historicalcostrecordingdoesnotreflectsuchchangesinvaluesofassetsandprofits.Thisproblem assumes a critical importance in case of inventories and material stocks. The problem is how to evaluate the inventory and the goods in the pipeline.
Therearethreepopularmethodsofinventoryvaluation:(i)first-in-first-out(FIFO),(ii)last-in-first-out(LIFO),and(iii) weighted average cost (WAC).
Under FIFOmethod,materialistakenoutofstockforfurtherprocessingintheorderinwhichtheyareacquired.Thematerialstocks,therefore,appearinthefirm’sbalancesheetattheiractualcostprice.Thismethodissuitablewhenpricehasaseculartrend.However,thissystemexaggeratesprofitsatthe time of rising prices.

NOTES
Self-InstructionalMaterial 141
Theories and Nature of Profit
The LIFO method assumes that stocks purchased most recently become the costs of the raw material in the current production. If inventory levels arestable,thecostofrawmaterialsusedatanypointinthecalculationofprofitsisalwaysclosetomarketorreplacementvalue.But,wheninventorylevelsfluctuate,thismethodlosesitsadvantages.
TheWACmethodtakestheweightedaverageofthecostsofmaterialspurchased at different prices and different points of time to evaluate the inventory.
Allthesemethodshavetheirownweaknessesand,therefore,theydonotreflectthe‘trueprofit’ofbusiness.Sotheproblemremainsthathowtoevaluateinventoriessothatityieldsatrueprofitfigure.
6.5 PROFIT POLICIES
Makingprofitistheultimateobjectiveofeverybusinessfirm.Thesuccessofafirmislargelymeasuredbytheamountofprofitearnedbyit.Thus,profitmaximizationistheultimateobjectiveofabusinessfirm.However,itistobenotedthatthemodernbusinessfirmsdonotacceptthisviewandholdanotheropinioninthisregard.Also,thisdoesnotimplythatearningprofitisnottheirobjective.Theirentirefocusisnotjustonearningprofitsbutonattainingotherobjectivesaswell.Allthesefactorsconstitutetheprofitpolicy. (i) Industry Leadership: Thismaycompriseeithertheaccomplishmentofthemaximumsales
volumeorthemanufactureofthemaximumproductlines.Inordertobealeaderintheindustry,therehastobeasatisfactorylevelofprofitalongwith capital invested, labour force employed andvolumeofoutput produced.
(ii) Restricting the Entry: Whenabusinessfirmadherestoapolicyofrestrictingitsprofit,no
competitorsareexpectedtoenterthemarket.Reasonableprofitswhichensure its survival and growth are essential.
(iii) Political Impact: Abusinessfirmearninghugeprofitsislikelytocomeunderthescanner
ofthegovernmentandtherebyattractheavyimpositionoftaxuponit. (iv) Consumer Goodwill: Good customer relationship is vital for the survival of every business
firminthemarket.Formaintainingconsumergoodwill,businessfirmshavetorestricttheprofit.Byupholdinglowprofit,thefirmsmaypursuethe goodwill of the consumers.
Theories and Nature of Profit
NOTES
Self-Instructional 142 Material
(v) Wage Consideration: Whenabusinessfirmearnshighprofits,thisimpliesithastheabilityto
payhighwagestoitslabourforce.Ifthefirmdeclareshighdividendsto the shareholders and the labour associations come to know about this,theywillnaturallydemandhigherwages,bonusandsoforth.
(vi) Liquidity Preference: Severalbusinessfirmsimpartgreaterprominencetocapitalsoundness
ofafirmand,hence,preferliquiditytoprofitmaximization.Liquiditypreference means the preference to hold cash to meet the day to day transactions.
(vii) Avoid Risk: Avoidingriskisanotherobjectiveofthemodembusinessforwhich
thefirmshavetorestricttheprofit.Theelementofriskishighunderprofitmaximization.
6.6 PLANNING AND FORECASTING
Theconsistencyofabusinessfirmisreckonedwhenitearnssoundprofitsaswellhandlestherisksaswellsmartly.Afirmisfacedwithanumberofuncertainties.Theseuncertaintiesarelargelyintheformofconsumerneeds,thevariednatureofcompetition,thenatureofmostelementsofcostandtheaspectofcopingupwiththerapidpaceoftechnologicaldevelopments.Attimes,thefirmisuncertainaboutthelikelypatternandtheextentofconsumerdemandforaspecificproductandthisincreasestheriskfacedbythefirm.Thenatureofcompetitionisrelatedtoeitherproduct,priceortobothfactorstogether. Product competition remains poignant till the product reaches the stage of maturity. Price competition begins in the market once the product isestablishedandreachesthematuritystage.Duringthegrowthstage,therisk of a product becoming obsolete is immense and thereby shortening the product life cycle.
The level of risk involved in product competition is greater than in pricecompetition.Whenthepricesrisecontinuously,nofirmcanbesurethat it will be able to manage the internal price changes/rise. This is because it does not have any control over the prices of raw materials or other aspects. Withthepassageoftime,constanttechnologicalenhancementsmaymakeproductioncompletelyoutdated.Ifanimprovedprocessisavailable,afirmcanrestrictitsriskbyneglectingitsfixedinvestment.Ifitdoesnothaveanaccesstotheimprovedprocesses,itmayhavetogooutofbusiness.Hence,afirmhastobefullypreparedtofacetheuncertaintiesbecauseasaresultoftheriskelement,itsprofitswillbechanged.Therefore,toplanforprofits,adetailedunderstandingoftherelationshipofcost,priceandvolumeisveryuseful to business individuals.

NOTES
Self-InstructionalMaterial 143
Theories and Nature of Profit
6.6.1 Calculation of Break Even Point
Theeconomistshavedevelopedanewtechnique,inadditiontocostanalysis,thatcanbeusedtofindanswertothesequestions.Thetechniqueisknownas Break-Even analysis known also as Profit Contribution Analysis and Cost-Volume Profit Analysis. In this section,wediscuss thebreak-even analysis and also its different variants.
6.6.2 Meaning of Break-even Analysis
The break-even analysis is an important analytical technique used to study therelationshipbetweenthetotalcosts, totalrevenueandtotalprofitandloss over the whole range of stipulated output. The break-even analysis is a techniqueofhavingapreviewofprofitprospectsandatoolofprofitplanning.Itintegratesthecostandrevenueestimatestoascertaintheprofitsandlossesassociated with different levels of output.
The relationship between cost and output and between price and output may be linear or non-linear in nature. We shall discuss the break-even analysis under both linear and non-linear revenue conditions.
6.6.3 Linear Cost and Revenue Functions
Toillustratethebreak-evenanalysisunderlinearcostandrevenueconditions,let us assume linear cost and linear revenue functions are given as follows. Costfunction:TC = 100 + 10Q …(6.1)
Revenuefunction:TR = 15Q …(6.2)
ThecostfunctiongiveninEq.(6.1)impliesthatthefirm’stotalfixedcost is given at `100 and its variable cost varies at a constant rate of `10 per unit in response to increase in output. The revenue function given in Eq. (6.2)impliesthatthepriceforthefirm’sproductisgiveninthemarketat`15 per unit of sale.
What the firm needs to carry out the break-even analysis of its businessoperations is tomakeachartof its totalfixedcost (TFC), totalvariablecost(TVC),totalcost(TC)andthetotalrevenue(TR),andgraphthem tofind thebreak-evenpoint.Theprocessofbreak-evenanalysis isillustrated graphically in Fig. 6.1. The line TFC showsthetotalfixedcostat `100foracertainlevelofoutput,andthelineTVC shows the variable cost rising with a slope DTVC/∆Q = 10/1 = 10. The line TC has been obtained by plotting the TC function. It can also be obtained by a vertical summation of TFC and TVC at various levels of output. The line TR shows the total revenue (TR) obtained as Q × P. The TR and TC lines intersect at point B,whereoutput is equal to 20units.ThepointB shows that at Q =20,firm’stotalcostequalsitstotalrevenue.Thatis,atQ =20,TC breaks-even with TR. Point B is,therefore,thebreak-even point and Q = 20 is the

Theories and Nature of Profit
NOTES
Self-Instructional 144 Material
break-evenoutput.Belowthislevelofoutput,TC exceedsTR. The vertical difference between TC and TR,(i.e.,TC–TR) is known as operating loss. Beyond Q =20,TR > TC,andTR–TC isknownasoperatingprofit.
Fig. 6.1 Break-even Analysis: Linear Functions
The break-even output can also be calculated algebraically. We know thatatbreak-evenpoint, TR = TC
Thatis,intermsofTR and TC functions, 15Q = 100 + 10Q 5Q = 100 Q = 20
Thus,20is thebreak-evenoutput.GiventheTR and TC functions,productionbeyond20unitswillyieldincreasingprofits,atleastintheshort-run.Algebra of Break-Even Analysis: The break-even analysis can also be presentedalgebraically.Atbreak-evenvolume,
TR = TCwhere TR = (P × Q) and TC = TFC + TVC.
In break-even analysis TVC isdefinedasTVC = AVC × Q.Thus,TC = TFC + AVC × Q
Now,break-evenquantity(QB) can be obtained as follows. TR = TC
QB ⋅ P = TFC + AVC ⋅ QB …(6.3)

NOTES
Self-InstructionalMaterial 145
Theories and Nature of Profit
where QB = break-even volume.RearrangingEq.(6.3),weget QB ⋅ P – AVC ⋅ QB = TFC
QB(P – AVC) = TFC
QB = TFCP AVC−
…(6.4)
Iffirm’sTFC,AVC and P areknown,QB can be obtained straightaway fromEq.(6.4).Limitations:The theory of break-even analysis, as presented above, isapplicable only if cost and revenue functions are linear. Under the condition of linearcostandrevenuefunctions,TC and TR are straight lines and they intersectatonlyonepoint(asshowninFig.6.1.)dividingthewholerangeof output into two parts—profitable and non-profitable. Itmay give theimpressionthatthewholeoutputbeyondthebreak-evenlevelisprofitable.Inreallife,however,marketconditionskeepchangingduetochangingpriceandcostlevels.Inreality,thecostandrevenuefunctionsmaybenon-linear.Non-linearity arises because AVC and price vary with variation in the output. Asaresult, thetotalcost(TC) may increase at increasing rates while the totalrevenue(TR)increasesatdecreasingrates.Therefore,atsomestageofoutput,TC mayexceedTR.Thus,theremightbetwobreak-evenpoints(asshowninFig.6.2)insteadofone.Thislimitstheprofitablerangeofoutputanddeterminesthelowerandupperlimitsofprofitableoutput.Theanalystshould,therefore,pre-testandverifythevalidityofcostandrevenuefunctionsrather than assuming straightaway the linearity conditions.
6.6.4 Non-linear Cost and Revenue Functions
Let us now describe the break-even analysis under non-linear cost and revenue functions. The non-linear functions are presented in Fig. 6.2. TFC lineshowsthefixedcostatOF and the vertical distance between TC and TFC measuresthetotalvariablecost(TVC). The curve TR shows the total saleproceedsorthetotalrevenue(TR) at different levels of output and price. The vertical distance between the TR and TC measurestheprofitorlossforvarious levels of output.
AsshowninFig.6.2,TR and TC curvesintersectattwopoints,B1 and B2,whereTR = TC. These are the lower and upper break-even points. For the whole range of output between OQ1 and OQ2,totalrevenue(TR) is greater thantotoalcost(TC).Thisisprofit-makingrangeofoutput.ItimpliesthatafirmproducinganoutputmorethanOQ1 and less than OQ2willmakeprofits.Inotherwords, theprofitablerangeofoutput liesbetweenOQ1 and OQ2 units of output. Producing less or more than these limits will result in losses.

Theories and Nature of Profit
NOTES
Self-Instructional 146 Material
Fig. 6.2 Break-even Analysis: Non-linear Functions
6.6.5 Contribution Analysis
Break-even charts can also be used for measuring the contribution made bythebusinessactivitytowardscoveringthefixedcosts.Forthispurpose,variablecostsareplottedbelowthefixedcostsasshowninFig.6.3.Fixedcostsareaconstantadditiontothevariablecosts.Inthatcase,thetotalcostline will run parallel to the variable cost line.
Fig. 6.3 Contribution Analysis
The‘contributionisthedifferencebetweentotalrevenueandvariablecosts’arisingoutofabusinessdecision.Atthebreak-evenlevelofoutputOQ inFig.6.3,contributionequalsfixedcosts.BelowtheoutputOQ,thetotalcontributionislessthanthefixedcost.Thisamountstolosstothefirm.Beyond output OQ,contributionexceedsfixedcost.ThedifferencebetweenTR and VC is the contribution towards profits resulting froma businessdecision.

NOTES
Self-InstructionalMaterial 147
Theories and Nature of Profit
Fig. 6.4 Profit Contribution Analysis
Sometimes,contributionoveratimeperiodisplottedinordertoindicatethecommitmentthatthemanagementhasmadeforfixedexpenditure,andtofindthelevelofoutputfromwhichitwillberecoveredandprofitwillbegin to emerge. This kind of contribution analysis is graphically presented inFig.6.4.AtoutputOQ,contributionequalsfixedcost.BeyondoutputOQ,contributionincludesnetprofit.
6.6.6 Profit: Volume Ratio
Theprofitvolume(PV)ratioisanotherhandytoolusedtofindtheBEP for sales,speciallyforthemulti-productfirms.TheformulaforPV ratio is given below.
PV Ratio= 100S VS− ×
where S =Sellingprice,andV =Variablecosts(average).Forexample,ifsellingprice(S) = `5andvariablecost(V) = `4 per
unit,then,
PV Ratio= 5 4 1005− × = 20 per cent
Thebreak-evenpoint(BEP) of sales value is calculate by dividing the fixedexpensesbyPV ratio as follows.
BEP (Salevalue)=FixedExpenses
RatioPV
Forexample,giventhesellingpriceat`5perunit,averagevariableexpensesat`3perunitandfixedexpenses(F) of `4,00prmnth,BEP (salevalue) is calculated as follows.

Theories and Nature of Profit
NOTES
Self-Instructional 148 Material
BEP (SaleValue)= FixedExpensesRatioPV or 4000
( ) (5 3)5
FS V
S− −=
= = `10,000
The break-even sale volume can also be calculated by using the ontributin per unit of sale by the following formula.
BEP (SaleValue)=Fixed Expenses
Contribution per unit
BEP = 4000 4000(5 – 3) 2
= =2,000units
The PV ratioisnotonlyhelpfulinfindingthebreak-evenpointbutitcan also be used for making a choice of the product.
Ifthereisnotimeconstraint,thechoiceshouldalwaysbeforaproductthat assures a higher PV ratio.Otherwise,PV ratio per time unit is taken as thebasisofchoice.Forexample,supposetwoproductsA and B involve the following variable cost and selling price.
Products A B
Sellingpriceperunit(`) 2 2.5 Variablecostpeunit(`) 1 1.5
Machine hour per unit 2 1.0
PV ratio for A = Selling Price – Variable cost
Selling price × 100
= 2 – 12 × 100 = 50 per cent
Therefre,foreachmachinehour,PV Ratio=50/2=25percent
PVRatioforB 2.5 – 1.5 1002.5
× = 100 = 40 per cent
Therefore,foreachmachinehour,PV Ratio=40percent.Inthiscase,product B is preferable to product A.
It may be noticed that break-even charts are good for displaying information. The same information is available from simple calculations.
6.6.7 Use of Break-Even Analysis
(i) Sales volume can be determined to earn a given amount of return on capital. (ii)Profitcanbeforecastifestimatesofrevenueandcostareavailable. (iii)Effectofchangeinthevolumeofsales,saleprice,costofproduction,
can be appraised.

NOTES
Self-InstructionalMaterial 149
Theories and Nature of Profit
(iv) Choice of products can be made from the available alternatives. Product-mixcanalsobedetermined.
(v) Impact of increase or decrease in fixed and variable costs can behighlighted.
(vi)Effectofhighfixedcostsandlowvariablecoststothetotalcostcanbe studied.
(vii)Validinter-firmcomparisonsofprofitabilitycanbemade.(viii) Cash break-even chart helps proper planning of cash requirements. (ix)Break-evenanalysisemphasizestheimportanceofcapacityutilization
for achieving economies. (x) Further help is provided by margin of safety and angle of incidence.
6.6.8 Limitations of Break-even Analysis
We have discussed above that the break-even analysis is based on linear assumptions. The linearity assumption can be removed by pre-testing the cost andrevenuefunctionsandbyusing,ifnecessary,thenon-linearityconditions.Nevertheless,thebreak-evenanalysisassuchhascertainotherlimitations.
First,thebreak-evenanalysiscanbeappliedonlytoasingleproductsystem.Under the condition ofmultiple products and joint operations,the break-even analysis can be applied only if product-wise cost can be ascertainedwhichis,ofcourse,extremelydifficult.
Second,break-evenanalysiscannotbeappliedusefullywherecostandprice data cannot be ascertained beforehand and where historical data are notrelevantforestimatingfuturecostsandprices.Despitetheselimitations,the break-even analysis may serve a useful purpose in production planning if relevant data can be easily obtained.
Check Your Progress
1.WhatarethetwopartsofriskaccordingtoF.B.Hawley? 2.Whatarethefactorsresponsiblefortheriseofmonopoly?
6.7 ANSWERS TO CHECK YOUR PROGRESS QUESTIONS
1.ThetwopartsofriskaccordingtoF.B.Hawleyare(i) compensation for actuarial or average loss incidental to the various classes of risks necessarilyassumedbytheentrepreneur;and(ii) an inducement to suffertheconsequencesofbeingexposedtoriskintheirentrepreneurialadventures.

Theories and Nature of Profit
NOTES
Self-Instructional 150 Material
2.Monopolymayariseduetosuchfactorsas:(i)economiesofscale, (ii)soleownershipofcertaincrucialrawmaterials,(iii) legal sanction andprotection,and(iv) mergers and takeovers.
6.8 SUMMARY
•OneofthemostwidelyknowntheoriesofprofitwaspropoundedbyF.A.Walker.Accordingtohim,profitistherentof“exceptionalabilitiesthat an entrepreneur may possess” over others.
•TherisktheoryofprofitwaspropoundedbyF.B.Hawleyin1893.Riskinbusinessmayariseforsuchreasonsasobsolescenceofaproduct,sudden fall in prices, non-availability of certain crucialmaterials,introductionofabettersubstitutebyacompetitor,andrisksduetofire,war,etc.
• FrankH.Knighttreatedprofitasaresidualreturntouncertaintybearing,nottoriskbearing.Obviously,Knightmadeadistinctionbetweenriskand uncertainty.
•TheinnovationtheoryofprofitwasdevelopedbyJosephA.Schumpeter7
Histheoryofprofitis,infact,theconstituentofhistheory of economic development.
•Monopoly is said to be another source of pure profit.Monopolycharacterizesamarketsituationinwhichthereisasinglesellerofacommodity without a close substitute.
•Capitalgainsandlossesareregardedas‘windfalls’.Fluctuationinthestockpricesisoneofthemostcommonsourcesof‘windfalls’.
•Abusinessisconsideredtobesoundifitincludesconsistencyinearningprofitwhileconsideringthevariousrisksaswell.
• The break-even analysis is an important analytical technique used to studytherelationshipbetweenthetotalcosts,totalrevenueandtotalprofitandlossoverthewholerangeofstipulatedoutput.
6.9 KEY WORDS
• Operating loss: It is the state in which a company’s operatingexpensesexceeditsincomeforagivenperiodoftime,usuallyaquarterorayear.
• Capital gain: It is a rise in the value of a capitalasset(investmentorreal estate) that gives it a higher worth than the purchase price.
• Opportunity cost: It is an economics term that refers to the value of what you have to give up in order to choose some other option in its place.
NOTES
Self-InstructionalMaterial 151
Theories and Nature of Profit6.10 SELF ASSESSMENT QUESTIONS AND
EXERCISES
Short-Answer Questions
1.Writeshortnotesonthefollowing: (a) Walker’sTheoryofProfit (b) Knight’sTheoryofProfit 2.Howdoesmonopolyfunctionasasourceofpureprofit? 3. State the limitations of break-even analysis.
Long-Answer Questions
1.Discusstheconceptofvaluationofstockandprofit. 2.Explaintheapplicationofthebreak-eventechnique. 3. Describe the uses of break-even analysis.
6.11 FURTHER READINGS
Dwivedi,D.N.2008.Principles of Economics,SeventhEdition.NewDelhi:Vikas Publishing House.
Weil. David N. 2004. Economic Growth.London:AddisonWesley.Thomas, Christopher R. andMaurice S. Charles. 2005.Managerial
Economics: Concepts and Applications,EighthEdition.NewDelhi:Tata McGraw-Hill Publishing Company Limited.
Mankiw,GregoryN.2002.Principles of Economics,SecondEdition.India:Thomson Press.

Managerial Decision Making
NOTES
Self-Instructional 152 Material
UNIT 7 MANAGERIAL DECISION MAKING
Structure 7.0 Introduction 7.1 Objectives 7.2 AnalysisofDecisionsandClassificationofManagerialDecisionProblems
7.2.1 MicroeconomicTheoriesAppliedtoInternalIssues 7.2.2 MacroeconomicsAppliedtoBusinessDecisions 7.2.3 MacroeconomicFactors 7.2.4 DecisionTheory
7.3 Risk and Uncertainty 7.3.1 MeaningofRisk 7.3.2 MeaningofUncertainty 7.3.3 ProbabilityTheorems
7.4 AnswerstoCheckYourProgressQuestions 7.5 Summary 7.6 Key Words 7.7 SelfAssessmentQuestionsandExercises 7.8 FurtherReadings
7.0 INTRODUCTION
The scopeofmanagerial economics is comprisedof economic concepts,theoriesandtoolsofanalysisthatcanbeappliedintheprocessofbusinessdecisionmakingtoanalysebusinessproblems,toevaluatebusinessoptions,to assess the business prospects,with the purpose offinding appropriatesolutiontobusinessproblemsandformulatingbusinesspoliciesforfuture.Asnotedabove,economic sciencehastwomajorbranches,viz.,microeconomics and macroeconomics. Inthisunit,youwillstudyaboutmanagerialdecisionmaking,riskanduncertainty,decisiontheory,classificationofmanagerialdecisionproblemsandprobabilitytheorems.
7.1 OBJECTIVES
Aftergoingthroughthisunit,youwillbeableto: •Discusstheapplicationofmacroeconomicstobusinessdecisions •Defineriskanduncertainty •Explainprobabilitytheorems
NOTES
Self-InstructionalMaterial 153
Managerial Decision Making7.2 ANALYSIS OF DECISIONS AND
CLASSIFICATION OF MANAGERIAL DECISION PROBLEMS
BothMicroeconomicsandMacroeconomicsareappliedtobusinessanalysisandbusinessdecisionmakingdependingon thenatureof the issue tobeexamined.Managerialdecisionissuescanbedividedbroadlyundertwobroadcategories:(a) Internal managerial issuesand(b) External environmental issues.
Inbrief,microeconomictheoriesandanalyticaltoolsareappliedtointernal managerial or operational issues andmacroeconomictheoriesandanalyticaltechniquesareappliedtoassesstheexternal and environmental issues.Letusnowlookatthenatureandareasofinternalmanagerialissuesandenvironmentalissuesandhowmicroandmacro-economictheoriesareappliedtoresolvethebusinessissues.
7.2.1 Microeconomic Theories Applied to Internal Issues
Internal managerial issues refer todecision-making issues arising in themanagementofthefirm.Internalmanagerialissuesincludeproblemsthatariseinoperatingthebusinessorganization.Allsuchmanagerialissuesfallwithinthepurviewandthecontrolofthemanagers.Someofthebasicinternalmanagementissuescanbelistedasfollows. •Whattoproduce—choiceofthebusiness •Howmuchtoproduce—determiningthesizeofthefirm •Howtoproducechoiceofefficientandaffordabletechnology •Howtopricetheproduct—determiningthepriceoftheproduct •Howtopromotesaleoftheproduct •Howtofacepricecompetitionfromthecompetingfirms •Howtoenlargethescaleofproduction—planningnewinvestment •Howtomanageprofitandcapital.
Themicroeconomictheoriesandtoolsofanalysisthatprovidealogicalbasisandwaysandmeanstofindareasonablesolutiontobusinessproblemsconstitute themicroeconomic scopeofmanagerial economics.Themainmicroeconomictheoriesthatfallwithinthescopeofmanagerialeconomicsarefollows:Theory of consumer demand: Theoryofconsumerdemandanalyses thedecision-makingbehaviouroftheconsumers.Thedecision-makingbehaviouroftheconsumerrelatestosuchquestionsas:howconsumersdecidewhattoconsume;howmuchtoconsume;howmuchtobuy,andhowconsumersreacttochangeinpriceoftheproductstheyconsumeandpriceoftheirsubstitutes.

Managerial Decision Making
NOTES
Self-Instructional 154 Material
Demandtheorycombinedwithquantitativetoolshelpsinassessingthetotaldemandforaproductatdifferentprices.Thus,theconsumerdemandtheoryhelpsindeciding‘whattoproduce’.Theory of production: Theoryofproductionanalysesthenatureofinput-outputrelationship.Itexplainshowoutputchangeswithchangeininputs—labourorcapital—giventhetechnology.Itprovidesguidanceinthechoiceoftechnologyandinmaximizingtheoutputfromtheresourcesofthefirm.Thus,theknowledgeandapplicationofthetheoryofproductionhelpsindeterminingtheoptimumlevelofproduction,thesizeofthefirm,andtheemploymentoflabourandcapital.Theory of cost: Theoryofcostanalysisthenatureandpatternofchangeincostofproductionwithchangeinoutput.Specifically,theoryofcostrevealsthechangeintotal,marginalandaveragecostofproduction.Applicationofcosttheoryhelpsinknowingthecostbehaviourwithincreaseinproductionandindeterminingtheoutputthatminimizestheaveragecostproduction.Inviewofprofit-maximizationobjective,thistheoryhelpsindeterminingtheprofitmaximizingoutput,givethepriceoftheproduct.Theory of price determination: Thetheoryofpricedeterminationoffersan analysis of howprice is determined under different kinds ofmarketconditions.Market conditions are determined on the basis of degree ofcompetition between the firms of the industry—perfect competition,monopolistic competition, oligopoly andmonopoly.The theory of pricedeterminationcombinedwiththecosttheoryhelpsfirmsindeterminingtheprofitmaximizingpriceoftheirproduct.Theory of capital and investment decisions: Capital is the foundationofbusinessfirms.Anefficientmanagementofcapital isoneof themostimportantfunctionsofthemanagersasitisthedeterminantofthesuccessof thefirm.Themajorissuesincapitalmanagementare(i) thechoiceofinvestmentavenues,(ii)assessingtheefficiencyandproductivityofcapitalinvestmentavenues,and(iii)makingthechoiceofmostefficientinvestmentproject.Thetheoryofcapitalcontributesagreatdealinmakingappropriateinvestmentdecisions.
7.2.2 Macroeconomics Applied to Business Decisions
Asnotedabove,macroeconomics is thestudyofeconomicconditionsoftheeconomyasawholewhereasafirmisasmallunitoftheeconomy.Assuch,macroeconomic theories are not directly applicable tomanagerialdecisions.However,businessmanagers,whilemakingbusinessdecisions,cannotassumetheeconomicconditionsofthecountrytoremainthesamefor ever.As amatter of fact, economic conditions of the country keepchanging.Changingeconomicconditionschangetheeconomicenvironmentof the country, and therebybusiness environment andbusiness prospect.And,asmanagementexpertsWeihrichandKoontzpointout,“...managers
NOTES
Self-InstructionalMaterial 155
Managerial Decision Making
cannotperformtheirtaskwellunlesstheyhaveanunderstandingof,andareresponsivetothemanyelementsoftheexternalenvironment—economic,technological,social,political,andethicalfactorsthataffecttheirareasofoperations.”Therefore,whilemakingbusiness decisions,managers havetotakeintoaccounttheeconomicenvironmentofthecountry.Thefactorswhich,ingeneral,determinetheeconomicenvironmentofacountryare(i) thegeneraltrendinnationalincome(GDP),savingandinvestment,prices,employment,etc.,(ii)thestructureandroleofthefinancialinstitutions,(iii) thelevelandtrendinforeigntrade,(iv)economicpoliciesofthegovernment,(v)socio-economicorganizationsliketradeunions,consumerassociations,and(vi)politicalenvironment.
Itisfarbeyondthepowersofasinglefirm,howsoeverlargeitmaybe, to determine the course of economic, political and social conditionsofthecountry.Buttheenvironmental factorshaveafarreachingbearingon the functioning and performance of the businessfirms.Therefore, itis essential for businessdecision-makers to take inview thepresent andfutureeconomicenvironmentofthecountry.Itisessentialbecausebusinessdecisions taken ignoring the environmental factorsmaynot only fail toproducetheresultbutmayalsocauseheavylosses.ThisiswhathappenedincaseofestablishingaSEZinNandigramandTata’ssmallcarprojectinSingrurdistrictofWestBengalin2009–10.Therefore,whiletakingdecisionregardingforwardplanningandprogrammeson(a)expandingthescaleofproduction,(b)settingupnewplants,and(c)introductionofnewproducts.Themajormacroeconomic issuesand factors thatbusinessmanagersaresupposedtotakeinviewwhilemakingdecisionswithlong-termimplicationsaredescribedherebriefly.
7.2.3 Macroeconomic Factors
Themajormacroeconomic environmental factors thatfigure in businessdecisions,especiallythoserelatedtoforwardplanningandformulationofstrategy,maybedescribedunderthefollowingthreecategories.1. Trend in the Economy: Theoveralltrendintheeconomyisdeterminedbythetrendinmacroeconomicfactors,viz.,Grossnationalproduct(GNP),economic growth rate, saving and investment, saving and investment,generalpricelevel,employment,andinvestmentclimate.Thetrendinthesefactorsdeterminesthefutureprospectofbusinesscorporations.Forexample,economic slowdown in the Indian economy and a high rate of inflationduring2012–12hasledtodeclineindemandandhencedeclineinindustrialproductionfrom4.3percentin2012to2.2percentinQ2of2013.Therefore,firmsplanningtoexpandtheirsizeortosetupanewunittaketheviewofthegeneraltrendintheeconomyanddemandlevelanditseffectonthedemandfortheirproduct.Acomprehensiveviewofthesefactorscanbeobtainedbyusingmacroeconomicconceptsandtheories.

Managerial Decision Making
NOTES
Self-Instructional 156 Material
2. International Economic Conditions: Business corporations involvedin foreign tradeandfinancial transactions are affecteddirectly andmoreheavily than the rest of thedomestic economyby thefluctuations in theinternationaleconomy.Fluctuationsintheinternationaltrade,exchangerateandfinancialflowsaffecttheeconomyofinterrelatedcountriesand,thereby,thebusinesscorporations.Forexample,the‘sub-primfinancialcrisis’oftheUSin2008–09ledtocollapseoftheEuropeancountriesandcauseddeclineingrowthrateofChinaandIndia.Thedeclineingrowthratehasadverseimpactonthedomesticindustries.Therefore,itisintheinterestofthebusinesscorporationshavinginternationaltransactionstotakeacomprehensiveviewoftrendsintheglobaleconomy.Internationaleconomicswhichconstitutesabranchofmacroeconomicsprovidesguidelinesforassessingtheinternationaleconomicconditions.3. Government Policies: Government’s economic policies, especiallymonetary,fiscal,industrialandforeigntradepolicies,playacrucialroleindeterminingtheinternaleconomicenvironmentofthecountry.Economicpolicies affect functioningof the businessfirms adversely or favourablydependingonpolicyobjectives.Therefore,whiletakingbusinessdecisions,businessmanagersarerequiredtohavetheknowledgeofhowgovernment’seconomicpoliciescanaffecttheirbusiness.Macroeconomictheoriesprovidethetheoreticalframeworkandanalyticalmodelstomeasuretheeffectsofgovernmentpolicies.
In brief, the scope ofmanagerial economics consists of economictheories,toolsofanalysis,conceptsandmethodologythatcanbeappliedtomanagerial decisionmaking. Economics has twomajor branches—microeconomics andmacroeconomics.Themain economic theories andtoolsofanalysisofbothmicroeconomicsandmacroeconomicsconstitutethesubjectmatterofmanagerialeconomics.Microeconomic theories and analytical tools are applied to business decision pertaining to internalmanagement problems like the choice of product, technology, quantityofproduct,priceof theproduct,scaleofproductioninfuture,methodoffacingcompetitionandpromotionofsales,etc.Macroeconomictheoriesandanalyticalmethodsareappliedtoexternalenvironmentalissueslikeassessingthepresentandfutureeconomicconditionsofthecountry,growthprospects,pricelevelandbusinessprospects.
7.2.4 Decision Theory
Frameworkoflogicalandmathematicalconcepts,aimedathelpingmanagersinformulatingrulesthatmayleadtoamostadvantageouscourseofactionunderthegivencircumstances.Decisiontheorydividesdecisionsintothreeclasses(1)Decisionsundercertainty:Underthis,amanagerhasfartoomuchinformationtochoosethebestalternative.(2)Decisionsunderconflict:Underthis,amanagerhastoanticipatemovesandcounter-movesofoneormorecompetitors.(3)Decisionsunderuncertainty:Underthis,amanagerhasto

NOTES
Self-InstructionalMaterial 157
Managerial Decision Making
findoutalotofdatatomakesenseofwhatisgoingonandwhatitisleadingto.Seealsogametheory.
7.3 RISK AND UNCERTAINTY
Certaintyisthestateofperfectknowledgeaboutthemarketconditions.Inthestateofcertainty,thereisonlyonerateofreturnontheinvestmentandthatrateisknowntotheinvestors.Thatis,inthestateofcertainty,theinvestorsarefullyawareoftheoutcomeoftheirinvestmentdecisions.Forexample,ifyoudeposityoursavingsin‘fixeddeposit’bearing10%interest,youknowforcertainthatthereturnonyourinvestmentintimedepositis10%,andFDR canbeconvertedintocashanyday.Or,ifyoubuygovernmentbonds,treasurybills,etc.bearinganinterestof11%,youknowforsurethatthereturnonyourinvestmentis11%perannum,yourprincipalremainingsafe.Ineithercase,youaresurethatthereislittleornopossibilityofthebankorthegovernmentdefaultingoninterestpaymentoronrefundingthemoney.Thisiscalledthestate of certainty.
Inreality,however,thereisavastareaofinvestmentavenuesinwhichtheoutcomeofinvestmentdecisionsisnotpreciselyknown.Theinvestorsdonotknowpreciselyorcannotpredictaccuratelythepossiblereturnontheirinvestment.Someexampleswillmakethepointclear.SupposeafirminvestsinR&Dtoinnovateanewproductandspendsmoneyonitsproductionandsale.ThesuccessoftheproductinacompetitivemarketandthereturnoninvestmentinR&Dandinproductionandsaleoftheproductcanhardlybe predicted accurately.There is, therefore, an element of uncertainty.Consideranotherexample.Supposeacompanydoublesitsexpenditureonadvertisementofitsproductwithaviewtoincreasingitssales.Whethersaleswilldefinitelyincreaseproportionatelyorotherwaycanhardlybeforecastwithahighdegreeofcertainty,foritdependsonanumberofunpredictableconditions.Consideryetanotherexample.MarutiUdyogLimited(MUL) decidedinJuly2000toinvestmoneyinfinancingthesaleofitsowncarswithaviewtopreventingthedownslideinitssaleswhichithadexperiencedoverthepasttwoyears.However,themanagersofMULcouldhardlyclaimtheknowledgeoforpredicttheoutcomeofthisdecisionaccurately.Sothisdecision involves risk and uncertainty.Inreallifesituations,infact,alargenumber of business decisions are takenunder the conditions of risk anduncertainty, i.e., the lackofpreciseknowledgeabout theoutcomeof thebusinessdecisions.Letusnowlookintotheprecisemeaningofthetermsrisk and uncertainty in business decisions.
7.3.1 Meaning of Risk
Incommonparlance,riskmeansalowprobabilityofanexpectedoutcome.Frombusinessdecision-makingpointofview,riskreferstoasituationin

Managerial Decision Making
NOTES
Self-Instructional 158 Material
whichabusinessdecisionisexpectedtoyieldmorethanoneoutcomeandtheprobabilityofeachoutcomeisknowntothedecisionmakersoritcanbereliablyestimated.Forexample,ifacompanydoublesitsadvertisementexpenditure,therearefourprobableoutcomes:(i)itssalesmaymore-than-double, (ii) theymay justdouble, (iii) increase insalesmaybe less thandouble,and(iv)salesdonotincreaseatall.Thecompanyhasestimatedtheprobabilitiesofthefourpossibleoutcomesonthebasisofitspastexperienceas(i)more-thandouble–20%(or0.2),(ii)almostdouble–40%(or0.4),(iii)less-thandouble–50%(or0.5)and(iv)noincrease–10%(or0.1).Itmeansthatthereis80%riskinexpectingmore-than-doubleincreaseinsales,and60%riskinexpectingdouleincreaseinsales,andsoon.
Therearetwoapproachestoestimatingprobabilitiesofoutcomesofabusinessdecision,viz.,(i) a priori approach,i.e.,theapproachbasedondeductive logic or intuition and (ii) posteriori approach, i.e., estimatingtheprobabilitystatisticallyonthebasisofthepastdata.Incaseofa priori probability,weknowthatwhenacoinistossed,theprobabilitiesof‘head’or‘tail’are50:50,andwhenadiceisthrown,eachsidehas1/6chancetobeonthetop.Theposterioriassumesthattheprobabilityofaneventinthepastwillholdinfuturealso.Theprobabilityofoutcomesofadecisioncanbeestimatedstatisticallybywayof‘standarddeviation’and‘coefficientofvariation’.
7.3.2 Meaning of Uncertainty
Uncertainty refers to a situation in which there is more than one outcome of a business decision and the probability of no outcome is known nor can it be reliably estimated.Theunpredictabilityofoutcomemaybeduetolackofreliablemarketinformation,inadequatepastexperience,andhighvolatilityofthemarketconditions.Forexample,ifanIndianfirm,highlyconcernedwithpopulationburdenonthecountry,inventsanirreversiblesterilitydrug,theoutcomeregardingitssuccessiscompletelyunpredictable.Considerthecaseofinsurancecompanies.Itispossibleforthemtopredictfairlyaccuratelytheprobabilityofdeathrateofinsuredpeople,accidentrateofcarsandotherautomobiles,rateofbuildingscatchingfire,andsoon,butitisnotpossibletopredictthedeathofaparticularinsuredindividual,aparticularcarmeetinganaccidentoraparticularhousecatchingfire,etc.
Thelong-terminvestmentdecisionsinvolveagreatdealofuncertaintywithunpredictableoutcomes.But,inreality,investmentdecisionsinvolvinguncertaintyhavetobetakenonthebasisofwhateverinformationcanbecollected,generatedand‘guesstimated’.Forthepurposeofdecision-making,theuncertaintyisclassifiedas: (a) completeignorance,and (b) partialignorance.

NOTES
Self-InstructionalMaterial 159
Managerial Decision Making
In case of complete ignorance,investmentdecisionsaretakenbytheinvestorusingtheirownjudgementorusinganyoftherationalcriteria.Whatcriterionhe choosesdependsonhis attitude towards risk.The investor’sattitudetowardsriskmaybethatof (i) ariskaverter, (ii) a risk neutral or (iii) a risk seeker or risk lover.
Insimplewords,ariskaverteravoidsinvestmentinhigh-riskbusiness.Arisk-neutralinvestortakesthebestpossibledecisiononthebasisofhisjudgement,understandingofthesituationandhispastexperience.Hedoeshisbestandleavestheresttothemarket.Ariskloverisonewhogoesbythedictumthat‘thehighertherisk,thehigherthegain’.Unlikeothercategoriesofinvestors,heprefersinvestmentinriskybusinesswithhighexpectedgains.
In case of partial ignorance,ontheotherhand,thereissomeknowledgeaboutthefuturemarketconditions;someinformationcanbeobtainedfromtheexpertsinthefield,andsomeprobabilityestimatescanbemade.Theavailableinformationmaybeincompleteandunreliable.Underthiscondition,thedecision-makers use their subjective judgement to assign ana priori probabilitytotheoutcomeorthepay-offofeachpossibleactionsuchthatthe sum of such probability distribution is always equal to one.Thisiscalledsubjective probability distribution.Theinvestmentdecisionsaretakeninthiscaseonthebasisofthesubjective probability distribution.
7.3.3 Probability Theorems
Incontrastwiththemethodsdiscussedabove,theprobabili ty theory method considersawholerangeofpossiblerisk-returncombinationswhichrepresentadequately the full rangeof alternativeoutcomesof a riskyundertaking.Therefore,itisnecessarytoconsideralargenumberofalternativecash-flowsandtheassociatedprobabilities,foreachtimeperiodunderconsideration.TheprocessisillustratedinTable.7.1.
Table 7.1 Alternative Cash-Flows and Associated Probabilities Alternative 1st Year 2nd Year 3rd Year Cashflows
(`) Probability Expected Probability Expected Probability Expected Returns Returns Returns 1000 0.50 500 0.50 500 0.70 700
2000 0.25 500 0.40 800 0.30 600
3000 0.15 450 0.10 300 0.00 —
4000 0.10 400 0.00 — 0.00 —
Total 1.00 1850 1.00 1600 1.00 1300

Managerial Decision Making
NOTES
Self-Instructional 160 Material
Asthetableshows,giventhealternativecash-flowsandtheassociatedprobabilities,theexpectedreturnswithprobability1are 1850inthe1styear,`1600inthe2ndyearand 1300inthe3rdyear.Theseexpectedreturnsmaynowbediscountedtotheirpresentvalue.Therestofthedecisionprocedureisthesameasincaseofdiscountedpresentvaluecriterion.Limitations.Theprobabilitytheorymethodhasalimitedapplication.Itcanbeappliedonlyifalargenumberofsimilarinvestmentsaretobeundertakenandifoneprojectfailstoyieldtheexpectedreturn,othersfaringsowellthatthelossismorethancompensated.Thismethodismoreappropriateforin-surancepolicies.Amongtheinsurancepolicy-holders,onlyafewdiebeforethe terminal date of insurancepolicy.Only in these cases, the insurancecompanysuffersaloss.But,sincemostpolicy-holderssurvivetillthematuritydateofthepolicy,theinsurancecompanymakesprofitswhichmorethancompensateforthelosscausedbythedeathofsomepolicy-holdersbeforethepolicymatures.
Probability Theory Approach and Portfolio Selection: Markowitz Approach
Despite its limitations, the probability theorymethod has a great dealof application to the problemof portfolio selection of securities, i.e., indetermining the optimum combination of stocks, bonds, governmentsecuritiesandotherfinancial instruments.Theapplicationof thismethodtotheproblemofportfolioselectionisanexemplarycase.Inhisapproach,Morkowitzhasutilizedtwofocalmeasures:(i)anindexofexpectedreturns,and(ii)anindexofrisk.Theindexofexpectedreturnscanbeconstructedbycomputingtheaverageexpectedearning.Theindexofriskisconstructedonthebasisofstandarddeviationoftheexpectedearning.Thenaseriesofcombinationsofriskandreturncanbeformedfordifferentkindsoffinancialinstruments.Thesecombinationswhengraphedgivearisk-returnprobabilitycurve,showingthevariousratesofreturnandtheassociatedrisk,asshownbythecurveRPinFig.7.1.Thiscurveshowsthevariouscombinationsofreturnratesandtheassociatedrisk.
Fig. 7.1 Risk-Earning Combination

NOTES
Self-InstructionalMaterial 161
Managerial Decision Making
ThecurveRPiscalledtherisk-earning possibility curve.ThevariouspointsonthecurveRPrepresent,inasense,theoptimalcombinationsofriskandreturn:thelowertherisk,thelowerthereturnandthehighertherisk,thehigherthereturn.Assuch,a priorichoiceofaparticularpointwillbearbitrary.Thosewhopreferlowerriskandlowerincomewouldchooseapointonthelowerpartofthecurve,e.g.,pointL,andthosewhopreferhigherriskandhigherreturnwouldchoosepointH.Thispatternofportfolioselectiondoesnotprovideanoptimalcombinationofstocksandsecurities.
Theoptimalcombinationofportfoliocan,however,bedeterminedbysuperimposingarisk-return indifference map onthesamefigure,asshownby curves I1, I2 and I3. It is not impossible, at least inprinciple, todrawrisk-returnindifferencecurvesfortheprospectiveinvestors.Therisk-returnindifferencecurveswould,ofcourse,beinvertedascomparedwithstandardindifference curves used in consumer’s analysis or isoquant curves usedintheanalysisofoptimalinput-combination.Contrarytotheindifferencecurvesandisoquants,theriskreturnindifferencecurves(I1,I2 and I3)haveapositiveslopebecauseastheriskincreases,arelativelyhigherrateofreturnmustbeassociatedwithittokeeptheinvestorindifferentbetweenthelowerandhigherrisk-returncombinations.
Giventhepropertiesoftherisk-earningpossibilitycurveandtherisk-return indifferencecurves,oneof the latter isbound tobe tangent to theformer.Suchasitis,theoptimal combination of portfolioisdecidedbythepointoftangencybetweentherisk-returnpossibilitycurveandtherisk-returnindifferencecurve.TheoptimalcombinationisshownbypointTinFig.7.1.Thispropositionis,however,onlyatheoreticalsolutiontotheproblemofportfolioselection.Inpractice,itdependstoagreatextentontheattitudeoftheinvestorstowardstherisk.
Check Your Progress
1.Whatarethemajorissuesincapitalmanagement? 2.Listthebasicinternalmanagementissues. 3.Namethetwotypesofuncertainty.
7.4 ANSWERS TO CHECK YOUR PROGRESS QUESTIONS
1.Themajorissuesincapitalmanagementare(i)thechoiceofinvestmentavenues, (ii) assessing the efficiency and productivity of capitalinvestment avenues, and (iii)making the choice ofmost efficientinvestmentproject.

Managerial Decision Making
NOTES
Self-Instructional 162 Material
2.Someofthebasicinternalmanagementissuescanbelistedasfollows. •Whattoproduce—choiceofthebusiness •Howmuchtoproduce—determiningthesizeofthefirm •Howtoproducechoiceofefficientandaffordabletechnology •Howtopricetheproduct—determiningthepriceoftheproduct •Howtopromotesaleoftheproduct •Howtofacepricecompetitionfromthecompetingfirms •Howtoenlargethescaleofproduction—planningnewinvestment •Howtomanageprofitandcapital. 3.The two types of uncertainty are complete ignorance and partial
ignorance.
7.5 SUMMARY
• Internalmanagerialissuesrefertodecision-makingissuesarisinginthemanagementofthefirm.Internalmanagerialissuesincludeproblemsthatariseinoperatingthebusinessorganization.
•Themicroeconomic theories and tools of analysis that provide alogical basis andways andmeans tofind a reasonable solution tobusinessproblemsconstitutethemicroeconomicscopeofmanagerialeconomics.
•Theoryofcostanalysis thenatureandpatternofchange incostofproductionwithchangeinoutput.Specifically,theoryofcostrevealsthechangeintotal,marginalandaveragecostofproduction.
•Asamatteroffact,economicconditionsofthecountrykeepchanging.Changingeconomicconditionschangetheeconomicenvironmentofthecountry,andtherebybusinessenvironmentandbusinessprospect.
•The overall trend in the economy is determined by the trend inmacroeconomicfactors,viz.,Grossnationalproduct(GNP),economicgrowthrate,savingandinvestment,savingandinvestment,generalpricelevel,employment,andinvestmentclimate.
•Government’seconomicpolicies,especiallymonetary,fiscal,industrialandforeigntradepolicies,playacrucialroleindeterminingtheinternaleconomicenvironmentofthecountry.
• Frameworkoflogicalandmathematicalconcepts,aimedathelpingmanagersinformulatingrulesthatmayleadtoamostadvantageouscourseofactionunderthegivencircumstances.
•Certaintyisthestateofperfectknowledgeaboutthemarketconditions.Inthestateofcertainty,thereisonlyonerateofreturnontheinvestmentandthatrateisknowntotheinvestors.
NOTES
Self-InstructionalMaterial 163
Managerial Decision Making
•Uncertaintyreferstoasituationinwhichthereismorethanoneoutcomeofabusinessdecisionandtheprobabilityofnooutcomeisknownnorcanitbereliablyestimated.
• Incontrastwiththemethodsdiscussedabove,theprobability theory methodconsidersawholerangeofpossiblerisk-returncombinationswhichrepresentadequatelythefullrangeofalternativeoutcomesofariskyundertaking.
7.6 KEY WORDS
• Risk:Itmeansalowprobabilityofanexpectedoutcome. • Uncertainty:Itreferstoasituationinwhichthereismorethanone
outcomeofabusinessdecisionandtheprobabilityofnooutcomeisknownnorcanitbereliablyestimated.
7.7 SELF ASSESSMENT QUESTIONS AND EXERCISES
Short-Answer Questions
1.Writeashortnoteonthetheoryofpricedetermination. 2.Brieflymentionthedecisiontheory. 3.Howdoyoudifferentiatebetweencertaintyanduncertainty?
Long-Answer Questions
1.Discuss themajormacroeconomic factors that influence businessdecisions.
2.Whatarethelimitationsoftheprobabilitytheorymethod? 3.Criticallyanalysetheapplicationofmacroeconomictheoriestobusiness
decisions.
7.8 FURTHER READINGS
Dwivedi,D.N.2008.Principles of Economics,SeventhEdition.NewDelhi:VikasPublishingHouse.
Weil.DavidN.2004.Economic Growth.London:AddisonWesley.Thomas, Christopher R. andMaurice S. Charles. 2005.Managerial
Economics: Concepts and Applications,EighthEdition.NewDelhi:TataMcGraw-HillPublishingCompanyLimited.
Mankiw,GregoryN.2002.Principles of Economics,SecondEdition.India:ThomsonPress.

Economic Planning and MRTP Act
NOTES
Self-Instructional 164 Material
UNIT 8 ECONOMIC PLANNING AND MRTP ACT
Structure 8.0 Introduction 8.1 Objectives 8.2 Objectives of Economic Planning 8.3 Control of Big Business
8.3.1 MRTP Act and the Evil Effects of Economic Concentration 8.3.2 Monopoly Inquiry Commission (1965)
8.4 Monopolies and Restrictive Trade Practices Act (1969) 8.5 Amendments in MRTP Act 8.6 Industrial Policy and its Features
8.6.1 Industrial Policies of Pre-1991 Period 8.6.2 The New Policy (1991)
8.7 Answers to Check Your Progress Questions 8.8 Summary 8.9 Key Words 8.10 Self Assessment Questions and Exercises 8.11 Further Readings
8.0 INTRODUCTION
All economies of the world have been endeavouring to achieve economic development through economic planning.
Economic planning has no definite and universally accepted definition. Most often, it depicts well-managed and rational economic system in which all economic activities are executed according to envisaged goals with an aim to achieve maximum social welfare. All the predetermined objectives are realized within a fixed time period. In this unit, you will study about objectives of economic planning, MRTP Act, evil effects of economic concentration and the introduction and implementation of industrial policies in India.
8.1 OBJECTIVES
After going through this unit, you will be able to: • List the objectives of economic planning • Discuss the functions of the MRTP Act • Discuss the various Industrial Policies implemented in India in the
pre-1991 period • Analyse the New Industrial Policy, 1991

NOTES
Self-InstructionalMaterial 165
Economic Planning and MRTP Act8.2 OBJECTIVES OF ECONOMIC PLANNING
Immediately after achieving independence in 1947, the All India Congress Committee (AICC) appointed the Economic Programme Committee in November 1947. This Committee was chaired by Jawaharlal Nehru. The AICC stated that one aim should be to evolve an economic structure, which will yield maximum production without operation of private monopolies and create a proper balance between urban and rural economies. The Committee was of the opinion that such a social structure can provide an alternative to acquisitive economy of private capitalism and the regimentation of totalitarian state. This gave rise to the idea of mixed economy.
The Economic Programme Committee submitted its detailed proposal on 25 January 1948 and recommended to establish a permanent planning commission. On 6 April 1948, the first Industrial Policy was announced. In March 1950, the Planning Commission was set up by the Government of India under the chairmanship of Jawaharlal Nehru to prepare a plan for the effective and balanced utilization of country’s resources. In July 1951, the Planning Commission issued the draft outline of the First Five Year Plan (1951 to 1956).
Objectives of Five Year Plans
India embarked on the path of planned economic development on 1 April 1951. Since then, it has gone through Twelve Five Year Plans. Some of the objectives of these plans have been as follows: • To increase national income and per capita income • To raise agricultural production • To industrialize the economy • To achieve balanced regional development • To expand employment opportunities • To eradicate poverty • To reduce income and wealth inequalities • To achieve self-reliance
8.3 CONTROL OF BIG BUSINESS
India’s independence was followed by the introduction of several changes in India, one of them being the establishment of big business houses such as that of Tata and Birla. After independence, India adopted in the centralized planning system—five year plans which provided a detailed account of the utilization of the country’s resources in the coming five years. The main

Economic Planning and MRTP Act
NOTES
Self-Instructional 166 Material
objective of the five year plans was to accelerate the economic and industrial growth of the country.
Most of the laws and policies that were passed during that time were based on the Principle of Command-and-Control. The government interfered in the matters of the private businesses and houses with the objective of promoting the public sector of the country which would lead to the growth of the economy. The private industries were required to take approval licenses from the government in order to function. The government used to support the big business houses as they largely contributed to the growth of the economy. Hence, it became easy for them to obtain licences. This eventually led to the concentration of economic power in the hands of few big industrialists. Consequently, the MRTP Act, 1969 was implemented.
8.3.1 MRTP Act and the Evil Effects of Economic Concentration
Growth of monopolies has been a widespread phenomenon in the industrial countries with capitalistic economic systems. Almost all industrialized, free enterprise nations have promulgated laws to control and regulate prices and production of existing monopolies and prevent further growth of monopolies. The emergence and existence of monopolies in India can be attributed to the introduction of the British industrial culture by the Britishers during their colonial rule in this country. Independent India inherited an economic system and industrial structure characterized by monopolies and economic concentration. Although the Directive Principles of the Indian Constitution laid down provisions for reducing concentration of economic power—wealth and means of production—no action was taken until 1970 and, as a result, monopolies and concentration of economic power continued to grow during the post-Independence period.
The need for controlling monopolies arises mainly because growth of private monopolies (except where it is permissible on the grounds of efficiency) and the concentration of economic power in the hands of a few individuals or firms are detrimental to the economic welfare of the society at large. Monopolies and economic concentration limit the promotion of society’s economic welfare in following ways. (i) Profit maximizing monopolies limit production much below their
efficient level and, thereby, restrict the supply of goods and services much below the potential level. This limits the availability of goods and services and the prospect of economic welfare.
(ii) Private monopolies set prices of their products at a level much higher than their competitive level and, thereby, reduce the consumer surplus and economic welfare.

NOTES
Self-InstructionalMaterial 167
Economic Planning and MRTP Act
(iii) By limiting the output, monopolies limit the scope of employment and income generation much below its potential level. This is detrimental to economic growth and promotion of economic welfare.
(iv) Monopolies prevent the growth of competition in the industrial sector and, thereby, the efficiency in production that can be achieved in the environment of competition.
(v) By using their economic power, monopolies influence the government’s decisions on policy matters pertaining to industrial growth, equity and social justice.
8.3.2 Monopoly Inquiry Commission (1965)
In view of the disadvantages of monopolies, the Government of India appointed a Monopoly Inquiry Commission in 1965 under the Chairmanship of Shri K.C. Dasgupta, to perform the following functions. (i) To inquire into the extent and effects of economic power in private
hands and the prevalence of monopolistic and restrictive trade practices in economic activities other than agriculture, and
(ii) To suggest, in the light of its findings, the legislative and other measures to control monopolies and to protect essential public interest.
Approach and Findings of Monopoly Inquiry Commission (1965)
In its approach to assess the concentration of market power, the Monopoly Inquiry Commission examined (i) product-wise concentration, and (ii) country-wide concentration (i.e., virtually the industrial house-wise concentration). In assessing the product wise concentration, the Monopoly Commission adopted the following criteria of concentration.
Degreeof concentration Shareoftopthreefirms
1. High 75% or more 2. Medium 60% to 74.9% 3. Low 50% to 59.9%
4. Nil Less than 50%
Product-wise concentration: The commission investigated the concentration of 100 products and concluded as follows: (i) High concentration in 65 products including infant milkfood, kerosene,
oil, petroleum, pump-stove, fluorescent tubes, dry batteries, domestic refrigerators, sewing machines, typewriters, tooth pastes, footwear, cigarettes, motor vehicles, etc.
(ii) Mediumconcentration in 10 products including biscuits, electric fans and lamps, radio receivers, cement, bicycles, etc.

Economic Planning and MRTP Act
NOTES
Self-Instructional 168 Material
(iii) Low concentration in eight products, including woollen fabrics, worsted knitting yarn, hurricane lantern, paper and pencils, stovewares, pipes, etc.
(iv) Nil concentration in 17 products including tea, coffee, sugar, vegetables oils, coal, cotton textiles, sanitary wares, etc.
Company-wide concentration: The Commission’s findings revealed that the topfive industrial houses, viz., Birlas (151), Bangurs (81), Surajmal Nagarmal (76), Bird Heilders (64) and Tatas (53), together controlled 425 companies. In all, top 75 business houses controlled 1536 companies with 44.1% joint share in the total assets of all the non-government and non-banking companies in 1963–64.
If one looks at the present status of the monopolies and concentration of economic power, things have not changed materially. In mid-1990s, for instance, five top-most business houses (Tatas, Birlas, Reliance, Thapars and Singhanias) had total assets of 25,000 crore which accounted for 60 per cent of the total assets of 41,610 crore of top 20 business houses and companies. Recommendations of the Monopoly Commission: Based on its findings, the Monopoly Commission made the following recommendations: (i) setting up a permanent body like Monopolies and Restrictive Trade
Practices Commission; (ii) liberalization of industrial licencing policy to facilitate the entry of
small and medium industrialists to monopolized industries; (iii) issuing import licences to all actual users of imported inputs rather
than issuing it to a few importers; and (iv) countervailing actions by the public sector to restrain monopolistic
practices expect where monopolies contribute to growth and are socially and economically desirable.
8.4 MONOPOLIES AND RESTRICTIVE TRADE PRACTICES ACT (1969)
Following the recommendations of the Monopoly Commission, the Government of India enacted the Monopolies and Restrictive Trade Practices Act, popularly known as the MRTP Act, in 1969. This Act was made effective from June 1, 1970. This Act is applicable to entire India, except Jammu and Kashmir. The MRTP Act (1969) has three main objectives: (i) to control and regulate the concentration of economic power, (ii) to control monopolies and restrictive trade practices, and (iii) to prohibit restrictive trade practices unless it is in public interest. To these ends, the MRTP Act defined the monopolisticordominantfirms,monopolistictradepractices, and restrictive trade practices in as great details as necessary for legal action. Here, we present the definitions in brief.

NOTES
Self-InstructionalMaterial 169
Economic Planning and MRTP Act
Monopolies or Dominant Firms: The MRTP Act (1969) provides that the companies of the following categories be treated as monopolies or dominant firms: (i) companies with assets of 20 crore, (ii) inter-connected companies with total assets of `20 crore, (iii) companies whose own supply accounts for one-third of the total supply, and (iv) interconnected companies working together as dominant companies with total assets of `1 crore or more. Monopolistic Trade Practices: The MRTP Act makes a distinction between monopolistictradepracticesand restrictive trade practices. The definition of monopolistictradepractices given by the MRTP Act can be summarized as follows. Monopolistic practices are the practices that are adopted by a firm or a group of firms by virtue of their dominance that are detrimental to public interest. Monopolistic practices includes (i) maintaining price at an unreasonably high level, limiting production and controlling the supply to maintain unreasonably high level of price, (ii) any policy, practice or act that reduces both the current and potential competition, and (iii) limiting capital investment and technical development and allowing the quality of product to deteriorate.Restrictive Trade Practices: Restrictive trade practices are, in contrast, related to the practices or acts that prevent, restrict or distort competition. Restrictive trade practices refer generally to the practices that are adopted by a small group of dominant firms with ‘agreement’, arrangement or understanding to prevent the growth of competition. This system is known as ‘cartelization’ of the industry. The restrictive trade practices by way of agreements, arrangements and understanding, listed by the MRTP Act are many and the list is long. These include mainly (i) restricting the sale of goods to or purchase of goods from specified persons and in specific manner, (ii) requiring the purchase of some goods to purchase some other goods, i.e., tie-in-sale, (iii) requiring the dealers and the wholesalers not to deal in the product of any other company, (iv) restricting the areas for sales, and (v) restricting the dealers in granting discounts, rebates and concessions and tying the sale to specified service sellers.
The other formsof restrictive trade practices include (i) collusion among firms or formation of cartels, (ii) price discrimination between different groups of buyers, (iii) predatory pricing to eliminate competitors, (iv) tie-up sales of goods in high and low demand, (v) forcing full-line purchase, and (vi) area restriction.
8.5 AMENDMENTS IN MRTP ACT
The MRTP Act (1969) was amended significantly in 1982, 1984, 1985 and 1991 to bring it in tune with the changing conditions of the industrial sector, though the basic structure of the Act remains the same.

Economic Planning and MRTP Act
NOTES
Self-Instructional 170 Material
In the 1982-amendment, the definition of dominant firm was changed from one having a market share of one-third to one having a market share of one-fourth of the total. In addition, the share of a firm in the total installed capacity for the production of a commodity was also made a consideration in deciding on a dominant firm. Also, export part of the total sale was excluded for the purpose of calculating the market dominance.
In the 1984-amendment, the major amendments included (i) unfair trade practices were brought under purview of the Act, (ii) certain provisions of Companies Act relating to acquisition and transfer of shares were transferred to the MRTP Act, and (iii) the central government was given powers to delink the interconnected companies in certain cases.
In the 1985-amendment, the asset-holding limit for the purpose of determining the dominant status of a firm was raised from 20 crore to 100 crore.
The 1991-amendments in the MRTP Act were made through the Industrial Policy change announced on July 24, 1991. This amendent made drastic changes in the Act. The major amendments are summarized. (i) The provision regarding the concentration of economic power was
repealed, except where it was detrimental to common cause. This shifted the emphasis of the Act from monopolies as such to their restrictive and unfair trade practices.
(ii) The provision of seeking government permission for (a) capacity expansion, (b) establishment of new undertakings, (c) merger, amalgamation and take over, and (d) appointment of certain directors was repealed too.The MRTP Act is implemented by the Monopolies and Restrictive Trade
Practices Commission (MRTP Commission) set up on the recommendation of the Monopoly Inquiry Commission (1965) for the purpose. The MRTP Commission is empowered to inquire into monopolistic, restrictive and unfair trade practices of the companies on (a) reference made by the Centre and the state governments, (b) on the application from the Director-General of Investigation, and (c) on complaints from a trade or consumer association with a membership of 25 or more. The MRTP Commission enjoys the power of a Civil Court. It has the power to summon a company or business house, inquire into its business activities and practices, ask it to submit its business accounts and to produce evidence contrary to the complaint against it. It has the power to dismiss a case against a company and initiate action in accordance with the provisions of the Act.
8.6 INDUSTRIAL POLICY AND ITS FEATURES
In unit 5, we have discussed monetary and fiscal policies of India. Both these policies are intended to achieve some macroeconomic goals of the

NOTES
Self-InstructionalMaterial 171
Economic Planning and MRTP Act
country. These policies do affect private business positively and negatively by changing the economic environment of the country. However, these policies do not serve the purpose of promoting, organizing and determining the desirable industrial structure and growth of industry. Therefore, the government has to formulate a separate policy for organising, developing and managing industrial growth of the country. This policy is known as industrial policy. Industrial policy refers to the rules and regulatory laws formulated by the government to determine the ownership and pattern of growth of industries in the country. In this unit, we present a brief description of different kinds of industrial policies adopted by the government since the year of Independence, their objectives and limitations.
Industrial policy of India has undergone a sea change during the post-Independence period – over a period of 65 years. In this unit, we present a brief review of India’s industrial policy in historical perspective just to show the process of formulation of industrial policy. It may be added here that a detailed historical review of India’s industrial policy is not over objective here as it does not serve any useful purpose. From historical review point of view, the history of India’s industrial policy can be divided two phases: (i) Pre-1991 phase of industrial policies, and (ii) Post-1991 phase of industrial policy. The year 1991 marks the year in which India was forced to make drastic changes in her economic policies including industrial policy. So we will present our review of India’s industrial policy in the two phases. We begin our discussion by looking at ‘why industrial policy is required’.
Why Industrial Policy?
In a democratic country and mixed economy like India where the government has adopted economic planning as an instrument of guided industrialization for establishing a ‘socialist pattern of society,’ it becomes indispensable for the government to control and regulate private industries with a view to bringing them in tune with national goals. The regulatory functions of the government in a mixed economy like India, include: (i) determining the areas for private and public sector industries; (ii) laying down the policy guidelines and norms for controlling and regulating the private and public sector industries; (iii) assisting, promoting and directing the private entrepreneurship for rapid growth of industries, and (iv) protecting the small-scale industries from competing large scale industries for promoting self-employment.
The government carries out these regulatory functions through (i) legislative measures, and (ii) discretionary changes in its fiscal and monetary policies. The legislative control measures or the direct controls are formulated in the form of ‘Industrial and Licensing Policy.’

Economic Planning and MRTP Act
NOTES
Self-Instructional 172 Material
8.6.1 Industrial Policies of Pre-1991 Period
As noted above, industrial policy of India has undergone numerous changes and reformulations. Here, we point out the basics of industrial policy formulated and used during the period from 1948 to 1990. Industrial Policy-1948: Industrial policy of 1948 was the first systematic attempt to formulate a comprehensive industrial policy of India. The basic purpose of this policy was to demarcate the areas of public and private sectors and bring out guidelines for the control and regulation of the industrial sector. The industrial policy of 1948 had divided industries into four broad categories, viz., (i) defence and strategic industries including arms and ammunitions, atomic energy and railway; (ii) basic and key industries including iron and steel, coal, aircraft manufacturing and ship-building; (iii) twenty other importantindustriesincluding heavy chemicals, sugar, cement, paper, cotton and woollen textiles, machine tools, etc. and (iv) residual industries, including all other industries not included in the other three categories.
Industries of category (i) were put under the exclusive monopoly of the government. ‘Basic and Key Industries’ of categories (ii) were open for private sector participation but were specified as state-controlled industries. Industries of category (iii) being mainly in the private sector were put under general state control and regulation. ‘Residual industries’, i.e., category (iv) were left purely to the private sector but were subject to general control and regulation of the state. In addition, cottage and small-scale industries, though placed, by and large, in the private sector were to be developed on cooperative lines, and coordinated and integrated with the large scale industries. With these provisions, the Industrial Policy (1948) laid the foundations of the mixed economy in India.Industrial Policy — 1956: The Industrial Policy (1948) was, revised and a new industrial policy was announced in 1956. The change in the industrial policy was necessitated by the changing conditions, such as acceptance of the national goal of establishing a ‘socialist pattern of society’ during the Second Plan and the need for (i) rapid industrialization of the economy through the expansion of public sector; (ii) rapid growth of capital goods and heavy industries; (iii) preventing growth of monopolistic tendency in the economy, and (iv) diversification and dispersal of industries towards the backward regions.
The main objective of the Industrial Policy Resolutions (1956) was to recategorise the industries and determine their ownership. Industries were regrouped under three broad categories: Schedule A, Schedule B and ‘residual industries’.
The Schedule A of industries was formed by merging together the first two categories of the 1948-policy. Schedule A consisted of 17 major

NOTES
Self-InstructionalMaterial 173
Economic Planning and MRTP Act
industries (e.g., arms and ammunitions, atomic energy, iron and steel, heavy machinery, railways, ship-building, aircraft manufacture, telephone and telegraph, generation and distribution of electricity, etc.). The development and promotion of these industries was made the exclusive responsibility of the state. The industries of Schedule B consisted of 12 industries, viz., aluminium, ferro-alloys, machine tools, antibiotics, fertilizers, synthetic rubber, minerals, dye-stuffs and plastics, road and sea transport, etc. These industries were to be progressively state-owned, with the provision that new units would be set up by the state and that private enterprise would be allowed to develop and assist the state in the promotion and growth of the industries of this category. The third category of industries consisted of the ‘residual industries’ of the 1948-policy. The ownership, management and promotion of industries in this category was left to the initiative and entrepreneurship of the private sector. It was, however, open to the state to enter and undertake production in any of these industries in the national interest.
Another important objective of the Industrial Policy Resolutions (1956) to promote cottage and small-scale industries in view of the ever growing need for (i) creating job opportunities for the unemployed; (ii) preventing further industrial and economic concentration and helping economic decentralization; (iii) ensuring an equitable distribution of national income and (iv) mobilizing and utilizing resources—local capital and skills available in small measures.
The Industrial Policy (1956) remained effective until 1973, although its rules governing the licensing system were modified several times in view of changing conditions and to meet the emerging requirements. The 1956-policy and licensing system were, however, found by R.K. Hazari to be lacking in many respects. His enquiry revealed that the licensing policy had failed to prevent economic concentration. It had instead encouraged economic concentration. The share of four big business houses in the total approved investment had increased from 22.4 per cent in 1959–60 to 24.6 per cent in 1965–66.
In view of the shortcomings of Industrial Policy (1956), the Government appointed an Industrial Licensing Policy Inquiry Committee under the Chairmanship of Subimal Dutt. The major findings of the Dutt-Committee: First, the large business houses had secured undue favour in licensing against other applicants. Second, some big industrial houses, most notably the Birlas, managed to secure unduly large number of licences by making a large number of applications for the same product through the firms controlled by them, while they implemented only a few. Third, the Committee disclosed that 31 per cent of the licences issued were never implemented and, on the contrary, many licences had built up production capacity in excess of licensed capacity and had secured regularization of capacity later. Fourth, the Committee did not find any clear

Economic Planning and MRTP Act
NOTES
Self-Instructional 174 Material
evidence of compliance with the Plan priorities in respect of regional dispersal of industries, import substitution and development of small industries. In many cases there was overlicensing from 50 to 100 per cent. Finally, the committee had also found that the share of 20 large business houses in the finance provided by the public financial institutions was unduly large.Industrial Policy—1970: Following some of the recommendations of the Dutt-Committee, the Government announced in February 1970, a revised industrial policy and licensing procedure. The main objectives of the Industrial Policy (1970) were: (i) widening the scope for expansion of the public sector; (ii) restricting the growth of large industrial houses and proliferation of foreign companies, and (iii) accelerating the growth of industries in small and medium scale sectors. Different kinds of licencing system was adopted for the industries of different categories.
Dutt Committee had also recommended setting up a joint sector. The ‘joint sector’ concept implies participation and cooperation of public and private sectors in the promotion and development of priority industries. In this sector, private managerial skill and public funds would work together for the promotion of industries. In effect, however, government participation appeared in the form of (i) conversion of financial assistance (loans and debentures) of IDBI and IFCI, etc., given to the private sector into equity capital, and (ii) representation of the public financial institutions in the management of companies getting assistance from them.Industry Policy—1973: Industrial licensing policy (1970) created a good deal of apprehension among the industrialists and also an atmosphere of uncertainty, particularly in the large scale sector. It caused a slackening in the overall investments in the industrial sector. In view of this experience and the requirements of the Fifth Plan which emphasized the need for additional job creation and ‘removal of poverty’, Government announced its yet another revised industrial policy on February 2, 1973.
The Industrial Policy (1973) was not essentially a new policy but a mere reiteration of Industrial Policy (1956). The 1973-policy created a new sector, the joint sector (discussed later) but it remained an ambiguous entity. Furthermore, the new policy liberalized the licensing which affected the interests of small and medium scale units. However, despite liberalization of licensing, the 1973-policy failed to create confidence in the private sector. It was for these reasons, the Government had to revise that the licensing policy and liberalize it further in 1975. Industrial Policy—1977: When Janata Party came to power in 1977, it reviewed the earlier industrial policies. It concluded that despite its certain merits and desirable elements, the Industrial Policy (1956) along with its subsequent amendments had many shortcomings and created certain distortions in the economy. With a view to removing the distortions caused

NOTES
Self-InstructionalMaterial 175
Economic Planning and MRTP Act
by the earlier industrial policy and to achieve the social objectives, the Janata Government announced its New Industrial Policy in December 1977.
The mainthrust of the 1977-industrial policy was an efficient promotionofcottageandsmall-scaleindustrieswidely dispersed in rural areas and small towns. It emphasized that what could be produced by cottage and small-scale industries should be reserved for them. Thus, the new industrial policy had shifted the emphasis from large-scale industries to cottage and small-scale industries. The area reserved for the large scale industries were (a) basic industries essential for the promotion of infrastructure and for development of small-scale and village industries; (b) capital goods industries; (c) high technology industries which required large scale production and met the development requirements of small-scale industries and agriculture and (d) industries other than those reserved for small-scale sector.
The Industrial Policy (1977) was however criticized on the following grounds.
First, the new policy was regarded as a mere extension of the 1956-Policy with some not-so-serious modifications. Second, it was also said that the emphasis on the growth of small-scale and cottage industries was merely an eye-wash. For, out of about 2400 items produced by the industries of this sector, only 504 items were reserved for the small sector which were not very different from the 180 items reserved by the 1956 policy. Third, although development of small-scale and cottage industries was the main thrust of the new industrial policy, the relative emphasis on the sector had, in effect, gone down. Only about 2 per cent of the total plan outlay had been earmarked for the development of small-scale and cottage industries compared to 3.8 per cent in the Second and Third Plans. Industrial Policy—1980: When the Congress Party returned to power in 1980, it liberalized the industrial policy with a view to accelerating industrial growth of the country. The 1980-policy stressed the growth of infrastructure industries like power, transport, communication and finance. The limits of investment in small and ancillary units were substantially enhanced to help their modernization. The 1980-policy emphasized the need for making public sector units efficient and economically viable. Restrictions on the expansion of private sector industries were relaxed and conditions were liberalized. Large private industries were automatically permitted to expand capacity upto 5% per annum subject to 25% expansion in five years. Licencing of private industries was simplified and streamlined with the objective of minimizing bureaucratic delays and preventing harassment of licence seekers. It also provided for permitting the use of advanced technology where necessary to modernize industrial units to help in increasing their international competitiveness.

Economic Planning and MRTP Act
NOTES
Self-Instructional 176 Material
The industrial policy (1980) remained in operation till July 1991. This policy was, in fact, the first step towards the liberalization of the industrial policy. It had no doubt proved helpful in increasing industrial investment but private sector industries remained shackled by licensing controls and regulations.
8.6.2 The New Policy (1991)
Industrial sector of India had made considerable progress; industrial structure was fairly diversified; and India had achieved near self-sufficiency in consumer goods industries. However, growth rate was not enough to absorb increasing manpower supply and alleviate poverty. There was a need for accelerating industrial growth rate that could help achieve these goals. But no major change in industrial policy was made. However, a new industrial policy was announced in July 1991 which was necessitated by the foreign exchange crisis of 1990. The country had reached close to financial bankruptcy. There was no alternative to borrowing from the IMF and the World Bank (WB) for tiding over the crisis. The IMF and the WB agreed to provide financial help on the condition that India would make drastic changes and structural reforms in her economic policies — industrial policy was one of them. The government had no option but to meet the IMF and the WB conditionality.
In compliance with one of the conditionalities, the government announced the New Industrial Policy (NIP) on July 24, 1991, along with other economic reforms. The following were the main features of the NIP. 1. De-reservation of Industries of the Public Sector: The NIP had
dereserved 9 out of 17 industries reserved for the public sector since 1956. The eight industries reserved for the public sector include those where security and strategic considerations were predominant. The industries dereserved include iron and steel, electricity, air transport, ship-building, heavy machinery industries like heavy electrical plants and telecommunication cables and instruments.
2. Privatization of the Government Share in Public Sector Units: The government resolved to offer 49 per cent of the government shareholding in 31 public sector undertakings (PSUs) to mutual funds, financial institutions, the general public and workers. A beginning had already been made. A part of the equities of the selected PSUs had been placed with mutual funds. The government put on sale the shares of seven PSUs (including SAIL).
3. Abolition of Industrial Licensing: The industrial licensing regime which was the main source of corruption and bureaucratic delays and also of most of the industrial ills, had been abolished for all industries irrespective of the level of investment, except for the industries involving national security and strategic considerations, social safety, environmental issues and industrial hazards.

NOTES
Self-InstructionalMaterial 177
Economic Planning and MRTP Act
4. Abolition of Phased Manufacturing Programmes: The New Industrial Policy abolished the phased manufacturing programme in force in a number of engineering and electronics industries, intended to force indigenization in manufacturing. The abolition of phased manufacturing programme removed a major irritant that a large number of firms had felt, i.e., discretionary power and government’s interference in business decisions.
5. Removal of Mandatory Convertibility Clause: The NIP removed the convertibility clause from the lending conditions of the financial institutions. Under this clause, the financial institutions financing an industrial project had the option of converting their loans into equity, if they wanted to do so. This clause was mandatory. Although this option was not often exercised, it was considered to be a hanging threat of takeover by the financial institutions. This clause was no longer mandatory.
6. Removal of Investment Control on Large Business Houses: The industrial units covered under MRTP Act (1969), i.e., those having assets worth `100 crore, were required to obtain a separate licence for additional investment and capacity expansion. Under the NIP resolutions, such firms would not be required to obtain prior approval of the government for investment in delicensed industries.
7. Liberalization of Foreign Investment: The earlier foreign investment policy was extremely restrictive. In the NIP, automatic permission was available to foreign investors upto 51% equity shares in the high priority industries. This facility was made available to the firms able to finance their capital imports through their foreign equity.Although some changes have been made and industrial policy continues
to be modified from time to time, the main thrust of the policy continues to remain the same.Evaluation: The NIP marked the end of the old policy regime and the beginning of a new era in the government’s approach towards the control and management of the industrial sector. The departure from the old industrial policy was of a drastic nature. Some of the changes were as follows: 1. The earlier policy resolutions had put a greater emphasis on such
policy goals as strengthening the public sector, building public sector enterprises, preventing economic concentration, reducing economic disparities, expanding gainful employment and self-reliance. In the NIP, the top priority was accorded to industrial efficiency, growth and international competitiveness.
2. The earlier industrial policies had made the public sector the main instrument of industrial growth. In the new policy, the private sector was made the main instrument for future industrial growth of the country.

Economic Planning and MRTP Act
NOTES
Self-Instructional 178 Material
3. Another striking feature of the NIP was liberalization of foreign investment. Foreign investment was earlier allowed on selective basis with only 40% equity. The new policy invited direct foreign investment to 34 industries with 51% equity. This had been done in view of the need for globalization of the Indian industries and the advantage of transfer of new technology. The new industrial policy had made Indian industries more efficient
and internationally competitive. It created a healthy environment for industrial growth, free from bureaucratic shackles. It encouraged fresh private investment in the new areas opened to the private sector.
Check Your Progress
1. Who was the chairman of the Economic Planning Committee of 1947?
2. Why was the Monopoly Inquiry Commission constituted? 3. State the main objectives of the MRTP Act, 1969.
8.7 ANSWERS TO CHECK YOUR PROGRESS QUESTIONS
1. Jawaharlal Nehru was the chairman of the Economic Planning Committee of 1947
2. In view of the disadvantages of monopolies, the Government of India appointed a Monopoly Inquiry Commission in 1965 to perform the following functions.
(i) To inquire into the extent and effects of economic power in private hands and the prevalence of monopolistic and restrictive trade practices in economic activities other than agriculture, and
(ii) To suggest, in the light of its findings, the legislative and other measures to control monopolies and to protect essential public interest.
3. The MRTP Act (1969) has three main objectives: (i) to control and regulate the concentration of economic power, (ii) to control monopolies and restrictive trade practices, and (iii) to prohibit restrictive trade practices unless it is in public interest. To
8.8 SUMMARY
• All economies of the world have been endeavouring to achieve economic development through economic planning.

NOTES
Self-InstructionalMaterial 179
Economic Planning and MRTP Act
• Immediately after achieving independence in 1947, the All India Congress Committee (AICC) appointed the Economic Programme Committee in November 1947.
• The Economic Programme Committee submitted its detailed proposal on 25 January 1948 and recommended to establish a permanent planning commission. On 6 April 1948, the first Industrial Policy was announced.
• India embarked on the path of planned economic development on 1 April 1951. Since then, it has gone through eleven Five Year Plans.
• Growth of monopolies has been a widespread phenomenon in the industrial countries with capitalistic economic systems.
• Following the recommendations of the Monopoly Commission, the Government of India enacted the Monopolies and Restrictive Trade Practices Act, popularly known as the MRTP Act, in 1969.
• The MRTP Act makes a distinction between monopolistic trade practices and restrictive trade practices.
• The MRTP Act (1969) was amended significantly in 1982, 1984, 1985 and 1991 to bring it in tune with the changing conditions of the industrial sector, though the basic structure of the Act remains the same.
• Industrial policy refers to the rules and regulatory laws formulated by the government to determine the ownership and pattern of growth of industries in the country.
• The government carries out these regulatory functions through (i) legislative measures, and (ii) discretionary changes in its fiscal and monetary policies. The legislative control measures or the direct controls are formulated in the form of ‘Industrial and Licensing Policy.’
• Industrial policy of 1948 was the first systematic attempt to formulate a comprehensive industrial policy of India.
• The main objective of the Industrial Policy Resolutions (1956) was to recategorise the industries and determine their ownership. Industries were regrouped under three broad categories: Schedule A, Schedule B and ‘residual industries’.
• In compliance with one of the conditionalities, the government announced the New Industrial Policy (NIP) on July 24, 1991, along with other economic reforms.
8.9 KEY WORDS
• Industrial policy: It refers to the rules and regulatory laws formulated by the government to determine the ownership and pattern of growth of industries in the country.

Economic Planning and MRTP Act
NOTES
Self-Instructional 180 Material
• Monopoly: It refers to a market structure characterized by a single seller, selling a unique product in the market.
8.10 SELF ASSESSMENT QUESTIONS AND EXERCISES
Short-Answer Questions
1. Why is it considered necessary to control the growth of monopoly and economic concentration in a country?
2. What were the recommendations of the Monopoly Inquiry Commission, 1965?
3. Write a short note on the amendments introduced in the MRTP Act, 1969.
4. What is the need of having an industrial policy in a mixed economy like India?
Long-Answer Questions
1. Discuss the findings of the Monopoly Inquiry Commission, 1965. 2. How does the MRTP Act distinguish between monopolistic trade
practices and restrictive trade practices? 3. Critically analyse the salient features of the New Industrial Policy,
1991. 4. Explain the Industrial policies of pre-1991 period in India.
8.11 FURTHER READINGS
Dwivedi, D. N. 2008. PrinciplesofEconomics, Seventh Edition. New Delhi: Vikas Publishing House.
Weil. David N. 2004. EconomicGrowth. London: Addison Wesley.Thomas, Christopher R. and Maurice S. Charles. 2005. Managerial
Economics:ConceptsandApplications, Eighth Edition. New Delhi: Tata McGraw-Hill Publishing Company Limited.
Mankiw, Gregory N. 2002. PrinciplesofEconomics, Second Edition. India: Thomson Press.

NOTES
Self-InstructionalMaterial 181
Consumer
UNIT 9 CONSUMERStructure 9.0 Introduction 9.1 Objectives 9.2 Consumer’s Surplus
9.2.1 Consumer’s Sovereignty 9.2.2 Consumer’s Surplus in a Market and Assumptions
9.3 The Marshallian Consumer’s Surplus 9.4 Hicksian Method of Measuring Consumer’s Surplus
9.4.1 Consumer’s Surplus with Constant MUm 9.4.2 Consumer’s Surplus with Variable MUm 9.4.3 Hicks’ Four Variations of Consumer’s Surplus
9.5 Some Uses of the Consumer’s Surplus Concept 9.6 Answers to Check Your Progress Questions 9.7 Summary 9.8 Key Words 9.9 Self Assessment Questions and Exercises 9.10 Further Readings
9.0 INTRODUCTION
In the previous unit, you studied about economic planning and the MRTP Act. This unit will introduce you to the concept of consumer’s surplus with special reference to Marshallian consumer’s surplus, Hicksian method of measuring consumer’s surplus and the uses of this concept.
A consumer is of paramount importance for marketers as the individual takes the decision whether to purchase a particular product/service or not. Hence, it is vital for the marketers to study consumer behaviour and accordingly, strategize and prepare their products for purchase in the competitive market.
9.1 OBJECTIVES
After going through this unit, you will be able to: • Analyse consumer’s sovereignty • Explain Marshallian consumer’s surplus • Discuss Hicksian method of measuring consumer’s surplus • State the uses of the consumer’s surplus concept

Consumer
NOTES
Self-Instructional 182 Material
9.2 CONSUMER’S SURPLUS
Any individual who purchases products or services for his personal use and not for manufacturing or resale is called a consumer. A consumer is one who is the decision maker whether or not to buy an item at the store, or someone who is influenced by advertisement and marketing. Every time someone goes to a store and buys a shirt, toy, beverage or anything else, they make a decision as a consumer. As such, consumers play a vital role in the economic system of a nation. Without consumer demand, producers would lack one of the key motivations to produce: to sell to consumers. The consumer also forms part of the chain of distribution.
A consumer surplus occurs when the consumer is willing to pay more for a given product than the current market price. The concept of consumer surplus was developed in 1844 to measure the social benefits of public goods such as national highways, canals and bridges. It has been an important tool in the field of welfare economics and in the formulation of tax policies by governments.
Producers often take advantage of consumer surplus when setting prices. If an organization can identify groups of consumers within their market who are willing and able to pay different prices for the same products, then sellers use price discrimination. In this way a consumer surplus can be converted into a product surplus, to generate higher revenues and profits.
Let us see how consumer surplus is affected by the elasticity of a demand curve: • When the demand for a good or service is perfectly elastic, consumer
surplus is zero because the price that people pay matches exactly what they are willing to pay.
• In contrast, when demand is perfectly inelastic, consumer surplus is infinite. In this situation, demand does not respond to a price change. Whatever the price, the quantity demanded remains the same.
• The majority of demand curves in markets are assumed to be downward sloping. When demand is inelastic, there is a greater potential consumer surplus because there are some buyers willing to pay a high price to continue consuming the product. Businesses often raise prices when demand is inelastic so that they can turn consumer surplus into a producer surplus.
9.2.1 Consumer’s Sovereignty
The ability and freedom of consumers to choose from a range of different goods and services is called consumer’s sovereignty. It means that ultimately it is the consumer who will decide what is produced and how scarce resources are allocated.

NOTES
Self-InstructionalMaterial 183
ConsumerConsumer sovereignty is an important concept for classical economics. This assumes that consumers have the sovereignty and ability to choose between the different suppliers and firms. In theory, consumers will use their discretion to choose the cheapest and/or the best quality goods. In theory, this consumer sovereignty ensures the effective functioning of free markets. It rewards efficient firms and encourages firms to provide goods consumers want.
Adam Smith, while describing the workings of a market economy, referred to an invisible hand – this involves consumers choosing certain goods – thus rewarding the firms who produce the goods which are in demand. Those firms which cannot win over customers will either have to improve the goods they offer or go out of business.
9.2.2 Consumer’s Surplus in a Market and Assumptions
The analysis of consumer’s behaviour in the preceding chapters assumes that the consumer is aware of the prices which he is required to pay for the goods and services he consumes. In real life, however, the consumers may be faced with such a situation that the price which he is willing to pay is higher than what he actually pays. The difference between the price a consumer is willing to pay and the price which he actually pays is consumer’s gain which is referred to as consumer’s surplus.
The concept of consumer’s surplus is believed to have been originated by a French engineer, Arsene Julis Dupuit, in 1844, in his effort to find a measure of the social benefit of such collective goods as roads, canals and bridges. In his opinion, the value of the benefit of such collective goods was greater than the price actually charged because most people would be willing to pay a higher price than they actually paid. This concept was later refined by Marshall who also provided a measure of consumer’s surplus. His premise of measuring consumer’s surplus was, however, rejected by the ordinalists who attempted to provide a different method of measuring consumer’s surplus through their indifference curve technique. In this unit, we will discuss the various methods of measuring consumer’s surplus and their merits and demerits. We will also point out the areas of economic analysis in which the concept of consumer’s surplus is widely used.
9.3 THE MARSHALLIAN CONSUMER’S SURPLUS
Although the concept of consumer surplus was originated by Dupuit, a French engineer, he had not provided a measure of the surplus. It was Marshall who provided a precise measure of consumer’s surplus. Marshall defined consumer’s surplus as “the excess of the price which [a consumer] would be willing to pay rather than go without the thing, over that which he actually does pay.” Accordingly, consumer surplus equals

Consumer
NOTES
Self-Instructional 184 Material
the difference between what a consumer is willing to pay for one unit of a commo dity and what he actually pays for it.
The concept of consumer’s surplus can be expressed also in terms of utility (or satisfaction). Since Marshall assumes constant MU of money, what a consumer is willing to pay for a commodity indicates his expected utility and what he actually pays measures the actual cost in terms of utility (of money). The difference between the utility gained and the utility lost in acquiring the commodity is consumer’s ‘surplus satisfaction’ which Marshall calls the ‘consumer’s surplus’.
The Marshallian concept of consumer’s surplus and its measurement are graphically illustrated in Fig. 9.1. The consumer’s willingness to pay is shown by his straight line demand curve MN. The demand curve MN shows what consumer would be willing to pay for each unit of commodity he purchases. The curve MN also indicates the utility derived from each unit of a commodity. Suppose that the market price, i.e., the price which a consumer actually pays, is given by OP. At price OP, the consumer buys OQ units of the commodity. The total utility derived by the consumer from OQ units is shown by the area OMBQ, for which the consumer pays OPBQ = OQ. OP. Thus, in Marshallian sense,
Consumer’s surplus = area OMBQ—area OPBQ = area PMB. That is, the shaded area PMB represents the consumer’s surplus in
Marshallian sense for OQ units of a commodity consumed.
Fig. 9.1 Consumer’s Surplus
Assumptions
The above analysis of consumer’s surplus is based on the following assumptions:

NOTES
Self-InstructionalMaterial 185
ConsumerFirst, it is assumed that the market price is given. It implies that market is perfectly competitive so that neither the sellers nor the buyers can affect the price. The consumer’s surplus will not exist if there is a monopolist and he adopts first degree price discrimination in his pricing policy, i.e., the monopolist charges each consumer according to his ability to pay for the product.
Second, utility is cardinally measurable and MU of consumer’s money income remains constant throughout.
Third, utility of each commodity is absolute and is independent of other goods and services consumed by the consumer.
Fourth, there is no close substitute for the commodity in question. For, if close substitutes are available, there may not be any difference between ‘what the consumer is willing to pay’ and ‘what he actually pays’ for a commodity.
Critical Appraisal
The Marshallian concept and measure of consumer’s surplus have been criticised on the following grounds.
First, the economists have pointed out difficulties in measuring the consumer’s surplus as suggested by Marshall by a triangle, in Fig. 9.1. In the words of Mark Blaug, “It is sometimes objected that demand curves are usually asymptotic to the price axis. If the individual’s offer for the first unit is not defined so that the demand curve does not touch the Y-axis, the integral under the demand curve is infinite. But this objection is easily overcome by measuring consumer’s surplus from some selected value of qx > O.”
Second, a “more fatal objection to Marshall’s method of measuring consumer’s surplus as ‘the triangle under the demand curves is that real income does not remain constant along the demand curve even for ‘unimportant’ commo dities.” As price falls along the demand curve, real income makes the estimate of consumer’s surplus an ambiguous one.
Third, it is generally alleged that the assumptions on which Marshallian con sumer’s surplus is based are unrealistic: MU of money does not remain constant; cardinal measurement of utility is not possible; utilities of various goods consum ed by a consumer are not independent of each other; most goods have their sustitutes-close or remote, and so on. Therefore, it is alleged that the Marshall ian consumer’s surplus is imaginary and hypothetical.
Fourth, in the ultimate analysis of consumer’s purchases of various goods and services, the consumer’s surplus is reduced to zero. For a consumer’s willingness to pay (i.e., ‘potential price’) cannot exceed his income, i.e., what he actually pays out. It means that, when all purchases have been made, the consumer’s willingness to pay equals what he actually pays (i.e., his income). This criticism is however not relevant because the

Consumer
NOTES
Self-Instructional 186 Material
concept of consumer surplus was developed with reference to an individual commodity.
Fifth, the concept of consumer’s surplus cannot be convincingly applied to ‘essential’ and prestigious goods. For example, a affluent person dying of hunger may be willing to pay `10,000 for a piece of bread while he may be required to pay only `10. As such, his consumer’s surplus will be equal to `9,990 which seems ridiculous. In case of prestigious goods, e.g., rare paintings, diamonds, etc., what a buyer is generally willing to pay equals what he actually pays. It means there is no consumer’s surplus. The concept of consumer’s surplus thus becomes illusory in some cases.
Perhaps due to these weaknesses, Samuelson considers this concept only of ‘historical and doctrinal interest’ and suggests that ‘the economists had best dispense with it’. Hicks has however tried to rehabilitate the consumer’s surplus as this concept is of great importance in the economics of welfare.
Check Your Progress
1. Who is a consumer? 2. Define consumer surplus.
9.4 HICKSIAN METHOD OF MEASURING CONSUMER’S SURPLUS
The Marshallian consumer’s surplus can be measured by using indifference curve analysis under (a) Marshallian assumptions that MU of money remains cons tant; and (b) that MU of money does not remain constant—Hicks’ own assumption. Let us first illustrate the measurement of consumer’s surplus under Marshall’s assumption of constancy of MU of money income.
9.4.1 Consumer’s Surplus with Constant MUm
In Fig. 9.2, Y-axis measures consumer’s money income, OM, and X-axis measures the quantity of commodity X. The line MN is the budget line which shows the money-quantity combinations which a consumer can buy, given the price of X as OM/ON = Px. The consumer is shown to be in equilibrium at point E on indifference curve I2. At point E, he buys OQ of X for which he pays MP2 of his income. The amount MP2 is what the consumer actually pays for OQ of X.

NOTES
Self-InstructionalMaterial 187
Consumer
Fig. 9.2 Marshallian Consumer’s Surplus through Indifference Curve Analysis
Let us now find what the consumer would be willing to pay for OQ of X, rather than go without it. This information can be obtained from a lower indifference curve having two qualifications (i) that the lower indifference curve must pass through point M; and (ii) that the lower indifference curve must be vertically parallel to the upper indifference curve. The second condition is neces sary to comply with the Marshallian assumption that MU of money remaining constant. The indifference curves having these qualifications are shown by I1 and I2. Since the two indifference curves, I1 and I2, are vertically parallel, they have the same slope for a given quantity. For example, point E on I2 and E′ on I1 refer to the same quantity OQ. Therefore, at point E,
MRSE = x
m
MUMU
and at point E′ also
MRSE′ = x
m
MUMU
where MUx = marginal utility of X and MUm= marginal utility of money income. Since MUm is constant and equals 1,
MRSE = 1=x
xMU MU
and MRSE′ = 1=x
xMU MU
Thus, at quantity OQ of X, the slopes of the two indifference curves are equal.

Consumer
NOTES
Self-Instructional 188 Material
Since points M and E are on the same indifference curve, I1, it means that the consumer would be equally well off at these points. That is, his total satisfaction from OM money income and zero units of X will be the same from OP1 of money income and OQ units of X. It means that he would be willing to pay OM – OP1 = MP1 of his income for OQ units of X. Thus, what the consumer is willing to pay for OQ is MP1 and what he actually pays (given the Px) is MP2. Therefore, consumer’s surplus = MP1 – MP2 = P1P2 = E′E.
9.4.2 Consumer’s Surplus with Variable MUm
We now illustrate the measurement of consumer’s surplus under the assumption that MU of money does not remain constant. Let us assume that the consumer is initially in equilibrium at E point in Fig. 9.3. At equilibrium point E, the consumer buys OQ units of X for which he pays DM of his income, given the price. The amount which the consumer would be willing to pay for OQ rather than go without it (the MU of money remaining constant) is shown by point E″ on indifference curve I0 which is vertically parallel to the indifference curve I2. Therefore, as shown in Fig. 9.3, the slopes of I2 at E and I0 at E′ are equal. The consumer’s surplus is DP = EE″.
Fig. 9.3 Consumer’s Surplus under Diminishing MU of Money
Let us now find out the maximum amount which the consumer would be will ing to pay for OQ (rather than go without it), under diminishing MU of money. Intuitively, if an indifference curve (say I1) is drawn under the condition of diminishing MU of money, it will not be vertically parallel to the original indiffe rence curve I2; it will be rather flatter than I2 for any given quantity of X. The indifference curve I1 passes through point E′. Point E′ indicates that TE′ = ΜΒ is the maximum amount which the consumer would be willing to pay for OQ rather than go without it. The consumer’s surplus under diminishing MU of money may be obtained as

NOTES
Self-InstructionalMaterial 189
Consumer TE′ – TE = EE′
or MB – MD = DB = EE′
Note that under constant MU of money, the consumer’s surplus is EE″ = DP which is larger than EE′ = DB by EE″ – EE′ = E′E″. Thus, the consumer’s surplus under diminishing MU of money is less than Marshallian consumer’s surplus.
9.4.3 Hicks’ Four Variations of Consumer’s Surplus
Hicks has pointed out in his Value and Capital that Marshallian consumer’s surplus was the same as his income-compensating variation. Henderson has however shown that Hicks’ income-compensating variation is not the same as Marshallian consumer’s surplus. In Marshallian measure of consumer’s surplus the quantity purchased remains the same whereas in Hicksian measure of it, the quantity purchased varies in accordance with consumer’s choice. That is, there is commodity constraint in the Marshallian measure of consumer’s surplus where as in the Hicksian compensating income variation it is not. This difference is illustrated in Fig. 9.4. Marshallian measure of consumer’s surplus is shown by BT, while Hicksian income compensating variation is MM (=BD) which is greater than BT, for given quantity OQ. Besides, if consumer shifts to equilibrium point E, there will be commodity variation also.
Realising this fallacy in his measure of consumer’s surplus, Hicks reformulated his measure of consumer’s surplus by assuming a price change and finding the compensating payment that would leave the consumer as well-off as before the change in price, if he were not allowed to move to his original position. It implies that the consumer would be so compensated that he would like to stay on the indifference curve to which he moves after the change in price and should be as well off as before the change in price. This can be accomplished by compensating the consumer in terms of price, quantity held constant or compensating the consumer in terms of quantity, price remaining constant. Accordingly, Hicks has reformulated four different variations of consumer surplus: (i) the quantity -compensating variation; (ii) the price-compensating variation; (iii) the quantity equivalent variation; and (iv) the price-equivalent variation. Let us now illustrate these measures of consumer’s surplus.

Consumer
NOTES
Self-Instructional 190 Material
Fig. 9.4 Marshall’s Consumer Surplus and Income Compensating Variation
1. The Quantity-Compensating Variation: Figure 9.5 illustrates the consumer’s surplus as quantity-compensating variation. Suppose that the consumer is in equilibrium at point P on indifference curve I1. At point P, he consumes OQ units of commodity X. Let its price, Px, fall so that the new budget line is MN′, and the consumer moves to a new equilibrium P′ on IC2 where he buys OQ′. Now the question is how much money should be withdrawn from the consumer so that he is as well off as at his original position (i.e., he stays back at I1), the quantity purchased at the new price remaining the same, OQ′. As shown in the figure, if the amount P′R is taken away from the consumer, he will be put back on his orginal indifference curve I1. Thus, P′R is one of the measures of consumer’s surplus called the quantity-compensating variation, since the consumer would be willing to pay P′R to buy OQ′ at the new price.
Fig. 9.5 Consumer’s Surplus: The Quantity Compensating Variation

NOTES
Self-InstructionalMaterial 191
Consumer 2. The Price-Compensating Variation: Price-compensating variation means the maximum amount a consumer would be willing to pay to achieve his initial level of satisfaction. For illustration of price-compensating variation, consider the original equilibrium position of the consumer at P on I1 in Fig. 9.5. Let the price of X fall so that the consumer moves to P′ on I2. If the whole real-income gain (MM′) resulting from the fall in the price is taken away from the consumer, he will move to the equilibrium point B. Now the question is how much the consumer would be willing to pay to gain equilibrium point P′ at the new price. Obviously, if MM′ is paid back to the consumer, he would move to P′. Note that MM′ = P′T. It implies that the consumer would be willing to pay P′T if he is allowed to move to P′. Thus P′T is price-compensating variation.
3. The Quantity-Equivalent Variation: The quantity-equivalent variation is the maximum sum which a consumer would be willing to accept as compensation for being deprived of reaching an upper indifference curve as a result of fall in price. The quantity-equivalent variation is illustrated in Fig. 9.6. The consumer is, let us suppose, in equilibrium at point P on the indifference curve I1. At this point, he buys OQ of the commodity X. When price of X falls so that new budget line is MN, the consumer moves to equilibrium P′ on I2 and his quantity purchased increases from OQ to OQ′. Now the question is if the consumer is prevented from moving to point P′, how much money will have to be paid to him as compensation so that he attains the level of satisfaction indicated by I2.
This amount can be obtained by extending the ordinate PQ to the I2. Figure 9.6 shows, the consumer will have to be paid PR to make him reach the indifference curve I2. With PR given to him, the consumer will be as well off at point R as at point P′. Thus PR is the quantity-equivalent variation.
4. The Price-Equivalent Variation: The price-equivalent variation is, according to Hicks, the maximum sum the consumer will accept as compensation for being deprived of the advantage of a fall in the price of a commodity. This sum equals the gain in terms of real-income due to fall in price. The price-equivalent variation can therefore be obtained by measuring the real-income effect. The real income effect of a fall in price of X from OM/ON to OM/ON′, in Fig. 9.6, can be measured by drawing a budget line JK tangent to the indifference curve I2 and parallel to the budget line MN. As the figure shows, the real income gain resulting from the fall in the price of X from OM/ON to OM/ON′ equals MJ = PB. That is, if MJ is paid to the consumer he would be

Consumer
NOTES
Self-Instructional 192 Material
economically as well off as he would be due to fall in the price of X. Thus MJ (=PB) is the price-equivalent variation.
Fig. 9.6 Consumer’s Surplus: The Quantity and Price Equivalent Variation
It may however be noted at the end that none of these Hicksian measures precisely correspond to Marshall’s measure of consumer’s surplus.
9.5 SOME USES OF THE CONSUMER’S SURPLUS CONCEPT
In spite of the fact that the concept of consumer’s surplus is beset with the problems of its measurement, it continues to be used in the analysis of certain practical problems. Some of its important uses are as follows:
First, the concept of consumer’s surplus is useful in demonstrating that price paid for a commodity does not represent the satisfaction derived from the commodity. Generally, the satisfaction derived from a commodity is greater than the price paid for it. This helps in comparing the economic position of a consumer faced with two different price- quantity situations, even if consumer’s surplus cannot be measured in a meaning ful way.
Second, the concept of consumer’s surplus is a useful tool in comparing the burden of direct and indirect taxes. Besides, the concept is useful in formulating fiscal policies. Taxes on commodities with higher consumer’s surplus are preferable to commodities with lower consumer’s surplus. For, the taxes of the former kind yield greater revenue; involve relatively less social cost, and also have lower distortionate effect on consumption and production. Furthermore, a tax on increasing-cost-industries involves smaller loss of

NOTES
Self-InstructionalMaterial 193
Consumersocial welfare than those on decreasing or constant-cost-industries. These conclusions are useful in the formulation of an appropriate taxation policy.
Third, in pricing policy of the monopoly, the concept of consumer’s surplus plays an important role, particularly where a discriminatory pricing of monopoly product is feasible and desirable. A revenue-maximising monopolist tries to extract the whole consumer’s surplus through the first-degree price-discrimination. He sets the price of a durable good, initially, at such a high level that only those who are willing to pay a high price can buy the commodity. Then, the seller lowers down the price gradually to attract the customers with lower paying capacity.
Fourth, the concept of consumer’s surplus is also used in social cost-benefit analysis of both private and public sector projects, e.g., dams, bridges, roads, flyovers, parks, etc. An element of social benefit of such projects is ‘cost-saving’. The concept of ‘cost-saving’ is directly derived from the concept of consumer’s surplus.
Finally, the consumer’s surplus concept is also used in estimating the gains from the international trade, i.e., the exchange of goods between the countries. This concept is also used in ascertaining, at least theoretically, the implication of customs and quota system used to control and regulate the imports of goods and services.
These uses of consumer surplus shall be illustrated in the forthcoming chapter at appropriate places.
Check Your Progress
3. What is the price-equivalent variation? 4. List the four different variations of consumer’s surplus reformulated
by Hicks.
9.6 ANSWERS TO CHECK YOUR PROGRESS QUESTIONS
1. Any individual who purchases products or services for his personal use and not for manufacturing or resale is called a consumer.
2. Consumer’s surplus is defined as the difference between the total amount that consumers are willing and able to pay for a good or service (indicated by the demand curve) and the total amount that they actually do pay (i.e. the market price).
3. The price-equivalent variation is, according to Hicks, the as compensation for being deprived of the advantage of a fall in the price of a commodity.

Consumer
NOTES
Self-Instructional 194 Material
4. Hicks has reformulated four different variations of consumer surplus: (i) the quantity-compensating variation (ii) the price-compensating variation (iii) the quantity equivalent variation; and (iv) the price-equivalent variation.
9.7 SUMMARY
• A consumer is one who is the decision maker whether or not to buy an item at the store, or someone who is influenced by advertisement and marketing. Every time someone goes to a store and buys a shirt, toy, beverage or anything else, they make a decision as a consumer.
• Consumers play a vital role in the economic system of a nation. Without consumer demand, producers would lack one of the key motivations to produce: to sell to consumers. The consumer also forms part of the chain of distribution.
• Producers often take advantage of consumer surplus when setting prices. If an organization can identify groups of consumers within their market who are willing and able to pay different prices for the same products, then sellers use price discrimination.
• The analysis of consumer’s behaviour in the preceding chapters assumes that the consumer is aware of the prices which he is required to pay for the goods and services he consumes.
• Although the concept of consumer surplus was originated by Dupuit, a French engineer, he had not provided a measure of the surplus.
• The Marshallian concept and measure of consumer’s surplus has been criticised on several grounds by several economists.
• The Marshallian consumer’s surplus can be measured by using indifference curve analysis under (a) Marshallian assumptions that MU of money remains constant; and (b) that MU of money does not remain constant—Hicks’ own assumption.
• Hicks has pointed out in his Value and Capital that Marshallian consumer’s surplus was the same as his income-compensating variation.
• In spite of the fact that the concept of consumer’s surplus is beset with the problems of its measurement, it continues to be used in the analysis of certain practical problems.

NOTES
Self-InstructionalMaterial 195
Consumer • The concept of consumer’s surplus is useful in demonstrating that price paid for a commodity does not represent the satisfaction derived from the commodity.
• The consumer’s surplus concept is also used in estimating the gains from international trade, that is, the exchange of goods between the countries.
9.8 KEY WORDS
• Consumer: He is someone who can make the decision whether or not to purchase an item at the store, and someone who can be influenced by marketing and advertisements.
• Surplus: This is an amount of something left over when requirements have been met; an excess of production or supply.
• Quantity-Equivalent Variation: It is the maximum sum which a consumer would be willing to accept as compensation for being deprived of reaching an upper indifference curve as a result of fall in price.
• Price-compensating variation: It means the maximum amount a consumer would be willing to play to achieve his initial level of satisfaction.
9.9 SELF ASSESSMENT QUESTIONS AND EXERCISES
Short-Answer Questions
1. What are the criticisms raised against the Marshallian concept of consumer’s surplus?
2. List the assumptions of the Marshallian concept of consumer’s surplus. 3. Briefly mention the use of the concept of consumer’s surplus.
Long-Answer Questions
1. ‘Consumer sovereignty is an important concept for classical economies.’ Elucidate the statement.
2. Explain the Marshallian concept of consumer’s surplus graphically. 3. Discuss Hicksian method of measuring consumer’s surplus.

Consumer
NOTES
Self-Instructional 196 Material
9.10 FURTHER READINGS
Dwivedi, D. N. 2008. Principles of Economics, Seventh Edition. New Delhi: Vikas Publishing House.
Weil. David N. 2004. Economic Growth. London: Addison Wesley.Thomas, Christopher R. and Maurice S. Charles. 2005. Managerial
Economics: Concepts and Applications, Eighth Edition. New Delhi: Tata McGraw-Hill Publishing Company Limited.
Mankiw, Gregory N. 2002. Principles of Economics, Second Edition. India: Thomson Press.

NOTES
Self-InstructionalMaterial 197
Business Cycles and Business PolicyUNIT 10 BUSINESS CYCLES AND
BUSINESS POLICYStructure 10.0 Introduction 10.1 Objectives 10.2 Business Cycles
10.2.1 Characteristics of Business Cycles 10.2.2 Phases of Business Cycles 10.2.3 Business Policy
10.3 Inflation 10.3.1 CharacteristicsofInflation 10.3.2 TypesofInflation 10.3.3 DemandPullInflationandCostPushInflation
10.4 ControlofDeflation 10.4.1 Effects on Business Cycle
10.5 Answers to Check Your Progress Questions 10.6 Summary 10.7 Key Words 10.8 Self Assessment Questions and Exercises 10.9 Further Readings
10.0 INTRODUCTION
Businesscyclesarethe“upsanddowns”ineconomicactivity,definedinterms of periods of expansion or recession. During expansions, the economy, measured by indicators like jobs, production, and sales, is growing in real terms,afterexcludingtheeffectsofinflation.Recessionsareperiodswhenthe economy is shrinking or contracting. In this unit, you will study about businesscyclesindetail.Theconceptofinflationalongwithitstypesandfeaturesandtheeffectofinflationanddeflationonthebusinesscyclehavealso been discussed here.
10.1 OBJECTIVES
After going through this unit, you will be able to: • State the characteristics and phases of a business cycles •Defineinflationanddeflation •Discussthetypesofinflation •Definedemandpullinflationandcostpushinflation •Listthemeasurestocontroldeflation

Business Cycles and Business Policy
NOTES
Self-Instructional 198 Material
10.2 BUSINESS CYCLES
Business cycles refer to the periodic booms and slumps in eco nomic activities, generallycomparedto‘ebbandflow’.Theupsanddownsintheeconomyarereflectedbythefluctuationsinaggregateeconomicmagnitudes,includingtotal production, investment, employment, prices, wages, bank credits, etc.
10.2.1 Characteristics of Business Cycles
Different business cycles differ in duration and intensity. However, they have some common features explained below. 1. Business cycles occur periodically. The duration of cycles varies from
a minimum of two years to a maximum of ten to twelve years. They do not show same regularity but they have some distinct phases such as expansion, peak, contraction or depression and trough.
2. Business cycles are synchronic. It means that they do not cause changes in any single industry or sector but are of all embracing character.
3. Ithasbeenobservedthatthatbusinesscyclescausefluctuationsnotonlyin the level of production but also simultaneously in other variables such as employment, investment, consumption, rate of interest and price level.
4. Investment and consumption of durable consumer goods such as cars, houses, and refrigerators are mostly affected by the cyclical fluctuations.
5. Consumption of non-durable goods and services does not vary much during different phases of business cycles.
6. The immediate impact of depression and expansion is on the inventories of goods. When depression sets in, the inventories start accumulating beyond the desired level. This leads to a cut in the production of goods. On the contrary, when recovery starts, the goods in the inventories go below the desired level. This encourages businessmen to place more orders for the goods whose production increases and stimulates investment in capital goods.
7. The occurrence of business cycles causes a lot of uncertainty for businessmenandmakesitdifficulttoforecasttheeconomicconditions.Thus,itleadstofluctuationinprofits.
8. Business cycles are international in character. It means that once the cycle sets in one country, it spreads to other countries through trade relations between them.

NOTES
Self-InstructionalMaterial 199
Business Cycles and Business Policy
10.2.2 Phases of Business Cycles
The upward and downward movements in the magnitudes show different phases of business cycles. Basically, there are only two phases in a cycle, viz., prosperity and depression. However, considering the inter mediate stages between prosperity and depression, the various phases of trade cycle are enumerated as follows: 1. Expansion of economic activities, 2. Peak of boom or prosperity, 3. Recession, the downtrend, 4. Trough, the bottom of depression, and 5. Recovery and expansion.
ThefivephasesofthebusinesscyclearepresentedinFig.10.1.Thesteady growth line shows the growth of the economy when there are no business cycles. The various phases of business cycles are shown by the line of cycle which moves up and down the steady growth line. The line of cycle moving above the steady growth line marks the beginning of the periodof‘expansion’orprosperity’intheeconomy.Theexpansion phase is characterized by increase in output, employment, investment, aggregate demand,sales,profits,bankcredits,wholesaleandretailprices,percapitaoutput and a rise in standard of living. However, growth rate eventually slows down and reaches its peak. The phase of recession begins when the downward slide in the growth rate becomes rapid and steady. Output, em-ployment, prices, etc., register a rapid decline, though the realized growth rate may still remain above the steady growth line. So long as growth rate exceeds or equals the expected steady growth rate, the economy enjoys the period of prosperity—high or low. But, when the growth rate falls below the steady growth rate, it marks the beginning of depression in the economy. When depression continues and hits the bottom, it marks a period of trough. After the period of trough, the economy begins to recuperate and treads on the path of recovery. The process is continuous.
Fig. 10.1 Phases of Business Cycle

Business Cycles and Business Policy
NOTES
Self-Instructional 200 Material
Let us now describe in some detail the important features of the various phases of business cycle, and also the causes of turning points.Prosperity: Expansion and Peak: The prosperity phase is characterized by a rise in the nation al output, rise in consumer and capital expenditure, rise inthepricesofrawmaterialsandfinishedgoods,andriseinthelevelofemployment. In the later stages of prosperity, however, inputs start falling shortoftheirdemand.Additionalworkersarehardtofind.Henceadditionalworkers can be obtained by bidding a wage rate higher than the prevailing rates.Labourmarket becomes a seller’smarket.A similar situation alsoappears in other input markets. Consequently, input prices increase rapidly leading to increase in output and employment. Cost of living increases at a rate relatively higher than the increase in household incomes. Hence consumers, particularlywageearnersandhouseholdsoffixedincomeclass,reviewtheirconsumptionexpenditure.Consumers’ resistancegetsmomentum.Actualdemandstagnatesorevendecreases.Thefirstandmostseriousimpactofdeclinefallsonthedemandfornewhouses,flatsandapartments.Incidently,this is what happened in the US in 2007–08 causing economic depression. Following this, demand for cement, iron and steel, and construction labour tends to halt. This trend subsequently appears in other durable goods industries like automobiles, refrigerators, furniture, etc. This marks reaching the peak.Turning-Point and Recession: As already mentioned, once the economy reaches the peak, increase in demand is halted. The demand even starts decreasing in some sectors, for the reason stated above. Producers, on the other hand, unaware of this fact continue to maintain their existing levels of production and investment. As a result, a discrepancy arises between output supply and demand: supply exceeds demand. The widening of discrepancy between supply and demand is so slow that it goes unnoticed for some time. But, the persistence of this problem makes the producers believe that they have indulged in ‘over-investment’ and over-production.Consequently,future investment plans are given up; orders placed for new equipments, raw materials and other inputs are cancelled. Replacement of worn-out capital is postponed. Demand for labour tends to decrease; and temporary and casual workers are laid off in a bid to bring demand and supply in balance. The cancellation of orders for inputs by the producers of consumer goods creates a chain-reaction in the input market. Producers of capital goods and raw materials cancel their orders for their input. This is the turning point and the begin ning of recession.
Since demand for inputs has decreased, input prices, e.g., wages, interest, etc., show a gradual decline leading to a simul taneous decrease in the incomes of wage and interest earners. This ultimately causes demand recession. On the other hand, producers lower their price in order to get rid of their inventories andalsotomeettheirfinancialobligations.Consumers,istheirturn,expecta further decrease in price, and hence, postpone their purchases. As a result,
NOTES
Self-InstructionalMaterial 201
Business Cycles and Business Policy
the discrepancy between demand and supply continues to grow. When this process gathers speed, it takes the form of irreversible recession. Investments start declining. The decline in investment leads to decline in employment, income and consumption. When investments continue to decline, production and employment continue to decline causing in further decline in demand for both consumer and capital goods. Borrowings for investment decreases; bank credit shrinks; stock prices de crease; unemployment increases even though there is a fall in wage rates. At this stage, the process of recession is complete. When growth rate falls below the steady growth line, the economy enters the phase of depression.Depression and Trough: During the phase of depression, economic activities slide down their normal level. The growth rate becomes negative. The level of national income and expenditure declines rapidly. Prices of consumer andcapitalgoodsdeclinesteadily.Workerslosetheirjobs.Debtorsfinditdifficulttopayofftheirdebts.Demandforbankcreditreachesalowebband banks experience mounting of their cash balances. Investment in stock becomeslessprofitableandlessattractive.Atthedepthofdepression, all economic activities touch the bottom and the phase of trough is reached. Even the expenditure on maintenance is deferred in view of excess production capacity.Weakerfirmsareeliminatedfromtheindustries.Atthispoint,theprocess of depression is complete.How is the Process Reversed?: The basic factor that reverses the recessionary trend is the limit to which an economy can shrink. When the econo my hits the bottom and stays there for some time, it marks the end of pessimism and beginning of optimism. This reverses the process. The process of reversal generally begins in the labour market. The widespread unemployment forces workers to work at wages less than the prevailing rates. The producers anticipating better future try to maintain their capital stock and offer jobs to some workers here and there. They do so also because they begin to take an optimistic view of the situation due to the halt in decrease in price in the trough phase. Consumers on their part expecting no further decline in price begin to resume their postponed consumption and hence demand picks up, though gradual ly. Bankers having accumulated excess liquidity (idle cash reserve)trytosalvagetheirfinancialpositionbyloweringthelendingrateand by investing their funds in securities and bonds, even if rate of return is very low. Consequently, investment picks up and employment gradually increases. Following this recovery in production and wage income, demand for both consumer and capital goods starts picking up. Since banks have accumulated excess cash reser ves, bank credit becomes easily available and at a lower rate. For all these reasons economic activities get accelerated. Due to increase in income and consumption, the process of multiplier gives further impetus to the economic activities, and the phase of recovery gets underway, depending on the speed of recovery.

Business Cycles and Business Policy
NOTES
Self-Instructional 202 Material
The Phase of Recovery:Astherecoverygathersmomentum,somefirmsplan addi tional investment; some undertake renovation programmes; and some undertake both. These activities generate construction activities in both consumer and capital goods sectors. Individuals who had postponed their plans to construct houses undertake this task now, lest cost of construction should mount. As a result, more and more em ployment is generated in the construction sector. As employment increases despite wage rates moving upward, the total wage incomes increase at a rate higher than the employment rate. Wage income rises and so does the consumption expenditure. Businessmenrealizingaquickreturnwithhighprofitability,speeduptheproduction machinery.
Over a period, as factors of production become more fully employed, wages and other input prices move upward rapidly, though not uniformly. Investors, therefore, select the best of the alternative investment opportunities. As prices, wages and other factor prices increase, a number of related developments begin to take place. Businessmen start increasing their inventories, consumers start buying more and more of durable goods and variety items. With this process catching up, the economy enters the phase of expansion and prosperity. The cycle is thus complete.
10.2.3 Business Policy
Policyisdifferentfromstrategy.‘Policy’isderivedfromtheGreekword‘politeia’,meaning‘polity’,thatis,thestateanditscitizens,andLatinpolotismeaning‘polished’,thatis,clear.
According to the New Webster Dictionary,‘policy’meanstheartormanner of governing a nation or the principle on which any measure or course ofactionisbased.Thisdefinitionimpliesthatpolicyisaprescribedguidelinefor governing actions of an organization with respect to given objectives. Kotlerhasgivenacleardefinitionofpolicy:
Policies define how the company will deal with stakeholders, employees, customers, suppliers, distributors and other important groups. Policies narrow the range of individual discretions so that employees act consistently on important issues.
Different Features of Policy
Onthebasisofthisdefinition,certainfeaturesofpolicycanbeidentified.These are: • Policies should follow from organizational objectives and should be
formulated in consistency with such objectives. • Policies provide guidelines to managers/members in an organization for
deciding a course of action, and these limit their discretion or freedom in choosing the course of action.
NOTES
Self-InstructionalMaterial 203
Business Cycles and Business Policy
• Policy formulation is generally the function of senior or top management of a company, and not the job of all managers.
• Policies are commonly expressed in qualitative terms in a general way. Sometimes,policiescanalsobestatedinaconditionalormorespecificway.
• In any organization, a policy will remain in vogue for sometime till it is reviewed, and a change in the policy is made or the policy is replaced by a new one. This means that policies do not change frequently.
To make the concept or meaning of policy clearer, some examples are given below. • A company will not consider any cost reduction measures if it means
compromising on the quality of its product(s). • A company decides to grow only through retained earnings and not
resort to capital issue or market borrowing. • A company will not consider adding any new products with less than
10 per cent return on investment. • A company sells on cash terms and also on credit terms. • A rental company charges a deposit for renting materials. •Acarcompanychargesextramoneyfordeliveringthecartothebuyer’s
premises. • A company hires personnel with experience only. • A company has guidelines on how to collect outstanding amounts from
its customers. • A company responds to 50 per cent of customer enquiries within three
working days. • A company does not question the return of goods by customers that
were purchased during last one month. • A company does not give any discount on price. • A company gives 10 per cent discount on price if payment is made in
cash.
Policy vs. Strategy
The difference between policy and strategy should now be clear. Policy is broader or more general—more in the form of guidelines or principles. Strategyismorespecificwithreferencetoaparticularsituation,targetorobjective.Policygenerallycomesfirst;strategycomeslater,and,sometimes,follows from or is subject to policy. Let us explain this with an example. A companywishestoachievegreatercostefficiency.Thisistheobjective.Thecompany also has a policy of not retrenching any of its existing employees.

Business Cycles and Business Policy
NOTES
Self-Instructional 204 Material
So, a strategy will be worked out, which is subject to or consistent with this policy. The strategy may relate to economies of scale or measures for increasing productivity or identifying and eliminating wasteful expenditure in some area(s) of operation.
Some policy analysts and strategic thinkers do not make much distinction between policy and strategy. According to them, the relationship between policy and strategy is an evolutionary phenomenon. Over a period of time, because of pressure of business and growing competition, business policiesofmanycompaniesevolvedintospecificstrategicprocesses.Theparadigm shift between policy and strategy has been well enunciated by Hofer and others (1984). This is shown below:First Phase: Till the mid-1930s: (Ad hoc policy)Adhocpolicymakingnecessitatedby the expansionofAmericanfirmsin terms of product, markets and customers; and, the consequent need for replacing informal controls by framing functional policies to guide managers.Second Phase: 1930s and 1940s (Planned policy)Planned policy formulation instead of ad hoc policy making and shift of emphasis to integration of function areas caused by environmental changes.Third Phase: 1960s (Strategy)Rapid pace of environmental changes and increasing complexity of management necessitating a critical look at business in relation to environment and the need for strategic decisions.Fourth Phase: 1980s and later (Strategic management)
Shift of focus to strategic processes and the responsibility of management in resolving strategic issues. The evolutionary aspect gives a good perspective to the difference between policy and strategy.
10.3 INFLATION
Inflationmeansgenerallyanunduelyhighandpersistentriseinthegenerallevel of prices over a period of time. However, there is no universally acceptabledefinitionofinflation.Thedefinitionofinflationhasbeenchangingover time depending on the perception of the economists. For example, accordingtoPigou,aneo-classicaleconomist,“Inflationexistswhenmoneyincome is expanding more than in proportion to increase in earning activity.” ToCoulborn,inflationisasituationof“toomuchmoneychasingtoofewgoods”.Moderneconomistshavetriedtodefineinflationmoremeaningfully.AccordingtoAckley,“Inflationisapersistentandappreciableriseinthegeneralleveloraverageofprices.”HarryG.Johnsondefinesinflationas“asustainedriseinprices.”AccordingtoSamuelson,“Inflationdenotesarisein the general level of prices.” Bronfenbrenner and Holzman have suggested

NOTES
Self-InstructionalMaterial 205
Business Cycles and Business Policy
anumberofalternativedefinitionsofinflationwhicharemostlymodifiedversionsofearlierdefinitions.Theiralternativedefinitionsmakethingsmorefuzzyratherthanaddingclaritytoinflation.
10.3.1 Characteristics of Inflation
Followingarethemaincharacteristicsofinflation: (i) Inflationisalwaysaccompaniedbyariseinthepricelevel. (ii) Inflationisgenerallycausedbyexcessivemoneysupply. (iii) Inflationisessentiallyaneconomicphenomenonasitoriginatesinthe
economic system. It is the result of action and interaction of economic forces.
(iv) Inflationisadynamicprocessasobservedoverthelongperiod. (v)Acyclicalmovementofpricesisnotinflation. (vi)Actualinflationbeginsafterfullemployment.(vii) Inflationmaybedemand-pullorcost-push.(viii)Theessenceofinflationliesinexcessdemandinrelationtothesupply
of everything.
10.3.2 Typesof Inflation
Inflationisgenerallyclassifiedonthebasisofitsrateandcauses.Thetypesofinflationbasedonitscausewillbediscussedunderthecausesofinflation.Here,wetakealookatthekindsofinflationbasedontherate of inflation. Inflationonthebasisofrateisclassifiedas(i)moderateinflation,(ii) galloping inflation,and(iii)hyper inflation.Anotherkindof inflationreferredto incontemporaryinflationstudiesis‘suppressedinflation’. (i)ModerateInflation:‘Asingledigit’rateofannualinflationiscalled
‘moderate inflation’ or ‘creeping inflation’.During the period ofmoderateinflation,pricesincreasebutatamoderateratefrom1%to9%.The‘moderaterate’mayvaryfromcountrytocountry.However,animportantfeatureofmoderateinflationisthatitis‘predictable’andpeopleholdmoneyasastoreofvalue.Bythisdefinition,Indiahashadamoderaterateofinflationduringthepost-independenceperiod,except in few years.
(ii)GallopingInflation:Averyhighrateofinflationiscalled“gallopinginflation’.How high should be the rate of inflation to be calledgallopinginflationisnotdefinedprecisely.AccordingtoBaumolandBlinder,“Gallopinginflationreferstoaninflationthatproceedsatanexceptionallyhighrate.”Theydonotspecifywhatrateof inflationis ‘exceptionallyhigh’.SamuelsonandNordhausdefine ‘gallopinginflation’moreprecisely.Accordingtothem,“Inflationinthedoubleortriple-digit range of 20, 100 or 200 per cent a year is labeled galloping

Business Cycles and Business Policy
NOTES
Self-Instructional 206 Material
inflation”.This definition is equally imprecise because the doubleandtriple-digitinflationvariesfrom10%to999%perannum.Thereis a very wide difference between these two lower and upper rates. Acountrywith900percent inflationwillhavedevastatingeffectswhereasacountrywith20–30percentinflationcanmanagewithoutpressing the alarm bell though in modern times, it does alarm the bell. Thepost-WorldWarIinflationinGermanyisanexampleof galloping inflation.ThewholesalepricesinGermanyincreasedby140percentin 1921 and a colossal 4100 per cent in 1922, which is, of course, the caseofhyperinflation.Somerecentexamplesofgallopinginflation,i.e.,theannualaveragerateofinflation,during1980–91areasfollows:Argentina–416.9%;Brazil–327.6%;Mexico–66.5%;Peru–287.3%and formerYugoslavia – 123.0%.These cases are often quoted asexamplesofhyperinflationalso.
(iii)HyperInflation:Accordingtotheearlyviews,hyperinflationtakesplace when prices shoot up at more than three-digit rate per annum. Duringtheperiodofhyperinflation,papercurrencybecomesworthless.Germanyhadhyperinflationin1922and1923whenwholesalepriceindex shot up by ‘100 million per cent between December 1922 and November 1923.’November 1923was theworst period of hyperinflationinGermany—“fromJanuary1922toNovember1923, theprice indexrosefrom1 to10,000,000,000.”Hungarian inflationof1945–46isanotherexampleofhyperinflation,infacttheworstcaseofhyperinflationeverrecorded.InHungary,“rateofinflationaveragedabout 20,000 per cent per month for a year and in the last month prices skyrocketed 42 quadrillion per cent.”
TheSuppressed Inflation
Anothercategoryofinflationthatoftencomesacrossincontemporarywritingsoninflationissuppressed inflation. Incontrasttoopeninflation(i.e.,pricerise without any control and regulation by the government), some countries experience suppressed inflation. When prices continue to rise in spite of price control but at less than potential rate, it is called suppressed inflation. Price control through various direct or indirect price control measures has become a common feature of economic policy of most developed and developingeconomies.Pricecontrolstaketheformofstatutoryfixationofthepriceorfixationofapriceceiling;rationingtheconsumptionofscarcegoods, controlled distribution of goods through public distribution system andsubsidizationofcommoditieswithhighinflationpotentials.Inspiteofthesecontrolmeasures,pricesdoriseandinflationdoestakeplacebutataratelowerthanthepotentialrateintheopensystem.Thiskindofinflationiscalledsuppressedinflation.

NOTES
Self-InstructionalMaterial 207
Business Cycles and Business Policy
10.3.3 DemandPull InflationandCostPush Inflation
Themoderntheoriesofinflationfollowsthetheoryofpricedetermination.That is, the general price is determined by aggregate demand for and aggregate supply of goods and services and the variation in the aggregate price level is caused by the level of shift in the aggregate demand and aggregate supply curves.Themodern theory of inflation is, in fact, asynthesis of classical andKeynesian theories of inflation.Themodernanalysisofinflationshowsthatinflationiscausedbyoneorbothofdemand and supply-side factors. The factors which operate on the demand side are called demand-pull factors, and those operating on the supply-side are called cost-push factors. Accordingly,therearetwokindsofinflation: (i) demand-pull inflation and (ii) costpush inflation. The two kinds of inflationarediscussedherebriefly.However,asectionofeconomistsarguesthatdemand-pullandcost-pushfactorsinteracttocauseinflation.Thetheoryofinflationbasedoninteractionofdemand-pullandcost-pushfactorshasbeen discussed subsequantly.
1.Demand-Pull Inflation
Thedemand-pull inflation occurswhen the aggregate demand increasesat a much higher rate than the aggregate supply. In other words, demand-pullinflationoccurswhen,giventheaggregatesupply,aggregatedemandincreases substantially. Increase in aggregate demand may be caused by (a) monetary factors, i.e., increase in money supply and/or (b) real factors, i.e., increase in demand for real output. Let us now see how monetary and real factorscauseinflation.(a) Increase in Money Supply and Demand-Pull Inflation: One important reasonfordemand-pullinflationisincreaseinmoneysupplyinexcessofincrease in potential output. Whether increase in money supply in excess of increaseinoutputistheonlycauseofinflationisacontroversialissue.Butthe fact is that monetary expansion in excess of increase in the level of output isoneofthemostimportantfactorscausingdemand-pullinflation.
Letuslookattheprocessofdemand-pullinflationcausedbymonetaryexpansion. When monetary and real sectors are in equilibrium at the same level of output and prices, the economy is said to be in general equilibrium. The general price level corresponding to the general equilibrium is called equilibriumpricelevel.Nowletmoneysupplyincrease,otherthingsremainingthe same. The increase in money supply causes a decline in the interest rate. The decrease in the interest rate increase in transaction demand for money, especially for investment. Increase in investment causes increase in the level of income. Increase in income causes a rise in consumption expenditure. The rise in investment and consumer expenditures increases aggregate demand, aggregate supply remaining the same. This rise in aggregate demand is exactly

Business Cycles and Business Policy
NOTES
Self-Instructional 208 Material
proportional to the rise in the money stock. The rise in aggregate demand, given the aggregate supply, causes increase in the general price level. Thus, increaseinmoneysupplycausesdemand-pullinflation.
TheGerman inflation of 1922–23 is often cited as an example ofdemand-pull inflation caused by the increase inmoney supply.During1922–23,theGermangovernmenthadfallenunderheavypost-wardebtsand reparations of payment obligations. The government, left with no option, printed and circulated billions and billions of paper currency. As a result, the general price level rose a billion fold. In recent times, the excess supply of moneycauseddemand-pullinflationinRussiain1990s‘whentheRussiangovernmentfinanceditsbudgetdeficitbyprintingroubles’.Due torapidincrease in money supply, the general level of prices had risen in Russia during the early 1990s at an average rate of ‘25 per cent per month [or 100 × (1.2512–1)=1355percentperyear].’(b) Real-Factor Demand-Pull Inflation: Real-Factordemand-pullinflationcan be caused by any or many of the following real factors. (i) Increase in the government expenditure without change in tax revenue; (ii) Cut in tax rates without change in the government expenditure; (iii) Increase in investment; (iv) Increase in consumer demand; (v) Increase in exports given imports; and (vi) Decrease in imports given the exports.
Thefirst four factors straightaway increase the level of disposableincome. Increase in aggregate income increases aggregate demand causing demand-pullinflation.Forexample,supposethatthegovernmentincreasesitsspendingfinancedthroughborrowingsabroad.Theriseinthegovernmentspending generates additional demand and, therefore, aggregate demand increases. Since there is, by assumption, full employment, additional resources can be acquired only by bidding a higher price. This pushes the prices up without increase in the output. Therefore, the transaction demand for money increases. In order to meet the additional transaction demand for money, peopleselltheirfinancialassets—bondsandsecurities.Consequently,bondand security prices go down and the rate of interest goes up. In the product market, prices increase to such an extent that the additional government spending is absorbed by the price rise. This is how other real factors also causeinflation.
2.Cost-Push Inflation
Thereareinstancesofinflationwhichcouldnotbefullyexplainedbythedemand-side factors. The 1958-recession in the western countries is a famous instance. During the period of recession, the aggregate demand had declined.

NOTES
Self-InstructionalMaterial 209
Business Cycles and Business Policy
Yet there was no decrease in the general price level. Instead, it tended to rise. In recent times, it is a common experience that prices generally do not decrease during the period of recession. Furthermore, even when there is stagnation intheeconomyandthereisnoinflationarypressure,thegeneralpricelevelgenerally continues to increase. It implies a situation of stagflation. The investigation into this kind of phenomenon, particularly for the 1958-puzzle, had led to the emergence of supply-side theories of inflation, popularly known as cost-push theory and supply-shock theoryofinflation.
Cost-pushinflationis generally caused by monopolistic groups of the society,likelabourunionsandfirmsinmonopolisticandoligopolisticmarketsetting. Strong labour unions often succeed in forcing money wages to go up causing prices to go up. This kind of rise in price level is called wage-pushinflation.Also,firmsenjoyingmonopolypowerhavealsobeenfoundusing their monopoly power to raise prices which in turn leads to rise in the generalpricelevel.Themonopolisticandoligopolyfirmspushtheirprofitmarginupcausingariseinthegeneralpricelevel.Thiskindofinflationiscalled profit-pushinflation.Anotherkindofcost-pushinflationissaidtobe caused by supply shocks, i.e., decrease in the aggregate supply. This is called supplyshockinflation.Minimum-wage legislation and administered prices are other supply side factors which not only keep price level up but also create conditions for increase in the prices. In this section, we will discuss brieflythesekindsofcost-pushinflation. (i) Wage-PushInflation:Wage-pushinflationisattributedtotheexercise
of monopolistic power by the labour unions to get their money wages enhanced more than the competitive labour market conditions would permit. Organized and powerful labour unions exercise their monopoly power and force their employers to increase their money wages above the competitive level without matching increase in labour productivity. Increase in money wages causes an equal increase in the costofproduction.Theincreaseincostofproductionforcesthefirmsto increase the price. This trend causes the aggregate supply curve to shift backward. A backward shift in the aggregate supply causes an upward movement in the price level.
However,everyriseinthemoneywagesisnotalwaysinflationary.The rise in money wages due to the following factors is not said to be inflationary.
(i) Increase in wage rate due to increase in productivity, (ii)Riseinwageratesduetoinflation, (iii) Wage rise where unionized wage bill is very small, and (iv) Wage rise due to shortage of labour supply.

Business Cycles and Business Policy
NOTES
Self-Instructional 210 Material
(ii) Profit-PushInflation:Incontrasttowage-pushinflation,profit-pushinflationiscausedbytheuseofmonopolypowerbythemonopolisticandoligopolisticfirmstoenhancetheirprofitmarginwhichresultsintheriseinpriceandinflation.Today,monopolisticcompetitionandoligopolies characterize the real market situation all over the world. Themonopolies,monopolisticallycompetitivefirmsandoligopoliestendtoincreasetheirpricetoincreasetheirprofitmargin,giventhemarketconditions,ofcourse.Therefore,aprofit-pushtypeofinflationis certainly a theoretical possibility.
Profit-wage Spiral: It may be added here that wage-push and profit-push inflation go hand in hand, whichever may be the leading cause. Labourunionsmaybethefirsttoforcewageratetogoupbutfirmsraisethe price level often more than proportionately. Or else, monopolistic firmsmaybe thefirst to push the product price up forcing labourunions to demand a higher wage rate. It then has its repercussions on themoneywages.Higherpricesandprofitsinducedemandforhigherwages. The powerful labour unions force their employers to raise their wages.Followingthewagehike,firmsraisetheproductprices.Whenthis process gets going, it takes the form of ‘profit-wagespiral’.
(iii) Supply-Shock Inflation: Supply shock is generally caused by unexpected decline in the supply of major consumer goods or key industrial inputs. For example, vegetable and foodgrain prices shot up in India by more than 100 per cent in the last quarter of 2013, making a big election issue in 2014. Prices of some key industrial inputs like, coal, steel, cement, oil, basic chemicals, etc., go up because of short supply caused by labour strikes, natural calamities, etc. Also, rise in the price may be caused by supply bottlenecks in the domestic economy or international events (generally wars) causing bottlenecks in the movement of internationally traded goods and causing thereby shortage of supply and rise in imported industrial inputs. The sudden rise in the OPEC oil prices of 1970s due to Arab-Israel
waristhefamousexampleofthesupplyshockinflationallovertheworld.The OPEC had more than quadrupled the oil prices between 1972 and 1974. The oil price (Arabian Lights/Dubai) had increased from $ 1.90 per barrel in 1972 to $ 10.41 per barrel in 1974. Due mainly to rise in the oil prices, the rateof inflation in Indiawas20.1% in1973–74, 25.2% in1974–75;17.1%in1979–80,and18.2%in1980–81comparedtotheannualaverageof6.1percentinflationduringtheprecedingandabout8percentinflationduring the succeeding decades. The other factors which had contributed to the high price-rise were failure of crops in 1972–73, aftermath of 1971 war andinfluxofBangladeshrefugees.Forthesereasons,priceshadrisenby32
NOTES
Self-InstructionalMaterial 211
Business Cycles and Business Policy
percentinSeptember1974.Thiskindofinflationfallsinthecategoryofsupply-shockinflation.
10.4 CONTROL OF DEFLATION
A economic scenario where there is a decline in general price levels of commoditiesandservicesisreferredtoasdeflation.Deflationsetsinwhentheoverallpricelevelfallsbecauseofwhichinflationratebecomesnegative.Deflationincreasestherealvalueofmoneyandonecanbuymoregoodsandservice with it than before.Measurestocontroldeflationincludes: • Credit expansion: Bank credit should be made easily available to the
public and business concerns. • Lowering the taxation: When the prices of goods and services are
reduced than previous one. This will lead to tremendous increase in the purchasing power of the people.
• Repayment of public debt: This would result in an increase in the amount of currency in the economy which helps to eradicate the deflation.
• Initiatives to attract more investments: This will attract the foreign institutional investors and domestic entrepreneurs to set up their businesses in the economy.
10.4.1 Effects on Business Cycle
Expansion and contraction phases are the two main parts of the business cycle. The expansion phase is dominated by strong demand for goods and services, and its inevitable effect is the driving up of prices. On the other hand, during the contraction phase of the cycle, demand weakens, incomes fallandunemploymentrises.Theresultisaweakeningoftheinflationrateataminimum,andiftherecessionissevereenough,deflation.Strongunderlyingsecular growth trend have shortened the recessions more than recoveries, so deflationhasnotbeenanissueoflastingconcern.Buteverytimeinflationdrops to a low level, economists worry.
Check Your Progress
1. List any two characteristics of a business cycle. 2.Namethetypesofinflation.

Business Cycles and Business Policy
NOTES
Self-Instructional 212 Material
10.5 ANSWERS TO CHECK YOUR PROGRESS QUESTIONS
1. Two characteristics of a business cycle are as follows: • Business cycles occur periodically: The duration of cycles varies
from a minimum of two years to a maximum of ten to twelve years. They do not show same regularity but they have some distinct phases such as expansion, peak, contraction or depression and trough.
• Business cycles are synchronic: It means that they do not cause changes in any single industry or sector but are of all embracing character.
2.Thetypesofinflationare(i)moderateinflation(ii)gallopinginflation(iii)hyperinflation(iv)demandpullinflation(v)costpushinflation.
10.6 SUMMARY
• Business cycles occur periodically. The duration of cycles varies from a minimum of two years to a maximum of ten to twelve years. They do not show same regularity but they have some distinct phases such as expansion, peak, contraction or depression and trough.
• The upward and downward movements in these magnitudes show different phases of business cycles. Basically, there are only two phases in a cycle, viz., prosperity and depression.
• Inflationmeansgenerally anundulyhighandpersistent rise in thegeneral level of prices over a period of time. However, there is no universallyacceptabledefinitionofinflation.
• Inflation is amonetary phenomenon and it is generally caused byexcessive money supply.
• Inflationonthebasisofrateisclassifiedas(i)moderateinflation,(ii)gallopinginflation,and(iii)hyperinflation.Anotherkindofinflationreferredtoincontemporaryinflationstudiesis‘suppressedinflation’.
•Thedemand-pullinflationoccurswhentheaggregatedemandincreasesat a much higher rate than the aggregate supply.
•Cost-pushinflationisgenerallycausedbymonopolisticgroupsofthesociety,likelabourunionsandfirmsinmonopolisticandoligopolisticmarket setting.
•Deflationmeansaneconomicscenariowherethereisdeclineingeneralprice levels of commodities and services.

NOTES
Self-InstructionalMaterial 213
Business Cycles and Business Policy
• The two main parts of the business cycle are the expansion and contraction phases. The expansion phase is dominated by strong demand for goods and services, which has the inevitable effect of driving up prices.
10.7 KEY WORDS
• Business cycle: It refers to the periodic booms and slumps in economic activities,generallycomparedto‘ebbandflow’.
• Inflation: It means generally an unduly high and persistent rise in the general level of prices over a period of time.
•Deflation: It means an economic scenario where there is decline in general price levels of commodities and services.
10.8 SELF ASSESSMENT QUESTIONS AND EXERCISES
Short-Answer Questions
1.WhatisthecurrentpositionofinflationinIndia? 2.Listthecharacteristicsofinflation. 3.Writeashortnoteonthekindsofcostpushinflation. 4.Listthemeasurestocontroldeflation.
Long-Answer Questions
1. Discuss the phases of a business cycle. 2.Whendoesdemandpullinflationtakeplace?Whatareitskinds? 3.Criticallyanalysetheeffectsofinflationanddeflationonthebusiness
cycle.
10.9 FURTHER READINGS
Dwivedi,D.N.2008.Principles of Economics,SeventhEdition.NewDelhi:Vikas Publishing House.
Weil.DavidN.2004.Economic Growth. London: Addison Wesley.Thomas, Christopher R. and Maurice S. Charles. 2005. Managerial
Economics: Concepts and Applications,EighthEdition.NewDelhi:TataMcGraw-HillPublishingCompanyLimited.
Mankiw,GregoryN.2002.Principles of Economics, Second Edition. India: Thomson Press.

Product Line
NOTES
Self-Instructional 214 Material
BLOCK - III
ECONOMIC APPROACHES
UNIT 11 PRODUCT LINEStructure 11.0 Introduction 11.1 Objectives 11.2 Reasons required for Changing Existing Product Mix
11.2.1 SignificanceofElementsofProductMix 11.2.2 Product Mix Strategy 11.2.3 ProductMixModifications 11.2.4 FactorsDeterminingtheScopeofProductLine 11.2.5 ProductLinePricing 11.2.6 SpecialOrderPricing 11.2.7 PricingComplementaryProducts
11.3 Answers to Check Your Progress Questions 11.4 Summary 11.5 Key Words 11.6 SelfAssessmentQuestionsandExercises 11.7 Further Readings
11.0 INTRODUCTION
Amarketing-orientedcompanydoesnotmerelysellthephysicalproductbutalsosellscustomersatisfactionalongwithit.Marketingstrategyinvolvesthedeterminationofthelevelofcustomersatisfaction.Thustheproductsthataremarketed,includephysicalgoods,services,experiences,persons,organization,informationandideas.Aproductmixisthesetofallproductsanditemsthataparticularselleroffersforsale.Productmixisthecompositeofproductsofferedforsalebyafirmorbusinessunit.Itisasetofallproductlinesanditemsthataparticularcompanyofferstobuyers.Thenatureoftheproductmixisattimesdescribedusingexpressionslikedepth,widthandconsistency.Inthisunit,youwillstudyaboutreasonsrequiredforchangingtheexistingproductmix.Youwillalsostudyaboutthefactorsdeterminingthe scopeofproduct line, product linepricing, special orderpricing andpricingcomplementaryproducts.
11.1 OBJECTIVES
Aftergoingthroughthisunit,youwillbeableto: • Statethereasonsrequiredforchangingtheexistingproductmix •Listthefactorsdeterminingthescopeofproductline

NOTES
Self-InstructionalMaterial 215
Product Line •Defineproductlinepricing • Prepareanoverviewofpricingcomplementaryproducts
11.2 REASONS REQUIRED FOR CHANGING EXISTING PRODUCT MIX
Theproductmixofacompanyis immenselyinfluencedbyits long-termobjectives.Theremaybemore thanone long-termobjective,but for theconvenience of this study,we can divide it into threemain parts: profitobjective,salesstabilityobjectiveandsalesgrowthobjective.
1. Profit objective
Profitmaximization is themainobjectiveof every company. Inorder tofacilitatethis,thecompanymaydecidetoaddaproductorproductsintheproductmixwhich aremoreprofit-oriented.Themarketermay take thedecisiontoimprovethelessprofitableproductandabsolutelyabandontheproductionofunprofitableproducts.
2. Sales stability objective
In order to fully utilize its production capacity, every company aims athavingstablesalesvolume.Theyalwayswanttoavoidasituationwheresalesmayfluctuatewidely.Forexample,ifthesalesvolumeofthecompanyreachesitspeak,thecompanymayrequireadditionalproductioncapacity.Butifduetocertainreasons,thesalesofthecompany’sproductdeclines,theproductioncapacitymayremainidle,leadingtoaheavypenaltyonthecompany’sinvestmentandahugefinanciallosstothecompany.Therefore,thecompanyhastoensurethatitachievesstabilityofsalesvolume.Thismayrequirethecompanytoinitiatechangesinitsproductmix.
3. Sales growth objective
Thesuccessofacompanycannotbeensuredonlybythestabilityofsalesvolume.This has to be further supported by comprehensive efforts ofmarketers to increase thesaleof thecompany’sproducts.Toachieve theobjectiveofsalesgrowth,thecompanyisrequiredtoinculcatechangesintheproductmix,keepinginviewthelife-cycleoftheexistingproducts.Aproductwhichhasreachedthesaturationpoint,shouldimmediatelybescrapped.Theoptionsthatareavailablewiththecompanyareeithertoimprovetheproductortoaddsomenewproducts.Itmayeventrytoenteranewmarketsegmentbyimprovingtheproducts.Suchstepscanenhancethesalespotentialofacompany’sproductmix.

Product Line
NOTES
Self-Instructional 216 Material
Nature of Product Mix
Productmixisasetofallproductlinesanditemsthataparticularcompanyofferstobuyers.Thenatureoftheproductmixisdescribedintermslikedepth,widthandconsistency.
1. Depth
Thedepthofaproductonlyreferstothenumberofvariantsthatareofferedforeachproductintheline.Forexample,HindustanLeveroffersClose-uptoothpasteinsizesof20gms,50gms,150gms,etc.Inthiscase,thereisaproductdepthofthree.Similarly,Haloshampoocomesinthreedifferentformulationsinthreedifferentsizesandhencehasaproductdepthofnine.Thiskindofassortmentispopularlyknownasstockkeepingunits(SKUs).
2. Length
Thelengthofproductmixreferstothetotalnumberofitemsinthemix.Thisisobtainedbydividingthetotallengthbythenumberoflines.TaketheexampleofProcterandGamblecompany,whichoffersdifferentproductlines.Itcarriesdifferentdetergentbrands,suchasArielandTide.
3. Width
Thewidthofproductmixreferstotheextentofdifferentproductlinesintheproductmixofferedby the company.For example,FMCGcompanyHindustanLeveroffersdifferentproductsliketoothpaste,detergent,bar/soap,etc.
4. Consistency
Theconsistencyofproductmixreferstotherelatednessofvariousproductlines.WecansaythatNestlé’sproductlinesareconsistent,inthesensethattheyareallfoodproducts.
11.2.1 Significance of Elements of Product Mix
Thethreeproductmixelementsare: (i)Depth (ii)Widthand (iii)Consistency.
Theproductmixelementsareverysignificantformarketersastheyform thebasis for rationalizationof themarketingprocess.Byenlargingthewidth, i.e., by increasing product lines, a company can satisfy itscustomers’needforvarietybymakingproductsofdiversequalitiesinthesameproductline.AcompanyproducingTVsmaymakethemindifferentsizesandqualities,keepinginmindthewiderangeofcustomers.Bydoingthis, thecompanymayspecializeinaparticularproductlineandthereby

NOTES
Self-InstructionalMaterial 217
Product Lineincreaseitsgoodwillandprofitabilitybyreducingthecostofproductionanddistribution.Thecompanycanalsocarryoutresearchworktoimprovethequalityofproducts.Itgivesthecompanyanopportunitytomakeadecisionaboutaddingnewproductsorimprovingthequalityofproduct.However,itshouldbekeptinmindthatnowadays,consumerspaymoreattentiontoqualitythanthepriceoftheproduct.
Incase there isconsistencyofproduct in theproduct lineor if theproduct belongs to the same category of consumer goods, it can reduceproductioncosttoagreatextent.Thecostofdistributionoftheproductmayalsocomedownbyusingthesamechannelsofdistributionandadvertisement.
11.2.2 Product Mix Strategy
The fact that a company likeGodrejmanufacturesdiverseassortmentofproducts,suchas,refrigerators,furniture,soaps,steelalmirahs,etc.,isnotbyaccident.Infact,itreflectstheplannedmarketingstrategyofthecompany.Tobesuccessfulinmarketing,manufacturers,distributorsandretailersneedtoadoptacarefully-craftedstrategyformanagingtheirproductmixes.
1. Product positioning
Therevenuegeneratedbytheproduct’ssalesandcompany’sprofitsdependstoagreatextentontheabilityofthemanagementtoattractcustomerstowardstheproduct.Alsoitdependsonthecapabilitytosuccessfullyachieveproductdifferentiationthatenablestheconsumertodistinguishtheproductfromthatofthecompetitors.Thus,whatisneeded,isaproductpositioningstrategythatenablesthecompanytodevelopastrongimageforitsproduct,vis-à-vis,competitors.Marketerscanoptforavarietyofproductpositioningstrategies:
2. Positioning in relation to the competitors’ product
Somemarketers prefer to put their product directly against that of thecompetitor’s—particularlywhen their product has a solid differentialadvantage.AfterlaunchingitsMicro-processor,Intelstartedacampaigntoconvincebuyersaboutthesuperiorityofitsproductvis-à-viscompetitors.Thecompanyevenpaidmoneytocomputermanufacturerstoincludetheslogan‘Intelinside’intheiradvertisingcampaign.Incasethecompetitorhasastrongmarketposition,‘HeadtoHead’positioningstrategyisexactlywhatthemarketersneedtodo.
3. Positioning in relation to a product class or exclusive feature
Sometimesmarketers adopt a positioning strategy that puts emphasison associatingor disassociating its product a class or an attribute.Somecompaniespromotetheirproductsas‘belongingtoanexclusiveclass’,suchas‘MadeinJapan’orhavingsomeattractivefeatures,suchas‘lowincalorie’orenergyconsumption,energysaver,environment-friendly,etc.Thisstrategy

Product Line
NOTES
Self-Instructional 218 Material
iswidelyusedbyfoodproductmanufacturers,whohighlighttheattributesoftheproductascholesterolfree,fatfree,sugarfree,etc.
4. Positioning by price and quality
Somegarmentmanufacturers and retailers likeRaymonds,VanHeusenandLouisPhillipeofferhighqualityproductsatapremiumprice. In theautomotivesegment,positioningisdoneonthebasisofexclusivefeatureslikehighqualityandhighprice.Forexample,MarutiSX4,HondaCivic,CorollaAltis,etc.
5. Positioning in relation to target markets
Whicheverpositioningstrategyacompanymayprefer,itmustalwaysgivedue consideration to the targetmarket.Using this strategy, the companymayfinditmoreconvenienttoaddresstheneedsandaspirationsofdifferentconsumersregardingtheirchoice,taste,pricepreferences,qualitypreferences,etc.
6. Trading up and trading down
The strategyof tradingupand tradingdown requiresmarketers tobringchangesintheproductpositioningandexpandtheproductline.Tradingupwouldmeanaddingpremiumpricedproductstoattractthehigh-endmarket.Thisstrategywillhelpacompanyinenhancingthesaleofitslow-pricedproductswhileencashingontheprestigeofthenewproduct.
Tradingdowninvolvesaddinglowpricedproductsinthecompany’sproduct line.According to thecompany’sstrategist, thosewhocouldnotaffordtobuytheproductearlierduetoitshighprice,cannoweasilyaffordthelow-pricedproductandcanthusfurtherenhancethecustomerbaseofthefirm.Aspertheconsumer’spsychology,buyingthelow-pricedproductofacompanywillprovidethestatusandbenefitsofthecompany’shigh-endproducts.
However,thereisanegativesideofthetradingdownstrategy,asthenewofferingmaypermanentlyspoilthecompany’sreputationandalsothatofitshighqualityproduct.Tominimizethissideeffect,thecompanymaygiveanewbrandnametoitslow-pricedproduct.
Incaseoftradingupstrategytoo,marketersarerequiredtobeextremelycautiouswhileformulatingtheirstrategy.Inthiscase,theproblemdependsonthefactthatwhetherthenewproductorlineusesthesamebrandwhichisalreadyestablishedorisgivenanewname.Incasethecompanydecidestocontinuewiththesamebrandevenforitsnewproduct,itmusttakestepstochangeit’simageinsuchamannerthatitwillnotbedifficultforcustomerstoacceptthehigh-pricedproduct.However,marketersdonotwanttolosetheiroldcustomers.Ifthecompanydecidestouseadifferentbrandname,

NOTES
Self-InstructionalMaterial 219
Product Lineitmustcreateawarenessamongconsumersandthenstimulatethemtobuythenewproduct.
7. Product mix contraction
Whileusingthisstrategy,marketerseithereliminatetheentirelineofproductsorconsolidatetheassortmentwithaline.Forexample,sometravelagenciesinstead of selling all kinds of travel services, decided to concentrate onspecializedtoursandtripstoexoticplaces.How many products/variants: Variouscompaniesandtheirdifferentbrandedproductsarefightingfortheshrinkingshelfspaceofretailingcompanies,whichinturnhascompelledmarketerstoreworkontheirbrands.Duringthepost-liberalizationphase,alargenumberofmultinationalcompaniesenteredtheIndianmarket.Asaresult,therewasintensecompetitionbetweenthedomesticandmulti-nationalcompanies.Togeneratemaximumexcitementamong consumers, the companies launched several variants of the sameproduct—newpackaging,newformulations,differentflavours,additionalquantityatthesamecost(25%extra),etc.
Infact,accordingtomarketers,extensionsareconsideredtobethebestwayofrespondingtoconsumer’sdesires.However,alargenumberofnewofferingsalsoposeaproblemforretailersintheformoflackofshelfspace.Thisproblemmayforceshowroommanagerstosqueezemoreitemsintotheirstorebyreducingtheaveragespaceallocatedtoeachoftheseitems.
11.2.3 Product Mix Modifications
Acompany’sproductmixisneverstatic.Customers’preferenceschange,newcustomersegmentsemerge,andcompany’scompetenciesandprioritieschange.Allthesechangeswarrantachangeinacompany’sproductmix.
(i) Product mix expansion
Productmixexpansionisachievedbyincreasingthedepthwithinaparticularproductline,i.e.,newbrandsorvariantsofexistingbrandsareaddedtotheproductlineand/orbyincreasingthenumberofproductlines.
(ii) Line extension
Whenacompanyaddsasimilaritemtoanexistingproductlinewiththesamebrandname,itiscalledlineextension.Acompanyresortstolineextensiontoappealtomoremarketsegmentsbyofferingawiderangeofoptionsofflavours,colour,size,etc.,foraparticularproduct.
(iii) Mix extension
Newproductlinesareaddedtothecompany’spresentassortment.Thenewlinesmayberelatedorunrelatedtothecurrentproducts.Thecompanymayuseoneoftheexistingbrandnamesormaygiveanentirelynewnametothe

Product Line
NOTES
Self-Instructional 220 Material
newproductlines.Whenacompanyusesoneofitsexistingbrandstoofferanewproductline,itiscalledbrand extension.
(iv) Product mix contraction
Productmixcontractionisachievedeitherbyeliminatinganentireproductlineoreliminatingafewproductsorbrandsfromwithinaline.Theideaistoweedoutunprofitableproductitemsorproductlinesandearnhigherprofitsfromfewerproducts.
(v) Repositioning
Repositioninginvolveschangingcustomers’perceptionsofabrand.Itinvolveschangingtheproduct’sattributesandcommunicationtothecustomers.
(vi) Product modification
Productmodificationwill involve changing the quality levels of theproductitemtomakeitmoreappropriateforthetargetmarket,functionalmodificationstoreflectchangingcustomerrequirementsandtoincorporatelatesttechnologiesandstylemodificationtoappealtocustomers’emergingaesthetic concerns.
(vii) Planned obsolescence
Thisisthepracticeofmodifyingproductssothatthosethathavealreadybeen sold become obsolete before they actually need replacement.Themodified product is substantially different and better than the earlierversion,andcustomerswhopossesstheearlierversionfeeldisadvantagedorunfashionable.
11.2.4 Factors Determining the Scope of Product Line
Productlineinvolvesthecreationofagroupofproductsthathavesimilarfeatures and perform the same functions.They aremarketed to similarcustomergroupsthroughthesamechannelsofdistribution.Aproductlinemayconsistofproductshavingvarioussizes,types,quality,colourandprice.Anexamplewouldbetherangeofsoapsmanufacturedbyacompanywhicharedifferentinsizesfragrance,colourandprice.Theimportantfeaturesofaproductlineareasfollows:
Line stretching
Thistypeofstrategyisusedbythemarketerwhenhefeelsthathecanincreasethecompany’sprofitabilitybyaddingordeletinganitemfromitsproductline.Thelinestretchingcaneitherbeanupwardordownwardmovement.
Upwardstretchingtakesplacewhenthecompanymovesorattemptstoreachtheupperendofthemarketthroughalineextension.Thecompanypreferstogoforupwardlinestretchingtoachieveahigherrateofgrowth

NOTES
Self-InstructionalMaterial 221
Product Lineandbettermargins.Theexampleof‘Lifebuoysoap’canexplainthecaseofupwardlinestretching.Whenthissoapwaslaunched,itwasmarketedasahygienicbathingsoapforthemasses,butlater,thecompanychangeditsstrategyandextendeditintoapremiumqualityliquidhandwashfortheupperstrataofsociety.
Downwardstretchingtakesplacewhenthecompanydecidestobringdown thepriceofaproduct inorder tomake itavailable to the lowendconsumers.TaketheexampleofArieldetergentpowder,whichstartedoutasapremiumproductfortheupperstrataofsociety,butwaslaterintroducedasArielBarinordertoattractlowerincomebuyers.
Line filling
Thisstrategyinvolvesincreasingthelengthoftheproductlinebyaddingmoreitems.Thereasonsbehindtheadoptionofthelinefillingstrategyare: (i)Toachieveincrementalprofits. (ii)Tosatisfythosedealersanddistributorswhocomplainaboutlostsales
duetoamissingproductline. (iii)Toutilizetheexcesscapacity. (iv)Toofferfullproductline. (v)Toadjustproductpositioning.
ThelaunchofLuxsoapindifferentvariantsisanexampleoflinefilling.Today,Luxismarketedindifferentwrappingsandfragrances.ThereisalsoaLuxInternationalsoapthathasanexclusivepackagingandthephotographofanactressormodelonthecover.
Such a strategy is adopted to enable the customers to differentiatebetweeneachitem.Eachitemmusthaveadistinctfeaturewhichwillsetitapartfromothers.
Line modernization
Incasethelengthoftheproductlineisalreadyadequate,itisadvisabletomodernizetheproductline.Here,theoptionbeforethecompanyiseithertooverhaulthelineofproductscompletelyoroneatatime.Onestrategyistoadoptapiecemealapproachwhichprovidesthecompanywithanopportunitytoevaluatethereactionofthecustomerstoanewstyle.However,themajordisadvantageof thispiecemealmodernization is that itgivescompetitorsan opportunity to see the changes and they can redesign their own lineaccordingly.
Intoday’senvironmentwhenthemarketischangingrapidly,thereisaneedtocarryoutthetaskofmodernizationcontinuouslyasthecompetitorsarealwaysmakinganattempttoupgradetheiroptions.Thusitisadvisablethateachcompanymustconstantlytrytore-designtheirofferings.

Product Line
NOTES
Self-Instructional 222 Material
Thecompanyshouldalsoensurethatmoreseriousattentionispaidtothetimingfactorinproductlineimprovements.Itshouldneitherbetooearlysothatitcausesdamagetothesalesofthecurrentproductlinenorshoulditbetoolatesoastoprovidecompetitorswithanopportunitytocompletelycapturethemarket.
Line Featuring
Under this strategy, the primeobjective of the company is to attract thecustomers andmake them visit their showroom by highlighting someexclusivefeaturesofoneormoreproducts.Whentheyvisittheshowroom,theyareexposedtootherproductrangesandmodels.Withthisstrategy,thecompanymaytrytoattracteitherhigh-endorlow-endcustomers.Sometimes,thecompanymaymakeanattempttoboostthesalesofsomeslow-movingitemsthroughthisstrategy.
11.2.5 Product Line Pricing
Productlinepricingpolicyisusuallyprevalentamongretailers.Thispolicyisclosertopsychologicalandcustomarypricing.Underthispolicyproductsarepricedatdifferent levels inorder toappeal toadifferent segmentofcustomers. For example, an appliancemanufacturer produces differentversionsoftelevisionslikeabasic,smartTVandapremiumrangetosuitdifferentpockets.
Productlinepricingpolicyisfollowedkeepinginmindtheinterestofconsumersforwhompricingisimportantinchoosingaparticularmodelofaproduct.Underthispolicy,pricingdecisionsaretakenattheinitialstagesandtheyremainfixedforalongerperiodoftime.Anychangeinthemarketconditionsareusuallymadebyadjustingthequalityofthemerchandise.
11.2.6 Special Order Pricing
Specialorderpricingisa techniqueusedtocalculateprices.It isusedtocalculatethelowestpriceofaproductorserviceatwhichaspecialordermaybeacceptedandbelowwhichaspecialordershouldberejected.Abusinessusuallyreceivesspecialordersfromcustomersatapricewhichislowerthanthenormal.Insuchcases,thebusinesswillnotacceptthatspecialorderifallitsoutputhavetobesoldatanormalprice.However,whenthesalesareloworwhentheproductioncapacityhaltsforsometime,specialordersshouldbeacceptedbybusinessiftheincrementalrevenuefromspecialorderisgreaterthanincrementalcosts.
Thismethodofpricingspecialorders,whereinpricesaresetbelownormalpricesbutthesalestillgeneratessomecontributionperunit,iscalledcontributionapproachtospecialorderpricing.Themainideais that it isbettertoreceivesomethingabovevariablecosts,thanreceivingnothingatall.

NOTES
Self-InstructionalMaterial 223
Product Line11.2.7 Pricing Complementary Product
Complementaryproductpricingisamethodinwhichoneoftheproductsispricedinawaythatitincreasesthesalesvolumeandinturnstimulatesthedemandofotherproduct.
Oneproductispricedlow,justtocoverthecostswithlittleornoprofitmargin.Ontheotherhand,anotherproductispricedhighwithaveryhighprofitmargin.Boththeproductsarecomplementaryproductsi.e.useofoneproduct is complementedby theotherproduct.This strategy isbasicallyfollowedtoovercomethelossincurredbytheproduct’ssale,bytheprofitprovidedbythesaleoftheothercomplementaryproduct.
This strategy is applicable for example in printers and cartridges.Onceyouhaveboughtaprinter,youarerequiredtobuythecomplementarycartridgeunlessyouarewillingtobuyinanewprinteritself.Also,companieskeepacheckonthecompetitorssellinginkfortheirprintersbyhavinguniquecartridges.
Check Your Progress
1.Defineproductmix. 2.Whatislineextension?
11.3 ANSWERS TO CHECK YOUR PROGRESS QUESTIONS
1.Productmix isasetofallproduct linesand items thataparticularcompanyofferstobuyers.
2.Whenacompanyaddsasimilaritemtoanexistingproductlinewiththesamebrandname,itiscalledlineextension.
11.4 SUMMARY
•Amarketing-oriented company does notmerely sell the physicalproductbutalsosellscustomersatisfactionalongwithit.Marketingstrategyinvolvesthedeterminationofthelevelofcustomersatisfaction.
•Theproductmixofacompanyisimmenselyinfluencedbyitslong-termobjectives.
• Productmix isasetofallproduct linesand items thataparticularcompanyofferstobuyers.Thenatureoftheproductmixisdescribedintermslikedepth,widthandconsistency.

Product Line
NOTES
Self-Instructional 224 Material
•Theconsistencyofproductmixrefers totherelatednessofvariousproductlines.WecansaythatNestlé’sproductlinesareconsistent,inthesensethattheyareallfoodproducts.
•Tobesuccessfulinmarketing,manufacturers,distributorsandretailersneedtoadoptacarefully-craftedstrategyformanagingtheirproductmixes.
•The strategyof tradingup and tradingdown requiresmarketers tobringchangesintheproductpositioningandexpandtheproductline.Tradingupwouldmeanaddingpremiumpricedproductstoattractthehigh-endmarket.
•A company’s productmix is never static.Customers’ preferenceschange,newcustomersegmentsemerge,andcompany’scompetenciesand priorities change.All these changeswarrant a change in acompany’sproductmix.
• Product line involves thecreationofagroupofproducts thathavesimilarfeaturesandperformthesamefunctions.Theyaremarketedtosimilarcustomergroupsthroughthesamechannelsofdistribution.
• Pricelinepolicyisfollowedkeepinginmindtheinterestofconsumersforwhompricing is important in choosing a particularmodel ofproduct.
•ComplementaryProduct pricing is amethod inwhich one of theproducts ispricedtomaximizethesalesvolumeandwhichin turnstimulatesthedemandofotherproduct.
11.5 KEY WORDS
• Brand Extension:Whenacompanyusesoneofitsexistingbrandstoofferanewproductline,itiscalledbrandextension.
• Product Positioning:Itistheprocessusedbymarketerstodeterminethebestwaytocommunicatetheirproducts’attributestotheirtargetcustomersonthebasisofcustomerneedsandavailablecommunicationchannels.
11.6 SELF ASSESSMENT QUESTIONS AND EXERCISES
Short-Answer Questions
1.Brieflymentionthesignificanceofelementsofproductmix. 2.Writeashortnoteonthefactorsdeterminingthescopeofproductline.
NOTES
Self-InstructionalMaterial 225
Product Line 3.Whatisthemainpurposeofusingthespecialorderpricingtechnique?
Long-Answer Questions
1.Discuss the various product positioning strategies adopted by acompanyforsuccessfulmarketing.
2.Evaluatetheusageofcomplementaryproductpricingbyamarketingcompany.
3.GiveexamplesreflectingtheuseofproductmixstrategiesfromthepresentIndianmarketscenario.
11.7 FURTHER READINGS
Dwivedi,D.N.2008.Principles of Economics,SeventhEdition.NewDelhi:VikasPublishingHouse.
Weil.DavidN.2004.Economic Growth.London:AddisonWesley.Thomas, Christopher R. andMaurice S. Charles. 2005.Managerial
Economics: Concepts and Applications,EighthEdition.NewDelhi:TataMcGraw-HillPublishingCompanyLimited.
Mankiw,GregoryN.2002.Principles of Economics,SecondEdition.India:ThomsonPress.

Economic Concentration
NOTES
Self-Instructional 226 Material
UNIT 12 ECONOMIC CONCENTRATION
Structure 12.0 Introduction 12.1 Objectives 12.2 Meaning of Economic Power
12.2.1 Forms of Concentration of Economic Power 12.2.2 Domination of Markets 12.2.3 Growth of Large Industrial Houses and Concentration of Economic
Power 12.3 Answers to Check Your Progress Questions 12.4 Summary 12.5 Key Words 12.6 Self Assessment Questions and Exercises 12.7 Further Readings
12.0 INTRODUCTION
Smaller firms use market or economic concentration when they account for large percentage of the total market. It measures the extent of domination of sales of one or more firms in a particular market. Concentration ratio is used for the measurement of market concentration ratio. The market concentration ratio is used to measure the combined market share of all the top firms in the industry. In other words, it is used to measure the ‘Market Share’ of a firm or forms. It could be measured through the sales, employment statistics, number of people using a company’s services or products, number of outlets, etc. Herfindahl-Hirschman Index (HHI) is the most common measure to calculate the market concentration of a firm. This index is calculated by adding the square root of the percentage market share of each individual firm in the industry. In this unit, you will study about forms of concentration of economic power, market dominance, and growth of large industrial houses and concentration of economic power.
12.1 OBJECTIVES
After going through this unit, you will be able to: •Explain the meaning of economic power •Define market dominance •State the forms of concentration of economic power

NOTES
Self-InstructionalMaterial 227
Economic Concentration12.2 MEANING OF ECONOMIC POWER
Economic power can be defined as the potentiality of countries, businesses, or individuals to enhance their standard of living. To put it in simple words, it improves their freedom to make decisions which are beneficial to them. At the same time, it reduces the power of any outside force to lessen their freedom. Purchasing power is a vital element of economic power. Countries, business firms and individuals can obtain economic power by improving their income, hence, adding to their wealth. This gives them the liberty to purchase more and better goods/services to satisfy their needs.
The actual method of increasing income is by producing a good/service that is extremely beneficial to the world. The customers are willing to pay more for purchasing a product/service when they find it extremely useful to them. This might imply that a country manufactures technologically advanced equipment or software in some other country, thereby providing employment to that foreign land. Examples of such Multinational Companies (MNCs) are Reliance Industries, Apple, Google and so forth. As far as individuals are concerned, they acquire economic power and enhance their income by providing skilled expertise. Individuals providing this kind of service include lawyers, doctors, technicians and so forth.
In the context of economic power, the market structure also plays a significant role. Monopolies, for instance, have a huge economic power. They own majority of the desired product/service. The most poignant example in this regard is that of Google. It almost has a monopoly on the Internet search market. People use Google for 65 percent of all searches. Google faces stiff competition from Microsoft and Yahoo which comprise 34 percent of the remaining market.
12.2.1 Forms of Concentration of Economic Power
India’s independence was followed by the introduction of several changes in India, one of them being the establishment of big business houses such as that of Tata and Birla. After independence, India adopted in the centralized planning system—five year plans which provided a detailed account of the utilization of the country’s resources in the coming five years. The main objective of the five year plans was to accelerate the economic and industrial growth of the country.
The Government of India initiated numerous reforms which were based on the studied conducted by committees and commissions during the 1960s to handle the problem of License Raj. The first in this regard was the Mahalanobis Committee. The Mahalanobis committee submitted its recommendation to the government. Accordingly, the government passed the Commissions of Inquiry Act 1952, under which a Monopolies Inquiry

Economic Concentration
NOTES
Self-Instructional 228 Material
Commission was established in 1964. The Monopoly Enquiry Commission (1964) studied the extent, effect and causes of this concentration and concludes that, “Concentration has been promoted more by way of planned economy which was adopted for rapid industrialisation in the country.”
The Monopoly Enquiry Commission primarily stated two forms of concentration in 1964: 1. Product-Wise Concentration: When an individual or group has
authority over the production or distribution of any product/service, it is termed as product-wise concentration.
It is divided into three parts: (a) High Concentration: On 75% or more by 3 main producers or distributors. (b) Medium Concentration: On 60% to 75% by 3 main producers or distributors. (c) Low Concentration: On 50% to 60% of production or distribution by 3 main producers,
if the concentration is less than 50% it will not be considered as concentration.
2. Country-Wise Concentration: When the ownership or control of most enterprises engaged in
production or distribution of different goods is controlled by one person, family or industrial group it is called country-wise concentration.
12.2.2 Domination of Markets
Market dominance is a parameter of the quality of a brand, service or product relative to competition. While defining market dominance, one has to take into consideration as to what extent an item, brand, or firm controls an item’s classification in a given geographic area.
It is to be noted that several methods are available for the calculation of market dominance. The most widely used method is that of market share. This is the percentage of the total market served by a firm or brand. A declining scale of market shares is common in most industries: that is, if the industry leader has say 50% share, the next largest might have 25% share, the next 12% share, the next 6% share, and all remaining firms combined might have 7% share.
Market share does not truly reflect market dominance. The influence of customers, suppliers, competitors and government regulations must be taken into consideration as well. The general rules taken into account while determining the relationship between market share and market dominance, are the following:

NOTES
Self-InstructionalMaterial 229
Economic Concentration • It is believed that a business firm, brand, product, or service that has a combined market share exceeding 60% will certainly enjoy market power and market dominance.
• Likewise, a market share of over 35% but less than 60%, held by one brand, product or service, is indicative of market strength but not mandatorily dominance.
• Once again, a market share of less than 35%, held by one brand, product or service, is not an indicator of strength or dominance and will not raise anti-competitive concerns by government regulators.There are also chances that market shares within an industry might not
convey a declining scale. In a duopolistic market, there could be only two firms in a duopolistic market, each with 50% share; or there could be three firms in the industry each with 33% share; or 100 firms each with 1% share. The concentration ratio of an industry is largely utilized to indicate the relative size of leading firms in relation to the industry as a whole. One widely used concentration ratio is the four-firm concentration ratio, which comprises the combined market share of the four largest firms, as a percentage, in the total industry. The higher the concentration ratio, the greater the market power of the leading firms.
In contrast to this, is the Herfindahl index. It is used to ascertain the size of firms in relation to the industry and is also indicative of the level of competition existing among them. It is defined as the total of the squares of the market shares of each individual firm. For instance, it can range from 0 to 10,000, that is, from a very large amount of very small firms to a single monopolistic producer. Decreases in the Herfindahl index primarily indicate a loss of pricing power and an increase in competition, whereas increases denote the opposite.
12.2.3 Growth of Large Industrial Houses and Concentration of Economic Power
In the present arena of globalization the presence of MNCs in the emerging markets has given rise to debatable issue as to whether their presence is having a negative or positive impact on the economy of the host country. According to economic historian and scientist, Fogel (2006), greater oligarchic family control over large corporations is associated with worse economic outcomes, interventionist governments and underdeveloped market institutions in a group of 41 countries including India. Similarly, Khanna and Palepu (2000) and Khanna and Rivkin (2001) suggest, in opposition, that oligarchic family groups operate efficiently by creating their own internal capital and managerial talent markets, operting largely independently of the institutional environment denoted by bureaucracy, ‘red tapeism’ and market failure.

Economic Concentration
NOTES
Self-Instructional 230 Material
Growth of Business Groups in India
After independence, the government of India was determined to ensure that the concentration of wealth will not remain in the hands of a few people. Not only this, the Constitution of India addressed this concern too and made it obligatory on the part of the government to control the concentration of wealth and check the growth of large business houses.
In the 1950s, the government was afraid of concentration of power in the wake of the fast pace of economic growth anticipated by the economic planners. It became absolutely necessary to curb this essential aspect of the Indian economic policy of those days. As a result, all the business houses in India were supposed to function in a strict and regulated policy environment, popularly known as the License Raj. The business houses were required to take prior permission to issue capital, to raise money from financial institutions and to obtain foreign exchange. A high tariff was imposed on imported capital goods and raw materials.
For four decades from 1950, the growth of business groups was regulated by two principal legislative instruments: the Industries (Development & Regulation) (IDR), Act, 1951 and the Monopolies and Restrictive Trade Practices (MRTP) Act, 1969. The IDR Act was meant to prevent the concentration of wealth through a comprehensive system of licensing. The MRTP Act was designed to regulate and check the growth of assets and market power of business groups or enterprises. Periodic amendments were made to the IDR Act and the MRTP Act was revised in 1982 and 1984. The Government constituted four important committees in the 1960s in order to evaluate whether such government policies were effective in curtailing the concentration of wealth. It was found that till 1970, the share of the top 20 business groups owning private corporate assets increased during the 1950s. While the share of assets reported for the 1960s is not strictly comparable with that of the 1950s, there was again a discernible increase in the relative share of the business groups. This was widely attributed to ineffective policy implementation.
Between 1972 and 1984, the share of the Top-20 large business houses in corporate India’s total assets declined. But the assets of other large business groups increased, particularly in the second half of the 1970s. Further, between 1985 and 1989, the share of large business group assets in total assets of the whole corporate sector declined. This implied that policy measures succeeded in slowing the growth of large business groups between 1972 and 1989.
Reform measures introduced from 1991 removed a large number of regulatory checks in order to increase competition in the domestic economy. As a part of these policy changes, the MRTP Act was amended in 1991, abolishing the asset limits on its scope. Regulation of market dominance

NOTES
Self-InstructionalMaterial 231
Economic Concentrationand abuse of market power was extended to the operations of all firms. As a result, the relative share of gross value of the Top-50 business groups in GDP was increased by about a third of a percentage point.
In today’s scenario, it is to be noted that while on one hand, economic growth led by investors and promoted by a State-capital alliance has made India one of the fastest growing economies of the world; on the other hand, the concentration of economic power in the corporate sector has widened the rural-urban, regional and sector inequalities.
Check Your Progress
1. When was the Monopoly Enquiry Commission established? 2. Define economic power.
12.3 ANSWERS TO CHECK YOUR PROGRESS QUESTIONS
1. The Monopoly Enquiry Commission was established in 1964. 2. Economic power can be defined as the potentiality of countries,
businesses, or individuals to enhance their standard of living. To put it in simple words, it improves their freedom to make decisions which are beneficial to them.
12.4 SUMMARY
•Smaller firms use market or economic concentration when they account for large percentage of the total market. It measures the extent of domination of sales of one or more firms in a particular market.
•Herfindahl-Hirschman Index (HHI) is the most common measure to calculate the market concentration of a firm. This index is calculated by adding the square root of the percentage market share of each individual firm in the industry.
•Economic power can be defined as the potentiality of countries, businesses, or individuals to enhance their standard of living. To put it in simple words, it improves their freedom to make decisions which are beneficial to them.
• In the context of economic power, the market structure also plays a significant role. Monopolies, for instance, have a huge economic power. They own majority of the desired product/service.
• India’s independence was followed by the introduction of several changes in India, one of them being the establishment of big business

Economic Concentration
NOTES
Self-Instructional 232 Material
houses such as that of Tata and Birla. After independence, India adopted in the centralized planning system—five year plans which provided a detailed account of the utilization of the country’s resources in the coming five years.
•The Monopoly Enquiry Commission (1964) studied the extent, effect and causes of this concentration and concludes that, “Concentration has been promoted more by way of planned economy which was adopted for rapid industrialisation in the country.”
•When the ownership or control of most enterprises engaged in production or distribution of different goods is controlled by one person, family or industrial group it is called country-wise concentration.
• In the present arena of globalization the presence of MNCs in the emerging markets has given rise to debatable issue as to whether their presence is having a negative or positive impact on the economy of the host country.
•For four decades from 1950, the growth of business groups was regulated by two principal legislative instruments: the Industries (Development & Regulation) (IDR), Act, 1951 and the Monopolies and Restrictive Trade Practices (MRTP) Act, 1969.
12.5 KEY WORDS
•Market dominance: Market dominance is a measure of the quality of a brand, service or product relative to competition.
•Duopoly: A duopoly is a situation where two companies own all or nearly all of the market for a given product or service.
12.6 SELF ASSESSMENT QUESTIONS AND EXERCISES
Short-Answer Questions
1. Write a short note on the use and calculation of Herfindahl-Hirschman Index (HHI).
2. Define four-firm concentration.
Long-Answer Questions
1. Explain the concentration of economic power in India after independence.
2. Discuss the legislative instruments introduced by the Government of India to curb concentration of economic power.

NOTES
Self-InstructionalMaterial 233
Economic Concentration12.7 FURTHER READINGS
Dwivedi, D. N. 2008. Principles of Economics, Seventh Edition. New Delhi: Vikas Publishing House.
Weil. David N. 2004. Economic Growth. London: Addison Wesley.Thomas, Christopher R. and Maurice S. Charles. 2005. Managerial
Economics: Concepts and Applications, Eighth Edition. New Delhi: Tata McGraw-Hill Publishing Company Limited.
Mankiw, Gregory N. 2002. Principles of Economics, Second Edition. India: Thomson Press.

Foreign Investment
NOTES
Self-Instructional 234 Material
UNIT 13 FOREIGN INVESTMENTStructure 13.0 Introduction 13.1 Objectives 13.2 Types of Foreign Investment and FDI
13.2.1 Types of Foreign Direct Investment 13.2.2 Methods of Foreign Direct Investment 13.2.3 FDIInflowinIndia 13.2.4 FDI in Developing Countries 13.2.5 Guidelines for Foreign Investments 13.2.6 FDI in Various Sectors and Euro Issues 13.2.7 FII
13.3 AnswerstoCheckYourProgressQuestions 13.4 Summary 13.5 Key Words 13.6 SelfAssessmentQuestionsandExercises 13.7 Further Readings
13.0 INTRODUCTION
According to the latest data of theDepartment of Industrial Policy andPromotion (DIPP),ForeignDirect Investment (FDI) in2017-18grewbyonly3percentto$44.85billion.Foreigninflowsinthecountrygrewby8.67percentin2016-17,29percentin2015-16,27percentin2014-15,and8percentin2013-14.Indiahasdoneconsiderablywellintermsofmovinguptherankingintermsofeaseofdoingbusiness,however,itneedstoreacha level that creates enthusiasm for the overseas investors. FDI is important asIndiawouldrequirehugeinvestmentsinthecomingyearstooverhaulitsinfrastructuresectortoboostgrowth.Declineinforeigninflowscouldput pressure on the country’s balance of payments and may also impact the valueoftherupee.ThisunitwillintroduceyoutotheconceptofFDIwithspecial reference to India.
13.1 OBJECTIVES
Aftergoingthroughthisunit,youwillbeableto: •Defineforeigndirectinvestment(FDI) •DiscusstheinflowofFDIinIndia • State the guidelines for foreign investments in India • PrepareanoverviewofForeignInstitutionalInvestor(FII)

NOTES
Self-InstructionalMaterial 235
Foreign Investment13.2 TYPES OF FOREIGN INVESTMENT AND FDI
Foreigndirectinvestmentisoneofthemosteffectivemethodsofcross-borderinvesting.Aforeignnationalmaywanttoinvestinacountryofferingnewmarkets,higherreturnsorcheaperfactorcosts.
Generally,therearetwokindsofcross-borderinvestments,whicharementionedasfollows: • Foreign Direct Investment (FDI): Investments made by a company or
entitybasedinonecountry,intoacompanyorentitybasedinanothercountry
• Foreign Portfolio Investment (FPI):Investmentsundertakenforthepurposeofreturnswithoutanyburdenofdecision-makingUnitedNationsConferenceonTradeandDevelopment(UNCTAD)
definesFDIasan‘investmentmadetoacquirelastinginterestinenterprisesoperating outside of the economy of the investor.’
Foreign direct investment is an important source of capital for a country. Itisespeciallyimportantfordevelopingcountrieswheretherateofcapitalformationislowandtherequirementforcapitalishigh.FDIisamethodbywhichtheresidentsofacountrymayinvestinanothercountry.FDI,alongwithprovidingreturns,alsohasdecision-makingrightsintheentitywheretheinvestmentismade.FDIoftenentailsacquiringafactoryorfacilityorevenstartingonewiththeintentionofformingabaseinthatcountry.
FDI leads to investing directly in the production process or any other business(retailorservicesector)ofanycountryotherthantheonewheretheinvestorresides.FDIentailsthetransferofownershipalongwiththetransferofotherfactorslikemanagementandtechnology.FDIinvestmentsworldwidehave seen a downturn following thefinancial crisis and the recessionarytrendsintheworldeconomy.
FDIistheflowoflong-termcapitalfromoneeconomytoanother.FDIflowinginandoutofaneconomyisreflectedintheBalanceofPayments(BoP)ofthatcountry.TheFDIisplacedinthesecondaccountoftheBoP,thecapitalaccount.TheincomegeneratedthroughFDIinvestmentisreflectedin the current account.
Table 13.1 Difference between FDI and FPI
Basis of Difference
Foreign Direct Investment (FDI)
Foreign Portfolio Investment (FPI)
Management and Control
Involved in management and ownershipcontrol
No active involvement in management. Investment instruments are more easily traded and do not represent controlling stake

Foreign Investment
NOTES
Self-Instructional 236 Material
Liquidationofinvestment
Difficulttoliquidateinterestorpull-out
Interesteasilyliquidatedandeasytopull-out
Liquidity Investmentshavelowliquidity
Highlyliquidinvestments
Origin Undertakenbymultinational corporations
Diversesourceslikemutualfunds,equityanddebtinstrumentsaswellaspension funds
Investment Investmentoffinancialandnon-financial(technologyandmanagementskills)assets
Onlyfinancialinvestment
Volatility Lowlevelofvolatility High level of volatility
Source: www.diffen.com/difference/FDI_vs_FPI
13.2.1 Types of Foreign Direct Investment
Foreigndirectinvestmentcantakeplaceinthefollowingways: 1. Vertical: When a company invests in a different country in the
same industry but in a process that is either after or before the one itiscurrentlyinvolvedin,itisacaseofverticalFDI.TherearetwocategoriesofverticalFDI,whichareasfollows:
• Backward Vertical: It is the investment in procedures that bring thecompanyastepclosertotheactualrawmaterials.Forexample,areadymadeclothesmanufacturerofChinabuysatextilefactoryin India.
• Forward Vertical: It is the investment in procedures that bring thecompanyastepclosertothedirectionofthemarketitcaters.For example, the readymadegarmentsmanufacturer ofChinabuys a retail chain dealing in readymade garments in Australia.
2. Horizontal: The company invests in the same activity it has been conductinginthehomecountry.Forexample,readymadegarmentsmanufacturer invests in a garment manufacturing factory in Germany.
3. Conglomerate:Thisisaninvestmentintoanunrelatedfield.ThistypeofFDIcarriesadoubleelementofriskasnotonlyisthecompanyenteringanewcountrybutitisalsoinvestinginafieldwhichmightnot be related to its core competencies.Therefore, the companyencounterstwicetheamountofbarriers.Investinginanewcountryanddiversificationcannotbeconsideredcomplementary strategies.Theyare,infact,mostoftenthoughtofasalternativestrategies.
4. Greenfield entry: When a company invests and establishes facilities aswellaselementsfromtheinitialstage,itiscalledaGreenfieldentry.Forexample,ifthegarmentmanufacturerweretostartafacilityby

NOTES
Self-InstructionalMaterial 237
Foreign Investmentbuyingland,hiringpeople,buildingthefactory,installingmachineryandultimatelymanufacturinggarments,itiscalledaGreenfieldentry.
5. Foreign takeovers:Thecompany takesoveranalready functionalfacility and does not have to go through the effort of establishing one themselves.Forexample,themanufacturerfromChinamaytakeovera garment manufacturing unit in South Africa.
13.2.2 Methods of Foreign Direct Investment
The various methods and strategies of foreign direct investment are enlisted asfollows: 1. License/franchisee: The company may decide to limit its FDI to
technological or other license or franchisee. The company may be unsureof themarketsizeorevenundertakethestrategytotest themarketbeforemakinganyfurthermoves.
2. Joint venture: The company may decide to go a step further than justsupplyingthetechnologyorexternalsupportandmaydecidetocommitcapitalonalargerscale.Insuchcases,thecompanyshouldenterintoajointventurewithanothercompanyfromthatcountryoranothercountrywithsomeexperienceinthelocalmarkets.
3. Wholly owned subsidiary:Thecompanymaydecidetosetupawhollyownedsubsidiaryinthenewcountry.
Motives or Benefits of Foreign Direct Investment
Thevariousbenefitsofforeigndirectinvestmentareasfollows: (a)Benefits to investor (MNC): Investors are interested in investment
opportunitiesoutsidetheirowncountryduetothefollowingreasons: •Diversificationofsystematicrisk • Earning higher returns as compared to the ones available at home •Opportunitytotakeadvantageofnewmarkets •Chancesoftaxsaving •Long-termopportunitiesofexpansionandprofitability •Benefitsofeconomiesofscope • Reduction in transportation costs (b)Benefits to investor’s economy: The economy of the investor also
stands to gain from the investment of funds in the form of FDI to other economies.Thesebenefitsareasfollows:
• Inflowofforeigncurrencyintheformofreturns • Increaseintaxableincomeintermsofforeignexchange (c)Benefits to the economy receiving FDI:Thebenefitsfortheeconomy
receivingFDIareself-evidentandarediscussedasfollows:

Foreign Investment
NOTES
Self-Instructional 238 Material
• Development of infrastructure • Creation of jobs • Enhancement of technology due to the import of latest technology • Increase in productive capacity • Positiveeffectoncapitalaccount • IncreaseinGDPduetoincreasedproduction • Lesser importing of goods
Effects of Foreign Direct Investment
FDIbenefitsarecharacterizedby increasedcapital inflow,domesticskilldevelopment,competitivemarkets,andimprovement inbalanceof trade,higher forex reserves, and building operational efficiencies.Let us nowunderstandtheeffectsofFDIparticularlyintheIndiancontext.
FDIinIndiaincreasedbyaround29percentin2015/16to$40billion.However,itstillformsaround1.8percentofGDP,asopposedtogrossfixedcapitalformationbeing29.3percentofGDP.Whenaforeignfirminvestsindomesticmarkets,itcreatespositivecascadeeffectsbyengagingwithlocalvendorsanddistributors.Thisresultsinhigherdomesticinvestment,inbothtechnologyandhumanresources.Thus,whileFDIroutehasopened,domesticinvestmentwouldcontinuetogrowwithbettertechnology,competitionandsubsequentspill-overs.
Marutihasseenmultiplelabourstrikes;Nestlé’smarketcapwaserodedbyalmost$1billionduringasinglesessioninJune2015,whenMaggiwasengulfedinacontroversy.Foreigninvestorswillhavetoprovidefavourableworking conditions, complywith the lawof the land just like domesticenterprises,andadapttoIndianindustrialclimatewhiletheyenvisagelong-termgrowth.FDIdoes not license investors to carry out businesswhileexploitingnationalresources.
In the quest to attract FDI, the overallmacro-economic climate isexpectedtobemorebusinessfriendly.Therehasbeencontinualfocusonimprovingeaseofbusinessinthecountry,both,fordomesticandforeigninvestors.India’srankingindoingbusinessimprovedfrom134(2015)to130(2016).Otherinitiativessuchassimplificationofapplicationprocessforindustriallicence,timeboundprocessingofapplications,andeBizplatformtofacilitatesinglewindowclearanceareboundtoimprovingbusinessclimatein India.
13.2.3 FDI Inflow in India
IndiawasrankedeighthinalistofnationsthatattractedmaximumFDIin2009.TheFDI inflowtoIndia in theyear2009wasUS$36billion.ThisrankingslippedtofourteenwiththedeclineintheFDIinflowstoUS$25billion,adeclineofaboutUS$10billion.

NOTES
Self-InstructionalMaterial 239
Foreign InvestmentInfact,theFDIflowstoalltheAsiancountriesdroppedintheyear2010,exceptthosetoBangladesh,whichhasestablisheditselfasalow-costproductionlocation.TheFDIflowstoBangladeshincreasedbyabout30percenttoUS$913millionintheyear2010.In2010,thesectorsthatattractedthemaximumFDIinIndiaincludedservices(bothfinancialaswellasnon-financial),telecom,housingandrealestatealongwithconstructionandpower.ThemajorinvestorsinIndiaduringthisperiodwereMauritius,Singapore,US,UK,Netherlands,Japan,GermanyandUAE.
India’sFDIflowstouchedarecordofoverUS$50billionintheyear2012.ThiswasalsotheyearthatsawtheFDIofBritishenergygiantBPflowintoIndiathroughadealwithRelianceIndustries.BPinvestedUS$8.9billioninIndia.By2012,IndiahadalreadygainedthirdrankafterChinaandUS in the list of countries that attracted highest FDIs.
IndiaisAsia’sthirdlargesteconomy.IndiasawFDIinflowsdropby15percentintheperiodbetweenApriltoOctober2013toUS$12.6billion.Thiswasdespitethegovernment’smovetoopennewsectorstoFDIasalsolift restrictions from many other sectors.
Thegraphclearly indicatesa rise in theFDI inflowsof Indiaonamonthlybasis.ThehighestFDIinflowswereinthemonthofSeptember.Thefactors that contributed to this increased investment in September included theappointmentofRaghuramRajanastheGovernorofRBI.ThisinfusedconfidenceamongsttheinvestorsasRajanisknownforhisinflationtargetingviewsandwasexpectedtobringtheinflationaswellasthefallingvalueoftheRupeeundercontrol.ThesamemonthalsosawastabilizationofthevalueoftheRupeewhichhadbeenfallingatafastpace.TheRupeehadfallentoarecordlowof`68.85/$on28August2013.ThevalueoftheIndianRupeeiscurrently(October2018)hoveringaround`73/$.
2,157 1795
1525
2,321
1,631
1,444
1,657
1,408
1,226
1,638 1,101
2,189
4,132
Jan2013
Feb Mar Apr May June July Aug Sep Oct Nov Dec
Source: Department of Industrial Policy & Promotion
(In US$ mn)
Fig. 13.1 FDI Growth in India during 2013-2014
Source:IndianExpressArchives;GraphPTI
Foreign Investment
NOTES
Self-Instructional 240 Material
The month ofFebruaryin2014sawariseinFDI(asforecastedintheabovegraph)toUS$2billion.Thisisariseof12percentascomparedtotheFDIofUS$1.79billioninFebruary2013.ThehighestFDIinthefiscalyear2013-14(uptoFebruary2014)wasinservices(US$2.18billion),automobiles(US$1.28billion), pharmaceuticals (US$1.27billion) and constructiondevelopment(US$1.05billion).ByApril2017,FDIinIndiaincreasedtoahighofUS$60.08Billion.
Despite recent increase, Indianeeds toattractmoreFDI,which, inturn,willhelpregainthemomentumofgrowththatwaslostduetotheglobaleconomiccrisis.Indiafacedagrowthratethatwasaslowas4.5percentduring2012-13.AnestimateshowsthatIndiawouldrequireapproximatelyUS$1trillionbetweentheyears2012-13and2016-17(the12thfiveyearplanperiod)forsuccessfullyfundingitsinfrastructuralprojects.Anyfallinthevalue of the RupeeislikelytoresultinadeclineintheFDIinflowstoIndia.
13.2.4 FDI in Developing Countries
On account of a strong increaseinFDIflowstodevelopingcountries,2004sawaslightreboundinglobalFDIafterthreeyearsofdecliningflows.At$648billion,worldFDIinflowswere2percenthigherin2004thanin2003.Inflowstodevelopingcountriessurgedby40percent,to$233billion,butdevelopedcountriesasagroupexperienceda14percentdropintheirinwardFDI.Asa result, theshareofdevelopingcountries inworldFDI inflowswas36percent, thehighestlevelsince1997.TheUnitedStatesretainedits position as the number one recipient ofFDI, followedby theUnitedKingdom and China.
In developing countries, cross-borderM&Aaccounted for amoremodestshareofoverallFDIactivity,althoughfirmsfromthedevelopingcountrieswereincreasinglyinvolvedinM&As,includingsomehigh-profilecases.TheupswinginFDIflowtodevelopingcountrieswasmainlyassociatedwith greenfield investments, notably inAsia.China and India togetheraccountedforaboutahalfofallnewregisteredgreenfield(andexpansion)projects in developing countries in 2004.
FDI continues to surpass other private capital flow to developingcountriesaswellasflowofOfficialDevelopmentAssistance(ODA).In2004,itaccountedformorethanhalfofallresourcesflowingtodevelopingcountriesandwasconsiderablylargerthanODA.However,FDIisconcentratedinahandfulofdevelopingcounties,whileODAremainsthemostimportantsourceoffinanceinanumberofotherdevelopingcountries.Thisisparticularlythecasewiththeleastdevelopedcountries(LDCs),eventhoughFDIflowshavesurpassed ODA for individual countries in that group. Countries continue

NOTES
Self-InstructionalMaterial 241
Foreign Investmenttoadoptnewlawsandregulationswithaviewtomakingtheirinvestmentenvironment more investor friendly.
TheupturninglobalFDIwasmarkedbysignificantdifferencesbetweencountriesandregions.AsiaandOceaniawereagainthetopdestinationforFDIflowtothedevelopingregions.Itattracted$148billion,$46billionmore than in2003,makingfor the largest increaseever.EastAsiasawa46percentincreaseininflows,toreach$105billion,drivenlargelybyasignificant increase inflows toHongKong (China). InSouth-EastAsia,FDIsurgedby48percentto$26billion,whileSouthAsia,withIndiaattheforefront,received$7billion,correspondingtoa30percentrise.FDIinflowtoWestAsiagrewevenmore,risingfrom$6.5billionto$9.8billion,ofwhichmorethanhalfwasconcentratedinSaudiArabia,theSyrianArabRepublicandTurkey.Chinacontinuedtobethelargestdevelopingcountryrecipientwith$61billioninFDIinflow.
The Asia and Oceania region is also emerging as an important source of FDI.In2004,theregion’soutwardflowquadrupedto$69billionmainlyduetoanextraordinarygrowthinFDIfromHongKong(China),andalsobecauseofincreasedinvestmentsbytransnationalcompanies(TNCs)fromotherpartsofEastandSouth-EastAsia.Mostoftheseinvestmentsareintraregional,takingplaceespeciallyamongtheeconomiesofEastandSouth-EastAsia.However,inter-regionalinvestmentsfromAsianeconomiesalsoincreased.Forexample,akeydriverofChineseoutwardFDIwasthegrowingdemandfornaturalresources.ThishasledtosignificantinvestmentprojectsinLatinAmerica. Indian TNCs also invested large amounts in natural resources in other regions,primarily inAfricancountriesand theRussianFederation.Asianinvestmentindevelopedcountriesisontheriseaswell:thepastyearinparticularhasseenafewsizeableacquisitionsoftheUnitedStatesandEUfirmsbyChineseandIndianTNCs–suchastheacquisitionbyLenovo(China)ofthepersonalcomputersdivisionofIBM(UnitedStates).
Followingfouryearsofcontinuousdecline,FDIflowedtoLatinAmericaandtheCaribbeanandregisteredasignificantupsurgein2004,reaching$68billion — 44 per cent above the level attained in 2003. Economic recovery intheregion,strongergrowthintheworldeconomyandhighercommoditypriceswereresponsibleforthisincreaseinFDI.BrazilandMexicowerethelargestrecipients,withinflowsof$18billionand$17billion,respectively.However,FDIinflowsdidnotincreaseinallthecountriesofLatinAmerica.
FDI Flow in Africa
FDIflowtoAfricawasabout$18billion—anincreaseof39percentover2003.FDIinnaturalresourceswasparticularlystrong,reflectingthehighpricesofmineralsandoilandtheincreasedprofitabilityofinvestmentin

Foreign Investment
NOTES
Self-Instructional 242 Material
theprimarysector.Highandrisingpricesofpetroleum,metalsandmineralsinducedTNCs tomaintain relatively high levels of investment in newexplorationprojectsortoescalateexistingproduction.FDIincreasedforalldevelopingregionsexceptAfrica,whereitremainedstableatahighlevel.Inflowsroseinfortyofthefifty-threecountriesinAfricaandfellinthirteen,includinginsomeofthetopFDIrecipientssuchasAngola,MoroccoandNigeria.ThefivetopcountriesthatinvestedinAfricain2004wereFrance,theNetherlands,SouthAfrica,theUKandUSA.TheUKandUSAtogetheraccountedfor5percentoftheFDIflowsintotheregion.Althoughinflowsin2004wererelativelyhigh,Africa’sshareinworldFDIinflowremainedsmall at 3 per cent.Continued demand for commodities, amore stablepolicyenvironmentandincreasingparticipationininfrastructurenetworksbyAfricanTNCswereexpectedtoboostFDIinAfricain2005.Atthesametime,FDIoutflowfromAfricancountriesmorethandoubledin2004.
13.2.5 Guidelines for Foreign Investments
TheDepartment of Industrial Policy andPromotion (DIPP),Ministry ofCommerce&Industry,GovernmentofIndiamakespolicypronouncementsonFDIthroughPressNotes/PressReleaseswhicharenotifiedbytheReserveBankofIndiaasamendmentstotheForeignExchangeManagement(TransferorIssueofSecuritybyPersonsResidentOutsideIndia)Regulations,2000(notificationNo.FEMA20/2000-RBdatedMay3,2000).
As per the Policy circular of 2016
• InvestmentmadebyNRIs,PIOsandOCIsunderSchedule4ofFEMA(Transfer or Issue ofSecurity byPersonsResidentOutside India)Regulationsonnon-repatriationbasisisnowdeemedtobedomesticinvestmentatparwiththeinvestmentmadebyresidents.
•ThespecialdispensationofNRIshasalsobeenextendedtocompanies,trustsandpartnershipfirms,whichareincorporatedoutsideIndiaandareownedandcontrolledbyNRIs.
• In order to provide simplicity to the FDI policy and bring clarity on applicationofconditionalitiesandapprovalrequirementsacrossvarioussectors,differentkindsofforeigninvestmentshavebeenmadefungibleunder one composite cap.
• FDIupto100%throughautomaticroutehasbeenallowedinWhite Label ATM Operations.
• Reforms in FDIPolicyonConstruction Developmentsectorinclude:ο Removal of conditions of area restriction and minimum
capitalizationtobebroughtinwithintheperiodofsixmonthsofthe commencement of business.

NOTES
Self-InstructionalMaterial 243
Foreign Investmentο Exitandrepatriationofforeigninvestmentisnowpermittedaftera lock-in-periodof threeyears.Transferofstakefromonenon-residenttoanothernon-resident,withoutrepatriationofinvestmentis also neither to be subjected to any lock-inperiodnor to anygovernment approval.
ο Exit ispermittedatanytimeifprojector trunkinfrastructure iscompletedbeforethelock-inperiod.
ο 100%FDIunderautomaticrouteispermittedincompletedprojectsfor operation andmanagement of townships,malls/ shoppingcomplexesandbusinesscentres.
• Foreigninvestmentupto49%indefence sector has been permitted underautomaticroutealongwithspecifiedconditions.FurtherportfolioinvestmentandinvestmentbyFVCIshasbeenalloweduptopermittedautomaticroute levelof49%.Theforeign investmentbeyond49%has been permitted through government approval in cases resulting in access to modern technology in the country or for other reasons to berecorded.Further,FDIlimitfordefencesectorhasalsobeenmadeapplicable to Manufacturing of Small Arms and Ammunitions covered underArmsAct1959.
• Sectoral cap on Broadcasting sector has been raised across various activitiesasfollows:ο 74%to100%inTeleports,DTH,CableNetworks(Digital),Mobile
TV,HITSο 26%to49%forFMRadio,up-linkingofnewsandcurrentaffairsο 49%to100%forCableNetworks(notundertakingdigitisation)
• FDIrouteforTeleports,DTH,CableNetworks(Digital),MobileTV,HITS,CableNetworks(notundertakingdigitisation),andUp-linkingofNon-‘newsandcurrentaffairs’anddown-linkingofchannelshasbeen changed to automatic route.
• Full fungibility of foreign investment has been introduced in Banking-Private sector.Accordingly,FIIs/FPIs/QFIs,followingdueprocedure,cannowinvestuptosectorallimitof74%.
• Certain plantationactivitiesnamelycoffee,rubber,cardamom,palmoiltree and olive oil tree plantations have been opened for 100% foreign investment under automatic route.
•Amanufacturerhasbeenpermittedtosellitsproductthroughwholesaleand/orretail,includingthroughe-commerceunderautomaticroute.
•Governmenthasreviewedsingle brand retail trading(SBRT)FDIpolicy to provide that sourcing of 30% of the value of goods purchased

Foreign Investment
NOTES
Self-Instructional 244 Material
wouldbereckonedfromtheopeningoffirststore.IncaseofentitiesundertakingSingleBrandRetailTradingof products having ‘stateof art’ and ‘cutting edge’ technology andwhere local sourcing isnotpossible,sourcingnormshavebeenrelaxeduptothreeyearsforentitiesundertakingSingleBrandRetail.Further,anentityoperatingSBRTthroughbrickandmortarstoreshasbeenpermittedtoundertakee-commerceactivitiesaswell.
• Indian brands are equally eligible for FDI to undertake SBRT. Inthis regard, ithasbeenprovided thatcertainconditionsof theFDIpolicyonthesectornamely-productstobesoldunderthesamebrandinternationallyandinvestmentbynon-residententity/entitiesasthebrandownerorunderlegallytenableagreementwiththebrandowner,willnotbemadeapplicableincaseofFDIinIndianbrands.
• 100%FDI is nowpermitted under automatic route inDuty Free Shops located and operated in the Customs bonded areas.
• FDIpolicyonwholesalecash&carryactivitieshasbeenreviewedtoprovidethatasingleentitywillbepermittedtoundertakeboththeactivitiesofSBRTandwholesale.
• 100%FDI is nowpermittedunder the automatic route inLimited Liability Partnerships (LLP)operating insectors/activitieswhere100%FDIisallowed,throughtheautomaticrouteandtherearenoFDI-linkedperformanceconditions.Further,theterms‘ownershipand‘control’withreferencetoLLPshavealsobeendefined.
• Regional Air Transport Service has been opened for foreign investmentupto100%,with49%underautomaticroute,andbeyondthat through government approval route. Foreign equity cap ofactivitiesofScheduledAirTransportService/DomesticScheduledPassengerAirlinehasbeenincreasedfrom49%to100%,with49%underautomaticroute,andbeyondthatthroughgovernmentapprovalroute.Further,foreignequitycapofactivitiesofNon-ScheduledAirTransportService,GroundHandlingServiceshavebeen increasedfrom 74% to 100% under the automatic route.
•Withaviewtoaidinmodernizationoftheexistingairportstoestablishahighstandardandhelpease thepressureon theexistingairports,100%FDIunderautomaticroutehasbeenpermittedinBrownfieldAirport projects.
• Foreign investment cap on Satellites- establishment and operation has nowbeenraisedfrom74%to100%underthegovernmentroute.
• Foreign investment cap on Credit Information Companieshasnowbeen increased from 74% to 100% under the automatic route.

NOTES
Self-InstructionalMaterial 245
Foreign Investment • In order to achieve faster approvals onmost of the proposals, theGovernmenthasraisedthethresholdlimitforapprovalbyFIPBtoRs.5000 crore.
• FDIPolicyonInsurance and Pensionsectorhasbeenreviewedtopermitforeigninvestmentupto49%undertheautomaticroute.
• Inordertoprovideclaritytothee-commercesector,theGovernmenthasissued guidelines for foreign investment in the sector. 100% FDI under automaticrouteispermittedinthemarketplacemodelofe-commerce.
•Withanobjectiveofincreaseinvestmentinthecountry,100%FDIinAssetReconstructionCompanieshasbeenallowedunderautomaticroute.
• 100% FDI under government approval route has been permitted for trading, including through e-commerce, in respect food productsmanufacturedand/orproducedinIndia.
• In Pharmaceutical sector,with theobjectiveofmaking the sectormoreattractivetoforeigninvestors,74%FDIunderautomaticroutehasbeenpermittedinbrownfieldpharmaceuticals.FDIbeyond74%willbeallowedthroughgovernmentapprovalroute.
• FDI limit for Private Security Agencies has been raised to 74%. FDI upto49%ispermittedunderautomaticrouteinthissectorandFDIbeyond49%andup to 74%would be permittedwith governmentapproval.
• Forestablishmentofbranchoffice,liaisonofficeorprojectofficeorany other place of business in India if the principal business of the applicant isDefence,Telecom,PrivateSecurityor InformationandBroadcasting,ithasbeenprovidedthatapprovalofReserveBankofIndiawouldnotberequiredincaseswhereFIPBapprovalorlicense/permission by the concernedMinistry/Regulator has already beengranted.
•AsperFDIPolicy2016,FDIinAnimalHusbandry(includingbreedingofdogs),Pisciculture,AquacultureandApiculturewasallowed100%underAutomaticRouteundercontrolledconditions.Thisrequirementof‘controlledconditions’forFDIintheseactivitieshasnowbeendoneawaywith.
• GovernmenthasreviewedFDIpolicyonOtherFinancialServicesandNBFCstoprovidethatforeigninvestmentinfinancialservicesactivitiesregulatedbyfinancialsectorregulatorssuchasRBI,SEBI,IRDAetc.willbe100%undertheautomaticroute.Infinancialservices,whicharenotregulatedbyanyfinancialsectorregulatororwhereonlypartofthefinancialserviceactivityisregulatedorwherethereisdoubt

Foreign Investment
NOTES
Self-Instructional 246 Material
regardingregulatoryoversight,foreigninvestmentupto100%willbeallowedunderthegovernmentapprovalroute.
13.2.6 FDI in Various Sectors and Euro Issues
India presents a vast potential for overseas investment and is actively encouragingforeignplayerstoenterthemarket.ForeignDirectInvestment(FDI)ispermittedunderthefollowingformsofinvestments: •Throughfinancialcollaborations • Through joint ventures and technical collaborations •ThroughcapitalmarketsviaEuroissues • Through private placements or preferential allotments
Euro Issues
Euro-issuesmeans the issueswhich are listed on the European StockExchange.AlthoughthesubscriptionsforthesamemaycomefromanycorneroftheworldotherthanIndia.Ithasalreadybeenstatedthatthissourcesforthesameare: (a)ForeignCurrencyConvertibleBonds(FCCB); (b)PureDebtBond; (c)Commercial(Bond)Paper;and (d)GlobalDepositoryReceipts(GDRs).
Thevariouskindsandnumberofdocumentspreparedbytheissuingcompanyisrestricted(ascomparedtothedomesticone)inaforeigncurrencyissue of securities transactions.
TheissuingcompanymaintainsitsaccountforthelastthreetofiveyearsonthebasisofGAAP(GenerallyAcceptedAccountingPrinciples)inacurrentformatwhicharegenerallyfollowedabroadandgoesbythenameofRNFS(ReformattedNon-ConsolidatedFinancialStatement).
Thisstatementisquitesignificantandindicatesthefinancialpositionoftheissuingcompany.ThesuccessandfailureoftheEuro-issuesdependuponahostoffactors,suchas,itsproperplanning,itsstrategybasedonfinancialperformances etc.Thus, it becomesnecessary to reador understand thevariousareasforsuchissues,e.g.,marketoftheinvestors,correctpriceetc.
13.2.7 FII
A Foreign Institutional Investor (FII) is an investor or investment fundregisteredinacountryoutsideoftheoneinwhichitisinvesting.Institutionalinvestorsmostnotablyincludehedgefunds,insurancecompanies,pension
NOTES
Self-InstructionalMaterial 247
Foreign Investmentfunds and mutual funds. The term is used most commonly in India and refers tooutsidecompaniesinvestinginthefinancialmarketsofIndia.
AnFIIisanytypeoflargeinvestorwhodoesbusinessinacountryotherthantheoneinwhichtheinvestmentinstrumentisbeingpurchased.Inadditiontothetypesofinvestorsabove,othersincludebanks,largecorporatebuyersorrepresentativesoflargeinstitutions.AllFIIstakeapositioninaforeignfinancialmarketonbehalfofthehomecountryinwhichtheyareregistered.
FIIsarecontributingtotheforeignexchangeinflowasthefundsfrommultilateralfinanceinstitutionsandFDIareinsufficient.TheGovernmentofIndiahasallowedtheentryofFIIsinordertoencouragethecapitalmarketandattractforeignfundstoIndia.Today,FIIsarepermittedtoinvestinallsecurities tradedon theprimaryandsecondarymarkets, includingequitysharesandothersecuritieslistedortobelistedonthestockexchanges.
Overtheyears,differenttypesofFIIshavebeenallowedtooperateinIndianstockmarkets.Theynowincludeinstitutionssuchaspensionfunds,mutual funds, investment trusts, assetmanagement companies, nomineecompanies,incorporated/institutionalportfoliomanagers,universityfunds,endowments,foundationsandcharitabletrusts/societieswithatrackrecord.ProprietaryfundshavealsobeenpermittedtomakeinvestmentsthroughtheFII route subject to certain conditions.
TheSEBIisthenodalagencyfordealingwithFIIs,andtheyhavetoobtain initial registrationwithSEBI.TheRBI,by itsgeneralpermission,allowsaregisteredFIItobuy,sellandrealisecapitalgainsoninvestmentsmade through initial corpus remitted to India, subscribe/renounce rightsofferings of shares, invest in all recognised stock exchanges through adesignatedbankbranch and appoint domestic custodians for custodyofinvestments held.
FIIs can invest in all securities traded on the primary and secondary markets. Such investments include equity/debentures/warrants/othersecurities/instruments of companies unlisted, listed or to be listed on astockexchangeinIndiaincludingtheOver-the-CounterExchangeofIndia,derivativestradedonarecognisedstockexchangeandschemesfloatedbydomestic mutual funds. A major feature of the guidelines is that there are no restrictionsonthevolumeofinvestment-minimumormaximum-forthepurposeofentryofFIIs.Thereisalsonolock-inperiodprescribedforthepurpose of such investments.
Further,FIIscanrepatriatecapitalgains,dividends,incomesreceivedbywayofinterestandanycompensationreceivedtowardssale/renouncementofrightsofferingofsharessubjecttopaymentofwithholdingtaxatsource.Thenetproceedscanberemittedatmarketratesofexchange.

Foreign Investment
NOTES
Self-Instructional 248 Material
AllsecondarymarketoperationswouldbeonlythroughtherecognisedintermediariesontheIndianstockexchanges,includingOTCEI.ForwardexchangecovercanbeprovidedtoFIIsbyauthoriseddealersbothinrespectofequityanddebtinstruments,subjecttoprescribedguidelines.Further,FIIscan lendsecurities throughanapproved intermediary inaccordancewithstocklendingschemesofSEBI.
Check Your Progress
1.Namethekindsofcross-borderinvestments. 2. What are the methods of FDI?
13.3 ANSWERS TO CHECK YOUR PROGRESS QUESTIONS
1.Therearetwokindsofcross-borderinvestments,whicharementionedasfollows:
• Foreign Direct Investment (FDI): Investments made by a companyorentitybasedinonecountry,intoacompanyorentitybased in another country.
• Foreign Portfolio Investment (FPI):Investmentsundertakenforthepurposeofreturnswithoutanyburdenofdecision-making.
2.ThemethodsofFDIarethefollowing: •License/franchisee • Joint venture •Whollyownedsubsidiary
13.4 SUMMARY
• Foreigndirectinvestmentisoneofthemosteffectivemethodsofcross-borderinvesting.Aforeignnationalmaywanttoinvestinacountryofferingnewmarkets,higherreturnsorcheaperfactorcosts.
• FDI leads to investing directly in the production process or any other business(retailorservicesector)ofanycountryotherthantheonewheretheinvestorresides.
•Whenacompanyinvestsandestablishesfacilitiesaswellaselementsfromtheinitialstage,itiscalledaGreenfieldentry.

NOTES
Self-InstructionalMaterial 249
Foreign Investment • FDIinIndiaincreasedbyaround29percentin2015/16to$40billion.However,itstillformsaround1.8percentofGDP,asopposedtogrossfixedcapitalformationbeing29.3percentofGDP.
•OnaccountofastrongincreaseinFDIflowstodevelopingcountries,2004sawaslightreboundinglobalFDIafterthreeyearsofdecliningflows.At$648billion,worldFDIinflowswere2percenthigherin2004 than in 2003.
• FDIPolicyon Insurance andPension sector has been reviewed topermitforeigninvestmentupto49%undertheautomaticroute.
13.5 KEY WORDS
• FDI: It is an investment in a business by an investor from another countryforwhichtheforeigninvestorhascontroloverthecompanypurchased.
• FPI:Itisinvestmentbynon-residentsinIndiansecuritiesincludingshares, government bonds, corporate bonds, convertible securities,infrastructure securities etc.
• Euro issue:Itisanamegiventosourcesoffinanceorcapitalavailableto raise money outside the home country in foreign currency.
13.6 SELF ASSESSMENT QUESTIONS AND EXERCISES
Short-Answer Questions
1. Mention the types of FDI. 2.StateanytwodifferencesbetweenFDIandFPI. 3. What are the guidelines for foreign investments in India? 4. What is the contribution of FIIs in enhancing capital in a country?
Long-Answer Questions
1.DiscussthebenefitsofFDI. 2.WhatisthepresentpositionofFDIinflowinIndia?Discuss. 3.DescribetheinflowofFDIindevelopingcountriesoftheworld.
13.7 FURTHER READINGS
Dwivedi,D.N.2008.Principles of Economics,SeventhEdition.NewDelhi:VikasPublishingHouse.

Foreign Investment
NOTES
Self-Instructional 250 Material
Weil. David N. 2004. Economic Growth.London:AddisonWesley.Thomas, Christopher R. andMaurice S. Charles. 2005.Managerial
Economics: Concepts and Applications,EighthEdition.NewDelhi:TataMcGraw-HillPublishingCompanyLimited.
Mankiw,GregoryN.2002.Principles of Economics,SecondEdition.India:ThomsonPress.

NOTES
Self-InstructionalMaterial 251
Government and Business
UNIT 14 GOVERNMENT AND BUSINESS
Structure 14.0 Introduction 14.1 Objectives 14.2 Public Sector in India
14.2.1 Performance of Public Sector Enterprises in India 14.2.2 Price Policies in Public Utilities 14.2.3 Government Measures to Control Monopoly in India
14.3 Answers to Check Your Progress Questions 14.4 Summary 14.5 Key Words 14.6 Self Assessment Questions and Exercises 14.7 Further Readings
14.0 INTRODUCTION
Public sector or public enterprises include all governmental activities including public, industrial and commercial enterprises. Public enterprise occupies a strategic and crucial position in the Indian economy. It is no exaggeration to say that the economy would sink or swim depending upon the efficiency with which these enterprises operate. In this unit, you will study about the performance of public sector enterprises in India, price policies in public utilities and government measures to control monopoly in India.
14.1 OBJECTIVES
After going through this unit, you will be able to: • Mention the kinds of public sector enterprises • Discuss the performance of public sector enterprises in India • Explain the price policies of public sector enterprises in India • List the measures of the government to control monopoly in India
14.2 PUBLIC SECTOR IN INDIA
The modern Indian economy is the creation of the Congress party and its leaders, Mahatma Gandhi and Nehru, who referred to India as a ‘Socialist’ economy. Socialism is largely a misnomer in the case of India, except for government ownership in industry and commerce. India is still primarily

Government and Business
NOTES
Self-Instructional 252 Material
an agricultural country and the distribution of income depends mainly on the distribution of agricultural property. Although there have been some attempts to distribute land to the peasants, land remains unequally distributed and there is evidence that the range of income inequality has been reduced. The tax system continues to be regressive, direct taxes are rarely levied on land and high urban income taxes are marked by evasion. The pre-tax income distribution figures sum up the failure to establish a more equitable distribution of income. In 1960, the bottom 10 per cent of families accounted for less than one per cent of all income, while the top 10 per cent accounted for over one-third. This income distribution is less equitable than in industrialized capitalist countries. Rather than seeking to achieve ‘socialist’ objectives through income redistribution, the architects of modern Indian economy emphasized State ownership in industry. The feeling was that socialism could be achieved through State control of industry which would serve as a surrogate for social change.
Public enterprises are expected to be the principal agents for rapid economic and social transformation by developing infrastructure and the core sector and by closing the gaps in the industrial structure. Its dominant position in the financial field is intended to control and guide the private sector, wherever necessary. Lastly, the economic growth through public enterprise will ensure social justice.
In developing countries, public enterprises are largely a necessity and not a matter of choice. In India, though the Congress government was clearly committed to expanding the public sector, it did not go into areas where private enterprise was operating. Nationalization of the existing enterprises has been generally resorted to where the public interest was involved or where it was imperative to put the industry on sound footing and regulation and control were not found sufficiently effective. The vast majority of public enterprises is in areas which were hitherto untouched or unexplored by the private sector.
In the Industrial Policy Statement of 1956 it was emphasized that public enterprise was designed to control the ‘commanding heights’ of the economy. But in recent years, the trends toward increasing liberalization are very much in evidence in India and one gets the impression that private sector is designed to play an important role in the economy in the coming era.
Public sector in the industrial field has expanded rapidly since Independence. In 1951, there were only five non-departmental public undertakings with an investment of 29 crore. On 31 March 2004, the number of public enterprises had risen to 230 with the total capital employed therein amounting to `586,140 crore.
The public enterprises comprise: (i) Public utilities, e.g., the Railways, Posts and Telegraphs and
Irrigation projects.
NOTES
Self-InstructionalMaterial 253
Government and Business (ii) Departmental undertakings of the Government, Central as well as State, e.g., Post and Telegraphs, Integral Coach Factory, etc.
(iii) Other industrial undertakings which derive their finance from the Government of India in the form of equity capital and loan, e.g., Durgapur Steel Plant, Hindustan Fertilizers, etc.
Public sector units generally are of four kinds: (i) National monopolies like railways that have downward sloping
unit cost curves. These are hard to assess, being monopolies. (ii) Entrepreneural ventures that, at the start and for many years
thereafter, are monopolies or near monopolies. These are generally large units with sophisticated technologies and long gestation periods that produce basic products. Many of the Indian public sector manufacturing units are of this type.
(iii) Sick units in the private sector that have been taken over to maintain employment etc.
(iv) Units taken over or formed to acquire the ‘commanding heights’ or for other ideological reasons.
The State Trading Corporation is a case in point.
Performance of Public Enterprises
The evaluation of the performance of the public sector is rather difficult. Public enterprises should be evaluated in terms of social cost-benefits rather than commercial profitability alone.
Performance of the public sector can be assessed on the following grounds: 1. The share of the public sector in the net domestic product has been
steadily increasing. The public sector accounts for one-fourth of the total income of the economy. The compound rate of annual growth of the public sector was 6 per cent whereas that of the private sector was only 2.8 per cent.
2. If we evaluate the relative efficiency of investment in the public enterprises against the performance of private enterprises, we find that private enterprises are, on an average, 2.5 times more profitable than public enterprises. For every hundred rupees invested, the private enterprise yields a return of 11.40, while the same amount in the public enterprise yields only 4.70. We must not forget that public enterprises are mostly concentrated in basic, core and heavy industries where the rate of return is very low and also in sick enterprises taken over by the government, such as the National Textile Corporation and Coal India Limited.
Government and Business
NOTES
Self-Instructional 254 Material
The economic efficiency of a public sector industry should be considered in terms of the transformation of the industrial structure, modernization, higher labour productivity on a countrywide scale, etc. The fact is that a higher proportion of the value produced by the public sector industries is realized outside this sector, and it is therefore, very difficult to estimate the efficiency of public sector enterprises in terms of costs and profitability.
B.H. Dholakia advocates the adoption of the total factor productivity criterion to judge the efficiency of public sector enterprises. The criterion examines the contribution made by the enterprise to the country’s net national product in terms of rent, wages and salaries, interest and profit. Adopting this criterion, Dholakia finds that over the period 1967–68 to 1975–76, the overall economic efficiency of the public enterprises increased at a rate of 2.44 percentage points per annum, whereas that of private sector enterprises could increase by only 0.59 percentage points per annum.
3. Share in capital formation: Public sector has played an important role in capital formation. The share of the public sector in the total gross fixed capital formation in the country was 41 per cent during the first and second Plans and 49 per cent during the third Plan. It was reduced to 42 per cent in the Fourth Plan and 40 per cent in the Fifth Plan. But, it again rose to 47 per cent in the Sixth Plan and 48 per cent in the Seventh Plan.
It should be pointed out that investment in the private sector producing luxury goods should be evaluated lower than similar types of investment in the public sector which is engaged in the production of basic goods and infrastructural services to the economy. Considering this, capital formation in the public sector is very significant for a developing economy like India.
4. Public sector enterprises and employment: In India, the organized sector is very small as it provides 10 per cent of the total employment in the economy and about 90 per cent is provided by the unorganized sector. The workers employed in the public sector constitute only 7 per cent of the total labour force in the country and those employed in the organized private sector are 3 per cent. The number of persons employed in the public sector enterprises stood at 23.05 lakh as on 31 March 1991. The public sector is a model employer which provides the workers better wages and other facilities compared to the private sector. The public sector enterprises have also spent huge amounts for the development of townships around industries.
5. Public sector and foreign exchange earnings: Foreign exchange earnings of public enterprises have been substantial and they have

NOTES
Self-InstructionalMaterial 255
Government and Businessalso helped in saving foreign exchange through their efforts at import substitution. Capital goods and industrial machinery which were imported about three decades ago are now being manufactured in the country itself. This has saved valuable foreign exchange. Public sector export earnings went up from 2143 crore in 1980–81 to 6366 crore in 1989–90. In addition to actual exports by manufacturing units, foreign exchange is also earned from services rendered by air corporations and shipping companies.
6. Financial performance: The value of sales of public sector enterprises is an indicator of their contribution to the flow of goods and services in the economy. The total turnover of public enterprises amounts to `5,86,140 crore in 2003–04. Public enterprises contribute to national exchequer in the form of interest on government loans, income tax and excise duty. In 1990–91, Central Government units generated about `11,372 crore of resources; it contributed about `1,400 crore towards tax and `4,100 crore towards interest.
As far as the net profit after tax is concerned, the position was unsatisfactory up to 1980–81. However, the situation improved and the public sector made impressive profits. In 1981–82, the net profit after tax was `445 crore which went up to `3,789 crore in 1989–90 and `53,168 crore in 2003–04.
Shortcomings
It is a fact that public sector enterprises contributed less to industrial progress than what was expected of them. These enterprises suffer from a number of shortcomings such as over-capitalization, underutilization of plant, bureaucratic and irresponsible management, political interference and wrong personnel policies and overstaffing.
Underutilization of installed capacity is an important cause for the low level profitability in public sector enterprises. In 1988–89, nearly 40 per cent of public enterprises showed capacity utilization of less than 75 per cent and 20 per cent enterprises worked at even lower than 50 per cent rate of capacity utilization. Unutilized capacities mean higher overhead charges which reduce the rate of profit.
There is overregulation of government undertakings which is not good for any business enterprise.
14.2.1 Performance of Public Sector Enterprises in India
As per the Public Enterprises Survey (2016-17): • Total paid up capital in 331 CPSEs as on 31.3.2017 stood at 2,33,112
crore as compared to `2,04,763 crore as on 31.3. 2016 (320 CPSEs), showing a growth of 13.84%.

Government and Business
NOTES
Self-Instructional 256 Material
• Total Investment (Financial) in all CPSEs stood at 12,50,373 crore as on 31.3.2017 compared to 11,61,019 crore as on 31.3.2016, recording a growth of 7.70%.
• Capital Employed in all CPSEs stood at `. `21,74,120 crore on 31.3.2017 compared to `20,59,529 crore as on 31.3.2016 showing a growth of 5.56 %.
• Total Gross Revenue from Operation of all CPSEs during 2016-17 stood at 19,54,616 crore compared to 18, 34,635 crore in the previous year showing a growth of 6.54 %.
• Total Income of all CPSEs during 2016-17 stood at `18,21,809 crore compared to 17, 64,232 crore in 2015-16, showing a growth of 3.26%.
• Profit of profit making CPSEs (174 CPSEs) stood at `1,52,647 crore during 2016-17 compared to `1,44,998 crore in 2015-16 showing a growth in profit by 5.28%.
• Loss of loss incurring CPSEs (i.e 82 CPSEs) stood at `25,045 crore in 2016-17 compared to `30,759 crore in 2015-16 showing decrease in loss by 18.58 %
• Overall net profit of all 257 CPSEs during 2016-17 stood at 1,27,602 crore compared to `1,14,239 crore during 2015-16 showing a growth in overall profit of 11.70%.
• Reserves & Surplus of all CPSEs went up from `8,98,510 crore in 2015-16 to `9,23,747 crores in 2016-17, showing an increase by 2.81 %.
• Net worth of all CPSEs went up from 10,79,953 crore as on 31.03.2016 to `11,07,981 crore as on 31.03.2017 showing an increase of 2.60%.
• Contribution of CPSEs to Central Exchequer by way of excise duty, customs duty, corporate tax, interest on Central Government loans, dividend and other duties and taxes increased from 2,75,841 crore in 2015-16 to `3,85,579 crore in 2016-17, showing a growth of 39.78%.
• Foreign exchange earnings through exports of goods and services increased from 76,644 crore in 2015-16 to 87,616 crore in 2016-17, showing an increase of 14.32%.
• Foreign exchange outgo on imports and royalty, know-how, consultancy, interest and other expenditure increased from 3,86,957 crore in 2015-16 to `4,59,210 crore in 2016-17 showing an increase of 18.67%.
• CPSEs employed 11.31 lakh people (excluding contractual and casual workers) in 2016-17 compared to 11.85 lakh in 2015-16, showing a reduction in employee strength by 4.60%.

NOTES
Self-InstructionalMaterial 257
Government and Business • Salary and wages went up in all CPSEs from 1,27,182 crore in 2015-16 to `1,40,384 crore in 2016-17 showing a growth of 10.38%.
• Total Market Capitalization (M-Cap) of 50 CPSEs traded on stock exchanges of India is `17,76,235 crore as on 31.03.2017 as compared to `12,94,245 crore as on 31.03.2016 showing an increase of 37.24%.
• M-Cap of CPSEs as per cent of BSE M-Cap increased from 13.66% as on 31.3.2016 to 14.61% as on 31.3.2017.
14.2.2 Price Policies in Public Utilities
The pricing policies of PSEs are divided into four categories. First, services rendered by the PSEs in the case of public utilities. Second, no-profit no-loss policy. Third, marginal cost pricing. Fourth, profit price policy. Here we will only discuss the price policy in public utilities.
The pricing of public utility services is governed by many principles. There are public utilities like education, sewage, roads etc. which may be supplied free to the public and their costs are covered through general taxation. Dalton calls it the general taxation principle. Such services are purely meant for the public goods whose benefits cannot be priced for the reason that they are invisible. It is not possible to identify the individual beneficiaries and charge them for the services.
However, in some cases, the beneficiaries may be identified but they cannot be charged for their use. For instance, the users of a flyover built over a railway line can be identified. But it may be inconvenient to the taxing authority to collect the road tax and for the road usage because it is unclear how much a user will pay the tax due for the time involved. The best course is to finance the flyover out of general taxation.
JF Due has mentioned the following four rules where public services should be provided free and their costs should be covered from general taxation. • In the case of such services, where little waste will occur if they are
provided free. • Where charging a price will restrict the use of the service. • Where the cost of collecting taxes is high. • Where the pattern of distribution of tax burden on services is inequitable.
These rules are applicable to a few essential public services like education, sewage, roads etc. But in the case of services other than those included under “pure public goods,” free services might lead to wastage of resources.
Dalton advocates the compulsory cost of service principle whereby the government should charge a price for the service provided to the people. This

Government and Business
NOTES
Self-Instructional 258 Material
is essential for the reason that municipal services such as sewage, sweeping street, street lighting, etc. are under-priced. Every family of a locality may be asked to pay for these services. But since they are public utilities, they may be charged nominally and the gap between revenues and costs remains. Hence, the finance is met from general taxation. This is a sort of government subsidy to the users of such services.
Dalton favours the voluntary price principle for public utilities. According to this principle, the consumers of a public service are required to pay the price fixed by the Public Sector Enterprises (PSE). The PSE may have a monopoly in a particular service, such as water or power supply and may even fix a price for it. But for the public utility services it may set a price lower than its cost of production so that the welfare of the community is not adversely affected.
14.2.3 Government Measures to Control Monopoly in India
The growth of monopoly power has the following evils: (a) It was disadvantageous for the weaker sections. (b) As development takes place, the initial monopolies have more of an
absorbing effect than the spread effect. (c) Economic disparity which arises due to undue concentration of
economic power “affects economic growth itself in the long run and inhibits it, for such a growth is not sufficiently wide spread to be self-generating.”
(d) Monopoly often causes inequalities. (e) Monopoly has the power to corrupt. (f) Monopoly can influence economic decisions of the government. Since
big business controls the press, it can influence the public world opinion to its favour.
(g) Monopoly is also responsible for misdirection of resources.Many countries of the world have enacted legislation to curb
monopolies. In India, the Monopolistic and Restrictive Trade Practices Act, 1969 was enacted to prevent monopolies. We have discussed it previously in Unit 8. At present, this act is not in force in India as it was repealed and replaced by the Competition Act 2002 with effect from September 1, 2009.
Check Your Progress
1. Mention the kinds of public sector units. 2. When was the Competition Act enacted in India?

NOTES
Self-InstructionalMaterial 259
Government and Business14.3 ANSWERS TO CHECK YOUR PROGRESS
QUESTIONS
1. Public sector units generally are of four kinds: (i) National monopolies like railways that have downward sloping
unit cost curves. These are hard to assess, being monopolies. (ii) Entrepreneurial ventures that, at the start and for many years
thereafter, are monopolies or near monopolies. These are generally large units with sophisticated technologies and long gestation periods that produce basic products. Many of the Indian public sector manufacturing units are of this type.
(iii) Sick units in the private sector that have been taken over to maintain employment etc.
(iv) Units taken over or formed to acquire the ‘commanding heights’ or for other ideological reasons.
2. The Competition Act was enacted by the Parliament on 13th January 2003.
14.4 SUMMARY
• Public sector or public enterprises include all governmental activities including public, industrial and commercial enterprises.
• The modern Indian economy is the creation of the Congress party and its leaders, Mahatma Gandhi and Nehru, who referred to India as a ‘Socialist’ economy.
• Public enterprises are expected to be the principal agents for rapid economic and social transformation by developing infrastructure and the core sector and by closing the gaps in the industrial structure.
• The evaluation of the performance of the public sector is rather difficult. Public enterprises should be evaluated in terms of social cost-benefits rather than commercial profitability alone.
• Underutilization of installed capacity is an important cause for the low level profitability in public sector enterprises.
• To create a fair competition in the economy and provide a ‘level playing field’ the Competition Act, 2002, was enacted by the Parliament on 13th January 2003.

Government and Business
NOTES
Self-Instructional 260 Material
14.5 KEY WORDS
• Socialism: It refers to an economic system in which goods and services are provided by a central system of cooperative and/or government ownership.
• Monopoly: It is the market condition where a single supplier dominates the market for a given product.
14.6 SELF ASSESSMENT QUESTIONS AND EXERCISES
Short-Answer Questions
1. Mention the shortcomings of public sector enterprises. 2. What were the main focus areas of the Competition Act, 2002? 3. List the measures taken by the government to control monopoly in
India.
Long-Answer Questions
1. Critically analyse the performance of public sector enterprises in India. 2. Discuss the price policies of public sector enterprises in India. 3. Discuss the growth and development of public sector enterprises in
India after independence.
14.7 FURTHER READINGS
Dwivedi, D. N. 2008. Principles of Economics, Seventh Edition. New Delhi: Vikas Publishing House.
Weil. David N. 2004. Economic Growth. London: Addison Wesley.Thomas, Christopher R. and Maurice S. Charles. 2005. Managerial
Economics: Concepts and Applications, Eighth Edition. New Delhi: Tata McGraw-Hill Publishing Company Limited.
Mankiw, Gregory N. 2002. Principles of Economics, Second Edition. India: Thomson Press.