MANAGERIAL AND ORGANIZATIONAL FACTORS ASSOCIATED · PDF fileMANAGERIAL AND ORGANIZATIONAL...
16
MANAGERIAL AND ORGANIZATIONAL FACTORS ASSOCIATED WITH COMPANY PERFORMANCE- PART 11. A CONTINGENCY ANALYSIS BY JOHN CHILD Abstract IN Part I of this paper we examined the possibility that certain managerial and organizational characteristicswere associated with company performance under a wide range of operating conditions. Part I1 now turns to an alter- native theory of performance which has attracted more attention in recent years. This is contingency theory, which identifies as the means to superior performance those attributes which enable a company to cope better with its particular operating conditions. In other words, the factors associated with high performance are expected to vary along with differences in a company’s context - especially with differences in its environment, size andtechnology. Environment Following the pioneering work of Burns and Stalker, a number of studies have all lent support to the argument that different organizational designs are more effective according to whether the environmentis variable and complex in nature, or stable and simp1e.l Variability in a company’s environ- ment refers to the presence of changes which are relatively difficult to predict, which involve important differences from previous conditions, and which are likely therefore to generate considerable uncertainty. Complexity of the environment is said to be greater the more extensive and heterogeneous are activities outside the organization which are relevant to its planning and operations, and which therefore constitute areas of information it should monitor. Duncan has found in his research that the degree of variability in environments is a more important contributor to uncertainty among man- agerial decision-makers than is the degree of complexity.2Our own analysis Burns, T. andStalker, G. M., The Management of Innovafion, London: Tavistock, 1961; Law- rence, P. R. and Lorsch, J. W., Organization and Environment, Managing Differenfiation and Integra- tion, Boston:HarvardUniversity,Graduate School of BusinessAdministration, 1967; Duncan, R. B., ‘Multiple Decision-Making Structures in Adapting to Environmental Uncertainty: Their Impact on Organizational Effectiveness’, Wor&g Paper 74-71, Graduate School of Management, Northwestern University, 1971; Khandwalla,P. N., ‘Uncertainty and the “Optimal” Design of Organization’, paper given to T.I.M.S. XIX Meeting, Houston, 1972. e Duncan, R. B., ‘Characteristics of Organizational Environments and Perceived Environmental Uncertainty’, Administrative Science Quarter&, Vol. 17, No. 3, September 1972, pp. 313-27. His ‘static-dynamic’ and ‘simple-complex’ dimensions of the environment are equivalent to ‘degree of variability’ and ‘degree of complexity’ respectively.
-
Upload
duongduong -
Category
Documents
-
view
228 -
download
0
Transcript of MANAGERIAL AND ORGANIZATIONAL FACTORS ASSOCIATED · PDF fileMANAGERIAL AND ORGANIZATIONAL...

MANAGERIAL AND ORGANIZATIONAL FACTORS ASSOCIATED WITH COMPANY PERFORMANCE-
PART 11. A CONTINGENCY ANALYSIS BY
JOHN CHILD
Abstract IN Part I of this paper we examined the possibility that certain managerial and organizational characteristics were associated with company performance under a wide range of operating conditions. Part I1 now turns to an alter- native theory of performance which has attracted more attention in recent years. This is contingency theory, which identifies as the means to superior performance those attributes which enable a company to cope better with its particular operating conditions. In other words, the factors associated with high performance are expected to vary along with differences in a company’s context - especially with differences in its environment, size and technology.
Environment Following the pioneering work of Burns and Stalker, a number of studies
have all lent support to the argument that different organizational designs are more effective according to whether the environment is variable and complex in nature, or stable and simp1e.l Variability in a company’s environ- ment refers to the presence of changes which are relatively difficult to predict, which involve important differences from previous conditions, and which are likely therefore to generate considerable uncertainty. Complexity of the environment is said to be greater the more extensive and heterogeneous are activities outside the organization which are relevant to its planning and operations, and which therefore constitute areas of information it should monitor. Duncan has found in his research that the degree of variability in environments is a more important contributor to uncertainty among man- agerial decision-makers than is the degree of complexity.2 Our own analysis
Burns, T. and Stalker, G. M., The Management of Innovafion, London: Tavistock, 1961; Law- rence, P. R. and Lorsch, J. W., Organization and Environment, Managing Differenfiation and Integra- tion, Boston: Harvard University, Graduate School of Business Administration, 1967; Duncan, R. B., ‘Multiple Decision-Making Structures in Adapting to Environmental Uncertainty: Their Impact on Organizational Effectiveness’, Wor&g Paper 74-71, Graduate School of Management, Northwestern University, 1971; Khandwalla, P. N., ‘Uncertainty and the “Optimal” Design of Organization’, paper given to T.I.M.S. X I X Meeting, Houston, 1972.
e Duncan, R. B., ‘Characteristics of Organizational Environments and Perceived Environmental Uncertainty’, Administrative Science Quarter&, Vol. 17, No. 3, September 1972, pp. 313-27. His ‘static-dynamic’ and ‘simple-complex’ dimensions of the environment are equivalent to ‘degree of variability’ and ‘degree of complexity’ respectively.

797j MANAGERIAL AND ORGANIZATIONAL FACTORS. I1 7 3
will concentrate on variability as the more significant dimension in environ- ments for this reason, and also because it can be measured more precisely with the information available.
In conditions of high variability in the environment, successful performance is likely to depend on a company 5aving the capacity for intelligent adapta- tion to changing circumstances. ‘i’here is considerable agreement among writers on organization as to the structural design which will normally assist such adaptation. One attribute is the employment of specialists who are in a position to secure necessary information, and who have the expertise both to evaluate it and to act upon it speedily. Such specialists would, for example, include marketing and technical personnel concerned with developing new products to meet emerging market requirements. A second attribute is an avoidance of heavily formalized systems of organization, in so far as these are built upon standard procedures and red-tape which tend to shape acti- vities on the basis of precedence rather than of new changing requirements.
The propositions that the most successful companies in variable, as opposed to stable environments have more specialized activities and less formalization can be examined among our sample of British firms, especially among those in the manufacturing sector where differences in the degree of variability are more clear-cut between the four industries concerned. The procedure used for establishing relative levels of variability in the environment is as follows.
Evaluation of Environmental Variabi@y Industry-wide data were employed to assess the degree of variability in
companies’ environments. The justification for using industrial statistics lies in their relatively objective nature, and in the argument that they are suffi- ciently indicative to provide sub-samples of companies which have signi- ficantly different clusters of environmental characteristics. A problem with employing this type of data lies in the fact that industries are not completely homogeneous. Therefore, the type of environment facing a particular com- pany is not necessarily precisely represented by a figure aggregated for the industry as a whole. The presence of heterogeneity within these industrial sub-samples will increase the error factor in statistical analysis using an inter- industry differentiation, with the probable consequence that any empirical associations between environment, organizational attributes and perform- ance will be less strongly represented in the research findings.
An alternative approach, not followed here, is to request evaluations of environmental characteristics from key personnel within each company studied. One problem of doing this is that the data are derived from persons whose perception of the environment may be heavily conditioned by the capability of their company’s own systems for obtaining and processing

I 4 THE JOURNAL OF MANAGEMENT STUDIES FEBRUARY
information about the world outside. The assessment of environmental characteristics and of a company's own internal attributes may therefore become confounded in analysis, and this constitutes a worrying possibility in some previous research on the ~ubjec t .~
In evaluating the variability of each industrial environment, particular attention has been given to data available on product market and technolo- gical characteristics. These are likely to have the most immediate bearing on the everyday operations of member companies.
The trend of industry sales figures was the main market statistic used, supplemented by information on short-term changes in company market rankings, the significance of foreign competition and so forth. Data on total industry sales expressed in current prices were obtained for each of the ten years up to the mid-point of the research fieldwork - that is, for the years I 960 to 1969 inclusive. The quality of this data varies as between the six industries. In particular, the series for daily newspapers is incomplete, while that for electronics (excluding consumer electronics) is not available for 1960 and is not wholly reliable.
The raw sales data expressed in E million were standardized. The stand- ardized series were then regressed against time, and the standard error of the estimate for each regression was divided by the mean score to serve as an indicator (V) of market variability. This figure points to the degree of variation about what were strongly linear trends in industry sales over the time period in question. The average year-to-year rates of growth in sales were also calculated for each industry; this serves as an indicator of market change, though not necessarily of variability as we have defined the concept.
The results were:
Manufacturing industries Au.
yearly growth
V* (pcentage)
Service industries A V .
Jearly growtb
V* (percentage) Cbocohte and sweets 3 4 I 5 I I Aduertising 316 5'75 Daily newspaps 469 7'32 LifG insurance 3 54 IO- 3 3 Electronics 661 14.21 Pbarmaceuticafs 674 9-41
* Decimals omitted.
These calculations suggest that electronics and pharmaceuticals represent more variable environments for manufacturing companies than do chocolate
For example, in the study by Lawrence, P. R. and Lorsch, J. W., op. cit. They assessed environ- mental differences on the basis of how much uncertainty executives in research, manufacturing and marketing functions said they faced. These measures have been strongly criticized by Tosi, Henry, Alday, Ramon and Storey, Ronald, 'On the Measurement of the Environment', Administra- tive ScienceQwrter~, Vol. 18, No. I, March 1973, pp. 27-36.

‘97j MANAGERIAL AND ORGANIZATIONAL FACTORS. I1 15
and sweets or daily newspapers. In the service sector, life insurance appears to be somewhat more variable than does advertising. Within the manufac- turing sector, other indicators of variability generally confirm the contrast between the two relatively variable industries, electronics and pharmaceuti- cals, and the two relatively stable industries, chocolate-sweets and daily newspapers. For example, the rate at which technically new products are normally introduced into the market is considerably higher in the two former industries. They also operate in markets where international com- petition is much more extensive and severe, with the additional uncertainties this can bring.
It is more difficult to make a consistent distinction between the two service industries in terms of variability. Industry sales data suggest that life insur- ance constitutes the more variable environment. On the other hand, there is considerably more year-to-year variation in company market rankings within advertising. Many advertising agencies depend on a few large clients for a large proportion of their business. Since accounts are often moved between agencies this high degree of dependence makes for frequent changes in market ranking and for a higher level of uncertainty. The package of services offered in an advertising campaign normally changes more fre- quently than do life insurance policies, and these advertising ‘products’ thus tend to have a shorter life. Advertising agencies rely heavily upon quasi- professional and creative manpower, and individual agencies have experi- enced major upheavals because of the high mobility of key personnel (indeed of all personnel) within the industry.
Data on the technological environments of the two industries, to be shown below, are relevant because they imply that advertising services are supported by a relatively larger design and development effort than is the case with life insurance. This type of activity is itself geared to producing change and innovation in an industry and will hence tend to enhance that industry’s degree of variability. Finally, looking to the future, there are dramatic con- trasts in the longer-term uncertainty surrounding the two industries. Normal rates of return are easier to maintain in life insurance than in advertising because of the dependence on large clients in the latter industry. The adver- tising industry has, as a whole, reduced employment substantially since 1966. It has been facing serious challenges to the traditional concept of an advert- ising agency from new creative consultancies, specialized media buyers and from an expansion of advertising services within clients’ own marketing departments. These considerations lead us to conclude that on balance the environment of advertising agencies tends to be more variable than that of the insurance companies specializing, as most of those studied did, in life insur- ance. However, the distinction is not as clear-cut as between the two pairs of manufacturing industries.

16 THE JOURNAL OF MANAGEMENT STUDIES FEBRUARY
Available statistics on technological environments provide data for indus- try expenditure rates on research and development and for the proportion of employment in R and D and equivalent areas of activity. This type of data gives some indication both of variability and complexity in the technological environment. In so far as R and D is a source of new products and processes then larger investments on it will promote greater external change and variability for an organization located in the industry. In so far as a higher level of R and D effort creates a wider and more complex range of relevant knowledge, and employs the services of more disciplines and specialized personnel, then it will also add to the complexity of the environment.
The Centre for the Study of Industrial Innovation in 1971 issued an analysis of R and D expenditure by the main manufacturing and construction industry groups in Britain during 1968-69. The four manufacturing indus- tries included in our study fall into the broad categories shown in table I. R and D expenditures were calculated for these groups as a percentage of net output (total sales minus costs of materials and fuels). For comparative purposes, table I also shows the percentage of total sales turnover expended on R and D in the same period by the companies in our sample: the data are averaged by industry.
Table I. Comparative industry expenditures on research and development as a proportion of (I) net output, (2) sales turnover
Percentage R and D Percentage R and D t o net ourput to sales turnover Nmber of
Industry Indus fry gronp andcategrrtyt (indwfry sample mean) companiesS Chocolde and sweets Food-drin~-fobacco I I ‘low’ 0.40 IO Daily newspapers Timber-pap-
fwniturropublirhing 0- 5 ‘Negligible’ 0- 14 I4 Electronics Electronics and I 9 6 ‘Intensive’ 5 ’ 2 2 I4
tclccommunimfions, scient@ instmments 5 5 ‘High’
toiletries Pharmaceuticals PbarmMedcals and 7- o ‘High’ 4- 60 I O
Advertising Not available 1-56 9 Lve insurance Not available 0.41 I I*
F ratio = 16.191, P < 0’001 * Predominantly life insurance. t Source: Centre for the Study of Industrial Innovation, Information Paper, November 1971. $ Note: Companies exchded could not supply accurate data.
These comparative statistics clearly indicate that within the manufacturing sector electronics and pharmaceutical companies operate in an innovative environment, while chocolate-sweets and daily newspaper companies do not. The level of investment in R and D reIative to sales was higher in the advert- ising agencies studied than among the insurance organizations. These broad inter-industry contrasts are in the main reflected in the percentages of total employees within companies working on specialized research, design,

'97 J MANAGERIAL AND ORGANIZATIONAL FACTORS. I1 '7 development or equivalent activities. In the following table these percentages, computed for companies in our sample, have been averaged by industry:
Percentage of total employees specializing wholb in R and D Cbocohte D a i b Lifc
IndUstr_Y: and sweets newspaps Electronics Pharmaceuticuls Advertising insurance Number of
Mean percentage of wganiqarions I 1 'I 16 I 2 I2 15
total employees 0' 3 0' I 4' 8 6.0 0' 3 0' I
Fratio = 13.194, P < 0.001. To summarize: as assessed by the indicators used here, electronics and
pharmaceuticals represent more variable organizational environments than do the other two manufacturing industries, chocolate-sweets and daily newspapers. On balance, advertising would appear to represent a more variable environment in the service sector than does life insurance, though the trend of market sales displays a higher level of variability for insurance. The degree of contrast in variability between the two service industries is not so clear-cut or substantial as within manufacturing, and for this reason further analysis on the environment will be confined to manufacturing companies.
Environment, organiTation andperformance Earlier on we noted the argument that environmental variability will
encourage companies to employ people in more specialized roles. In the firms studied, the average number of specialized roles was indeed higher among electronics and pharmaceutical companies than among those in the less variable industries of chocolate-sweets and daily newspapers. When performance was taken into account, however, the degree of specialization did not vary significantly between high and low performing companies within either the stable or variable industries. The contrasting levels of specialization between the two pairs of industries cannot be explained by other factors such as differences in the size of companies. It seems reasonable to suggest therefore that the contrast represents a general long-term adjust- ment on the part of practically all companies to their environments, bearing in mind the technological and professional sophistication of the: science- based industries.
It has been found in several studies that institutions with a greater degree of internal specialization also tend to operate through a relatively formalized organization structure.* If companies operating in a variable environment
4 Cf. Pugh, D. S. et al., 'Dimensions of Organization Structure', Administrutizv SciemeQwrterb, Vol. 13, No. I, June 1968, pp. 65-105; Child, J., 'Predicting and Understanding Organization Structure', Adminisfrative Science Quarter&, Vol. 18, No. 2, June 1973, pp. 168-85. These articles also describe in more detail the measures of organization structure used in this paper.

1 8 THE JOURNAL OF MANAGEMENT STUDIES FEBRUARY
tend to be more specialized internally, does this then mean that there is no support either for the argument that successful companies in such an environ- ment will have relatively low levels of formalization ?
There was no association between the profitability of companies and their degree of formalization, when contrasting stable and variable environments. The proposition that successful companies in variable environments will be less formalized was, nevertheless, supported when growth in sales was used as the performance criterion. Table I1 indicates that there was a significantly lower reliance on standardized procedures and on documentation (especially written records on people's performance within the company) among faster growing companies in the more variable environments. Although there were no significant differences in leve1.s of formalization between high and low growth companies in the more stable industries, it is worth noting that the high growth group has consistently higher average scores.
Table 11. Comparison of the formalization of companies achieving above and below average levels of growth, and located in stable and variable environments
Stable environments Variable environments (2 5 chocolate-sweets and newspaper (26 electronics and pharmaceuticals
Variables of formaliqation companies) companies) Mean scores Mean scores
r 1 Above Below Above Below average average average average growtb growtb growtb growth
A
(N= II)(N= 14) 1 P (N= 8) (N= 18) t P* Overall standmdqation
Overall docnmentation 24.46 21-43 0.886 n.s. 28'1.3 34-11 1.859 < o * o j Written records of role
of procedracs 82-82 76-93 0.783 n.s. 85-13 104.58 2.508 < 0 . 0 2 5
performance 5 - 5 5 5-29 0.278 n.s. 7-50 8-94 2.431 <0*025
* One-tail test, assuming df = IO.
These results can be interpreted as giving limited support to the contin- gency argument on organization design and environment. Although the companies in the variable environments do have high levels of formalization, the faster growing firms manage to restrain formalization to a significantly lower level. The alternative explanation for this finding, that it is a faster rate of growth which is the operative factor, leaving the development of formalized administrative systems lagging behind, is not very plausible. For the faster growing companies in the stable environments exhibit somewhat higher average levels of formalization than do the slow growers.
The differences between high and low growth companies were most marked in certain areas of formalization. For instance, fast growing compan- ies operating in variable environments made relatively little use of formal

I975 MANAGERIAL AND ORGANIZATIONAL FACTORS. I1 =9 training procedures and courses, of standardized personnel practices con- cerned with minor rewards and sanctions (such as ceremonies and discip- line), of hierarchical procedures for seeking and conveying communication and decisions, or of procedures for progress chasing. Within the stable sector, fast growing companies were distinguishable by having significantly more formalization in the production area, especially concerning operator training, defining operative tasks and recording wastage rates.
The establishment of procedures and paper records can, from a manage- ment point of view, make it easier to delegate decisions without losing con- trol, because formalization sets limits on the discretionary content of sub- ordinates’ roles and allows for feedback on their performance to be assessed against clearly prescribed standards. It is not surprising therefore that the ways in which delegation and performance were related among companies in the two environments to some extent reflect the pattern found with formalization. While there was no association between performance and levels of delegation as a whole in companies, those operating under more stable conditions which delegated decisions in the production area tended to be more profitable and to grow faster. At the same time, the more profit- able companies in this type of environment tended to restrict decisions on expenditure and purchasing to a more senior level of management. In contrast, the more profitable companies in the variable industries were distinguished by a greater centralization of decision-making on shop floor matters, including labour disputes, as well as on decisions concerning the type of market to be aimed for and the pricing of products.
Sixe of Company Several investigations have found a high degree of association between
the size of organizations and the extent to which they exhibit particular structural characteristics. Larger organizations tend to assign their greater numbers of employees to more specialized roles within a greater range of different departments, to have more standardized procedures and documen- tation, and to delegate decisions further down from top level: further down the more extended hierarchies which constitute another of their salient characteristic^.^
The strength and consistency of these relationships suggest that, as insti- tutions grow, their structures have to be developed towards the models which characterize large units in order to avoid prohibitive costs which might follow a breakdown in coordination and control if structure is not so adjusted. This process of adjustment implies that there is some lag between a change in size and a change in structure, which in turn raises the possibility that better performing institutions may be those which reduce this lag to a minimum.
See, Child, J., ibid.

20 THE JOURNAL OF MANAGEMENT STUDIES FEBRUARY
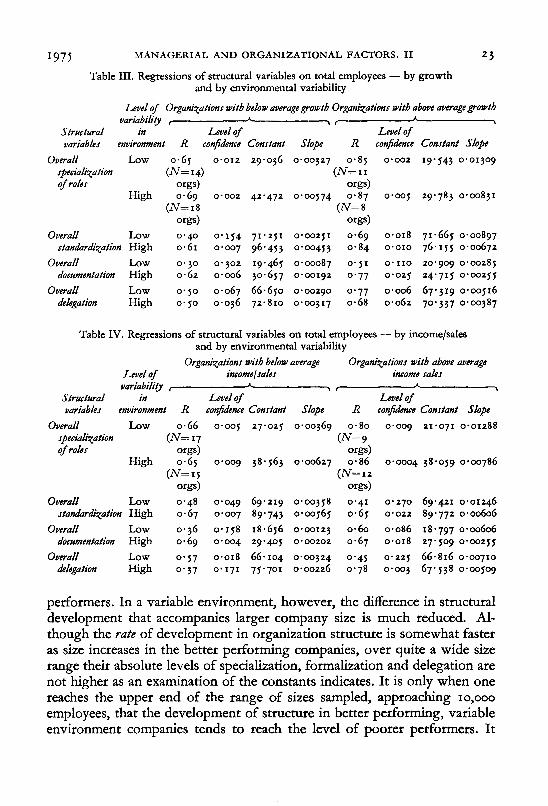
Some light can be thrown on the validity of this proposition by comparing the regressions of salient dimensions of organization structure on a measure of size, exhibited by above and below average performing companies. When this analysis was performed on the full sample of business companies it was found that as size (total employees) increases, the rise in values of the struc- tural dimensions is normally steeper for those companies achieving above average levels of growth and profit performance. Two exceptions are the number of hierarchical levels, and the range of specialist departments in the comparisons of profitability, where there were no marked differences in regression slopes.
An indication of the pattern of these findings is given by figure I where the slopes for the overall specialization of roles within companies are plotted. The differences between high and low performing companies are also very similar in regard to the use of standard procedures, the degree of reliance on documekation, and the overall level of delegation, slopes for which are not shown here. The general pattern is for both high and low performing companies to have similar intercept values (constants) but noticeably different slope values. This means that among the smaller companies sampled there is little difference between the structural profiles of high and low performers. It is as one moves to a larger size of company that the structural differences between good and poor performing companies progressively widen. Poorly performing large companies tend to specialize their staff less, to have less developed systems and procedures, and to delegate decision-making less extensively. It is also worth noting that among the poorly performing com- panies the strength of the relation between changes in size and changes in structure (R2) is noticeably reduced compared to that among high performers.
A detailed examination of the individual elements in the measures of organization structure revealed that differences between high and low per- forming companies are most marked in certain areas of activity. In the faster growing and more profitable companies, as total size increased so the develop- ment of specialized roles took place at a particularly rapid rate (compared with that in poor performing companies) in the areas of finance and account- ing, production control, production methods and work study, personnel and general administration. The biggest differences in regression slopes for other structural features between high and low performers were mostly in the same areas of activity. For example, the following systems and procedures were among those used more extensively by high performance companies as they became larger than by low performers: sophisticated financial controls applied to a wide range of activities, a precise definition of operative tasks by management, the application of work study and methods, the use of labour turnover statistics, the planning of recruitment, and the regular updating of company forms and documents. These types of regular procedure fell into

N
12
0
C 80
*S 3 .b
60
20
AI
= Co
mpa
nies
with
abov
e av
erag
e gr
owth
, R2
=0
-64
, N =
29.
A2
= Co
mpa
nies
with
abo
ve a
vera
ge in
com
e /s
ales
, R'
= 0.4
9, N
= 35.
A3
= Co
mpa
nies
with
abo
ve av
erag
e in
com
e/ne
t as
sets
, R2
=0.66, N
= 21
.
BI
= Co
mpa
nies
with
belo
w av
erag
e gr
owth
, F?
=0-
3l, N=48.
B2
= Co
mpa
nies
with
bel
ow a
vera
ge in
com
e/sa
les,
R2=0-35, N=
44
.
B3 =
Com
pani
es w
ith b
elow
ave
rage
inco
meh
et a
sset
s, R
2 ~0
.30
, N=
31.
l I
I 1
I I
I I
I 1
I
10
0
2000
3000
40
00
5000
6000
7000
8000
9000
1000
0 Em
ploy
ees
Figu
re I
. R
egre
ssio
n of
tota
l spe
cial
izat
ion
bet
wee
n ro
les
on to
tal
empl
oyee
s fo
r co
mpa
nies
with
abo
ve and b
elow
ave
rage
per
form
ance
\3
W 2
22 THE JOURNAL OF MANAGEMENT STUDIES FEBRUARY
the areas of activity in which specialized roles tended to develop more rapidly with an increase in size among the better performing companies.
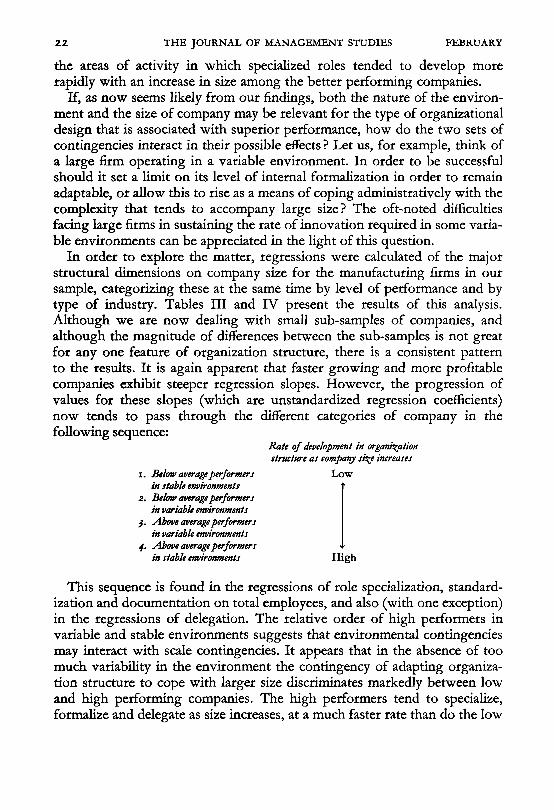
If, as now seems likely from our findings, both the nature of the environ- ment and the size of company may be relevant for the type of organizational design that is associated with superior performance, how do the two sets of contingencies interact in their possible effects ? Let us, for example, think of a large firm operating in a variable environment. In order to be successful should it set a limit on its level of internal formalization in order to remain adaptable, or allow this to rise as a means of coping administratively with the complexity that tends to accompany large size ? The oft-noted difficulties facing large firms in sustaining the rate of innovation required in some varia- ble environments can be appreciated in the light of this question.
In order to explore the matter, regressions were calculated of the major structural dimensions on company size for the manufacturing firms in our sample, categorizing these at the same time by level of performance and by type of industry. Tables I11 and IV present the results of this analysis. Although we are now dealing with small sub-samples of companies, and although the magnitude of differences between the sub-samples is not great for any one feature of organization structure, there is a consistent pattern to the results. It is again apparent that faster growing and more profitable companies exhibit steeper regression slopes. However, the progression of values for these slopes (which are unstandardized regression coefficients) now tends to pass through the different categories of company in the following sequence:
I. Below average performers in stabb environments
2. Below averageperfmmers in variable environments
J. Above average performers in variable environments
4. Above average perfmmers in stable environments
Rate of development in organization stlwctwe as company size increases
LOW
High
This sequence is found in the regressions of role specialization, standard- ization and documentation on total employees, and also (with one exception) in the regressions of delegation. The relative order of high performers in variable and stable environments suggests that environmental contingencies may interact with scale contingencies. It appears that in the absence of too much variability in the environment the contingency of adapting organiza- tion structure to cope with larger size discriminates markedly between low and high performing companies. The high performers tend to specialize, formalize and delegate as size increases, at a much faster rate than do the low
I97 > MANAGERIAL AND ORGANIZATIONAL FACTORS. 11
Table 111. Regressions of structural variables on total employees - by growth and by environmental variability
23
Level of Organizations with below averagegrowth Organizations with above average gt.otvfh variability c-'---> r A \
Structural in Level of b e l of variables environment R confidence Constant Slope R confihnce conmnf slope
Overall specia lixa tion of roles
Overall standbrdiza tion
documentation Overall
Overall &legation
Low
High
Low High Low High Low High
0'012
0'002
0' I54 0 007 0- 302 0 - 006 0.067 0.036
29.036
42 - 472
71.251 96'453 19.465 30' 65 7 66 - 650 72.810
0'002
0.005
0.018 0'010
0' I IO 0'02J
0*006 0.062
29.783 0.00831
71.665 0.00897 76.155 0.00672 20.909 o.00~85
67.319 0.00516 24'71s 0'002s5
70'337 0.00387
Table IV. Regressions of structural variables on total employees - by income/sales and by environmental variability
Organixations with below average Organizatiotrs with above average b e l of incornelsales income sales
variability L I t h \
Structural in b e l of h e f of variables environment R confidence Constant Slope R conjhnce Constant Slope
Overall Low 0.66 0.00s 27.025 0.00369 0.80 0.009 21.071 0.01288 specialization (N=17 (N=9 of roles o w ) o w )
(N= I 5 (N=I~
Overall Low 0.48 0.049 69.219 0.00358 0.41 0.270 69.4.21 0.01246 stadzrdi~ation High 0.67 0.007 89.743 0*00565 0.65 0.022 89.772 0~00606
Overall Low 0.36 0 . 1 5 8 18.656 0-00123 0.60 0.086 18.797 0-00606 documentation High 0.69 0.004 29-40s 0~00202 0.67 0.018 27.509 0.00255
Overall Low 0.57 0.018 66.104 0-00324 0.45 0.225 66.816 0~00710 delegation High 0.37 0.171 71.701 0*00226 0.78 0.003 67.138 0~00509
High 0.65 0.009 38.563 0.00627 0.86 0.0004 38.059 0.00786
o w ) orss)
performers. In a variable environment, however, the difference in structural development that accompanies larger company size is much reduced. Al- though the rate of development in organization structure is somewhat faster as size increases in the better performing companies, over quite a wide size range their absolute levels of specialization, formalization and delegation are not higher as an examination of the constants indicates. It is only when one reaches the upper end of the range of sizes sampled, approaching IO,OOO
employees, that the development of structure in better performing, variable environment companies tends to reach the level of poorer performers. It

24 THE JOURNAL OF MANAGEMENT STUDIES FEBRUARY
appears, then, that management has to pay regard to multiple contingencies, such as those of environment and scale together, when planning the design of its organization.
Deductions such as these from the results of a single study are obviously highly tentative. They do, nevertheless, accord with the current mode of theorizing on organization and performance and certainly deserve to be tested further in future research.
A third strand in the contingency approach is found in the proposition that company performance will be enhanced if organization is designed to suit the prevailing type of technology. This argument is chiefly linked with Woodward’s studies, but unfortunately in testing it empirically neither she nor other investigators have employed precise measures of performance.g
Previous analyses of the present sample of companies concluded that organization was systematically related to technological variables in certain limited respects. As the integration of technology varied, especially in the continuity and rigidity of production systems, so there were corresponding changes in the nature of specialization within areas of activity such as main- tenance, production control, despatch and transport.’ These activities are ancillary to a company’s main workflow, to which the measures of tech- nology were applied. It was found, in addition, that the proportion of total employment allocated to some of these ancillary functions varied along with differences in technology.8
These associations between technology and the structure of employment in companies lead one to ask whether, as with environment and size, there is some logic of adjustment to contingencies here. If there is, then the extent to which companies recognize the logic in their organizational planning may predict differences in their performance.
There was some support for this proposition. Correlations were computed separately for above and below average performance companies between a measure of rigidity in the main workflow and organizational variables. Cer- tain significant differences appeared in the structure of specialist employ- ment. For instance, although in both high and low performance companies maintenance roles became more specialized along with the use of more rigid technology (generally characterized by heavier and more specialized plant),
6 Woodward, J., Indwfrial Organiqafion: T b e q and Practice, London: Oxford University Press, 1965. Also Zwerman, W. L., New Perspectives on Orguniqation Theory, Westport, Conn.: Greenwood, ‘970.
7 Child, J. and Mansfield, R., ‘Technology, Size and Organization Structure’, JocioZo~, Vol. 6, No. 3, September 1972, pp. 369-93.
Child, J., ‘Parkinson’s Progress: Accounting for the Number of Specialists in Organizations’, Adminisfrufive ScienceQwrterb, Vol. 18, No. 3, September 1973, pp. 328-48.

974 MANAGERIAL AND ORGANIZATIONAL FACTORS. 11 25
it was only in faster growing and more profitable companies that the require- ments of the more rigid technologies were met by allocating a larger per- centage of total employment to maintenance services. A comparable distinc- tion was apparent with despatch and transport activities. In higher per- formance companies there was a significant positive relationship between rigidity of technology and a greater proportion of total employment being given over to these activities, in low performance companies there was no relationship.
A further connection between technology, performance and organization was apparent in regard to market research activities. Among the companies securing an above average level of income to sales, as rigidity of technology increased so did the proportion of employment devoted to market research activities and also the level of specialization among employees in that function. The difficulties of achieving a rapid changeover of products with less flexible technologies may help to account for this finding, since they place a premium on the securing of adequate data about market trends and on the forecasting of market changes.
Conclusion Research into the performance of a sample of British companies has lent
tentative support to both universalistic and contingency arguments. The findings of this research suggest several ways in which the two arguments are compatible. In essence, the contingency approach emphasizes that com- pany decision-makers should adequately secure and evaluate information on their operating situation, and that they should adapt the design of their organization when necessary. It is quite possibly a general rule that man- agerial characteristics, such as the personal flexibility and energy associated with youth, favour this capacity for reorganizing, accepting and adjusting to new contingencies, whatever the type of company and its operating circumstances. This last proposition is universalistic in nature, and is suggested by some of our findings; it is nevertheless quite compatible with a contin- gency view of organizational design. A further example is that the priority attached to difference objectives by top management might generally 'influ- ence the profile of performance that a company attains, while at the same time the performance of two companies with identical sets of objectives will be determined by the quality of their adjustment to prevailing contin- gencies.
The research that has been reported does not demonstrate very strong relationships between managerial or organizational variables and company performance. To some extent this may reflect inadequacies in the measure- ments employed or in the choice of variables which were investigated. Another consideration is that if, as Boswell maintains, 'a vast number of

26 THE JOURNAL OF MANAGEMENT STUDIES FEBRUARY
influences on performance are at work’, then no single factor is likely to have much effect on its own? A third explanation for the lack of strong relation- ships with performance may lie in the fact that, over the course of time, managements are normally able to adopt strategies which are intended to modify the constraints otherwise imposed by the situation in which they find themselves. That is to say, management is an active and dynamic force rather than just a reactive and static one. Managers can, and do, take various steps to modify the environment in which they operate and to manipulate factors such as the size of operating units and their technologies. This freedom of action tends to reduce the degree to which contingency theories can account for large proportions of the variance in company performance.10
In making the last point, we have reminded ourselves that managers are decision-makers, and that the processes of decision-making are relevant for an understanding of company performance. A limitation of our research, and of virtually all studies so far undertaken, is that they do not tell us much about the internal behaviour of companies at policy-making levels. Future investigations into management decision-making behaviour should lead us to the more direct causes of poor performance. Such causes might include barriers in the flow of relevant information to managers, or problems in reconciling managers’ personal values with certain unpalatable decisions necessary for the maintenance of performance.
Although a great many questions remain unanswered, some implications for management practice do emerge from our research. Two can be advanced with some confidence, and they both concern quite fundamental matters.
The first practical lesson is drawn from the association between youthful top management and the chances of attaining a high rate of company growth. We concluded in Part I of the paper that age was probably an operative variable in this relationship, through the medium of the more ‘thrustful’ attitudes and behaviour which tend to characterize younger managers. It would follow from this conclusion that companies’ career planning should ensure a sufficiently rapid rise of suitably qualified young people into fairly senior ranks of management. A corrolary is that the practice among certain American companies of re-locating senior managers after a certain age, allowing for differences in individual preferences and levels of achievement, should become a normal and matter-of-course event which is not seen to cast any personal reflection on the managers concerned. In this connection it is interesting to note that a few years ago Professor Dubin when comparing British and American practice, remarked in similar vein that British manage- ment should change the primary basis for status among its ranks from a
Boswell, J., The Rise and Decline of Small Firms, London: Allen and Unwin, 1973. l0 Child, J., ‘Organizational Structure, Environment and Performance: The Role of Strategic
Choice’, Sociologa Vol. 6, No. I, January 1972, pp. 1-22.

‘97j THE MANAGERIAL AND ORGANIZATIONAL FACTORS. I1 27 person’s age to the nature of the job he occupies and his performance in it.11 We are, of course, talking here of a major shift in cultural attitudes which many people may resist and which would probably have a difficult passage. None the less, our available knowledge on the managerial concomitants of company performance speaks in its favour.
The second practical conclusion which derives from our research is today fairly widely recognized. Namely, the design of organization is a matter of serious consequence for company performance, which requires an informed judgment as to how to strike a balance between the conflicting requirements that may be imposed by different situational contingencies. We discussed one such conflict in regard to the implications for organizational design which stem from large scale on the one hand and from operating in a variable innovative environment on the other. The fundamental point is that the presence of Merent requirements across the range of varied operating circumstances in which different companies find themselves, means that there is no single mode of organizing which can serve as an optimum for all situations.
This, of course, is the central argument in contingency theory. Managers should expect factors like environment, size and technology to establish requirements for organizational design which have to be carefully investigated and assessed. At the same time, as we have hinted earlier in this conclusion, the contingency approach can mislead in the way it implies that it is wholly outside the management’s powers to modify the context of its company operations quite deliberately as a matter of policy. If one takes the question of large size, for example, not only is it often possible to devolve many activities into smaller units (as with the venture management subsidiary) but, looking ahead, managers may be under increasing social pressures to take this course of action in conditions where huge amorphous institutions become too complex to control and too remote to gain the commitment of their employees.
The import, then, of our existing knowledge on the managerial and organ- izational concomitants of company performance is that it already indicates some of the directions in which positive management action can have tangible results.
Dubin, R., ‘Management in Britain - Impressions of a Visiting Professor’, Journal of Man- agement Stdie$, Vol. 7, No. 2, May 1970, pp. 183-98.