Managerial Accounting 12e (Garrison) - Instructor's Manual Ch 1
Upload
rajutheoneCategory
view
656download
87description
Introduction
Managerial accounting is concerned with providing information to managers i.e., people inside an organization who direct and control its operations.
Managerial accountants prepare a variety of reports. For example, reports on how well managers or business units have performed-comparing actual results. The reports help to plan and to set standard.

As it is manager oriented, any study of managerial accounting must be preceded by some understanding of what managers do, the information managers need, and the general business environment.
The Work of Management and the Need for Managerial Accounting Information
Managers carry out three major activities- planning, directing and motivating, and controlling.
Planning involves establishing a basic strategy, selecting a course of action, and specifying how the action will be implemented. Directing and motivating involves mobilizing people to carry out plans and run routine operations. Controlling involves ensuring that the plan is actually carried out. Management accounting information plays a vital role in these basic management activities but most particularly in the planning and control functions.
Cost concepts and Classification
The work of management focuses on-
Planning, and
Controlling.
To carry out these planning and controlling responsibilities, managers need information about the organization. This information often relates to the costs of the organization.
Cost concepts and Classification
Cost: Cost is an exchange price or a sacrifice made to secure benefit.
Cost means the resources sacrificed for acquiring anything.
Example: Purchase of equipment for Tk. 50,000.
Frequently the term ‘cost’ is used synonymously with the term ‘expense’.
An expense may be defined as a measured outflow of goods or service, which is matched with revenue to determine income.
Expense includes all expired costs which are deductible from revenues.
Example: Depreciation of equipment Tk. 5,000.
Loss: When the organization is failure to use the asset then creates loss.
Loss is the difference between expense and revenue.
Cost Classification
General Cost Classifications
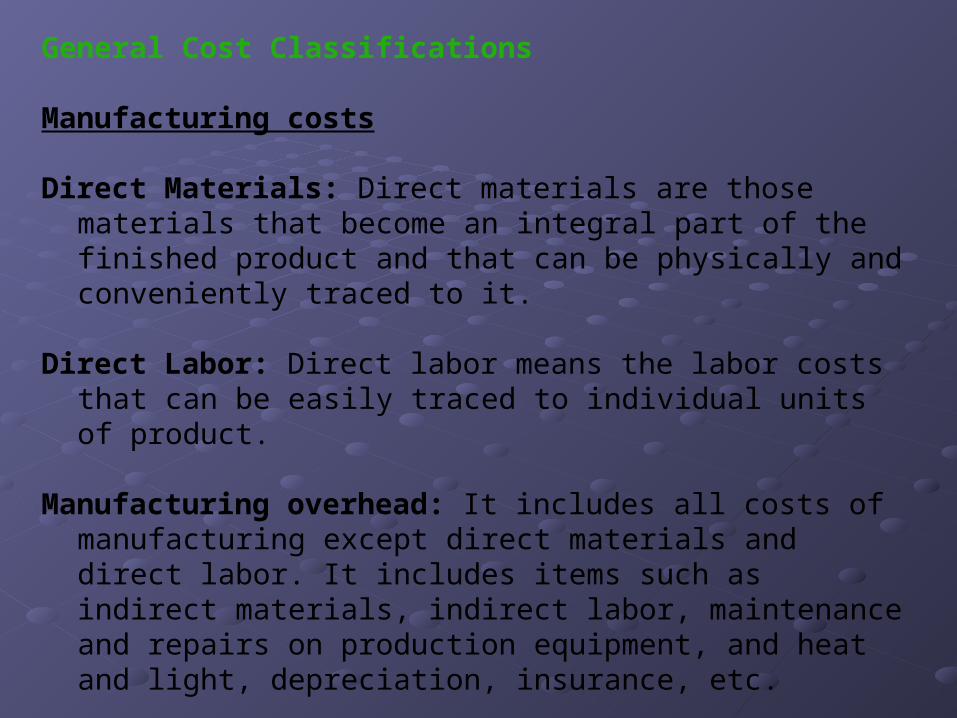
• Manufacturing costs: Most manufacturing companies separate manufacturing cost into three broad categories- direct materials, direct labor, and manufacturing overhead.
• Nonmanufacturing costs
General Cost Classifications
Manufacturing costs
Direct Materials: Direct materials are those materials that become an integral part of the finished product and that can be physically and conveniently traced to it.
Direct Labor: Direct labor means the labor costs that can be easily traced to individual units of product.
Manufacturing overhead: It includes all costs of manufacturing except direct materials and direct labor. It includes items such as indirect materials, indirect labor, maintenance and repairs on production equipment, and heat and light, depreciation, insurance, etc.
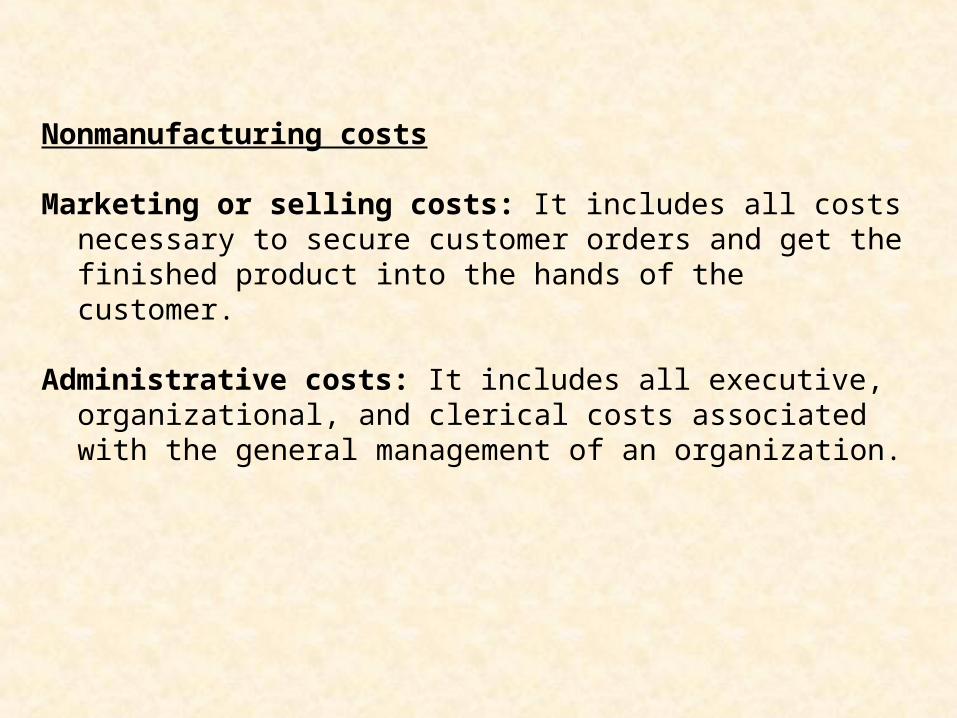
Nonmanufacturing costs
Marketing or selling costs: It includes all costs necessary to secure customer orders and get the finished product into the hands of the customer.
Administrative costs: It includes all executive, organizational, and clerical costs associated with the general management of an organization.
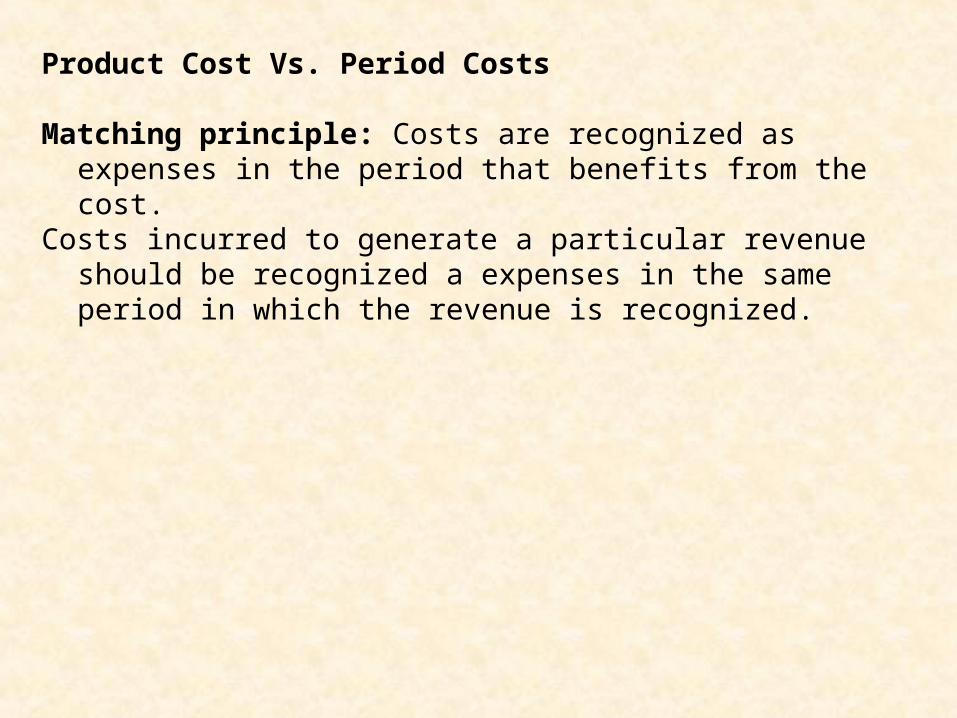
Product Cost Vs. Period Costs
Matching principle: Costs are recognized as expenses in the period that benefits from the cost.
Costs incurred to generate a particular revenue should be recognized a expenses in the same period in which the revenue is recognized.
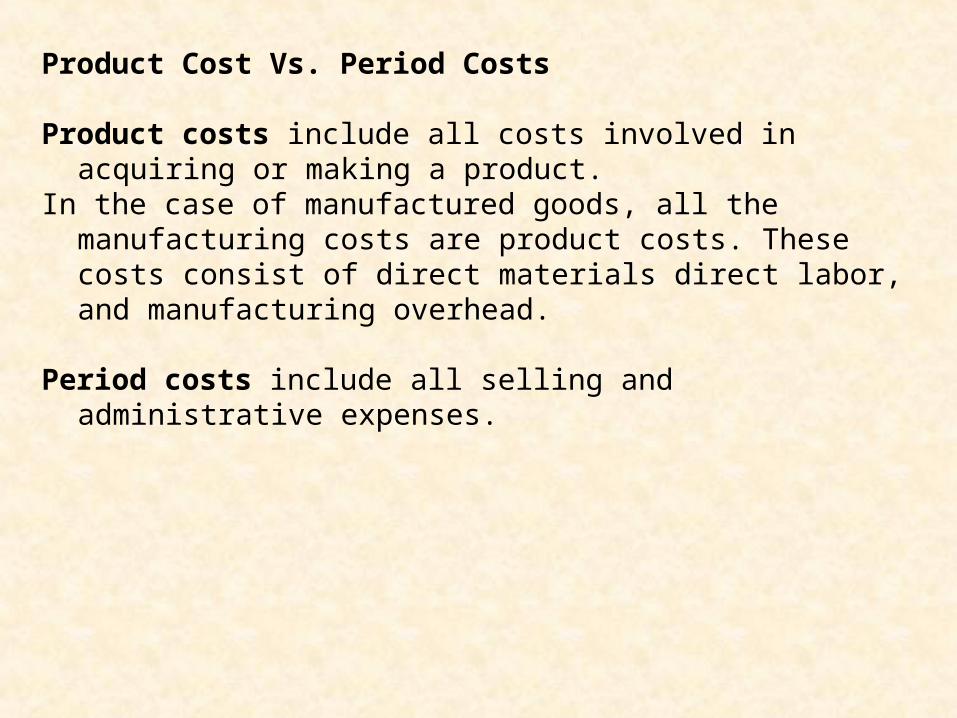
Product Cost Vs. Period Costs
Product costs include all costs involved in acquiring or making a product.
In the case of manufactured goods, all the manufacturing costs are product costs. These costs consist of direct materials direct labor, and manufacturing overhead.
Period costs include all selling and administrative expenses.
Product Cost Vs. Period Costs
Inventoriable Costs: Product costs are known as inventoriable costs since those are initially assigned to inventories. Product costs are initially assigned to an inventory account on the balance sheet, When the goods are sold, the costs are recorded as expenses by the name cost of goods sold and matched against sales revenue.
Prime Cost and Conversion Cost
Prime cost is the sum of direct materials cost and direct labor.
Conversion cost is the sum of direct labor and manufacturing overhead cost.
Cost Classifications on financial Statements
• The Balance Sheet
Inventories accounts of a manufacturing company differ from inventory account of a merchandising company. A merchandising company has only one class of inventory – merchandise inventory.
A manufacturing company has three classes of inventories-raw materials, work in process, and finished goods.
Cost Classifications on financial Statements
• The Income StatementCost of Goods Sold in a Merchandising Company
Beginning merchandise inventory + Purchases = Ending merchandise inventory + Cost of goods sold
Cost of Goods Sold in a Manufacturing Company
Beginning finished goods inventory + cost of goods manufactured = Ending finished goods inventory + Cost of goods sold
Cost classifications in relation to volume
Variable cost: Variable cost changes in proportion to changes in production volume.
Per unit variable cost is fixed but total variable cost is changeable.
Fixed cost: Fixed cost remains unchanged for a given time period despite changes in production volume.
Total fixed cost is fixed but per unit fixed cost is changeable.
Semi-variable cost: one part is fixed and another part is variable.
Example: Electricity bill, water bill, etc.
Cost classifications for assigning cost to Cost Objects
Cost are assigned to objects for a variety of purposes including pricing, profitability studies, and control of spending.
Cost Object is anything for which a separate measurement of costs is desired. For example, product, service, customer, etc.
Direct costs: A direct cost is a cost that can be easily traced to the particular cost object under consideration.
Indirect costs: An indirect cost is a cost that cannot be easily traced to the particular cost object under consideration.
Some indirect cost are common costs.
A common cost is a cost that is common to a number of costing objects. it cannot be traced to them individually.
Cost classifications for decision making
Differential cost: A difference in costs between any two alternatives is known as a deferential cost.
Opportunity cost: Opportunity cost is the potential benefit that is given up when one alternative is selected over another.
Sunk cost: A sunk cost is a cost that has already been incurred and that cannot be changed by any decision made now or in the future.
Relevant Cost
Irrelevant Cost
Systems Design: Job-Order Costing
Chapter 3
Product costing is the process of assigning costs to the products and services provided by a company. An understanding of this costing process is vital to managers, since it has an impact on key management decisions.
In this chapter, we will see the use of an absorption costing approach to determine product costs. In absorption costing, all manufacturing costs, fixed and variable, are assigned to units of product. This approach is also known as the full cost approach.
Types of Costing Systems Used to Determine Product Costs
• Process costing• Job-order costing
A job-order costing system is used in situations where many different products are produced each period.
In a job-order costing system, costs are traced and allocated to jobs and then the costs of the job are divided by t6he number of units in the job to arrive at an average cost per unit.
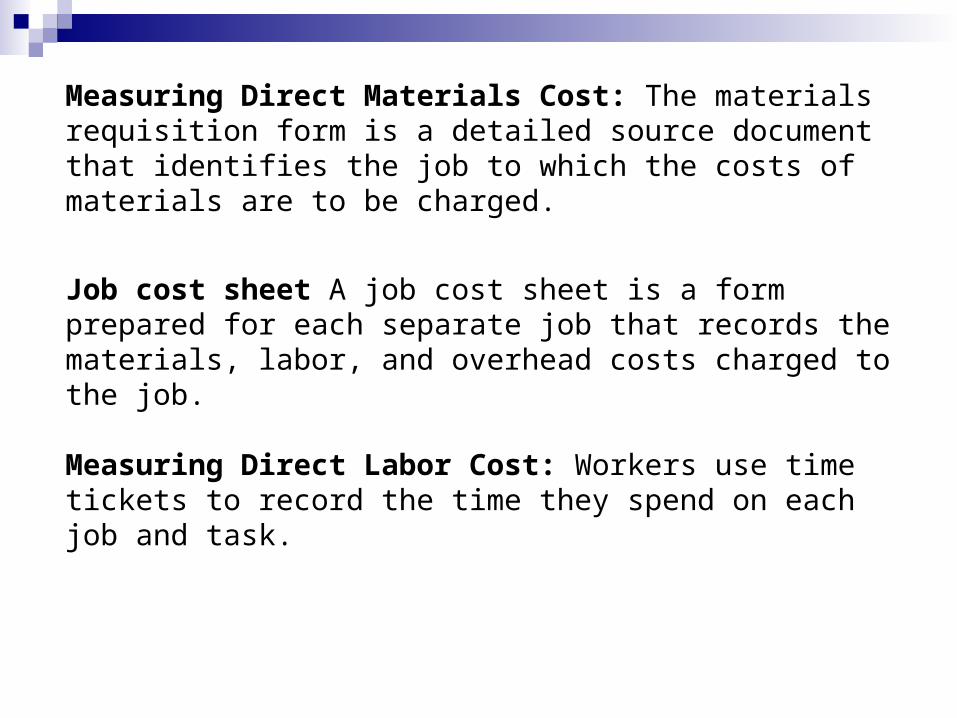
Measuring Direct Materials Cost: The materials requisition form is a detailed source document that identifies the job to which the costs of materials are to be charged.
Job cost sheet A job cost sheet is a form prepared for each separate job that records the materials, labor, and overhead costs charged to the job.
Measuring Direct Labor Cost: Workers use time tickets to record the time they spend on each job and task.
Direct materials cost and direct labor cost are traced directly to each job.
Manufacturing O/H applied to each job using a predetermined rate.
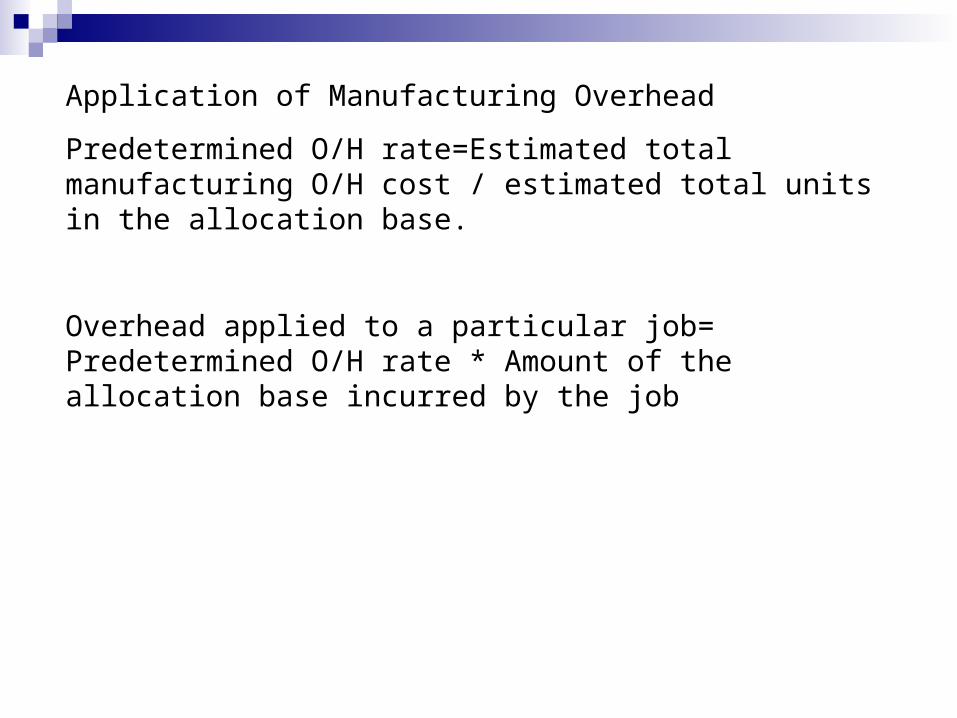
Application of Manufacturing Overhead
Predetermined O/H rate=Estimated total manufacturing O/H cost / estimated total units in the allocation base.
Overhead applied to a particular job= Predetermined O/H rate * Amount of the allocation base incurred by the job
Using a predetermined rate makes itpossible to estimate total job costs
sooner.
Actual overhead for the period is notknown until the end of the period.
The Need for a Predetermined Manufacturing Overhead Rate
Job-Order Costing – Typical Accounting Entries
Let’s look at journal entries for a job-order costing system.
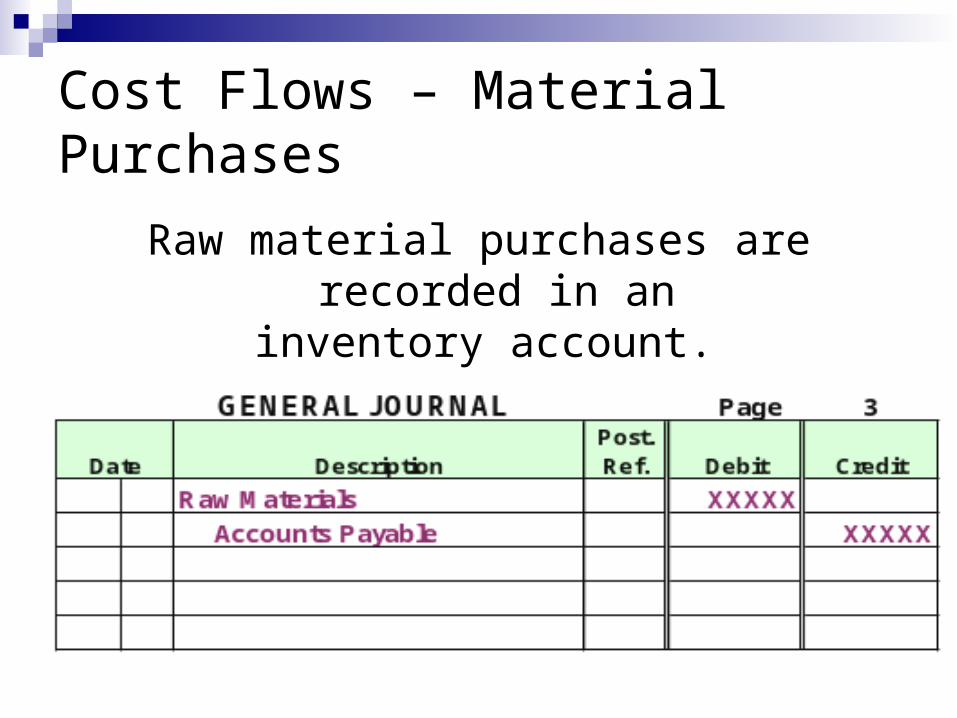
Cost Flows – Material Purchases
Raw material purchases are recorded in aninventory account.
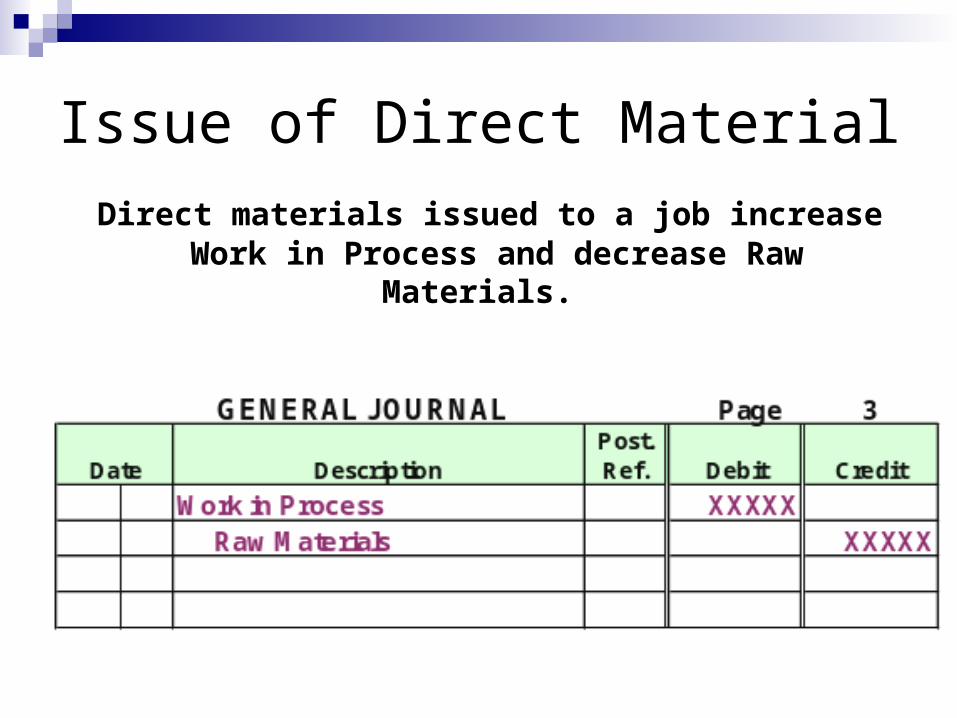
Issue of Direct Material
Direct materials issued to a job increase Work in Process and decrease Raw Materials.
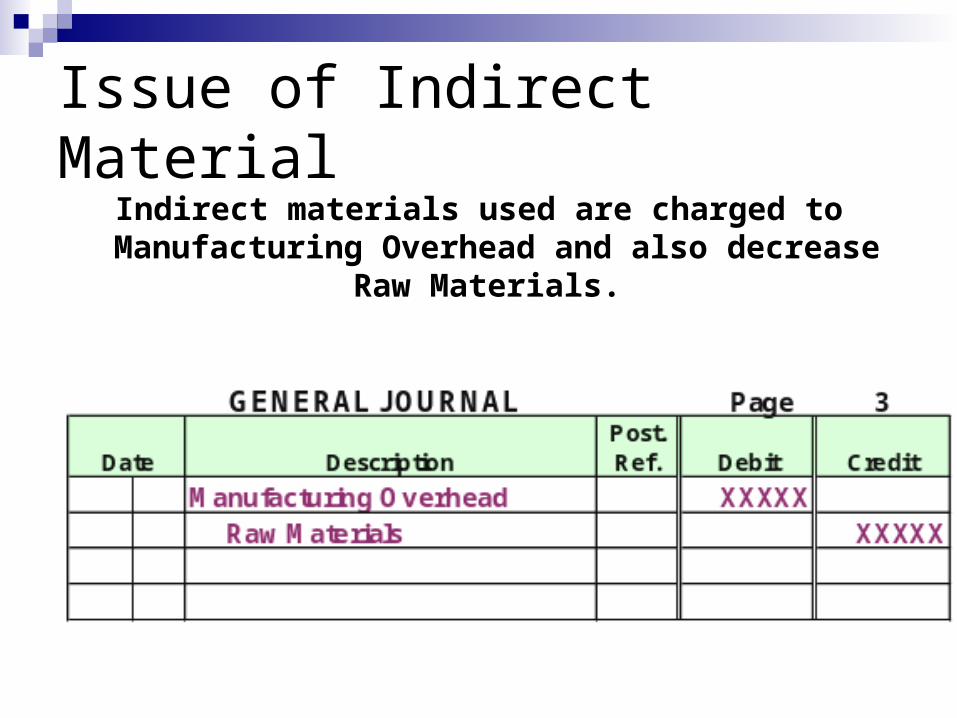
Issue of Indirect MaterialIndirect materials used are charged to Manufacturing
Overhead and also decrease Raw Materials.
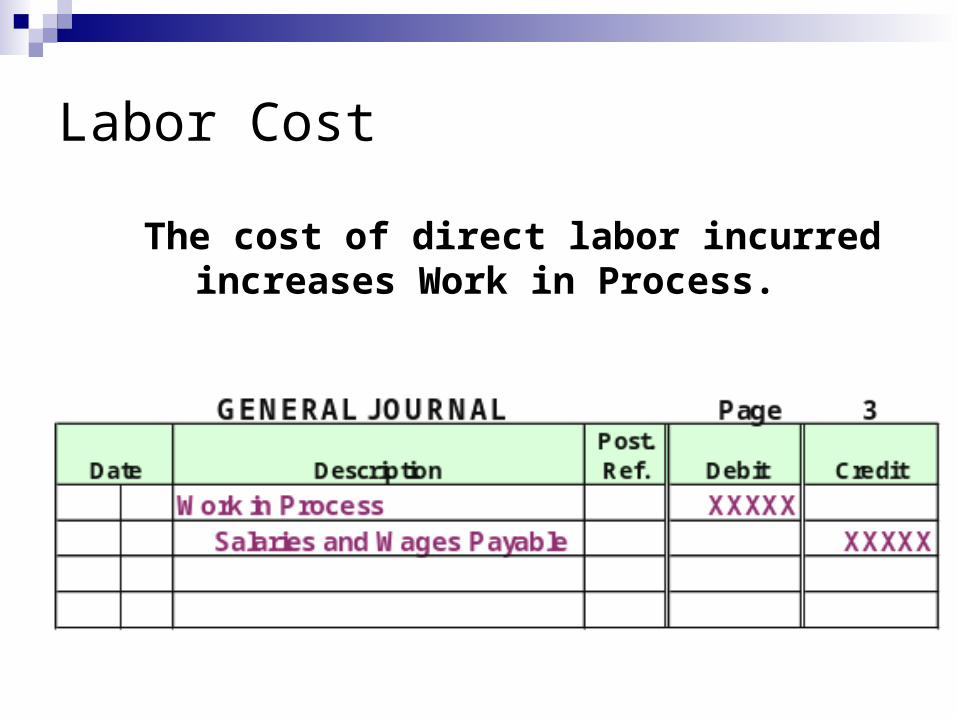
Labor Cost
The cost of direct labor incurred increases Work in Process.
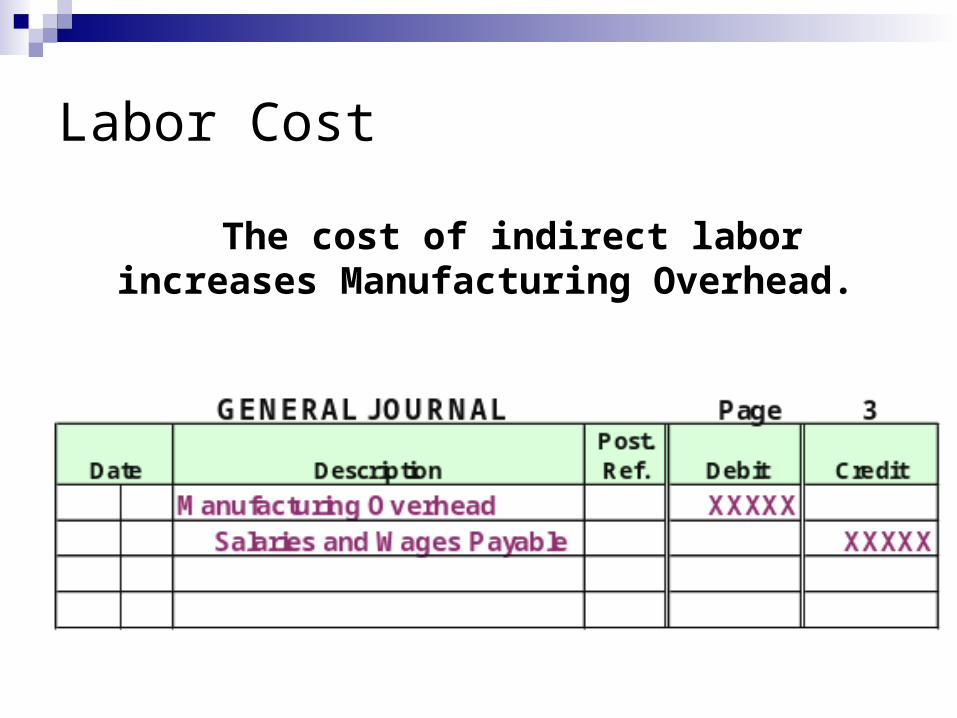
Labor Cost
The cost of indirect labor increases Manufacturing Overhead.
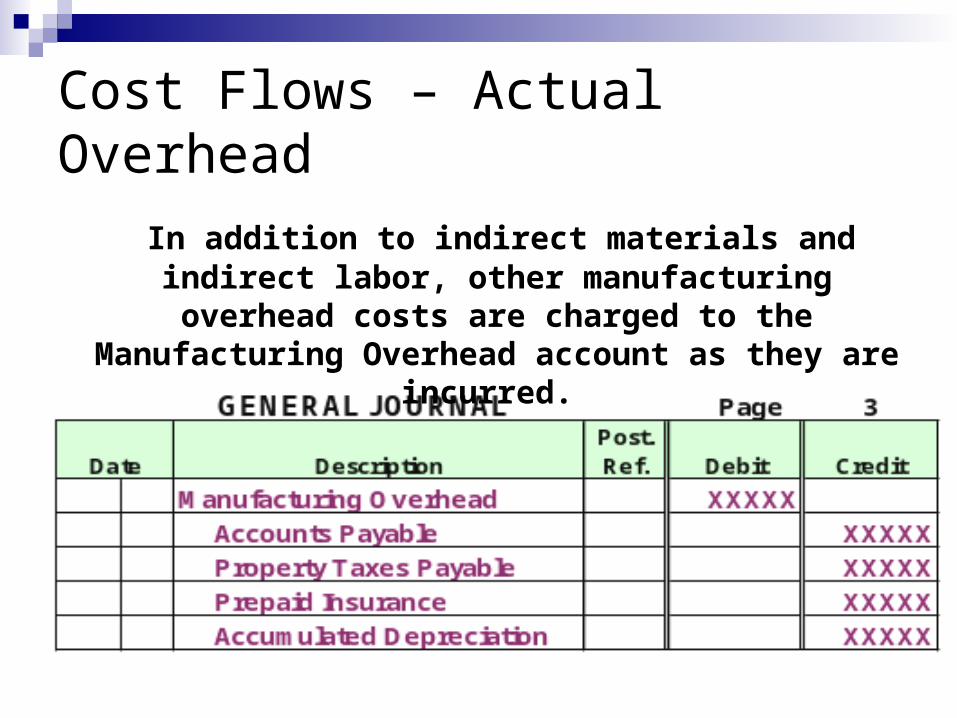
Cost Flows – Actual Overhead
In addition to indirect materials and indirect labor, other manufacturing overhead costs are charged to
the Manufacturing Overhead account as they are incurred.
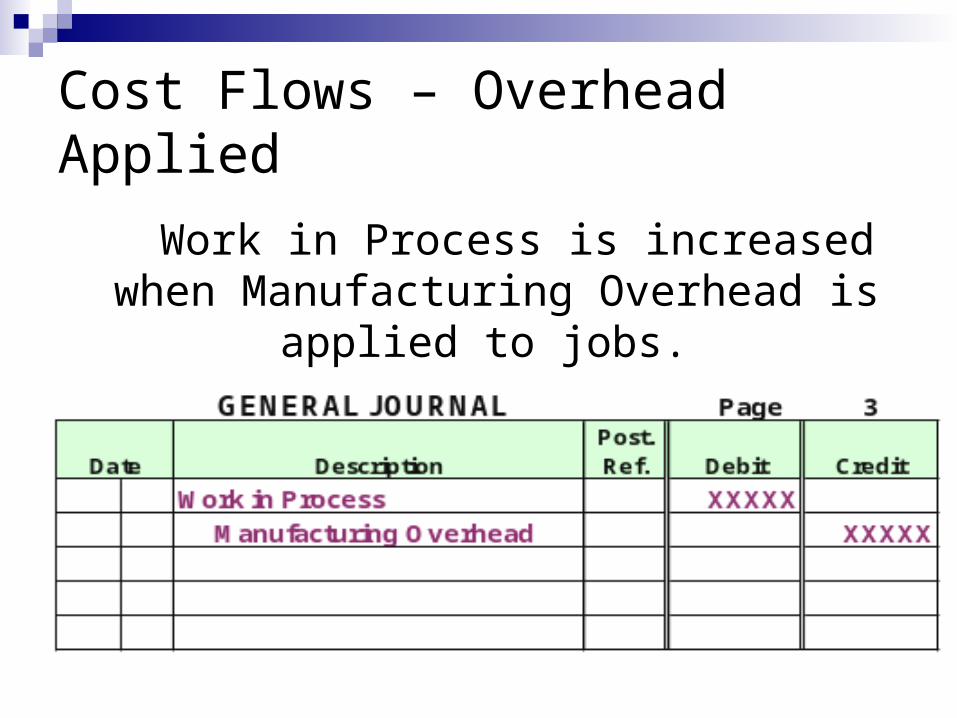
Cost Flows – Overhead Applied
Work in Process is increased when Manufacturing Overhead is applied to
jobs.
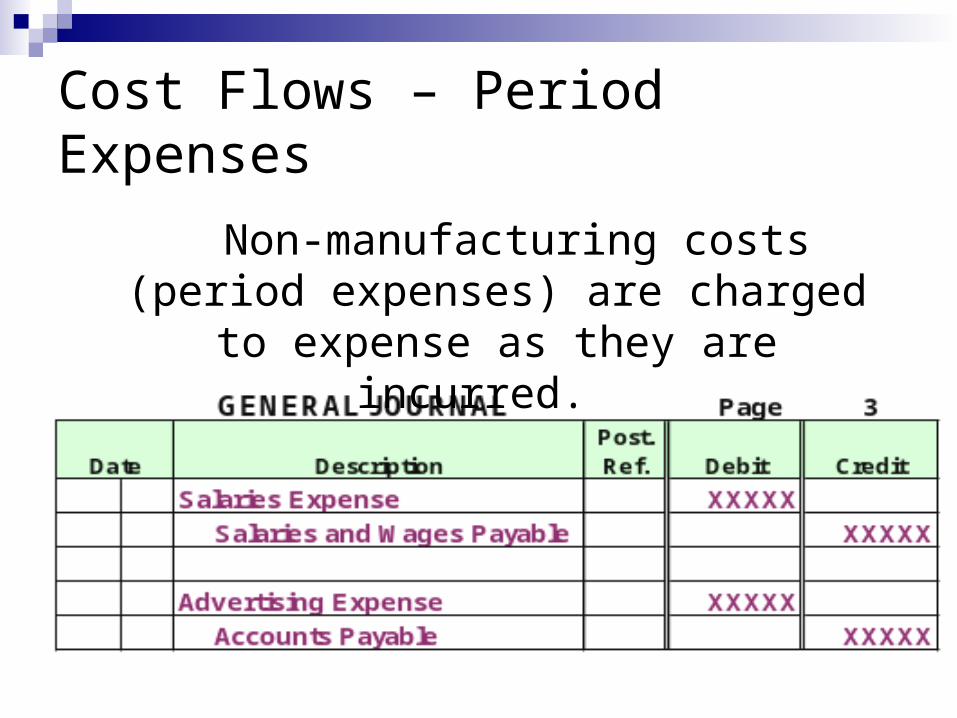
Cost Flows – Period Expenses
Non-manufacturing costs (period expenses) are charged to expense as they
are incurred.
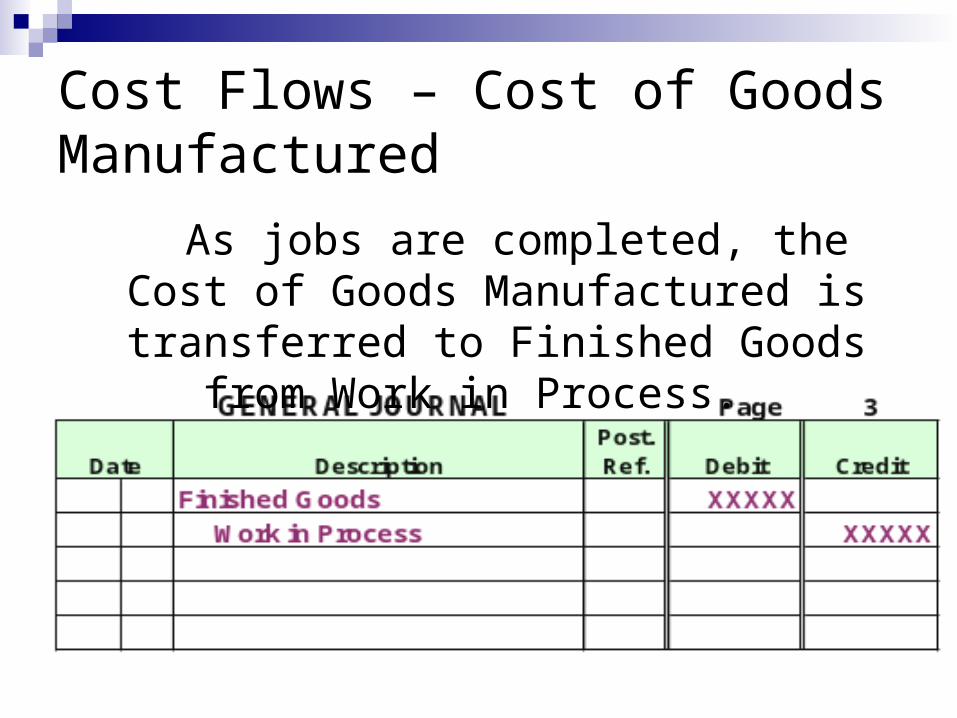
Cost Flows – Cost of Goods Manufactured
As jobs are completed, the Cost of Goods Manufactured is transferred to Finished
Goods from Work in Process.
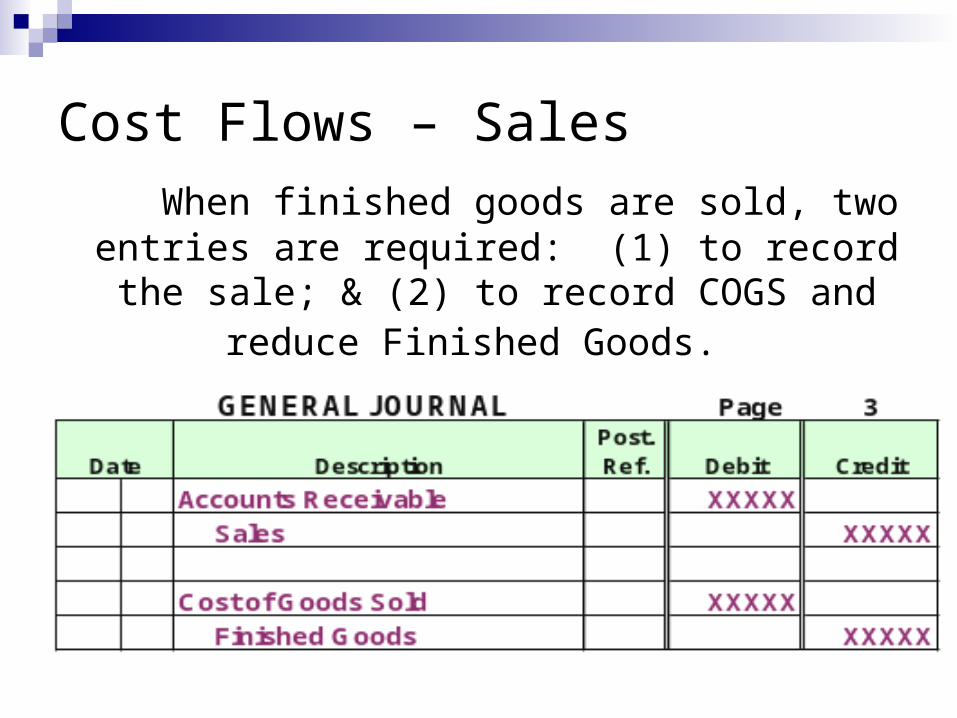
Cost Flows – Sales When finished goods are sold, two entries are
required: (1) to record the sale; & (2) to record COGS and reduce Finished Goods.
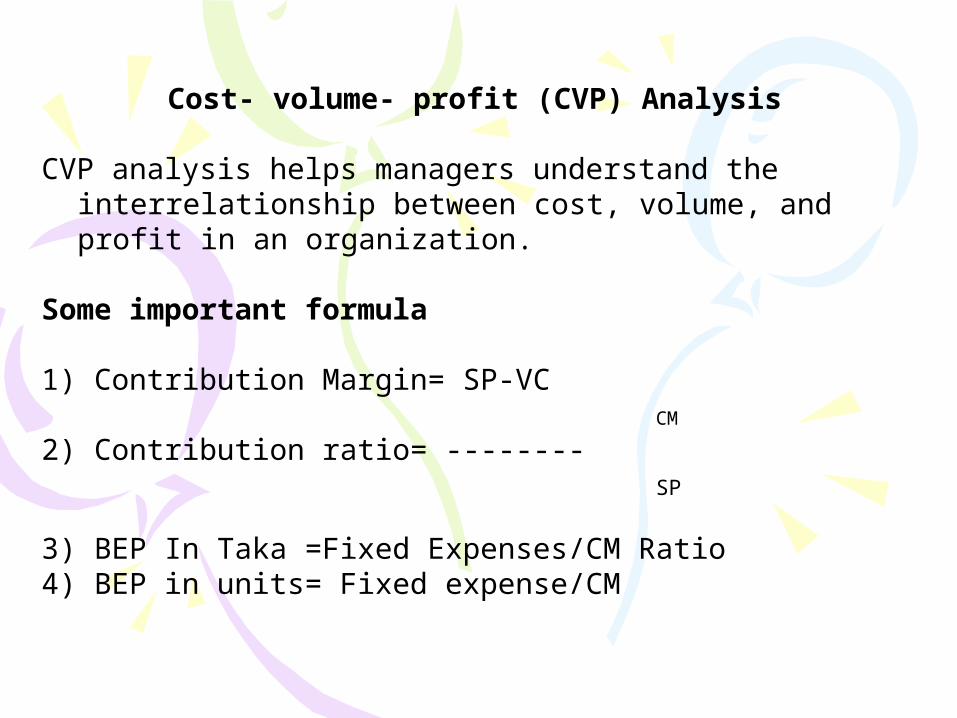
Cost- volume- profit (CVP) Analysis
CVP analysis helps managers understand the interrelationship between cost, volume, and profit in an organization.
Some important formula
1) Contribution Margin= SP-VC CM
2) Contribution ratio= -------- SP
3) BEP In Taka =Fixed Expenses/CM Ratio4) BEP in units= Fixed expense/CM
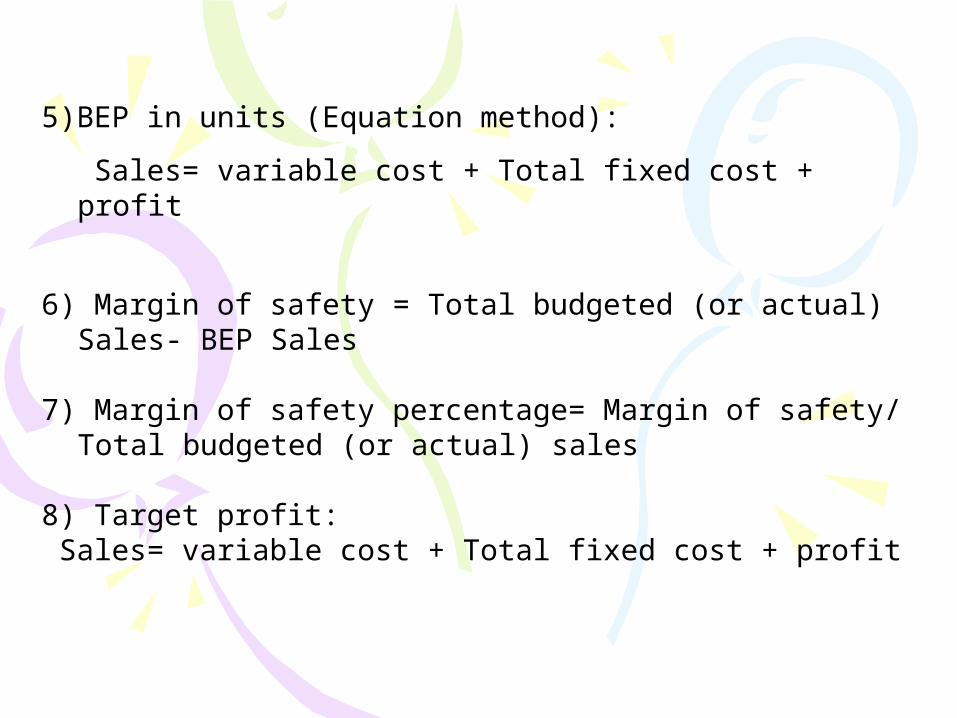
5)BEP in units (Equation method):
Sales= variable cost + Total fixed cost + profit
6) Margin of safety = Total budgeted (or actual) Sales- BEP Sales
7) Margin of safety percentage= Margin of safety/ Total budgeted (or actual) sales
8) Target profit: Sales= variable cost + Total fixed cost + profit
Contribution income statement
Contribution income statement emphasizes the behavior of costs. It helps manager understand how changes in selling price, cost, or volume affect profits.
Contribution margin is the amount remaining from sales revenue after variable expenses have been deducted. It is the amount available to cover fixed expenses and then to provide profits for the period.
If the contribution margin is not sufficient to cover the fixed expenses, then a loss occurs for the period.
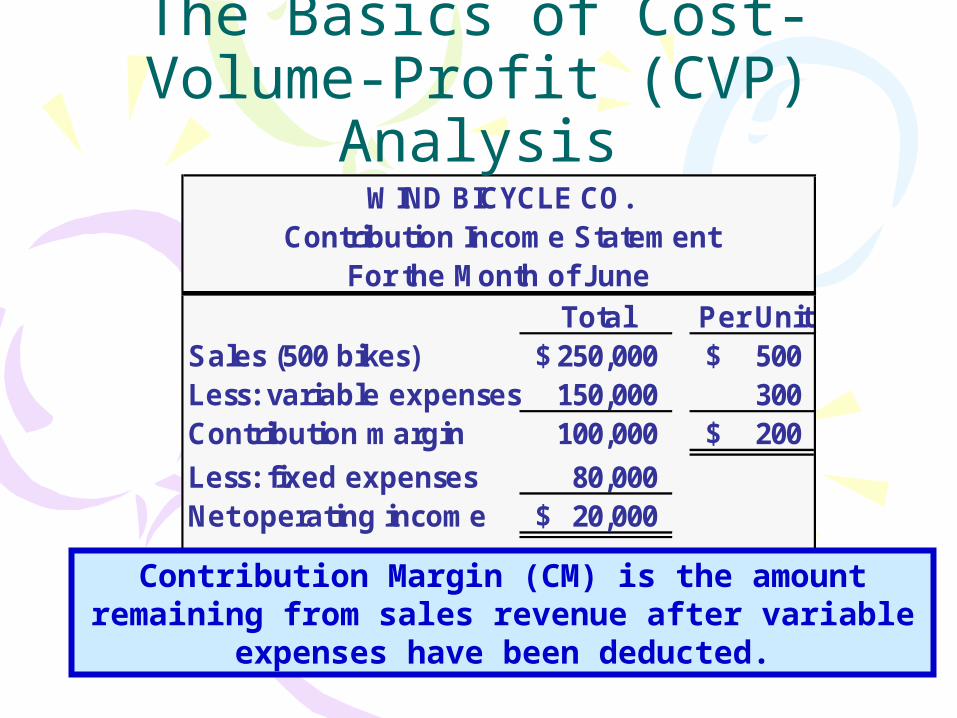
Total Per UnitSales (500 bikes) 250,000$ 500$ Less: variable expenses 150,000 300 Contribution margin 100,000 200$
Less: fixed expenses 80,000 Net operating income 20,000$
WIND BICYCLE CO.Contribution Income Statement
For the Month of June
The Basics of Cost-Volume-Profit (CVP) Analysis
Contribution Margin (CM) is the amount remaining from sales revenue after variable expenses have been
deducted.
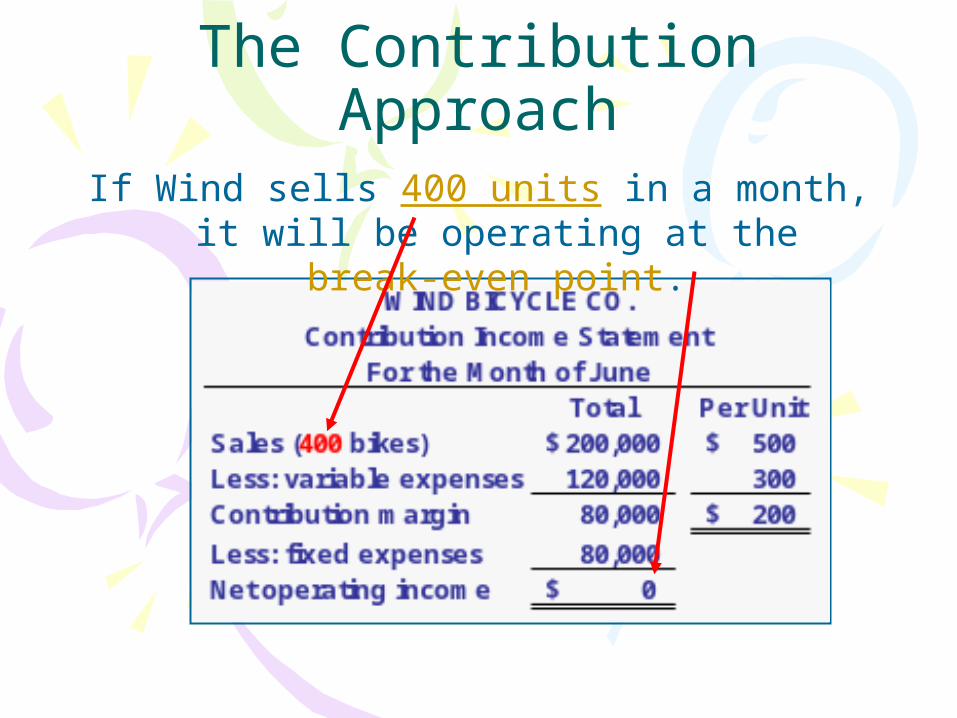
The Contribution Approach
If Wind sells 400 units in a month, it will be operating at the break-even point.
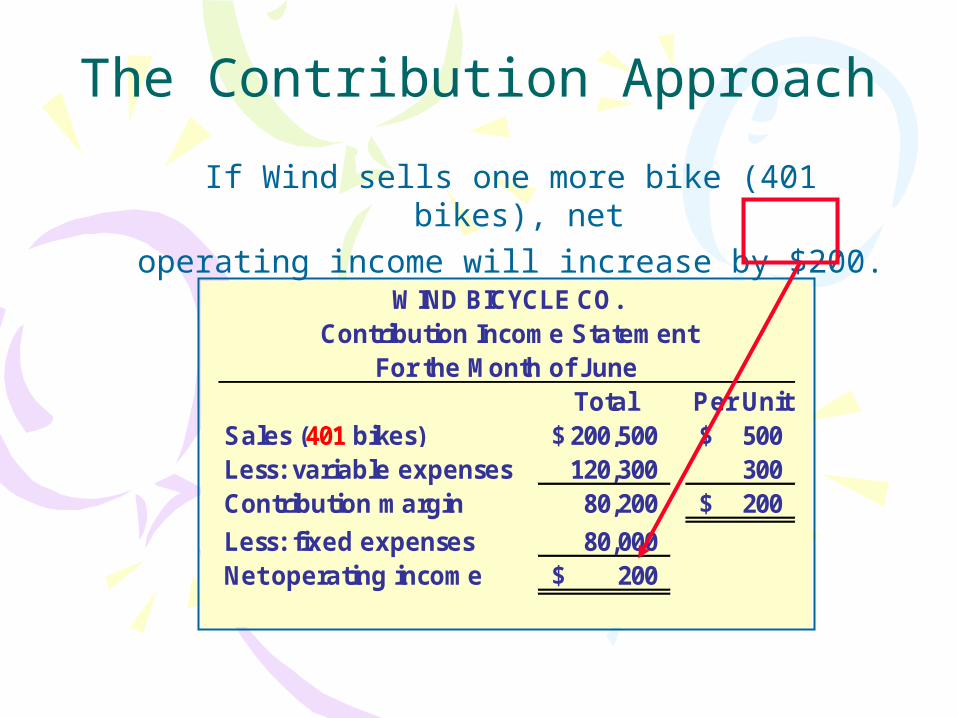
Total Per UnitSales (401 bikes) 200,500$ 500$ Less: variable expenses 120,300 300 Contribution margin 80,200 200$
Less: fixed expenses 80,000 Net operating income 200$
WIND BICYCLE CO.Contribution Income Statement
For the Month of June
The Contribution Approach
If Wind sells one more bike (401 bikes), net operating income will increase by $200.
-
50,000
100,000
150,000
200,000
250,000
300,000
350,000
400,000
450,000
- 100 200 300 400 500 600 700 800
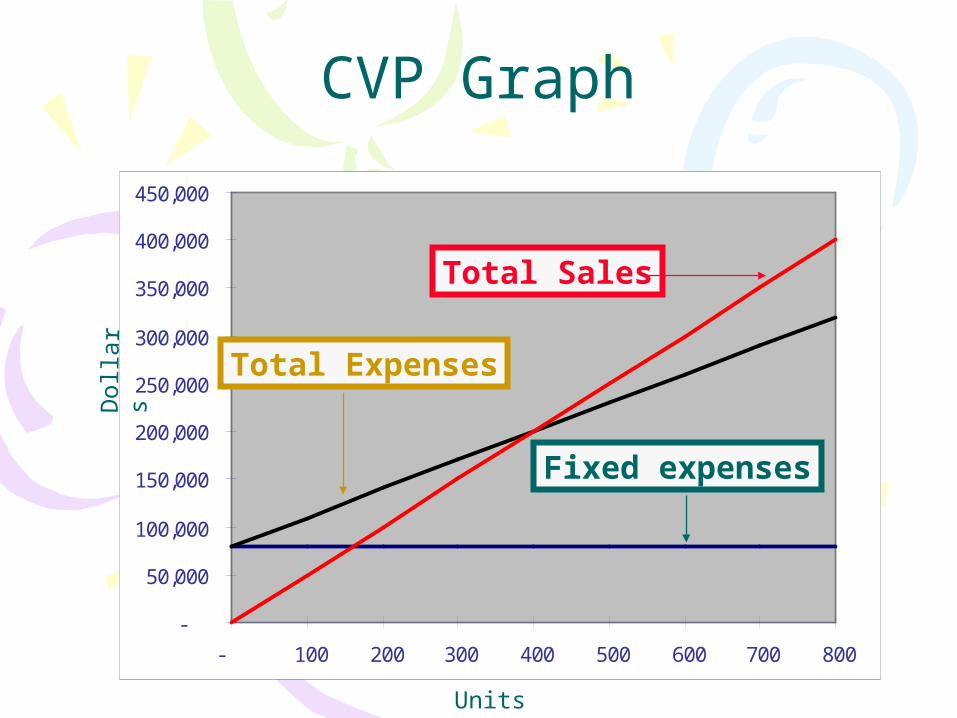
CVP Graph
Fixed expenses
Units
Dol
lars Total Expenses
Total Sales
Example: Nadia Enterprise sold 400 speakers in the month of September for Tk. 250 each. Variable expense per speaker is Tk. 150 and total fixed expense is Tk. 35,000. what is the contribution margin and net income?
Contribution Margin Ratio
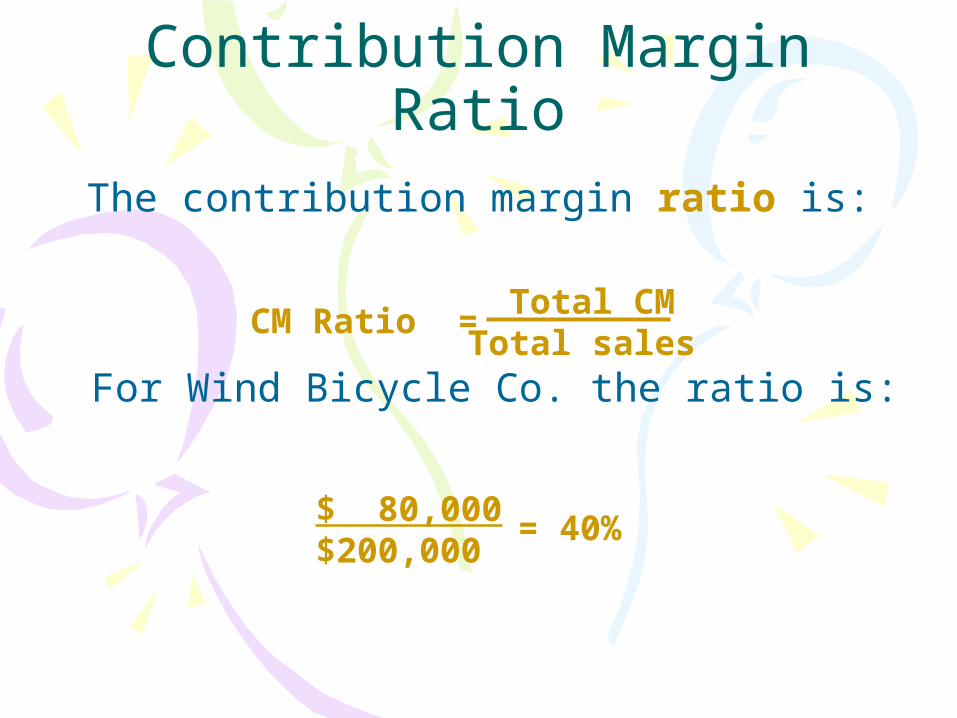
The contribution margin ratio is:
For Wind Bicycle Co. the ratio is:
$ 80,000$200,000
= 40%
Total CMTotal sales
CM Ratio =
Contribution Margin Ratio
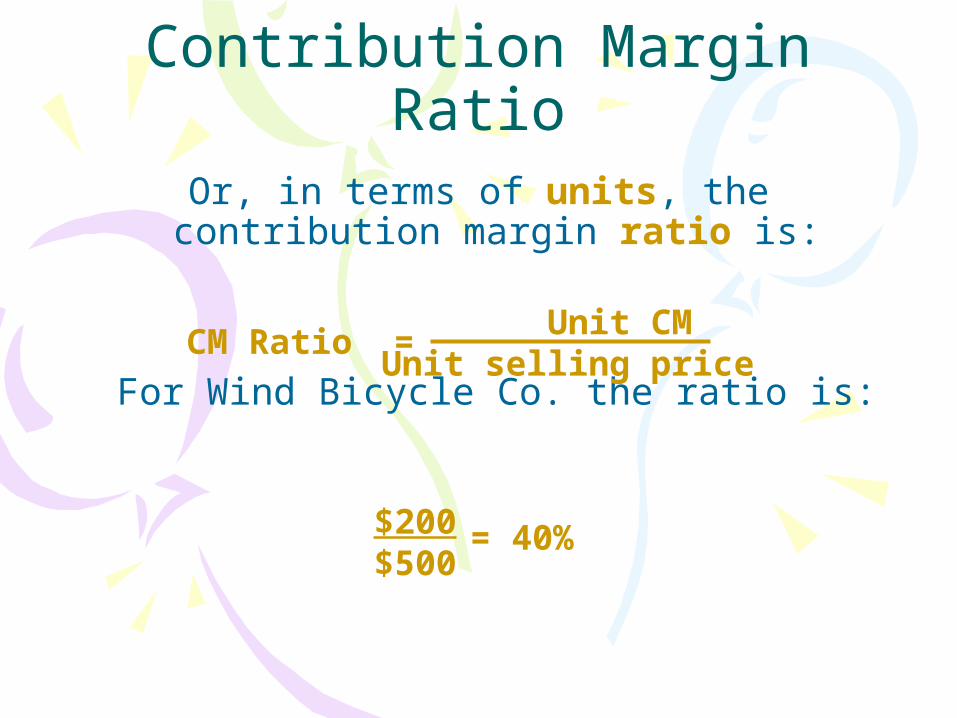
Or, in terms of units, the contribution margin ratio is:
For Wind Bicycle Co. the ratio is:
$200$500
= 40%
Unit CMUnit selling price
CM Ratio =
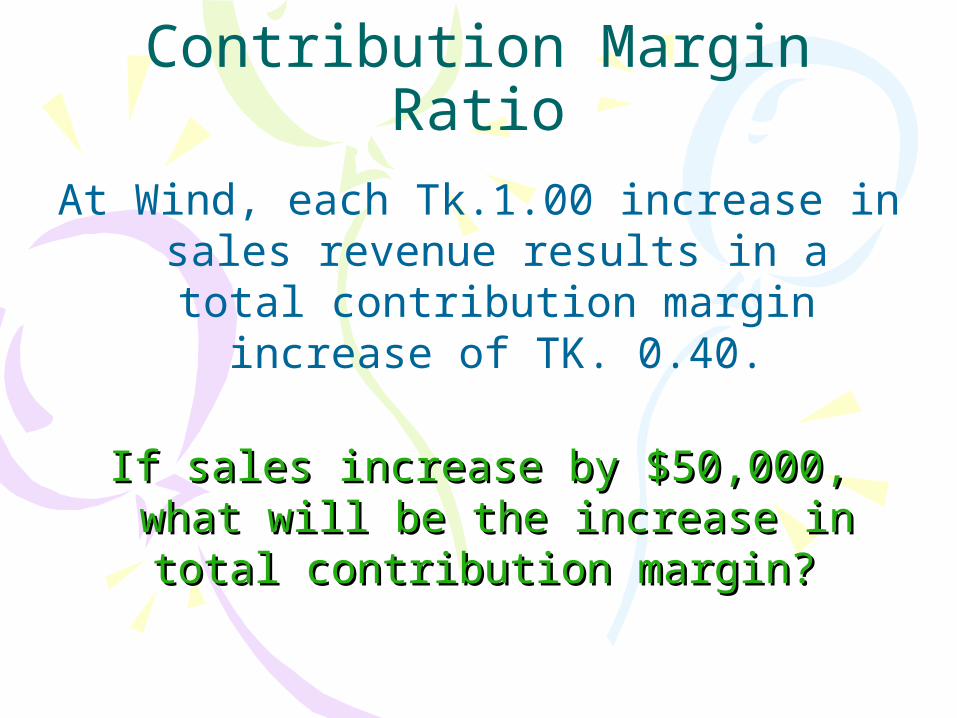
Contribution Margin Ratio
At Wind, each Tk.1.00 increase in sales revenue results in a total contribution
margin increase of TK. 0.40.
If sales increase by $50,000, what will If sales increase by $50,000, what will be the increase in total contribution be the increase in total contribution
margin?margin?
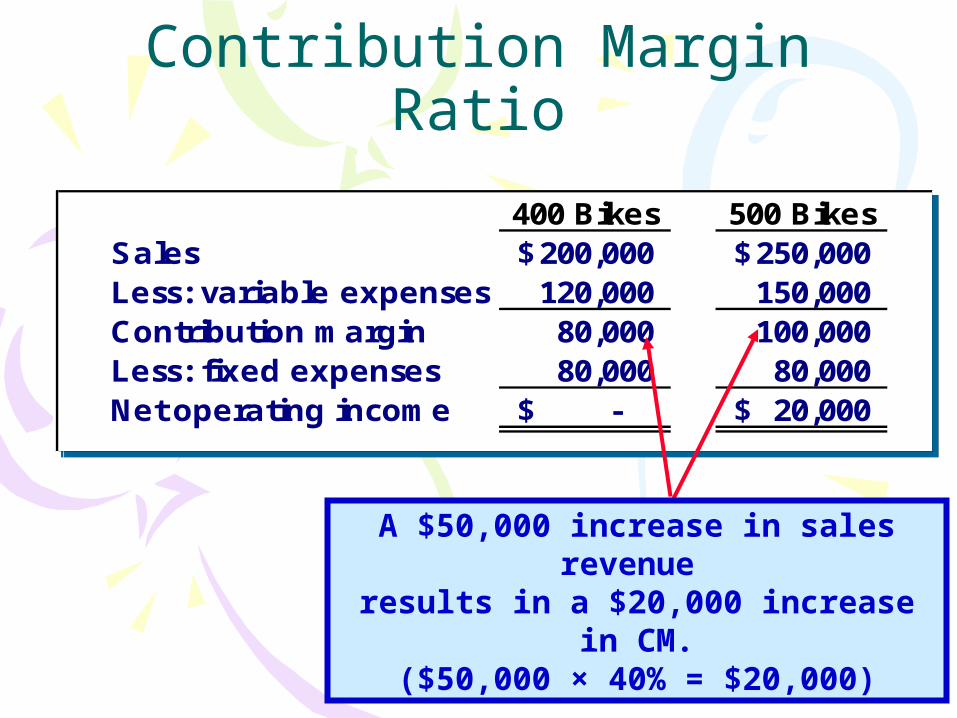
400 Bikes 500 BikesSales 200,000$ 250,000$ Less: variable expenses 120,000 150,000 Contribution margin 80,000 100,000 Less: fixed expenses 80,000 80,000 Net operating income -$ 20,000$
400 Bikes 500 BikesSales 200,000$ 250,000$ Less: variable expenses 120,000 150,000 Contribution margin 80,000 100,000 Less: fixed expenses 80,000 80,000 Net operating income -$ 20,000$
Contribution Margin Ratio
A $50,000 increase in sales revenue results in a $20,000 increase in CM.
($50,000 × 40% = $20,000)

Some Applications of CVP Concepts
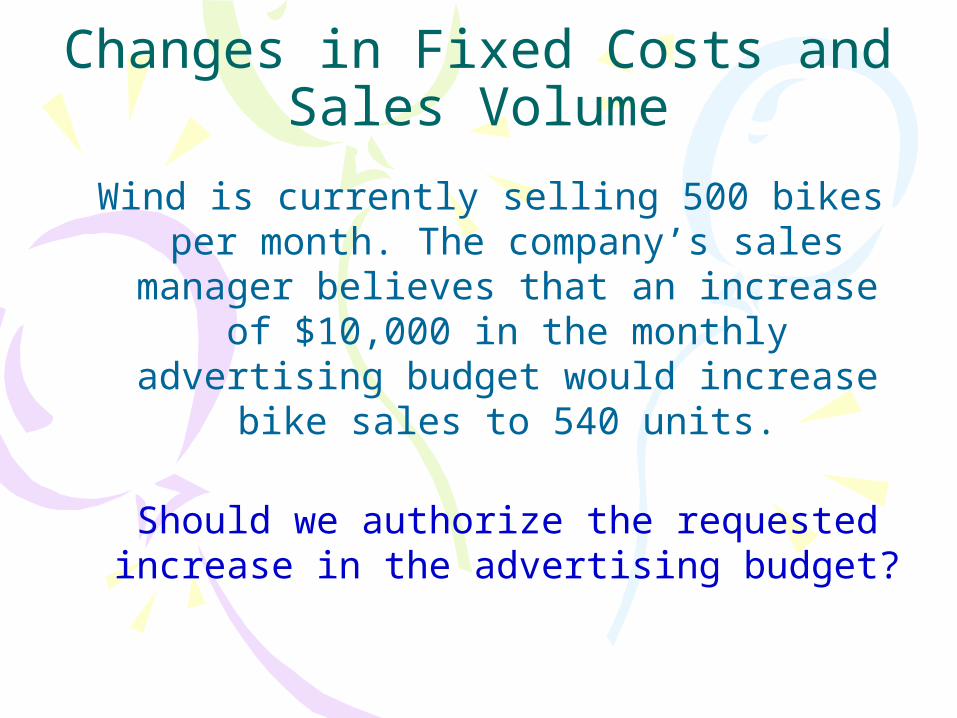
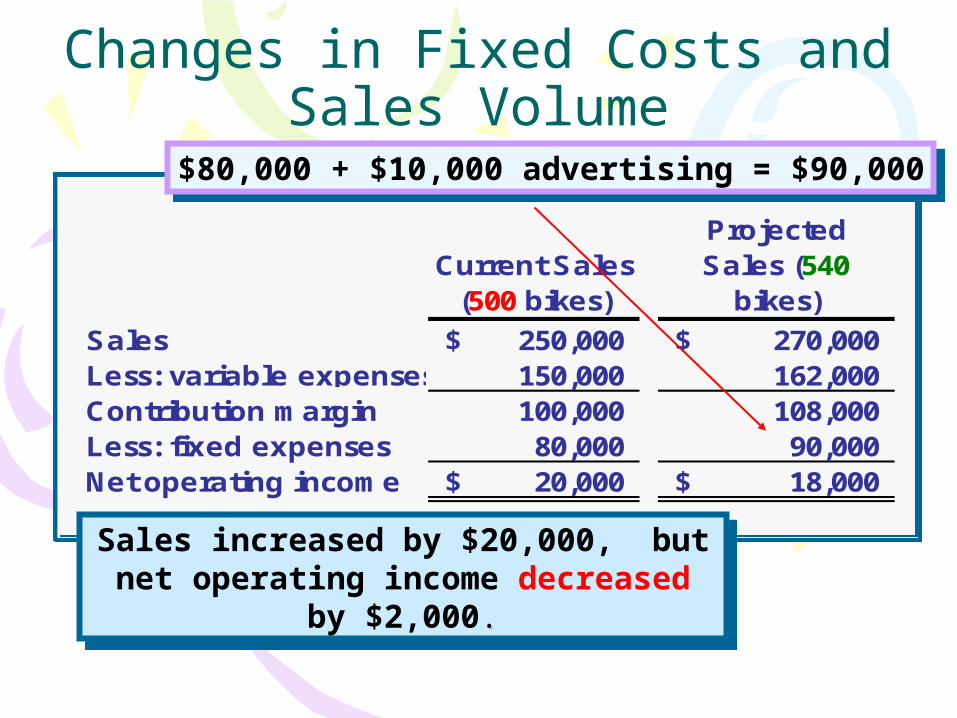
Changes in Fixed Costs and Sales Volume
Wind is currently selling 500 bikes per month. The company’s sales manager believes that an increase of $10,000 in the monthly advertising budget would
increase bike sales to 540 units.
Should we authorize the requested increase in the advertising budget?
Current Sales (500 bikes)
Projected Sales (540
bikes)
Sales 250,000$ 270,000$ Less: variable expenses 150,000 162,000 Contribution margin 100,000 108,000 Less: fixed expenses 80,000 90,000 Net operating income 20,000$ 18,000$
Current Sales (500 bikes)
Projected Sales (540
bikes)
Sales 250,000$ 270,000$ Less: variable expenses 150,000 162,000 Contribution margin 100,000 108,000 Less: fixed expenses 80,000 90,000 Net operating income 20,000$ 18,000$
Changes in Fixed Costs and Sales Volume
Sales increased by $20,000, but net operating income decreased by $2,000..
Sales increased by $20,000, but net operating income decreased by $2,000..
$80,000 + $10,000 advertising = $90,000$80,000 + $10,000 advertising = $90,000
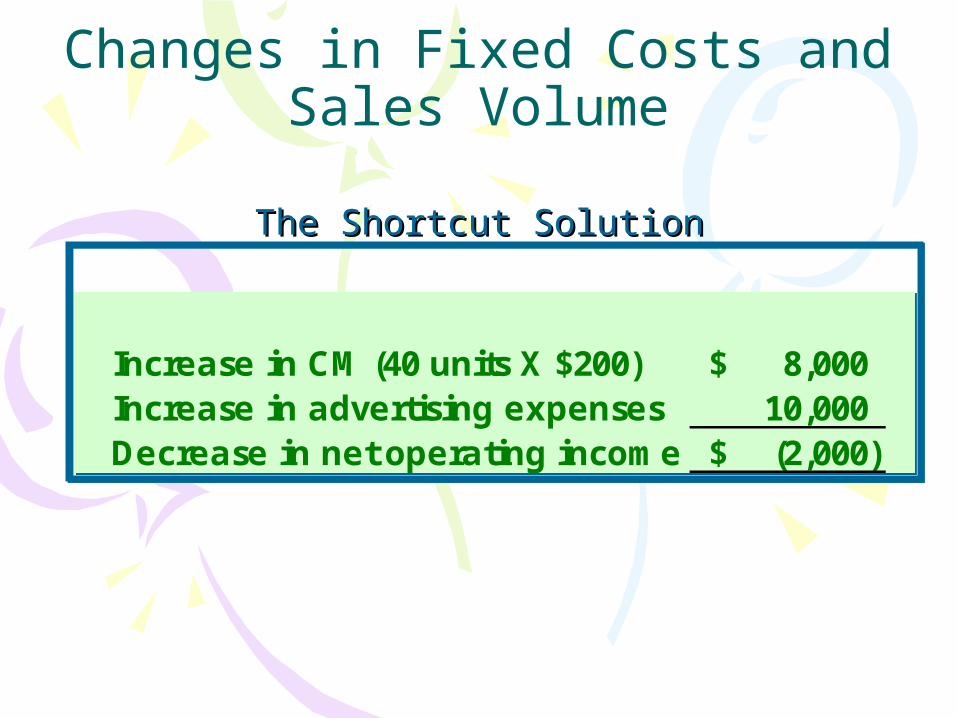
Changes in Fixed Costs and Sales Volume
The Shortcut SolutionThe Shortcut Solution
Increase in CM (40 units X $200) 8,000$ Increase in advertising expenses 10,000 Decrease in net operating income (2,000)$
Increase in CM (40 units X $200) 8,000$ Increase in advertising expenses 10,000 Decrease in net operating income (2,000)$
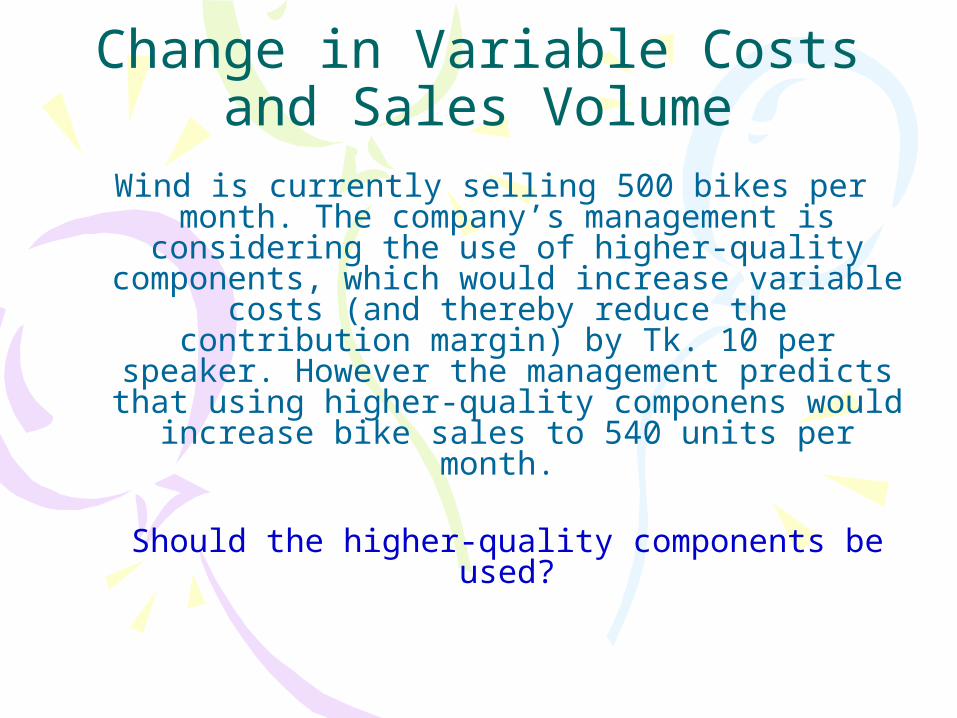
Change in Variable Costs and Sales Volume
Wind is currently selling 500 bikes per month. The company’s management is considering the use of higher-quality components, which would increase variable costs (and thereby
reduce the contribution margin) by Tk. 10 per speaker. However the management predicts that using higher-quality componens would increase bike sales to 540 units per month.
Should the higher-quality components be used?
Break-Even Analysis
Break-even analysis can be approached in three ways:
1. Graphical analysis.2. Equation method.3. Contribution margin method.
Target Profit Analysis
Suppose Wind Co. wants to know how many bikes must be sold to earn a
profit of $100,000.
We can use our CVP formula to determine the sales volume needed to achieve a target net profit figure.
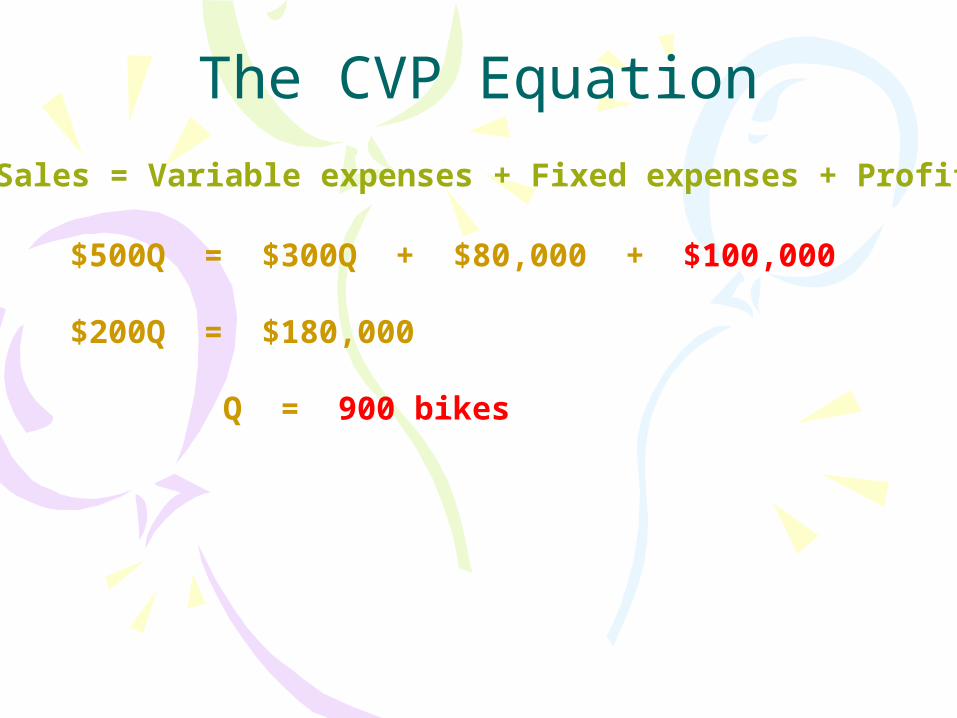
The CVP Equation
Sales = Variable expenses + Fixed expenses + Profits
$500Q = $300Q + $80,000 + $100,000
$200Q = $180,000
Q = 900 bikes
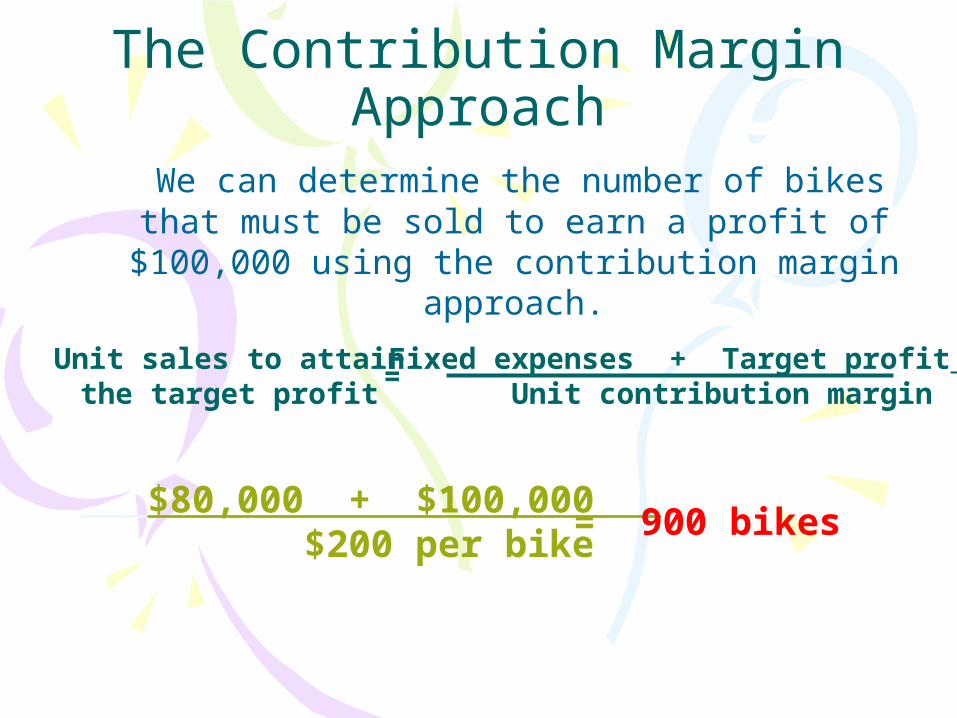
The Contribution Margin Approach
We can determine the number of bikes that must be sold to earn a profit of $100,000 using the contribution margin approach.
Fixed expenses + Target profit Unit contribution margin
=Unit sales to attain
the target profit
$80,000 + $100,000 $200 per bike
= 900 bikes
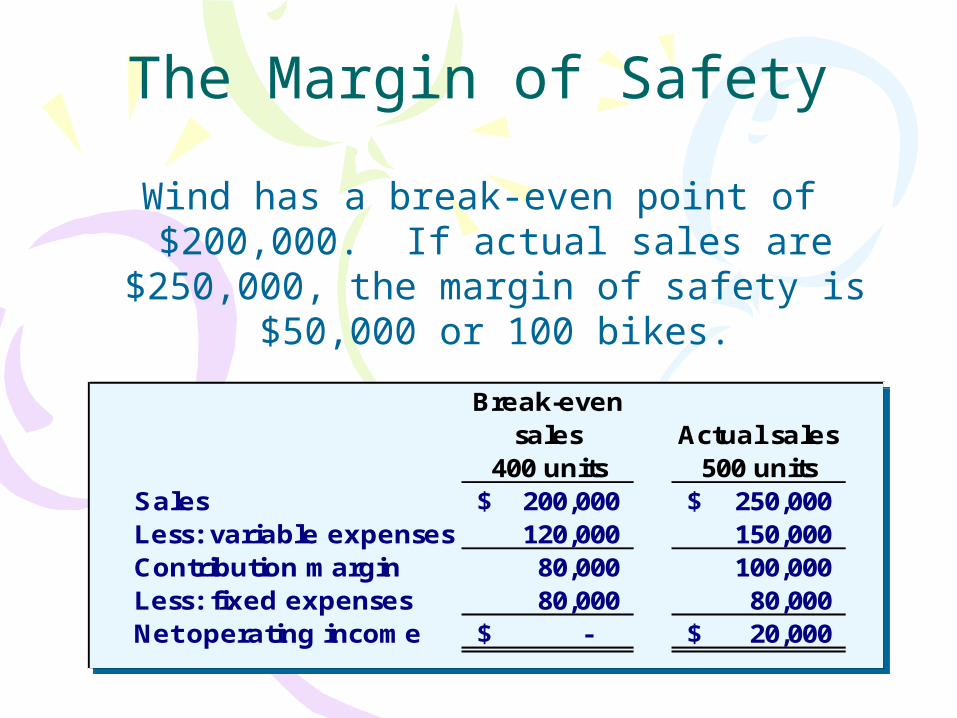
The Margin of Safety
Excess of budgeted (or actual) sales over the break-even volume of sales. The amount by which sales can drop before losses begin to be incurred.
Margin of safety = Total sales - Break-even sales
Let’s calculate the margin of safety for Wind.
The Margin of Safety
Wind has a break-even point of $200,000. If actual sales are $250,000, the margin
of safety is $50,000 or 100 bikes.
Break-even sales
400 unitsActual sales
500 unitsSales 200,000$ 250,000$ Less: variable expenses 120,000 150,000 Contribution margin 80,000 100,000 Less: fixed expenses 80,000 80,000 Net operating income -$ 20,000$
Break-even sales
400 unitsActual sales
500 unitsSales 200,000$ 250,000$ Less: variable expenses 120,000 150,000 Contribution margin 80,000 100,000 Less: fixed expenses 80,000 80,000 Net operating income -$ 20,000$
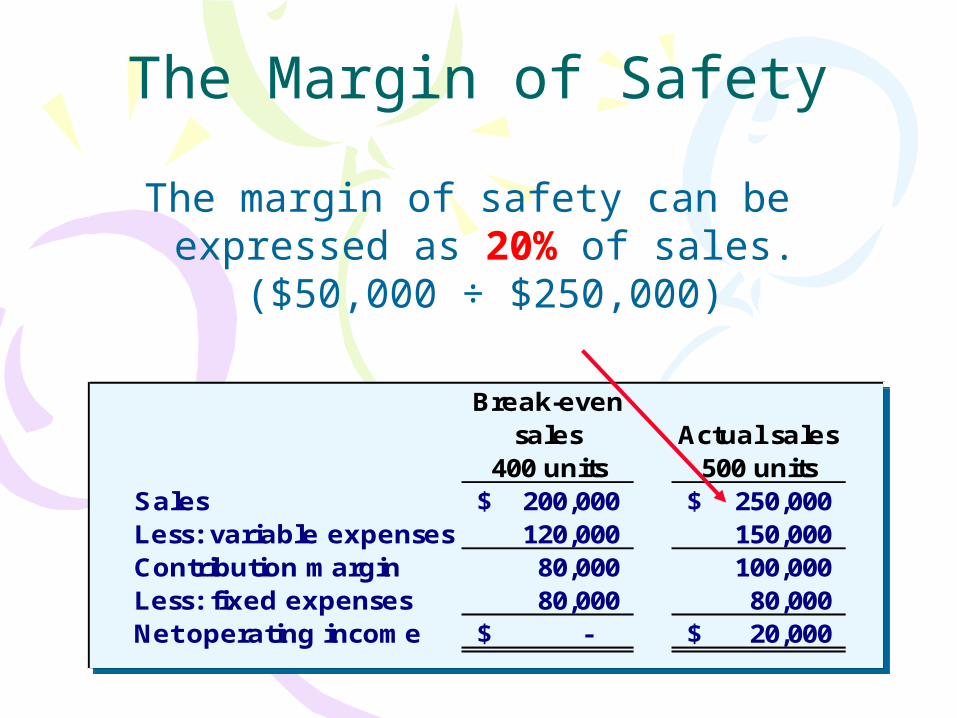
The Margin of Safety
The margin of safety can be expressed as 20% of sales.
($50,000 ÷ $250,000)
Break-even sales
400 unitsActual sales
500 unitsSales 200,000$ 250,000$ Less: variable expenses 120,000 150,000 Contribution margin 80,000 100,000 Less: fixed expenses 80,000 80,000 Net operating income -$ 20,000$
Break-even sales
400 unitsActual sales
500 unitsSales 200,000$ 250,000$ Less: variable expenses 120,000 150,000 Contribution margin 80,000 100,000 Less: fixed expenses 80,000 80,000 Net operating income -$ 20,000$
Profit Planning
Chapter 9
What is a budget?
It is a detailed plan for It is a detailed plan for acquiring and using financial acquiring and using financial and other resources over a and other resources over a specified period of time.specified period of time.
What are the purposes of budget?
PlanningPlanning ControllingControlling
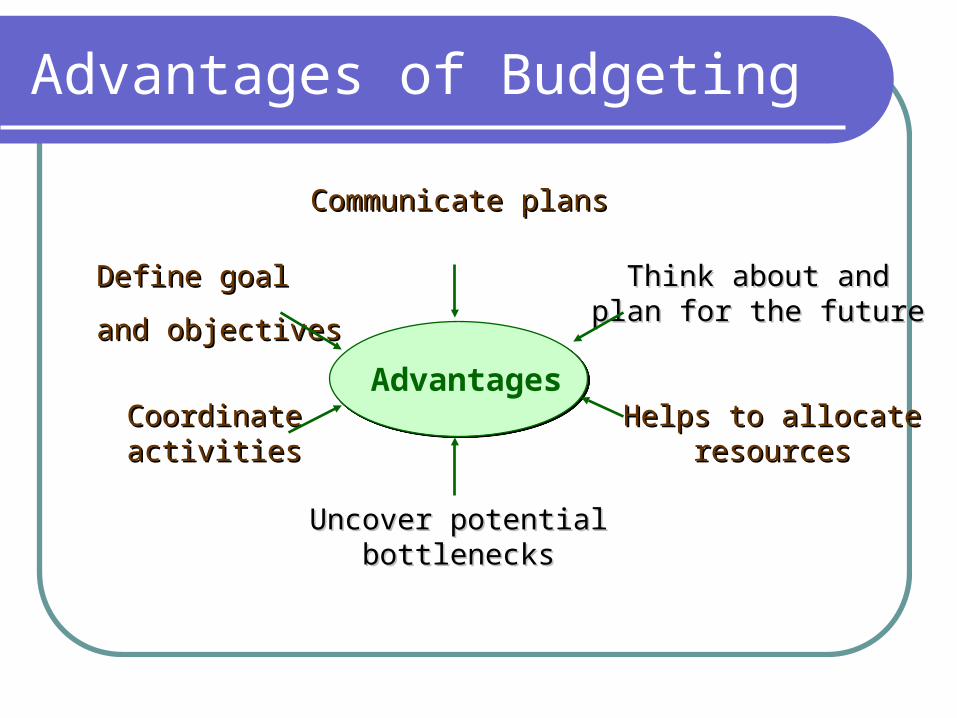
Advantages of Budgeting
Advantages
Communicate plansCommunicate plans
Uncover potentialUncover potentialbottlenecksbottlenecks
CoordinateCoordinateactivitiesactivities
Define goalDefine goal
and objectivesand objectives
Think about andThink about andplan for the futureplan for the future
Helps to allocateHelps to allocateresourcesresources
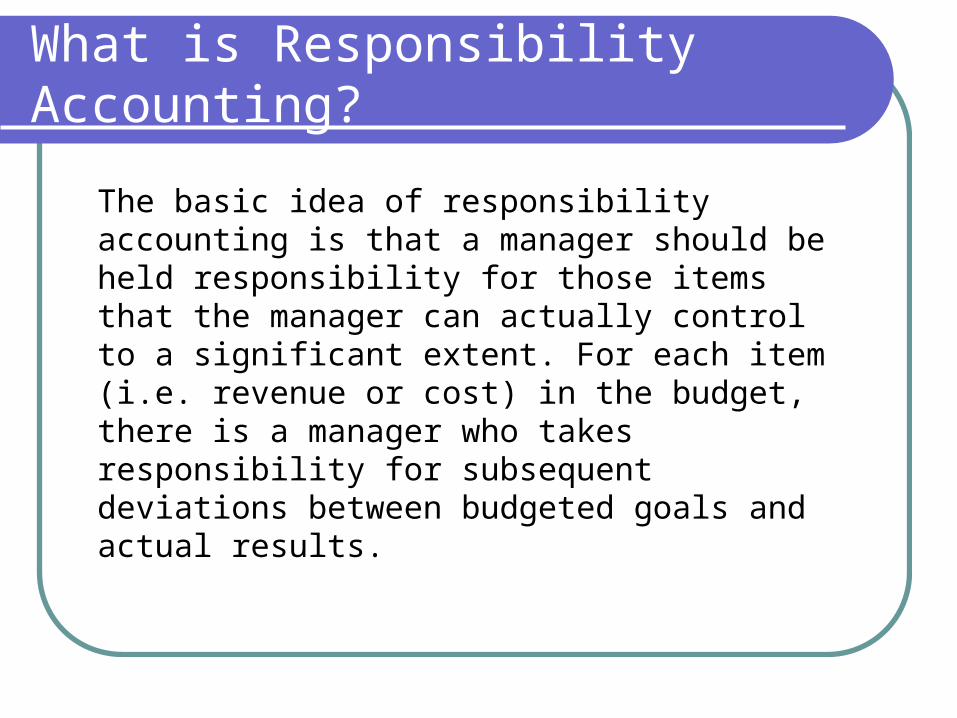
What is Responsibility Accounting?
The basic idea of responsibility accounting is that a manager should be held responsibility for those items that the manager can actually control to a significant extent. For each item (i.e. revenue or cost) in the budget, there is a manager who takes responsibility for subsequent deviations between budgeted goals and actual results.
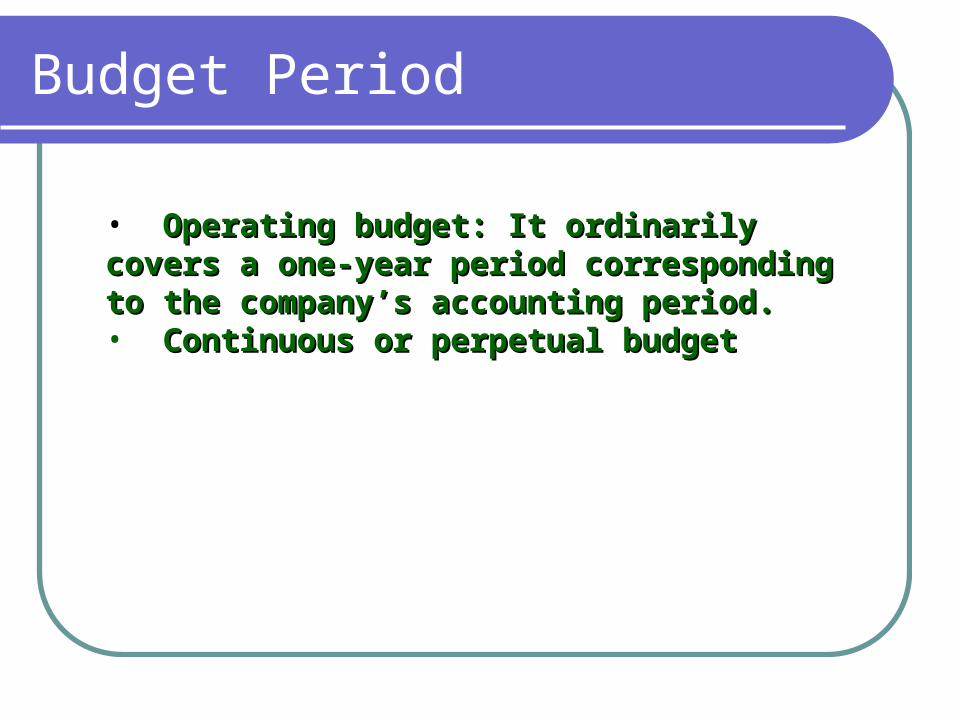
Budget Period
• Operating budget: It ordinarily covers a one-year Operating budget: It ordinarily covers a one-year period corresponding to the company’s accounting period corresponding to the company’s accounting period.period.• Continuous or perpetual budgetContinuous or perpetual budget
Self-Imposed/ Participative Budget
It is a budget that is prepared with the full It is a budget that is prepared with the full cooperation and participation of managers at all cooperation and participation of managers at all levels.levels.Many managers believe that being empowered to Many managers believe that being empowered to create their own self-imposed budgets is the most create their own self-imposed budgets is the most effective method of budget preparation.effective method of budget preparation.
What is a master budget?
It is a summary of a company’s plans that It is a summary of a company’s plans that sets specific targets for sales, production, sets specific targets for sales, production,
distribution,and financial activities.distribution,and financial activities.

The Master Budget
ProductionBudget
ProductionBudget
Selling andAdministrative
Budget
Selling andAdministrative
Budget
DirectMaterialsBudget
DirectMaterialsBudget
ManufacturingOverhead
Budget
ManufacturingOverhead
Budget
DirectLabor
Budget
DirectLabor
Budget
CashBudgetCash
Budget
SalesBudgetSales
Budget
Budgeted Financial StatementsBudgeted Financial StatementsBudgeted Financial StatementsBudgeted Financial Statements
The Sales Budget
The first step in the budgeting The first step in the budgeting process is the preparation of the process is the preparation of the sales budget.sales budget.
It is a detailed schedule showing It is a detailed schedule showing expected sales for the coming expected sales for the coming periods expressed in units and taka.periods expressed in units and taka.
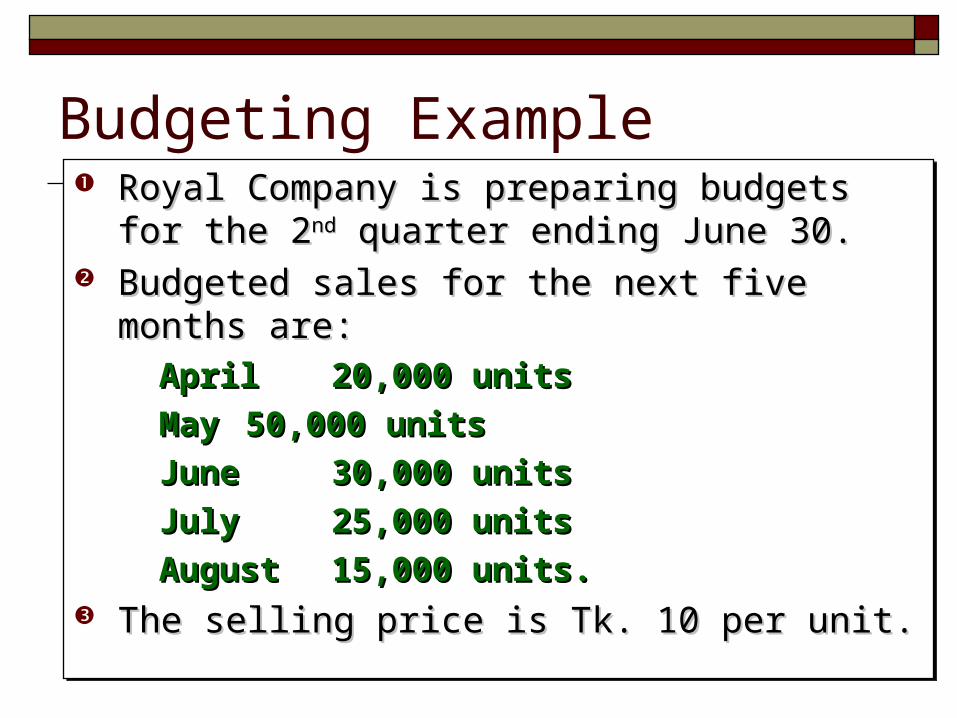
Budgeting Example Royal Company is preparing budgets for the 2Royal Company is preparing budgets for the 2ndnd
quarter ending June 30.quarter ending June 30. Budgeted sales for the next five months are:Budgeted sales for the next five months are:
April April 20,000 units20,000 units May May 50,000 units50,000 units June June 30,000 units30,000 units July July 25,000 units25,000 units August August 15,000 units.15,000 units.
The selling price is Tk. 10 per unit.The selling price is Tk. 10 per unit.
Royal Company is preparing budgets for the 2Royal Company is preparing budgets for the 2ndnd quarter ending June 30.quarter ending June 30.
Budgeted sales for the next five months are:Budgeted sales for the next five months are: April April 20,000 units20,000 units May May 50,000 units50,000 units June June 30,000 units30,000 units July July 25,000 units25,000 units August August 15,000 units.15,000 units.
The selling price is Tk. 10 per unit.The selling price is Tk. 10 per unit.
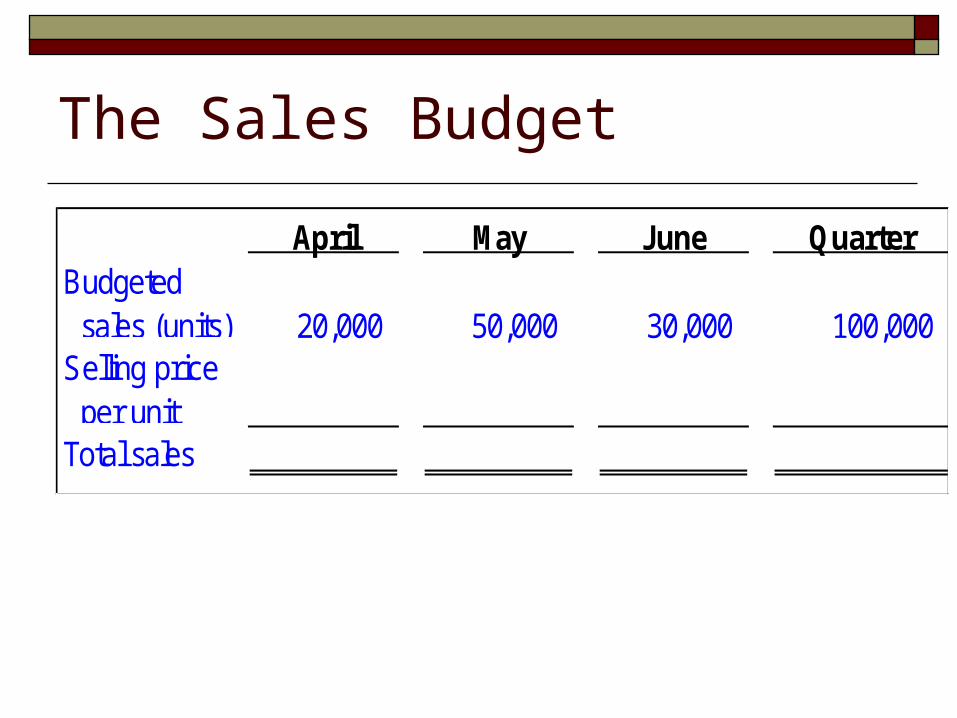
The Sales Budget
April May June QuarterBudgeted sales (units) 20,000 50,000 30,000 100,000 Selling price per unitTotal sales
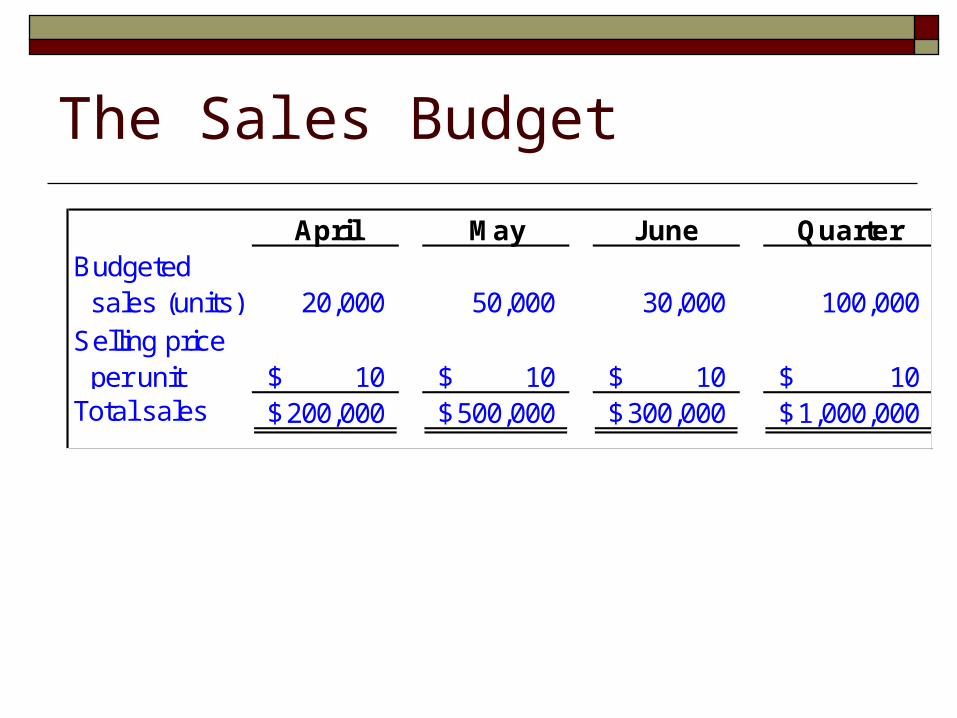
The Sales Budget
April May June QuarterBudgeted sales (units) 20,000 50,000 30,000 100,000 Selling price per unit 10$ 10$ 10$ 10$ Total sales 200,000$ 500,000$ 300,000$ 1,000,000$
Expected Cash Collections
A schedule of expected cash collections, is A schedule of expected cash collections, is prepared after the sales budget. This prepared after the sales budget. This schedule will be needed later to prepare schedule will be needed later to prepare the cash budget.the cash budget.
A schedule of expected cash collections, is A schedule of expected cash collections, is prepared after the sales budget. This prepared after the sales budget. This schedule will be needed later to prepare schedule will be needed later to prepare the cash budget.the cash budget.
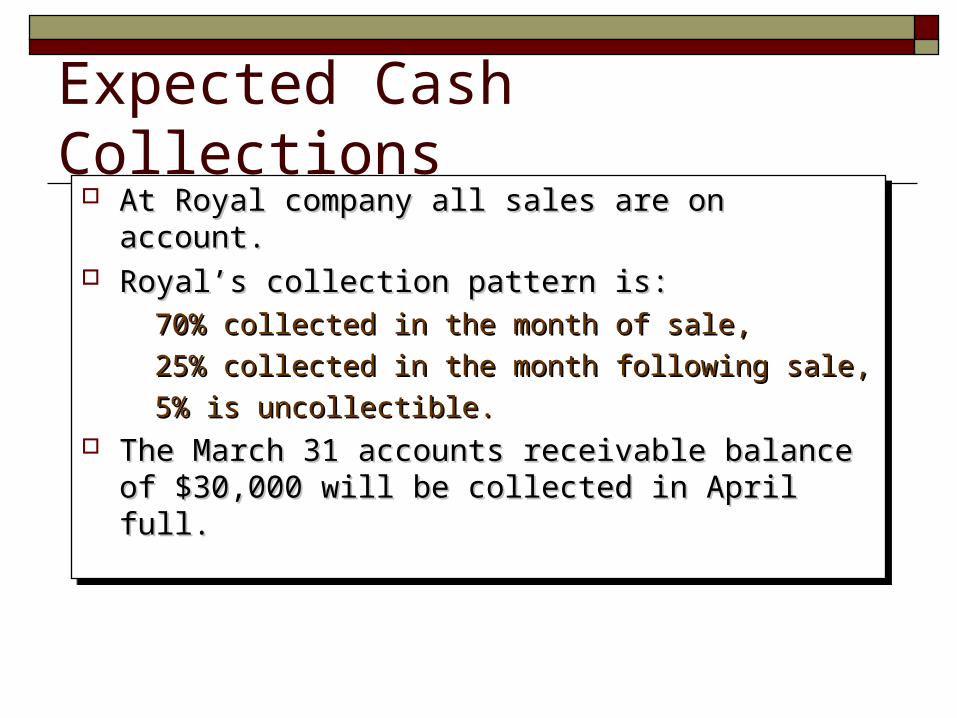
Expected Cash Collections At Royal company all sales are on account.At Royal company all sales are on account. Royal’s collection pattern is:Royal’s collection pattern is:
70% collected in the month of sale,70% collected in the month of sale, 25% collected in the month following sale,25% collected in the month following sale, 5% is uncollectible.5% is uncollectible.
The March 31 accounts receivable balance of The March 31 accounts receivable balance of $30,000 will be collected in April full.$30,000 will be collected in April full.
At Royal company all sales are on account.At Royal company all sales are on account. Royal’s collection pattern is:Royal’s collection pattern is:
70% collected in the month of sale,70% collected in the month of sale, 25% collected in the month following sale,25% collected in the month following sale, 5% is uncollectible.5% is uncollectible.
The March 31 accounts receivable balance of The March 31 accounts receivable balance of $30,000 will be collected in April full.$30,000 will be collected in April full.
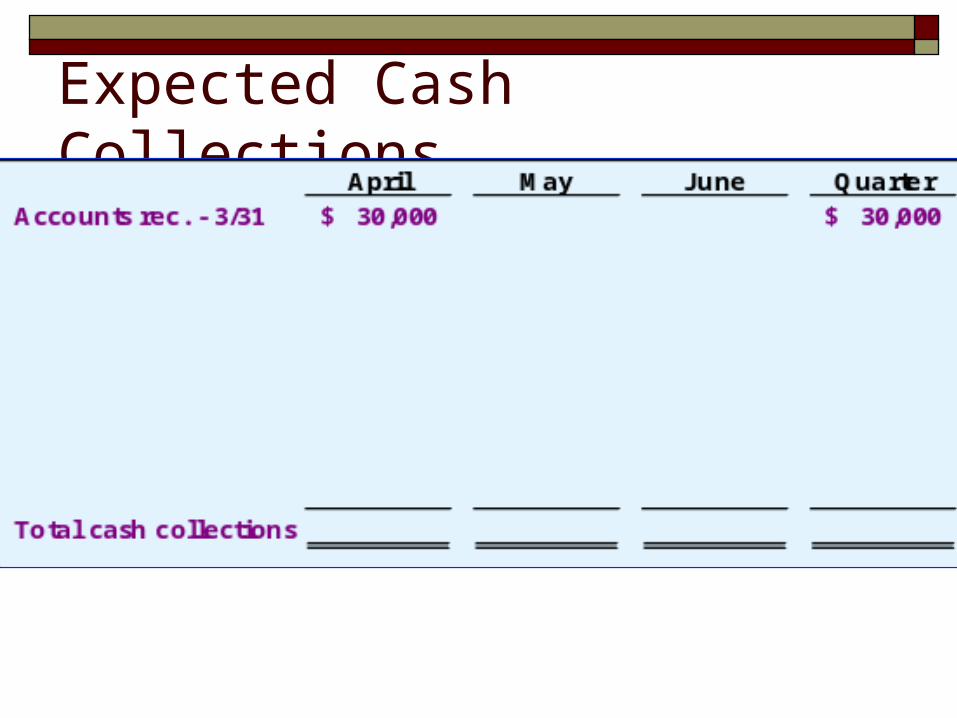
Expected Cash Collections
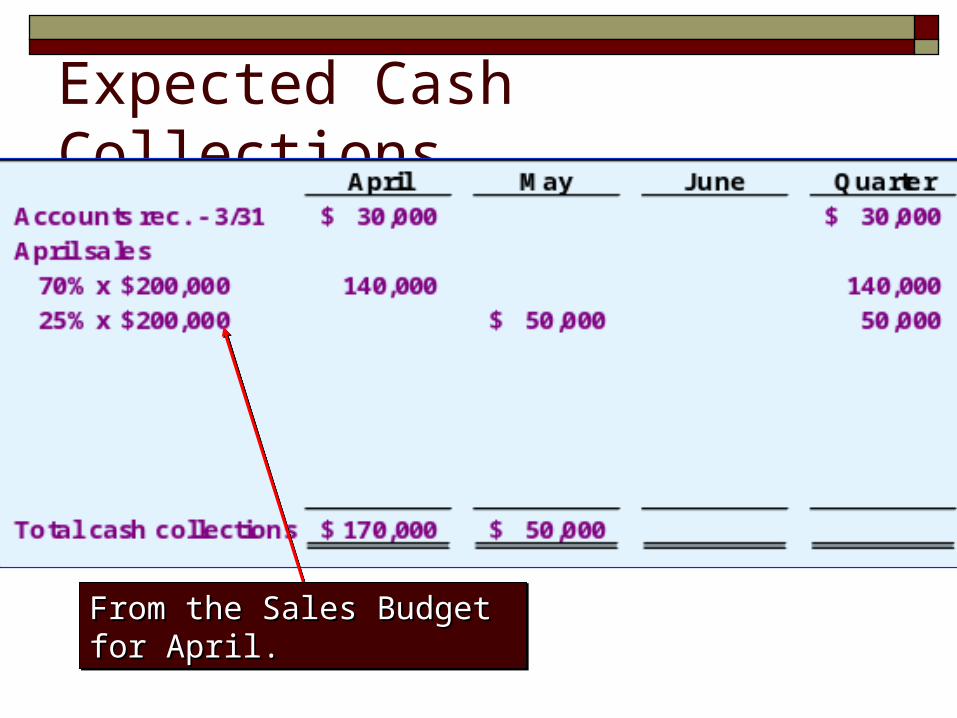
Expected Cash Collections
From the Sales Budget for April.From the Sales Budget for April.From the Sales Budget for April.From the Sales Budget for April.
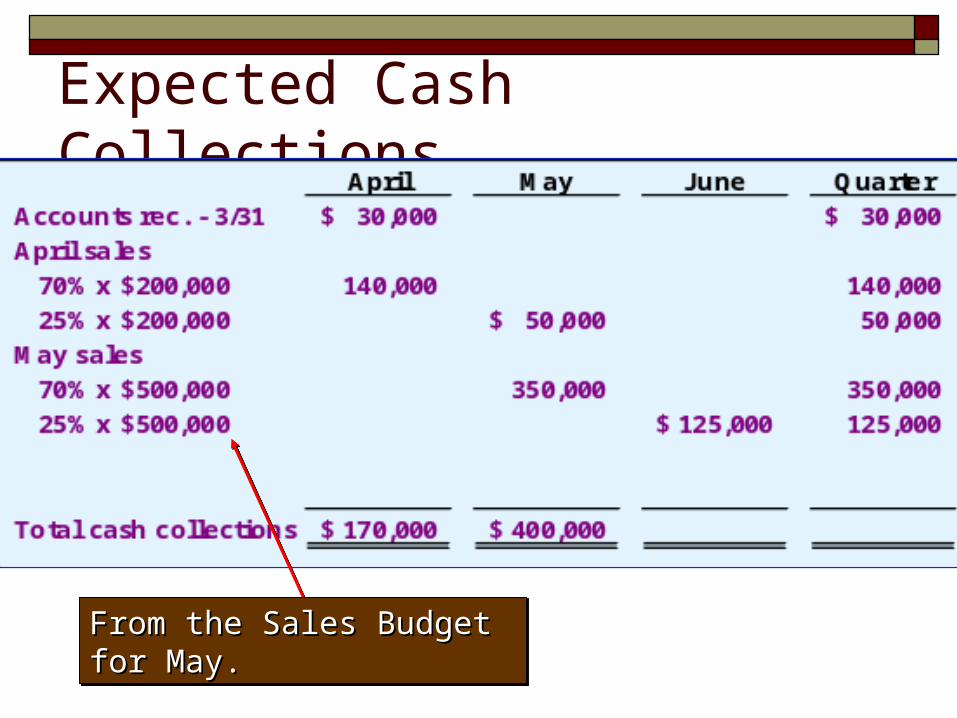
Expected Cash Collections
From the Sales Budget for May.From the Sales Budget for May.From the Sales Budget for May.From the Sales Budget for May.
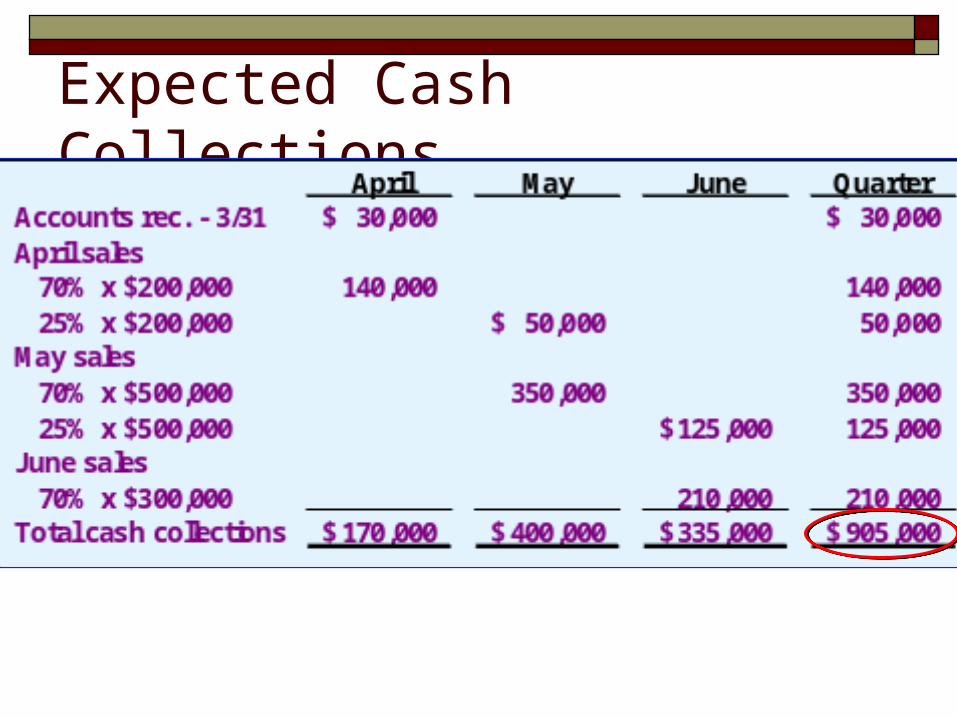
Expected Cash Collections
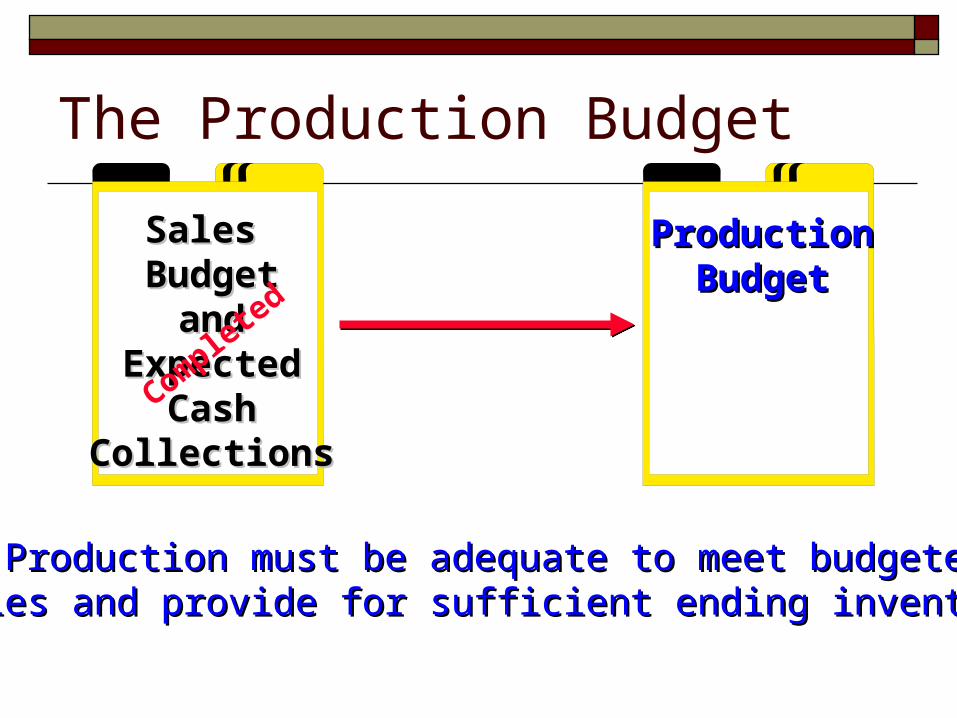
The Production Budget
ProductionProductionBudgetBudget
Sales Sales BudgetBudget
andandExpectedExpected
CashCashCollectionsCollections
Complete
d
Production must be adequate to meet budgetedProduction must be adequate to meet budgetedsales and provide for sufficient ending inventory.sales and provide for sufficient ending inventory.
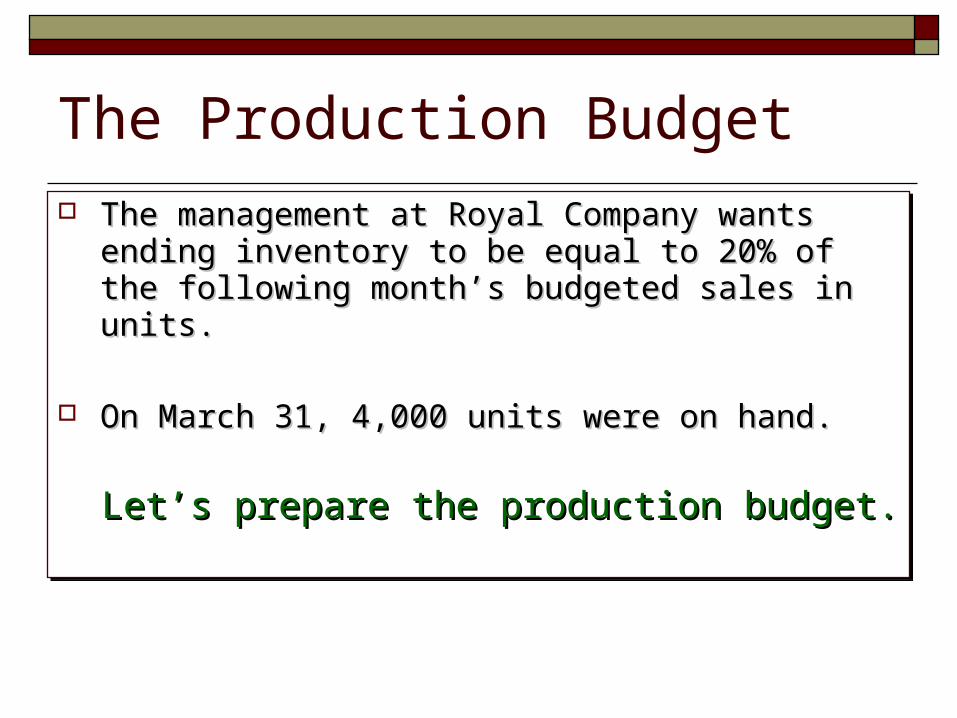
The Production Budget
The management at Royal Company wants ending The management at Royal Company wants ending inventory to be equal to 20% of the following inventory to be equal to 20% of the following month’s budgeted sales in units.month’s budgeted sales in units.
On March 31, 4,000 units were on hand.On March 31, 4,000 units were on hand.
Let’s prepare the production budget.Let’s prepare the production budget.
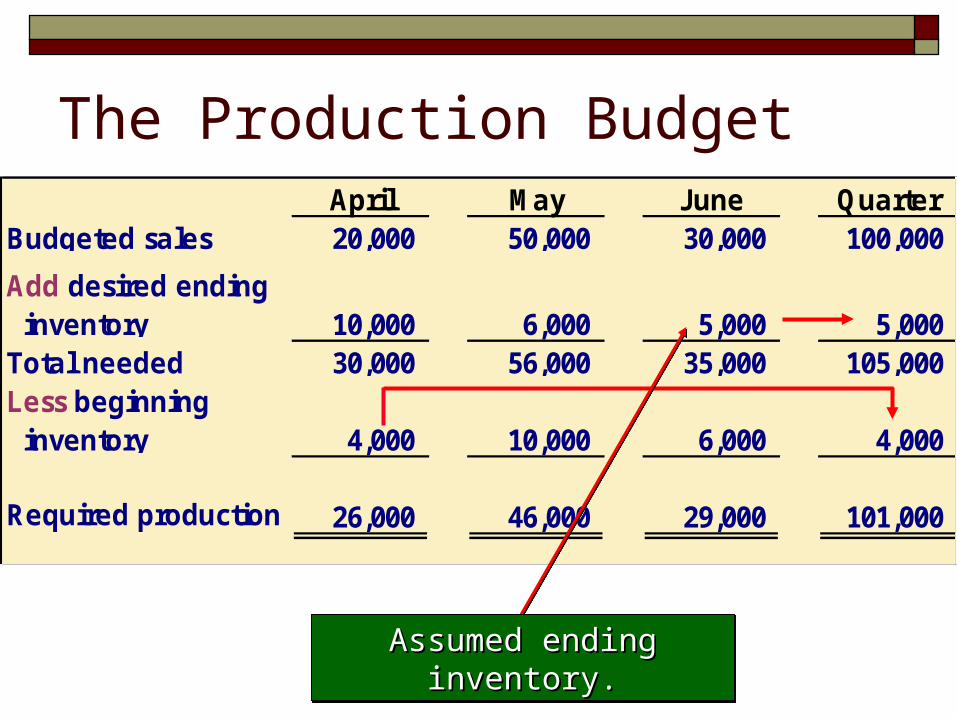
April May June QuarterBudgeted sales 20,000 50,000 30,000 100,000
Add desired ending inventory 10,000 6,000 5,000 5,000 Total needed 30,000 56,000 35,000 105,000 Less beginning inventory 4,000 10,000 6,000 4,000
Required production 26,000 46,000 29,000 101,000
The Production Budget
Assumed ending inventory.Assumed ending inventory.Assumed ending inventory.Assumed ending inventory.
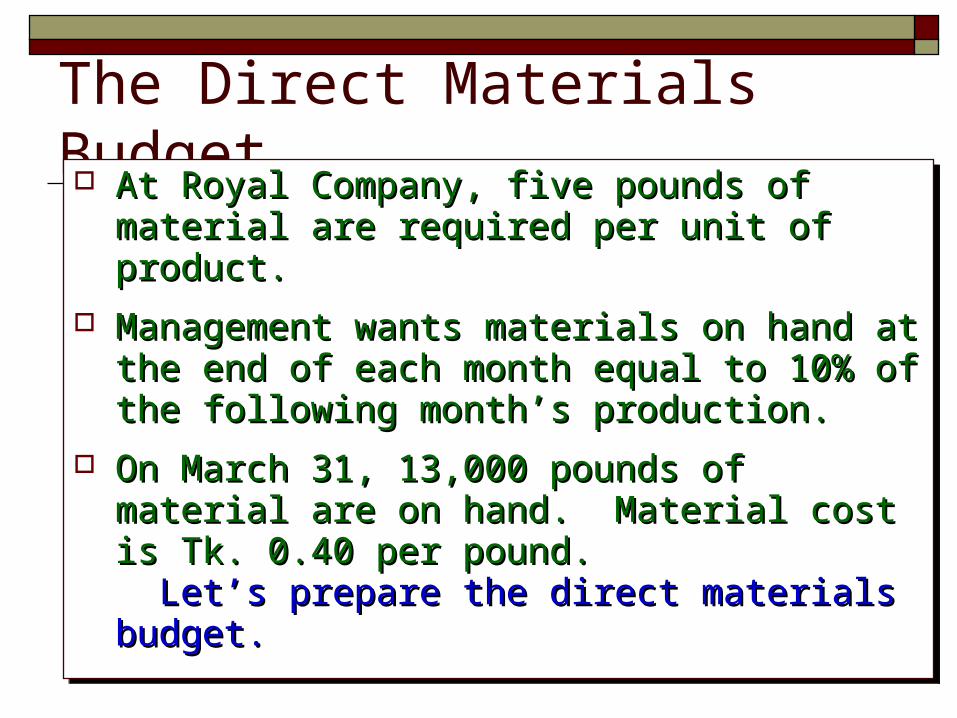
The Direct Materials Budget At Royal Company, five pounds of material At Royal Company, five pounds of material
are required per unit of product.are required per unit of product.
Management wants materials on hand at the Management wants materials on hand at the end of each month equal to 10% of the end of each month equal to 10% of the following month’s production.following month’s production.
On March 31, 13,000 pounds of material are On March 31, 13,000 pounds of material are on hand. Material cost is Tk. 0.40 per pound.on hand. Material cost is Tk. 0.40 per pound. Let’s prepare the direct materials budget.Let’s prepare the direct materials budget.
At Royal Company, five pounds of material At Royal Company, five pounds of material are required per unit of product.are required per unit of product.
Management wants materials on hand at the Management wants materials on hand at the end of each month equal to 10% of the end of each month equal to 10% of the following month’s production.following month’s production.
On March 31, 13,000 pounds of material are On March 31, 13,000 pounds of material are on hand. Material cost is Tk. 0.40 per pound.on hand. Material cost is Tk. 0.40 per pound. Let’s prepare the direct materials budget.Let’s prepare the direct materials budget.
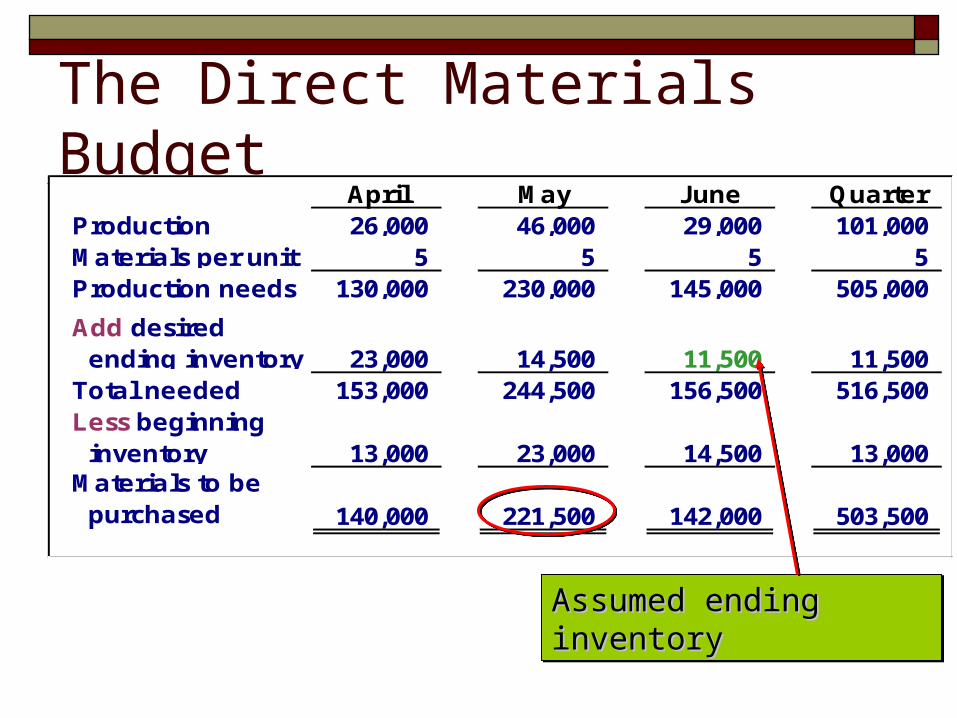
The Direct Materials BudgetApril May June Quarter
Production 26,000 46,000 29,000 101,000 Materials per unit 5 5 5 5 Production needs 130,000 230,000 145,000 505,000
Add desired ending inventory 23,000 14,500 11,500 11,500 Total needed 153,000 244,500 156,500 516,500 Less beginning inventory 13,000 23,000 14,500 13,000 Materials to be purchased 140,000 221,500 142,000 503,500
Assumed ending inventoryAssumed ending inventoryAssumed ending inventoryAssumed ending inventory
Expected Cash Disbursement for Materials Royal pays Tk 0.40 per pound for its Royal pays Tk 0.40 per pound for its
materials.materials.
One-half of a month’s purchases are paid for One-half of a month’s purchases are paid for in the month of purchase; the other half is in the month of purchase; the other half is paid in the following month.paid in the following month.
The March 31 accounts payable balance is The March 31 accounts payable balance is Tk.12,000.Tk.12,000.
Let’s calculate expected cash Let’s calculate expected cash disbursements.disbursements.
Royal pays Tk 0.40 per pound for its Royal pays Tk 0.40 per pound for its materials.materials.
One-half of a month’s purchases are paid for One-half of a month’s purchases are paid for in the month of purchase; the other half is in the month of purchase; the other half is paid in the following month.paid in the following month.
The March 31 accounts payable balance is The March 31 accounts payable balance is Tk.12,000.Tk.12,000.
Let’s calculate expected cash Let’s calculate expected cash disbursements.disbursements.
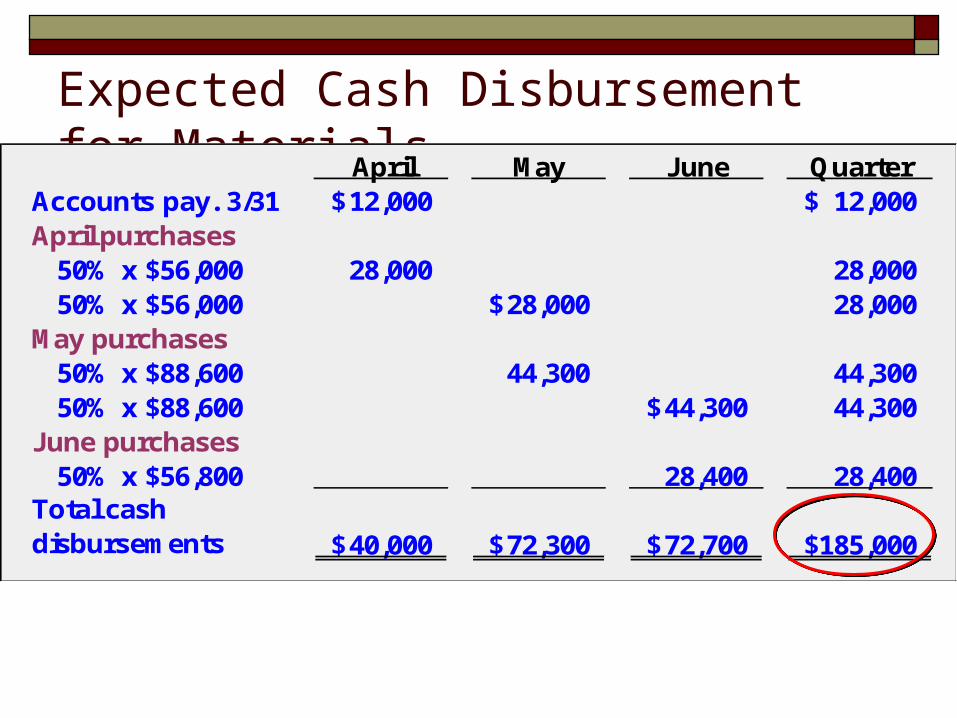
Expected Cash Disbursement for MaterialsApril May June Quarter
Accounts pay. 3/31 12,000$ 12,000$ April purchases 50% x $56,000 28,000 28,000 50% x $56,000 28,000$ 28,000 May purchases 50% x $88,600 44,300 44,300 50% x $88,600 44,300$ 44,300 June purchases 50% x $56,800 28,400 28,400 Total cash disbursements 40,000$ 72,300$ 72,700$ 185,000$
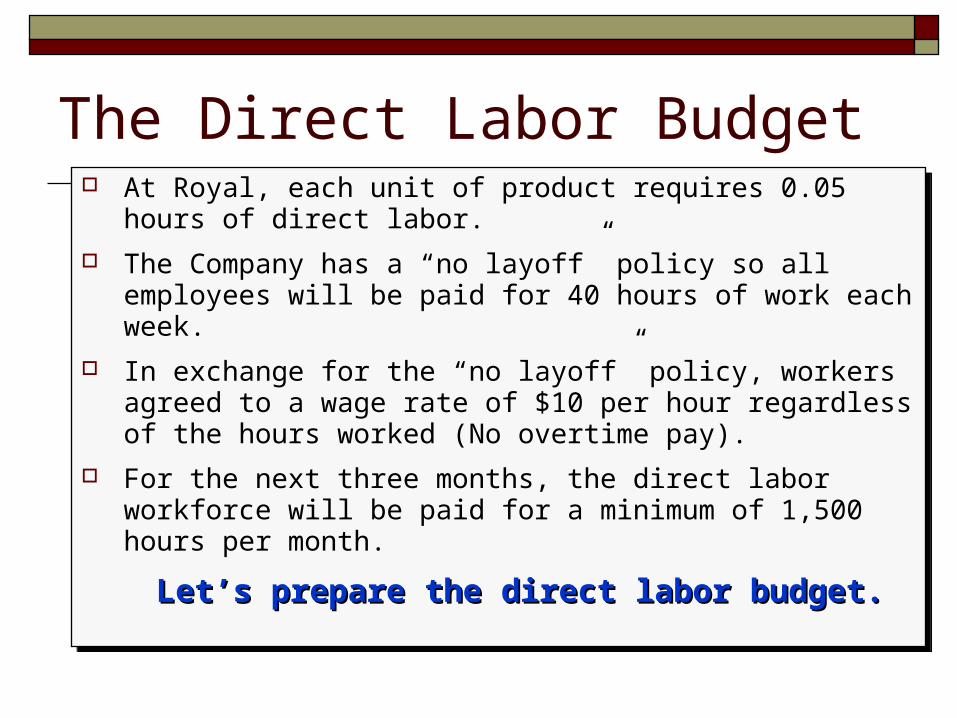
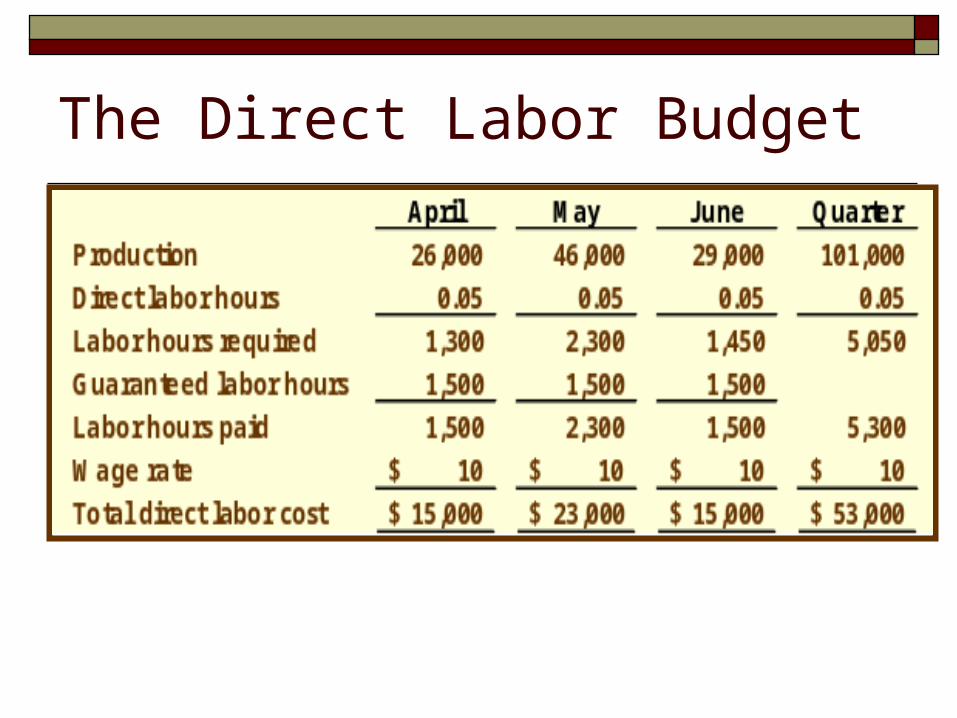
The Direct Labor Budget At Royal, each unit of product requires 0.05 hours of direct
labor.
The Company has a “no layoff” policy so all employees will be paid for 40 hours of work each week.
In exchange for the “no layoff” policy, workers agreed to a wage rate of $10 per hour regardless of the hours worked (No overtime pay).
For the next three months, the direct labor workforce will be paid for a minimum of 1,500 hours per month.
Let’s prepare the direct labor budget.Let’s prepare the direct labor budget.
At Royal, each unit of product requires 0.05 hours of direct labor.
The Company has a “no layoff” policy so all employees will be paid for 40 hours of work each week.
In exchange for the “no layoff” policy, workers agreed to a wage rate of $10 per hour regardless of the hours worked (No overtime pay).
For the next three months, the direct labor workforce will be paid for a minimum of 1,500 hours per month.
Let’s prepare the direct labor budget.Let’s prepare the direct labor budget.
The Direct Labor Budget
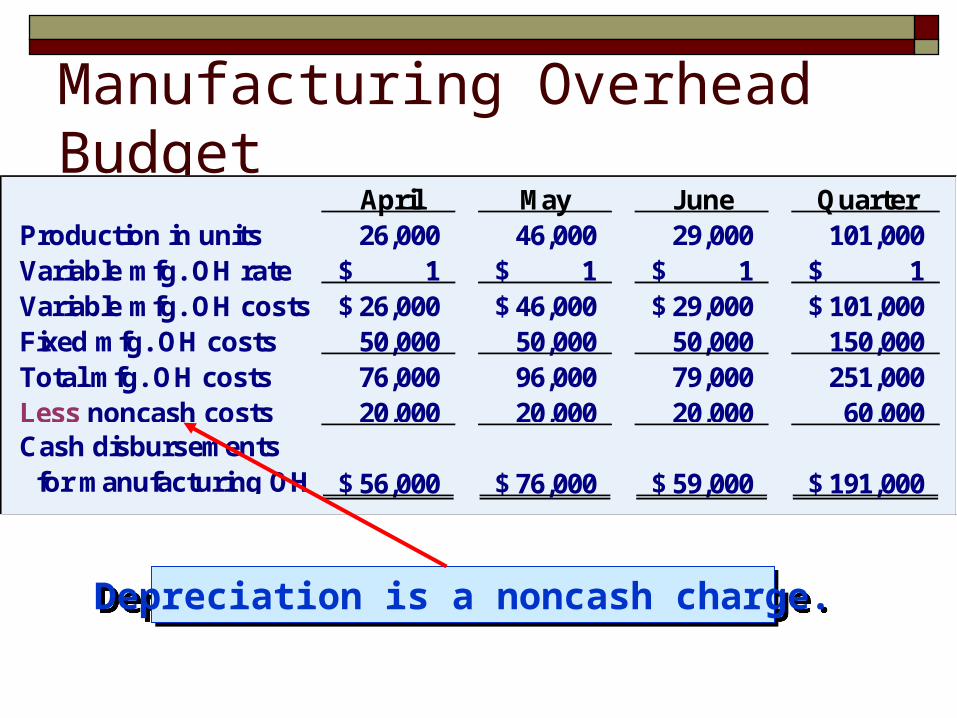
Manufacturing Overhead BudgetApril May June Quarter
Production in units 26,000 46,000 29,000 101,000 Variable mfg. OH rate 1$ 1$ 1$ 1$ Variable mfg. OH costs 26,000$ 46,000$ 29,000$ 101,000$ Fixed mfg. OH costs 50,000 50,000 50,000 150,000 Total mfg. OH costs 76,000 96,000 79,000 251,000 Less noncash costs 20,000 20,000 20,000 60,000 Cash disbursements for manufacturing OH 56,000$ 76,000$ 59,000$ 191,000$
Depreciation is a noncash charge.Depreciation is a noncash charge.
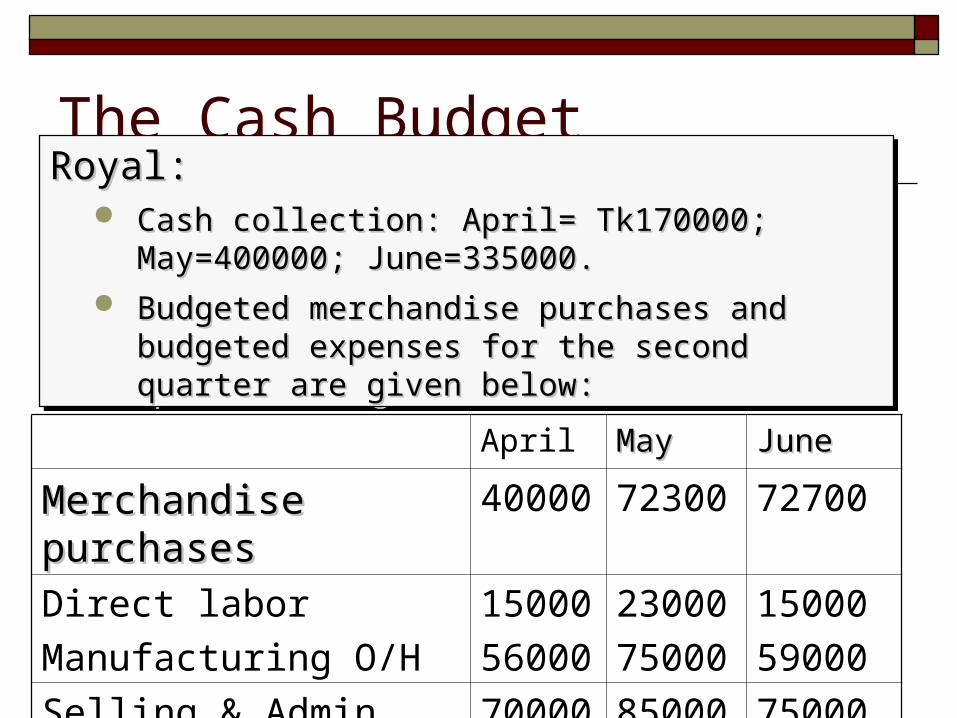
The Cash BudgetRoyal:Royal:
Cash collection: April= Tk170000; May=400000; Cash collection: April= Tk170000; May=400000; June=335000.June=335000.
Budgeted merchandise purchases and budgeted Budgeted merchandise purchases and budgeted expenses for the second quarter are given below:expenses for the second quarter are given below:
Royal:Royal: Cash collection: April= Tk170000; May=400000; Cash collection: April= Tk170000; May=400000;
June=335000.June=335000. Budgeted merchandise purchases and budgeted Budgeted merchandise purchases and budgeted
expenses for the second quarter are given below:expenses for the second quarter are given below:
April MayMay JuneJune
Merchandise purchasesMerchandise purchases 40000 72300 72700
Direct labor
Manufacturing O/H
15000
56000
23000
75000
15000
59000
Selling & Admin. 70000 85000 75000
The Cash Budget
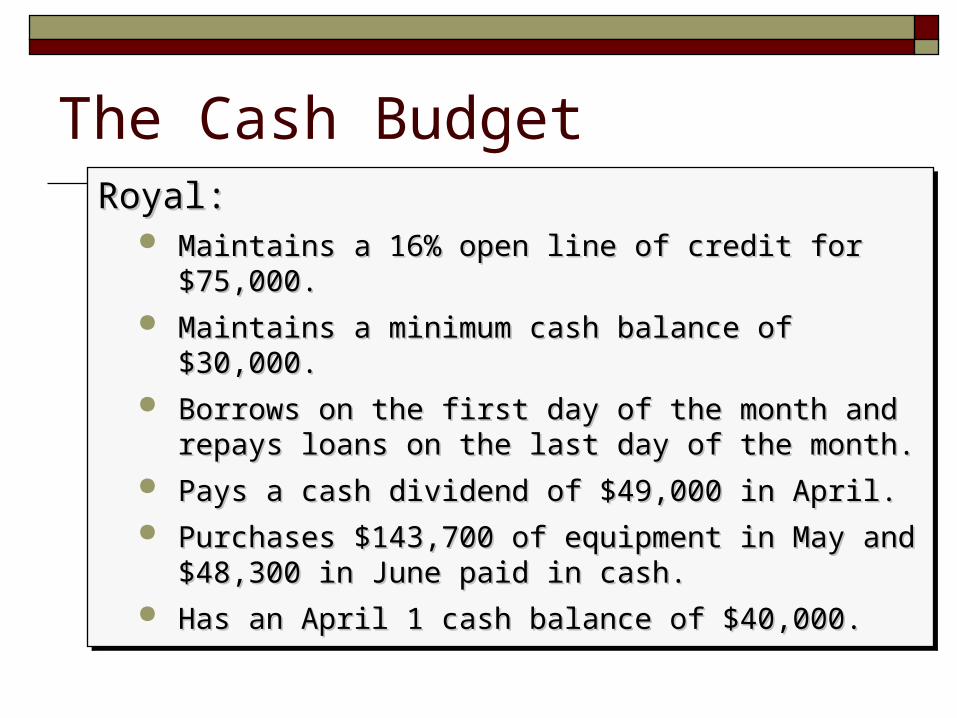
Royal:Royal: Maintains a 16% open line of credit for $75,000.Maintains a 16% open line of credit for $75,000. Maintains a minimum cash balance of $30,000.Maintains a minimum cash balance of $30,000. Borrows on the first day of the month and repays Borrows on the first day of the month and repays
loans on the last day of the month.loans on the last day of the month. Pays a cash dividend of $49,000 in April.Pays a cash dividend of $49,000 in April. Purchases $143,700 of equipment in May and Purchases $143,700 of equipment in May and
$48,300 in June paid in cash.$48,300 in June paid in cash. Has an April 1 cash balance of $40,000.Has an April 1 cash balance of $40,000.
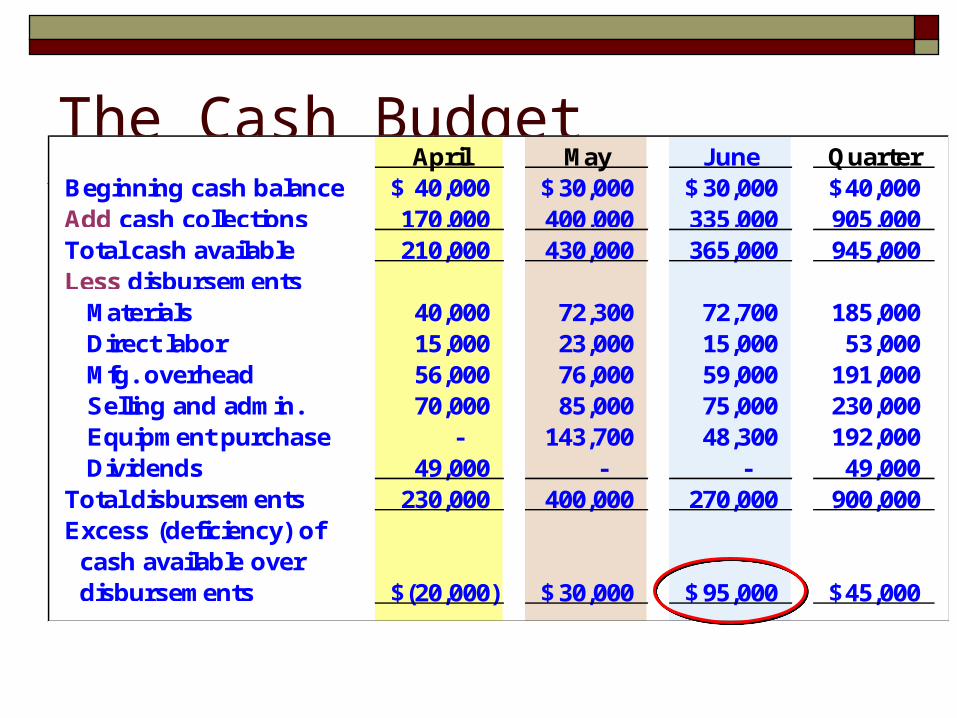
The Cash BudgetApril May June Quarter
Beginning cash balance 40,000$ 30,000$ 30,000$ 40,000$ Add cash collections 170,000 400,000 335,000 905,000 Total cash available 210,000 430,000 365,000 945,000 Less disbursements Materials 40,000 72,300 72,700 185,000 Direct labor 15,000 23,000 15,000 53,000 Mfg. overhead 56,000 76,000 59,000 191,000 Selling and admin. 70,000 85,000 75,000 230,000 Equipment purchase - 143,700 48,300 192,000 Dividends 49,000 - - 49,000 Total disbursements 230,000 400,000 270,000 900,000 Excess (deficiency) of cash available over disbursements (20,000)$ 30,000$ 95,000$ 45,000$
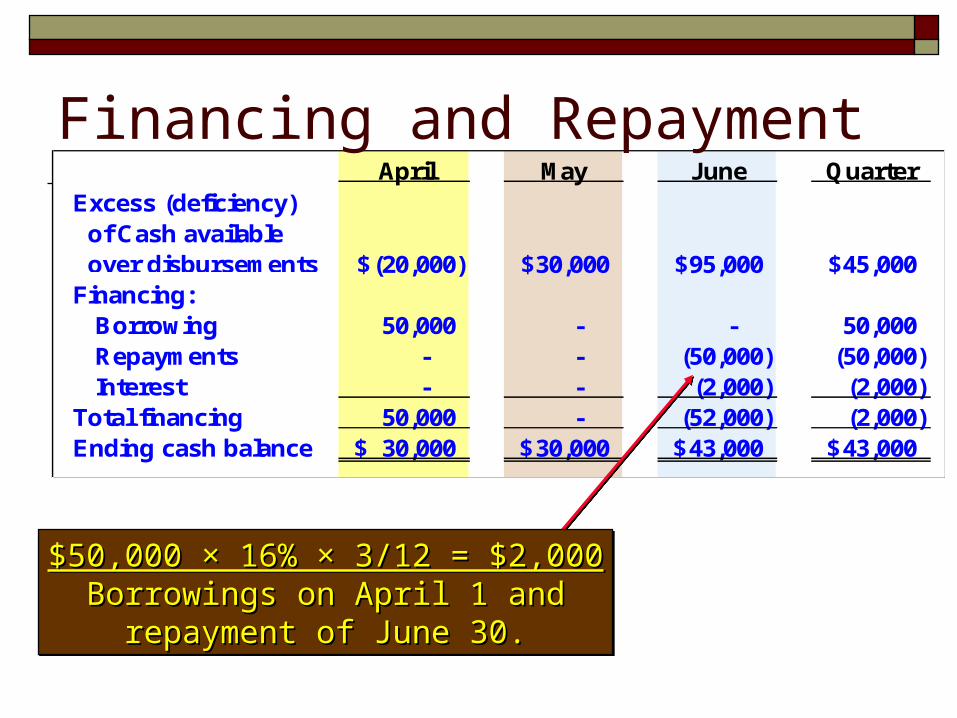
April May June QuarterExcess (deficiency) of Cash available over disbursements (20,000)$ 30,000$ 95,000$ 45,000$ Financing: Borrowing 50,000 - - 50,000 Repayments - - (50,000) (50,000) Interest - - (2,000) (2,000) Total financing 50,000 - (52,000) (2,000) Ending cash balance 30,000$ 30,000$ 43,000$ 43,000$
Financing and Repayment
$50,000 × 16% × 3/12 = $2,000$50,000 × 16% × 3/12 = $2,000Borrowings on April 1 andBorrowings on April 1 and
repayment of June 30.repayment of June 30.
$50,000 × 16% × 3/12 = $2,000$50,000 × 16% × 3/12 = $2,000Borrowings on April 1 andBorrowings on April 1 and
repayment of June 30.repayment of June 30.
Standard Costs and the Balanced Scorecard
Chapter 10
What is standard?
It is a benchmark or norm for measuring performance.
Many organizations use various tools to control operations and to evaluate performance. One of those tools is standard cost.
Performance measurement can provide feedback concerning what works and what does not work, and it can motivate people to sustain their efforts.
Companies in highly competitive industries must be able to provide high-quality goods and services at low cost.
If inputs (direct material, labor & overhead) are purchased at prices that are too high or more inputs is used than is really necessary for production, higher costs will result.
Managers use standard costs to control costs.
A standard is a benchmark or “norm” which is considered as normal in general condition.
A standard cost is the predetermined cost of manufacturing a single unit or a number of product units during a specific periods in the immediate future.
The use of standard costs for accounting purposes simplifies costing procedures and reduces clerical labor and expense.
Standard Costs-Management by Exception
Management by exception is a management system in which standards are set for various activities, and are compared with actual results. Significant deviations from standards are noted as exceptions.
Quantity and cost standards are set for each major input. Quantity standards specify how much of an input should be used to make a product or provide a service. Cost (price) standards specify how much should be paid for each unit of the input. Actual quantities and actual costs of inputs are compared to these standards. If actual deviates from standards, managers investigate the discrepancy to find the cause of the problem and eliminate it. This process is called management by exception.
Purposes of Standard Costs
Standard cost are used for:
1. Establishing budgets.2. Controlling costs3. Motivating and measuring efficiencies.4. Promoting possible cost reduction.5. Simplifying costing procedures.6. Assigning costs to materials, work in process, and
finished goods inventories.7. Forming the basis for setting sales prices.
What standard should we use?
practical standardsor ideal standards?
Practical standards are “tight but attainable.” This standard is set at levels that are currently attainable with reasonable and
efficient effort.
Ideal standards are those that can be attained only
under the best circumstances.
Direct Materials Standards
1. Materials price standard2. Materials quantity (or usage) standard
Materials price standardPrice standards help (1) checking the performance of
the purchasing department and (2) measuring the effect of price increases or decreases on the company’s profits.
Materials price varianceIf actual price paid is more or less than the standard
price, a price variance occurs.
Material price variance = Actual quantity purchased (Actual
cost - Standard cost)
Material price variance = AQ (AC-SC)
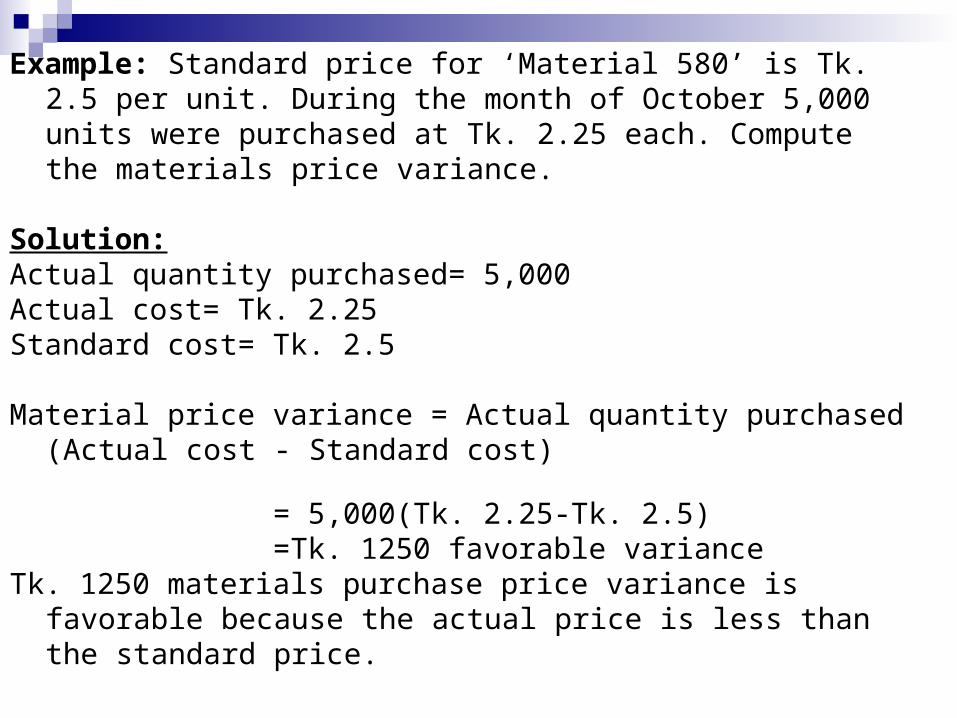
Example: Standard price for ‘Material 580’ is Tk. 2.5 per unit. During the month of October 5,000 units were purchased at Tk. 2.25 each. Compute the materials price variance.
Solution:Actual quantity purchased= 5,000Actual cost= Tk. 2.25Standard cost= Tk. 2.5
Material price variance = Actual quantity purchased (Actual cost - Standard cost)
= 5,000(Tk. 2.25-Tk. 2.5) =Tk. 1250 favorable varianceTk. 1250 materials purchase price variance is favorable
because the actual price is less than the standard price.
Materials quantity variance
Material quantity variance = Standard price (Actual quantity used -standard quantity allowed)
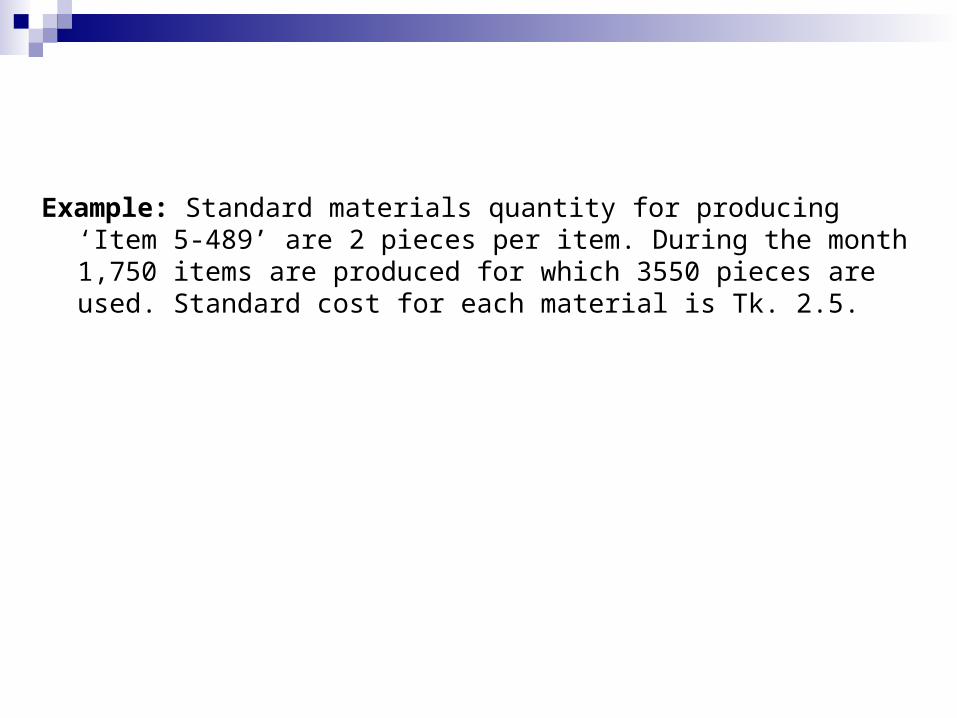
Example: Standard materials quantity for producing ‘Item 5-489’ are 2 pieces per item. During the month 1,750 items are produced for which 3550 pieces are used. Standard cost for each material is Tk. 2.5.
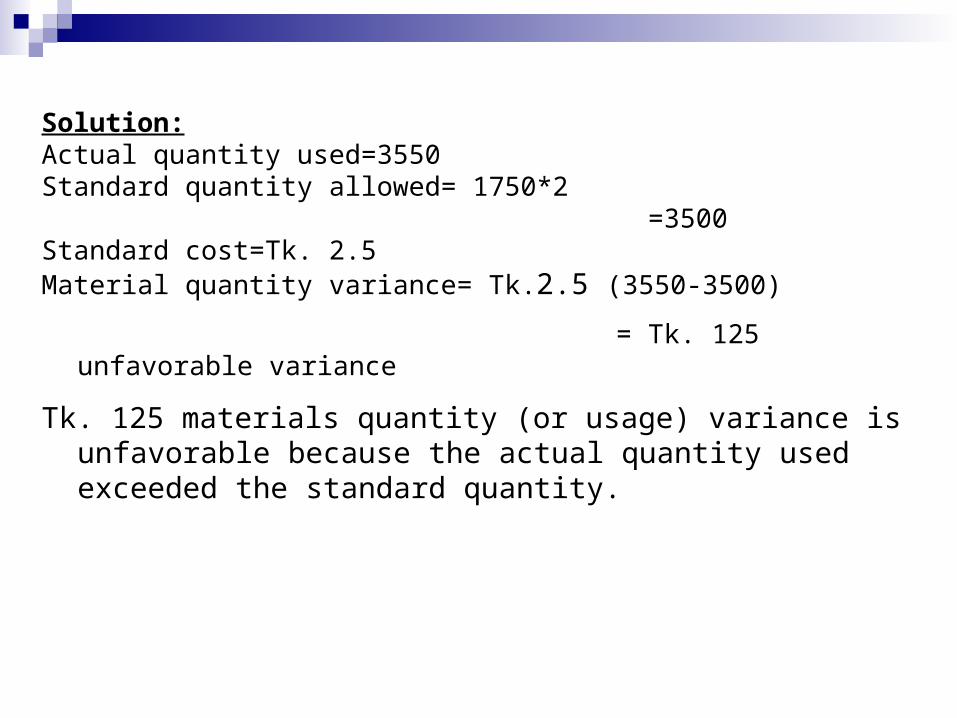
Solution:Actual quantity used=3550Standard quantity allowed= 1750*2 =3500Standard cost=Tk. 2.5Material quantity variance= Tk.2.5 (3550-3500)
= Tk. 125 unfavorable variance
Tk. 125 materials quantity (or usage) variance is unfavorable because the actual quantity used exceeded the standard quantity.
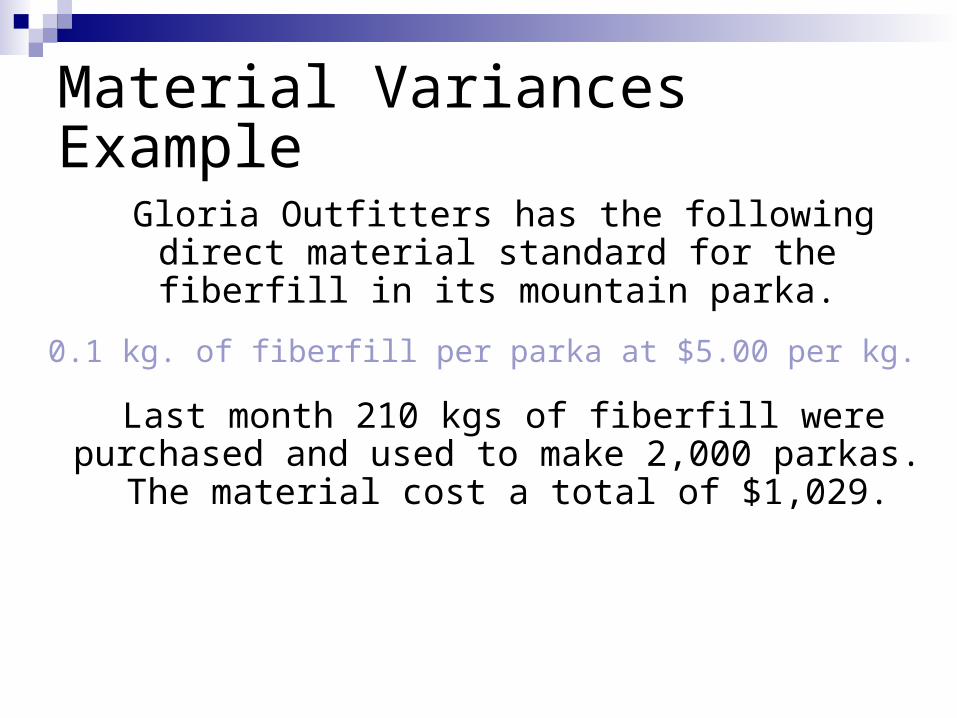
Gloria Outfitters has the following direct material standard for the fiberfill in its
mountain parka.
0.1 kg. of fiberfill per parka at $5.00 per kg.
Last month 210 kgs of fiberfill were purchased and used to make 2,000 parkas.
The material cost a total of $1,029.
Material VariancesExample
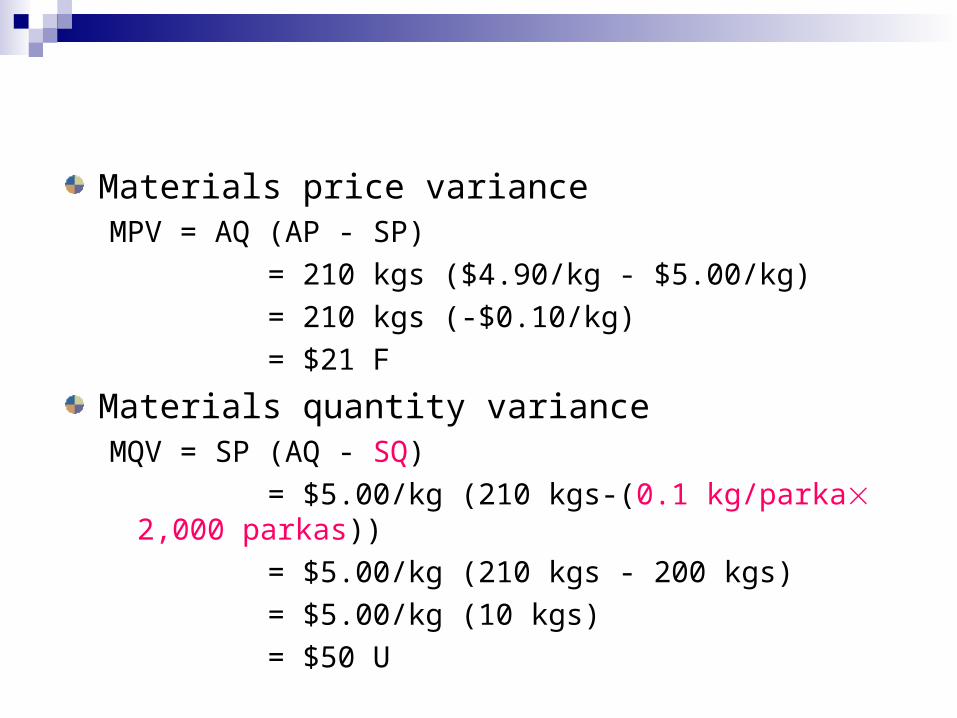
Materials price varianceMPV = AQ (AP - SP)
= 210 kgs ($4.90/kg - $5.00/kg)
= 210 kgs (-$0.10/kg)
= $21 F
Materials quantity varianceMQV = SP (AQ - SQ)
= $5.00/kg (210 kgs-(0.1 kg/parka 2,000 parkas))
= $5.00/kg (210 kgs - 200 kgs)
= $5.00/kg (10 kgs)
= $50 U
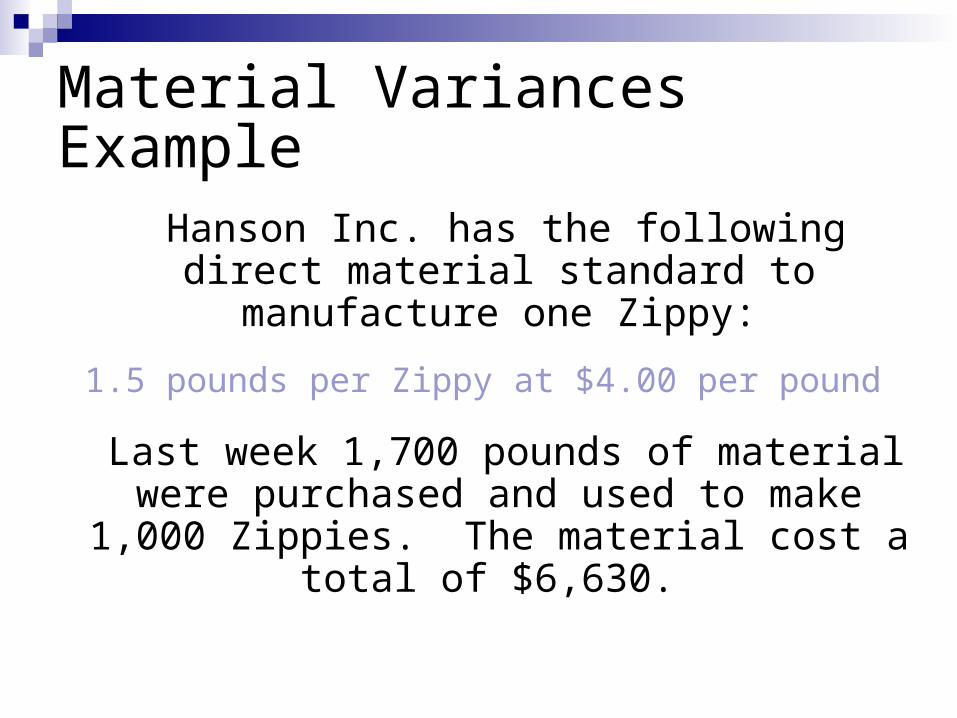
Hanson Inc. has the following direct material standard to manufacture one Zippy:
1.5 pounds per Zippy at $4.00 per pound
Last week 1,700 pounds of material were purchased and used to make 1,000 Zippies.
The material cost a total of $6,630.
Material VariancesExample
Direct Labor Standards
1. Rate (wage or cost) standard.2. Efficiency (time) standard.
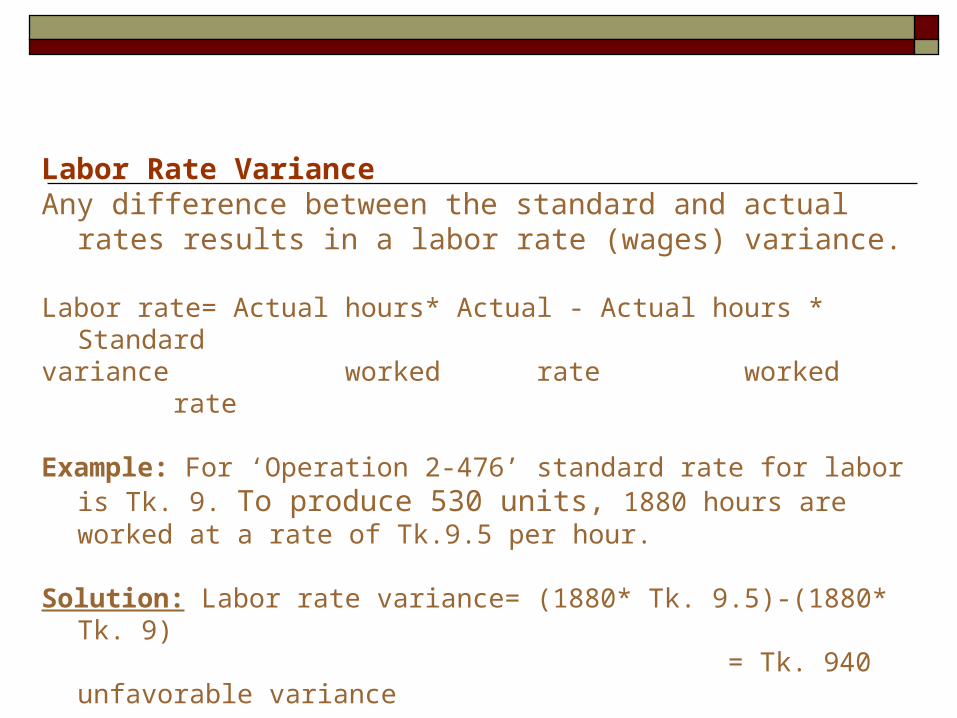
Labor Rate VarianceAny difference between the standard and actual rates
results in a labor rate (wages) variance.
Labor rate= Actual hours* Actual - Actual hours * Standard variance worked rate worked rate
Example: For ‘Operation 2-476’ standard rate for labor is Tk. 9. To produce 530 units, 1880 hours are worked at a rate of Tk.9.5 per hour.
Solution: Labor rate variance= (1880* Tk. 9.5)-(1880* Tk. 9) = Tk. 940 unfavorable variance
Labor Efficiency standardLabor Efficiency standards are set in accordance with
scientific methods and accepted practices. They are based on actual performance of a worker or group of workers possessing average skill.
Labor Efficiency VarianceThe labor efficiency variance is computed at the end of
any reporting period (day, week, or month) by comparing actual hours worked with standard hours allowed, both at the standard labor rate.
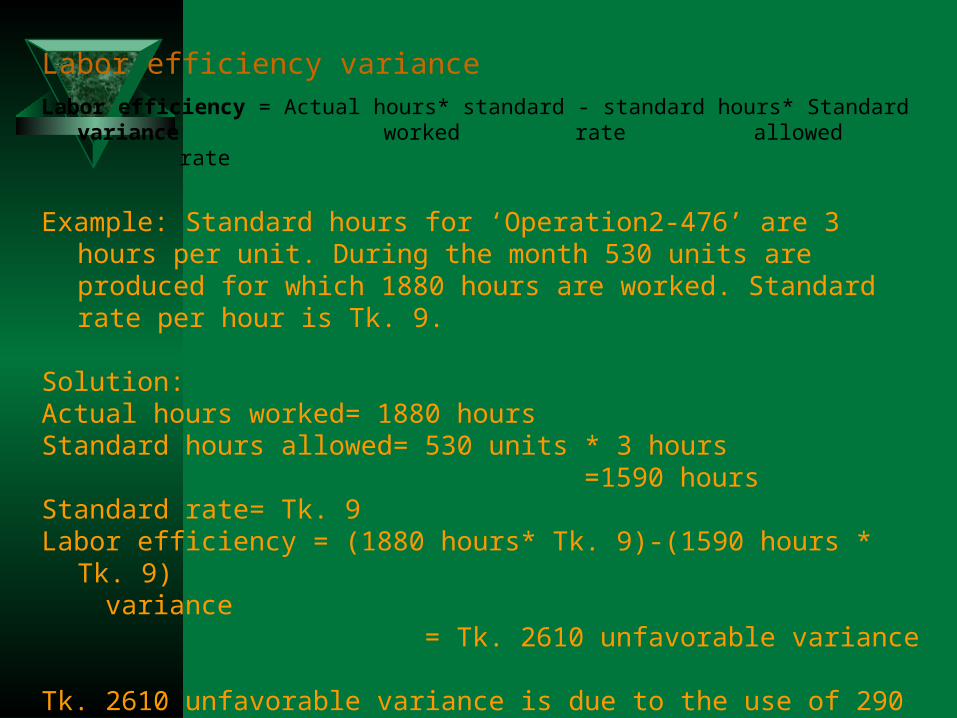
Labor efficiency varianceLabor efficiency = Actual hours* standard - standard hours* Standard variance
worked rate allowed rate
Example: Standard hours for ‘Operation2-476’ are 3 hours per unit. During the month 530 units are produced for which 1880 hours are worked. Standard rate per hour is Tk. 9.
Solution:Actual hours worked= 1880 hours Standard hours allowed= 530 units * 3 hours =1590 hoursStandard rate= Tk. 9Labor efficiency = (1880 hours* Tk. 9)-(1590 hours * Tk. 9) variance = Tk. 2610 unfavorable variance
Tk. 2610 unfavorable variance is due to the use of 290 hours in excess of standard hours allowed.
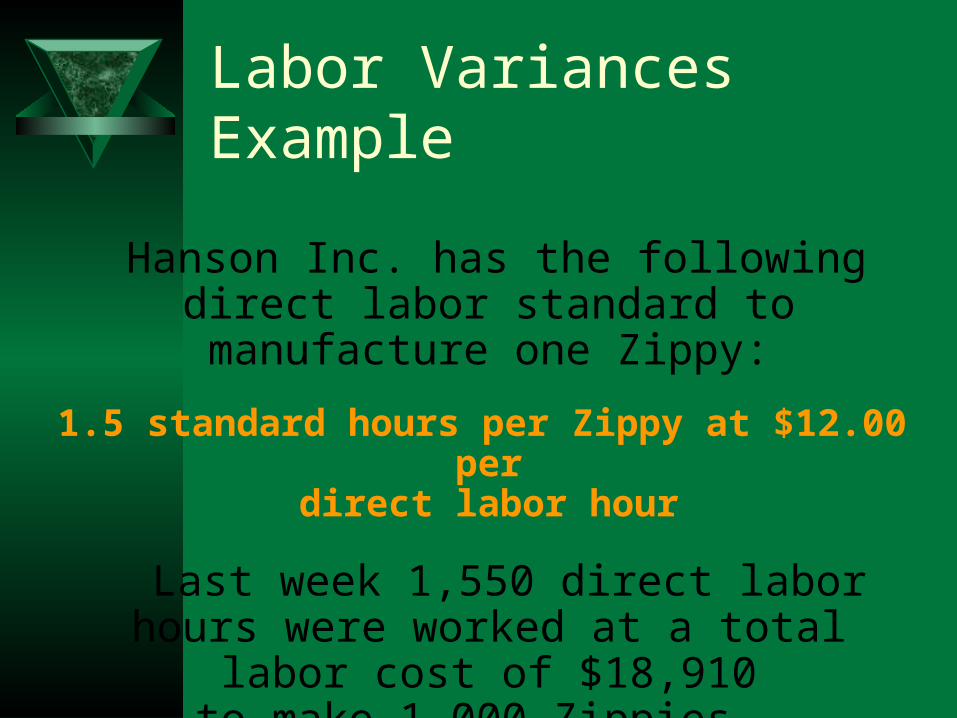
Hanson Inc. has the following direct labor standard to manufacture one Zippy:
1.5 standard hours per Zippy at $12.00 perdirect labor hour
Last week 1,550 direct labor hours were worked at a total labor cost of $18,910
to make 1,000 Zippies.
Labor Variances Example
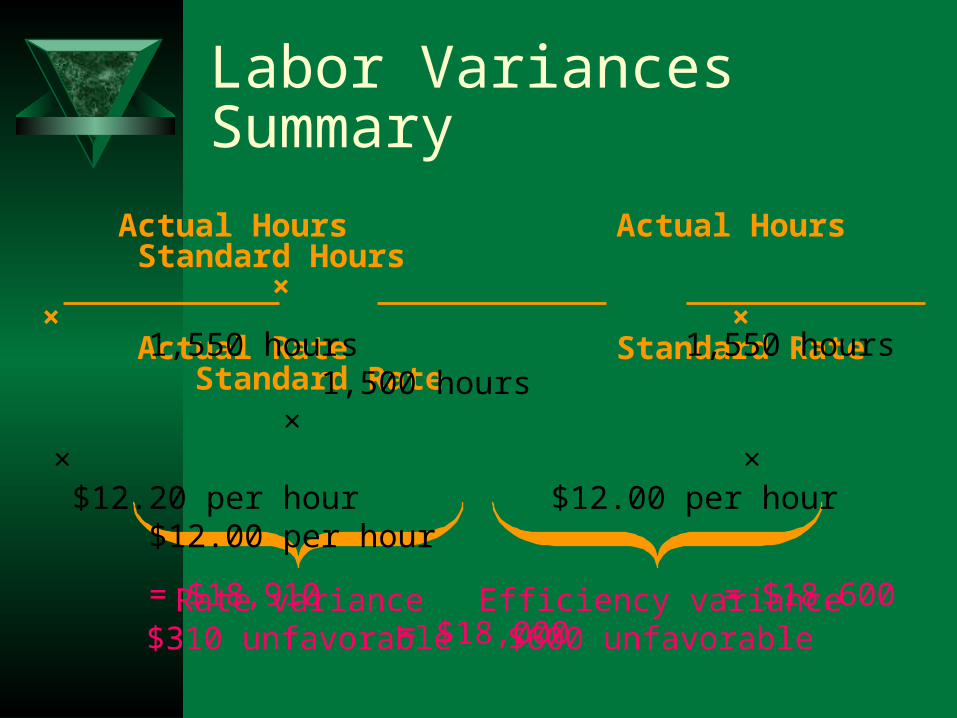
Actual Hours Actual Hours Standard Hours × × × Actual Rate Standard Rate Standard Rate
Labor VariancesSummary
Rate variance$310 unfavorable
Efficiency variance$600 unfavorable
1,550 hours 1,550 hours 1,500 hours × × × $12.20 per hour $12.00 per hour $12.00 per hour
= $18,910 = $18,600 = $18,000
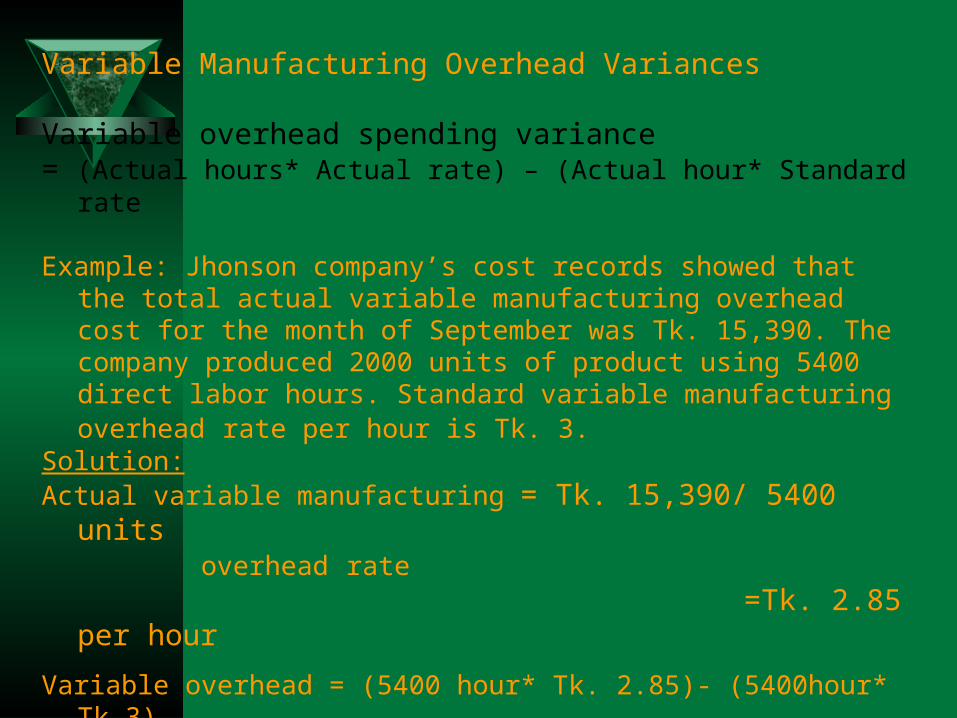
Variable Manufacturing Overhead Variances
Variable overhead spending variance= (Actual hours* Actual rate) – (Actual hour* Standard rate
Example: Jhonson company’s cost records showed that the total actual variable manufacturing overhead cost for the month of September was Tk. 15,390. The company produced 2000 units of product using 5400 direct labor hours. Standard variable manufacturing overhead rate per hour is Tk. 3.
Solution:Actual variable manufacturing = Tk. 15,390/ 5400 units overhead rate =Tk. 2.85 per hour
Variable overhead = (5400 hour* Tk. 2.85)- (5400hour* Tk.3)
spending variance
= Tk.810 Favorable variance
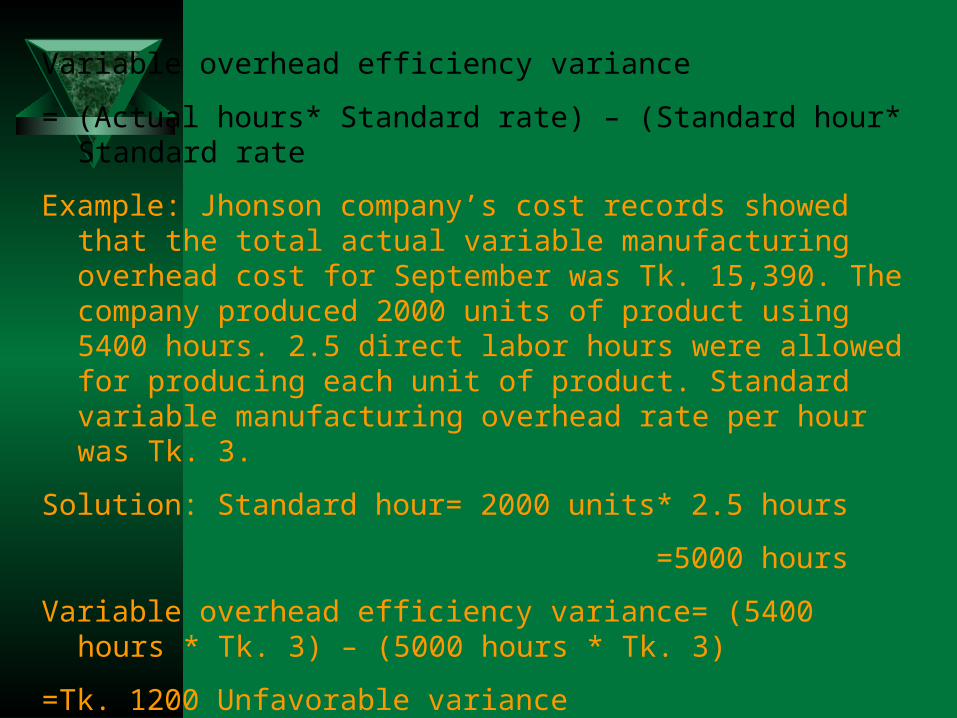
Variable overhead efficiency variance
= (Actual hours* Standard rate) – (Standard hour* Standard rate
Example: Jhonson company’s cost records showed that the total actual variable manufacturing overhead cost for September was Tk. 15,390. The company produced 2000 units of product using 5400 hours. 2.5 direct labor hours were allowed for producing each unit of product. Standard variable manufacturing overhead rate per hour was Tk. 3.
Solution: Standard hour= 2000 units* 2.5 hours
=5000 hours
Variable overhead efficiency variance= (5400 hours * Tk. 3) – (5000 hours * Tk. 3)
=Tk. 1200 Unfavorable variance
Balanced Scorecard
The balanced scorecard is a management system that enables organizations to clarify their vision and strategy and translate them into action. The balanced scorecard approach provides a clear prescription as to what companies should measure in order to 'balance' the financial perspective.
The Balanced Scorecard is a performance management approach that focuses on four indicators, including financial, customer perspective, internal-business processes, and learning and growth, to monitor progress toward organization's strategic goals. The basic idea is that learning is necessary to improve an internal- business process; improving business process is necessary to improve customer satisfaction; and improving customer satisfaction is necessary to improve financial results.
In the balanced scorecard approach, continual improvement is encouraged. This is a matter of survival. If an organization does not continually improve, it will eventually lose out in the long run.
Activity-Based Costing
Activity-based costing (ABC) is developed to provide more accurate ways of assigning the indirect costs to products, services, and customers. In activity-based costing, the objective is to understand overhead and the profitability of products and customers.
Differences between ABC and traditional costing system
In ABC, nonmanufacturing as well as manufacturing costs may be assigned to products. Here some manufacturing costs may be excluded from product costs. The overhead costs are allocated to cost objects using its own measure of activity or allocation base. Here, the costs of idle capacity are not charged to products.
But in traditional costing system only manufacturing costs are assigned to products. Here all the manufacturing costs are assigned to products. The allocation bases often differ from those used in ABC system. Here, the costs of idle capacity are charged to products.
Nonmanufacturing Costs and Activity-Based costing
Nonmanufacturing costs like commissions paid to salespersons, shipping costs and warranty repair costs can be easily traced to individual products. To determine the profitability of products, such nonmanufacturing costs are assigned to products in activity-based costing.
Manufacturing Costs and Activity-Based costing
Manufacturing costs like factory security guard’s wages are totally unaffected by which products are made or not made during a period. In ABC, a cost is assigned to a product only if there is good reason to believe that the cost would be affected by decisions concerning the product.
The costs of Idle Capacity in ABC:
In ABC, the costs of idle capacity are not charged to products. The products are charged for the costs of capacity they use, not for the costs of capacity they don’t use. This is consistent with the objective of assigning only those costs to products that are actually caused by the products.
Steps for Implementing Activity-Based Costing
1. Identify activities and activity cost pools: The first step is to identify the activities that will form the foundation for the system. A useful way to think about activities is to organize them into five general levels:
a) Unit-level activities are performed each time a unit is produced.
a) Batch-level activities are performed each time a batch is processed.
a) Product-level activities relate to specific products and must be carried out regardless of how many batches are run or units of product are produced.
d) Customer level activities relate to specific customers.
e) Organization sustaining activities includes activities such as cleaning offices, providing computer network, arranging for loans, preparing annual reports to shareholders, etc.