Management’s Statement of Responsibility Matters 2 – Additional Consolidating Information Our...
27
Transcript of Management’s Statement of Responsibility Matters 2 – Additional Consolidating Information Our...


Management’s Statement of Responsibility March 3, 2017 The management of the American Chemical Society (ACS or the Society) is responsible for the preparation and fair presentation of the consolidated financial statements in accordance with accounting principles generally accepted in the United States and, as such, the statements include amounts based on estimates and judgments by management. The consolidated financial statements have been audited by the independent accounting firm KPMG LLP, which was given unrestricted access to all financial records and related data, including minutes of all meetings of the Board of Directors and its committees. Their report, which follows, expresses their opinion as to whether the consolidated financial statements, considered in their entirety, fairly present the Society’s financial position, operating results, and cash flows in conformity with accounting principles generally accepted in the United States. Management believes that all representations made to the independent auditors during their audit were true and accurate. The Society maintains a system of internal controls which is designed to provide reasonable assurance that assets are safeguarded, transactions are executed in accordance with management’s authorization, and accounting records are reliable for preparing financial statements. The Society’s internal controls are maintained through the establishment and communication of accounting and financial policies and procedures and by the selection and training of qualified personnel. There are, however, inherent limitations in the effectiveness of any system of internal controls, including the possibility of human error and the circumvention of controls. Accordingly, even an effective internal control system can provide only reasonable assurance with respect to financial statement preparation. Furthermore, the effectiveness of an internal control system can change with circumstances. Management believes that as of December 31, 2016 and 2015, the Society’s system of internal controls was adequate to accomplish the objectives discussed herein. The ACS Board of Directors fulfills its oversight responsibility for the consolidated financial statements through its Audit Committee, which is composed of Committee members who are independent of Society management. The Audit Committee has a charter in place that outlines its responsibilities, which include engaging the independent auditors and internal auditors, reviewing accounting, auditing, internal control, and financial reporting matters, and meeting with management and the independent auditors to ensure that each is carrying out their responsibilities. Recommendations made by the independent auditors are considered and appropriate action is taken with respect to these recommendations. The independent auditors and internal auditors have free and full access to the Audit Committee. Thomas M. Connelly, Jr. Brian A. Bernstein Executive Director & CEO Treasurer & CFO
AMERICAN CHEMICAL SOCIETY
Consolidated Financial Statements
December 31, 2016 and 2015
(With Independent Auditors’ Report Thereon)

KPMG LLP
Suite 12000
1801 K Street, NW
Washington, DC 20006
KPMG LLP is a Delaware limited liability partnership,
the U.S. member firm of KPMG International Cooperative
(“KPMG International”), a Swiss entity.
Independent Auditors’ Report
The Board of Directors American Chemical Society:
We have audited the accompanying consolidated financial statements of the American Chemical Society and its subsidiaries, which comprise the consolidated statements of financial position as of December 31, 2016 and 2015, and the related consolidated statements of activities and cash flows for the years then ended, and the related notes to the consolidated financial statements.
Management’s Responsibility for the Financial Statements
Management is responsible for the preparation and fair presentation of these consolidated financial statements in accordance with U.S. generally accepted accounting principles; this includes the design, implementation, and maintenance of internal control relevant to the preparation and fair presentation of consolidated financial statements that are free from material misstatement, whether due to fraud or error.
Auditors ’ Responsibility
Our responsibility is to express an opinion on these consolidated financial statements based on our audits.
We conducted our audits in accordance with auditing standards generally accepted in the United States of America. Those standards require that we plan and perform the audit to obtain reasonable assurance about whether the consolidated financial statements are free from material misstatement.
An audit involves performing procedures to obtain audit evidence about the amounts and disclosures in the consolidated financial statements. The procedures selected depend on the auditors’ judgment, including the assessment of the risks of material misstatement of the consolidated financial statements, whether due to fraud or error. In making those risk assessments, the auditor considers internal control relevant to the entity’s preparation and fair presentation of the consolidated financial statements in order to design audit procedures that are appropriate in the circumstances, but not for the purpose of expressing an opinion on the effectiveness of the entity’s internal control. Accordingly, we express no such opinion. An audit also includes evaluating the appropriateness of accounting policies used and the reasonableness of significant accounting estimates made by management, as well as evaluating the overall presentation of the consolidated financial statements.
We believe that the audit evidence we have obtained is sufficient and appropriate to provide a basis for our audit opinion.
Opinion
In our opinion, the consolidated financial statements referred to above present fairly, in all material respects, the financial position of the American Chemical Society and its subsidiaries as of December 31, 2016 and 2015, and the results of their operations and their cash flows for the years then ended, in accordance with U.S. generally accepted accounting principles.
2
Other Matters – Additional Consolidating Information
Our audit was conducted for the purpose of forming an opinion on the consolidated financial statements as a whole. The consolidating information is presented for purposes of additional analysis and is not a required part of the consolidated financial statements. Such information is the responsibility of management and was derived from and relates directly to the underlying accounting and other records used to prepare the consolidated financial statements. The information has been subjected to the auditing procedures applied in the audit of the consolidated financial statements and certain additional procedures, including comparing and reconciling such information directly to the underlying accounting and other records used to prepare the consolidated financial statements or to the consolidated financial statements themselves, and other additional procedures in accordance with auditing standards generally accepted in the United States of America. In our opinion, the consolidating information is fairly stated in all material respects in relation to the consolidated financial statements as a whole.
Washington, DC March 3, 2017

3
2015Additional Consolidating Information
ACS Programs
Petroleum Research Fund Total Total
ASSETS
Current AssetsCash and Cash Equivalents 62,202$ 21,216$ 83,418$ 62,583$ Accounts Receivable, Net 146,274 - 146,274 125,122 Interfund (Payable) Receivable (16,501) 16,501 - - Other 12,980 57 13,037 15,976
Total Current Assets 204,955 37,774 242,729 203,681
Non-Current AssetsInvestments 483,914 503,839 987,753 983,687 Buildings, Land, and Other Property, Net 117,100 78 117,178 109,846 Postretirement Benefits and Other 9,863 - 9,863 9,976
Total Non-Current Assets 610,877 503,917 1,114,794 1,103,509
Total Assets 815,832$ 541,691$ 1,357,523$ 1,307,190$
LIABILITIES AND NET ASSETS
Current LiabilitiesAccounts Payable 33,786$ 6$ 33,792$ 30,039$ Accrued Expenses 35,696 14,282 49,978 48,379 Deferred Revenues 217,695 - 217,695 195,662 Postretirement Benefits and Other 3,087 - 3,087 3,055
Total Current Liabilities 290,264 14,288 304,552 277,135
Non-Current LiabilitiesDeferred Revenues 1,322 - 1,322 1,457 Postretirement Benefits and Other 168,823 4,718 173,541 191,011
Total Non-Current Liabilities 170,145 4,718 174,863 192,468
Total Liabilities 460,409 19,006 479,415 469,603
Net AssetsUnrestricted 247,316 - 247,316 202,321 Temporarily Restricted 41,053 450,185 491,238 497,232 Permanently Restricted 67,054 72,500 139,554 138,034
Total Net Assets 355,423 522,685 878,108 837,587
Total Liabilities and Net Assets 815,832$ 541,691$ 1,357,523$ 1,307,190$
See accompanying notes to the consolidated financial statements.
American Chemical SocietyConsolidated Statements of Financial Position
As of December 31,(in thousands)
2016

4
2015Additional Consolidating Information
ACS Programs
Petroleum Research
Fund Total Total
Change in Unrestricted Net Assets - OperationsRevenues
Electronic Services 461,498$ -$ 461,498$ 447,010$ Member Insurance Premiums, Refunds, and Fees 13,761 - 13,761 9,923 Dues 11,757 - 11,757 12,003 Registration Fees and Booth Sales 11,390 - 11,390 10,457 Investment Income 8,112 90 8,202 9,299 Advertising 5,894 - 5,894 7,227 Printed Services 3,184 - 3,184 3,859 Net Assets Released from Restriction 6,945 24,726 31,671 29,791 Other 5,325 - 5,325 6,177
Total Unrestricted Revenues 527,866 24,816 552,682 535,746
ExpensesProgram Expenses
Information Services 384,853 - 384,853 382,180 Membership and Scientific Advancement 27,978 - 27,978 27,311 Member Insurance Program 14,806 - 14,806 16,502 Education 10,416 - 10,416 9,703 Grants and Awards 2,822 23,089 25,911 25,027 Other 4,912 - 4,912 4,882
Supporting ExpensesAdministrative 48,511 1,727 50,238 48,696 Member Promotion and Retention 3,059 - 3,059 3,396 Other 7,650 - 7,650 7,611
Total Expenses 505,007 24,816 529,823 525,308
Change in Unrestricted Net Assets from Operations 22,859 - 22,859 10,438
Change in Unrestricted Net Assets - Non-Operating Net Investment Gains (Losses) 16,703 - 16,703 (16,985) Change in Postretirement Benefit Obligations 5,433 - 5,433 18,765
Change in Unrestricted Net Assets - Non-Operating 22,136 - 22,136 1,780
Change in Unrestricted Net Assets 44,995 - 44,995 12,218
Change in Temporarily Restricted Net AssetsContributions 2,555 - 2,555 4,290 Net Investment Gains (Losses) 3,299 8,393 11,692 (9,635) Investment Income 2,458 8,972 11,430 12,257 Net Assets Released From Restriction (6,945) (24,726) (31,671) (29,791) Transfer of Net Assets - - - 11,463
Change in Temporarily Restricted Net Assets 1,367 (7,361) (5,994) (11,416)
Change in Permanently Restricted Net AssetsContributions 383 - 383 1,268 Net Investment Gains (Losses) 1,137 - 1,137 (463) Investment Income - - - 4 Transfer of Net Assets - - - (11,463)
Change in Permanently Restricted Net Assets 1,520 - 1,520 (10,654)
Change in Net Assets 47,882 (7,361) 40,521 (9,852) Beginning Net Assets 307,541 530,046 837,587 847,439
Ending Net Assets 355,423$ 522,685$ 878,108$ 837,587$
See accompanying notes to the consolidated financial statements.
American Chemical SocietyConsolidated Statements of Activities
For the Years Ended December 31,(in thousands)
2016

5
2015Additional Consolidating Information
ACS Programs
Petroleum Research
Fund Total Total
Cash Flows From Operating Activities
Change in Net Assets 47,882$ (7,361)$ 40,521$ (9,852)$
Adjustments to Reconcile Change in Net Assets to NetCash Provided By (Used in) Operating Activities:
Net Investment (Gains) Losses (21,139) (8,393) (29,532) 27,083 Change in Postretirement Benefit Obligations (5,433) - (5,433) (18,765) Depreciation and Amortization 27,738 9 27,747 28,344 Beneficial Interest in Gift Annuities - - - (4) Contributions Restricted for Long-Term Investment (383) - (383) (1,268) Amortization of Prepaid Bond Costs - - - 7 Net Loss on Property Dispositions 219 - 219 2,377
Changes in Operating Assets and Liabilities:(Increases) Decreases in Assets:
Accounts Receivable, Net (20,312) - (20,312) (13,058) Interfund Receivable (Payable) 2,713 (2,713) - - Other Assets 3,860 (5) 3,855 (1,289)
Increases (Decreases) in Liabilities:Accounts Payable 3,747 6 3,753 194 Accrued Expenses 649 885 1,534 (4,857) Deferred Revenues 21,898 - 21,898 10,018 Other Liabilities (13,380) 373 (13,007) (13,603)
Net Cash Provided by (Used in) Operating Activities 48,059 (17,199) 30,860 5,327
Cash Flows From Investing Activities
Purchases of Investments (45,001) (1,146,907) (1,191,908) (688,913) Sales and Maturities of Investments 51,451 1,165,148 1,216,599 725,129 Acquisitions of Buildings, Land, and Other Property (35,099) - (35,099) (34,232)
Net Cash (Used in) Provided by Investing Activities (28,649) 18,241 (10,408) 1,984
Cash Flows From Financing Activities
Payments on Debt - - - (860) Contributions Restricted for Long-Term Investment 383 - 383 1,268
Net Cash Provided by Financing Activities 383 - 383 408
Net Increase in Cash and Cash Equivalents 19,793 1,042 20,835 7,719 Beginning Cash and Cash Equivalents 42,409 20,174 62,583 54,864
Ending Cash and Cash Equivalents 62,202$ 21,216$ 83,418$ 62,583$
See accompanying notes to the consolidated financial statements.
American Chemical SocietyConsolidated Statements of Cash Flows
For the Years Ended December 31,(in thousands)
2016
6
AMERICAN CHEMICAL SOCIETY
NOTES TO CONSOLIDATED FINANCIAL STATEMENTS FOR THE YEARS ENDED DECEMBER 31, 2016 and 2015
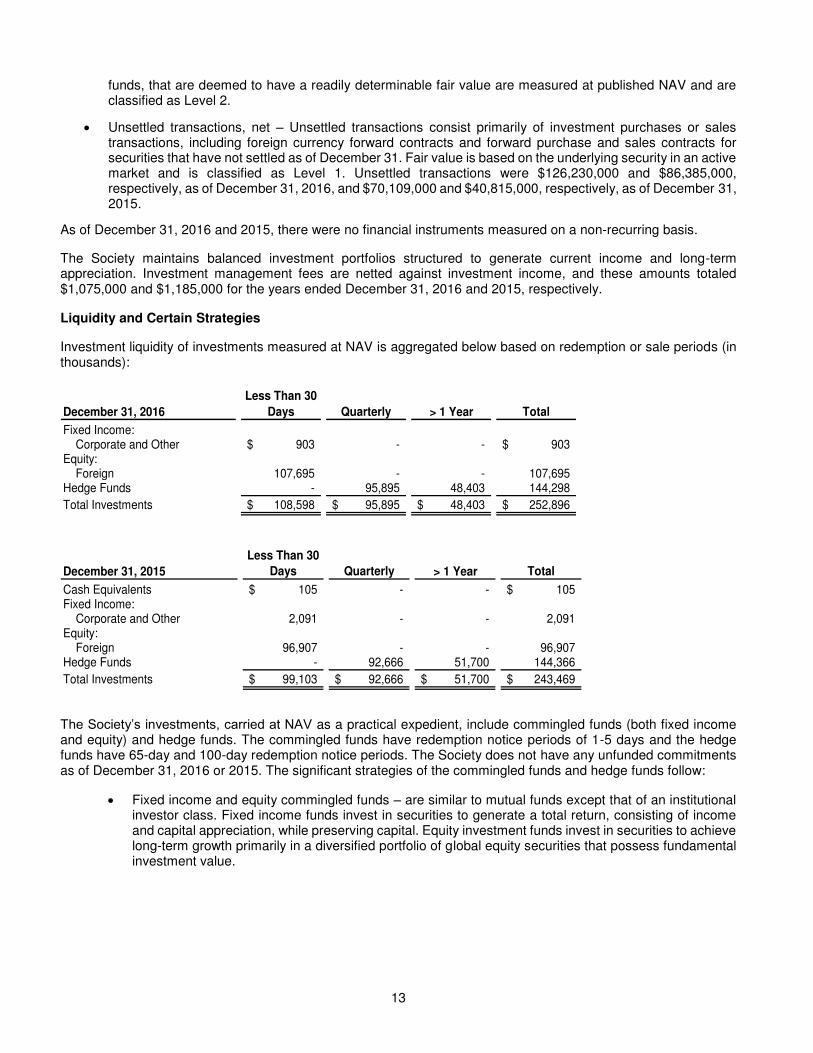
1. ORGANIZATION AND PURPOSE
The American Chemical Society (the Society) was founded in 1876. It is a U.S. not-for-profit corporation whose national charter was approved by the U.S. Congress on August 25, 1937. The Society’s consolidated financial statements include the operations of two wholly owned for-profit subsidiaries and an insurance trust. The Society was organized for the purposes of encouraging the advancement of chemistry, promoting research in chemical science, increasing and diffusing chemical knowledge, and promoting scientific interests and inquiry through its meetings, reports, papers, and publications. The Society has more than 156,000 members.
The Society is generally exempt from federal income tax under Section 501(c)(3) of the Internal Revenue Code and accomplishes its exempt purpose through a number of educational and membership programs. These include continuing education programs, national and regional meetings that provide forums for sharing scientific information, employment services, and public outreach. In addition, the Society provides expert testimony at the federal, state, and local government levels on topics relevant to the chemistry enterprise. The Society also provides a significant service to its members and the chemistry enterprise in the form of print and electronic scientific journals and databases pertaining to chemical and related scientific information.
The principal sources of funding for the Society’s activities include net revenue generated by the Publications Division and the Chemical Abstracts Service (CAS) Division. The Publications Division publishes a wide range of peer-reviewed scientific journals, periodicals, and books. CAS analyzes, organizes, and shares scientific information that drives discovery, providing innovative solutions that empower scientists, patent information professionals, and business leaders worldwide. Other sources of the Society’s revenue include member dues, insurance premiums, registration fees, investment income, and contributions from individuals and institutions to support Society programs. Products and services are sold domestically and in overseas markets, principally in Europe and Asia. The Society’s diverse clientele is composed of its members and other chemistry-related practitioners, corporations, academic institutions, and government agencies.
2. SUMMARY OF SIGNIFICANT ACCOUNTING POLICIES
Principles of Presentation and Consolidation
The accompanying consolidated financial statements include the accounts of the American Chemical Society and its related entities, which consist of ACS International, Ltd., a wholly owned international marketing services subsidiary, and Hampden Data Services, Ltd., a wholly owned chemical information software company. The consolidated financial statements also include the accounts of the American Chemical Society Petroleum Research Fund, an endowment fund established to advance scientific education and research in the petroleum field, and the American Chemical Society Insurance Trust, a grantor trust established to enable members of the Society to purchase insurance coverage through group insurance policies. All significant interorganizational transactions have been eliminated. The accounts of the Society’s chapters, referred to as local sections and divisions, are not included in the Society’s consolidated financial statements because the Society does not have a financial controlling interest in its chapters.
Use of Estimates
The preparation of the consolidated financial statements, in conformity with U.S. generally accepted accounting principles, requires management to make estimates and assumptions that affect the reported amounts of assets and liabilities, the disclosure of contingent assets and liabilities at the date of the consolidated financial statements, and the reported amounts of revenues and expenses during the reporting period. The Society’s most significant estimates include valuation of investments and derivatives, actuarial assumptions for postretirement benefit obligations, and useful lives of buildings and other property. Actual results could differ from these estimates.
Cash Equivalents
Cash equivalents include money market funds which can be liquidated on a daily basis. These money market funds invest primarily in short-term U.S. Treasury securities, other short-term highly-liquid investments, and certain fixed

7
income securities. Cash and cash equivalents that are managed as part of investments are reported within investments, as these funds are not used for daily operating needs.
Accounts Receivable
Accounts receivable are recorded at the invoiced amount and do not bear interest. The Society maintains an allowance for doubtful accounts for estimated losses. In establishing the allowance, management considers historical losses and past-due balances. The Society records receivables from subscribers related to the next calendar year journal subscriptions billed before December 31 based on written commitments from customers and historically high renewal rates.
Investments
Investments are reported at fair value in the consolidated statements of financial position except for certain commingled trust funds and hedge funds, which are reported at net asset value (NAV) as a practical expedient for fair value, unless it is probable that all or a portion of the investment will be sold for an amount different than NAV. Fair values of certain commingled funds, similar to mutual funds, that are deemed to have a readily determinable fair value are measured at published NAV. The net asset values are provided by external investment managers and involve assumptions and estimation methods; therefore, the estimates could differ materially from actual results. The Society reviews and evaluates the values provided by the investment managers and agrees with the valuation methods and assumptions used in determining the net asset values. Certain investments reported at NAV are subject to withdrawal restrictions and are less liquid than the Society’s other investments. As of December 31, 2016 and 2015, the Society had no plans or intentions to sell investments at amounts different from NAV.
Changes in fair value are recognized as net investment gains or losses in the consolidated statements of activities. Investment income, consisting of interest and dividends, is recognized when earned. Purchases and sales of investments are recorded on the trade date. Unsettled transactions that are managed as part of investments are reported within investments as the funds related to the settlements of such transactions stay within the investment pools and are not used for operating purposes. Unsettled transactions include forward purchase and sales contracts for debt securities and foreign currency contracts.
The Society invests in various instruments including domestic and foreign equities, fixed income securities, and financial derivatives. Investments, in general, carry various risks such as interest rate, credit, liquidity, and overall market risk. Due to the level of risk associated with certain investments, it is reasonably possible that changes in the values of investments may occur in the near term and such changes could materially affect the amounts reported in investments.
The Society has authorized its investment managers to utilize various derivative instruments, including financial futures, options, interest rate swaps, and credit default swaps, to either hedge risk or alter the exposure to certain asset classes. The Society has established procedures to monitor and manage the use of these derivative instruments and the related market, interest, and counterparty credit risks. These derivative instruments are recognized at fair value, using quoted market prices for similar instruments, within investments in the consolidated statements of financial position.
Foreign Currency Forward Contracts
The Society recognizes foreign currency contracts (not related to its investment portfolios) as either accounts receivable, accounts payable, or deferred revenue in the consolidated statements of financial position at their respective fair values. The fair values of foreign currency forward contracts are based on quoted market prices for similar contracts at December 31. Changes in fair value are recognized as net investment gains or losses in the consolidated statements of activities.

8
Fair Value Measurements
Fair value is the price that would be received to sell an asset or paid to transfer a liability in an orderly transaction between market participants at the measurement date.
The fair value measurement standard establishes a three-tier fair value hierarchy that prioritizes the inputs used in measuring fair value. The standard requires that assets and liabilities carried at fair value be classified and disclosed in one of the following three categories:
Level 1 – Observable inputs such as quoted prices in active markets for identical assets or liabilities (e.g., U.S. Treasury issues, equities, and mutual funds traded on major exchanges)
Level 2 – Inputs, other than quoted prices in active markets for identical assets or liabilities, that are observable either directly or indirectly, such as interest rates, yield curves, and quoted prices in active markets for similar assets or liabilities (e.g., U.S. government and agency issues, corporate bonds, money market funds, and foreign exchange forward contracts)
Level 3 – Unobservable inputs in which there is little or no market data, requiring the reporting entity to develop its own assumptions
The Society utilizes the best information available in measuring fair value, and financial assets and liabilities are classified based on the lowest level of input that is significant to the fair value measurement.
See Note 4 for the disclosure of the fair value of applicable financial assets and liabilities measured on a recurring basis.
Buildings and Other Property
Buildings and other property are carried at cost less accumulated depreciation and amortization. Improvements that extend the estimated useful life of an asset are capitalized. Internally developed software is capitalized in accordance with the Financial Accounting Standards Board’s (FASB) Accounting Standard Codification (ASC), ASC 350-40, Internal-Use Software and ASC 350-50, Website Development Costs. Software that will be included in a product or service or developed for resale purposes is recorded in accordance with ASC 985-20, Costs of Software to Be Sold, Leased, or Marketed.
Assets are amortized on a straight-line basis over the useful life of the asset. One-half year’s depreciation or amortization is taken in the year an asset is placed in service. Useful lives range from 3 to 15 years for computer equipment and software; 3 to 45 years for buildings and improvements; and 3 to 10 years for furniture, fixtures, and office equipment. Repairs and maintenance costs are charged to expense as incurred.
Long-Lived Assets
Long-lived assets are reviewed for impairment whenever events or changes in circumstances indicate that the carrying amount of an asset may not be recoverable.
Member Insurance Program
The Society maintains a separate Member Insurance Program, the American Chemical Society Insurance Trust (the Insurance Trust), which provides members with insurance coverage through several group insurance policies. The Insurance Trust currently maintains group insurance policies that provide term life, accidental death and dismemberment, hospital indemnity, long-term disability, long-term care, excess major medical, short-term medical, supplemental Medicare, auto, homeowners, and professional liability insurance coverage. Insurance carriers underwrite these policies while third-party administrators handle the processing and administration of claims.
The Insurance Trust generates revenue from premiums received from program participants, refunds from the insurance carrier based on favorable claims experience, endorsement fees, interest and dividends earned on investments, and interest income earned on reserves held by the insurance carrier to ensure the stability of the program. The Insurance Trust’s expenses include the cost of purchasing group insurance policies, as well as the cost of administering the program.

9
The Insurance Trust accounted for a $1,787,000 increase and $6,342,000 decrease in the Society’s unrestricted net assets for the years ended December 31, 2016 and 2015, respectively. The Insurance Trust accounts for $40,820,000 and $39,033,000 of the Society’s total unrestricted net assets in the consolidated statements of financial position as of December 31, 2016 and 2015, respectively. The activities of the Insurance Trust are included in ACS Programs in the consolidated statements of activities.
Contributions and Net Assets
Contributions are considered to be available for unrestricted use unless specifically restricted by the donor. Amounts received that are designated for future periods, or are restricted by the donor for specific purposes, are reported as temporarily restricted or permanently restricted.
A donor restriction expires when a stipulated time restriction ends or when a purpose restriction is accomplished. Upon expiration, temporarily restricted net assets are reclassified to unrestricted net assets and are reported in the consolidated statements of activities as net assets released from restriction. Restricted contributions received in the same year in which the restrictions are met are recorded as an increase to restricted net assets at the time of receipt and as net assets released from restriction.
Donor restrictions that permanently limit the use of contributed assets are classified as permanently restricted support. Income earned on permanently restricted assets is recorded in accordance with the donor ’s designation. Income that is permanently restricted by the donor is reported as permanently restricted. Income designated as restricted for a future period or for a specific purpose is reported as temporarily restricted and released when the restriction is met, as approved by the Board of Directors.
Revenue Recognition
Printed Materials and Electronic Information Services - Revenue from the sale of printed materials and electronic information services is recognized when the printed product is shipped or when the electronic information service is provided to the customer. Subscription revenue from the sale of printed materials and electronic subscriptions is recognized ratably over the term of the subscription. Subscription revenue billed in advance or cash collected in advance is deferred.
Dues and Subscriptions for Future Periods - The Society renews dues and subscription agreements each year for services to be rendered and publications to be delivered in future periods. These amounts are included in deferred revenue in the accompanying consolidated statements of financial position and are recognized ratably over the membership period or the term of the service.
Advertising Revenue - The Society recognizes advertising revenue over the period the advertisement is run. For print advertising, this is based on release of the journal or publication; for Internet advertising, it is based on the time period of the campaign.
Government Grants and Contracts - Revenue from government contracts is derived from fixed-price arrangements and is recognized based on labor hours expended times a fixed-price rate per hour. Revenue from government grants is recognized as allowable costs are incurred. Both government grants and contracts are subject to audit by federal agencies. Grant and contract revenue is included in other revenues in the accompanying consolidated statements of activities.
Expenses
The cost of programs and supporting activities is summarized by functional classification in the consolidated statements of activities. Accordingly, certain costs have been allocated among program activities and supporting services based on specific identification or appropriate allocation methodologies.
Supporting expenses identified as other in the consolidated statements of activities include expenses associated with the Society’s web strategy and operations, the investment program, and fundraising activities.
Income Taxes
The Society is generally exempt from federal income taxes under Internal Revenue Code Section 501(c)(3). However, the Society is subject to taxation on any net unrelated business income. At December 31, 2016, the Society had a net operating loss carryforward for income tax purposes of approximately $16,300,000, which expires over

10
the years 2017 through 2036. A deferred tax asset has not been recorded for the net operating loss because the Society has determined as of December 31, 2016, it is not recoverable.
Management annually reviews its tax positions and has determined that there are no material uncertain tax positions that require recognition in the consolidated financial statements.
Petroleum Research Fund
The American Chemical Society Petroleum Research Fund is an endowment fund established on October 25, 2000 as a result of The Agreement of Transfer of Trust (Agreement) between the Society and Morgan Guaranty Trust Company of New York, approved by the Attorney General for the State of New York, and ordered by the Supreme Court of New York. The Agreement dissolved the Petroleum Research Fund Trust (the Trust) and transferred the assets to the Society to create the American Chemical Society Petroleum Research Fund (the Fund), the purpose of which is the same as the Trust. The Agreement made the Society responsible for the management and administration of the Fund in an account separate and apart from any other accounts of the Society. As a result of the transfer, the historic dollar value for the Fund was established at $72,500,000, the value of the securities originally donated in 1944 to create the Trust. This amount must be held inviolate as permanently restricted assets.
The assets of the Fund consist primarily of domestic equities, foreign equities, fixed income securities and hedge funds. Under the terms of the Agreement, annual payouts from the Fund are capped at a maximum spending rate of 5% of the net asset value of the Fund over a rolling three-year average. The Society uses distributions from the Fund to make grants for advanced scientific education and fundamental research in the petroleum field. Grants are expensed when awarded by the Society’s Board of Directors and accepted by the recipient. The Fund awarded $20,183,000 in 2016 and $18,550,000 in 2015.
Risks and Uncertainties
Concentration of Credit Risk – The Society is subject to potential concentrations of credit risk in its cash and cash equivalents and investments. Noninterest-bearing deposits in financial institutions insured by the Federal Deposit Insurance Corporation (FDIC) were insured up to a maximum of $250,000 at December 31, 2016 and 2015. Investments at other financial institutions were insured by the Securities Investor Protection Corporation (SIPC) up to $500,000, which includes a $250,000 limit for cash. At December 31, 2016 and 2015, the aggregate balances were in excess of the insurance and, therefore, pose some risk since they are not collateralized. The Society has historically not experienced any losses on its cash and cash equivalents and investments in relation to FDIC and SIPC insurance limits.
Capital Market Risk – The Society invests in domestic equities, foreign equities, and fixed income securities, which are subject to market risk and may result in gains or losses due to changes in market value. In addition, the Society utilizes futures and options to hedge changes in the market value of underlying investments, and forward contracts to hedge changes in the value of revenue denominated in foreign currencies. These financial instruments are also subject to market risk and may result in gains or losses; however, they are not used to leverage market exposure, and any such gains or losses would be largely offset by changes in the market value of the underlying investments or foreign currencies.
Foreign Currency Risk – Portions of the Society’s revenues and expenditures are in foreign currencies. The Society enters into foreign currency forward contracts to reduce the risk that exchange rate fluctuations will adversely impact the U.S. dollar value of future net revenue denominated in foreign currency.
Counterparty Risk – The Society enters into derivative instruments with counterparties. While there is risk that the counterparties may fail to meet their obligations, the Society does not have significant positions with any one counterparty.
Insurance Risk – Given the uncertainty of claims experience in any given year and the resulting impact on the level of experience refunds from the insurance carrier, the Insurance Trust can have either a positive or a negative impact on the Society’s consolidated statements of activities.

11
Recent Accounting Pronouncements
In 2016, the Society retroactively adopted the provisions of Accounting Standards Update (ASU) No. 2015-10, Technical Corrections and Improvements. This ASU clarified one aspect of the definition of readily determinable fair value (RDFV), thereby affecting the measurement of and disclosure about certain equity instruments. During 2016, management evaluated its investments historically measured using NAV as a practical expedient in structures with characteristics similar to a mutual fund to determine whether they have a RDFV. Society investments of $308,580,000, previously presented using NAV as a practical expedient as of December 31, 2015 and excluded from the fair value hierarchy, were determined to meet the technical definition of RDFV. Of this amount, $170,000 has been classified as Level 1 investments and $308,410,000 as Level 2. This is consistent with the December 31, 2016 presentation. The Society performed a similar analysis on the investments in the Society’s defined-benefit pension plan. Pension plan investments totaling $96,301,000, previously presented using NAV as a practical expedient as of December 31, 2015, were determined to meet the technical definition of RDFV and the entire amount has been classified as Level 2 investments. This is consistent with the December 31, 2016 presentation.
3. ACCOUNTS RECEIVABLE
Accounts receivable consisted of the following at December 31 (in thousands):
2016 2015
Accounts Receivable 148,380$ 127,126$
Less Allowance for Doubtful Receivables 2,106 2,004
Accounts Receivable, Net 146,274$ 125,122$
Accounts receivable from subscribers related to the next calendar year journal subscriptions billed before December 31, 2016 and 2015 were $88,240,000 and $75,838,000, respectively.
4. INVESTMENTS AND FAIR VALUE OF FINANCIAL INSTRUMENTS
The following tables summarize the Society’s investments and other financial instruments measured at fair value on a recurring basis according to the classification hierarchy as of December 31, 2016 and 2015 (in thousands):
Investments
Measured at
NAV (1) Level 1 Level 2 Level 3 Total
Cash Equivalents -$ 34,008$ -$ -$ 34,008$ Deferred Compensation Plan Assets - 7,751 796 - 8,547 Foreign Currency Forward Contracts - - 5,348 - 5,348 Investments:
Cash Equivalents - 14,245 13,081 - 27,326 Fixed Income:
U.S. government and agencies - 83,847 54,820 - 138,667 Foreign - - 25,802 - 25,802 Corporate and Other 903 21,418 172,046 - 194,367
Equity:Domestic - 83,609 246,729 - 330,338 Foreign 107,695 10,178 48,927 - 166,800
Hedge Funds 144,298 - - - 144,298 Unsettled Transactions, Net - (39,845) - - (39,845)
Total Investments 252,896 173,452 561,405 - 987,753
Total Financial Instruments 252,896$ 215,211$ 567,549$ -$ 1,035,656$
December 31, 2016

12
Investments
Measured at
NAV (1) Level 1 Level 2 Level 3 Total
Cash Equivalents -$ -$ 22,877$ -$ 22,877$ Deferred Compensation Plan Assets - 7,091 653 - 7,744 Foreign Currency Forward Contracts - - 3,836 - 3,836 Investments:
Cash Equivalents 105 10,397 14,306 - 24,808 Fixed Income:
U.S. government and agencies - 90,167 44,550 - 134,717 Foreign - 11 26,363 - 26,374 Corporate and Other 2,091 19,651 164,256 - 185,998
Equity:Domestic - 95,616 243,158 - 338,774 Foreign 96,907 18,245 42,792 - 157,944
Hedge Funds 144,366 - - - 144,366 Unsettled Transactions, Net - (29,294) - - (29,294)
Total Investments 243,469 204,793 535,425 - 983,687
Total Financial Instruments 243,469$ 211,884$ 562,791$ -$ 1,018,144$
December 31, 2015
(1) Certain investments are measured at fair value using NAV as a practical expedient and have not been classified in the fair value hierarchy. The NAV amounts have been presented to permit reconciliation of the fair value hierarchy to the amounts presented in the statements of financial position.
The following estimates and assumptions were used to determine the fair value of financial instruments within the fair value hierarchy:
Cash equivalents – Cash equivalents consist of money market funds, commercial paper, and cash collateral held by custodians. Money market funds and commercial paper are classified as Level 2 given that they are valued at amortized cost, which approximates fair value. Cash collateral held by custodians is classified as Level 2 based on prices for similar assets.
Deferred compensation plan assets – The Society offers a non-qualified tax-advantaged deferred-compensation retirement plan to certain employees per Section 457 of the Internal Revenue Code. Assets of the plan comprise 25 mutual funds that are actively traded on major exchanges, 24 of which are classified as Level 1. The remaining fund is a money market fund that values securities at amortized cost, which approximates fair value, and is classified as Level 2.
Foreign currency forward contracts – Foreign currency forward contracts are derivative instruments and recognized at fair value based on quoted prices, in active markets, for similar contracts and are classified as Level 2.
Fixed income securities – Fixed income securities primarily include U.S. Treasury issues, U.S. government and agency issues, corporate securities, mortgage-backed securities, asset-backed securities, municipal bonds, fixed income mutual funds, and credit default swaps. U.S. Treasury issues and certain fixed income mutual funds are valued using quoted prices in active markets for identical assets and are classified as Level 1. The remainder of this investment class is valued using quoted prices in active markets for similar securities and is classified as Level 2. Fair values of investments in commingled funds, similar to mutual funds, that are deemed to have a readily determinable fair value are measured at published NAV and are classified as Level 2.
Equity investments – Equity investments consist primarily of common stock held in mutual funds, separate accounts, and commingled trust funds. Securities traded on active exchanges are priced using unadjusted market quotes for identical assets and are classified as Level 1. Securities that are traded infrequently or that have comparable traded assets are priced using available quotes and other market data that are observable and are classified as Level 2. Fair values of investments in commingled funds, similar to mutual
13
funds, that are deemed to have a readily determinable fair value are measured at published NAV and are classified as Level 2.
Unsettled transactions, net – Unsettled transactions consist primarily of investment purchases or sales transactions, including foreign currency forward contracts and forward purchase and sales contracts for securities that have not settled as of December 31. Fair value is based on the underlying security in an active market and is classified as Level 1. Unsettled transactions were $126,230,000 and $86,385,000, respectively, as of December 31, 2016, and $70,109,000 and $40,815,000, respectively, as of December 31, 2015.
As of December 31, 2016 and 2015, there were no financial instruments measured on a non-recurring basis.
The Society maintains balanced investment portfolios structured to generate current income and long-term appreciation. Investment management fees are netted against investment income, and these amounts totaled $1,075,000 and $1,185,000 for the years ended December 31, 2016 and 2015, respectively.
Liquidity and Certain Strategies
Investment liquidity of investments measured at NAV is aggregated below based on redemption or sale periods (in thousands):
Less Than 30
Days Quarterly > 1 Year Total
Fixed Income:Corporate and Other 903$ - - 903$
Equity:Foreign 107,695 - - 107,695
Hedge Funds - 95,895 48,403 144,298
Total Investments 108,598$ 95,895$ 48,403$ 252,896$
December 31, 2016
Less Than 30
Days Quarterly > 1 Year Total
Cash Equivalents 105$ - - 105$ Fixed Income:
Corporate and Other 2,091 - - 2,091 Equity:
Foreign 96,907 - - 96,907 Hedge Funds - 92,666 51,700 144,366
Total Investments 99,103$ 92,666$ 51,700$ 243,469$
December 31, 2015
The Society’s investments, carried at NAV as a practical expedient, include commingled funds (both fixed income and equity) and hedge funds. The commingled funds have redemption notice periods of 1-5 days and the hedge funds have 65-day and 100-day redemption notice periods. The Society does not have any unfunded commitments as of December 31, 2016 or 2015. The significant strategies of the commingled funds and hedge funds follow:
Fixed income and equity commingled funds – are similar to mutual funds except that of an institutional investor class. Fixed income funds invest in securities to generate a total return, consisting of income and capital appreciation, while preserving capital. Equity investment funds invest in securities to achieve long-term growth primarily in a diversified portfolio of global equity securities that possess fundamental investment value.

14
Hedge funds – includes two investments in fund of hedge funds that each contain 15 to 30 underlying hedge funds. The underlying hedge funds employ a variety of different strategies including long/short equity, fixed income arbitrage, distressed debt, credit and capital structure arbitrage, merger arbitrage, volatility arbitrage, and global asset allocation.
Investment Derivatives
The Society’s investment managers may employ derivatives in order to manage market risks, arbitrage mispricing of securities, or replicate long or short positions in a cost effective manner. In no instance are derivatives used to speculate or leverage positions.
All derivative instruments are carried at fair value and are reported net in investments on the consolidated statements of financial position. The derivatives are held with 14 different counterparties and are subject to master netting agreements. The master netting agreements allow the Society to offset net positions by counterparty and available collateral held.
The following tables provide the fair value of investment derivatives as of December 31, 2016 and 2015 and gains and losses for the years ended December 31, 2016 and 2015 (in thousands):
2016
Assets Liabilities Gains (Losses)
Derivatives:
Foreign Currency Contracts 23,061$ (22,944)$ 118$
Credit Default Swaps 484 (19) 149
Interest Rate Swaps 831 (188) 534
Financial Futures and other 41 (84) (4)
Total Derivatives 24,417$ (23,235)$ 797$
2015
Assets Liabilities Gains (Losses)
Derivatives:
Foreign Currency Contracts 19,436$ (19,542)$ (106)$
Credit Default Swaps 124 (3) (16)
Interest Rate Swaps 56 (340) (224)
Financial Futures and other - (42) 10
Total Derivatives 19,616$ (19,927)$ (336)$
As of December 31, 2016 and 2015, the foreign currency contracts had a notional value of $22,982,000 and $19,469,000, respectively.
As of December 31, 2016 and 2015, the total notional amount of credit default swap contracts for sell protection amounted to $28,840,000 and $2,400,000, respectively. There were no buy protection credit default swaps as of December 31, 2016; the notional amount related to buy protection credit default swap contracts was $10,900,000 as of December 31, 2015.
The notional amounts related to interest rate swap contracts that pay based on fixed rates at December 31, 2016 and 2015 was $213,300,000 and $201,500,000, respectively. There were no notional amounts related to interest rate swap contracts that pay based on floating rates at December 31, 2016 and 2015.
Financial futures contracts had a notional value of $15,742,000 and $22,657,000 at December 31, 2016 and 2015, respectively.

15
Other Derivative Instruments
Foreign Currency Forward Contracts - The Society had an unrealized gain of $775,000 and an unrealized loss of $4,693,000 for the years ended December 31, 2016 and 2015, respectively. The unrealized losses/gains are included in net investment losses/gains from non-operating activity in the consolidated statements of activities.
The Society’s foreign currency forward contracts are held with one counterparty and are subject to a master netting agreement, which allows for net settlement of positions with the counterparty. The foreign currency forward contracts are presented net in the consolidated statements of financial position within accounts receivable, accounts payable, and deferred revenue. The fair value of the foreign currency forward contracts as of December 31, 2016 and 2015 was as follows (in thousands):
Assets Liabilities Net
Foreign Currency Forwards 5,724$ (376)$ 5,348$
Assets Liabilities Net
Foreign Currency Forwards 4,418$ (582)$ 3,836$
2016
2015
The following table summarizes the notional amounts relating to unsettled foreign currency forward contracts maturing at various times through 2019 (in thousands):
2016 2015
Contracts maturing in 2016 -$ 46,495$ Contracts maturing in 2017 56,411 20,539 Contracts maturing in 2018 35,106 2,124 Contracts maturing in 2019 6,141 -
Total Notional Amount of Unsettled Forward Contracts 97,658$ 69,158$
In addition to unrealized gains and losses on foreign currency forward contracts, the Society incurred realized gains and losses throughout the year. To the extent that actual remittances in foreign currencies differ from contracted amounts and the exchange rates at time of settlement are different from contracted exchange rates, the Society realizes gains or losses on settlement. The Society recorded realized gains of $773,000 and losses $231,000 in 2016 and 2015, respectively, from foreign exchange transactions. The realized gains and losses are included in information services expenses in the consolidated statements of activities.
5. BUILDINGS AND OTHER PROPERTY
At December 31, buildings and other property consisted of the following (in thousands):
2016 2015
Computer Equipment and Software 196,105$ 178,500$ Buildings and Improvements 106,783 114,337 Furniture, Fixtures, and Office Equipment 21,076 28,602 Land 2,930 2,930
Total Cost of Buildings and Other Property 326,894 324,369
Less Accumulated Depreciation and Amortization 209,716 214,523
Buildings and Other Property, Net 117,178$ 109,846$

16
6. POSTRETIREMENT BENEFITS
Defined-Benefit Pension Plan - The Society has a funded noncontributory defined-benefit pension plan (the Plan), which is qualified under Section 401(a) of the Internal Revenue Code and covers employees hired prior to September 1, 2007. The Society makes actuarially determined contributions to satisfy all funding requirements. Effective September 1, 2007, the Plan was closed to new employees. Effective October 31, 2009, the Society froze benefit accruals associated with the Plan, and all participants were transitioned to a defined-contribution retirement plan.
Defined-Contribution Retirement Plan (DCRP) and ACS ERISA 403(b) Plans – The Society’s 401(a) DCRP and the ACS ERISA 403(b) Plans are available to substantially all employees. The DCRP provides an employer contribution equal to 6% of base pay, plus an employer match equal to 50% of the first 6% a participant contributes to the DCRP and/or the ACS ERISA 403(b) Plan, a tax-deferred investment program. Employer contributions to the DCRP totaled $14,981,000 and $15,111,000 in 2016 and 2015, respectively.
Postretirement Medical Plan – The Society provides postretirement medical benefits to all benefit-eligible employees who were employed as of October 31, 2001, have at least five years of service, reach retirement age while employed by the Society, and are collecting retirement benefits from the defined-benefit pension plan. The postretirement medical plan is contributory with participants’ contributions adjusted annually. The Plan’s prescription benefit is actuarially equivalent to Medicare Part D and eligible for the federal subsidy. The Society’s contributions toward the overall cost of postretirement medical insurance for both current and future eligible retirees were capped at the 2009 level.
Effective January 1, 2016, the Society adopted a Medicare Advantage Plan for eligible retirees and spouses who are at least 65 years old. The Medicare Advantage Plan continues to provide eligible retirees with an option for medical coverage. Transitioning to the Medicare Advantage Plan lowered the overall cost of the postretirement medical plan and reduced the Plan’s Accumulated Postretirement Benefit Obligation (APBO) by approximately $9 million at December 31, 2015.
The following tables present the change in benefit obligations, change in plan assets, and the composition of accrued benefit costs and amounts recognized in the accompanying consolidated statements of financial position and consolidated statements of activities for the years ended December 31, 2016 and 2015 (in thousands).

17
Defined-Benefit Pension and Postretirement Medical Plans
PostretirementPension Plan Medical Plan
2016 2015 2016 2015
Change in Benefit Obligation
Benefit Obligation at January 1 693,287$ 750,685$ 46,529$ 58,326$
Service Cost - - 662 883
Interest Cost 29,727 29,695 1,941 2,262
Plan Participants' Contributions - - 1,673 1,406
Actuarial Loss (Gain) 11,495 (52,750) 135 (1,945)
Plan Change - - - (9,215)
Benefits and Administrative Fees Paid (35,221) (34,343) (4,101) (5,188)
Benefit Obligation at December 31 699,288 693,287 46,839 46,529
Change in Fair Value of Plan Assets
Plan Assets at January 1 565,011 601,534 - -
Actual Return (Loss) on Plan Assets 47,050 (14,180) - -
Employer Contributions 12,000 12,000 2,428 3,781
Plan Participants' Contributions - - 1,673 1,406
Benefits and Administrative Fees Paid (35,221) (34,343) (4,101) (5,187)
Plan Assets at December 31 588,840 565,011 - -
Funded Status (110,448)$ (128,276)$ (46,839)$ (46,529)$
Amounts Recognized in the Consolidated
Statements of Financial Position
Current Liabilities -$ -$ (3,137)$ (3,034)$
Noncurrent Liabilities (110,448) (128,276) (43,702) (43,495)
Net Liability at December 31 (110,448)$ (128,276)$ (46,839)$ (46,529)$
Defined-Benefit
Postretirement
Pension Plan Medical Plan
2016 2015 2016 2015
Amounts Recognized in Unrestricted Net
Assets not yet in Net Periodic Costs
Unrecognized Loss 246,467$ 255,637$ 30,945$ 33,883$
Unrecognized Prior Service Credit - - (15,613) (22,288)
Net Recognized in Unrestricted Net Assets 246,467$ 255,637$ 15,332$ 11,595$
Defined-Benefit
The estimated net actuarial loss for the defined-benefit pension plan that will be amortized from non-operating income for 2017 is $6,972.000.
The estimated net actuarial loss and prior service credit for the postretirement medical plan that will be amortized from non-operating income for 2017 are $2,769,000 and $(6,675,000), respectively.

18
Components of Net Periodic Benefit Cost (Credits) for the Year Ended December 31 (in thousands):
PostretirementPension Plan Medical Plan
2016 2015 2016 2015
Service Cost -$ -$ 662$ 883$ Interest Cost 29,727 29,695 1,941 2,262Expected Return on Plan Assets (33,424) (35,630) - - Amortization of Prior Service Credits - - (6,675) (5,573)Amortization of Net Actuarial Loss 7,038 6,875 3,073 3,363
Net Periodic Benefit Cost (Credits) 3,341$ 940$ (999)$ 935$
Defined-Benefit
Other Changes in Plan Assets and Benefit Obligations Recognized in Non-Operating Activities:
The following table provides information for other changes in plan assets and benefit obligations recognized in unrestricted net assets for the years ended December 31 (in thousands):
PostretirementPension Plan Medical Plan
2016 2015 2016 2015
Net Actuarial (Gain) Loss (2,132)$ (2,939)$ 135$ (1,945)$
Amortization of Prior Service Credit - - 6,675 5,573
Amortization of Net Actuarial Loss (7,038) (6,875) (3,073) (3,363)
Prior Service Credit Arising During
Measurement Period - - - (9,215)
Total Recognized in Unrestricted Net Assets (9,170)$ (9,814)$ 3,737$ (8,950)$
Defined-Benefit
Assumptions
Assumptions used to determine benefit obligations at December 31:
Postretirement Pension Plan Medical Plan
2016 2015 2016 2015
Discount Rate 4.14% 4.40% 4.07% 4.31%
Mortality Projection Scales MP-2016 MP-2015 MP-2016 MP-2015
Defined-Benefit
Annually, the Society of Actuaries (SOA) issues, and the Society adopts, updated mortality projection scales. The Society adopted MP-2015 effective December 31, 2015, which lowered the defined-benefit pension plan’s Projected Benefit Obligation (PBO) by $15,045,000, and reduced the APBO of the postretirement medical plan by $1,048,000.
Assumptions used to determine net periodic benefit cost for the years ended December 31:
Postretirement Pension Plan Medical Plan
2016 2015 2016 2015
Discount Rate 4.40% 4.05% 4.31% 3.99%
Expected Return on Plan Assets 6.00% 6.00% N/A N/A
Defined-Benefit
The Society determines the long-term expected rate of return on plan assets by examining historic capital market returns, correlations between asset classes, and the Plan’s normal asset allocation. Current and near-term market factors such as inflation and interest rates are then evaluated to arrive at the expected return on plan assets. Peer group and benchmarking data are also reviewed to ensure a reasonable return assumption.
19
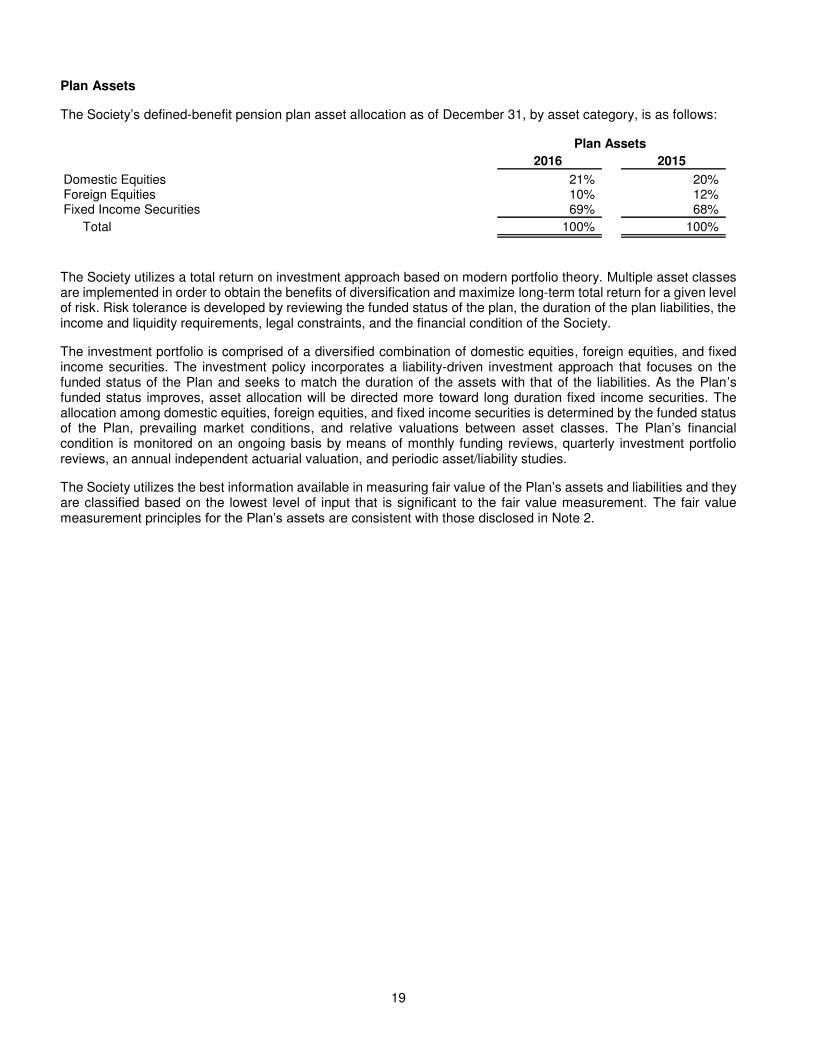
Plan Assets
The Society’s defined-benefit pension plan asset allocation as of December 31, by asset category, is as follows:
Plan Assets
2016 2015
Domestic Equities 21% 20%Foreign Equities 10% 12%Fixed Income Securities 69% 68%
Total 100% 100%
The Society utilizes a total return on investment approach based on modern portfolio theory. Multiple asset classes are implemented in order to obtain the benefits of diversification and maximize long-term total return for a given level of risk. Risk tolerance is developed by reviewing the funded status of the plan, the duration of the plan liabilities, the income and liquidity requirements, legal constraints, and the financial condition of the Society.
The investment portfolio is comprised of a diversified combination of domestic equities, foreign equities, and fixed income securities. The investment policy incorporates a liability-driven investment approach that focuses on the funded status of the Plan and seeks to match the duration of the assets with that of the liabilities. As the Plan’s funded status improves, asset allocation will be directed more toward long duration fixed income securities. The allocation among domestic equities, foreign equities, and fixed income securities is determined by the funded status of the Plan, prevailing market conditions, and relative valuations between asset classes. The Plan’s financial condition is monitored on an ongoing basis by means of monthly funding reviews, quarterly investment portfolio reviews, an annual independent actuarial valuation, and periodic asset/liability studies.
The Society utilizes the best information available in measuring fair value of the Plan’s assets and liabilities and they are classified based on the lowest level of input that is significant to the fair value measurement. The fair value measurement principles for the Plan’s assets are consistent with those disclosed in Note 2.

20
The following tables summarize valuations of the Society’s defined-benefit pension plan assets according to the fair value hierarchy as of December 31, 2016 and 2015 (in thousands):
December 31, 2016
Investments
Measured at
NAV (1) Level 1 Level 2 Level 3 Total
Cash Equivalents 9,027$ -$ 5,531$ -$ 14,558$ Fixed Income:
U.S. government and agencies - 143,768 3,975 - 147,743 Foreign - - 53,913 - 53,913 Corporate and Other 35,903 - 205,670 - 241,573
Equity:Domestic - 42,795 77,039 - 119,834 Foreign 36,422 3,955 21,115 - 61,492
Unsettled Transactions, Net - (50,273) - - (50,273)
Net Plan Assets 81,352$ 140,245$ 367,243$ -$ 588,840$
December 31, 2015
Investments
Measured at
NAV (1) Level 1 Level 2 Level 3 Total
Cash Equivalents 7,782$ -$ 2,026$ -$ 9,808$ Fixed Income:
U.S. government and agencies - 125,388 - - 125,388 Foreign - - 42,195 - 42,195 Corporate and Other 13,216 - 198,925 - 212,141
Equity:Domestic - 37,359 85,120 - 122,479 Foreign 42,318 4,144 24,476 - 70,938
Unsettled Transactions, Net - (17,938) - - (17,938)
Net Plan Assets 63,316$ 148,953$ 352,742$ -$ 565,011$
(1) Certain investments are measured at fair value using NAV as a practical expedient and have not been classified in the fair value hierarchy. The NAV amounts have been presented to permit reconciliation of the fair value hierarchy to the amounts reported as total plan assets.
Unsettled transactions consist primarily of purchases and sales of securities pending settlement of $79,823,000 and $29,550,000, respectively, as of December 31, 2016, and $27,348,000 and $9,410,000, respectively, as of December 31, 2015.
Liquidity and Certain Strategies
Plan assets, inclusive of investments stated at NAV as a practical expedient, have redemption liquidity of less than 30 days with no significant notice periods. The plan has no investment funding commitments.
Derivatives
The Plan’s fixed income investment manager may employ derivatives in order to manage market risks, arbitrage mispricing of securities, or replicate long or short positions in a cost effective manner. In no instance are derivatives used to speculate or leverage positions.

21
The following tables provide the fair value of plan asset derivative agreements as of December 31, 2016 and 2015, and gains and losses for the years ended December 31, 2016 and 2015 (in thousands):
2016
Assets Liabilities Gains/(Losses)Derivatives:
Foreign Currency Contracts 8,538$ (8,463)$ 75$ Credit Default Swaps 993 (731) 316 Interest Rate Swaps 7,859 (199) 15,413 Financial Futures and other 5,924 (7,510) (1,227)
Total Derivatives 23,314$ (16,903)$ 14,577$
2015
Assets Liabilities Gains/(Losses)Derivatives:
Foreign Currency Contracts 12,379$ (12,226)$ 152$ Credit Default Swaps 983 (1,530) (1,063) Interest Rate Swaps 152 (3,576) (2,307) Financial Futures and other 1,813 (1,587) 501
Total Derivatives 15,327$ (18,919)$ (2,717)$
As of December 31, 2016 and 2015, the foreign currency contracts had a notional value of $8,458,000 and $12,378,000, respectively.
There were no buy protection credit default swaps as of December 31, 2016. The total notional amount of credit default swap contracts for buy protection as of December 31, 2015 amounted to $43,550,000. The notional amount related to sell protection amounted to $79,148,000 and $76,293,000, as of December 31, 2016 and 2015, respectively.
The notional amount of interest rate swap contracts that pay based on fixed rates at December 31, 2016 and 2015 was $175,700,000 and $200,200,000, respectively. There were $55,900,000 notional amounts related to interest rate swap contracts that pay based on floating rates at December 31, 2015. There were no notional amounts related to interest rate swaps that pay based on floating rates for 2016. Financial futures had a notional value of $59,376,000 and $260,041,000 at December 31, 2016 and December 31, 2015, respectively.
The Plan does not have significant positions with any one counterparty.
Cash Contribution - The Society expects to contribute $12,000,000 to the Plan in 2017.
Projected Benefit Payments - The Society expects the Plans to make the following benefit payments in future years (in thousands):
Defined-Benefit PostretirementPension Medical
Payments Payments
Fiscal year 2017 36,903$ 3,139$ Fiscal year 2018 38,144 3,165 Fiscal year 2019 39,326 3,184 Fiscal year 2020 40,447 3,195 Fiscal year 2021 41,287 3,177
Fiscal years 2022–2026 217,515 15,588

22
7. RESTRICTED NET ASSETS
Temporarily restricted net assets at December 31 were available for the following programs (in thousands):
2016 2015
Petroleum Research Fund 450,185$ 457,546$ Grants and Awards 37,028 36,144 Membership and Scientific Advancement 2,183 2,506 Education 1,815 976 Other 27 60
Total Temporarily Restricted Net Assets 491,238$ 497,232$
Temporarily restricted net assets were released from restriction for the following programs by incurring expenses satisfying the purposes specified by the donors during the years ended December 31 (in thousands):
2016 2015
Petroleum Research Fund 24,726$ 23,226$ Education 3,055 2,133 Grants and Awards 2,417 3,188 Membership and Scientific Advancement 1,367 1,243 Other 106 1
Total Net Assets Released from Restriction 31,671$ 29,791$
Permanently restricted net assets are invested in perpetuity. The income generated by these assets is used to support donor-specified programs or general activities of the Society. At December 31, the Society held the following permanently restricted net assets, the income from which supports the following programs (in thousands):
2016 2015
Petroleum Research Fund 72,500$ 72,500$ Grants and Awards 64,977 63,552 Membership and Scientific Advancement 2,077 1,982
Total Permanently Restricted Net Assets 139,554$ 138,034$
The Society incurred direct fundraising expenses of $1,231,000 in 2016 and $1,104,000 in 2015.
8. ENDOWMENTS
The Society’s Board of Directors has evaluated the Uniform Prudent Management of Institutional Funds Act (UPMIFA) and has decided to continue to require the preservation of the historical cost of the original gift, as of the gift date, of the donor-restricted endowment funds absent explicit donor stipulations to the contrary. As a result, the Society classifies as permanently restricted the original value of gifts donated to permanent endowments, the original value of subsequent gifts to permanent endowments, and accumulations to permanent endowments made in accordance with explicit donor instructions stipulated in the gift instruments. The remaining portions of the donor-restricted endowment funds that are not classified as permanently restricted are classified as temporarily restricted until those amounts are made available for expenditure in a manner consistent with the donor gift instrument, the program operating budgets, and the standard of prudence prescribed by UPMIFA. In accordance with UPMIFA, the Society considers the following factors in making a determination as to the preservation and use of the donor-restricted endowment funds:
The donor gift instrument
The duration and preservation of the fund
The purposes of the Society and the fund
General economic conditions
The possible effect of inflation and deflation

23
The expected total return from income and the appreciation of investments
Other resources of the Society
The Society’s investment policies
Donor-restricted endowment funds are invested in accordance with the Society’s investment policies. The investment policies are intended to assure the Society’s Board of Directors and the Board Committee on Pensions and Investments that the assets of the Society are being invested in accordance with the best long-term interests of the Society and its donors, given the following considerations:
The Society’s risk tolerance
The Society’s need to obtain real, or inflation-adjusted, growth in its investments
The Society’s requirement for current income to support programs and activities
The Society adopted investment policies for endowment assets that attempt to generate a sufficient level of funding for programs supported by endowments. Endowment assets include those assets of donor-restricted funds that the Society must hold in perpetuity or for a donor-specified period or purpose. Under the policies, as approved by the Board Committee on Pensions and Investments, endowment assets are invested in a manner intended to provide sufficient inflation-adjusted returns to support annual spending policies and achieve real growth in the asset base while maintaining a moderate level of investment risk.
To satisfy its long-term rate-of-return objectives, the Society relies on a total return strategy in which investment returns are achieved through both capital appreciation (realized and unrealized) and current yield (interest and dividends). The Society targets a diversified asset allocation that places a greater emphasis on equity-based investments to achieve its long-term return objectives within prudent risk constraints.
Funds are appropriated from the endowment funds when expenses are approved by management. Expenditures of endowment assets are recorded in accordance with the explicit donor instructions stipulated in the gift instruments.
The Society has 31 donor-restricted endowment funds established for a variety of purposes. As required by U.S. generally accepted accounting principles, net assets associated with the donor-restricted endowment funds are classified and reported based on the existence or absence of donor-imposed restrictions. In accordance with these principles, the Society has permanently and temporarily restricted endowment funds.
In 2015, a donor modification to an endowment resulted in a transfer of $11,468,000 from permanently restricted net assets to temporarily restricted net assets.
24
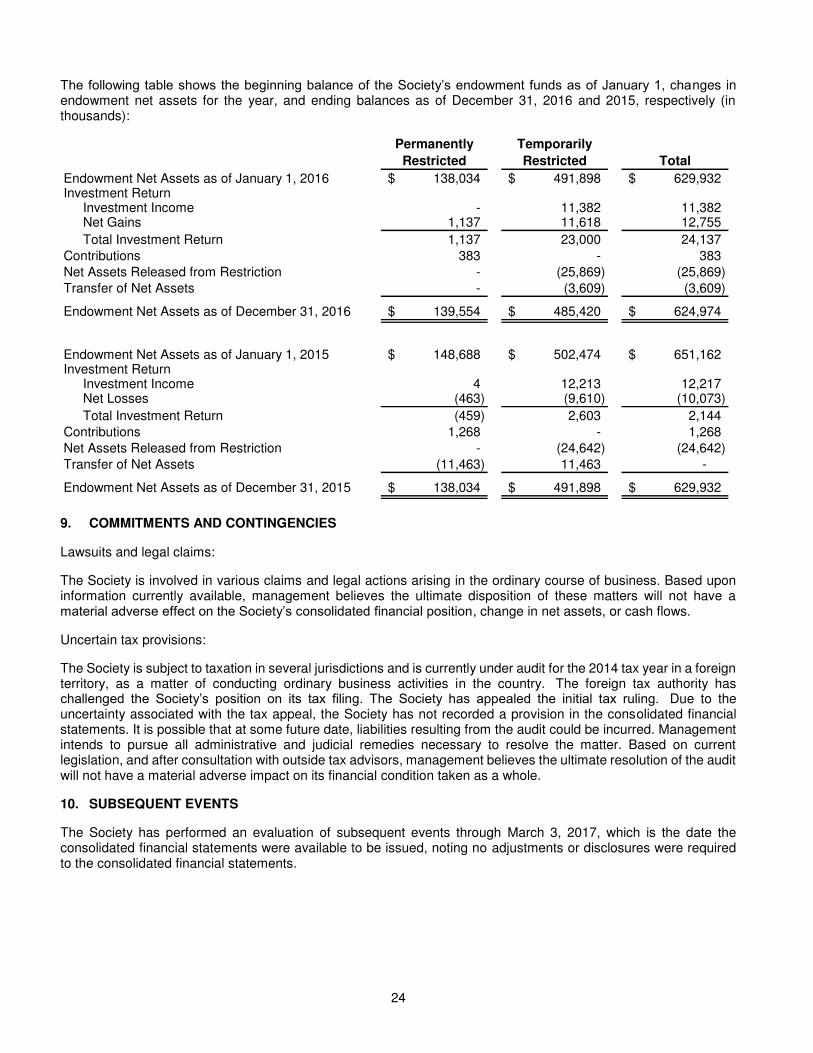
The following table shows the beginning balance of the Society’s endowment funds as of January 1, changes in endowment net assets for the year, and ending balances as of December 31, 2016 and 2015, respectively (in thousands):
Permanently
Restricted
Temporarily
Restricted Total
Endowment Net Assets as of January 1, 2016 138,034$ 491,898$ 629,932$ Investment Return
Investment Income - 11,382 11,382 Net Gains 1,137 11,618 12,755
Total Investment Return 1,137 23,000 24,137
Contributions 383 - 383
Net Assets Released from Restriction - (25,869) (25,869)
Transfer of Net Assets - (3,609) (3,609)
Endowment Net Assets as of December 31, 2016 139,554$ 485,420$ 624,974$
Endowment Net Assets as of January 1, 2015 148,688$ 502,474$ 651,162$ Investment Return
Investment Income 4 12,213 12,217 Net Losses (463) (9,610) (10,073)
Total Investment Return (459) 2,603 2,144
Contributions 1,268 - 1,268
Net Assets Released from Restriction - (24,642) (24,642)
Transfer of Net Assets (11,463) 11,463 -
Endowment Net Assets as of December 31, 2015 138,034$ 491,898$ 629,932$
9. COMMITMENTS AND CONTINGENCIES
Lawsuits and legal claims:
The Society is involved in various claims and legal actions arising in the ordinary course of business. Based upon information currently available, management believes the ultimate disposition of these matters will not have a material adverse effect on the Society’s consolidated financial position, change in net assets, or cash flows.
Uncertain tax provisions:
The Society is subject to taxation in several jurisdictions and is currently under audit for the 2014 tax year in a foreign territory, as a matter of conducting ordinary business activities in the country. The foreign tax authority has challenged the Society’s position on its tax filing. The Society has appealed the initial tax ruling. Due to the uncertainty associated with the tax appeal, the Society has not recorded a provision in the consolidated financial statements. It is possible that at some future date, liabilities resulting from the audit could be incurred. Management intends to pursue all administrative and judicial remedies necessary to resolve the matter. Based on current legislation, and after consultation with outside tax advisors, management believes the ultimate resolution of the audit will not have a material adverse impact on its financial condition taken as a whole.
10. SUBSEQUENT EVENTS
The Society has performed an evaluation of subsequent events through March 3, 2017, which is the date the consolidated financial statements were available to be issued, noting no adjustments or disclosures were required to the consolidated financial statements.