Management’s Discussion and...
25
Management’s Discussion and Analysis For the three months ended March 31, 2018 and March 31, 2017 May 1, 2018
-
Upload
phungnguyet -
Category
Documents
-
view
214 -
download
0
Transcript of Management’s Discussion and...

Management’s Discussion and Analysis
For the three months ended March 31, 2018
and March 31, 2017
May 1, 2018
2
TABLE OF CONTENTS
HIGHLIGHTS ................................................................................................................................................ 4
NOTES .......................................................................................................................................................... 4
Q1 2018 SUMMARY ..................................................................................................................................... 4
GOING FORWARD ...................................................................................................................................... 5
DESCRIPTION OF BUSINESS .................................................................................................................... 5
NORTHERN IRELAND PROPERTIES ........................................................................................................ 7
Overview ................................................................................................................................................... 7
Curraghinalt Gold Deposit – Feasibility Study .......................................................................................... 7
Curraghinalt Gold Deposit – 2017 and 2018 Work Programs ................................................................ 13
Curraghinalt Gold Deposit – Permitting .................................................................................................. 14
Regional Exploration – Targeting additional discoveries ........................................................................ 17
Breakdown of Mineral Property under Development .............................................................................. 18
OVERVIEW OF SELECTED INFORMATION FROM THE FINANCIAL STATEMENTS .......................... 19
Results of Operations for the Three Months Ended March 31, 2018, compared to the Three Months
Ended March 31, 2017 ............................................................................................................................ 19
Summary of Quarterly Results ................................................................................................................ 20
FINANCIAL CONDITION, CASH FLOWS, LIQUIDITY AND CAPITAL RESOURCES ............................ 21
Capital Resources ................................................................................................................................... 21
Liquidity ................................................................................................................................................... 21
Working Capital ....................................................................................................................................... 21
Contractual Obligations ........................................................................................................................... 22
Contingent Liability .................................................................................................................................. 22
Off-balance Sheet Arrangements ........................................................................................................... 22
Non-IFRS Measures ............................................................................................................................... 22
FINANCIAL INSTRUMENTS AND RISK MANAGEMENT ........................................................................ 22
OUTSTANDING SHARE DATA ................................................................................................................. 23
FINANCIAL STATEMENTS – CRITICAL ACCOUNTING ESTIMATES ................................................... 24
RECENT ACCOUNTING PRONOUNCEMENTS AND ADOPTION OF NEW AND AMENDED IFRS
STANDARDS .............................................................................................................................................. 24
INTERNAL CONTROL OVER FINANCIAL REPORTING AND DISCLOSURE CONTROLS AND
PROCEDURES ........................................................................................................................................... 25
INDUSTRY AND ECONOMIC FACTORS AFFECTING PERFORMANCE .............................................. 25
RISK FACTORS ......................................................................................................................................... 25
ADDITIONAL INFORMATION.................................................................................................................... 25

3
Caution Regarding Forward-Looking Information
This MD&A (as defined herein) contains “forward looking information” which may include, but is not limited to, statements with respect
to the timing and review process in connection with the Planning Application and PLI (as defined herein), the future financial or
operating performance of the Company (as defined herein) its subsidiaries and its mineral project, the future price of metals, test work
and confirming results from work performed to date, the estimation of mineral resources and mineral reserves, the realization of
mineral resource and mineral reserve estimates, the timing and amount of estimated future production, costs of production, capital,
operating and exploration expenditures, costs and timing of the development of new deposits, costs and timing of future exploration,
requirements for additional capital, government regulation of mining operations, environmental risks, reclamation expenses, title
disputes or claims, limitations of insurance coverage, the timing and possible outcome of pending regulatory matters and the
realization of the expected production, economics and mine life of the Curraghinalt gold deposit. Often, but not always, forward looking
statements can be identified by the use of words and phrases such as “plans”, “expects”, “is expected”, “budget”, “scheduled”,
“estimates”, “forecasts”, “intends”, “anticipates”, or “believes” or variations (including negative variations) of such words and phrases,
or statements that certain actions, events or results “may”, “could”, “would”, “might” or “will” be taken, occur or be achieved.
Forward-looking statements are based on the opinions and estimates of management as of the date such statements are made and
are based on various assumptions, which may include but are not limited to, the continued political stability in Northern Ireland, that
the timing and review process in connection with the Planning Application and PLI remaining in line with expectations, that permits
required for the Company’s operations will be obtained on a timely basis in order to permit Dalradian (as defined herein) to proceed
on schedule with its planned exploration and mine development, construction and production programs, that skilled personnel and
contractors will be available as Dalradian’s operations commence and continue to grow towards production and mining operations,
that the price of gold will be at levels that render Dalradian’s mineral project economic, that the Company will be able to continue
raising the necessary capital to finance its operations and realize on mineral resource and mineral reserve estimates and current mine
plans, that the assumptions contained in the Company’s Technical Report (as defined herein) are accurate and complete and that a
permitting application for mine construction will be approved.
Forward looking statements involve known and unknown risks, uncertainties and other factors which may cause the actual results,
performance or achievements of Dalradian to be materially different from any future results, performance or achievements expressed
or implied by the forward-looking statements. Such factors include, among others, general business, economic, competitive, political
and social uncertainties; the actual results of current and future exploration activities; the actual results of reclamation activities;
conclusions of economic evaluations; meeting various expected cost estimates; changes in project parameters and/or economic
assessments as plans continue to be refined; future prices of metals; possible variations of mineral grade or recovery rates; the risk
that actual costs may exceed estimated costs; failure of plant, equipment or processes to operate as anticipated; accidents, labour
disputes and other risks of the mining industry; political instability; delays in obtaining governmental approvals or financing or in the
completion of development or construction activities, as well as those factors discussed in the section entitled “Risk Factors” in this
MD&A. Although the Company has attempted to identify important factors that could cause actual actions, events or results to differ
materially from those described in forward looking statements, there may be other factors that cause actions, events or results to differ
from those anticipated, estimated or intended. Forward looking statements contained herein are made as of the date of this MD&A
and the Company disclaims any obligation to update any forward-looking statements, whether as a result of new information, future
events or results, except as may be required by applicable securities laws. There can be no assurance that forward-looking statements
will prove to be accurate, as actual results and future events could differ materially from those anticipated in such statements.
Accordingly, readers should not place undue reliance on forward-looking statements.

4
HIGHLIGHTS
Table 1: Highlights of Q1 2018 and Subsequent Period
May 1, 2018 Drill results released from 13 step-out holes and 30 infill holes, including an intercept of 1.54 metres at 61.49 grams per tonne (“g/t”) gold
February 20, 2018 Infill drill results released from 16 holes, including an intercept of 1.05 metres at 53.64 g/t gold
January 11, 2018 Michael Barton joined the Board of Directors of the Company
NOTES
All references to the “Company” or “Dalradian” refer to Dalradian Resources Inc., including its subsidiaries,
unless the context requires otherwise.
This management’s discussion and analysis (“MD&A”) should be read in conjunction with the Company’s
unaudited interim condensed consolidated financial statements and related notes for the three months
ended March 31, 2018 and March 31, 2017 (the “Consolidated Financial Statements”), and the audited
consolidated financial statements and related notes for the years ended December 31, 2017 and December
31, 2016, which have been prepared in accordance with International Financial Reporting Standards
(“IFRS”) as issued by the International Accounting Standards Board. This MD&A should also be read in
conjunction with the Company’s Annual Information Form (“AIF”) for the year ended December 31, 2017,
dated March 15, 2018, which is available on SEDAR at www.sedar.com.
Eric Tremblay, P.Eng., Chief Operating Officer, and Greg Hope, MAIG, Exploration and Geology Manager
with Dalradian are the qualified persons, as defined under the guidelines of National Instrument 43-101
Standards of Disclosure for Mineral Projects (“NI 43-101”) of the Canadian Securities Administrators, and
have reviewed and approved the technical information contained in this MD&A.
For additional details on the Curraghinalt high-grade gold deposit (“Curraghinalt”), please refer to the
Company’s technical report titled “NI 43-101 Feasibility Study Technical Report on the Curraghinalt Gold
Project Northern Ireland” (the “Technical Report”), dated January 25, 2017 and prepared by Garett
Macdonald, P.Eng., Michael Makarenko, P.Eng., Indi Gopinathan, P.Eng. and Stacy Freudigmann, P.Eng.,
all of JDS Energy & Mining Inc., and Jean-François Couture, P.Geo., Bruce Murphy, P.Eng., Cam Scott,
P.Eng., all of SRK Consulting (Canada) Inc., and William Harding, C.Geol., of SRK Consulting (UK) Ltd.,
all of whom are independent Qualified Persons as defined by NI 43-101. The Technical Report is available
on the Company’s website and on SEDAR at www.sedar.com.
All amounts are in Canadian dollars unless otherwise noted.
This MD&A is dated May 1, 2018.
The Company is developing the Curraghinalt gold deposit while continuing to explore for other mineral
deposits at its properties in Northern Ireland. The Company is subject to a number of risks and uncertainties
that are not discussed in this MD&A. To properly understand such risks, readers are directed to the section
entitled “Risk Factors” in the AIF which are incorporated by reference into this MD&A.
Q1 2018 SUMMARY
During the first quarter of 2018 and subsequent period, progress was achieved in:
• Commencement of public and statutory consultation processes for the permitting application to
build a mine at the Curraghinalt deposit (the “Planning Application”);
• Community relations activities, including welcoming our 1,000th local visitor on a tunnel tour and
site visit;

5
• Receipt of approximately 1,400 submissions of interest in careers at the proposed mine, with
approximately one-third of applicants coming from the local area;
• Completion of a technical work program in preparation for updates to the 2016 NI 43-101 Mineral
Resource Estimate (“Mineral Resource”), including completion of 6,324 metres of infill drilling in 22
holes to close off the infill drilling program totalling 29,026 metres in 76 holes;
• Continued progression of the technical work program for an update of the feasibility study (“FS”)
contained in the Technical Report, including advancement of the geotechnical model and further
work on ore-sorting technology;
• Completion of 5,275 metres of drilling in 12 holes in peripheral areas of Curraghinalt to test
continuity of the deposit; and
• The Company has an active program in place to meet the requirements of the General Data
Protection Regulation (GDPR) that becomes effective in Northern Ireland on May 25, 2018. GDPR
will supersede the UK Data Protection Act 1998 and expands the rights of individuals to control
how their personal information is collected and processed. GDPR places a range of new obligations
on the Company to be more accountable for data protection.
GOING FORWARD
Taking Curraghinalt to production is the Company’s primary goal and will be advanced in 2018 through
further drilling, engineering and geological studies, and environmental and permitting activities. The
Company expects to release a mineral resource update during Q2 2018, followed by an updated FS during
Q3 2018. In addition, Dalradian will also continue to explore its large land package to delineate targets for
drilling. Permitting activities will include preparation and submission of applications for ancillary permits and
consents and expanded stakeholder relations activities to support the Planning Application.
The overall budget for 2018 is approximately $49 million for operational activities in Northern Ireland and
Canada, including general and administrative costs. The two major items that represent approximately 50%
of the operational budget are exploration and permitting, with planned expenditures roughly similar for the
two areas. Mine planning and engineering work to produce an updated FS is the third-largest component
at approximately 10% of the overall budget. During Q1 2018, operational spending totalled approximately
$9 million.
Working capital (see Non-IFRS measures below) at March 31, 2018 was $124 million compared to
$132 million at December 31, 2017. This financial strength supports 2018 plans to continue exploration and
other work to increase the value of the Northern Ireland Properties (as defined below), while simultaneously
moving Curraghinalt through the permitting process.
DESCRIPTION OF BUSINESS
Incorporated on March 27, 2009, pursuant to the provisions of the Business Corporations Act (Ontario),
Dalradian is involved in the acquisition, exploration, evaluation and development of mineral properties in
Northern Ireland. The Company is listed on the Toronto Stock Exchange (“TSX”) under the stock symbol
“DNA” and the AIM Market of the London Stock Exchange (“AIM”) under the symbol “DALR”. The
Company’s registered office is in Toronto, while operations are focused on Dalradian’s Curraghinalt gold
deposit in Northern Ireland.
The Company, through its wholly-owned subsidiary, Dalradian Gold Limited (“DGL”), holds a 100% interest
in option agreements and prospecting licences, subject to a royalty as described below, covering
approximately 74,000 hectares, consisting of four areas (DG1, DG2, DG5 and DG6) located in counties
Tyrone and Londonderry, Northern Ireland, United Kingdom. Also in counties Tyrone and Londonderry, the
Company holds a 100% interest in option agreements, subject to a royalty as described below, covering
approximately 48,000 hectares, consisting of two contiguous areas (DG3 and DG4) and has pending
applications for renewal of prospecting licenses for the same two areas (see below). This approximately
6
122,000-hectare area is collectively known as the “Northern Ireland Properties” (location is shown on Figure
1 below). There are two elements comprising this interest for each of the six licence areas:
• the option agreements for mining leases entered into with the Crown Estate Commissioners
(“CEC”) for gold and silver (the "CEC Mining Lease Option Agreements"); and
• the prospecting licences entered into with the Department for the Economy (“DfE”, formerly known
as the Department of Enterprise, Trade and Investment) for base metals (the "DfE Prospecting
Licences").
On March 11, 2016, DGL finalized renewals of DG1-DG4 CEC Mining Lease Option Agreements, using a
new standard form of CEC agreement, each with a commencement date of January 1, 2016 and an initial
expiry date of December 31, 2021. On March 11, 2016, DGL also entered into initial CEC Mining Lease
Option Agreements for DG5 and DG6 with a commencement date of January 1, 2016 and expiry date of
December 31, 2021. The CEC Mining Lease Option Agreements have a six-year term, with an option to
extend the term for up to an additional four years. An extension will only be granted if there is satisfactory
evidence that DGL has made significant progress towards obtaining and/or has submitted an application
for the requisite planning permission for the exploration and mining of gold and silver (and including access
to and from the surface land) within the mining area (the “Planning Permission”). Pursuant to the terms of
the CEC Mining Lease Option Agreements, DGL can exercise its option and require the CEC to grant a
mining lease (in a form as agreed and appended to the CEC Mining Lease Option Agreements) (the “Mining
Lease”) over the relevant part of the licence area, provided that either of the following have been obtained:
(i) the grant of a Planning Permission or (ii) confirmation by the Department for Infrastructure that it intends
to grant Planning Permission subject only to the finalization of planning obligations or conditions or the
execution of a planning agreement. The Mining Lease, will, among other things, set out the terms,
conditions, obligations and certain rent and royalty payments to be made in connection with DGL’s right to
discover, extract and sell gold and silver from the relevant areas.
The DfE Prospecting Licences for DG1 and DG2 were issued in 2013 and are currently in their second two-
year extension term which runs from January 1, 2018 to December 31, 2019. The DfE Prospecting Licences
for DG3 and DG4 completed their second two-year extension term on April 23, 2017 and the Company’s
applications for new Prospecting Licences on those areas are being processed by DfE. Although the
Company has received renewals of these licences in the past, there is no guarantee that the Company will
receive them in the future. On June 23, 2016, DGL was granted DfE Prospecting Licences for DG5 and
DG6 with a commencement date of June 1, 2016 and expiry date of May 31, 2022. A DfE Prospecting
Licence cannot be extended beyond six years (equivalent to three two-year licences) from the date of grant;
however, at the end of the second two-year extension, DGL may apply for a new DfE Prospecting Licence
over the same area. Applications for new DfE Prospecting Licences will be required for DG1 and DG2 in
late 2019 and for DG5 and DG6 in early 2022.
As provided in the CEC Mining Lease Option Agreements, a 4% royalty will be payable to the CEC upon
production of gold and/or silver from the Northern Ireland Properties.
On August 30, 2017, Dalradian concluded the acquisition of the 2% net smelter return royalty on a portion
of the Northern Ireland properties (as defined in a royalty agreement, dated December 13, 2004) including
the Curraghinalt gold deposit (the “Royalty”) from Minco plc under Rule 2.5 of the Irish Takeover Panel Act,
Takeover Rules 2013 (the “Royalty Transaction”). On April 23, 2018, DGL and the Company terminated
the royalty agreement.
Within the Northern Ireland Properties, the Company’s main focus is on Curraghinalt. The Company has
completed a FS and submitted a Planning Application to DfI in November 2017 to build a mine. See
“Northern Ireland Properties – Curraghinalt Gold Deposit”, below.

7
NORTHERN IRELAND PROPERTIES
Overview
Central to DGL’s Northern Ireland Properties is the Curraghinalt deposit, an orogenic gold system consisting
of a series of structurally controlled, high-grade gold bearing quartz-carbonate veins. Dalradian’s work
during Q1 2018 focused primarily on the deposit, including step-out, infill and geotechnical drilling,
geological and engineering studies, community relations and permitting activities.
Figure 1: Location of Curraghinalt within the Northern Ireland Properties
Curraghinalt Gold Deposit – Feasibility Study
On December 12, 2016, Dalradian announced the results of an independent FS prepared in accordance
with NI 43-101 for the Curraghinalt gold deposit. The FS was prepared under the direction of JDS Energy
& Mining Inc. ("JDS"), an international engineering firm with extensive experience in both the construction
and operation of mining projects. The study was supported by SRK Consulting and was summarized in the
Technical Report dated January 25, 2017. Results of the FS demonstrate that the Curraghinalt gold deposit
warrants development due to its positive, robust economics. The FS has highlighted several opportunities
to increase mine profitability and project economics and reduce identified risks. Some of the work on
Curraghinalt during Q1 2018 focussed on these opportunities and the results will be incorporated into an
updated FS, planned for release in Q3 2018.
All of the information in this section, “Curraghinalt Gold Deposit – Feasibility Study”, is sourced from the
Technical Report except as noted. During 2017, the Company acquired the Royalty, thereby improving the
numbers shown below in the FS Highlights section, as discussed in “Effect of the Royalty Transaction on
FS Economics” below.
FS Highlights
(using prices of US$1,250/ounce for gold and US$17/ounce for silver and exchange rates of $1.20 USD:GBP and $0.75 USD:CAD)
• Net Present Value (“NPV”) of US$301 million (CDN$402 million) after tax (at a 5% discount rate)
and Internal Rate of Return (“IRR”) of 24.4% after tax, at an assumed gold price of US$1,250/ounce
• Proven & Probable Mineral Reserves of 1.44 million ounces (“oz”) of gold and 0.66 million ounces
of silver (5.24 million tonnes at 8.54 g/t Au and 3.9 g/t Ag), a subset of the Measured and Indicated

8
Resources of 2.10 million ounces of gold (5.61 million tonnes at 11.61 g/t Au). The FS excludes
Inferred Resources of 2.31 million ounces of gold (7.13 million tonnes at 10.06 g/t Au)
• Life of mine (“LOM”) production of approximately 1.36 million ounces of gold and 0.38 million
ounces of silver over an initial 10.5 year mine life using an average overall gold recovery of 94.3%
• Average annual gold production of 130,000 ounces in the first 10 years with an average LOM total
cash cost of US$556/oz and a LOM all-in sustaining cost of US$674/oz
• Estimated initial capital cost, including contingency, of US$192.0 million with payback of 4.0 years,
and LOM sustaining capital costs of US$165.1 million
• At year 5, production increases above 150,000 oz/year, with peak production achieved in year 7,
at 170,000 ounces. There is potential to maintain this higher rate of production beyond year 7 with
conversion of existing Inferred Mineral Resources
Table 2 - NPV and IRR pre-tax and after-tax
Pre-Tax After-Tax
Net Present Value @ 5% discount rate (NPV5)
US$371.7 million US$301.3 million
Internal Rate of Return (IRR)
27.8% 24.4%
Payback (Years) 3.6 4.0
Note: All figures are reported on a 100% equity project basis valuation. Capital payback is calculated based on start of production.
Table 3 - Cash flow over the initial three years of production and LOM (in millions of US dollars)
US$M Year 1 Year 2 Year 3 LOM
Total Revenue (Au & Ag) 120.2 164.2 172.9 1,700.5
Total Operating Costs 58.8 64.8 65.2 647.3
Transportation, Royalties & Refining 7.6 10.3 10.8 106.9
Operating Margin 53.9 89.1 96.8 946.4
Capital Costs 41.7 19.9 17.0 357.1
Working Capital 0.6 0.6 (0.4) -
Corporate Taxes 0.7 7.6 9.7 96.7
Undiscounted After-tax Cash Flow 10.9 61.1 70.4 492.6
Note: the cash flow is based on assumed prices of US$1,250/ounce for gold and US$17/ounce for silver and exchange rates of $1.20 USD:GBP and $0.75 USD:CAD
Combined results from three test stopes completed in 2016 demonstrated a 50%-plus improvement in gold
ounces recovered compared to the resource model on the V-75 vein (see news releases of September 14,
2016 and December 8, 2016 for details). This is a direct result of a higher than expected grade in those
areas. At a broader scale, the resource table (Table 4) shows that tighter drill spacing results in higher
grade with gold grades increasing from 10.1 g/t in the Inferred, to 11.5 g/t in the Indicated to 27.0 g/t in the
Measured categories. The FS sensitivities demonstrate considerable potential for grade upside, such that
a 20% grade improvement increases after-tax NPV by 64% and after-tax IRR by 39%.
Effect of the Royalty Transaction on FS Economics (not sourced from the Technical Report)
Incorporating the Royalty Transaction results in the following improvements to the FS results:
• Increases after tax NPV to $US322 million (C$429 million)
• Increases IRR to 25.5%
• Reduces total cash cost to US$531/oz

9
• Decreases AISC to US$653/oz
• Reduces after-tax payback to 3.8 years
Project Enhancement Opportunities
There are numerous opportunities to further enhance Curraghinalt project economics including:
• Enhancement of the deposit grade via tighter drill spacing.
• Mine life extension from (i) conversion of Inferred Resources to Measured and Indicated Resources
and then into reserves with infill drilling and (ii) overall resource and reserve growth from step-out
drilling along strike and at depth combined with exploring the potential for new veins parallel to
those already defined.
• Reduction of operating costs with additional geotechnical programs to maximize long-hole mining
methods. Part of the work program that is ongoing is the geotechnical review; results will be
incorporated into the updated FS.
• Ore sorting technology to increase the grade, reduce the tonnage of material entering the
processing plant and potentially reduce the cut-off grade, thereby increasing revenues. Results
announced during Q3 2017 demonstrated strong potential for application of this technology at
Curraghinalt, with grade increased by 55% and waste decreased by 36% with application of both
x-ray and laser sorting steps. Studies are ongoing including cost-benefit analysis of the secondary
laser step and site visits to operations using the technology prior to incorporation into the FS update.
Mineral Resources
Curraghinalt is an orogenic gold system consisting of a series of moderately to steeply dipping, structurally
controlled, high-grade gold bearing quartz-carbonate veins. The deposit remains open in all directions. In
addition to the data included in the previous mineral resource, the Mineral Resource estimate incorporates
information from 175 infill drill holes (51,215 metres) and underground samples from new and existing drifts
along the T17, Sheep Dip, 106-16, V-75, Slap Shot and No. 1 Vein Zones. The Measured Mineral
Resources are higher grade than the Indicated and Inferred Mineral Resources.
The current Mineral Resource estimate consists of 2.1 million ounces of contained gold in the Measured
and Indicated categories (5.61 million tonnes at 11.61 g/t) and 2.3 million ounces of contained gold in the
Inferred category (7.13 million tonnes at 10.06 g/t gold).
Table 4 - Mineral Resources, inclusive of Mineral Reserves (as set forth in Table 5 below) as at May 5, 2016
Mineral Resource Statement, Curraghinalt Gold Project, Northern Ireland
SRK Consulting (Canada) Inc., May 5, 2016
Contained
Resource Category Million Grade Gold
(Cut-off Grade of 5.0 g/t) Tonnes (g/t Au) (ounces)
Measured 0.03 26.99 25,000
Indicated 5.58 11.53 2,069,000
Measured + Indicated 5.61 11.61 2,094,000
Inferred 7.13 10.06 2,306,000
Notes: 1. Mineral Resource Statement prepared by SRK Consulting (Canada) Inc. in accordance with NI 43-101 with an effective
date of May 5, 2016 and the corresponding NI 43-101 technical report was filed on SEDAR. 2. Mineral Resources are not Mineral Reserves and have no demonstrated economic viability. The estimate of Mineral
Resources may be materially affected by environmental, permitting, legal, marketing, or other relevant issues. The Mineral Resources have been classified according to the CIM Definition Standards for Mineral Resources and Mineral Reserves (May 2014).
3. All figures have been rounded to reflect the relative accuracy of the estimates. 4. The Mineral Resources are reported at a cut-off grade of 5.0 g/t gold, based on a gold price of US$1,200 per ounce and
95% gold recovery.

10
Mineral Reserves and Mining
The estimated Mineral Reserves, presented by reserve class, are shown in the following table. The overall
diluted gold grade of the mineralized material that would go to the mill is estimated at 8.54 g/t.
Table 5 - Probable Mineral Reserves as at December 12, 2016
Diluted Tonnes
Au Grade
Au Ounces
Ag Grade
Ag Ounces
Category (t) (g/t) (oz) (g/t) (oz)
Proven 28,000 18.93 17,000 10.0 9,000
Probable 5,211,000 8.48 1,421,000 3.9 655,000
TOTAL 5,239,000 8.54 1,438,000 3.9 664,000
Notes:
1. The Qualified Person for the Mineral Reserve estimate is Michael Makarenko, P. Eng., of JDS Energy & Mining Inc. 2. Mineral Reserves have an effective date of December 12, 2016. All Mineral Reserves in this table are Proven and Probable
Mineral Reserves. The Mineral Reserves are not in addition to the Mineral Resources, but are a subset thereof. 3. Mineral Reserves were estimated using a US$1,200/oz gold price and gold cut-off grade of 5.0 g/t. Other costs and factors
used for gold cut-off grade determination were mining, process and other costs of US$165/t, transport and treatment charges of US$6.00/oz Au. A royalty of US$71.50/oz Au and a gold metallurgical recovery of 94% were assumed.
4. Silver was not used in the estimation of cut-off grades but is recovered and contributes to the revenue stream. 5. Tonnages are rounded to the nearest 1,000 t, gold grades are rounded to two decimal places, and silver grades are rounded
to one decimal place. Tonnage and grade measurements are in metric units; contained gold and silver are reported as thousands of troy ounces.
6. Rounding as required by reporting guidelines may result in summation differences.
The Curraghinalt deposit is expected to be accessed by the existing exploration adit and a new ramp to be
developed adjacent to the proposed plant site. This new ramp will serve as the primary access to the mine
for personnel, materials and haulage of mineralized material to the plant site. Annual ore production of up
to 511,000 tonnes (1,400 tonnes per day on average) is planned from a combination of primary longitudinal
long-hole retreat, with some cut and fill mining methods and development along the veins. Sub-levels are
set at 18 m intervals (floor to floor) with primary cross cuts spaced approximately 200 m apart to access
the 16 mineralized veins in the deposit. The 2016 test stoping program at Curraghinalt successfully
demonstrated the long-hole mining method at vein dips ranging between 55-75 degrees with good control
on dilution. In zones of more challenging ground conditions or shallow dip, methods including cut and fill
and uppers retreat will be used.
Dalradian is studying the effects of adding ore sorting technology to the mining process for the next FS
update, per the discussion earlier in this MD&A of the positive results from ore sorting tests “Curraghinalt
Gold Deposit – Feasibility Study – Project Enhancement Opportunities”.
Processing
Curraghinalt mineralization is expected to be processed using a crush, grind, flotation and leach flowsheet
to recover gold and silver into doré. Extensive metallurgical test work has shown overall gold and silver
recoveries of 94.3% and 57.9% can be expected over the LOM using a coarse primary grind size of
approximately 80% passing 240 microns.
The process plant uses the industry standard S02/air treatment process to destroy the cyanide to below
regulatory levels and directs the tailings to the paste backfill plant to be stored in the underground mine.
Tailings from the flotation circuit (approximately 90% of the material that enters the plant), which will not
have come into contact with cyanide, are expected to be filtered and placed as dry stack material in the
mine waste storage facility and also used to complete the underground paste backfill requirement.
Capital & Operating Costs
The initial capital cost is estimated to be US$192.0 million. This capital cost was estimated under the
assumption that any expenditures by the Company prior to the start of construction are a sunk cost and are
not included in the estimate shown in Table 6. The sustaining capital is estimated to be US$165.1 million
including reclamation and closure costs.
11
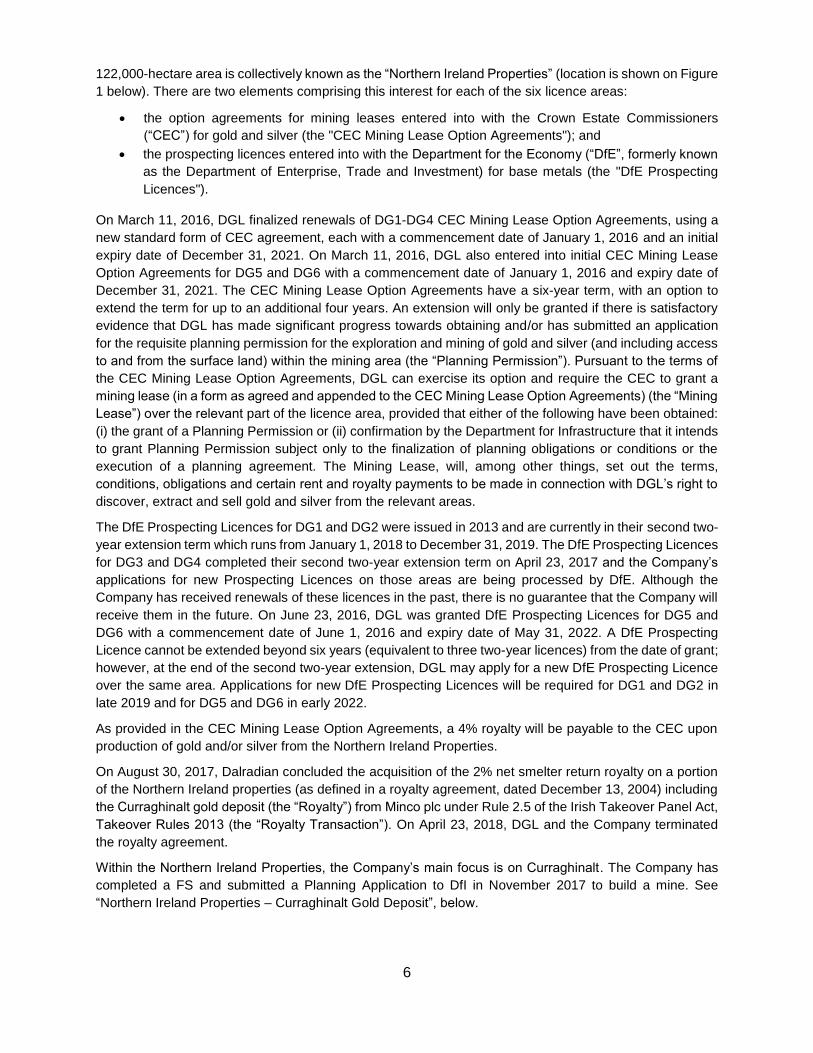
Table 6 - Capital Cost Summary
CAPEX Pre-Production Sustaining LOM
US$ millions US$ millions US$ millions
Mining incl. Paste Plant 45.9 142.6 188.5
Site Development 8.7 2.0 10.7
Crushing & Handling 6.5 1.4 7.9
Mineral Processing Plant 36.9 4.1 41.0
On-Site Infrastructure 28.9 - 28.9
Off-Site Infrastructure 4.9 - 4.9
Tailings Management 1.4 2.6 4.0
Indirect Costs 20.4 2.2 22.6
Owners Costs 13.2 - 13.2
Closure Assurance 7.5 (7.5) -
Closure Net of Salvage - 11.4 11.4
Contingency 17.6 6.4 24.0
Total 192.0 165.1 357.1
Note: some numbers may not sum correctly due to rounding.
The LOM operating cost (“OPEX”) estimate is US$143.94 per tonne of mineralized material. The operating
costs were estimated based on process design criteria, equipment lease rates (if applicable), labour,
reagents, power, fuel, explosives, maintenance and other miscellaneous costs. All costs are in Q4 2016
dollars and noted in Table 7 below.
Table 7 - LOM Operating Cost by Area
OPEX LOM Unit Cost
US$ millions US$/tonne US$/ payable Au oz
Mining 442 84.44 326.43
Processing 146 27.83 107.60
General & Admin 59 11.27 43.57
Subtotal - On-Site OPEX 647 123.54 477.60
Refinement/Transport 5 0.93 3.60
Royalties 102 19.46 75.24
Subtotal - Off-Site OPEX 107 20.39 78.84
All-in OPEX 754 143.94 556.44
Note: all cash cost information is net of silver by-product credits of US$4.77/oz. Some numbers may not sum correctly due to rounding
12
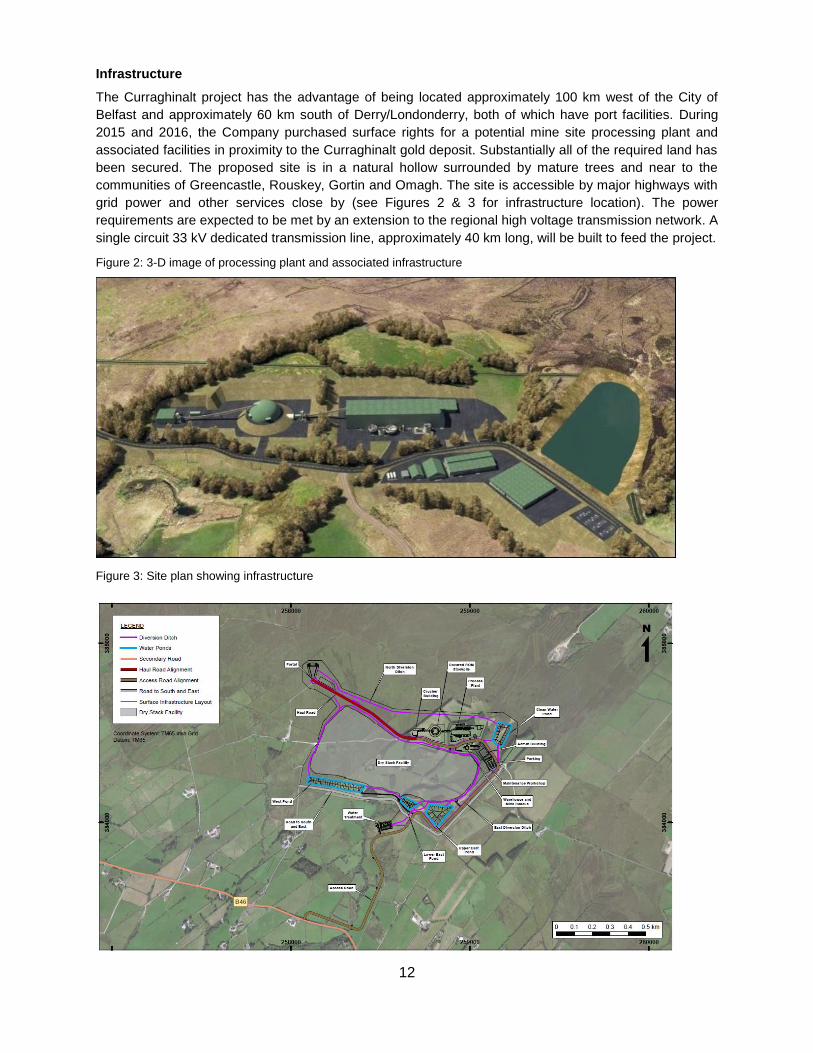
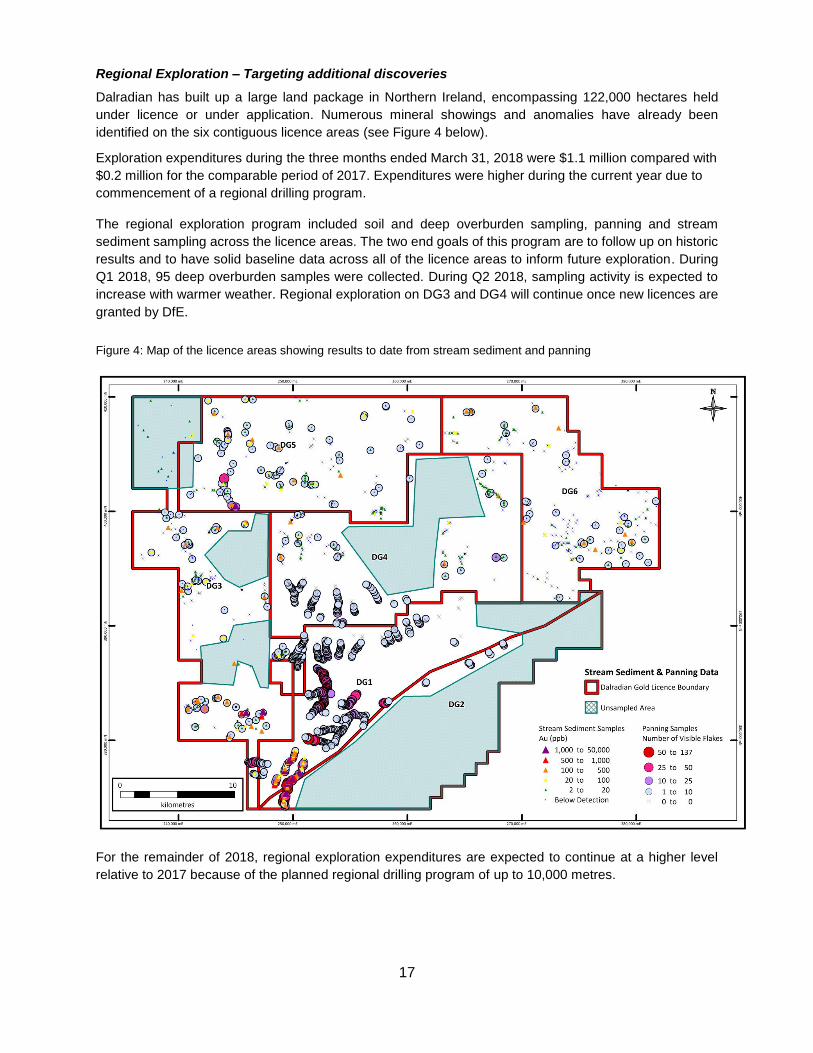
Infrastructure
The Curraghinalt project has the advantage of being located approximately 100 km west of the City of
Belfast and approximately 60 km south of Derry/Londonderry, both of which have port facilities. During
2015 and 2016, the Company purchased surface rights for a potential mine site processing plant and
associated facilities in proximity to the Curraghinalt gold deposit. Substantially all of the required land has
been secured. The proposed site is in a natural hollow surrounded by mature trees and near to the
communities of Greencastle, Rouskey, Gortin and Omagh. The site is accessible by major highways with
grid power and other services close by (see Figures 2 & 3 for infrastructure location). The power
requirements are expected to be met by an extension to the regional high voltage transmission network. A
single circuit 33 kV dedicated transmission line, approximately 40 km long, will be built to feed the project.
Figure 2: 3-D image of processing plant and associated infrastructure
Figure 3: Site plan showing infrastructure

13
Curraghinalt Gold Deposit – 2017 and 2018 Work Programs
The 2017 work program was aimed at further enhancing the economics of the Curraghinalt gold deposit.
The program included infill, step-out and geotechnical drilling, geotechnical studies and ore-sorting tests.
Certain aspects of the work program were completed during Q1 2018. The Company anticipates
incorporating results from the 2017 work program into an updated mineral resource estimate in Q2 2018
followed by an updated FS in Q3 2018.
The main objectives of the drill program totalling approximately 40,000 metres were to (i) augment total
resource ounces; (ii) increase the grade in the areas of infill drilling; and (iii) provide data to support
geotechnical studies. In total, 29,026 metres of infill drilling were completed in 76 holes, primarily in support
of objectives ii and iii above. Step-out drilling beyond the existing resource envelope in support of the first
objective above totalled 14,500 metres in 36 holes. Results from 12 drill holes have not yet been received
and will be released when all of the assay results are received from the lab.
On May 1, 2018 the Company reported results of 13 step-out drill holes and 30 infill drill holes for a total of
16,775 metres of drilling. Highlights included:
• Step out: 0.46 metres of 42.90 g/t gold from the V75 vein in hole 17-CT-462
• Step-out: 0.26 metres of 30.30 g/t gold from the 106-16 vein in hole 17-CT-464
• Infill: 1.54 metres of 61.49 g/t gold from the Mullan vein in hole 17-CT-472
• Infill: 0.87 metres of 50.96 g/t gold from the No.1 vein in hole 17-CT-482a
• Infill: 0.26 metres of 150.50 g/t gold from the T17 vein in hole 17-CT-485
• Infill: 0.27 metres of 154.00 g/t gold from the V55 vein in hole 17-CT-486
• Infill: 1.01 metres of 54.89 g/t gold from the Crow vein in hole 18-CT-491a
• Infill: 0.54 metres of 65.49 g/t gold from the Mullan vein in hole 17-CT-493
• Infill: 0.43 metres of 61.10 g/t gold from the V55 vein in hole 17-CT-493
All of the results for the drill program supporting the updated mineral resource estimate have now been
released. The drilling has both extended the strike length of the system and identified a number of new
veins.
During Q3 2017, the Company announced a new approach to mineral resource estimation using a greater
reliance on logged geology and compositing over smaller intervals constrained within geologically defined
wireframes. Application of this new approach to two of the main veins (T-17 and V-75) in the Mineral
Resource model resulted in a 37% increase in grade and a 10% increase in ounces, while yielding 24%
narrower veins and a 20% decrease in tonnage. When the resources were then treated with all the same
parameters as in the FS, the end result was higher potentially mineable tonnage of 34% and a
corresponding increase in mineable ounces of 32%, with a negligible decrease in grade, since material
previously below the lower cut-off grade was elevated into the reserves. The Company intends to apply this
approach in its next resource update, planned for completion during Q2 2018.
A portion of the underground drilling was in support of geotechnical studies that began during Q1 2017,
targeting areas of the deposit that were originally classified as having poor ground conditions but which
management believes could be reclassified as having good ground conditions with more data. Analysis of
the new data from 2017 drilling advanced the geotechnical studies during Q1 2018. The reclassification
should allow more of the deposit to be mined using lower-cost long-hole methods.
Results from larger scale ore-sorting tests were reported during Q3 2017, demonstrating the potential for
this technology to reduce costs and increase the grade of material being sent to the process plant. Further
investigation is ongoing prior to inclusion in the updated FS (see more detailed discussion above in
“Curraghinalt Gold Deposit – Feasibility Study – Project Enhancement Opportunities”).

14
Expenditures on mineral property under development for the three months ended March 31, 2018 were
$6.1 million compared with $2.5 million, net of expected receipt from processing of mineralized material,
during the comparable period in 2017. During Q1 2018, drilling and permitting were the largest spending
categories as work focused on supporting the Planning Application and infill and step-out drilling. This
compares with Q1 2017 when much of the activity centered on preparing the Planning Application,
processing the mineralized material from underground development, limited drilling since the drill program
was just beginning and limited underground development. During Q1 2017, the cost of processing the
mineralized material from underground development was $4.4 million, offset by a receivable of $5.4 million
from the processing. There was no equivalent cost or receivable in Q1 2018.
The budget for 2018 on expenditures on mineral property under development includes completion of the
2017 work program during Q1 2018, completion of the updated mineral resource estimate during Q2 2018,
completion of an updated FS during Q3 2018 and up to 14,000 metres of step out drilling at the Curraghinalt
deposit during Q2 and Q3, 2018.
Curraghinalt Gold Deposit – Permitting
During November 2017, the Company submitted its Planning (permitting) Application to build a mine at the
Curraghinalt gold deposit to DfI. During 2018, permitting and stakeholder consultation activities will continue
to be a major focus for the Company.
Dalradian has already successfully permitted underground and associated surface operations at the
Curraghinalt deposit. Three permits were required and obtained for the underground exploration program:
planning permission; a site discharge consent for water; and an explosives storage licence. As part of this
planning permission, the Company submitted and received approval from Northern Ireland regulators for a
number of management plans governing items such as water, noise, traffic and dust. During the
underground exploration program, over 70 site inspections were completed by the various environmental
and health and safety regulatory authorities, with no enforcement actions and a strong health and safety
record.
During Q1 2018, the Company continued its excellent record of compliance with the terms and conditions
of its permits and had zero lost time injuries.
In Q4 2014, Dalradian commenced an Environmental and Social Impact Assessment (“ESIA”), to examine
the potential impacts of a full mine build, as well as options for the elimination or mitigation of such impacts.
SRK UK was the environmental consultant for preparation of the ESIA. The ESIA report, together with a
project description, form the basis of the Planning Application submitted during Q4 2017.
During 2018, spending on permitting is expected to remain at a similar level to 2017 as activities shift from
preparation of the application to supporting it through the planning review process and preparing
applications for other licences and consents associated with the main application.
The entire planning process, from submission of the application to a decision being announced by the
relevant authority, is expected to take approximately 24 months. Review of the application, including
consultation by DfI with various statutory consultees (such as near neighbours and government
departments charged with regulating aspects such as water, traffic, ecology and waste), is expected to take
until early 2019. This includes one round of requests for further information from DfI followed by consultation
on the additional information provided. Following the review by DfI, it is expected that a Public Local Inquiry
(“PLI”) will be called, given the scale of the project. The typical time frame for a PLI is approximately one
year. At the end of this process, the minister responsible for infrastructure or a senior civil servant will
announce a decision on the application, which is anticipated by the end of 2019.
The Company has already completed extensive consultation on its plans to build a mine at the Curraghinalt
gold deposit. Dalradian and SRK UK along with other consultants began stakeholder engagement for the
ESIA in December 2015 with an initial meeting with planning officials. This was followed by other
government agency meetings and initial community consultations in January 2016. The purpose of these

15
meetings was to receive government agency, community and other stakeholder feedback to input into the
Planning Application. Since December 2015 and up to submission of the Planning Application, Dalradian
had 44 meetings in total with various regulatory agencies to receive feedback on the proposed project.
Dalradian formally began the pre-application community consultation process on its proposal to build a
mine in January 2016. Dalradian consulted on the early scope of the ESIA at five public events in the local
communities of Greencastle, Gortin and Rouskey. However, these five consultations were prior to the
statutory window. The statutory process began in August 2016 following submission of the Proposal of
Application Notice to DfI.
On November 19 and 21, 2016, as part of the formal pre-application community consultation, Dalradian
held two public information events attended by more than 270 people. More than 5,000 households in a 15
kilometre radius of the site had been sent information about the project and the public information events.
The events took place at the Company’s current underground exploration site and allowed residents to
access more information about the project and ask questions of the 30 Dalradian employees and
consultants in attendance. More than 60 information boards/posters were on display, the majority of them
relating to environmental impact and modelling, at 12 stations depicting various aspects of the proposed
mine, with a scale model of the site and a 3-D animation to assist in visualizing the future site.
Since the beginning of the statutory process in August 2016 and up to submission of the Planning
Application, in excess of 450 individual comments or representations were recorded in response to the
Company’s plans. Included within this figure are 189 responses to the online, postal or event feedback
forms. A total of 74% of respondents are supportive, or neutral, to the Company’s plans assuming that
appropriate controls and safeguards are in place. A breakdown of the 189 responses is as follows: 123
(65%) “supportive, with controls and safeguards in place”, 11 (6%) “undecided”, 5 (3%) “no comment” and
50 (26%) “against”. The Company believes that ongoing engagement and consultation will help address
many of the concerns articulated.
To further promote understanding of the Curraghinalt gold deposit and transparency with respect to the
Company’s operations, Dalradian offers tunnel and site tours and face-to-face meetings with local residents,
businesses and members of the wider public. Since the summer of 2016, approximately 1,000 local
residents and stakeholders have attended tunnel and site tours, which are ongoing.
Dalradian will continue to seek constructive dialogue and provide clarity and reassurance to local residents
and the wider public about its plans. Throughout all of the Company’s formal and informal consultations, it
has sought to engage meaningfully and continues to communicate regularly with residents and the wider
public of West Tyrone and Northern Ireland. In the lead-up to submission of the Planning Application, a
series of weekly informative advertorials were run in local newspapers and promoted on social media to
give residents more details concerning the benefits of the project and environmental protection measures.
The Company has continued these weekly communications, with topics tailored to address concerns raised
by local residents.
Written submissions to the Company’s consultation events held in November 2016 demonstrated majority
support for the project. However, as with most regionally significant planning applications, there are a
number of people who are currently opposed to the project. The planning system in Northern Ireland allows
and encourages all interested parties to make their views known and to submit the specific reasons for their
support or opposition. The Company respects the planning process in Northern Ireland and is confident the
project will succeed because it is a responsible development that will bring sustainable economic and social
benefits to the local area and Northern Ireland as a whole for years to come.
It is common, with respect to regionally significant planning applications in Northern Ireland, to have multiple
legal challenges, including judicial reviews. A judicial review (“JR”) is a type of court proceeding in which a
judge reviews the lawfulness of a decision or action made by a public body; they are a challenge to the way
in which a decision has been made, rather than the conclusion reached. Two JRs have been brought

16
against government departments in Northern Ireland relating to decisions taken by these departments (on
planning and environmental grounds) and Dalradian is a notice party. The first JR concerns the decision by
DfI to accept the Company’s Planning Application and has a hearing date in mid-June. The second JR
concerns the decision by the Department of Agriculture, Environment and Rural Affairs to grant a revised
water discharge consent for the Company’s exploration site. In June, the date for the hearing of the second
JR will be set and it is expected to take place in the second half of the year. Both departments are robustly
defending the proceedings and the decisions made. Dalradian, as a notice party, will also be submitting
evidence in defence of the decision-making process. The timing and process for review of the Planning
Application is not affected by the JR process and the application has continued to move through review and
consultation steps. The Company will provide updates on any material developments regarding the JRs.
Stakeholder engagement and presentations to various levels of government will continue throughout the
permitting period. During 2018, a number of ancillary permitting applications will be prepared. The
permitting team will also be preparing materials for an expected PLI and responding to any further requests
for information from DfI relating to the Planning Application. A broader communications campaign is
ongoing during 2018 to support the permitting process by publicizing the sustainable economic and social
benefits that will accrue to West Tyrone and Northern Ireland if the project is granted planning permission.
The proposed mine has attracted considerable careers interest, with approximately 1,400 job seekers
having contacted the Company, including approximately one-third from County Tyrone.
17
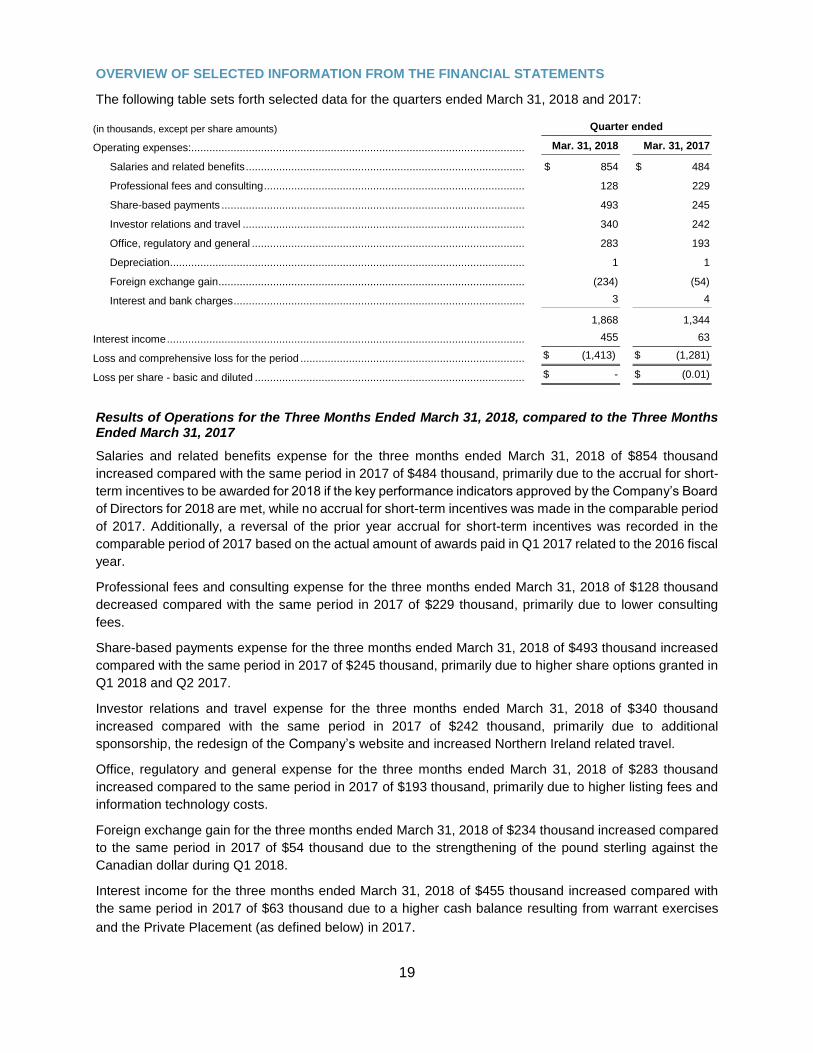
Regional Exploration – Targeting additional discoveries
Dalradian has built up a large land package in Northern Ireland, encompassing 122,000 hectares held
under licence or under application. Numerous mineral showings and anomalies have already been
identified on the six contiguous licence areas (see Figure 4 below).
Exploration expenditures during the three months ended March 31, 2018 were $1.1 million compared with
$0.2 million for the comparable period of 2017. Expenditures were higher during the current year due to
commencement of a regional drilling program.
The regional exploration program included soil and deep overburden sampling, panning and stream
sediment sampling across the licence areas. The two end goals of this program are to follow up on historic
results and to have solid baseline data across all of the licence areas to inform future exploration. During
Q1 2018, 95 deep overburden samples were collected. During Q2 2018, sampling activity is expected to
increase with warmer weather. Regional exploration on DG3 and DG4 will continue once new licences are
granted by DfE.
Figure 4: Map of the licence areas showing results to date from stream sediment and panning
For the remainder of 2018, regional exploration expenditures are expected to continue at a higher level
relative to 2017 because of the planned regional drilling program of up to 10,000 metres.

18
Breakdown of Mineral Property under Development
Table 8:
(in thousands)
Balance Dec. 31, 2017
Additions Q1 2018
Balance Mar. 31, 2018
Minco royalty acquisition ............................................................................... $ 26,492 $ - $ 26,492
Mineralized material processing, net ............................................................. (1,006) - (1,006)
Underground development ............................................................................ 28,023 434 28,457
Infill drilling .................................................................................................... 20,183 2,840 23,023
Technical Studies .......................................................................................... 13,210 485 13,695
Permitting ...................................................................................................... 14,489 1,060 15,549
Geology ........................................................................................................ 36,444 498 36,942
Administrative and other ................................................................................ 7,915 1,297 9,212
Provision for reclamation ............................................................................... 1,182 - 1,182
Capitalized depreciation ................................................................................ 3,010 169 3,179
Share-based payments ................................................................................. 1,590 73 1,663
Warrants ...................................................................................................... 139 - 139
$ 151,671 $ 6,856 $ 158,527
(in thousands)
Balance Dec. 31, 2016
Additions Q1 2017
Balance Mar. 31 2017
Mineralized material processing, net ............................................................. $ - $ (1,015) $ (1,015)
Underground development ............................................................................ 25,118 1,037 26,155
Infill drilling .................................................................................................... 11,359 730 12,089
Technical Studies .......................................................................................... 11,454 592 12,046
Permitting ...................................................................................................... 9,856 715 10,571
Geology ........................................................................................................ 35,511 165 35,676
Administrative and other ................................................................................ 5,509 486 5,995
Provision for reclamation ............................................................................... 1,182 - 1,182
Capitalized depreciation ................................................................................ 2,281 186 2,467
Share-based payments ................................................................................. 1,287 53 1,340
Warrants ...................................................................................................... 139 - 139
$ 103,696 $ 2,949 $ 106,645
The primary activities during Q1 2018 relating to mineral property under development were infill drilling and
permitting, while the primary activities during Q1 2017 were underground development, infill drilling and
permitting.
During Q1 2017, a recovery of net $1.0 million was credited to property, plant and equipment related to the
$4.4 million cost of processing the mineralized material from underground development offset by proceeds
of $5.4 million from the sale of processed ore.
19
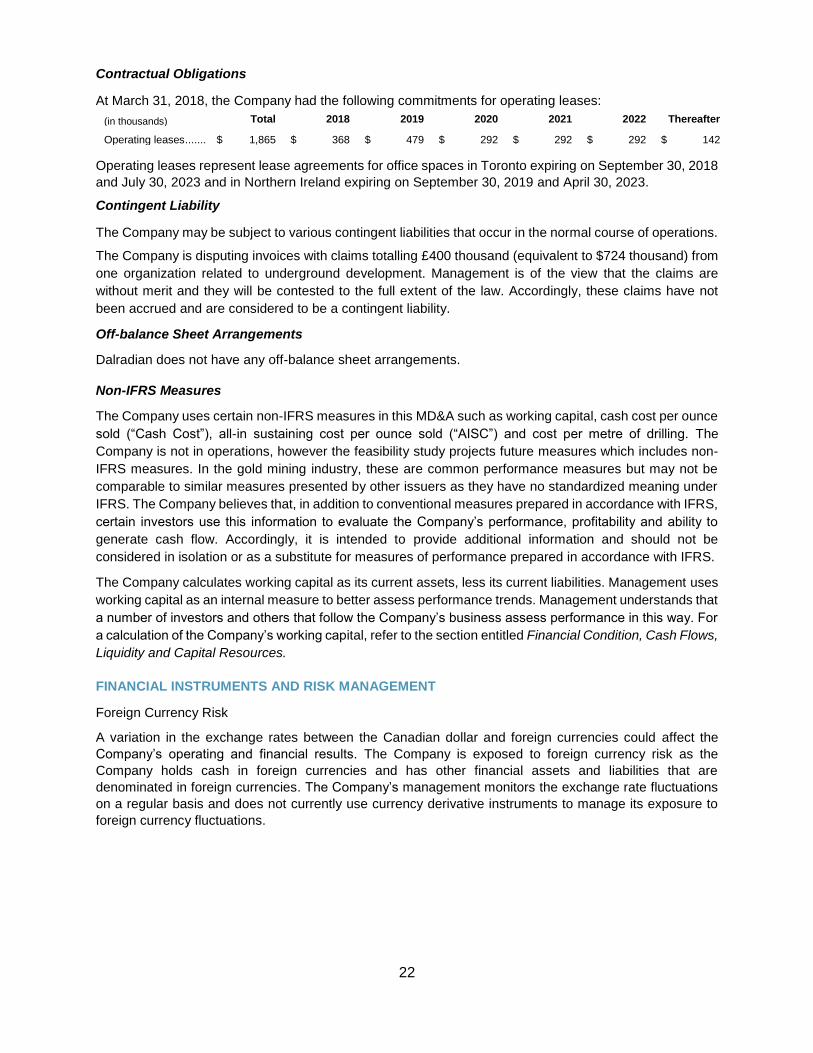
OVERVIEW OF SELECTED INFORMATION FROM THE FINANCIAL STATEMENTS
The following table sets forth selected data for the quarters ended March 31, 2018 and 2017:
(in thousands, except per share amounts) Quarter ended
Operating expenses:.............................................................................................................. Mar. 31, 2018 Mar. 31, 2017
Salaries and related benefits ............................................................................................ $ 854 $ 484
Professional fees and consulting ...................................................................................... 128 229
Share-based payments .................................................................................................... 493 245
Investor relations and travel ............................................................................................. 340 242
Office, regulatory and general .......................................................................................... 283 193
Depreciation ..................................................................................................................... 1 1
Foreign exchange gain ..................................................................................................... (234) (54)
Interest and bank charges ................................................................................................ 3 4
1,868 1,344
Interest income ...................................................................................................................... 455 63
Loss and comprehensive loss for the period .......................................................................... $ (1,413) $ (1,281)
Loss per share - basic and diluted ......................................................................................... $ - $ (0.01)
Results of Operations for the Three Months Ended March 31, 2018, compared to the Three Months Ended March 31, 2017
Salaries and related benefits expense for the three months ended March 31, 2018 of $854 thousand
increased compared with the same period in 2017 of $484 thousand, primarily due to the accrual for short-
term incentives to be awarded for 2018 if the key performance indicators approved by the Company’s Board
of Directors for 2018 are met, while no accrual for short-term incentives was made in the comparable period
of 2017. Additionally, a reversal of the prior year accrual for short-term incentives was recorded in the
comparable period of 2017 based on the actual amount of awards paid in Q1 2017 related to the 2016 fiscal
year.
Professional fees and consulting expense for the three months ended March 31, 2018 of $128 thousand
decreased compared with the same period in 2017 of $229 thousand, primarily due to lower consulting
fees.
Share-based payments expense for the three months ended March 31, 2018 of $493 thousand increased
compared with the same period in 2017 of $245 thousand, primarily due to higher share options granted in
Q1 2018 and Q2 2017.
Investor relations and travel expense for the three months ended March 31, 2018 of $340 thousand
increased compared with the same period in 2017 of $242 thousand, primarily due to additional
sponsorship, the redesign of the Company’s website and increased Northern Ireland related travel.
Office, regulatory and general expense for the three months ended March 31, 2018 of $283 thousand
increased compared to the same period in 2017 of $193 thousand, primarily due to higher listing fees and
information technology costs.
Foreign exchange gain for the three months ended March 31, 2018 of $234 thousand increased compared
to the same period in 2017 of $54 thousand due to the strengthening of the pound sterling against the
Canadian dollar during Q1 2018.
Interest income for the three months ended March 31, 2018 of $455 thousand increased compared with
the same period in 2017 of $63 thousand due to a higher cash balance resulting from warrant exercises
and the Private Placement (as defined below) in 2017.

20
Summary of Quarterly Results
The following table sets forth selected consolidated financial information for each of the Company’s eight
most recently completed quarters:
(in thousands, except per share amounts) Three months ended
Mar. 31, 2018 Dec. 31, 2017 Sept. 30, 2017 Jun. 30, 2017
Interest income and other $ 455 $ 263 $ 104 $ 55
Net loss (1,413) (1,827) (1,878) (2,718)
Net loss per common share (basic and diluted) - (0.01) (0.01) (0.01)
Cash and cash equivalents 126,929 137,963 48,763 34,619
Other current assets 2,169 1,336 1,325 1,513
Restoration deposit 1,130 1,058 1,042 1,051
Property, plant and equipment 173,033 166,347 158,976 126,533
Exploration and evaluation assets 5,209 4,601 4,292 4,176
Other asset - - - 413
Total assets $ 308,470 $ 311,305 $ 214,398 $ 168,305
Total shareholders' equity $ 302,266 $ 303,113 $ 207,275 $ 162,760
(in thousands, except per share amounts) Three months ended
Mar. 31, 2017 Dec. 31, 2016 Sept. 30, 2016 Jun. 30, 2016
Interest income and other $ 63 $ 67 $ 33 $ 37
Net loss (1,281) (3,008) (1,415) (1,427)
Net loss per common share (basic and diluted) (0.01) (0.01) (0.01) (0.01)
Cash and cash equivalents 36,447 35,719 43,109 22,712
Other current assets 6,440 1,173 987 1,359
Restoration deposit 1,041 1,032 1,063 1,072
Property, plant and equipment 121,810 118,988 13,961 14,146
Exploration and evaluation assets 4,021 3,943 102,870 97,652
Total assets $ 169,759 $ 160,855 $ 161,990 $ 136,941
Total shareholders' equity $ 161,794 $ 154,920 $ 156,816 $ 132,021
To date, seasonality or commodity market fluctuations have not had a direct impact on the Company’s
results of operations, as the Company is focused on advancing mineral properties with no current revenues.
Fluctuations in quarterly results are mainly due to cycles of spending on properties and financing future
activities. Cash balances rose during Q3 2016 and from Q1 2017 through Q4 2017 due to warrant exercises.
In Q4 2017 cash balances rose significantly due to the Private Placement (as defined below). Cash
balances were reduced quarterly depending on exploration and evaluation and development activities.
Quarters with higher net losses typically involved a higher level of corporate activity, usually related to
marketing the Company or higher share-based payments.
The substantial increase in property, plant and equipment (and decrease in exploration and evaluation
assets) between Q3 2016 and Q4 2016 relates to the transition of the Curraghinalt gold deposit from
exploration-based accounting to development-based accounting. The other substantial increase, which
occurred in Q3 2017 reflects the acquisition of the Royalty. The “Other current assets” amount in Q1 2017
is unusually high due to the receivable for the processing of mineralized material.

21
FINANCIAL CONDITION, CASH FLOWS, LIQUIDITY AND CAPITAL RESOURCES
Capital Resources
The adequacy of the Company’s capital structure is monitored on an ongoing basis and adjusted as
necessary according to market conditions to meet Dalradian’s objectives given the current outlook of the
business and industry in general. The Company may manage its capital structure by issuing new shares,
adjusting spending, disposing of assets or issuing debt.
Dalradian is not in commercial production on its Northern Ireland Properties and, accordingly, it does not
generate cash from operations. Dalradian’s only source of income has been interest earned from funds on
deposit. Accordingly, when cash resources are nearing depletion, the Company is dependent on issuing
equity or other forms of financing to complete programs associated with its development and exploration
and evaluation of properties.
During the year ended 2017, the Company received approximately $49.8 million from warrant exercises.
Currently, the Company has no warrants outstanding as the remaining 50,000 warrants outstanding at year
end 2017 expired on January 1, 2018.
On November 27, 2017 Orion Mine Finance Fund II LP acquired 34,013,605 common shares of the
Company and Osisko Gold Royalties acquired 19,217,687 common shares of the Company, each at a price
of C$1.47 per common share for total gross proceeds of C$78.25 million (the “Private Placement”).
Dalradian’s cash and cash equivalents as at March 31, 2018 were $126.9 million, compared with $138.0
million as at December 31, 2017.
Liquidity
The Company primarily finances its activities by raising capital through the issuance of equity. While the
Company has no source of revenue, management believes it has sufficient cash resources to meet its
obligations and fund planned expenditures and administrative costs for at least the next twelve months.
The Company will have to raise financing in the future to develop a mine and meet future expenditures and
administrative costs. Although the Company has been successful in raising funds to date, as evidenced by
proceeds raised from warrant exercises and the Private Placement received during 2017, there can be no
assurance that adequate financing will be available in the future or available under terms acceptable to the
Company. Global commodity markets and, in particular, the price of gold, remain volatile and uncertain,
which could lead to difficulties in raising funds.
Working Capital
(in thousands)
Quarter ended Mar. 31, 2018
Year ended Dec. 31, 2017 Change
Current Assets
Cash and cash equivalents………………………………………………… $ 126,929 $ 137,963 $ (11,034)
Amounts receivable ………………………………………………………… 1,508 651 857
Prepaid expenses and other assets...................................................... 661 685 (24)
$ 129,098 $ 139,299 $ (10,201)
Current Liabilities
Accounts payable and accrued liabilities………………………….……… $ 5,086 $ 7,141 $ (2,055)
Provision for reclamation ...................................................................... 176 356 (180)
$ 5,262 $ 7,497 $ (2,235)
Working Capital(1)……………………………………………..…………… $ 123,836 $ 131,802 $ (7,966)
(1) Working capital is not a recognized measure under IFRS (see Non-IFRS measures below).
The majority of accounts payable and accrued liabilities relate to trade payables incurred in the normal
course of operations.
22
Contractual Obligations
At March 31, 2018, the Company had the following commitments for operating leases:
(in thousands) Total 2018 2019 2020 2021 2022 Thereafter
Operating leases ....... $ 1,865 $ 368 $ 479 $ 292 $ 292 $ 292 $ 142
Operating leases represent lease agreements for office spaces in Toronto expiring on September 30, 2018
and July 30, 2023 and in Northern Ireland expiring on September 30, 2019 and April 30, 2023.
Contingent Liability
The Company may be subject to various contingent liabilities that occur in the normal course of operations.
The Company is disputing invoices with claims totalling £400 thousand (equivalent to $724 thousand) from
one organization related to underground development. Management is of the view that the claims are
without merit and they will be contested to the full extent of the law. Accordingly, these claims have not
been accrued and are considered to be a contingent liability.
Off-balance Sheet Arrangements
Dalradian does not have any off-balance sheet arrangements.
Non-IFRS Measures
The Company uses certain non-IFRS measures in this MD&A such as working capital, cash cost per ounce
sold (“Cash Cost”), all-in sustaining cost per ounce sold (“AISC”) and cost per metre of drilling. The
Company is not in operations, however the feasibility study projects future measures which includes non-
IFRS measures. In the gold mining industry, these are common performance measures but may not be
comparable to similar measures presented by other issuers as they have no standardized meaning under
IFRS. The Company believes that, in addition to conventional measures prepared in accordance with IFRS,
certain investors use this information to evaluate the Company’s performance, profitability and ability to
generate cash flow. Accordingly, it is intended to provide additional information and should not be
considered in isolation or as a substitute for measures of performance prepared in accordance with IFRS.
The Company calculates working capital as its current assets, less its current liabilities. Management uses
working capital as an internal measure to better assess performance trends. Management understands that
a number of investors and others that follow the Company’s business assess performance in this way. For
a calculation of the Company’s working capital, refer to the section entitled Financial Condition, Cash Flows,
Liquidity and Capital Resources.
FINANCIAL INSTRUMENTS AND RISK MANAGEMENT
Foreign Currency Risk
A variation in the exchange rates between the Canadian dollar and foreign currencies could affect the
Company’s operating and financial results. The Company is exposed to foreign currency risk as the
Company holds cash in foreign currencies and has other financial assets and liabilities that are
denominated in foreign currencies. The Company’s management monitors the exchange rate fluctuations
on a regular basis and does not currently use currency derivative instruments to manage its exposure to
foreign currency fluctuations.

23
At March 31, 2018, the carrying amounts of Dalradian's foreign currency-denominated net financial assets
are approximately as follows:
(in thousands)
Net financial assets
(liabilities)
Effect of 10% change in
exchange rate on loss
U.S. dollar ............................................................................ $ (863) $ 86
Pound sterling ...................................................................... 3,985 399
Euro ..................................................................................... (119) 12
Australian dollar ................................................................... (128) 13
OUTSTANDING SHARE DATA
The following table summarizes the capitalization of the Company as at March 31, 2018:
Number of Common Shares
Common Shares ............................................................. 355,493,448
Options
Expiry1 Exercise Price
Number of Common Shares
Issuable
Proceeds if fully vested and
exercised2 (in thousands)
Expiring July 9, 2018 .................................................... $ 0.71 250,000 $ 178
Expiring February 14, 2019 .......................................... 0.85 300,000 255
Expiring June 25, 2019 ................................................ 0.98 1,300,000 1,274
Expiring September 25, 2019 ....................................... 0.71 140,000 99
Expiring March 2, 2020 ................................................ 0.78 750,000 585
Expiring April 1, 2020 ................................................... 0.87 8,333 7
Expiring April 8, 2020 ................................................... 0.92 100,000 92
Expiring August 20, 2020 ............................................. 0.90 500,000 450
Expiring August 21, 2020 ............................................. 0.91 100,000 91
Expiring December 18, 2020 ........................................ 0.67 2,083,333 1,396
Expiring May 13, 2021 ................................................. 1.14 175,000 200
Expiring December 14, 2021 ........................................ 1.30 125,000 163
Expiring December 16, 2021 ........................................ 1.19 1,400,000 1,666
Expiring February 1, 2022 ............................................ 1.33 100,000 133
Expiring June 30, 2022 ................................................ 1.65 2,160,000 3,564
Expiring January 18, 2023 ........................................... 1.27 250,000 318
Expiring January 22, 2023 ........................................... $ 1.19 100,000 119
Total Options ............................................................... 9,841,666 $ 10,590
Restricted Share Units (“RSUs”)3 .................................. - 1,740,000
Deferred Share Units (“DSUs”) ...................................... - 504,000
Total fully diluted ............................................................ 367,579,114
1 Under the Company’s share option plan, in the event that the expiry of any option falls within, or within two days of, a trading blackout period imposed by the Company (the “Blackout Period”), the expiry date of such options shall be automatically extended to the 10th business day following the end of the Blackout Period.
2 Calculated as exercise price multiplied by number of common shares. 3 Including 85,000 Performance Share Units (“PSUs”) subject to a performance condition. The number of PSUs which vest will be
adjusted by a multiple of 0% to 150% depending on the Company’s Total Shareholder Return (defined as the cumulative share price appreciation).

24
As at May 1, 2018, the Company has 355,493,448 common shares, 9,841,666 options, 1,740,000 RSUs
and 504,000 DSUs issued and outstanding, amounting to 367,579,114 common shares outstanding on a
fully-diluted basis.
FINANCIAL STATEMENTS – CRITICAL ACCOUNTING ESTIMATES
The Consolidated Financial Statements of the Company are prepared in accordance with International
Accounting Standard (“IAS”) 34, Interim Financial Reporting. The significant accounting policies of the
Company are described in note 2 of the Company’s audited consolidated financial statements for the year
ended December 31, 2017.
The preparation of the Consolidated Financial Statements requires management to make estimates,
judgments and assumptions. Measurement uncertainties are described in the Company’s audited financial
statement for the year ended December 31, 2017. There has been no change in the nature of critical
accounting estimates from the year ended December 31, 2017.
RECENT ACCOUNTING PRONOUNCEMENTS AND ADOPTION OF NEW AND AMENDED IFRS
STANDARDS
(a) Adoption of new and amended IFRS standard
The Company has adopted the IFRS standard described below as at January 1, 2018.
IFRS 9 Financial Instruments
On July 24, 2014, the IASB issued the completed IFRS 9, Financial Instruments, (IFRS 9 (2014)) to come
into effect on January 1, 2018 with early adoption permitted.
IFRS 9 (2014) includes finalized guidance on the classification and measurement of financial assets. Under
IFRS 9, financial assets are classified and measured either at amortized cost, fair value through other
comprehensive income or fair value through profit or loss based on the business model in which they are
held and the characteristics of their contractual cash flows. IFRS 9 largely retains the existing requirements
in IAS 39 Financial Instruments: recognition and measurement, for the classification and measurement of
financial liabilities.
The Company adopted IFRS 9 in its Consolidated Financial Statements on January 1, 2018. Due to the
nature of its financial instruments, the adoption of IFRS 9 had no impact on the opening accumulated deficit
balance on January 1, 2018. The impact on the classification and measurement of its financial instruments
is set out in Note 3 of the Consolidated Financial Statements.
(b) New accounting pronouncement
The following new IFRS standard is issued but not yet effective for the Company.
IFRS 16 Leases
On January 13, 2016, the IASB issued IFRS 16, Leases.
The standard introduces a single lessee accounting model and requires, unless the underlying asset is of
low value, a lessee to recognize assets and liabilities for all leases with a term of more than 12 months. A
lessee is required to recognize a right-of-use asset representing its right to use the underlying asset and a
lease liability representing its obligation to make lease payments. IFRS 16 is to come into effect on January
1, 2019 with early adoption permitted.
The Company intends to adopt IFRS 16 in its financial statements for the annual period beginning on
January 1, 2019. The extent of the impact of adoption of the standard has not yet been determined.

25
INTERNAL CONTROL OVER FINANCIAL REPORTING AND DISCLOSURE CONTROLS AND
PROCEDURES
The Company has established and maintains disclosure controls and procedures (“DC & P”) designed to
provide reasonable assurance that material information relating to the Company is made known to the Chief
Executive Officer and the Chief Financial Officer by others, particularly during the period in which annual
filings are being prepared, and that information required to be disclosed in the Company’s annual filings,
interim filings or other reports filed or submitted by it under securities legislation is recorded, processed,
summarized and reported within the time periods specified by such securities legislation.
The Company also maintains a system of internal controls over financial reporting (“ICFR”) designed under
the supervision of the Company’s Chief Executive Officer and Chief Financial Officer to provide reasonable
assurance regarding the reliability of financial reporting and the preparation of financial statements for
external purposes in accordance with IFRS, however, due to inherent limitations, ICFR may not prevent or
detect all misstatements and fraud. The Board of Directors approves the audited financial statements and
ensures that management discharges its financial responsibilities. The Audit Committee, which is
composed of independent directors, meets periodically with management and auditors to review financial
reporting and control matters and approves the interim financial statements with the Board of Directors
approving the annual financial statements.
There have been no changes during the period ended March 31, 2018 that have materially affected, or are
reasonably likely to materially affect, the Company’s ICFR.
INDUSTRY AND ECONOMIC FACTORS AFFECTING PERFORMANCE
Dalradian is a mineral development and exploration entity, whose activities include the selection,
acquisition, exploration, evaluation and development of mineral properties. Its current focus is to develop
the Curraghinalt gold deposit. The future performance of Dalradian is largely tied to the development of its
property interests and other prospective business opportunities and the overall financial markets. Financial
markets for mineral companies are volatile, reflecting ongoing concerns about the stability of commodity
prices. The Company’s financial success will be dependent upon the extent to which it can achieve
milestones in determining the economic viability of the deposits in its portfolio or of any new discoveries
that it may make. The development of such assets may take years to complete and the resulting revenue,
if any, is difficult to determine with any certainty. To date, Dalradian has not produced any revenue. The
sales value of any minerals discovered by Dalradian is largely dependent upon factors beyond its control,
such as the market value of the commodities produced. There are significant uncertainties regarding the
prices of precious metals and the availability of equity financing for the purposes of exploration and
development. Global commodity markets are volatile and uncertain which has contributed to difficulties in
raising equity and borrowing funds. As a result, the Company may have difficulties raising equity financing
for the purposes of exploration and development, particularly without excessively diluting the interests of
existing shareholders. These trends may limit the ability of Dalradian to develop and/or further explore its
current mineral exploration properties and any other property interests that may be acquired in the future.
RISK FACTORS
The Company is subject to a number of risks and uncertainties which are not discussed in this MD&A. To
properly understand such risks, readers are directed to the Company’s AIF for the year ended December
31, 2017 under the heading “Risk Factors”, which is incorporated by reference into this MD&A. The AIF is
available on SEDAR (www.sedar.com).
ADDITIONAL INFORMATION
Additional information regarding the Company, including the AIF, can be found at www.dalradian.com and
www.sedar.com.