Management’s Discussion and Analysis Management’s Discussion and Analysis ... and not to place...
100
Management’s Discussion and Analysis For the year 2016
-
Upload
duongtuyen -
Category
Documents
-
view
221 -
download
2
Transcript of Management’s Discussion and Analysis Management’s Discussion and Analysis ... and not to place...

Management’s Discussion and Analysis
For the year 2016
MANAGEMENT’S DISCUSSION AND ANALYSIS
FOR THE PERIOD ENDED DECEMBER 31, 2016
DATED: FEBRUARY 9, 2017
This Management’s Discussion and Analysis (MD&A) presents management’s view of the financial condition, results of operationsand cash flows of Great-West Lifeco Inc. (Lifeco or the Company) for the three and twelve months ended December 31, 2016 andincludes a comparison to the corresponding periods in 2015, to the three months ended September 30, 2016, and to the Company’sfinancial condition as at December 31, 2015. This MD&A provides an overall discussion, followed by analysis of the performanceof Lifeco's three major reportable segments: Canada, United States (U.S.) and Europe.
Management's Discussion and Analysis
1
BUSINESSES OF LIFECO Lifeco has operations in Canada, the United States, Europe and Asia through The Great-West Life Assurance Company (Great-West Life), London Life Insurance Company (London Life), The Canada Life Assurance Company (Canada Life), Great-West Life& Annuity Insurance Company (Great-West Financial), Putnam Investments, LLC (Putnam) and Irish Life Group Limited (Irish Life).
In Canada, Great-West Life and its operating subsidiaries, London Life and Canada Life (owned through holding companies LondonInsurance Group Inc. (LIG) and Canada Life Financial Corporation (CLFC) respectively), offer a broad portfolio of financial andbenefit plan solutions for individuals, families, businesses and organizations, through a network of Freedom 55 FinancialTM andGreat-West Life financial security advisors, and through a multi-channel network of brokers, advisors, managing general agenciesand financial institutions.
In the U.S., Great-West Financial is a leading provider of employer-sponsored retirement savings plans in the public/non-profit andcorporate sectors. Under the Empower Retirement brand name, Great-West Financial® offers employer-sponsored definedcontribution plans, individual retirement accounts, enrollment services, communication materials, investment options and educationservices as well as fund management, investment and advisory services. Its products and services are marketed nationwide throughits sales force, brokers, consultants, advisors, third-party administrators and financial institutions. Putnam provides investmentmanagement, certain administrative functions and distribution services through a broad range of investment products, including thePutnam Funds, its own family of mutual funds, which are offered to individual and institutional investors.
The Europe segment comprises two distinct business units: Insurance & Annuities, which offers protection and wealth managementproducts, including payout annuity products, through subsidiaries of Canada Life in the United Kingdom, the Isle of Man and Germanyas well as through Irish Life in Ireland; and Reinsurance, which operates primarily in the U.S., Barbados and Ireland. Reinsuranceproducts are provided through Canada Life, London Life and their subsidiaries.
In Asia, Putnam has a 10% interest in Nissay Asset Management (NAM), a partnership with Nippon Life Insurance Company.Putnam predominantly acts as a sub-advisor for certain retail mutual funds distributed by NAM and also manages pension fundassets for NAM clients.
Lifeco currently has no other holdings and carries on no business or activities unrelated to its holdings in Great-West Life, LondonLife, Canada Life, Great-West Financial, Putnam and their subsidiaries. However, Lifeco is not restricted to investing in thosecompanies and may make other investments in the future.
BASIS OF PRESENTATION AND SUMMARY OF ACCOUNTING POLICIESThe consolidated financial statements of Lifeco, which are the basis for data presented in this report, have been prepared inaccordance with International Financial Reporting Standards (IFRS) unless otherwise noted and are presented in millions of Canadiandollars unless otherwise indicated. This MD&A should be read in conjunction with the Company's consolidated financial statementsfor the period ended December 31, 2016.

CAUTIONARY NOTE REGARDING FORWARD-LOOKING INFORMATIONThis MD&A may contain forward-looking statements. Forward-looking statements include statements that are predictive in nature,depend upon or refer to future events or conditions, or include words such as "expects", "anticipates", "intends", "plans", "believes","estimates" and other similar expressions or negative versions thereof. These statements may include, without limitation, statementsabout the Company's operations, business, financial condition, expected financial performance (including revenues, earnings orgrowth rates), ongoing business strategies or prospects, and possible future actions by the Company, including statements madewith respect to the expected benefits of acquisitions and divestitures. Forward-looking statements are based on expectations,forecasts, predictions, projections and conclusions about future events that were current at the time of the statements and areinherently subject to, among other things, risks, uncertainties and assumptions about the Company, economic factors and thefinancial services industry generally, including the insurance and mutual fund industries. They are not guarantees of futureperformance, and the reader is cautioned that actual events and results could differ materially from those expressed or implied byforward-looking statements. Material factors and assumptions that were applied in formulating the forward-looking informationcontained herein include the assumption that the business and economic conditions affecting the Company’s operations will continuesubstantially in their current state, including, without limitation, with respect to customer behaviour, the Company's reputation, marketprices for products provided, sales levels, premium income, fee income, expense levels, mortality experience, morbidity experience,policy lapse rates, reinsurance arrangements, liquidity requirements, capital requirements, credit ratings, taxes, inflation, interestand foreign exchange rates, investment values, hedging activities, global equity and capital markets, business competition andother general economic, political and market factors in North America and internationally. Many of these assumptions are basedon factors and events that are not within the control of the Company and there is no assurance that they will prove to be correct.Other important factors and assumptions that could cause actual results to differ materially from those contained in forward-lookingstatements include customer responses to new products, impairments of goodwill and other intangible assets, the Company's abilityto execute strategic plans and changes to strategic plans, technological changes, breaches or failure of information systems andsecurity (including cyber attacks), payments required under investment products, changes in local and international laws andregulations, changes in accounting policies and the effect of applying future accounting policy changes, unexpected judicial orregulatory proceedings, catastrophic events, continuity and availability of personnel and third party service providers, the Company'sability to complete strategic transactions and integrate acquisitions and unplanned material changes to the Company's facilities,customer and employee relations or credit arrangements. The reader is cautioned that the foregoing list of assumptions and factorsis not exhaustive, and there may be other factors listed in other filings with securities regulators, including factors set out in theCompany's 2016 Annual MD&A under "Risk Management and Control Practices" and "Summary of Critical Accounting Estimates",which, along with other filings, is available for review at www.sedar.com. The reader is also cautioned to consider these and otherfactors, uncertainties and potential events carefully and not to place undue reliance on forward-looking statements. Other than asspecifically required by applicable law, the Company does not intend to update any forward-looking statements whether as a resultof new information, future events or otherwise.
CAUTIONARY NOTE REGARDING NON-IFRS FINANCIAL MEASURESThis MD&A contains some non-IFRS financial measures. Terms by which non-IFRS financial measures are identified include, butare not limited to, "operating earnings", "constant currency basis", "premiums and deposits", "sales", "assets under management","assets under administration" and other similar expressions. Non-IFRS financial measures are used to provide management andinvestors with additional measures of performance to help assess results where no comparable IFRS measure exists. However,non-IFRS financial measures do not have standard meanings prescribed by IFRS and are not directly comparable to similar measuresused by other companies. Please refer to the appropriate reconciliations of these non-IFRS financial measures to measuresprescribed by IFRS.
Management's Discussion and Analysis
2
CONSOLIDATED OPERATING RESULTS
Management's Discussion and Analysis
3
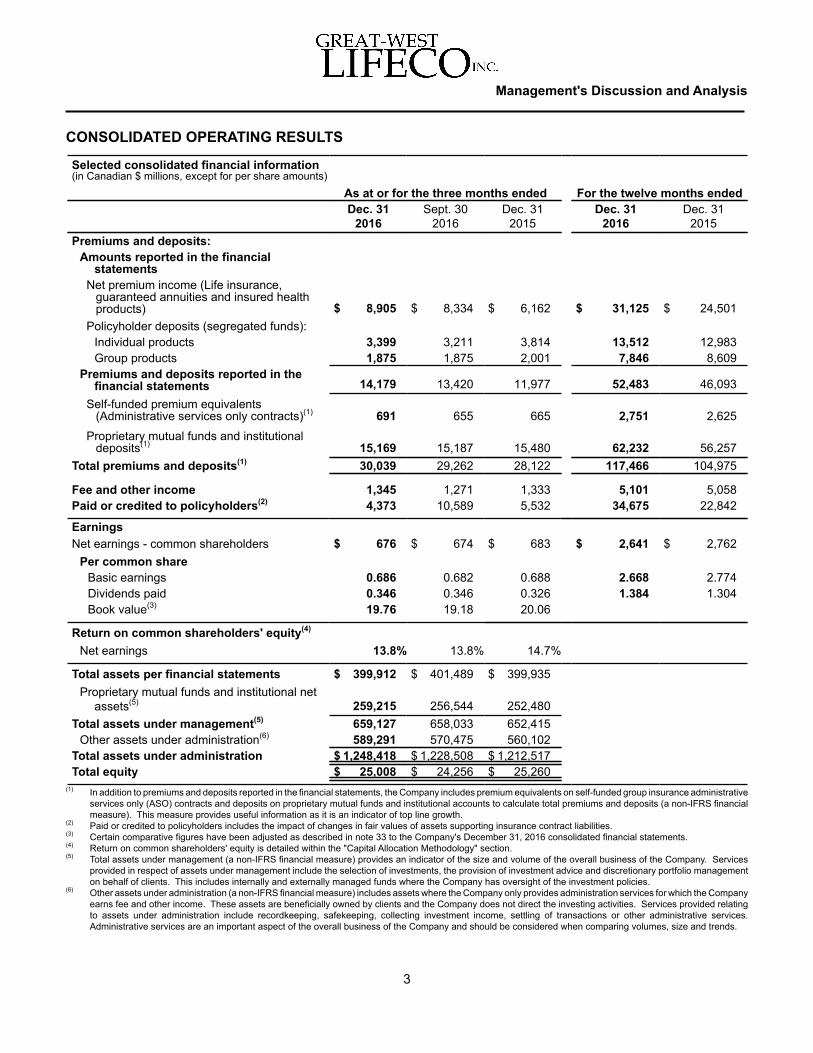
Selected consolidated financial information(in Canadian $ millions, except for per share amounts)
As at or for the three months ended For the twelve months endedDec. 31
2016Sept. 30
2016Dec. 31
2015Dec. 31
2016Dec. 31
2015Premiums and deposits:
Amounts reported in the financialstatements
Net premium income (Life insurance,guaranteed annuities and insured healthproducts) $ 8,905 $ 8,334 $ 6,162 $ 31,125 $ 24,501
Policyholder deposits (segregated funds):Individual products 3,399 3,211 3,814 13,512 12,983Group products 1,875 1,875 2,001 7,846 8,609
Premiums and deposits reported in thefinancial statements 14,179 13,420 11,977 52,483 46,093
Self-funded premium equivalents(Administrative services only contracts)(1) 691 655 665 2,751 2,625
Proprietary mutual funds and institutionaldeposits(1) 15,169 15,187 15,480 62,232 56,257
Total premiums and deposits(1) 30,039 29,262 28,122 117,466 104,975
Fee and other income 1,345 1,271 1,333 5,101 5,058Paid or credited to policyholders(2) 4,373 10,589 5,532 34,675 22,842
EarningsNet earnings - common shareholders $ 676 $ 674 $ 683 $ 2,641 $ 2,762
Per common shareBasic earnings 0.686 0.682 0.688 2.668 2.774Dividends paid 0.346 0.346 0.326 1.384 1.304Book value(3) 19.76 19.18 20.06
Return on common shareholders' equity(4)
Net earnings 13.8% 13.8% 14.7%
Total assets per financial statements $ 399,912 $ 401,489 $ 399,935Proprietary mutual funds and institutional net
assets(5) 259,215 256,544 252,480Total assets under management(5) 659,127 658,033 652,415
Other assets under administration(6) 589,291 570,475 560,102Total assets under administration $ 1,248,418 $ 1,228,508 $ 1,212,517Total equity $ 25,008 $ 24,256 $ 25,260
(1) In addition to premiums and deposits reported in the financial statements, the Company includes premium equivalents on self-funded group insurance administrativeservices only (ASO) contracts and deposits on proprietary mutual funds and institutional accounts to calculate total premiums and deposits (a non-IFRS financialmeasure). This measure provides useful information as it is an indicator of top line growth.
(2) Paid or credited to policyholders includes the impact of changes in fair values of assets supporting insurance contract liabilities.(3) Certain comparative figures have been adjusted as described in note 33 to the Company's December 31, 2016 consolidated financial statements.(4) Return on common shareholders' equity is detailed within the "Capital Allocation Methodology" section.(5) Total assets under management (a non-IFRS financial measure) provides an indicator of the size and volume of the overall business of the Company. Services
provided in respect of assets under management include the selection of investments, the provision of investment advice and discretionary portfolio managementon behalf of clients. This includes internally and externally managed funds where the Company has oversight of the investment policies.
(6) Other assets under administration (a non-IFRS financial measure) includes assets where the Company only provides administration services for which the Companyearns fee and other income. These assets are beneficially owned by clients and the Company does not direct the investing activities. Services provided relatingto assets under administration include recordkeeping, safekeeping, collecting investment income, settling of transactions or other administrative services.Administrative services are an important aspect of the overall business of the Company and should be considered when comparing volumes, size and trends.

LIFECO 2016 HIGHLIGHTS
Maintained strong capital position and solid financial performance
• The Company's strong capital position is evidenced by a Minimum Continuing Capital and SurplusRequirements (MCCSR) ratio at December 31, 2016 of 240% for The Great-West Life Assurance Company,Lifeco’s major Canadian operating subsidiary.
• For the twelve months ended December 31, 2016, net earnings attributable to common shareholders were$2,641 million, a decrease of 4% from the previous year. While net earnings in the Canada and Europesegments finished the year up from 2015, earnings were negatively impacted by currency movement,particularly the weakening of the British pound, and lower earnings in the U.S. segment, which included $20million of restructuring costs related to a realignment of Putnam.
• In 2016, Lifeco’s quarterly common share dividend increased 6% to $0.3460 per share.
• The Company returned to the European capital markets in December 2016 with the issuance of 500 millioneuro-denominated 10-year bonds, with proceeds used to further support foreign operations and for generalcorporate purposes. The bonds pay an annual coupon of 1.75%, are rated A+ by Standard & Poor's RatingServices and are listed on the Irish Stock Exchange.
• The Company’s financial leverage ratio at December 31, 2016 was 28%, including the issuance of the 500million euro-denominated bonds. This was consistent with credit rating agencies’ targets for highly rated entitiesand provides the Company with financial flexibility to invest in organic growth and acquisition strategies.
Stability during challenging global economic and regulatory conditions
• On June 23, 2016, the U.K. voted to leave the European Union (EU). The Company's operations in Europehave strong, stable businesses and a diversified investment portfolio. The Company's U.K. operations areprimarily domestic businesses and have continued to perform well during this period of uncertainty. Operationsin Ireland and Germany are domestic and have experienced minimal impact. These businesses areappropriately capitalized and the Company remains committed to these markets. The most notable impacton the Company's financial results in 2016 has been the weakening of the British pound. The decline in thesecond half of 2016 reduced the average currency translation rate for the Company's British pound net earningsby 12% compared to the first half of 2016. The Company will continue to work closely with customers, businesspartners and regulators over the next few years as the U.K. and the EU enter a period of negotiation and agreeon their new relationship.
• On September 12, 2016, the Office of the Superintendent of Financial Institutions (OSFI) issued the LifeInsurance Capital Adequacy Test (LICAT) guideline. Effective January 1, 2018, OSFI plans for the LICATguideline to replace the MCCSR guideline. OSFI has stated that the LICAT guideline is not expected to increasethe amount of capital in the industry compared to the current MCCSR guideline and is continuing to conductassessments of the new guideline. The Company will continue its ongoing dialogue with OSFI and industryparticipants during 2017.
• In Europe, Solvency II regulations were effective in 2016 and have been a focus of the Company's regulatedEuropean businesses. All of the Company's regulated European-based subsidiaries have met the newrequirements. During the year, the Company effectively managed capital volatility under the new regulations.In 2017, work will continue on refining the Company's internal risk models and management of potential capitalvolatility under the new regulations.
Management's Discussion and Analysis
4
• The recent elections in the U.S. have brought into focus the prospects for significant policy changes, includingcorporate federal tax reform. Both Congress and the President share the same goal of reducing corporateincome tax rates for businesses. A reduction in the corporate tax rate would likely have a favourable impacton the Company's effective tax rate in the years subsequent to the year of enactment. Any change in tax lawsand rates may affect recorded deferred tax assets and deferred tax liabilities and the effective tax rate in thefuture. A reduction in the statutory corporate tax rate would result in a reduction in the deferred tax asset ordeferred tax liability, which may give rise to a one-time negative impact on the financial results of operationsin the year of enactment. Any one-time adjustment to the deferred tax accounts would not affect cash taxespaid.
Outlook for 2017
• Lifeco is focused on investing strategically to drive growth and productivity while maintaining a strong risk andexpense discipline to deliver long-term value to its customers and shareholders.
• In Canada, the core business units will be realigned to focus on individual and group customers supported bya new strategic customer marketing function. With the goal of creating a more holistic customer experience,these changes will support earnings growth balanced with reinvestment in customer-centered innovations andservice offerings, generated through productivity gains and cost savings.
• In the U.S., work continues on streamlining back office processes to support Empower Retirement growth,cost savings and improving customer experience and engagement. At Putnam, expense reductions resultingfrom the realignment of resources were announced to support the objective of building a scalable, profitableasset management franchise with continued focus on strong investment performance. Following the U.S.election, the U.S. markets and interest rates have increased which is expected to have a positive impact onthe results of the business; although volatility is expected to continue into 2017 as the new PresidentialAdministration unveils its initiatives.
• In Europe, development of the Company's U.K. bulk annuity capabilities will continue to complement theCompany's strong position in the U.K. retail payout annuity market. Investment in digital opportunities willremain a focal point to grow the Company's market leading U.K. group risk business. In Ireland, deepeningand broadening the market leading retail, corporate and investment management businesses while managingcosts will continue to be the focus. In Germany, the Company will strengthen its presence in the growingmarket for pension unit-linked products by maintaining innovative products and a strong service offering.Investments will continue in technology to drive processing efficiencies and lay the foundation for enhancedfuture capabilities for the German business. Reinsurance will build on its diversified multi-niche base to continueto meet client needs.
Management's Discussion and Analysis
5
NET EARNINGSConsolidated net earnings of Lifeco include the net earnings of Great-West Life and its operating subsidiaries, LondonLife, Canada Life and Irish Life; Great-West Financial and Putnam; together with Lifeco’s Corporate operating results.
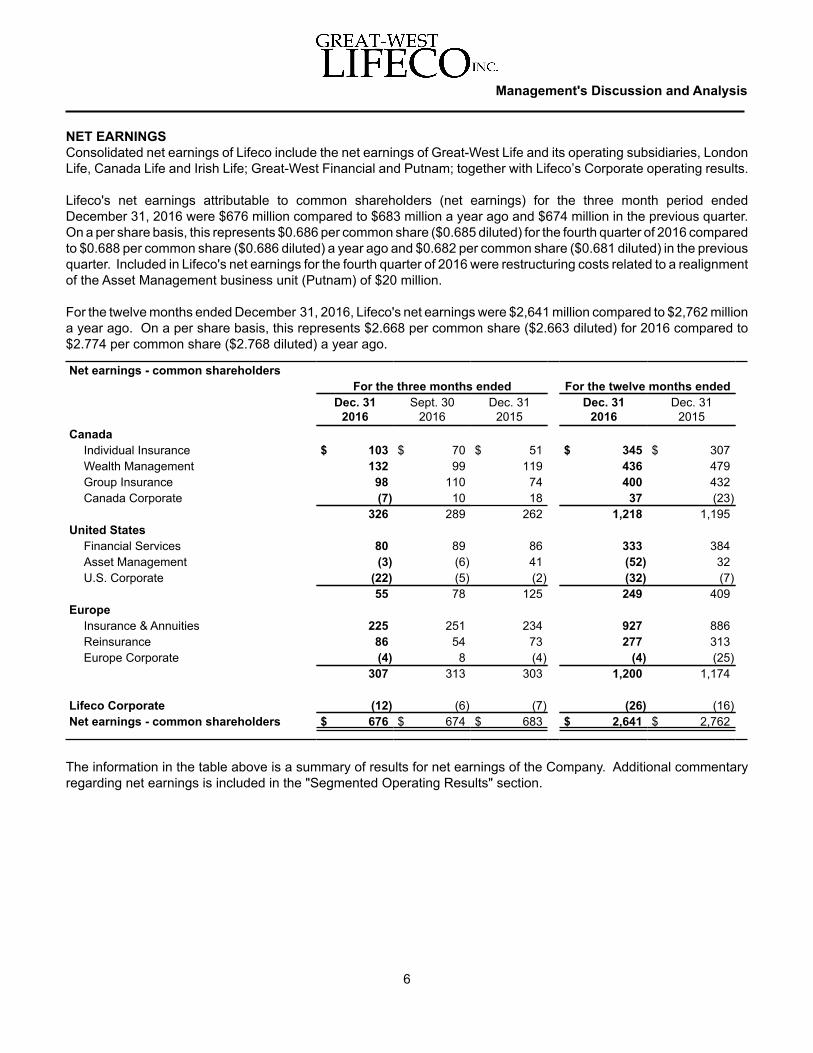
Lifeco's net earnings attributable to common shareholders (net earnings) for the three month period endedDecember 31, 2016 were $676 million compared to $683 million a year ago and $674 million in the previous quarter.On a per share basis, this represents $0.686 per common share ($0.685 diluted) for the fourth quarter of 2016 comparedto $0.688 per common share ($0.686 diluted) a year ago and $0.682 per common share ($0.681 diluted) in the previousquarter. Included in Lifeco's net earnings for the fourth quarter of 2016 were restructuring costs related to a realignmentof the Asset Management business unit (Putnam) of $20 million.
For the twelve months ended December 31, 2016, Lifeco's net earnings were $2,641 million compared to $2,762 milliona year ago. On a per share basis, this represents $2.668 per common share ($2.663 diluted) for 2016 compared to$2.774 per common share ($2.768 diluted) a year ago.
Net earnings - common shareholdersFor the three months ended For the twelve months ended
Dec. 312016
Sept. 302016
Dec. 312015
Dec. 312016
Dec. 312015
CanadaIndividual Insurance $ 103 $ 70 $ 51 $ 345 $ 307Wealth Management 132 99 119 436 479Group Insurance 98 110 74 400 432Canada Corporate (7) 10 18 37 (23)
326 289 262 1,218 1,195United States
Financial Services 80 89 86 333 384Asset Management (3) (6) 41 (52) 32U.S. Corporate (22) (5) (2) (32) (7)
55 78 125 249 409Europe
Insurance & Annuities 225 251 234 927 886Reinsurance 86 54 73 277 313Europe Corporate (4) 8 (4) (4) (25)
307 313 303 1,200 1,174
Lifeco Corporate (12) (6) (7) (26) (16)Net earnings - common shareholders $ 676 $ 674 $ 683 $ 2,641 $ 2,762
The information in the table above is a summary of results for net earnings of the Company. Additional commentaryregarding net earnings is included in the "Segmented Operating Results" section.
Management's Discussion and Analysis
6

MARKET IMPACTS
Interest Rate EnvironmentInterest rates in countries where the Company operates mostly increased during 2016, except in the U.K., where ratesdecreased. The net change in interest rates did not impact the range of interest rate scenarios tested through thevaluation process and had no material impact on net earnings. The net change in interest rates for the quarter andyear-to-date did not have a material impact on Great-West Life's MCCSR ratio.
In order to mitigate the Company's exposure to interest rate fluctuations, the Company follows disciplined processesfor matching asset and liability cash flows. As a result, the impact of changes in fair values of bonds backing insurancecontract liabilities recorded through profit or loss is mostly offset by a corresponding change in the insurance contractliabilities.
The Company's sensitivity to interest rate fluctuations is detailed in the "Accounting Policies - Summary of CriticalAccounting Estimates" section.
Equity MarketsIn the regions where the Company operates, average equity market levels in the fourth quarter of 2016 and year-to-date were mostly up compared to the same periods in 2015 and ended the quarter at higher market levels comparedto September 30, 2016. Relative to the Company's expectation, the change in average market levels and marketvolatility had a negligible impact on net earnings during the fourth quarter of 2016 and a negative impact of $10 millionyear-to-date in 2016 ($9 million positive impact in the fourth quarter of 2015 and $12 million negative impact year-to-date in 2015), related to asset-based fee income and the costs related to guarantees of death, maturity or incomebenefits within certain wealth management products offered by the Company. In addition, the impact on net earningswas negligible in the fourth quarter of 2016 and positive $4 million year-to-date in 2016 ($6 million positive impact inthe fourth quarter of 2015 and $5 million positive impact year-to-date in 2015), related to seed money investmentsheld in the Asset Management and Canada Corporate business units.
Comparing the fourth quarter of 2016 to the fourth quarter of 2015, average equity market levels were up by 11% inCanada (as measured by S&P TSX), 7% in the U.S. (as measured by S&P 500), 10% in the U.K. (as measured byFTSE 100); however, were down by 7% in broader Europe (as measured by Eurostoxx 50). The major equity indicesfinished the fourth quarter up 4% in Canada, 3% in the U.S., 4% in the U.K. and 10% in broader Europe, compared toSeptember 30, 2016.
Foreign CurrencyThroughout this document, a number of terms are used to highlight the impact of foreign exchange on results, suchas: "constant currency basis", "impact of currency movement" and "effect of currency translation fluctuations". Thesemeasures have been calculated using the average or period end rates, as appropriate, in effect at the date of thecomparative period. This non-IFRS measure provides useful information as it facilitates the comparability of resultsbetween periods.
The average currency translation rate for the fourth quarter of 2016 decreased for the U.S. dollar, the British poundand the euro compared to the fourth quarter of 2015. The overall impact of currency movement on the Company’snet earnings for the three month period ended December 31, 2016 was a decrease of $33 million ($50 million year-to-date) compared to translation rates a year ago.
From September 30, 2016 to December 31, 2016, the market rate at the end of the reporting period used to translateU.S. dollar assets and liabilities to the Canadian dollar increased, while the end-of-period market rates for euro andBritish pound assets and liabilities decreased. The movements in end-of-period market rates resulted in unrealizedforeign exchange losses from the translation of foreign operations, including related hedging activities, of $50 millionin-quarter ($1,449 million net unrealized losses year-to-date) recorded in other comprehensive income.
Translation rates for the reporting period and comparative periods are detailed in the "Translation of Foreign Currency"section.
Management's Discussion and Analysis
7
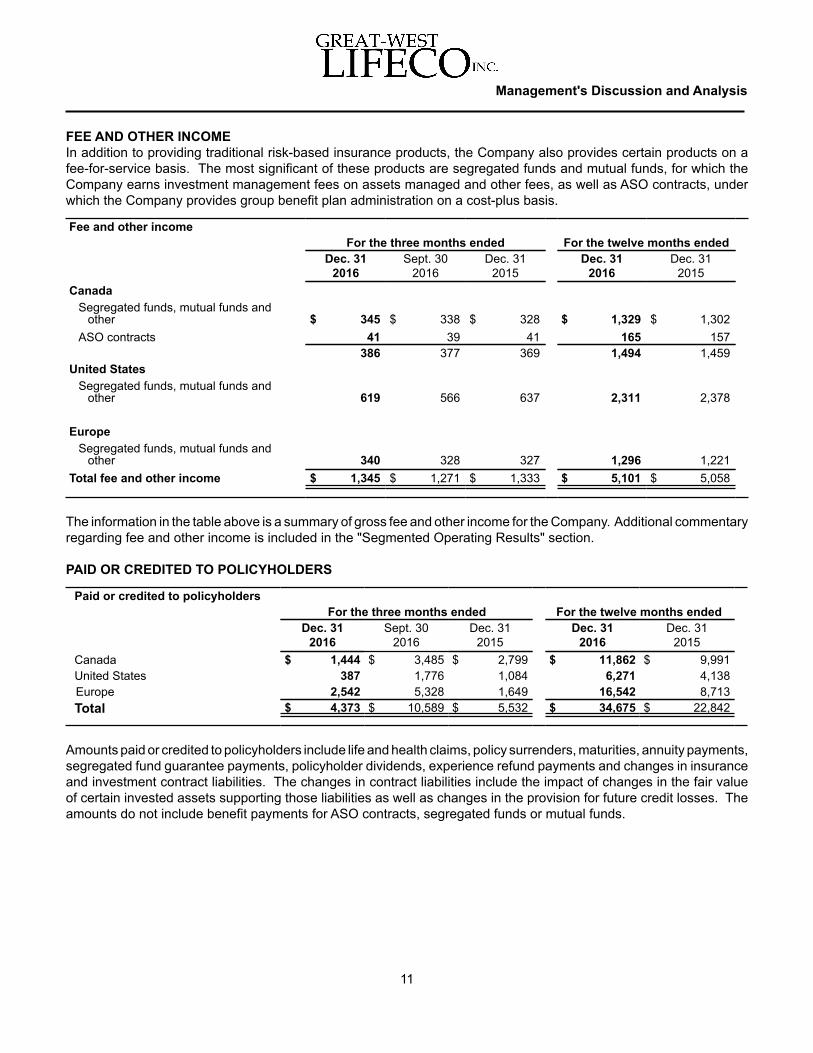
Credit Markets
Credit markets impact on common shareholders' net earnings (after-tax)For the three months ended December 31, 2016 For the twelve months ended December 31, 2016
Impairment(charges) /recoveries
Changes inprovisions for
futurecredit
losses ininsurancecontract
liabilities Total
Impairment(charges) /recoveries
Changes inprovisions for
futurecredit
losses ininsurancecontract
liabilities TotalCanada $ — $ (2) $ (2) $ — $ 1 $ 1United States (1) 1 — 1 (1) —Europe 5 3 8 (18) 12 (6)Total $ 4 $ 2 $ 6 $ (17) $ 12 $ (5)
In the fourth quarter of 2016, the Company experienced net recoveries on impaired investments, including dispositions,which positively impacted net earnings by $4 million ($1 million net charge in the fourth quarter of 2015). Changes incredit ratings in the Company's bond portfolio resulted in a net decrease to provisions for future credit losses in insurancecontract liabilities, which positively impacted net earnings by $2 million in the quarter ($25 million net charge in thefourth quarter of 2015). For the twelve months ended December 31, 2016, the Company experienced net charges on impaired investments,including dispositions, which negatively impacted net earnings by $17 million ($7 million net recovery in 2015), primarilydriven by impairment charges on mortgage loans as a result of the insolvency of British Homes Stores (BHS), a U.K.retailer. Changes in credit ratings in the Company's bond portfolio resulted in a net decrease to provisions for futurecredit losses in insurance contract liabilities, which positively impacted net earnings by $12 million year-to-date ($55million net charge in 2015).
Management's Discussion and Analysis
8
ACTUARIAL ASSUMPTION CHANGESDuring the fourth quarter of 2016, the Company updated a number of actuarial assumptions resulting in a positive netearnings impact of $115 million, compared to $97 million for the same quarter last year and $171 million for the previousquarter. In Europe, net earnings were positively impacted by $75 million, primarily due to the impact of updatedeconomic, annuitant mortality and morbidity assumptions, partially offset by the impact of updated expenseassumptions. In the U.S., net earnings were positively impacted by $20 million, primarily due to the impact of updatedeconomic assumptions. In Canada, net earnings were positively impacted by $20 million due to the impact of a numberof small assumption changes, including updated economic assumptions, modeling refinements and updated expenseassumptions.
For the twelve months ended December 31, 2016, actuarial assumption changes resulted in a positive net earningsimpact of $446 million, compared to $376 million for the same period in 2015.

PREMIUMS AND DEPOSITS AND SALESTotal premiums and deposits (a non-IFRS financial measure) include premiums on risk-based insurance and annuityproducts net of ceded reinsurance (as defined under IFRS), premium equivalents on self-funded group insuranceadministrative services only (ASO) contracts, deposits on individual and group segregated fund products as well asdeposits on proprietary mutual funds and institutional accounts. This measure provides an indicator of top-line growth.
Sales (a non-IFRS financial measure) for risk-based insurance and annuity products include 100% of single premiumand annualized premiums expected in the first twelve months of the plan. Group insurance and ASO sales reflectannualized premiums and premium equivalents for new policies and new benefits covered or expansion of coverageon existing policies. For individual wealth management products, sales include deposits on segregated fund products,proprietary mutual funds and institutional accounts as well as deposits on non-proprietary mutual funds. For groupwealth management products, sales include assets transferred from previous plan providers and the expected annualcontributions from the new plan. This measure provides an indicator of new business growth.
Premiums and depositsFor the three months ended For the twelve months ended
Dec. 312016
Sept. 302016
Dec. 312015
Dec. 312016
Dec. 312015
CanadaIndividual Insurance $ 1,543 $ 1,298 $ 1,304 $ 5,371 $ 4,894Wealth Management 3,041 2,716 2,804 10,979 10,832Group Insurance 2,097 2,040 2,002 8,311 7,838
6,681 6,054 6,110 24,661 23,564United States
Financial Services 3,525 3,575 5,087 14,156 13,798Asset Management 11,119 11,341 10,869 45,471 39,850
14,644 14,916 15,956 59,627 53,648Europe
Insurance & Annuities 4,984 5,325 4,497 22,276 22,127Reinsurance 3,730 2,967 1,559 10,902 5,636
8,714 8,292 6,056 33,178 27,763Total premiums and deposits $ 30,039 $ 29,262 $ 28,122 $ 117,466 $ 104,975
SalesFor the three months ended For the twelve months ended
Dec. 312016
Sept. 302016
Dec. 312015
Dec. 312016
Dec. 312015
Canada $ 3,871 $ 3,117 $ 3,492 $ 12,933 $ 12,635United States 18,384 23,011 31,630 98,218 95,715Europe - Insurance & Annuities 4,410 4,645 3,917 19,179 19,485
Total sales $ 26,665 $ 30,773 $ 39,039 $ 130,330 $ 127,835
The information in the table above is a summary of results for the Company's total premiums and deposits and sales.Additional commentary regarding premiums and deposits and sales is included in the "Segmented Operating Results"section.
Management's Discussion and Analysis
9

NET INVESTMENT INCOME
Net investment incomeFor the three months ended For the twelve months ended
Dec. 312016
Sept. 302016
Dec. 312015
Dec. 312016
Dec. 312015
Investment income earned (net of investmentproperties expenses) $ 1,522 $ 1,480 $ 1,623 $ 6,229 $ 6,168
Allowances for credit losses on loans andreceivables (13) 1 (1) (35) —
Net realized gains 25 41 78 165 213Regular investment income 1,534 1,522 1,700 6,359 6,381Investment expenses (27) (26) (30) (107) (110)Regular net investment income 1,507 1,496 1,670 6,252 6,271Changes in fair value through profit or loss (3,943) 2,307 (844) 3,903 (2,010)Net investment income $ (2,436) $ 3,803 $ 826 $ 10,155 $ 4,261
Net investment income in the fourth quarter of 2016, which includes changes in fair value through profit or loss,decreased by $3,262 million compared to the same quarter last year. The changes in fair value in the fourth quarterof 2016 were a decrease of $3,943 million compared to a decrease of $844 million for the fourth quarter of 2015. Inthe fourth quarter of 2016, the decrease was primarily due to an increase in bond yields across all geographies. Inthe fourth quarter of 2015, the decrease was primarily due to an increase in U.K. and U.S. bond yields.
Regular net investment income in the fourth quarter of 2016, which excludes changes in fair value through profit orloss, decreased by $163 million compared to the fourth quarter of 2015. The decrease was primarily due to the impactof currency movement as the Canadian dollar strengthened against the British pound, as well as lower net realizedgains. Net realized gains include gains on available-for-sale securities of $14 million for the fourth quarter of 2016compared to $4 million for the same quarter last year.
For the twelve months ended December 31, 2016, net investment income increased by $5,894 million compared tothe same period last year. The changes in fair value for the twelve month period in 2016 were an increase of $3,903million compared to a decrease of $2,010 million during the same period in 2015. The changes in fair value wereprimarily due to a decline in U.K. bond yields and an increase in Canadian equity markets during 2016, compared toan increase in U.K. and U.S. bond yields and a decline in Canadian equity markets during 2015.
Regular net investment income for the twelve months ended December 31, 2016 decreased by $19 million comparedto the same period last year. The decrease was primarily due to the impact of currency movement as the Canadiandollar strengthened against the British pound, as well as lower net realized gains, partially offset by the impact of theU.S. dollar strengthening against the Canadian dollar. Net realized gains include gains on available-for-sale securitiesof $84 million for the twelve months ended December 31, 2016, compared to $106 million for the same period lastyear.
Net investment income in the fourth quarter of 2016 decreased by $6,239 million compared to the previous quarter,primarily due to net decreases in fair values of $3,943 million in the fourth quarter of 2016 compared to net increasesin fair values of $2,307 million in the previous quarter. The net decrease in fair values during the fourth quarter wasprimarily due to an increase in bond yields, while the net increase in fair values during the previous quarter was primarilydue to a decrease in bond yields.
Management's Discussion and Analysis
10
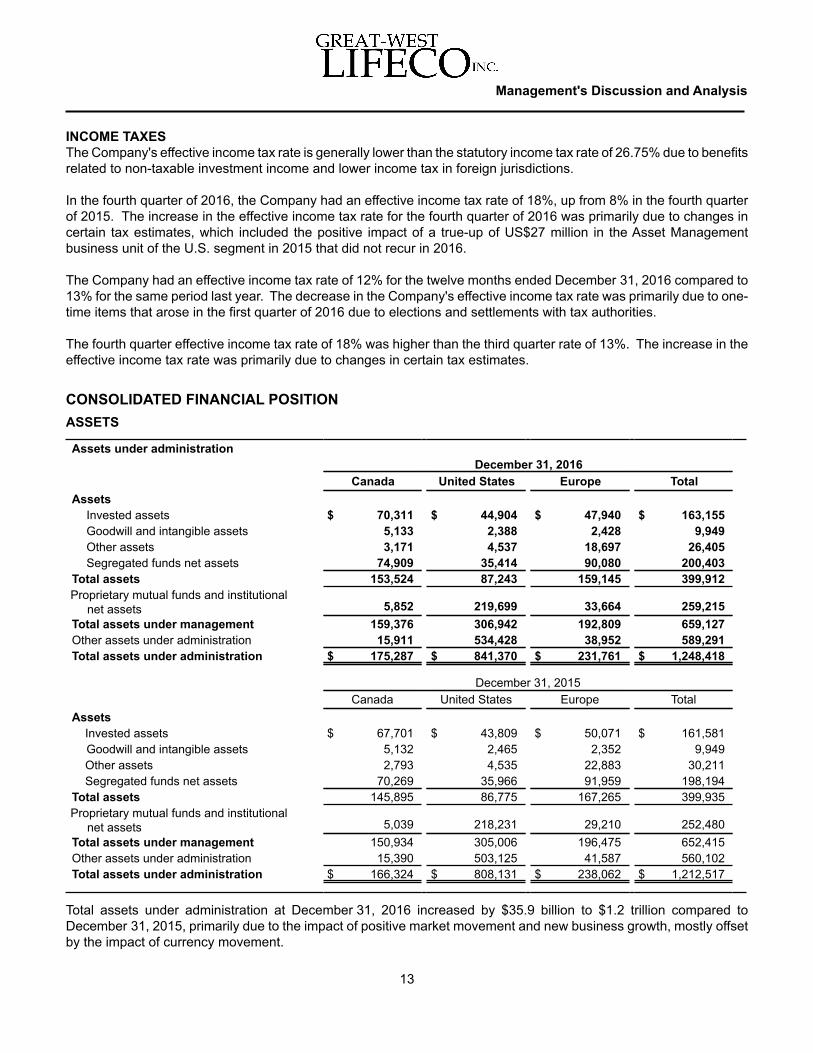
FEE AND OTHER INCOMEIn addition to providing traditional risk-based insurance products, the Company also provides certain products on afee-for-service basis. The most significant of these products are segregated funds and mutual funds, for which theCompany earns investment management fees on assets managed and other fees, as well as ASO contracts, underwhich the Company provides group benefit plan administration on a cost-plus basis.
Fee and other incomeFor the three months ended For the twelve months ended
Dec. 312016
Sept. 302016
Dec. 312015
Dec. 312016
Dec. 312015
CanadaSegregated funds, mutual funds and
other $ 345 $ 338 $ 328 $ 1,329 $ 1,302ASO contracts 41 39 41 165 157
386 377 369 1,494 1,459United States
Segregated funds, mutual funds andother 619 566 637 2,311 2,378
EuropeSegregated funds, mutual funds and
other 340 328 327 1,296 1,221Total fee and other income $ 1,345 $ 1,271 $ 1,333 $ 5,101 $ 5,058
The information in the table above is a summary of gross fee and other income for the Company. Additional commentaryregarding fee and other income is included in the "Segmented Operating Results" section.
Management's Discussion and Analysis
11
PAID OR CREDITED TO POLICYHOLDERS
Paid or credited to policyholdersFor the three months ended For the twelve months ended
Dec. 312016
Sept. 302016
Dec. 312015
Dec. 312016
Dec. 312015
Canada $ 1,444 $ 3,485 $ 2,799 $ 11,862 $ 9,991United States 387 1,776 1,084 6,271 4,138Europe 2,542 5,328 1,649 16,542 8,713Total $ 4,373 $ 10,589 $ 5,532 $ 34,675 $ 22,842
Amounts paid or credited to policyholders include life and health claims, policy surrenders, maturities, annuity payments,segregated fund guarantee payments, policyholder dividends, experience refund payments and changes in insuranceand investment contract liabilities. The changes in contract liabilities include the impact of changes in the fair valueof certain invested assets supporting those liabilities as well as changes in the provision for future credit losses. Theamounts do not include benefit payments for ASO contracts, segregated funds or mutual funds.

For the three months ended December 31, 2016, consolidated amounts paid or credited to policyholders were $4.4billion, including $7.9 billion of policyholder benefit payments and a $3.5 billion decrease in contract liabilities. Thedecrease of $1.2 billion from the same period in 2015 consisted of a $3.2 billion decrease in changes in contractliabilities and a $2.0 billion increase in benefit payments. The decrease in changes in contract liabilities was primarilydue to fair value adjustments to insurance contract liabilities as a result of changes in interest rates in Canada, theU.S. and Europe. The increase in benefit payments was primarily due to new and restructured reinsurance treaties,partially offset by the impact of currency movement.
For the twelve months ended December 31, 2016, consolidated amounts paid or credited to policyholders were $34.7billion, including $27.7 billion of policyholder benefit payments and a $7.0 billion increase in contract liabilities. Theincrease of $11.8 billion from the same period in 2015 consisted of a $6.1 billion increase in changes in contract liabilitiesand a $5.7 billion increase in benefit payments. The increase in changes in contract liabilities was primarily due to fairvalue adjustments to insurance contract liabilities as a result of changes in interest rates in Canada, the U.S. andEurope, partially offset by the impact of the acquisition of The Equitable Life Assurance Society's (Equitable Life) annuitybusiness, which increased contract liabilities in the first quarter of 2015. The increase in benefit payments was primarilydue to new and restructured reinsurance treaties.
Compared to the previous quarter, consolidated amounts paid or credited to policyholders decreased by $6.2 billion.The decrease consisted of a $6.7 billion decrease in changes in contract liabilities, primarily due to fair value adjustmentsto insurance contract liabilities as a result of changes in interest rates in Canada, the U.S. and Europe. The decreasewas partially offset by a $0.5 billion increase in benefit payments, primarily due to new reinsurance treaties, moderatedby the impact of lower business volumes.
Management's Discussion and Analysis
12
OTHER BENEFITS AND EXPENSES
Other benefits and expensesFor the three months ended For the twelve months ended
Dec. 312016
Sept. 302016
Dec. 312015
Dec. 312016
Dec. 312015
Commissions $ 853 $ 584 $ 584 $ 2,602 $ 2,218Operating and administrative expenses 1,250 1,180 1,175 4,799 4,466Premium taxes 112 109 92 411 339Financing charges 75 74 73 302 303Amortization of finite life intangible assets 44 43 37 177 146Restructuring and acquisition expenses 35 19 7 63 35Total $ 2,369 $ 2,009 $ 1,968 $ 8,354 $ 7,507
Other benefits and expenses for the fourth quarter of 2016 of $2,369 million increased by $401 million compared tothe fourth quarter of 2015, primarily due to higher commissions, driven by higher sales in Canada, as well as an increasein operating and administrative expenses related to increased business volumes and strategic initiatives. For the twelve months ended December 31, 2016, other benefits and expenses increased by $847 million to $8,354million compared to the same period last year, primarily due to the same reasons discussed for the in-quarter resultsas well as higher premium taxes.
Other benefits and expenses for the fourth quarter of 2016 increased by $360 million compared to the previous quarter,primarily due to higher commissions, driven by higher sales in Canada, and higher operating and administrativeexpenses related to increased business volumes and strategic initiatives.
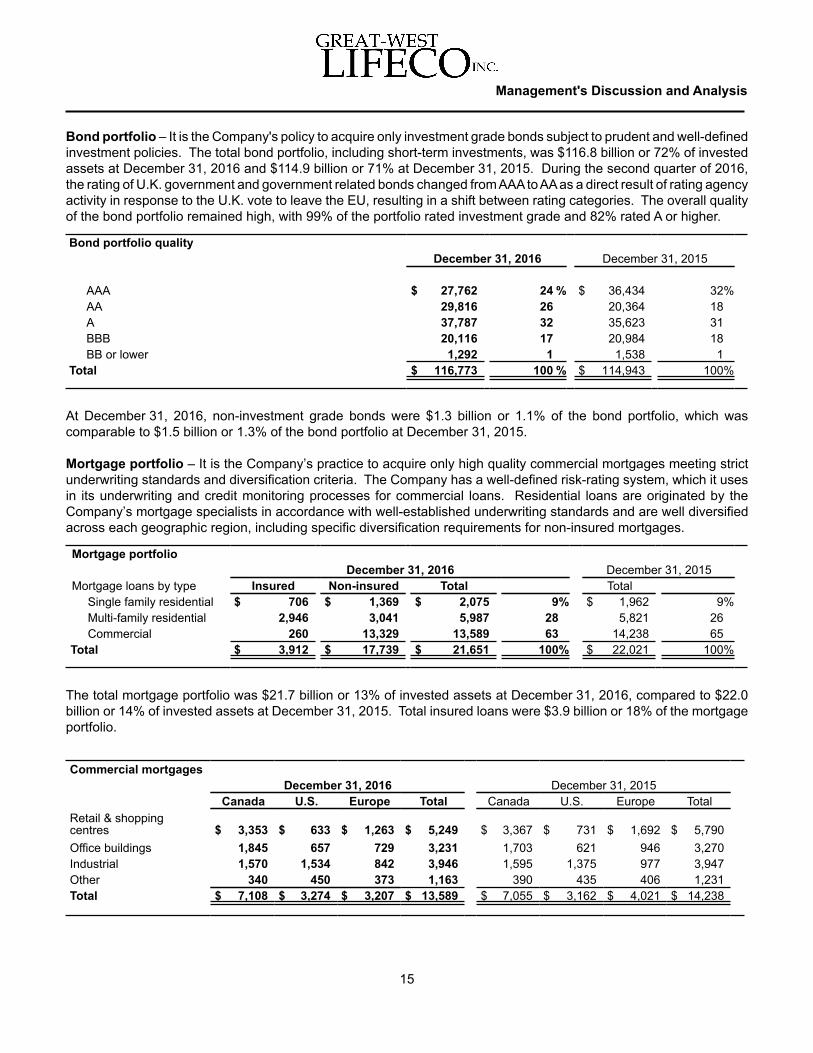
INCOME TAXES The Company's effective income tax rate is generally lower than the statutory income tax rate of 26.75% due to benefitsrelated to non-taxable investment income and lower income tax in foreign jurisdictions.
In the fourth quarter of 2016, the Company had an effective income tax rate of 18%, up from 8% in the fourth quarterof 2015. The increase in the effective income tax rate for the fourth quarter of 2016 was primarily due to changes incertain tax estimates, which included the positive impact of a true-up of US$27 million in the Asset Managementbusiness unit of the U.S. segment in 2015 that did not recur in 2016.
The Company had an effective income tax rate of 12% for the twelve months ended December 31, 2016 compared to13% for the same period last year. The decrease in the Company's effective income tax rate was primarily due to one-time items that arose in the first quarter of 2016 due to elections and settlements with tax authorities.
The fourth quarter effective income tax rate of 18% was higher than the third quarter rate of 13%. The increase in theeffective income tax rate was primarily due to changes in certain tax estimates.
Management's Discussion and Analysis
13
CONSOLIDATED FINANCIAL POSITIONASSETS
Assets under administrationDecember 31, 2016
Canada United States Europe TotalAssets
Invested assets $ 70,311 $ 44,904 $ 47,940 $ 163,155Goodwill and intangible assets 5,133 2,388 2,428 9,949Other assets 3,171 4,537 18,697 26,405Segregated funds net assets 74,909 35,414 90,080 200,403
Total assets 153,524 87,243 159,145 399,912Proprietary mutual funds and institutional net assets 5,852 219,699 33,664 259,215Total assets under management 159,376 306,942 192,809 659,127Other assets under administration 15,911 534,428 38,952 589,291Total assets under administration $ 175,287 $ 841,370 $ 231,761 $ 1,248,418
December 31, 2015Canada United States Europe Total
AssetsInvested assets $ 67,701 $ 43,809 $ 50,071 $ 161,581Goodwill and intangible assets 5,132 2,465 2,352 9,949Other assets 2,793 4,535 22,883 30,211Segregated funds net assets 70,269 35,966 91,959 198,194
Total assets 145,895 86,775 167,265 399,935Proprietary mutual funds and institutional net assets 5,039 218,231 29,210 252,480Total assets under management 150,934 305,006 196,475 652,415Other assets under administration 15,390 503,125 41,587 560,102Total assets under administration $ 166,324 $ 808,131 $ 238,062 $ 1,212,517
Total assets under administration at December 31, 2016 increased by $35.9 billion to $1.2 trillion compared toDecember 31, 2015, primarily due to the impact of positive market movement and new business growth, mostly offsetby the impact of currency movement.

INVESTED ASSETSThe Company manages its general fund assets to support the cash flow, liquidity and profitability requirements of theCompany's insurance and investment products. The Company follows prudent and conservative investment policies,so that assets are not unduly exposed to concentration, credit or market risks. The Company implements strategieswithin the overall framework of the Company’s policies, reviewing and adjusting them on an ongoing basis in light ofliability cash flows and capital market conditions. The majority of investments of the general fund are in medium-termand long-term fixed-income investments, primarily bonds and mortgages, reflecting the characteristics of the Company’sliabilities.
Management's Discussion and Analysis
14
Invested asset distributionDecember 31, 2016
Canada United States Europe TotalBonds
Government & related $ 23,580 $ 8,384 $ 18,905 $ 50,869 31%Corporate & other 21,138 24,589 20,177 65,904 41Sub-total bonds 44,718 32,973 39,082 116,773 72
Mortgages 12,892 5,169 3,590 21,651 13Stocks 7,903 160 602 8,665 5Investment properties 1,574 5 2,761 4,340 3
Sub-total portfolio investments 67,087 38,307 46,035 151,429 93Cash and cash equivalents 615 852 1,792 3,259 2Loans to policyholders 2,609 5,745 113 8,467 5Total invested assets $ 70,311 $ 44,904 $ 47,940 $ 163,155 100%
December 31, 2015Canada United States Europe Total
BondsGovernment & related(1) $ 21,732 $ 9,413 $ 19,304 $ 50,449 31%Corporate & other(1) 21,388 22,638 20,468 64,494 40Sub-total bonds 43,120 32,051 39,772 114,943 71
Mortgages 12,691 4,932 4,398 22,021 14Stocks 6,971 168 734 7,873 5Investment properties 1,788 5 3,444 5,237 3
Sub-total portfolio investments 64,570 37,156 48,348 150,074 93Cash and cash equivalents 578 627 1,608 2,813 2Loans to policyholders 2,553 6,026 115 8,694 5Total invested assets $ 67,701 $ 43,809 $ 50,071 $ 161,581 100%
(1) Comparative figures have been reclassified for presentation purposes.
At December 31, 2016, total invested assets were $163.2 billion, an increase of $1.6 billion from December 31, 2015.The increase in invested assets was primarily due to regular business activity, including transferring portfolio investmentspreviously reported as funds held by ceding insurers, as described in note 6 to the Company's December 31, 2016annual consolidated financial statements. The increase was mostly offset by the impact of currency movement, asthe Canadian dollar strengthened against the British pound, U.S. dollar and euro. The distribution of assets has notchanged significantly and remains heavily weighted to bonds and mortgages.
Bond portfolio – It is the Company's policy to acquire only investment grade bonds subject to prudent and well-definedinvestment policies. The total bond portfolio, including short-term investments, was $116.8 billion or 72% of investedassets at December 31, 2016 and $114.9 billion or 71% at December 31, 2015. During the second quarter of 2016,the rating of U.K. government and government related bonds changed from AAA to AA as a direct result of rating agencyactivity in response to the U.K. vote to leave the EU, resulting in a shift between rating categories. The overall qualityof the bond portfolio remained high, with 99% of the portfolio rated investment grade and 82% rated A or higher.
Bond portfolio qualityDecember 31, 2016 December 31, 2015
AAA $ 27,762 24 % $ 36,434 32%AA 29,816 26 20,364 18A 37,787 32 35,623 31BBB 20,116 17 20,984 18BB or lower 1,292 1 1,538 1
Total $ 116,773 100 % $ 114,943 100%
At December 31, 2016, non-investment grade bonds were $1.3 billion or 1.1% of the bond portfolio, which wascomparable to $1.5 billion or 1.3% of the bond portfolio at December 31, 2015.
Mortgage portfolio – It is the Company’s practice to acquire only high quality commercial mortgages meeting strictunderwriting standards and diversification criteria. The Company has a well-defined risk-rating system, which it usesin its underwriting and credit monitoring processes for commercial loans. Residential loans are originated by theCompany’s mortgage specialists in accordance with well-established underwriting standards and are well diversifiedacross each geographic region, including specific diversification requirements for non-insured mortgages.
Mortgage portfolioDecember 31, 2016 December 31, 2015
Mortgage loans by type Insured Non-insured Total TotalSingle family residential $ 706 $ 1,369 $ 2,075 9% $ 1,962 9%Multi-family residential 2,946 3,041 5,987 28 5,821 26Commercial 260 13,329 13,589 63 14,238 65
Total $ 3,912 $ 17,739 $ 21,651 100% $ 22,021 100%
The total mortgage portfolio was $21.7 billion or 13% of invested assets at December 31, 2016, compared to $22.0billion or 14% of invested assets at December 31, 2015. Total insured loans were $3.9 billion or 18% of the mortgageportfolio.
Commercial mortgagesDecember 31, 2016 December 31, 2015
Canada U.S. Europe Total Canada U.S. Europe TotalRetail & shoppingcentres $ 3,353 $ 633 $ 1,263 $ 5,249 $ 3,367 $ 731 $ 1,692 $ 5,790Office buildings 1,845 657 729 3,231 1,703 621 946 3,270Industrial 1,570 1,534 842 3,946 1,595 1,375 977 3,947Other 340 450 373 1,163 390 435 406 1,231Total $ 7,108 $ 3,274 $ 3,207 $ 13,589 $ 7,055 $ 3,162 $ 4,021 $ 14,238
Management's Discussion and Analysis
15

Single family residential mortgages
Region December 31, 2016 December 31, 2015Ontario $ 1,005 49% $ 946 49%Quebec 436 21 405 21Alberta 140 7 136 7British Columbia 127 6 123 6Newfoundland 113 5 105 5Saskatchewan 86 4 84 4Nova Scotia 65 3 62 3Manitoba 53 3 55 3New Brunswick 46 2 42 2Other 4 — 4 —
Total $ 2,075 100% $ 1,962 100%
During the twelve months ended December 31, 2016, single family mortgage originations, including renewals, were$763 million, of which 26% were insured. Insured mortgages include mortgages where insurance is provided by athird party and protects the Company in the event that the borrower is unable to fulfil their mortgage obligations. Loansthat are insured are subject to the requirements of the mortgage default insurance provider. For new originations ofnon-insured residential mortgages, the Company’s investment policies limit the amortization period to a maximum of25 years and the loan-to-value to a maximum of 80% of the purchase price or current appraised value of the property.The weighted average remaining amortization period for the single family residential mortgage portfolio was 22 yearsas at December 31, 2016.
Management's Discussion and Analysis
16
Equity portfolioDecember 31, 2016 December 31, 2015
Equity portfolio by typePublicly traded stocks $ 7,988 62% $ 7,054 54%Privately held equities 677 5 819 6Sub-total 8,665 67 7,873 60Investment properties 4,340 33 5,237 40
Total $ 13,005 100% $ 13,110 100%
Investment propertiesDecember 31, 2016 December 31, 2015
Canada U.S. Europe Total Canada U.S. Europe TotalOffice buildings $ 702 $ — $ 625 $ 1,327 $ 955 $ — $ 730 $ 1,685Industrial 293 — 596 889 288 — 762 1,050Retail 207 — 1,114 1,321 204 — 1,417 1,621Other 372 5 426 803 341 5 535 881Total $ 1,574 $ 5 $ 2,761 $ 4,340 $ 1,788 $ 5 $ 3,444 $ 5,237
Equity portfolio – The total equity portfolio was $13.0 billion or 8% of invested assets at December 31, 2016 comparedto $13.1 billion or 8% of invested assets at December 31, 2015. The equity portfolio consists of publicly traded stocks,privately held equities and investment properties. The increase in stocks of $0.8 billion was primarily due to an increasein Canadian equity markets. The decrease in investment properties of $0.9 billion was mainly a result of thestrengthening of the Canadian dollar against the British pound and net dispositions of properties, primarily in Canada.

Impaired investments – Impaired investments include bonds in default, mortgages in default or in the process offoreclosure, investment properties acquired by foreclosure and other assets where management no longer hasreasonable assurance that all contractual cash flows will be received.
Impaired investmentsDecember 31, 2016 December 31, 2015
Grossamount
Impairmentrecovery
Impairmentprovision
Carryingamount
Grossamount
Impairmentrecovery
Impairmentprovision
Carryingamount
Fair value through profitor loss $ 231 $ 53 $ (1) $ 283 $ 287 $ 69 $ (1) $ 355Available-for-sale 8 3 (1) 10 12 2 (3) 11Loans and receivables 122 — (43) 79 50 — (20) 30Total $ 361 $ 56 $ (45) $ 372 $ 349 $ 71 $ (24) $ 396
The gross amount of impaired investments totaled $361 million or 0.2% of portfolio investments, including funds heldby ceding insurers, at December 31, 2016 compared with $349 million or 0.2% at December 31, 2015, a net increaseof $12 million. The increase in impaired investments was primarily due to new impairments, partially offset bydispositions and repayments, as well as the strengthening of the Canadian dollar against the British pound and U.S.dollar.
The impairment recovery at December 31, 2016 was $56 million, which reflects the improvement in market values ofcertain impaired investments from the date at which they became impaired. The impairment provision at December 31,2016 was $45 million, compared to $24 million at December 31, 2015. The increase was primarily due to the impairmentof BHS mortgage loans. While the fair values have improved on certain impaired assets, these assets remain impairedbased on other impairment factors as described in the "Summary of Critical Accounting Estimates" section of thisdocument and in note 2 of the Company's December 31, 2016 annual consolidated financial statements.
Management's Discussion and Analysis
17
Provision for future credit lossesAs a component of insurance contract liabilities, the total actuarial provision for future credit losses is determinedconsistent with the Canadian Institute of Actuaries' Standards of Practice and includes provisions for adverse deviation.
At December 31, 2016, the total actuarial provision for future credit losses in insurance contract liabilities was $2,946million compared to $3,558 million at December 31, 2015, a decrease of $612 million, primarily due to the impact ofassumption changes and currency movement, partially offset by normal business activity.
The aggregate of impairment provisions of $45 million ($24 million at December 31, 2015) and actuarial provisions forfuture credit losses in insurance contract liabilities of $2,946 million ($3,558 million at December 31, 2015) represents2.0% of bond and mortgage assets, including funds held by ceding insurers, at December 31, 2016 (2.4% atDecember 31, 2015).

Energy Sector
Holdings of Energy Sector(1) related Bonds, Mortgages and Investment Properties
December 31, 2016December 31,
2015Canada U.S. Europe Total Total
Bonds(2)(3) $ 1,618 $ 2,102 $ 1,336 $ 5,056 $ 5,216Mortgages(4) 2,093 392 44 2,529 2,560Investment properties 288 — — 288 300Total $ 3,999 $ 2,494 $ 1,380 $ 7,873 $ 8,076
(1) Energy sector bond holdings are a sub-category of certain industry sectors presented in note 7(a)(ii) in the Company's December 31, 2016annual consolidated financial statements.
(2) Amortized cost of these bonds is $4,823 million at December 31, 2016 and $5,177 million at December 31, 2015.(3) Includes certain funds held by ceding insurers with a carrying value of $279 million and an amortized cost of $259 million at December 31,
2016.(4) Includes $625 million of insured mortgages at December 31, 2016 and $613 million at December 31, 2015.
At December 31, 2016, the Company's holdings of energy sector related investments, including funds held by cedinginsurers, were $7.9 billion ($8.1 billion at December 31, 2015). This included direct exposure of bond holdings of $5.1billion ($5.2 billion at December 31, 2015), or 2.9% of invested assets including funds held by ceding insurers, andindirect exposure of commercial mortgages and investment properties of $2.8 billion ($2.9 billion at December 31,2015), or 1.7% of invested assets including funds held by ceding insurers.
At December 31, 2016, the Company's energy sector related bond holdings were well diversified across multiple sub-sectors and were high quality with approximately 97% rated investment grade. Approximately half of the portfolio wasinvested in Midstream and Refining entities and half in Integrated, Independent and Oil Field Services entities.
In addition, the Company's indirect exposure of energy sector related commercial mortgages and investment propertieswere concentrated in certain geographic regions where the economy is more dependent upon the energy sector andwere well diversified across property type - Multi-family (31%), Industrial/Other (28%), Office (23%) and Retail (18%).Approximately 80% of the portfolio was concentrated in the province of Alberta, with the remainder primarily in thestate of Texas. The weighted average loan-to-value ratio of the commercial mortgages was 59% at December 31,2016.
In December 2016, Moody’s Investors Service (Moody’s) and Standard & Poor’s Ratings Services revised their forecastsfor crude oil upward. Hydrocarbon price assumptions are a key input into cash flow forecasts and the resulting issuerand sector credit risk profile, particularly for the Integrated, Independent and Oil Field Services sub-sectors. Moody’shas changed its outlook to Stable for Integrated and Positive for Independent while the outlook for Oilfield Servicesremains Negative. Moody’s has also maintained its Stable outlook for Midstream and Master Limited Partnerships buthas lowered its Refining sub-sector outlook to Negative. Increases to provisions for future credit losses as a result ofratings downgrades specific to the energy sector were modest and impairments were minimal in 2016. Recoveringcrude oil prices through most of the year has resulted in the general tightening of spreads on bonds held by theCompany.
Management's Discussion and Analysis
18

United Kingdom Property Related Exposures
Holdings of United Kingdom Mortgages and Investment Properties
December 31, 2016December 31,
2015Multi-Family
Residential
Retail &shoppingcentres
Officebuildings Industrial Other Total Total
Mortgages $ 343 $ 1,434 $ 700 $ 923 $ 372 $ 3,772 $ 4,520Investment properties — 1,094 623 596 416 2,729 3,411Total $ 343 $ 2,528 $ 1,323 $ 1,519 $ 788 $ 6,501 $ 7,931
At December 31, 2016, the Company's holdings of property related investments in the U.K. were $6.5 billion ($7.9billion at December 31, 2015) or 3.8% of invested assets including funds held by ceding insurers. The $1.4 billiondecrease from December 31, 2015 was primarily due to the impact of currency movement, as the Canadian dollarstrengthened against the British pound. Holdings in Central London were $1.9 billion ($2.1 billion at December 31,2015) or 1.1% of invested assets including funds held by ceding insurers, while holdings in other regions of the U.K.were $4.6 billion ($5.8 billion at December 31, 2015) or 2.7% of invested assets including funds held by ceding insurers.These holdings were well diversified across property type - Retail (39%), Industrial/Other (36%), Office (20%) andMulti-family (5%). The weighted average loan-to-value ratio of the mortgages was 54% and the weighted averagedebt-service coverage ratio was 2.1 at December 31, 2016. At December 31, 2016, the weighted average mortgageand property lease term was 14 years.
Management's Discussion and Analysis
19
DERIVATIVE FINANCIAL INSTRUMENTSThere were no major changes to the Company's policies and procedures with respect to the use of derivative financialinstruments in 2016. The Company’s derivative transactions are generally governed by International Swaps andDerivatives Association, Inc. (ISDA) Master Agreements, which provide for legally enforceable set-off and close-outnetting of exposure to specific counterparties in the event of an early termination of a transaction, which includes, butis not limited to, events of default and bankruptcy. In the event of an early termination, the Company is permitted toset off receivables from a counterparty against payables to the same counterparty, in the same legal entity, arising outof all included transactions. The Company’s ISDA Master Agreements may include Credit Support Annex provisions,which require both the pledging and accepting of collateral in connection with its derivative transactions. At December 31, 2016, total financial collateral, including initial margin and overcollateralization, received on derivativeassets was $159 million ($107 million at December 31, 2015) and pledged on derivative liabilities was $475 million($671 million at December 31, 2015). Collateral received on derivative assets increased and collateral pledged onderivative liabilities decreased in 2016, primarily driven by the impact of the strengthening Canadian dollar against theU.S. dollar, British pound and euro on cross-currency swap fair values.
During the twelve month period ended December 31, 2016, the outstanding notional amount of derivative contractsincreased by $0.5 billion to $17.2 billion, primarily as a result of regular hedging activities, partially offset by the impactof currency movement for foreign denominated derivatives as the Canadian dollar strengthened against the Britishpound, euro and U.S. dollar.
The Company’s exposure to derivative counterparty credit risk, which reflects the current fair value of those instrumentsin a gain position, increased to $528 million at December 31, 2016 from $461 million at December 31, 2015. Marketvalues increased on cross-currency swaps as the end-of-period rates for the Canadian dollar strengthened againstthe U.S. dollar, British pound and euro.

Goodwill and intangible assets
Goodwill and intangible assetsDecember 31
2016 2015Goodwill $ 5,977 $ 5,913Indefinite life intangible assets 3,030 3,115Finite life intangible assets 942 921Total $ 9,949 $ 9,949
The Company's goodwill and intangible assets relate primarily to its acquisitions of London Life, Canada Life, Putnamand Irish Life. Goodwill and intangible assets of $9,949 million at December 31, 2016 were comparable to December 31,2015. Goodwill increased by $64 million to $5,977 million driven by the acquisitions of Aviva Health Insurance Limited(Aviva Health) and GloHealth Financial Services Limited (GloHealth) by Irish Life, partially offset by the impact ofcurrency movement. Indefinite and finite life intangible assets decreased by $64 million during 2016, driven by theimpact of currency movement, partially offset by $35 million of additions to customer contract related finite life intangibleassets relating to the acquisitions of Aviva Health and GloHealth, and net additions to computer software.
IFRS principles require the Company to assess at the end of each reporting period whether there is any indication thatan asset may be impaired and to perform an impairment test on goodwill and indefinite life intangible assets at leastannually or more frequently if events indicate that impairment may have occurred. Intangible assets that were previouslyimpaired are reviewed at each reporting date for evidence of reversal. Finite life intangible assets are reviewed annuallyto determine if there are indications of impairment and assess whether the amortization periods and methods areappropriate. In the fourth quarter of 2016, the Company conducted its annual impairment testing of goodwill andintangible assets based on September 30, 2016 asset balances. It was determined that the recoverable amounts ofcash generating unit groupings were in excess of their carrying values and there was no evidence of impairment. Therecoverable amount is the higher of the asset's fair value less costs of disposal and value-in-use. In addition, therewere no impairment charges in 2016 to finite life intangible assets.
Refer to note 9 in the Company's December 31, 2016 annual consolidated financial statements for further details ofthe Company's goodwill and intangible assets. Also, refer to the "Summary of Critical Accounting Estimates" sectionof this document for details on impairment testing of these assets.
Management's Discussion and Analysis
20
Other general fund assets
Other general fund assetsDecember 31
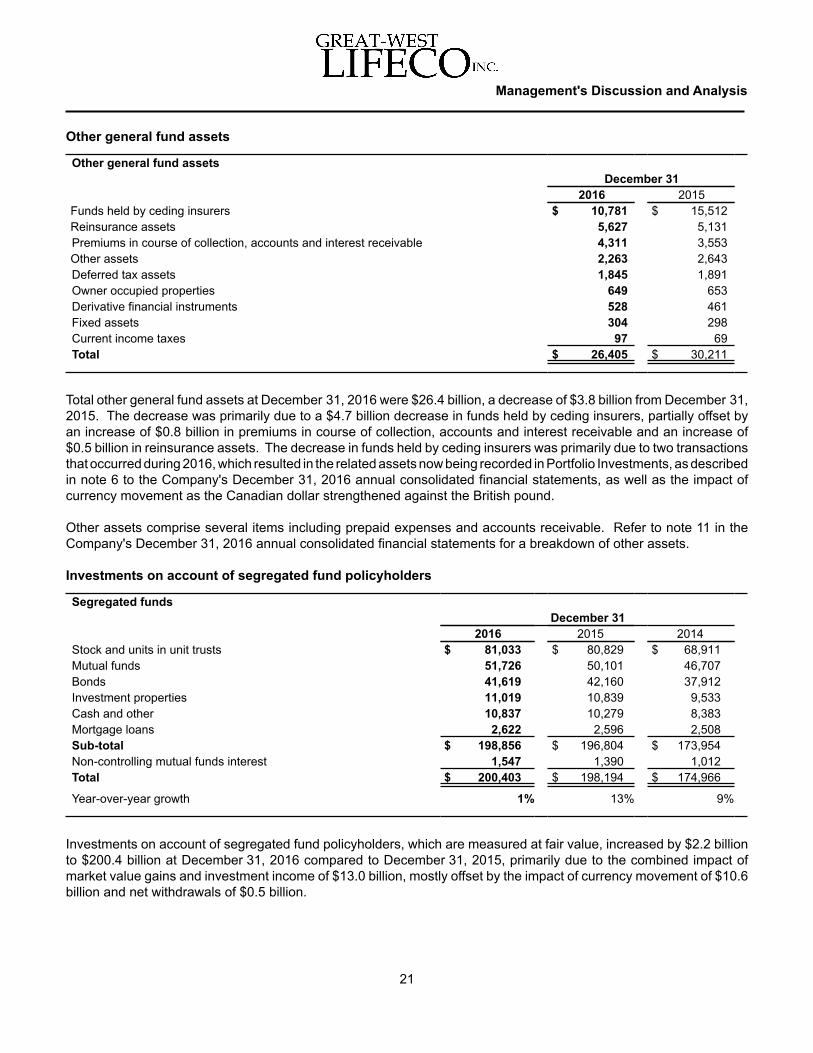
2016 2015Funds held by ceding insurers $ 10,781 $ 15,512Reinsurance assets 5,627 5,131Premiums in course of collection, accounts and interest receivable 4,311 3,553Other assets 2,263 2,643Deferred tax assets 1,845 1,891Owner occupied properties 649 653Derivative financial instruments 528 461Fixed assets 304 298Current income taxes 97 69Total $ 26,405 $ 30,211
Total other general fund assets at December 31, 2016 were $26.4 billion, a decrease of $3.8 billion from December 31,2015. The decrease was primarily due to a $4.7 billion decrease in funds held by ceding insurers, partially offset byan increase of $0.8 billion in premiums in course of collection, accounts and interest receivable and an increase of$0.5 billion in reinsurance assets. The decrease in funds held by ceding insurers was primarily due to two transactionsthat occurred during 2016, which resulted in the related assets now being recorded in Portfolio Investments, as describedin note 6 to the Company's December 31, 2016 annual consolidated financial statements, as well as the impact ofcurrency movement as the Canadian dollar strengthened against the British pound.
Other assets comprise several items including prepaid expenses and accounts receivable. Refer to note 11 in theCompany's December 31, 2016 annual consolidated financial statements for a breakdown of other assets.
Investments on account of segregated fund policyholders
Segregated fundsDecember 31
2016 2015 2014Stock and units in unit trusts $ 81,033 $ 80,829 $ 68,911Mutual funds 51,726 50,101 46,707Bonds 41,619 42,160 37,912Investment properties 11,019 10,839 9,533Cash and other 10,837 10,279 8,383Mortgage loans 2,622 2,596 2,508Sub-total $ 198,856 $ 196,804 $ 173,954Non-controlling mutual funds interest 1,547 1,390 1,012Total $ 200,403 $ 198,194 $ 174,966
Year-over-year growth 1% 13% 9%
Investments on account of segregated fund policyholders, which are measured at fair value, increased by $2.2 billionto $200.4 billion at December 31, 2016 compared to December 31, 2015, primarily due to the combined impact ofmarket value gains and investment income of $13.0 billion, mostly offset by the impact of currency movement of $10.6billion and net withdrawals of $0.5 billion.
Management's Discussion and Analysis
21

Proprietary mutual funds
Proprietary mutual funds and institutional net assetsDecember 31
2016 2015Mutual fundsBlend equity $ 31,328 $ 40,070Growth equity 13,252 14,468Equity value 23,163 22,798Fixed-income 33,999 34,384Money market 164 123Great-West Financial Funds(1) 15,856 13,480
Sub-total 117,762 125,323
Institutional accountsEquity 84,257 77,236Fixed-income 48,700 44,458Other 8,496 5,463
Sub-total 141,453 127,157
Total proprietary mutual funds and institutional accounts $ 259,215 $ 252,480
(1) At December 31, 2016, mutual funds exclude $10.9 billion of Putnam managed funds ($9.1 billion at December 31, 2015), which are includedin the categories above.
At December 31, 2016, total proprietary mutual funds and institutional accounts include $219.7 billion at Putnam andGreat-West Financial, $5.8 billion at Quadrus and $32.9 billion at Irish Life. Proprietary mutual funds and institutionalaccounts under management increased by $6.7 billion, primarily as a result of the positive impact of currency andmarket movements.
Management's Discussion and Analysis
22
LIABILITIES
Total liabilitiesDecember 31
2016 2015(1)
Insurance and investment contract liabilities $ 157,949 $ 160,745Other general fund liabilities 16,552 15,736Investment and insurance contracts on account of segregated fund policyholders 200,403 198,194Total $ 374,904 $ 374,675
(1) Comparative figures have been reclassified as described in note 33 to the Company's December 31, 2016 consolidated financial statements.
Total liabilities increased by $0.2 billion to $374.9 billion at December 31, 2016 from December 31, 2015.
Insurance and investment contract liabilities decreased by $2.8 billion. The decrease was primarily due to thestrengthening of the Canadian dollar against the British pound, euro and U.S. dollar, partially offset by the impact ofnew business and fair value adjustments. Investment and insurance contracts on account of segregated fundpolicyholders increased by $2.2 billion, primarily due to the combined impact of market value gains and investmentincome of $13.0 billion, mostly offset by the impact of currency movement of $10.6 billion and net withdrawals of $0.5billion.
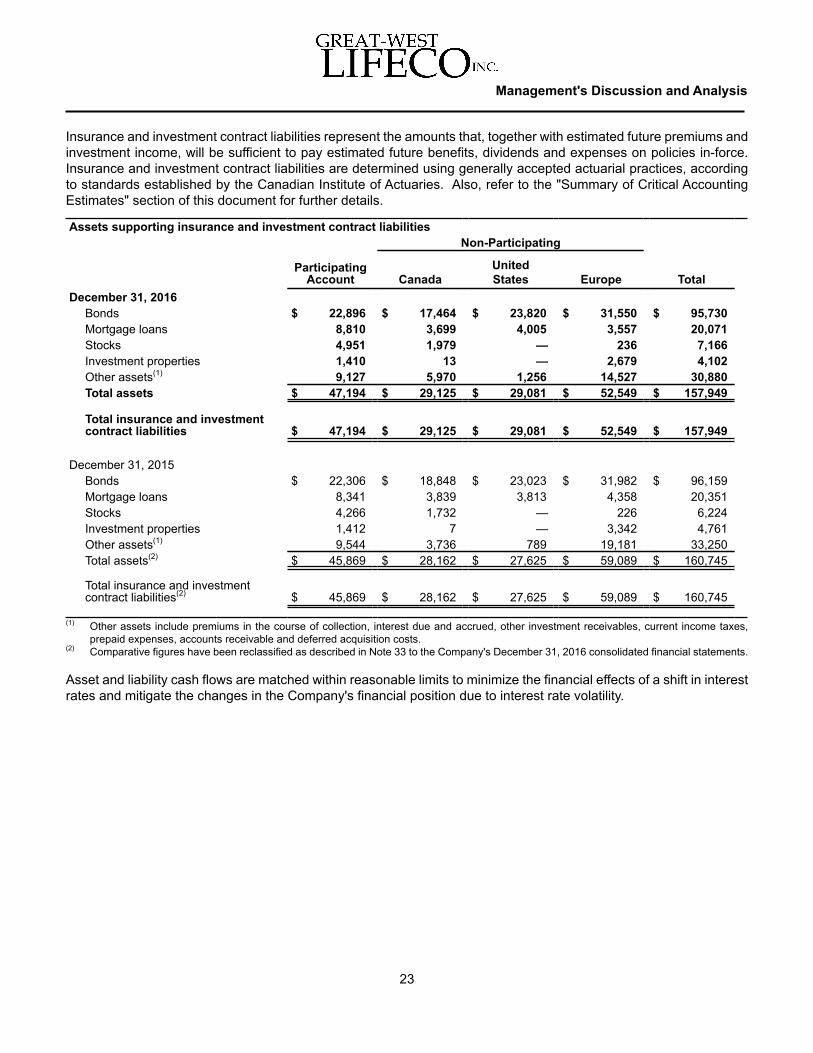
Insurance and investment contract liabilities represent the amounts that, together with estimated future premiums andinvestment income, will be sufficient to pay estimated future benefits, dividends and expenses on policies in-force.Insurance and investment contract liabilities are determined using generally accepted actuarial practices, accordingto standards established by the Canadian Institute of Actuaries. Also, refer to the "Summary of Critical AccountingEstimates" section of this document for further details.
Management's Discussion and Analysis
23
Assets supporting insurance and investment contract liabilitiesNon-Participating
ParticipatingAccount Canada
UnitedStates Europe Total
December 31, 2016Bonds $ 22,896 $ 17,464 $ 23,820 $ 31,550 $ 95,730Mortgage loans 8,810 3,699 4,005 3,557 20,071Stocks 4,951 1,979 — 236 7,166Investment properties 1,410 13 — 2,679 4,102Other assets(1) 9,127 5,970 1,256 14,527 30,880Total assets $ 47,194 $ 29,125 $ 29,081 $ 52,549 $ 157,949
Total insurance and investmentcontract liabilities $ 47,194 $ 29,125 $ 29,081 $ 52,549 $ 157,949
December 31, 2015Bonds $ 22,306 $ 18,848 $ 23,023 $ 31,982 $ 96,159Mortgage loans 8,341 3,839 3,813 4,358 20,351Stocks 4,266 1,732 — 226 6,224Investment properties 1,412 7 — 3,342 4,761Other assets(1) 9,544 3,736 789 19,181 33,250Total assets(2) $ 45,869 $ 28,162 $ 27,625 $ 59,089 $ 160,745
Total insurance and investmentcontract liabilities(2) $ 45,869 $ 28,162 $ 27,625 $ 59,089 $ 160,745
(1) Other assets include premiums in the course of collection, interest due and accrued, other investment receivables, current income taxes,prepaid expenses, accounts receivable and deferred acquisition costs.
(2) Comparative figures have been reclassified as described in Note 33 to the Company's December 31, 2016 consolidated financial statements.
Asset and liability cash flows are matched within reasonable limits to minimize the financial effects of a shift in interestrates and mitigate the changes in the Company's financial position due to interest rate volatility.

Other general fund liabilities
Other general fund liabilitiesDecember 31
2016 2015(1)
Debentures and other debt instruments $ 5,980 $ 5,395Other liabilities 3,836 3,367Accounts payable 2,049 1,755Derivative financial instruments 2,012 2,624Deferred tax liabilities 1,645 1,586Current income taxes 549 492Funds held under reinsurance contracts 320 356Capital trust securities 161 161Total $ 16,552 $ 15,736
(1) Comparative figures have been reclassified as described in note 33 to the Company's December 31, 2016 consolidated financial statements.
Total other general fund liabilities at December 31, 2016 were $16.6 billion, an increase of $0.8 billion from December 31,2015, primarily due to an increase in accounts payable and other liabilities of $0.8 billion and increased debenturesand other debt instruments of $0.6 billion, partially offset by a decrease in derivative financial instruments of $0.6 billion.Other liabilities of $3.8 billion include pension and other post-employment benefits, deferred income reserve, bankoverdraft and other liability balances. Refer to note 17 in the Company’s December 31, 2016 annual consolidatedfinancial statements for a breakdown of the other liabilities balance and note 15 in the Company’s December 31, 2016annual consolidated financial statements for details of the debentures and other debt instruments.
Management's Discussion and Analysis
24
Segregated Fund and Variable Annuity GuaranteesThe Company offers retail segregated fund products, unitized with profits (UWP) products and variable annuity productsthat provide for certain guarantees that are tied to the market values of the investment funds.
The Company utilizes internal reinsurance treaties to aggregate the business as a risk-mitigating tool. Aggregationenables the Company to benefit from diversification of segregated fund risks within one legal entity, a more efficientand cost effective hedging process, and better management of the liquidity risk associated with hedging. It also resultsin the Company holding lower required capital and insurance contract liabilities, as aggregation of different risk profilesallows the Company to reflect offsets at a consolidated level.
In Canada, the Company offers individual segregated fund products through Great-West Life, London Life and CanadaLife. These products provide guaranteed minimum death benefits (GMDB) and guaranteed minimum accumulationon maturity benefits (GMAB). In 2009, Great-West Life, London Life and Canada Life launched new individualsegregated fund products, which offer three levels of death and maturity guarantees, guarantee reset riders and lifetimeguaranteed minimum withdrawal benefits (GMWB).
For a certain generation of products, the guarantees in connection with the Canadian individual segregated fundbusinesses of Great-West Life, London Life and Canada Life have been reinsured to London Reinsurance Group Inc.(LRG), a subsidiary of London Life. This does not include the guarantees on newer Canadian products, which havebeen reinsured to London Life. In addition to the guarantees reinsured from Great-West Life, London Life and CanadaLife, LRG also has a closed portfolio of GMDB, GMAB and guaranteed minimum income benefits (GMIB) that it hasreinsured from other U.S. and Canadian life insurance and reinsurance companies.
In Europe, the Company offers UWP products through Canada Life and unit-linked products with investment guaranteesthrough Irish Life. These products are similar to segregated fund products, but include pooling of policyholders' fundsand minimum credited interest rates. The Company also offers a GMWB product in Germany through Canada Life.

In the U.S., the Company offers variable annuities with GMDB through Great-West Financial. Most are a return ofpremium on death with the guarantee expiring at age 70. Great-West Financial in the U.S. also offers a GMWB product.The GMWB products offered by the Company in Canada, the U.S. and Germany, and previously offered in Ireland,provide the policyholder with a guaranteed minimum level of annual income for life. The minimum level of income mayincrease depending upon the level of growth in the market value of the policyholder's funds. Where the market valueof the policyholder's funds is ultimately insufficient to meet the level of guarantee purchased by the policyholder, theCompany is obligated to make up the shortfall.
These products involve cash flows of which the magnitude and timing are uncertain and are dependent on the levelof equity and fixed-income market returns, interest rates, currency markets, market volatility, policyholder behaviourand policyholder longevity.
The Company has a hedging program in place to manage certain risks associated with options embedded in its GMWBproducts. The program methodology quantifies both the embedded option value and its sensitivity to movements inequity markets, currency markets and interest rates. Equity derivative instruments, currency derivative instrumentsand interest rate derivative instruments are used to mitigate changes in the embedded option value attributable tomovements in equity markets, currency markets and interest rates respectively. The hedging program, by its nature,requires continuous monitoring and rebalancing to avoid over or under hedged positions. Periods of heightened marketvolatility will increase the frequency of hedge rebalancing.
By their nature, certain risks associated with the GMWB product either cannot be hedged, or cannot be hedged on acost effective basis. These risks include policyholder behaviour, policyholder longevity and basis risk and marketvolatility. Consequently, the hedging program will not mitigate all risks to the Company associated with the GMWBproducts, and may expose the Company to additional risks including the operational risk associated with the relianceupon sophisticated models, and counterparty credit risk associated with the use of derivative instruments.
Other risk management processes are in place aimed at appropriately limiting the Company’s exposure to the risks itis not hedging or are otherwise inherent in its GMWB hedging program. In particular, the GMWB product has beendesigned with specific regard to limiting policyholder anti-selection, and the array of investment funds available topolicyholders has been determined with a view to minimizing underlying basis risk.
Certain GMWB products offered by the Company offer levels of death and maturity guarantees. At December 31,2016, the amount of GMWB product in-force in Canada, the U.S., Ireland and Germany was $3,917 million ($3,488million at December 31, 2015).
Segregated fund and variable annuity guarantee exposureDecember 31, 2016
Investment deficiency by benefit typeMarket Value Income Maturity Death Total(1)
Canada $ 31,494 $ — $ 16 $ 50 $ 50United States 12,412 9 — 43 52Europe
Insurance & Annuities 8,745 7 — 377 377Reinsurance(2) 1,169 391 — 20 411
Total Europe 9,914 398 — 397 788Total $ 53,820 $ 407 $ 16 $ 490 $ 890
(1) A policy can only receive a payout from one of the three trigger events (income election, maturity or death). Total deficiency measures thepoint-in-time exposure assuming the most costly trigger event for each policy occurred on December 31, 2016.
(2) Reinsurance exposure is to markets in Canada and the United States.
Management's Discussion and Analysis
25
The investment deficiency measures the point-in-time exposure to a trigger event (i.e., income election, maturity ordeath) assuming it occurred on December 31, 2016. The actual cost to the Company will depend on the trigger eventhaving occurred and the market values at that time. The actual claims before tax associated with these guaranteeswere $4 million in-quarter ($4 million for the fourth quarter of 2015) and $21 million year-to-date ($15 million year-to-date for 2015), with the majority arising in the Reinsurance business unit in the Europe segment.
Management's Discussion and Analysis
26
LIFECO CAPITAL STRUCTUREIn establishing the appropriate mix of capital required to support the operations of the Company and its subsidiaries,management utilizes a variety of debt, equity and other hybrid instruments giving consideration to both the short andlong-term capital needs of the Company.
DEBENTURES AND OTHER DEBT INSTRUMENTSAt December 31, 2016, debentures and other debt instruments increased by $585 million to $5,980 million comparedto December 31, 2015, primarily due to the issuance of a €500 million 10-year senior bond. The bond pays an annualcoupon of 1.75% and was priced at 99.718% of par for a yield to maturity of 1.781%. The bond is rated A+ by Standard& Poor's Rating Services and is listed on the Irish Stock Exchange. This was Lifeco's second debt issuance in theeuro market. On February 8, 2017, Irish Life Assurance Plc, a subsidiary of the Company, redeemed its 5.25% €200million subordinated debenture notes at their principal amount together with accrued interest.
During the second quarter of 2016, Great-West Life & Annuity Insurance Capital, LP II, a subsidiary, elected to not callits US$300 million 7.153% junior subordinated debentures with a first par call date of May 16, 2016 and a final maturitydate of May 16, 2046. Beginning May 16, 2016, the debentures pay a floating rate of interest set at 3-month LIBORplus 2.538%. Great-West Financial also entered into an external 30-year interest rate swap transaction whereby it willpay a fixed 4.68% rate of interest and will receive a floating 3-month LIBOR plus 2.538% rate of interest on the notionalprincipal amount.
Refer to note 15 in the Company's December 31, 2016 annual consolidated financial statements for further details ofthe Company's debentures and other debt instruments.
CAPITAL TRUST SECURITIES At December 31, 2016, the Company had $150 million principal outstanding of Canada Life Capital Trust Securities –Series B (CLiCS – Series B). Included in the Company's invested assets at December 31, 2016 were CLiCS – SeriesB with a fair value of $50 million and principal value of $37 million (fair value of $50 million at December 31, 2015).
Each holder of the CLiCS – Series B is entitled to receive a semi-annual non-cumulative fixed cash distribution of$37.645 per CLiCS – Series B, representing an annual yield of 7.529% payable out of Canada Life Capital Trust's(CLCT) distributable funds. Subject to regulatory approval, CLCT may redeem the CLiCS – Series B, in whole or inpart, at any time and the CLiCS – Series B are callable at par on June 30, 2032.
EQUITYShare capital outstanding at December 31, 2016 was $9,644 million, which comprises $7,130 million of common shares,$2,264 million of non-cumulative First Preferred Shares, $213 million of 5-year rate reset First Preferred Shares and$37 million of floating rate First Preferred Shares.
Common sharesAt December 31, 2016, the Company had 986,398,335 common shares outstanding with a stated value of $7,130million compared to 993,350,331 common shares with a stated value of $7,156 million at December 31, 2015.

The Company commenced a normal course issuer bid (NCIB) on January 8, 2016 for one year to purchase and cancelup to 8,000,000 of its common shares at market prices in order to mitigate the dilutive effect of stock options grantedunder the Company's Stock Option Plan. The NCIB was amended effective February 23, 2016 to purchase up to20,000,000 common shares.
On June 17, 2016, the Company announced its intention to purchase for cancellation, up to 5,809,000 of its commonshares pursuant to private agreements between the Company and several arm’s length third-party sellers. As ofDecember 31, 2016, the Company had entered into private agreements for the repurchase of 1,600,000 of its commonshares. Subsequent to December 31, 2016, the Company did not purchase any additional common shares prior tothe expiration of this arrangement on January 7, 2017.
During the twelve months ended December 31, 2016, the Company repurchased and subsequently cancelled 7,967,881common shares (2015 - 6,279,856) at an average cost per share of $33.54 (2015 - $35.17) under its NCIB, whichincluded shares repurchased under private agreements. Subsequent to December 31, 2016, in order to mitigate the dilutive effect of stock options granted under the Company'sStock Option Plan and for other capital management purposes, the Company announced a normal course issuer bidcommencing January 9, 2017 and terminating January 8, 2018 to purchase for cancellation up to but not more than20,000,000 of its common shares at market prices.
Preferred shares At December 31, 2016, the Company had 10 series of fixed rate First Preferred Shares, one series of 5-year rate resetFirst Preferred Shares and one series of floating rate First Preferred Shares outstanding with aggregate stated valuesof $2,264 million, $213 million and $37 million, respectively.
The terms and conditions of the outstanding First Preferred Shares are set out in the table below:
Great-West Lifeco Inc.Series F Series G Series H Series I Series L Series M
General Type Fixed Rate Fixed Rate Fixed Rate Fixed Rate Fixed Rate Fixed Rate
Cumulative/Non-Cumulative Non-cumulative Non-cumulative Non-cumulative Non-cumulative Non-cumulative Non-cumulative
Date Issued Jul 10, 2003 Sep 14, 2004 Aug 12, 2005 Apr 12, 2006 Oct 2, 2009 Mar 4, 2010
Shares Outstanding 7,740,032 12,000,000 12,000,000 12,000,000 6,800,000 6,000,000
Amount Outstanding (Par) $193,500,800 $300,000,000 $300,000,000 $300,000,000 $170,000,000 $150,000,000
Yield 5.90% 5.20% 4.85% 4.50% 5.65% 5.80%
Earliest Issuer Redemption Date Sep 30, 2008 Dec 31, 2009 Sep 30, 2010 Jun 30, 2011 Dec 31, 2014 Mar 31, 2015
Great-West Lifeco Inc.Series N(1) Series O(2) Series P Series Q Series R Series S
General Type 5-Year Rate Reset Floating Rate Fixed Rate Fixed Rate Fixed Rate Fixed Rate
Cumulative/Non-Cumulative Non-cumulative Non-cumulative Non-cumulative Non-cumulative Non-cumulative Non-cumulative
Date Issued Nov 23, 2010 Dec 31, 2015 Feb 22, 2012 Jul 6, 2012 Oct 11, 2012 May 22, 2014
Shares Outstanding 8,524,422 1,475,578 10,000,000 8,000,000 8,000,000 8,000,000
Amount Outstanding (Par) $213,110,550 $36,889,450 $250,000,000 $200,000,000 $200,000,000 $200,000,000
Yield 2.176% Floating 5.40% 5.15% 4.80% 5.25%
Earliest Issuer Redemption Date Dec 31, 2015 Dec 31, 2015 March 31, 2017 Sep 30, 2017 Dec 31, 2017 Jun 30, 2019(1) The Series N, Non-Cumulative 5-Year Rate Reset First Preferred Shares carry an annual fixed dividend rate of 2.176% to but excluding
December 31, 2020 and are redeemable at the option of the Company on December 31, 2020 and on December 31 every five years thereafterfor $25.00 per share plus all declared and unpaid dividends to but excluding the date of redemption. Subject to the Company's right of redemptionand certain other restrictions on conversion described in the Series N share conditions, each Series N share is convertible into one Series Oshare at the option of the holders on December 31, 2020 and on December 31 every five years thereafter.
(2) The Series O, Non-Cumulative Floating Rate First Preferred Shares carry a floating dividend rate equal to the relevant Government of CanadaTreasury Bill rate plus 1.30% and are redeemable at the option of the Company for $25.50 per share, unless the shares are redeemed onDecember 31, 2020 or on December 31 every five years thereafter in which case the redemption price will be $25.00 per share, plus in eachcase all declared and unpaid dividends to but excluding the date of redemption. Subject to the Company's right of redemption and certain otherrestrictions on conversion described in the Series O share conditions, each Series O share is convertible into one Series N share at the optionof the holders on December 31, 2020 and on December 31 every five years thereafter.
Management's Discussion and Analysis
27
The terms and conditions of the First Preferred Shares do not allow the holder to convert to common shares of theCompany or to otherwise cause the Company to redeem the shares. Preferred shares issued by the Company arecommonly referred to as perpetual and represent a form of financing that does not have a fixed term.
Management's Discussion and Analysis
28
NON-CONTROLLING INTERESTSThe Company's non-controlling interests include participating account surplus in subsidiaries and non-controllinginterests in subsidiaries. Refer to note 18 in the Company's December 31, 2016 annual consolidated financialstatements for further details of the Company's non-controlling interests.
Non-controlling interestsDecember 31
2016 2015(1)
Participating account surplus in subsidiaries:Great-West Life $ 610 $ 607London Life 1,798 1,780Canada Life 357 222Great-West Financial 17 17
$ 2,782 $ 2,626
Non-controlling interests in subsidiaries $ 224 $ 195
(1) Comparative figures have been reclassified as described in note 33 to the Company's December 31, 2016 consolidated financial statements. LIQUIDITY AND CAPITAL MANAGEMENT AND ADEQUACYLIQUIDITYThe Company’s liquidity requirements are largely self-funded, with short-term obligations being met by internal fundsand maintaining adequate levels of liquid investments. The Company holds cash, cash equivalents and short-termbonds at the Lifeco holding company level and with the Lifeco consolidated subsidiary companies. At December 31,2016, the Company and its operating subsidiaries held cash, cash equivalents and short-term bonds of $7.9 billion($7.1 billion at December 31, 2015) and other liquid assets and marketable securities of $91.6 billion ($90.5 billion atDecember 31, 2015). Included in the cash, cash equivalents and short-term bonds at December 31, 2016 was $1.1billion ($0.9 billion at December 31, 2015) at the Lifeco holding company level. In addition, the Company maintainssufficient committed lines of credit with Canadian chartered banks for unanticipated liquidity needs, if required.
The Company does not have a formal common shareholder dividend policy. Dividends on outstanding common sharesof the Company are declared and paid at the sole discretion of the Board of Directors of the Company. The decisionto declare a dividend on the common shares of the Company takes into account a variety of factors including the levelof earnings, adequacy of capital and availability of cash resources.
As a holding company, the Company’s ability to pay dividends is dependent upon the Company receiving dividendsfrom its operating subsidiaries. The Company’s operating subsidiaries are subject to regulation in a number ofjurisdictions, each of which maintains its own regime for determining the amount of capital that must be held in connectionwith the different businesses carried on by the operating subsidiaries. The requirements imposed by the regulators inany jurisdiction may change from time to time, and thereby impact the ability of the operating subsidiaries to paydividends to the Company. For regulated entities based in Europe, the local solvency capital regime has changed tothe Solvency II basis, effective January 1, 2016. In 2016, the Company effectively managed capital volatility underthe new regulations. Transitional measures and other measures approved by the regulators for long-term guaranteedbusiness act to reduce the impact of current market volatility on Solvency II regulatory capital.
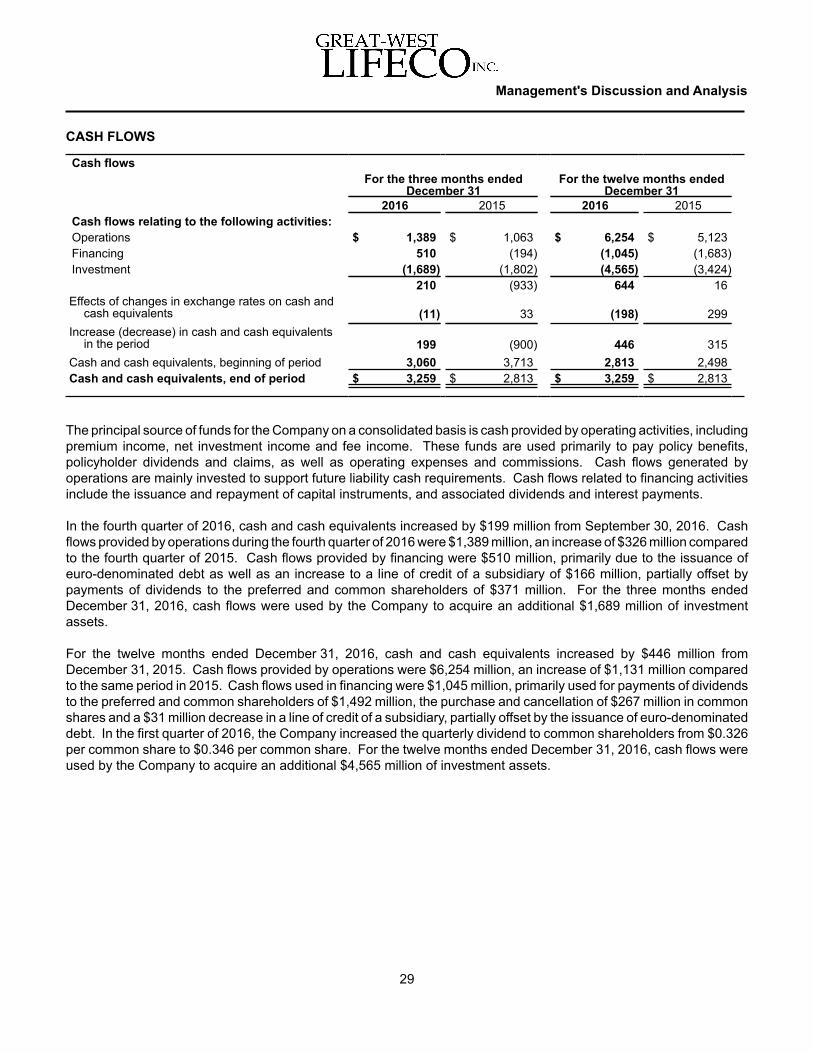
CASH FLOWS
Cash flowsFor the three months ended
December 31For the twelve months ended
December 312016 2015 2016 2015
Cash flows relating to the following activities:Operations $ 1,389 $ 1,063 $ 6,254 $ 5,123Financing 510 (194) (1,045) (1,683)Investment (1,689) (1,802) (4,565) (3,424)
210 (933) 644 16Effects of changes in exchange rates on cash and
cash equivalents (11) 33 (198) 299Increase (decrease) in cash and cash equivalents
in the period 199 (900) 446 315Cash and cash equivalents, beginning of period 3,060 3,713 2,813 2,498Cash and cash equivalents, end of period $ 3,259 $ 2,813 $ 3,259 $ 2,813
The principal source of funds for the Company on a consolidated basis is cash provided by operating activities, includingpremium income, net investment income and fee income. These funds are used primarily to pay policy benefits,policyholder dividends and claims, as well as operating expenses and commissions. Cash flows generated byoperations are mainly invested to support future liability cash requirements. Cash flows related to financing activitiesinclude the issuance and repayment of capital instruments, and associated dividends and interest payments.
In the fourth quarter of 2016, cash and cash equivalents increased by $199 million from September 30, 2016. Cashflows provided by operations during the fourth quarter of 2016 were $1,389 million, an increase of $326 million comparedto the fourth quarter of 2015. Cash flows provided by financing were $510 million, primarily due to the issuance ofeuro-denominated debt as well as an increase to a line of credit of a subsidiary of $166 million, partially offset bypayments of dividends to the preferred and common shareholders of $371 million. For the three months endedDecember 31, 2016, cash flows were used by the Company to acquire an additional $1,689 million of investmentassets.
For the twelve months ended December 31, 2016, cash and cash equivalents increased by $446 million fromDecember 31, 2015. Cash flows provided by operations were $6,254 million, an increase of $1,131 million comparedto the same period in 2015. Cash flows used in financing were $1,045 million, primarily used for payments of dividendsto the preferred and common shareholders of $1,492 million, the purchase and cancellation of $267 million in commonshares and a $31 million decrease in a line of credit of a subsidiary, partially offset by the issuance of euro-denominateddebt. In the first quarter of 2016, the Company increased the quarterly dividend to common shareholders from $0.326per common share to $0.346 per common share. For the twelve months ended December 31, 2016, cash flows wereused by the Company to acquire an additional $4,565 million of investment assets.
Management's Discussion and Analysis
29

COMMITMENTS/CONTRACTUAL OBLIGATIONS
Commitments/contractual obligationsAt December 31, 2016 Payments due by period
Total 1 year 2 years 3 years 4 years 5 yearsOver
5 years1) Debentures and other debt
instruments $ 5,585 $ 284 $ 200 $ — $ 500 $ — $ 4,6012) Operating leases
- office 664 109 99 74 59 49 274- equipment 17 6 6 3 1 1 —
3) Purchase obligations 283 108 53 62 42 15 34) Credit-related arrangements
(a) Contractual commitments 1,172 1,084 88 — — — —(b) Letters of credit see note 4(b) below
5) Pension contributions 273 273 — — — — —Total contractual obligations $ 7,994 $ 1,864 $ 446 $ 139 $ 602 $ 65 $ 4,878
1) Refer to note 15 in the Company's December 31, 2016 annual consolidated financial statements. Excluded from debentures and other debtinstruments are unamortized transaction costs.
2) Operating leases include office space and certain equipment used in the normal course of business. Lease payments are charged to operationsover the period of use.
3) Purchase obligations are commitments to acquire goods and services, essentially related to information services.4) (a) Contractual commitments are essentially commitments of investment transactions made in the normal course of operations in accordance
with policies and guidelines that are to be disbursed upon fulfillment of certain contract conditions.(b) Letters of credit (LOC) are written commitments provided by a bank. The total amount of LOC facilities is US$2.9 billion of which
US$2.7 billion were issued as of December 31, 2016.
The Reinsurance operation periodically uses letters of credit as collateral under certain reinsurance contracts for on-balance sheet policyliabilities. The Company may be required to seek collateral alternatives if it is unable to renew existing LOCs on maturity. Various Lifecosubsidiaries have provided LOCs as follows:
To external partiesClients residing in the United States are required pursuant to their insurance laws to obtain LOCs issued on the Company’s behalf fromapproved banks in order to further secure the Company’s obligations under certain reinsurance contracts.
Great-West Life has a LOC facility for US$600 million with a bank syndicate, which can be used by Great-West Life and its subsidiaries.As of December 31, 2016, Great-West Life subsidiaries have issued US$96 million to external parties.
Great-West Life also has a LOC facility for US$375 million for use by Great-West Life and its subsidiaries. Under this facility, CanadaLife has issued US$66 million to external parties.
As well, certain London Reinsurance Group subsidiaries and London Life have provided LOCs totaling US$6 million to external parties.
To internal parties GWL&A Financial Inc. has a US$1.2 billion LOC facility. As of December 31, 2016, US$1,167 million has been issued to the U.S. branchof Canada Life as beneficiary, to allow it to receive statutory capital credit for reserves ceded to Great-West Life & Annuity InsuranceCompany of South Carolina.
Great-West Life & Annuity Insurance Company also has a US$70 million LOC facility in place. As of December 31, 2016, US$70 millionhas been issued to Great-West Life & Annuity Insurance Company of South Carolina as beneficiary, to allow it to receive statutory capitalcredit.
Canada Life has a £117 million LOC issued to Canada Life Limited (CLL) as beneficiary, to allow CLL to receive statutory capital creditin the United Kingdom for a loan made from The Canada Life Group (U.K.) Limited.
Canada Life Reinsurance has a US$500 million LOC facility. As of December 31, 2016, US$500 million has been issued to Canada Life’sU.S. Branch.
In addition, using capacity from the facilities listed above, Great-West Life subsidiaries have issued US$627 million to other subsidiaries.
5) Pension contributions are subject to change, as contribution decisions are affected by many factors including market performance, regulatoryrequirements and management’s ability to change funding policy. Funding estimates beyond one year are excluded due to the significantvariability in the assumptions required to project the timing of future contributions.
Management's Discussion and Analysis
30
CAPITAL MANAGEMENT AND ADEQUACYAt the holding company level, the Company monitors the amount of consolidated capital available and the amountsdeployed in its various operating subsidiaries. The amount of capital deployed in any particular company or countryis dependent upon local regulatory requirements, as well as the Company’s internal assessment of capital requirementsin the context of its operational risks and requirements and strategic plans. The Company’s practice is to maintain thecapitalization of its regulated operating subsidiaries at a level that will exceed the relevant minimum regulatory capitalrequirements in the jurisdictions in which they operate. The capitalization decisions of the Company and its operatingsubsidiaries also give consideration to the impact such actions may have on the opinions expressed by various creditrating agencies that provide financial strength and other ratings to the Company.
In Canada, the Office of the Superintendent of Financial Institutions (OSFI) has established a capital adequacymeasurement for life insurance companies incorporated under the Insurance Companies Act (Canada) and theirsubsidiaries, known as the MCCSR ratio. The internal target range of the MCCSR ratio for Lifeco's major Canadianoperating subsidiaries is 175% to 215% (on a consolidated basis).
Great-West Life’s MCCSR ratio at December 31, 2016 was 240% (238% at December 31, 2015). London Life’s MCCSRratio at December 31, 2016 was 217% (226% at December 31, 2015). Canada Life's MCCSR ratio at December 31,2016 was 275% (260% at December 31, 2015). The MCCSR ratio does not take into account any impact from $1.1billion of liquidity at the Lifeco holding company level at December 31, 2016 ($0.9 billion at December 31, 2015).
The MCCSR ratio of 240% for Great-West Life includes 4 points for the impact of a new €200 million subordinatedloan, relating to a portion of the proceeds from the €500 million bonds issued by Lifeco, which was downstreamed,during the fourth quarter of 2016. The related impact for Canada Life was 7 points and nil for London Life. This newdebenture will replace an existing perpetual capital note at Irish Life Assurance Plc (ILA) that ILA announced it isredeeming on February 8, 2017. As a result of the redemption of these notes, the MCCSR ratio for Great-West Lifeand Canada Life will decrease in the first quarter of 2017. The net MCCSR impact of the new intercompany debenturein the fourth quarter of 2016, combined with the redemption in the first quarter of 2017 is nil.
In calculating the MCCSR position, available regulatory capital is reduced by goodwill and intangible assets, subjectto a prescribed inclusion for a portion of intangible assets. The OSFI MCCSR Guideline also prescribes that quarterlyre-measurements to defined benefit plans, impacting available capital for the Company’s federally regulatedsubsidiaries, are amortized over twelve quarters.
At December 31, 2016, the Risk Based Capital (RBC) ratio of Great-West Life & Annuity Insurance Company, Lifeco'sregulated U.S. operating company, is estimated to be 455% of the Company Action Level set by the National Associationof Insurance Commissioners. Great-West Life & Annuity Insurance Company reports its RBC ratio annually to U.S.Insurance Regulators.
The Board of Directors reviews and approves an annual capital plan as well as capital transactions undertaken bymanagement pursuant to the plan. The capital plan is designed to ensure that the Company maintains adequatecapital, taking into account the Company's strategy, risk profile and business plans. The Company has establishedpolicies and procedures designed to identify, measure and report all material risks. Management is responsible forestablishing capital management procedures for implementing and monitoring the capital plan. In addition toundertaking capital transactions, the Company uses and provides traditional and structured reinsurance to supportcapital and risk management.
OSFI Regulatory Capital Initiatives On September 12, 2016, OSFI issued the Life Insurance Capital Adequacy Test (LICAT) guideline. Effective January1, 2018, OSFI plans for the LICAT guideline to replace the MCCSR guideline. OSFI has stated that the LICAT guidelineis not expected to increase the amount of capital in the industry compared to the current MCCSR guideline. SinceOSFI developed the LICAT guideline to better align risk measures with the economic realities of the life insurancebusiness, capital distribution and impact by risk and by company may change. OSFI continues to conduct assessmentsof the new guideline, which will help to inform the final calibration of the LICAT guideline.
Management's Discussion and Analysis
31

The Company will continue ongoing dialogue with OSFI, the Canadian Institute of Actuaries, The Canadian Life andHealth Insurance Association and other industry participants during the assessment period and subsequentimplementation phase.
Due to the evolving nature of IFRS and proposed future changes to IFRS for the measurement of insurance contractliabilities, there will likely be further regulatory capital and accounting changes, some of which may be significant.
Management's Discussion and Analysis
32
CAPITAL ALLOCATION METHODOLOGY The Company has a capital allocation methodology, which allocates financing costs in proportion to allocated capital.For the Canadian and European segments (essentially Great-West Life), this allocation method tracks the regulatorycapital requirements, while for U.S. Financial Services and U.S. Asset Management (Putnam), it tracks the financialstatement carrying value of the business units. Total leverage capital is consistently allocated across all business unitsin proportion to total capital resulting in a debt-to-equity ratio in each business unit mirroring the consolidated Company.
The capital allocation methodology allows the Company to calculate comparable Return on Equity (ROE) for eachbusiness unit. These ROEs are therefore based on the capital the business unit has been allocated and the financingcharges associated with that capital.
Return on Equity(1)
Dec. 312016
Sept. 302016
Dec. 312015
Canada 19.9 % 19.0 % 20.2 %U.S. Financial Services(2) 10.6 % 11.0 % 13.0 %U.S. Asset Management (Putnam)(2) (2.9)% (0.3)% 1.4 %Europe 17.1 % 16.9 % 16.8 %Lifeco Corporate (5.2)% (3.6)% (2.7)%
Total Lifeco Net Earnings Basis 13.8 % 13.8 % 14.7 %(1) Return on Equity is the calculation of net earnings divided by the average common shareholders' equity over the trailing four quarters.(2) U.S. Financial Services includes U.S. Corporate, excluding restructuring costs relating to Putnam of $20 million, which are included in U.S.
Asset Management (Putnam).
The Company reported ROE of 13.8% at December 31, 2016 compared to 14.7% at December 31, 2015.

RATINGSThe Company’s financial leverage ratio has been maintained at a level consistent with credit rating agencies’ targetsfor highly rated entities and provides the Company with financial flexibility to invest in organic growth and acquisitionstrategies.
Lifeco maintains ratings from five independent ratings companies. In 2016, the credit ratings for Lifeco and its majoroperating subsidiaries were unchanged (set out in table below). The Company continued to receive strong ratingsrelative to its North American peer group resulting from its conservative risk profile, stable net earnings and consistentdividend track record. During the fourth quarter of 2016, Standard & Poor's Rating Services incorporated Irish Life aspart of its group ratings. ILA is not part of the group ratings for Fitch Ratings.
Lifeco's operating companies are assigned a group rating from each rating agency. This group rating is predominantlysupported by the Company’s leading position in the Canadian insurance market and competitive positions in the U.S.and European markets. Great-West Life, London Life and Canada Life have common management, governance andstrategy, as well as an integrated business platform. Each operating company benefits from the strong implicit financialsupport and collective ownership by Lifeco. There were no changes to the Company's group credit ratings in 2016.
Rating agency Measurement Lifeco
Great-WestLife
LondonLife
CanadaLife
IrishLife
Great-West Life &Annuity Insurance
CompanyA.M. Best Company Financial Strength A+ A+ A+ A+DBRS Limited Issuer Rating A (high) AA
Financial Strength AA AA AA NRSenior Debt A (high)Subordinated Debt AA (low)
Fitch Ratings Insurer Financial Strength AA AA AA AA AASenior Debt ASubordinated Debt A
Moody's InvestorsService
Insurance Financial Strength Aa3 Aa3 Aa3 Aa3
Standard & Poor'sRatings Services
Insurer Financial Strength AA AA AA AAIssuer Rating A+Senior Debt A+Subordinated Debt AA- A-
Management's Discussion and Analysis
33
SEGMENTED OPERATING RESULTSThe consolidated operating results of Lifeco, including the comparative figures, are presented on an IFRS basis aftercapital allocation. Consolidated operating results for Lifeco comprise the net earnings of Great-West Life and itsoperating subsidiaries, London Life and Canada Life; Great-West Financial and Putnam; together with Lifeco'sCorporate results.
For reporting purposes, the consolidated operating results are grouped into four reportable segments – Canada, UnitedStates, Europe and Lifeco Corporate – reflecting geographic lines as well as the management and corporate structureof the companies.
CANADAThe Canada segment of Lifeco includes the operating results of the Canadian businesses operated by Great-WestLife, London Life and Canada Life, together with an allocation of a portion of Lifeco's corporate results. There arethree primary business units included in this segment. Through the Individual Insurance business unit, the Companyprovides life, disability and critical illness insurance products to individual clients. Through the Wealth Managementbusiness unit, the Company provides accumulation products and annuity products for both group and individual clientsin Canada. Through the Group Insurance business unit, the Company provides life, accidental death anddismemberment, critical illness, health and dental protection, creditor and direct marketing insurance as well as specialtyproducts to group clients in Canada.
Management's Discussion and Analysis
34
BUSINESS PROFILE
INDIVIDUAL INSURANCEIn Canada, Individual Insurance consists of Individual Life Insurance and Living Benefits. Products and services aredistributed through diverse, complementary channels: financial security advisors and brokers associated with Great-West Life; financial security advisors associated with London Life’s Freedom 55 FinancialTM division and the Wealth& Estate Planning Group; and the distribution channels Canada Life supports, including independent advisorsassociated with managing general agencies (MGAs), as well as national accounts, including Investors Group, a memberof the Power Financial Corporation group of companies.
The various distribution channels are accessed through distinct product labels offered by Great-West Life, London Lifeand Canada Life. Unique products and services are offered to meet the needs of each distribution channel to allowthe Company to maximize opportunities while minimizing channel conflict.
WEALTH MANAGEMENTThe Wealth Management business unit consists of Individual Retirement & Investment Services (IRIS) and GroupRetirement Services (GRS) product lines. The Company utilizes diverse, complementary distribution channels and isa leader in Canada for all Wealth Management product lines. Products are distributed through the same channels asdescribed above for Individual Insurance as well as independent brokers, consultants and direct business for theCompany's GRS business.
The individual lines of business access the various distribution channels through distinct product labels offered byGreat-West Life, London Life, Canada Life and Quadrus Investment Services Ltd. (Quadrus). Unique products andservices are offered to meet the needs of each distribution channel and customer to allow the Company to maximizeopportunities while minimizing channel conflict.
GROUP INSURANCE In Canada, the Company offers effective benefit solutions for small, medium and large plan sponsors. Through theCompany’s extensive network of Group sales offices and Sales and Marketing Centres located across the country, itdistributes its products through brokers, consultants and financial security advisors. The Company offers a wide rangeof Group products and services including life, accidental death and dismemberment, critical illness, disability, healthand dental protection as well as specialty products.
The Company’s creditor and direct marketing business, conducted through its Canada Life subsidiary, offers effectivebenefit solutions for large financial institutions, credit card companies, alumni and association groups. Canada Life isa leader in the creditor insurance business in Canada.

MARKET OVERVIEW
PRODUCTS AND SERVICES
Management's Discussion and Analysis
35
INDIVIDUAL INSURANCE The Company provides an array of individual insurance products that are distributed through multiple sales channels.Products are marketed under the Great-West Life, London Life and Canada Life brands.
MARKET POSITION PRODUCTS AND SERVICES DISTRIBUTION• Manages largest portfolio of life
insurance in Canada as measuredby premium(1)
• Pre-eminent provider of individualdisability and critical illnessinsurance with 27% market shareof in-force premium(1)
Individual Life Insurance• Term Life• Universal Life• Participating Life
Living Benefits• Disability• Critical Illness
Associated with:Great-West Life Distribution• 2,868 Great-West Life financial security advisors• 2,068 advisors associated with a number of
intercorporate arrangements• 5,698 independent brokers
London Life Distribution• 3,760 Freedom 55 Financial and Wealth & Estate
Planning Group financial security advisors
Canada Life Distribution• 7,737 independent brokers associated with 36
MGAs• 1,897 advisors associated with 14 national
accounts• 3,509 Investors Group consultants who actively sell
Canada Life products• 141 direct brokers and producer groups
(1) As at September 30, 2016
WEALTH MANAGEMENT The Company provides an array of savings and income products that are distributed through multiple sales channels.Products are marketed under the Great-West Life, London Life, Canada Life and Quadrus brands.
The Company offers a wide range of segregated funds through its multiple distribution channels including 97 LondonLife segregated funds to individual Freedom 55 FinancialTM clients, 90 Canada Life segregated funds to individualCanada Life clients, 93 Great-West Life segregated funds to individual Great-West Life clients and over 200 segregatedfunds to Envision Group Capital Accumulation Fund clients.
Quadrus offers 59 mutual funds under the Quadrus Group of FundsTM brand and over 5,000 third-party mutual funds.Mackenzie Financial Corporation, a member of the Power Financial Corporation group of companies, administers theQuadrus Group of Funds.
MARKET POSITION PRODUCTS AND SERVICES DISTRIBUTION• 27% market share of
individual segregatedfunds(1)
• 17% market share ofgroup capital accumulationplans(2)
• 23% new sales marketshare of single premiumgroup annuities(1)
Group Retirement Services• Group Capital
Accumulation Plans• Non-registered savings
programs• Deferred profit sharing
plans• Defined contribution
pension plans• Group RRSPs & TFSAs
Invested in:• Segregated funds• Guaranteed investment
options• Single company stock
• Retirement Income Plans• Payout annuities• Deferred annuities• Retirement income funds• Life income funds
• Investment managementservices only plans
Invested in:• Segregated funds• Guaranteed investment
options• Securities
Individual Retirement &Investment Services
• Savings plans• RRSPs• Non-registered savings
programs• TFSAs
Invested in:• Segregated funds • Mutual funds• Guaranteed investment
options
• Retirement Income Plans• Segregated funds with
GMWB rider• Retirement income funds• Life income funds• Payout annuities• Deferred annuities
• Residential mortgages• Banking products
Associated with:Great-West Life Distribution• 2,868 Great-West Life financial
security advisors• 2,068 advisors associated with a
number of intercorporatearrangements
• 5,698 independent brokers
London Life Distribution• 3,760 Freedom 55 Financial and
Wealth & Estate Planning Groupfinancial security advisors
Canada Life Distribution• 7,737 independent brokers associated
with 36 MGAs• 1,897 advisors associated with 14
national accounts• 3,509 Investors Group consultants
who actively sell Canada Life products• 141 direct brokers and producer
groups
Quadrus Investment Services Ltd. (alsoincluded in Great-West Life and LondonLife advisor counts):
• 4,133 investment representatives
Group Retirement Services • Benefits Consultants, Brokers and
Affiliated advisors (as above)(1) As at September 30, 2016(2) As at June 30, 2016
Management's Discussion and Analysis
36

GROUP INSURANCE The Company provides an array of life, health and creditor insurance products that are distributed primarily throughGroup sales offices across the country.
MARKET POSITION PRODUCTS AND SERVICES DISTRIBUTION• Employee benefits to over 30,000 plan
sponsors(1)
• 21% market share for employee/employerplans(2)
• Leading market share with 39% forcreditor products(2) with coverageprovided to over 7.4 million planmembers(1)
• 5% market share for direct marketingproducts(2) with coverage provided to over0.6 million plan members(1)
Life and Health• Life• Disability• Critical Illness• Accidental death & dismemberment• Dental • Expatriate coverage• Extended health care
Creditor• Creditor life• Creditor disability• Creditor job loss• Creditor critical illness• Creditor credit card outstanding balance
• 119 account managers and sales stafflocated in 18 Group Offices
• 81 Regional Employee BenefitsManagers and Selectpac SalesSpecialists located in 28 Sales andMarketing Centres
(1) As at December 31, 2016(2) As at December 31, 2015
Management's Discussion and Analysis
37
COMPETITIVE CONDITIONS
INDIVIDUAL INSURANCEThe individual insurance marketplace is highly competitive. Competition focuses on service, technology, productfeatures, price and financial strength, as indicated by ratings issued by nationally recognized agencies. The Company'sbroad spectrum of distribution associates, including exclusive and independent channels, provides important strategicadvantages within the Canadian market.
WEALTH MANAGEMENTThe wealth management marketplace is very competitive. The Company's main competitors include mutual fundcompanies, insurance companies, banks and investment advisors, as well as other service and professionalorganizations. New competitors have entered the marketplace leading to increased competition. Competition focuseson service, variety of investment options, investment performance, product features, price and financial strength, asindicated by ratings issued by nationally recognized agencies. Wealth Management's broad spectrum of distributionassociates, including exclusive and independent channels, provide important strategic advantages within the Canadianmarket.
GROUP INSURANCE The group insurance market in Canada is highly competitive. There are three large group insurance carriers withsignificant market positions, as well as a number of smaller companies operating nationally, and several regional andniche competitors. The Company has significant market share of 21%. This strong market share position, supportedby extensive distribution and access to a wide range of products and services, is a distinct advantage for competingsuccessfully in the Canadian group insurance market.
Selected consolidated financial information - CanadaFor the three months ended For the twelve months ended
Dec. 312016
Sept. 302016
Dec. 312015
Dec. 312016
Dec. 312015
Premiums and deposits $ 6,681 $ 6,054 $ 6,110 $ 24,661 $ 23,564Sales 3,871 3,117 3,492 12,933 12,635Fee and other income 386 377 369 1,494 1,459Net earnings - common shareholders 326 289 262 1,218 1,195
Total assets $ 153,524 $ 152,484 $ 145,895Proprietary mutual funds and institutional net
assets 5,852 5,625 5,039Total assets under management 159,376 158,109 150,934Other assets under administration 15,911 15,815 15,390Total assets under administration $ 175,287 $ 173,924 $ 166,324
Management's Discussion and Analysis
38
Net earnings - common shareholdersFor the three months ended For the twelve months ended
Dec. 312016
Sept. 302016
Dec. 312015
Dec. 312016
Dec. 312015
Individual Insurance $ 103 $ 70 $ 51 $ 345 $ 307Wealth Management 132 99 119 436 479Group Insurance 98 110 74 400 432Corporate (7) 10 18 37 (23)Net earnings $ 326 $ 289 $ 262 $ 1,218 $ 1,195
2016 DEVELOPMENTS • Premiums and deposits for the twelve months ended December 31, 2016 were $24.7 billion compared to $23.6
billion for the same period in 2015. Premiums and deposits in the fourth quarter of 2016 were $6.7 billion, a 9%increase from the same quarter last year.
• Sales for the twelve months ended December 31, 2016 were $12.9 billion compared to $12.6 billion for the sameperiod in 2015. Sales in the fourth quarter of 2016 were $3.9 billion, an 11% increase from the same quarter in2015, which reflects strong sales across all lines of business including a 161% increase in Individual Life sales anda 29% increase in Group Retirement Services sales. Group Insurance led the market in sales both in the quarterand for the full year of 2016.
• Fee and other income for the twelve months ended December 31, 2016 was $1,494 million compared to $1,459million for the same period in 2015. Fee and other income was $386 million for the fourth quarter of 2016, anincrease of $17 million compared to the same quarter in 2015.
• Net earnings for the twelve months ended December 31, 2016 were $1,218 million compared to $1,195 million forthe same period in 2015. Net earnings for the fourth quarter of 2016 were $326 million, an increase of $64 millioncompared to the same quarter last year, primarily due to favourable mortality and morbidity experience as well ashigher net fee income, partially offset by lower contributions from insurance contract liability basis changes.
• In 2017, Great-West Life, London Life and Canada Life will realign their operations into two new business units:one focused on individual customers and the other on group customers. As part of the realignment, a new strategiccustomer marketing function is being created to provide a more holistic customer experience through digital andinnovative capabilities and services.
• The Company is an active participant in the pension plan de-risking market within Canada. During the fourth quarterof 2016, Lifeco's Canadian operations entered into its first longevity swap transaction. This transaction supplementsthe other products and strategies that the Company offers to assist companies in managing their pension plan risk.
• Group Insurance extended its market reach and self-service options, with several new initiatives and online offerings:
◦ Great-West Life announced that in early 2017 it will begin providing small group insurance product optionsto Collage Technologies Inc., which offers online automated HR services and tools to Canadian businesses.
◦ Great-West Life’s e-Benefit portal is available to advisors in the individual health benefits market for a moreefficient and convenient sales experience.
◦ Creditor Insurance launched a Customer Self-Service Portal, which allows claimants to securely view thestatus of their disability or job loss claim.
• Great-West Life and its subsidiaries, London Life and Canada Life, were honoured to again be selected as one ofCanada’s Top 100 Employers. They were also named as one of Canada’s Top Employers for Young People.
Management's Discussion and Analysis
39
BUSINESS UNITS - CANADA
INDIVIDUAL INSURANCE
OPERATING RESULTS
For the three months ended For the twelve months endedDec. 31
2016Sept. 30
2016Dec. 31
2015Dec. 31
2016Dec. 31
2015Premiums and deposits $ 1,543 $ 1,298 $ 1,304 $ 5,371 $ 4,894Sales 341 164 137 785 530Net earnings 103 70 51 345 307
Premiums and depositsIndividual Insurance premiums for the fourth quarter of 2016 increased by $239 million to $1,543 million compared tothe same quarter last year. Individual Life premiums for the quarter increased by $237 million to $1,458 million comparedto the same quarter last year, primarily due to a 24% increase in participating life premiums. Living Benefits premiumsof $85 million were comparable to same quarter last year.
For the twelve months ended December 31, 2016, Individual Insurance premiums increased by $477 million to $5,371million compared to the same period last year. Individual Life premiums increased by $472 million to $5,035 millioncompared to the same period last year, primarily due to a 13% increase in participating life premiums. Living Benefitspremiums of $336 million were comparable to the same period last year.
Individual Insurance premiums for the fourth quarter of 2016 increased by $245 million compared to the previousquarter, primarily due to a 26% increase in participating life premiums.
SalesIndividual Insurance sales for the fourth quarter of 2016 increased by $204 million to $341 million compared to thesame quarter last year, reflecting an increase in participating life sales of $185 million or 183%, and an increase inUniversal Life and Term Life insurance product sales of $19 million or 73%. The increase in Individual Life sales wasprimarily due to changes to tax exempt legislation effective in January 2017. Living Benefits product sales of $10million were comparable to the same quarter last year.

For the twelve months ended December 31, 2016, Individual Insurance sales increased by $255 million to $785 millioncompared to the same period last year. Participating life sales increased by $225 million or 58%, while Universal Lifeand Term Life insurance product sales increased by $27 million or 25%, primarily due to the same reasons discussedfor the in-quarter results. Living Benefit product sales increased $3 million or 9% compared to the same period lastyear.
Individual Insurance sales for the fourth quarter of 2016 increased by $177 million compared to the previous quarter,primarily due to a 134% increase in participating life sales and a 41% increase in Universal Life and Term Life insuranceproduct sales, driven by the same reasons discussed for the in-quarter results.
Net earningsNet earnings for the fourth quarter of 2016 increased by $52 million to $103 million compared to the same quarter lastyear. The increase was primarily due to higher contributions from investment experience and favourable mortalityexperience, partially offset by less favourable morbidity and policyholder behaviour experience.
For the twelve months ended December 31, 2016, net earnings increased by $38 million to $345 million compared tothe same period last year. The increase was primarily due to higher contributions from investment experience andfavourable mortality experience, partially offset by lower contributions from insurance contract liability basis changes,higher new business strain as well as less favourable morbidity and policyholder behaviour experience.
Net earnings for the fourth quarter of 2016 increased by $33 million compared to the previous quarter. The increasewas primarily due to higher contributions from investment experience and lower new business strain, partially offsetby less favourable morbidity experience.
For the fourth quarter of 2016, net earnings attributable to the participating account increased by $138 million to $178million compared to the same quarter last year, primarily due to higher contributions from insurance contract liabilitybasis changes.
For the twelve months ended December 31, 2016, net earnings attributable to the participating account increased by$80 million to $191 million compared to the same period last year. The increase was primarily due to higher contributionsfrom insurance contract liability basis changes, partially offset by lower contributions from investment experience onparticipating account surplus assets and higher new business strain.
Net earnings attributable to the participating account for the fourth quarter of 2016 increased by $181 million comparedto the previous quarter, primarily due to higher contributions from insurance contract liability basis changes and lowerexpenses, partially offset by higher new business strain.
Management's Discussion and Analysis
40
OUTLOOK – INDIVIDUAL INSURANCERefer to Cautionary Note regarding Forward-looking Information and Cautionary Note regarding non-IFRS FinancialMeasures at the beginning of this document.
The Individual Insurance division delivered strong results in 2016. The Company's reputation for strength and stability,combined with prudent business practices as well as the depth and breadth of its distribution channels positions theCompany well for 2017 and beyond. The Company has reviewed its strategies with the goal of achieving superiororganic growth from profitable products.
In 2017, the Company will continue to provide advisors with strategies and tools for helping clients focus on achievinglong-term financial security regardless of market fluctuations. This approach is beneficial to strong client retention aswell as helping advisors attract new clients to the Company. A key distribution strategy will be to maximize the use ofcommon tools, processes and support, while tailoring support to specific segments of advisors where appropriate.

The Company will continue to competitively develop, price and market its comprehensive range of Individual Insuranceproducts while maintaining its focus on sales and service support for large cases in all channels.
Operational expense management continues to be critically important to delivering strong financial results. This willbe achieved through disciplined expense controls and effective development and implementation of strategicinvestments. Management has identified a number of areas of focus for these investments to facilitate the objectiveof organic growth.
The Company’s diversified offering of Individual Insurance products including participating whole life, term, universallife, disability, and critical illness insurance, combined with a commitment to new business service will position it tocontinue to achieve market leading sales in 2017. The Company will continue to enhance its suite of product solutions,including launching updated participating whole life, term and universal life insurance products that comply with newtax exempt legislation effective January 2017, and will continue to focus on growing its business organically by constantlyimproving service to clients.
Management's Discussion and Analysis
41
WEALTH MANAGEMENT
OPERATING RESULTS
For the three months ended For the twelve months endedDec. 31
2016Sept. 30
2016Dec. 31
2015Dec. 31
2016Dec. 31
2015Premiums and deposits $ 3,041 $ 2,716 $ 2,804 $ 10,979 $ 10,832Sales 3,350 2,863 3,220 11,476 11,472Fee and other income 331 326 316 1,279 1,247Net earnings 132 99 119 436 479
Premiums and depositsPremiums and deposits for the fourth quarter of 2016 increased by $237 million to $3,041 million compared to thesame quarter last year. The increase was primarily due to higher premiums and deposits related to single premiumgroup annuities (SPGAs), partially offset by lower premiums and deposits related to group capital accumulation plans(GCAP). For the twelve months ended December 31, 2016, premiums and deposits increased by $147 million to $10,979 millioncompared to the same period last year. The increase was primarily due to higher premiums and deposits related toSPGAs and GCAP products, partially offset by lower deposits related to individual investment funds, reflective of adecline in industry asset cash flows pertaining to segregated funds and mutual funds.
Premiums and deposits for the fourth quarter of 2016 increased by $325 million compared to the previous quarter.The increase was primarily due to higher premiums and deposits related to SPGAs and individual investment funds. SalesSales for the fourth quarter of 2016 increased by $130 million to $3,350 million compared to the same quarter lastyear. The increase was primarily due to higher sales of SPGAs, partially offset by lower sales of individual investmentfunds.
For the twelve months ended December 31, 2016, sales of $11,476 million were comparable to the same period lastyear as higher sales of SPGAs and GCAP products were offset by lower sales of individual investment funds.

Sales for the fourth quarter of 2016 increased by $487 million compared to the previous quarter. The increase wasprimarily driven by higher sales related to SPGAs and individual investment funds, partially offset by lower sales ofGCAP products.
For the GCAP and proprietary individual investment fund business, net cash inflows for the fourth quarter of 2016 were$193 million compared to $358 million in the same quarter last year and net cash outflows of $784 million in the previousquarter, which included a $910 million withdrawal of a lower margin GCAP plan. Excluding the GCAP plan withdrawaldiscussed for the in-quarter results, net cash inflows for the twelve months ended December 31, 2016 were $725million compared to $788 million for the same period last year.
Management's Discussion and Analysis
42
Assets under administrationDecember 31
2016 2015Assets under managementIndividual Retirement & Investment Services
Risk-based products $ 5,527 $ 5,739Segregated funds 31,931 29,836Proprietary mutual funds 5,530 4,917
Group Retirement ServicesRisk-based products 7,595 7,161Segregated funds 42,978 40,433Institutional assets 322 122
Total assets under management $ 93,883 $ 88,208
Other assets under administration(1)
Individual Retirement & Investment Services 7,240 6,620Group Retirement Services 538 526Total other assets under administration $ 7,778 $ 7,146
Total assets under administration $ 101,661 $ 95,354
Summary by business/productIndividual Retirement & Investment Services 50,228 47,112Group Retirement Services 51,433 48,242
Total assets under administration $ 101,661 $ 95,354
(1) Includes mutual funds distributed by Quadrus Investment Services Ltd., stock purchase plans administered by London Life and portfolio assetsmanaged by GLC Asset Management Group.
Fee and other incomeFee and other income for the fourth quarter of 2016 increased by $15 million to $331 million compared to the samequarter last year, primarily due to higher average assets under administration driven by higher average equity marketlevels, partially offset by lower margins.
Fee and other income for the twelve months ended December 31, 2016 increased by $32 million to $1,279 millioncompared to the same period last year. The increase was primarily due to growth in other income related to distributionarrangements as well as higher fee income driven by higher average assets under administration, partially offset bylower margins.
Fee and other income for the fourth quarter of 2016 increased by $5 million compared to the previous quarter, primarilydue to higher average assets under administration driven by higher average equity market levels.

Net earningsNet earnings for the fourth quarter of 2016 increased by $13 million to $132 million compared to the same quarter lastyear. The increase was primarily due to higher net fee income, higher new business volumes and more favourablelongevity experience, partially offset by lower contributions from insurance contract liability basis changes.
For the twelve months ended December 31, 2016, net earnings decreased by $43 million to $436 million comparedto the same period last year. The decrease was primarily due to lower contributions from insurance contract liabilitybasis changes, less favourable longevity experience, lower contributions from investment experience and higheroperating expenses, partially offset by higher new business volumes.
Net earnings for the fourth quarter of 2016 increased by $33 million compared to the previous quarter, primarily dueto higher contributions from insurance contract liability basis changes, more favourable longevity experience, highercontributions from investment experience and higher new business volumes.
Management's Discussion and Analysis
43
OUTLOOK – WEALTH MANAGEMENT Refer to Cautionary Note regarding Forward-looking Information and Cautionary Note regarding non-IFRS FinancialMeasures at the beginning of this document.
In 2016, the Company's HelloLifeTM Planner won the 2016 Internet Advertising Competition Award for “Best InsuranceInteractive Application”. The planner allows the Company's financial security advisors to help individuals create aretirement program tailored to their specific needs. The Company also launched a pilot for Wayfinder, a new onlineapplication that allows Group Retirement Services members to create customized financial plans. Wayfinder usesinnovative tools to allow members to connect directly with online financial coaches, and to import data from externalfinancial institutions to create a complete picture of their financial status. The Company will continue to focus on servingthe needs of the aging demographic and enhancing the client's experience through various initiatives targeted at bothindividual and group customers.
In 2017, the Company will continue to provide advisors with strategies and tools for helping clients focus on achievinglong-term investment success. This approach benefits the Company by improving existing asset retention and byhelping advisors attract new client deposits to the Company. A key distribution strategy is to maximize use of commontools, processes and support, while tailoring support to specific segments of advisors where appropriate.
The Company's reputation for strength and stability, combined with prudent business practices as well as the depthand breadth of Wealth Management's distribution channels, positions the Company well for 2017 and beyond. WealthManagement’s strategy and organization are focused on achieving growth from profitable products.
The Company will continue to develop, price and market its comprehensive and competitive range of wealthmanagement products to both retail and group clients. The Company continues to observe fee income compressiondue to the competitive market; however, targets to offset these impacts by growing assets under management andcontinuing to improve the Company's operational efficiency. The Company will focus on strategic investment in the business, operational efficiency improvements and disciplinedexpense management to deliver strong financial results.
GROUP INSURANCE
OPERATING RESULTS
For the three months ended For the twelve months endedDec. 31
2016Sept. 30
2016Dec. 31
2015Dec. 31
2016Dec. 31
2015Premiums and deposits $ 2,097 $ 2,040 $ 2,002 $ 8,311 $ 7,838Sales 180 90 135 672 633Fee and other income 41 39 41 165 157Net earnings 98 110 74 400 432
Premiums and depositsPremiums and deposits for the fourth quarter of 2016 increased by $95 million to $2,097 million compared to the samequarter last year, due to an increase in premiums and deposits across most market segments.
For the twelve months ended December 31, 2016, premiums and deposits increased by $473 million to $8,311 millioncompared to the same period last year, for the same reasons discussed for the in-quarter results.
Premiums and deposits for the fourth quarter of 2016 increased by $57 million compared to the previous quarter,primarily due to an increase in large case market premiums and deposits.
SalesSales for the fourth quarter of 2016 increased by $45 million to $180 million compared to the same quarter last year.The increase was primarily due to higher sales in the large case and creditor markets. Sales of creditor products andlarge cases can be highly variable from quarter to quarter.
For the twelve months ended December 31, 2016, sales increased by $39 million to $672 million compared to thesame period last year. The increase was due to higher sales across most market segments.
Sales for the fourth quarter of 2016 increased by $90 million compared to the previous quarter, due to higher salesacross all market segments.
Fee and other incomeFee and other income of $41 million for the fourth quarter of 2016 was comparable to both the same quarter last yearand to the previous quarter.
Fee and other income of $165 million for the twelve months ended December 31, 2016 was also comparable to thesame period last year.
Net earningsNet earnings for the fourth quarter of 2016 increased by $24 million to $98 million compared to the same quarter lastyear. The increase was primarily due to more favourable non-refund long-term disability morbidity experience andmore favourable mortality experience, partially offset by lower contributions from insurance contract liability basischanges.
Management's Discussion and Analysis
44
For the twelve months ended December 31, 2016, net earnings decreased by $32 million to $400 million comparedto the same period last year. The decrease was primarily due to less favourable long-term disability morbidity experience,mostly related to large non-refund cases, and higher income taxes, as net earnings in 2015 were more favourablyimpacted by changes to certain income tax estimates, partially offset by more favourable mortality experience andhigher contributions from insurance contract liability basis changes. The Company continues to implement rateincreases with respect to long-term disability contracts, where appropriate, when contracts are renewed.
Net earnings for the fourth quarter of 2016 decreased by $12 million compared to the previous quarter, primarily dueto lower contributions from insurance contract liability basis changes, partially offset by more favourable mortalityexperience and higher contributions from investment experience.
Management's Discussion and Analysis
45
OUTLOOK – GROUP INSURANCERefer to Cautionary Note regarding Forward-looking Information and Cautionary Note regarding non-IFRS FinancialMeasures at the beginning of this document.
During 2016, the Company maintained its strong competitive position in the Canadian group insurance market withleading or strong market shares in all case size, regional and benefit market segments. The Company believes thatthis market share position, together with its expense management capabilities and distribution capacity, will facilitatecontinued growth in revenue premium. In particular, through effective investment in digital technologies and innovativebenefit solutions, the Company expects to continue to enhance its competitive position in the marketplace.
CANADA CORPORATECanada Corporate consists of items not associated directly with or allocated to the Canadian business units.
For the fourth quarter of 2016, Canada Corporate had a net loss of $7 million compared to net earnings of $18 millionfor the same quarter last year. The change in net earnings was primarily due to lower net investment income andhigher operating expenses. In addition, net earnings for the fourth quarter of 2015 were more favourably impacted bychanges to certain tax estimates.
For the twelve months ended December 31, 2016, Canada Corporate had net earnings of $37 million compared to anet loss of $23 million for the same period last year. The change in net earnings was primarily due to the favourableimpact of changes to certain income tax estimates and higher net investment income, which included a gain on saleof an investment property during the second quarter, partially offset by higher operating expenses.
For the fourth quarter of 2016, Canada Corporate had a net loss of $7 million compared to net earnings of $10 millionin the previous quarter. The change in net earnings was primarily due to lower net investment income. In addition,net earnings for the third quarter of 2016 were more favourably impacted by changes to certain tax estimates.
OUTLOOK – CANADAIn 2017, Great-West Life, London Life and Canada Life will realign their operations into two new business units: onefocused on individual customers and the other on group customers, supported by a new strategic customer marketingfunction. With the goal of creating a more holistic customer experience, productivity gains and cost savings associatedwith these changes will support earnings growth balanced with reinvestment in customer-centered innovations andservice offerings. As part of the realignment, Wealth Management's Individual Retirement & Investment Servicesproduct lines will combine with the Individual Insurance business unit to create a business unit that is focused onindividual customers. Wealth Management's Group Retirement Services product lines will combine with the GroupInsurance business unit to create a business unit that is focused on group customers.

UNITED STATESThe United States operating results for Lifeco include the results of Great-West Financial, Putnam and the results ofthe insurance businesses in the United States branches of Great-West Life and Canada Life, together with an allocationof a portion of Lifeco's corporate results.
Through its Financial Services business unit, and specifically the Empower Retirement brand, the Company providesan array of financial security products, including employer-sponsored defined contribution plans, administrative andrecordkeeping services, individual retirement accounts, fund management as well as investment and advisory services.The Company also provides life insurance, annuity and executive benefits products through its Individual Marketsoperations.
Through its Asset Management business unit, the Company provides investment management, certain administrativefunctions, distribution and related services, through a broad range of investment products.
TRANSLATION OF FOREIGN CURRENCYForeign currency assets and liabilities are translated into Canadian dollars at the market rate at the end of the financialperiod. All income and expense items are translated at an average rate for the period.
Currency translation impact is a non-IFRS financial measure that highlights the impact of changes in currency translationrates on IFRS results. This measure provides useful information as it facilitates the comparability of results betweenperiods. Refer to the Cautionary Note regarding non-IFRS Financial Measures at the beginning of this document.
Management's Discussion and Analysis
46
BUSINESS PROFILE
FINANCIAL SERVICES Great-West Financial provides an array of financial security products, including employer-sponsored definedcontribution plans, individual retirement accounts, life insurance, annuity products and executive benefits products.Under the Empower Retirement brand name, Great-West Financial offers employer-sponsored defined contributionplans, individual retirement accounts, enrollment services, communication materials, investment options and educationservices as well as fund management, investment and advisory services. Through its FASCore subsidiary, the Companyoffers private label recordkeeping and administrative services for other providers of defined contribution plans. Throughrelationships with government plan sponsors, the Company is the largest provider of services to state definedcontribution plans, with 22 recordkeeping and two investment only state clients.
ASSET MANAGEMENT Putnam provides investment management, certain administrative functions and distribution services. Putnam offersa broad range of investment products, including equity, fixed-income, absolute return and alternative strategies, throughPutnam Funds, Putnam World Trust Funds and institutional portfolios. Revenue is derived from the value andcomposition of assets under management and performance fees as well as service and distribution fees. Accordingly,fluctuations in the financial markets and changes in the composition of assets or accounts affect revenues and resultsof operations.

MARKET OVERVIEW
PRODUCTS AND SERVICESThe Company provides a focused product offering that is distributed through a variety of channels.
Management's Discussion and Analysis
47
FINANCIAL SERVICESMARKET POSITION PRODUCTS AND SERVICES DISTRIBUTION
• Second largest defined contributionrecordkeeper in the country(4), providingservices for over 8 million participantaccounts and 36,334 plans(1)
• 24% market share in state and localgovernment deferred compensationplans, based on number of participantaccounts(2)
• 32% market share of individual lifeinsurance sold through the retail bankchannel(3)
• 10% market share of executive benefitsmarkets life insurance purchased byfinancial institutions(3)
• Great-West Lifetime Funds are the 13th
largest target date fund offering in theUnited States(1)
• Employer-sponsored defined contributionplans, enrollment services,communication materials, investmentoptions and education services
• Administrative and recordkeepingservices for financial institutions andemployer-sponsored defined contributionplans and associated defined benefitplans
• Fund management, investment andadvisory services
• Individual retirement accounts (IRAs),individual term and single premium lifeinsurance and individual annuity products
• Executive benefits markets life insuranceproducts
• Retirement services products distributedto plan sponsors through brokers,consultants, advisors, third-partyadministrators and banks
• FASCore recordkeeping andadministrative services distributedthrough institutional clients
• Individual life and annuity productsdistributed through wholesale and retailsales force, banks, broker dealers andinvestment advisors
• IRAs available to individuals through theRetirement Solutions Group
• Executive benefits markets life insuranceproducts distributed through wholesalersand specialized consultants
(1) As at December 31, 2016(2) As at September 30, 2016(3) Market share based on annualized Q1 - Q3 2016 sales data(4) As at December 31, 2015

ASSET MANAGEMENT
MARKET POSITION PRODUCTS AND SERVICES DISTRIBUTION• A global asset manager with assets
under management of US$152 billion(1) • Global distribution includes sales teams
that are focused on major institutionalmarkets in the U.S., Europe, the MiddleEast, Asia and Australia and through astrategic distribution relationship in Japan
Investment Management Products &Services
• Individual retail investors - a family ofopen-end and closed-end mutual funds,college savings plans and variableannuity products
• Institutional investors - defined benefitand defined contribution investment onlyplans sponsored by corporations, state,municipal and other governmentalauthorities, university endowment funds,charitable foundations, and collectiveinvestment vehicles (both U.S. and non-U.S.)
• Investment services for definedcontribution investment only plans
• Alternative investment products acrossthe fixed-income, quantitative and equitygroups
Administrative Services • Transfer agency, underwriting,
distribution, shareholder services, trusteeand other fiduciary services
Individual Retail Investors• A broad network of distribution
relationships with unaffiliated brokerdealers, financial planners, registeredinvestment advisors and other financialinstitutions that distribute the PutnamFunds and defined contributioninvestment only services to theircustomers, which, in total, includesapproximately 157,500 advisors
• Sub-advisory relationships and Putnam-labeled funds as investment options forinsurance companies and non-U.S.residents
• Retail distribution channels aresupported by Putnam's sales andrelationship management team
• Retirement plan sponsors andparticipants are supported by Putnam’sdedicated retirement plan professionalsand through a relationship with EmpowerRetirement.
Institutional Investors• Supported by Putnam's dedicated
account management, productmanagement and client serviceprofessionals
• Strategic relationships with severalinvestment management firms outside ofthe U.S.
(1) As at December 31, 2016
Management's Discussion and Analysis
48
COMPETITIVE CONDITIONS
FINANCIAL SERVICES The life insurance, savings and investments marketplace is competitive. The Company's competitors include mutualfund companies, insurance companies, banks, investment advisors and certain service and professional organizations.No one competitor or small number of competitors is dominant. Competition focuses on name recognition, service,technology, cost, variety of investment options, investment performance, product features, price and financial strengthas indicated by ratings issued by nationally recognized agencies.
ASSET MANAGEMENTThe investment management business is highly competitive. Putnam competes with other providers of investmentproducts and services, primarily based on the range of investment products offered, investment performance,distribution, scope and quality of shareholder and other services as well as general reputation in the marketplace.Putnam’s investment management business is also influenced by general securities market conditions, governmentregulations, global economic conditions as well as advertising and sales promotional efforts. Putnam competes withother mutual fund firms and institutional asset managers that offer investment products similar to Putnam as well asproducts that Putnam does not offer. Putnam also competes with a number of mutual fund sponsors that offer theirfunds directly to the public. Conversely, Putnam offers its funds only through intermediaries.
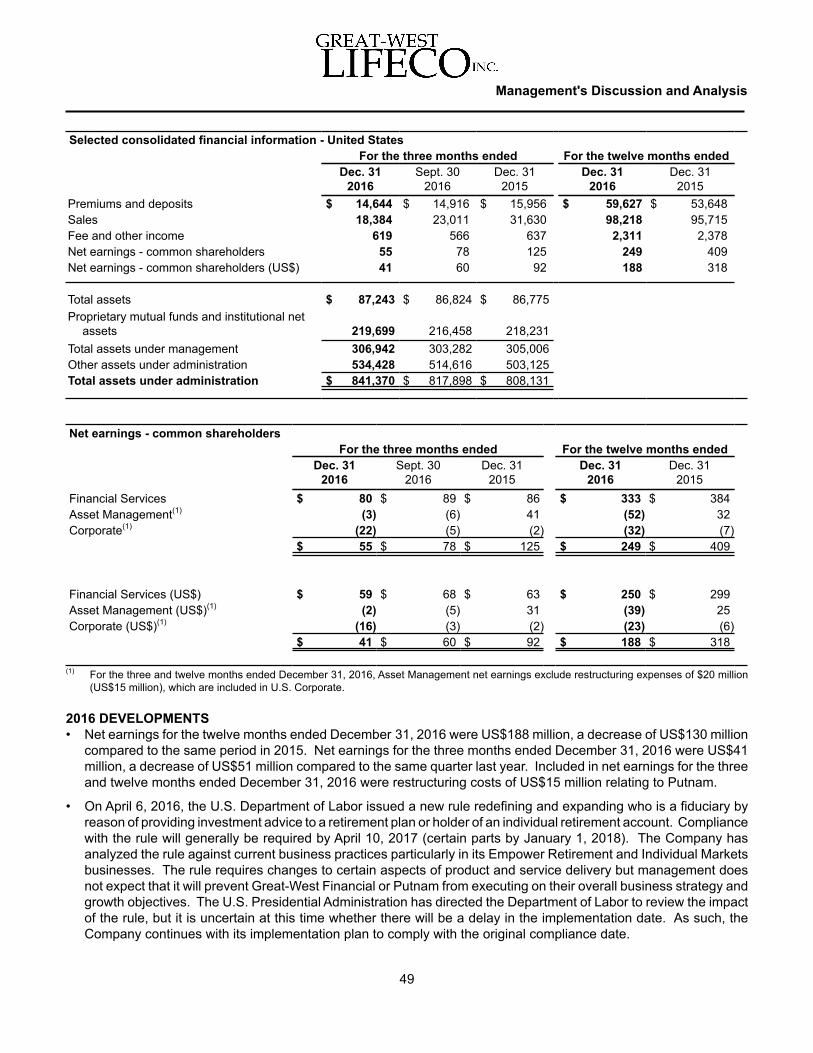
Selected consolidated financial information - United StatesFor the three months ended For the twelve months ended
Dec. 312016
Sept. 302016
Dec. 312015
Dec. 312016
Dec. 312015
Premiums and deposits $ 14,644 $ 14,916 $ 15,956 $ 59,627 $ 53,648Sales 18,384 23,011 31,630 98,218 95,715Fee and other income 619 566 637 2,311 2,378Net earnings - common shareholders 55 78 125 249 409Net earnings - common shareholders (US$) 41 60 92 188 318
Total assets $ 87,243 $ 86,824 $ 86,775Proprietary mutual funds and institutional net
assets 219,699 216,458 218,231Total assets under management 306,942 303,282 305,006Other assets under administration 534,428 514,616 503,125Total assets under administration $ 841,370 $ 817,898 $ 808,131
Management's Discussion and Analysis
49
Net earnings - common shareholdersFor the three months ended For the twelve months ended
Dec. 312016
Sept. 302016
Dec. 312015
Dec. 312016
Dec. 312015
Financial Services $ 80 $ 89 $ 86 $ 333 $ 384Asset Management(1) (3) (6) 41 (52) 32Corporate(1) (22) (5) (2) (32) (7)
$ 55 $ 78 $ 125 $ 249 $ 409
Financial Services (US$) $ 59 $ 68 $ 63 $ 250 $ 299Asset Management (US$)(1) (2) (5) 31 (39) 25Corporate (US$)(1) (16) (3) (2) (23) (6)
$ 41 $ 60 $ 92 $ 188 $ 318
(1) For the three and twelve months ended December 31, 2016, Asset Management net earnings exclude restructuring expenses of $20 million(US$15 million), which are included in U.S. Corporate.
2016 DEVELOPMENTS • Net earnings for the twelve months ended December 31, 2016 were US$188 million, a decrease of US$130 million
compared to the same period in 2015. Net earnings for the three months ended December 31, 2016 were US$41million, a decrease of US$51 million compared to the same quarter last year. Included in net earnings for the threeand twelve months ended December 31, 2016 were restructuring costs of US$15 million relating to Putnam.
• On April 6, 2016, the U.S. Department of Labor issued a new rule redefining and expanding who is a fiduciary byreason of providing investment advice to a retirement plan or holder of an individual retirement account. Compliancewith the rule will generally be required by April 10, 2017 (certain parts by January 1, 2018). The Company hasanalyzed the rule against current business practices particularly in its Empower Retirement and Individual Marketsbusinesses. The rule requires changes to certain aspects of product and service delivery but management doesnot expect that it will prevent Great-West Financial or Putnam from executing on their overall business strategy andgrowth objectives. The U.S. Presidential Administration has directed the Department of Labor to review the impactof the rule, but it is uncertain at this time whether there will be a delay in the implementation date. As such, theCompany continues with its implementation plan to comply with the original compliance date.

• The recent elections in the U.S. have brought into focus the prospects for significant policy changes, includingcorporate federal tax reform. Both Congress and the President share the same goal of reducing corporate incometax rates for businesses. A reduction in the corporate tax rate would likely have a favourable impact on the Company'seffective tax rate in the years subsequent to the year of enactment. Any change in tax laws and rates may affectrecorded deferred tax assets and deferred tax liabilities and the effective tax rate in the future. A reduction in thestatutory corporate tax rate would result in a reduction in the deferred tax asset or deferred tax liability, which maygive rise to a one-time negative impact on the financial results of operations in the year of enactment. Any one-time adjustment to the deferred tax accounts would not affect cash taxes paid.
• During the fourth quarter of 2016, Putnam announced that it was undertaking US$65 million in expense reductionsand was realigning its resources to better position itself for current and future opportunities. These expensereductions are being addressed through a reduction in staff, elimination of certain non-core business programs andvendor consolidation. As of December 31, 2016, approximately US$40 million in annualized reductions has beenachieved, with the remainder to be realized over 2017. As part of this effort, Putnam has reduced its staff by nearlyeight percent, primarily operations and technology professionals, but also a small number of investment managementprofessionals. For the three months ended December 31, 2016, the Company incurred restructuring costs relatingto these initiatives that reduced net earnings by US$15 million. These restructuring costs are included in the U.S.Corporate results.
Management's Discussion and Analysis
50
BUSINESS UNITS – UNITED STATES
FINANCIAL SERVICES
2016 DEVELOPMENTS • Premiums and deposits for the twelve months ended December 31, 2016 of US$10.7 billion were comparable to
the same period last year. Premiums and deposits for the three months ended December 31, 2016 wereUS$2.7 billion, a decrease of US$1.1 billion compared to the same quarter last year, primarily due to fewer largeplan sales in Empower Retirement.
• Sales for the twelve months ended December 31, 2016 were US$39.3 billion, down from US$43.2 billion duringthe same period last year. Sales in the fourth quarter of 2016 were US$5.5 billion, a decrease of US$10.0 billioncompared to the same quarter in 2015, primarily due to fewer large plan sales in Empower Retirement.
• Fee and other income for the twelve months ended December 31, 2016 was US$1,029 million compared toUS$973 million for the same period in 2015. Fee and other income for the three months ended December 31, 2016was US$288 million, an increase of US$28 million from the same quarter last year.
• Net earnings for the twelve months ended December 31, 2016 were US$250 million compared to US$299 millionfor the same period in 2015. Net earnings for the three months ended December 31, 2016 were US$59 million, adecrease of US$4 million from the same quarter last year.
• Empower Retirement continues to incur strategic and business development expenses as it focuses onenhancements, which will improve the client-facing experience as well as streamline the back-office processingover the next several years. The Company originally anticipated investing approximately US$150 million in totalon this multi-year initiative and had invested US$149 million by December 31, 2016. The Company expects theremaining investment to complete integration activities to be approximately US$10 million. In 2015, these costsdecreased net earnings by US$34 million. For the three and twelve months ended December 31, 2016, these costshave decreased net earnings by US$3 million and US$22 million, respectively.

• The Company has set an annual cost savings target of US$40 million to US$50 million pre-tax, expected from theinvestment in the Empower Retirement business. Integration activities are expected to be completed by the secondquarter of 2017 with the annual reduction of operating costs fully reflected upon the completion of the businesstransformation in the next two to three years. These synergies are expected to be achieved through efficienciesfrom the conversion of business onto a single back-office platform, increased utilization of Great-West Global, whichlaunched in the third quarter of 2015, with over 565 professionals based in India, as well as scale-driven costimprovements. Ongoing operations will include amortization expense from system and infrastructureenhancements. The Company expects that these enhancements will increase market share by driving future salesand improving the retention of participants and assets. Empower Retirement participant accounts have grown toover 8 million at December 31, 2016 from over 7.5 million at December 31, 2015.
Management's Discussion and Analysis
51
OPERATING RESULTS
For the three months ended For the twelve months endedDec. 31
2016Sept. 30
2016Dec. 31
2015Dec. 31
2016Dec. 31
2015Premiums and deposits $ 3,525 $ 3,575 $ 5,087 $ 14,156 $ 13,798Sales 7,265 11,670 20,761 52,747 55,865Fee and other income 383 335 349 1,362 1,247Net earnings 80 89 86 333 384
Premiums and deposits (US$) $ 2,650 $ 2,729 $ 3,796 $ 10,680 $ 10,688Sales (US$) 5,462 8,908 15,493 39,324 43,195Fee and other income (US$) 288 256 260 1,029 973Net earnings (US$) 59 68 63 250 299
Premiums and depositsPremiums and deposits for the fourth quarter of 2016 decreased by US$1.1 billion to US$2.7 billion compared to thesame quarter last year, primarily due to lower large plan sales in Empower Retirement in 2016.
For the twelve months ended December 31, 2016, premiums and deposits of US$10.7 billion were comparable to thesame period last year. Empower Retirement had lower sales partially offset by higher deposits from existing participantsand higher net transfers from retail investment options. This net decrease was offset by higher sales in the executivebenefits, retail bank insurance and individual annuity lines of business for Individual Markets.
Premiums and deposits for the fourth quarter of 2016 of US$2.7 billion were comparable to the previous quarter.
SalesSales in the fourth quarter of 2016 decreased by US$10.0 billion to US$5.5 billion compared to the same quarter lastyear, primarily due to a decrease in Empower Retirement sales. The decrease in Empower Retirement sales wasprimarily due to lower large plan sales driven by two large plan sales in the fourth quarter of 2015, which did not recurin 2016. Large plan sales can be highly variable from period to period and tend to be lower margin.
For the twelve months ended December 31, 2016, sales decreased by US$3.9 billion to US$39.3 billion compared tothe same period last year, due to a decrease of US$4.3 billion in Empower Retirement sales, partially offset by anincrease of US$0.4 billion in Individual Markets. The decrease in Empower Retirement sales was primarily due tolower large plan sales. The increase in Individual Markets was due to higher sales in the executive benefits, retailbank insurance and individual annuity lines of business.

Sales in the fourth quarter of 2016 decreased by US$3.4 billion compared to the previous quarter. The decrease wasprimarily due to a decrease of US$3.2 billion in Empower Retirement sales, driven by lower large plan sales reflectingone large plan sale in the third quarter of 2016 that did not recur, as well as lower sales in the executive benefits lineof business for Individual Markets.
Management's Discussion and Analysis
52
Empower Retirement - customer account values (US$)
Change for the twelve months ended
December 31 Total at December 312016 2015 2016 2015 % Change
General account - fixed options $ 1,226 $ 527 $ 12,219 $ 10,993 11%Segregated funds - variable options (162) (801) 19,421 19,583 (1)Proprietary mutual funds(1) 3,665 9,212 19,950 16,285 23Unaffiliated retail investment options &administrative services only 34,243 (12,930) 398,825 364,582 9
$ 38,972 $ (3,992) $ 450,415 $ 411,443 9%
(1) At December 31, 2016, proprietary mutual funds included US$8.2 billion in Putnam managed funds (US$6.6 billion at December 31, 2015).
Empower Retirement customer account values at December 31, 2016 increased by US$39.0 billion compared toDecember 31, 2015, primarily due to higher average equity market levels and net cash inflows. Net cash inflows forthe general account, proprietary mutual funds and unaffiliated retail investment options and administrative servicesonly account values were partially offset by net asset outflows for segregated funds.
Fee and other incomeFee income is derived primarily from assets under management, assets under administration, shareholder servicingfees, administration and recordkeeping services and investment advisory services. Generally, fees are earned basedon assets under management, assets under administration or the number of plans and participants for which servicesare provided.
Fee and other income for the fourth quarter of 2016 increased by US$28 million to US$288 million compared to thesame quarter last year. Included in fee and other income for the fourth quarter of 2016 were reclassification adjustmentsof US$33 million while the fourth quarter of 2015 included adjustments of US$18 million relating to variable-asset basedfee income. Excluding these adjustments, fee and other income increased US$13 million, primarily due to higheraverage equity market levels and growth in participants.
For the twelve months ended December 31, 2016, fee and other income increased by US$56 million to US$1,029million compared to the same period last year. Excluding the adjustments discussed for the in-quarter results, theincrease in fee and other income was US$41 million, primarily due to higher asset-based fees, driven by growth inthese assets, due to positive net cash flows and higher average equity market levels.
Fee and other income for the fourth quarter of 2016 increased by US$32 million compared to the previous quarter,primarily due to the adjustment discussed for the in-quarter results.
Net earningsNet earnings for the fourth quarter of 2016 decreased by US$4 million to US$59 million compared to the same quarterlast year. Included in net earnings for the fourth quarter of 2015 was an adjustment of US$11 million to the contingentconsideration related to the J.P. Morgan Retirement Plan Services (RPS) acquisition. Excluding this adjustment, netearnings increased by US$7 million, primarily due to higher contributions from contract liability basis changes, highernet fee income and higher contributions from investment experience, partially offset by higher operating expenses,driven primarily by business growth. Fourth quarter 2016 results included US$2 million of strategic and businessdevelopment expenses related to Empower Retirement, compared to US$7 million for the fourth quarter of 2015.
For the twelve months ended December 31, 2016, net earnings decreased by US$49 million to US$250 million comparedto the same period last year. Net earnings in 2016 included the positive impact of a management election to claimforeign tax credits of US$19 million, while net earnings in 2015 included an adjustment of US$11 million discussed forthe in-quarter results. Excluding these items, net earnings decreased by US$57 million primarily due to higher operatingexpenses and lower contributions from investment experience, partially offset by higher contributions from contractliability basis changes. Included in the year-to-date net earnings were US$16 million of strategic and developmentexpenses related to Empower Retirement, compared to US$28 million for the same period in 2015.
Net earnings for the fourth quarter of 2016 decreased by US$9 million compared to the previous quarter, primarily dueto higher operating expenses.
Management's Discussion and Analysis
53
OUTLOOK – FINANCIAL SERVICES Refer to Cautionary Note regarding Forward-looking Information and Cautionary Note regarding non-IFRS FinancialMeasures at the beginning of this document.
As the second largest recordkeeping provider in the U.S., Empower Retirement is positioned for significant growthopportunities with expertise and diversification across all plan types, company sizes and market segments. Great-West Financial continually examines opportunities to structure products and develop strategies to stimulate growth inassets under management.
In 2017, Empower Retirement's strategies to drive sales growth will continue to include active marketing of the brand,investing in product differentiation and offering a best-in-class service model. In 2016, service enhancements weremade to this model including standardizing and improving client-facing tools, optimizing advisor relationshipmanagement and client alignment as well as adopting best practices for participant communications. In 2017,investments will continue to be made to improve the customer web experiences, including adding innovative capabilitiesand ease of service products. These efforts in 2016 and 2017 are expected to increase customer retention andultimately increase participant retirement savings.
In 2017, Great-West Financial will continue to pursue operational efficiencies. The conversion of the recordkeepingbusiness to a single back-office platform continues and is expected to be completed in the first half of 2017. Uponcompletion of the conversion, Empower Retirement will provide a single recordkeeping platform. This platform includesa unique, interactive web-based experience which was launched in 2015 to help participants understand their retirementincome needs. Great-West Global non-client facing operations will continue to expand with a focus on lower unit costs.
Through its Individual Markets line of business, Great-West Financial focuses on providing value and innovativeproducts to the partners, brokers and the clients they serve to help them live well longer. Great-West Financial wasthe second largest distributor of life insurance through banks in 2016 and 2015. The Company's strategy focuses onprotecting customers’ wealth and income in retirement with a comprehensive suite of asset growth, income protectionand wealth transfer products.
To distribute retail retirement income products, the Company has established strategic partnerships with banks andindependent broker dealers. Since June 2016, the Company has added 45 new broker dealers to its annuity platform,bringing the total number of advisors within the primary distribution channel for retirement income products, to morethan 45,000. The new products launched in 2016 are expected to increase sales in 2017. The Company expects theinnovative distribution and product strategies for longevity will increase Great-West Financial's share in the retirementincome marketplace.
In the executive benefits market, Great-West Financial provides unique solutions to address the complex needs oforganizations for funding employee benefits and retaining key executives. Great-West Financial partners with a networkof specialized benefit consultants and brokers to create customized solutions based on clients’ needs. The longstandingbroker relationships and new partnerships that generated higher regional and corporate bank sales in 2016 are expectedto drive future sales growth.
ASSET MANAGEMENT
Management's Discussion and Analysis
54
2016 DEVELOPMENTS • Putnam’s ending assets under management (AUM) at December 31, 2016 of US$152.1 billion increased by
US$3.8 billion compared to the same period last year, while average AUM for the twelve months ended December 31,2016 of US$148.0 billion decreased by US$7.8 billion compared to the same period last year.
• Sales for the twelve months ended December 31, 2016 were US$34.3 billion compared to US$31.1 billion for thesame period in 2015. Putnam's sales for the three months ended December 31, 2016 were US$8.4 billion comparedto US$8.1 billion for the same period last year, driven by an increase in mutual fund sales.
• Fee income for the twelve months ended December 31, 2016 was US$716 million compared to US$885 million forthe same period in 2015. For the three months ended December 31, 2016, fee income was US$178 million, adecrease of US$38 million compared to the same period last year.
• Putnam continues to sustain strong investment performance relative to its peers. As of December 31, 2016,approximately 85% of Putnam’s fund assets performed at levels above the Lipper median on a five-year basis.
• For the 27th consecutive year, Putnam has been recognized by DALBAR Inc. for mutual fund service quality, citingindustry-leading consistency and reliability. This recognition includes Putnam being named as a DALBAR MutualFund Service Award winner for 25 of those years and the winner of DALBAR's Total Client Experience award forthe past five years.
• In the fourth quarter of 2016, Putnam was ranked as the number one digital engagement leader for financial advisors,brokers and other intermediaries by DST kasina, LLC.
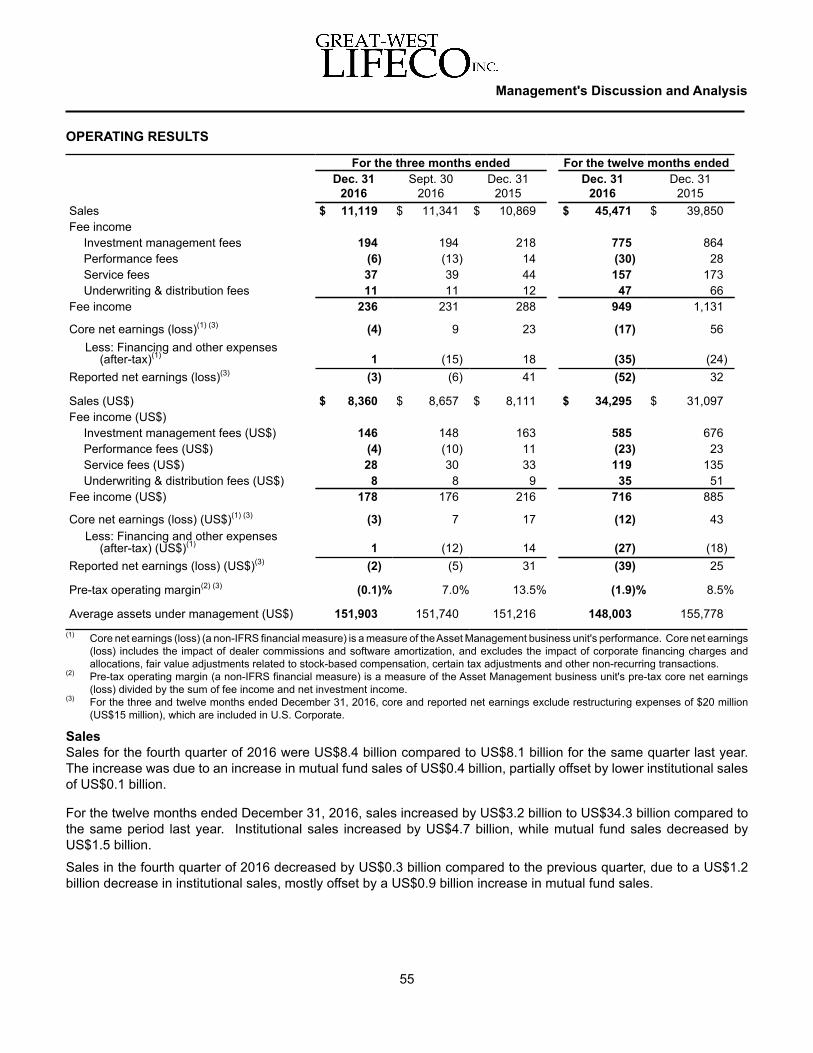
OPERATING RESULTS
For the three months ended For the twelve months endedDec. 31
2016Sept. 30
2016Dec. 31
2015Dec. 31
2016Dec. 31
2015Sales $ 11,119 $ 11,341 $ 10,869 $ 45,471 $ 39,850Fee income
Investment management fees 194 194 218 775 864Performance fees (6) (13) 14 (30) 28Service fees 37 39 44 157 173Underwriting & distribution fees 11 11 12 47 66
Fee income 236 231 288 949 1,131
Core net earnings (loss)(1) (3) (4) 9 23 (17) 56Less: Financing and other expenses
(after-tax)(1) 1 (15) 18 (35) (24)Reported net earnings (loss)(3) (3) (6) 41 (52) 32
Sales (US$) $ 8,360 $ 8,657 $ 8,111 $ 34,295 $ 31,097Fee income (US$)
Investment management fees (US$) 146 148 163 585 676Performance fees (US$) (4) (10) 11 (23) 23Service fees (US$) 28 30 33 119 135Underwriting & distribution fees (US$) 8 8 9 35 51
Fee income (US$) 178 176 216 716 885
Core net earnings (loss) (US$)(1) (3) (3) 7 17 (12) 43Less: Financing and other expenses
(after-tax) (US$)(1) 1 (12) 14 (27) (18)Reported net earnings (loss) (US$)(3) (2) (5) 31 (39) 25
Pre-tax operating margin(2) (3) (0.1)% 7.0% 13.5% (1.9)% 8.5%
Average assets under management (US$) 151,903 151,740 151,216 148,003 155,778(1) Core net earnings (loss) (a non-IFRS financial measure) is a measure of the Asset Management business unit's performance. Core net earnings
(loss) includes the impact of dealer commissions and software amortization, and excludes the impact of corporate financing charges andallocations, fair value adjustments related to stock-based compensation, certain tax adjustments and other non-recurring transactions.
(2) Pre-tax operating margin (a non-IFRS financial measure) is a measure of the Asset Management business unit's pre-tax core net earnings(loss) divided by the sum of fee income and net investment income.
(3) For the three and twelve months ended December 31, 2016, core and reported net earnings exclude restructuring expenses of $20 million(US$15 million), which are included in U.S. Corporate.
SalesSales for the fourth quarter of 2016 were US$8.4 billion compared to US$8.1 billion for the same quarter last year.The increase was due to an increase in mutual fund sales of US$0.4 billion, partially offset by lower institutional salesof US$0.1 billion.
For the twelve months ended December 31, 2016, sales increased by US$3.2 billion to US$34.3 billion compared tothe same period last year. Institutional sales increased by US$4.7 billion, while mutual fund sales decreased byUS$1.5 billion.
Sales in the fourth quarter of 2016 decreased by US$0.3 billion compared to the previous quarter, due to a US$1.2billion decrease in institutional sales, mostly offset by a US$0.9 billion increase in mutual fund sales.
Management's Discussion and Analysis
55

Fee incomeFee income is derived primarily from investment management fees, performance fees, transfer agency and otherservice fees, as well as underwriting and distribution fees. Generally, fees are earned based on AUM and may dependon financial markets, the relative performance of Putnam’s investment products, the number of retail accounts andsales.
Fee income for the fourth quarter of 2016 decreased by US$38 million to US$178 million compared to the same quarterlast year. The decrease was primarily due to lower asset-based fees reflecting lower average AUM, driven by areduction in mutual funds, reflective of the decline in industry flows in the segments where Putnam operates, as wellas lower performance fees on mutual funds and institutional products.
For the twelve months ended December 31, 2016, fee income decreased by US$169 million to US$716 million comparedto the same period last year. The decrease was primarily due to the same reasons discussed for the in-quarter results,as well as lower service fees reflecting a decrease in the number of accounts.
Fee income for the fourth quarter of 2016 increased by US$2 million compared to the previous quarter, primarily dueto increased performance fees due to the seasonality in which these fees were earned, partially offset by lowerinvestment management fees as discussed for the in-quarter results.
Net earningsThe core net loss (a non-IFRS financial measure) for the fourth quarter of 2016 was US$3 million, excluding restructuringcosts of US$15 million, compared to core net earnings of US$17 million for the same quarter last year. The decreasein net earnings was primarily due to lower net fee income and lower net investment income, driven by unrealized losseson seed capital, partially offset by lower compensation costs. In the fourth quarter of 2016, the reported net loss,including financing and other expenses, was US$2 million compared to reported net earnings of US$31 million for thesame quarter last year. Financing and other expenses for the fourth quarter of 2016 represent an expense recoveryof US$1 million, compared to an expense recovery of US$14 million for the same quarter last year. Included in financingand other expenses was the positive impact of an adjustment to certain income tax estimates of US$11 million for thecurrent quarter, compared to US$27 million for the same quarter last year.
For the twelve months ended December 31, 2016, the core net loss was US$12 million, excluding restructuring costsdiscussed for the in-quarter results, compared to core net earnings of US$43 million for the same period last year. Thedecrease was primarily due to lower net fee income, partially offset by higher net investment income and lowercompensation costs. For the twelve months ended December 31, 2016, the reported net loss, including financing andother expenses, was US$39 million compared to reported net earnings of US$25 million for the same period last year.Financing and other expenses for the twelve month period ended December 31, 2016 increased by US$9 million toUS$27 million compared to the same period last year, primarily due to the positive impact of adjustments to certainincome tax estimates of US$17 million for the current year compared to US$27 million for the same period last year.
The core net loss for the fourth quarter of 2016 was US$3 million, excluding restructuring costs discussed for the in-quarter results, compared to core net earnings of US$7 million for the previous quarter. Core net earnings for the thirdquarter of 2016 included a one-time expense recovery of US$8 million relating to the amortization of certain sales-based commissions due to a change in accounting estimate. Excluding this item, the core net loss increased byUS$2 million, primarily due to lower net investment income, driven by unrealized losses on seed capital, mostly offsetby lower compensation costs. The reported net loss, including financing and other expenses, for the fourth quarter of2016 was US$2 million compared to US$5 million for the previous quarter. Financing and other expenses for the fourthquarter of 2016 represent an expense recovery of US$1 million compared to expenses of US$12 million for the previousquarter. This change was primarily due to the positive impact of adjustments to certain income tax estimates discussedfor the in-quarter results.
Management's Discussion and Analysis
56
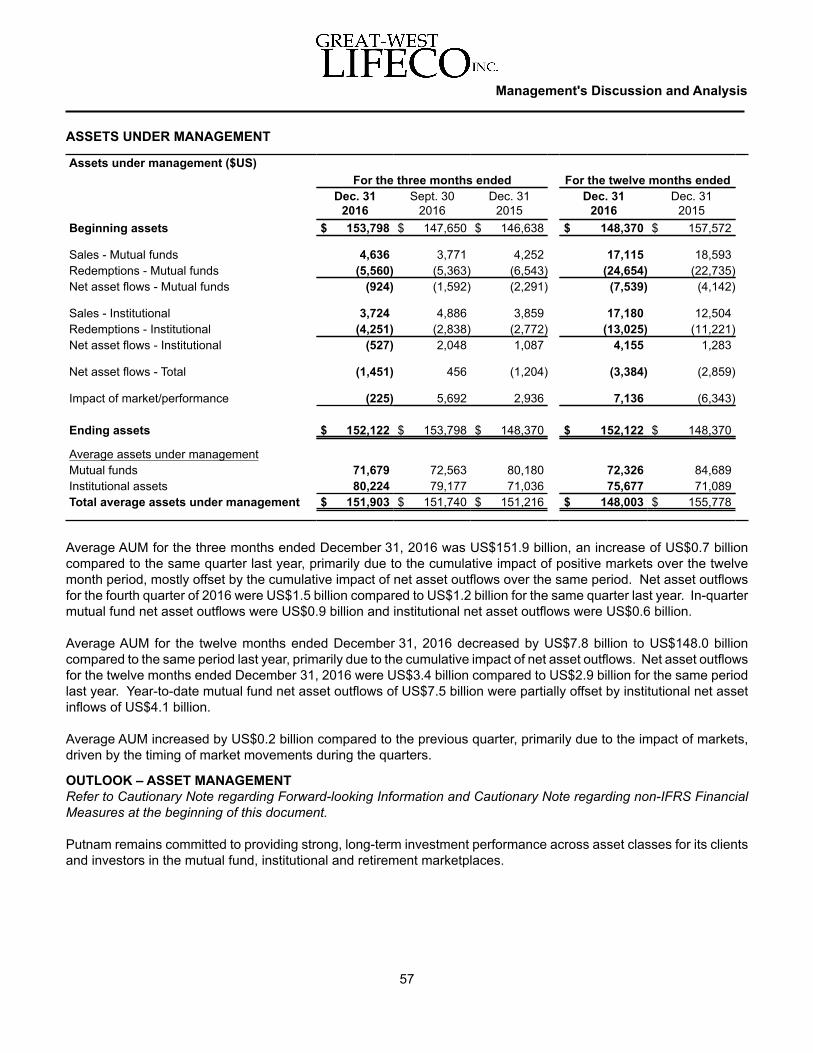
ASSETS UNDER MANAGEMENT
Assets under management ($US)For the three months ended For the twelve months ended
Dec. 312016
Sept. 302016
Dec. 312015
Dec. 312016
Dec. 312015
Beginning assets $ 153,798 $ 147,650 $ 146,638 $ 148,370 $ 157,572
Sales - Mutual funds 4,636 3,771 4,252 17,115 18,593Redemptions - Mutual funds (5,560) (5,363) (6,543) (24,654) (22,735)Net asset flows - Mutual funds (924) (1,592) (2,291) (7,539) (4,142)
Sales - Institutional 3,724 4,886 3,859 17,180 12,504Redemptions - Institutional (4,251) (2,838) (2,772) (13,025) (11,221)Net asset flows - Institutional (527) 2,048 1,087 4,155 1,283
Net asset flows - Total (1,451) 456 (1,204) (3,384) (2,859)
Impact of market/performance (225) 5,692 2,936 7,136 (6,343)
Ending assets $ 152,122 $ 153,798 $ 148,370 $ 152,122 $ 148,370
Average assets under managementMutual funds 71,679 72,563 80,180 72,326 84,689Institutional assets 80,224 79,177 71,036 75,677 71,089Total average assets under management $ 151,903 $ 151,740 $ 151,216 $ 148,003 $ 155,778
Average AUM for the three months ended December 31, 2016 was US$151.9 billion, an increase of US$0.7 billioncompared to the same quarter last year, primarily due to the cumulative impact of positive markets over the twelvemonth period, mostly offset by the cumulative impact of net asset outflows over the same period. Net asset outflowsfor the fourth quarter of 2016 were US$1.5 billion compared to US$1.2 billion for the same quarter last year. In-quartermutual fund net asset outflows were US$0.9 billion and institutional net asset outflows were US$0.6 billion.
Average AUM for the twelve months ended December 31, 2016 decreased by US$7.8 billion to US$148.0 billioncompared to the same period last year, primarily due to the cumulative impact of net asset outflows. Net asset outflowsfor the twelve months ended December 31, 2016 were US$3.4 billion compared to US$2.9 billion for the same periodlast year. Year-to-date mutual fund net asset outflows of US$7.5 billion were partially offset by institutional net assetinflows of US$4.1 billion.
Average AUM increased by US$0.2 billion compared to the previous quarter, primarily due to the impact of markets,driven by the timing of market movements during the quarters.
Management's Discussion and Analysis
57
OUTLOOK – ASSET MANAGEMENT Refer to Cautionary Note regarding Forward-looking Information and Cautionary Note regarding non-IFRS FinancialMeasures at the beginning of this document.
Putnam remains committed to providing strong, long-term investment performance across asset classes for its clientsand investors in the mutual fund, institutional and retirement marketplaces.

In 2017, Putnam will continue to focus efforts on driving growth and market share through new sales and asset retentionin all markets it serves including Global Institutional, PanAgora (Putnam’s quantitative institutional manager), U.S.Retail, Defined Contribution Investment Only and Registered Investment Advisors, while maintaining its industryrecognized reputation for service excellence.
Innovation will remain a key differentiator in 2017, as Putnam further develops its product offerings, service featuresand operational functions, while bolstering its corporate and business/product brand image with a wide range of keyconstituents. Putnam continues to increasingly incorporate digital technology throughout its business to drive greaterefficiencies and create business opportunities.
Putnam will continue to focus on growth of revenues and assets in 2017, while at the same time managing firm-wideexpenses, as the firm seeks to build a scalable, profitable asset management franchise.
Management's Discussion and Analysis
58
UNITED STATES CORPORATEUnited States Corporate consists of items not associated directly with or allocated to the United States business units,including the impact of certain non-continuing items related to the U.S. segment.
In the fourth quarter of 2016, the net loss increased by US$14 million to US$16 million compared to the same quarterin 2015, primarily due to higher restructuring costs. Fourth quarter 2016 results included restructuring costs of US$15million relating to Putnam and US$1 million relating to RPS, compared to US$2 million of RPS related restructuringcosts for the same quarter last year.
For the twelve months ended December 31, 2016, the net loss increased by US$17 million to US$23 million comparedto the same period in 2015, primarily due to higher restructuring costs as well as a legal settlement related to discontinuedoperations. Included in the year-to-date results were US$15 million of restructuring costs relating to Putnam andUS$6 million of restructuring costs relating to RPS, compared to US$6 million of RPS related restructuring costs forthe same period last year.
The net loss for the three months ended December 31, 2016 increased by US$13 million to US$16 million comparedto the previous quarter, primarily due to higher restructuring costs, partially offset by a legal settlement related todiscontinued operations in third quarter of 2016 that did not recur.
EUROPEThe Europe segment comprises two distinct business units: Insurance & Annuities and Reinsurance, together with anallocation of a portion of Lifeco's corporate results. Insurance & Annuities provides protection and wealth managementproducts, including payout annuity products, through subsidiaries of Canada Life in the U.K., the Isle of Man andGermany, as well as through Irish Life in Ireland. Reinsurance operates primarily in the U.S., Barbados and Ireland,and is conducted through Canada Life, London Life and their subsidiaries.
TRANSLATION OF FOREIGN CURRENCYForeign currency assets and liabilities are translated into Canadian dollars at the market rate at the end of the financialperiod. All income and expense items are translated at an average rate for the period.
Currency translation impact is a non-IFRS financial measure that highlights the impact of changes in currency translationrates on IFRS results. This measure provides useful information as it facilitates the comparability of results betweenperiods. Refer to the Cautionary Note regarding non-IFRS Financial Measures at the beginning of this document.

BUSINESS PROFILE
INSURANCE & ANNUITIES The core products offered in the U.K. are guaranteed annuities, investments (including retirement drawdown) andgroup insurance. These products are distributed through independent financial advisors (IFAs) and employee benefitconsultants. The international operations based in the Isle of Man and Ireland offer investment, savings and individualprotection products that are sold through IFAs and private banks in the U.K. and in other selected territories. CanadaLife Investments is the fund management division in the U.K. and manages over £35 billion of assets. These includeequities, fixed-income, property, mortgages and cash for companies in the Lifeco group as well as a wide range of life,pension and collective funds. The funds are distributed mainly through financial advisors as well as wealth managersand discretionary managers in the U.K. In 2015, the Company acquired a block of payout annuities from EquitableLife for £875 million with the agreement that Canada Life would provide future pension payments on the annuities.The transfer of the block of annuities was completed in February, 2016 following court approval.
The core products offered by Irish Life in Ireland are savings and investments, individual and group life insurance,health insurance and pension products. These products are distributed through independent brokers, a direct salesforce and tied agent bank branches. On August 1, 2016, Irish Life completed the acquisition of Aviva Health InsuranceIreland Limited and assumed control of GloHealth Financial Services Limited. The new Irish health insurance businessoperates under the Irish Life Health brand. Irish Life Health offers individual and corporate health plans, distributedthrough independent brokers and direct channels. Irish Life Investment Managers (ILIM) is the Company's fundmanagement operation in Ireland and manages over €63 billion of assets. ILIM manages assets on behalf of companiesin the Lifeco group as well as a wide range of institutional and retail clients, occupational defined benefit and definedcontribution pensions, large multinational corporations, charities and domestic companies and is the largest managerof Irish pension assets. The German operation focuses on pension, lifetime GMWB and individual protection products that are distributedthrough independent brokers and multi-tied agents.
Insurance & Annuities continues to expand its presence in its defined market segments by focusing on the introductionof innovative products and services, the quality of its service offerings as well as the enhancement of distributioncapabilities and intermediary relationships.
REINSURANCE Reinsurance operates primarily in the U.S., Barbados and Ireland. In the U.S., the reinsurance business operatesthrough branches of Canada Life, London Life, subsidiaries of London Life and an indirect subsidiary of Great-WestFinancial. In Barbados, the reinsurance business operates primarily through branches of Canada Life, London Lifeand subsidiaries of London Life. In Ireland, the reinsurance business operates through subsidiaries of Canada Life.
The Company's business includes both reinsurance and retrocession business transacted directly with clients or throughreinsurance brokers. As a retrocessionaire, the Company provides reinsurance to other reinsurers to allow thosecompanies to manage their insurance risk.
The product portfolio offered by the Company includes life, annuity as well as property and casualty reinsurance,provided on both a proportional and non-proportional basis.
In addition to providing reinsurance products to third parties, the Company also utilizes internal reinsurance transactionsbetween companies in the Lifeco group. These transactions are undertaken to better manage insurance risks relatingto retention, volatility and concentration; and to facilitate capital management for the Company, its subsidiaries andbranch operations. These internal reinsurance transactions may produce benefits that are reflected in one or more ofthe Company's other business units.
Management's Discussion and Analysis
59
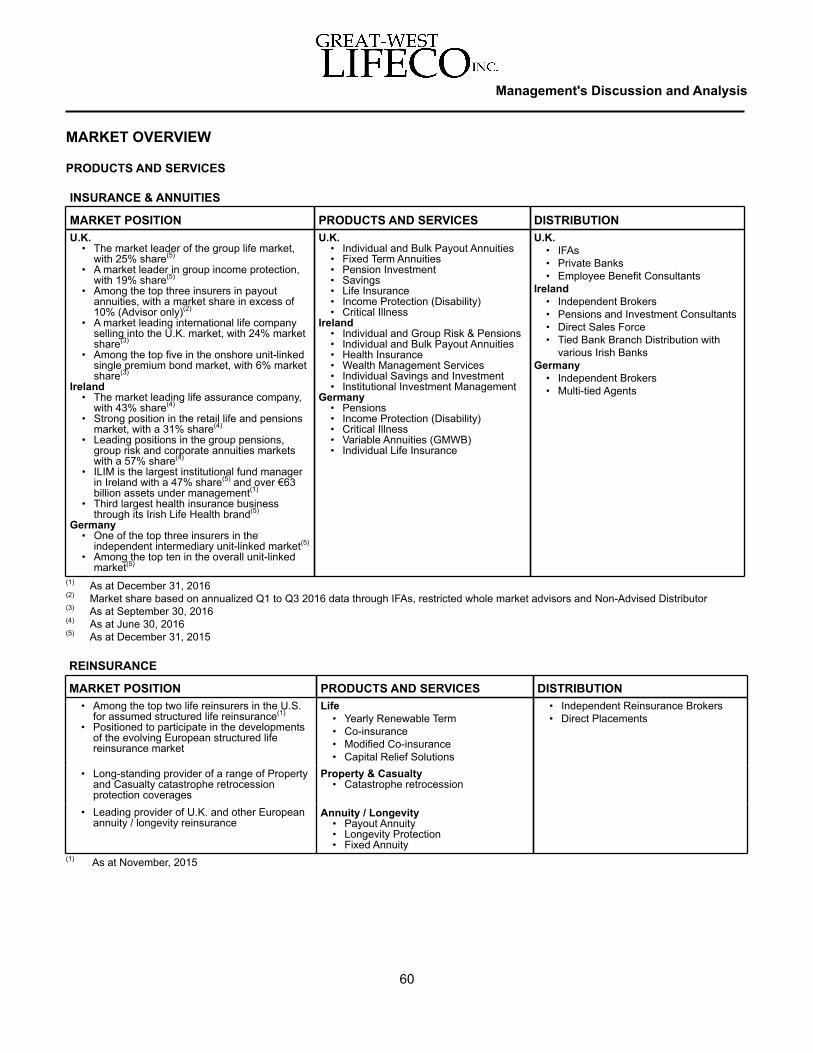
MARKET OVERVIEW
PRODUCTS AND SERVICES
INSURANCE & ANNUITIES
MARKET POSITION PRODUCTS AND SERVICES DISTRIBUTIONU.K.
• The market leader of the group life market,with 25% share(5)
• A market leader in group income protection,with 19% share(5)
• Among the top three insurers in payoutannuities, with a market share in excess of10% (Advisor only)(2)
• A market leading international life companyselling into the U.K. market, with 24% marketshare(3)
• Among the top five in the onshore unit-linkedsingle premium bond market, with 6% marketshare(3)
Ireland• The market leading life assurance company,
with 43% share(4)
• Strong position in the retail life and pensionsmarket, with a 31% share(4)
• Leading positions in the group pensions,group risk and corporate annuities marketswith a 57% share(4)
• ILIM is the largest institutional fund managerin Ireland with a 47% share(5) and over €63billion assets under management(1)
• Third largest health insurance businessthrough its Irish Life Health brand(5)
Germany• One of the top three insurers in the
independent intermediary unit-linked market(5) • Among the top ten in the overall unit-linked
market(5)
U.K.• Individual and Bulk Payout Annuities• Fixed Term Annuities• Pension Investment• Savings• Life Insurance• Income Protection (Disability)• Critical Illness
Ireland• Individual and Group Risk & Pensions• Individual and Bulk Payout Annuities• Health Insurance• Wealth Management Services• Individual Savings and Investment• Institutional Investment Management
Germany• Pensions• Income Protection (Disability)• Critical Illness• Variable Annuities (GMWB)• Individual Life Insurance
U.K. • IFAs• Private Banks• Employee Benefit Consultants
Ireland• Independent Brokers• Pensions and Investment Consultants• Direct Sales Force• Tied Bank Branch Distribution with
various Irish BanksGermany
• Independent Brokers• Multi-tied Agents
(1) As at December 31, 2016 (2) Market share based on annualized Q1 to Q3 2016 data through IFAs, restricted whole market advisors and Non-Advised Distributor (3) As at September 30, 2016(4) As at June 30, 2016(5) As at December 31, 2015
REINSURANCE
MARKET POSITION PRODUCTS AND SERVICES DISTRIBUTION• Among the top two life reinsurers in the U.S.
for assumed structured life reinsurance(1)
• Positioned to participate in the developmentsof the evolving European structured lifereinsurance market
Life• Yearly Renewable Term• Co-insurance• Modified Co-insurance• Capital Relief Solutions
• Independent Reinsurance Brokers• Direct Placements
• Long-standing provider of a range of Propertyand Casualty catastrophe retrocessionprotection coverages
Property & Casualty• Catastrophe retrocession
• Leading provider of U.K. and other Europeanannuity / longevity reinsurance
Annuity / Longevity• Payout Annuity• Longevity Protection• Fixed Annuity
(1) As at November, 2015
Management's Discussion and Analysis
60

COMPETITIVE CONDITIONS
United KingdomIn the U.K., the Company has strong market positions for group risk, payout annuities and wealth management products,where, combining sales from onshore and international businesses, Canada Life is one of the top three unit-linkedsingle premium bond provider in the U.K.
The market for payout annuities increased in 2016. The Company benefited from increased demand from customersfor competitive pricing, which increased the proportion of annuities sold through independent financial advisors, theCompany’s primary distribution channel. The Company continued to offer both standard and enhanced annuities andmaintained its market share in this market as well as pension products for individuals who want to take advantage ofthe greater pension flexibility introduced in recent years. The Company also offers bulk annuities aimed at trusteesof defined benefits plans who want to insure pension annuities in payment. There have been a number of new entrantsto this market; however, this is a sizeable market and demand from trustees remains strong. The market is expectedto grow as pension plan funding improves and trustees consider ways to reduce risk from pension plans. With expertiseand experience in longevity and investment products, the Company is well placed to continue to grow new business.
In international wealth management operations, the market in 2016 remained relatively flat. The more profitable retailsales have been maintained and this is an area of continued focus. Future estate planning continues to be an areaof focus for U.K. advisors and Canada Life International is among the leading companies in this sector of the market.In the fourth quarter of 2016, Canada Life added a Capital Redemption Bond option to the key products in both theIsle of Man and Ireland, the first international life group to offer this choice in both jurisdictions.
The impact of Brexit remains uncertain as both the U.K. and EU prepare to start exit negotiations later in 2017.
IrelandThe Company maintained its market-leading presence in Ireland through Irish Life and continues to be the largest lifeassurance company growing its market share to 43%. Irish Life follows a multi-channel distribution strategy with thelargest broker distribution network, the largest direct sales force and the largest Bancassurance distribution networkwhere it has tied relationships with five banks.
Irish Life Investment Managers (ILIM) is Ireland’s largest institutional fund manager with over €63 billion of assetsunder management, including funds managed for other companies within the Lifeco group, as at December 31, 2016.
The Company now operates its Irish health insurance business under the Irish Life Health brand, where it has a topthree position with 21% market share.
Setanta Asset Management (Setanta), a subsidiary of Canada Life, manages assets for a number of institutional clients,both third-party institutions as well as for companies in the Lifeco group, and has €8.5 billion of assets under managementas at December 31, 2016.
GermanyCanada Life has established a leading position among providers of unit-linked products to the German independentintermediary market. This market remains competitive as more companies enter the market due to the projected stronggrowth over the coming years. Throughout this period of increased competition, the Company has increased marketshare and maintained a top three position in this segment of the market through continuous product, technology andservice improvements. The market for traditional German insurance products has been challenging following theintroduction of Solvency II and the further reduction in the statutory guaranteed interest rate on these products. Similarto 2015, this new environment continues to create growth opportunities for Canada Life and its unit-linked products.
Management's Discussion and Analysis
61

ReinsuranceIn the U.S. life reinsurance market, the demand for capital relief remains strong because of continuing conservativereserving requirements on term and universal life products. Several competitors are now focusing on growing theirshare of this market, which increased competition for this business. However, an industry survey released in November2015 confirmed that the Company remains one of the top two providers of capital relief solutions in the U.S. market.
The Company has also had success in traditional life reinsurance as the number of remaining life reinsurers is decliningdue to consolidation and clients’ value diversification. The Company's financial strength and ability to offer both capitalsolutions and traditional mortality reinsurance continues to be a competitive advantage.
In Europe, Solvency II dominates the regulatory landscape and interest in capital relief transactions that produce capitalbenefits under the new regime continues to grow. Demand for longevity reinsurance remains very strong in the U.K.and some continental European countries. As a result, there are now more reinsurers participating in this market, buteven so demand for longevity coverage continues to exceed supply.
The 2016 Atlantic Hurricane season was the most active and costly since 2012. There was only one event, HurricaneMatthew, which had a material impact on the U.S. Current industry estimates of insured losses arising from HurricaneMatthew range from US$4 billion to US$9 billion. The Company does not expect to incur claims from this hurricane.The pricing in the property catastrophe market continues to be challenging, driven by capacity in the industry.
Management's Discussion and Analysis
62
Selected consolidated financial information - Europe
For the three months ended For the twelve months endedDec. 31
2016Sept. 30
2016Dec. 31
2015Dec. 31
2016Dec. 31
2015Premiums and deposits $ 8,714 $ 8,292 $ 6,056 $ 33,178 $ 27,763Fee and other income 340 328 327 1,296 1,221Net earnings - common shareholders 307 313 303 1,200 1,174
Total assets $ 159,145 $ 162,181 $ 167,265Proprietary mutual funds and institutional net
assets 33,664 34,461 29,210Total assets under management 192,809 196,642 196,475Other assets under administration 38,952 40,044 41,587Total assets under administration(1) $ 231,761 $ 236,686 $ 238,062
(1) At December 31, 2016, total assets under administration excludes $7.9 billion of assets managed for other business units within the Lifecogroup of companies ($7.2 billion at September 30, 2016).
Net earnings - common shareholdersFor the three months ended For the twelve months ended
Dec. 312016
Sept. 302016
Dec. 312015
Dec. 312016
Dec. 312015
Insurance & Annuities $ 225 $ 251 $ 234 $ 927 $ 886Reinsurance 86 54 73 277 313Europe Corporate (4) 8 (4) (4) (25)Net earnings $ 307 $ 313 $ 303 $ 1,200 $ 1,174
2016 DEVELOPMENTS• Net earnings for the twelve months ended December 31, 2016 were $1,200 million, an increase of $26 million
compared to the same period in 2015. Net earnings for the three months ended December 31, 2016 were $307million, an increase of $4 million from the same quarter last year.
• Premiums and deposits for the twelve months ended December 31, 2016 increased by $5.4 billion to $33.2 billioncompared to the same period in 2015. Premiums and deposits for the three months ended December 31, 2016were $8.7 billion compared to $6.1 billion for the same quarter last year, primarily due to new reinsurance agreementsand higher fund management sales in Ireland.
• Fee and other income for the twelve months ended December 31, 2016 increased by $75 million to $1,296 millioncompared to the same period in 2015. Fee and other income for the three months ended December 31, 2016increased by $13 million to $340 million compared to the same quarter last year, primarily due to higher managementfees and from other income.
• Market volatility continues following the U.K.'s June 23, 2016 vote to leave the European Union, most notablyresulting in a weaker British pound and higher U.K. equity markets. The Company remains committed to itsoperations in the U.K. which are strong and are primarily domestic businesses with well-diversified investmentportfolios. The Company will continue to work closely with customers, business partners and regulators over thenext few years as the U.K. and the EU enter a period of negotiation and agree on their new relationship. TheCompany's other European businesses may also see some impacts arising from the market uncertainty in Europefrom Brexit, but the impacts are not currently expected to be significant.
• In Europe, Solvency II regulations have been effective throughout 2016. All of the Company's regulated European-based subsidiaries have met the new requirements. The new governance regime focuses on more active and risk-focused Board of Directors involvement, which fits well with the Company's existing philosophy and culture. Thecapital regime has moved from a factor-based approach to a more risk-based methodology, which is more sensitiveto interest rate movements. In 2016, the Company effectively managed capital volatility under the new regulations.Transitional measures and other measures approved by the regulators for long-term guaranteed business act toreduce the impact of current market volatility on Solvency II regulatory capital.
• On August 1, 2016, the Company completed the acquisition of Aviva Health Insurance Ireland Limited (Aviva Health),an Irish health insurance company, and assumed control of GloHealth Financial Services Limited (GloHealth), wherethe Company recorded a gain of $24 million, to reflect the fair value of the GloHealth investment. The Companyoperates the new Irish health insurance business under the Irish Life Health brand. The Company has set annualcost savings targets of €16 million pre-tax to be achieved through operating efficiencies from the combination ofthe businesses. Integration activities, with an expected cost of €16 million pre-tax, are anticipated to be completedin the next 18 to 24 months. For the three and twelve months ended December 31, 2016, these costs have decreasednet earnings by nil and €8 million, respectively. For the three and twelve months ended December 31, 2016,annualized synergies achieved have been €3 million and €4 million, respectively.
• Subsequent to December 31, 2016, in January 2017 the Company agreed to sell its 30.43% ownership of AllianzIreland to a subsidiary of Allianz SE. The transaction is expected to be complete in the first quarter of 2017 and issubject to court approval. The impact of the transaction on net earnings is not expected to be material. Refer tonote 5 in the Company’s December 31, 2016 annual consolidated financial statements for further details on theCompany’s investment in Allianz Ireland.
• During the fourth quarter of 2016, the Company received a number of awards:
◦ Canada Life International, a subsidiary of Canada Life in the U.K., received a number of awards at the 2016International Fund & Product Awards, including Best International Life Group (U.K.) and Best InternationalPortfolio Bond.
◦ Canada Life achieved ‘5 stars’ in the 2016 Financial Adviser Service Awards in both the ‘Life and Pensions’and ‘Investment Providers and Packagers’ categories.
Management's Discussion and Analysis
63

◦ At the 2016 Irish Pension Awards:
▪ the Irish Life Corporate business won the Communications award;
▪ ILIM won Passive Manager of the Year; and
▪ Setanta was awarded Equities Manager of the Year, for the fifth consecutive year.
Management's Discussion and Analysis
64
BUSINESS UNITS – EUROPE
INSURANCE & ANNUITIES
OPERATING RESULTS
For the three months ended For the twelve months endedDec. 31
2016Sept. 30
2016Dec. 31
2015Dec. 31
2016Dec. 31
2015Premiums and deposits(1) $ 4,984 $ 5,325 $ 4,497 $ 22,276 $ 22,127Sales(1) 4,410 4,645 3,917 19,179 19,485Fee and other income 333 324 320 1,276 1,197Net earnings 225 251 234 927 886
(1) For the three and twelve months ended December 31, 2016, premiums and deposits and sales exclude $0.4 billion and $7.5 billion, respectively,of assets managed for other business units within the Lifeco group of companies ($0.2 billion for the three months ended September 30, 2016).
Premiums and depositsPremiums and deposits for the fourth quarter of 2016 increased by $0.5 billion to $5.0 billion compared to the samequarter last year. The increase was primarily due to higher fund management sales, partially offset by lower wealthmanagement sales in the U.K. and the impact of currency movement.
For the twelve months ended December 31, 2016, premiums and deposits were $22.3 billion compared to $22.1 billionfor the same period last year, which included two large sales in 2015. Excluding the impact of these two large sales,premiums and deposits increased by $5.3 billion, primarily due to higher fund management sales and higher sales ofpayout annuities, partially offset by the impact of currency movement.
Premiums and deposits for the fourth quarter of 2016 decreased by $0.3 billion compared to the previous quarter,primarily due to lower payout annuities and fund management sales as well as the impact of currency movement,partially offset by higher pension sales in Germany. SalesSales for the fourth quarter of 2016 increased by $0.5 billion to $4.4 billion compared to the same quarter last year,primarily due to the same reasons discussed for premiums and deposits for the same period.
For the twelve months ended December 31, 2016, sales decreased by $0.3 billion to $19.2 billion compared to thesame period last year, which included two large sales in 2015. Excluding the impact of these two large sales, salesincreased by $4.8 billion, primarily due to the same reasons discussed for premiums and deposits for the same period.
Sales for the fourth quarter of 2016 decreased by $0.2 billion from the previous quarter, primarily due to the samereasons discussed for premiums and deposits for the same period.
Fee and other incomeFee and other income for the fourth quarter of 2016 increased by $13 million to $333 million compared to the samequarter last year, primarily due to higher asset management fees and higher other income, which can be highly variablefrom quarter to quarter, partially offset by the impact of currency movement.

For the twelve months ended December 31, 2016, fee and other income increased by $79 million to $1,276 millioncompared to the same period last year. The increase was primarily due to higher investment gain related fee incomeassociated with a closed block of Irish unit-linked business and higher other income as well as the impact of currencymovement. The fee income on the closed block of Irish unit-linked business is particularly sensitive to market levelsat the start and end of a reporting period.
Fee and other income for fourth quarter of 2016 increased by $9 million compared the previous quarter, primarily dueto higher investment gain related fee income associated with a closed block of Irish unit-linked business and higherother income as well as the impact of currency movement.
Net earnings Net earnings for the fourth quarter of 2016 decreased by $9 million to $225 million compared to the same quarter lastyear. The decrease was primarily due to less favourable morbidity experience, a higher percentage of earnings subjectto lower rates of income tax in foreign jurisdictions in the prior year and the impact of currency movement. Thesedecreases were partially offset by higher contributions from investment experience and favourable mortality experiencein the U.K.
Net earnings for the twelve months ended December 31, 2016 increased by $41 million to $927 million compared tothe same period last year. The increase was primarily due to higher contributions from insurance contract liability basischanges and investment experience, favourable mortality experience and lower income taxes. These increases werepartially offset by less favourable morbidity experience and the impact of currency movement. Net earnings for the fourth quarter of 2016 decreased by $26 million compared to the previous quarter, primarily dueto lower contributions from insurance contract liability basis changes, partially offset by higher contributions frominvestment experience.
Management's Discussion and Analysis
65
OUTLOOK – INSURANCE & ANNUITIES Refer to Cautionary Note regarding Forward-looking Information and Cautionary Note regarding non-IFRS FinancialMeasures at the beginning of this document.
In Europe, the implementation of Solvency II regulations has been the focus of the Company's regulated Europeanbusinesses during 2016. Transitional measures, matching adjustments and volatility adjustments were applied for bya number of the Company's European subsidiaries and were approved as planned in 2015. In 2017, work will continuerefining the Company's internal risk models and management of capital volatility under the new regulations.
United Kingdom – The outlook for payout annuities in 2017 is stable with signs of further growth. Since April 2015,when changes to the U.K. budget became effective, individuals with defined contribution pensions have had greaterflexibility for accessing their savings in retirement. As expected, some individuals have chosen to remain invested inthe market while drawing a pension income rather than buying a payout annuity and the Company expects that theattractiveness of this guaranteed income will remain a key part of customers’ retirement planning in the future. In thefuture, the Company sees the opportunity to grow its payout annuity business in line with the expected growth in theoverall retirement market. The Company will look to further develop its presence in the bulk annuity market, wheretrustees want to insure pension annuities in payment. The Company will also continue to develop additional productsfor individuals who require additional pension flexibility. The overall size of the retirement market continues to growas more retirees have defined contribution pensions due to the closure of defined benefit plans.

Canada Life continues to be a key player in the single premium investment bond marketplace. It will continue todevelop a presence in both the international and onshore market segments. The Company’s distribution strategy foronshore will remain focused on IFAs. In the international wealth management segment, the outlook for 2017 is cautiouslyoptimistic with an expectation that the market will start to grow once again, albeit slowly after a relatively stable 2016.The private banking business is expected to stabilize; however, the majority of the Company's business growth isexpected to be through discretionary fund management wealth advisors, the retail market and through tax and estateplanning products.
The outlook for the group risk operation remains positive and has benefited from additional risk benefits as a result ofthe U.K. Government’s Pensions Auto Enrolment initiative in the workplace, which commenced October 2012 and willbe complete in 2018. During 2015 and 2016, small employers began to enroll in this initiative and now present theoperation with an opportunity to increase the penetration of the U.K. Group Market with new business sales. LargerCanada Life plans have grown, as the pension legislation increased the membership of the associated group plans.The Company expects the expansion of the existing customer base experienced in recent years will moderate as largeremployers have implemented the changes required by the legislation. The Company's group operations will continueto show pricing discipline, reflecting the low interest rate environment.
The Company has seen market volatility as a result of the Brexit vote, although this at present has benefited the U.K.stock market. It is anticipated that the current conditions will continue until further clarity is provided as to thecommencement of the exit process and the respective negotiating positions become clearer. This uncertainty isexpected to continue throughout 2017.
Ireland – Overall economic growth is expected to be robust in 2016 and 2017, with forecasts of GDP growth of 4.2%and 3.5%, respectively. These forecasts have been revised marginally downwards since the beginning of 2016, largelyas a result of the U.K. referendum and other potential trade-related uncertainty. Uncertainty surrounding the U.K. andthe weakening of British pound are likely to hinder Irish export growth in 2017.
Domestic sources of growth remain relatively robust. The labour market continues to improve and the unemploymentrate is expected to fall to 6.8% by the end of 2017. Although the consumer sentiment index has not increased in recentmonths, the figure remains above the long-term average. This activity and consumer confidence are expected tofavourably influence the retention and new activity measures of the Irish businesses. Irish Life is looking to maintainmarket share and improve profitability across its retail, corporate and investment management businesses followingits multi-channel distribution strategy. Irish Life is also encouraging collaboration across the Company to capturesynergies and extend its presence into new market segments.
In 2017, the new Irish health insurance businesses will operate under the Irish Life Health (ILH) brand. The economicdrivers in Ireland have resulted in an increase in the Irish health insurance market in 2016 and ILH has marginallyincreased its share of this market to approximately 21%.
ILIM is the largest investment management firm in Ireland with a 47% share of the domestic market and continues toexpand its business relationships in North America. ILIM now provides active equity management services to companiesin the Lifeco group in Canada as well as Lifeco's affiliates, including Investors Group and Mackenzie Funds. ILIM willalso continue to work with Putnam to build new distribution opportunities in the Irish market.
Germany – The outlook for the German business continues to be positive and the Company expects continued growthin assets under management in 2017.
Management's Discussion and Analysis
66
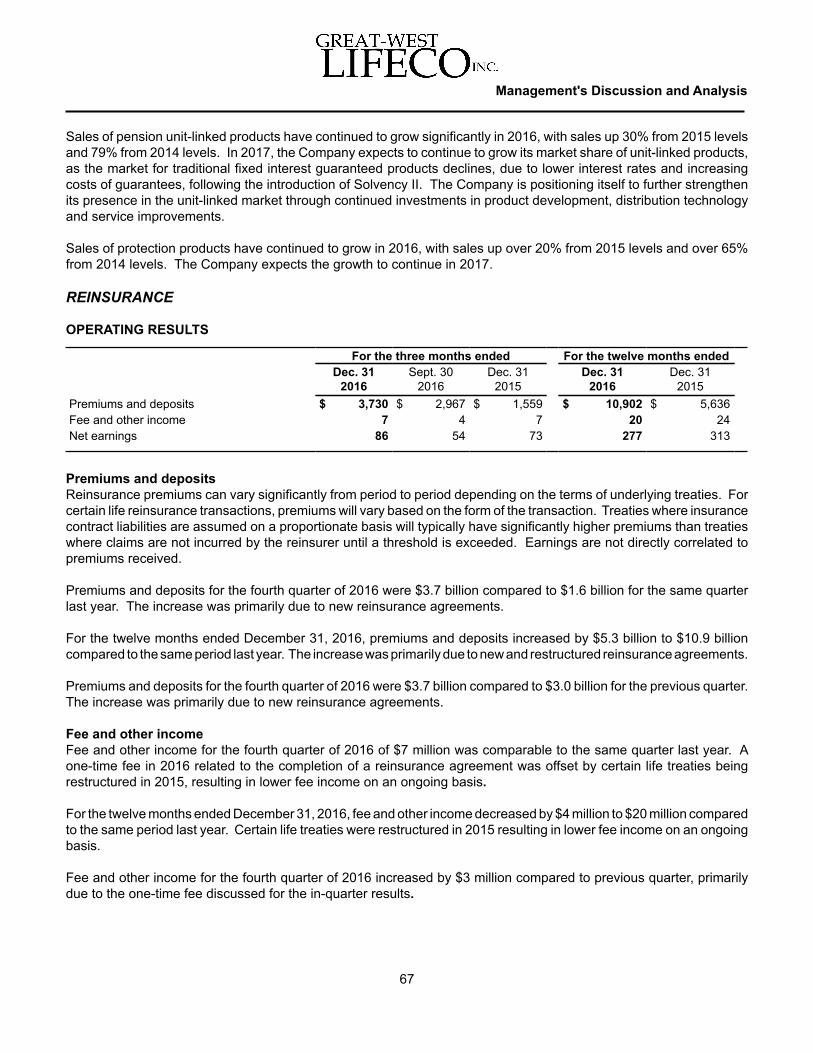
Sales of pension unit-linked products have continued to grow significantly in 2016, with sales up 30% from 2015 levelsand 79% from 2014 levels. In 2017, the Company expects to continue to grow its market share of unit-linked products,as the market for traditional fixed interest guaranteed products declines, due to lower interest rates and increasingcosts of guarantees, following the introduction of Solvency II. The Company is positioning itself to further strengthenits presence in the unit-linked market through continued investments in product development, distribution technologyand service improvements.
Sales of protection products have continued to grow in 2016, with sales up over 20% from 2015 levels and over 65%from 2014 levels. The Company expects the growth to continue in 2017.
Management's Discussion and Analysis
67
REINSURANCE
OPERATING RESULTS
For the three months ended For the twelve months endedDec. 31
2016Sept. 30
2016Dec. 31
2015Dec. 31
2016Dec. 31
2015Premiums and deposits $ 3,730 $ 2,967 $ 1,559 $ 10,902 $ 5,636Fee and other income 7 4 7 20 24Net earnings 86 54 73 277 313
Premiums and depositsReinsurance premiums can vary significantly from period to period depending on the terms of underlying treaties. Forcertain life reinsurance transactions, premiums will vary based on the form of the transaction. Treaties where insurancecontract liabilities are assumed on a proportionate basis will typically have significantly higher premiums than treatieswhere claims are not incurred by the reinsurer until a threshold is exceeded. Earnings are not directly correlated topremiums received.
Premiums and deposits for the fourth quarter of 2016 were $3.7 billion compared to $1.6 billion for the same quarterlast year. The increase was primarily due to new reinsurance agreements.
For the twelve months ended December 31, 2016, premiums and deposits increased by $5.3 billion to $10.9 billioncompared to the same period last year. The increase was primarily due to new and restructured reinsurance agreements.
Premiums and deposits for the fourth quarter of 2016 were $3.7 billion compared to $3.0 billion for the previous quarter.The increase was primarily due to new reinsurance agreements.
Fee and other incomeFee and other income for the fourth quarter of 2016 of $7 million was comparable to the same quarter last year. Aone-time fee in 2016 related to the completion of a reinsurance agreement was offset by certain life treaties beingrestructured in 2015, resulting in lower fee income on an ongoing basis.
For the twelve months ended December 31, 2016, fee and other income decreased by $4 million to $20 million comparedto the same period last year. Certain life treaties were restructured in 2015 resulting in lower fee income on an ongoingbasis.
Fee and other income for the fourth quarter of 2016 increased by $3 million compared to previous quarter, primarilydue to the one-time fee discussed for the in-quarter results.

Net earningsNet earnings for the fourth quarter of 2016 increased by $13 million to $86 million compared to the same quarter lastyear. The increase was primarily due to favourable morbidity experience and higher new business volumes, partiallyoffset by lower contributions from insurance contract liability basis changes.
For the twelve months ended December 31, 2016, net earnings decreased by $36 million to $277 million comparedto the same period last year. The decrease was primarily due to less favourable mortality experience for the traditionallife business, partially offset by higher contributions from insurance contract liability basis changes and favourablemorbidity experience. In addition, net earnings in 2015 were positively impacted by changes to certain income taxestimates, which did not recur in 2016.
Net earnings for the fourth quarter of 2016 increased by $32 million compared to the previous quarter, primarily dueto favourable mortality experience and higher new business volumes, partially offset by lower contributions frominsurance contract liability basis changes.
Management's Discussion and Analysis
68
OUTLOOK – REINSURANCE Refer to Cautionary Note regarding Forward-looking Information and Cautionary Note regarding non-IFRS FinancialMeasures at the beginning of this document.
The U.S. life reinsurance industry is focused on accessing certain demographics, including the low to middle incomefamilies market. If the industry is successful, this could create renewed growth, otherwise expected sales and volumewill remain stable. The incoming Presidential Administration in the U.S. has signaled the desire to repeal and replacethe Affordable Care Act. At this point, the Company cannot determine what the impact may be on the health reinsurancemarket. Additionally, new U.S. regulatory rules (Principle-Based Reserving) affecting the calculation of statutoryreserves are expected to be effective in 2017.
In Europe, Solvency II is expected to continue to be the main driver of the business in 2017 and beyond. The Company’sreinsurance operation is preparing to help European clients and other affiliated companies meet the capital challengesand business opportunities arising from these regulatory changes.
While the 2016 Atlantic hurricane season was the most active and costly since 2012, the Company expects 2017pricing for the property and casualty market will continue to soften, although not as significantly as in previous years.Hedge fund capacity, collateralized covers and catastrophe bond issuance are expected to continue to grow in 2017,while buyer demand is under downward pressure due to increasing client retention. The primary focus for 2017 willbe to continue to move further away from exposure risk, continue to utilize the most recent U.S. modeling updatesfrom Risk Management Solutions (RMS) and manage geographic exposures without significant impact on margins.
EUROPE CORPORATEThe Europe Corporate account includes financing charges and the impact of certain non-continuing items as well asthe results for the legacy international businesses.
The net loss for the fourth quarter of 2016 of $4 million was comparable to the same quarter last year.
For the twelve months ended December 31, 2016, Europe Corporate had a net loss of $4 million compared to $25million for the same period last year. Following the transaction to assume control of GloHealth in the third quarter of2016, the Company reported a gain to reflect the fair value of the GloHealth investment, which increased net earningsby $24 million. Excluding this item, the net loss increased by $3 million, primarily due to lower restructuring costs.Included in the year-to-date results were $15 million of restructuring and acquisition costs primarily relating to AvivaHealth and GloHealth, compared to $20 million of Irish Life and Legal & General International (Ireland) Limitedrestructuring costs for the same period in 2015.

The net loss for the three months ended December 31, 2016 was $4 million compared to net earnings of $8 million inthe previous quarter. Excluding the fair value gain related to GloHealth discussed for the year-to-date results, the netloss decreased by $12 million, primarily due to restructuring and acquisition costs relating to Aviva Health and GloHealthin the third quarter of 2016, which did not recur.
Management's Discussion and Analysis
69
LIFECO CORPORATE OPERATING RESULTSThe Lifeco Corporate segment includes operating results for activities of Lifeco that are not associated with the majorbusiness units of the Company.
The net loss for the three months ended December 31, 2016 of $12 million increased from a net loss of $7 million forthe same quarter last year, primarily due to higher operating expenses.For the twelve months ended December 31, 2016, Lifeco Corporate had a net loss of $26 million, an increase from anet loss of $16 million for the same period last year, primarily due to higher operating expenses and higher incometaxes, driven by the impact of changes to certain income tax estimates in 2015.
The net loss for the three months ended December 31, 2016 of $12 million increased from a net loss of $6 million forthe previous quarter, primarily due to higher operating expenses and lower net investment income. These increaseswere partially offset by the negative impact of changes to certain income tax estimates in the third quarter of 2016,which did not recur.
RISK MANAGEMENT
OVERVIEW As a diverse financial services company, the effective management of risk is integral to the success of the Company’sbusiness. The Company has a prudent and measured approach to risk management. This approach is built on astrong risk culture and is guided by an integrated Enterprise Risk Management (ERM) Framework.
The Company’s ERM Framework facilitates the alignment of business strategy with risk appetite, informs and improvesthe deployment of capital; and supports the identification, mitigation and management of exposure to possibleoperational surprises, losses and risks. The Company’s Risk Function is responsible for the Risk Appetite Framework(RAF), the supporting risk policies and risk limit structure, and provides independent risk oversight across the Company’soperations.
ENTERPRISE RISK MANAGEMENT FRAMEWORK The Company’s Board and Management Committees provide oversight of the ERM Framework which is comprisedof four components: Risk Strategy and Culture, Risk Governance, Risk Appetite Framework and Limits and RiskProcesses.
RISK STRATEGY AND CULTURE The Company’s business strategy is aligned with its risk strategy and risk appetite. The risk strategy supports theCompany’s main objectives to keep its commitments while growing shareholder value. The risk strategy requires:diversification of products and services, customers, distribution channels and geographies; a prudent and measuredapproach to risk-taking; conducting business with high standards of integrity; and generating consistent returns. The risk strategy emphasizes the Company’s strong culture of managing risk, which is strengthened by the role of theBoard of Directors and senior management. This reflects the Company’s commitment to placing the interests of itscustomers and the long-term strength of the Company at the centre of decision-making.
The Company’s culture emphasizes open communication, transparency and ethical behaviour.
RISK GOVERNANCE
Board of Directors The Board of Directors is ultimately responsible for the Company’s risk governance and associated risk policies andannually approves the ERM Policy, RAF and Own Risk and Solvency Assessment (ORSA). The Board considersadvice from the Risk Committee of the Board of Directors on risk oversight matters.
The Board of Directors addresses risk management and governance primarily through its Risk Committee. The RiskCommittee's responsibilities include:
• Review and oversight of the ERM Policy and RAF; • Review, approval and oversight of the credit, market, insurance, operational and other key risk policies; • Approving the risk limit framework, associated risk limits and monitoring adherence to those limits; • Evaluating the Company's risk culture;• Discussing risks in aggregate and by type of risk; • Reviewing Risk Function reports including stress testing and Dynamic Capital Adequacy Testing (DCAT); • Reviewing the Own Risk and Solvency Assessment (ORSA); • Reviewing and assessing the performance and compensation of the Company's Chief Risk Officer (CRO) and
providing input on succession planning; and • Reviewing and assessing the effectiveness of risk management across the Company including processes to
ensure effective identification, measurement, management, monitoring and reporting on significant currentand emerging risks.
Members of the Board Risk Committee are independent of management. The Governance and Nominating Committeeof the Board of Directors regularly assess Board and Board Committee effectiveness.
Senior Management Committees The Executive Risk Management Committee (ERMC) is the key senior management committee that oversees all formsof risk and the implementation of the ERM Framework. Its responsibilities include reviewing compliance with the RAF,risk policies and risk standards. It also assesses the risk impact of business strategies, capital and financial plans,and material initiatives. The Board Risk Committee delegates authority for the approval and management of lowerlevel risk limits to the ERMC.
The Company’s Chief Risk Officer (CRO) leads the Risk Function and chairs the ERMC. The following four enterprise-wide sub-committees, chaired by the Risk Function, report into the ERMC to provide advice and recommendations oneach of the key risk categories:
• Market Risk Committee • Credit Risk Management Committee • Insurance Risk Committee • Operational Risk Committee
The oversight responsibilities of the above committees include identification, measurement, management, monitoringand reporting of their respective risks.
Management's Discussion and Analysis
70
Accountabilities The Company has adopted a three lines of defense model in order to clearly segregate risk management and riskoversight responsibilities and applies the ERM Framework rigorously across the enterprise:
• First Line: Business units and support functions, including Investment Management, Human Resources,Information Services and Legal, have primary responsibility for identifying and managing the risks inherent inthe products, activities, processes and systems for which they are accountable;
• Second Line: The Risk Function has overall responsibility for independent risk oversight and governancethrough developing and implementing the ERM framework. In this role, the Risk Function receives supportfrom other control functions including Actuarial, Compliance and Finance; and
• Third Line: Internal Audit is responsible for independently assessing the adequacy of the design andoperational effectiveness of the Company's ERM Framework.
The Company’s CRO reports directly, both to the President and CEO and to the Board Risk Committee. The CRO isresponsible for ensuring that the Risk Function is appropriately resourced and effective in executing its responsibilities.The accountabilities of the CRO include reporting on compliance with the ERM Policy and RAF as well as for escalatingmatters that require attention.
Regional ERMCs monitor all risk categories for businesses and operations within their respective business segments.Risk resources and capabilities are aligned with the Company's business segments and operating units. Furthersupport is provided by centrally based risk areas of expertise.
Risk Management Policies The Company has codified its procedures and operations related to risk management and oversight requirements ina set of guiding documents composed of risk policies, operating standards, and associated guidelines. Thiscomprehensive documentation framework provides detailed and effective guidance across all risk managementprocesses. These documents enable a consistent approach to risk management and oversight across the Company’sbusinesses and are reviewed and approved regularly, in accordance with an established authority hierarchy, by theBoard of Directors, the Board Risk Committee or a senior management committee. Similar policy structures havebeen developed and are maintained by each region.
Management's Discussion and Analysis
71
RISK APPETITE FRAMEWORK AND LIMITS A key component of the Company’s ERM Framework is the Risk Appetite Framework (RAF). The RAF includes a RiskAppetite Statement that reflects the levels and types of risk that the Company is willing to accept to achieve its businessobjectives. The Company’s Risk Appetite Statement has four key components:
• Strong Capital Position: the Company maintains a strong balance sheet and does not take risks that wouldjeopardize its financial strength;
• Mitigated Earnings Volatility: the Company seeks to avoid substantial earnings shortfalls by ensuringappropriate diversification and limiting exposure to more volatile lines of business;
• Strong Liquidity: the Company maintains a high quality, diversified investment portfolio with sufficient liquidityto meet the demands of policyholder and financing obligations under normal and stressed conditions; and
• Maintenance of the Company’s Reputation: the Company considers, across all business activities andoperations, the potential impact on its reputation.
A comprehensive structure of risk limits and controls is in place across the Company. Enterprise risk limits are furtherbroken down by business unit and risk type. The limit structure is accompanied by comprehensive limit approval andbreach management processes to ensure effective governance and oversight of the RAF.
The Company and its subsidiaries are subject to various regulatory regimes. The capital requirements under theseregulatory capital regimes are reflected in the development of risk limits.

RISK PROCESSES Risk processes follow a cycle of: identification, measurement, management, monitoring and reporting and are designedto ensure both current and emerging risks are assessed against the RAF.
Risk identification requires the structured analysis of the current and emerging risks facing the Company, so that theyare understood and appropriately controlled. Processes ensure risks are considered, assessed, prioritized andaddressed in all business initiatives and changes, including investment strategies, product design, significanttransactions, annual planning and budgeting as well as potential business acquisitions and disposals.
The Company has processes in place to identify risk exposures on an ongoing basis and, where appropriate, developsmitigation strategies to proactively manage these risks. Effective risk management requires the selection andimplementation of approaches to accept, reject, transfer, avoid or control risk, including mitigation plans. It is basedon a control framework that includes risk limits, key risk indicators, stress and scenario testing to ensure appropriateescalation and resolution of potential issues in a timely manner.
Risk measurement provides the means to quantify and assess the Company’s risk profile and monitor the profile againstthe risk limits. Any material new business development or change in strategy warrants an independent assessmentof risk and potential impact on reputation, in addition to measurement of the impact on capital, earnings and liquidity.Stress and scenario testing is used to evaluate risk exposures against the risk appetite. Sensitivity testing of key risksis used to evaluate the impact of risk exposures independent of other risks. Scenario testing is used to evaluate thecombined impact of multiple risk exposures.
A key responsibility of the Risk Function is to ensure that the risk appetite is applied consistently across the Companyand that limits are established to ensure that risk exposures comply with the risk appetite and Company-wide riskpolicies.
Management's Discussion and Analysis
72
Risk Monitoring, Reporting and Escalation Risk monitoring relates to ongoing oversight and tracking of the Company’s risk exposures, ensuring that the riskmanagement approaches in place remain effective. Monitoring may also identify risk-taking opportunities.
Risk reporting presents an accurate and timely picture of existing and emerging risk issues and exposures as well astheir potential impact on business activities. Reporting highlights the risk profile relative to the risk appetite andassociated risk limits.
A clearly defined escalation protocol has been established in respect of breaches of the RAF, risk policies, operatingstandards and guidelines. Remediation plans are reviewed by the Risk Function and escalated to designatedmanagement and Board committees.
RISK MANAGEMENT AND CONTROL PRACTICES The Company’s risk profile is impacted by a variety of risks and its risk management and independent oversightprocesses are tailored to the type, volatility and magnitude of each risk. The Company has defined specific riskmanagement and oversight processes for risks, broadly grouped in the following categories:
1. Market and Liquidity Risks 2. Credit Risks 3. Insurance Risks 4. Operational / Other Risks

MARKET AND LIQUIDITY RISK
Risk Description Market risk is the risk of loss arising from potential changes in market rates and prices and from changes associatedwith future cash flows of the Company’s business activities. Market risks include interest rate, equity market, realestate and foreign exchange rate risks. Liquidity risk is the risk that the Company cannot meet cash and collateralcommitments as they fall due. Market and Liquidity Risk Management The Company’s Market Risk Policy sets out the market risk management framework and provides the principles formarket risk management. This policy is supported by a number of other policies and guidelines that provide detailedguidance.
An effective governance structure has been implemented for the management of market risk. The business units,including Investment Management, are the ultimate owners of market risk and as such have primary responsibility forthe identification, measurement, management, monitoring and reporting of market risk. The Company has establisheda senior management committee to provide oversight of market risk, which includes completing reviews and makingrecommendations regarding risk limits, the risk policy and associated compliance, breach management and mitigationpertaining to market risk. Each region has established oversight committees and operating committees to help managemarket risk within the region. The Company has developed risk limits, key risk indicators and measures to supportthe management of market and liquidity risk in compliance with the Company's RAF.
The Company is willing to accept market risk and liquidity risk in certain circumstances as a consequence of its businessmodel and seeks to mitigate the risk wherever practical through the immunization of the assets and liabilities, eitherdirectly or indirectly (e.g. using derivatives).
Risks and risk management activities associated with the broad market and liquidity risk categories are detailed below.
Interest Rate Risk Interest rate and spread risk is the risk of loss resulting from the effect of the volatility and uncertainty of future interestrates and credit spreads on asset cash flows relative to liability cash flows and on assets backing surplus. TheCompany’s principal exposure to interest rate risk arises from certain general fund and segregated fund products. TheCompany’s Asset Liability Management (ALM) strategy has been designed to mitigate interest rate risks associatedwith general fund products, with close matching of asset cash flows and insurance and investment contract obligations.Products with similar risk characteristics are grouped together to ensure an effective aggregation and management ofthe Company’s ALM positions. Asset portfolios backing liabilities are segmented to align with the duration and othercharacteristics (e.g. liquidity) of contract liabilities.
Crediting rates within general fund products are set prudently and a significant proportion of the Company’s portfolioof crediting rate products includes pass-through features, which allow for the risk and returns to be shared withpolicyholders. Asset management and related products permit redemptions; however, the Company attempts tomitigate this risk by establishing long-term customer relationships, built on a strategic customer focus and an emphasison delivering strong fund performance.
The Company has established dynamic hedging programs to hedge interest rate risk sensitivity associated withsegregated fund and variable annuity guarantees. The hedging programs are designed to offset changes in theeconomic value of liabilities through the use of derivative instruments. The Company’s approach to dynamic hedgingof interest rate risk principally involves transacting in interest rate swaps. The hedge asset portfolios are dynamicallyrebalanced within approved thresholds and rebalancing criteria.
Where the Company’s insurance and investment products have benefit or expense payments that are dependent oninflation (e.g. inflation-indexed annuities, pensions and disability claims), the Company generally invests in real returninstruments to mitigate changes in the real dollar liability cash flows. Some protection against changes in the inflationindex can be achieved, as any related change in the fair value of the assets will be largely offset by a similar changein the fair value of the liabilities.
Management's Discussion and Analysis
73
Equity Risk Equity risk is the risk of loss resulting from the sensitivity of the values of assets, liabilities, financial instruments andfee revenue to changes in the level or in the volatility of prices of equity markets. The Company’s principal exposureto equity risk arises from segregated funds and fee income associated with the Company’s assets under management.Approved investment and risk policies also provide for general fund investments in equity markets within defined limits.
The Company has established dynamic hedging programs to hedge equity risk sensitivity associated with segregatedfund and variable annuity guarantees. The hedging programs are designed to mitigate exposure to changes in theeconomic value of these liabilities through the use of derivative instruments. The Company’s approach to dynamichedging of equity risk principally involves the short selling of equity index futures. The hedge asset portfolios aredynamically rebalanced within approved thresholds and rebalancing criteria.
For certain very long-dated liabilities it is not practical or efficient to closely match liability cash flows with fixed-incomeinvestments. Certain long-dated asset portfolios therefore target an investment return sufficient to meet liability cashflows over the longer term. These segments are partially backed by a diversified portfolio of non-fixed incomeinvestments, including equity and real estate investments, in addition to long dated fixed-income instruments thatprovide duration. Foreign Exchange Risk Foreign exchange risk is the risk of loss due to changes in currency exchange rates. The Company’s foreign exchangeinvestment and risk management policies and practices are to match the currency of the Company’s general fundinvestments with the currency of the underlying insurance and investment contract liabilities. To enhance portfoliodiversification and improve asset liability matching, the Company may use foreign exchange derivatives to mitigatecurrency exchange risk to the extent this is practical through the use of forward contracts and swaps.
The Company’s revenue, expenses and income denominated in currencies other than the Canadian dollar are subjectto fluctuations due to the movement of the Canadian dollar against these currencies. Such fluctuations affect theCompany’s financial results. The Company has exposures to the U.S. dollar resulting from the operations of Great-West Financial and Putnam in the United States segment and the Reinsurance business unit within the Europe segment;and to the British pound and the Euro resulting from operations in the U.K., the Isle of Man, Ireland and Germany inthe Europe segment.
The Company has net investments in foreign operations. In accordance with IFRS, foreign currency translation gainsand losses from net investments in foreign operations, net of related hedging activities and tax effects, are recordedin accumulated other comprehensive income (loss). Strengthening or weakening of the Canadian dollar spot ratecompared to the U.S. dollar, British pound and euro spot rates impacts the Company’s total share capital and surplus.Correspondingly, the Company’s book value per share and capital ratios monitored by rating agencies are also impacted.
• A 5% appreciation (depreciation) of the average exchange rate of the Canadian dollar to each of the U.S.dollar, British pound and euro would decrease (increase) operating earnings in 2016 by $16 million, $38 millionand $22 million, respectively.
• A 5% appreciation (depreciation) of the Canadian dollar spot rate compared to each of the U.S. dollar, Britishpound and euro spot rates would decrease (increase) the unrealized foreign currency translation losses,including the impact of instruments designated as hedges of net investments on foreign operations, inaccumulated other comprehensive income (loss) of shareholders’ equity by approximately $334 million, $247million and $107 million, respectively, as at December 31, 2016.
Management may use forward foreign currency contracts and foreign denominated debt to mitigate the volatility arisingfrom the movement of rates as they impact the translation of net investments in foreign operations. The Companyuses non-IFRS financial measures such as constant currency calculations to assist in communicating the effect ofcurrency translation fluctuation on financial results.
Management's Discussion and Analysis
74

Liquidity Risk Liquidity risk arises from the Company’s inability to generate the necessary funds to meet its on-and-off balance sheetobligations as they come due.
The Company’s liquidity risk framework and associated limits are designed to ensure that the Company can meet cashand collateral commitments as they fall due, both on an expected basis and under a severe liquidity stress. In the normal course of certain Reinsurance business, the Company provides Letters of Credit (LOCs) to other parties,or beneficiaries. A beneficiary will typically hold a LOC as collateral in order to secure statutory credit for insuranceand investment contract liabilities ceded to or amounts due from the Company.
The Company may be required to seek collateral alternatives if it is unable to renew existing LOCs at maturity. TheCompany monitors its use of LOCs on a regular basis and assesses the ongoing availability of these and alternativeforms of operating credit. The Company has contractual rights to reduce the amount of LOCs issued to the LOCbeneficiaries for certain reinsurance treaties. The Company staggers the maturities of LOCs to reduce the renewalrisk.
LiquidityDecember 31
2016 2015(1)
Cash, cash equivalents and short-term bonds $ 7,874 $ 7,056
Other liquid assets and marketable securitiesGovernment bonds 36,873 36,584Corporate bonds 43,044 43,140Common/Preferred shares (public) 7,989 7,054Residential mortgages - insured 3,652 3,704
$ 91,558 $ 90,482
Total $ 99,432 $ 97,538
Cashable liability characteristicsDecember 31
2016 2015Surrenderable insurance and investment contract liabilities
At market value $ 20,369 $ 19,641At book value 49,751 47,403
Total $ 70,120 $ 67,044
(1) Comparative figures have been reclassified for presentation purposes. The carrying value of the Company's liquid assets and marketable securities is approximately $99.4 billion or 1.4 timesthe Company’s surrenderable insurance and investment contract liabilities. The Company believes that it holdsadequate and appropriate liquid assets to meet anticipated cash flow requirements as well as to meet cash flow needsunder a severe liquidity stress.
The majority of liquid assets and other marketable securities comprise fixed-income securities whose value is inverselyrelated to interest rates. Consequently, a significant rise in prevailing interest rates would result in a decrease in thevalue of this pool of liquid assets. As well, a high interest rate environment may encourage holders of certain types ofpolicies to terminate their policies, thereby placing demands on the Company's liquidity position.
Management's Discussion and Analysis
75

CREDIT RISK
Risk Description Credit risk is the risk of loss arising from an obligor’s potential inability or unwillingness to fully meet its contractualobligations. Exposure to credit risk occurs any time funds are extended, committed or invested through actual orimplied contractual agreements. The Company is exposed to the credit risk of issuers of securities held in the Company’sgeneral fund and pension plans (e.g. bonds, mortgages, structured securities), and to the credit risk of reinsuranceand derivative counterparties. Credit exposure resulting from the purchase of fixed-income securities, which are primarily used to support policyholderliabilities, is considered to be a core business risk that is appropriately factored into the Company’s risk appetite. TheCompany manages financial contracts with counterparties which may result in counterparty credit risk related to themitigation of insurance risk, through reinsurance agreements, and market risk, through derivative contracts. Creditrisk arising from both sources is included in the Company’s measurement of its credit risk profile.
Credit Risk Management The Company’s credit risk management framework focuses on minimizing undue concentration within issuers,connected companies, industries or individual geographies by emphasizing diversification as well as by limiting newexposures to investment grade assets as per the Company’s Investment Policy. Diversification is achieved throughthe establishment of appropriate limits and transaction approval authority protocols. The Company’s approach to creditrisk management includes the continuous review of its existing risk profile relative to the RAF as well as to the projectionof potential changes in the risk profile under stress scenarios.
Effective governance of credit risk management is enabled with the involvement of dedicated senior managementcommittees, experienced credit risk personnel, and with the guidance of appropriate credit risk policies, standards andprocesses. For credit risk, the Investment Committee of the Board of Directors (Investment Committee) is responsiblefor the approval of investment decisions of significant size or level of complexity, and oversight of the Company’s globalinvestment strategy, including compliance with investment limits and policies as well as breach management.Additionally, the Investment Committee reviews the Company’s investment policies, procedures, guidelines, andcorresponding limits to ensure that investment decisions are in compliance with the Company's RAF. The RiskCommittee advises the Board of Directors on credit risk oversight matters and approves and monitors compliance withcredit risk policies and limits. The Risk Committee also provides oversight of the Credit Risk Management Policy andrelated processes, and is responsible for ensuring compliance with the Company's RAF.
The Investment Committee and Risk Committee are supported by senior management committees. The GlobalManagement Investment Review Committee (GMIRC) and the Management Investment Review Committees (MIRCs)for each regional business segment review and approve new investments and manage credit risk across investedassets and counterparties. The Credit Risk Management Committee (CRMC), is the ERMC sub-committee responsiblefor providing global oversight of credit risk management activities, including credit risk limit approval and breachmanagement processes, and credit risk policy compliance.
The Company has established business-segment specific Investment and Lending Policies, including investment limitsfor each asset class, which are approved by the Investment Committee. These policies and limits are complementedby the Credit Risk Policy which describes credit risk management processes and identifies the role of the Risk Functionin the oversight of credit risk, including the setting and monitoring of aggregate risk limits, and the approval and escalationof exceptions.
The Company identifies credit risk through an internal credit risk rating system which includes a detailed assessmentof an obligor’s creditworthiness based on a thorough and objective analysis of business risk, financial profile, structuralconsiderations and security characteristics including seniority and covenants. Credit risk ratings are expressed usinga 22-point scale that is consistent with those used by external rating agencies. In accordance with the Company’spolicies, internal credit risk ratings cannot be higher than the highest rating provided by certain independent ratingscompanies. The Risk Function reviews and approves the credit risk ratings assigned by Investment Management forall new investments, and reviews the appropriateness of ratings assigned to outstanding exposures.
Management's Discussion and Analysis
76
The Risk Function assigns credit risk parameters (probabilities of default, rating transition rates, loss given defaults,exposures at default) to all credit exposures in order to measure the Company’s aggregate credit risk profile. In addition,the Risk Function establishes limits and processes, performs stress and scenario testing (using stochastic anddeterministic scenarios) and assesses compliance with the limits established in the RAF. It regularly reports on theCompany's credit risk profile to executive management, the Board of Directors and various committees at enterprise,regional and legal entity levels.
Investment Management and the Risk Function are independently responsible for the monitoring of exposures relativeto limits as well as for the management and escalation of risk limit breaches as they occur. The Investment ManagementFunction is also responsible for the continuous monitoring of its portfolios for changes in credit outlook, and performsregular credit reviews of all relevant obligors and counterparties, based on a combination of bottom-up credit analysisand top-down views on the economy and assessment of industry and sub-sector outlooks. Watch Lists are also usedat the regional business segment levels to plan and execute the relevant risk mitigation strategies.
The Risk Function oversees monitoring, breach management and escalation activities, and has developed risk limits,key risk indicators (KRIs) and risk budgets to act as early warnings against unacceptable levels of concentration andto support the management of credit risk limits in compliance with the Company’s RAF.
Counterparty Risk Through reinsurance arrangements, the Company cedes insurance risk in order to mitigate insurance risk.Counterparties providing reinsurance to the Company are reviewed for financial soundness as part of an ongoingmonitoring process. The minimum financial strength of reinsurers is outlined in the Corporate Reinsurance CededRisk Management Policy. The Company seeks to minimize reinsurance credit risk by setting rating based limits onnet ceded exposure by counterparty as well as seeking protection in the form of collateral or funds withheld arrangementswhere possible.
The Company uses derivatives for risk mitigation purposes. Derivative products are traded through exchanges or withcounterparties approved by the Board of Directors or the Investment Committee. The Company seeks to mitigatederivative credit risk by setting rating based counterparty limits in its investment policies and through collateralarrangements where possible. In addition, the Company includes potential future exposure of derivatives in its measureof total exposure against single name limits.
Management's Discussion and Analysis
77
INSURANCE RISK Risk Description Insurance risk is the risk of loss resulting from adverse changes in experience associated with contractual promisesand obligations made under insurance contracts. Insurance risk includes uncertainties around the ultimate amount ofnet cash flows (premiums, commissions, claims, payouts and related settlement expenses), the timing of the receiptand payment of these cash flows, as well as the impact of policyholder behaviour (e.g. lapses).
The Company identifies six broad categories of insurance risk, which may contribute to financial losses: mortality risk,morbidity risk, longevity risk, lapse risk, expense risk and property damage risk. Mortality risk, morbidity risk andlongevity risk are core business risks and the exchange of these risks into value is a core business activity. Lapse riskand expense risk associated with offering the core products are accepted as a consequence of the business modeland mitigated where appropriate. Property damage risk is a non-core business risk for which the Company takes extrameasures to manage and mitigate.
Insurance Risk Management Insurance products involve commitments by the insurer to provide services and financial obligations with coverage forextended periods of time. In order to provide insurance protection effectively, the insurer must design and price productsso that the premiums received, and the investment income earned on those premiums, will be sufficient to pay futureclaims and expenses associated with the product. This requires the insurer, in pricing products and establishinginsurance contract liabilities, to make assumptions regarding expected levels of income, claims and expenses andhow policyholder behaviours and market risks might impact these assumptions. Insurance contract liability valuationrequires regular updating of assumptions to reflect emerging experience. Insurance contract liabilities are establishedto fund future claims and include a provision for adverse deviation, set in accordance with professional actuarialstandards.
An effective governance structure has been implemented for the management of insurance risk. Business units arethe ultimate owners of insurance risk and as such have primary responsibility for the identification, measurement,management, monitoring and reporting of insurance risk. The Risk Function, supported by Corporate Actuarial, isprimarily responsible for oversight of the insurance risk management framework. The Company has established theInsurance Risk Committee to provide oversight of insurance risk, which includes completing reviews and makingrecommendations regarding risk limits, the risk policy and associated compliance, breach management and mitigationpertaining to insurance risk. Each region has established oversight committees and operating committees to helpmanage insurance risk within the region.
The Company’s Insurance Risk Policy sets out the insurance risk management framework and provides the principlesfor insurance risk management. This policy is supported by a number of other policies and guidelines that providedetailed guidance, including:
• Corporate Product Design and Pricing Risk Management Policy and Corporate Reinsurance Ceded RiskManagement Policy, which provide guidelines and standards for the product design and pricing riskmanagement processes and reinsurance ceded risk management practices;
• Corporate Actuarial Valuation Policy, which provides documentation and control standards consistent with thevaluation standards of the Canadian Institute of Actuaries; and
• Participating Account Management Policies and Participating Policyholder Dividend Policies, which governthe management of participating accounts and provide for the distribution of a portion of the earnings in theparticipating account as participating policyholder dividends.
The Risk Function in conjunction with Corporate Actuarial implements a number of processes to carry out itsresponsibility for oversight of insurance risk. It reviews the Insurance Risk Policy relative to current risk exposuresand updates it as required. It reviews insurance risk management processes carried out by the business units, includingproduct design and pricing, underwriting, claims adjudication, and reinsurance ceding, and provides challenge asrequired. The Risk Function works with the business units and other oversight functions to ensure that current andemerging insurance risks are identified and that appropriate action is taken if required. Insurance risk limits, riskbudgets and key risk indicators are set to keep the insurance risk profile within the Company’s appetite for insurancerisk and the Risk Function regularly monitors the insurance risk profile relative to these measures. Any breaches wouldbe escalated as required and appropriate remediation would be implemented. The Risk Function performs stresstesting and does analysis of insurance risks, including review of experience studies. It provides regular reporting onthese activities to the business units, senior management, and risk oversight committees.
Risks and risk management activities associated with the broad insurance risk categories are detailed below.
Mortality and Morbidity Risk Mortality risk is the risk of loss resulting from adverse changes in the level, trend, or volatility of mortality rates, wherean increase in the mortality rate leads to an increase in the value of insurance contract liabilities.
Morbidity risk is the risk of loss resulting from adverse changes in the level, trend, or volatility of disability, health, dental,critical illness and other sickness rates, where an increase in the incidence rate or a decrease in the disability recoveryrate leads to an increase in the value of insurance contract liabilities.
Management's Discussion and Analysis
78

There is a risk that the Company will mis-estimate the level of mortality or morbidity, or accept customers who generateworse mortality and morbidity experience than expected.
The Company employs the following practices to manage its mortality and morbidity risk:
• Research and analysis is done regularly to provide the basis for pricing and valuation assumptions to properlyreflect the insurance and reinsurance risks in markets where the Company is active.
• Underwriting limits, practices and policies control the amount of risk exposure, the selection of risks insuredfor consistency with claims expectations and support the long-term sustainability of the Company.
• The insurance contract liabilities established to fund future claims include a provision for adverse deviation,set in accordance with professional standards. This margin is required to provide for the possibilities of mis-estimation of the best estimate and/or future deterioration in the best estimate assumptions.
• The Company sets and adheres to retention limits for mortality and morbidity risks. Aggregate risk is managedthrough a combination of reinsurance and capital market solutions to transfer the risk where appropriate.
• For Group life products, exposure to a concentrated mortality event due to concentration of risk in specificlocations for example, could have an impact on financial results. To manage the risk, concentrations aremonitored for new business and renewals. The Company may impose single-event limits on some group plansand declines to quote in localized areas where the aggregate risk is deemed excessive.
• Effective plan design and claims adjudication practices, for both morbidity and mortality risks are critical to themanagement of the risk. As an example, for Group healthcare products, inflation and utilization will influencethe level of claims costs, which can be difficult to predict. The Company manages the impact of these andsimilar factors through plan designs that limit new costs and long-term price guarantees and include the abilityto regularly re-price for emerging experience.
• The Company manages large blocks of business, which, in aggregate, are expected to result in relatively lowstatistical fluctuations in any given period. For some policies, these risks are shared with the policyholderthrough adjustments to future policyholder charges or in the case of participating policies through future changesin policyholder dividends.
Longevity Risk Longevity risk is the risk of loss resulting from adverse changes in the level, trend, or volatility of mortality rates, wherea decrease in the mortality rate leads to an increase in the value of insurance contract liabilities. Annuities and somesegregated fund products with Guaranteed Minimum Withdrawal Benefits are priced and valued to reflect the lifeexpectancy of the annuitant. There is a risk that annuitants could live longer than was estimated by the Company,which would increase the value of the associated insurance contract liabilities.
Business is priced using mortality assumptions which take into account recent Company and industry experience andthe latest research on expected future trends in mortality.
Aggregate risk is managed through a combination of reinsurance and capital market solutions to transfer the risk asappropriate. The Company has processes in place to verify annuitants’ eligibility for continued income benefits. Theseprocesses are designed to ensure annuity payments accrue to those contractually entitled to receive them and helpensure mortality data used to develop pricing and valuation assumptions is as complete as possible.
Lapse Risk Lapse risk is the risk of loss resulting from adverse changes in the level or volatility of the rates of policy lapses,terminations, renewals and/or surrenders.
Many products are priced and valued to reflect the expected duration of contracts. There is a risk that the contractmay be terminated before expenses can be recovered, to the extent that higher costs are incurred in early contractyears. Risk also exists where the contract is terminated later than assumed, on certain long-term level premiumproducts where costs increase by age.
Management's Discussion and Analysis
79

Business is priced using policy termination assumptions which take into account product designs and policyholderoptions, recent Company and industry experience and the latest research on expected future trends. Assumptionsare reviewed regularly and are updated for new policies as necessary.
The Company also incorporates early surrender charges into certain contracts and incorporates commissionchargebacks in its distribution agreements to reduce unrecovered expenses.
Policyholder taxation rules in many jurisdictions help encourage the retention of insurance coverage.
Expense Risk Expense risk is the risk of loss resulting from adverse variability of expenses incurred with fee-for-service business orin servicing and maintaining insurance, savings or reinsurance contracts, including direct expenses and allocations ofoverhead costs.
Expense management programs are regularly monitored to control unit costs while maintaining effective servicedelivery.
Property Damage Risk Property damage risk is the risk of loss resulting from adverse changes in property damage experience and is mainlyrelated to extreme or catastrophic events.
The reinsurance business in particular has exposure to natural catastrophic events that result in property damage. Asa retrocessionaire for property catastrophe risk, the Company generally participates at more remote event-lossexposures than primary carriers and reinsurers. Generally, an event of significant size must occur prior to the Companyincurring a claim. The Company limits the total maximum claim amount under all property catastrophe contracts. TheCompany monitors cedant companies’ claims experience and research from third party expert risk models on anongoing basis and incorporates this information in pricing models to ensure that the premium is adequate for the riskundertaken.
Management's Discussion and Analysis
80
OPERATIONAL RISK
Risk Description Operational Risk is the risk of loss arising from potential problems relating to internal processes, people and systemsor from external events. Operational risk can result from either normal day-to-day operations or a specific unanticipatedevent. Operational risks include legal and regulatory, human resources, infrastructure, fraud and supplier risks. Inaddition to operational risks, the Company also manages reputational risk, which can emerge across many businessesand risk types; therefore, reputational considerations are incorporated within each aspect of the Company’s businessand risk management practices.
Operational Risk Management While operational risks can be mitigated and managed, they remain an inherent feature of the business model, asmultiple processes, systems, and stakeholders are required to interact across the enterprise on an ongoing basis. TheCompany actively manages operational risk across the enterprise in order to maintain a strong reputation and standing,maintain financial strength and protect value. On-going engagement of businesses and support functions across theenterprise through robust training and communications is regularly undertaken for identifying, assessing and mitigatingoperational risk issues.
Operational Risk Management governance and oversight reflects a combined effort between business units andoversight functions. This combined effort is particularly critical for management of operational risk, and it is a key factorfor ensuring the Company remains within its Risk Appetite. The Risk Function is responsible for development ofoperational risk management policies and operating standards as well as overseeing operational risk managementactivities performed in the first line of defense. The Operational Risk Committee has the primary mandate to providerisk oversight for Operational Risk across the enterprise. In addition, each regional business segment has establishedoperating committees to oversee operational risk management within their business.

The Company has an Operational Risk Policy, that is supported by standards and guidelines that relate to specializedfunctions, detailing practices related to stress testing, modeling, fraud, risk data aggregation and risk reporting,regulatory and information technology risk management. The Company implements controls to manage operationalrisk through integrated policies, procedures, processes and practices, with consideration given to the cost/benefit trade-off. Processes and controls are monitored and refined by the business areas and periodically reviewed by theCompany’s Internal Audit department. Financial reporting processes and controls are further examined by externalauditors.
The Company also manages operational risks through the corporate insurance program which transfers a portion ofthe operational risk exposure by purchasing insurance coverage that provides protection against unexpected materiallosses resulting from events such as property loss or damage and liability exposures. As well, the Company purchasesinsurance to satisfy legal requirements and/or contractual obligations. The nature and amount of insurance protectionpurchased is assessed with regard to the Company’s risk profile, risk appetite and tolerance for the associated risks.
The Company employs a combination of operational risk management methods including risk and control assessments,internal control factors and risk events analyses. For the identification of operational risks, the Company utilizes Riskand Control Assessments which systematically identify and assess potential operational risks and associated controls.Scenario analysis is employed to identify and quantify potential severe operational risk exposures. Key risk indicators,risk appetite preferences, and other processes are leveraged to measure, manage and monitor operational risks.Internal and external operational risk events are analyzed to identify root causes and provide insights into potentialnew operational risks that could impact the Company.
The Risk Function monitors the status of actions being undertaken to remediate risks to ensure that risk exposuresare mitigated in a timely manner and has processes in place to escalate significant matters to senior management toinform and enable management to take appropriate action when needed. The Risk Function regularly reports on theCompany’s operational risk profile to executive management, the Board of Directors and various committees atenterprise, regional and legal entity levels.
Key operational risks and the Company’s approach to managing them are outlined below.
Legal and Regulatory Risk Legal and regulatory risk arises from non-compliance with specific local or international rules, laws, and regulations,prescribed practices, or ethical standards as well as civil or criminal litigation against the Company. As a multi-nationalcompany, the Company and certain of its subsidiaries are subject to extensive legal and regulatory requirements inCanada, the U.S., the U.K., Ireland and other jurisdictions. The requirements scope covers most aspects of theCompany’s operations including capital adequacy, liquidity and solvency, investments, the sale and marketing ofinsurance and annuity products, the business conduct of insurers, asset managers and investment advisors as wellas reinsurance processes. Material changes in the legal or regulatory framework or the failure to comply with legaland regulatory requirements could have a material adverse effect on the Company.
Legal and Regulatory risk is managed through coordination between first and second line of defense functions. TheCompany records, manages and monitors the regulatory compliance environment closely, leveraging the subject matterexpertise of both local and enterprise-wide Compliance and Legal stakeholders and reporting on emerging changesthat would have significant impact on the Company’s operations or business.
Human Resources Recruitment and Retention Risk Human Resources risks can arise from an inability to attract, retain, train and develop the right talent, ineffectivegovernance practices or legal action related to discrimination, and can impact the ability of the Company to meet itsbusiness objectives. The Company maintains a highly skilled workforce that is reflective of the diverse cultures andpractices of the countries in which the Company operates. Human resource programs, including competitivecompensation programs, succession planning and assessing and addressing employee engagement, are in place tomanage these risks.
Management's Discussion and Analysis
81

Infrastructure Risk Infrastructure Risk arises from reduced or non-availability of any aspect of a fully functioning business environment.This includes corporate facilities, physical assets, human resources and/or technology (technology assets, systems,applications, cloud computing), security (logical, physical and cyber), failures in license management and insufficientsoftware/application support.
The ability to consistently and reliably obtain securities pricing information, accurately process client transactions andprovide reports and other customer services is essential to the Company’s operations. A failure of any of these servicescould have an adverse effect on the Company’s results of operations and financial condition and could lead to loss ofclient confidence, harm to the Company’s reputation, exposure to disciplinary action and liability to the Company’scustomers.
The Company maintains a resilient and secure environment by investing in and managing infrastructure that issustainable and effective in meeting the Company’s needs for a fully functioning and secure business operation thatprotects assets and stakeholder value. Infrastructure risk management programs include strong business continuitycapabilities across the enterprise to manage short-term incidents or outages and the recovery of critical functions inthe event of a disaster. In addition, security measures are designed to deny unauthorized access to facilities, equipmentand resources, and to protect personnel and property from damage or harm (such as espionage, theft or terroristattacks) and events that could cause serious losses or damage.
Technology and Cyber Risk Technology and Cyber Risk is an integral component of Infrastructure Risk. Similar to other major financial institutions,the Company faces heightened technology and cyber risks due to its reliance on the internet and use of technologiesto serve customers. The risks faced include the threat of corporate espionage, identity theft and hacking, includingthe risk of denial of service or ransomware attacks.
To remain resilient to such threats and to protect customers, brand and reputation, the Company continues to investin capabilities to prevent, detect, respond and manage such cyber security threats. More specifically, the Companyhas established enterprise-wide cyber security programs, benchmarked capabilities to sound industry practices, andhas implemented robust threat and vulnerability assessment and response capabilities. Process Risk Inadequate or failed business processes can adversely impact the Company’s financial results, relationships withcustomers and reputation. Process risk includes risks arising from significant change management initiatives such asbusiness model changes, major systems implementation, new product introductions and leadership changes.
Risk management ensures strategic alignment and congruency in all business activities, including change initiativesand business-as-usual activities, with the Company’s operational risk appetite and considers the potential impact onthe Company’s reputation. Further, the Company seeks to control processes across the value chain through automation,standardization and process improvements to prevent or reduce operational losses.
Fraud Risk Fraud can result in a financial loss or reputational impact to the Company. Fraud management is built around theprinciples of prevention, detection and response. The Company promotes a culture of honesty, integrity, transparencyand fairness in its internal operations and further manages fiduciary responsibilities through the Company’s Fraud RiskManagement Policy and Code of Conduct. The Company maintains a strong set of controls designed to prevent fraudand employs sophisticated data analytics to detect fraud. A fraud response plan is in place to deal with events througha coordinated investigative strategy to ensure stakeholders and the interests of the Company are protected.
Management's Discussion and Analysis
82

Supplier Risk The Company strategically engages suppliers to maintain cost efficiency, to free internal resources and capital and toutilize skills, expertise and resources not otherwise available to the Company. The Company’s profitability or reputationcould be negatively impacted if suppliers do not meet Company standards for performance.
The Company utilizes a supplier risk management program to minimize risks when engaging suppliers and to provideeffective oversight and monitoring throughout the entire supplier relationship. This program helps to ensure thearrangements, transactions and other interactions with suppliers meet standards for quality of service and riskmanagement expectations.
Management's Discussion and Analysis
83
OTHER RISKS
Conduct Risk Conduct risk is the risk of unfair outcomes for customers as a result of inadequate or failed processes and/orinappropriate behaviours, offerings or interactions by the Company or its agents. Conduct risk may result in loss dueto the cost of customer remediation, damage to reputation and/or regulatory fines.
The Company manages conduct risk by ensuring appropriate clarity of communications; applying sales and adviceprocesses that are focused on fair outcomes to customers; seeking customer feedback; maintaining proper controlsand adhering to Board-approved policies and processes. Conduct Risk is incorporated in risk management andcompliance activities, including Risk and Control Assessments, internal events reporting, emerging risk assessments,and other measurement, monitoring and reporting activities. Strategic Risk Strategic risk arises as a result of failures of internal planning, ineffective strategic decision-making, major regulatorychanges, macroeconomic or country risk events, or changes to the external environment manifesting over the mediumto long term. In addition, strategic risk includes risks associated with the Company’s holding company structure,potential future acquisitions and ongoing access to product distribution.
The Company manages strategic risk through proactive engagement, industry representation and a rigorous strategicplanning process. The Risk Function is engaged in the business planning cycle to ensure business strategies are inalignment with the Company’s Risk Appetite. The Company’s strategic plan is reviewed with the Board of Directorsand Senior Management, with the Risk Function providing objective assessment of enterprise strategic risks and riskmitigation plans. Significant risks and opportunities are identified, and a review of the alignment with risk strategy andqualitative risk preferences is completed. Initiatives, including those related to new markets, distribution channels,product design and investments, are also subject to independent risk review.
Holding Company Structure Risk As a holding company, the Company’s ability to pay interest, dividends and other operating expenses and to meet itsobligations generally depends upon receipt of sufficient funds from its principal subsidiaries and its ability to raiseadditional capital. In the event of the bankruptcy, liquidation or reorganization of any of these subsidiaries, insuranceand investment contract liabilities of these subsidiaries will be completely provided for before any assets of suchsubsidiaries are made available for distribution to the Company; in addition, the other creditors of these subsidiarieswill generally be entitled to the payment of their claims before any assets are made available for distribution to theCompany except to the extent that the Company is recognized as a creditor of the relevant subsidiaries.
Any payment (including payment of interest and dividends) by the principal subsidiaries is subject to restrictions setforth in relevant insurance, securities, corporate and other laws and regulations which require that solvency and capitalstandards be maintained by Great-West Life, London Life, Canada Life, Great-West Financial, and their subsidiariesand certain subsidiaries of Putnam. There are considerable risks and benefits related to this structure.

Management closely monitors the solvency and capital positions of its principal subsidiaries opposite liquidityrequirements at the holding company level. Additional liquidity is available through established lines of credit and theCompany’s demonstrated ability to access capital markets for funds. Management actively monitors the regulatorylaws and regulations at both the holding company and operating company levels to ensure ongoing compliance.
Mergers and Acquisitions Risk From time-to-time, the Company and its subsidiaries evaluate existing companies, businesses, products and services,and such review could result in the Company or its subsidiaries disposing of or acquiring businesses or offering new,or discontinuing existing products and services. In the ordinary course of their operations, the Company and itssubsidiaries consider and discuss with third parties the purchase or sale of companies, businesses or businesssegments. If effected, such transactions could be material to the Company in size or scope, and could result in changesin the value of the securities of the Company, including the common shares of the Company.
The Company undergoes extensive due diligence upon any consideration of acquiring or disposing of businesses orcompanies or offering new, or discontinuing existing, products and services. In its consideration of strategic acquisitions,the Company may determine it to be prudent to hold additional capital for contingencies that may arise during theintegration period following an acquisition.
Product Distribution Risk The Company’s ability to market its products is significantly dependent on its access to a network of distribution channelsand intermediaries. These intermediaries generally offer their clients products in addition to, and in competition with,the Company’s products, and are not obligated to continue working with the Company. In addition, certain investorsrely on consultants to advise them on the choice of advisor and the consultants may not always consider or recommendthe Company. The loss of access to a distribution channel, the failure to maintain effective relationships withintermediaries or the failure to respond to changes in distribution channels could have a significant impact on theCompany’s ability to generate sales.
Product distribution risk is managed by maintaining a broad network of distribution relationships, with productsdistributed through numerous broker-dealers, managing general agencies, financial planners, banks and other financialinstitutions.
Environmental Risk The Company may experience direct or indirect financial, operational or reputational impact stemming fromenvironmental risk events, which include environmental issues, regulatory enforcement or costs associated withchanges in environmental laws and regulations. The Company endeavors to respect the environment and to take abalanced and environmentally sustainable approach to conducting business. The Company has establishedenvironmental policies and guidelines pertaining to the acquisition and ongoing management of investment properties,loans secured by real property and investments in equity and fixed-income securities. These policies are approvedby the Board of Directors and are reviewed annually.
Management's Discussion and Analysis
84

EXPOSURES AND SENSITIVITIES
Insurance and Investment Contract Liabilities
The following illustrates the approximate impact to the Company’s earnings that would arise as a result of changes tomanagement’s best estimate of certain assumptions used to determine the Company’s insurance contract liabilities.
Increase (decrease) innet earnings
2016 2015
Mortality - 2% increase $ (281) $ (282)Annuitant mortality - 2% decrease $ (384) $ (314)Morbidity - 5% adverse change $ (242) $ (225)Investment returns
Parallel shift in yield curve1% increase $ — $ —1% decrease $ — $ —
Change in range of interest rates1% increase $ 149 $ 1091% decrease $ (491) $ (430)
Change in equity markets10% increase $ 43 $ 4510% decrease $ (50) $ (108)
Change in best estimate returns for equities1% increase $ 407 $ 4331% decrease $ (438) $ (457)
Expenses - 5% increase $ (117) $ (108)Policy termination and renewal - 10% adverse change $ (608) $ (602)
Although the Company takes steps to anticipate and minimize risks in general, unforeseen future events may have anegative impact on the Company's business, financial condition and results of operations.
Management's Discussion and Analysis
85

ACCOUNTING POLICIES
Management's Discussion and Analysis
86
SUMMARY OF CRITICAL ACCOUNTING ESTIMATESThe preparation of financial statements in accordance with IFRS requires management to make estimates, judgmentsand assumptions that affect the reported amounts of assets and liabilities, and disclosure of contingent assets andliabilities at the reporting date, and the reported amounts of revenue and expenses during the reporting period. Theresults of the Company reflect management's judgments regarding the impact of prevailing global credit, equity andforeign exchange market conditions. The estimation of insurance contract liabilities relies upon investment creditratings. The Company's practice is to use third-party independent credit ratings where available.
The significant accounting estimates include the following:
Fair Value MeasurementFinancial and other instruments held by the Company include portfolio investments, various derivative financialinstruments, debentures and other debt instruments.
Financial instrument carrying values reflect the liquidity of the markets and the liquidity premiums embedded in themarket pricing methods the Company relies upon.
The Company’s assets and liabilities recorded at fair value have been categorized based upon the following fair valuehierarchy:
Level 1 inputs utilize observable, quoted prices (unadjusted) in active markets for identical assets or liabilities that theCompany has the ability to access.
Level 2 inputs utilize other than quoted prices included in Level 1 that are observable for the asset or liability, eitherdirectly or indirectly. Level 3 inputs utilize one or more significant inputs that are not based on observable market inputs and include situationswhere there is little, if any, market activity for the asset or liability.
In certain cases, the inputs used to measure fair value may fall into different levels of the fair value hierarchy. In suchcases, the level in the fair value hierarchy within which the fair value measurement in its entirety falls has beendetermined based on the lowest level input that is significant to the fair value measurement in its entirety. The Company’sassessment of the significance of a particular input to the fair value measurement in its entirety requires judgment andconsiders factors specific to the asset or liability.
Refer to note 7 in the Company's December 31, 2016 annual consolidated financial statements for disclosure of theCompany's financial instruments fair value measurement at December 31, 2016.
Fair values for bonds classified as fair value through profit or loss or available-for-sale are determined using quotedmarket prices. Where prices are not quoted in a normally active market, fair values are determined by valuation modelsprimarily using observable market data inputs. Market values for bonds and mortgages classified as loans andreceivables are determined by discounting expected future cash flows using current market rates.
Fair values for public stocks are generally determined by the last bid price for the security from the exchange whereit is principally traded. Fair values for stocks for which there is no active market are determined by discounting expectedfuture cash flows based on expected dividends and where market value cannot be measured reliably, fair value isestimated to be equal to cost. Fair values for investment properties are determined using independent appraisalservices and include management adjustments for material changes in property cash flows, capital expenditures orgeneral market conditions in the interim period between appraisals.
Investment impairmentInvestments are reviewed regularly on an individual basis to determine impairment status. The Company considersvarious factors in the impairment evaluation process, including, but not limited to, the financial condition of the issuer,specific adverse conditions affecting an industry or region, decline in fair value not related to interest rates, bankruptcyor defaults and delinquency in payments of interest or principal. Investments are deemed to be impaired when thereis no longer reasonable assurance of timely collection of the full amount of the principal and interest due. The fairvalue of an investment is not a definitive indicator of impairment, as it may be significantly influenced by other factorsincluding the remaining term to maturity and liquidity of the asset, however, market price must be taken into considerationwhen evaluating impairment.
For impaired mortgages and bonds classified as loans and receivables, provisions are established or write-offs madeto adjust the carrying value to the net realizable amount. Wherever possible, the fair value of collateral underlying theloans or observable market price is used to establish the estimated realizable value. For impaired available-for-salebonds, recorded at fair value, the accumulated loss recorded in accumulated other comprehensive income (loss) isreclassified to net investment income. Impairments on available-for-sale debt instruments are reversed if there isobjective evidence that a permanent recovery has occurred. All gains and losses on bonds classified or designatedas fair value through profit or loss are already recorded in income; therefore, a reduction due to impairment of theseassets will be recorded in net investment income. As well, when determined to be impaired, interest is no longeraccrued and previous interest accruals are reversed.
Goodwill and intangibles impairment testingGoodwill and indefinite life intangible assets are tested for impairment annually or more frequently if events indicatethat impairment may have occurred. Intangible assets that were previously impaired are reviewed at each reportingdate for evidence of reversal. In the event that certain conditions have been met, the Company would be required toreverse the impairment charge or a portion thereof.
Goodwill and indefinite life intangible assets have been allocated to cash generating unit groupings, representing thelowest level that the assets are monitored for internal reporting purposes. Goodwill and indefinite life intangible assetsare tested for impairment by comparing the carrying value of each cash generating unit grouping containing the assetsto its recoverable amount. An impairment loss is recognized for the amount by which the asset's carrying amountexceeds its recoverable amount.
The recoverable amount is the higher of the asset's fair value less costs of disposal and value-in-use, which is calculatedusing the present value of estimated future cash flows expected to be generated.
Insurance and investment contract liabilitiesInsurance and investment contract liabilities represent the amounts required, in addition to future premiums andinvestment income, to provide for future benefit payments, policyholder dividends, commission and policy administrativeexpenses for all insurance and annuity policies in-force with the Company. The Appointed Actuaries of the Company'ssubsidiaries are responsible for determining the amount of the liabilities to make appropriate provisions for theCompany's obligations to policyholders. The Appointed Actuaries determine the liabilities for insurance contracts usinggenerally accepted actuarial practices, according to the standards established by the Canadian Institute of Actuaries.The valuation uses the Canadian Asset Liability Method (CALM). This method involves the projection of future eventsin order to determine the amount of assets that must be set aside currently to provide for all future obligations andinvolves a significant amount of judgment.
In the computation of insurance contract liabilities, valuation assumptions have been made regarding rates of mortality/morbidity, investment returns, levels of operating expenses, rates of policy termination and rates of utilization of electivepolicy options or provisions. The valuation assumptions use best estimates of future experience together with a marginfor adverse deviation. These margins are necessary to provide for possibilities of mis-estimation and/or futuredeterioration in the best-estimate assumptions and provide reasonable assurance that insurance contract liabilitiescover a range of possible outcomes. Margins are reviewed periodically for continued appropriateness.
Management's Discussion and Analysis
87

Investment contract liabilities are measured at fair value determined using discounted cash flows utilizing the yieldcurves of financial instruments with similar cash flow characteristics.
The methods for arriving at these valuation assumptions are outlined below:
Mortality – A life insurance mortality study is carried out annually for each major block of insurance business. Theresults of each study are used to update the Company’s experience valuation mortality tables for that business. Whenthere is insufficient data, use is made of the latest industry experience to derive an appropriate valuation mortalityassumption. Mortality improvement has been projected to occur for the next 25 years. In addition, appropriate provisionshave been made for future mortality deterioration on term insurance. A 2% increase in the best estimate assumptionwould cause a decrease in net earnings of approximately $281 million.
Annuitant mortality is also studied regularly and the results used to modify established industry experience annuitantmortality tables. Mortality improvement has been projected to occur throughout future years for annuitants. A 2%decrease in the best estimate assumption would cause a decrease in net earnings of approximately $384 million.
Morbidity – The Company uses industry developed experience tables modified to reflect emerging companyexperience. Both claim incidence and termination are monitored regularly and emerging experience is factored intothe current valuation. For products for which morbidity is a significant assumption, a 5% decrease in best estimatetermination assumptions for claim liabilities and a 5% increase in best-estimate incidence assumptions for active lifeliabilities would cause a decrease in net earnings of approximately $242 million.
Property and casualty reinsurance – Insurance contract liabilities for property and casualty reinsurance written byLRG are determined using accepted actuarial practices for property and casualty insurers in Canada. The insurancecontract liabilities are based on cession statements provided by ceding companies. In addition, insurance contractliabilities also include an amount for incurred but not reported losses, which may differ significantly from the ultimateloss development. The estimates and underlying methodology are continually reviewed and updated and adjustmentsto estimates are reflected in net earnings. LRG analyzes the emergence of claims experience against expectedassumptions for each reinsurance contract separately and at the portfolio level. If necessary, a more in depth analysisis undertaken of the cedant experience. Investment returns – The assets which correspond to the different liability categories are segmented. For eachsegment, projected cash flows from the current assets and liabilities are used in CALM to determine insurance contractliabilities. Cash flows from assets are reduced to provide for asset default losses. Testing under several interest ratescenarios (including increasing and decreasing rates) is done to provide for reinvestment risk. The total provision forinterest rates is sufficient to cover a broader or more severe set of risks than the minimum arising from the currentCanadian Institute of Actuaries' prescribed scenarios. Given the continuing low interest rates experienced over thepast several years, the Actuarial Standards Board has indicated a plan to revisit the reinvestment assumptions in 2017.While the magnitude of any potential changes is uncertain, the Company expects the change to be more modest thanthe changes included in the sensitivity disclosure that follows.
The range of interest rates covered by these provisions is set in consideration of long-term historical results and ismonitored quarterly with a full review annually. An immediate 1% parallel shift in the yield curve would not have amaterial impact on the Company’s view of the range of interest rates to be covered by the provisions. If sustained,however, the parallel shift could impact the Company’s range of scenarios covered.
Management's Discussion and Analysis
88
The total provision for interest rates also considers the impact of the Canadian Institute of Actuaries' prescribedscenarios.
• The effect of an immediate 1% parallel increase in the yield curve on the prescribed scenarios would not changethe total provision for interest rates.
• The effect of an immediate 1% parallel decrease in the yield curve on the prescribed scenarios would not changethe total provision for interest rates.
Another way of measuring the interest rate risk associated with this assumption is to determine the effect on theinsurance and investment contract liabilities impacting the shareholders' net earnings of the Company of a 1% changein the Company's view of the range of interest rates to be covered by these provisions.
• The effect of an immediate 1% increase in the low and high end of the range of interest rates recognized in theprovisions would be to decrease these insurance and investment contract liabilities by approximately $202 millioncausing an increase in net earnings of approximately $149 million.
• The effect of an immediate 1% decrease in the low and high end of the range of interest rates recognized in theprovisions would be to increase these insurance and investment contract liabilities by approximately $677 millioncausing a decrease in net earnings of approximately $491 million.
In addition to interest rates, the Company is also exposed to movements in equity markets.
Some insurance and investment contract liabilities are supported by investment properties, common stocks and privateequities; for example segregated fund products and products with long-tail cash flows. Generally, these liabilities willfluctuate in line with equity values. There will be additional impacts on these liabilities as equity values fluctuate.
• A 10% increase in equity values would be expected to additionally decrease non-participating insurance andinvestment contract liabilities by approximately $51 million, causing an increase in net earnings of approximately$43 million.
• A 10% decrease in equity values would be expected to additionally increase non-participating insurance andinvestment contract liabilities by approximately $61 million, causing a decrease in net earnings of approximately$50 million.
The best-estimate return assumptions for equities are primarily based on long-term historical averages. Changes inthe current market could result in changes to these assumptions and will impact both asset and liability cash flows.
• A 1% increase in the best estimate assumption would be expected to decrease non-participating insurance contractliabilities by approximately $504 million causing an increase in net earnings of approximately $407 million.
• A 1% decrease in the best estimate assumption would be expected to increase non-participating insurance contractliabilities by approximately $552 million causing a decrease in net earnings of approximately $438 million.
Expenses – Contractual policy expenses (e.g., sales commissions) and tax expenses are reflected on a best estimatebasis. Expense studies for indirect operating expenses are updated regularly to determine an appropriate estimateof future operating expenses for the liability type being valued. Improvements in unit operating expenses are notprojected. An inflation assumption is incorporated in the estimate of future operating expenses consistent with theinterest rate scenarios projected under CALM as inflation is assumed to be correlated with new money interest rates.A 5% increase in the best estimate maintenance unit expense assumption would cause a decrease in net earnings ofapproximately $117 million.
Management's Discussion and Analysis
89

Policy termination – Studies to determine rates of policy termination are updated regularly to form the basis of thisestimate. Industry data is also available and is useful where the Company has no experience with specific types ofpolicies or its exposure is limited. The Company has significant exposures in respect of the T-100 and Level Cost ofInsurance Universal Life products in Canada and policy renewal rates at the end of the term for renewable term policiesin Canada and Reinsurance. Industry experience has guided the Company's assumptions for these products as itsown experience is very limited. A 10% adverse change in the best-estimate policy termination and renewal assumptionswould cause a decrease in net earnings of approximately $608 million.
Utilization of elective policy options – There are a wide range of elective options embedded in the policies issuedby the Company. Examples include term renewals, conversion to whole life insurance (term insurance), settlementannuity purchase at guaranteed rates (deposit annuities) and guarantee re-sets (segregated fund maturity guarantees).The assumed rates of utilization are based on company or industry experience when it exists and when not on judgmentconsidering incentives to utilize the option. Generally, whenever it is clearly in the best interests of an informedpolicyholder to utilize an option, then it is assumed to be elected.
Policyholder dividends and adjustable policy features – Future policyholder dividends and other adjustable policyfeatures are included in the determination of insurance contract liabilities with the assumption that policyholder dividendsor adjustable benefits will change in the future in response to the relevant experience. The dividend and policyadjustments are determined consistent with policyholders’ reasonable expectations, such expectations being influencedby the participating policyholder dividend policies and/or policyholder communications, marketing material and pastpractice. It is the Company's expectation that changes will occur in policyholder dividend scales or adjustable benefitsfor participating or adjustable business respectively, corresponding to changes in the best estimate assumptions,resulting in an immaterial net change in insurance contract liabilities. Where underlying guarantees may limit the abilityto pass all of this experience back to the policyholder, the impact of this non-adjustability impacting shareholders' netearnings is reflected in the impacts of changes in best estimate assumptions above.
Income taxes – The Company is subject to income tax laws in various jurisdictions. The Company’s operations arecomplex and related income tax interpretations, regulations and legislation that pertain to its activities are subject tocontinual change. As multinational life insurance companies, the Company's primary Canadian operating subsidiariesare subject to a regime of specialized rules prescribed under the Income Tax Act (Canada) for purposes of determiningthe amount of the Companies' income that will be subject to tax in Canada.
The Company utilizes tax planning strategies involving multiple jurisdictions to obtain tax efficiencies. The Companycontinually assesses the uncertainty associated with these strategies and holds an appropriate level of provisions foruncertain income tax positions. Accordingly, the provision for income taxes represents management’s interpretationof the relevant income tax laws and its estimate of current and deferred income tax implications of the transactionsand events during the period. Deferred income tax assets and liabilities are recorded based on expected future incometax rates and management’s assumptions regarding the expected timing of the reversal of temporary differences. TheCompany has substantial deferred income tax assets. The recognition of deferred income tax assets depends onmanagement's assumption that future earnings will be sufficient to realize the deferred benefit. The amount of theasset recorded is based on management's best estimate of the timing of the reversal of the asset. The audit and review activities of the Canada Revenue Agency and other jurisdictions’ tax authorities affect the ultimatedetermination of the amounts of income taxes payable or receivable, deferred income tax assets or liabilities andincome tax expense. Therefore, there can be no assurance that income taxes will be payable as anticipated and/orthe amount and timing of receipt or use of the income tax related assets will be as currently expected. Management’sexperience indicates the taxation authorities are more aggressively pursuing perceived income tax issues and haveincreased the resources they put to these efforts.
Management's Discussion and Analysis
90

Employee future benefits – The Company’s subsidiaries maintain contributory and non-contributory defined benefitand defined contribution pension plans for certain employees and advisors. The defined benefit pension plans providepensions based on length of service and final average pay. For most plans, active plan participants share in the costof benefits through employee contributions in respect of current service. Certain pension payments are indexed oneither an ad hoc basis or a guaranteed basis. The determination of the defined benefit obligation reflects pensionbenefits in accordance with the terms of the plans. The assets supporting the funded pension plans are held in separatetrusteed pension funds. The obligations for the wholly unfunded plans are included in other liabilities and are supportedby general assets. The significant defined benefit plans of the Company's subsidiaries are closed to new entrants. Allnew hires are eligible only for defined contribution benefits. The Company’s defined benefit plan exposure will continueto be reduced in future years. The defined contribution pension plans provide pension benefits based on accumulatedemployee and subsidiary Company contributions. The Company’s subsidiaries also provide post-employment health,dental and life insurance benefits to eligible employees, advisors and their dependants. These plans are also closedto new entrants. For further information on the Company’s pension plans and other post-employment benefits referto note 23 in the Company's December 31, 2016 annual consolidated financial statements.
For the defined benefit plans of the Company's subsidiaries, service costs and net interest costs are recognized in theConsolidated Statements of Earnings. Service costs include current service cost, administration expenses, past servicecosts and the impact of curtailments and settlements. Re-measurements of the defined benefit liability (asset) due toasset returns less (greater) than interest income, actuarial losses (gains) and changes in the asset ceiling are recognizedimmediately in the Consolidated Statements of Comprehensive Income.
Accounting for defined benefit pension and other post-employment benefits requires estimates of expected increasesin compensation levels, indexation of certain pension payments, trends in health-care costs, the period of time overwhich benefits will be paid, as well as the appropriate discount rates for past and future service liabilities. Theseassumptions are determined by management using actuarial methods, and are reviewed and approved annually.Emerging experience that differs from the assumptions will be revealed in future valuations and will affect the futurefinancial position of the plans and net periodic benefit costs.
Actuarial assumptions - employee future benefitsAt December 31
Defined benefitpension plans
Other post-employmentbenefits
2016 2015 2016 2015Actuarial assumptions used to determine benefit cost
Discount rate - past service liabilities 3.8 % 3.5 % 4.1 % 3.9%Discount rate - future service liabilities 3.8 % 3.6 % 4.5 % 4.0%Rate of compensation increase 3.2 % 3.2 % — —Future pension increases(1) 1.5 % 1.1 % — —
Actuarial assumptions used to determine defined benefitobligation
Discount rate - past service liabilities 3.3 % 3.8 % 3.8 % 4.1%Rate of compensation increase 3.2 % 3.2 % — —Future pension increases(1) 1.1 % 1.5 % — —
Medical cost trend rates:Initial medical cost trend rate 5.1 % 5.2%Ultimate medical cost trend rate 4.5 % 4.5%Year ultimate trend rate is reached 2029 2029
(1) Represents the weighted average of plans subject to future pension increases.
Management's Discussion and Analysis
91

Actuarial assumptions – The period of time over which benefits are assumed to be paid is based on best estimatesof future mortality, including allowances for mortality improvements. This estimate is subject to considerable uncertainty,and judgment is required in establishing this assumption. As mortality assumptions are significant in measuring thedefined benefit obligation, the mortality assumptions applied by the Company take into consideration such factors asage, gender and geographic location, in addition to an estimation of future improvements in longevity.
The mortality tables are reviewed at least annually, and assumptions are in accordance with accepted actuarial practices.Emerging plan experience is reviewed and considered in establishing the best estimate for future mortality.
As these assumptions relate to factors that are long-term in nature, they are subject to a degree of uncertainty.Differences between actual experience and the assumptions, as well as changes in the assumptions resulting fromchanges in future expectations, result in increases or decreases in the pension and post-employment benefits expenseand defined benefit obligation in future years. There is no assurance that the plans will be able to earn assumed ratesof return, and market driven changes to assumptions could impact future contributions and expenses.
The following table indicates the impact of changes to certain key assumptions related to pension and post-employmentbenefits.
Impact of a change of 1.0% in actuarial assumptionson defined benefit obligation
1% increase 1% decrease2016 2015 2016 2015
Defined benefit pension plans:Impact of a change to the discount rate $ (1,138) $ (1,026) $ 1,458 $ 1,353Impact of a change to the rate of compensation increase 303 314 (264) (272)Impact of a change to the rate of inflation 550 551 (498) (536)
Other post-employment benefits:Impact of a change to assumed medical cost trend rates 33 34 (28) (28)Impact of a change to the discount rate (46) (44) 56 54
To measure the impact of a change in an assumption, all other assumptions were held constant. It is expected that there would be interactionbetween at least some of the assumptions.
Funding – The Company’s subsidiaries have both funded and unfunded pension plans as well as other post-employment benefit plans that are unfunded. The Company’s subsidiaries' funded pension plans are funded to orabove the amounts required by relevant legislation. During the year, the Company's subsidiaries contributed $190million ($158 million in 2015) to the pension plans and made benefit payments of $19 million ($19 million in 2015) forpost-employment benefits. The Company's subsidiaries expect to contribute $254 million to the benefit pension plansand make benefit payments of $19 million for post-employment benefits in 2017.
Management's Discussion and Analysis
92
INTERNATIONAL FINANCIAL REPORTING STANDARDS Due to the evolving nature of International Financial Reporting Standards (IFRS), there are a number of IFRS changesthat impacted the Company in 2016, as well as standards that could impact the Company in future reporting periods.The Company actively monitors future IFRS changes proposed by the International Accounting Standards Board (IASB)to assess if the changes to the standards may have an impact on the Company's results or operations.
The Company adopted the narrow scope amendments to IFRS for IFRS 11 Joint Arrangements, IAS 16 Property, Plantand Equipment, IAS 38 Intangible Assets, IAS 1 Presentation of Financial Statements, IFRS 10 Consolidated FinancialStatements, IFRS 12 Disclosure of Interests in Other Entities, IAS 28 Investments in Associates and Joint Venturesand Annual Improvements 2012 - 2014 Cycle effective January 1, 2016. The adoption of these narrow scopeamendments did not have a significant impact on the Company’s financial statements.

IFRS that have changed or may change subsequent to 2016 and could impact the Company in future reporting periods,are set out in the following table:
New Standard Summary of Future ChangesIFRS 17 - InsuranceContracts (exposure draft)
In June 2013, the IASB issued a revised IFRS 4, Insurance Contracts exposure draftproposing changes to the accounting for insurance contracts. The intent of therevised standard is to eliminate inconsistencies by providing a single principle basedframework to account for all types of insurance contracts, including reinsurance.The new standard will also provide requirements for presentation and disclosureitems to enhance comparability between entities. IFRS 17, Insurance Contracts willreplace IFRS 4, Insurance Contracts in its entirety and is expected to be issued inthe first half of 2017 with a proposed effective date of January 1, 2021. During 2016, at the request of the IASB, the Company participated in additional fieldtesting of the exposure draft to address potential interpretation and operationalchallenges; the proposed standard differs significantly from the Company’s currentaccounting and actuarial practices under the Canadian Asset Liability Method(CALM). The Company is actively monitoring developments in this area and willcontinue to measure insurance contract liabilities under current accounting andactuarial policies, including CALM, until IFRS for insurance contract measurementis issued and effective.
IFRS 4 - InsuranceContracts
In September 2016, the IASB issued an amendment to IFRS 4, Insurance Contracts(IFRS 4). The amendment "Applying IFRS 9, Financial Instruments with IFRS 4,Insurance Contracts" provides qualifying insurance companies with two options toaddress the potential volatility associated with implementing the IFRS 9, FinancialInstruments (IFRS 9) standard before the new proposed insurance contract standardis effective. The two options are as follows:
• Deferral Approach - provides the option to defer implementation of IFRS 9until the year 2021 or the effective date of the new insurance contractstandard, whichever is earlier, or
• Overlay Approach - provides the option to recognize the volatility that couldarise when IFRS 9 is applied within other comprehensive income, ratherthan profit or loss.
The Company qualifies for the amendment and will be applying the deferral approachto allow adoption of both IFRS 9 and the new insurance contract standardsimultaneously on January 1, 2021.
IFRS 9 - FinancialInstruments
In July 2014, the IASB issued a final version of IFRS 9, Financial Instruments toreplace IAS 39, Financial Instruments: Recognition and Measurement. The standardprovides changes to financial instruments accounting for the following:
• classification and measurement of financial instruments based on a businessmodel approach for managing financial assets and the contractual cash flowcharacteristics of the financial asset;
• impairment based on an expected loss model; and • hedge accounting that incorporates the risk management practices of an
entity.Due to applying the deferral method as noted above, the standard will be effectivefor the Company on January 1, 2021.
Management's Discussion and Analysis
93

New Standard Summary of Future ChangesIFRS 15 - Revenuefrom Contracts withCustomers
In May 2014, the IASB issued IFRS 15, Revenue from Contracts with Customers,which provides a single revenue recognition standard to align the financial reportingof revenue from contracts with customers and related costs. The revenue arisingfrom insurance contracts, leases and financial instruments is not required to applythe revenue recognition requirements in IFRS 15. A company would recognizerevenue when it transfers goods or services to a customer in the amount ofconsideration the company expects to receive from the customer.In September 2015, the IASB issued an amendment to IFRS 15 providing a deferralof one year of the effective date of the standard, from January 1, 2017 to January1, 2018.In April 2016, an additional amendment to IFRS 15 was issued clarifyingrequirements of the standard and providing additional transitional relief forcompanies implementing the standard.The Company is evaluating the impact of the adoption of this standard. The Companydoes not anticipate a significant impact for the adoption of this standard; however,it is not possible as yet to provide a reliable estimate of the impact on the Company'sfinancial statements.
IFRS 16 - Leases In January 2016, the IASB issued IFRS 16, Leases, which introduces new guidancefor identifying leases as well as a new right-of-use accounting model for lessees,replacing the operating and finance lease accounting models that currently exist.The new accounting model will generally require all lessees to recognize leaseassets and liabilities on the balance sheet, initially measured at the present valueof unavoidable lease payments for all leases with a maximum possible term of morethan 12 months.In contrast to the significant changes for lessees, the new standard will retain manykey aspects of the current lessor accounting model.The standard is effective January 1, 2019. The Company is evaluating the impactof the adoption of this standard, however it is not yet possible to provide a reliableestimate of the impact on the Company's financial statements.
IAS 40 - InvestmentProperty
In December 2016, the IASB issued an amendment to IAS 40, Investment Propertyto clarify the requirements on transfers to, or from, investment property.The amendment is effective January 1, 2018. The Company is evaluating the impactof the adoption of this standard.
IFRS 2 - Share-basedPayment
In June 2016, the IASB issued narrow scope amendments to IFRS 2, Share-basedPayments clarifying how to account for certain types of share-based paymenttransactions.The amendment is effective January 1, 2018. The Company is evaluating the impactof the adoption of this amendment.
IFRIC 22 - ForeignCurrency Transactionsand AdvanceConsideration
In December 2016, the IASB issued IFRIC Interpretation 22, Foreign CurrencyTransactions and Advance Consideration that provides requirements about whichexchange rate to use in reporting foreign currency transactions when payment ismade or received in advance.The interpretation is effective January 1, 2018. The Company is evaluating theimpact of the adoption of this interpretation.
Management's Discussion and Analysis
94

New Standard Summary of ChangesAnnual Improvements2014 - 2016 Cycle
In December 2016, the IASB issued Annual Improvements 2014 - 2016 Cycle aspart of its ongoing process to efficiently deal with non-urgent narrow scopeamendments to IFRS. Three amendments were included in this issue relating toIFRS 12, Disclosure of Interests in Other Entities, IFRS 1, First-time Adoption ofInternational Financial Reporting Standards and IAS 28, Investments in Associatesand Joint Ventures.
The amendments to IFRS 12 are effective January 1, 2017, while the amendmentsto IFRS 1 and IAS 28 are effective January 1, 2018. Adoption of these amendmentswill not have an impact on the Company's consolidated financial statements.
IAS 7 - Statement ofCash Flows
In January 2016, the IASB issued an amendment to IAS 7, Statement of Cash Flowsthat requires additional disclosures to enable users of the financial statements toevaluate changes in liabilities arising from financing activities.
The amendment is effective January 1, 2017. Adoption of this amendment will nothave a significant impact on the Company's consolidated financial statements.
IAS 12 - Income Taxes In January 2016, the IASB issued an amendment to IAS 12, Income Taxes thatclarifies the accounting for deferred tax assets for unrealized losses on debtinstruments measured at fair value.
The amendment is effective January 1, 2017. Adoption of this amendment will nothave an impact on the Company's consolidated financial statements.
Management's Discussion and Analysis
95

OTHER INFORMATION
Management's Discussion and Analysis
96
SELECTED ANNUAL INFORMATION(in $ millions, except per share amounts) Years ended December 31
2016 2015 2014Total revenue $ 46,381 $ 33,820 $ 39,181
Net earnings - common shareholdersNet earnings 2,641 2,762 2,546
Net earnings per common shareBasic 2.668 2.774 2.549Diluted 2.663 2.768 2.546
Total assetsTotal assets $ 399,912 $ 399,935 $ 356,709Proprietary mutual funds and institutional net assets 259,215 252,480 216,271Total assets under management 659,127 652,415 572,980Other assets under administration 589,291 560,102 490,353Total assets under administration $ 1,248,418 $ 1,212,517 $ 1,063,333
Total liabilities $ 374,904 $ 374,675 $ 334,812
Dividends paid per shareSeries F First Preferred 1.4750 1.4750 1.4750Series G First Preferred 1.3000 1.3000 1.3000Series H First Preferred 1.21252 1.21252 1.21252Series I First Preferred 1.1250 1.1250 1.1250Series L First Preferred 1.41250 1.41250 1.41250Series M First Preferred 1.450 1.450 1.450Series N First Preferred 0.544000 0.912500 0.912500Series O First Preferred(1) 0.449219 — —Series P First Preferred 1.350 1.350 1.350Series Q First Preferred 1.2875 1.2875 1.2875Series R First Preferred 1.200 1.200 1.200Series S First Preferred(2) 1.312500 1.312500 0.799185Common 1.384 1.304 1.230
(1) The Series O First Preferred Shares were issued on December 31, 2015.(2) The Series S First Preferred Shares were issued on May 22, 2014. The first dividend payment was made on September 30, 2014 in the amount
of $0.47106 per share. Regular quarterly dividends are $0.328125 per share.
QUARTERLY FINANCIAL INFORMATION
Quarterly financial information(in $ millions, except per share amounts)
2016 2015Q4(2) Q3 Q2 Q1 Q4 Q3 Q2 Q1
Total revenue(1) $ 7,678 $ 13,408 $ 12,807 $ 12,352 $ 8,321 $ 8,596 $ 4,224 $ 12,679
Common shareholdersNet earnings
Total(2) 676 674 671 620 683 720 659 700Basic - per share(2) 0.686 0.682 0.675 0.625 0.688 0.724 0.661 0.702Diluted - per share(2) 0.685 0.681 0.674 0.623 0.686 0.722 0.659 0.700
(1) Revenue includes the changes in fair value through profit or loss on investment assets.(2) Net earnings for the fourth quarter of 2016 include restructuring costs relating to a realignment of the Asset Management business unit.
Excluding the impact of these restructuring costs, net earnings for the fourth quarter of 2016 were $696 million or $0.707 per common share($0.706 diluted).
Lifeco's consolidated net earnings attributable to common shareholders were $676 million for the fourth quarter of2016 compared to $683 million reported a year ago. On a per share basis, this represents $0.686 per common share($0.685 diluted) for the fourth quarter of 2016 compared to $0.688 per common share ($0.686 diluted) a year ago.
Total revenue for the fourth quarter of 2016 was $7,678 million and comprises premium income of $8,905 million,regular net investment income of $1,507 million, a negative change in fair value through profit or loss on investmentassets of $3,943 million and fee and other income of $1,345 million.
Management's Discussion and Analysis
97
DISCLOSURE CONTROLS AND PROCEDURES The Company’s disclosure controls and procedures are designed to provide reasonable assurance that informationrelating to the Company which is required to be disclosed in reports filed under provincial and territorial securitieslegislation is: (a) recorded, processed, summarized and reported within the time periods specified in the provincial andterritorial securities legislation, and (b) accumulated and communicated to the Company's senior management,including the President and Chief Executive Officer and the Executive Vice-President and Chief Financial Officer, asappropriate, to allow timely decisions regarding required disclosure. Management evaluated the effectiveness of theCompany's disclosure controls and procedures as at December 31, 2016 and, based on such evaluation, the Presidentand Chief Executive Officer and the Executive Vice-President and Chief Financial Officer have concluded that theCompany's disclosure controls and procedures are effective.
INTERNAL CONTROL OVER FINANCIAL REPORTINGThe Company’s internal control over financial reporting is designed to provide reasonable assurance regarding thereliability of financial reporting and the preparation of financial statements for external purposes in accordance withIFRS. The Company’s management is responsible for establishing and maintaining effective internal control overfinancial reporting. All internal control systems have inherent limitations and may become ineffective because ofchanges in conditions. Therefore, even those systems determined to be effective can provide only reasonableassurance with respect to financial statement preparation and presentation.
The Company's management, under the supervision of the President and Chief Executive Officer and the ExecutiveVice-President and Chief Financial Officer, has evaluated the effectiveness of the Company's internal control overfinancial reporting based on the 2013 Internal Control - Integrated Framework (COSO Framework) published by theCommittee of Sponsoring Organizations of the Treadway Commission. The Company’s management adopted therevised 2013 COSO Framework in 2015 as the basis to evaluate the effectiveness of the Lifeco’s internal control overfinancial reporting.
Management evaluated the effectiveness of the Company’s internal control over financial reporting as at December 31,2016 and, based on such evaluation, the President and Chief Executive Officer and the Executive Vice-President andChief Financial Officer have concluded that the Company’s internal control over financial reporting is effective and thatthere are no material weaknesses in the Company’s internal control over financial reporting.
Management's Discussion and Analysis
98
TRANSACTIONS WITH RELATED PARTIES In the normal course of business, Great-West Life and Putnam enter into various transactions with related companies,which include providing insurance benefits and sub-advisory services to other companies within the Power FinancialCorporation, Lifeco’s parent, group of companies. In all cases, transactions were at market terms and conditions.
During the year, Great-West Life provided to and received from IGM Financial Inc. and its subsidiaries (IGM), a memberof the Power Financial Corporation group of companies, certain administrative services. Great-West Life also providedlife insurance, annuity and disability insurance products under a distribution agreement with IGM. London Life provideddistribution services to IGM.
Segregated funds of the Company were invested in funds managed by Investors Group and Mackenzie Investments.The Company also has interests in mutual funds, open-ended investment companies and unit trusts. Some of thesefunds are managed by related parties of the Company and the Company receives management fees related to theseservices.
At December 31, 2016 the Company held $42 million ($43 million in 2015) of debentures issued by IGM.
During the normal course of business in 2016, the Company purchased residential mortgages of $184 million fromIGM ($206 million in 2015).
In October 2016, the Company made an investment in Portag3 Ventures which invests in the FinTech sector. Theinvestment is a corporate partnership with Power Financial Corporation and IGM.
The Company provides asset management and administrative services for employee benefit plans relating to pensionand other post-employment benefits for employees of the Company and its subsidiaries.
As at December 31, 2016 and December 31, 2015, there were no significant outstanding loans or guarantees and noloans or guarantees issued during 2016 or 2015 with related parties. There were no provisions for uncollectible amountsfrom related parties during 2016 or 2015.

TRANSLATION OF FOREIGN CURRENCYThrough its operating subsidiaries, Lifeco conducts business in multiple currencies. The four primary currencies arethe Canadian dollar, the U.S. dollar, the British pound and the euro. Throughout this document, foreign currency assetsand liabilities are translated into Canadian dollars at the market rate at the end of the reporting period. All income andexpense items are translated at an average rate for the period. The rates employed are:
Translation of foreign currencyPeriod ended Dec. 31
2016Sept. 30
2016June 30
2016Mar. 31
2016Dec. 31
2015Sept. 30
2015June 30
2015Mar. 31
2015United States dollarBalance sheet $ 1.34 $ 1.31 $ 1.30 $ 1.30 $ 1.38 $ 1.34 $ 1.25 $ 1.27Income and expenses $ 1.33 $ 1.31 $ 1.29 $ 1.37 $ 1.34 $ 1.31 $ 1.23 $ 1.24
British poundBalance sheet $ 1.66 $ 1.71 $ 1.72 $ 1.87 $ 2.04 $ 2.02 $ 1.96 $ 1.88Income and expenses $ 1.66 $ 1.71 $ 1.85 $ 1.96 $ 2.03 $ 2.03 $ 1.89 $ 1.88
EuroBalance sheet $ 1.42 $ 1.47 $ 1.44 $ 1.48 $ 1.50 $ 1.50 $ 1.39 $ 1.36Income and expenses $ 1.44 $ 1.46 $ 1.46 $ 1.51 $ 1.46 $ 1.46 $ 1.36 $ 1.40
Management's Discussion and Analysis
99
Additional information relating to Lifeco, including Lifeco's most recent consolidated financial statements, CEO/CFOcertification and Annual Information Form are available at www.sedar.com.