MANAGEMENT'S DISCUSSION AND ANALYSIS · 2019-05-14 · MANAGEMENT'S DISCUSSION AND ANALYSIS ......
27
1 MANAGEMENT'S DISCUSSION AND ANALYSIS This following Management's Discussion and Analysis provides a review of the financial condition and results of operations for CannTrust Holdings Inc. (the "Company" or “CannTrust”) for the three months ended March 31, 2019 (the "MD&A"). This MD&A should be read in conjunction with the Company's unaudited condensed interim consolidated financial statements and notes thereto (“Financial Statements”) for the three months ended March 31, 2019. The financial information presented in this MD&A is derived from the Financial Statements. This MD&A contains “forward-looking information” within the meaning of Canadian securities laws and “forward-looking statements” within the meaning of the United States Private Securities Litigation Reform Act of 1995 and other applicable United States safe harbors. All such forward-looking information and statements are made and disclosed in reliance upon the safe harbor provisions of applicable Canadian and United States securities laws. Forward-looking information and statements include all information and statements regarding the Company’s intentions, plans, expectations, beliefs, objectives, future performance, and strategy, as well as any other information or statements that relate to future events or circumstances and which do not directly and exclusively relate to historical facts. Forward-looking information and statements often but not always use words such as “believe”, “estimate”, “expect”, “intend”, “anticipate”, “foresee”, “plan”, “predict”, “project”, “aim”, “seek”, “strive”, “potential”, “continue”, “target”, “may”, “might”, “could”, “should”, and similar expressions and variations thereof. These information and statements are based on our perception of historic trends, current conditions and expected future developments, as well as other assumptions, both general and specific, that we believe are appropriate in the circumstances. Such information and statements are, however, by their very nature, subject to inherent risks and uncertainties, of which many are beyond the control of the Company, and which give rise to the possibility that actual results could differ materially from our expectations expressed in, or implied by, such forward-looking information or forward-looking statements. These risks and uncertainties include risks identified or incorporated by reference in this MD&A and in other documents that we make public, including our filings with the Canadian Securities Administrators (on SEDAR at www.sedar.com) and the U.S. Securities and Exchange Commission (on EDGAR at www.sec.gov). Unless otherwise stated, the forward-looking information and statements contained in this MD&A are made as of the date hereof and the Company disclaims any intention or obligation to publicly update or revise any forward-looking information or forward-looking statements, whether as a result of new information, future events or otherwise, except as required by applicable law. While we believe that our assumptions on which these forward-looking information and forward-looking statements are based were reasonable as at the date of this MD&A, readers are cautioned not to place undue reliance on these forward-looking information or statements. Furthermore, readers are reminded that forward-looking information and statements are presented for the sole purpose of assisting investors and others in understanding our objectives, strategic priorities and business outlook as well as our anticipated operating environment. Readers are cautioned that such information may not be appropriate for other purposes. In this document and in the Company’s consolidated financial statements unless otherwise noted, all financial data is prepared in accordance with International Financial Reporting Standards (“IFRS”). All amounts, unless specifically identified as otherwise, both in the Financial Statements and MD&A, are expressed in Canadian dollars. This MD&A refers to certain non-IFRS financial measures. These measures are not recognized measures under IFRS, do not have a standardized meaning prescribed by IFRS and are, therefore, unlikely to be comparable to similar measures presented by other companies. Rather, these measures are provided as additional information to complement IFRS measures by providing further understanding of the Company's results of operations from management's perspective. Accordingly, they should not be considered in isolation nor as a substitute for analysis of financial information reported under IFRS. The Company uses
Transcript of MANAGEMENT'S DISCUSSION AND ANALYSIS · 2019-05-14 · MANAGEMENT'S DISCUSSION AND ANALYSIS ......

1
MANAGEMENT'S DISCUSSION AND ANALYSIS
This following Management's Discussion and Analysis provides a review of the financial condition and
results of operations for CannTrust Holdings Inc. (the "Company" or “CannTrust”) for the three months
ended March 31, 2019 (the "MD&A"). This MD&A should be read in conjunction with the Company's
unaudited condensed interim consolidated financial statements and notes thereto (“Financial Statements”)
for the three months ended March 31, 2019. The financial information presented in this MD&A is derived
from the Financial Statements. This MD&A contains “forward-looking information” within the meaning
of Canadian securities laws and “forward-looking statements” within the meaning of the United States
Private Securities Litigation Reform Act of 1995 and other applicable United States safe harbors. All such
forward-looking information and statements are made and disclosed in reliance upon the safe harbor
provisions of applicable Canadian and United States securities laws. Forward-looking information and
statements include all information and statements regarding the Company’s intentions, plans, expectations,
beliefs, objectives, future performance, and strategy, as well as any other information or statements that
relate to future events or circumstances and which do not directly and exclusively relate to historical facts.
Forward-looking information and statements often but not always use words such as “believe”, “estimate”,
“expect”, “intend”, “anticipate”, “foresee”, “plan”, “predict”, “project”, “aim”, “seek”, “strive”,
“potential”, “continue”, “target”, “may”, “might”, “could”, “should”, and similar expressions and
variations thereof. These information and statements are based on our perception of historic trends, current
conditions and expected future developments, as well as other assumptions, both general and specific, that
we believe are appropriate in the circumstances. Such information and statements are, however, by their
very nature, subject to inherent risks and uncertainties, of which many are beyond the control of the
Company, and which give rise to the possibility that actual results could differ materially from our
expectations expressed in, or implied by, such forward-looking information or forward-looking statements.
These risks and uncertainties include risks identified or incorporated by reference in this MD&A and in
other documents that we make public, including our filings with the Canadian Securities Administrators
(on SEDAR at www.sedar.com) and the U.S. Securities and Exchange Commission (on EDGAR at
www.sec.gov). Unless otherwise stated, the forward-looking information and statements contained in this
MD&A are made as of the date hereof and the Company disclaims any intention or obligation to publicly
update or revise any forward-looking information or forward-looking statements, whether as a result of
new information, future events or otherwise, except as required by applicable law. While we believe that
our assumptions on which these forward-looking information and forward-looking statements are based
were reasonable as at the date of this MD&A, readers are cautioned not to place undue reliance on these
forward-looking information or statements. Furthermore, readers are reminded that forward-looking
information and statements are presented for the sole purpose of assisting investors and others in
understanding our objectives, strategic priorities and business outlook as well as our anticipated operating
environment. Readers are cautioned that such information may not be appropriate for other purposes.
In this document and in the Company’s consolidated financial statements unless otherwise noted, all
financial data is prepared in accordance with International Financial Reporting Standards (“IFRS”). All
amounts, unless specifically identified as otherwise, both in the Financial Statements and MD&A, are
expressed in Canadian dollars.
This MD&A refers to certain non-IFRS financial measures. These measures are not recognized measures
under IFRS, do not have a standardized meaning prescribed by IFRS and are, therefore, unlikely to be
comparable to similar measures presented by other companies. Rather, these measures are provided as
additional information to complement IFRS measures by providing further understanding of the Company's
results of operations from management's perspective. Accordingly, they should not be considered in
isolation nor as a substitute for analysis of financial information reported under IFRS. The Company uses
2
Adjusted EBITDA, a non-IFRS financial measure, as a supplemental measure of operating performance
which highlight trends in its core business that may not otherwise be apparent when relying solely on IFRS
financial measures. The Company believes that securities analysts, investors and other interested parties
frequently use non-IFRS financial measures in the evaluation of issuers. The Company’s management also
uses this non-IFRS financial measure to facilitate operating performance comparisons from period to
period, prepare annual operating budgets and to assess the Company’s ability to meet capital expenditure
and working capital requirements. See "Selected Information" and "Non-IFRS Financial Measure
Reconciliation in this MD&A".
The discussion and analysis in this MD&A is based on information available to management as of May 13,
2019.
3
Overview
The Company is a publicly traded corporation incorporated in Canada with its head office located at 3280
Langstaff Road, Vaughan, Ontario L4K4Z8. The Company’s common shares are traded on the Toronto
Stock Exchange (the “TSX”) under the trading symbol “TRST”. As of February 25, 2019, the Company’s
common shares commenced trading on the New York Stock Exchange (the “NYSE”) under the trading
symbol “CTST”. The Company is the parent company of CannTrust Inc., Elmcliffe Investments Inc.
("Elmcliffe"), Elmcliffe Investments [No. 2] Inc. and CTI Holdings Inc. The Company holds 50% of the
outstanding shares of Cannabis Coffee & Tea Pod Company Ltd, 50% of the outstanding shares of Greytrust
Inc. (“Greytrust”), 50% of the outstanding shares of O Cannabis We Stand On Guard For Thee Corporation,
19% of the outstanding shares of Stenocare A/S (“Stenocare”) and 19.8% of the outstanding shares in
Cannatrek Ltd (“Cannatrek”) (see Business Developments section).
CannTrust is a Licensed Producer and distributor of medical and recreational cannabis pursuant to the
provisions of the Cannabis Act (Canada) (the “Cannabis Act”) and its regulations which came into force
on October 17, 2018. The Company's primary focus is to produce and deliver the highest quality,
standardized, cannabis products, strengthen its market share in legal cannabis markets in Canada, and
expand its business in legal cannabis markets internationally.
CannTrust received its license from Health Canada in June 2014, and began production of medical cannabis
at its hydroponic indoor facility in Vaughan, Ontario (the “Vaughan Facility”). In 2018, the Company
repurposed the Vaughan Facility from a grow facility into a state-of-the-art extraction, manufacturing and
packaging facility of approximately 60,000 square feet, including an in-house quality control laboratory.
The Company owns and operates an approximately 450,000 square foot perpetual harvest facility in the
Niagara region (the “Perpetual Harvest Facility”), which is expected to have an annual capacity of
approximately 50,000 kilograms. The planned Phase 3 expansion is expected to increase the annual capacity
of the Perpetual Harvest Facility to 100,000 kilograms upon its completion.
Canadian Medical Operations
Executing on a patient-focused business model, the Company’s medical cannabis operations currently have
over 2,500 active physicians prescribing its products and currently more than 70,000 Canadian patients.
The Company’s medical cannabis operations are supported by its award-winning patient care center which
on-boards, advises and assists patients with renewals and recurring orders through the Company’s e-
commerce platform. The Company’s patient base grew by 17% during the three months ended March 31,
2019, from approximately 58,000 as at December 31, 2018, to 68,000 as at March 31, 2019. With the
implementation of the federal government’s excise tax on medical cannabis on October 17, 2018, the
Company made the decision to absorb the excise tax, so that the price of medical cannabis offered by
CannTrust for its patients would not be affected. To serve the needs of patients, the Company provides
same day delivery, patient assistance programs and telemedicine services.
As part of the Company’s commitment to contribute to the growing body of evidence-based research
regarding the use and efficacy of medical cannabis, the Company participates in, and offers support to,
clinical trials with leading research universities worldwide. Current activities include a partnership with the
Gold Coast University Hospital in Queensland, Australia This trial is exploring the effects of cannabidiol
(“CBD”) oil, using CannTrust’s proprietary strain of CBD-dominant Cannatonic, in slowing the
progression of Amyotrophic Lateral Sclerosis (ALS) and Motor Neuron Disease (MND). The trial will also
assess the safety and tolerability of CannTrust’s cannabis oil capsules and potential for improvement of
patients’ quality of life. In addition, a first of its kind trial is in process with Hamilton McMaster University
in Ontario, to explore the impact of cannabis oil capsules, including CBD and 1:1 CBD:THC, in treating
chronic pain.
4
Canadian Adult-Use Recreational Operation
In 2018, recreational adult use cannabis was legalized in Canada. On June 21, 2018, the Government of
Canada announced that Bill C-45 received Royal Assent. The Cannabis Act and the regulations thereunder,
(the "Cannabis Regulations") came into force on October 17, 2018, thereby legalizing the sale of cannabis
for adult recreational use, and replacing the Access to Cannabis for Medical Purposes Regulations
(ACMPR) and the Controlled Drugs and Substances Act (Canada) (CDSA), as the governing legislation on
the production, sale and distribution of medical cannabis. The ACMPR was repealed on the same day.
Management has invested significant time and resources in securing channels into the regulated recreational
markets. These efforts have resulted in the Company securing supply related agreements with nine
provinces across Canada. Currently, the Cannabis Regulations permit the sale of dried cannabis, cannabis
oil, fresh cannabis, cannabis plants, and cannabis seeds. Edible cannabis and cannabis concentrate products
are currently prohibited but are expected to be permitted for legal sale on or before October 17, 2019, based
on proposed amendments to the Cannabis Act not yet in force.
Market Opportunity
Public health concerns and awareness around the dangers of opioids are driving the development of
alternative approaches to pain management. These factors have created a significant market opportunity for
cannabis-based products and may drive substantial upstream demand for Licensed Producers. The
development of pharmaceuticals based on cannabis could significantly expand the market by ensuring
consistent, quantifiable dosing, which will provide physicians with comfort in prescribing it.
The cannabis market opportunity continues to evolve as regulations change and consumer preferences
evolve. According to Grand View Research, the global legal medical and recreational market opportunities
are estimated to be $150 billion by 2025. A strong presence in both the medical and recreational cannabis
markets will be essential to capturing the full breadth of the opportunity, particularly the expansion of
applications and products that can be leveraged across markets in the natural health products, health and
wellness, adult-use recreational and pet care segments. The Company believes its foundation in medical
cannabis will position the Company globally for continued leadership in new dosage formats and future
pharmaceutical products, while its high-quality, standardized products will underpin strong recreational
brands, providing consistent experiences for a variety of uses and consumer lifestyles.
Corporate Strategy
The Company plans to increase its presence in existing markets, and drive growth by entering new regions,
as well as broaden consumer awareness and education of the benefits of cannabis globally. The Company
plans to expand its operational capacity and capabilities in Canada, with the expansion of its Perpetual
Harvest Facility as well as by establishing an outdoor cultivation strategy to provide low cost production
for use in extraction-based products.
The Company’s international presence has been established so far through partnerships in Australia and
Denmark. In Australia, the Company has a partnership with CannaTrek, one of the first Australian
companies to be awarded a cannabis research, cultivation, manufacturing, sales and import license. Through
a 19.8% ownership stake, the Company has access to CannaTrek’s vertically-integrated model, expanding
capacity and supply of low-cost product, which the Company believes will facilitate entry into Asia-Pacific
markets. In Denmark, CannTrust has entered into a partnership with Stenocare, a leading cannabis company
that holds supply agreements with distributors serving 99% of pharmacies in the country. A 19% ownership
stake in Stenocare enables CannTrust to leverage Danish licensing and strategic distribution agreements
with hospitals and pharmacies, with the objective of increasing broader access to European markets.
5
Through the import of CannTrust’s cannabis products, Stenocare became the first company to make
cannabis oils available to the Danish market.
To expand access to, and distribution of, CannTrust’s products, the Company has been active in developing
partnerships in medical, retail and product channels. The Company has a partnership with Apotex, the
largest Canadian-owned generic pharmaceutical company, to develop alternate dosage formats for the
Company’s medical cannabis products. Through this partnership, and upon completion of clinical trials,
CannTrust seeks to apply for registration of proprietary formulations to become available in pharmacies
and through benefit plans in many of the 115 countries where Apotex currently distributes products. With
respect to retail distribution, the Company has an exclusive partnership with Kindred, a wholly-owned
subsidiary of Breakthru Beverage Group (“Breakthru”), the top alcohol distributor in Canada. Through this
partnership, CannTrust seeks to leverage Breakthru’s experience with provincial boards and private retailers
to gain access to its state-of-the-art route-to-market platform for the adult-use recreational market. This will
include access to route planning, sales tools, analytics and insights on consumer behavior and preferences
to maximize CannTrust’s position in the market as adult-use expands. CannTrust has also established a
partnership with National Access Cannabis (“NAC”), having purchased 5,494,505 shares of NAC,
providing the Company with greater exposure to recreational retail sales in Canada through preferred status
and shelf space. In addition, CannTrust is in active discussions with other beverage, manufacturing,
pharmaceutical, mass retail, over-the-counter and other natural health product partners for future global
business development opportunities.
The Company plans to build on its foundation of high-quality, standardized products to enter new
international markets where medical use is legalized, and to build on CannTrust’s industry excellence to
expand into other markets where the regulatory environment allows. The Company intends to continue to
develop both commercial and research partnerships with emerging companies that have a proven
understanding of their markets and regulatory environment.
Product & Brands
Medical
For medical use, the Company offers dried flower formats, as well as several cannabis drops and
encapsulated cannabis oil products. These products come in three varieties: CannTrust CBD Drops,
CannTrust 1:1 Drops and CannTrust THC Drops. The Company also produces similar products in capsule
form using two-piece capsules that are vegan-based and do not use animal products, such as gelatin, making
them more desirable for a variety of customers and patients.
Recreational
The Company has launched four adult use brands: liiv, Synr.g, Xscape and Peak Leaf. The first three are
currently available in nine provinces, and the Peak Leaf line of products is available exclusively in British
Columbia. The liiv brand will be available in Quebec effective May 2019. Each product line is focused on
a distinct lifestyle or usage type, and the branding provides the consumer with reference points for the type
of experience they will have with specific strains.
The Company’s brands have been specifically designed for the adult-use recreational market, targeting
identifiable consumer segments as follows:
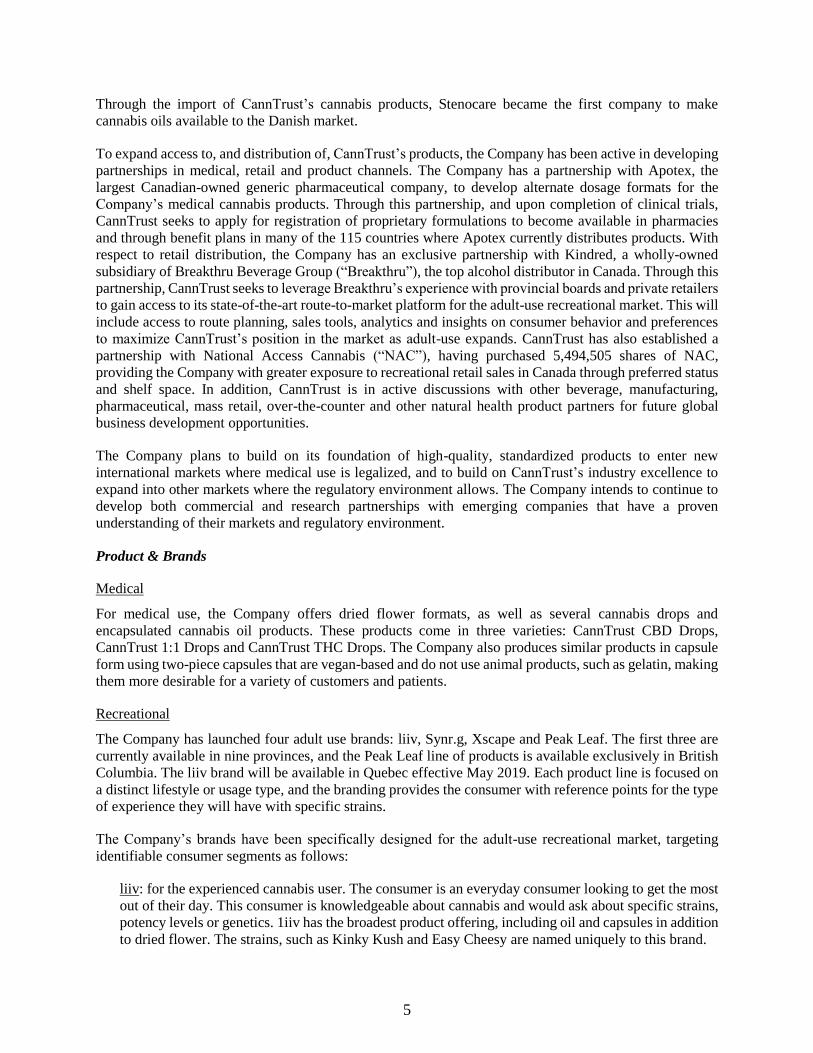
liiv: for the experienced cannabis user. The consumer is an everyday consumer looking to get the most
out of their day. This consumer is knowledgeable about cannabis and would ask about specific strains,
potency levels or genetics. 1iiv has the broadest product offering, including oil and capsules in addition
to dried flower. The strains, such as Kinky Kush and Easy Cheesy are named uniquely to this brand.
6
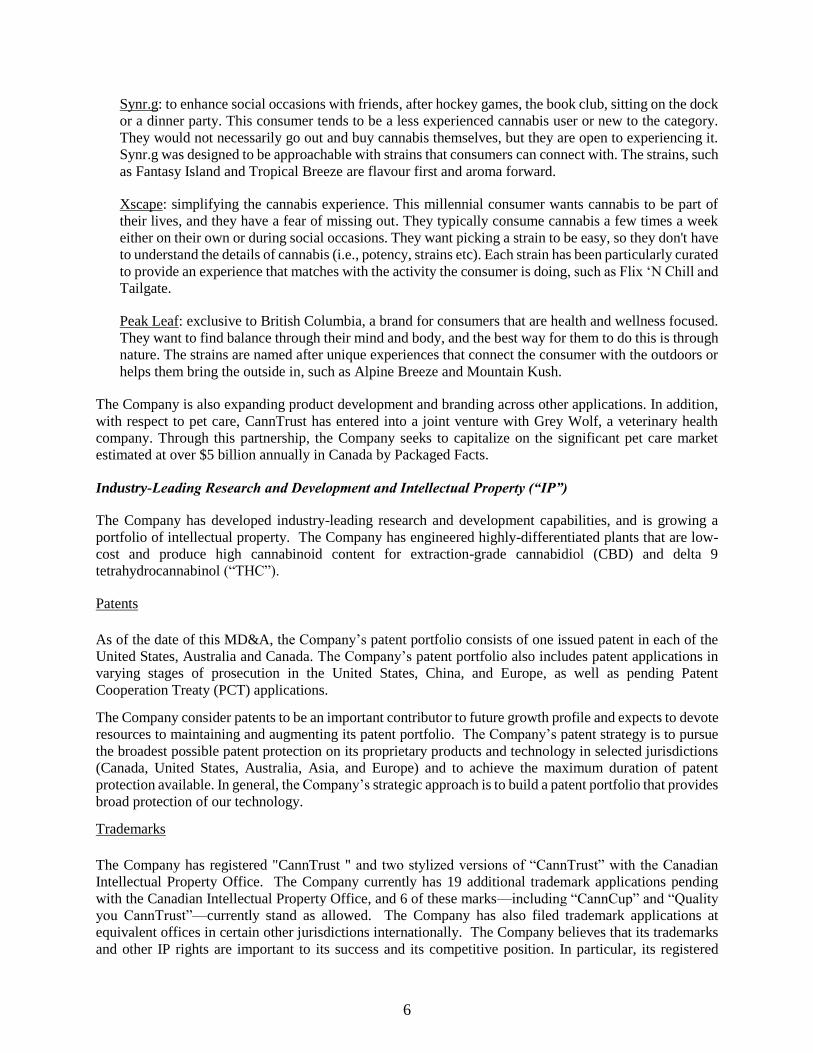
Synr.g: to enhance social occasions with friends, after hockey games, the book club, sitting on the dock
or a dinner party. This consumer tends to be a less experienced cannabis user or new to the category.
They would not necessarily go out and buy cannabis themselves, but they are open to experiencing it.
Synr.g was designed to be approachable with strains that consumers can connect with. The strains, such
as Fantasy Island and Tropical Breeze are flavour first and aroma forward.
Xscape: simplifying the cannabis experience. This millennial consumer wants cannabis to be part of
their lives, and they have a fear of missing out. They typically consume cannabis a few times a week
either on their own or during social occasions. They want picking a strain to be easy, so they don't have
to understand the details of cannabis (i.e., potency, strains etc). Each strain has been particularly curated
to provide an experience that matches with the activity the consumer is doing, such as Flix ‘N Chill and
Tailgate.
Peak Leaf: exclusive to British Columbia, a brand for consumers that are health and wellness focused.
They want to find balance through their mind and body, and the best way for them to do this is through
nature. The strains are named after unique experiences that connect the consumer with the outdoors or
helps them bring the outside in, such as Alpine Breeze and Mountain Kush.
The Company is also expanding product development and branding across other applications. In addition,
with respect to pet care, CannTrust has entered into a joint venture with Grey Wolf, a veterinary health
company. Through this partnership, the Company seeks to capitalize on the significant pet care market
estimated at over $5 billion annually in Canada by Packaged Facts.
Industry-Leading Research and Development and Intellectual Property (“IP”)
The Company has developed industry-leading research and development capabilities, and is growing a
portfolio of intellectual property. The Company has engineered highly-differentiated plants that are low-
cost and produce high cannabinoid content for extraction-grade cannabidiol (CBD) and delta 9
tetrahydrocannabinol (“THC”).
Patents
As of the date of this MD&A, the Company’s patent portfolio consists of one issued patent in each of the
United States, Australia and Canada. The Company’s patent portfolio also includes patent applications in
varying stages of prosecution in the United States, China, and Europe, as well as pending Patent
Cooperation Treaty (PCT) applications.
The Company consider patents to be an important contributor to future growth profile and expects to devote
resources to maintaining and augmenting its patent portfolio. The Company’s patent strategy is to pursue
the broadest possible patent protection on its proprietary products and technology in selected jurisdictions
(Canada, United States, Australia, Asia, and Europe) and to achieve the maximum duration of patent
protection available. In general, the Company’s strategic approach is to build a patent portfolio that provides
broad protection of our technology.
Trademarks
The Company has registered "CannTrust " and two stylized versions of “CannTrust” with the Canadian
Intellectual Property Office. The Company currently has 19 additional trademark applications pending
with the Canadian Intellectual Property Office, and 6 of these marks—including “CannCup” and “Quality
you CannTrust”—currently stand as allowed. The Company has also filed trademark applications at
equivalent offices in certain other jurisdictions internationally. The Company believes that its trademarks
and other IP rights are important to its success and its competitive position. In particular, its registered

7
trademarks and service marks are valuable assets that distinguish its brand and reinforce its customers’
positive perception of its products.
Intellectual Property Protection
The Company’s success depends, in part, on its ability to protect its proprietary technology and IP. In
addition to its patent portfolio, the Company relies upon trade secrets, know-how and continuing
technological innovations to develop its competitive position. The Company seeks to establish and
safeguard its IP, in part, through a combination of confidentiality, licensing and other agreements with
executives, consultants and third parties. In the case of employees and consultants, such agreements provide
that all inventions resulting from work performed for the Company utilizing its property or relating to its
business and conceived of or completed by the individual during employment are the Company’s exclusive
property.
Research and Development
The Company is a leader in the use of micro- and nano-technology in the cannabis sector. This technology
improves plant bioavailability and enhances the amount of active CBD and/or THC that a patient or
consumer absorbs. The technology has also lowered manufacturing costs and has allowed the Company to
develop a broad spectrum of concentrated, water-soluble, tasteless and odorless consumer products,
including food additives, beverages, edibles and sprays. An example of the Company’s product innovation
is the patented BrewBudz line of single-serve, cannabis beverage pods that will have multiple applications
for consumer use, demonstrating the Company’s ability to leverage its research capabilities to develop
innovative products for consumers. Both the Company’s research and development and resulting IP
position the Company well for expanding consumer markets as a result of the anticipated regulatory changes
later in 2019.
Outlook
CannTrust expects to continue to make investments in a disciplined and deliberate manner to position the
Company to take advantage of future opportunities, both domestically and internationally. The Company
continues to invest in people, process, technology and marketing, and is developing innovative products for
the expected legalization new product formats in Canada later in 2019. These products include vape pens,
beverages, confectionaries and healthcare products. CannTrust is also making strategic investments into its
capacity to prepare for expected increases in demand for its products. The Company believes it will be a
leader in outdoor growing capability, which will leverage its proprietary genetics and has the potential to
accelerate the Company’s low-cost production advantage.
The completed Phase 2 expansion of the Perpetual Harvest Facility is expected to increase production
capacity to 50,000kg on an annualized basis by the third quarter of 2019. With this increased production
capability, the Company believes revenue will increase significantly in 2019 compared to the 2018 full year
results, with revenue growth accelerating in the second quarter of 2019. The Company has received all
necessary regulatory approvals for the Phase 2 expansion, which is now fully operational. In addition,
having obtained all necessary permits from the Town of Pelham for the construction of its Phase 3
expansion, the Company continues to expect its Perpetual Harvest Facility capacity to reach 100,000kg on
an annualized basis in the second half of 2020. The Company has completed the design and vendor selection
for its Phase 3 expansion, and is finalizing its planning to begin construction in the third quarter of 2019.
Driving further capacity enhancement for primarily extraction-based products, CannTrust’s outdoor
growing initiatives are targeted to deliver material future revenue contributions as early as 2019. The

8
Company estimates the production from this initiative to result in 75,000kg of production in 2019, subject
to regulatory approvals, and between 100,000kg to 200,000kg of cannabis in 2020 subject to regulatory
approvals.
CannTrust’s investments into people, process, technology and marketing are expected to impact near-term
profitability as the Company continues to scale. These are calculated investments that the Company expects
will result in increasing yields, lower cost per gram and the advance of the Company’s brand and strategic
initiatives. As the Phase 2 expansion contributes to positive operating leverage, the Company is targeting a
return to profitability in 2019. CannTrust expects that its gross margin before fair value changes to
biological assets should increase throughout 2019 as the Company increases its production levels and gains
production efficiencies.
Business Developments
The Company is diversifying its business by developing new and innovative products and dosage forms for
controlled and responsible use of medical cannabis. In 2015, the Company together with Club Coffee L.P
founded Cannabis Coffee & Tea Pod Company Ltd. ("CCTPC") to launch BrewBudz™ globally.
BrewBudz™ is a patented unit dose pod formulation allowing the administration of cannabis using single-
serve brewing pods for use in Keurig, Nespresso and Tassimo type brewers.
In March 2017, through Elmcliffe, the Company acquired the real estate assets and related equipment of a
greenhouse in the Town of Fenwick, Ontario within the Niagara Region. In October 2017, CannTrust
received its Health Canada Cultivation Licence under the ACMPR for its completed 250,000 square foot
Phase 1 redevelopment of the Perpetual Harvest Facility and began production there. The redevelopment
of the Perpetual Harvest Facility was Canada’s first automated perpetual harvest designed specifically for
this scale of cannabis production. The Company received its Health Canada Sales License for the Perpetual
Harvest Facility in February 2018. The Phase 2 expansion at the Perpetual Harvest Facility was
substantially completed during the first quarter of 2019, and is as of the date of this MD&A, fully licensed
by Health Canada.
On November 6, 2017, CannTrust received Health Canada approval to export medical marijuana
internationally to countries where medical marijuana is legalized and the Company began shipping to
Australia. Australia is the first of many markets that the Company seeks to supply. In March 2018,
CannTrust expanded internationally through a joint venture in Denmark with Stenocare. Initially Stenocare
will sell CannTrust’s market leading standardized cannabis products in Denmark while working towards
developing a domestic growing facility. CannTrust initially received a 25% equity stake in Stenocare. On
July 6, 2018, Stenocare received approval to distribute CannTrust products in Denmark. The Company’s
cannabis oils are the first oils approved for Denmark’s list of admitted cannabis products and are the only
“ready-to-use” oil products available in Denmark. With the completion of all phases of the Niagara
expansion, the Company believes it has the ability to supply a substantial share of the increased demand
arising from international markets.
In June 2018, the Company entered into a shareholder’s agreement with Grey Wolf to develop ground
breaking cannabis products to support the well-being of pets. Under the terms of the partnership Grey Wolf
and CannTrust are equal partners in a newly created joint venture of Grey Wolf. On August 14, 2018, the
Company invested $1 million in Grey Wolf. In addition, CannTrust will, upon exercise of share purchase
warrants held by CannTrust, acquire a more significant position and likely role in Grey Wolf’s cannabis-
related activities.
On June 5, 2018, the Company closed its short form prospectus offering, on a bought deal basis, including
the full exercise of the over-allotment option. A total of 11,155,000 units of the Company (“Units”) were

9
sold at a price of $9.00 per Unit for aggregate gross proceeds of $100 million. Each Unit was comprised of
one common share and a half warrant. Each full warrant is exercisable to acquire one common share of the
Company at an exercise price of $12.00 per share.
During the fiscal year, as part of the legalization of the recreational market for cannabis, the Company
entered into agreements with nine Canadian provinces to supply a broad range of adult-use products,
consisting of the Company’s four recreational cannabis brands liiv, Xscape, Synr.g and Peak Leaf.
On October 5, 2018, the Company acquired a 50% interest in O’Cannabis We Stand On Guard For Thee
Corporation (“O’Cannabis”), a telemedicine provider for gross proceeds of $0.5 million. The Company is
entitled to appoint two out of four board members of O’Cannabis.
On October 15, 2018, as part of Stenocare’s initial public offering (“Stenocare IPO”), the Company
purchased 272,727 common shares of Stenocare. Stenocare began trading on the Spotlight Stock Market
under the trading symbol STENO on October 26, 2018. Post this Stenocare IPO, the Company holds 19%
of the outstanding shares of Stenocare.
On October 17, 2018, the Company finalized an exclusive partnership agreement with Kindred Partners
Inc., a wholly-owned Canadian subsidiary of Breakthru, the largest Canadian beverage alcohol broker of
premium spirits, wine and beer brands, to represent CannTrust’s specialty products to Canadian adult
consumers for recreational use. In connection with this partnership Breakthru purchased 902,405 common
shares of CannTrust at a purchase price of $10.23 per share for gross proceeds of $9.2 million.
On October 24, 2018, the Company closed on the purchase of a 19.4 acre property on land adjacent to the
Perpetual Harvest Facility. On January 22, 2019, the Company obtained all necessary permits from the
Town of Pelham to construct the Phase 3 expansion. The Company will begin construction of an additional
390,000 square foot Phase 3 expansion on the 19.4 acres of recently purchased adjacent land. The Company
has targeted the completion of the Phase 3 expansion in the third quarter of 2020. After completion of Phase
3, the Company expects the Perpetual Harvest Facility to have a total production capacity of 100,000 kg
per year. The Company expects to have in excess of 800,000 square feet of production capacity after
completion of all phases of the Perpetual Harvest Facility expansion. The Company continues to research
options for additional growing capacity as the adult-use recreational market evolves. In March 2018, the
Company entered into a long term agreement with Envest Corp., to provide low cost heat and power from
natural gas co-generation at the Company’s Perpetual Harvest Facility. The implementation of a 10
megawatt cogeneration solution will ensure that the Company remains one of the lowest cost producers in
the industry.
On October 26, 2018, the Company entered into a strategic partnership with Australian licensed producer,
Cannatrek. Cannatrek is one of the first Australian vertically integrated enterprises to be awarded a cannabis
research, cultivation, manufacturing, sales and import license by federal and state governments and is
pioneering a world class 1.7 million sq. ft. greenhouse facility. The Company believes that this greenhouse
project will provide significant supply for the Asia-Pacific region and will allow CannTrust to purchase
quality, low-cost cannabis from Cannatrek. As part of the partnership, CannTrust made an investment for
a 19.8% stake in Cannatrek, with an option to maintain this shareholding through any future share issuances
up to and including Cannatrek completing an initial public offering.
On October 26, 2018, the Company invested $5 million in National Access Cannabis Corp (“NAC”), a
Canadian cannabis retailer. NAC’s common shares are listed on the TSX Venture Exchange under the
trading symbol META. The Company owns approximately 3% of the outstanding common shares of NAC.

10
On February 25, 2019, the Company’s common shares began trading on the NYSE under the trading symbol
CTST.
In March 2019, the Company entered into Letters of Intent to secure approximately 200 acres of land
through purchase and lease for use in outdoor cultivation. In March 2019, through CTI Holdings, the
Company acquired 81 acres of outdoor cultivation land in British Columbia, representing a portion of the
200 acres under Letters of Intent. The Company expects to realize its first harvest from outdoor cultivation
in 2019, estimated at 75,000 kg, subject to regulatory approval.
On May 6, 2019, the Company completed an underwritten public offering of 30,909,091 common shares
at a price of US$5.50 per share for gross proceeds to the Company of approximately US$170 million before
deducting underwriting discounts and commissions and estimated offering expenses, and net proceeds of
approximately US$160 million. In connection with the offering, the underwriters have an option to acquire
up to 4,636,363 additional common shares within 30 days of May 1, 2019 at a net price to the Company of
US$5.19 per share.

11
2019 First Quarter Highlights
Record quarterly revenues of $16.9 million, a 115% increase versus the first quarter of 2018. 67%
of revenue was from medical sales and 33% of revenue from wholesale in international and
recreational sales
17% growth in medical patients for the three months ended March 31, 2019
Harvested approximately 9,500 kg of cannabis during the three months ended March 31, 2019, a
439% increase versus 1,749 kg for the three months ended March 31, 2018
Sold 3,000 kg of dried Cannabis and dried Cannabis equivalent at an average net price of $5.47 per
gram
41 % of dried cannabis sales were derived from Canadian medical and 59% was derived from
wholesale in international and recreational markets
88% of extract sales, which includes oils and capsules, was derived Canadian medical and 12%
was derived from wholesale in international and recreational markets
Cost of sales per gram sold and cash cost per gram sold were $3.03 and $2.77, respectively,
compared to $3.08 and $2.94, respectively, in the fourth quarter of 2018
12
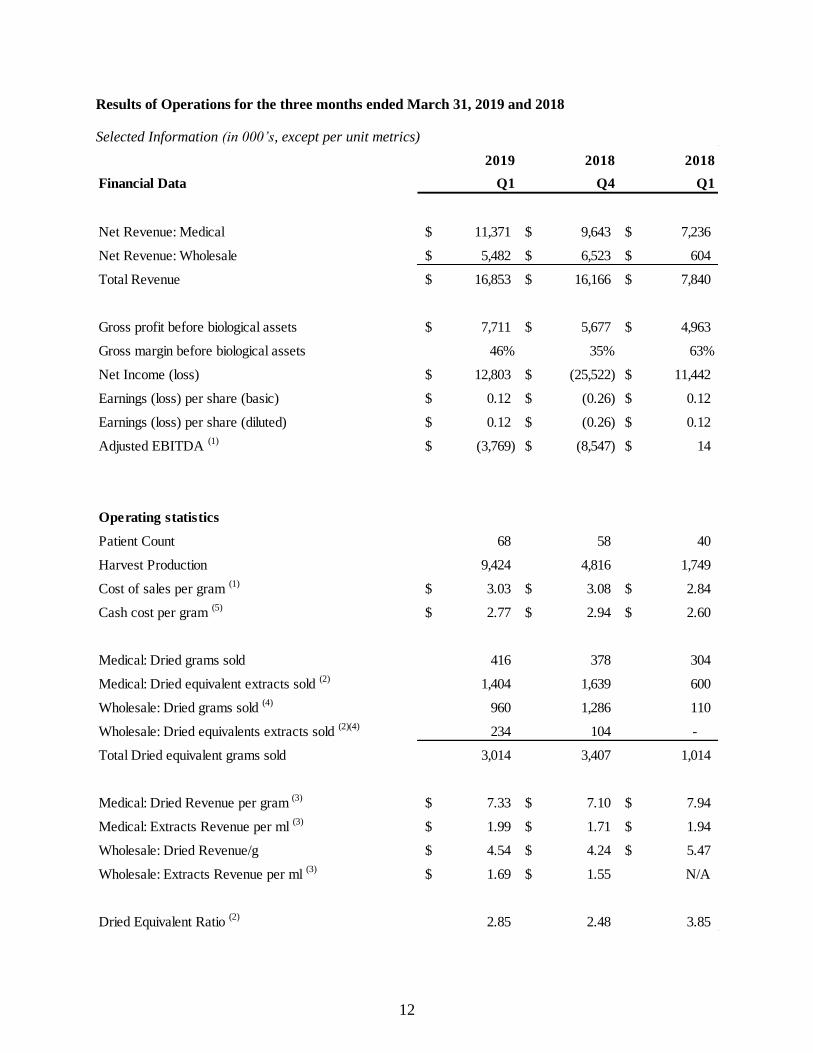
Results of Operations for the three months ended March 31, 2019 and 2018
Selected Information (in 000’s, except per unit metrics)
2019 2018 2018
Financial Data Q1 Q4 Q1
Net Revenue: Medical 11,371$ 9,643$ 7,236$
Net Revenue: Wholesale 5,482$ 6,523$ 604$
Total Revenue 16,853$ 16,166$ 7,840$
Gross profit before biological assets 7,711$ 5,677$ 4,963$
Gross margin before biological assets 46% 35% 63%
Net Income (loss) 12,803$ (25,522)$ 11,442$
Earnings (loss) per share (basic) 0.12$ (0.26)$ 0.12$
Earnings (loss) per share (diluted) 0.12$ (0.26)$ 0.12$
Adjusted EBITDA (1)
(3,769)$ (8,547)$ 14$
Operating statistics
Patient Count 68 58 40
Harvest Production 9,424 4,816 1,749
Cost of sales per gram (1)
3.03$ 3.08$ 2.84$
Cash cost per gram (5)
2.77$ 2.94$ 2.60$
Medical: Dried grams sold 416 378 304
Medical: Dried equivalent extracts sold (2)
1,404 1,639 600
Wholesale: Dried grams sold (4)
960 1,286 110
Wholesale: Dried equivalents extracts sold (2)(4)
234 104 -
Total Dried equivalent grams sold 3,014 3,407 1,014
Medical: Dried Revenue per gram (3)
7.33$ 7.10$ 7.94$
Medical: Extracts Revenue per ml (3)
1.99$ 1.71$ 1.94$
Wholesale: Dried Revenue/g 4.54$ 4.24$ 5.47$
Wholesale: Extracts Revenue per ml (3)
1.69$ 1.55$ N/A
Dried Equivalent Ratio (2)
2.85 2.48 3.85

13
Notes: (1) See description of non-IFRS measure in the "Non-IFRS Financial Measure and Reconciliation" section of this MD&A. The
terms Adjusted EBITDA, and Cash Cost per gram do not have any standardized meanings under IFRS and therefore they may not be comparable to similar measures presented by other companies.
(2) Dried equivalent of cannabis is calculated on the basis of millilitres (ml) of extracts equivalent to 1 g of dried cannabis. The
increase (decrease) in ml of extracts equivalent to 1 gram of cannabis is a result of cannabis with higher (lower) cannabinoid content being used in the extraction process.
(3) Average Revenue per gram (net) is calculated by taking the revenue (Canadian Medical or Wholesale) relating to sales of dry
cannabis as per the Company’s Financial Statements prepared in accordance with IFRS, divided by the grams of dry cannabis sold
(Canadian Medical or Wholesale) in the period per the MD&A. Average Revenue per gram of cannabis equivalent from extract
sales (net) is calculated by taking the revenue relating to sales of extracts as per the Company’s Financial Statements prepared in accordance with IFRS divided by the equivalent grams of dried cannabis used in the extract sold in the period.
(4) Wholesale revenue includes goods and services sold to international markets, the Canadian recreational market and to third
party Licensed Producers.
(5) Cost of sales per gram sold is calculated by taking the cost of goods sold as per the Company’s Financial Statements prepared
in accordance with IFRS, divided by the grams of dry cannabis and cannabis equivalent sold in the period per the MD&A.
Operational Overview
Location Use Size Capacity Status License
Vaughan Vaughan,
Ontario,
Canada
Manufacturing
and Packaging
60,000 sq ft n/a In
production
Cultivation
and sale
Niagara
Phase 1 and
2
Pelham,
Ontario,
Canada
Grow 450,000 sq ft 50,000
kg/year
In
production
Cultivation
and sale
Niagara
Phase 3
Pelham,
Ontario,
Canada
Grow 390,000 sq ft 50,000
kg/year
Permitted
Outdoor British
Columbia,
Canada
Grow 81 acres
120+ acres
under LOI for
long term
lease.
Total 200+
acres
75,000
kg/year
100,000
kg/year –
200,000
kg/year
In
development
Pending
approval

14
Medical Patients (approximately)
As of March 2019, the Company had approximately 68,000 active patients, an increase of 17% from the
beginning of the year.
Review of the Financial Results of Operations for the three months ended March 31, 2019 and 2018
Revenue
Revenue for the three months ended March 31, 2019 was $16.9 million compared to $7.8 million for the
comparable 2018 period, an increase of 115%. The increase in revenue in the three months ended March
31, 2019 was primarily attributable to increased sales volumes due to the growth in the Company's medical
patient base from approximately 40,000 at March 31, 2018 to 68,000 as at March 31, 2019, as well as sales
derived from the Company’s wholesale revenue streams, which reflects sales to the provinces related to the
legalization of the adult-use recreational market.
The total quantity of dried cannabis equivalent sold to medical patients during the three months ended
March 31, 2019 increased to 1,820 kg, a 101% increase from the comparable 2018 period. The total quantity
of dried cannabis equivalent sold in the wholesale market during the three months ended March 31, 2019
increased to 1,194 kg, a 985% increase from the comparable 2018 period.
Canadian Medical average revenue per gram realized for the three months ended March 31, 2019, decreased
from the prior year periods mainly due to the Company absorbing the excise tax following its
implementation in October 2018. The impact of absorbing the excise tax on medical products was $1.2
million.
Cost of Sales
Cost of goods sold for the three months ended March 31, 2019 was $9.1 million compared to $2.9 million
in the comparable prior year period. Cost of goods sold includes pre-harvest production, post-harvest
production and processing costs of cannabis, packaging, testing and inventory purchased from third parties.
Cost of goods sold during the three months ended March 31, 2019 increased compared to the comparable
2018 period due to an increase in sales and the associated increase in the scale of production activities.
Plants that are in pre-harvest are considered biological assets and are recorded at fair market value less cost
to sell at their point of harvest. Costs to sell include trimming, fulfillment, testing, partnership commissions
and shipping costs. As the plants continue to grow through the pre-harvest stages, pre-harvest cash costs
are capitalized to the value of the cannabis plants. An additional non-cash unrealized gain is recognized in
gross profit, reflecting the changes in fair value of the biological assets in excess of the pre-harvest cash
costs capitalized to the value of the cannabis plants. At harvest, the biological assets are transferred to
inventory at their fair value less cost to sell which becomes the deemed cost of inventory. Biological assets
inventory is subsequently expensed in cost of goods sold and ‘Fair Value changes in biological assets
included in inventory sold’. Together the unrealized gain from changes in the fair value of biological assets,
Q1
2019
Q4
2018
Q3
2018
Q2
2018
Q1
2018
Q4
2017
Q3
2017
Q2
2017
Active Patients 68,000 58,000 50,000 45,000 40,000 37,000 31,000 20,000
Increase in Active
Patients 10,000 8,000 5,000 5,000 3,000 6,000 11,000 6,000
Quarterly Growth 17% 16% 11% 13% 8% 19% 55% 43%

15
the fair value changes in biological assets included in inventory sold and cost of goods sold are included in
gross profit. The unrealized gain from changes in the fair value of biological assets will vary from period
to period based upon the number of pre-harvest plants, where the plants are in the grow cycle at the end of
the period, the proportion of capitalized cash costs, the strains being grown and the ultimate net selling
price that that can be realized.
The fair value changes in biological assets included in inventory sold, net of the unrealized gain/(loss) on
changes in fair value of biological assets, in the three months ended March 31, 2019 was a gain of $26
million and compared to a gain of $16 million for the comparable 2018 period. For the three months ended
March 31, 2019, harvested production was 9,424 kg, a 439% increase from the 1,749 kg in the comparable
2018 period. The increase in the fair value of biological assets recorded during the period was due to: the
ramp up of production at the Perpetual Harvest Facility following approval from Health Canada of the final
rooms from Phase 2, and an increase in the average stage of the plants in the grow cycle combined with
higher expected revenue per gram as a result of the selling price increases in the medical and recreational
markets.
Gross Profit
Gross profit/(loss) for the for the three months ended 31 March 2019 was $33.7 million compared to $21
million in the comparable prior year period. Gross profit includes the unrealized gains and losses on changes
in the fair value of biological assets.
Excluding the impact of the change in the fair value of biological assets, gross profit for the three months
ended March 31, 2019 was $7.7 million compared to $5 million in the comparable prior year period. The
increase in gross profit excluding the impact of the change in the fair value of biological assets was a result
of increased scale of operations. Gross margin percentage excluding the impact of the change in the fair
value of biological assets for the three months ended March 31, 2019 was 46% compared to 63% in the
comparable prior year period. The gross margin percentage excluding the impact of the change in the fair
value of biological assets was lower in the first quarter of 2019 compared to the comparable period mainly
due to the Company absorbing the impact of the excise tax on medical sales, the increase in recreational
sales which have lower revenue per gram and cost attributable to a larger production facility.
Operating Expenses
Operating Expenses for the three months ended March 31, 2019 were $16.2 million compared to $9.5
million in the comparable prior year period. The increase in expenses in 2019 was due to increases in
general and administrative expenses, marketing and promotion expenses, selling and shipping costs and
salaries and benefits, as the Company changed and expanded its leadership team, and increased its staff to
meet the increased demand for the Company's products. In addition, the Company incurred a substantial
increase in marketing and promotion expenses of $1.7 million as a result of the Company’s launch of four
new recreational brands with the legalization of adult-use recreational cannabis in Canada in October 2018.
Professional fees in 2019 increased due to the additional legal and audit work relating to the Company’s
listing on the NYSE, and business development opportunities.
Amortization related to pre- and post-harvest production are capitalized to biological assets and inventory
and then expensed as part of cost of goods sold when the associated inventory is sold. Amortization related
to operations is expensed directly to the Consolidated Statement of Net Income and Comprehensive
Income. Total amortization expense for the three months ended March 31, 2019 was $1.8 million, compared
to $1 million in the comparable prior year period. As at March 31, 2019, $0.5 million of amortization from
the three months ended March 31, 2019 remained in inventory. The increase in amortization expenses in
16
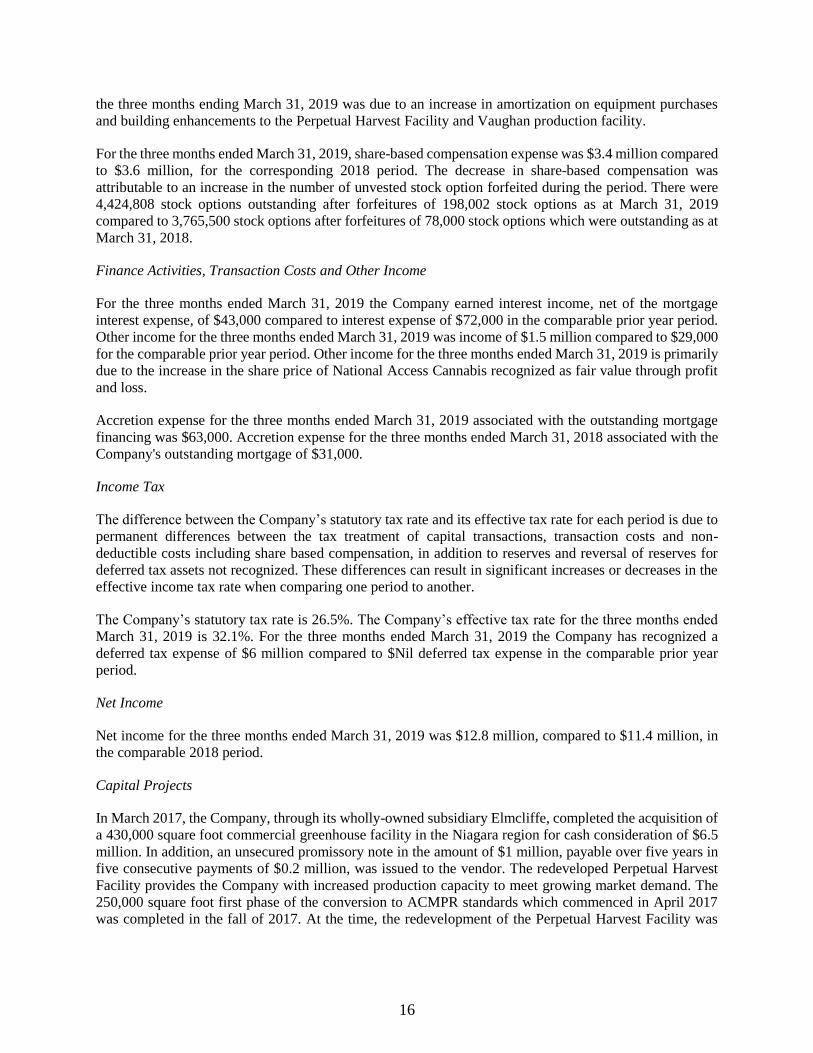
the three months ending March 31, 2019 was due to an increase in amortization on equipment purchases
and building enhancements to the Perpetual Harvest Facility and Vaughan production facility.
For the three months ended March 31, 2019, share-based compensation expense was $3.4 million compared
to $3.6 million, for the corresponding 2018 period. The decrease in share-based compensation was
attributable to an increase in the number of unvested stock option forfeited during the period. There were
4,424,808 stock options outstanding after forfeitures of 198,002 stock options as at March 31, 2019
compared to 3,765,500 stock options after forfeitures of 78,000 stock options which were outstanding as at
March 31, 2018.
Finance Activities, Transaction Costs and Other Income
For the three months ended March 31, 2019 the Company earned interest income, net of the mortgage
interest expense, of $43,000 compared to interest expense of $72,000 in the comparable prior year period.
Other income for the three months ended March 31, 2019 was income of $1.5 million compared to $29,000
for the comparable prior year period. Other income for the three months ended March 31, 2019 is primarily
due to the increase in the share price of National Access Cannabis recognized as fair value through profit
and loss.
Accretion expense for the three months ended March 31, 2019 associated with the outstanding mortgage
financing was $63,000. Accretion expense for the three months ended March 31, 2018 associated with the
Company's outstanding mortgage of $31,000.
Income Tax
The difference between the Company’s statutory tax rate and its effective tax rate for each period is due to
permanent differences between the tax treatment of capital transactions, transaction costs and non-
deductible costs including share based compensation, in addition to reserves and reversal of reserves for
deferred tax assets not recognized. These differences can result in significant increases or decreases in the
effective income tax rate when comparing one period to another.
The Company’s statutory tax rate is 26.5%. The Company’s effective tax rate for the three months ended
March 31, 2019 is 32.1%. For the three months ended March 31, 2019 the Company has recognized a
deferred tax expense of $6 million compared to $Nil deferred tax expense in the comparable prior year
period.
Net Income
Net income for the three months ended March 31, 2019 was $12.8 million, compared to $11.4 million, in
the comparable 2018 period.
Capital Projects
In March 2017, the Company, through its wholly-owned subsidiary Elmcliffe, completed the acquisition of
a 430,000 square foot commercial greenhouse facility in the Niagara region for cash consideration of $6.5
million. In addition, an unsecured promissory note in the amount of $1 million, payable over five years in
five consecutive payments of $0.2 million, was issued to the vendor. The redeveloped Perpetual Harvest
Facility provides the Company with increased production capacity to meet growing market demand. The
250,000 square foot first phase of the conversion to ACMPR standards which commenced in April 2017
was completed in the fall of 2017. At the time, the redevelopment of the Perpetual Harvest Facility was

17
Canada’s first continuous harvest automated greenhouse designed specifically for this quantum scale of
cannabis production.
The Company received its Health Canada License under the ACMPR on October 6, 2017 for the Phase 1
redevelopment. On February 12, 2018 the Company obtained its Health Canada sales license under the
ACMPR and began operating Phase 1 at full capacity. The 200,000 square foot Phase 2 expansion at the
Perpetual Harvest Facility was substantially completed in the first quarter of 2019 and was fully licensed
as of April 2019.
In January 2019, the Company received the necessary permits to develop the 390,000 sq. ft. Phase 3 Niagara
expansion, which when completed, is expected to increase the annual production capacity from the
perpetual harvest greenhouse to 100,000 Kg.
Liquidity and Capital Resources as at March 31, 2019 and December 31, 2018 and for the periods
ended March 31, 2019 and 2018
Operating cash flow and equity and debt financings are the Company's primary source of liquidity. At
March 31, 2019 cash and short term investments were $42.7 million compared to $72 million as at
December 31, 2018.
The Company's Working Capital as at March 31, 2019 and December 31, 201 is as follows:
Working capital is primarily represented by cash, short-term investments, accounts receivable, inventory,
biological assets, harmonized sales tax recoverable and prepaids, offset by accounts payable and the current
portions of the mortgage and the promissory note issued on the Perpetual Harvest Facility acquisition. The
Company's working capital increased by $3 million to $115 million as at March 31, 2019 compared to $112
million at December 31, 2018.
Operating Activities
During the three months ended March 31, 2019, the Company's cash flow used in operating activities was
$19 million, compared to cash flow used in operating activities of $2.9 million in the comparable 2018
period. This increase is cash used in operating activities is due to higher non-cash income and higher levels
of investment in working capital, due to the increased production resulting from the legalization of the
recreational market. In addition, prepaid expenses had increased significantly due to the extension of
directors and officer’s insurance policies.
March 31,
2019
December
31, 2018
$000s $000s
Current Assets 139,510 128,442
Current Liabilities 24,739 16,797
Working Capital 114,771 111,645
Ratio of current assets to current liabilities 5.6 7.6
18
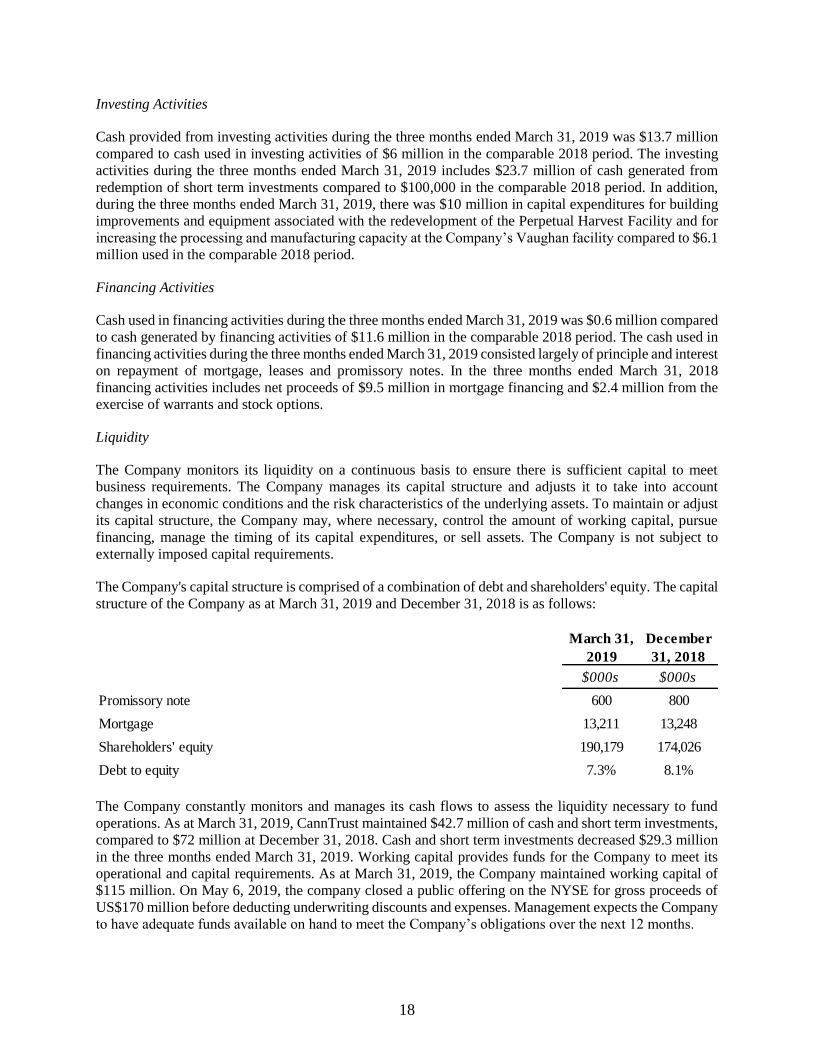
Investing Activities
Cash provided from investing activities during the three months ended March 31, 2019 was $13.7 million
compared to cash used in investing activities of $6 million in the comparable 2018 period. The investing
activities during the three months ended March 31, 2019 includes $23.7 million of cash generated from
redemption of short term investments compared to $100,000 in the comparable 2018 period. In addition,
during the three months ended March 31, 2019, there was $10 million in capital expenditures for building
improvements and equipment associated with the redevelopment of the Perpetual Harvest Facility and for
increasing the processing and manufacturing capacity at the Company’s Vaughan facility compared to $6.1
million used in the comparable 2018 period.
Financing Activities
Cash used in financing activities during the three months ended March 31, 2019 was $0.6 million compared
to cash generated by financing activities of $11.6 million in the comparable 2018 period. The cash used in
financing activities during the three months ended March 31, 2019 consisted largely of principle and interest
on repayment of mortgage, leases and promissory notes. In the three months ended March 31, 2018
financing activities includes net proceeds of $9.5 million in mortgage financing and $2.4 million from the
exercise of warrants and stock options.
Liquidity
The Company monitors its liquidity on a continuous basis to ensure there is sufficient capital to meet
business requirements. The Company manages its capital structure and adjusts it to take into account
changes in economic conditions and the risk characteristics of the underlying assets. To maintain or adjust
its capital structure, the Company may, where necessary, control the amount of working capital, pursue
financing, manage the timing of its capital expenditures, or sell assets. The Company is not subject to
externally imposed capital requirements.
The Company's capital structure is comprised of a combination of debt and shareholders' equity. The capital
structure of the Company as at March 31, 2019 and December 31, 2018 is as follows:
The Company constantly monitors and manages its cash flows to assess the liquidity necessary to fund
operations. As at March 31, 2019, CannTrust maintained $42.7 million of cash and short term investments,
compared to $72 million at December 31, 2018. Cash and short term investments decreased $29.3 million
in the three months ended March 31, 2019. Working capital provides funds for the Company to meet its
operational and capital requirements. As at March 31, 2019, the Company maintained working capital of
$115 million. On May 6, 2019, the company closed a public offering on the NYSE for gross proceeds of
US$170 million before deducting underwriting discounts and expenses. Management expects the Company
to have adequate funds available on hand to meet the Company’s obligations over the next 12 months.
March 31,
2019
December
31, 2018
$000s $000s
Promissory note 600 800
Mortgage 13,211 13,248
Shareholders' equity 190,179 174,026
Debt to equity 7.3% 8.1%

19
Financial Instruments, Financial Risk Management and Other Instruments
The Company does not utilize financial instruments such as derivatives to manage financial risks.
The Company's financial instruments consist of cash, accounts receivable, restricted cash, short-term
investments, warrants, accounts payable and accrued liabilities, promissory note and mortgage. The
Company does not believe that it is exposed to significant currency or credit risk arising from these financial
instruments. These financial instruments are measured at fair value or are short term in nature where fair
value approximates their carrying value (see note 9 and 18 to the Financial Statements). Investment in
shares of National Access Cannabis are measured at fair value through profit and loss which increase the
volatility of profitability due to price risk.
Contractual Obligations
The Company’s commitments as at March 31, 2019 consisted of the following ($000s):
On March 7, 2018, the Company executed a long-term agreement with Envest Corp. to provide
cogeneration derived heat and power at its 450,000 square foot Perpetual Harvest Facility. As part of the
agreement, CannTrust is committed to $62 million in aggregated lease and maintenance payments for a 20-
year term to secure the rights to the Cogen equipment. The Company is currently utilizing a temporary
Cogen equipment system to provide heat and power while the long-term Cogen solution is being installed.
The installation, once completed, will constitute a lease under IFRS 16 and the Cogen equipment will be
recorded within right-of-use assets, with a corresponding lease liability recognized. Embedded service costs
pertaining to maintenance will be separated from the lease and expensed as incurred.
Years $'000
2019 4,263
2020 3,539
2021 3,511
2022 3,488
2023 3,382
Beyond 47,773
Total 65,956
20
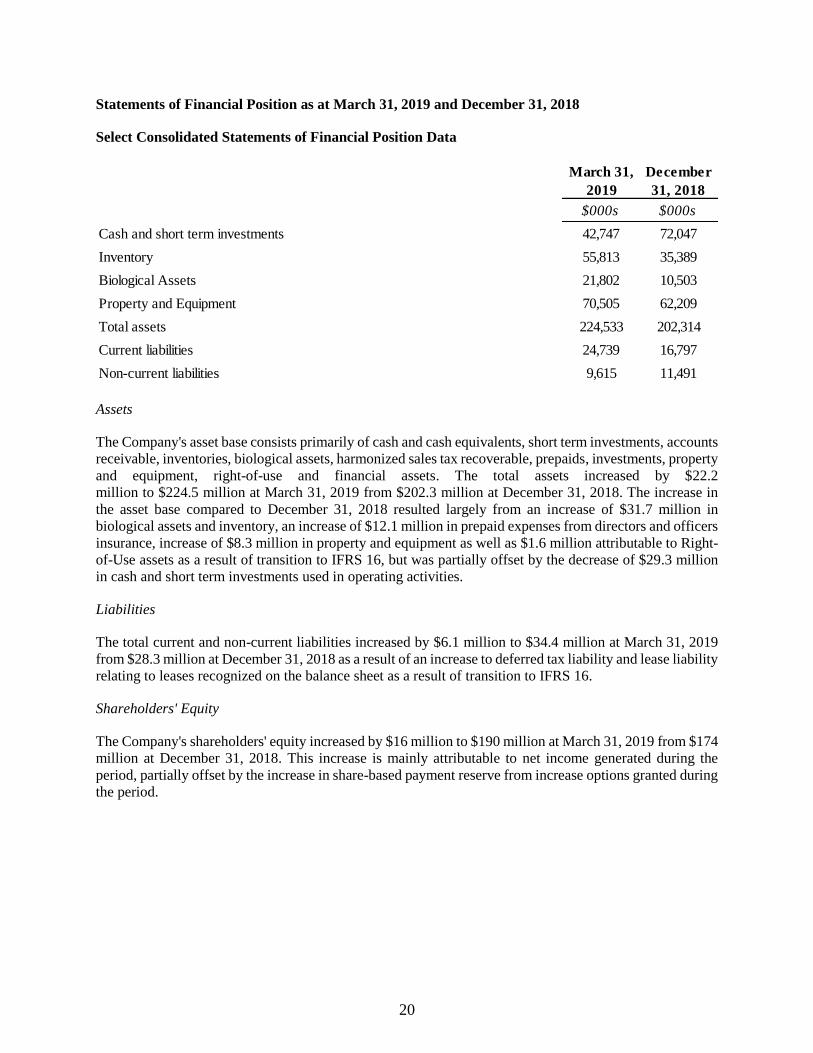
Statements of Financial Position as at March 31, 2019 and December 31, 2018
Select Consolidated Statements of Financial Position Data
Assets
The Company's asset base consists primarily of cash and cash equivalents, short term investments, accounts
receivable, inventories, biological assets, harmonized sales tax recoverable, prepaids, investments, property
and equipment, right-of-use and financial assets. The total assets increased by $22.2
million to $224.5 million at March 31, 2019 from $202.3 million at December 31, 2018. The increase in
the asset base compared to December 31, 2018 resulted largely from an increase of $31.7 million in
biological assets and inventory, an increase of $12.1 million in prepaid expenses from directors and officers
insurance, increase of $8.3 million in property and equipment as well as $1.6 million attributable to Right-
of-Use assets as a result of transition to IFRS 16, but was partially offset by the decrease of $29.3 million
in cash and short term investments used in operating activities.
Liabilities
The total current and non-current liabilities increased by $6.1 million to $34.4 million at March 31, 2019
from $28.3 million at December 31, 2018 as a result of an increase to deferred tax liability and lease liability
relating to leases recognized on the balance sheet as a result of transition to IFRS 16.
Shareholders' Equity
The Company's shareholders' equity increased by $16 million to $190 million at March 31, 2019 from $174
million at December 31, 2018. This increase is mainly attributable to net income generated during the
period, partially offset by the increase in share-based payment reserve from increase options granted during
the period.
March 31,
2019
December
31, 2018
$000s $000s
Cash and short term investments 42,747 72,047
Inventory 55,813 35,389
Biological Assets 21,802 10,503
Property and Equipment 70,505 62,209
Total assets 224,533 202,314
Current liabilities 24,739 16,797
Non-current liabilities 9,615 11,491

21
Related Party Transactions for the three months ended March 31, 2019
During the three months ended March 31, 2019 the Company entered into transactions and had outstanding
balances with various related parties. The transactions with related parties are in the normal course of
business.
Related party transactions for the three months ended March 31, 2019 are summarized as follows:
Compensation to key management and directors of the Company totalling $0.4 million (March 31, 2018 -
$0.4 million) was paid to key management personnel. There were 309,129 (March 31, 2018 – 285,000)
stock options valued at $1.8 million (March 31, 2018 – $2.3 million) issued to key management and
directors during the period. There were Nil (March 31, 2018 – 175,000) stock options valued at $Nil (March
31, 2018 – $0.3 million) exercised by related parties during the period. There were Nil (March 31, 2018 –
75,000) stock options valued at $Nil (March 31, 2018 – $0.3 million) forfeited by related parties during the
period.
The Company incurred $25,000 of management fees to Forum Financial Corporation (“Forum”), for the
three months ended March, 31, 2019. A director and officer of the Company are also officers and a director
of Forum. The management services agreement was cancelled effective March 31, 2019.
The Company incurred legal fees of $0.3 million (March 31, 2018 - $0.2 million) relating to corporate
services provided by a firm at which a director of the Company is a partner.
The Company transacted with its associate Stenocare, whereby The Company sold cannabis extracts to
Stenocare in the amount of $0.2 million.
Share Data
The following table sets forth the Outstanding Share Data for the Company as at May 13, 2019:
Authorized Issued
Common Shares Unlimited 136,563,951
Warrants 9,167,776
Stock Options 10% of outstanding shares 4,331,328
On May 6, 2019, the Company completed an underwritten public offering of 30,909,091 common shares
at a price of US$5.50 per share for gross proceeds to the Company of approximately US$170 million before
deducting underwriting discounts and commissions and estimated offering expenses, and net proceeds of
approximately US$160 million. In connection with the offering, the underwriters have an option to acquire
up to 4,636,363 additional common shares within 30 days of May 1, 2019 at a net price to the Company of
US$5.19 per share.

22
Risks and Uncertainties
The Company is subject to a number of broad risks and uncertainties including general economic
conditions. In addition to these broad risks and uncertainties, the Company has specific risks that it faces,
the most significant of which are included in the Company’s recently filed Annual Information Form dated
March 28, 2019 which can be found on SEDAR at - See "Risk Factors". The risks and uncertainties
discussed herein highlight the more important factors that could significantly affect the Company's
operations and profitability. They do not represent and exhaustive list of all the potential issues that
could affect the financial results of the Company. Additional risks and uncertainties not presently
known to the Company or that the Company believes to be immaterial may also adversely affect the
Company's business, operations and profitability.
There were no significant changes to these risk and uncertainties as of the date of this MD&A.
Accounting Estimates
Certain of the Company's accounting policies set out in Note 3 to the Company's Financial Statements
require that management make decisions with respect to the formulation of estimates and assumptions that
affect the reported amounts of assets, liabilities, revenues and expenses. The Company's significant
accounting estimates are contained in Note 4 of the Company's Financial Statements. The following is a
discussion of the accounting estimates that are critical in determining the Company's financial results.
Valuation of Biological Assets and Inventories
Biological assets, consisting of plants, are measured at fair value less costs to sell up to the point of harvest.
Determination of the fair values of the biological assets requires the Company to make assumptions about
how market participants assign fair values to these assets. These assumptions primarily relate to the level
of effort required to bring the plants up to the point of harvest, sales price, risk, and expected remaining
future yields for the plants. As the valuation of biological assets becomes the basis for the cost of finished
goods inventories after harvest, this is also a significant estimate for the valuation of inventories.
The significant assumptions used in determining the fair value of medical cannabis plants are as follows:
stage of plant growth (days until harvest);
wastage of plants based on their various stages of growth;
expected yield by plant;
expected weighted average selling price per gram of harvested cannabis (based on estimated grams
to be sold for the medical and recreational market);
percentage of costs incurred to date compared to the expected costs to be incurred are used to
estimate fair value of an in-process plant; and
expected number of days to sell the yield from biological assets
Estimated Useful lives of Property and Amortization of Plant and Equipment and Intangible Assets
Depreciation and amortization of property and equipment and finite-life intangible assets is dependent upon
estimates of useful lives, which are determined through the exercise of judgment. The assessment of any
impairment of these assets is dependent upon estimates of recoverable amounts that consider factors such
as economic and market conditions and the useful lives of assets.

23
Share-based Compensation and Warrants
In calculating the share-based compensation expense and the value of warrants, key estimates such as the
value of the Common Shares, the rate of forfeiture of options granted, the expected life of the option, the
volatility of the value of the Common Shares and the risk-free interest rate are used as inputs to the Black
Scholes model.
Taxes
Deferred tax assets will be recognized for all unused tax losses to the extent that it is probable that taxable
profit will be available against which the losses can be utilized. Significant management judgement is
required to determine the amount of deferred tax assets that can be recognized, based upon the likely timing
and the level of future taxable profits together with tax planning strategies. The Company has determined
that the realization of deferred tax assets is not probable on the basis of future taxable income.
Financial Assets
In calculating the fair value of the financial assets, key estimates such as the value of the common shares,
the expected life of the option, the volatility of the value of the common shares and the risk-free interest
rate are used as inputs to the Black Scholes model.
Accounting Standards Adopted in the Period
Change in Accounting Policy
During the year ended December 31, 2018, the Company made a voluntary change in accounting policy to
capitalize the direct and indirect costs incurred before harvest attributable to the biological asset
transformation. The Company believes the new policy is preferable as it matches the recognition of these
costs as an expense in the same period in which the revenue is generated. The impact of this voluntary
change in accounting policy on the financial statements is primarily to reduce cost of goods sold for the
pre-harvest costs and increasing the amount capitalized to biological assets and inventory. The previous
accounting policy was to expense these costs to cost of goods sold during the period in which the direct and
indirect costs were incurred – See note 5 to the Financial Statements.
IFRS 16 ‘Leases’
The Company has adopted IFRS 16 for the period beginning on January 1, 2019. IFRS 16 introduced a
single, on-balance sheet accounting model for lessees. As a result, the Company, as a lessee, has recognized
Right-of-Use assets representing its rights to use the underlying assets and lease liabilities representing its
obligation to make lease payments. The company has applied IFRS 16 using the modified retrospective
approach, under which the cumulative effect of initial application is recognized in deficit at January 1,
2019. Accordingly, the comparative information presented for previous periods have not been restated.
On transition to IFRS 16, the Company recognized Right-of-Use assets and corresponding lease liabilities,
recognizing the difference in deficit as follows:
January 1, 2019
Right-of-Use assets 1,712,037$
Lease Liability 1,891,346
Deferred tax asset 47,517
Deficit 131,792$

24
IFRS 23 ‘Uncertainty over Income Tax Treatments’
IFRIC 23 ‘Uncertainty over Income Tax Treatments’ was issued by the IASB in June 2017 and specifies
the interpretation to be applied to the determination of taxable profit, tax bases, unused tax losses, unused
tax credits and tax rates, when there is uncertainty over income tax treatments under IAS 12. The Company
has adopted IFRIC 23 on January 1, 2019 and had no significant impact.
Selected Quarterly financial information
The following table summarizes selected financial information for the last eight quarters (in $000’s):
(1) In the three months ended June 30, 2018 and 2017, gross profit was restated due to the change in accounting policy. Please
refer to note 5 on the notes to the financial statements for more details.
Non-IFRS Financial Measure and Reconciliation
Adjusted Earnings before Interest, Taxes, Depreciation and Amortization ("EBITDA"). The term Adjusted
EBITDA does not have any standardized meaning under IFRS. Therefore, it may not be comparable to
similar measures presented by other companies.
Management uses Adjusted EBITDA to evaluate the performance of the Company’s business as it reflects
its ongoing profitability. The Company believes that certain investors and analysts use Adjusted EBITDA
to measure a company's ability to service debt and to meet other payment obligations or as a common
measurement to value companies in the biopharmaceutical industry. Adjusted EBITDA has no direct
comparable IFRS financial measure. Such information is intended to provide additional information and
should not be considered in isolation or as a substitute for measures of performance prepared in accordance
with IFRS.
The Company measures Adjusted EBITDA as net income (loss) less unrealized gain on changes in fair
value of biological assets and other income plus fair value changes in biological assets included in inventory
sold, income taxes, interest expense, accretion expense, transaction costs, loss on revaluation of derivative
liability, share based compensation and depreciation and amortization. The Company believes that this
definition is suited to measure the Company’s ability to service debt and to meet other payment obligations.
2019 2018 2018 2018 2018 2017 2017 2017
Q1 Q4 Q3 Q2 Q1 Q4 Q3 Q2
Gross Revenue 18,814$ 18,911$ 12,589$ 9,050$ 7,840$ 6,983$ 6,140$ 4,541$
Net Revenue 16,853 16,166 12,589 9,050 7,840 6,983 6,140 4,541
Gross profit (1)
7,711 (8,282) 12,541 11,221 21,013 11,036 5,357 3,798
Net income (loss) 12,803 (25,522) 421 105 11,442 6,253 655 755
Earning (loss) per share 0.12$ (0.26)$ -$ -$ 0.12$ 0.08$ 0.01$ 0.01$

25
The following table provides a reconciliation of earnings as determined under IFRS to Adjusted EBITDA:
(1) Share based compensation represents non-cash expense recognized in relation to the Company’s stock option plan.
(2) Other income primarily represents the revaluation of the Company’s shares in NAC.
(3) Loss of equity accounted investments represents the Company’s share of the net loss incurred by the Company’s equity
accounted investments including Cannatrek, GWAH, CCTP and Stenocare.
Cash Cost per gram sold
The term Cash Cost per gram sold does not have any standardized meaning under IFRS. Therefore, it may
not be comparable to similar measures presented by other companies.
Management uses Cash Cost per gram sold to evaluate the performance of the Company’s business as it
reflects its operational productivity in economic terms. The Company believes that certain investors and
analysts use Cash Costs per gram sold to measure a company's production capabilities. Cash Cost per gram
sold has no direct comparable IFRS financial measure. Such information is intended to provide additional
information and should not be considered in isolation or as a substitute for measures of performance
prepared in accordance with IFRS.
The Company measures Cash Cost per gram sold as cost of goods sold less depreciation and amortization
contained within cost of goods sold divided by the number grams of dried cannabis and cannabis equivalent
sold during the period. The Company believes that this definition is suited to measure the Company’s
operational productivity in economic terms.
Calculation of Adjusted EBITDA
2019 2018
$000s $000s
Net income 12,803 11,442
Fair value changes in biological assets included in
inventory sold 6,654 4,444
Unrealized loss (gain) on changes in fair value of
biological assets (32,641) (20,495)
Share based compensation (1) 3,406 3,631
Other income (2) (1,518) (29)
Loss of equity accounted investments (3) 123 43
Interest (income) expense, net (43) 72
Accretion expense 63 31
Income Taxes 6,045 -
Depreciation and amortization 1,339 875
Adjusted EBITDA (3,769) 14
Three Months Ended
March 31

26
Disclosure Controls and Internal Controls over Financial Reporting
In accordance with National Instrument 52-109 – Certification of Disclosure in Issuers’ Annual and Interim
Filings, and as required by the applicable rules of the SEC, management is responsible for establishing and
maintaining disclosure controls and procedures (“DC&P”), as defined in Rules 13a-15(e) and 15d-15(e)
under the United States Securities Exchange Act of 1934, as amended (the “Exchange Act”) and internal
control over financial reporting (“ICFR”), as defined in Rules 13a-15(f) and 15d-15(f) under the Exchange
Act. Management has designed ICFR based on the 2013 Internal Control Integrated Framework issued by
the Committee of Sponsoring Organizations of the Treadway Commission.
The Company’s disclosure controls and procedures are designed to provide reasonable assurance that
material information relating to the Company is made known to senior management, including the Chief
Executive Officer (“CEO”) and the Chief Financial Officer (“CFO”) and information required to be
disclosed by the Company is recorded, processed, summarized and reported within the time periods
specified in securities legislation. ICFR is designed by management, under the supervision of the CEO and
CFO, to provide reasonable assurance regarding the reliability of the Company’s financial reporting and
the preparation of its financial statements in accordance with IFRS.
As of December 31, 2018, the Company had limited accounting personnel with expertise to assist in the
effective preparation of financial statements and related note disclosures. In particular, the Company did
not have sufficient resources with appropriate knowledge of IFRS to allow for an independent review in
complex areas of financial reporting with respect to non-routine transactions, resulting in a reasonable
likelihood that a material misstatement to the consolidated financial statements may not be prevented or
detected on a timely basis. As a result of the non-routine transaction assessment, management concluded
that the DC&P and ICFR were not effective as of December 31, 2018, and has since implemented new
mitigating controls and procedures. This assessment was not related to internal control deficiencies
identified for routine operating activities. The Company has devoted significant resources and time to
design and implement its current ICFR program and continues to engage third party resources specialized
in ICFR implementations to enhance its current controls and the associated processes and systems.
Additionally, the Company has provided significant human resources to these efforts, including hiring new
employees to assist in ICFR activities and training of key process owners. In particular, since December
31, 2018, the Company hired a new Chief Financial Officer and a new Vice President of Finance, both of
whom have expertise in internal controls and governance, to enhance the existing team. Management has
consistently embraced the importance of maintaining a robust ICFR program and is committed to enhancing
the current system through continuous improvement and review. As at March 31, 2019, the Company
continues to be in the process of evaluating the effectiveness of the new controls and procedures
implemented to enhance the control environment.
2019 2018
$000s $000s
Cost of goods sold 9,143 2,877
Depreciation and amortization included in cost of
goods sold (807) (238)
8,336 2,639
Dried Cannabis and Cannabis Equivilent Sold (grams) 3,014 1,014
Cash Cost per gram sold 2.77 2.60
Three months ended
March 31
27
Changes in Internal Control Over Financial Reporting
In the ordinary course of business, the Company’s management reviews its ICFR system and make changes
to its applications and processes to improve such controls and increase efficiency, while ensuring that the
Company maintains an adequate internal control environment. Other than as discussed above, during the
first quarter of 2019 there were no changes in ICFR that have materially affected, or are reasonably likely
to materially affect, the Company’s internal control over financial reporting.
Limitations of Controls and Procedures
The Company's management, including the Chief Executive Officer and Chief Financial Officer, believes
that any DC&P or ICFR, no matter how well conceived and operated, can provide only reasonable, not
absolute, assurance that the objectives of the control system are met. Further, the design of a control system
must reflect the fact that there are resource constraints, and the benefits of controls must be considered
relative to their costs. Because of the inherent limitations in all control systems, they cannot provide
absolute assurance that all control issues and instances of fraud, if any, within the Company have been
prevented or detected. These inherent limitations include the realities that judgments in decision-making
can be faulty and that breakdowns can occur because of simple error or mistake. Additionally, controls can
be circumvented by the individual acts of some persons, by collusion of two or more people, or by
unauthorized override of the control. The design of any control system is also based in part upon certain
assumptions about the likelihood of future events and there can be no assurance that any design will succeed
in achieving its stated goals under all potential future conditions. Accordingly, because of the inherent
limitations in a cost-effective control system, misstatements due to error or fraud may occur and not be
detected.
Additional Information
Additional information relating to the Company, including the Company's audited year-end financial results
and unaudited quarterly financial results, can be accessed on SEDAR (www.sedar.com) and in the United
States on EDGAR (www.sec.gov/edgar). For further information shareholders may also contact the
Company by email via [email protected].