MANAGEMENT’S DISCUSSION & ANALYSIS OF EDC's...
29
MANAGEMENT’S DISCUSSION & ANALYSIS OF EDC's FINANCIAL CONDITION AND RESULTS OF OPERATIONS The following report represents management’s discussion and analysis of EDC's financial condition and results of operations for the twelve month period ending December 31, 2012 and is intended to help our shareholders and other users of our financial statements better understand our operations and attendant financial results and current financial condition. This information is provided as a supplement to, and should be read in conjunction with, our audited 2012 Consolidated Financial Statements and the accompanying notes, prepared in accordance with US GAAP. This discussion should not be considered all inclusive as it does not necessarily include all changes regarding general economic, political, governmental and environmental events. As used in this report, “Company”, “we,” “us,” “our,” and “EDC” means Eurasia Drilling Company Limited and, where the context requires, includes our subsidiaries. This report contains forward-looking statements that involve known and unknown risks, uncertainties, and other factors which may cause our actual results, performance, or achievements to be materially different from any future results, performance, or achievements expressed or implied by such forward-looking statements. Nature of operations We are the largest provider of onshore drilling services in Russia, as measured by the number of meters drilled, according to REnergyCo. We also provide offshore drilling services in the Caspian Sea and are the largest provider of such services in the sectors where we operate, based on the number of jack-up drilling rigs, according to Wood Mackenzie. We offer our onshore integrated well construction services and workover services to local and international oil and gas companies primarily in Russia and our offshore drilling services to Russian and international oil and gas companies in the Russian, Kazakh and Turkmen sectors of the Caspian Sea. In addition, we provide onshore drilling services in Iraq. Our total land fleet consists of 670 rigs consists of 257 onshore drilling and sidetracking rigs and 413 workover rigs. Our offshore fleet consists of two jack-up rigs with an additional two under construction. For the year ended December 31, 2012, we had total revenue of US$3,237 million, EBITDA of US$790 million and net income of US$382 million, compared to total revenue of US$2,767 million, EBITDA of US$603 million and net income of US$283 million for the year ended December 31, 2011 and total revenue of US$1,822 million, EBITDA of US$437 million and net income of US$207 million for the year ended December 31, 2010. Our business is currently organized into two main divisions: onshore and offshore drilling services. For the year ended December 31, 2012, we had total revenue of US$3,071 million from our onshore division and total revenue of US$166 million from our offshore division. For the year ended December 31, 2012, we had an estimated market share of approximately 29% of the onshore drilling services market in Russia, as measured by the number of meters drilled, compared to 25% for the year ended December 31, 2011, according to REnergyCo. Our onshore fleet of 253 land drilling and sidetracking rigs is located in all major Russian oil and gas producing regions, including Western Siberia, Volga-Urals, Eastern Siberia and Timan Pechora. In all these regions we have well-established land support bases. We have expanded our Russian onshore drilling business organically since acquiring substantially all of LUKOIL's onshore drilling assets in 2004. Since our entry into the onshore drilling services, we have transformed the business from an in-house cost center to a major independent oilfield service provider with
Transcript of MANAGEMENT’S DISCUSSION & ANALYSIS OF EDC's...

MANAGEMENT’S DISCUSSION & ANALYSIS OF EDC's FINANCIAL CONDITION AND RESULTS OF OPERATIONS
The following report represents management’s discussion and analysis of EDC's financial condition and results of operations for the twelve month period ending December 31, 2012 and is intended to help our shareholders and other users of our financial statements better understand our operations and attendant financial results and current financial condition. This information is provided as a supplement to, and should be read in conjunction with, our audited 2012 Consolidated Financial Statements and the accompanying notes, prepared in accordance with US GAAP. This discussion should not be considered all inclusive as it does not necessarily include all changes regarding general economic, political, governmental and environmental events. As used in this report, “Company”, “we,” “us,” “our,” and “EDC” means Eurasia Drilling Company Limited and, where the context requires, includes our subsidiaries.
This report contains forward-looking statements that involve known and unknown risks, uncertainties, and other factors which may cause our actual results, performance, or achievements to be materially different from any future results, performance, or achievements expressed or implied by such forward-looking statements.
Nature of operations
We are the largest provider of onshore drilling services in Russia, as measured by the number of meters drilled, according to REnergyCo. We also provide offshore drilling services in the Caspian Sea and are the largest provider of such services in the sectors where we operate, based on the number of jack-up drilling rigs, according to Wood Mackenzie. We offer our onshore integrated well construction services and workover services to local and international oil and gas companies primarily in Russia and our offshore drilling services to Russian and international oil and gas companies in the Russian, Kazakh and Turkmen sectors of the Caspian Sea. In addition, we provide onshore drilling services in Iraq. Our total land fleet consists of 670 rigs consists of 257 onshore drilling and sidetracking rigs and 413 workover rigs. Our offshore fleet consists of two jack-up rigs with an additional two under construction.
For the year ended December 31, 2012, we had total revenue of US$3,237 million, EBITDA of US$790 million and net income of US$382 million, compared to total revenue of US$2,767 million, EBITDA of US$603 million and net income of US$283 million for the year ended December 31, 2011 and total revenue of US$1,822 million, EBITDA of US$437 million and net income of US$207 million for the year ended December 31, 2010.
Our business is currently organized into two main divisions: onshore and offshore drilling services. For the year ended December 31, 2012, we had total revenue of US$3,071 million from our onshore division and total revenue of US$166 million from our offshore division.
For the year ended December 31, 2012, we had an estimated market share of approximately 29% of the onshore drilling services market in Russia, as measured by the number of meters drilled, compared to 25% for the year ended December 31, 2011, according to REnergyCo. Our onshore fleet of 253 land drilling and sidetracking rigs is located in all major Russian oil and gas producing regions, including Western Siberia, Volga-Urals, Eastern Siberia and Timan Pechora. In all these regions we have well-established land support bases. We have expanded our Russian onshore drilling business organically since acquiring substantially all of LUKOIL's onshore drilling assets in 2004. Since our entry into the onshore drilling services, we have transformed the business from an in-house cost center to a major independent oilfield service provider with

| Eurasia Drilling Company Limited
2 | Management’s Discussion & Analysis
sound finances and materially improved operating efficiency. Our onshore drilling services include the construction of production, exploration and appraisal oil and gas and certain other types of wells, including vertical, deviated and horizontal wells, ranging from a depth of approximately 1,200 to more than 6,400 meters. In addition, we provide a wide range of onshore workover and sidetracking services. As of December 31, 2012 our total workover fleet consisted of 413 workover rigs.
In April 2011, we entered into a strategic alliance in Russia and the CIS with Schlumberger, pursuant to which Schlumberger became our preferred supplier for certain drilling services for a five-year period. The transaction also involved an asset swap where we acquired Schlumberger's drilling, sidetracking and workover assets in Russia and sold them certain of our non-core drilling services businesses and assets to our services portfolio. The transaction positively contributed to our operational and financial results.
Our customers include a number of major Russian and international oil and gas companies operating in Russia, such as LUKOIL, Rosneft, Gazprom Neft, TNK-BP, Rusvietpetro, Pechoraneft, Russneft and Tomskneft.
We entered the international drilling market outside the CIS for the first time in the second half of 2012. We acquired three land drilling rigs from an existing drilling contractor and late in 2012 added a fourth rig in Iraq. All four rigs are contracted to international oil and gas companies Afren, Gulf Keystone, HKN and Marathon Oil.
For the year ended December 31, 2012, we were the largest offshore drilling contractor operating in the jack-up market of the Russian, Kazakh and Turkmen sectors of the Caspian Sea. In these sectors there are three jack-up rigs currently operating and we own two of them, the ASTRA and SATURN jack-up rigs, according to Wood Mackenzie. We entered the offshore drilling business in 2006 by acquiring the ASTRA jack-up rig from LUKOIL. Since 2009, we have provided our drilling services on LUKOIL's marine ice-resistant fixed platform LSP-1 on the Yuri Korchagin field in the Russian sector of the Caspian Sea. In 2011, we acquired our second jack-up rig, the SATURN, from Transocean. Our offshore drilling services division constructs oil and gas exploration and production wells in waters with depths of up to 107 meters. In addition, we have two new-build jack-up rigs that are in the process of being constructed by Lamprell plc, the NEPTUNE and the MERCURY rigs, with delivery scheduled for the third quarter of 2013 and the fourth quarter of 2014, respectively.
Our offshore customers in the Caspian Sea have included LUKOIL, Petronas, Dragon Oil, CMOC (a joint venture between Shell, KazMunayTeniz and the Oman Pearls Company Ltd) and the N Operating Company (a joint venture between KazMunayGas, ConocoPhillips and Mubadala).
General overview
Demand for drilling services depends on a variety of factors, including worldwide demand for oil and gas, the ability of OPEC to set and maintain production levels and pricing, the level of production of non-OPEC countries, and the policies of various governments regarding exploration and development of their oil and gas reserves. Our results of operations depend on the levels of activity in Russia and the countries of the Caspian Sea, and the prices of crude oil and natural gas in Russia. To date most of our drilling activities have been in oil provinces rather than gas provinces. This business mix may slowly change over time if we obtain new clients whose activities are more heavily weighted to drilling natural gas wells.
The oilfield services market in Russia is robust and it is arguably the most stable land market of any size in the world. Onshore drilling activity (as measured by wells or metres drilled) fell in 2009 as compared to 2008 by only around 6%, which was substantially less than the reductions in drilling activity experienced in the world’s other large markets. Following the global recession, oil prices stabilised in 2010 and have remained stable at historically high levels in 2011 and 2012, giving oil and gas companies confidence to increase their CAPEX budgets. Russia’s oil production and drilling volumes have continued to grow in 2012; in 2012 average oil and condensate output grew to 10.3 mln bpd, an increase of approximately 1%, and drilling volumes

| Eurasia Drilling Company Limited
3 | Management’s Discussion & Analysis
expanded to 21 million metres, an increase of 9.6% as compared to the full year 2011, according to REnergyCO.
Russia’s oil production is mostly comprised of output from mature fields, which in 2012 produced over 80% of total oil output in Russia. Since 2008 the output from these fields has been declining; the overall growth in Russian production was achieved by the contribution from greenfields coming on stream in Eastern Siberia, Timan-Pechora, the Caspian, and Sakhalin.
Operations review
During 2012 our business continued to benefit from favorable market conditions resulting primarily from fairly stable commodity prices and a resulting increase in demand for our services. Our 2012 results were impacted by consolidation from the beginning of the year, the results of operations of ex-Schlumberger drilling, sidetracking, and workover assets, which we acquired April 28, 2011, and the results of SATURN, the jack-up drilling rig acquired February 8, 2011 from Transocean, impacting the year on year comparisons. In addition, on July 24, 2012 we announced the acquisition of two onshore drilling rigs in Northern Iraq, and later in the year added two more drilling rigs.
Onshore business
Our 2012 onshore operating results include:
Drilling output of 6.051 million metres, 26.6% above the output achieved in the corresponding period of 2011 (4.777 million metres);
Horizontal metres drilled during 2012 were down slightly by 1.9% compared to the corresponding period of 2011 and amounted to 862 thousand metres;
Exploration drilling volumes increased by 25.9% during 2012 compared to the corresponding period of 2011;
Sidetracking activity remained at strong levels with 225 well sidetracks performed during 2012;
The share of our largest customer, LUKOIL, amounted to 57% of our total metres drilled during 2012, as compared to 55% during the corresponding period of 2011; however, LUKOIL drilling volumes increased by 30.4% for the same period;
The share of Rosneft, our second largest customer, was 24% of our total metres drilled during 2012 as compared to 19% during the corresponding period of 2011;
Our market share increased to approximately 29% based on metres drilled onshore in Russia during 2012, up from 25% in the corresponding period of 2011;
In 2012 we acquired four onshore drilling rigs in Iraq, which are currently under contract or being tendered to international customers.
Our Russian onshore drilling volumes increased by 26.6% compared to the volumes achieved in 2011. Growth in metres drilled in our legacy operations outpaced the overall Russian market growth and amounted to 16% in 2012 versus the corresponding period of 2011. The results of onshore drilling operations from the ex-Schlumberger drilling assets (“SGC”) further contributed to the overall growth of metres drilled. For the year ended December 31, 2012 drilling volumes by SGC accounted for 19% of total metres drilled. As a result of such outstanding performance our onshore Russian market share based on metres drilled increased to approximately 29%, or four percentage point above our market share in 2011.
EDC’s horizontal drilling volumes in 2012 were slightly down from the corresponding period of 2011, and amounted to 862 thousand metres, which corresponds to 14% of our total metres drilled. In horizontal drilling the component of high value third party services, such as directional drilling and telemetry services, is usually much more significant compared to conventional vertical or deviated well drilling.
Our cooperation with our main customer, LUKOIL, continues to be strong as we operate under long-term Framework Agreements that govern minimum volume commitments and indicative pricing ranges. The most recent Framework Agreement expired at the end of 2012 and we have concluded a new Framework

| Eurasia Drilling Company Limited
4 | Management’s Discussion & Analysis
Agreement for the three years to the end of 2015 that includes greater flexibility regarding fleet deployment and contract structures. Pursuant to the new agreement, depending on the complexity of the drilling, our services are provided either on a general contractor "turn-key" basis or on a day rate basis. Completion services which are a part of the well construction service that we provide, pursuant to the new framework agreement, are contracted separately, given the increased complexity of such services. In 2012 LUKOIL increased its drilling volumes by 30.4% over the corresponding period of 2011. Despite such a significant increase in LUKOIL’s drilling activity, its share in our total drilling volumes increased only by two percentage points compared to 2011. Most of the growth comes from intensified drilling activity in Western Siberia.
It’s our strategic priority to diversify our customer base in Russia while building long-term relationships with our clients. As such, the share of Rosneft increased to 24% during 2012 in our total drilling volumes from 19% in 2011 as the metres drilled surged by 60.2% period-over-period. Most of the growth is attributable to the consolidation of SGC operations from the beginning of 2012. Rosneft is SGC’s largest client and accounted for 64% of its drilling volumes for the period. In addition, our legacy drilling operations, represented by OOO Burovaya Kompaniya Evraziya (“BKE”), were awarded more contracts to drill in the Vankor field in Eastern Siberia. Management believes that EDC has a strong proven track record with Rosneft and is eager to build the cooperation beyond the existing frontiers.
In 2010 we started to provide drilling services to TNK-BP. For 2012 its share of our total drilling volumes accounted for 2% compared to approximately 3% 2011, as the volumes decreased by 46 thousand metres period-over-period. The decrease is the result of lower activity in Western Siberia offset by increased activity in the Orenburg area, where drilling is much slower and more complex as compared to the drilling of an average well in Western Siberia. The share of TNK-BP in our total revenue reflects this complexity and despite the decrease in metres drilled period-over-period, revenues remained at a meaningful level. In addition, early in 2012 we concluded a three-year agreement with TNK-BP for drilling services in the Orenburg area. We are determined to meet or exceed all key performance indicators specified in the agreement.
One of the notable events of 2012 is the award of a drilling contract on the Novopostovskoe field in the Yamalo-Nenetsk Region, one of Gazpromneft’s greenfield projects, where drilling commenced in May 2012. We’ve also placed one rig for Gazpromneft in the Orenburg area. Overall the share of Gazpromneft in our drilling volumes decreased to 10% during 2012, compared to 15% in 2011. EDC still provides a sizable 24% of Gazpromneft's total drilling volumes in Russia, according to REnergyCo in 2012, and we are expanding collaboration in geographies of strategic importance to this customer.
Our client portfolio includes the four largest E&P companies in Russia, which, together, accounted for about 60% of the total drilling volumes in Russia in 2012, based on REnergyCo. We also continue to work for smaller oil and gas companies such as Pechoraneft, Samaranafta, Rusvietpetro, Russneft and others.
The availability of rigs is one of the keys to being a successful drilling company. Our rig fleet as of December 31, 2012 totaled 257 onshore drilling and sidetracking rigs, one rig less than as of December 31, 2011. Our rigs are located in almost of the major oil and gas provinces of Russia and we continue to invest in modernisation of our rig fleet. Management believes that the effective age of our rig fleet is less than Russia’s average of 16 years, as per Douglas Westwood estimates. 34% of our rigs are less than 5 years old and only 33% of our rigs are over 20 years old compared to Russia’s average of 59% as per Douglas Westwood. Our rigs are capable of drilling a wide range of oil and gas wells, including vertical, deviated, horizontal, and extended-reach wellbores up to 6,400 metres (21,000 feet) in total length. More than half of our rigs are configured for pad drilling, the method that we believe will dominate future developments.
In Russia, as in the rest of the world, unexploited oil and gas reserves increasingly occur in more challenging environments, both geographically and geologically. The services market in Russia is evolving toward higher technological content and advanced techniques. As technology applications advance, so do the costs of bringing a barrel of hydrocarbons to market. To justify the higher costs, technologies must deliver greater efficiency and production potential to the oil and gas producers. To satisfy this requirement, and to ensure the stability and further growth of oil production in Russia, we forecast an increasing requirement for new
| Eurasia Drilling Company Limited
5 | Management’s Discussion & Analysis
modern rigs. We continue to deliver on our five year rig fleet upgrade and modernisation plan, developed in 2010, according to which 11 rigs were contracted in 2012 for 2013/early 2014 delivery. The drilling rigs that we are ordering are produced by Russian and Chinese manufacturers at prices significantly lower than the recent peak in 2008, with considerably shorter lead times.
Our onshore workover and sidetracking operations continue to be an important part of our business. Our workover fleet as of December 31, 2012 totaled to 413 workover rigs, as compared to 330 rigs the previous year. The increase is due to the purchase of new workover rigs which are intended to replace older workover rigs due for retirement later this year. Growth in our total workover and sidetracking jobs performed in 2012 has been quite moderate.
We commenced drilling operations in Iraq in June 2012 by acquiring three land drilling rigs from an existing drilling contractor and added a fourth rig in Iraq later in 2012. We manage our operations through two offices and a rig yard in Iraq. There is also an administrative office located in Houston. We operate four single well drilling rigs capable of drilling wells of up to 5,000 metres in depth. All four rigs are contracted to international oil and gas companies including Afren, Gulf Keystone, HKN and Marathon Oil.
Offshore business
Our 2012 offshore operating results include:
During 2012 our ASTRA jack-up rig was employed in Russian and Kazakh waters of the Caspian Sea;
Our SATURN jack-up rig continued its operations for PETRONAS Carigali (Turkmenistan) Sdn Bhd (PETRONAS) in Turkmen waters of the Caspian Sea; during 2012 four geological sidetracks were performed and two wells were drilled;
In September 2012 EDC signed a multi-year contract extension with PETRONAS for drilling offshore Turkmenistan, effective January 9, 2013;
We drilled and completed six wells on Lukoil's Yuri Korchagin field platform in the Caspian Sea including five extended-reach horizontal development wells;
Modules of our 3rd jack-up rig, the new-build NEPTUNE, were shipped to the Caspian Sea from Lamprell's shipyard in the UAE during 2012; and
In April 2012 we contracted Lamprell to build our 4th jack-up drilling rig for our operations in the Caspian Sea.
Our offshore operations remained strong in 2012. Our crews remained active on LUKOIL’s Yuri Korchagin field platform, drilling five challenging extended reach development (ERD) wells. ERD on Yuri Korchagin is expected to continue. During 2012 the longest ERD well drilled by us offshore on this field was 7.4 km.
Our ASTRA jack-up was deployed on the N Block in the Kazakh sector of the Caspian Sea, drilling three exploration wells for N Operating Company, a joint venture between KazMunayGas, ConocoPhillips and Mubadala. Once it completed operations in N Block, the ASTRA moved to Russian waters of the Caspian Sea to work for LUKOIL where one well was drilled during 2012.
Our SATURN jack-up continues operations for Petronas in Turkmenistan, and in the end of 2012 we signed a multiyear contract extension with Petronas for drilling offshore Turkmenistan in the Caspian Sea. Effective from January 9, 2013, our jack-up drilling rig SATURN is contracted for a three-year period. The award marks a continuation of several previous multi-year contracts, as SATURN has been contracted to Petronas since 2003, working almost entirely throughout this period in Turkmenistan. In June 2012 the SATURN achieved a major milestone of working continuously for five years without a Lost Time Incident (LTI).
Fabrication of NEPTUNE, our third Caspian jack-up rig, remains on schedule for deployment in the third quarter of 2013, and during 2012 all the rig modules were shipped via the Volga-Don canal system to the shipyard in the Caspian Sea. The LeTourneau designed Super 116E hull and related components are being pre-fabricated by Lamprell in its Sharjah facility, while the remaining component fabrication, final assembly, and commissioning are being performed at a shipyard in the Caspian Sea.
| Eurasia Drilling Company Limited
6 | Management’s Discussion & Analysis
In April 2012 we ordered a 4th jack-up rig for our Caspian Sea operations from Lamprell; this rig will be another LeTourneau Super 116E, which we believe is the most versatile and efficient design in its class. This rig is planned for late 2014 delivery. Both Super 116E jack-ups we have on order are designed to operate in water depths of up to 350 feet, and will have rated drilling depths of 30,000 feet.
The demand for jack-up rigs in the Caspian Sea has reached a level where we are confident that both new high-spec rigs will be fully contracted for several years at favorable operating rates, once commissioned.
Non-US GAAP Measure
Reconciliation of Net Income to EBITDA
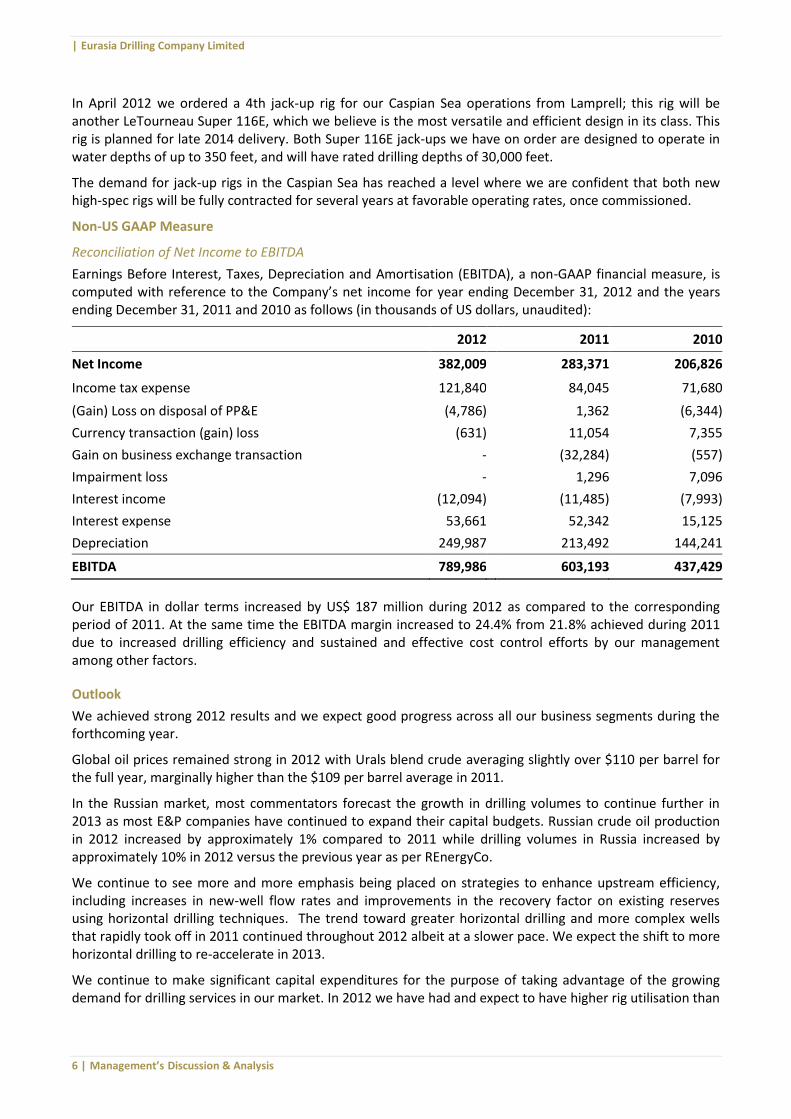
Earnings Before Interest, Taxes, Depreciation and Amortisation (EBITDA), a non-GAAP financial measure, is computed with reference to the Company’s net income for year ending December 31, 2012 and the years ending December 31, 2011 and 2010 as follows (in thousands of US dollars, unaudited):
2012 2011 2010
Net Income 382,009 283,371 206,826
Income tax expense 121,840 84,045 71,680
(Gain) Loss on disposal of PP&E (4,786) 1,362 (6,344)
Currency transaction (gain) loss (631) 11,054 7,355
Gain on business exchange transaction - (32,284) (557)
Impairment loss - 1,296 7,096
Interest income (12,094) (11,485) (7,993)
Interest expense 53,661 52,342 15,125
Depreciation 249,987 213,492 144,241
EBITDA 789,986 603,193 437,429
Our EBITDA in dollar terms increased by US$ 187 million during 2012 as compared to the corresponding period of 2011. At the same time the EBITDA margin increased to 24.4% from 21.8% achieved during 2011 due to increased drilling efficiency and sustained and effective cost control efforts by our management among other factors.
Outlook
We achieved strong 2012 results and we expect good progress across all our business segments during the forthcoming year.
Global oil prices remained strong in 2012 with Urals blend crude averaging slightly over $110 per barrel for the full year, marginally higher than the $109 per barrel average in 2011.
In the Russian market, most commentators forecast the growth in drilling volumes to continue further in 2013 as most E&P companies have continued to expand their capital budgets. Russian crude oil production in 2012 increased by approximately 1% compared to 2011 while drilling volumes in Russia increased by approximately 10% in 2012 versus the previous year as per REnergyCo.
We continue to see more and more emphasis being placed on strategies to enhance upstream efficiency, including increases in new-well flow rates and improvements in the recovery factor on existing reserves using horizontal drilling techniques. The trend toward greater horizontal drilling and more complex wells that rapidly took off in 2011 continued throughout 2012 albeit at a slower pace. We expect the shift to more horizontal drilling to re-accelerate in 2013.
We continue to make significant capital expenditures for the purpose of taking advantage of the growing demand for drilling services in our market. In 2012 we have had and expect to have higher rig utilisation than

| Eurasia Drilling Company Limited
7 | Management’s Discussion & Analysis
in prior years. Pricing for drilling services in 2012 is more favourable than in 2011 as our customers started to observe some tightness in the rig supply, especially in heavier rig classes, which renewed certain clients’ interest in establishing multi-year contracts to insure rig availability for their future drilling plans.
For 2013 we expect our onshore drilling volumes to moderately exceed 2012 volumes, however this estimate assumes an increase in horizontal drilling of up to 50% as we continue to see increased demand from our customers for more horizontal drilling and complex drilling in general. Given the strong growth in more complex drilling services, we expect our total revenues and EBITDA margin to continue to increase in 2013 as we continue to improve utilisation, achieve further operating efficiencies and benefit from the strong market environment in the offshore Caspian Sea.
The Company’s relationship with its customers continues to be strong. Most of our customers increased their drilling volumes during 2012 compared to the corresponding period of 2011 and we expect this trend to continue into 2013. We expect Rosneft to account for approximately a quarter of our total drilling volumes with the gains coming from both our legacy business and the drilling assets acquired from Schlumberger. The share of our major customer, LUKOIL, is projected to be at approximately 55% of total EDC drilling volumes. We expect our drilling volumes with Gazpromneft to continue to decline in Western Siberia, which should be offset by volumes gained in the Yamal area.
In 2013 the well intervention market in Russia is projected to expand as high oil prices encourage efforts to prolong and enhance existing well production. Workover and sidetracking drilling activity are expected to be strong contributors to the Company’s revenue in 2013. We continue to provide workover services to Rosneft in the Vankor field in East Siberia, which we commenced in the second quarter of 2011. The workover assets acquired from Schlumberger are well utilised and primarily contracted to TNK-BP in their Samotlor field, representing a newer area of activity for EDC.
EDC has established a significant offshore presence, beginning our first platform drilling services contract in 2009 and adding a second jack-up rig (the SATURN) to our fleet in early 2011. The ASTRA jack-up drilling rig is committed to a full 12 month program in 2013 for drilling in the Russian and Kazakh sectors of the Caspian Sea at attractive day-rates. The SATURN jack-up will continue drilling for Petronas under a new 3-year contract effective January 9, 2013 in Turkmen waters of the Caspian Sea. We will continue to provide our services on Lukoil’s Yuri Korchagin field ice-resistant platform throughout the year, drilling complex extended reach wells. Our third jack-up rig, new-build NEPTUNE, is currently being assembled in a shipyard in the Caspian Sea, with the rig expected to begin operations in the third quarter of 2013. Construction of our fourth jack-up drilling rig, new-build MERCURY, is proceeding as planned with expected completion near the end of 2014. First rig component shipments are expected to start at the end of 2013. We continue to evaluate opportunities for further expansion in this growing market.
Having made an initial foray into the international drilling market with the acquisition of two rigs in Iraq in July 2012, in late 2012 EDC added a third onshore drilling rig and purchased a new fourth rig from an international vendor in Houston. In 2013 we will have four rigs under contract in Iraq working for large independent oil companies. We continue to evaluate opportunities outside Russia and the CIS.
Certain Factors Affecting our Results of Operations
Macroeconomic Factors Affecting Oil Companies' Capital Expenditure Programs
Our results of operations are subject to the business cycles of our customers in the oil and gas sector and, more specifically, on their planned capital expenditure programs and their ability to execute them. Oil and gas companies rely on their cash flows from operating activities to finance significant portions of their capital expenditures. Such cash flows depend heavily on the global prices for crude oil and natural gas, which affect the prices that our customers receive for sales of their products. Accordingly, oil and gas companies' budgets are normally based on assumptions of expected crude oil and natural gas prices for the relevant periods. Lower prices may reduce the amount of oil and gas that our customers can produce economically or reduce the economic viability of projects, both planned and in development. A substantial or extended decline in

| Eurasia Drilling Company Limited
8 | Management’s Discussion & Analysis
crude oil and natural gas prices could result in lower capital expenditures by our customers, and, consequently, lead to a reduction in the number of wells they commission to be drilled. Fluctuations in our customers' capital expenditures have caused the results of our drilling operations to vary from year to year.
World prices for crude oil are characterized by significant fluctuations determined by the global balance of supply and demand, expectations regarding future supply and demand, the condition of the world economy and geopolitical events, prices of, demand for and availability of alternative fuels and many other factors beyond our control. Natural gas prices in Russia are regulated by the Russian government. While Russian natural gas prices have increased in recent years, and are expected to continue to rise to a level closer to parity with export netbacks, they are still significantly below world levels.
Change in Mix of Services
Because margins can vary significantly amongst the services we provide, our results of operations are affected by changes in the mix of onshore and offshore drilling and workover services we provide to our customers. The services we provide in our onshore division have expanded from offering primarily conventional production and exploration drilling services in January 2005 to offering a wider range of drilling and workover services, including sidetracking, horizontal, and underbalanced drilling.
For example, in 2012 we drilled 862,309 metres utilizing horizontal drilling techniques, representing 14% of our total drilling volumes, while in 2011 our horizontal drilling operations were 879,090 metres, or about 18% of total drilling volumes. Unexploited oil and gas reserves in Russia increasingly occur in more challenging environments, both geographically and geologically, and drilling is getting increasingly complex. "Easy to access" reservoirs that were intensively developed during past decades are no longer capable of delivering appropriate flow rates using conventional drilling techniques. As existing brownfield resources deplete, particularly in such mature oil production provinces as Western Siberia and Volga Urals, the period of sustainable production growth from conventional oil is ending and oil companies are being pushed to develop less explored regions where the complexity of drilling and, accordingly, its costs, are currently higher. Additionally, Russia's strategic goal to maintain oil production at least at current levels is driving higher drilling volumes and complexity of drilling as oil becomes harder to extract from maturing brownfields. Looking forward we see an increase in horizontal drilling as our customers report higher flow rates from wells drilled horizontally. In many instances vertical wells are not economically feasible due to low flow rates. The horizontal drilling technique is especially beneficial when used to drill reservoirs with a greater horizontal dimension than vertical thickness. Douglas-Westwood estimates that horizontal drilling could improve initial well flow rates by two to seven times in some reservoirs.
Our margins are also affected by the level of pass-through third party services in our expenses and revenue. Under most of our onshore drilling contracts, we act as a general contractor and are contractually responsible for managing all aspects of the drilling process, including certain services we do not perform ourselves. Therefore, historically, some of the revenue has related to pass-through third party services and products sold to our customers with little or no related mark-up (such as, for example, telemetry and technology services for horizontal drilling). The corresponding payments we make to third party service providers are recorded under services of subcontractors. In 2012, we experienced a decrease in pass-through services due to our customer LUKOIL-West Siberia starting to contract for telemetry services directly with the third party provider from May 2012 as well as due to certain other non-recurring factors.
Productivity
Our results of operations are affected by the productivity of our crews, which in turn depends on a number of factors. These factors include crew training and incentives, operating procedures, fleet upgrades and modernization, logistics flow and mix of services.

| Eurasia Drilling Company Limited
9 | Management’s Discussion & Analysis
Our core productivity as measured in metres drilled per crew per day improved by 8% during 2012 as compared to 2011. Over the medium-term to long-term we expect our productivity to continue to improve due to the ongoing implementation and utilization of more advanced drilling technologies and the application of new standards to our drilling operations. Advanced crew training and application of innovative technologies have allowed us to both improve rates of penetration and reduce non-productive time. Examples of technological advancements include wider usage of polycrystalline diamond compact drill bits, introduction of new generation drilling motors, optimization of bottom-hole assembly and mud programs/properties, and real-time drilling navigation. The use of top-drives and four-step drilling mud cleaning systems on our high specification rigs further improved rates of penetration and efficiency in the increasingly challenging wells we are drilling.
During the last several years we have witnessed a number of factors that could moderate the rate of productivity improvement when measured on a per meter basis. All these factors can be broadly described as changing the mix of services that we provide to our customers. Horizontal wells are inherently more time consuming to drill than comparable deviated wells. Another factor that affects our crew productivity is seasonality described in more detail below.
Seasonality and Extreme Weather Conditions
Our results of operations in both our onshore and offshore segments have experienced in the past, and are expected to continue to experience, seasonal fluctuations in revenue and expenses as a result of weather conditions. Our revenue from onshore and offshore drilling services can be negatively affected by particularly severe winter weather in certain regions of Russia that may make oil and gas operations difficult and potentially non-operational during that season. Our revenue from onshore drilling services may also be negatively affected by spring thawing because drilling rigs, equipment, and materials situated in certain regions can only be transported during winter when the ground is sufficiently frozen to create access roads. As a result, a portion of our business activity in the fourth and first quarter of each year is devoted to transportation of drilling rigs, equipment, and materials and we experience a decrease in revenue while continuing to incur costs. If we fail to complete a drilling contract on time or are unable to move our equipment due to adverse weather conditions our ability to commence drilling on a timely basis at another site may be impeded. However, the effect of severe weather conditions on our operations depends on the specific type of service being provided. For instance, our onshore exploration drilling services are most affected by adverse weather conditions, as our drilling rigs, equipment, material and crews that are required for such services are mobilized to remote locations accessible only by winter roads or helicopters. On the other hand, onshore production drilling services tend to be less affected by adverse weather conditions due to the cluster drilling method we utilize, which involves drilling multiple wells from a single drilling pad. However, also when using this drilling method, our operations may be temporarily disrupted by adverse weather conditions such that we are unable to operate our rigs or mobilize required supplies to rig sites. With respect to our offshore division, we are generally unable to perform drilling services in the Russian sector of the Caspian Sea during winter months due to the presence of ice. However, the Yuri Korchagin platform is ice-resistant, which allows us to drill there year-round.
Operating Capacity
Our revenue growth can be negatively affected by the number of drilling rigs and drilling crews available to us. Our ability to increase our onshore business or maintain its current level depends on our ability to procure a sufficient number of new drilling rigs and modernize our existing ones. Following the stabilization of the global economy, we witnessed the recovery of demand for drilling services in Russia. Importantly, since the wells we drill are getting deeper we anticipate increased demand for heavier rigs. In 2010, we developed a five-year plan for the delivery of new rigs pursuant to which we ordered 11 new drilling rigs in 2012 with the delivery in 2013/2014. These new purchases were either for heavy rigs, i.e., 320 ton hook load, equivalent to 1,500 horsepower or greater, or medium rigs with 250 ton hook load. In the next three

| Eurasia Drilling Company Limited
10 | Management’s Discussion & Analysis
years, we expect to purchase up to 32 new onshore rigs as part of our rig fleet upgrade and modernization plan. As of December 31, 2012, approximately 25% of our drilling rigs were in the heavy class.
At the end of 2012 we believed we had sufficient operating capacity with the addition of the new rigs to our drilling fleet and our increased drilling productivity to drill approximately 7.3 million metres on an annual basis. The transaction with Schlumberger has substantially expanded our capacity and strengthened our presence in Russia.
Additionally, our results of operations can be affected by the amount of capital expenditures we are required to undertake in order to modernize and renovate our drilling rig fleet periodically and to satisfy applicable equipment certification requirements. As of December 31, 2012, approximately 33% of our drilling rigs were more than 20 years old, compared to the Russian average of 59% of rigs that were over 20 years old, according to Douglas Westwood.
Foreign Currency Fluctuations
Our audited consolidated financial statements are presented in US dollars, which is the Group's presentation currency. The functional currency of most of our operating entities is the Russian ruble as this is the currency of the primary economic environment in which they operate and in which cash is generated and expended. Foreign exchange gains and losses result from converting monetary assets and liabilities denominated in Russian rubles into US dollar amounts at each balance sheet date.
The Group has currency exposure on the carrying amount of the rig fleet, which is reflected as a Russian ruble asset in the accounting records of the Group's Russian subsidiaries and then translated into US dollars in the Group's audited consolidated financial statements. A strengthening of the Russian ruble against the US dollar means a higher US dollar carrying amount of the Group's rig fleet and vice versa. At the same time, as of December 31, 2012, 39% of our long and short-term debt was denominated in US dollars. Accordingly, the translation effect of the assets is not balanced by a similar translation effect of the liabilities.
Factors Affecting Comparability of Prior Periods
Our selected financial data, audited consolidated financial statements and related notes and the following discussion and analysis reflect the contribution of the businesses we acquire from their respective dates of consolidation, and, as a result, include results for our consolidated subsidiaries SGC-Drilling and SKRS since May 2011 and CSVI Limited since February 2011. Full-year consolidation of these subsidiaries' results in 2012, compared to their partial consolidation in 2011, has affected the direct comparability of our results for 2012 versus 2011. Any future acquisitions that we may complete will similarly affect the comparability of our results for the relevant future periods. We do not provide comparable financial information for periods preceding the date on which we started consolidating the relevant subsidiaries. For more information, see Note 17 to the Consolidated Financial Statements, "—Liquidity and Capital Resources—Cash Flows—Investing Activities" and "—Results of Operations—Year Ended December 31, 2012 Compared to Year Ended December 31, 2011" below.
Recent Developments
During the first quarter of 2013, we drew down US$165.4 million under our five-year US$227 million loan facility arranged by ZAO UniCredit Bank.
On January 1, 2013, our new incentive plan for top managers went into effect. It provides for a bonus computed upon a multiple of the manager's base pay and yearly cash bonus earned upon the achievement of certain EPS goals, which vests over three years. The award is paid each year in either cash or stock, at the election of our Board of Directors.

| Eurasia Drilling Company Limited
11 | Management’s Discussion & Analysis
Revenue
We generate our revenue primarily from the sale of onshore drilling services, as well as from offshore drilling services and certain other services.
Our revenue from drilling and related services represented approximately 99.6%, 98.8%, and 99.3% of our total revenue for the years ended December 31, 2012, 2011 and 2010, respectively. Related services include our workover and sidetracking operations.
A significant portion of our revenue from drilling and related services is derived from LUKOIL, which, for the year ended December 31, 2012, accounted for approximately 63.5% of our total revenue. We provide our onshore drilling services to LUKOIL on the basis of long-term three-year onshore drilling services framework agreement (the "Framework Agreement"), under which we are required to provide a guaranteed scope of drilling and well construction services to LUKOIL through the end of 2015. Pursuant to the Framework Agreement, BKE enters into annual contracts with companies in the LUKOIL group which contain detailed information on the numbers and locations of the wells to be drilled during the relevant year, as well as the basis on which our services are provided. Depending on the complexity of the drilling, our services are provided either on a general contractor "turn-key" basis or on a day rate basis. Completion services which are a part of the well construction service that we provide are contracted separately, given the increased complexity of such services.
In addition, in 2010 we entered into a five-year workover framework agreement with LUKOIL. This workover framework agreement includes a guaranteed volume of workover services to be provided during the five-year term. LUKOIL also represents a significant part of our offshore drilling business, as we have a multi-year agreement for our services on LSP-1 platform on Yury Korchagin field in the Caspian Sea.
With respect to our other customers and the companies of the LUKOIL group with which we enter into contracts outside of the scope of the Framework Agreement, contracts are typically for a period of one year. We generally contract to provide our onshore drilling services on the basis of agreed procedures and prices, as a general contractor and, to a limited extent, on a day rate basis.
Current contracting practices in the Russian drilling market contribute to fluctuations in revenue. We obtain a significant part of our business through open tenders. Most tenders are conducted annually through a process that begins with requests for proposals in September and ends with signed contractual commitments generally between December and March. As a result, a portion of our business activity in the winter months is generally devoted to rig up and rig down operations and transportation of equipment and personnel required for our onshore drilling services.
Cost of Services, Excluding Depreciation and Taxes
Our cost of services, excluding depreciation and taxes, comprises seven primary cost categories: services of subcontractors, wages and salaries, materials, fuel and energy, transportation, leasing and rent and other. The table below sets forth the costs associated with each category in dollars and as a percentage of the cost of services, excluding depreciation and taxes, for the periods indicated.
Year ended December 31,
2012 2011 2010
(in thousands of US$, except percentages) Cost of services, excluding depreciation and taxes, 2,151,336 100% 1,906,256 100% 1,204,333 100%
Services of subcontractors 936,797 43.5% 917,187 48.1% 492,243 40.9% Wages and salaries 488,407 22.7% 425,210 22.3% 326,299 27.1% Materials 414,288 19.2% 309,252 16.2% 221,375 18.4%

| Eurasia Drilling Company Limited
12 | Management’s Discussion & Analysis
Fuel and energy 152,785 7.1% 131,776 6.9% 80,273 6.7% Transportation of employees to
drilling fields 40,003 1.9% 30,689 1.6% 23,364 1.9% Leasing and rent 20,781 1.0% 26,336 1.4% 10,884 0.9% Other 98,275 4.6% 65,806 3.5% 49,895 4.1%
Services of Subcontractors
Under most of our onshore drilling contracts, we act as a general contractor and are contractually responsible for managing all aspects of the drilling process, including certain services we do not perform ourselves. In our onshore division, services contracted from third parties include subcontracting for technological services, transportation services, preparatory services, well facility services, petrophysical services, well services, drilling motor and drilling navigation services, cementing services, and drilling bit services. Subcontractor services was the largest component of our cost of services, excluding depreciation and taxes, for the years ended December 31, 2012, 2011 and 2010. Services of subcontractors include certain reimbursable services the cost of which is passed through to our customers at little or no mark-up. The reimbursements for such services that we receive from our customers are recorded as revenue.
Wages and Salaries
Employee wages and salaries include costs of our personnel directly engaged in providing onshore and offshore drilling and other services. Employee costs include amounts we pay in support of our private employee insurance and medical funds. Such expenses do not include contributions to pension funds or social taxes.
Materials
Expenditures for materials have been driven primarily by our customers' particular drilling programs and projects. Materials for our onshore and offshore drilling divisions primarily include spare parts, tubular goods, mud chemicals, cement, and drilling tools.
Fuel and energy
Fuel and energy costs consist primarily of oil, lubricants, and electricity.
Transportation of employees to drilling fields
Costs relating to the transportation of employees to field locations primarily include transportation services related to the mobilization and rotation of rig crews.
Leasing and Rent
Leasing and rent costs consist primarily of the cost of renting drilling equipment.
Other
The remaining portion of our cost of services, excluding depreciation and taxes, which we categorize as "other", includes current repair expenses for fixed assets license fees, insurance expenses, safety and environmental expenses, and maintenance expenses.
Results of Operations

| Eurasia Drilling Company Limited
13 | Management’s Discussion & Analysis
The table below sets forth a summary of our operating results in dollars and as a percentage of total revenue for the periods indicated. In absolute terms, all of our 2012 operating results set forth below were affected by the 5.5% depreciation of the Russian ruble against the US dollar as of year-end 2012 as compared to year-end 2011.
Year ended December 31,
2012 2011 2010
(in thousands of US$, except percentages) Total revenue 3,237,333 100% 2,766,749 100% 1,822,180 100% Cost of services, excluding
depreciation and taxes (2,151,336) (66.4%) (1,906,256) (68.9%) (1,204,333) (66.0%) General and administrative
expenses, excluding depreciation and taxes (161,270) (5.0%) (144,614) (5.2%) (106,920) (5.9%)
Taxes other than income taxes (134,733) (4.2%) (119,181) (4.3%) (72,547) (4.0%) Depreciation (249,987) (7.7%) (213,492) (7.7%) (144,241) (7.9%) Gain/(loss) on disposal of
property, plant and equipment 4,786 0.1% (1,362) (0.1%) 6,344 0.3%
Impairment loss - - (1,296) (0.0%) (7,096) (0.4%) Income from operating
activities
544,793 16.8% 380,548 13.8% 293,387 16.1% Interest expense (53,661) (1.6%) (52,342) (1.9%) (15,125) (0.8%) Interest income 12,094 0.4% 11,485 0.4% 7,993 0.4% Currency transaction gain/(loss) 631 0.0% (11,054) (0.4%) (7,355) (0.4%) Gain/(loss) on business
exchange transaction - - 32,284 1.2% 557 0.0% Other income/(expenses) (8) (0.0%) 6,495 0.2% (951) (0.0%) Income before income taxes 503,849 15.6% 367,416 13.3% 278,506 15.3% Income tax expense (121,840) (3.8%) (84,045) (3.1%) (71,680) (3.9%) Net income 382,009 11.8% 283,371 10.2% 206,826 11.4%
Year Ended December 31, 2012 Compared to Year Ended December 31, 2011
Revenue
Revenue increased by US$470.6 million, or 17.0%, to US$3,237.3 million for 2012 from US$2,766.7 million in 2011. The increase was primarily due to an increase in services provided to our customers in most of our business lines and the full-year consolidation of the newly acquired businesses that we purchased in 2011 from Schlumberger and Transocean. In US dollar terms, revenue did not increase in line with the increase in drilling volumes primarily as a result of the 5.5% depreciation of the Russian ruble against the US dollar as of year-end 2012 as compared to year-end 2011. In addition, revenue was negatively impacted by the decrease in reimbursable pass-through telemetry services due to our customer LUKOIL-West Siberia starting to contract for such services directly with the third party provider from May 2012.
The following table sets forth a breakdown of our revenue by type of services provided and as a percentage of total revenue for the period indicated.

| Eurasia Drilling Company Limited
14 | Management’s Discussion & Analysis
Year ended December 31,
2012 2011
(in thousands of US$, except percentages) Drilling and related services 3,222,830 99.6% 2,734,444 98.8% Other sales and services 14,503 0.4% 32,305 1.2% Total Revenue 3,237,333 100% 2,766,749 100%
Cost of services, excluding depreciation and taxes
Cost of services, excluding depreciation and taxes, increased by US$245.1 million, or 12.9%, to US$2,151.3 million for 2012 from US$1,906.3 million for 2011. Cost of services, excluding depreciation and taxes, as a percentage of total revenue decreased from 68.9% for 2011 to 66.4% for 2012. The decrease as a percentage of total revenue was primarily attributable to a decrease in reimbursable pass-through services (such as, for example, telemetry and technology services) as described in more detail above, and efforts by the Group’s management to control costs. The increase in absolute terms was primarily due to the overall growth of our operations.
For 2012, services of subcontractors were US$936.8 million, or 43.5% of total cost of services, excluding depreciation and taxes, as compared to US$917.2 million, or 48.1% of total cost of services, excluding depreciation and taxes, for 2011. The increase in absolute terms was primarily due to the full year consolidation of newly acquired businesses, compared to their partial consolidation in 2011, and growth in workover volumes, which was almost fully offset by a decrease in reimbursable services that were largely pass-through, as described above, in the BKE onshore business, as well as a decline in technological, cementing and drilling fluids pass-through services in our offshore drilling segment.
Wages and salaries for 2012 were US$488.4 million, or 22.7% of total cost of services, excluding depreciation and taxes, as compared to US$425.2 million, or 22.3% of total cost of services, excluding depreciation and taxes, for 2011. The increase in absolute terms was primarily driven by the full year consolidation of the newly acquired businesses, compared to their partial consolidation in 2011, the formation of new crews in the light of increased drilling volumes in 2012 over 2011, and a significant growth in workover volumes where wages and salaries are a comparatively larger component of cost of services, excluding depreciation and taxes. The effect from the annual regular salary increase for our employees was largely offset by the depreciation of the Russian ruble against the US dollar. The increase in wages and salaries as a percentage of total cost of services, excluding depreciation and taxes, resulted from a decrease in the share of pass-through services of subcontractors in total cost of services, excluding depreciation and taxes, as described above, causing the relative share of other constituents of our cost of services, excluding depreciation and taxes, to increase. We were able to achieve revenue growth in our core drilling business without proportional increase in headcount due to increased productivity.
For 2012, cost of materials was US$414.3 million, or 19.2% of total cost of services, excluding depreciation and taxes, as compared to US$309.3 million, or 16.2% of total cost of services, excluding depreciation and taxes, for 2011. The increase in both absolute terms and as a percentage of total cost of services, excluding depreciation and taxes, was primarily caused by the first-time full year consolidation of SGC-Drilling in 2012 (where a significant portion of cost of materials was attributable to the casing pipe for Rosneft in Nefteyugansk, the cost of which was a pass-through) and growth in the usage of materials in West Siberia (also significantly affected by the casing pipe in Nefteyugansk).
Fuel and energy costs for 2012 were US$152.8 million, or 7.1% of total cost of services, excluding depreciation and taxes, compared to US$131.8 million, or 6.9% of total cost of services, excluding depreciation and taxes, for 2011. The increase in absolute terms was primarily driven by the full year consolidation of newly acquired businesses and growth in volumes of our legacy drilling and workover operations, while the increase as a percentage of total cost of services, excluding depreciation and taxes, was immaterial.
| Eurasia Drilling Company Limited
15 | Management’s Discussion & Analysis
Expenses relating to the transportation of employees to field locations for 2012 were US$40.0 million, or 1.9% of total cost of services, excluding depreciation and taxes, compared to US$30.7 million, or 1.6% of total cost of services, excluding depreciation and taxes, for 2011. The increase both in absolute terms and as a percentage of the total cost of services, excluding depreciation and taxes, was primarily caused by the indexation of air ticket prices and geographic diversification of our operations due to new customer relationships.
Leasing and rent costs for 2012 were US$20.8 million, or 1.0% of total cost of services, excluding depreciation and taxes, compared to US$26.3 million, or 1.4% of total cost of services, excluding depreciation and taxes, for 2011. The decrease in both absolute terms and as a percentage of total cost of services, excluding depreciation and taxes, was due to the gradual discontinuance of the leases in respect of drilling equipment, partially offset by the full year consolidation of the newly acquired businesses and the rent of equipment to start a workover project for Rosneft in a new location on the Vankor field.
Other expenses amounted to US$98.3 million, or 4.6%, of our total cost of services, excluding depreciation and taxes, for 2012, as compared to US$65.8 million, or 3.5% of our total cost of services, excluding depreciation and taxes, for 2011. The increase both in absolute terms and as a percentage of total cost of services, excluding depreciation and taxes, was primarily driven by the increase in insurance expenses due to the expansion of our rig fleet and higher well insurance costs related to the deeper wells we drilled. In addition, the integration of the newly acquired businesses also contributed to the increase.
General and Administrative Expenses, Excluding Depreciation and Taxes
General and administrative expenses, excluding depreciation and taxes, increased by US$16.7 million, or 11.5%, to US$161.3 million for 2012, as compared to US$144.6 million for 2011. As a percentage of total revenue, General and administrative expenses, excluding depreciation and taxes, decreased to 5.0% for 2012 from 5.2% for 2011. The increase in absolute terms was primarily attributable to the full-year consolidation of newly acquired businesses, while the decrease as a percentage of total revenue was not material.
Taxes Other Than Income Taxes
Taxes other than income taxes include various local taxes, such as social, property, road, and other small regional taxes. Taxes other than income taxes increased by US$15.6 million, or 13.0%, to US$134.7 million for 2012, as compared to US$119.2 million for 2011. The increase in absolute terms was primarily driven by the full-year consolidation of newly acquired businesses and formation of new workover crews, while the decrease as a percentage of total revenue from 4.3% in 2011 to 4.2% in 2012 was not material.
Depreciation
Depreciation increased by US$36.5 million, or 17.1%, to US$250.0 million for 2012 as compared to US$213.5 million for 2011. As a percentage of total revenue, depreciation was 7.7% in both 2012 and 2011. The increase in absolute terms was primarily the result of our on-going modernization program, significant capital expenditures in property, plant and equipment, and the depreciation of equipment and machinery acquired with the purchase of new businesses from Schlumberger and Transocean as described in more detail above.
Gains/(Loss) on Disposal of Property, Plant and Equipment
Gain on the disposal of property, plant and equipment amounted to US$4.8 million for 2012, as compared to a US$1.4 million loss on the disposal of property, plant and equipment for 2011. This difference was primarily due to the timing of opportunistic sales of unneeded or obsolete equipment.

| Eurasia Drilling Company Limited
16 | Management’s Discussion & Analysis
Impairment Loss
In 2012 we did not recognize any impairment loss, compared to a loss of US$1.3 million in 2011 resulting from the write-down of intangible assets of one of our smaller subsidiaries.
Income From Operating Activities
Income from operating activities increased by US$164.2 million, or 43.2%, to US$544.8 million for 2012, as compared to US$380.5 million for 2011. The increase in absolute terms was primarily due to the increase in drilling and, to a lesser extent, workover volumes, and sustained cost control efforts, as well as the full-year consolidation of newly acquired businesses. As a percentage of total revenue, income from operating activities increased from 13.8% for 2011 to 16.8% in 2012. This was primarily due to the overall positive impact of our cost control efforts.
Interest Expense
Interest expenses increased by US$1.3 million, or 2.5%, to US$53.7 million for 2012, compared to US$52.3 million for 2011. The increase in interest expense was primarily attributable to the full year impact of additional borrowings raised during 2011 to support the growth of both our onshore and offshore businesses including the acquisitions of new businesses from Schlumberger and Transocean and modernization of our drilling fleet. This was partially offset by the scheduled repayment of our other outstanding loans. In particular, during 2011 we obtained a dollar-denominated credit facility from Raiffeisenbank in the amount of US$220 million bearing interest at 5.65% per annum and issued ruble bonds in the amount of RUB5,000 million bearing interest at 8.4% per annum.
Interest Income
Interest income increased by US$0.6 million, or 5.3%, to US$12.1 million for 2012 from US$11.5 million in 2011. The increase was primarily due to larger average cash balances in 2012 as compared to 2011.
Currency Transaction Gain/(Loss)
Currency transaction gain amounted to US$0.6 million for 2012, as compared to a loss of US$11.1 million in 2011. The difference was primarily due to less fluctuation of the Russian ruble / US dollar exchange rate in 2012 as compared to 2011.
Gain on Business Exchange Transaction
We realized a gain on business exchange transaction of US$32.3 million in 2011 in connection with the sale of our telemetry, cementing and drilling fluid assets to Schlumberger as part of the asset swap transaction. We did not have a gain on business exchange transaction during 2012.
Other Income/(Expenses)
Other income was US$6.5 million in 2011. These amounts represent unusual income or expense not resulting from our ordinary course of business activities. In 2011 we recognized income from the collection of a performance guarantee from one of our suppliers. We had a non material amount of other expense during 2012.
Income Before Income Taxes
Income before income taxes increased by US$136.4 million, or 37.1%, to US$503.8 million for 2012, compared to US$367.4 million for 2011. The increase in income before income taxes was attributable to the factors described in more detail above.
| Eurasia Drilling Company Limited
17 | Management’s Discussion & Analysis
Income Tax Expense
Income tax expenses increased by US$37.8 million, or 45.0%, to US$121.8 million for 2012, compared to US$84.0 million for 2011. The increase was due primarily to a higher tax base. Our effective tax rate increased to 24.2% in 2012 from 22.9% in 2011. During 2011 we recognized a non-taxable net gain in the amount of US$32.8 million from selling our telemetry, cementing and drilling fluid assets to Schlumberger in April 2011. During 2012 no similar items were recognized and thus our effective tax rate returned to levels at which it was prior to 2011.
Net Income
As a result of the foregoing factors, net income increased by US$98.6 million, or 34.8%, to US$382.0 million for 2012, compared to US$283.4 million for 2011.
Year Ended December 31, 2011 Compared to December 31, 2010
Revenue
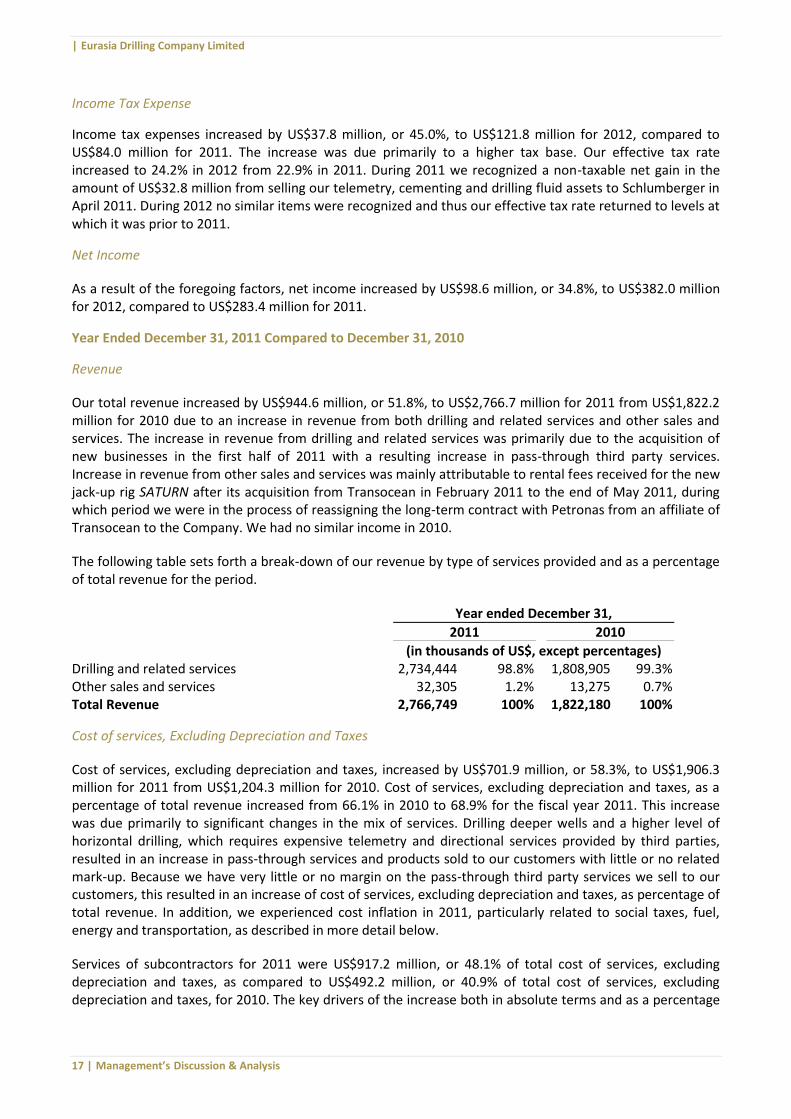
Our total revenue increased by US$944.6 million, or 51.8%, to US$2,766.7 million for 2011 from US$1,822.2 million for 2010 due to an increase in revenue from both drilling and related services and other sales and services. The increase in revenue from drilling and related services was primarily due to the acquisition of new businesses in the first half of 2011 with a resulting increase in pass-through third party services. Increase in revenue from other sales and services was mainly attributable to rental fees received for the new jack-up rig SATURN after its acquisition from Transocean in February 2011 to the end of May 2011, during which period we were in the process of reassigning the long-term contract with Petronas from an affiliate of Transocean to the Company. We had no similar income in 2010.
The following table sets forth a break-down of our revenue by type of services provided and as a percentage of total revenue for the period.
Year ended December 31,
2011 2010
(in thousands of US$, except percentages) Drilling and related services 2,734,444 98.8% 1,808,905 99.3% Other sales and services 32,305 1.2% 13,275 0.7% Total Revenue 2,766,749 100% 1,822,180 100%
Cost of services, Excluding Depreciation and Taxes
Cost of services, excluding depreciation and taxes, increased by US$701.9 million, or 58.3%, to US$1,906.3 million for 2011 from US$1,204.3 million for 2010. Cost of services, excluding depreciation and taxes, as a percentage of total revenue increased from 66.1% in 2010 to 68.9% for the fiscal year 2011. This increase was due primarily to significant changes in the mix of services. Drilling deeper wells and a higher level of horizontal drilling, which requires expensive telemetry and directional services provided by third parties, resulted in an increase in pass-through services and products sold to our customers with little or no related mark-up. Because we have very little or no margin on the pass-through third party services we sell to our customers, this resulted in an increase of cost of services, excluding depreciation and taxes, as percentage of total revenue. In addition, we experienced cost inflation in 2011, particularly related to social taxes, fuel, energy and transportation, as described in more detail below.
Services of subcontractors for 2011 were US$917.2 million, or 48.1% of total cost of services, excluding depreciation and taxes, as compared to US$492.2 million, or 40.9% of total cost of services, excluding depreciation and taxes, for 2010. The key drivers of the increase both in absolute terms and as a percentage

| Eurasia Drilling Company Limited
18 | Management’s Discussion & Analysis
of total cost of services, excluding depreciation and taxes, were an increase in pass-through services which are sold to customers with little or no related mark-up (such as telemetry for horizontal wells, casing and pads construction), as described in more detail above, and the asset swap with Schlumberger which resulted in the disposal of internal services assets and a corresponding increase in the use of subcontractors.
Wages and salaries for 2011 were US$425.2 million, or 22.3% of total cost of services, excluding depreciation and taxes, as compared to US$326.3 million, or 27.1% of total cost of services, excluding depreciation and taxes, for 2010. The increase in absolute terms was primarily caused by the full-year consolidation of newly acquired businesses and by the general wage indexation. The decrease in the percentage of total cost of services, excluding depreciation and taxes, was mostly caused by an increase of services of subcontractors as percentage of total cost of services, excluding depreciation and taxes, resulting in the decrease of the relative share of other constituents of our cost of services, excluding depreciation and taxes.
Expenditures for materials for 2011 were US$309.3 million, or 16.2% of total cost of services, excluding depreciation and taxes, as compared to US$221.4 million, or 18.4% of total cost of services, excluding depreciation and taxes, for 2010. The increase in absolute terms was primarily due to the growth in drilling volumes and an increase in expenditures for materials attributable to casing pipe in some of our new projects, the cost of which is a pass-through.
Fuel and energy costs for 2011 were US$131.8 million, or 6.9% of total cost of services, excluding depreciation and taxes, as compared to US$80.3 million, or 6.7% of total cost of services, excluding depreciation and taxes, for 2010. The increase as a percentage of total cost of services, excluding depreciation and taxes, was not material while the increase in absolute terms was primarily due to the inflation of prices for energy and fuel in 2011 and the growth of our business in general.
Expenses relating to the transportation of employees to drilling fields for 2011 were US$30.7 million, or 1.6% of total cost of services, excluding depreciation and taxes, as compared to US$23.4 million, or 1.9% of total cost of services, excluding depreciation and taxes, for 2010. The decrease as a percentage of total cost of services, excluding depreciation and taxes, was due to increased use of third party services, while the increase in absolute terms was not material.
Leasing and rent costs for 2011 were US$26.3 million, or 1.4% of total cost of services, excluding depreciation and taxes, as compared to US$10.9 million, or 0.9% of total cost of services, excluding depreciation and taxes, for 2010. The change in percentage of total cost of services, excluding depreciation and taxes, was not material. The increase in absolute terms was primarily due to an increase in the amount of drilling equipment we hold under lease as well as the integration of leased equipment of SGC-Drilling acquired from Schlumberger in April 2011.
Other expenses amounted to US$65.8 million, or 3.5% of our total cost of services, excluding depreciation and taxes, for 2011, as compared to US$49.9 million, or 4.1% of our total cost of services, excluding depreciation and taxes, for 2010. The increase in absolute terms was primarily caused by an increase in insurance costs. The decrease as a percentage of total cost of services, excluding depreciation and taxes, was mostly caused by an increase of services of subcontractors as percentage of total cost of services, excluding depreciation and taxes, resulting in the decrease of the relative share of other constituents of our cost of services, excluding depreciation and taxes.
General and Administrative Expenses, Excluding Depreciation and Taxes
General and administrative expenses, excluding depreciation and taxes, increased by US$37.7 million, or 35.3%, to US$144.6 million for 2011, as compared to US$106.9 million for 2010. The increase was mostly attributable to the growth of our business, both organically and through acquisitions of new businesses from Schlumberger and Transocean. As a percentage of total revenue, General and administrative expenses,

| Eurasia Drilling Company Limited
19 | Management’s Discussion & Analysis
excluding depreciation and taxes, decreased to 5.3% in 2011 from 5.9% in 2010 due to the semi-fixed nature of such expenses.
Taxes Other Than Income Taxes
Taxes other than income taxes increased by US$46.7 million, or 64.4%, to US$119.2 million for 2011 as compared to US$72.5 million for 2010. This increase was mostly attributable to the change in Russian tax law and continuous adjustments in the formula for social contributions. As a percentage of revenue, taxes other than income taxes increased to 4.3% of revenue in 2011 as compared to 4.0% in 2010.
Depreciation
Depreciation increased by US$69.3 million, or 48.0%, to US$213.5 million for 2011 as compared to US$144.2 million for 2010. As a percentage of revenue, depreciation decreased to 7.7% for 2011 from 7.9% for 2010. The increase in absolute terms was caused primarily by our ongoing modernization program and significant capital expenditures in property, plant and equipment, as well as by the depreciation of the equipment and machinery acquired as part of the purchase of the new businesses. In addition, during 2011 we revised our original estimates of the useful life of our drilling pipe from 2-4 years to 2-3 years which increased depreciation for 2011 by US$16.1 million.
(Loss)/Gain on Disposal of Property, Plant & Equipment
Loss on the disposal of property, plant and equipment amounted to US$1.4 million for 2011 as compared to a gain of US$6.3 million for 2010. This change is explained by ordinary course disposals of property, plant and equipment and by the fact that no significant assets were sold in 2011 compared to 2010 when gain was achieved through the sale of our transportation assets in the Perm branch of BKE.
Impairment Loss
Impairment loss decreased by US$5.8 million, or 81.7%, to US$1.3 million for 2011 from US$7.1 million in 2010. The decrease was primarily due to the impairment of goodwill related to the purchase of a small workover company brought on by a negative change in its business prospects.
Income from Operating Activities
Income from operating activities increased by US$87.1 million, or 29.7%, to US$380.5 million for 2011, as compared to US$293.4 million for 2010. The increase was primarily due to an increase in the metres drilled and consolidation of the newly acquired businesses. As a percentage of total revenue, income from operating activities decreased to 13.8% in 2011 from 16.1% in 2010. This decrease was primarily due to an increase in services of subcontractors (particularly reimbursable services in horizontal drilling sold to customers with little or no mark-up which have a negative impact on our margins) and inflation of social taxes and prices for energy, fuel and transportation, as described in more detail above.
Interest Expense
Interest expense increased by US$37.2 million, or 246.4%, to US$52.3 million for 2011 as compared to US$15.1 million for 2010. This increase was caused by interest incurred on the debt raised in the end of 2010 and the first half of 2011 (US$254 million from Alfa-Bank in December 2010, US$220 million from Raiffeisenbank in April 2011, and a US$176 million ruble bond issue in June 2011). This debt was raised for the purposes of developing our onshore and offshore operations through acquisitions of new businesses from Schlumberger and Transocean and modernization of our drilling fleet.

| Eurasia Drilling Company Limited
20 | Management’s Discussion & Analysis
Interest Income
Interest income increased by US$3.5 million, or 43.8%, to US$11.5 million for 2011 from US$8.0 million in 2010. The increase was primarily due to larger average cash balances in 2011 as compared to 2010.
Currency Transaction Gain/(Loss)
Currency transaction loss increased by US$3.7 million, or 50.0%, to US$11.1 million for 2011 from US$7.4 million in 2010. The increase was primarily due to greater fluctuation of the Russian ruble / US dollar exchange rate in 2011 as compared to 2010.
Gain on Business Exchange Transaction
Gain on business exchange transaction for 2011 was US$32.3 million, compared to US$0.6 million in 2010. The increase was due to a non-taxable gain realized on the sale of our in-house telemetry, drilling fluids and cementing business to Schlumberger in April 2011. No such material transactions occurred in 2010.
Other income/(expenses)
Other income amounted to US$6.5 million for 2011 as compared to other expenses of US$1 million in 2010. The difference was primarily due to collection on a performance guarantee bond from one of our suppliers in 2011.No such material events occurred in 2010.
Income before Income Taxes
Income before income taxes increased by US$88.9 million, or 31.9%, to US$367.4 million for 2011, as compared to US$278.5 million for 2010. The increase was attributable to the net gain realized from selling telemetry, cementing and drilling fluid assets to Schlumberger in April 2011 and to the other factors described in more detail above.
Income Tax Expense
Income tax expense increased by US$12.3 million, or 17.2%, to US$84.0 million for 2011, as compared to US$71.7 million for 2010. Our effective tax rate decreased to 22.9% in 2011 from 25.7% in 2010 primarily due to the fact that in 2010 a 5% foreign withholding tax was imposed on intercompany dividends declared and paid in the amount of RUB5,000 million. Additionally, in 2011 no tax was due on the US 32.8 million gain realized on the sale of certain assets to Schlumberger.
Net Income
As a result of the foregoing factors, net income increased by US$76.6 million, or 37.0%, to US$283.4 million for the fiscal year 2011, as compared to US$206.8 million for 2010.
Liquidity and Capital Resources
The Company's primary sources of liquidity are cash generated from operating activities and debt financing. The Company's plan going forward is to finance its capital expenditures, interest payments and dividends primarily out of operating cash flows, as well as to finance a portion of its capital expenditures through existing and prospective credit facilities, as well as by utilizing a portion of the proceeds from the Offering.

| Eurasia Drilling Company Limited
21 | Management’s Discussion & Analysis
Cash Flows
The table below shows our net cash flows from operating, investing and financing activities for the years ended December 31, 2012, 2011 and 2010.
Year ended December 31,
2012 2011 2010
Net cash provided by operating activities 592,455 425,729 322,553 Net cash used in investing activities (617,922) (848,865) (325,190) Net cash provided by (used in) financing activities (197,140) 347,340 206,188
Operating activities
Net cash provided by operating activities amounted to US$592.5 million for 2012, as compared to US$425.7 million for 2011. This increase in cash flows provided by operating activities was principally due to higher drilling and workover volumes, the full-year consolidation of newly acquired businesses, and sustained cost control efforts by our management.
Net cash provided by operating activities amounted to US$425.7 million for 2011, as compared to US$322.6 million for 2010. This increase in cash flows provided by operating activities was principally due to higher drilling volumes in 2011 compared to 2010 as well as cash flow generated by the newly acquired businesses.
Investing activities
Net cash used in investing activities amounted to US$617.9 million for 2012, as compared to US$848.9 million for 2011. Investing activities during 2012 were mainly represented by our capital expenditures that amounted to US$619.9 million (including US$150 million offshore capital expenditures) as compared to US$400.0 million (including US$97 million offshore capital expenditures) during the corresponding period of 2011. The increase of US$219.9 million primarily represented a payment to Lamprell in the amount of US$45.4 million for the construction of our second new-build jack-up rig, MERCURY, with delivery scheduled for late 2014, as well as acquisition of four drilling rigs in Iraq for US$46.6 million, and our continuing focus on upgrading our onshore drilling fleet in Russia. During 2011 our investing activities were focused on the acquisitions of onshore and offshore assets from Schlumberger and Transocean, respectively.
Net cash used in investing activities amounted to US$848.9 million for 2011, as compared to US$325.2 million for 2010. The increase was attributable primarily to the acquisition of the jack-up rig SATURN from Transocean and the asset swap with Schlumberger. In addition, we continued to capitalize on the growth opportunities in our markets by significantly increasing our investments in new property, plant and equipment. In 2011 our capital expenditures were US$400.0 million, as compared to US$283.8 million in 2010 (which includes US$50 million offshore capital expenditures), including US$84 million spent in 2011 on construction of a new jack up drilling rig as compared to US$42 million for 2010. Another key factor attributing to this growth was the increase in our technical upgrade program and payments for the new rigs ordered in late 2010 and during 2011. Starting from 2010, our capital expenditures include payments to Lamprell for the construction of two new-build jack-up rigs of US$235 million per rig. The payments are staged and paid upon certain construction milestones.
Financing activities
Net cash used in financing activities amounted to US$197.1 million for 2012, compared to net cash of US$347.3 million provided by financing activities for 2011. During both periods, dividends were paid and certain debt was redeemed in accordance with its terms. During 2011, we raised RUB5,000 million
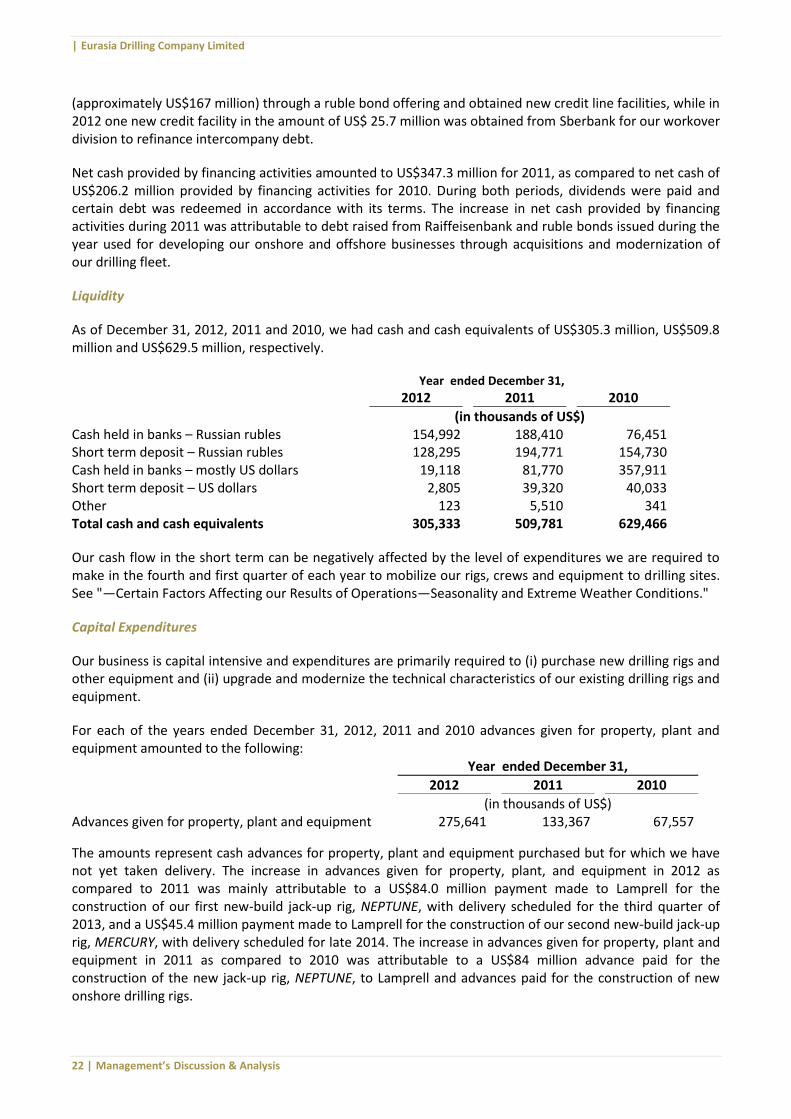
| Eurasia Drilling Company Limited
22 | Management’s Discussion & Analysis
(approximately US$167 million) through a ruble bond offering and obtained new credit line facilities, while in 2012 one new credit facility in the amount of US$ 25.7 million was obtained from Sberbank for our workover division to refinance intercompany debt.
Net cash provided by financing activities amounted to US$347.3 million for 2011, as compared to net cash of US$206.2 million provided by financing activities for 2010. During both periods, dividends were paid and certain debt was redeemed in accordance with its terms. The increase in net cash provided by financing activities during 2011 was attributable to debt raised from Raiffeisenbank and ruble bonds issued during the year used for developing our onshore and offshore businesses through acquisitions and modernization of our drilling fleet.
Liquidity
As of December 31, 2012, 2011 and 2010, we had cash and cash equivalents of US$305.3 million, US$509.8 million and US$629.5 million, respectively.
Year ended December 31,
2012 2011 2010
(in thousands of US$) Cash held in banks – Russian rubles 154,992 188,410 76,451 Short term deposit – Russian rubles 128,295 194,771 154,730 Cash held in banks – mostly US dollars 19,118 81,770 357,911 Short term deposit – US dollars 2,805 39,320 40,033 Other 123 5,510 341 Total cash and cash equivalents 305,333 509,781 629,466
Our cash flow in the short term can be negatively affected by the level of expenditures we are required to make in the fourth and first quarter of each year to mobilize our rigs, crews and equipment to drilling sites. See "—Certain Factors Affecting our Results of Operations—Seasonality and Extreme Weather Conditions."
Capital Expenditures
Our business is capital intensive and expenditures are primarily required to (i) purchase new drilling rigs and other equipment and (ii) upgrade and modernize the technical characteristics of our existing drilling rigs and equipment.
For each of the years ended December 31, 2012, 2011 and 2010 advances given for property, plant and equipment amounted to the following:
Year ended December 31,
2012 2011 2010
(in thousands of US$) Advances given for property, plant and equipment 275,641 133,367 67,557
The amounts represent cash advances for property, plant and equipment purchased but for which we have not yet taken delivery. The increase in advances given for property, plant, and equipment in 2012 as compared to 2011 was mainly attributable to a US$84.0 million payment made to Lamprell for the construction of our first new-build jack-up rig, NEPTUNE, with delivery scheduled for the third quarter of 2013, and a US$45.4 million payment made to Lamprell for the construction of our second new-build jack-up rig, MERCURY, with delivery scheduled for late 2014. The increase in advances given for property, plant and equipment in 2011 as compared to 2010 was attributable to a US$84 million advance paid for the construction of the new jack-up rig, NEPTUNE, to Lamprell and advances paid for the construction of new onshore drilling rigs.

| Eurasia Drilling Company Limited
23 | Management’s Discussion & Analysis
The table below presents the amounts invested in construction still in progress for the periods indicated:
Year ended December 31,
2012 2011 2010
(in thousands of US$) Construction in progress 51,568 92,142 40,146
The decrease in construction in progress as of December 31, 2012 compared to December 31, 2011 was the result of normal variances in the new drilling rig delivery schedule. The increase in construction in progress as of December 31, 2011 compared to December 31, 2010 was due to the arrival of new drilling rigs that had not yet been put into service.
Additionally, as of December 31, 2012, we had on deposit restricted cash in the amount of US$45.4 million included in non-current assets to secure progress payments to Lamprell for the construction of the two new-build jack-up drilling rigs. We had an additional US$ 4.0 million of restricted cash included in current assets as of December 31, 2012 used to collateralize the issuance of a guarantee for a customer.
Capital Resources
For the years ended December 31, 2012, 2011 and 2010, our short-term and long-term debt amounted to the following:
At December 31,
2012 2011 2010
(in thousands of US$) Short-term debt and current portion of long-term debt 257,860 175,217 117,550 Long-term debt 442,013 578,117 286,367
As of December 31, 2012, our loans and borrowings were comprised of the following:
Long-term debt Final maturity date Currency Interest Rate
Outstanding debt (in thousands
of US$) Security
Debt of the Company Loans from stockholders 2014 USD 5.8% 50,000 None
Debt of our subsidiaries Bank loans
OAO Sberbank of Russia 2014 RUB 7.7% 43,899 None
OAO Sberbank of Russia 2013 RUB LIBOR + 4.1% 20,214
Property, plant and
equipment
OAO Sberbank of Russia 2015 RUB 10.15% 26,339 None
Raiffeisenbank 2016 USD 5.65% 220,000
Shares in CSVI
Limited
Alfa-Bank 2013 RUB 8.4% 122,478 None
Russian ruble bonds 2018 RUB 8.4% 164,622 None
Rushong-Hua 2015 RUB 6.3% 52,321 None

| Eurasia Drilling Company Limited
24 | Management’s Discussion & Analysis
As of December 31, 2012, we had two unused lines with ZAO UniCredit Bank. The first was a revolving short-term line of credit denominated in Russian rubles which at the applicable ruble-U.S. dollar exchange rate of the Central Bank of Russia on December 31, 2012 equaled US$96.1 million. Loans under this line of credit are provided for a duration of 90 days and are available for drawdown until November 2014. The second one is a revolving overdraft line denominated in Russian rubles which at the applicable ruble-U.S. dollar exchange rate of the Central Bank of Russia on December 31, 2012 equaled US$17.3 million and is available until September 2015. We can use both lines solely for issuing or extending unsecured commercial letters of credit for the purpose of acquiring new drilling rigs (used as security for these lines).
As of December 31, 2012, we also had a revolving multi-currency overdraft line with OAO Sberbank of Russia denominated in Russian rubles which at the applicable ruble-U.S. dollar exchange rate of the Central Bank of Russia on December 31, 2012 equaled US$98.8 million and is available until June 2017. We can use the overdraft line solely for issuing or extending unsecured commercial letters of credit for the purpose of acquiring new drilling rigs. As of December 31, 2012, the line was undrawn.
As of December 31, 2012, we entered into a five-year US$227 million loan facility arranged by ZAO UniCredit Bank with an interest rate of three month LIBOR + 3.65% per annum. The final maturity date of the facility is December 27, 2017. The loan facility also provides for an irrevocable renewable bank guarantee of US$45.4 million. The loan facility is secured by our drilling assets. As of December 31, 2012, the line was undrawn. In the first quarter of 2013, we drew down US$165.4 million under this facility.
We believe we have sufficient working capital to meet our requirements for at least the next 12 months. We also expect to meet our contractual payment obligation requirements for at least the next 12 months with cash flow from our operations, other financing arrangements, and our available working capital.
The following table summarizes the principal maturities of our long-term debt, including its current portion, as of December 31, 2012. Long-term debt also includes remaining installment payments for onshore rigs. We expect to meet our debt payment requirements with cash flows from our operations and other financing arrangements.
Payments due by period
Total 2013 2014 2015 2016 2017 2018 and
thereafter
(in thousands of US$) Contractual Obligations Long-term debt 699,873 257,860 148,615 94,930 33,846 - 164,622
Our long-term debt and overdraft lines are secured by certain property, plant and equipment with a carrying amount of US$264.9 million as of December 31, 2012. As of December 31, 2012, our secured debt represented approximately 34% of our total long and short-term debt.
As of December 31, 2012, our short-term and long-term capital lease obligations were nil.
Off-balance sheet arrangements
The Company does not have off-balance sheet arrangements that have, or are reasonably likely to have, a current or future material effect on its financial condition, revenue, expenses, results of operations, liquidity, capital expenditures or capital resources.
Overview of other matters
Dividend policy and year-end 2012 dividend declaration
Total long-term debt 699,873 Total non-current long-term debt 442,013

| Eurasia Drilling Company Limited
25 | Management’s Discussion & Analysis
Our ability to pay dividends depends primarily on the amount of cash we have on-hand and on the receipt of dividends and distributions from our subsidiaries. The payment of dividends by our subsidiaries is contingent upon the sufficiency of their earnings, cash flows, and distributable reserves and the ability of our subsidiaries to make, in accordance with relevant legislation, Company law, exchange controls and contractual restrictions, dividend payments and other types of distributions to us.
In August 2007, we adopted a dividend policy according to which we expect to declare and pay dividends each year based on the Company’s earnings and the cash needs of the business.
Our results of operations and cash generating capacity continue to be strong, which allows us both to invest in our growing business and to increase dividend payments to our shareholders. The decision of the Board of Directors on the amount of dividends to pay depends on many factors, including, but not limited to, the financial situation and results of the Company, its capital needs for the support of business growth, the overall macroeconomic and market environment, and tax and legislative issues.
For the year ended December 31, 2012 a dividend was declared by the Board of Directors on December 12, 2012 in the amount of 70 cents per share, or US$103 million, which was included in “Accounts payable and accrued liabilities” and paid on January 17, 2013. For 2011 a dividend of 47 cents per share, or US $69 million, was declared in December 2011 and paid early in 2012. For 2010 a dividend of 31 cents per share, or US $45 million, was declared in December 2010 and paid early in 2011.
Treasury shares
In March 2008, the Company introduced an incentive plan for certain members of management for a five-year period beginning January 1, 2008. In accordance with its Incentive Compensation Plan (the Plan), 522,060 GDRs were awarded early in 2011 to participants in the Plan for their performance in 2010.
No GDR’s were awarded to our officers under the Plan for fiscal 2011 as the company’s stock price did not increase past the required amount.
In August 2011, we announced that we may buy back up to US $60 million of our Global Depositary Receipts due to exogenous market conditions. The repurchase programme lasted for 180 days and expired on February 26, 2012. During the time of the share buy-back programme 105,781 GDRs were purchased. During the reporting period 27,924 shares were transferred to Directors in lieu of cash for their service in 2011. As of December 31, 2012 there are 77,857 shares in treasury.
In accordance with the Company’s Incentive Compensation Plan participants of the Plan were awarded 875,260 GDRs for their performance in 2012.
Earnings per share
Basic earnings per share is computed by dividing net income available to common stockholders by the weighted average number of shares of common stock outstanding during the reporting periods. Diluted earnings per share reflects shares that may be issued contingent upon stock price performance under the terms of the Plan.
The calculation of earnings per share for the periods indicated was as follows:
2012 2011 2010
Net income available for common stockholders 382,009 283,371 206,826
Weighted average number of outstanding shares 146,782,754 146,768,307 143,270,265
Basic earnings per share of common stock (US dollars) 2.60 1.93 1.44
Contingent shares of the Plan 875,260 - 522,060
Weighted average number of outstanding shares, after dilution 147,658,014 146,768,307 143,792,325
Diluted earnings per share of common stock (US dollars) 2.59 1.93 1.44

| Eurasia Drilling Company Limited
26 | Management’s Discussion & Analysis
Earnings per share calculated on a diluted basis of 147,658,014 shares amounted to US $2.59 in 2012, compared to US $1.93 in 2011. The improvement in earnings per share was attributable mainly to the increase in net income by 35% in 2012 compared to 2011.
Basic earnings per share were US $2.60 in 2012 compared to US $1.93 in 2011.
Related party transactions
Shareholder loans
In the period from November 2006 through March 2007 the Company entered into loan agreements with its shareholders to partially fund the investment programme of our onshore drilling services division and the purchase of our offshore drilling services business. The aggregate principal amount of such loans was US $50 million as of December 31, 2012 and December 31, 2011 and US $70 million as of December 31, 2010. These loans are denominated in US dollars and bear interest at 5.8% per annum (starting 2011, prior to that interest rate was set at 8.6%), with the maturity date on or before December 31, 2014.
US $2.9 million interest was recognised and paid on these loans during both 2012 and 2011. US $6 million interest was recognised and paid on the year ended December 31, 2010. Management believes the terms of these loans are no more onerous than those that would have been negotiated in an arms-length negotiation.
Legal services
The Company’s General Counsel, Douglas Stinemetz, is a partner with The Stinemetz Law Firm (the Firm). During the years ended December 31, 2012, 2011 and 2010 the Firm billed EDC for costs and expenses of US $2.0 million, US $2.4 million and US $2.2 million respectively. All services were billed at a discount to the Firm’s normal billing rates, while expenses were billed at their actual cost. In addition the amounts paid to The Stinemetz Law Firm include considerable third party expenses and charges for the services of other lawyers. Mr. Stinemetz is not otherwise paid for his services as the Company’s General Counsel. Management believes the amounts paid for these legal services are no more onerous than those that would have been negotiated in an arms-length negotiation for a similar level of service and expertise.
Loan to associate company
During 2012 the Group decreased its share in OOO Kliver from 51% to 25% but increased its investment in OOO Kliver by USD 5.6 million. During 2012 the Group issued a short-term loans of USD 20.6 million to an associate company OOO Kliver. The loans are denominated in Russian rubles, bear interest at 10% and mature on July 1, 2013. The outstanding balance was US $3.6 million as of December 31, 2012. Interest income of US $0.2 million was recognized during 2012.
Guarantees
In October 2010 the Company originated a bank guarantee with a value of $5.1 million in favor of a subcontractor in consideration for an option to acquire an interest in an exploration project from a company controlled by related parties. The bank guarantee and the option expired in October 2011 without being exercised and at no cost to the Company.
Qualitative and Quantitative Disclosures About Market Risk
We are exposed to market risk from adverse movements in foreign currency exchange rates and changes in interest rates on our obligations. Our overall risk management objective is to reduce the potential adverse effects of these risks on our financial performance; however, we do not maintain any formal hedging programs beyond management of credit risk.
Credit Risks. Financial assets which potentially subject our entities to credit risk consist principally of trade receivables. We have policies in place to ensure that sales of products and services are made to customers with an appropriate credit history. Credit risks related to accounts receivable are systematically monitored
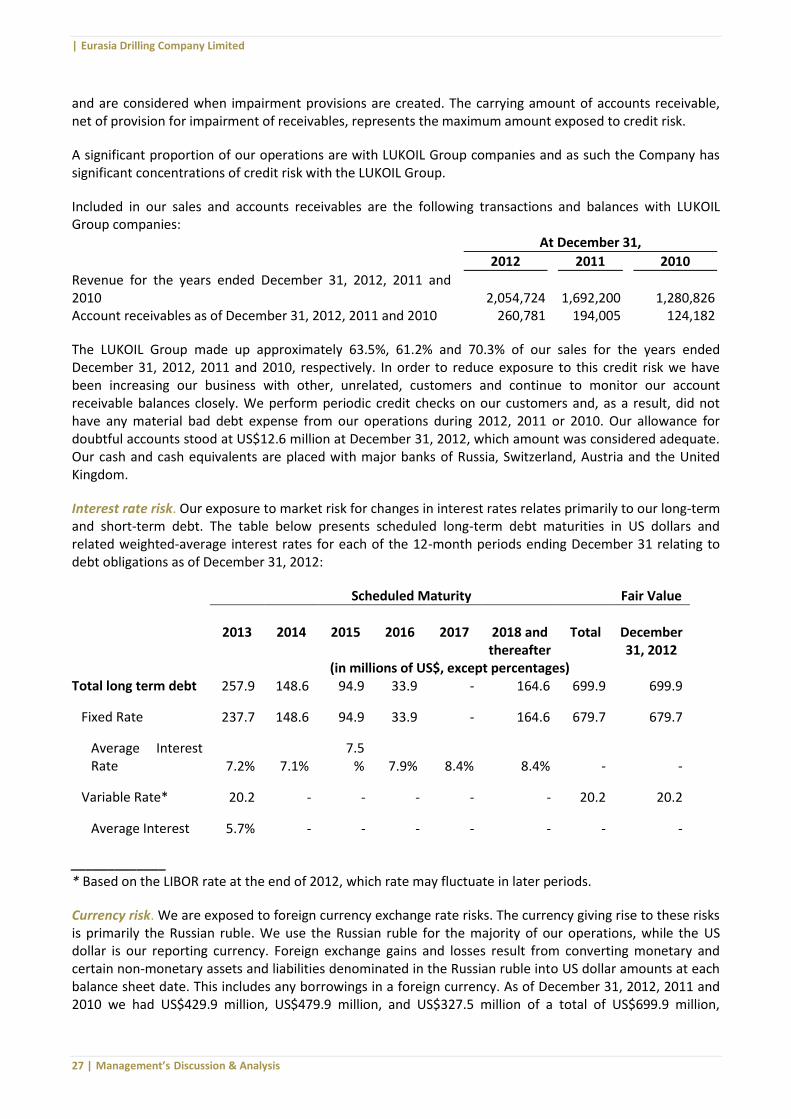
| Eurasia Drilling Company Limited
27 | Management’s Discussion & Analysis
and are considered when impairment provisions are created. The carrying amount of accounts receivable, net of provision for impairment of receivables, represents the maximum amount exposed to credit risk.
A significant proportion of our operations are with LUKOIL Group companies and as such the Company has significant concentrations of credit risk with the LUKOIL Group.
Included in our sales and accounts receivables are the following transactions and balances with LUKOIL Group companies:
At December 31,
2012 2011 2010
Revenue for the years ended December 31, 2012, 2011 and 2010 2,054,724 1,692,200 1,280,826 Account receivables as of December 31, 2012, 2011 and 2010 260,781 194,005 124,182
The LUKOIL Group made up approximately 63.5%, 61.2% and 70.3% of our sales for the years ended December 31, 2012, 2011 and 2010, respectively. In order to reduce exposure to this credit risk we have been increasing our business with other, unrelated, customers and continue to monitor our account receivable balances closely. We perform periodic credit checks on our customers and, as a result, did not have any material bad debt expense from our operations during 2012, 2011 or 2010. Our allowance for doubtful accounts stood at US$12.6 million at December 31, 2012, which amount was considered adequate. Our cash and cash equivalents are placed with major banks of Russia, Switzerland, Austria and the United Kingdom.
Interest rate risk. Our exposure to market risk for changes in interest rates relates primarily to our long-term and short-term debt. The table below presents scheduled long-term debt maturities in US dollars and related weighted-average interest rates for each of the 12-month periods ending December 31 relating to debt obligations as of December 31, 2012:
Scheduled Maturity Fair Value
2013 2014 2015 2016 2017 2018 and
thereafter Total December
31, 2012 (in millions of US$, except percentages) Total long term debt 257.9 148.6 94.9 33.9 - 164.6 699.9 699.9
Fixed Rate 237.7 148.6 94.9 33.9 - 164.6 679.7 679.7
Average Interest Rate 7.2% 7.1%
7.5% 7.9% 8.4% 8.4% - -
Variable Rate* 20.2 - - - - - 20.2 20.2
Average Interest 5.7% - - - - - - -
_____________ * Based on the LIBOR rate at the end of 2012, which rate may fluctuate in later periods.
Currency risk. We are exposed to foreign currency exchange rate risks. The currency giving rise to these risks is primarily the Russian ruble. We use the Russian ruble for the majority of our operations, while the US dollar is our reporting currency. Foreign exchange gains and losses result from converting monetary and certain non-monetary assets and liabilities denominated in the Russian ruble into US dollar amounts at each balance sheet date. This includes any borrowings in a foreign currency. As of December 31, 2012, 2011 and 2010 we had US$429.9 million, US$479.9 million, and US$327.5 million of a total of US$699.9 million,
| Eurasia Drilling Company Limited
28 | Management’s Discussion & Analysis
US$753.3 million, and US$403.9 million of our long and short-term debt denominated in the Russian ruble, respectively. In addition, the results of our operations are impacted by transactions entered into in currencies other than the Russian ruble, and a fluctuation in the Russian ruble versus US dollar exchange rates will result in a change in the recognized revenue and expenses associated with such transactions. Furthermore, while the majority of our revenue are denominated in the Russian ruble, some of our costs, including some of those associated with purchases of foreign manufactured land and offshore drilling rigs, are denominated in the US dollar and other currencies. Any significant foreign currency exchange rate fluctuations (both short- and long-term) could have a material adverse effect on our business, financial condition and results of operations. In addition, in each of 2012, 2011 and 2010 certain of our intercompany debt was denominated in a currency other than the functional currency of the debtor company (in all cases the debtor companies are and were 100% owned members of our consolidated group).
Critical Accounting Policies
The preparation of consolidated financial statements in conformity with US GAAP requires estimates and assumptions that affect the reported amounts of assets, liabilities, revenue and expenses and the disclosure of contingent assets and liabilities. Actual amounts may differ from these estimates. The following critical accounting policies require significant judgments, assumptions and estimates and should be read in conjunction with our consolidated financial statements.
Revenue recognition. Drilling and related services are generally sold based upon contracts with our customers that do not include significant post-delivery obligations. Service revenue is recognized when the services are rendered and collectability is reasonably assured. Rates for services are typically priced on a per day, per meter, per man-hour, or similar basis. Claims and change orders that are in the process of being negotiated with customers for extra work or changes in the scope of work are included in revenue when collection is deemed probable to the extent that work has been performed.
In 2012 we changed our revenue recognition policy from units-of-delivery method to the percentage-of-completion method. This change was caused by the intention to shift from US GAAP to IFRS. In connection with this change, certain prior period amounts have been adjusted to conform to the current period presentation. All such adjustments are disclosed in Note 2 to the Consolidated Financial Statements.
The units-of-delivery method recognizes as revenue the contract price of units of a basic production product delivered during a period and as the cost of earned revenue the costs allocable to the delivered units; costs allocable to undelivered units were reported in the balance sheet as inventory or work in progress.
The percentage-of-completion method recognizes income as work on a contract progresses. For unit-price contracts (based on metres drilled or day-rates), the percentage-of-completion equals 100% of work performed each month. Revenue is recognized based on metres drilled or day-rates. For fixed-price contracts the percentage-of-completion is defined based on surveys of work performed or completion of physical proportion. Contract costs are accumulated in the same manner as inventory costs and are charged to operations as the related revenue from contracts is recognized. Claims and change orders that are in the process of being negotiated with customers for extra work or changes in the scope of work are included in revenue when collection is deemed probable.
Revenue is recognized only when it is probable that the economic benefits associated with the transaction will flow to the Group.
Revenue for other sales and services is recognized when the significant risks and rewards of ownership have passed to the buyer, when it is probable that economic benefits will flow to the Group and when these economic benefits can be reliably measured.
All sales are shown net of applicable value added tax.

| Eurasia Drilling Company Limited
29 | Management’s Discussion & Analysis
The description of our other critical accounting policies is provided in the audited consolidated financial statements for the year ended December 31, 2012.
Transition from US GAAP to IFRS
We currently anticipate that we will continue to report our financial results under US GAAP up to and including the year 2014, but intend to report our interim and full-year 2015 financial results and all periods thereafter under IFRS. We do not expect the adoption of IFRS to have a material impact on our results of operations, financial position and cash flows.