Management’s Discussion & Analysis (‘MD&A’) For the Third ... · “RMM” and the TSX...
23
Management’s Discussion & Analysis (‘MD&A’) For the Third Quarter Ended September 30, 2018 Rambler Metals and Mining plc Salatin House 19 Cedar Road Sutton Surrey SM2 5DA This MD&A, including appendices, is unaudited and is intended to help the reader understand Rambler Metals and Mining plc (‘the parent company’) and its subsidiaries (the ‘Group’ or ‘Rambler’), our operations and our present business environment. It has been prepared as of November 20, 2018 and covers the results of operations for the quarter ended September 30, 2018. This discussion should be read in conjunction with the audited Financial Statements for the year ended December 31, 2017 and notes thereto. This consolidated financial information has been prepared in accordance with International Financial Reporting Standards (“IFRS”) and their interpretations issued by the International Accounting Standards Board (“IASB”), as adopted by the European Union and with IFRS and their interpretations issued by the IASB. The presentation currency is US Dollars. These statements together with the following MD&A are intended to provide investors with a reasonable basis for assessing the potential future performance. See Forward Looking Statement disclosure in Appendix 5.
Transcript of Management’s Discussion & Analysis (‘MD&A’) For the Third ... · “RMM” and the TSX...

Management’s Discussion & Analysis (‘MD&A’)
For the Third Quarter Ended September 30, 2018
Rambler Metals and Mining plc Salatin House
19 Cedar Road Sutton Surrey
SM2 5DA
This MD&A, including appendices, is unaudited and is intended to help the reader understand Rambler Metals and Mining plc (‘the parent company’) and its subsidiaries (the ‘Group’ or ‘Rambler’), our operations and our present business environment. It has been prepared as of November 20, 2018 and covers the results of operations for the quarter ended September 30, 2018. This discussion should be read in conjunction with the audited Financial Statements for the year ended December 31, 2017 and notes thereto. This consolidated financial information has been prepared in accordance with International Financial Reporting Standards (“IFRS”) and their interpretations issued by the International Accounting Standards Board (“IASB”), as adopted by the European Union and with IFRS and their interpretations issued by the IASB. The presentation currency is US Dollars. These statements together with the following MD&A are intended to provide investors with a reasonable basis for assessing the potential future performance. See Forward Looking Statement disclosure in Appendix 5.
GROUP OVERVIEW The Company is transforming the Ming Copper-Gold Mine Project (‘the Project’) with the completion of its Phase II expansion with a focus on sustaining the new 1,250 metric tonne per day (‘mtpd’) production target. Its principal activity is the development, mining and exploration of its mining Project in Newfoundland and Labrador (see map referenced in Appendix 1) with a longer-term goal of continued exploration and development of other properties in its portfolio, all located in Canada. The Company is currently focussed on:
1. Returning the operation to profitability and positive cash flow following the completion of the productivity improvement initiative which focused on three key areas; mine planning, mine operations and mine mobile equipment maintenance. As the sustainability phase of the initiative continues the Company is most encouraged with the upward trending performance targeting daily production of 1,250 dry metric tonnes of ore to surface, improving mine delivered grades, lowering net direct cash costs (C1) per pound of saleable and ultimately returning to profitability.
2. Following sustained production, at the planned tonnes and grade, the Company will continue with engineering studies with a view to further increase production to 2,000 mtpd. Detailed engineering will include: underground material handling options; shaft rehabilitation; mill location trade-offs.
3. Continue diamond drilling programs aiming to increase available resources and reserves through continued exploration within the Ming mine’s mineralized trend.
See Forward Looking Information in Appendix 5. The Company’s directors and management believe that these priorities provide a solid foundation for Rambler, and its shareholders, as it continues working towards building a successful mid-tier mining company. The parent Company’s Ordinary Shares trade on the London AIM market under the symbol “RMM” and the TSX Venture Exchange under the symbol “RAB”.
1 Rambler Metals and Mining plc MD&A Q3 Fiscal 2018

HIGHLIGHTS OF THE THIRD QUARTER Continued the productivity improvement initiative at the mine focused on productivity and
efficiency improvements in three main areas: mine planning, mine operations and mine mobile equipment maintenance. Upward moving trends:
o Mine development (excluding post-pillar-cut-and-fill (‘PPCF’) advance) in the quarter totalled 807 meters, representing a 5.4% increase compared to Q2/18 and a 40.3% increase over Q1/18. This reflects the improvements in productivity that have been embedded in the operation and the decision to convert the LFZ Block 1 mineral reserves from PPCF to a longhole mining method. This is allowing the development teams to focus on creating new ramps and ore access headings with the goal of improving the developed state of the mine and reducing overall mining costs.
o Longhole production drilling meters and longhole tonnes blasted increased by 60% and 74% respectively in Q3/18 compared to Q2/18, reflective of the increased focus on stope access development in the mine.
o Total weekly material (ore and waste) moved to final location trended upwards during the quarter averaging 11,595 wet metric tonnes (‘wmt’) at quarter end compared to 10,100 at June 1, 2018, a 15% improvement. These trends continue with total weekly material moved, as of the date of this release, exceeding the 12,600 wmt target 4 out of 7 weeks after quarter end.
o While average daily ore hauled to surface trended upward during the quarter the mine is just now showing consistent improvements in its fundamental ore production metrics. Management is beginning to develop real insight into managing the short-term developed state of the mine. During the month of October, the mine averaged 1278 tonnes ore and 556 tonnes waste per day.
A total of 1,266 tonnes of saleable copper were recovered to concentrate in the quarter, a
29% increase over Q2/18 and a 26% increase over Q3/17. The quarterly production of saleable gold totalled 1,020 ounces, a 15% reduction from Q2/18 and 10% increase over Q3/17.
Production during the quarter of 93,128 dry metric tonnes (‘dmt’) (Q2/18: 94,589 dmt, Q3/17: 79,300 dmt) with copper concentrate grade of 29% (Q2/18: 28%, Q3/17: 29%) and copper head grade of 1.46% (Q2/18: 1.12%, Q3/17: 1.38%).
Revenue for the quarter was US$9.0 million (Q2/18: US$8.1 million, Q3/17: US$7.3 million).
Average prices for the quarter were US$2.77 per pound of copper (Q2/18: US$3.13, Q3/17: US$2.86) and US$1,216 per ounce gold (Q2/18: US$1,307, Q3/17: US$1,273).
Operating loss of US$3.8 million (Q2/18: US$3.4 million, Q3/18: US$2.5 million) and
Earnings/(losses) before interest, taxes, depreciation, amortisation (‘EBITDA’) of US$(1.5) million (Q2/18: US$(1.4) million, Q3/17: US$1.1 million). EBITDA adjusted for one off mine consultancy costs for the quarter was US$(0.3) million (Q2/18: US$(0.8) million.
2 Rambler Metals and Mining plc MD&A Q3 Fiscal 2018
Direct cash costs net of by-product credits (‘C1 costs’) for the quarter were US$3.35 (Q2/18: US$3.66, Q3/17: US$ 2.87).
Cash flows generated from/(utilized in) operating activities during the quarter were US$(0.7)
million (Q2/18: US$(1.9) million, Q3/17: US$2.2 million).
3 Rambler Metals and Mining plc MD&A Q3 Fiscal 2018
FINANCIAL RESULTS Revenue A total of 4,550 dmt (Q2/18 – 3,601 dmt, Q3/17 - 3,681 dmt) of concentrate was provisionally
invoiced during the period at an average price of US$2.77 (Q2/18 – US$3.13, Q3/17 - US$2.86) per pound copper and US$1,216 (Q2/18 – US$1,307, Q3/17 - US$1,273) per ounce gold, generating US$9.0 million in revenue (Q2/18: US$8.1, Q3/17: US$7.3).
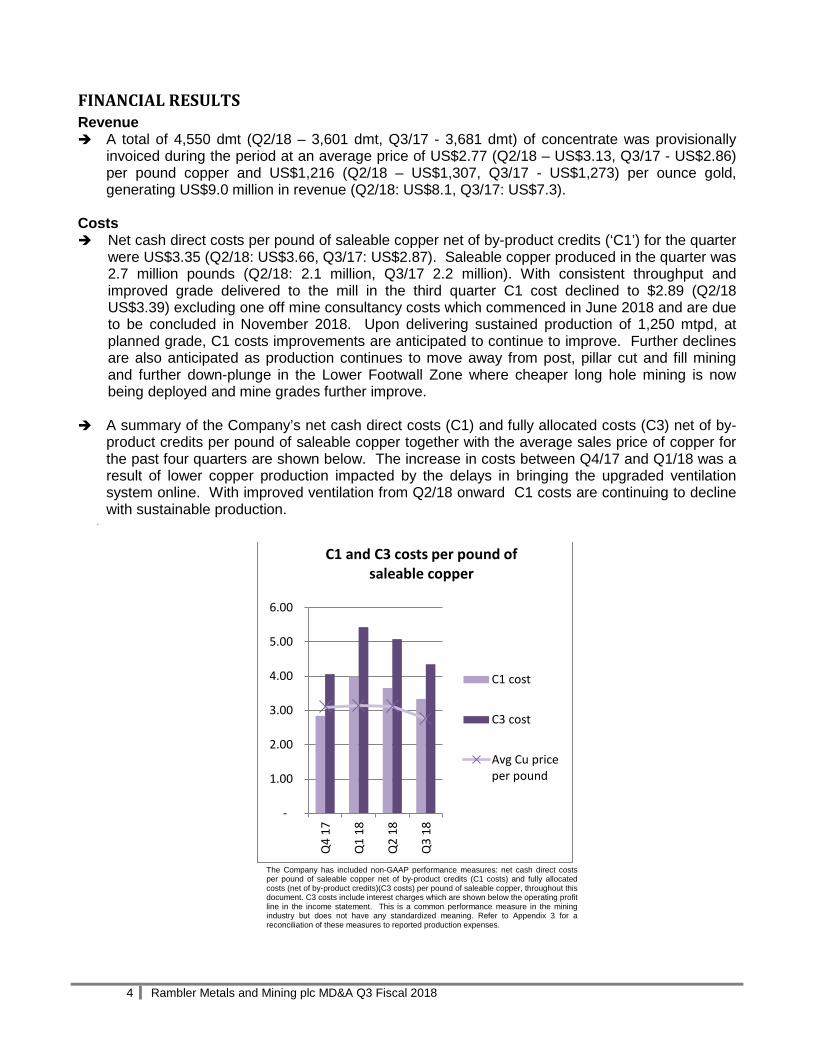
Costs Net cash direct costs per pound of saleable copper net of by-product credits (‘C1’) for the quarter
were US$3.35 (Q2/18: US$3.66, Q3/17: US$2.87). Saleable copper produced in the quarter was 2.7 million pounds (Q2/18: 2.1 million, Q3/17 2.2 million). With consistent throughput and improved grade delivered to the mill in the third quarter C1 cost declined to $2.89 (Q2/18 US$3.39) excluding one off mine consultancy costs which commenced in June 2018 and are due to be concluded in November 2018. Upon delivering sustained production of 1,250 mtpd, at planned grade, C1 costs improvements are anticipated to continue to improve. Further declines are also anticipated as production continues to move away from post, pillar cut and fill mining and further down-plunge in the Lower Footwall Zone where cheaper long hole mining is now being deployed and mine grades further improve.
A summary of the Company’s net cash direct costs (C1) and fully allocated costs (C3) net of by-
product credits per pound of saleable copper together with the average sales price of copper for the past four quarters are shown below. The increase in costs between Q4/17 and Q1/18 was a result of lower copper production impacted by the delays in bringing the upgraded ventilation system online. With improved ventilation from Q2/18 onward C1 costs are continuing to decline with sustainable production.
.
The Company has included non-GAAP performance measures: net cash direct costs per pound of saleable copper net of by-product credits (C1 costs) and fully allocated costs (net of by-product credits)(C3 costs) per pound of saleable copper, throughout this document. C3 costs include interest charges which are shown below the operating profit line in the income statement. This is a common performance measure in the mining industry but does not have any standardized meaning. Refer to Appendix 3 for a reconciliation of these measures to reported production expenses.
-
1.00
2.00
3.00
4.00
5.00
6.00
Q4
17
Q1
18
Q2
18
Q3
18
C1 and C3 costs per pound of saleable copper
C1 cost
C3 cost
Avg Cu priceper pound
4 Rambler Metals and Mining plc MD&A Q3 Fiscal 2018
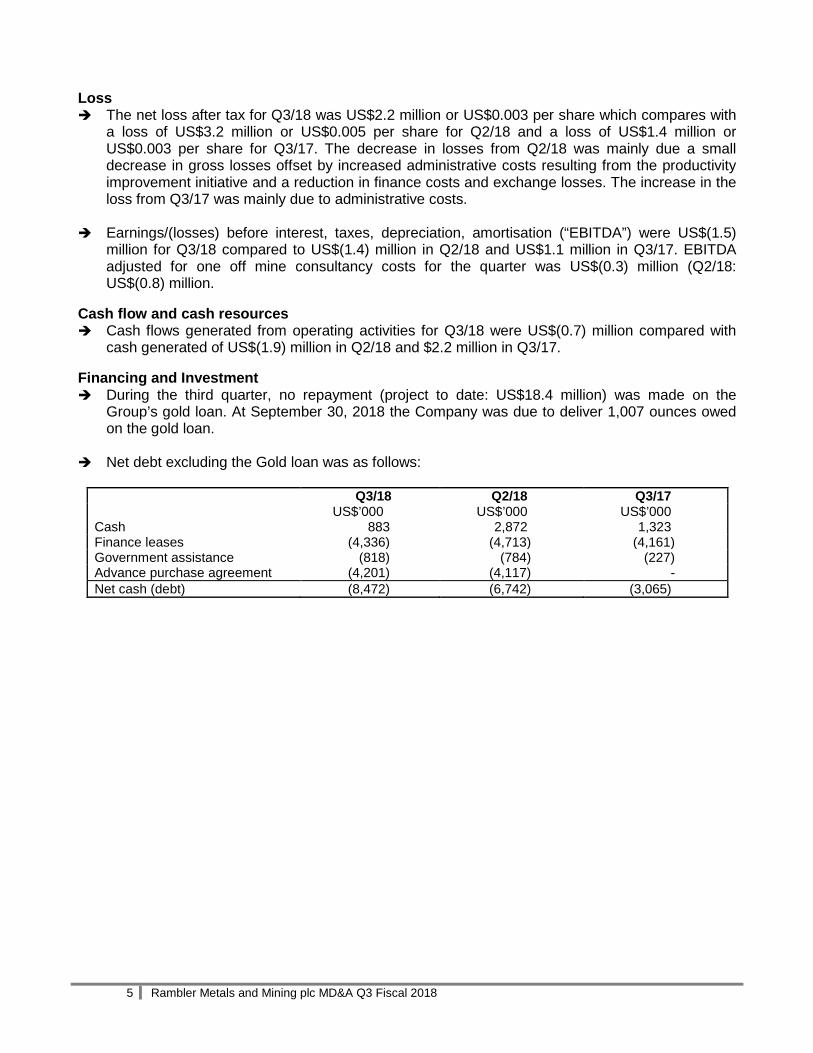
Loss The net loss after tax for Q3/18 was US$2.2 million or US$0.003 per share which compares with
a loss of US$3.2 million or US$0.005 per share for Q2/18 and a loss of US$1.4 million or US$0.003 per share for Q3/17. The decrease in losses from Q2/18 was mainly due a small decrease in gross losses offset by increased administrative costs resulting from the productivity improvement initiative and a reduction in finance costs and exchange losses. The increase in the loss from Q3/17 was mainly due to administrative costs.
Earnings/(losses) before interest, taxes, depreciation, amortisation (“EBITDA”) were US$(1.5)
million for Q3/18 compared to US$(1.4) million in Q2/18 and US$1.1 million in Q3/17. EBITDA adjusted for one off mine consultancy costs for the quarter was US$(0.3) million (Q2/18: US$(0.8) million.
Cash flow and cash resources Cash flows generated from operating activities for Q3/18 were US$(0.7) million compared with
cash generated of US$(1.9) million in Q2/18 and $2.2 million in Q3/17. Financing and Investment During the third quarter, no repayment (project to date: US$18.4 million) was made on the
Group’s gold loan. At September 30, 2018 the Company was due to deliver 1,007 ounces owed on the gold loan.
Net debt excluding the Gold loan was as follows:
Q3/18 Q2/18 Q3/17 US$’000 US$’000 US$’000 Cash 883 2,872 1,323 Finance leases (4,336) (4,713) (4,161) Government assistance (818) (784) (227) Advance purchase agreement (4,201) (4,117) - Net cash (debt) (8,472) (6,742) (3,065)
5 Rambler Metals and Mining plc MD&A Q3 Fiscal 2018

ORE CONCENTRATE AND PRODUCTION QUARTER BY QUARTER PRODUCTION Q2/18
Q3/18
Q3/17
Q3/18
Dry Tonnes Milled 94,589 93,128 -2% 79,300 93,128 17% Copper Recovery (%) 95.9 97.3 1% 95.4 97.3 2% Gold Recovery (%) 68.9 71.9 4% 61.7 71.9 17% Copper Head Grade (%) 1.12 1.46 30% 1.38 1.46 5% Gold Head Grade (g/t) 0.63 0.54 -15% 0.66 0.54 -19% CONCENTRATE (Produced and Stored in Warehouse)
Copper (%) 28.0 29.4 5% 28.9 29.4 2% Gold (g/t) 11.2 8.1 -28% 9.0 8.1 -10% Dry Tonnes Produced 3,643 4,478 23% 3,614 4,478 24% Saleable Copper Metal (t) 978 1,266 29% 1,004 1,266 26% Saleable Gold (oz) 1,199 1,020 -15% 930 1,020 10%
• Production of 4,478 tonnes of copper concentrate, representing a 23% increase over Q2/18
resulting from higher copper head grade during the quarter.
• Dry tonnes milled of 93,128 tonnes, a 2% decrease over Q2/18 and a 17% increase over Q3/17.
o 1,266 tonnes of saleable copper (a 29% increase over Q2/18 and a 26% increase over Q3/17)
o 1,020 ounces of saleable gold (a 15% decrease over Q2/18 and a 10% increase over Q3/17)
• Head grades of copper averaged 1.46% for the quarter (a 30% increase over Q2/18 and 5% increase over Q3/17); gold averaged 0.54 g/t (15% decrease over Q2/18 and 19% decrease over Q3/17).
OUTLOOK
Management continues to pursue the following objectives:
Continue building on the momentum gained from the productivity improvement initiative embedded at the operation during the third quarter delivering a sustained production of 1,250 dry meter tonnes per day with average copper and gold grades between 1.35-1.45% copper and 0.5 to 0.7 g/t gold before the end of year. As we continue to develop deeper into the LFZ, over the projected 20 year mine life, diamond drill results show that grades and mineralized thickness continue to strengthen at depth.
6 Rambler Metals and Mining plc MD&A Q3 Fiscal 2018
Further evaluate the potential of a Phase III operation with increase in mine production and mill throughput to about 2,000 mtpd.
Continuing with the underground exploration program to allow for further exploration of the mineralized trends both up-dip and down-dip with the goal to increase near-mine mine resource and reserves.
Continue with the surface exploration program aimed further expand on the known massive
sulphide and LFZ mineralization.
See ‘Forward Looking Information’ in Appendix 5 for a description of the factors that may cause actual results to differ from forecast.
7 Rambler Metals and Mining plc MD&A Q3 Fiscal 2018

FINANCIAL REVIEW Q3/18
Results (US$000’s)
Commentary Comparatives
Q2/18 B/(W)* Q3/17 B/(W)
8,973
Revenue of US$8.9 million in Q3/18 was generated through the sale of 4,550 dmt of copper concentrate containing 1,250 tonnes of saleable copper metal, 1,021 ounces of saleable gold compared with US$8.1 million from the sale of 3,601 dmt of copper concentrate in Q2/18. Revenue in Q3/17 was generated through the sale of 3,681 dmt of copper concentrate containing 1,005 tonnes of saleable copper metal and 923 ounces of saleable gold. The increase in revenue from Q2/18 reflects increased saleable metal sold as a result of higher head grades.
8,155 10% 7,280 23%
8,206
Production costs relate to the processing and mining costs associated with Group’s Ming Mine production and include processing and mining costs of US$1.6 million (Q2/18: US$1.5 million, Q3/17: US$1.4 million) and US$6.6 million (Q2/18: US$6.1 million, Q3/17: US$5.3 million) respectively. Costs are higher than Q2/18 and higher than Q3/17 due to increased production.
7,559 8% 6,728 22%
2,199 General and administrative expenses were higher than the previous quarter mainly due to an increase in consultancy fees of US$0.7 million associated with the productivity improvement initiative. In comparison to Q3/17 administrative expenses increased by US$1.5 million again mainly because of increased consultancy fees.
1,567 40% 730 201%
(420)
Gain/(loss) on derivative financial instruments. During the quarter the net unrealised fair value loss adjustment recognized was US$420,000 being the difference in the commodity prices at time of provisional invoicing and anticipated commodity prices upon final settlement. During Q2/18 the net unrealised fair value loss adjustment recognized was US$115,000 and during Q3/17 the net unrealised fair value loss adjustment recognized was US$384,000 offset by a realised gain of US$1,203,000.
(115) 365% 819 51%
329 Foreign exchange differences arising on the Gold Loan resulted in a gain in Q3/18 as a result of the strengthening of the Canadian Dollar against the US Dollar during the quarter. (394) 83% 460 (28%)
889 Income tax credit/(expense). A deferred tax credit of $889,000 was recognised on the loss for the quarter. This compares with a credit of $1,316,000 in Q2/18 and a credit of $552,000 for Q3/17. 1,316 (32)% 552 61%
921 Mineral property. The group incurred costs of $0.9 million in the quarter. The cost includes labour costs of US$0.4 million and underground development costs of US$0.5 million. The costs are lower than in Q2/18 as the Company’s development sequencing resulted in an increase in operating and less capital development.
1,133 (19)% 1,792 (49%)
428 Capital spending on property, plant and equipment decreased by US$0.5 million during the quarter compared to Q2/18 and US$0.5 million less than in Q3/17. 970 (56)% 994 (57)%
*B / (W) = Better / (Worse)
8 Rambler Metals and Mining plc MD&A Q3 Fiscal 2018

SUMMARY OF QUARTERLY RESULTS The quarterly results for the Group for the last eight fiscal quarters are set out in the following table.
Quarterly Results (All amounts in 000s of US Dollars, except Loss per share figures)
4th Quarter
3rd Quarter
2nd Quarter
1st Quarter
Calendar 2018 Jul – Sep Apr – Jun Jan – Mar
Revenue 8,973 8,155 6,244
(Loss)/profit before impairment and tax (3,108) (4,540) (6,133)
Net (loss) income (2,219) (3,224) (4,332)
(Loss)/earnings per Share (Basic & Diluted) (0.003) (0.005) (0.008)
Fully allocated cost net of by-products (C3) per pound of saleable copper
4.36
5.08
5.43
Calendar 2017 Oct - Dec Jul – Sep Apr – Jun Jan – Mar
Revenue 8,380 7,280 6,939 5,725
(Loss)/profit before impairment and tax 1,316 (1,905) (949) (3,906)
Net (loss) income 686 (1,353) (702) (2,779)
(Loss)/earnings per Share (Basic & Diluted) 0.001 (0.003) (0.001) (0.005)
Fully allocated cost net of by-products (C3) per pound of saleable copper
3.09
4.10
3.53
4.57
Calendar 2016 Oct - Dec
Revenue 5,396
(Loss)/profit before impairment and tax (4,423)
Net (loss) income (1,565)
(Loss)/earnings per Share (Basic & Diluted) (0.004)
Fully allocated cost net of by-products (C3) per pound of saleable copper
4.27
* closest comparative quarters Financial results are impacted by the levels of copper concentrate production, the costs associated with that production and the selling prices of the concentrate. The prices for the copper, gold and silver contained in the concentrate are determined using prevailing international prices in US Dollars whereas the majority of the mine costs are in Canadian Dollars. Volatility of revenue and earnings over the past eight quarters is due to the combined effect of changes in volumes and fluctuations in metal prices and the fluctuation of the US Dollar exchange rate.
9 Rambler Metals and Mining plc MD&A Q3 Fiscal 2018

LIQUIDITY, CAPITAL RESOURCES AND FINANCIAL POSITION Historically the Company has been successful in accessing the equity and debt markets to finance the acquisition and initial development of the Project. During Q2/18 the Company received US$7.3 million from the issue of shares from the exercise of 65 million warrants and the issue of 44.4 million shares from a private placement. In future, the Company plans to fund operational requirements through internally generated cash flow, debt offerings and, if necessary, additional equity financing. The Company continually reviews operational results, expenditures and additional financial opportunities in order to ensure adequate liquidity to support its growth strategy while maintaining or increasing production levels at the Ming Mine. However, there is no guarantee that the Company will have access to future capital or the ability to generate positive cash flows and this represents a material uncertainty which casts significant doubt upon the Group’s continued ability to operate as a going concern, such that it may be unable to realise its assets and discharge its liabilities in the normal course of business. The financial statements have been prepared on a going concern basis which assumes that the Group will be able to realise its assets and settle its obligations in the normal course of business. The financial statements do not reflect adjustments to the carrying values and classification of assets and liabilities that would be necessary should the Group be unable to continue as a going concern. Such adjustments might be material. Cash flows utilised in investing activities amounted to US$0.9 million for the quarter. Cash of US$0.9 million was spent on the Company’s mineral property and $0.4 million was spent on property, plant and equipment offset by US$446,000 received from the sale of available for sale investments. Cash flows utilised in financing activities during the period amounted to US$0.5 million, consisting of the repayment of finance leases. The cash balance decreased by US$2 million during the quarter to US$0.9 million as a result of continued operating losses. The Company is in advanced negotiations in relation to a financing of US$2 million to support cash requirements in the short-term and expects to announce the outcome of these negotiations in the next few days. The Company is required to hold Letters of Credit in favour of the Government of Newfoundland and Labrador in respect of the reclamation and closure liability at the Project. At period end the Group holds bearer deposit notes totalling US$3.4 million. Sales of copper concentrate are in US Dollars and the majority of the Company’s expenses are incurred in Canadian Dollars. The Company’s principal exchange rate risk relates to movements between the Canadian and US Dollar. The Gold Loan is repayable from future sales of gold mitigating the exchange risk. Management will closely monitor exchange fluctuation and consider the use of forward exchange contracts as required. Interest rates on the capital leases and short term borrowings are fixed, eliminating interest rate risk.
10 Rambler Metals and Mining plc MD&A Q3 Fiscal 2018

Financial Instruments The Company’s principal financial assets comprise: cash and cash equivalents, restricted cash, available for sale investments, derivative financial instruments and trade and other receivables. The Company’s financial liabilities comprise trade payables; other payables; and interest bearing loans and borrowings. All of the Company’s financial liabilities are measured at amortised cost. The Board of Directors determines, as required, the degree to which it is appropriate to use financial instruments and hedging techniques to mitigate risks. The main risks for which such instruments may be appropriate are foreign currency risk, liquidity risk, credit risk, interest rate risk and commodity price risk each of which is discussed in note 24 of the financial statements for the period ended December 31, 2017.
11 Rambler Metals and Mining plc MD&A Q3 Fiscal 2018
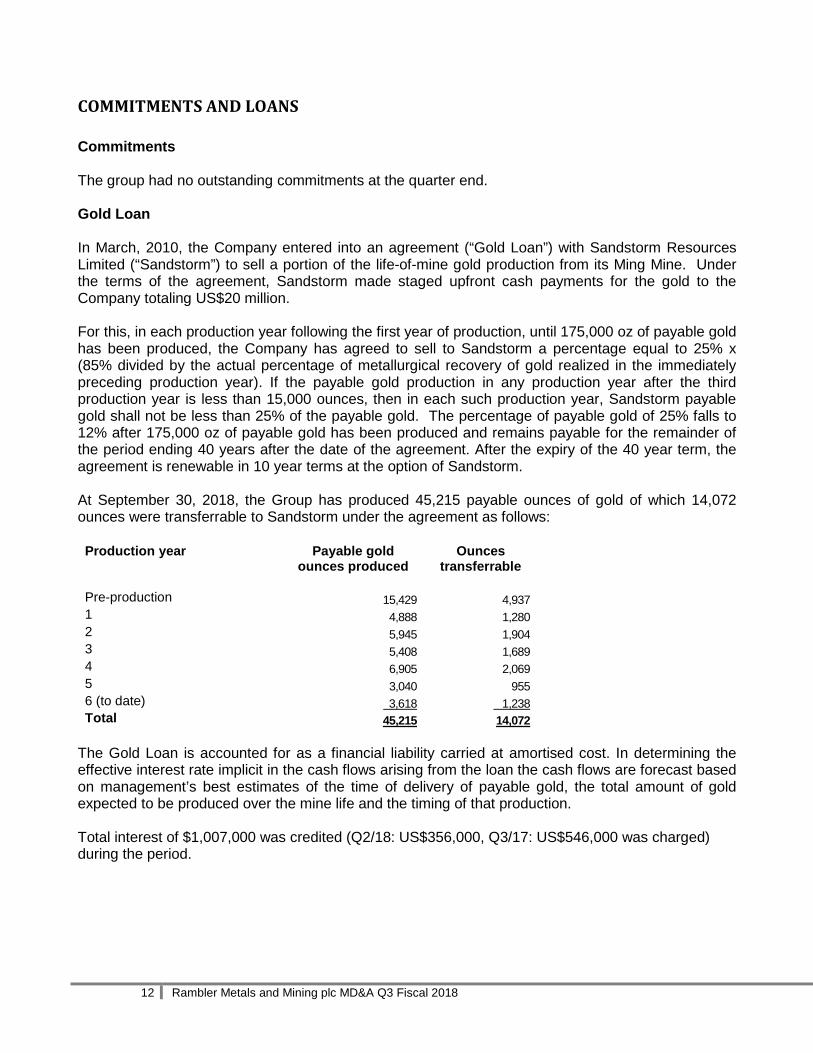
COMMITMENTS AND LOANS Commitments The group had no outstanding commitments at the quarter end. Gold Loan In March, 2010, the Company entered into an agreement (“Gold Loan”) with Sandstorm Resources Limited (“Sandstorm”) to sell a portion of the life-of-mine gold production from its Ming Mine. Under the terms of the agreement, Sandstorm made staged upfront cash payments for the gold to the Company totaling US$20 million. For this, in each production year following the first year of production, until 175,000 oz of payable gold has been produced, the Company has agreed to sell to Sandstorm a percentage equal to 25% x (85% divided by the actual percentage of metallurgical recovery of gold realized in the immediately preceding production year). If the payable gold production in any production year after the third production year is less than 15,000 ounces, then in each such production year, Sandstorm payable gold shall not be less than 25% of the payable gold. The percentage of payable gold of 25% falls to 12% after 175,000 oz of payable gold has been produced and remains payable for the remainder of the period ending 40 years after the date of the agreement. After the expiry of the 40 year term, the agreement is renewable in 10 year terms at the option of Sandstorm. At September 30, 2018, the Group has produced 45,215 payable ounces of gold of which 14,072 ounces were transferrable to Sandstorm under the agreement as follows: Production year Payable gold
ounces produced Ounces
transferrable Pre-production 15,429 4,937 1 4,888 1,280 2 5,945 1,904 3 5,408 1,689 4 6,905 2,069 5 3,040 955 6 (to date) 3,618 1,238 Total 45,215 14,072
The Gold Loan is accounted for as a financial liability carried at amortised cost. In determining the effective interest rate implicit in the cash flows arising from the loan the cash flows are forecast based on management’s best estimates of the time of delivery of payable gold, the total amount of gold expected to be produced over the mine life and the timing of that production. Total interest of $1,007,000 was credited (Q2/18: US$356,000, Q3/17: US$546,000 was charged) during the period.
12 Rambler Metals and Mining plc MD&A Q3 Fiscal 2018
COMMITMENTS AND LOANS (continued) Advance Purchase Agreement During the year ended December 31, 2017 the Company repaid the balance of the advance purchase agreement originally signed in July 2015 and in December 2017 the Group entered into another amended and restated purchase agreement with Transamine Trading S.A. (“Transamine”). Pursuant to the terms of the Purchase Agreement, Transamine agreed to purchase in advance, at Rambler’s option, up to US$4 million of concentrate (the “Advance Purchase Payments”) to be used for working capital requirements along with the development and construction of Rambler’s Lower Footwall Zone optimisation plan (Phase II) at the Project. The Company drew down US$4 million of Advance Purchase Payments on December 29, 2017. At September 30, 2018 the balance was US$4.2 million. The loan is repayable by eighteen monthly instalments of US$222,222 plus interest at 6.75% per annum commencing June 28, 2018. The agreement has subsequently been amended with three monthly instalments of $111,111 commencing October 15, 2018 followed by monthly instalments of $222,222 commencing January 15, 2019. The advance purchase payments of US$4 million have been accounted for as a financial liability carried at amortised cost. Related party loan In 2017 the Company received a loan of US$1 million from CE Mining II Rambler Limited. The loan is unsecured, repayable by October 17, 2018 and carried interest at 9.5% per annum. The loan was repaid in full on June 20, 2018. Loan and lease balances At September 30, 2018, interest bearing loans and borrowings, included finance lease commitments, of US$4.3 million. The Company did not enter into any finance lease commitments during the quarter.
13 Rambler Metals and Mining plc MD&A Q3 Fiscal 2018

APPENDIX 1 – LOCATION MAP
14 Rambler Metals and Mining plc MD&A Q3 Fiscal 2018

APPENDIX 2 - SELECTED FINANCIAL INFORMATION & REVIEW OF OVERALL PERFORMANCE
Financial Highlights (All amounts in 000s of US Dollars, unless otherwise stated)
Three months ended,
September 30, 2018
June 30, 2018
September30, 2017
Concentrate sales (dmt) 4,550 3,601 3,681 Average revenue per pound of Cu ($) 2.77 3.13 2.86 Revenue 8,973 8,155 7,280
Production costs 8,206 7,559 6,728 Administrative expenses 2,232 1,567 730 Net (loss)/income (2,219) (3,224) (1,353) Cash Flow generated from operating activities (670) (1,921) 2,239 Cash Flow used in investing activities (890) (2,208) (3,284) Cash Flow used in financing activities (478) 5,745 (728) Net increase/(decrease) in cash (2,038) 1,616 (1,773) Cash and cash equivalents at end of period 883 2,872 1,323 Total Assets 94,033 94,807 92,194 Total Liabilities (34,021) (33,537) (28,099) Working Capital (13,278) (9,667) (5,592) Weighted average number of shares outstanding (‘000s)
613,423
613,423
535,605
Earnings/(loss) per share ($) (0.003) (0.005) (0.003)
15 Rambler Metals and Mining plc MD&A Q3 Fiscal 2018
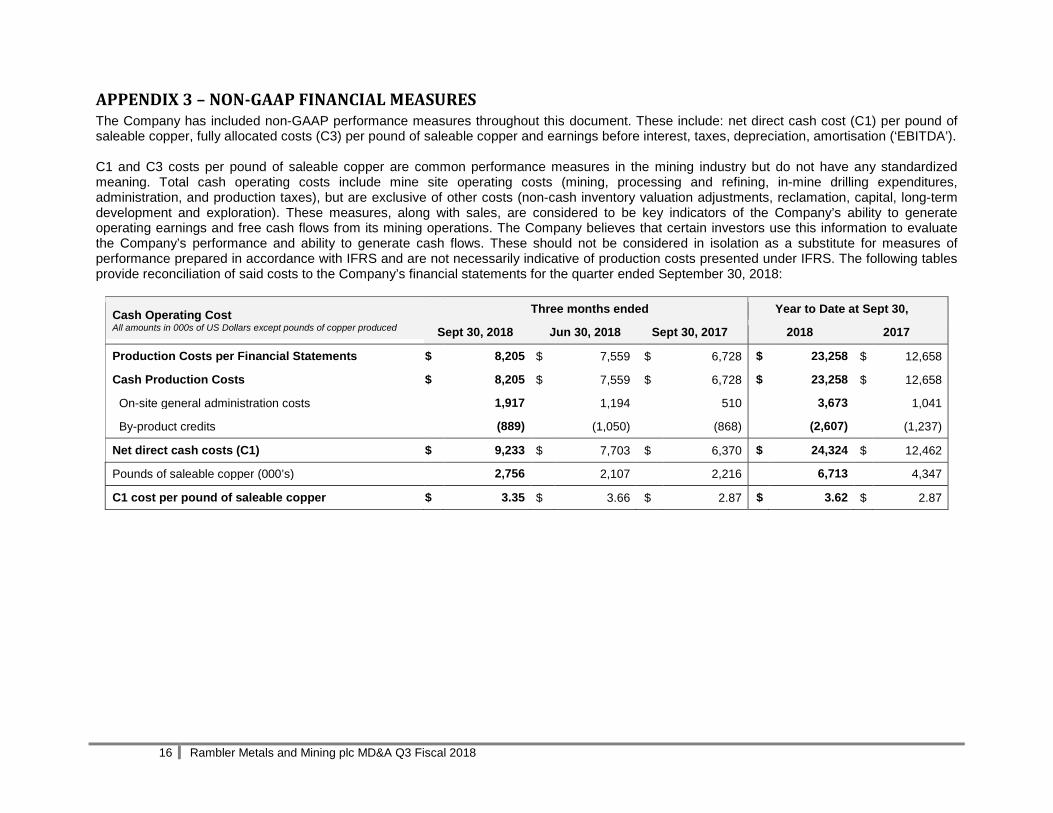
APPENDIX 3 – NON-GAAP FINANCIAL MEASURES The Company has included non-GAAP performance measures throughout this document. These include: net direct cash cost (C1) per pound of saleable copper, fully allocated costs (C3) per pound of saleable copper and earnings before interest, taxes, depreciation, amortisation (‘EBITDA’). C1 and C3 costs per pound of saleable copper are common performance measures in the mining industry but do not have any standardized meaning. Total cash operating costs include mine site operating costs (mining, processing and refining, in-mine drilling expenditures, administration, and production taxes), but are exclusive of other costs (non-cash inventory valuation adjustments, reclamation, capital, long-term development and exploration). These measures, along with sales, are considered to be key indicators of the Company’s ability to generate operating earnings and free cash flows from its mining operations. The Company believes that certain investors use this information to evaluate the Company’s performance and ability to generate cash flows. These should not be considered in isolation as a substitute for measures of performance prepared in accordance with IFRS and are not necessarily indicative of production costs presented under IFRS. The following tables provide reconciliation of said costs to the Company’s financial statements for the quarter ended September 30, 2018:
Cash Operating Cost All amounts in 000s of US Dollars except pounds of copper produced
Three months ended Year to Date at Sept 30,
Sept 30, 2018 Jun 30, 2018 Sept 30, 2017 2018 2017
Production Costs per Financial Statements $ 8,205 $ 7,559 $ 6,728 $ 23,258 $ 12,658
Cash Production Costs $ 8,205 $ 7,559 $ 6,728 $ 23,258 $ 12,658
On-site general administration costs 1,917 1,194 510 3,673 1,041
By-product credits (889) (1,050) (868) (2,607) (1,237)
Net direct cash costs (C1) $ 9,233 $ 7,703 $ 6,370 $ 24,324 $ 12,462
Pounds of saleable copper (000’s) 2,756 2,107 2,216 6,713 4,347
C1 cost per pound of saleable copper $ 3.35 $ 3.66 $ 2.87 $ 3.62 $ 2.87
16 Rambler Metals and Mining plc MD&A Q3 Fiscal 2018

APPENDIX 3 - NON-GAAP FINANCIAL MEASURES (continued)
C3 per Pound of Saleable Copper All amounts in 000s of US Dollars except pounds of saleable copper
Three months ended Year to date at Sept 30,
Sept 30, 2018 Jun 30, 2018 Sept 30, 2017 2018 2017
Net direct cash costs (see above) $ 9,233 $ 7,703 $ 6,370 $ 24,324 $ 18,832
Depreciation and amortisation 2,368 2,474 2,350 7,044 6,503
Corporate Cash Expense 164 284 236 694 843
Cash Interest Expense 246 249 129 709 272
Fully allocated costs (C3 cost) $ 12,011 $ 10,710 $ 9,085 $ 32,771 $ 26,470
Pounds of saleable copper 2,756 2,107 2,216 6,713 6,563
C3 cost per pound of saleable copper $ 4.36 $ 5.08 $ 4.10 $ 4.88 $ 4.03
Earnings before interest, tax and depreciation All amounts in 000s of US Dollars
Three months ended Year to date at Sept 30,
Sept 30, 2018 Jun 30, 2018 Sept 30, 2017 2018 2017
(Loss)/profit after tax per Financial statements $ (2,219) $ (3,224) $ (1,353) $ (9,775) $ (4,834)
Taxation (889) (1,316) (552) (4,006) (1,926)
Net interest (774) 594 664 400 1,153
(Gain)/ Loss on disposal of property, plant and equipment
-
25
-
90
-
Depreciation and amortisation 2,368 2,474 2,350 7,044 6,503
EBITDA $ (1,514) $ (1,447) $ 1,109 $ (6,247) $ 896
17 Rambler Metals and Mining plc MD&A Q3 Fiscal 2018
APPENDIX 4 - CRITICAL ACCOUNTING POLICIES AND ESTIMATES The details of the Company’s accounting policies are presented in accordance with International Financial Reporting Standards as set out in Note 2 to the financial statements. The preparation of financial statements in conformity with IFRS requires management to make estimates and assumptions that affect the reported amounts of assets and liabilities and the disclosure of contingent assets and liabilities at the date of the financial statements and the reported amounts of revenues and expenses during the period. The following estimates are considered by management to be the most critical for investors to understand some of the processes and reasoning that go into the preparation of the Company’s financial statements, providing some insight also to uncertainties that could impact the Company’s financial results. Going Concern Historically the Company has been successful in accessing the equity and debt markets to finance the acquisition and initial development of the Project. During Q2/18 the Company received US$7.3 million from the issue of shares from the exercise of 65 million warrants and the issue of 44.4 million shares from a private placement. In future, the Company plans to fund operational requirements through internally generated cash flow, debt offerings and, if necessary, additional equity financing. The Company continually reviews operational results, expenditures and additional financial opportunities in order to ensure adequate liquidity to support its growth strategy while maintaining or increasing production levels at the Ming Mine. However, there is no guarantee that the Company will have access to future capital or the ability to generate positive cash flows and this represents a material uncertainty which casts significant doubt upon the Group’s continued ability to operate as a going concern, such that it may be unable to realise its assets and discharge its liabilities in the normal course of business. The financial statements have been prepared on a going concern basis which assumes that the Group will be able to realise its assets and settle its obligations in the normal course of business. The financial statements do not reflect adjustments to the carrying values and classification of assets and liabilities that would be necessary should the Group be unable to continue as a going concern. Such adjustments might be material. Share-based payments The Company calculates the cost of share-based payments using the Black-Scholes model. Inputs into the model in respect of the expected option/warrant life and the volatility are subject to management estimates and any changes to these estimates may have a significant effect on the cost. The assumptions used in calculating the cost of share-based payments are explained in notes 6 and 21 of the financial statements for the year ended December 31, 2017.
18 Rambler Metals and Mining plc MD&A Q3 Fiscal 2018

APPENDIX 4 - CRITICAL ACCOUNTING POLICIES AND ESTIMATES (continued) Gold Loan The Company calculates the effective interest rate on the Gold Loan based on estimates of future cash flows arising from the sale of payable gold (see note 22 of the financial statements for the period ended December 31, 2017). The cash flows will be dependent on the production of gold and its selling price at the time of delivery which have been estimated in line with the mine plan, future prices of gold and resource and reserve estimates. Management’s estimates of these factors are subject to risk and uncertainties affecting the amount of the interest charge. Any changes to these estimates may result in a significantly different interest charge which would affect the income statement and the corresponding Gold Loan liability. Mineral Property and Exploration and Evaluation Costs The directors have assessed whether there are any indicators of impairment in respect of mineral property and exploration and evaluation costs. In making this assessment they have considered the Company’s business plan which includes resource estimates, future processing capacity, the forward market and longer term price outlook for copper and gold. Resource estimates have been based on the most recently filed NI43-101 report and its opportunities economic model which includes resource estimates without conversion of its inferred resources. Management’s estimates of these factors are subject to risk and uncertainties affecting the recoverability of the Company’s mineral property and exploration and evaluation costs. After consideration of the above factors, the directors do not consider that there are any indicators that mineral property and exploration and evaluation costs are impaired at the quarter end. Amortisation of Mineral Property Amortisation of the Mineral Property is calculated on a unit of production method expected to amortise the cost including future forecast capital expenditure over the expected life of the mine based on the tonnes of ore expected to be extracted. Any changes to these estimates may result in an increase in the amortisation charge with a corresponding reduction in the carrying value of the Mineral Property. Closure Costs The Company has an obligation to reclaim its Project after the minerals have been mined from the site, and has estimated the costs necessary to comply with existing reclamation standards. These estimates are recorded as a liability at their fair values in the periods in which they occur. If the estimate of reclamation costs proves to be inaccurate, the Company could be required to increase the provision for site closure and reclamation costs, which would increase the amount of future reclamation expense, resulting in a reduction in the Company’s earnings and net assets. Revenue Revenues are subject to variation after the date of sale due to assay, price and foreign exchange fluctuations. Management monitors these changes closely and at the end of the period the directors will consider whether the effect of these variations are material on the whole and determine whether an adjustment is therefore appropriate. Available for sale investments Management considers that they do not have significant influence over the financial and policy decisions of the entities in which investment has been made and therefore have included the investments as available for sale investments.
19 Rambler Metals and Mining plc MD&A Q3 Fiscal 2018

APPENDIX 4 - CRITICAL ACCOUNTING POLICIES AND ESTIMATES (continued) Deferred tax The Company has incurred losses which will be available for offset against future taxable profits and one of the subsidiaries has tax credits available to offset against future tax liabilities. Following the declaration of commercial production in the previous year it has been concluded that the Company has sufficient evidence of future taxable profits to justify the recognition of a deferred tax asset. If future taxable profits prove to be insufficient the Company could be required to reduce the deferred tax asset which would result in a reduction in the Company’s earnings and net assets. CHANGES IN ACCOUNTING POLICIES The Company has adopted all of the new and revised Standards and Interpretations that are relevant to its operations and effective for accounting periods beginning on or after 1 January 2018. The adoption of these new and revised Standards and Interpretations had no material effect on the profit or loss or financial position of the Company. No standards issued but not yet effective have been adopted early. International Financial Reporting Standards that have recently been issued or amended but are not yet effective have not been adopted for the annual reporting period ended December 31, 2018: IFRS /Amendment
Title Nature of change to accounting policy
Application date of standard
Application date for Company
IFRS 16 Leases Accounting policy will be updated to reflect requirements of IFRS 16
January 1, 2019 January 1, 2019
IFRS 16 ‘Leases’ – IFRS 16 ‘Leases’ was issued by the IASB in January 2016 and is effective for accounting periods beginning on or after 1 January 2019. The new standard will replace IAS 17 ‘Leases’ and will eliminate the classification of leases as either operating leases or finance leases and, instead, introduce a single lessee accounting model. The Standard Provides a single lessee accounting model, specifying how leases are recognised, measured, presented and disclosed. The Group does not expect any significant changes to the accounting treatment of its existing lease arrangements and the Directors do not consider that the financial and operational impact of this standard, will have a material impact but are continuing to assess the impact of this new standard. Details of the main accounting policies of the Group are included in note 2 of the financial statements for the year ended December 31, 2017.
20 Rambler Metals and Mining plc MD&A Q3 Fiscal 2018

APPENDIX 5 – OTHER MATTERS Outstanding Share & Option Data As at the date of this MD&A the following securities are outstanding:
Security Shares issued or Issuable
Weighted Average Exercise Price
Common Shares 659,139,702 --
Options 20,833,000* US$0.10 *if all options have fully vested
For further assistance Mr. Peter Mercer, Corporate Secretary can be reached directly at +1-709-800-1929 ext.500 or [email protected].
Forward Looking Information
This MD&A contains "forward-looking information" ("FLI") which may include, but is not limited to, statements with respect to the Company’s objectives and strategy, future financial or operating performance of the Company and its projects, exploration expenditures, costs and timing of the development of new deposits, costs and timing of future exploration, requirements for additional capital, government regulation of mining exploration and development, environmental risks, title disputes or claims and limitations of insurance coverage. All statements, other than statements of historical fact, are forward-looking statements. Often, but not always, statements containing FLI can be identified by the use of words such as "plans", "expects", "is expected", "budget", "scheduled", "estimates", "forecasts", "intends", "anticipates", or "believes" or variations (including negative variations) of such words and phrases, or state that certain actions, events or results "may", "could", "would", "might" or "will" be taken, occur be achieved or continue to be achieved. Forward-looking statements are based on opinions, estimates and assumptions of management considered reasonably at the date the statements are made. Key assumptions include without limitation, the price of and anticipated costs of recovery of, copper concentrate, gold and silver, the presence of and continuity of such minerals at modeled grades and values, the capacities of various machinery and equipment, the availability of personnel, machinery and equipment at estimated prices, mineral recovery rates, and others. Investors are cautioned however that forward-looking statements necessarily involve both known and unknown risks, uncertainties and other factors which may cause the actual results, performance or achievements of the Company to be materially different from any future results, performance or achievements expressed or implied by the FLI. Such factors include, among others, general business, economic, competitive, political and social uncertainties; the actual results of current exploration activities; conclusions of economic evaluations; availability and cost of credit; fluctuations in Canadian Dollar interest rates; fluctuations in the relative value of United States Dollars, Canadian Dollars and British Pounds; changes in planned parameters as plans continue to be refined; fluctuations in the market and forward prices of copper, gold, silver or certain other commodities; possible variations of ore grade or recovery rates; failure of equipment; accidents and other risks of the mining exploration industry; political instability, insurrection or war; delays in obtaining governmental approvals or financing or in the completion of development or construction activities, as well as those factors discussed in the section entitled "Risks and Uncertainties" in the Report of Directors for the period ended December 31, 2017. Although the Company has attempted to identify important factors that could cause actual actions, events or results to differ materially from those described in the FLI contained in this MD&A, there may be other factors that cause actions, events or results to differ from those anticipated, estimated or intended.
21 Rambler Metals and Mining plc MD&A Q3 Fiscal 2018

APPENDIX 5 – OTHER MATTERS (continued)
Forward Looking Information (continued)
Unless stated otherwise, statements containing FLI herein are made as of the date of this MD&A and the Company disclaims any intention or obligation and assumes no responsibility to update or revise any FLI contained herein, whether as a result of new information, future events or otherwise, except as required by applicable law. Other than as required by applicable securities law, the Company disclaims any obligation to update any forward-looking statements, whether as a result of new information, future events or results or otherwise. There can be no assurance that forward-looking statements will prove to be accurate, as actual results and future events could differ materially from those anticipated in such statements. All of the forward-looking statements made in this MD&A are qualified by these cautionary statements. Accordingly, readers should not place undue reliance on forward-looking statements. The following table outlines certain significant forward-looking statements contained in this MD&A and provides the material assumptions used to develop such forward-looking statements and material risk factors that could cause actual results to differ materially from the forward looking statements.
FLI statements Assumptions Risk Factors
Continued mining and milling the exposed massive sulphide and LFZ workplaces with further exploration up-dip and down-dip
Achieving the planned capital and operating development and production targets; and, timely completion of drill bays to allow commencement of exploration drilling
Development delays reducing access to production ore
Sustaining production from the Ming Mine at 1,250 mtpd and optimising production to reduce costs.
Continued monitoring and optimisation of existing infrastructure and availability of finance from cash flow from operations
Economic viability
Further information Additional information relating to the Company is on SEDAR at www.sedar.com and on the Company’s web site at www.ramblermines.com.
22 Rambler Metals and Mining plc MD&A Q3 Fiscal 2018