MANAGEMENT S DISCUSSION AND ANALYSIS ALTICE …altice.net/sites/default/files/pdf/ANV MDA Q218...
33
MANAGEMENT’ S DISCUSSION AND ANALYSIS ALTICE EUROPE N.V. (FORMERLY ALTICE N.V.) FOR THE SIX MONTHS ENDED JUNE 30, 2018
Transcript of MANAGEMENT S DISCUSSION AND ANALYSIS ALTICE …altice.net/sites/default/files/pdf/ANV MDA Q218...

MANAGEMENT’S DISCUSSION AND ANALYSIS
ALTICE EUROPE N.V. (FORMERLY ALTICE N.V.)
FOR THE SIX MONTHS ENDED JUNE 30, 2018
Contents
Overview 2
Key Factors Affecting Our Results of Operations 7
Basis of Preparation 9
Discussion and Analysis of Our Results of Operations 9
Significant Events Affecting Historical Results 10
Revenue 11
Adjusted EBITDA 14
Other items Impacting Profit/(Loss) 16
Capital Expenditure 18
Liquidity and Capital Resources 21
Key Operating Measures 24
Other Disclosures 26
Glossary 30
Overview
Our Business
We deliver fixed services, mobile telephony services and media and advertising services to B2C and B2B customers in all
of the territories in which we operate. In addition, we offer a variety of wholesale and other services across our footprint.
We also invest in specific content to supplement and enrich the services that we are providing to our customers. Our
footprint extends across 10 territories through a fiber‑rich broadband network with approximately 32.0 million homes
passed as at June 30, 2018.
We have 7 reportable segments for which we discuss the results of operations for our business:
• France: The Group controls Altice France S.A., the second largest telecom operator in France, which provides
services to residential (B2C) and business clients (B2B) as well as wholesale customers, providing mobile and
high-speed internet services using SFR and the associated brands. As of 2018, this segment also comprises of the
French Overseas Territories (FOT), Altice Technical Services France (ATSF) and Altice Customer Services
(ACS).
• Portugal: Altice owns Portugal Telecom (“PT Portugal”), the largest telecom operator in Portugal. PT Portugal
caters to fixed and mobile B2C, B2B and wholesale clients using the MEO brand. As of 2018, this segment also
includes the Altice Technical Services entities in Portugal.
• Israel: Fixed and mobile services are provided using the HOT telecom, HOT mobile and HOT net brands to B2C
and B2B clients. HOT also produces award winning exclusive content that it distributes using its fixed network.
As of 2018, this segment also includes the Altice Technical Services entity in Israel.
• Dominican Republic: The Group provides fixed and mobile services to B2C, B2B and wholesale clients using
Altice brands. As of 2018, this segment also includes the Altice Technical Services entity in the Dominican
Republic.
• Teads: Provides digital advertising solutions.
• Altice TV: Content business from the use of content rights.
• Others: This segment includes all corporate entities and i24 US LLC. The Board of Directors believes that these
operations are not substantial enough to require a separate reporting segment, and so are reported under “Others”.
Historically, we have made substantial investments in our network and the development of new and innovative products
and other service offerings for our customers as a way of differentiating ourselves from our competitors and may continue
to do so in the future. Our fixed services (high-quality pay TV, broadband Internet and fixed line telephony) are mainly
provided over its cable- and fiber-based network infrastructure which are either DOCSIS 3.0, DOCSIS 2.0 or FTTH
enabled, offering download speeds of between 30 Mbps and 1 Gbps depending on geography. At June 30, 2018, we had a
total of 9.0 million unique fixed B2C customers. We also offer mobile services in the geographies in which we operate,
through 2G, 3G and 4G Long-Term-Evolution (“LTE”) technology, and, on a blended basis, as at June 30, 2018, we had
25.7 million mobile B2C customers (of which 17.8 million were post-paid customers).
In all territories in which we provide mobile telephony services, we are focused on the convergence of fixed and mobile
services by cross-selling and up-selling our offerings to further increase our multiplay penetration (except for Israel, where
the regulator does not allow it). Our cable, fiber and mobile technologies enable it to offer premium digital services,
attractive interactive features (such as its ‘MEO Go!’ offering in Portugal) and local content (e.g., through its ‘HOT 3’
channel in Israel) to our subscribers, including exclusive football rights in France and Netflix. We have leveraged our
network advantage to drive our multiplay strategy and offer an attractive combination of content, speed and functionality.
We offer our B2C customers bundled double- and triple-play services, which comprises paying for a combination of TV,
broadband Internet access and fixed line telephony services (e.g., through its ‘Box Home de SFR’ offering in France) at
what we believe are attractive prices. We believe the demand for our multi-play packages is primarily driven by the
inherent quality of the various products included in them, which we believe are among the best available in the markets in
which we operate. Although we believe that our products offer the best value for money and cost-savings for customers
when purchased as part of multi-play packages, the we typically also offer most of these services on a stand-alone basis in
most of its geographies. In some markets, such as France and Portugal, we offer quad-play bundles including mobile
services, as well.
The Group is also focused on strategically developing content to complement its fixed and mobile services with exclusive
or high-quality content offerings.
Our operations and the operating metrics discussed below have been, and may continue to be, affected by certain key
factors as well as certain historical events and actions. The key factors affecting the ordinary course of our business and
our results of operations include, among others, network upgrades, competition, acquisitions and integration of acquired
businesses, disposals, macro-economic and political risks in the areas where we operate, our pricing and cost structure,
churn and the introduction of new products and services, including multi-play services.
Recent Transactions
On February 12, 2018, the Company announced the closing of the transaction to sell its telecommunications solutions
business and data center operations in Switzerland, green.ch AG and Green Datacenter AG, to InfraVia Capital Partners.
The transaction values the business at an enterprise value of approximately 214 million CHF (9.9x LTM Adjusted
EBITDA).
On April 5, 2018, Altice France acquired the minority stake held by News Participations (NP) in Altice Content
Luxembourg (ACL) for the amount of €100 million by exercising the call option it held on NP’s 25% stake in ACL. On
May 31, 2018, Altice France increased its ownership in NextRadioTV S.A. via conversion of convertible bonds into equity.
Following the transactions described above, the Group’s ownership in NextRadioTV S.A. and its subsidiaries increased to
100%.
In April 2018, the Group exercised the call option for the acquisition of the remaining 49% in Altice Technical Services
(“ATS”) for a fixed price of €147 million, bearing interests at an annual rate of EURIBOR 1 month plus 3.5%. This amount
will be paid in November 2018. As a result of the exercise of the call option, the Company’s ownership in ATS increased
to 100%.
On June 8, 2018, the Company and Altice USA announced that the planned separation of Altice USA from the Company
(the "Separation") had been implemented. In the context of the Separation, the corporate name of the Company was
changed from Altice N.V to Altice Europe N.V.
The Separation took place by way of a special distribution in kind by the Company of its 67.2% interest in Altice USA to
the Company’s shareholders out of the Company’s share premium reserve (the "Distribution"). The Company instructed
its agent to transfer to each of its shareholders 0.4163 shares of Altice USA common stock for every share held by such
shareholder in the Company's capital on the Distribution record date.
As announced by the Company and Altice USA on June 7, 2018, the total number of shares of Altice USA Class A
common stock and Altice USA Class B common stock that have been distributed are:
• Altice USA Class A common stock 247,683,489
• Altice USA Class B common stock 247,683,443

Following the Distribution, there were 489,384,523 shares of Altice USA Class A common stock and 247,684,443 shares
of Altice USA Class B common stock outstanding.
As part of the Separation, on June 6, 2018, Altice USA paid a $1.5 billion of cash dividend to its shareholders, including
$1.1 billion to the Company.
On April 23, 2018, the Group completed the sale of i24News Europe and i24News US (international 24-hour news and
current affairs television channel) to Altice USA for a total consideration of $10.1 million (€8.3 million).
The Separation was treated as a discontinued operation as specified in IFRS 5 Non-currents assets Held for sale and
discontinued operations, all the statement of income line items was restated to remove the impact of Altice USA and its
contribution to the net result was presented in the line "discontinued operation" of the statement of income. Prior year
period was restated.
The table below presents the impacts of discontinued operations of Altice USA in the statement of income for the six
month period ended June 30, 2018 and June 30, 2017:
Note that Altice USA figures in table above are only presented up to June 8, 2018 which was the date of the Separation.
In December 2017, the Board of Directors of the Company decided to sell the Group’s International Wholesale business.
The transits and international outgoing traffic business in Portugal and the Dominican Republic was classified as held for
sale as of December 31, 2017, in accordance with IFRS 5 Non-Current Assets Held for Sale and Discontinued Operations.
On March 12, 2018, the Company announced that it had entered into exclusivity with Tofane Global, a Paris-based
telecommunications and digital player specializing in international carrier services, for the sale of its international
wholesale voice carrier business in France, Portugal and the Dominican Republic. As a result, the working capital related
to the French wholesale business was also classified as a disposal group held for sale as of June 30, 2018, in accordance
with IFRS 5 Non-Current Assets Held for Sale and Discontinued Operations. The results from these operations are
included in the respective segments mentioned above. On July 18, 2018, Sale and Purchase Agreements had been signed
separately by Altice France, Altice Dominicana and MEO with Tofane Global. The transaction is expected to close in
September 2018.
On June 20, 2018, PT Portugal reached an agreement with a consortium including Morgan Stanley Infrastructure Partners
and Horizon Equity Partners for the sale of a 75% stake in the newly formed tower company called Passivetel
Equipamentos Passivos that will comprise 2,961 sites currently operated by Altice Portugal. The transaction is expected
to close during Q3 2018 and is subject to the effective demerger and customary closing conditions. As a consequence,
these assets and liabilities were classified as held for sale as of June 30, 2018.
On June 20, 2018, Altice France entered into an exclusivity with Starlight BidCo S.A.S., an entity controlled by funds
affiliated with KKR for the sale of 49.99% of the shares in a newly incorporated tower company called SFR TowerCo that
will comprise 10,198 sites currently operated by the Group. Altice France will continue to fully consolidate SFR TowerCo
and hence the assets and liabilities related to SFR TowerCo were not classified as held for sale. The closing of the
transaction, which scope is towers and does not include any telco equipment, will be subject to customary conditions
precedent, including that at least 90% of the sites have been contributed to SFR TowerCo, as well as regulatory approvals
Disposal groups held for sale Altice USA
(€m) June 30, 2018 June 30, 2017
Revenue 3,363.3 4,275.0
Operating profit 1,315.1 207.5
Finance costs (696.8) (770.7) Share earnings of associates (9.0) -
Income tax (176.4) 34.5
Net income/(loss) related to discontinued operation 433.0 (528.9)
and is expected to occur in the financial year ending December 31, 2018. The Sale and Purchase Agreement has been
signed on August 7, 2018 for a consideration of €3,500.0 million.
On July 30, 2018, Altice Europe announced that its subsidiary Altice Dominicana had reached an agreement with Phoenix
Tower International, a portfolio company of Blackstone, for the sale of 100% in the tower company Teletorres del Caribe
that will comprise 1,049 sites currently operated by Altice Dominicana. As of June 30, 2018, the closing of this transaction
was not highly probable hence the assets and liabilities were not classified as held for sale.
In the prior year, Green and Green Datacenter had been classified as held for sale. The sale was completed on February
12, 2018.
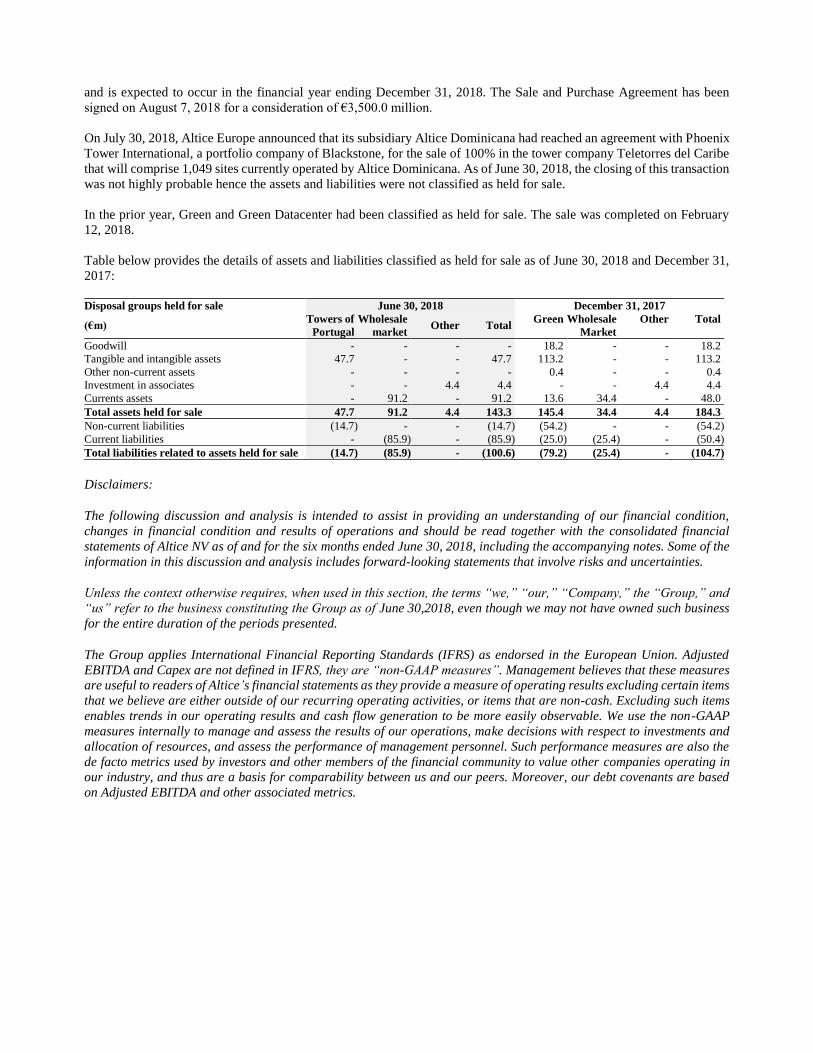
Table below provides the details of assets and liabilities classified as held for sale as of June 30, 2018 and December 31,
2017:
Disclaimers:
The following discussion and analysis is intended to assist in providing an understanding of our financial condition,
changes in financial condition and results of operations and should be read together with the consolidated financial
statements of Altice NV as of and for the six months ended June 30, 2018, including the accompanying notes. Some of the
information in this discussion and analysis includes forward-looking statements that involve risks and uncertainties.
Unless the context otherwise requires, when used in this section, the terms “we,” “our,” “Company,” the “Group,” and
“us” refer to the business constituting the Group as of June 30,2018, even though we may not have owned such business
for the entire duration of the periods presented.
The Group applies International Financial Reporting Standards (IFRS) as endorsed in the European Union. Adjusted
EBITDA and Capex are not defined in IFRS, they are “non-GAAP measures”. Management believes that these measures
are useful to readers of Altice’s financial statements as they provide a measure of operating results excluding certain items
that we believe are either outside of our recurring operating activities, or items that are non-cash. Excluding such items
enables trends in our operating results and cash flow generation to be more easily observable. We use the non-GAAP
measures internally to manage and assess the results of our operations, make decisions with respect to investments and
allocation of resources, and assess the performance of management personnel. Such performance measures are also the
de facto metrics used by investors and other members of the financial community to value other companies operating in
our industry, and thus are a basis for comparability between us and our peers. Moreover, our debt covenants are based
on Adjusted EBITDA and other associated metrics.
Disposal groups held for sale June 30, 2018 December 31, 2017
(€m) Towers of
Portugal
Wholesale
market Other Total
Green Wholesale
Market
Other Total
Goodwill - - - - 18.2 - - 18.2
Tangible and intangible assets 47.7 - - 47.7 113.2 - - 113.2
Other non-current assets - - - - 0.4 - - 0.4
Investment in associates - - 4.4 4.4 - - 4.4 4.4
Currents assets - 91.2 - 91.2 13.6 34.4 - 48.0
Total assets held for sale 47.7 91.2 4.4 143.3 145.4 34.4 4.4 184.3
Non-current liabilities (14.7) - - (14.7) (54.2) - - (54.2)
Current liabilities - (85.9) - (85.9) (25.0) (25.4) - (50.4)
Total liabilities related to assets held for sale (14.7) (85.9) - (100.6) (79.2) (25.4) - (104.7)
Key Factors Affecting Our Results of Operations
Our future performance is dependent, to a large extent, on the impact of direct competition, general economic conditions
(including capital and credit market conditions), our ability to manage our businesses effectively, and our relative strength
and leverage in the marketplace, both with suppliers and customers. We operate in a highly competitive, consumer and
technology driven and rapidly changing business that is affected by government regulation and economic, strategic,
technological, political and social conditions. Various factors could adversely affect our operations, business or financial
results in the future and cause our actual results to differ materially from those contained in the forward‑looking
statements. In addition, important factors that could cause our actual results to differ materially from those in our forward
‑looking statements include:
• competition for broadband, pay television and telephony customers from existing competitors (such as broadband
communications companies, DBS providers and Internet‑based providers) and new competitors entering our
footprint;
• changes in consumer preferences, laws and regulations or technology that may cause us to change our operational
strategies;
• increased difficulty negotiating programming agreements on favourable terms, if at all, resulting in increased costs to
us and/or the loss of popular programming;
• increasing programming costs and delivery expenses related to our products and services;
• our ability to achieve anticipated customer and revenue growth, to successfully introduce new products and services
and to implement our growth strategy;
• our ability to complete our capital investment plans on time and on budget, including our plan to build a FTTH
network, and deploy Altice One, our new home communications hub;
• our ability to develop and deploy mobile voice and data;
• the effects of economic conditions or other factors which may negatively affect our customers’ demand for our
products and services;
• the effects of industry conditions;
• demand for advertising on our cable systems;
• our substantial indebtedness and debt service obligations;
• adverse changes in the credit market;
• changes as a result of any tax reforms that may affect our business;
• financial community and rating agency perceptions of our business, operations, financial condition and the
industries in which we operate;
• the restrictions contained in our financing agreements;
• our ability to generate sufficient cash flow to meet our debt service obligations;
• fluctuations in interest rates which may cause our interest expense to vary from quarter to quarter;

• technical failures, equipment defects, physical or electronic break‑ins to our services, computer viruses and similar
problems; the disruption or failure of our network, information systems or technologies as a result of computer
hacking, computer viruses, “cyber‑attacks,” misappropriation of data, outages, natural disasters and other material
events;
• our ability to obtain necessary hardware, software, communications equipment and services and other items from
our vendors at reasonable costs;
• our ability to effectively integrate acquisitions and to maximize expected operating efficiencies from our
acquisitions or as a result of the transactions, if any;
• significant unanticipated increases in the use of bandwidth‑intensive Internet‑based services;
• the outcome of litigation, government investigations and other proceedings;
• our ability to successfully operate our business following the completion of our separation from Altice N.V., and
• other risks and uncertainties inherent in our cable and other broadband communications businesses and our other
businesses.

Basis of Presentation
The discussion and analysis for each of the periods presented is based on the financial information derived from the
audited consolidated financial statements of Altice Europe N.V. as of and for the six months ended June 30, 2018.
Please refer to the Glossary for a definition of the key financial terms discussed and analysed in this document.
Discussion and Analysis of Our Results of Operations
For the six months ended June 30, 2018 compared to the six months ended June 30, 2017
The below table sets forth our consolidated statement of income for the six months ended June 30, 2018 and 2017, in
millions of Euros. Due to the separation of Altice USA from the Company on June 8, 2018, the financial results of Altice
USA for both periods are shown in the caption “Profit / loss after tax from discontinued operations”.
Finance costs, net For the six months
ended June 30, 2018
For the six months
ended June 30, 2017 (*
revised) Change
(€m)
Revenues 7,147.9 7,556.8 -5.4%
Purchasing and subcontracting costs (2,184.7) (2,398.1) -8.9%
Other operating expenses (1,664.3) (1,584.8) 5.0%
Staff costs and employee benefits (734.5) (801.8) -8.4%
Depreciation, amortization and impairment (1,952.7) (2,009.1) -2.8%
Other expenses and income (44.6) (809.4) -94.5%
Operating profit 567.1 (46.4) -1321.6%
Interest relative to gross financial debt (885.5) (1,087.4) -18.6%
Other financial expenses (143.4) (43.4) 230.6%
Finance income (expense) 9.2 115.6 -92.1%
Net result on extinguishment of a financial liability - (39.0) -100.0%
Finance costs, net (1,019.7) (1,054.2) -3.3%
Share of earnings of associates (3.7) (1.2) NM
Loss before income tax from continuing operations (456.2) (1,101.8) -58.6%
Income tax benefit (3.7) 188.9 -102.0%
Loss for the period from continuing operations (460.0) (912.9) -49.6%
Discontinued operations
Profit/loss after tax for the year from discontinued operations1 433.0 (528.9) -181.9%
Loss for the period (27.0) (1,441.8) -98.1%
Attributable to equity holders of the parent (148.2) (1,234.4) -88.0%
Attributable to non‑controlling interests 121.2 (207.4) -158.4%
Significant Events Affecting Historical Results
Our results of operations as of and for the six months ended June 30, 2018 and the six months ended June 30, 2017 were
significantly impacted by the following events:
On February 24, 2017, PT Portugal acquired a 25% stake in the capital of SPORT TV for €12.3 million. SPORT TV is a
sports broadcaster based in Portugal. Following this investment, SPORT TV’s shareholders are PT Portugal, NOS,
Olivedesportos and Vodafone, each of which with a 25% stake. This new structure benefits, above all, PT Portugal’s
customers and the Portuguese market, guaranteeing all the operators’ access to the sports content considered essential in
fair and non-discriminatory market conditions.
Sale by SFR Group of L’Etudiant and the B2B Division of Newsco Group to Coalition Media Group
In 2016, SFR Group and Marc Laufer began exclusive negotiations for a new partnership between SFR, NewsCo and
l’Etudiant. In accordance with IFRS 5 Non-current Assets Held for Sale and Discontinued Operations, the associated
disposal group was classified as held for sale as of December 31, 2016. On April 28, 2017, SFR Group completed the sale
of the companies. SFR Group subsequently acquired a 25% stake in this holding, this is classified as an investment in
associate. As part of the transaction, the vendor loan contracted during the acquisition of Altice Media Group for €100
million was fully reimbursed. The Group recorded a €28.6 million capital gain for this transaction.
As at December 31, 2016, the Group had entered into an agreement to sell its Belgian and Luxembourg (Belux)
telecommunication businesses, and accordingly classified the associated assets and liabilities as a disposal group held for
sale in accordance with IFRS 5 Non-current Assets Held for Sale and Discontinued Operations. On June 19, 2017, the
Group completed the sale of Coditel Brabant SPRL and Coditel S.à r.l, to Telenet Group BVBA, a direct subsidiary of
Telenet Group Holding N.V. After the final post-closing price adjustments, the Group received €280.8 million, and
recognized a loss on sale after transactions costs of €24.0 million.
On June 22, 2017, Altice Teads (a company which the Group has 98.5% of the financial interest, with 1.5% attributable
to the managers of Teads) closed the acquisition of Teads. Teads is the number one online video advertising marketplace
in the world with an audience of more than 1.2 billion unique visitors. The acquisition values Teads at an enterprise of up
to €302.3 million. The acquisition purchase price was due 75% at closing, with the remaining 25% earn-out subject to
Teads obtaining defined revenue performance in 2017. As the defined revenue targets for 2017 were met, an earn-out
payment of €48.6 million was made to the former owners of Teads during Q2 2018, with an additional earn-out payment
of €13.1 million made on July 3, 2018.
On February 12, 2018, the Company announced the closing of the transaction to sell its telecommunications solutions
business and data center operations in Switzerland, green.ch AG and Green Datacenter AG, to InfraVia Capital Partners.
The transaction values the business at an enterprise value of approximately 214 million CHF (9.9x LTM Adjusted
EBITDA).
On April 5, 2018, Altice France acquired the minority stake held by News Participations (NP) in Altice Content
Luxembourg (ACL) for the amount of €100 million by exercising the call option it held on NP’s 25% stake in ACL. On
May 31, 2018, Altice France increased its ownership in NextRadioTV S.A. via conversion of convertible bonds into equity.
Following the transactions described above, the Group’s ownership in NextRadioTV S.A. and its subsidiaries increased to
100%.
In April 2018, the Group exercised the call option for the acquisition of the remaining 49% in Altice Technical Services
(“ATS”) for a fixed price of €147 million, bearing interests at an annual rate of EURIBOR 1 month plus 3.5%. This amount
will be paid in November 2018. As a result of the exercise of the call option, the Company’s ownership in ATS increased
to 100%.
On June 8, 2018, the Company and Altice USA announced that the planned separation of Altice USA from the Company
(the "Separation") had been implemented.
On April 23, 2018, the Group completed the sale of i24News Europe and i24News US (international 24-hour news and
current affairs television channel) to Altice USA for a total consideration of $10.1 million (€8.3 million). Please also refer
to section Overview for further details regarding the Altice USA separation.
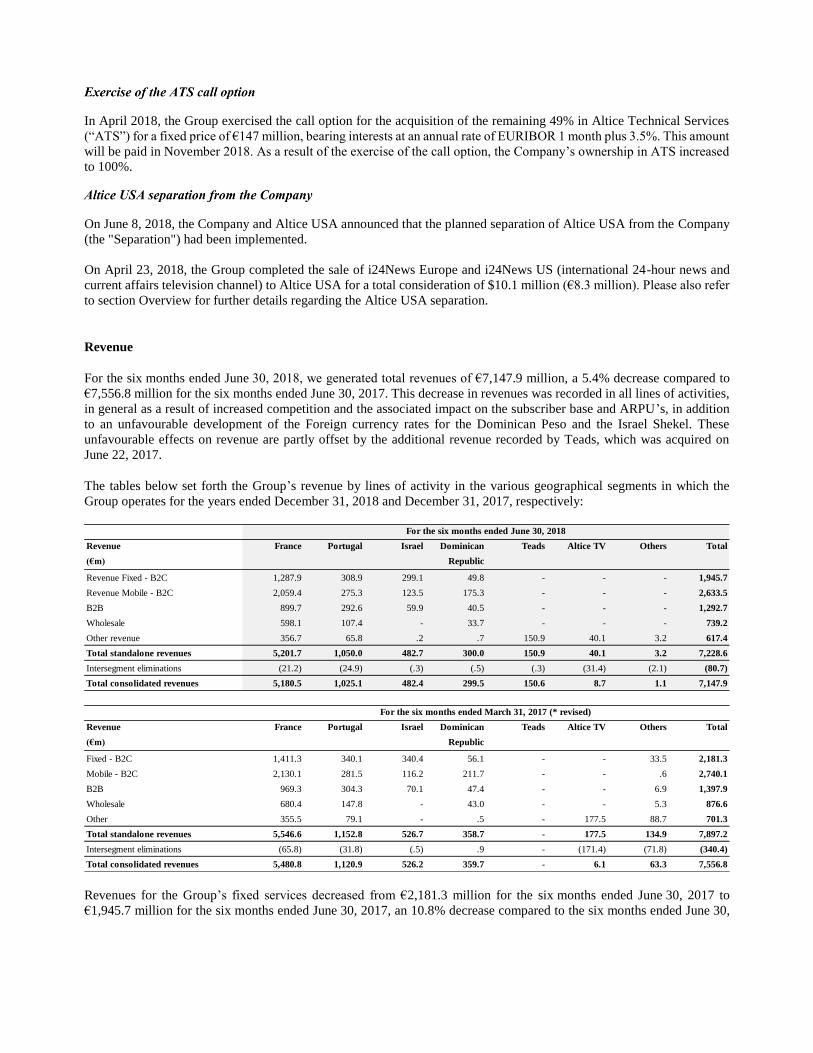
Revenue
For the six months ended June 30, 2018, we generated total revenues of €7,147.9 million, a 5.4% decrease compared to
€7,556.8 million for the six months ended June 30, 2017. This decrease in revenues was recorded in all lines of activities,
in general as a result of increased competition and the associated impact on the subscriber base and ARPU’s, in addition
to an unfavourable development of the Foreign currency rates for the Dominican Peso and the Israel Shekel. These
unfavourable effects on revenue are partly offset by the additional revenue recorded by Teads, which was acquired on
June 22, 2017.
The tables below set forth the Group’s revenue by lines of activity in the various geographical segments in which the
Group operates for the years ended December 31, 2018 and December 31, 2017, respectively:
Revenues for the Group’s fixed services decreased from €2,181.3 million for the six months ended June 30, 2017 to
€1,945.7 million for the six months ended June 30, 2017, an 10.8% decrease compared to the six months ended June 30,
Revenue France Portugal Israel Dominican Teads Altice TV Others Total
(€m) Republic
Revenue Fixed - B2C 1,287.9 308.9 299.1 49.8 - - - 1,945.7
Revenue Mobile - B2C 2,059.4 275.3 123.5 175.3 - - - 2,633.5
B2B 899.7 292.6 59.9 40.5 - - - 1,292.7
Wholesale 598.1 107.4 - 33.7 - - - 739.2
Other revenue 356.7 65.8 .2 .7 150.9 40.1 3.2 617.4
Total standalone revenues 5,201.7 1,050.0 482.7 300.0 150.9 40.1 3.2 7,228.6
Intersegment eliminations (21.2) (24.9) (.3) (.5) (.3) (31.4) (2.1) (80.7)
Total consolidated revenues 5,180.5 1,025.1 482.4 299.5 150.6 8.7 1.1 7,147.9
Revenue France Portugal Israel Dominican Teads Altice TV Others Total
(€m) Republic
Fixed - B2C 1,411.3 340.1 340.4 56.1 - - 33.5 2,181.3
Mobile - B2C 2,130.1 281.5 116.2 211.7 - - .6 2,740.1
B2B 969.3 304.3 70.1 47.4 - - 6.9 1,397.9
Wholesale 680.4 147.8 - 43.0 - - 5.3 876.6
Other 355.5 79.1 - .5 - 177.5 88.7 701.3
Total standalone revenues 5,546.6 1,152.8 526.7 358.7 - 177.5 134.9 7,897.2
Intersegment eliminations (65.8) (31.8) (.5) .9 - (171.4) (71.8) (340.4)
Total consolidated revenues 5,480.8 1,120.9 526.2 359.7 - 6.1 63.3 7,556.8
For the six months ended June 30, 2018
For the six months ended March 31, 2017 (* revised)
2017. This decrease was driven primarily by growing competition and associated impact on subscriber numbers and pricing
pressure.
The Group’s mobile services revenue decreased to €2,633.5 million for the six months ended June 30, 2018, a 3.9%
decrease compared to €2,740.1 million for the six months ended June 30, 2017, mainly due to a decrease in France resulting
from continued pricing pressure on mobile offers for our B2C base, impacts of customer loss from previous quarters and
the repricing of the B2B mobile base in the second quarter of 2017. In addition mobile revenues decreased in the
Dominican Republic resulting from price erosion.
The Group’s B2B services revenue decreased to €1,292.7 million for the six months ended June 30, 2018, a 7.5% decrease
compared to €1,397.9 million for the six months ended June 30, 2017, mainly due to a decrease in France resulting from
price reductions which were implemented during Q2 2017.
The Group’s Wholesale services revenue decreased to €739.2 million for the six months ended June 30, 2018, a 15.7%
decrease compared to €876.6 million for the six months ended June 30, 2017, mainly due to decreases in France and
Portugal due to lower international voice traffic.
Revenues from the Group’s other activities totalled €617.4 million for six months ended June 30, 2018, a 12.0% decrease
as compared to €701.3 million for the six months ended June 30, 2017. The decrease in other revenues was mainly due to
a reduction of intersegment recharging of services provided to group companies. These decreases are partly offset by an
increase of revenues related to Teads, which was acquired on June 22, 2017.
Geographical segments
France
For the six months ended June 30, 2018, the Group generated external revenue in France of €5,180.5 million, a 5.5%
decrease compared to €5,480.8 million for the six months ended June 30, 2017. This decrease is attributable to decreases
in all service revenues.
Revenues from the Group’s fixed business decreased by 8.7% from €1,411.3 million for the six months ended June 30,
2017 compared to €1,287.9 million for the six months ended June 30, 2018. This decrease is explained by customer losses
experienced in previous quarters and more intense market competition following SFR’s successful churn reduction and
more proactive retention activity. B2C fixed revenue was also impacted by the loss of favourable VAT treatment on
telecom/press bundles, which ended in February 2018.
The Group’s mobile business posted a net revenue decrease of 3.3% from €2,130.1 million for the six months ended
June 30, 2017 compared to €2,059.4 million for the six months ended June 30, 2018. This decrease was driven primarily
by continued pricing pressure on mobile offers for our B2C base and the impact of customer loss from previous quarters.
B2C mobile revenue was also impacted by the loss of favourable VAT treatment on telecom/press bundles, which ended
in February 2018.
Revenues from the Group’s B2B business decreased by 7.2%, from €969.3 million for the six months ended June 30, 2017
compared to €899.7 million for the six months ended June 30, 2018. B2B revenues were impacted by price reductions in
the first half of 2017.
Revenues from the Group’s Wholesale business decreased by 12.1%, from €680.4 million for the six months ended
June 30, 2017 compared to €598.1 million for the six months ended June 30, 2018. Wholesale revenues decreased mainly
due a decrease in revenues from white label operators and a decline in the international wholesale voice business.
Other revenues mainly include the contribution of the media assets. Revenues increased slightly from €355.5 for the
six months period ended June 30, 2017 to €356.7 million for the six months ended June 30, 2018, an increase of 0.3%.
This growth was mainly driven by record audiences and ad revenues from our BFM and RMC brand channels.

Portugal
For the six months ended June 30, 2018, the Group generated revenues in Portugal of €1,025.1 million, a 8.6% decrease
compared to €1,120.9 million for the six months ended June 30, 2017. This decrease was mainly due to a decline in the
fixed revenues, reflecting the competitive pressure in the market and the resulting price erosion notwithstanding an
improved performance in customer net additions in the period. In addition, wholesale revenues decreased due to lower
international voice traffic.
Revenues from the Group’s fixed business decreased by 9.2% from €340.1 million for the six months ended June 30,
2017 compared to €308.9 million for the six months ended June 30, 2018. This decrease is explained by the year on year
decline in fixed ARPU, which more than offset the positive net adds reported during the first half year of 2018, as
compared to negative net adds during the same period of last year.
The Group’s mobile business posted a net revenue decrease of 2.2% from €281.5 million for the six months ended June 30,
2017 compared to €275.3 million for the six months ended June 30, 2018. This decrease was driven primarily by a decline
in mobile ARPU and lower prepaid revenues.
Revenues from the Group’s B2B business decreased by 3.8%, from €304.3 million for the six months ended June 30, 2017
compared to €292.6 million for the six months ended June 30, 2018. B2B revenues were impacted by intense competition
and the resulting continued repricing.
Revenues from the Group’s Wholesale business decreased by 27.3%, from €147.8 million for the six months ended
June 30, 2017 compared to €107.4 million for the six months ended June 30, 2018. Wholesale revenues decreased mainly
due to lower international voice traffic.
Revenues decreased from €79.1 million for the six months period ended June 30, 2017 to €65.8 million for the six months
ended June 30, 2018, a decrease of 16.8%. This decrease is primarily driven by a decline in non-group revenues of Altice
Labs.
Israel
For the six months ended June 30, 2018, the Group generated revenue in Israel of €482.4 million, an 8.3% decrease
compared to €526.2 million for the six months ended June 30, 2017. On a constant currency basis, revenues decreased by
1.4%. On a constant currency basis, this was mainly due to a decrease in fixed revenues due to lower fixed ARPU resulting
from a change in product mix following high competition in the TV market, offset by an increase in mobile revenues due
to an increase in the mobile subscriber base.
Dominican Republic
For the six months ended June 30, 2018, the Group generated total revenue of €299.5 million, a 16.7% decrease compared
to €359.7 million for the six months ended June 30, 2017. On a constant currency basis, revenues decreased by 2.4%. On
a constant currency basis, this was largely driven by a decrease in mobile B2C revenues as a result of voice erosion, which
is only partially offset by an increase of B2C post-paid ARPU as a result of an increase in data usage and the
implementation of our upgrade strategy.
Teads
Due to the fact that Teads was acquired on June 22, 2017, no comparative financial information is available.
Altice TV
For the six months ended June 30, 2018, the Group generated total revenue in Altice TV of €8.7 million, compared to
€6.1 million for the six months ended June 30, 2017.

Others
For the six months ended June 30, 2018, the Group generated total revenue in Others (which comprises of the Group’s
corporate entities) of €1.0 million, a 98.2% decrease compared to €63.3 million for the six months ended June 30, 2017.
Adjusted EBITDA
For the six months ended June 30, 2018, our Adjusted EBITDA was €2,574.5 million, a decrease of 7.6% compared to the
six months ended June 30, 2017 (€2,786.5 million). This decrease can be attributed to lower revenue, as explained above,
and higher other operating expenses, partially offset by decreased purchasing and subcontracting expenses and staff costs
and employee benefits.
• Purchasing and subcontracting costs decreased by 8.9%, from €2,398.1 million in the six months ended June 30, 2017
to €2,184.7 million in the six months ended June 30, 2018.
• Other operating expenses increased by 5.0% to €1,664.3 million in the six months ended June 30, 2018 from €1,584.8
million in the six months ended June 30, 2017.
• Staff costs and employee benefit expenses decreased by 8.4%, from €801.8 million in the six months ended June 30,
2017 to €734.5 million in the six months ended June 30, 2018.
Geographical segments
France
For the six months ended France Portugal Israel Dominican Teads Altice TV Others Inter- Total
June 30, 2018 Republic segment
€m elimination
Revenues 5,201.7 1,050.0 482.7 300.0 150.9 40.1 3.2 (80.7) 7,147.9
Purchasing and subcontracting costs (1,616.7) (274.2) (130.6) (86.3) - (150.5) (0.9) 74.6 (2,184.7)
Other operating expenses (1,207.0) (194.5) (107.8) (46.8) (95.9) (5.5) (9.4) 2.7 (1,664.3)
Staff costs and employee benefits (489.6) (137.0) (32.2) (13.0) (39.2) (2.3) (21.3) 0.1 (734.5)
Total 1,888.4 444.3 212.1 153.9 15.8 (118.3) (28.4) (3.3) 2,564.5
Stock option expense - - - - - - 10.0 - 10.0
Adjusted EBITDA 1,888.4 444.3 212.1 153.9 15.8 (118.3) (18.4) (3.3) 2,574.5
Depreciation, amortisation and
impairment (1,301.4) (329.4) (157.0) (61.9) (8.2) (90.8) (4.0) - (1,952.7)
Stock option expense - - - - - - (10.0) - (10.0)
Other expenses and income (273.6) (41.6) (7.4) (2.1) 0.4 300.2 (19.8) (0.7) (44.6)
Operating profit/(loss) 313.4 73.3 47.7 90.0 8.0 91.1 (52.2) (4.0) 567.1
For the six months ended France Portugal Israel Dominican Teads Altice TV Others Inter- Total
June 30, 2017 (*revised) Republic segment
€m elimination
Revenues 5,546.6 1,152.8 526.7 358.7 - 177.5 134.9 (340.4) 7,556.8
Purchasing and subcontracting costs (1,998.0) (312.3) (140.9) (97.6) - (62.2) (15.7) 228.6 (2,398.1)
Other operating expenses (1,242.7) (188.6) (112.3) (54.2) - (7.4) (81.4) 101.7 (1,584.8)
Staff costs and employee benefits (570.6) (139.9) (36.4) (15.6) - (2.8) (40.5) 4.0 (801.8)
Total 1,735.3 512.1 237.1 191.3 - 105.0 (2.5) (6.1) 2,772.1
Stock option expense 0.7 - - - - - 13.6 - 14.4
Adjusted EBITDA 1,736.1 512.1 237.1 191.3 - 105.0 11.1 (6.1) 2,786.5
Depreciation, amortisation and
impairment (1,339.5) (345.4) (167.8) (70.2) - (77.4) (8.8) - (2,009.1)
Stock option expense (0.7) - - - - - (13.6) - (14.4)
Other expenses and income (793.9) (50.5) (7.4) (13.5) - 0.4 53.5 2.1 (809.4)
Operating profit/(loss) (398.1) 116.1 61.9 107.5 - 28.1 42.1 (4.1) (46.4)

For the six months ended June 30, 2018, the Group’s Adjusted EBITDA in France was €1,888.4 million, an increase of
8.8% from €1,736.1 million compared to the six months ended June 30, 2017. This increase was mainly due to a decrease
in content and staff costs, offset partially by the decrease in revenues described above. The decrease in content costs is
mainly driven by lower costs for premium content supplied by other Altice group companies following the restructuring
and the creation of the new Altice TV unit announced in January 2018. The decrease in staff costs is mainly driven by a
decrease in employee numbers as part of the voluntary restructuring plan launched in 2017.
Portugal
For the six months ended June 30, 2018, the Group’s Adjusted EBITDA in Portugal was €444.3 million, a decrease of
13.2% from €512.1 million compared to the six months ended June 30, 2017. This decrease is attributable to a decline in
gross margin reflecting primarily the reduction in fixed revenues, which was only partially offset by lower purchasing and
subcontracting costs, reflecting lower international voice traffic costs, in line with the decline in related revenues.
Israel
For the six months ended June 30, 2018, the Group’s Adjusted EBITDA in Israel was €212.1 million, a decrease of 10.6%
compared to €237.1 million for the six months ended June 30, 2017. Adjusted EBITDA on a constant currency basis
decreased by 6.2% compared to 2017. On a constant currency basis, this decrease is mainly due to a decrease in revenues
and increases in purchasing and sub-contracting costs and other operating expenses (mainly costs of handsets and inter-
connect in the mobile sector), which are only partly offset by a reduction in content expenses and in staff costs and
employee benefits as a result of the departure plan which was implemented during the third quarter of 2017.
Dominican Republic
For the six months ended June 30, 2018, the Group’s Adjusted EBITDA in the Dominican Republic decreased by 19.5%
from €191.3 million for the six months ended June 30, 2017 to €153.9 million (6.1% on a constant currency basis). On a
constant currency basis, this decrease is mainly attributable to a decline in revenues and an increase in Purchasing and
subcontracting costs, resulting from higher content costs.
Teads
Due to the fact that Teads was acquired on June 22, 2017, no comparative financial information is available.
Altice TV
For the six months ended June 30, 2018, the Group’s Adjusted EBITDA for Altice TV decreased by 212.7% from €105.0
million for the six months ended June 30, 2017 to a negative Adjusted EBITDA of €118.3 million. This decrease is mainly
attributable to a reduction of intersegment recharging of services provided to group companies.
Others
For the six months ended June 30, 2018, the Group’s Adjusted EBITDA in Others was a negative amount of €18.4 million,
an increase of 266.4% from n Adjusted EBITDA of €11.1 million for the six months ended June 30, 2017.
Depreciation and Amortization and Impairment
For the six months ended June 30, 2018, depreciation and amortization totalled 1,952.7 million, an 2.8% decrease
compared to €2,009.1 million for the six months ended June 30, 2017.
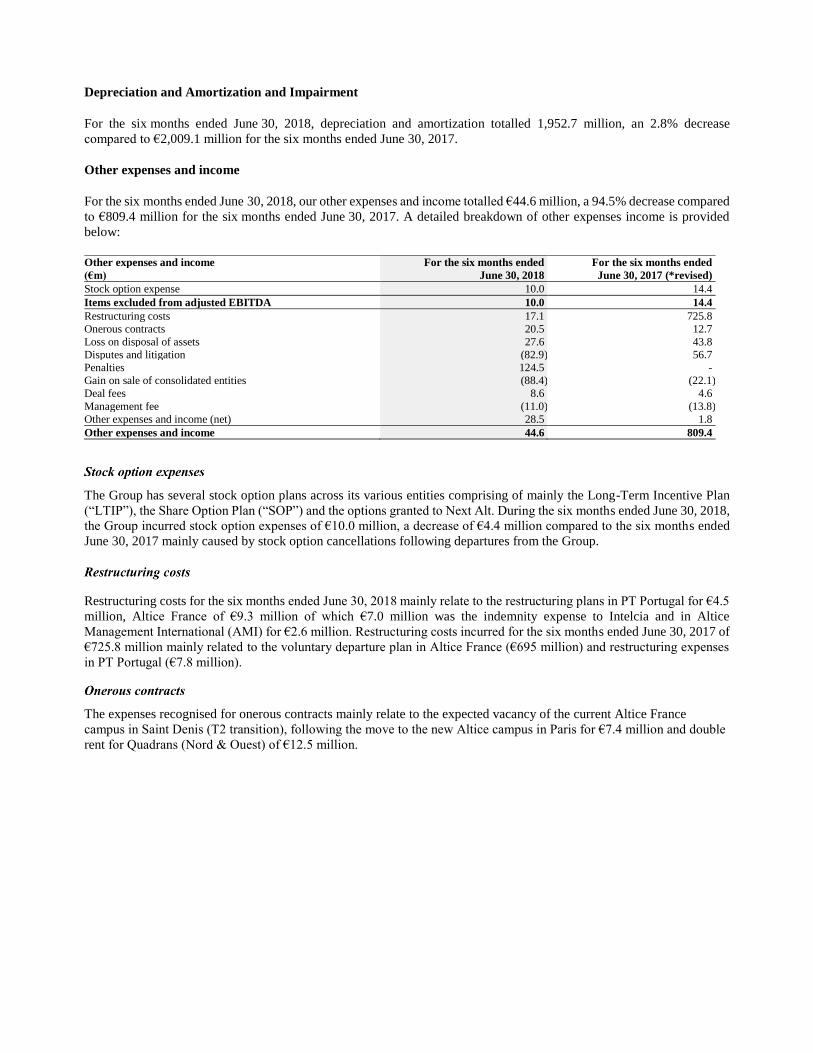
Other expenses and income
For the six months ended June 30, 2018, our other expenses and income totalled €44.6 million, a 94.5% decrease compared
to €809.4 million for the six months ended June 30, 2017. A detailed breakdown of other expenses income is provided
below:
The Group has several stock option plans across its various entities comprising of mainly the Long-Term Incentive Plan
(“LTIP”), the Share Option Plan (“SOP”) and the options granted to Next Alt. During the six months ended June 30, 2018,
the Group incurred stock option expenses of €10.0 million, a decrease of €4.4 million compared to the six months ended
June 30, 2017 mainly caused by stock option cancellations following departures from the Group.
Restructuring costs for the six months ended June 30, 2018 mainly relate to the restructuring plans in PT Portugal for €4.5
million, Altice France of €9.3 million of which €7.0 million was the indemnity expense to Intelcia and in Altice
Management International (AMI) for €2.6 million. Restructuring costs incurred for the six months ended June 30, 2017 of
€725.8 million mainly related to the voluntary departure plan in Altice France (€695 million) and restructuring expenses
in PT Portugal (€7.8 million).
The expenses recognised for onerous contracts mainly relate to the expected vacancy of the current Altice France
campus in Saint Denis (T2 transition), following the move to the new Altice campus in Paris for €7.4 million and double
rent for Quadrans (Nord & Ouest) of €12.5 million.
Other expenses and income For the six months ended For the six months ended
(€m) June 30, 2018 June 30, 2017 (*revised)
Stock option expense 10.0 14.4
Items excluded from adjusted EBITDA 10.0 14.4
Restructuring costs 17.1 725.8
Onerous contracts 20.5 12.7
Loss on disposal of assets 27.6 43.8
Disputes and litigation (82.9) 56.7
Penalties 124.5 -
Gain on sale of consolidated entities (88.4) (22.1)
Deal fees 8.6 4.6
Management fee (11.0) (13.8)
Other expenses and income (net) 28.5 1.8
Other expenses and income 44.6 809.4
The loss on disposal of assets primarily relates to losses on the disposal of property, plant and equipment, assets related to
DSP network in Altice France (€27.1 million) and in PT Portugal due to forest fires damages (€1.6 million). The loss on
disposal in 2017 was recorded in Altice France, related to loss on sale of Completel ADSL network to KOSC (€32 million).
Disputes and litigation mainly relate to releases of Altice France litigations provisions with Orange of €122 million, which
was offset by €5.0 million of compensation to Free and €15.0 million of settlements of operational litigation with Orange.
Additionally, a €20.0 million litigation provision was recorded in PT Portugal.
Penalties correspond to the fine imposed to the Group following the European Commission’s investigation on gun jum-
ping during the acquisition of PT Portugal by the Group. The €124.5 million fine was recorded in Portugal segment.
Gain on sale of consolidated entities
This relates to the gain on the sale of telecommunications solutions business and Data Center operations in Switzerland,
green.ch AG and Green Datacenter AG and the loss of (€0.3 million) on the sale of i24News US to Altice USA.
Deal fees consisted mainly of €2.7 million deal fee in Altice France and €5.9 million expenses in PT Portugal for the
financial and legal advisory fees in the ongoing sale of the tower business.
Management fee income corresponds to the corporate costs charged by Altice Management International (AMI) to Altice
USA, which amounted to €11.0 million and €13.8 million for the six months ended June 30, 2018 and June 30, 2017,
respectively.
Consisted mainly of expenses in Altice Holdings of €13.0 million related to the removal of managers and board of AB2
and the corresponding termination agreement. In addition, PT Portugal recorded €3.3 million of fines (mostly related to
the termination fee of a real estate rental agreement of €2.4 million) and €1.9 million donations granted under social
programs. It also includes liquidation expenses of €2.6 million.
Finance costs (net)
Net finance costs amounted to €1,019.7 million for the six months ended June 30, 2018, registering an decrease of 3.3%
compared to €1,054.2 million for the six months ended June 30, 2017. A detailed breakdown of Finance costs (net) is
provided below:
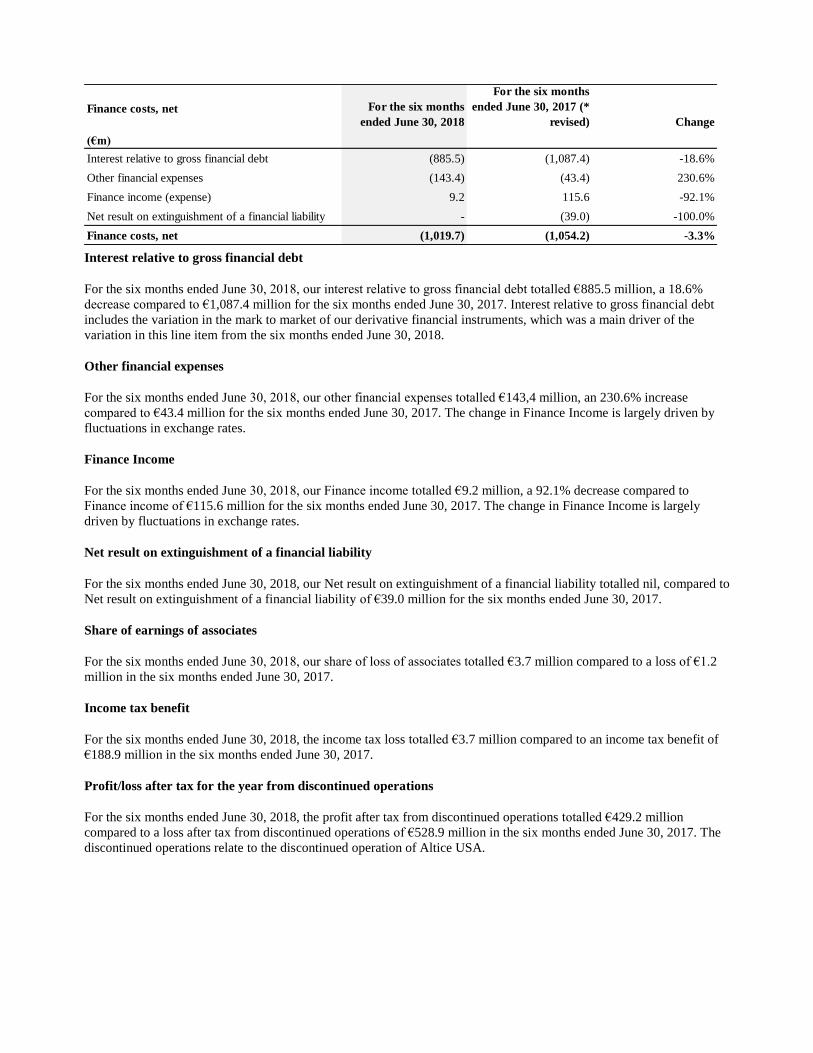
Interest relative to gross financial debt
For the six months ended June 30, 2018, our interest relative to gross financial debt totalled €885.5 million, a 18.6%
decrease compared to €1,087.4 million for the six months ended June 30, 2017. Interest relative to gross financial debt
includes the variation in the mark to market of our derivative financial instruments, which was a main driver of the
variation in this line item from the six months ended June 30, 2018.
Other financial expenses
For the six months ended June 30, 2018, our other financial expenses totalled €143,4 million, an 230.6% increase
compared to €43.4 million for the six months ended June 30, 2017. The change in Finance Income is largely driven by
fluctuations in exchange rates.
Finance Income
For the six months ended June 30, 2018, our Finance income totalled €9.2 million, a 92.1% decrease compared to
Finance income of €115.6 million for the six months ended June 30, 2017. The change in Finance Income is largely
driven by fluctuations in exchange rates.
Net result on extinguishment of a financial liability
For the six months ended June 30, 2018, our Net result on extinguishment of a financial liability totalled nil, compared to
Net result on extinguishment of a financial liability of €39.0 million for the six months ended June 30, 2017.
Share of earnings of associates
For the six months ended June 30, 2018, our share of loss of associates totalled €3.7 million compared to a loss of €1.2
million in the six months ended June 30, 2017.
Income tax benefit
For the six months ended June 30, 2018, the income tax loss totalled €3.7 million compared to an income tax benefit of
€188.9 million in the six months ended June 30, 2017.
Profit/loss after tax for the year from discontinued operations
For the six months ended June 30, 2018, the profit after tax from discontinued operations totalled €429.2 million
compared to a loss after tax from discontinued operations of €528.9 million in the six months ended June 30, 2017. The
discontinued operations relate to the discontinued operation of Altice USA.
Finance costs, net For the six months
ended June 30, 2018
For the six months
ended June 30, 2017 (*
revised) Change
(€m)
Interest relative to gross financial debt (885.5) (1,087.4) -18.6%
Other financial expenses (143.4) (43.4) 230.6%
Finance income (expense) 9.2 115.6 -92.1%
Net result on extinguishment of a financial liability - (39.0) -100.0%
Finance costs, net (1,019.7) (1,054.2) -3.3%

Capital Expenditures
For the six months ended June 30, 2018, our total capital expenditures were €1,576.2 million (representing 22.1% of
revenue), a 13.5% decrease compared to €1,821.2 million (representing 24.1% of revenue) for the six months ended
June 30, 2017.
France
For the six months ended June 30, 2018, total capital expenditure in France was €1,056.8 million (representing 20.4% of
revenue in France), a 19.7% decrease compared to €1,315.7 million for the six months ended June 30, 2017 (representing
24.0% of revenue in France). The decrease is mainly explained by the significant capital expenditure (between 22-24% of
total consolidated revenues) incurred in previous years in order to improve our mobile network and to roll out new fiber
homes (we are the market leader in very high-speed internet).
Portugal
For the six months ended June 30, 2018, PT Portugal’s total capital expenditures were €256.7 million (representing 25.0%
of revenue in Portugal), a 7.1% increase compared to €239.8 million for the six months ended June 30, 2017 (representing
21.4% of revenue in Portugal). The increase in capex is explained by an increase in mobile network related capex reflecting
the deployment of the single RAN technology, higher SAC-related capex reflecting both higher gross adds and an increase
in the unitary SAC and changes in capital expenditure related working capital. These increases are partially offset by lower
fixed network related capex as a result of a lower number of homes passed.
Israel
Capital expenditure in Israel increased by 4.5%, from €117.6 million (representing 22.4% of our revenue in Israel) in the
six months ended June 30, 2017 to €123.0 million (representing 25.5% of our revenue in Israel) in the six months ended
June 30, 2018. On a constant currency basis, capital expenditure increased by 12.5%, driven by higher network and
installation spend which was partly offset by lower investments in CPE.
Dominican Republic
For the six months ended June 30, 2018, our total capital expenditures were €54.1 million (representing 18.1% of our
revenue in the Dominican Republic), a 32.7% increase compared to €40.8 million for the six months ended June 30, 2017
(representing 11.3% of revenue in the Dominican Republic). On a constant currency basis, accrued capital expenditures
increased by 54.9%, to a large extent driven by mobile related purchase of equipment and services for the migration to
single RAN technology, in addition to the impact of working capital changes.
For the six months ended France Portugal Israel Dominican Teads Altice TV Others Eliminations Total
June 30, 2018 Republic
€m
Capital expenditure (accrued) 1,142.3 211.0 118.6 56.7 - 5.0 - 0.3 1,534.0
Capital expenditure - working capital
items (85.6) 45.7 4.3 (2.6) - 80.3 - -
42.2
Payments to acquire tangible and
intangible assets 1,056.8 256.7 123.0 54.1 - 85.3 - 0.3 1,576.2
For the six months ended France Portugal Israel Dominican Teads Altice TV Others Eliminations Total
June 30, 2017 (*revised) Republic
€m
Capital expenditure (accrued) 1,135.6 207.1 119.4 53.5 - 29.0 19.2 (3.3) 1,560.4
Capital expenditure - working capital
items 176.1 32.7 (1.6) (12.7) - 66.3 - - 260.7
Payments to acquire tangible and
intangible assets 1,311.7 239.8 117.6 40.8 - 95.3 19.2 (3.3) 1,821.2

Teads
Due to the fact that Teads was acquired on June 22, 2017, no comparative financial information is available. In general,
Teads has limited capital expenditures due to the nature of the business.
Altice TV
For the six months ended June 30, 2018, our total capital expenditures were €85.3 million, a 10.5% decrease compared to
€95.3 million for the six months ended June 30, 2017.
Others
For the six months ended June 30, 2018, our total capital expenditures were nil, compared to €19.2 million for the
six months ended June 30, 2017.
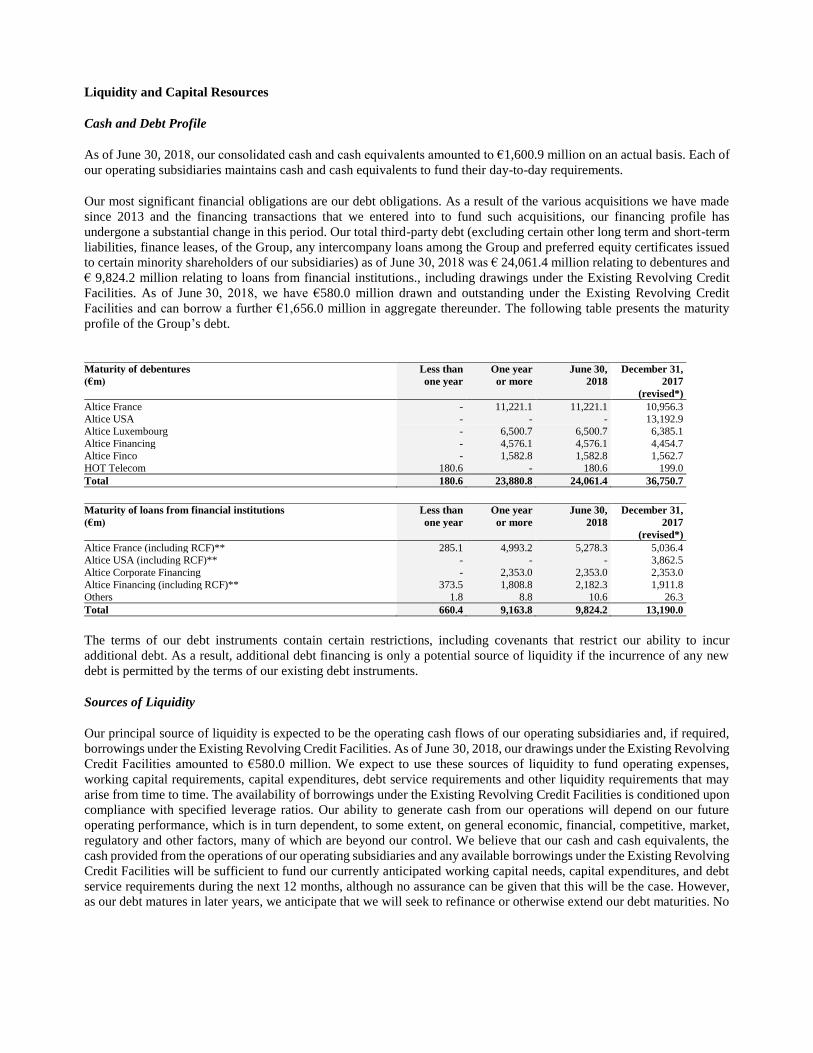
Liquidity and Capital Resources
Cash and Debt Profile
As of June 30, 2018, our consolidated cash and cash equivalents amounted to €1,600.9 million on an actual basis. Each of
our operating subsidiaries maintains cash and cash equivalents to fund their day-to-day requirements.
Our most significant financial obligations are our debt obligations. As a result of the various acquisitions we have made
since 2013 and the financing transactions that we entered into to fund such acquisitions, our financing profile has
undergone a substantial change in this period. Our total third-party debt (excluding certain other long term and short-term
liabilities, finance leases, of the Group, any intercompany loans among the Group and preferred equity certificates issued
to certain minority shareholders of our subsidiaries) as of June 30, 2018 was € 24,061.4 million relating to debentures and
€ 9,824.2 million relating to loans from financial institutions., including drawings under the Existing Revolving Credit
Facilities. As of June 30, 2018, we have €580.0 million drawn and outstanding under the Existing Revolving Credit
Facilities and can borrow a further €1,656.0 million in aggregate thereunder. The following table presents the maturity
profile of the Group’s debt.
The terms of our debt instruments contain certain restrictions, including covenants that restrict our ability to incur
additional debt. As a result, additional debt financing is only a potential source of liquidity if the incurrence of any new
debt is permitted by the terms of our existing debt instruments.
Sources of Liquidity
Our principal source of liquidity is expected to be the operating cash flows of our operating subsidiaries and, if required,
borrowings under the Existing Revolving Credit Facilities. As of June 30, 2018, our drawings under the Existing Revolving
Credit Facilities amounted to €580.0 million. We expect to use these sources of liquidity to fund operating expenses,
working capital requirements, capital expenditures, debt service requirements and other liquidity requirements that may
arise from time to time. The availability of borrowings under the Existing Revolving Credit Facilities is conditioned upon
compliance with specified leverage ratios. Our ability to generate cash from our operations will depend on our future
operating performance, which is in turn dependent, to some extent, on general economic, financial, competitive, market,
regulatory and other factors, many of which are beyond our control. We believe that our cash and cash equivalents, the
cash provided from the operations of our operating subsidiaries and any available borrowings under the Existing Revolving
Credit Facilities will be sufficient to fund our currently anticipated working capital needs, capital expenditures, and debt
service requirements during the next 12 months, although no assurance can be given that this will be the case. However,
as our debt matures in later years, we anticipate that we will seek to refinance or otherwise extend our debt maturities. No
Maturity of debentures Less than One year June 30, December 31,
(€m) one year or more 2018 2017
(revised*)
Altice France - 11,221.1 11,221.1 10,956.3
Altice USA - - - 13,192.9
Altice Luxembourg - 6,500.7 6,500.7 6,385.1
Altice Financing - 4,576.1 4,576.1 4,454.7
Altice Finco - 1,582.8 1,582.8 1,562.7
HOT Telecom 180.6 - 180.6 199.0
Total 180.6 23,880.8 24,061.4 36,750.7
Maturity of loans from financial institutions Less than One year June 30, December 31,
(€m) one year or more 2018 2017
(revised*)
Altice France (including RCF)** 285.1 4,993.2 5,278.3 5,036.4
Altice USA (including RCF)** - - - 3,862.5
Altice Corporate Financing - 2,353.0 2,353.0 2,353.0
Altice Financing (including RCF)** 373.5 1,808.8 2,182.3 1,911.8
Others 1.8 8.8 10.6 26.3
Total 660.4 9,163.8 9,824.2 13,190.0

assurance can be given that we will be able to complete the Refinancing Transactions or otherwise extend our debt
maturities. In this regard, it is not possible to predict how economic conditions, sovereign debt concerns and/or any adverse
regulatory developments could impact the credit markets we access and accordingly, our future liquidity and financial
position. In addition, sustained or increased competition, particularly in combination with adverse economic or regulatory
developments, could have an unfavourable impact on our cash flows and liquidity.
The debt issued by the subsidiaries of the Company is subject to certain restrictive covenants, which apply in the case of
debt issued by:
• Altice Luxembourg, to Altice Luxembourg and its restricted subsidiaries,
• Altice Financing S.A. and Altice Finco S.A., to Altice International S.à r.l. and its restricted subsidiaries,
• SFR Group, to SFR Group and its restricted subsidiaries,
Other than the HOT debentures and the revolving credit facilities, described below, such debt issued by the Group’s
subsidiaries is subject to incurrence based covenants, which do not require ongoing compliance with financial ratios, but
place certain limitations on the relevant restricted group’s ability to, among other things, incur or guarantee additional debt
(including to finance new acquisitions), create liens, pay dividends and other distributions to shareholders or prepay
subordinated indebtedness, make investments, sell assets, engage in affiliate transactions or engage in mergers or
consolidations. These covenants are subject to several important exceptions and qualifications.
To be able to incur additional debt under an applicable debt instrument, the relevant restricted group must either meet the
ratio test described below (on a pro forma basis for any contemplated transaction giving rise to the debt incurrence) or
have available capacity under the general debt basket described below or meet certain other exceptions to the limitation
on indebtedness covenant in such debt instrument.
Senior Secured Debt and Senior Debt is subject to an incurrence test as following:
• Senior Secured debt of Altice International is subject to an incurrence test of 3:1 (Adjusted EBITDA to Net Debt) and
Senior Debt is subject to an incurrence test of 4:1 (Adjusted EBITDA to Net Debt),
• Secured Debt of SFR Group is subject to an incurrence test of 3.25:1 (Adjusted EBITDA to Net Debt),
The Company or its relevant subsidiaries are allowed to fully consolidate the EBITDA from any subsidiaries in which they
have a controlling interest and that are contained in the restricted group as defined in the relevant debt instruments.
The Group has access to various revolving credit facilities, which are subject to maintenance covenants. The terms of these
facilities are no more restrictive than the incurrence covenants contained in other debt instruments.
The Issuer is a holding company with no direct source of operating income. Therefore, the Issuer will be dependent on
dividends and other payments from its operating subsidiaries to meet its liquidity requirements.
Working Capital
As of June 30, 2018, the Group had net current liability position of €4,409.1 million (mainly due to trade payables
amounting to €6,922.6 million) and a negative working capital of €1,912.8 million. The negative working capital position
is structural and follows industry norms. Customers generally pay subscription revenues early or mid-month, with
short days of sales outstanding, and suppliers are paid in the beginning of the following month, thus generating a negative
working capital. Payables due the following month are generally covered by operating cash flow. We expect that our

operating cash flows and, if required, available borrowings under the Existing Revolving Credit Facilities will be sufficient
to meet our working capital requirements during the next 12 months.
Net cash provided by operating activities
Net cash provided by operating activities decreased by 26.3% to €1,816.9 million for the six months ended June 30, 2018
compared to €2,464.2 million for the six months ended June 30, 2017. The decrease in net cash provided by operations
was mainly related to a lower net loss for the six months ended June 30, 2018 and lower income tax related cash impact,
which was more than offset by changes in working capital and other non-cash movements, mainly related to restructuring.
Net cash used in investing activities
Net cash used in investing activities decreased by 17.8% to €1,508.3 million for the six months ended June 30, 2018
compared to €1,834.3 million for the six months ended June 30, 2017. The decrease in the six months ended June 30, 2018
can be attributed to lower capital expenditures (please refer to the capital expenditure section) and lower payments for
acquisitions, mainly due to the acquisition of Teads in June 2017.
Net cash provided by (used in) financing activities
Net cash used / generated in financing activities increased by 180.6% to cash generated for an amount of €327.4 million
for the six months ended June 30, 2018 compared to cash used amounting to €406.4 million for the six months ended
June 30, 2017. The increase for the six months ended March 3, 2018 can primarily be attributed to the receipt of the
dividend of €894.3 million from Altice USA.
Net Cash Flows
(€m)
Net cash flow from operating activities 1,816.9 2,464.2 -26.3%
Net cash flow from investing activities (1,508.3) (1,834.3) -17.8%
Net cash flow from financing activities 327.4 (406.4) 180.6%
Changes in cash and cash equivalents 636.0 223.5 184.6%
Classification of cash as held for sale (274.4) - nm
Effects of exchange rate changes on cash held in foreign currencies 0.3 18.7 -98.4%
Net changes in cash and cash equivalents 361.9 242.2 49.4%
For the six months ended
June 30, 2018
For the six months ended
June 30, 2017 (* revised)Change

Key Operating Measures
We use several key operating measures, including number of homes passed, Cable/Fiber Customer Relationships, RGUs,
RGUs per Cable/Fiber Customer Relationship and ARPUs to track the financial and operating performance of our business.
None of these terms are measures of financial performance under IFRS, nor have these measures been audited or reviewed
by an auditor, consultant or expert. These measures are derived from our internal operating and financial systems.
As defined by our management, these terms may not be directly comparable to similar terms used by competitors or other
companies.
Dominican
France FOT Portugal Israel Republic Total
Homes passed 23,841 178 5,071 2,104 789 31,983
Fiber / cable homes passed 11,550 172 4,284 2,104 752 18,862
FIXED B2C
Fiber / cable unique customers 2,383 59 714 1,001 198 4,355
Fiber / cable customer net adds 152 0 95 1 (6) 242
Total fixed B2C unique customers 6,027 82 1,565 1,001 324 9,000
Total fixed B2C customer net adds 84 0 10 1 1 96
Fixed ARPU (€/month) € 32.1 € 44.7 € 32.3 € 50.2 € 26.2 -
MOBILE B2C
Postpaid subscribers 12,986 206 2,890 1,144 539 17,763
Postpaid net adds 450 14 72 (8) 3 532
Prepaid subscribers 1,566 52 3,492 156 2,637 7,904
Total mobile B2C subscribers 14,551 258 6,382 1,300 3,176 25,667
Postpaid Mobile ARPU (€/month) € 22.6 € 35.0 € 9.9 € 12.2 € 21.0 -
As and for the six months ended June 30, 2018

Notes to the Key Operating Measures:
(1) Total homes passed in France includes unbundled DSL homes outside of SFR’s fiber / cable (FTTH / FTTB) footprint.
Portugal total homes passed includes DSL homes enabled for IPTV outside of MEO’s fiber footprint and fiber homes
passed figures include homes where MEO has access through wholesale fiber operators (c.0.4m in Q2 2018).
(2) Fiber / cable unique customers represents the number of individual end users who have subscribed for one or more of
our fiber / cable-based services (including pay television, broadband or telephony), without regard to how many
services to which the end user subscribed. It is calculated on a unique premises basis. Fiber / cable customers for
France excludes white-label wholesale subscribers. For Israel, it refers to the total number of unique customer
relationships, including both B2C and B2B.
(3) ARPU is an average monthly measure that we use to evaluate how effectively we are realizing revenue from
subscribers. ARPU is calculated by dividing the revenue for the service provided after certain deductions for non-
customer related revenue (such as hosting fees paid by channels) for the respective period by the average number of
customer relationships for that period and further by the number of months in the period. The average number of
customer relationships is calculated as the number of customer relationships on the first day in the respective period
plus the number of customer relationships on the last day of the respective period, divided by two. For Israel and
Dominican Republic, ARPU has been calculated by using the following exchange rates: average rate for Q2 2018,
€1.00 = ILS 4.2635, €1.00 = 58.9757 DOP. ARPU numbers disclosed relate to the three months ended June 30, 2018
and the three month period ended June 30, 2017.
(4) Mobile subscribers is equal to the net number of lines or SIM cards that have been activated on our mobile networks.
In Israel, the split between iDEN and UMTS (B2C only, including prepaid) services as follows: 7k iDEN and 1,294k
UMTS as of June 30, 2018, and 9k iDEN and 1,238k UMTS as of June 30, 2017.
Dominican
France FOT Portugal Israel Republic Total
Homes passed 25,074 178 4,999 2,070 774 33,095
Fiber / cable homes passed 9,963 172 3,707 2,070 675 16,587
FIXED B2C
Fiber / cable unique customers 2,118 59 542 1,010 209 3,939
Fiber / cable customer net adds 80 0 64 (7) 5 142
Total fixed B2C unique customers 6,063 84 1,560 1,010 319 9,035
Total fixed B2C customer net adds (51) (4) - (40) - (7) - (1) - (103)
Fixed ARPU (€/month) € 35.1 € 46.2 € 34.1 € 58.6 € 28.7 -
MOBILE B2C
Postpaid subscribers 12,439 175 2,769 1,120 550 17,052
Postpaid net adds 102 - 12 - 46 - 39 - (15) - 185
Prepaid subscribers 2,112 56 3,562 127 2,783 8,639
Total mobile B2C subscribers 14,551 230 6,330 1,247 3,333 25,692
Postpaid Mobile ARPU (€/month) € 25.2 € 36.2 € 9.7 € 13.0 € 23.0 -
As and for the six months ended June 30, 2017

Other disclosures
Post-Balance Sheet Date Events
The following is an overview of key transactions since June 30, 2018 which may have a significant impact on the Group’s
financial condition and results of operations.
On July 3, 2018, the restricted cash that was held in an escrow account following the acquisition of Teads in Q2 2017 has
been fully released. The cash was used to pay non-reinvesting and reinvesting sellers for a total amount of €42.1 million.
In addition, an earn-out payment of €13.1 million was made to certain former owners of the company. This earn-out was
subject to Teads obtaining defined revenue performance in 2017, which targets have been met. Subsequent to the earn-out
payment of the €13.1 million, €5.2 million was reinvested by the former owners in the share capital of the company.
On July 10, 2018, the General Meeting determined the remuneration of the Company’s. CEO, Mr. Alain Weill, as follows:
• an aggregate annual fixed compensation of €2.0 million;
• a discretionary annual cash bonus of up to €1.0 million, which shall be determined by the Board upon a proposal of
the Remuneration Committee;
• in connection with the proposed Separation, an adjustment of the terms and conditions governing his current right to
acquire in aggregate 1,855,664 Preference Shares B, as follows:
• 1,103,096 Preference Shares B, each upon vesting convertible into one newly to be issued Common Share A as
well as 0.4163 existing shares of Class A Common Stock in Altice USA;
• 752,568 Preference Shares B, each upon vesting convertible into a number of newly to be issued Common Shares
A depending on the share price of the Common Shares A during the 5 trading days preceding the conversion
request;
• a gross cash compensation of a maximum aggregate amount of USD 839,991.15;
• the right to acquire in aggregate up to 50,000,000 Preference Shares B (the "New Preference Shares B"), with the
following characteristics:
• granted number of New Preference Shares B: 25,000,000;
• vesting period: earliest of four years and the Company’s annual General Meeting held in 2022;
• performance criteria: the Company having generated an annual consolidated EBITDA (as reported on a
consolidated basis and with constant perimeter and accounting standards) equal or in excess of the projected annual
consolidated EBITDA in the 4-year business plan adopted by the Company;
• number of New Preference Shares B, each convertible into one Common Share A, ranging between 0% and 200%
of number of granted preference shares, to be assessed at the end of the vesting period, according to a
predetermined allocation key linked to performance criteria.
On July 10, 2018, the Company repaid €625 million of the Altice Corporate Financing facility for certain tranches with a
maturity date of 2021, using part of the proceeds received in the Altice USA dividend distribution.
On July 16, 2018, the Company priced and allocated for its Altice France credit pool $2.5 billion of new 8-year Term
Loans B’s. The new Term Loan B will bear interest at a margin of 400bps over LIBOR. Closing of the new financing is

expected on August 14, 2018 and subject to closing conditions and the proceeds will be used by Altice France to call a
portion of its $4.0 billion May 2022 6.0% Senior Secured Notes.
On July 18, 2018, the Company had successfully priced and allocated for its Altice France credit pool €1.0 billion and
$1.75 billion of new 8.5-year Senior Secured Notes. The new €1.0 billion and $1.75 billion Senior Secured Notes have a
coupon of 5.875% and 8.125% respectively. The proceeds from this transaction, in conjunction with the proceeds raised
through the $2.5 billion of new Term Loans priced earlier in July 2018, will be used by Altice France to redeem in full its
$4.0 billion May 2022 6.0% Senior Secured Notes and €1.0 billion May 2022 5.375% Senior Secured Notes.
Following the consummation of this refinancing, and pro forma for the $2.5 billion of new 8-year Term Loans priced in
July 2018, the average maturity of Altice France’s capital structure has been extended from 6.4 to 7.5 years and the
weighted average cost of Altice France’s debt is 5.0%.
On July 25, 2018, the Company issued a bank guarantee to the European Commission in relation to the fine for an amount
of €124.5 million (see note 13.2.1).
On July 30, 2018, the Company announced that its subsidiary Altice Dominicana has reached an agreement with Phoenix
Tower International, a portfolio company of Blackstone, for the sale of 100% in the tower company Teletorres del Caribe
that will comprise 1,049 sites currently operated by Altice Dominicana. The transaction values Teletorres del Caribe, at
an enterprise value of $170 million. In conjunction with the contemplated transaction, Altice Dominicana will enter into a
20-year master agreement with Teletorres del Caribe, setting a clear partnership framework between the two companies.
Teletorres del Caribe has committed to support Altice Dominicana in the continued deployment of its network. Altice
Dominicana will pursue its long-term industrial project and continue providing best-in-class telecommunication services
to its subscribers, as part of the Altice Group. The transaction is expected to close during the third quarter of 2018 and is
subject to the effective de-merger and customary closing conditions.
The Group had started the preparation of the sale in the end of November 2017, however, the Management considered that
the sale was not highly probable given the preparatory works were mostly executed in 2018 and the decision to sell the
business in the Dominican Republic had not been taken by the Board. Therefore, as of December 31, 2017, the transaction
did not meet the classification criteria of held for sale according to IFRS 5 Non-currents Assets Held for Sale and
Discontinued Operations.
There were negotiations that took place during the first two quarters of 2018, however, the Management considered that
the sale was not highly probable as of June 30, 2018. The criteria for classification as held for sale was not met.
On August 7, 2018, Altice France signed a sale and purchase agreement with Starlight BidCo S.A.S related to the sale of
49.99% of shares in a newly incorporated tower company called SFR TowerCo. The contribution of the tower sites

currently operated by the Group to SFR TowerCo, as well as the closing of the of the transaction are expected to occur in
the financial year ending December 31, 2018.
Following the refinancing of the Altice France 2022 $4.0 billion 6.00% High Yield Notes certain cross-currency swaps
have been amended to hedge the new 2026 $2,500 million L+400 Term Loan B and the new 2027 $1,750 million 8.125%
High Yield Notes. In this process the euro notional of the swaps has been increased by approximately €157 million. The
corresponding amounts received will be used to partially repay the outstanding revolver at Altice France.
In addition, Altice France has entered a new swap to hedge the $250 million upsize of the 2027 $1.75 billion of Senior
Secured Notes of with a coupon of 8.125%.

Unrecognized Contractual Commitments
We have other contractual obligations incurred in the ordinary course of business, including commitments relating to
building or upgrading network infrastructure, purchase of set-top boxes, modems, mobile handsets and other end-user
equipment and various maintenance and support contracts primarily relating to the maintenance and support of network
infrastructure and equipment, purchase commitments for content, royalty payments to regulatory authorities and authors’
rights to societies and commitments under interconnection contracts.
Related Party Transactions
Please refer to Note 15 to the audited consolidated financial statements of Altice NV as of and for the six months ended
June 30, 2018.
Off Balance Sheet Arrangements
We are not party to any off-balance sheet arrangements that have, or are reasonably likely to have, a current or future
material effect on our financial condition, changes in financial condition, revenue or expenses, results of operations,
liquidity, capital expenditure or capital resources, other than the contractual commitments relating to purchase of property
plant, and equipment, operating leases or as disclosed below or in the audited consolidated financial statements of Altice
Luxembourg as of and for the six months ended June 30, 2018.
Critical Accounting Policies, Judgments and Estimates
For details regarding the Group’s critical accounting policies, judgments and estimates, see Note 2 to the audited
consolidated financial statements of Altice NV as of and for the six months ended June 30, 2018.

Key Income Statement Items
Revenue
Revenue consists of income generated from the delivery of fixed-based services to our B2C and B2B customers, mobile
services to our B2C and B2B customers, wholesale and other services. Revenue is recognized at the fair value of the
consideration received or receivable net of value added tax, returns, rebates and discounts and after eliminating
intercompany sales within the Group.
Fixed-based B2C services: Revenue from fixed-based services consists of revenue from pay television services, including
related services such as Video on Demand (“VoD”), broadband internet services, fixed-line telephony services and ISP
services to our customers. This primarily includes (i) recurring subscription revenue for pay television services, broadband
internet and fixed-line telephony (which are recognized in revenue on a straight-line basis over the subscription period),
(ii) variable usage fees from VoD and fixed-line telephone calls (which are recognized in revenue when the service is
rendered), (iii) installation fees (which are recognized in revenue when the service is rendered if consideration received is
lower than the direct costs to acquire the contractual relationship) and (iv) interconnection revenue received for calls that
terminate on our cable network.
Mobile B2C services: Revenue from mobile telephony services primarily consists of (i) recurring subscription revenue for
our post-paid mobile services (which are recognized in revenue on a straight-line basis over the subscription period),
(ii) revenue from purchases of our pre-paid mobile services (which are recognized in revenue when the service is rendered),
(iii) variable usage fees for mobile telephony calls (which are recognized in revenue when the service is rendered),
(iv) revenue from the sale of handsets (which are recognized on the date of transfer of ownership), and (v) interconnection
revenue received for calls that terminate on our mobile network.
Wholesale and B2B fixed and mobile services: Revenue from wholesale services primarily consists of revenues derived
from renting our network infrastructure services, including IRUs and bandwidth capacity on its network, to other
telecommunications operators, including mobile virtual network operations (“MVNOs”) as well as related maintenance
services. Revenue from B2B services is the same as the above fixed and mobile services, but for the business sector.
Others: Revenue from our other services primarily consists of revenue from other businesses, such as (i) datacenter
activities, (ii) content production and distribution, (iii) advertising, (iv) customer services, (v) technical services, and
(vi) other activities that are not related to our core fixed or mobile businesses.
Intersegment Eliminations: Intersegment costs, which primarily relate to services rendered by certain centralized Group
functions (such content production and customer service) to the operational segments of the Group, are eliminated in
consolidation.
Purchasing and subcontracting services
Purchasing and subcontracting services consist of direct costs associated with the delivery of fixed-based services to our
B2C and B2B customers, mobile services to our B2C and B2B customers, wholesale and other services. We present
purchasing and subcontracting services paid for the procurement of the following services:
Fixed-based services: Purchasing and subcontracting services associated with fixed-based services consist of all direct
costs related to the (i) procurement of non-exclusive television content, royalties and licenses to broadcast,
(ii) transmission of data services and (iii) interconnection costs related to fixed-line telephony. In addition, it includes costs
incurred in providing VoD or other interactive services to subscribers and accounting variations arising from changes in
inventories of customer premises equipment (such as modems, set-top boxes and decoders).
Mobile services: Purchasing and subcontracting services associated with mobile services consist primarily of mobile
interconnection fees, including roaming charges and accounting variations arising from the changes in inventories of
mobile handsets.
Wholesale: Purchasing and subcontracting services associated with wholesale primarily consist of costs associated with
delivering wholesale services to other operators.
Others: Other purchasing and subcontracting services consist of the (i) cost of renting space for datacenters (subject to
certain exceptions), (ii) utility costs related to the operation of datacenters (such as power and water supply costs), (iii) in
relation to the content activity of the Group, technical costs associated with the delivery of content, such as satellite rental
costs, (iv) in our technical services business, the cost of raw materials used in the technical activities related to the
construction and maintenance of the network, cables for customer connections, etc., and sub-contractor fees associated
with the performance of basic field work and the supervision of such sub-contractors, and (v) direct costs related to our
call center operations, such as service expenses, telecom consumption subscriptions and energy costs, in our customer
services functions.
Intersegment Eliminations: Intersegment costs, which primarily relate to services rendered by certain centralized Group
functions (such content production and customer service) to the operational segments of the Group, are eliminated in
consolidation.
Other operating expenses
Other operating expenses mainly consist of the following subcategories:
Customer service costs: Customer service costs include all costs related to billing systems, bank commissions, external
costs associated with operating call centers, allowances for bad customer debts and recovery costs associated therewith.
Technical and maintenance: Technical and maintenance costs include all costs related to infrastructure rental, equipment,
equipment repair, costs of external subcontractors, maintenance of backbone equipment and datacenter equipment,
maintenance and upkeep of the fixed-based and mobile networks, costs of utilities to run network equipment and those
costs related to customer installations that are not capitalized (such as service visits, disconnection and reconnection costs).
Business taxes: Business taxes include all costs related to payroll and professional taxes or fees.
General and administrative expenses: General and administrative expenses consist of office rent and maintenance,
professional and legal advice, recruitment and placement, welfare and other administrative expenses.
Other sales and marketing expenses: Other sales and marketing expenses consist of advertising and sales promotion
expenses, office rent and maintenance, commissions for marketers, external sales and storage and other expenses related
to sales and marketing efforts.
Staff costs and employee benefits
Staff costs and employee benefits are comprised of all costs related to wages and salaries, bonuses, social security, pension
contributions and other outlays paid to Group employees.
Depreciation and amortization
Depreciation and amortization includes depreciation of tangible assets related to production, sales and administrative
functions and the amortization of intangible assets.
Impairment losses
Impairment losses include the write-off of any goodwill or tangible and intangible assets that have been recognized on the
acquisition of assets based upon a re-evaluation of the cash generating capacity of such assets compared to the initial
valuation thereof.

Other expenses and income
Other expenses and income include any one-off or non-recurring income or expenses incurred during the on-going
financial year. This includes deal fees paid to external consultants for merger and acquisition activities, restructuring and
other non-recurring costs related to those acquisitions or the business in general, any non-cash operating gains or losses
realized on the disposal of tangible and intangible assets and management fees paid to related parties.
Interest relative to gross financial debt
Interest relative to gross financial debt includes interest expenses recognized on third party debt (excluding other long term
liabilities, short term liabilities and other finance leases) incurred by the Group.
Other financial expenses
Other financial expenses include other financial expenses not related to the third party debt (excluding other long term
liabilities and short term liabilities, other than finance leases) incurred by the Group. Such expenses mainly include interest
costs of finance leases, variations in the fair value of non-hedged derivative instruments and the inefficient portion of
hedged derivative instruments.
Financial income
Financial income consists of changes in the net fair value of the financial derivatives, gains from the disposal of financial
assets, net exchange rate differences, and other financial income.
Net result on disposal of businesses
Net result on disposal of businesses includes the gain/loss recognized on the disposal of our subsidiaries. This line item is
presented separately in the consolidated statement of income for the years ended December 31, 2015 and 2017 and for the
six months ended June 30, 2017. For the six months ended June 30, 2018, the net result on disposal of businesses is booked
under other expenses and income.
Share of profit of associates
Share of profit of associates consists of the net result arising from activities that are accounted for using the equity method
in the consolidation perimeter of the Group.
Income tax expenses
Income tax expenses are comprised of current tax and deferred tax. Taxes on income are recognized in the income
statement except when the underlying transaction is recognized in other comprehensive income, at which point the
associated tax effect is also recognized under other comprehensive income or in equity.
Adjusted EBITDA
Adjusted EBITDA is defined as operating profit before depreciation and amortization, impairment and losses, other
operating and non-recurring items and other adjustments (equity-based compensation expenses) in EBITDA. Adjusted
EBITDA is unaudited and is not required by or presented in accordance with IFRS or any other generally accepted
accounting standards. We believe that this measure is useful to readers of our financial as it provides them with a measure
of the operating results which excludes certain items we consider outside of our recurring operating activities or that are
non-cash, making trends more easily observable and providing information regarding our operating results and cash flow
generation that allows investors to better identify trends in its financial performance. Adjusted EBITDA should not be
considered as a substitute measure for operating income and may not be comparable to similarly titled measures used by
other companies.

Capital expenditure
We classify our capital expenditures in the following categories.
Fixed-based services (including wholesale): Includes capital expenditures related to (i) connection of customer premises
and investment in hardware, such as set-top boxes, routers and other equipment, which is directly linked to RGU growth
(“CPEs and installation related”); (ii) investment in improving or expanding our cable network, investments in the
television and fixed-line platforms and investments in DOCSIS network capacity (“cable network and construction
related”) and (iii) other capital expenditures related to our cable/fibre based business. This also includes capital
expenditures relating to datacentres, backbone network, connection fees of client’s premises, rental equipment to
customers and other B2B operations as well as content related capital expenditures relating to our subsidiaries that produce
and distribute content. Capital expenditures relating to network and equipment that is common to the delivery of fixed-
based or mobile services as well as in Others are reflected in cable capital expenditures or mobile capital expenditures as
the case may be.
Mobile services: Includes capital expenditures related to improving or expanding our mobile networks and platforms and
other investments relating to our mobile business.
Others: Includes capital expenditures relating to our content rights and other non-core fixed-based or mobile activities,
such as capital expenditures relation to our datacentres and backbone network.