Management Quality of German Football Clubs - HHL · Management Quality of German Football Clubs...
81
No. 167 August 2017 HHL Working Paper Management Quality of German Football Clubs The Football Management (FoMa) Q-Score 2017 Henning Zülch a , Moritz Palme b a Prof. Dr. Henning Zülch is Holder of the Chair of Accounting and Auditing at HHL Leipzig Graduate School of Management, Leipzig, Germany. Email: [email protected] b Moritz Palme is a research assistant at the Chair of Accounting and Auditing at HHL Abstract Managing a football club has become much more complex in recent years as they have turned into football companies and a growing number of stakeholders have entered the industry. The clubs’ capabilities to handle the increased complexity vary, turning management quality into a crucial competitive (dis-)advantage. This study establishes a new framework which comprehen- sively assesses management quality along four dimensions, namely Sporting Success, Financial Performance, Fan Welfare Maximization and Leadership & Governance validated by interviews with industry experts. Filled with measurable key performance indicators (KPIs), these dimen- sions intend to objectively quantify the relevant success factors. Ultimately, the performance in all dimensions, referred to as FoMa Q-Score, indicates a club’s management quality. To the best of our knowledge, this is the first exploratory study which derives and measures relevant key criteria for managing football clubs and illustrates the findings for the German Bundesliga in a transparent and understandable ranking. Football managers concerned can make use of our findings and derive specific actions to benchmark their club’s setups in order to make up ground or defend their competitive positions.
Transcript of Management Quality of German Football Clubs - HHL · Management Quality of German Football Clubs...
No. 167 August 2017
HHL Working Paper
Management Quality of German Football Clubs
The Football Management (FoMa) Q-Score 2017
Henning Zülcha, Moritz Palmeb a Prof. Dr. Henning Zülch is Holder of the Chair of Accounting and Auditing at HHL Leipzig Graduate School of Management, Leipzig, Germany. Email: [email protected] b Moritz Palme is a research assistant at the Chair of Accounting and Auditing at HHL
AbstractManaging a football club has become much more complex in recent years as they have turned into football companies and a growing number of stakeholders have entered the industry. The clubs’ capabilities to handle the increased complexity vary, turning management quality into a crucial competitive (dis-)advantage. This study establishes a new framework which comprehen-sively assesses management quality along four dimensions, namely Sporting Success, Financial Performance, Fan Welfare Maximization and Leadership & Governance validated by interviews with industry experts. Filled with measurable key performance indicators (KPIs), these dimen-sions intend to objectively quantify the relevant success factors. Ultimately, the performance in all dimensions, referred to as FoMa Q-Score, indicates a club’s management quality. To the best of our knowledge, this is the first exploratory study which derives and measures relevant key criteria for managing football clubs and illustrates the findings for the German Bundesliga in a transparent and understandable ranking. Football managers concerned can make use of our findings and derive specific actions to benchmark their club’s setups in order to make up ground or defend their competitive positions.
Management Quality of German Football Clubs
The Football Management (FoMa) Q-Score 2017
Henning Zülch and Moritz Palme
Acknowledgement We gratefully acknowledge the valuable and constructive comments of our interview partners, namely high-level representatives of distinguished German football clubs (Borussia Dortmund, Eintracht Frankfurt, FC Bayern München, Hamburger SV and RB Leipzig), media representatives (11 Freunde, FINANCE), and external stakeholders (Group Lagardère, Puma).
II
Table of Content
List of Figures IV
List of Tables V
List of Abbreviations VI
1 Starting Point 1
2 Literature Review and Scientific Approach 3
2.1 Preliminary Remarks 3
2.2 Literature Review of General Company’s Management 5
2.2.1 Financial Perspective 5
2.2.2 Customer Perspective 6
2.2.3 Internal-Business-Process Perspective 7
2.2.4 Learning & Growth Perspective 9
2.2.5 Implications for Assessing Management Quality of Football Clubs 11
2.3 Determination of Football Club’s Managerial Dimensions 11
2.3.1 From Management to Sports: a First Reconciliation 11
2.3.2 Sporting Success 15
2.3.3 Financial Performance 18
2.3.4 Fan Welfare Maximization 22
2.3.5 Leadership and Governance 25
2.3.6 Intermediate Result 27
3 Evaluation Procedures and Data Foundation 27
3.1 Preliminary Remarks 27
3.2 Validation using Expert Interviews 28
3.3 Football Management Evaluation Framework (FMEF) 28
3.4 The Football Mangement (FoMa) Q-Score 31
3.4.1 KPI - Definition and Data Collection 31
3.4.2 The FoMa-Scoring Model 41
3.4.3 Composition of the Bundesliga Members in the 2016/17 Season 44
4 Results of and Implications based on the FoMa-Scoring Model 46

III
4.1 Results of the FoMa-Scoring Model: the FoMa Q-Score 46
4.2 Implications based on the FoMa-Scoring Model 51
5 Conclusion 53
Appendix 56
List of Sources X
IV
List of Figures
Figure 1: Balanced Scorecard Perspectives ........................................................................... 4
Figure 2: Managerial Dimensions of Football Clubs ............................................................ 15
Figure 3: Bundesliga Revenue Mix 2015/16 ........................................................................ 20
Figure 4: Bundesliga Expenditure Mix 2015/16 .................................................................. 21
Figure 5: Football Management Evaluation Framework ..................................................... 29
Figure 6: Illustrative Example of a FoMa Q-Score Calculation ............................................ 44
V
List of Tables
Table 1: Measured KPIs – Sporting Success ........................................................................ 34
Table 2: Measured KPIs – Financial Performance ............................................................... 36
Table 3: Measured KPIs – Fan Welfare Maximization ......................................................... 38
Table 4: Measured KPIs – Leadership & Governance.......................................................... 40
Table 5: Illustrative Example of a Measured KPI ................................................................. 42
Table 6: Overview of Bundesliga Clubs 2016/17 ................................................................. 45
Table 7: FoMa- Q-Scores ..................................................................................................... 47
VI
List of Abbreviations
A
AG Aktiengesellschaft (joint stock company)
B
B Branding
BQ Board Quality
BSC Berliner Sport Club
C
C Communication
CEO Chief Executive Officer
CG Corporate Governance
Co. Company
CSR Corporate Social Responsibility
D
DFB Deutscher Fußball Bund (German Football Association)
DFL Deutsche Fußball Liga (German Football League)
E
e.g. for example (Latin: exempli gratia)
e.V. eingetragener Verein (registered association)
ed. editor, edition
et al. and others (Latin: et alii)
etc. et cetera
F
FC Fußball Club/football club/company
FMEF Football Management Evaluation Framework
FoMa Football Management
VII
FP Financial Performance
FSV Fußball- und Sportverein (football and sports associations)
FWM Fan Welfare Maximization
G
G Governance
GmbH Gesellschaft(en) mit beschränkter Haftung (limited company)
GP Growth/Profitability
I
I Internationalization
i.a. among others (Latin: inter alia)
i.e. that is (Latin: id est)
IMUG Institut für Markt-Umwelt-Gesellschaft e.V. (Institute for Market, Environ-
ment, and Society)
K
KGaA Kommanditgesellschaft auf Aktien (partnership limited by shares)
KKR Kohlberg Kraus Roberts & Co.
KPI Key Performance Indicator
KPMG Klynveld Peat Marwick Goerdeler
L
LG Leadership & Governance
M
MA Membership/Attendance
P
p. page
PCC Player/Coach Characteristics
PD Player Development
PL Player(s)
VIII
pp. pages
R
RB RasenBallsport (lawn ball games)
Q
Q Quality
S
SC Sport Club
SPOAC Sports Business Academy
SS Sporting Success
SR Social Responsibility
SV Sport Verein (sports club)
T
T Transparency
TP Team Performance
TSG Turn- und Sportgemeinschaft (physical education association)
U
UEFA Union of European Football Associations
V
VfB Verein für Bewegungsspiele (active games club)
VfL Verein für Leibesübungen (physical exercise club)
VIP Very Important Person(s)
1
1 Starting Point
Record-breaking broadcasting deals, potent investors, ever-increasing sponsorship ar-
rangements – the European football industry has become highly commercialized in the
past decade. The size of the European football market has nearly doubled since the last
ten years and is projected to exceed €25 billion in the 2016/17 season (STATISTA, 2017).
More than half of the market consists of the five major European leagues, namely Prem-
ier League (England), Bundesliga (Germany), La Liga (Spain), Serie A (Italy), and Ligue 1
(France) (DELOITTE, 2016, pp. 8–9). While the Premier League currently is the dominating
league with a considerable advantage in terms of overall revenue, the Bundesliga leads
the race for runner-up. Total revenues of €3.2 billion in the 2015/16 season denoted the
twelfth consecutive all-time high for the Bundesliga clubs (DFL, 2017, pp. 8–9). In the on-
going 2016/17 campaign, Germany’s highest football league features European power-
houses, such as FC Bayern München and Borussia Dortmund, but also national light-
weights, such as SV Darmstadt 98 and FC Ingolstadt 04. Throughout this diverse set of
football clubs a general trend can be observed, where an increase in commercialization
has been concurrent with additional advertising, match, and media revenues (DFL, 2017,
p. 14). Today, based on their turnover numbers, the majority of Bundesliga clubs can be
categorized as large enterprises1 (FRANZKE, 2017, pp. 76–77).
Naturally, managing a football club has become much more complex in recent years as
they have turned into football companies (FCs) and a growing number of stakeholders
have entered the industry. The FCs’ capabilities to handle the increased complexity vary,
turning management quality into a crucial competitive (dis-)advantage. By now, profes-
sional football is characterized by fierce competition on the management level (JUSCHUS,
LEISTER, & PRIGGE, 2016a, p. 212). Generally, management theory has been broadly dis-
cussed in the sport literature (see PITTS, DANYLCHUK, & QUARTERMAN (2014) and PITTS &
PEDERSEN (2005) for reviews). However, one area which has been widely neglected so far is
the holistic evaluation of FCs’ management quality levels. In this context, management
1 Companies with turnover of >€50 million are considered large enterprises (EUROPEAN COMMISSION, 2017).
2
does not merely refer to the individuals in charge but rather to the comprehensive guid-
ance of FCs.
With FCs increasingly resembling traditional enterprises, a suitable approach to this
topic is to build upon existing (general) management theory. This course of action is in
line with COSTA (2005, p. 124), who identifies the use of theory from parent disciplines,
such as general management, to be the most important research issue for the future of
sport management research. Enriching those learnings with insights from the sport-
specific literature field allows for the development of a comprehensive model assessing
management quality of FCs.2
The present study derives a new framework which comprehensively assesses man-
agement quality along four dimensions, namely Sporting Success; Financial Performance;
Fan Welfare Maximization; and Leadership & Governance. Interviews with industry ex-
perts led to the conclusion that the four dimensions holistically describe the target con-
struct of an FC. Filled with measurable key performance indicators (KPIs), these dimen-
sions serve the purpose of objectively quantifying the relevant success factors. Ultimately,
the performance in all dimensions indicates an FC’s management quality. To the best of
our knowledge, this is the first exploratory study which derives and measures relevant
key criteria for managing FCs and illustrates the findings in a ranking. The aim of the study
at hand is to establish a model which impacts both academia and practice. By utilizing
existing management literature and adjusting it to football particularities, the newfound
knowledge begins to close the gap in sport management literature. Football managers
can make use of the framework’s findings and derive specific actions to benchmark their
FCs’ setups in order to make up ground or defend their competitive positions.
The remainder of this study is structured as follows: chapter two lays the theoretical
foundation from the perspectives of both existing management literature and sport man-
agement theory. It concludes with a theoretical framework to assess management quality
2 Such models have been partly introduced by two projects. JUSCHUS ET AL. (2016a) adapted a proven scheme to assess corporate
governance of listed German companies and ranked the Bundesliga clubs accordingly. The British research and rating company OMS applied the Organizational Maturity Index, “[…] determining the quality of leadership and human capital management capa-bility […]”, on the Premier League clubs (OMS, 2016). These studies shed light on specific aspects of management quality but do not include all relevant dimensions.
3
of FCs. Chapter three introduces the evaluation method and data analysis approach. Also,
this chapter takes a look at the specifications of the Bundesliga members in the 2016/17
season, supplemented by the promoted teams of VfB Stuttgart 1893 and Hannover 96.
Thereafter, the results of the FCs’ management quality levels are finally presented in
chapter four. Chapter five discusses the findings and reflects on their limitations. Finally,
chapter six summarizes the methodology and main findings.
2 Literature Review and Scientific Approach
2.1 Preliminary Remarks
Whether the management of a company is considered successful or not generally de-
pends on its level of goal achievement. Therefore, it is necessary to set up dimensions
along which management performance can be assessed. Clearly, the objectives of enter-
prises vary strongly (financial vs. non-financial, internal vs. external, etc.) and it is chal-
lenging to come up with a universal approach. A framework which includes the most im-
portant factors seems to be most suitable for this analysis to cover the perspectives of a
broad range of companies.
One management tool which fulfills this requirement is the so-called Balanced Score-
card, developed by ROBERT S. KAPLAN and DAVID P. NORTON in the early 1990s. The authors
criticized the prevailing overemphasis of financial performance indicators and suggested a
more balanced approach of financial and non-financial goals. The Balanced Scorecard is
“perhaps the best known performance measurement framework […]” (NEELY, GREGORY, &
PLATTS, 1995, p. 96) and looks at performance from four different but highly interlinked
perspectives (KAPLAN & NORTON, 1996, p. 9):
1. Financial Perspective
2. Customer Perspective
3. Internal-Business-Process Perspective
4. Learning & Growth Perspective
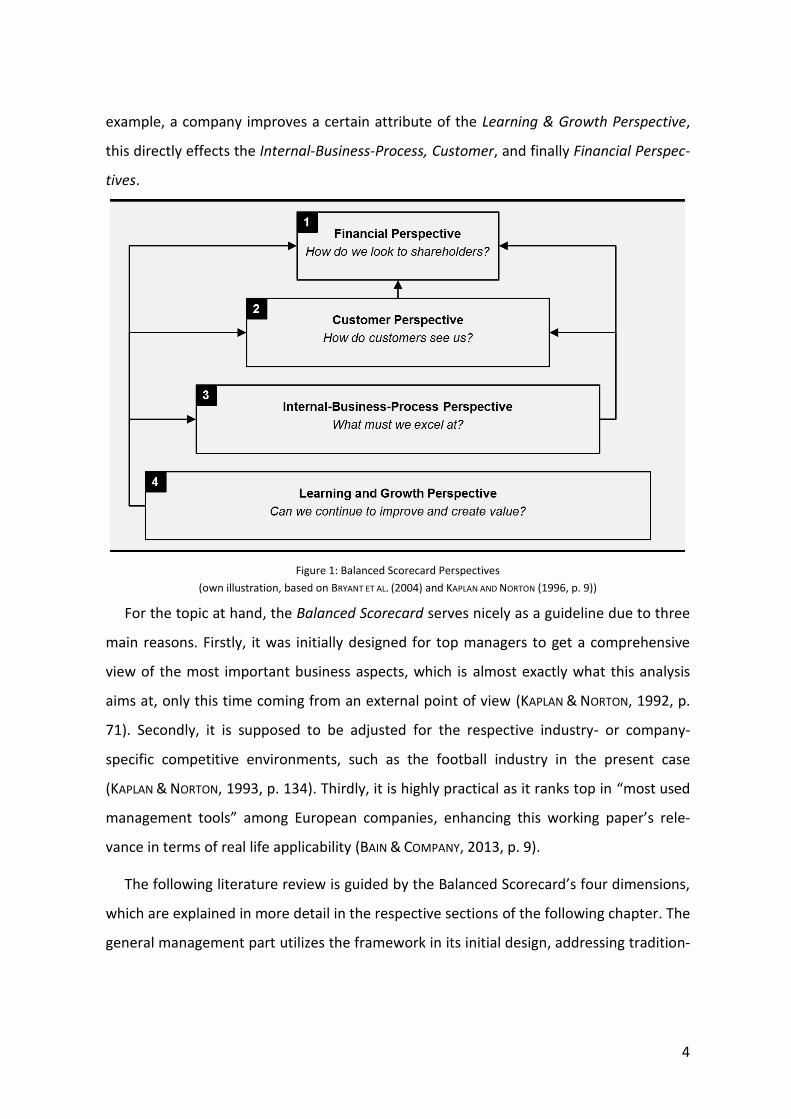
BRYANT, JONES, AND WIDENER (2004) were able to show a pyramidal hierarchy within the
four dimensions, with the Financial Perspective being the highest one (see Figure 1). They
conclude that the results of each perspective influence all higher-level perspectives. If, for
4
example, a company improves a certain attribute of the Learning & Growth Perspective,
this directly effects the Internal-Business-Process, Customer, and finally Financial Perspec-
tives.
Figure 1: Balanced Scorecard Perspectives
(own illustration, based on BRYANT ET AL. (2004) and KAPLAN AND NORTON (1996, p. 9))
For the topic at hand, the Balanced Scorecard serves nicely as a guideline due to three
main reasons. Firstly, it was initially designed for top managers to get a comprehensive
view of the most important business aspects, which is almost exactly what this analysis
aims at, only this time coming from an external point of view (KAPLAN & NORTON, 1992, p.
71). Secondly, it is supposed to be adjusted for the respective industry- or company-
specific competitive environments, such as the football industry in the present case
(KAPLAN & NORTON, 1993, p. 134). Thirdly, it is highly practical as it ranks top in “most used
management tools” among European companies, enhancing this working paper’s rele-
vance in terms of real life applicability (BAIN & COMPANY, 2013, p. 9).
The following literature review is guided by the Balanced Scorecard’s four dimensions,
which are explained in more detail in the respective sections of the following chapter. The
general management part utilizes the framework in its initial design, addressing tradition-
5
al companies with generic application. For the subsequent football-related analysis, sev-
eral adjustments are to be made.
2.2 Literature Review of General Company’s Management
At first one has to obtain a broad understanding of the factors influencing the capabil-
ity to manage large companies. Those insights are thereafter used to transfer as much of
this knowledge as possible on managing FCs. Since the general management literature is
very comprehensive, the emphasis is put on meta-analyses3 and selected, widely recog-
nized academic papers. The review is structured by the Balanced Scorecard’s dimensions,
namely Financial, Customer, Internal-Business-Process and Learning & Growth.
2.2.1 Financial Perspective
The highest perspective in the above mentioned pyramidal hierarchy and consequently
the most important for managing most companies is the Financial Perspective. In the
past, companies relied primarily on financial performance measures such as return on
investment or economic value analysis. While those still play a vital role in modern com-
panies, they are now broadly enriched with non-financial indicators (CHENHALL & LANGFIELD-
SMITH, 2007, p. 266). In contrast to the following Balanced Scorecard perspectives, the
Financial Perspective does not contain substantial levers which can be adjusted in order
to improve performance. Rather, adjustments in the lower perspectives are necessary to
drive overall financial success ( BRYANT ET AL., 2004, p. 113).
KAPLAN AND NORTON (1996, pp. 48–50) reason that financial targets strongly depend on
the respective stage of a company’s life cycle. They distinguish three main stages: growth,
sustain, and harvest. Growth businesses are situated at an early life cycle stage, in which
their products and services still have a lot of growth potential. Their emphasis in terms of
financial objectives lies on sales growth rates, indicating the success of expansion efforts.
Companies in the sustain stage have a proven track record and are expected to defend or
improve their market positions by exploiting (re)investments. The focus of those busi-
nesses is put on market share comparisons and profitability measures. Lastly, companies
3 A meta-analysis is a “[…] statistical analysis of a large collection of analysis results from individual studies for the purpose of inte-
grating the findings.” (GLASS, 1976, p. 3)
6
in a mature life cycle stage aim to harvest the investments from the two previous stages
without significant new investments. They aim to maximize cash flows, which can eventu-
ally be utilized for tapping into new markets. Certainly, companies may find themselves in
between two stages or switching from one stage to another when new opportunities
arise.
2.2.2 Customer Perspective
The Customer Perspective is the second dimension of the Balanced Scorecard and has a
direct impact on the Financial Perspective. Companies increasingly understand the im-
portance of the customer as source of financial success and consequently become more
and more customer-oriented. Generally, customers tend to be concerned with matters of
time, quality, performance, service, and cost (KAPLAN & NORTON, 1992, p. 73). Companies,
therefore, aim to deliver products and services which fulfill those criteria and are conse-
quently valued by customers. Valuable products and services are expected to enhance
the main customer measures of satisfaction, loyalty, retention, and acquisition (KAPLAN &
NORTON, 1996, p. 63). The influence of those customer-related factors on a company’s
financial performance is strongly supported by academic literature.
A popular study with Swedish companies indicated that there is a direct correlation be-
tween customer satisfaction and superior economic return (ANDERSON, FORNELL, & LEHMANN,
1994). By continuously improving their customer satisfaction measures, firms were able
to achieve an average increase in net income of up to 12%. In addition to positive finan-
cial influences in terms of purchasing behavior (e.g. future-period retention) and account-
ing performance (e.g. profit margins), ITTNER AND LARCKER (1998) state that satisfied cus-
tomers lead to an increase in the number of future customers due to positive word-of-
mouth. This is especially valuable for modern companies in digitized environments, which
are characterized by considerably higher customer acquisition costs than firms operating
in the offline world (REICHHELD & SCHEFTER, 1998, p. 106). Therefore, companies have the
ability to significantly reduce acquisition costs by satisfying existing customers and creat-
ing a buzz around their products and brands.
7
For companies it is essential to understand the sources of customer satisfaction in or-
der to appropriately manage quality and communication. SPRENG, MACKENZIE, AND OLSHAV-
SKY (1996) disentangled the antecedents of customer satisfaction and boiled them down
to two major factors: expectations and desires. The authors define expectations as “be-
liefs about a product's attributes or performance at some time in the future” and desires
as “the levels of attributes and benefits that a consumer believes will lead to or are asso-
ciated with higher-level values” ( SPRENG, MACKENZIE, AND OLSHAVSKY, 1996, pp. 16–17). Ex-
emplarily, a higher-level value could be protection, leading to a customer’s preference for
products which contain attributes of this certain desire. According to the model, custom-
ers are satisfied when their perceptions of a product’s performance match or exceed both
their expectations and desires.
When companies consistently manage to fulfill customers’ expectations and desires,
they have the opportunity to involve them in a long-term relationship and thus maximize
customers’ lifetime values. A customer’s lifetime value can be understood as “a series of
transactions between the firm and its customer over the entire time period the customer
remains in business with the firm” (JAIN & SINGH, 2002, p. 35).
2.2.3 Internal-Business-Process Perspective
In order to deliver the appropriate value propositions to customers and meet financial
objectives, a company needs to derive pivotal internal functions, which the organization
must master (KAPLAN & NORTON, 1996, p. 26). Four generic processes that practically all
companies have in common are innovation, customer management, operations and logis-
tics, and regulatory and environmental (KAPLAN & NORTON, 2001, p. 92). Their characteris-
tics and influences on company performance are further described in the following.
Innovation processes concern the development of new products and services as well
as the exploitation of new market and customer segments (KAPLAN & NORTON, 2001, p. 93).
ADAMS, BESSANT, AND PHELPS (2006, pp. 26–38) unfolded the necessary management pro-
cesses for being a successful innovator, which, amongst others, include input manage-
ment (e.g. resource and development intensity), knowledge management (i.e. generating
and sharing ideas and information), and commercialization (i.e. market introduction of
8
innovations). Tapping into new products or markets is often rewarded by positive impacts
on sales, profitability, and market share developments, which was verified by multiple
academic meta-analyses (e.g. HAUSER, TELLIS, & GRIFFIN, 2006; ROSENBUSCH, BRINCKMANN, &
BAUSCH, 2011).
Customer management processes serve the purpose of “expanding and deepening re-
lationships with existing customers” (KAPLAN & NORTON, 2001, p. 93). Both academics and
practitioners are increasingly interested in customer relationship management in order to
lengthen the interaction with existing customers and thereby raise customer lifetime val-
ues, mentioned in the Customer Perspective of the Balanced Scorecard (CHENHALL & LANG-
FIELD-SMITH, 2007, p. 271). REINARTZ, KRAFFT, AND HOYER (2004) structure the customer rela-
tionship management process into three parts: relationship initiation, maintenance, and
termination. The authors, especially for the maintenance process, confirm a positive cor-
relation with profitability, measured in terms of return on assets. One particularly rele-
vant possibility for modern companies to maintain and expand relationships with cus-
tomers is utilizing social media as a communication tool.
For operation and logistic processes, managers are involved with issues concerning the
efficiency increase of crucial processes, such as supply-chain management and asset utili-
zation (KAPLAN & NORTON, 2001, p. 93). Simply put, operations management allows insights
into the inputs, throughputs, and outputs of different processes (CHENHALL & LANGFIELD-
SMITH, 2007, p. 268). Clearly, increasing (decreasing) outputs (inputs) while keeping inputs
(outputs) constant leads to a higher productivity level and ultimately to better processes.
As the processes become more efficient, profitability is increased and management is
able to allocate relevant resources to other areas.
Regarding the last aspect of the Internal-Business-Process Perspective, regulatory and
environmental processes, the management is engaged in positioning the company as
“good corporate citizen” and thereby acting in a responsible way (KAPLAN & NORTON, 2001,
p. 93). From a regulatory point of view, it is reasonable to expect from a company and its
management to act within the general laws as well as the more industry-specific regula-
tions. The subject of social performance has recently grown in importance and comprises
9
“an organization’s behavior on society including the broader community, employees, cus-
tomers, and suppliers” (CHENHALL & LANGFIELD-SMITH, 2007, p. 277). The strategy to follow
in this context is described by the term “Avoiding Bad” (KLEINAU, KRETZMANN AND ZÜLCH,
2016, p. 77). A meta-analysis, incorporating 30 years of cross-industry research, has prov-
en that a higher level of corporate social performance goes hand in hand with an increase
in financial success (ORLITZKY, SCHMIDT, & RYNES, 2003). However, there are also articles
with findings that mitigate this relationship (e.g. MCGUIRE, SUNDGREN, AND SCHNEEWEIS, 1988,
p. 869).
2.2.4 Learning & Growth Perspective
The bottom of the pyramidal hierarchy within the Balanced Scorecard is the Learning &
Growth Perspective. It influences the three higher dimensions and can, therefore, be con-
sidered as foundation and enabler of future success. The main components of the Learn-
ing & Growth Perspective are intangible assets, which have significantly grown in im-
portance in the Balanced Scorecard (CHENHALL & LANGFIELD-SMITH, 2007, p. 274). It was
shown by CHEN, CHENG, AND HWANG (2005, p. 174) that intellectual capital positively influ-
ences profitability in present and future periods. KAPLAN AND NORTON (2004, p. 45) synthe-
sized three drivers of the perspective: human, informational, and organizational capital.
Firstly, informational capital mainly concerns IT-systems and networks which support a
company’s strategy. Secondly, human capital relates to all relevant characteristics of the
people employed in the company. These can range from relevant skills to specific know-
how. Thirdly, organizational capital affects the company’s capability to drive and retain
change processes, which are required to implement a strategy, and comprises factors
such as leadership, organizational structure, and culture. Since the IT-infrastructure is
highly firm-specific and can only be poorly evaluated from an external perspective, the
emphasis is put on the two latter drivers in the following.
As foundation for human and organizational capital, the principal-agency theory plays
a major role in helping to understand the involved and interlinked factors. An agency rela-
tionship is defined as “a contract under which one or more persons (the principal(s)) en-
gage another person (the agent) to perform some service on their behalf which involves
10
delegating some decision making authority to the agent” (JENSEN & MECKLING, 1976, p.
308). The general idea of this theory is that ownership and control are separated. This is
usually the case for listed companies, in which the shareholders act as principal and the
board of directors as agent. Naturally, assuming both parties aim to maximize their own
utility functions, they have diverging interests (e.g. shareholder value vs. revenue in-
crease). Therefore, it is necessary to create incentives such that both parties strive for the
same objectives and set up monitoring mechanisms in order to control the agent by limit-
ing their power. This leads to the existence of agency costs, which can be reduced by em-
ploying people with similar objective functions and establishing efficient governance4
structures.
Generally, there are several ownership types which can be differentiated. One owner-
ship type, institutional ownership5, and its influence on firm performance have received
considerable attention by scholars. For example, KRIVOGORSKY (2006) found in an investiga-
tion among continental European companies that the percentage of institutional owner-
ship is positively related to profitability, measured as return on equity. It is argued that
institutional governance increases the principal’s monitoring capabilities. Building on this,
ELYASIANI AND JAI (2010, p. 619) add that not only the level of institutional ownership but
also institutional shareholding stability has a positive effect on firm performance. They
reason that the longer an institution is invested in a firm, the greater the principal’s
knowledge of and involvement in the firm can become.
The owners of a company or their elected representatives, often in combination with
further stakeholders and independent persons, constitute the supervisory board, which
monitors the management. The supervisory board is supposed to provide important re-
sources, for example in the form of advice or external connections, rationally monitor the
management, and elect the chief executive officer (HILLMAN & DALZIEL, 2003, pp. 384–386).
4 Corporate governance relates to all “procedures and processes according to which an organization is directed and controlled”.
(OECD, 2005) 5
Institutional ownership refers to “ [...] the amount of a company’s available stock owned by mutual or pension funds, insurance
companies, investment firms, private foundations, endowments or other large entities that manage funds on the behalf of oth-ers.“ (INVESTOPEDIA, 2017)
11
Since independent board members6 have a less emotional point of view and are certainly
equipped with external resources, it seems logical that a positive correlation between
their representation in the supervisory board and financial performance is indicated by
research (KRIVOGORSKY, 2006, p. 191). This line of argumentation was similarly used in a
meta-analysis, investigating the relationship between supervisory board size and financial
performance (DALTON, DAILY, JOHNSON, & ELLSTRAND, 1999) 7.
2.2.5 Implications for Assessing Management Quality of Football Clubs
The review of the general management literature based on the Balanced Scorecard’s
four dimensions has shown that managing large companies heavily depends on a multi-
tude of factors, ultimately determining a company’s financial success in the long-term. A
broad range of criteria from the Financial, Customer, Internal-Business-Process, and
Learning & Growth Perspectives have to be considered both strategically and on a day-to-
day basis. Successful management means that the critical success factors have been iden-
tified, are under continuous observation, and regularly lead to new impulses.
As much of the gained knowledge from this chapter as possible is to be transferred to
managing FCs and incorporated in the final model to assess management quality of the
Bundesliga teams. However, due to football industry’s special characteristics, adjustments
in terms of the relevant management dimensions as well as certain correlations within
these dimensions are necessary.
2.3 Determination of Football Club’s Managerial Dimensions
2.3.1 From Management to Sports: a First Reconciliation
The Balanced Scorecard was a very suitable and efficient framework to determine the
relevant management dimensions of traditional companies and raise awareness for some
of the interdependencies within them. Several academic investigations have been made,
applying the Balanced Scorecard in sport-related settings (e.g. VINCK, 2009). Some of these
6 Independent board members generally do not have strong family or business ties to company management or controlling share-
holders (KRIVOGORSKY, 2006, p. 187) . 7 DALTON, DAILY, JOHNSON, & ELLSTRAND (1999) found out that a higher number of board members leads to superior market-based and
accounting-based financial performances, which is due to the increased access to resources, such as external capital, and the higher level of counseling to the executive team.
12
studies utilized the tool’s original four dimensions and thereby failed to take the special
characteristics of FCs into consideration (e.g. BECSKY, 2011, p. 30). Other studies adjusted
the framework for the football environment but did not provide adequate explanation for
origin of the new perspectives and reasons for their incorporation (e.g. KELLER, 2008, pp.
313–316).
In one recent case, an adjusted version of the Balanced Scorecard was actually applied
at a Bundesliga club in practice. When the former CEO of IBM Germany, Erwin Staudt,
became president of then-Bundesliga member VfB Stuttgart in 2003, he implemented the
internal management tool together with the management consulting firm Horváth &
Partners (HANDELSBLATT, 2004). The aim of this initiative was to improve controlling and
management capabilities of the FC by introducing goals and strategies for all dimensions
and making the most important success factors traceable (WEHRLE & HEINZELMANN, 2004, p.
350). While this shows the theoretical and practical relevance of internally professionaliz-
ing an FC’s management by applying the Balanced Scorecard, the study at hand strives to
approach the topic from a strictly external perspective.
The equivalent of traditional companies’ products and services on the part of FCs is the
sporting performance. The initial question which traditional companies must ask them-
selves in the Internal-Business-Process Perspective of the Balanced Scorecard (see Figure 1
on page 4) is: “What must we excel at?”. FCs first and foremost have to deliver high qual-
ity on the pitch and excel at the sport-related factors enabling it. An evaluation of man-
agement quality in FCs cannot be undertaken without incorporating a sport dimension
because it constitutes the centerpiece of each FC and is assessed by the public on a daily
basis (KELLER, 2008, p. 56). Therefore, the Internal-Business-Process Perspective is adjusted
to a sport dimension, which better suits the management of football companies (1st Di-
mension: Sporting Success [SS]).
The football literature is dominated by the broad consent that, in the case of modern
FCs, sport objectives are accompanied by financial goals. Since the Financial Perspective is
also part of the traditional Balanced Scorecard, there is no need to make any adjust-
ments. The interdependence of sport and finance perspectives is extensively reviewed by
13
KELLER (2008, pp. 49–81). The author states that the two perspectives are highly correlat-
ed and strongly depend on each other. An improvement in sporting performance goes
hand in hand with an increase in financial performance due to factors such as higher mer-
chandising and TV revenues or new sponsorship agreements. Resulting financial re-
sources, in turn, can be used for investments in team squad or youth academy, which will
under normal circumstances eventually lead to better sporting performance. Thus, sport
and finance dimensions form a spiral, which can turn both directions, upwards and
downwards. This effect has been verified by research. Examining the top 30 EU FCs
(based on revenues), ROHDE AND BREUER (2016, pp. 12–14) provide evidence for the highly
positive influence of sporting performance on revenues. Simultaneously, the data shows
superior sporting performance in terms of league points per game caused by additional
team investments, which are enabled by an increase in revenues. Nonetheless, the rela-
tive importance of the two dimensions is not necessarily the same and has been subject
to scientific investigations. In a sophisticated statistical model analyzing the behavior of
professional FCs from the Spanish and English top leagues the FCs are found to rather act
in a win-maximization than profit-maximization way (GARCIA-DEL-BARRIO & SZYMANSKI,
2009). As German FCs directly compete with those from Spain and England and resemble
them on many levels, there is no reason to assume any contrasting behavior in the Bun-
desliga. This assumption is supported by a recent survey among top managers from all 18
Bundesliga clubs (KAWOHL, ZEIBIG, & MANZ, 2016, p. 13). In the short-run, they report a
strong emphasis on sporting performance while only aiming to break even in financial
terms. In the long-run, optimizing business-related factors becomes increasingly im-
portant, though still subordinated to sporting success (2nd Dimension: Financial Perfor-
mance [FP]).
“The pressure is unbelievably high because every third day [we] are under review, [and]
have to deliver in front of the eyes of the public. That’s not the case in any corporation in
the world.” (HORIZONT, 2017, p. 20) This quote by HANS-JOACHIM WATZKE, CEO of Borussia
Dortmund, sums up the extraordinary status the public, and especially the fans, have in
the football industry. Managers of the other Bundesliga clubs agree with this view by stat-
14
ing that “without fans, everything is nothing” (KAWOHL ET AL., 2016, p. 13). Especially in
the modern, commercialized football industry, FCs are highly dependent on fans and
spectators to generate merchandising, ticket, and TV revenues. Therefore, it can be con-
cluded that the ultimate purpose of FCs is to serve their fans. Recent research supports
the stance of a third dimension in the target system of FCs. In addition to win and profit
maximization, MADDEN (2012) statistically discovered a further objective, namely fan wel-
fare maximization. The author attributes this effect to the special characteristics adherent
to FCs, in which “fans (or supporters) have a particular allegiance to a club, are the con-
sumers of its products, and directly influence club policies” (MADDEN, 2012, p. 560). Fan
welfare maximization orientation was particularly strong for Bundesliga clubs. The fun-
damental reason for this is the prevalent 50+1 rule in the German Football Association’s
statutes (DFB, 2017). It determines that either at least 50% plus one additional vote of a
club’s voting rights are in the hands of a registered association (e.V.) or similar organiza-
tional structures are in place, guaranteeing the same dominating status. Thereby, single
external shareholders are prevented from accumulating too much power, which conse-
quently leaves a lot of rights with the e.V. and the fans. The adoption of three dimensions
in the target system of FCs has recently been used by other investigations as well (e.g.
JUSCHUS ET AL., 2016a). Based on these findings, the Customer Perspective of the traditional
Balanced Scorecard is slightly adjusted to an increased focus on fans (3rd Dimension: Fan
Welfare Maximization [FWM]).
The previous remarks in this chapter have revealed a target system for FCs, consisting
of the three dimensions Sporting Success, Financial Performance, and Fan Welfare Maxi-
mization. All three objectives have to be properly managed and weighed out against each
other, which is becoming increasingly challenging in the complex football environment.
Conventional wisdom has it that the professionalization of management skills and struc-
tures lacks behind the intense commercialization in the industry (HOLZMÜLLER, CRAMER, &
THOM, 2014, p. 69; HÜPPI, 2014, p. 86). Practical examples from the recent past, such as
frequent changes in the leadership team of Hamburger SV or the unclear compensation
structure of Mainz 05’s president Harald Strutz support this view. Therefore, a fourth di-
15
mension, which is concerned with an FC’s organizational and human capital, is part of the
following considerations. It is largely in line with the Learning & Growth Perspective from
the traditional Balanced Scorecard, but renamed for this specific purpose (4th Dimension:
Leadership & Governance [LG]).
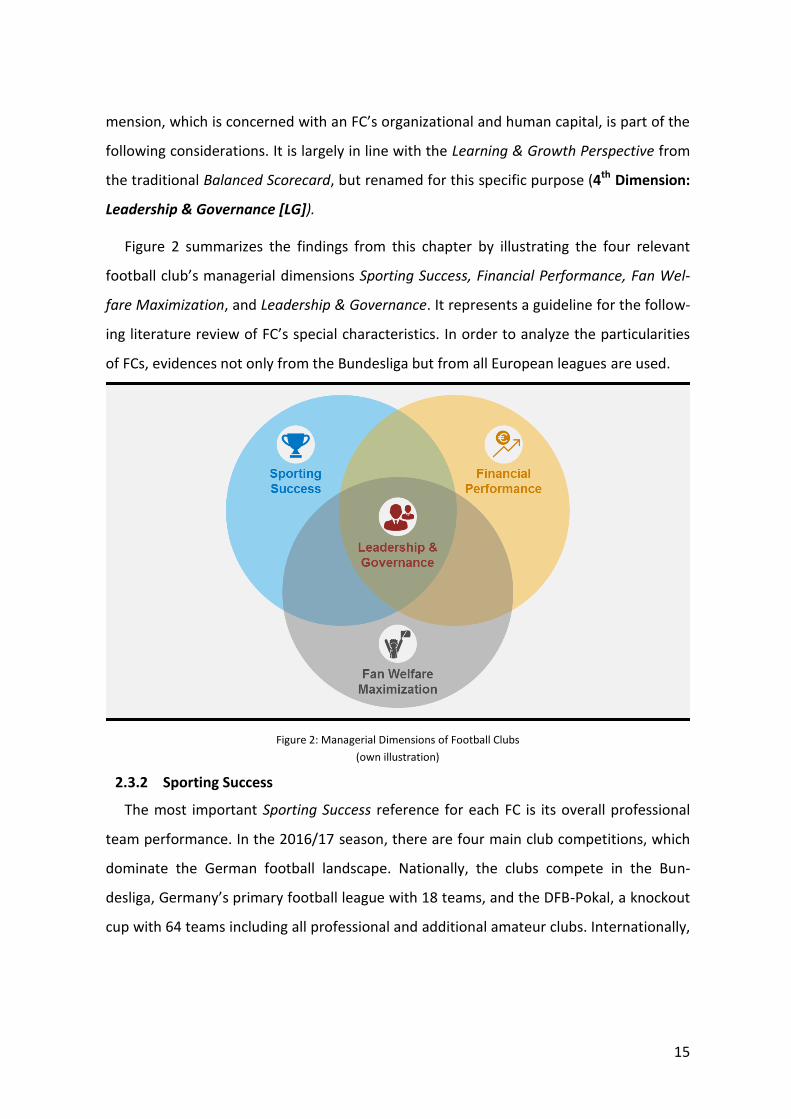
Figure 2 summarizes the findings from this chapter by illustrating the four relevant
football club’s managerial dimensions Sporting Success, Financial Performance, Fan Wel-
fare Maximization, and Leadership & Governance. It represents a guideline for the follow-
ing literature review of FC’s special characteristics. In order to analyze the particularities
of FCs, evidences not only from the Bundesliga but from all European leagues are used.
Figure 2: Managerial Dimensions of Football Clubs
(own illustration)
2.3.2 Sporting Success
The most important Sporting Success reference for each FC is its overall professional
team performance. In the 2016/17 season, there are four main club competitions, which
dominate the German football landscape. Nationally, the clubs compete in the Bun-
desliga, Germany’s primary football league with 18 teams, and the DFB-Pokal, a knockout
cup with 64 teams including all professional and additional amateur clubs. Internationally,
16
six teams are able to qualify for either UEFA Champions League or UEFA Europa League,
depending on their performance in the previous season.
As the Bundesliga positon at the end of each campaign is one of the decisive influences
on an FC’s immediate future, it can be considered as the most significant club competi-
tion (KELLER, 2008, p. 117). Places one to six qualify for one of the two international club
competitions; place 16 goes along with a relegation match against the third-place finisher
from the 2. Bundesliga, while places 17 and 18 imply a direct relegation. The DFB-Pokal as
Germany’s second main club competition is a chance for FCs to earn additional revenues
by reaching subsequent rounds and to qualify for the UEFA Europa League if they manage
to win the cup8. Qualifying for the international club competitions significantly increases
revenues but also requires additional player capacities because the number of matches
and associated travels get higher.
Given the differences in financial resources, not all FCs pursue the same targets. Ac-
cording to KAWOHL ET AL. (2016, pp. 18–19), FCs can be categorized into four general
groups, based on their strategic positioning. The first group, International Players such as
FC Bayern München and Borussia Dortmund, is active on the global transfer market and
aims to keep up in financial terms with the international competition, especially from the
English Premier League. National Traditional Clubs (e.g. Borussia Mönchengladbach and
Hamburger SV) form the second group and are characterized by a strong regional rooted-
ness as well as a long-term establishment in the Bundesliga. They aim to maintain their
regional embeddedness and fight for the places behind the international players. The
third group comprises the likes of SC Freiburg and 1. FSV Mainz 05, FCs which benefit
from their strong youth academies and depend on regularly selling their best players to
more successful teams. These so-called Training Clubs strive to become less dependent
on big financial transfer injections by constant sporting success. Lastly, the group of Pro-
ject Clubs has emerged in the recent past and managed to permanently settle in the Bun-
desliga. FCs such as RB Leipzig and VfL Wolfsburg are the result of long-term plans to es-
8 In case the cup winner has already qualified for an international competition through its Bundesliga performance, the additional
participation right for the UEFA Europa League is allocated to the 7th place of the Bundesliga.
17
tablish FCs in the Bundesliga, often to satisfy business goals of the owners (e.g. Red Bull in
Leipzig and Volkswagen in Wolfsburg). A complete overview of all FCs’ group allocations
can be found in Table 6 on page 45.
In addition to their individual targets, the FCs can distinguish the evaluation of their
sporting performance along four time horizons, namely myo- (single matchday), micro-
(one campaign), meso- (two to three campaigns), and macro-cycle (more than three cam-
paigns) (KELLER, 2008, p. 120). This seems reasonable considering the example of an FC
which has recently been promoted to the Bundesliga and has to balance out the long-
term goal of establishing itself in the first division (macro-cycle) with the short-term goal
of maximizing the points each matchday (myo-cycle).
Two main ingredients of an FC’s sporting success are its players and coaches. FRITZ
(2006, p. 162) investigated the influences of these two factors on sporting performance.
Amongst others, he figured out that investments in higher-quality players, which he
measured in relative team salary, significantly lead to better performance on the pitch.
Additionally, FCs benefit from a stable core team, meaning that a limited number of play-
ers, which are highly familiarized with their team-mates and the tactical formations, are
responsible for the majority of playing time. Regarding the employment of coaches, FRITZ
found similar evidence. The number of managerial dismissals is negatively correlated to
sporting success, which implicitly means that ensuring consistency by giving a coach
enough time to implement his concept should be a priority of FCs. This is in line with a
finding from AUDAS, DOBSON, AND GODDARD (2002, p. 643), who prove the same effect in the
English football leagues. They state that, while there is a higher variance in sporting per-
formance after a within-season managerial change, overall, FCs perform worse in the re-
mainder of the same season. Higher variance, therefore, explains why sometimes a man-
agerial change within the season leads to an improved sporting performance. Nonethe-
less, from a strategic point of view a within-season change is suboptimal as the sustaina-
ble long-term development of the FC suffers (KAWOHL ET AL., 2016, p. 13). Other research-
ers have examined the influence of the coach’s prior experiences on performance. DAW-
SON AND DOBSON (2002, p. 480) figured out that in the English Premier League there exists a
18
positive correlation between a coach’s career points ratio as coach and the reduction of
technical inefficiencies, which ultimately results in higher sporting performance (FRICK &
SIMMONS, 2008, p. 599).
Especially Training Clubs, but also those from the other three categories of FCs, aim to
continuously develop their players and thus benefit from either increased sporting suc-
cess or additional transfer revenues (RELVAS, LITTLEWOOD, NESTI, GILBOURNE, & RICHARDSON,
2010, p. 179). The most systematic and integrated development approach is to accompa-
ny players from early on in an FC-internal youth academy and support them in becoming
part of the professional team. Bundesliga clubs have recently intensified their efforts to
seize this opportunity by doubling their investments in young players, amateurs, and
academies from €55 million (2008/09 season) to €110 million (2015/16) (DFL, 2013, p. 23,
2017, p. 27). Not only did the investments grow in absolute terms during this period but
also in relation to the total expenses, indicating the increased importance of developing
players in-house. In 2001, the DFL, responsible for organizing and marketing the Bun-
desliga, decided that German FCs are obliged to operate youth academies in order to ob-
tain a license for playing in the Bundesliga (DFL, 2016, p. 7). The youth academies are reg-
ularly reviewed and certified by the external agency Double PASS (DFB, 2015). Eight cate-
gories are incorporated in the final score, with dimensions ranging from coaching staff to
off-pitch support and education. One of the most important criteria within this certifica-
tion process is efficiency and permeability, which amongst others measures the number
of youth players reaching the professional team and the amount of national players in the
youth teams.
2.3.3 Financial Performance
In addition to the youth academies, FCs’ financials are also under examination as part
of the DFL’s yearly licensing procedure (DFL, 2016, pp. 21–33). Financial insights are im-
portant factors for evaluating the FCs’ capabilities of maintaining the professional team
activities and, amongst others, include the analyses of income statements and balance
sheets (LITTKEMANN, OLDENBURG-TIETJEN, & HAHN, 2014). Some researchers have argued that
FCs are not mainly concerned with earning significant profits but rather with ensuring
19
constant survival by any means (e.g. ANDREWS & HARRINGTON, 2016). Generally, this survival
can be guaranteed by either operating profitably and thereby being able to react to un-
expected developments or by having an investor on board who balances out potential
losses. However, the UEFA Financial Fair Play Regulations, which are relevant for all clubs
competing in international competitions and therefore play a vital role for the majority of
Bundesliga clubs, have comprised a “break even” clause since 2014 (UEFA, 2015). This
clause “require[s] clubs to balance their spending with their revenues and restricts clubs
from accumulating debt”. Capital from owners or related parties can only limitedly com-
pensate for operating losses. Therefore, operating sustainably in financial terms is a ne-
cessity for FCs and provides them with the ability to make investments in team and infra-
structure, which ultimately improves sporting success.
Partly due to its rigorous licensing procedure, the Bundesliga is considered as one of
the most stable European football leagues in terms of financial sustainability (LITTKEMANN
ET AL., 2014, p. 1). The revenue and expenditure components of the income statement
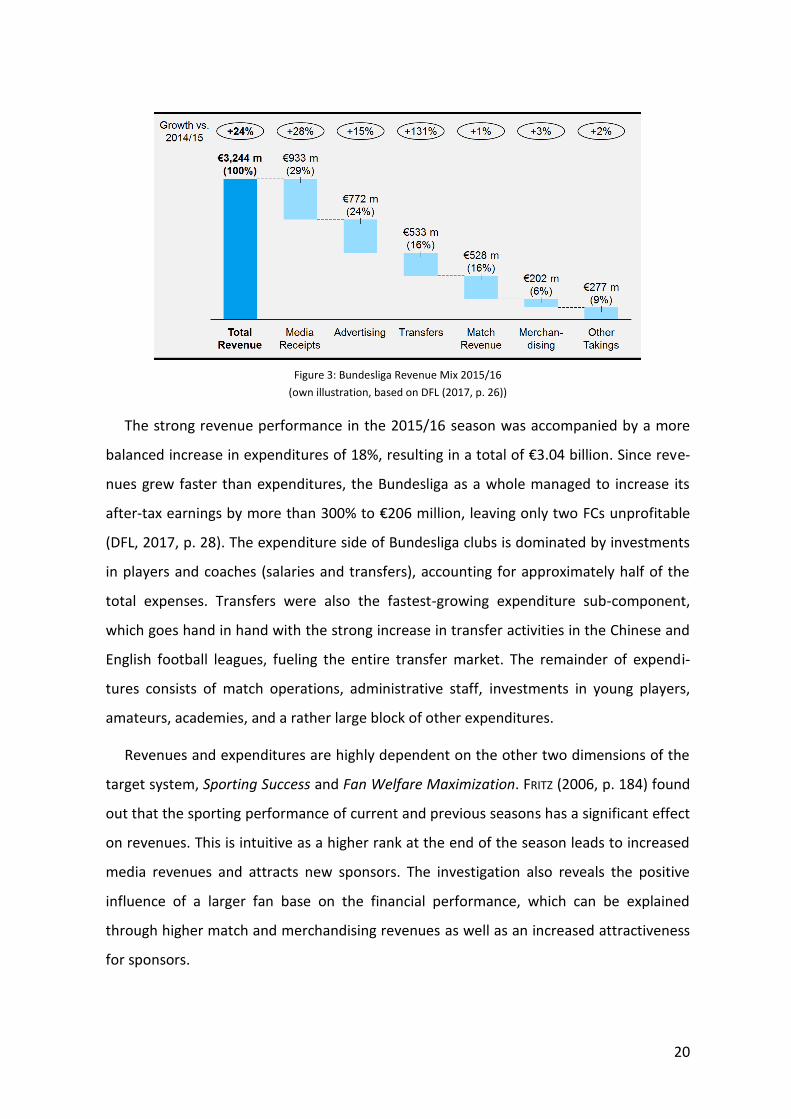
and their year-on-year development are illustrated in Figure 3 and Figure 4, respectively.
Overall, the Bundesliga clubs accumulated revenues of €3.24 billion in the 2015/16 sea-
son, which is 24% more than in the previous one. The largest and simultaneously strong-
est growing revenue contributors were those of media deals, sponsorship agreements,
and incoming transfer fees. Further major sources of FCs’ revenue streams, which showed
marginal growth compared to the 2014/15 season, were match day revenues and mer-
chandising activities.
20
Figure 3: Bundesliga Revenue Mix 2015/16
(own illustration, based on DFL (2017, p. 26))
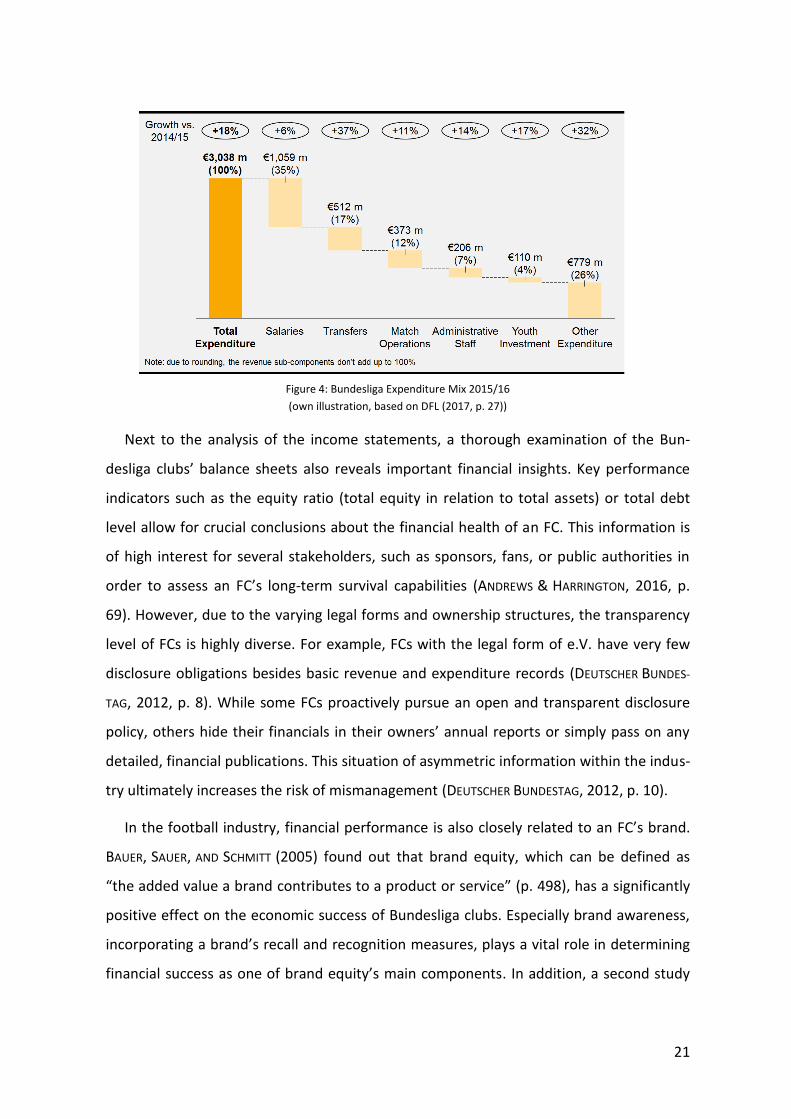
The strong revenue performance in the 2015/16 season was accompanied by a more
balanced increase in expenditures of 18%, resulting in a total of €3.04 billion. Since reve-
nues grew faster than expenditures, the Bundesliga as a whole managed to increase its
after-tax earnings by more than 300% to €206 million, leaving only two FCs unprofitable
(DFL, 2017, p. 28). The expenditure side of Bundesliga clubs is dominated by investments
in players and coaches (salaries and transfers), accounting for approximately half of the
total expenses. Transfers were also the fastest-growing expenditure sub-component,
which goes hand in hand with the strong increase in transfer activities in the Chinese and
English football leagues, fueling the entire transfer market. The remainder of expendi-
tures consists of match operations, administrative staff, investments in young players,
amateurs, academies, and a rather large block of other expenditures.
Revenues and expenditures are highly dependent on the other two dimensions of the
target system, Sporting Success and Fan Welfare Maximization. FRITZ (2006, p. 184) found
out that the sporting performance of current and previous seasons has a significant effect
on revenues. This is intuitive as a higher rank at the end of the season leads to increased
media revenues and attracts new sponsors. The investigation also reveals the positive
influence of a larger fan base on the financial performance, which can be explained
through higher match and merchandising revenues as well as an increased attractiveness
for sponsors.
21
Figure 4: Bundesliga Expenditure Mix 2015/16
(own illustration, based on DFL (2017, p. 27))
Next to the analysis of the income statements, a thorough examination of the Bun-
desliga clubs’ balance sheets also reveals important financial insights. Key performance
indicators such as the equity ratio (total equity in relation to total assets) or total debt
level allow for crucial conclusions about the financial health of an FC. This information is
of high interest for several stakeholders, such as sponsors, fans, or public authorities in
order to assess an FC’s long-term survival capabilities (ANDREWS & HARRINGTON, 2016, p.
69). However, due to the varying legal forms and ownership structures, the transparency
level of FCs is highly diverse. For example, FCs with the legal form of e.V. have very few
disclosure obligations besides basic revenue and expenditure records (DEUTSCHER BUNDES-
TAG, 2012, p. 8). While some FCs proactively pursue an open and transparent disclosure
policy, others hide their financials in their owners’ annual reports or simply pass on any
detailed, financial publications. This situation of asymmetric information within the indus-
try ultimately increases the risk of mismanagement (DEUTSCHER BUNDESTAG, 2012, p. 10).
In the football industry, financial performance is also closely related to an FC’s brand.
BAUER, SAUER, AND SCHMITT (2005) found out that brand equity, which can be defined as
“the added value a brand contributes to a product or service” (p. 498), has a significantly
positive effect on the economic success of Bundesliga clubs. Especially brand awareness,
incorporating a brand’s recall and recognition measures, plays a vital role in determining
financial success as one of brand equity’s main components. In addition, a second study
22
shows that brand equity dimensions, in this case consumers’ associations with regards to
a club (brand image), positively influence fan loyalty, an important factor of the Fan Wel-
fare Maximization dimension (BAUER, STOKBURGER-SAUER, & EXLER, 2008, p. 220). Establish-
ing, maintaining, and fostering strong, positive relationships with their fans is a crucial
challenge for FCs and can be improved by maintaining an appropriate brand image.
The topics of transparency and branding are likely to increase in the near future as FCs
strive to exploit international markets around the world. When getting involved in activi-
ties abroad, FCs aim to build up and maintain an international brand, which then can be
monetized in the form of new sponsorship deals and additional merchandising revenues
(KAWOHL ET AL., 2016, p. 20). International Players as defined in Chapter 2.3.2 have already
started to set up own offices in different parts of the world, including Borussia Dortmund
in Singapore or FC Bayern München in New York City (BORUSSIA DORTMUND, 2014; FC BAYERN
MÜNCHEN, 2014). But also smaller clubs like Eintracht Frankfurt, which recently went in a
trip to the United States, have identified the financial opportunities of an internationaliza-
tion strategy (EINTRACHT FRANKFURT, 2017). To enter new markets, KAWOHL ET AL. (2016, pp.
21–22) differentiate four approaches, which are the clubs’ physical presences in local
markets (e.g. training camps), use of digital media (e.g. English YouTube channels), coop-
eration with global sponsors (e.g. joint international events of clubs and main sponsors),
and support of youth development programs (e.g. local football schools).
2.3.4 Fan Welfare Maximization
With trends like the increased internationalization, the balancing act between com-
mercialization and satisfying traditional fans becomes an increasing challenge for FCs
(QUITZAU, 2016). So far, the Bundesliga clubs were able to maintain close ties with their
most loyal fans, the members, which is indicated by continuously increasing membership
numbers since the 1990s (PRIGGE, 2015, p. 2). The author emphasizes in his article the
special relationship between German FCs and their members. He argues that, historically,
the Bundesliga consisted solely of registered associations (e.V.), in which the members
had significant voting influence via the members’ assembly, the clubs’ central decision
bodies. In the 2016/17 season, only four FCs with the traditional form remain, whereas
23
the remainder operates under different corporation forms. However, due to the 50+1
rule, briefly described in the previous chapter, the members still have substantial influ-
ence in FCs’ decision-making processes.
Not only do the members have decision-making power, they also regularly enjoy prior-
ity access to match tickets. Consequently, many of the spectators in the stadiums are also
club members. Therefore, the general match attendance can point out the overall satis-
faction of the members with their preferred FCs. In terms of match attendance, the Bun-
desliga as a whole is considered the strongest football league worldwide (DFL, 2017, p.
48). In the 2015/16 campaign, on average, 42,421 spectators attended the Bundesliga
matches, exceeding 40,000 for the ninth consecutive time. One specific study investigates
the relationship of an FC and its fans in detail. HEIDBRINK, KOCHANEK, BRANDS, AND JENEWEIN
(2014) had a closer look at Bundesliga member Schalke 04. Interviews with both club and
management representatives were conducted and revealed that the dependence goes
both ways. On the one hand, fans feel highly emotional about their preferred FC and con-
sider it as part of their lives. On the other hand, these strong feelings and extraordinary
levels of loyalty are important drivers for the FC’s brand, which makes maintaining a sta-
ble fan base a key priority. One way to foster relationships with their fans is for FCs to
regularly communicate and interact with them.
The fans as brand assets of FCs and the members as their democratic basis require a
carefully planned communication approach to strengthen trust and loyalty levels as well
as to build up understanding for the FCs’ actions (BURK, GRIMMER, & PAWLOWSKI, 2014, p.
34). In their study, the researchers investigate the sources used by more than 11,000
members of Bundesliga club Hamburger SV to receive information. The results reveal
that, with regards to club-owned communication tools, the webpage (more than 90% of
members at least sometimes visit it) is still the most commonly used source. However,
with an increasing number of digital natives caused by demographic change in Germany,
it seems likely that in the near future social media and mobile applications (at the mo-
ment ca. 35%-40% of members use it at least sometimes) gain in importance. This argu-
ment is supported in a broad study among sport managers conducted by the SPOAC-
24
Sports Business Academy (SPOAC, 2017). The managers consider digital media, including
social networks such as Snapchat with its great reach, as by far the strongest revenue
growth segment within the next five years.
When FCs engage in social media activities, they aim to establish and maintain emo-
tional fan loyalty, which is manifested in FC-specific fan cultures and ultimately translates
into stronger brands (KAINZ, OBERLEHNER, KREY AND WERNER, 2014, p. 45). According to the
authors, four ingredients for successful social media communication can be differentiat-
ed, namely multimediality, interaction, cross-mediality, and activation. In practical terms,
this means that FCs should offer their fans exclusive content in different forms (i.e. text,
photo, video, etc.) and on multiple channels (e.g. Facebook, Instagram, Snapchat), en-
couraging them to get involved.
Aside from social media, FC managers see a lot of growth potential in digital innova-
tions along the customer journey (KAWOHL ET AL., 2016, pp. 25–30). These digital innova-
tions can range from stadium experience enhancements (e.g. free stadium WLAN for
spectators) to the introduction of entirely new fan experiences (e.g. provision of virtual
reality-enabled videos). While the aforementioned approaches are rather closely linked to
an FC’s core business, other innovations (e.g. involvement in eSports activities) are less
so. At the moment, most of the Bundesliga members are in a hesitating and observing
state with regards to digital innovativeness. However, according to the SPOAC survey
(2017, p. 14), exploiting new business areas through digital business models and new
technologies is the top requirement among sport managers in order to maintain future
viability. Therefore, it seems likely that those FCs which experiment with digital innova-
tions from early on will eventually be rewarded for those efforts.
FCs can also demonstrate innovativeness in a completely different field, which has in-
creased in importance with the ongoing commercialization of the industry. The topic of
corporate social responsibility (CSR) in modern football can be seen as a counterbalance
to the partly irrational economic and ecologic developments (LAUFMANN, 2016). LAUFMANN,
who holds the position of director of CSR as well as fan and member support at SV
Werder Bremen, created a case study about CSR at the FC, in which she quotes Klaus-
25
Dieter Fischer, initiator of many CSR activities. The club’s honorary president stated that
SV Werder Bremen’s aim is to “give something back to the region” (LAUFMANN, 2016, p.
202). MEYNHARDT AND FRANTZ (2016) demonstrate that an FC’s ability to contribute to the
public good indeed goes far beyond its sporting success. FCs can have a significant impact
on deeply-rooted regional aspects of culture and identity, as shown in their investigation
of Bundesliga member RB Leipzig. But CSR is not limited to social aspects only. Sustaina-
bility in a broader sense, including ecological and economic factors, can be covered to
holistically provide benefits for a region. The importance of this topic is unambiguous,
evidenced by the fact that first studies of the FCs’ sustainability activities have been pub-
lished, with the one from IMUG (2016), a consultancy firm for social and ecological innova-
tions, being by far the most comprehensive one. FCs benefit from CSR activities by satisfy-
ing external and internal stakeholders, which can lead to concrete implications such as
fan base increase or acquisition of new sponsors (LAUFMANN, 2016). The topic of CSR is
likely to increase in the near future as commercialization continues to dominate the Bun-
desliga.
2.3.5 Leadership and Governance
As the previous chapters have shown, the target system of FCs has become increasing-
ly sophisticated in the recent past. Finding the right balance among the three targets and
satisfying their respective stakeholders heavily depends on the leadership structures of
the FCs (KELLER, 2008, p. 315). In addition, through increases in financial resources, politi-
cal power, and public interest, the risk of agents’ opportunistic behaviors has grown, mak-
ing enhanced governance mechanisms inevitable (JUSCHUS ET AL., 2016a, p. 212).
The leadership of German FCs generally consists of an executive and a supervisory
board, which are separated bodies. In this matter, the Bundesliga clubs differ from many
European competitors (see for example FC Barcelona, Manchester United F.C., or Ju-
ventus F.C.). These clubs combine executive and supervisory functions in a combined
board of directors. Therefore, the findings of DIMITROPOULOS AND TSAGKANOS (2012), who
investigated the single-bodied boards of directors of 67 European FCs, partly concern
both executive and supervisory boards in the case of German FCs. The authors demon-
26
strate a significant positive effect of increased board size and board independence on the
financial performance of FCs. These findings, as well as the reasoning behind it, are large-
ly in line with those of the general management literature in Chapter 2.2, suggesting that
general management criteria of leadership and governance are also applicable for FCs. In
their corporate governance ranking approach of Bundesliga clubs, JUSCHUS ET AL. (2016a)
allocate the highest importance to the executive and supervisory board dimension, fur-
ther indicating the major relevance of the two leadership bodies.
Usually, executive and/or supervisory boards contain owners of the FCs, who directly
or indirectly want to keep track of the decision-making processes and have their say in
important strategic moves. In the Bundesliga, besides the registered associations and
public investors (BORUSSIA DORTMUND), three general types of owners can be differentiated
(JUSCHUS ET AL., 2016a, pp. 215, 218): private individuals (e.g. Dietmar Hopp at TSG 1899
Hoffenheim), financial investors (e.g. KKR at Hertha BSC), and strategic investors (e.g.
Adidas at FC Bayern München). These shareholder types have diverging agendas and, to
date, can’t be unambiguously assessed with regards to their performance contributions.
However, what has been proven to be a significant driver of success is the general pres-
ence of investors (BIRKHÄUSER, KASERER, & URBAN, 2015). In their study of more than 300
international FCs, the researchers find additional investor funds to positively influence
squads’ market values and ultimately overall sporting performances. This finding reso-
nates with DIMITROPOULOS AND TSAGKANOS (2012, pp. 291–292), who provide evidence that
higher managerial and institutional ownership levels are associated with better financial
performance. They reason that managers and institutions as shareholders contribute to
reductions in agency costs and enhanced decision-making processes.
The possibility of and attractiveness for external investors to acquire shares in an FC
partly depends on its legal form. As of the 2016/17 season, four legal forms, which to
some degree differ with regards to their legal obligations, are prevalent in the Bundesliga
(see LANG (2008, pp. 56–70) for a detailed discussion of the legal forms): AG (e.g. Bayern
München), e.V. (e.g. 1. FSV Mainz 05), GmbH (e.g. VfL Wolfsburg), and GmbH & Co. KGaA
(e.g. Hertha BSC). Borussia Dortmund GmbH & Co. KGaA constitutes an exception as it is
27
the only German Bundesliga club which is publicly traded. Table 6 on page 45, amongst
others, provides an overview of the legal forms of all Bundesliga members. JUSCHUS ET AL.’S
(2016b, pp. 245–247) corporate governance ranking allows for assessing the legal status
of Bundesliga clubs, including the fact whether they are publicly-listed or not, according
to their contribution to good corporate governance. It is evident that a publicly-listed
football company secures the highest level of corporate governance, which is mainly due
to high formal requirements. Excluding the case of Borussia Dortmund, the study reveals
that the legal form AG can be considered the strongest with regards to corporate govern-
ance, followed by GmbH & Co. KGaA and GmbH. The least efficient legal form is e.V.,
which can be attributed to the lack of legal obligations. While the pattern of the legal
forms’ varying capabilities to contribute to good corporate governance is evident in the
data, Bundesliga clubs can nonetheless implement high governing standards with less
efficient legal forms.
2.3.6 Intermediate Result
This chapter has derived the main dimensions, determining the success of an FC: Sport-
ing Success, Financial Performance, Fan Welfare Maximization and Leadership & Govern-
ance. Detailed insights into each of these dimensions have been provided. The variety of
factors, influencing the dimensions, turns the management of FCs into a sophisticated
challenge. Successful management means balancing the dimensions and achieving the
objectives within them.
As this study aims to establish a method for evaluating management quality, the next
chapter transfers the achieved findings into an evaluation approach, based on the theo-
retical remarks from this chapter and enriched by industry expert insights.
3 Evaluation Procedures and Data Foundation
3.1 Preliminary Remarks
Within the previous chapter of this study we have analyzed both general company
management and specific football management literature. The lessons learned from the
extensive theoretical review allowed for the creation of a preliminary evaluation frame-
28
work (see the high-level framework in Figure 2 on page 15), which served as basis for dis-
cussions with industry experts.
3.2 Validation using Expert Interviews
In order to enrich theoretical with practical insights as well as to validate the findings,
semi-structured interviews with ten industry experts were conducted from February to
March 2017. In semi-structured interviews an interview guideline with a list of questions
or topics to be covered is available, “but there is flexibility in how and when the questions
are put and how the interviewee can respond” (EDWARDS & HOLLAND, 2013, p. 29 and
BOGNER & MENZ, 2009). This interview design was beneficial for the present case as it left
space for taking into account the interviewee’s different areas of expertise and for devel-
oping new ideas. Interview partners were high-level representatives of FCs (Borussia
Dortmund, Eintracht Frankfurt, FC Bayern München, Hamburger SV, RB Leipzig), media
(11 Freunde, FINANCE) and further external stakeholders (Lagardère Sports Germany,
Puma). A detailed list of the interview partners can be found in Appendix I. The interviews
were conducted via phone in German and lasted on average 36 minutes. Interviewees
were presented with the preliminary evaluation framework and were asked to provide
feedback with regards to completeness of the model, relative importance of the four di-
mensions, and specific ideas for the measurement of sub-categories. Practitioner feed-
back was then calibrated with the existing theoretical groundwork. Ultimately, both input
sources were combined to create the final evaluation model.
3.3 Football Management Evaluation Framework (FMEF)
Figure 5 depicts the final evaluation framework, from here on referred to as Football
Management Evaluation Framework (FMEF). The FMEF consists of the four dimensions
described in Chapter 2.3, which are specified by three sub-dimensions each. The relative
importance of each dimension was determined by the average relative importance given
by all expert interviews on the one hand and the authors’ personal impression based on
the extensive literature review described in the previous chapter on the other hand. The
two factors contributed equally to the final value respectively the final score referred to
as Football Management (FoMa) Q-Score. In general, the difference between experts’ and
29
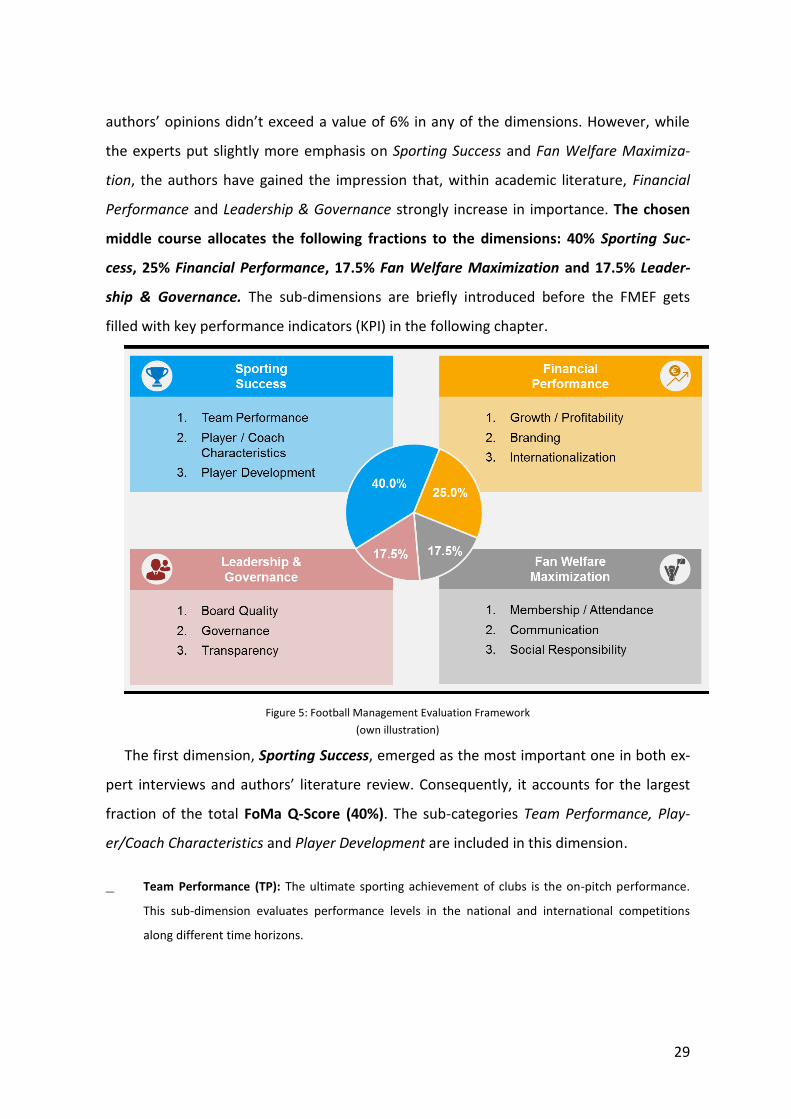
authors’ opinions didn’t exceed a value of 6% in any of the dimensions. However, while
the experts put slightly more emphasis on Sporting Success and Fan Welfare Maximiza-
tion, the authors have gained the impression that, within academic literature, Financial
Performance and Leadership & Governance strongly increase in importance. The chosen
middle course allocates the following fractions to the dimensions: 40% Sporting Suc-
cess, 25% Financial Performance, 17.5% Fan Welfare Maximization and 17.5% Leader-
ship & Governance. The sub-dimensions are briefly introduced before the FMEF gets
filled with key performance indicators (KPI) in the following chapter.
Figure 5: Football Management Evaluation Framework
(own illustration)
The first dimension, Sporting Success, emerged as the most important one in both ex-
pert interviews and authors’ literature review. Consequently, it accounts for the largest
fraction of the total FoMa Q-Score (40%). The sub-categories Team Performance, Play-
er/Coach Characteristics and Player Development are included in this dimension.
_ Team Performance (TP): The ultimate sporting achievement of clubs is the on-pitch performance.
This sub-dimension evaluates performance levels in the national and international competitions
along different time horizons.
30
_ Player/Coach Characteristics (PCC): Team performance is heavily dependent on a variety of individ-
ual characteristics. This sub-dimension looks at the player- and coach-related KPIs.
_ Player Development (PD): Refining (youth) players is an important aspect of the sport-related per-
formance of FCs and improves the future outlook. This sub-dimension assesses players’ development
opportunities within FCs.
The second dimension, Financial Performance, is worth 25% of the FoMa Q-Score and
comprises the sub-dimensions Growth/Profitability, Branding and Internationalization.
_ Growth/Profitability (GP): The majority of FCs currently find themselves between growth and har-
vest stages according to the definition in chapter 2.2. This sub-dimension takes a closer look into the
FCs’ financial information.
_ Branding (B): A strong brand is one of the keys to attract sponsors and supporters. This sub-
dimension investigates the strength of FCs’ brands.
_ Internationalization (I): The football business increasingly takes place on a global scale. This sub-
dimension examines FCs’ internationalization efforts.
The third dimension, Fan Welfare Maximization, amounts to 17.5% of the total FoMa
Q-Score. It contains the sub-categories Membership/Attendance, Communication and
Social Responsibility.
_ Membership/Attendance (MA): Fulfilling expectations and desires of their customers is of highest
importance for FCs. This sub-dimension scrutinizes fan and member metrics.
_ Communication (C): FCs can maintain and foster their fan bases by regular interaction, which in
today’s football environment can be facilitated by online technologies. This sub-dimension rates FCs’
(digital) communication efforts.
_ Social Responsibility (SR): Through their high impact on society, FCs bear high levels of responsibil-
ity. This sub-dimension measures sustainability efforts along several criteria.
The fourth dimension, Leadership & Governance, adds the remainder of 17.5% to the
total FoMa Q-Score and is formed by the sub-dimensions Board Quality, Governance and
Transparency.
31
_ Board Quality (BQ): The leadership bodies are important to calmly and consistently steer FCs and
determine their future directions. This sub-dimension assesses specific characteristics of both execu-
tive and supervisory boards.
_ Governance (G): The FCs’ governance capabilities are crucial to prevent managerial misconduct and
ensure that the FCs stick to the given rules of the game. This sub-dimension looks at the predefining
bases of governance mechanisms.
_ Transparency (T): Publicly disclosed processes and responsibilities have the ability to create trust
among stakeholders. This sub-dimension evaluates the disclosure policies of the FCs.
The FMEF aims to deliver a comprehensive view on the complex management system
of FCs. It relies on academic evidences and has been challenged and modified with the
support of industry experts. After the derivation of the FMEF including its four dimensions
and 12 sub-dimensions, the next step is to describe the methodological approach on how
to measure each sub-dimension and how this is transferred into a management quality
ranking, namely the FoMa Q-Score.
3.4 The Football Mangement (FoMa) Q-Score
3.4.1 KPI - Definition and Data Collection
In order to obtain a score for each of the FMEF’s four dimensions, the sub-dimensions
needed to be filled with measurable KPIs. The following criteria, based on GLOBERSON
(1985, p. 640) but adjusted for the specific context of this study, were applied to derive
and explain the KPIs:
1. KPIs must have a close relation to their respective dimensions.
2. KPIs must allow a direct comparison among FCs.
3. The purpose of each KPI must be clear.
4. Data sources and calculation methods of KPIs must be clearly defined.
5. Ratio-based KPIs are preferred to absolute numbers.
6. FCs’ management teams should be able to control each KPI.
7. KPIs should be derived through discussions with relevant stakeholders.
8. Objective KPIs are preferred to subjective ones.
32
Many investigations in the football environment rely on FCs which have a highly trans-
parent disclosure policy and therefore allow for a comprehensive comparison of very spe-
cific KPIs (cf. DIMITROPOULOS & TSAGKANOS (2012)). However, this approach is only suitable if
the object of investigation is rather broad and flexible, for example when analyzing the
European football market in general. In those cases, a selection of which FCs to include
and exclude can be undertaken, eliminating the problem of non-available data. Since this
working paper is concerned with the management quality of the German Bundesliga in its
entirety, the strongly varying transparency levels of FCs have to be taken into account.
The consequence is that creating a level playing field9 becomes a challenge in itself. It is
not possible to purely rely on official statements, such as annual reports or detailed press
statements. Therefore, the general aim in this study is to include a broader range of KPIs,
which can be measured for all FCs. In doing so, realistic scores can be approximated.
In total, 66 KPIs were measured in the four dimensions, with a maximum of 22 KPIs in
Fan Welfare Maximization and a minimum of seven KPIs in Leadership & Governance. Due
to the special characteristics of the scoring model, described in more detail in Chapter
3.4.2, the mere quantity of measured KPIs doesn’t influence the final results. The KPIs
were derived based on a mix of traditionally applied indicators (cf. KPMG (2017) for a se-
lection), suggestions by the industry expert interview partners, and authors’ ideas to ap-
proximate the quality of certain FCs’ management areas. All measured KPIs can be ob-
served in Table 1 to Table 4 on the following pages. The first four columns of each KPI
show the corresponding sub-dimension, an ID, a brief definition, as well as an indication
as to why a certain KPI was incorporated in the final FoMa Q-Score. Since the KPIs vary in
their importance, each of them was allocated a low, medium, or high priority (based on
the authors’ personal opinion). This allows in a subsequent step to determine different
weights for each of the priorities. It was the authors’ goal to mainly use KPIs for which a
clear preference regarding the desired outcome exists. Nonetheless, different percep-
tions may exist, making it necessary to detail the order of the KPI outcome (ascending
9 Level playing field is a philosophical approach to describe the equality of opportunity (STANFORD UNIVERSITY, 2015). In this working
paper, the level playing field notion is expanded and refers to a data base which provides data points for all FCs. Thereby, all FCs have the same opportunity to score and the results are not distorted by the absence of information.

33
[lower score preferable] or descending [higher score preferable]). Lastly, the tables state
the underlying data sources.
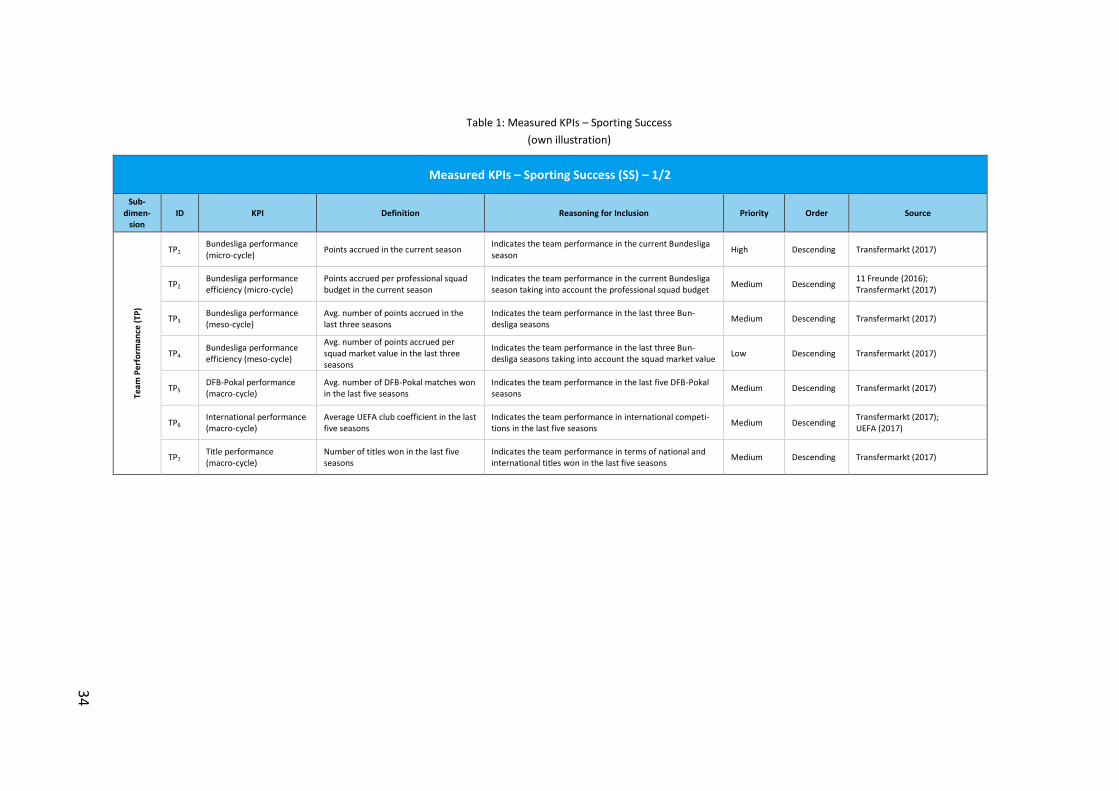
34
Table 1: Measured KPIs – Sporting Success
(own illustration)
Measured KPIs – Sporting Success (SS) – 1/2
Sub-dimen-
sion ID KPI Definition Reasoning for Inclusion Priority Order Source
Team
Pe
rfo
rman
ce (
TP)
TP1 Bundesliga performance (micro-cycle)
Points accrued in the current season Indicates the team performance in the current Bundesliga season
High Descending Transfermarkt (2017)
TP2 Bundesliga performance efficiency (micro-cycle)
Points accrued per professional squad budget in the current season
Indicates the team performance in the current Bundesliga season taking into account the professional squad budget
Medium Descending 11 Freunde (2016); Transfermarkt (2017)
TP3 Bundesliga performance (meso-cycle)
Avg. number of points accrued in the last three seasons
Indicates the team performance in the last three Bun-desliga seasons
Medium Descending Transfermarkt (2017)
TP4 Bundesliga performance efficiency (meso-cycle)
Avg. number of points accrued per squad market value in the last three seasons
Indicates the team performance in the last three Bun-desliga seasons taking into account the squad market value
Low Descending Transfermarkt (2017)
TP5 DFB-Pokal performance (macro-cycle)
Avg. number of DFB-Pokal matches won in the last five seasons
Indicates the team performance in the last five DFB-Pokal seasons
Medium Descending Transfermarkt (2017)
TP6 International performance (macro-cycle)
Average UEFA club coefficient in the last five seasons
Indicates the team performance in international competi-tions in the last five seasons
Medium Descending Transfermarkt (2017); UEFA (2017)
TP7 Title performance (macro-cycle)
Number of titles won in the last five seasons
Indicates the team performance in terms of national and international titles won in the last five seasons
Medium Descending Transfermarkt (2017)
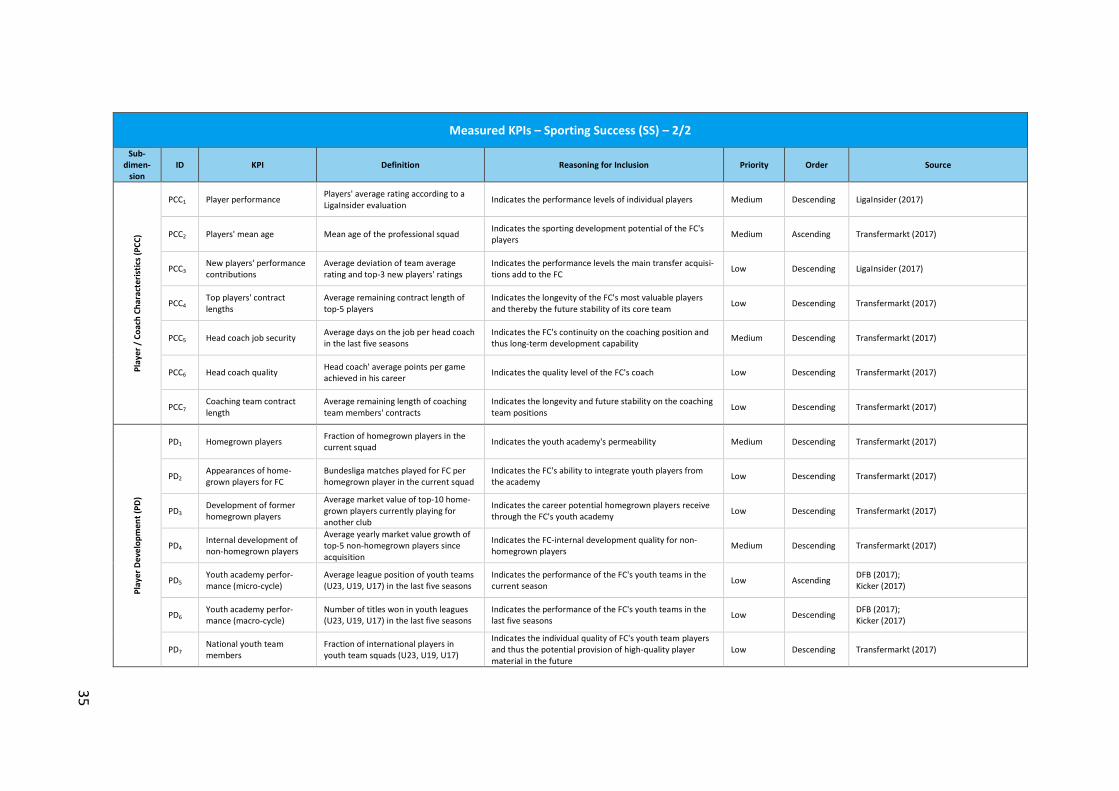
35
Measured KPIs – Sporting Success (SS) – 2/2
Sub-dimen-
sion ID KPI Definition Reasoning for Inclusion Priority Order Source
Pla
yer
/ C
oac
h C
har
acte
rist
ics
(PC
C)
PCC1 Player performance Players' average rating according to a LigaInsider evaluation
Indicates the performance levels of individual players Medium Descending LigaInsider (2017)
PCC2 Players' mean age Mean age of the professional squad Indicates the sporting development potential of the FC's players
Medium Ascending Transfermarkt (2017)
PCC3 New players' performance contributions
Average deviation of team average rating and top-3 new players' ratings
Indicates the performance levels the main transfer acquisi-tions add to the FC
Low Descending LigaInsider (2017)
PCC4 Top players' contract lengths
Average remaining contract length of top-5 players
Indicates the longevity of the FC's most valuable players and thereby the future stability of its core team
Low Descending Transfermarkt (2017)
PCC5 Head coach job security Average days on the job per head coach in the last five seasons
Indicates the FC's continuity on the coaching position and thus long-term development capability
Medium Descending Transfermarkt (2017)
PCC6 Head coach quality Head coach' average points per game achieved in his career
Indicates the quality level of the FC's coach Low Descending Transfermarkt (2017)
PCC7 Coaching team contract length
Average remaining length of coaching team members' contracts
Indicates the longevity and future stability on the coaching team positions
Low Descending Transfermarkt (2017)
Pla
yer
Dev
elo
pm
ent
(PD
)
PD1 Homegrown players Fraction of homegrown players in the current squad
Indicates the youth academy's permeability Medium Descending Transfermarkt (2017)
PD2 Appearances of home-grown players for FC
Bundesliga matches played for FC per homegrown player in the current squad
Indicates the FC's ability to integrate youth players from the academy
Low Descending Transfermarkt (2017)
PD3 Development of former homegrown players
Average market value of top-10 home-grown players currently playing for another club
Indicates the career potential homegrown players receive through the FC's youth academy
Low Descending Transfermarkt (2017)
PD4 Internal development of non-homegrown players
Average yearly market value growth of top-5 non-homegrown players since acquisition
Indicates the FC-internal development quality for non-homegrown players
Medium Descending Transfermarkt (2017)
PD5 Youth academy perfor-mance (micro-cycle)
Average league position of youth teams (U23, U19, U17) in the last five seasons
Indicates the performance of the FC's youth teams in the current season
Low Ascending DFB (2017); Kicker (2017)
PD6 Youth academy perfor-mance (macro-cycle)
Number of titles won in youth leagues (U23, U19, U17) in the last five seasons
Indicates the performance of the FC's youth teams in the last five seasons
Low Descending DFB (2017); Kicker (2017)
PD7 National youth team members
Fraction of international players in youth team squads (U23, U19, U17)
Indicates the individual quality of FC's youth team players and thus the potential provision of high-quality player material in the future
Low Descending Transfermarkt (2017)
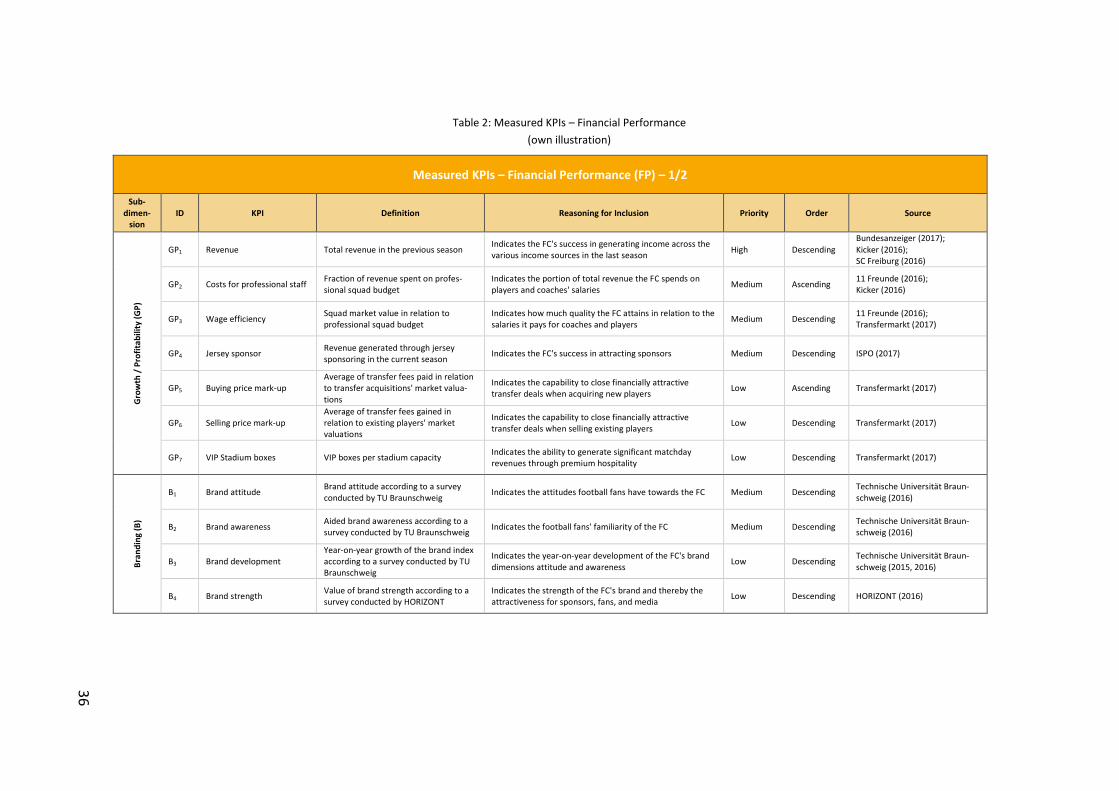
36
Table 2: Measured KPIs – Financial Performance
(own illustration)
Measured KPIs – Financial Performance (FP) – 1/2
Sub-dimen-
sion ID KPI Definition Reasoning for Inclusion Priority Order Source
Gro
wth
/ P
rofi
tab
ility
(G
P)
GP1 Revenue Total revenue in the previous season Indicates the FC's success in generating income across the various income sources in the last season
High Descending Bundesanzeiger (2017); Kicker (2016); SC Freiburg (2016)
GP2 Costs for professional staff Fraction of revenue spent on profes-sional squad budget
Indicates the portion of total revenue the FC spends on players and coaches' salaries
Medium Ascending 11 Freunde (2016); Kicker (2016)
GP3 Wage efficiency Squad market value in relation to professional squad budget
Indicates how much quality the FC attains in relation to the salaries it pays for coaches and players
Medium Descending 11 Freunde (2016); Transfermarkt (2017)
GP4 Jersey sponsor Revenue generated through jersey sponsoring in the current season
Indicates the FC's success in attracting sponsors Medium Descending ISPO (2017)
GP5 Buying price mark-up Average of transfer fees paid in relation to transfer acquisitions' market valua-tions
Indicates the capability to close financially attractive transfer deals when acquiring new players
Low Ascending Transfermarkt (2017)
GP6 Selling price mark-up Average of transfer fees gained in relation to existing players' market valuations
Indicates the capability to close financially attractive transfer deals when selling existing players
Low Descending Transfermarkt (2017)
GP7 VIP Stadium boxes VIP boxes per stadium capacity Indicates the ability to generate significant matchday revenues through premium hospitality
Low Descending Transfermarkt (2017)
Bra
nd
ing
(B)
B1 Brand attitude Brand attitude according to a survey conducted by TU Braunschweig
Indicates the attitudes football fans have towards the FC Medium Descending Technische Universität Braun-schweig (2016)
B2 Brand awareness Aided brand awareness according to a survey conducted by TU Braunschweig
Indicates the football fans' familiarity of the FC Medium Descending Technische Universität Braun-schweig (2016)
B3 Brand development Year-on-year growth of the brand index according to a survey conducted by TU Braunschweig
Indicates the year-on-year development of the FC's brand dimensions attitude and awareness
Low Descending Technische Universität Braun-schweig (2015, 2016)
B4 Brand strength Value of brand strength according to a survey conducted by HORIZONT
Indicates the strength of the FC's brand and thereby the attractiveness for sponsors, fans, and media
Low Descending HORIZONT (2016)
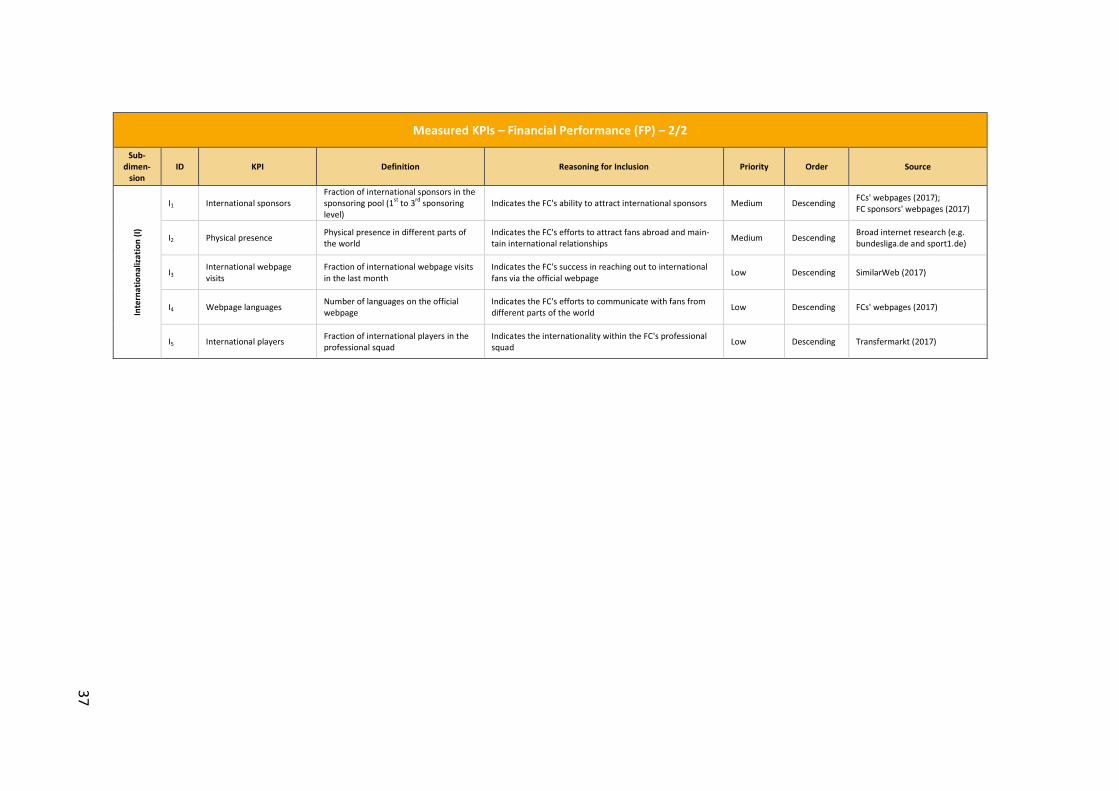
37
Measured KPIs – Financial Performance (FP) – 2/2
Sub-dimen-
sion ID KPI Definition Reasoning for Inclusion Priority Order Source
Inte
rna
tio
nal
izat
ion
(I)
I1 International sponsors Fraction of international sponsors in the sponsoring pool (1
st to 3
rd sponsoring
level) Indicates the FC's ability to attract international sponsors Medium Descending
FCs' webpages (2017); FC sponsors' webpages (2017)
I2 Physical presence Physical presence in different parts of the world
Indicates the FC's efforts to attract fans abroad and main-tain international relationships
Medium Descending Broad internet research (e.g. bundesliga.de and sport1.de)
I3 International webpage visits
Fraction of international webpage visits in the last month
Indicates the FC's success in reaching out to international fans via the official webpage
Low Descending SimilarWeb (2017)
I4 Webpage languages Number of languages on the official webpage
Indicates the FC's efforts to communicate with fans from different parts of the world
Low Descending FCs' webpages (2017)
I5 International players Fraction of international players in the professional squad
Indicates the internationality within the FC's professional squad
Low Descending Transfermarkt (2017)
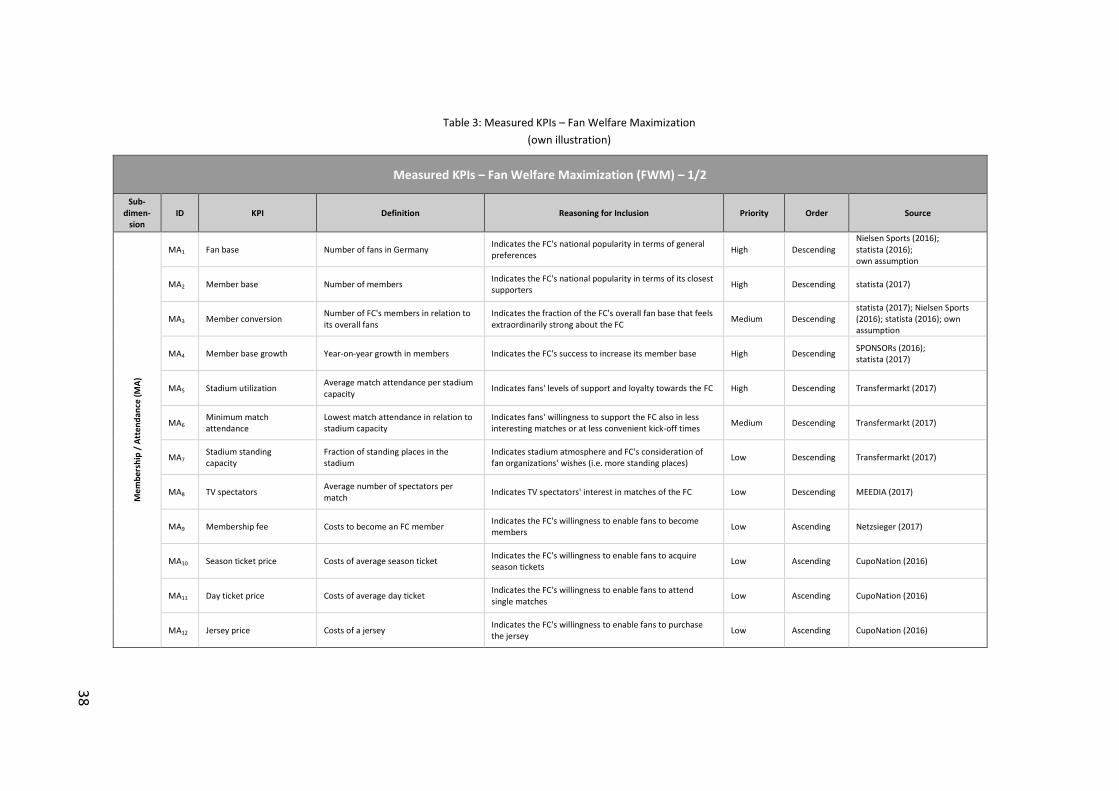
38
Table 3: Measured KPIs – Fan Welfare Maximization
(own illustration)
Measured KPIs – Fan Welfare Maximization (FWM) – 1/2
Sub-dimen-
sion ID KPI Definition Reasoning for Inclusion Priority Order Source
Mem
be
rsh
ip /
Att
end
ance
(M
A)
MA1 Fan base Number of fans in Germany Indicates the FC's national popularity in terms of general preferences
High Descending Nielsen Sports (2016); statista (2016); own assumption
MA2 Member base Number of members Indicates the FC's national popularity in terms of its closest supporters
High Descending statista (2017)
MA3 Member conversion Number of FC's members in relation to its overall fans
Indicates the fraction of the FC's overall fan base that feels extraordinarily strong about the FC
Medium Descending statista (2017); Nielsen Sports (2016); statista (2016); own assumption
MA4 Member base growth Year-on-year growth in members Indicates the FC's success to increase its member base High Descending SPONSORs (2016); statista (2017)
MA5 Stadium utilization Average match attendance per stadium capacity
Indicates fans' levels of support and loyalty towards the FC High Descending Transfermarkt (2017)
MA6 Minimum match attendance
Lowest match attendance in relation to stadium capacity
Indicates fans' willingness to support the FC also in less interesting matches or at less convenient kick-off times
Medium Descending Transfermarkt (2017)
MA7 Stadium standing capacity
Fraction of standing places in the stadium
Indicates stadium atmosphere and FC's consideration of fan organizations' wishes (i.e. more standing places)
Low Descending Transfermarkt (2017)
MA8 TV spectators Average number of spectators per match
Indicates TV spectators' interest in matches of the FC Low Descending MEEDIA (2017)
MA9 Membership fee Costs to become an FC member Indicates the FC's willingness to enable fans to become members
Low Ascending Netzsieger (2017)
MA10 Season ticket price Costs of average season ticket Indicates the FC's willingness to enable fans to acquire season tickets
Low Ascending CupoNation (2016)
MA11 Day ticket price Costs of average day ticket Indicates the FC's willingness to enable fans to attend single matches
Low Ascending CupoNation (2016)
MA12 Jersey price Costs of a jersey Indicates the FC's willingness to enable fans to purchase the jersey
Low Ascending CupoNation (2016)
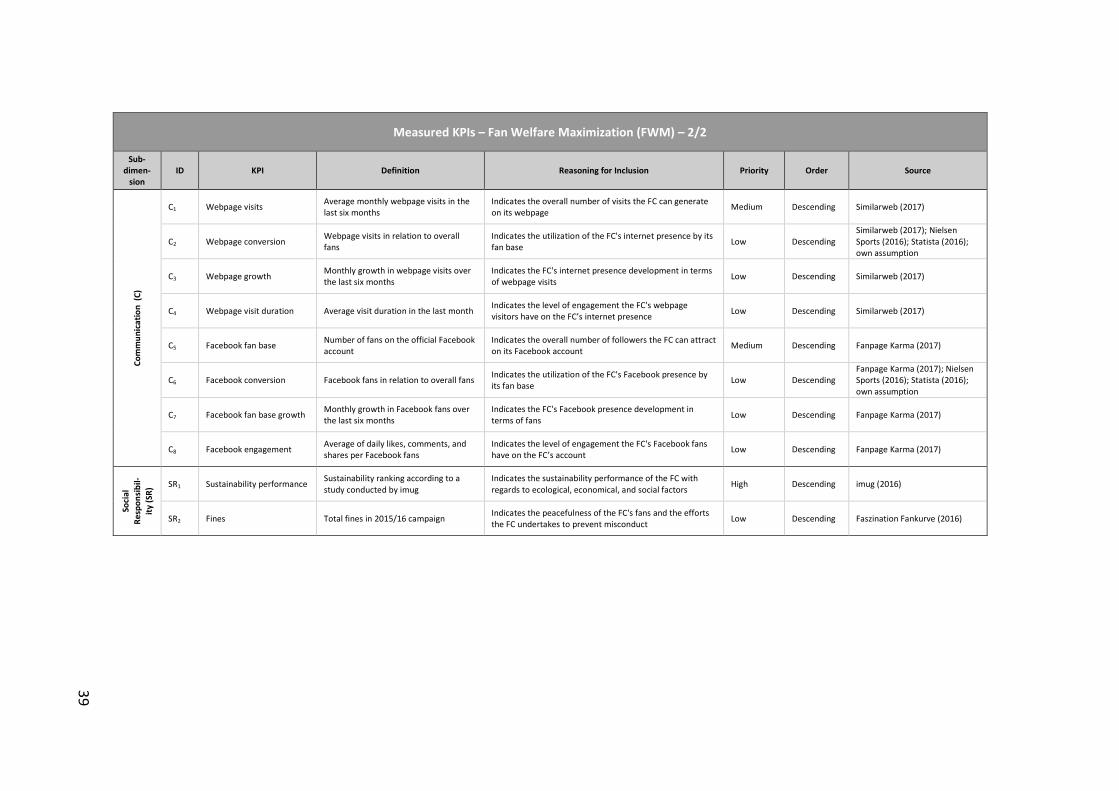
39
Measured KPIs – Fan Welfare Maximization (FWM) – 2/2
Sub-dimen-
sion ID KPI Definition Reasoning for Inclusion Priority Order Source
Co
mm
un
icat
ion
(C
)
C1 Webpage visits Average monthly webpage visits in the last six months
Indicates the overall number of visits the FC can generate on its webpage
Medium Descending Similarweb (2017)
C2 Webpage conversion Webpage visits in relation to overall fans
Indicates the utilization of the FC's internet presence by its fan base
Low Descending Similarweb (2017); Nielsen Sports (2016); Statista (2016); own assumption
C3 Webpage growth Monthly growth in webpage visits over the last six months
Indicates the FC's internet presence development in terms of webpage visits
Low Descending Similarweb (2017)
C4 Webpage visit duration Average visit duration in the last month Indicates the level of engagement the FC's webpage visitors have on the FC’s internet presence
Low Descending Similarweb (2017)
C5 Facebook fan base Number of fans on the official Facebook account
Indicates the overall number of followers the FC can attract on its Facebook account
Medium Descending Fanpage Karma (2017)
C6 Facebook conversion Facebook fans in relation to overall fans Indicates the utilization of the FC's Facebook presence by its fan base
Low Descending Fanpage Karma (2017); Nielsen Sports (2016); Statista (2016); own assumption
C7 Facebook fan base growth Monthly growth in Facebook fans over the last six months
Indicates the FC's Facebook presence development in terms of fans
Low Descending Fanpage Karma (2017)
C8 Facebook engagement Average of daily likes, comments, and shares per Facebook fans
Indicates the level of engagement the FC's Facebook fans have on the FC’s account
Low Descending Fanpage Karma (2017)
Soci
al
Res
po
nsi
bil-
ity
(SR
) SR1 Sustainability performance Sustainability ranking according to a study conducted by imug
Indicates the sustainability performance of the FC with regards to ecological, economical, and social factors
High Descending imug (2016)
SR2 Fines Total fines in 2015/16 campaign Indicates the peacefulness of the FC's fans and the efforts the FC undertakes to prevent misconduct
Low Descending Faszination Fankurve (2016)
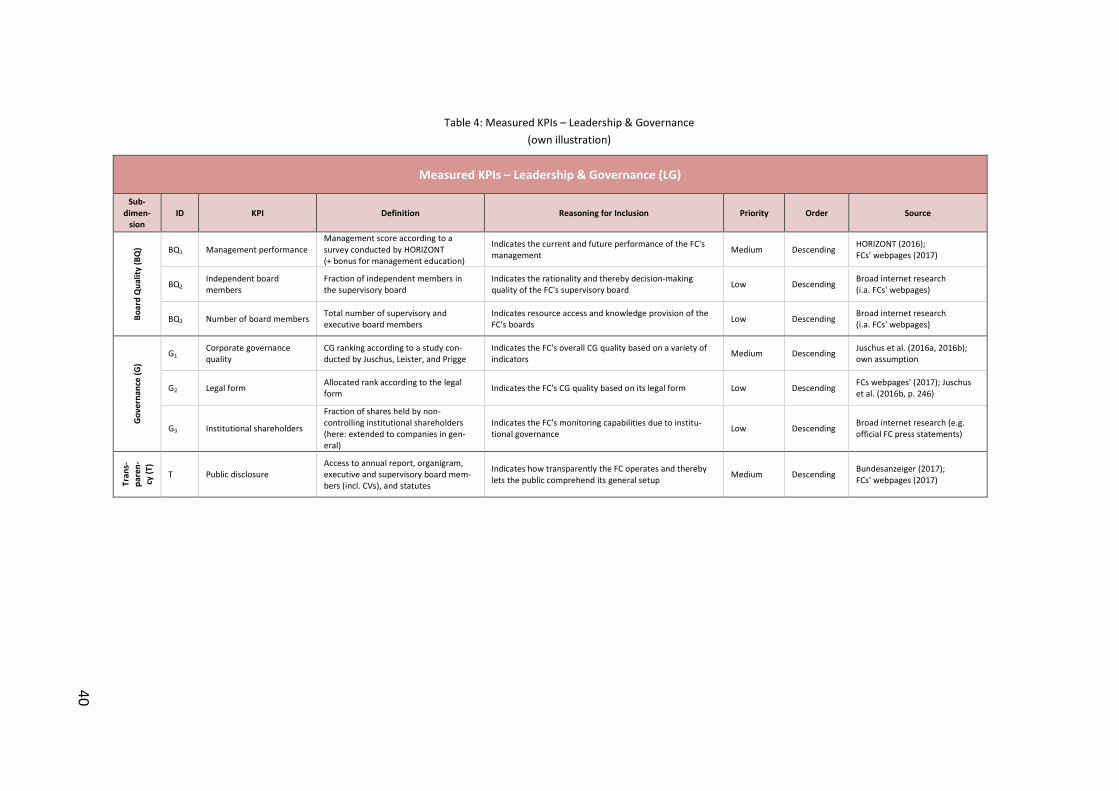
40
Table 4: Measured KPIs – Leadership & Governance
(own illustration)
Measured KPIs – Leadership & Governance (LG)
Sub-dimen-
sion ID KPI Definition Reasoning for Inclusion Priority Order Source
Bo
ard
Qu
alit
y (B
Q) BQ1 Management performance
Management score according to a survey conducted by HORIZONT (+ bonus for management education)
Indicates the current and future performance of the FC's management
Medium Descending HORIZONT (2016); FCs' webpages (2017)
BQ2 Independent board members
Fraction of independent members in the supervisory board
Indicates the rationality and thereby decision-making quality of the FC's supervisory board
Low Descending Broad internet research (i.a. FCs' webpages)
BQ3 Number of board members Total number of supervisory and executive board members
Indicates resource access and knowledge provision of the FC's boards
Low Descending Broad internet research (i.a. FCs' webpages)
Go
vern
ance
(G
)
G1 Corporate governance quality
CG ranking according to a study con-ducted by Juschus, Leister, and Prigge
Indicates the FC's overall CG quality based on a variety of indicators
Medium Descending Juschus et al. (2016a, 2016b); own assumption
G2 Legal form Allocated rank according to the legal form
Indicates the FC's CG quality based on its legal form Low Descending FCs webpages' (2017); Juschus et al. (2016b, p. 246)
G3 Institutional shareholders
Fraction of shares held by non-controlling institutional shareholders (here: extended to companies in gen-eral)
Indicates the FC's monitoring capabilities due to institu-tional governance
Low Descending Broad internet research (e.g. official FC press statements)
Tran
s-
par
en-
cy (
T)
T Public disclosure Access to annual report, organigram, executive and supervisory board mem-bers (incl. CVs), and statutes
Indicates how transparently the FC operates and thereby lets the public comprehend its general setup
Medium Descending Bundesanzeiger (2017); FCs' webpages (2017)
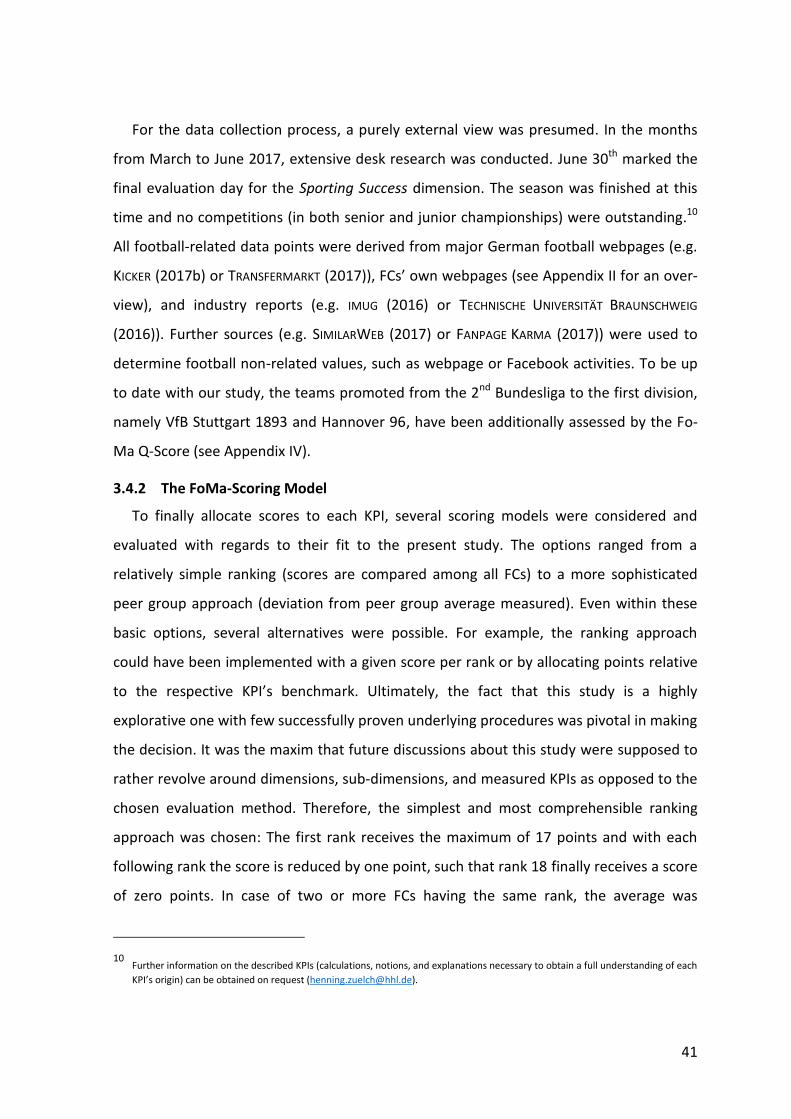
41
For the data collection process, a purely external view was presumed. In the months
from March to June 2017, extensive desk research was conducted. June 30th marked the
final evaluation day for the Sporting Success dimension. The season was finished at this
time and no competitions (in both senior and junior championships) were outstanding.10
All football-related data points were derived from major German football webpages (e.g.
KICKER (2017b) or TRANSFERMARKT (2017)), FCs’ own webpages (see Appendix II for an over-
view), and industry reports (e.g. IMUG (2016) or TECHNISCHE UNIVERSITÄT BRAUNSCHWEIG
(2016)). Further sources (e.g. SIMILARWEB (2017) or FANPAGE KARMA (2017)) were used to
determine football non-related values, such as webpage or Facebook activities. To be up
to date with our study, the teams promoted from the 2nd Bundesliga to the first division,
namely VfB Stuttgart 1893 and Hannover 96, have been additionally assessed by the Fo-
Ma Q-Score (see Appendix IV).
3.4.2 The FoMa-Scoring Model
To finally allocate scores to each KPI, several scoring models were considered and
evaluated with regards to their fit to the present study. The options ranged from a
relatively simple ranking (scores are compared among all FCs) to a more sophisticated
peer group approach (deviation from peer group average measured). Even within these
basic options, several alternatives were possible. For example, the ranking approach
could have been implemented with a given score per rank or by allocating points relative
to the respective KPI’s benchmark. Ultimately, the fact that this study is a highly
explorative one with few successfully proven underlying procedures was pivotal in making
the decision. It was the maxim that future discussions about this study were supposed to
rather revolve around dimensions, sub-dimensions, and measured KPIs as opposed to the
chosen evaluation method. Therefore, the simplest and most comprehensible ranking
approach was chosen: The first rank receives the maximum of 17 points and with each
following rank the score is reduced by one point, such that rank 18 finally receives a score
of zero points. In case of two or more FCs having the same rank, the average was
10 Further information on the described KPIs (calculations, notions, and explanations necessary to obtain a full understanding of each
KPI’s origin) can be obtained on request ([email protected]).
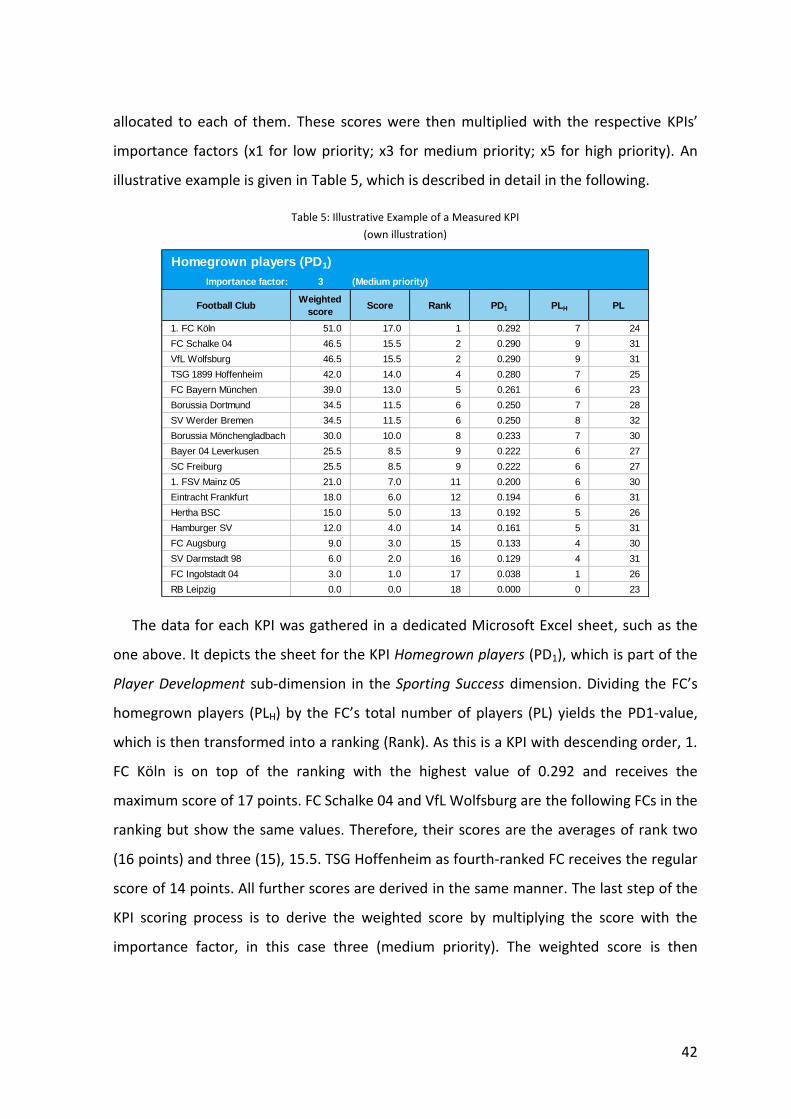
42
allocated to each of them. These scores were then multiplied with the respective KPIs’
importance factors (x1 for low priority; x3 for medium priority; x5 for high priority). An
illustrative example is given in Table 5, which is described in detail in the following.
Table 5: Illustrative Example of a Measured KPI
(own illustration)
The data for each KPI was gathered in a dedicated Microsoft Excel sheet, such as the
one above. It depicts the sheet for the KPI Homegrown players (PD1), which is part of the
Player Development sub-dimension in the Sporting Success dimension. Dividing the FC’s
homegrown players (PLH) by the FC’s total number of players (PL) yields the PD1-value,
which is then transformed into a ranking (Rank). As this is a KPI with descending order, 1.
FC Köln is on top of the ranking with the highest value of 0.292 and receives the
maximum score of 17 points. FC Schalke 04 and VfL Wolfsburg are the following FCs in the
ranking but show the same values. Therefore, their scores are the averages of rank two
(16 points) and three (15), 15.5. TSG Hoffenheim as fourth-ranked FC receives the regular
score of 14 points. All further scores are derived in the same manner. The last step of the
KPI scoring process is to derive the weighted score by multiplying the score with the
importance factor, in this case three (medium priority). The weighted score is then
Homegrown players (PD1)
Importance factor: 3 (Medium priority)
Football ClubWeighted
scoreScore Rank PD1 PLH PL
1. FC Köln 51.0 17.0 1 0.292 7 24
FC Schalke 04 46.5 15.5 2 0.290 9 31
VfL Wolfsburg 46.5 15.5 2 0.290 9 31
TSG 1899 Hoffenheim 42.0 14.0 4 0.280 7 25
FC Bayern München 39.0 13.0 5 0.261 6 23
Borussia Dortmund 34.5 11.5 6 0.250 7 28
SV Werder Bremen 34.5 11.5 6 0.250 8 32
Borussia Mönchengladbach 30.0 10.0 8 0.233 7 30
Bayer 04 Leverkusen 25.5 8.5 9 0.222 6 27
SC Freiburg 25.5 8.5 9 0.222 6 27
1. FSV Mainz 05 21.0 7.0 11 0.200 6 30
Eintracht Frankfurt 18.0 6.0 12 0.194 6 31
Hertha BSC 15.0 5.0 13 0.192 5 26
Hamburger SV 12.0 4.0 14 0.161 5 31
FC Augsburg 9.0 3.0 15 0.133 4 30
SV Darmstadt 98 6.0 2.0 16 0.129 4 31
FC Ingolstadt 04 3.0 1.0 17 0.038 1 26
RB Leipzig 0.0 0.0 18 0.000 0 23
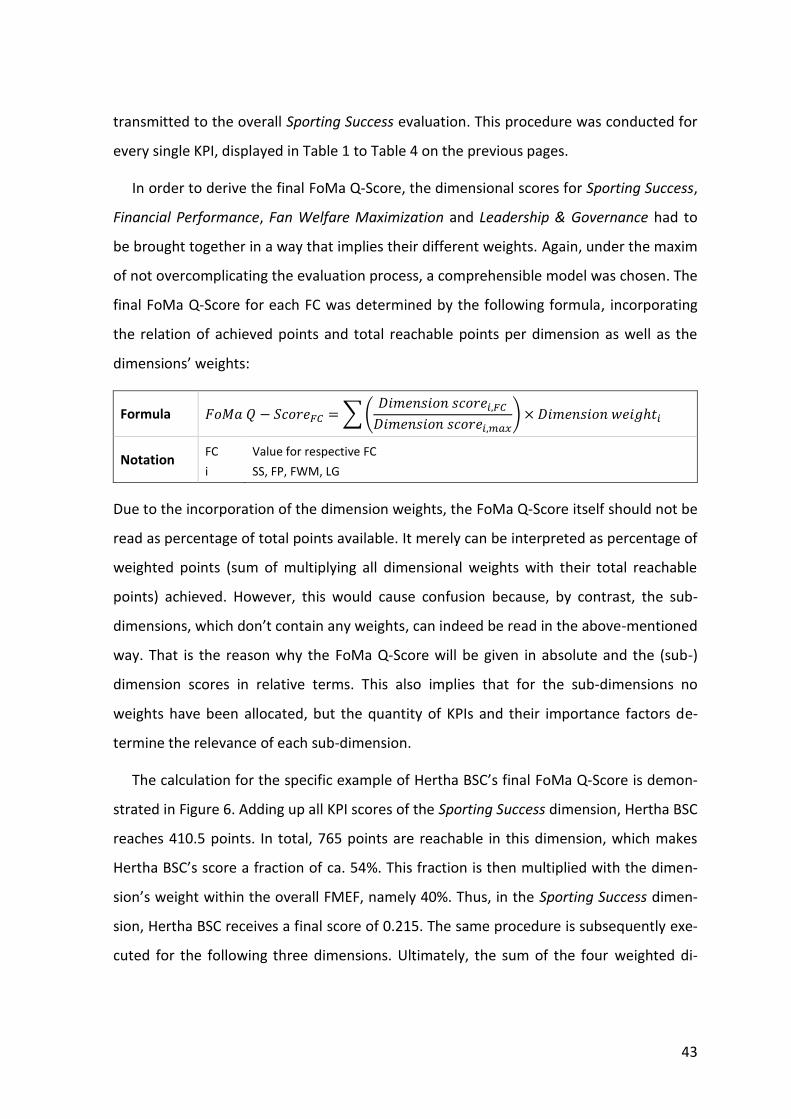
43
transmitted to the overall Sporting Success evaluation. This procedure was conducted for
every single KPI, displayed in Table 1 to Table 4 on the previous pages.
In order to derive the final FoMa Q-Score, the dimensional scores for Sporting Success,
Financial Performance, Fan Welfare Maximization and Leadership & Governance had to
be brought together in a way that implies their different weights. Again, under the maxim
of not overcomplicating the evaluation process, a comprehensible model was chosen. The
final FoMa Q-Score for each FC was determined by the following formula, incorporating
the relation of achieved points and total reachable points per dimension as well as the
dimensions’ weights:
Formula 𝐹𝑜𝑀𝑎 𝑄 − 𝑆𝑐𝑜𝑟𝑒𝐹𝐶 = ∑ (𝐷𝑖𝑚𝑒𝑛𝑠𝑖𝑜𝑛 𝑠𝑐𝑜𝑟𝑒𝑖,𝐹𝐶
𝐷𝑖𝑚𝑒𝑛𝑠𝑖𝑜𝑛 𝑠𝑐𝑜𝑟𝑒𝑖,𝑚𝑎𝑥) × 𝐷𝑖𝑚𝑒𝑛𝑠𝑖𝑜𝑛 𝑤𝑒𝑖𝑔ℎ𝑡𝑖
Notation FC
i
Value for respective FC
SS, FP, FWM, LG
Due to the incorporation of the dimension weights, the FoMa Q-Score itself should not be
read as percentage of total points available. It merely can be interpreted as percentage of
weighted points (sum of multiplying all dimensional weights with their total reachable
points) achieved. However, this would cause confusion because, by contrast, the sub-
dimensions, which don’t contain any weights, can indeed be read in the above-mentioned
way. That is the reason why the FoMa Q-Score will be given in absolute and the (sub-)
dimension scores in relative terms. This also implies that for the sub-dimensions no
weights have been allocated, but the quantity of KPIs and their importance factors de-
termine the relevance of each sub-dimension.
The calculation for the specific example of Hertha BSC’s final FoMa Q-Score is demon-
strated in Figure 6. Adding up all KPI scores of the Sporting Success dimension, Hertha BSC
reaches 410.5 points. In total, 765 points are reachable in this dimension, which makes
Hertha BSC’s score a fraction of ca. 54%. This fraction is then multiplied with the dimen-
sion’s weight within the overall FMEF, namely 40%. Thus, in the Sporting Success dimen-
sion, Hertha BSC receives a final score of 0.215. The same procedure is subsequently exe-
cuted for the following three dimensions. Ultimately, the sum of the four weighted di-
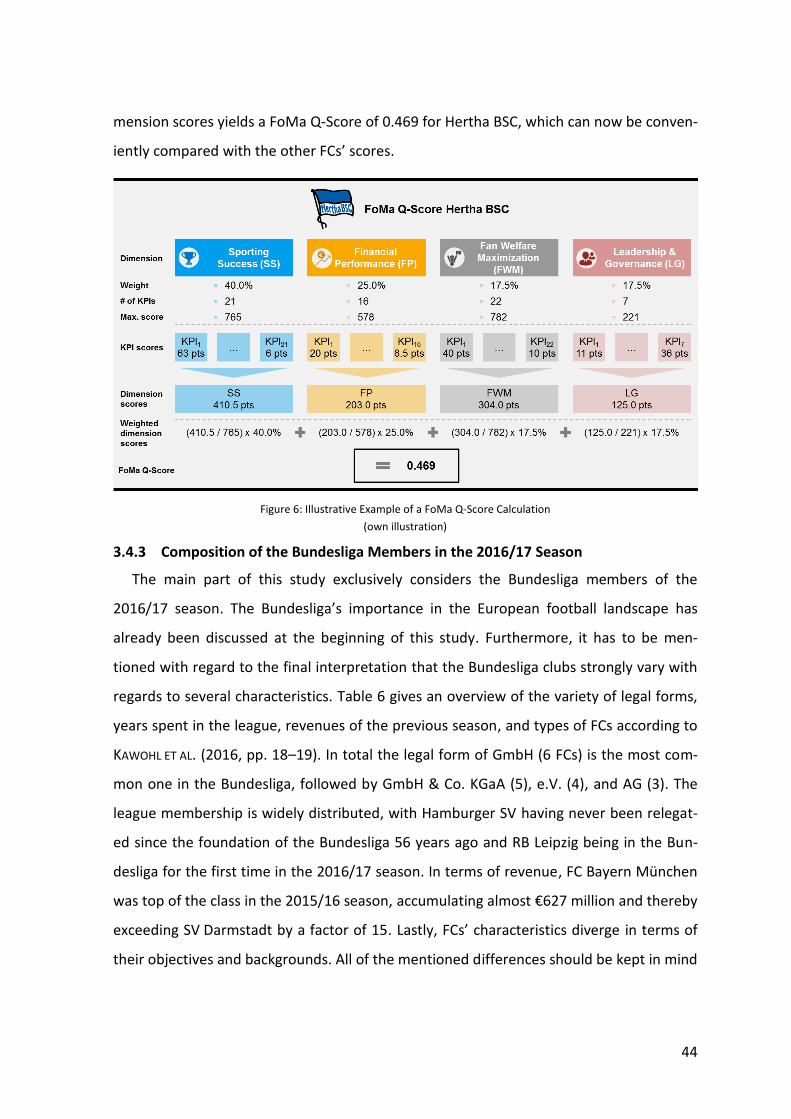
44
mension scores yields a FoMa Q-Score of 0.469 for Hertha BSC, which can now be conven-
iently compared with the other FCs’ scores.
Figure 6: Illustrative Example of a FoMa Q-Score Calculation
(own illustration)
3.4.3 Composition of the Bundesliga Members in the 2016/17 Season
The main part of this study exclusively considers the Bundesliga members of the
2016/17 season. The Bundesliga’s importance in the European football landscape has
already been discussed at the beginning of this study. Furthermore, it has to be men-
tioned with regard to the final interpretation that the Bundesliga clubs strongly vary with
regards to several characteristics. Table 6 gives an overview of the variety of legal forms,
years spent in the league, revenues of the previous season, and types of FCs according to
KAWOHL ET AL. (2016, pp. 18–19). In total the legal form of GmbH (6 FCs) is the most com-
mon one in the Bundesliga, followed by GmbH & Co. KGaA (5), e.V. (4), and AG (3). The
league membership is widely distributed, with Hamburger SV having never been relegat-
ed since the foundation of the Bundesliga 56 years ago and RB Leipzig being in the Bun-
desliga for the first time in the 2016/17 season. In terms of revenue, FC Bayern München
was top of the class in the 2015/16 season, accumulating almost €627 million and thereby
exceeding SV Darmstadt by a factor of 15. Lastly, FCs’ characteristics diverge in terms of
their objectives and backgrounds. All of the mentioned differences should be kept in mind
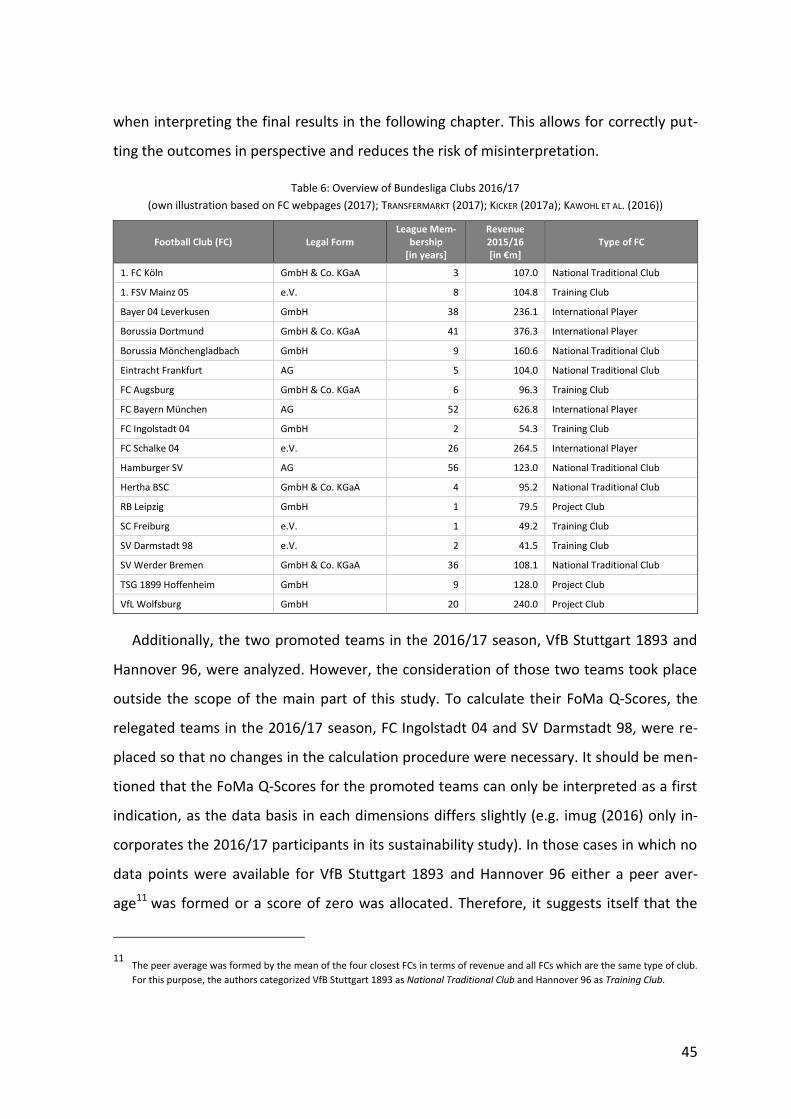
45
when interpreting the final results in the following chapter. This allows for correctly put-
ting the outcomes in perspective and reduces the risk of misinterpretation.
Table 6: Overview of Bundesliga Clubs 2016/17
(own illustration based on FC webpages (2017); TRANSFERMARKT (2017); KICKER (2017a); KAWOHL ET AL. (2016))
Football Club (FC) Legal Form League Mem-
bership [in years]
Revenue 2015/16 [in €m]
Type of FC
1. FC Köln GmbH & Co. KGaA 3 107.0 National Traditional Club
1. FSV Mainz 05 e.V. 8 104.8 Training Club
Bayer 04 Leverkusen GmbH 38 236.1 International Player
Borussia Dortmund GmbH & Co. KGaA 41 376.3 International Player
Borussia Mönchengladbach GmbH 9 160.6 National Traditional Club
Eintracht Frankfurt AG 5 104.0 National Traditional Club
FC Augsburg GmbH & Co. KGaA 6 96.3 Training Club
FC Bayern München AG 52 626.8 International Player
FC Ingolstadt 04 GmbH 2 54.3 Training Club
FC Schalke 04 e.V. 26 264.5 International Player
Hamburger SV AG 56 123.0 National Traditional Club
Hertha BSC GmbH & Co. KGaA 4 95.2 National Traditional Club
RB Leipzig GmbH 1 79.5 Project Club
SC Freiburg e.V. 1 49.2 Training Club
SV Darmstadt 98 e.V. 2 41.5 Training Club
SV Werder Bremen GmbH & Co. KGaA 36 108.1 National Traditional Club
TSG 1899 Hoffenheim GmbH 9 128.0 Project Club
VfL Wolfsburg GmbH 20 240.0 Project Club
Additionally, the two promoted teams in the 2016/17 season, VfB Stuttgart 1893 and
Hannover 96, were analyzed. However, the consideration of those two teams took place
outside the scope of the main part of this study. To calculate their FoMa Q-Scores, the
relegated teams in the 2016/17 season, FC Ingolstadt 04 and SV Darmstadt 98, were re-
placed so that no changes in the calculation procedure were necessary. It should be men-
tioned that the FoMa Q-Scores for the promoted teams can only be interpreted as a first
indication, as the data basis in each dimensions differs slightly (e.g. imug (2016) only in-
corporates the 2016/17 participants in its sustainability study). In those cases in which no
data points were available for VfB Stuttgart 1893 and Hannover 96 either a peer aver-
age11 was formed or a score of zero was allocated. Therefore, it suggests itself that the
11 The peer average was formed by the mean of the four closest FCs in terms of revenue and all FCs which are the same type of club.
For this purpose, the authors categorized VfB Stuttgart 1893 as National Traditional Club and Hannover 96 as Training Club.
46
promoted FCs’ FoMa Q-Scores rather underestimate the true value, which would result
under full data comparability. The purpose of stating these indicative FoMa Q-Scores is to
demonstrate timeliness of data and cast a glance at the upcoming season.
4 Results of and Implications based on the FoMa-Scoring Model
4.1 Results of the FoMa-Scoring Model: the FoMa Q-Score
The final results, the FoMa Q-Scores, were derived according to the procedure de-
scribed in Chapter 3.4.2. It is now possible to rank the FCs according to their FoMa Q-
Scores and to visualize the FCs’ performance in the (sub-)dimensions. Table 7 contains the
relevant information12. For the purposes of enhanced readability and simplified interpre-
tation the FCs are grouped into four classes and the levels of their scores are indicated by
different coloring.
12 Due to space considerations the results are shown up to sub-dimension level only. The results for each KPI are available and can
be requested at the corresponding author’s address.
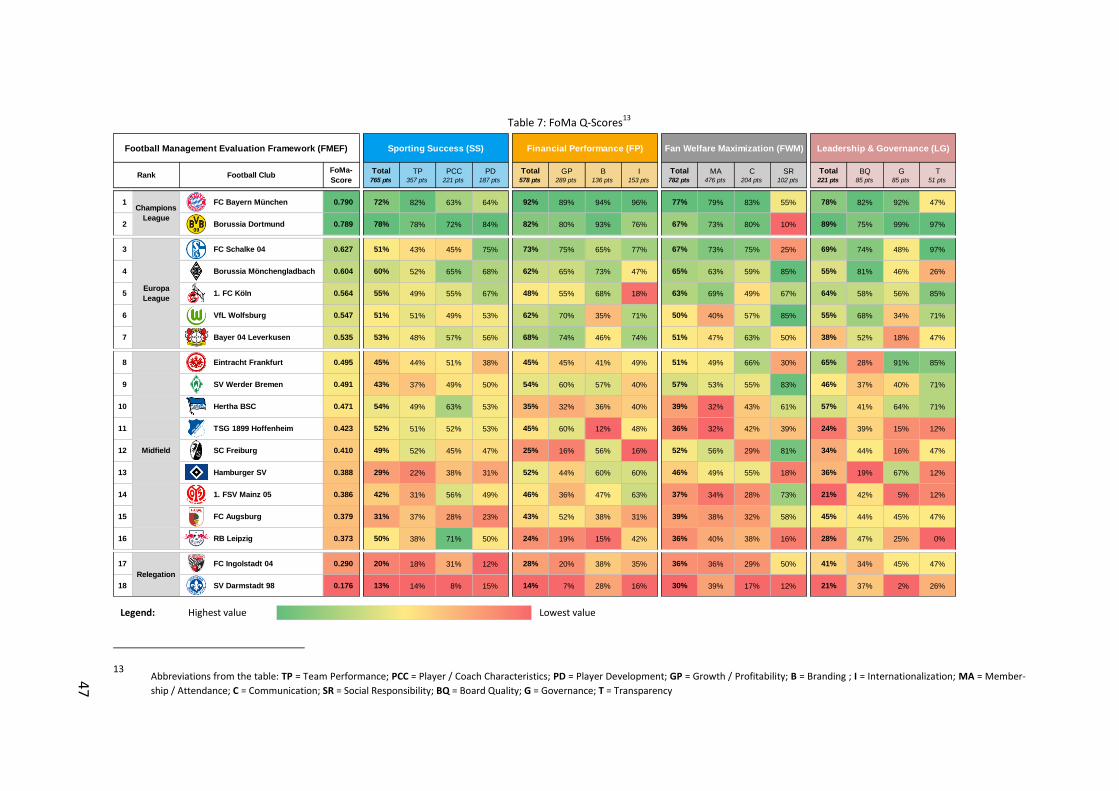
47
Table 7: FoMa Q-Scores13
Legend: Highest value Lowest value
13 Abbreviations from the table: TP = Team Performance; PCC = Player / Coach Characteristics; PD = Player Development; GP = Growth / Profitability; B = Branding ; I = Internationalization; MA = Member-
ship / Attendance; C = Communication; SR = Social Responsibility; BQ = Board Quality; G = Governance; T = Transparency
Football Management Evaluation Framework (FMEF) Sporting Success (SS) Financial Performance (FP) Fan Welfare Maximization (FWM) Leadership & Governance (LG)
Rank Football ClubFoMa-
Score
Total765 pts
TP357 pts
PCC221 pts
PD187 pts
Total578 pts
GP289 pts
B136 pts
I153 pts
Total782 pts
MA476 pts
C204 pts
SR102 pts
Total221 pts
BQ85 pts
G85 pts
T51 pts
1 FC Bayern München 0.790 72% 82% 63% 64% 92% 89% 94% 96% 77% 79% 83% 55% 78% 82% 92% 47%
2 Borussia Dortmund 0.789 78% 78% 72% 84% 82% 80% 93% 76% 67% 73% 80% 10% 89% 75% 99% 97%
3 FC Schalke 04 0.627 51% 43% 45% 75% 73% 75% 65% 77% 67% 73% 75% 25% 69% 74% 48% 97%
4 Borussia Mönchengladbach 0.604 60% 52% 65% 68% 62% 65% 73% 47% 65% 63% 59% 85% 55% 81% 46% 26%
5 1. FC Köln 0.564 55% 49% 55% 67% 48% 55% 68% 18% 63% 69% 49% 67% 64% 58% 56% 85%
6 VfL Wolfsburg 0.547 51% 51% 49% 53% 62% 70% 35% 71% 50% 40% 57% 85% 55% 68% 34% 71%
7 Bayer 04 Leverkusen 0.535 53% 48% 57% 56% 68% 74% 46% 74% 51% 47% 63% 50% 38% 52% 18% 47%
8 Eintracht Frankfurt 0.495 45% 44% 51% 38% 45% 45% 41% 49% 51% 49% 66% 30% 65% 28% 91% 85%
9 SV Werder Bremen 0.491 43% 37% 49% 50% 54% 60% 57% 40% 57% 53% 55% 83% 46% 37% 40% 71%
10 Hertha BSC 0.471 54% 49% 63% 53% 35% 32% 36% 40% 39% 32% 43% 61% 57% 41% 64% 71%
11 TSG 1899 Hoffenheim 0.423 52% 51% 52% 53% 45% 60% 12% 48% 36% 32% 42% 39% 24% 39% 15% 12%
12 SC Freiburg 0.410 49% 52% 45% 47% 25% 16% 56% 16% 52% 56% 29% 81% 34% 44% 16% 47%
13 Hamburger SV 0.388 29% 22% 38% 31% 52% 44% 60% 60% 46% 49% 55% 18% 36% 19% 67% 12%
14 1. FSV Mainz 05 0.386 42% 31% 56% 49% 46% 36% 47% 63% 37% 34% 28% 73% 21% 42% 5% 12%
15 FC Augsburg 0.379 31% 37% 28% 23% 43% 52% 38% 31% 39% 38% 32% 58% 45% 44% 45% 47%
16 RB Leipzig 0.373 50% 38% 71% 50% 24% 19% 15% 42% 36% 40% 38% 16% 28% 47% 25% 0%
17 FC Ingolstadt 04 0.290 20% 18% 31% 12% 28% 20% 38% 35% 36% 36% 29% 50% 41% 34% 45% 47%
18 SV Darmstadt 98 0.176 13% 14% 8% 15% 14% 7% 28% 16% 30% 39% 17% 12% 21% 37% 2% 26%
Champions
League
Europa
League
Midfield
Relegation
48
As described above, the FoMa Q-Score is independent of any scale units and can only
be compared among the FCs. Therefore, the FoMa Q-Score is provided in absolute terms.
The values of the (sub-)dimensions, on the contrary, indicate how many points a certain
FC was able to achieve in relation to the total points available. Consequently, it is more
intuitive to report these figures in relative terms. To enhance the readability of the table,
all values are visually represented by colors. Each column’s highest value is indicated by
deep green, whereas its lowest value is filled with deep red. The closer the values in be-
tween approximate the highest value (lowest value), the more the filling turns into green
(red). A yellow filling stands for a value which is in the middle of the highest and lowest
values. Thus, it is very easy to discover interesting outliers and patterns which are worth
discussing. Additionally, the FCs are grouped into four categories, which match the classi-
cal outcome of a Bundesliga season. Generally speaking, FCs can either reach the UEFA
Champions League, the UEFA Europa League, a place in the midfield or are relegated to
the 2. Bundesliga. Consequently, the four categories are Champions League, Europa
League, Midfield and Relegation. The group allocation for the management quality
doesn’t match the actual distribution but is rather oriented on larger gaps between FCs’
FoMa Q-Scores, which also become evident by the column’s color distribution.
With a total FoMa Q-Score of 0.790, Bayern München achieves the highest level of
management quality in the 2016/17 ranking. Only 0.001 points behind the winner follows
Borussia Dortmund. These two FCs form the Champions League of football management
in the Bundesliga. They score higher than 65% in each of the four dimensions and can
therefore be considered as highly balanced in managing each of them. FC Schalke 04
(FoMa Q-Score of 0.627) is the FC closest to the Champions League but already has a sub-
stantial margin. FC Schalke 04 heads the Europa League group, which also contains Bo-
russia Mönchengladbach (0.604), 1. FC Köln (0.564), VfL Wolfsburg (0.547), and Bayer 04
Leverkusen (0.535). The FCs from the Europa League also show consistent scores along
most (sub-)dimensions with very few negative outliers. While they are still able to com-
pete to a certain degree with the Champions League FCs in the Financial Performance,
Fan Welfare Maximization and Leadership & Governance dimensions, they lack competi-
49
tiveness in the Sporting Success dimension. After the Europa League, a total of nine FCs
constitute the largest group within the FoMa-Scoring model, namely the Midfield. This
group of FCs can only compete with the high-performers in a selected number of sub-
dimensions and displays a multitude of low-performance scores. The Midfield is com-
posed of Eintracht Frankfurt (0.495), SV Werder Bremen (0.491), Hertha BSC (0.471), TSG
1899 Hoffenheim (0.423), SC Freiburg (0.410), Hamburger SV (0.388), 1. FSV Mainz 05
(0.386), FC Augsburg (0.379), and RB Leipzig (0.373). The FCs with the lowest FoMa Q-
Scores are FC Ingolstadt 04 with 0.290 and SV Darmstadt 98 with 0.176. They can be con-
sidered as relegated FCs in the FoMa-Scoring Model. When it comes to management
quality, FC Ingolstadt 04 to some and SV Darmstadt 98 to full extent are not able to keep
up with the rest of the Bundesliga. They lack behind in each of the dimensions and there-
fore unsurprisingly were finally relegated to Germany’s 2. Football Bundesliga.
FC Ingolstadt 04 and SV Darmstadt 98 will be replaced by VfB Stuttgart 1893 and Han-
nover 96 in the 2017/18 season. Under the above mentioned limitations, the two teams
already reach FoMa Q-Scores of 0.291 (Hannover 96) and 0.384 (VfB Stuttgart 1893) for
the 2016/17 season. Assuming a boost in each of the four dimensions, which usually ac-
companies a promotion to a higher league, it is suggested that the teams will be much
better prepared and suited to compete in the Bundesliga than their two predecessors.
Clearly, after the last season in the 2. Bundesliga, both teams have significant room for
improvement in the Sporting Success dimension. Hannover 96 slightly lacks behind in the
other three dimensions as well but can build upon a solid foundation, which can help the
FC to perform a good season in the next year. Strategically, the data suggests that Hanno-
ver 96 should be more active in the Fan Welfare Maximization dimension, in which the FC
currently ranks last. This will likely also improve their financial situation. VfB Stuttgart
1893 finds itself in the bottom of the midfield group in the other three dimensions, show-
ing that the FC has a rich and successful past. This basis likely enables the club to reestab-
lish itself in the Bundesliga. Nonetheless, further efforts, for example, in the areas of
branding and internationalization are required in order to build up a sustainable market
position. The precise results can be seen in Appendix IV.
50
With the Football Management Evaluation Framework (FMEF) as underlying basis, a
broad variety of interpretations on the (sub-)dimension- and FC-level can be undertaken.
In the following, a selection of three examples is discussed, demonstrating the power of
the FoMa-Scoring Model.
Firstly, the 2016/17 season marks a special case as RB Leipzig, just recently promoted
from the 2. Bundesliga, conquered the top places from the beginning on. This situation
has mixed up rather traditional orders in the Bundesliga table and has created a lot of
excitement among stakeholders. RB Leipzig especially excels with a second rank in the
Player & Coach Characteristics (PCC) sub-dimension but also achieves decent scores in
Player Development (PD) (especially youth academy performance). It seems as if the
management has created a highly favorable environment for achieving sustainable Sport-
ing Success. Clearly, this will automatically influence other dimensions as well. Nonethe-
less, RB Leipzig could proactively enhance the performance in the following dimensions
by increasing branding efforts (higher Financial Performance score), initiating activities
which foster their social footprint in the region (higher Fan Welfare Maximization score),
and disclosing more information with regards to their internal structures (higher Leader-
ship & Governance score). In doing so, the FC could leapfrog TSG 1899 Hoffenheim, an FC
which found itself in a comparable situation in the 2008/09 season, in a short period of
time. TSG 1899 Hoffenheim has managed to become an established member of the Bun-
desliga and loosen the ties to patron Dietmar Hopp in financial terms. However, to date
they struggle in becoming more attractive to fans and members (Fan Welfare Maximiza-
tion dimension) and in setting up efficient and transparent governance mechanisms
(Leadership & Governance dimension). The FMEF could help RB Leipzig to derive learnings
and avoid making similar mistakes as comparable FCs.
Secondly, the FMEF ranking shows that management quality is not necessarily bound
to the size of FCs. 1. FC Köln and SC Freiburg score well beyond what might be expected
from them according to public perception. For both 1. FC Köln and SC Freiburg, it holds
true that in order to play a major role in the Bundesliga in the long-run, they need to im-
prove their Financial Performance. Especially in the Internationalization sub-dimension,
51
the two FCs show low scores, indicating that they could increase their efforts in this area.
While it is undoubtedly a challenge to find the right balance between thinking globally
and acting locally, an increased reach will boost revenues significantly through additional
sponsorship agreements. In contrast, Hamburger SV ends up in the 13th place in the Fo-
Ma-Scoring Model, which is clearly not in line with the aspirations. The data reveals that
the FC’s management in terms of Financial Performance and Fan Welfare Maximization is
rather successful. However, especially the Team Performance (TP) of the Sporting Success
dimension lacks behind. This could partially be explained by the poor level of Player De-
velopment (PD) as well as the underdeveloped Leadership & Governance mechanisms,
which negatively affect the players.
Thirdly, the data indicates a trend in which the top-3 FCs (FC Bayern München, Borus-
sia Dortmund, FC Schalke 04), which theoretically would have the financial background,
don’t put a strong emphasis on Social Responsibility (SR). It seems likely that the men-
tioned FCs rather rely on either their qualities in the Team Performance (TP) sub-
dimension or on Branding (B) and Internationalization (I) efforts to attract and satisfy
their fans. In the long run, this course of action has the potential to create less identifica-
tion among local supporters and harm the FCs in their Financial Performance dimension.
Conversely, it appears that FCs with less developed international brands, such as Borussia
Mönchengladbach, VfL Wolfsburg, SV Werder Bremen, and SC Freiburg, try to offset this
shortcoming by giving back more to their local communities. In order to sustainably be
competitive, these FCs must nonetheless increase their efforts in establishing interna-
tional brands while simultaneously maintaining their close ties with the region.
4.2 Implications based on the FoMa-Scoring Model
By allowing discussions such as the ones in the previous chapter, the FoMa-Scoring
Model can prove highly useful for stakeholders from the football environment. Within
FCs, an interesting utilization could be the application of the FoMa-Scoring Model for
benchmarking purposes. Football managers can quite conveniently compare their FC’s
performance in specific (sub-)dimensions with that of their main competitors. When
transformed into concrete actions, the learnings can provide substantial advantages with
52
regards to an FC’s competitiveness. In addition, the FMEF’s insights could be transformed
into an internal controlling system, allowing managers to be evaluated with a more relia-
ble foundation. Do’s and don’ts for the implementation phase can be derived from VfB
Stuttgart’s attempt in 2003 to install such a management tool (further described in Chap-
ter 2.3 on page 11). For non-FC stakeholders the FMEF opens up new opportunities to
receive more detailed information about an FC: For example, it would be appropriate for
sponsors to consider the FoMa Q-Score within the scope of a due diligence. It may pro-
vide insights as to the strengths and weaknesses of an FC, which then can be compared
with the company’s objectives and capabilities. As last practical application opportunity
the DFL licensing procedure should be mentioned. It is one of the goals of this procedure
to foster managerial and financial structures (DFL, 2016, p. 3). A refined version of the
FMEF could serve as an indicator for the existing structures of FCs and give insightful in-
spiration for areas which require particular attention in the near future.
As the present study is the first one to comprehensively evaluate the relevant dimen-
sions of managing FCs, it is still highly explorative. Therefore, several limitations should be
mentioned in order to correctly interpret the results and derive potential next steps. First
of all, the measured KPIs of the four dimensions haven’t been tested with regards to their
explanatory power. Some measured KPIs are likely relevant for all FCs, whereas others
only concern a certain group of FCs. This one size fits all approach presumably favors larg-
er FCs to a certain degree as some KPIs contain absolute, instead of relative, values. Sec-
ondly, the scoring model doesn’t follow a scientific best-practice procedure due to the
reason that such a procedure doesn’t exist yet. The aim was to design the evaluation as
intuitive as possible in order to enable deeper discussions about the content, which in this
case is related to dimensions, sub-dimensions, and KPI definitions. Especially the weights
of sub-dimensions (based on the quantity of measured KPIs) and individual KPIs (low, me-
dium, high priority) were derived subjectively. Thirdly, the access to relevant data was
exclusively restricted to publicly available sources. As the setups of most FCs allow them
to control the disclosure of information, it was a challenge to establish a common level
playing field. However, in order to prevent the results from being distorted due to a lack
53
of transparency, it was a necessary hurdle to overcome. The KPIs and their underlying
data were selected and analyzed to the best of the authors’ knowledge. Nevertheless, it
seems likely that full access to the FCs’ financial results, governance mechanisms, and
partnering structures would have at least slightly changed the outcome.
The limitations discussed above suggest the need for more thorough examinations.
Although this study is a first step towards closing the gap of management quality research
in the football arena, additional investigations are needed.
5 Conclusion
As the European football industry has been going through a phase characterized by a
high level of commercialization, the challenges for and requirements of an FC’s manage-
ment have increased considerably. The German Bundesliga as one of the five major Euro-
pean leagues is strongly affected by this development. So far, the topic of management
quality in the football industry has received little consideration, which is the reason why
this study aims to start closing the gap within this research stream. The ultimate objective
was to create a ranking of the Bundesliga members’ management qualities. Five steps
were taken to derive the final result, which indicates that FC Bayern München and Borus-
sia Dortmund lead the Bundesliga with some distance in terms of management quality.
Firstly, a broad literature review was conducted to learn as much as possible from
general management theory. It was argued that since most of the Bundesliga members
can nowadays be considered as medium or large enterprises, a lot of these insights can
also be applied on FCs. To structure the literature analysis, KAPLAN AND NORTON’S Balanced
Scorecard was applied. It categorizes management tasks into four broad perspectives:
Financial, Customer, Internal-Business-Process, and Learning & Growth. The relationship
of these perspectives and management quality seems intuitive: the more a company ex-
cels in each of the perspectives, the better it is thought to be managed. After all, man-
agement quality is evaluated with respect to the achievement of objectives in the four
perspectives. For each of them, key drivers and correlations have been identified and dis-
cussed.
54
Secondly, based on the traditional literature analysis, the particularities of FCs were
analyzed. It is rather apparent that FCs only function like traditional companies to a cer-
tain degree. Therefore, correctly determining the dimensions driving the success of FCs
was the key to a reliable framework of management quality in the Bundesliga. A thorough
analysis of academic sports literature as well as recent industry reports yielded the fol-
lowing four relevant dimensions: Sporting Success, Financial Performance, Fan Welfare
Maximization and Leadership & Governance. After having scrutinized each of the dimen-
sions, three sub-dimensions were determined per dimension. The sub-dimensions are
supposed to cover the most important areas and simultaneously overlap as little as possi-
ble.
Thirdly, the theoretical foundation from steps one and two were presented to industry
experts. The aim of this study is to be of high practical relevance. For this reason, ten
semi-structured interviews with industry experts have been conducted. Interview part-
ners were high-level stakeholders from FCs (FC Bayern München, Borussia Dortmund,
Eintracht Frankfurt, Hamburger SV, RB Leipzig), media (11 Freunde, FINANCE) and further
external stakeholders (Lagardère Sports Germany, Puma). The framework was perceived
very positively by the interview partners and their feedback subsequently incorporated in
the refinement of the Football Management Evaluation Framework (FMEF).
The intermediate result after the first three steps was the FMEF depicted in Figure 5 on
page 29. The FMEF defines the weights of the four dimensions: Sporting Success = 40%,
Financial Performance = 25%, Fan Welfare Maximization = 17.5% and Leadership &
Governance = 17.5%. In addition, the relevant sub-dimensions are mentioned.
Fourthly, for each of the sub-dimensions a set of KPIs was identified. To finally arrive at
a management quality ranking of the Bundesliga members, it was necessary to fill the
FMEF with measurable, objective KPIs. This working paper has taken a purely external
point of view, which made the creation of a level playing field a major challenge. Due to
the inconsistencies with regards to public disclosure of information among the FCs, sever-
al sources such as annual reports had to be excluded from the analysis. Instead, publicly
available data for all FCs were collected in several Microsoft Excel files. The KPIs were
55
clearly defined and documented in order to guarantee full transparency concerning the
results.
Fifthly, a scoring model was set up, allowing FCs to be compared against each other. It
was the authors’ goal to first enable discussions about the content of the FMEF, which
consists of the (sub-)dimensions and the measured KPIs. Clearly, the scoring model is an
important part of the final ranking. However, deeper, more technically advanced investi-
gations are going to be necessary to derive the most reliable and scientifically robust pro-
cedure. For this study, the maximum of 17 points was distributed to the first place of a
KPI evaluation. With each lower place, one point was deducted. The total points gathered
for all KPIs of a certain dimension were set in relation to the total points available. This
fraction was then multiplied with the weight of that particular dimension. After the same
procedure all dimensional values were derived and then summed up. The ultimate out-
come is considered the Football Management (FoMa) Q-Score of a certain FC.
The final result of this working paper is depicted in Table 7 on page 47. The winner of
the 2016/17 FMEF ranking is FC Bayern München (FoMa Q-Score of 0.790), closely fol-
lowed by Borussia Dortmund (0.789). These two FCs play in the Champions League of
management quality. The other FCs were categorized in Europa League, Midfield and Rel-
egation.
Refining this framework through additional scientific and practical investigations could
develop the FMEF into a reliable industry benchmark in the near future. Various practical
stakeholders are expected to benefit from the insights. Overall, this study strives to be
the nucleus for a sophisticated management quality evaluation framework, which helps
to improve management quality in the football environment.
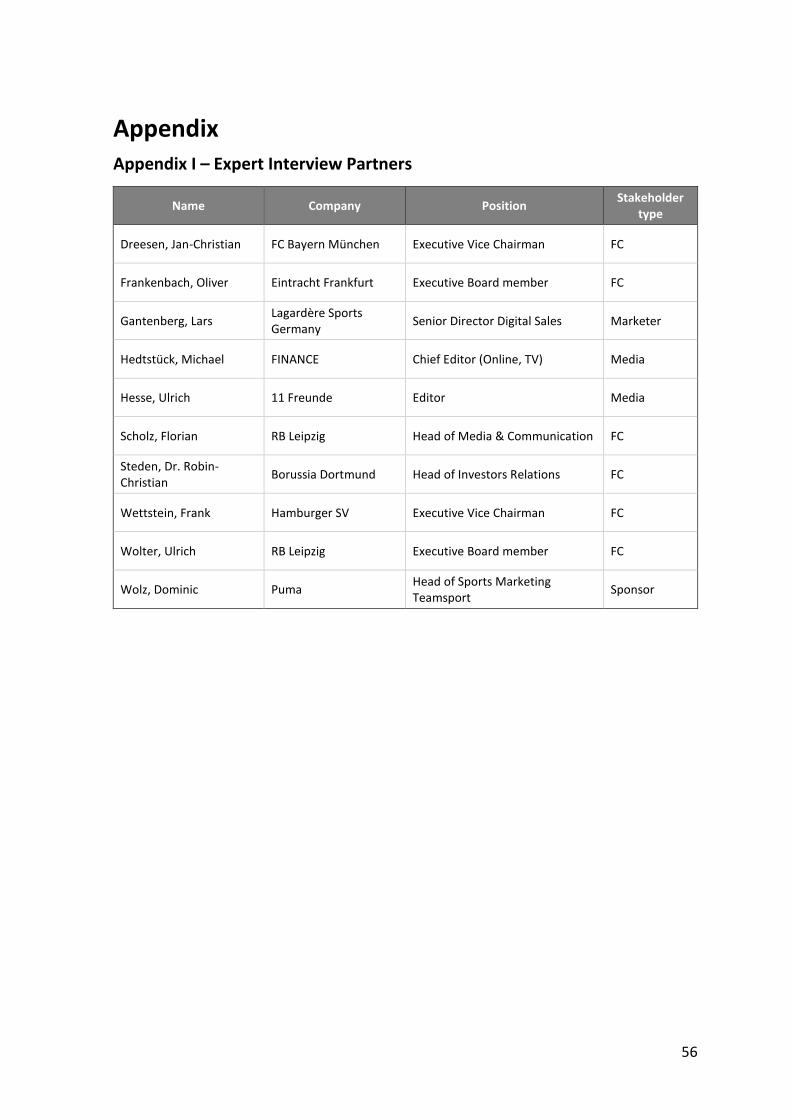
56
Appendix Appendix I – Expert Interview Partners
Name Company Position Stakeholder
type
Dreesen, Jan-Christian FC Bayern München Executive Vice Chairman FC
Frankenbach, Oliver Eintracht Frankfurt Executive Board member FC
Gantenberg, Lars Lagardère Sports Germany
Senior Director Digital Sales Marketer
Hedtstück, Michael FINANCE Chief Editor (Online, TV) Media
Hesse, Ulrich 11 Freunde Editor Media
Scholz, Florian RB Leipzig Head of Media & Communication FC
Steden, Dr. Robin-Christian
Borussia Dortmund Head of Investors Relations FC
Wettstein, Frank Hamburger SV Executive Vice Chairman FC
Wolter, Ulrich RB Leipzig Executive Board member FC
Wolz, Dominic Puma Head of Sports Marketing Teamsport
Sponsor
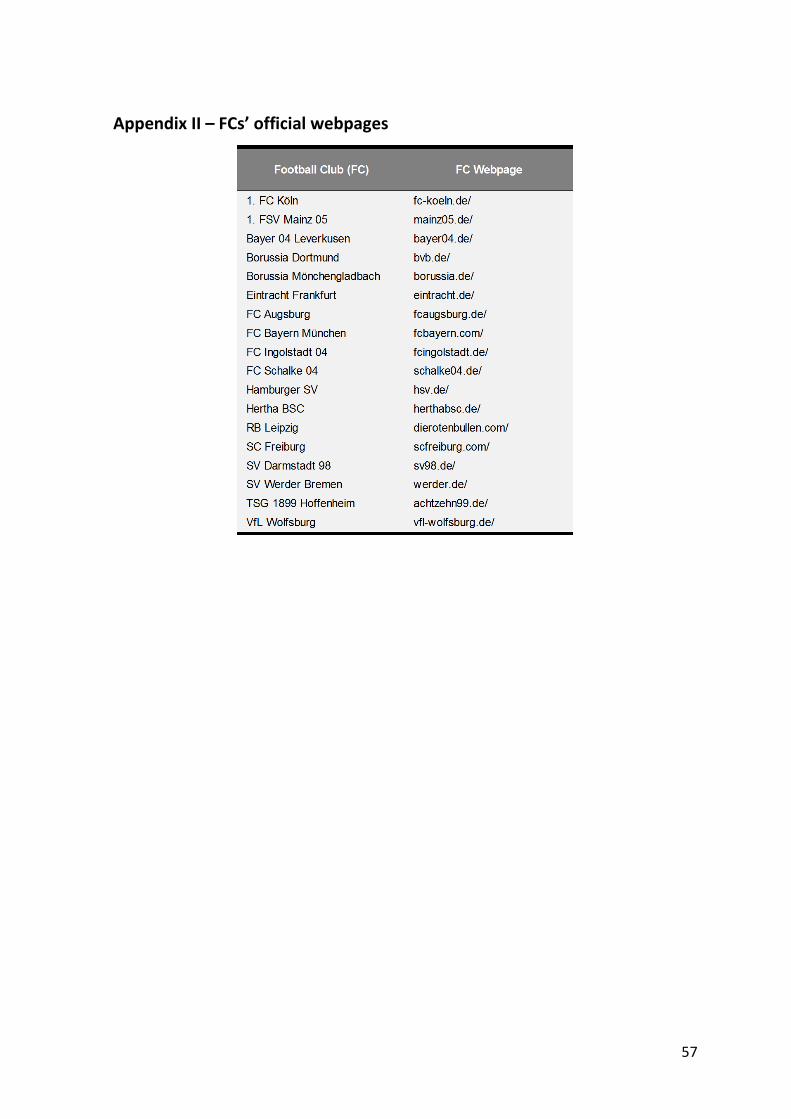
57
Appendix II – FCs’ official webpages
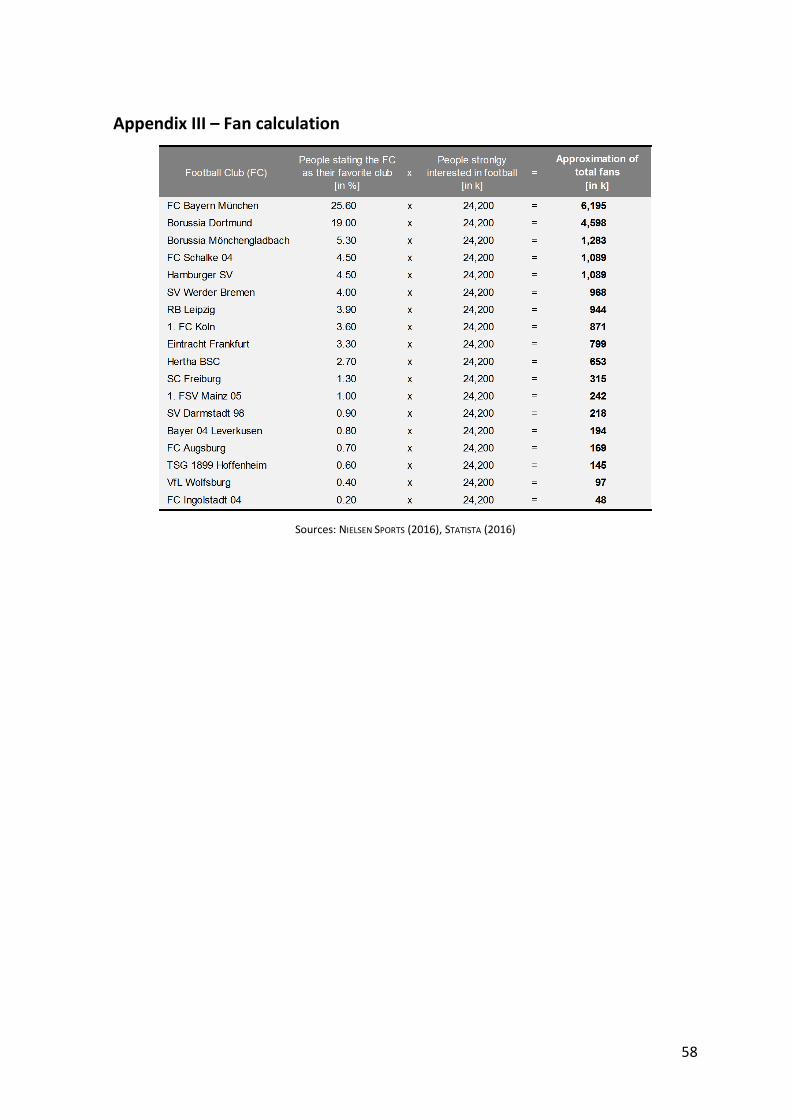
58
Appendix III – Fan calculation
Sources: NIELSEN SPORTS (2016), STATISTA (2016)
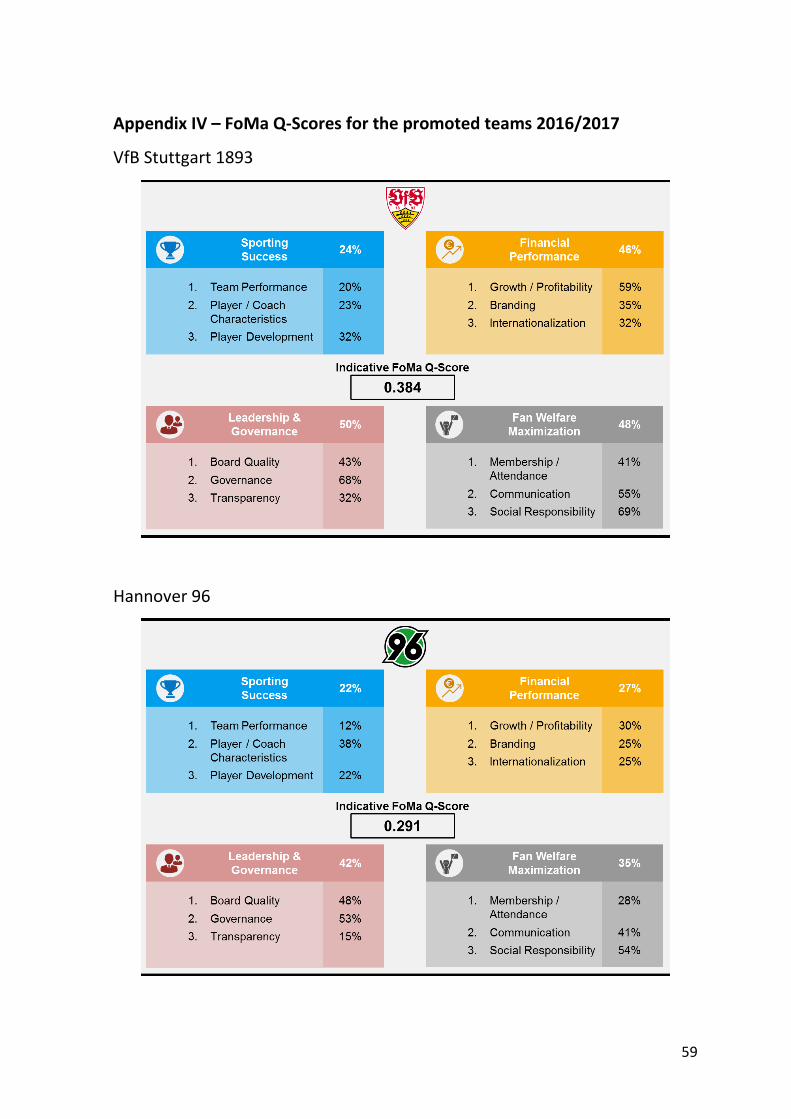
59
Appendix IV – FoMa Q-Scores for the promoted teams 2016/2017
VfB Stuttgart 1893
Hannover 96
X
List of Sources
11 FREUNDE (ED.). (2016). Der Untergang [The demise]. 11 Freunde, 2016(11), 26–37.
A
ADAMS, R., BESSANT, J., & PHELPS, R. (2006). Innovation management measurement: A re-
view. International Journal of Management Reviews, 8, 21–47.
ADVANT GROUP. (2017). Ranking of Internationalization of Europe‘s Top-5 Leagues 2016-
2017. Frankfurt am Main, Germany.
ANDERSON, E. W., FORNELL, C., & LEHMANN, D. R. (1994). Customer satisfaction, market share,
and profitability: Findings from Sweden. Journal of Marketing, 58(3), 53–66.
ANDREWS, M., & HARRINGTON, P. (2016). Off Pitch: Football’s financial integrity weaknesses,
and how to strengthen them (CID Working Paper No. 311). Cambridge, USA: Har-
vard Kennedy School.
AUDAS, R., DOBSON, S., & GODDARD, J. (2002). The impact of managerial change on team
performance in professional sports. Journal of Economics and Business, 54, 633–
650.
B
BAIN & COMPANY. (2013). Management tools & trends 2013. Boston, United States: Darrell
Rigby, Barbara Bilodeau.
BAUER, H. H., SAUER, N. E., & SCHMITT, P. (2005). Customer‐based brand equity in the team
sport industry: Operationalization and impact on the economic success of sport
teams. European Journal of Marketing, 39, 496–513.
BAUER, H. H., STOKBURGER-SAUER, N. E., & EXLER, S. (2008). Brand image and fan loyalty in
professional team sport: A refined model and empirical assessment. Journal of
Sport Management, 22, 205–226.
BECSKY, A. (2011). The application of Balanced Scorecard in team sports. APSTRACT: Ap-
plied Studies in Agribusiness and Commerce, 5(3–4), 29–32.
XI
BIRKHÄUSER, S., KASERER, C., & URBAN, D. (2015). Investor presence and competition in major
European football leagues (Working paper). Munich, Germany: Technische Univer-
sität München.
BORUSSIA DORTMUND. (2014). Suresh Letchmanan to head Singapore office. Retrieved from
http://www.bvb.de/eng/News/Overview/Suresh-Letchmanan-to-head-Singapore-
office
BOGNER, A., LITTIG, B., & MENZ, W. (2009). Experteninterviews: Theorien, Methoden, An-
wendungsfelder [Expert Interviews: Theories, Methods and Fields of Application]
(3rd ed.). Wiesbaden, Germany: VS Verlag für Sozialwissenschaften.
BRYANT, L., JONES, D. A., & WIDENER, S. K. (2004). Managing value creation within the firm:
An examination of multiple performance measures. Journal of Management Ac-
counting Research, 16, 107–131.
BUNDESANZEIGER. (2017). Bundesanzeiger. Retrieved from
https://www.bundesanzeiger.de/ebanzwww/wexsservlet
BURK, V., GRIMMER, C. G., & PAWLOWSKI, T. (2014). Stadionzeitung meets Facebook [Stadium
magazine meets Facebook]. Marketing Review St. Gallen, 31(2), 32–39.
C
CHEN, M., CHENG, S., & HWANG, Y. (2005). An empirical investigation of the relationship be-
tween intellectual capital and firms’ market value and financial performance.
Journal of Intellectual Capital, 6, 159–176.
CHENHALL, R. H., & LANGFIELD-SMITH, K. (2007). Multiple perspectives of performance
measures. European Management Journal, 25, 266–282.
COSTA, C. A. (2005). The status and future of sport management: A Delphi study. Journal of
Sport Management, 19, 117–142.
CUPONATION. (2016). Der Fußball-Bundesliga Preisvergleich 2016/2017 [The football Bun-
desliga price comparison 2016/17]. Retrieved from
https://www.cuponation.de/tag/fussball-bundesliga-preisvergleich-1617
XII
D
DALTON, D. R., DAILY, C. M., JOHNSON, J. L., & ELLSTRAND, A. E. (1999). Number of directors
and financial performance: A meta-analysis. The Academy of Management Jour-
nal, 42, 674–686.
DAWSON, P., & DOBSON, S. (2002). Managerial efficiency and human capital: An application
to English association football. Managerial and Decision Economics, 23, 471–486.
DELOITTE. (2016). Reboot: Annual review of football finance 2016. London, United King-
dom: Sam Boor, Matthew Green, Chris Hanson, Andy Shaffer, Alexander Thorpe,
Christopher Winn.
DEUTSCHER BUNDESTAG. (2012). Governance-Strukturen im deutschen Profi-Fußball [Gover-
nance structures in German professional football]. Berlin, Germany.
DFB (2015). „Wir arbeiten zusammen, nicht gegeneinander!“ [”We work together, not
against each other!"]. Fußballtraining, 8, 6–10.
DFB (2017). DFB - Deutscher Fußball-Bund e.V. Retrieved March 1, 2017, from
http://www.dfb.de/start/
DFL (2013). Bundesliga Report 2013: Die wirtschaftliche Situation im Lizenzfußball [Bun-
desliga Report 2013: the economic situation of lincensed football]. Frankfurt, Ger-
many.
DFL (2016). Lizenzierungsordnung [Licensing procedure]. Frankfurt, Germany. Retrieved
from http://s.bundesliga.de/assets/doc/1120000/1115274_original.pdf
DFL (2017). The Bundesliga report 2017: The economic state of German professional foot-
ball. Frankfurt, Germany.
DIMITROPOULOS, P. E., & TSAGKANOS, A. (2012). Financial performance and corporate gov-
ernance in the European football industry. International Journal of Sport Finance,
7, 280–308.
XIII
E
EDWARDS, R., & HOLLAND, J. (2013). What is qualitative interviewing? (1st ed.). London,
United Kingdom: Bloomsbury Publishing.
EINTRACHT FRANKFURT. (2017). USA Tour in July 2017. Retrieved from
http://www.eintracht.de/en/news/article/usa-tour-in-july-2017-58768/
ELYASIANI, E., & JIA, J. (2010). Distribution of institutional ownership and corporate firm
performance. Journal of Banking & Finance, 34, 606–620.
EUROPEAN COMMISSION. (2017). What is an SME? Retrieved from
http://ec.europa.eu/growth/smes/business-friendly-environment/sme-
definition_de
F
FANPAGE KARMA. (2017). Fanpage Karma: Monitor Facebook marketing - Statistics and re-
porting tools. Retrieved March 1, 2017, from http://www.fanpagekarma.com/
FASZINATION FANKURVE. (2016). Borussia Dortmund ist Strafenmeister der Saison [Borussia
Dortmund is this season’s fines champion]. Retrieved from
http://www.faszination-fankurve.de/index.php?head=Borussia-Dortmund-ist-
Strafenmeister-der-Saison&folder=sites&site=news_detail&news_id=13170
FC BAYERN MÜNCHEN. (2014). FCB opens New York City office. Retrieved from
https://fcbayern.com/en/news/2014/08/fcb-open-office-in-new-york-city
FRANZKE, R. (2017). 3 Milliarden geknackt [Surpassed three billion]. Kicker-Sportmagazin,
6, 76–77.
FRICK, B., & SIMMONS, R. (2008). The impact of managerial quality on organizational per-
formance: evidence from German soccer. Managerial and Decision Economics, 8,
593–600.
FRITZ, T. (2006). Fußball und Strategie: Eine effizienzorientierte Analyse der Fußballbun-
desliga [Football and strategy: An efficiency-oriented analysis of the Bundesliga]
(1st ed.). Mering, Germany: Rainer Hampp Verlag.
XIV
G
GARCIA-DEL-BARRIO, P., & SZYMANSKI, S. (2009). Goal! Profit maximization versus win maxi-
mization in soccer. Review of Industrial Organization, 34, 45–68.
GLASS, G. V. (1976). Primary, secondary, and meta-analysis of research. Educational Re-
searcher, 5(10), 3–8.
GLOBERSON, S. (1985). Issues in developing a performance criteria system for an organiza-
tion. International Journal of Production Research, 23(4), 639–646.
H
HANDELSBLATT. (2004). IBMs ehemaliger Deutschland-Chef Erwin Staudt krempelt den VFB
Stuttgart um: Zwischen Strafraum und Scorecard [VFB Stuttgart to be restructured
by former IBM Germany CEO Erwin Staudt: In-between penalty area and score-
card]. Retrieved from
http://www.handelsblatt.com/unternehmen/management/ibms-ehemaliger-
deutschland-chef-erwin-staudt-krempelt-den-vfb-stuttgart-um-zwischen-
strafraum-und-scorecard/2302234.html
HAUSER, J., TELLIS, G. J., & GRIFFIN, A. (2006). Research on innovation: A review and agenda
for Marketing Science. Marketing Science, 25, 687–717.
HEIDBRINK, M., KOCHANEK, T., BRANDS, J., & JENEWEIN, W. (2014). Kunden zu Fans machen
[Transforming customers to fans]. Marketing Review St. Gallen, 31(2), 10–19.
HILLMAN, A. J., & DALZIEL, T. (2003). Boards of directors and firm performance: Integrating
agency and resource dependence perspectives. The Academy of Management Re-
view, 28, 383–396.
HOLZMÜLLER, H. H., CRAMER, C., & THOM, D. C. (2014). Markenführung im Profi-Fußball
[Brand management in professional football]. Marketing Review St. Gallen, 31(2),
68–83.
HORIZONT. (2016). Dynamisches Duo im Dauerwettstreit [Dynamic duo in constant rival-
ry]. HORIZONT, 2016(33), 22–23.
XV
HORIZONT. (2017). Watzkes Wohnzimmer [Watzke’s living room]. HORIZONT Award Ma-
gazin 2017, 16–20.
HÜPPI, M. (2014). Führung im modernen Fußball [Leadership in modern football]. Marke-
ting Review St. Gallen, 31(2), 84–92.
I
IMUG. (2016). Nachhaltigkeit im Profifußball: Offensivspektakel oder Abwehrschlacht? Ein
Blick auf die 1. Bundesliga [Sustainability in professional football: Offensive specta-
cle or defensive battle? Spotlight on the German Bundesliga]. Hannover, Germany.
INVESTOPEDIA. (2017). Institutional ownership. Retrieved from
http://www.investopedia.com/terms/i/institutional-ownership.asp
ISPO. (2017). Sponsoren der Bundesliga-Clubs: Alle Trikots, alle Einnahmen [Sponsors of
Bundesliga clubs: All jerseys, all revenues]. Retrieved from
http://www.ispo.com/unternehmen/id_78796694/sponsoren-der-bundesliga-
clubs-alle-trikots-alle-einnahmen.html
ITTNER, C. D., & LARCKER, D. F. (1998). Are nonfinancial measures leading indicators of finan-
cial performance? An analysis of customer satisfaction. Journal of Accounting Re-
search, 36 (Studies on Enhancing the Financial Reporting Model), 1–35.
J
JAIN, D., & SINGH, S. S. (2002). Customer lifetime value research in marketing: A review and
future directions. Journal of Interactive Marketing, 16(2), 34–46.
JENSEN, M. C., & MECKLING, W. H. (1976). Theory of the firm: Managerial behavior, agency
costs and ownership structure. Journal of Financial Economics, 3, 305–360.
JUSCHUS, A., LEISTER, R., & PRIGGE, S. (2016A). Die Corporate-Governance-Tabelle: Eine Be-
standsaufnahme der Corporate Governance in der Ersten Fußballbundesliga (Teil
A). Zeitschrift Für Corporate Governance, 5, 212–220.
XVI
JUSCHUS, A., LEISTER, R., & PRIGGE, S. (2016B). Die Corporate-Governance-Tabelle: Eine Be-
standsaufnahme der Corporate Governance in der Ersten Fußballbundesliga (Teil
B). Zeitschrift Für Corporate Governance, 6, 245–251.
K
KAINZ, F., OBERLEHNER, C., KREY, F., & WERNER, C. (2014). Wie Social Media Marketing im
Fußball wirkt [How social media marketing works in football]. Marketing Review
St. Gallen, 31(2), 40–57.
KAPLAN, R. S., & NORTON, D. P. (1992). The Balanced Scorecard – Measures that drive per-
formance. Harvard Business Review, 70 (January-February), 71–79.
KAPLAN, R. S., & NORTON, D. P. (1993). Putting the Balanced Scorecard to work. Harvard
Business Review, 71 (September-October), 134–147.
KAPLAN, R. S., & NORTON, D. P. (1996). The Balanced Scorecard: Translating strategy into
action (1st ed.). Boston, United States: Harvard Business School Press.
KAPLAN, R. S., & NORTON, D. P. (2001). Transforming the Balanced Scorecard from perfor-
mance measurement to strategic management: Part I. Accounting Horizons, 15,
87–104.
KAPLAN, R. S., & NORTON, D. P. (2004). Strategy maps: Der Weg von immateriellen Werten
zum materiellen Erfolg (P. Horváth & B. Gaiser, Trans.) [Strategy maps: Converting
intangible assets into tangible outcomes] (1st ed.). Stuttgart, Germany: Schäffer-
Poeschel Verlag Stuttgart.
KAWOHL, J., ZEIBIG, D., & MANZ, E. (2016). Profisport 4.0: Wohin rollt die Fußballbundesliga?
[Professional Sports 4.0: Where is the Bundesliga aiming to?] Berlin, Germany.
KELLER, C. (2008). Steuerung von Fußballunternehmen: Finanziellen und sportlichen Erfolg
langfristig gestalten [Managing football companies: Shaping financial and athletic
success sustainably] (1st ed.). Berlin, Germany: Erich Schmidt Verlag GmbH & Co.
KICKER. (2017A). 3 Milliarden geknackt [3 billion exceeded]. Kicker-Sportmagazin, 2017(6),
76–77.
XVII
KICKER. (2017B). Sportnachrichten [Sport news]. Retrieved March 1, 2017, from
http://www.kicker.de/
KLEINAU, C., KRETZMANN, C., ZÜLCH, H. (2016). Minimizing Corporate Social Irresponsibility to
Maximize Social Welfare. Global Journal of Business Research, 10, 77-91.
KPMG. (2017). Football Benchmark - Available information. Retrieved March 1, 2017,
from https://www.footballbenchmark.com/available_information
KRIVOGORSKY, V. (2006). Ownership, board structure, and performance in continental Eu-
rope. The International Journal of Accounting, 41, 176–197.
L
LANG, J. C. (2008). Corporate Governance der Fußballunternehmen: Leitung, Überwachung
und Interessen im Sportmanagement [Corporate governance of football compa-
nies: Management, monitoring, and interests in sport management] (1st ed.). Ber-
lin, Germany: Erich Schmidt Verlag GmbH & Co.
LAUFMANN, A.-K. (2016). Werder Bremen: Von der Philanthropie zu einem strategisch
verankerten Corporate Social Responsibility Management [Werder Bremen: from
philantrophy to a strategically-anchored corporate social responsibility manage-
ment]. In H. Künzel (Ed.), Erfolgsfaktor performance management: Leis-
tungsbereitschaft einer aufgeklärten Generation [Success factor performance
management: commitment of an enlightened generation] (pp. 199–210). Heidel-
berg, Germany: Springer Gabler.
LIGAINSIDER. (2017). Noten und Punkte: Das LigaInsider-Ranking [Grades and scores: The
LigaInsider ranking]. Retrieved March 1, 2017, from
http://www.ligainsider.de/bundesliga/noten/
LITTKEMANN, J., OLDENBURG-TIETJEN, F., & HAHN, T. (2014). Hamburger Sportverein e. V. – quo
vadis? Eine Analyse der wirtschaftlichen Lage [Hamburger Sportverein e. V. – quo
vadis? An analysis of the economic situation]. Sciamus – Sport Und Management,
2014(4), 1–16.
XVIII
M
MADDEN, P. (2012). Fan welfare maximization as a club objective in a professional sports
league. European Economic Review, 56, 560–578.
MCGUIRE, J. B., SUNDGREN, A., & SCHNEEWEIS, T. (1988). Corporate social responsibility and
firm financial performance. The Academy of Management Journal, 31, 854–872.
MEEDIA. (2017). Sky-Bundesliga: FC Bayern-HSV und Schalke-Hoffenheim holen die Top-
Quoten des Spieltags [Sky-Bundesliga: FC Bayern-HSV and Schalke-Hoffenheim
with highest ratings of the matchday]. Retrieved from
http://meedia.de/2017/02/27/sky-bundesliga-fc-bayern-hsv-und-schalke-
hoffenheim-holen-die-top-quoten-des-spieltags/
MEYNHARDT, T., & FRANTZ, E. (2016). Der Public Value des RB Leipzig - Eine Untersuchung
des Gemeinwohlpotenzials des RB Leipzig [The public value of RB Leipzig - An in-
vestigation of RB Leipzig’s public good potential]. Leipzig, Jena, Germany: HHL
Leipzig Graduate School of Management and Friedrich Schiller University Jena.
N
NEELY, A., GREGORY, M., & PLATTS, K. (1995). Performance measurement system design: A
literature review and research agenda. International Journal of Operations & Pro-
duction Management, 15(4), 80–116.
NETZSIEGER. (2017). Vereinsmitgliedschaften der 1. Fußball-Bundesliga [Club memberships
of the football Bundesliga]. Retrieved from
https://www.netzsieger.de/ratgeber/bundesliga-mitgliedschaften
NIELSEN SPORTS. (2016). Umfrage: Die Lieblingsvereine der deutschen Fußball-Anhänger
[Survey: The favorite clubs of German football supporters]. Retrieved from
http://nielsensports.com/de/umfrage-fussball-bundesliga-lieblingsvereine-fans-
deutschland/
O
OECD. (2005). Glossary of statistical terms: Corporate governance. Retrieved from
https://stats.oecd.org/glossary/detail.asp?ID=6778
XIX
OMS. (2016). The Premier League 2015/16 Organizational Maturity Index (OMI). Bristol,
United Kingdom.
ORLITZKY, M., SCHMIDT, F. L., & RYNES, S. L. (2003). Corporate social and financial perfor-
mance: A meta-analysis. Organization Studies, 24, 403–441.
P
PITTS, B., DANYLCHUK, K., & QUARTERMAN, J. (2014). Analysis of sport management literature:
European Sport Management Quarterly. Sports Management International Jour-
nal: Choregia, 10(2), 45–72.
PITTS, B., & PEDERSEN, P. M. (2005). Examining the body of knowledge in sport manage-
ment: A content analysis of the Journal of Sport Management. Sport Management
and Related Topics Journal, 2(1), 33–52.
PRIGGE, S. (2015). Memberness A research proposal for a concept to describe, analyze, and
measure members’ influence in a professional football club as part of its corporate
governance. HSBA Comments, 01/2015, 1–5.
Q
QUITZAU, J. (2016). Das Spiel als Premium-Produkt: Die Ökonomie der Bundesliga [The
game as premium product: The economy of the Bundesliga]. Retrieved from
http://www.bpb.de/gesellschaft/sport/bundesliga/160773/oekonomie-der-
bundesliga?p=all
R
REICHHELD, F. F., & SCHEFTER, P. (1998). E-loyalty: Your secret weapon on the web. Harvard
Business Review, 78 (July-August), 105–113.
REINARTZ, W., KRAFFT, M., & HOYER, W. D. (2004). The customer relationship management
process: Its ,measurement and impact on performance. Journal of Marketing Re-
search, 41, 293–305.
RELVAS, H., LITTLEWOOD, M., NESTI, M., GILBOURNE, D., & RICHARDSON, D. (2010). Organization-
al structures and working practices in elite European professional football clubs:
XX
Understanding the relationship between youth and professional domains. Europe-
an Sport Management Quarterly, 10, 165–187.
ROHDE, M., & BREUER, C. (2016). Europe’s elite football: Financial growth, sporting success,
transfer investment, and private majority investors. International Journal of Finan-
cial Studies, 4(2), 12, 1–20.
ROSENBUSCH, N., BRINCKMANN, J., & BAUSCH, A. (2011). Is innovation always beneficial? A
meta-analysis of the relationship between innovation and performance in SMEs.
Journal of Business Venturing, 26(4), 441–457.
S
SC FREIBURG. (2017). Wiederaufstieg und positives Jahresergebnis [Promotion and positive
annual result]. Retrieved from https://www.scfreiburg.com/news/wiederaufstieg-
und-positives-jahresergebnis
SIMILARWEB. (2017). SimilarWeb - Digital market intelligence and website traffic. Retrieved
March 1, 2017, from https://www.similarweb.com/
SMITH, R. E., & WRIGHT, W. F. (2004). Determinants of customer loyalty and financial per-
formance. Journal of Management Accounting Research, 16(1), 183–205.
SPOAC. (2017). SPOAC Sportbusiness-Studie 2017 [SPOAC sport business study 2017].
Hamburg, Germany: Sascha L. Schmidt, Felix Krause.
SPONSORS. (2016). Mitglieder, Fanclubs und Jahresbeiträge in der Bundesliga und 2. Bun-
desliga (2015/16) [Members, fan clubs, and yearly fees in the Bundesliga and 2.
Bundesliga (2015/16)]. SPONSORs Magazin, 2016(1).
SPORT BILD. (2016). Bundesligisten im Fan-Vergleich [Fan comparison of Bundesliga
members]. Retrieved from
http://sportbild.bild.de/bundesliga/2016/bundesliga/bvb-vor-schalke-
mitgliedszahlen-der-bundesligisten-48693912.sport.html
SPRENG, R. A., MACKENZIE, S. B., & OLSHAVSKY, R. W. (1996). A reexamination of the determi-
nants of consumer satisfaction. Journal of Marketing, 60(3), 15–32.
XXI
STANFORD UNIVERSITY. (2015). Equality of opportunity (Stanford Encyclopedia of Philoso-
phy). Retrieved March 26, 2017, from https://plato.stanford.edu/entries/equal-
opportunity/#LevPlaFieConLucEga
STATISTA. (2016). Fußball-Interesse in Deutschland bis 2016 [Interest in football in Germa-
ny until 2016]. Retrieved March 1, 2017, from
https://de.statista.com/statistik/daten/studie/171037/umfrage/interesse-an-der-
sportart-fussball/
STATISTA. (2017). European football market size 2006-2017. Retrieved from
https://www.statista.com/statistics/261223/european-soccer-market-total-
revenue/
STATISTA. (2017). Mitgliederzahlen der Bundesliga-Vereine 2016/17 [Membership figures
of the Bundesliga clubs 2016/17]. Retrieved June 30, 2017 from
https://de.statista.com/statistik/daten/studie/29723/umfrage/anzahl-der-
mitglieder-ausgewaehlter-vereine-der-bundesliga/
T
TECHNISCHE UNIVERSITÄT BRAUNSCHWEIG. (2015). Fußballstudie 2015: Die Marken-Landschaft
der Fußball-Bundesliga [Football study 2015: The brand environment of the foot-
ball Bundesliga]. Braunschweig, Germany: David M. Woisetschläger, Christof
Backhaus, Jan Dreisbach, Marc Schnöring.
TECHNISCHE UNIVERSITÄT BRAUNSCHWEIG. (2016). Fußballstudie 2016: Die Marken-Landschaft
der Fußball-Bundesliga [Football study 2016: The brand environment of the foot-
ball Bundesliga]. Braunschweig, Germany: David M. Woisetschläger, Christof
Backhaus, Jan Dreisbach.
TRANSFERMARKT. (2017). Fußball-Transfers, Gerüchte, Marktwerte und News [Football
transfers, rumors, market values, and news]. Retrieved March 1, 2017, from
http://www.transfermarkt.de/
U
UEFA (2015). Financial fair play: All you need to know. Retrieved February 18, 2017, from
http://www.uefa.com/community/news/newsid=2064391.html
XXII
UEFA (2017). UEFA rankings for club competitions. Retrieved March 1, 2017, from
http://www.uefa.com/memberassociations/uefarankings/club/
V
VINCK, C. (2009). Die Entwicklung einer Balanced Scorecard für eine Non-Profit-
Organisation: Am Beispiel des Deutschen Tennis Bundes e. V. [Developing a Bal-
anced Scorecard for a non-profit-organisation: The example of German Tennis
Federation]. Hagen, Germany: Books on Demand.
W
WEHRLE, A., & HEINZELMANN, M. (2004). Reporting und strategische Steuerung im
Profifußball: Konzeption und Umsetzung eines Balanced Scorecard basierten Sys-
tems beim VfB Stuttgart [Reporting and strategic management in professional
football: Conception and implementation of a Balanced Scorecard-based system
at VfB Stuttgart]. Controlling: Zeitschrift Für Erfolgsorientierte Unternehmenssteu-
erung, 16, 349–354.
WORLD ECONOMIC FORUM. (2015). The Global Competitiveness Report. Retrieved from
http://reports.weforum.org/global-competitiveness-report-2015-2016/report-
highlights/