Management Presentation 27 th September 2002. Corporate Strategy Andrew Lindberg Managing Director...
91
Management Presentation 27 th September 2002
-
Upload
angel-dorsey -
Category
Documents
-
view
215 -
download
0
Transcript of Management Presentation 27 th September 2002. Corporate Strategy Andrew Lindberg Managing Director...

Management Presentation27th September 2002

Corporate Strategy
Andrew LindbergManaging Director
27th September 2002

Our financial objectives are clear
Target:
• 15% ROE
• Consistent trend EPS growth
• Stable dividend
• Improve quality of earnings
• Efficient capital management

The global asset manager model defines long term growth as being both vertical and horizontal
Australian other grains
Australian other commodities
Australian wheat
International wheat
International other grains & commodities
Solid domestic base enables domestic value chain integration and international growth
Grower Relation-
ships
Customer Relation-
ships
Va
lue
ad
din
g p
rod
uc
ts a
nd
se
rvic
es
Rural Services Inputs
Seed & Grain Tech.
Shipping
Finance & Risk Mgmt.
Grain Acq. & Trading
Supply Chain
Milling & Processing
Pool Mgmt.

Maximise value for growers, customers & shareholders
In order to achieve our objectives, AWB has clearly defined strategies
• Win grower mandates• Create value through supply
chain efficiencies
• Sustain trading out performance • Lead in grain technology
• Maintain growth and diversify revenue streams
• Strengthen stakeholder support
• Secure end user demand• Strengthen organisational
capability and performance

Specific near term initiatives will support our strategies
• Diversify domestically and offshore
– Expand finance & risk management offerings
– Strengthen position in Asia and Middle East and develop global trading business (Geneva)
– Step up investigation of M&A opportunities
• Increase grains under management
• Strengthen our rural services base
• Supply chain investments that provide commercial returns
• Active capital management
• Ensure effective cost control

In 2001/02 AWB strengthened its core business …
Strengthen core business to sustain performance
• Further improvement to a key under-performing business area - Chartering
• Strengthening of the performance of the Single Desk and implementation of new performance based remuneration model
• Broaden financial and risk services to growers and customers
• Strengthen grower/rural services and financial advisory networks
• Development of AWB supply chain network with capacity of around 3mt
• Development of superior grain varieties through a JV with Syngenta
• Establishment of new business processes, systems and product development capability
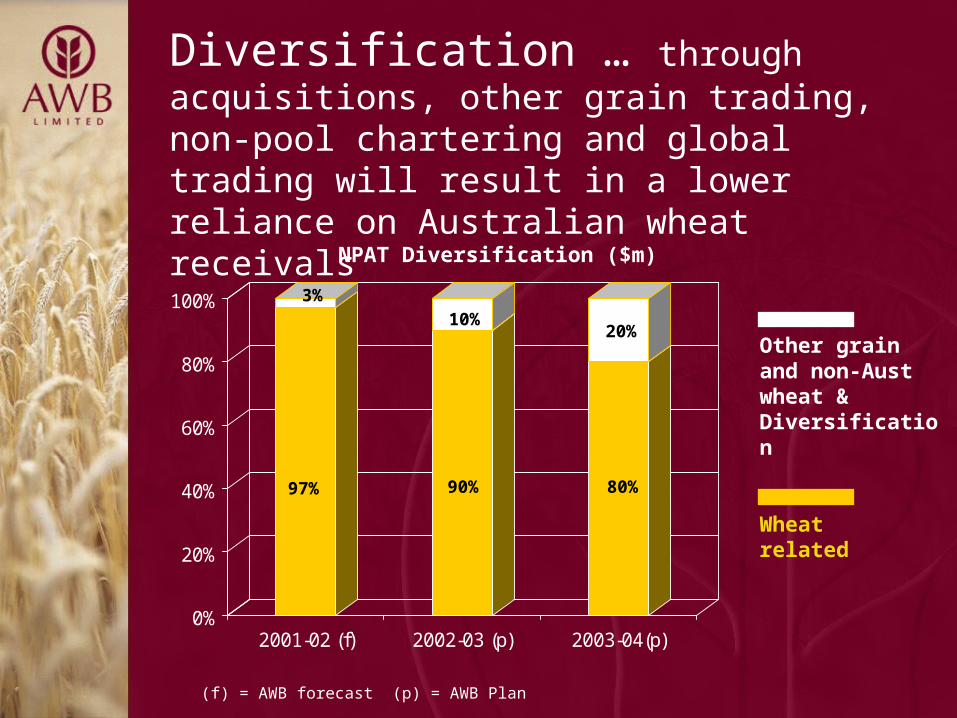
Diversification … through acquisitions, other grain trading, non-pool chartering and global trading will result in a lower reliance on Australian wheat receivals
0%
20%
40%
60%
80%
100%
2001-02 (f) 2002-03 (p) 2003-04(p)
(f) = AWB forecast (p) = AWB Plan
Other grain and non-Aust wheat & Diversification
Wheat related
NPAT Diversification ($m)
97% 90% 80%
3%10%
20%
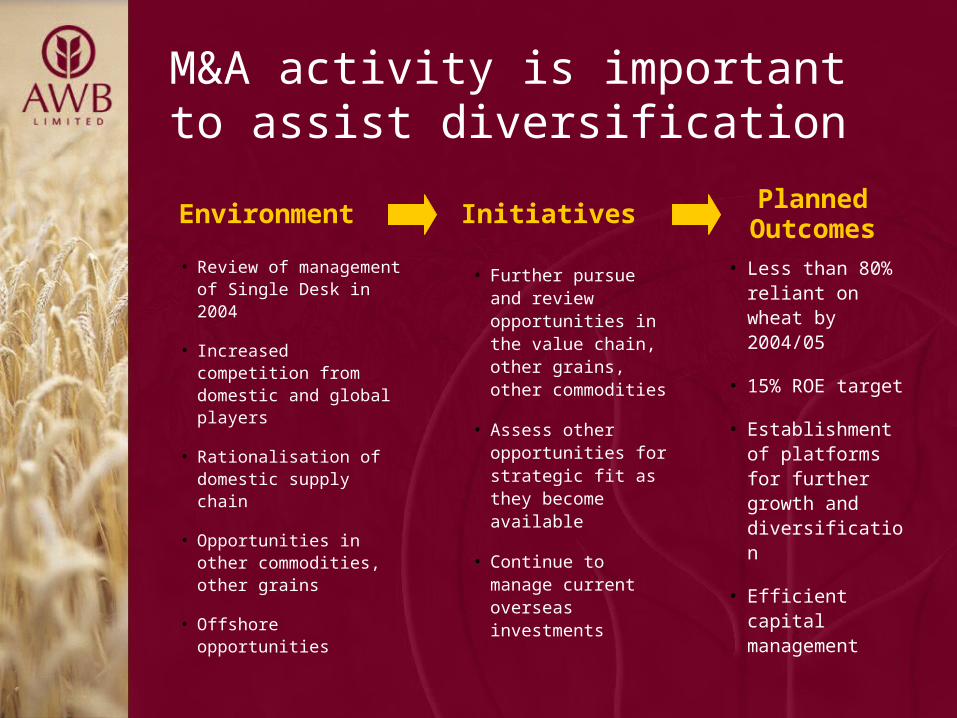
M&A activity is important to assist diversification
• Less than 80% reliant on wheat by 2004/05
• 15% ROE target
• Establishment of platforms for further growth and diversification
• Efficient capital management
• Further pursue and review opportunities in the value chain, other grains, other commodities
• Assess other opportunities for strategic fit as they become available
• Continue to manage current overseas investments
• Review of management of Single Desk in 2004
• Increased competition from domestic and global players
• Rationalisation of domestic supply chain
• Opportunities in other commodities, other grains
• Offshore opportunities
Planned Outcomes
InitiativesEnvironment

Investment highlights
• Significant expertise and scale in global wheat marketing
• One of the largest integrated global wheat managers
• Large existing customer base
• Manager of the Single Desk
• Potential to broaden range of products, services and
customers in Australia and overseas
• Strong balance sheet and dividend paying capacity

QUESTIONS
Corporate Strategy

Capital Management, Risk Management & Financial Services
Paul InglebyChief Financial Officer
27th September 2002

Efficient capital management
01/02
Shareholders’ funds (average) $772m
PAT (midpoint of range) $105m
ROE 13.6%
EPS 38 cps
DPS 25-28 cps

Capital allocation
Capital is allocated (notionally to businesses)
• Main businesses that use capital are:
- Finance & Risk Management Products
- Grain Acquisition & Trading
- Supply Chain & Other Investments
• Other business streams include:
- Grain Technology
- Pool Management Services

Capital management
• We allocate capital using a top-down and bottom-up approach
• We consider a range of factors such as targeted credit rating, value at risk and the universe of agricultural operations and product companies
• As an indication, for 2001/02 we allocated:
- Finance & Risk Management Products $150m
- Grain Acquisition & Trading $200m
- Supply Chain & Other Investments $100m
• Other main capital uses include corporate assets
• As we diversify we will allocate capital accordingly

Capital management (cont)
• Capital management means getting maximum value from
capital through leverage within risk range
• We target rating levels and to some extent this will
determine if we have excess capital
• We are continually looking at ways to grow the business
- Organically
- Investments in end use assets
- Investments in supply chain
- Acquisitions

Capital management (cont)
Commercial Paper
• We fund the company and therefore businesses through 3 commercial paper (CP) programs – AUD, US & EURO
• We have a relationship bank panel of 16 throughout the world. These banks provide liquidity support i.e. ability to fund company at all times even when markets are tight
• Last year AWB issued over $US5b in CP
• We are an active participant in the FX, Options and Swaps markets

Capital management (cont)
• We are constantly looking at the mix of capital and debt in relation to the opportunities available to us
• Depending on the range and size of these opportunities we will consider the structure of the balance sheet for maximum value to shareholders
• This will include raising some long term debt (none currently) which could take the form of medium term notes, private placement, or hybrid securities.
• We will consider a share buy back if this makes sense for shareholder value

Risk management
AWB comprises of a range of businesses with a range of risk profiles.
AWB has a focus on risk management:- Corporate Risk Board Committee (CRBC)
- Corporate Risk Review Committee (CRRC)
- Corporate Risk Unit (CRU)
Key factors are:- Physical sales
- Foreign exchange management
- Wheat price management
- Administration
- Governance

Financial services product range has been
expanded to provide more flexibility to growers
• Pool payment options take-up above 65%
• Enhanced relationship with growers from more flexible product suite
• Improved skill set and product knowledge of staff in marketing financial services
• Improve ‘time to market’
• Wealth creation pilot program
• New Group GM of Financial Services, Marcus Kennedy
• Expand loan products:- Harvest Loan- Flexible Drawdown Loan
- Pre Delivery Loan
• New payment products:- Advanced Payment- Deferred Payment
• Strengthening of grower services network
• 6 new Regional Financial Services Managers as on-ground product experts
• Reliant on value of national wheat export crop
• Increase in cash purchases decreases market available for loans
• Increased competition from banks, particularly NAB, ANZ and CBA
• Expand financial services to offer more cashflow choices for grain marketing decisions
• Opportunity to introduce wealth creation products and strategies to growers
Planned OutcomesInitiativesEnvironment

QUESTIONS
Capital Management, Risk Management & Financial Services

Grower Interface
Tim GoodacreGroup General Manager Corporate
27th September 2002

Grower profile
• 35,000 grain growers
• Average wheat yield = 1.91* tonnes per hectare
• Average wheat grower cash income = $113,503*
• Average size of grain cropping per farm = 500ha
• Average wheat tonnage produced per grower = 600t
• Average wheat delivered to AWB per grower = 480t
• Grower attitudes**
- 88% support the Single Desk
- 88% support AWB’s management of the Single Desk
*Average over 3 years to 2001-02, source = ABARE ** Independent Survey, 2002

The relationship with growers will be enhanced by a stronger rural presence
• Continue to
enhance existing
deep relationship
with growers
• Maximise market
penetration
• Retention of Single
Desk beyond 2010
• Expanded grower
services network
- 63 AWB
regional staff
(plus 6 financial
advisers)
- 25 AWB
regional offices
- 10 agencies
• Increased
competition by banks
and bulk handlers
• New more flexible
suite of AWB
products
• Growers perceive
AWB is heading in
the right direction
• 88% grower support
for Single Desk
marketing
Planned Outcomes
InitiativesEnvironment
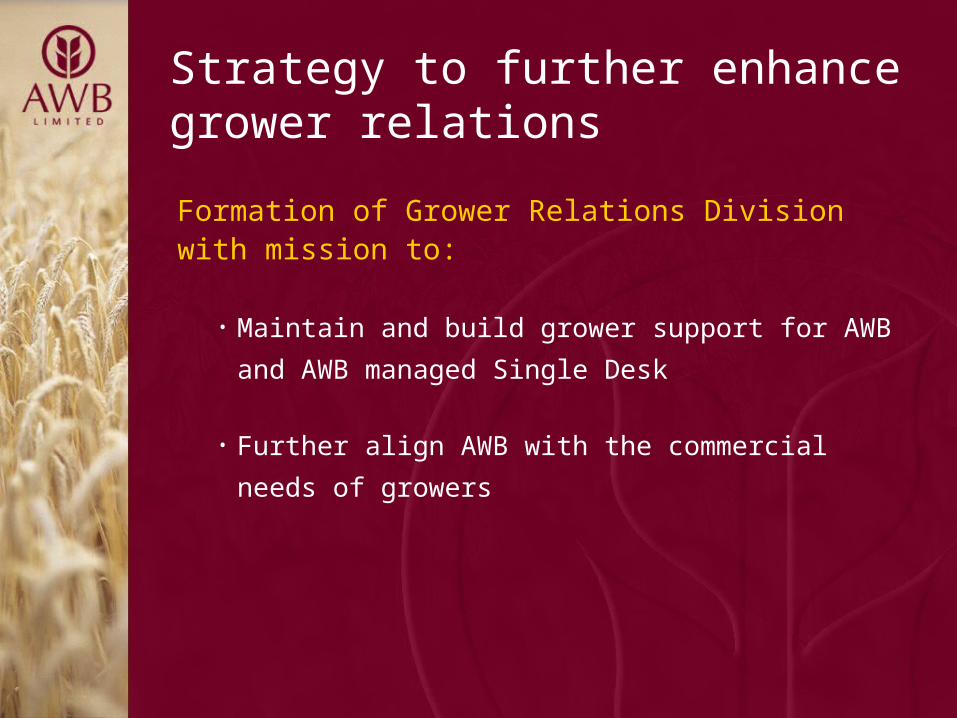
Strategy to further enhance grower relations
Formation of Grower Relations Division with mission to:
• Maintain and build grower support for AWB and AWB
managed Single Desk
• Further align AWB with the commercial needs of
growers

QUESTIONS
Grower Interface

National Pool and the Pool Services Management Model
Sarah ScalesGeneral Manager National Pool
27th September 2002

AWB
Growers
Business services
Pool payments
Wheat deliveries
AWBI Export markets
Wheat
marketing
Monitor
performance of
AWBI
Wheat Export
Authority
Relationship of the WEA, AWB & AWBI

Performance Based Remuneration
• Retention of Single
Desk beyond 2010
• Performance based
remuneration system
fully integrated into
business
• Continued
maximisation of
returns to growers
through pool out-
performance
• Focus on performance
improvement
• Management of the
relationship with the
WEA
• OPI implementation
• About 50% decreased
crop value in 2002/03
compared to 2001/02
• 2002-03, second year
of OPI arrangements
- First year of OPI
entitlement from
previous year
• Review of management
of Single Desk in 2004
Planned Outcomes
InitiativesEnvironment
Note: OPI = Out Performance Incentive

AWB(I)’s Mandate
Maximise net returns to National Pool Growers
• Maximise USD FOB price obtained
• Minimise USD/AUD rate
• Minimise domestic supply chain costs deducted from growers
Actively manage the main harvest risk exposures
• Management of wheat price, currency and domestic supply chain cost exposures
Total harvest coverage
• Accept delivery of all grades of Australian wheat (subject to minimum quality standards)
• Sell all Australian wheat delivered to the National Pool in the pool period

AWB(I)’s Pool Management Performance Benchmark - WIB
1. USD Wheat PriceSub-
benchmark
2. FX (AUD/USD)
Sub- benchmark
3. Domestic Supply Chain
Sub- benchmark
• WIB designed to measure AWBI performance consistent with mandate
• Integrated nature of risk and return
- Price
- FX
- Supply Chain costs
• Applicable to market:
- World/Competitor prices
- Liquidity, demand, capacity constraints.
• Seasonal pool basis – applicable to management and growers
WIB Pool Benchmark
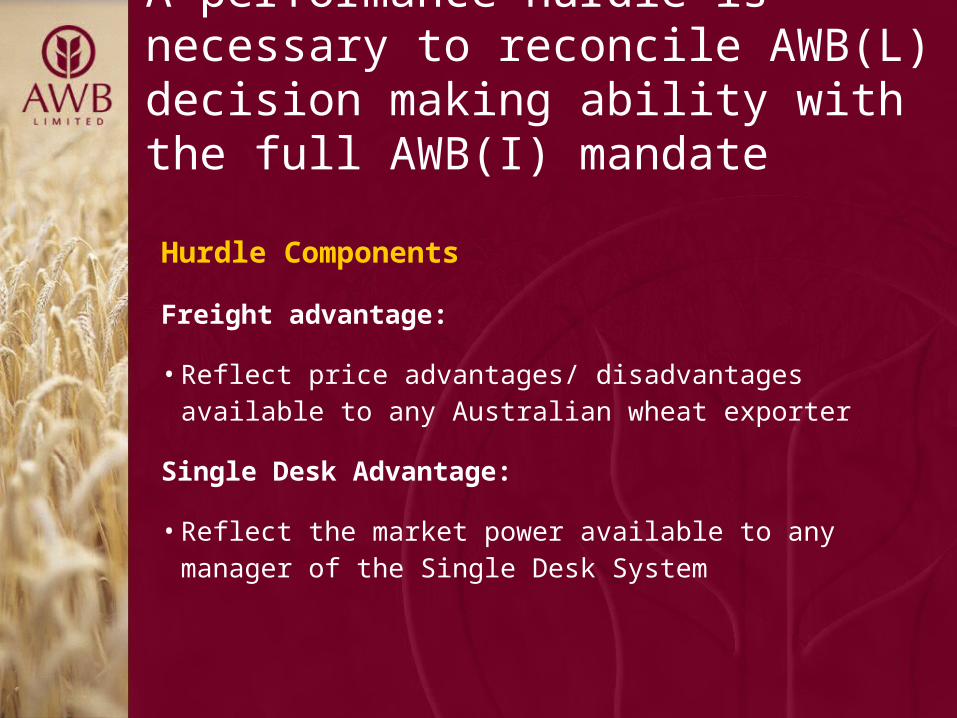
A performance hurdle is necessary to reconcile AWB(L) decision making ability with the full AWB(I) mandate
Hurdle Components
Freight advantage:
• Reflect price advantages/ disadvantages available to any Australian wheat exporter
Single Desk Advantage:
• Reflect the market power available to any manager of the Single Desk System

Performance Based Remuneration Model
1. Base Fee
• 1.5% of Gross Pool Value(GPV)
• Subject to a cap of AUD$60m and a floor of AUD$45m (CPI indexed)
• Effectively covers operating costs to provide services to AWB(I)
• Reduces risk to both AWB(I) and AWB(L)
2. Out-Performance Incentive (OPI)
• Calculated as 20% of revenue generated above the WIB plus hurdle: = [GPV – {WIB + HURDLE}] x 20%
Total cap of 3% of GPV, limiting risk to AWB(I)
The performance based remuneration model has a two-
tiered payment system consisting of:

Conclusion
• Consistent with the Pool mandate:
- Strives for out-performance within defined risk parameters - balancing grower risk and grower rewards (Pool Returns)
- Does not strive for maximum returns regardless of risk
• Transparent, objective, auditable
• Provides incentive to the manager to maximise grower returns
• Grower preference: reflects main revenue and cost drivers for the National Pool & links AWB(L) remuneration to Pool Performance
• Practically applicable to the business & consistent with industry standards
• Quantifies and limits remuneration risk to AWB(I) and AWB(L)
• Encourages AWB(L) to invest in achieving out-performance

QUESTIONS
National Pool and the Pool Services
Management Model

Grain Acquisition & Trading
Peter GearyGroup General Manager Trading
27th September 2002

Domestic and global trading
Grain Acquisition & Trading
Domestic Global
• Establish global trading
business in Geneva
• Establishing new trade flows
with new customers
• 02/03 opportunity to supply
existing customers other origin
wheat
• Global trading to trade 1.5
million tonnes in 2002/03
•Contract Acquisition Products
- 70 Regional based representatives
- 2 million tonnes committed prior to harvest 2001/02
•Domestic Trading
- Wheat and other grains
- 50 domestic customers
- Grain traders
- Pool transfers
- Normally trade 4.5 to 5 million tonnes
•Non Wheat exports
- Canola, sorghum, barley

Our domestic trading strategy
• Grain is predominately
accumulated incrementally from
growers
• Grain is physically priced with
customers or priced in the
derivatives market leaving a basis
position to trade
• AWB also trades with other grain
companies which increases the
volume of grain trade and liquidity
to close physical positions
• Positions will be built and
transferred to the Pool in the
appropriate circumstances
Major factors impacting
trading strategy for
growers in 02/03
• Domestic regional
shortages in high
domestic demand areas

Mix of traded grain
0
1
2
3
4
5
6
99/
00
00/
01
01/
02
02/
03(p
)
Pool wheat Trading Wheat
Other Grain Fwd Contract
2002/03 we could see:
• Forward contracting
approaching 2000/01 levels
• East coast cash prices are
outstripping national pool
returns and will be primarily
trade for cash
• Transfers to the pool, (other
than on east coast) but at
reduced levels
(p) = AWB projection
mt

Trading risks and how we manage them
• Local production – volume traded
• Price volatility – production in exporters &
importer
• Foreign exchange exposure – active
management
• Hedging is used to price physical
exposures (not to speculate)
• Basis trading – requires correctly
positioning physical product in line with
movements in basis
Drought conditions result in contract
washouts
• replacement cost to protect position
• credit risk of collecting washout settlement

Grower demand for risk products increasing
• Increased take-up
of Riskassist
• Stronger
relationship with
growers
• Contribution to
securing end user
demand through
solution selling
• Expanded range of risk
management products:
- Basis Pool
- Riskassist – Basis
Pool Products
- Riskassist – Fixed
Basis Contracts
- Riskassist –
Consumer Risk
Services
• Grower demand for
risk products
increasing
• Opportunity to expand
the range of contract
alternatives to
growers
• Opportunity, as part of
trading group, to
provide solution
selling to end users
Planned Outcomes
InitiativesEnvironment

QUESTIONS
Grain Acquisition & Trading

Supply Chain Investments & Chartering
Jill GillinghamChief Operating Officer
27th September 2002

Agenda
• Objectives for supply chain
• Outline of supply chain strategy
• Examples of returns
• Chartering

Objectives for supply chain
• Reduce costs
• Improve efficiency
• Secure grain for the long-term
• Commercial return on capital invested
East Coast:Compete
West Coast:Collaborate
Strategy

Domestic supply chain strategy
•Supply chain optimisation
•Deliver a return on investment above weighted average cost of capital
•OPI for supply chain sub-benchmark
• Increase AWB’s ability to access the wheat flow
•Strategic hedge against deregulation
• New grain centres built
• On farm storage pilot being conducted during the 2002/03 harvest in Southern NSW
• Investment in NSW rail and grain handling infrastructure via joint rail freight agreement with FreightCorp
• Purchase of rail wagons – leased to Freight Australia
• Port options being investigated
• JV / Merger options being investigated with CBH and Grain Pool of WA
• Supply chain costs of $1.4b
• Domestic supply chain inefficient
• Old infrastructure BHCs have geographic monopolies and employ traditional uniform pricing structures
• Freight companies with traditional monopolies have also employed uniform pricing structures
• Susceptible to competition from new entrants with modern infrastructure and differential pricing
Planned OutcomesInitiativesEnvironment

Expenditure on AWB grain centres*
Number of Sites (Cumulative)
Capacity Location Capital Cost (Cumulative)
1999/00 1 200k VIC $11M
2001/02 7 1m4 VIC
3 NSW$58M
2002/03 16 2.9m
4 VIC
9 NSW
3 SA
$130M
2003/04 Up to 22 4.0m TBA Up to $175m
* 17 Grain centres have been announced

Grain Centres – Dimboola Grain Centre
1999/00 2000/01 2001/02f
Tonnes Received (kt) 89 203 232
EBITDA ($m) 0.6 1.4 1.9
EBIT ($m) (0.1) 0.5 1.0
Asset WDV $10.5m $9.7m $8.9m
ROI (1.0%) 5.0% 11.0%
• Investment of $11.3m in 1999
Note: WDV = written down value

Grain Centres – Standard new site
Year 1 Year 2 Year 3 Year 4 Year 5
Tonnes Received (kt) 100 125 168 168 168
EBITDA ($m) 0.4 0.8 1.2 1.2 1.2
EBIT ($m) (0.2) 0.2 0.7 0.7 0.7
Asset WDV $6.7m $6.1m $5.5m $5.0m $4.5m
ROI (3.0%) 3.3% 12.7% 14.0% 15.6%
• Investment of $7.3m for each site

Current Investments – Melbourne Port Terminal
Note: AWB’s financial year differs from the contract period. High payment rates for initial tonnages are spread between alternate years leading to the variation in financial results shown above.
2000/01 2001/02f
Tonnes Received (kt) 1,257 1,222
EBITDA ($m) 3.9 3.1
EBIT ($m) 3.1 2.3
Asset WDV $17.8m $17.0m
ROI 17.0% 13.5%
• Investment of $18.6m in 2000

Current Investments – Rail Wagons
Year 1 Year 2 Year 3
EBITDA ($m) 1.15 1.15 1.15
EBIT ($m) 0.8 0.8 0.8
Asset WDV $4.8m $4.4m $4.0m
ROI 16.8% 18.2% 19.8%
• Investment of $5.4m in 2001

Customer
Chartering
National Pool/Trading
External
CFR or FOB+FR
FR
FR
One Parcel of Grain
Three AWB Contracts
Freight offer by
Chartering
“Market on the Day”• No margin • Net of Adcom
Chartering
Position Takers
plus Success Fee
1
2
3
Chartering contract flow

Objective is to increase non-pool chartering
• Increase tonnes
sold CFR to around
55% by 2004/05
• Triple non pool
chartering tonnes
by 2004/05 (to
1.6mt)
• Charter 2.0 million
tonnes from
Geneva office by
2003/04
• Increase pool tonnes
sold CFR
• Build a chartering
program to achieve
economies of scale
thereby enabling
globally competitive
rates for non pool
chartering
• Develop freight
function in Geneva to
complement Global
Trading
• Pool chartering
dependent on size of
export crop
• Market conditions
putting pressure on
trading margins
• Opportunity to expand
non pool business
• Opportunity to increase
market penetration of
chartering through
global trading
Planned Outcomes
InitiativesEnvironment

Summary
• Reduce costs
• Improve efficiency
• Secure grain for the long-term
• Commercial return on capital invested
QUESTIONS
Supply Chain Investments &
Chartering
Presentation Supplement

Finance & Risk Management Products

Wheat receivals currently have significant impact on profit
Sensitivity Analysis
Key DriversIncremental
changeImpact on
2002-03 NPAT
National Wheat Crop (mt) +/- 1mt
USD Wheat Price (US$) +/- US$5.00
USD/AUD Exchange Rate -/+ $0.05
Domestic Interest Rate (%) +/- 1.0%
+/- $6 - 7m
+/- $1m
+/- $3m - 4m
+/- $2m - 3m

Opportunity to introduce wealth creation products and strategies to growers
• $3.5-$5B in gross pool value per annum
• Each crop farm has $70,000 in liquid assets ($31k shares, $17k deposits)
• Average balance of Farm Management Deposit account is $40,000 (medium/long term investment product)
• Succession planning issues for growers
• AWB has strong brand name with growers
• Pilot program in 2003
Source: ABARE, Australian Farm Surveys Report 2001. Dept of Fisheries, Agriculture and Forestry Australia

Strengthening our financial services manufacturing and distribution capability
• Marcus Kennedy, new Group General Manager Financial Services
- Strong financial services background
• Grower Services Division
- 63 regional staff, 25 regional offices and 10 agencies
• 6 new Regional Financial Services Managers
- On-ground product experts
• Product Development Division
- Improving ‘time to market’ capability
• New SAP system which enables products to be built in-house rapidly

AWB business sensitivities
Climate -Impact on domestic and offshore crop production
International prices
& exchange rates
-Wheat price impacts
-AUD relative to USD
-Increase in US and European farm subsidies
Global Markets-Instability in Iraq
-Increasing role of minor exporters
Regulatory-Review of management of Single Desk in 2004 by WEA
-ACCC
Competitive
-Rationalisation of domestic supply chain
-Banks and bulk handlers providing financial services
-Global traders entering domestic market

Pool management services risk profile
Operation Risk Control / Risk Mitigator
National Pool
• OPI Fee Return
• Price Risk (Flat & Basis)*
• FX Risk*
• Interest rate risk*
• Sales risk*
• Crop size*
• Logistics risk*
• Credit risk*
• Hedge Policies & Benchmarks
• Board Committees Oversight
• Position Reporting
• Mgt Risk Committee Monitoring
• Credit Limits on Counter-Parties
• Internal/External Audit Reviews
• Credit Risk Transfer
• Insurance
* Grower risks

Finance & risk management products risk profile
Operation Risk Control / Risk Mitigator
Financial services products
• Underwriting Risk
• Size of Pool
• Margin on Loans
• Underwriting Fees
• Reduced Take-up of Harvest Payment Products
• Loan Book Interest Rate
• Competition
• Underwriting risk model mgt
• Grower Services relationship management
• Interest Rate risk management policies
• Product design flexibility and speed to market
Basis Pool Management
• Basis Pool Receival Tonnes
• Management & underwriting fee
• Grower Services relationship mgt
Discretionary Treasury Trading
•Market risk• FX & IR risk limits
• Mgt Risk Committee Monitoring
Riskassist
•Tonnes Managed by Risk Assist
•Risk Assist Fee
•Grower credit risk
• Contracting policy limits
• Grower Services relationship mgt
• Insurance to mitigate potential

Grain acquisition & trading risk profile
Operation Risk Control / Risk Mitigator
Domestic Trading
• Trade Execution Management
• Credit Risk
• Market Risk
• VAR & Trading Limits
• Board Committee oversight
• Position reporting
• Mgt Risk Committee Monitoring
Grain Contract Acquisition Products
• Credit Risk
• Grower Services relationship management
• Grower Services "Almanac" Policies
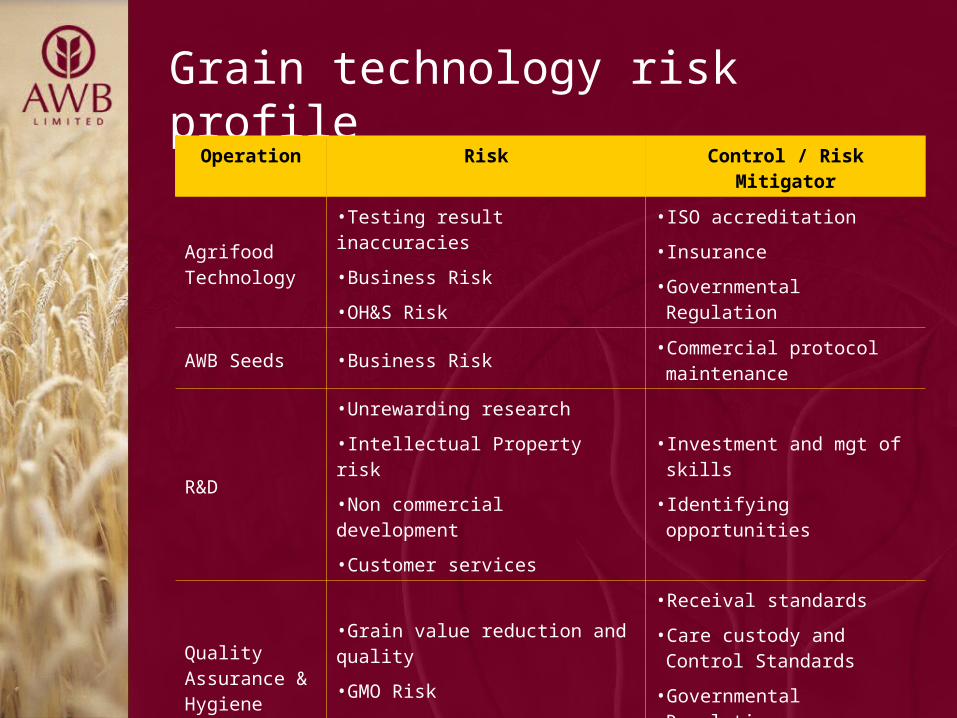
Grain technology risk profile
Operation Risk Control / Risk Mitigator
Agrifood Technology
•Testing result inaccuracies
•Business Risk
•OH&S Risk
• ISO accreditation
• Insurance
• Governmental Regulation
AWB Seeds •Business Risk• Commercial protocol maintenance
R&D
•Unrewarding research
•Intellectual Property risk
•Non commercial development
•Customer services
• Investment and mgt of skills
• Identifying opportunities
Quality Assurance & Hygiene
•Grain value reduction and quality
•GMO Risk
•Customer service risk
• Receival standards
• Care custody and Control Standards
• Governmental Regulation
• AWB GMO Policy

Supply chain & other investments risk profile
Operation Risk Control / Risk Mitigator
Chartering • Pool Receival Tonnes
• Chartering Price risk
• National Pool service
• FX and Chartering Price Risk Limits
• Insurance
Domestic Investments (Grain Centres)
• Tonnes Handled/Received
• OH&S Risk
• Operational Risk
• Business/Grower relationship management
• O,H&S Risk management strategy
• Insurance
Offshore Investments
•Country/Political Risk
•Market Risk
•Business Risk
• Active Board Management and Oversight
• Risk limits and policies

Pool Management Services

AWB National Pool
AWB Pool Management Services
International Sales & Marketing
Managing the Wheat Supply Chain
Risk Management Services
Research & Development
Grower Services
AWB Limited manages AWB National Pool to maximise net pool returns to growers and provide Pool Management Services

AWB National Pool
National Pool
AWB Limited
Customers Growers
Receival & BulkHandling Freight Port
Maintains “paddock to
plate”
Integrated value chain
Increases competition &
drives cost savings

Managing to achieve AWB(I)’s Mandate
Management behaviour consistent with mandate:
• Maximise Pool Returns within defined risk parameters
• Performance Monitoring Models drives behaviour
• Performance Monitoring Models consistent with mandate
• Remuneration also drives behaviour
• Remuneration therefore consistent with mandate and
performance assessment of achieving mandate

Management of “paddock to plate” marketing
• National Pool generates value for growers through managing the value chain from farm-gate to end user
• “Line of sight” is maintained between customer and grower to ensure customers get the product they want and growers are rewarded for providing the product
• National Pool shapes the quality profile of the crop by:
• Setting receival standards
• Developing binning and segregation strategies
• Operating payment programs like Golden Rewards
• National Pool meets customers’ growing requirements through sophisticated site selection of cargoes based on specific quality attributes of the grain from a region or even receival point.
• Uses its customer relationships, its marketing ability and its confidence to back up the quality of the product to extract premiums and maintain and enhance market share

• In an effort to achieve cost reductions, the National Pool is becoming involved in tactical management of the supply chain
• Strategic management of grain flows
• Direct negotiation with service providers
• Coordinating interface between storage and handling, freight and port services
• Tactical management is increasingly allowing the National Pool to manage logistics and select most efficient distribution channels for specific parcels of grain
• National Pool returns all value generated back to growers in full – efficiency gains, blending and swap revenues
Integrated management of the value chain

Driving competition in the supply chain• National Pool involvement at the tactical level critical to it carrying out its
marketing program today and into the future.
• New players prepared to invest in new assets eg. AWB, ABA, movement across borders
• Incumbents investing in up grades and new sites to maintain their market position
• Similar reductions have been seen where competition has been introduced in rail freight services
• In NSW, have witnessed savings of between 8.3% and 17.5% depending on the level of competition on freight routes
• These are real savings being passed on to growers in the form of lower costs
• A more efficient industry will benefit all participants

• The benchmark aims to represent average USD price achieved for a passively managed portfolio of Australian Wheat (of known grade mix and volume) sold into global markets (of known global demand)
• It has three core elements:
- an expected price for Australian wheat based on the market prices of world traded wheat grades that can be related to Australian wheat prices
- a sell-down (allocation to market) profile which takes account of capacity and demand constraints
- a return from wheat price hedging in accordance with the Hedging Policy
USD Wheat Price Sub-benchmark

FX Sub-Benchmark:
• The FX benchmark aims to represent the currency outcome a passive manager could expect to achieve given the AWB(I) FX mandate and a passively managed $US wheat price exposure
Supply Chain Sub-Benchmark:
• The Supply Chain benchmark, unlike export wheat and FX, there is no ‘market’ in supply chain services. AWB is the price maker.
• The benchmark index aims to reflect the expected/passive outcome for supply chain costs,
• It adjusts for cost changes outside the control of the pool manager, such as those caused by different harvest sizes.
• It has three main components, Freight Costs, Bulk Handling costs & Port Costs
FX (AUD/USD) and Supply Chain Sub-benchmarks

Grain Acquisition & Trading

AWB Geneva office established
Business activities
• Australian wheat sales
• Non Australian wheat and feed-grain sales
• Freight
• Structured finance products/services
• Risk management products/services
Investment structure
• 100% AWBL ownership
• US$20m capital investment via AWBL
Tonnes traded 1.5mt in 2003
Management
• Skill and capability of core team is strong
• Office of 12

Supply Chain & Other Investments

Supply chain history in Australia
• Established more than 60 years ago yet remains remarkably unchanged
• Minor cost savings, competition and efficiency gains achieved in this time
• Competition in the supply chain has historically been limited – only small number of new entrants
• Incumbents still enjoy monopoly or near monopoly positions in their markets
• Incumbents enjoy high profit margins on storage and handling business – up to 50%
• BHC’s charge uniform prices across storage facilities leads to inefficient use of infrastructure

Supply chain costs demand attention
Export Customer
On-Farm Storage & Transport
$250m
Domestic Customer
Feed Wheat $40m
Milling Wheat $100m
Total supply chain
costs = $1.4
billion
Land-Based$750m
Sea-Freight$260m
Note: based on wheat production of 24 million
APW Pool Return
$189
$0
$50
$100
$150
$200
$250
NSW
port costs
rail freight
storage and handling
grower return
$50.45 supply chain cost

High capacity Shuttle Trains
Werris Creek GCF
Stockinbingal GCF
Branchline Shuttle Trains
Branchline Shuttle Trains
High capacity Shuttle Trains
Objective is to maximise asset utilisation• Grain consolidation facilities (GCF)
provide coverage to all of network –
including branchlines
• GCFs resolve Port access issues
• GCFs create two supply chains to
allow train cycling on a 24 hour basis

Typical efficiency drivers for grain train transport
Characteristics Efficient Operators Traditional
Silo load rate 1,000 t/hr 200 t/hr
Sliding length 42 wagons 15 wagons
Operating hours 24hrs / 7 days 8 hrs / 5 days
Track 23t axle loads15t – 19t axle
loads
Track speed 80km/hr 30km/hr
Wagon capacity 67t – 72t <50t
*AWB grain centre sites designed for optimal interface with rail transport providers

Grain Technology

LongReach Plant Breeders JVResearch & Germplasm
Enhancement
Commercial Breeding
Seed, Product Development &
Distribution
Grower Services & Supply Chain
Management
Risk Mgt Marketing
Customer Mgt
Specific research projects
Bundles of grower products & services under collaboration agreement: Seed, Agronomic Inputs, Finance & Risk Mgt, Contract Production systems
Crop Management Solutions
Millers, End Users, Consumers
AWB Product Management: Acquisition, Segregation Mgt, Logistics, Marketing, Technical Services, Agrifood
Grain Products
AWB Grain Technology, AWB Seeds, Syngenta Seeds, Agrifood, Grain Development, Seeds Management, Distribution, End Product & Processing R&D
Product Development
Long Reach Plant Breeders
AWB Market Intelligence, Syngenta Technology, Genomics, Cereal Chem, Disease Biology, DNA Diagnostic, and Product Quality Performance Trends
Market F
eedb
ack (d
irection
from
AW
B)
GrainGene AWB/GRDC/CSIRO/Syngenta

Measuring efficiency & effectiveness of AWB R&D processes
Product/Market Development View
Discovery Implementation Commercialisation
•No. of successful discoveries
•No. of usable suggestions from the user groups
•Effectiveness of R&D alliances
•Return on development investments
•No. of registered patents
•Success and/or quota of outcomes
•Time-to-market
•No. of marketing partners
•Market shares
•Innovation revenues (revenues of products younger than 2 years)
•Brand value
Key
dri
ver
s in
R&
D/G
rain
Tec
hn
olo
gy
Wheat Statistics

El Niño patterns generally last 12 & 18 months
0
5
10
15
20
25
3019
70-71
1971
-7219
72-73
1973
-7419
74-75
1975
-7619
76-77
1977
-7819
78-79
1979
-8019
80-81
1981
-8219
82-83
1983
-8419
84-85
1985
-8619
86-87
1987
-8819
88-89
1989
-90
1990
-9119
91-92
1992
-9319
93-94
1994
-9519
95-96
1996
-9719
97-98
1998
-9919
99-00
2000
-0120
01-02
2002
-03
0.0
50.0
100.0
150.0
200.0
250.0
300.0
Volume Price
Volume (mt)
Price ($AUD)
El NiñoEl Niño
El Niño El Niño
El Niño
Source: ABARE f = forecast. Note: 5 – 20 yr averages include 2002-03 forecast
Production: 5 yr ave = 21.1 mt 10 yr ave = 19.0 mt 20 yr ave = 17.3 mt
f
Area: 5 yr ave=11.8 m/ha 10 yr ave=10.7 m/ha 20 yr ave=10.4 m/ha

International supply & demand
•2002-03 world consumption
expected to again exceed world
production
•2002-03 carryover stocks
forecast to decline for the fourth
consecutive year
•EU is the only major exporting
country forecast to increase
production for 2002-03.
•Continued competition from
minor exporting countries
despite production forecast to be
slightly less than 2001-02.
500520540560580600620640
2001-02(f) 2002-03(z) 2003-04(z)100
105
110
115
120
125
130
Production
Consumption
Closing stocks
Prod & Cons (mt) Closing Stocks(mt)
Source: USDA June 2002 & ABARE March 2002 (mt) = million tonnes (f) = forecast (z) = Projection
2002-03 Global Prod 597mt, Cons 604mt

Senior Management

Senior management
Office of the MD
Richard Fuller
Company Secretary
Michael Thomas
Head of Investor Relations
Jean-Luc Boulanger
GM, Strategy &
Performance Mgt.
Paul Ingleby
CFO, 50
Joined AWB 1998
Responsible for Finance & Admin, Treasury, Trade Finance, Risk Mgt & Compliance, Legal, and Commercial Managers.
Tim Goodacre
Group GM, Corporate, 48
Joined AWB 1990
Responsible for Grower Services, Public Affairs and HR.
Sarah Scales
Group GM National Pool, 36
Joined AWB 1992
Responsible for managing National Wheat Pools and the Single Desk.
Peter Geary
Group GM, Trading, 41
Joined AWB 1985
Responsible for Domestic & Global Trading and International Sales & Marketing.
Jill Gillingham
Chief Operating Officer, 52
Joined AWB 2000
Responsible for Information Systems, Supply Chain Mgt, Chartering and Grain Technology.
Andrew Lindberg MD, 49 Joined AWB 2000
Charles Stott
Group GM, Bus. Development, 43
Joined AWB 2000
Responsible for Investments, Mergers and Acquisitions.
Marcus Kennedy
Group GM, Financial Services, 43
Joined AWB 2002
Responsible for Financial Services & Product Development.

For more information contact:
Michael Thomas
Head of Investor Relations
Ph: +61 3 9209 2064
Email: [email protected]