MANAGEMENT OF TYPE 2 DIABETES MELLITUS BY …
83
MANAGEMENT OF TYPE 2 DIABETES MELLITUS BY DIABETIC CLIENTS IN NYANDARUA COUNTY, KENYA MUOKI FRANCIS MATHEKA (BSc.N) Q57/CTY/PT/20598/2012 A THESIS SUBMITTED IN PARTIAL FULFILMENT OF THE REQUIREMENTS FOR THE AWARD OF THE DEGREE OF MASTER OF PUBLIC HEALTH (MONITORING AND EVALUATION) IN THE SCHOOL OF PUBLIC HEALTH OF KENYATTA UNIVERSITY NOVEMBER, 2017
Transcript of MANAGEMENT OF TYPE 2 DIABETES MELLITUS BY …

MANAGEMENT OF TYPE 2 DIABETES MELLITUS BY DIABETIC
CLIENTS IN NYANDARUA COUNTY, KENYA
MUOKI FRANCIS MATHEKA (BSc.N)
Q57/CTY/PT/20598/2012
A THESIS SUBMITTED IN PARTIAL FULFILMENT OF THE
REQUIREMENTS FOR THE AWARD OF THE DEGREE OF MASTER OF
PUBLIC HEALTH (MONITORING AND EVALUATION) IN THE SCHOOL
OF PUBLIC HEALTH OF KENYATTA UNIVERSITY
NOVEMBER, 2017

ii
DECLARATION
This thesis is my original work and has not been presented in any other university
for the award of a degree or for any other award.
Signature …………………………......... Date …………………………
Muoki Francis Matheka - Q57/CTY/PT/20598/2012
Department of Community Health
SUPERVISORS
We confirm that the work reported in this thesis was carried out by the candidate
under our supervision;
Signature………………………… Date ……………………….
Prof. Ephantus Kabiru
School of Public Health,
Kenyatta University
Signature………………………… Date ……………………….
Dr. Anthony Wanyoro
Department of Obstetrics and Gynaecology,
Kenyatta University

iii
DEDICATION
I dedicate this thesis to diabetic clients in Nyandarua County and all persons with
interest in understanding management of type 2 diabetes mellitus.

iv
ACKNOWLEDGEMENTS
I sincerely thank my supervisors; Prof. Ephantus Kabiru and Dr. Anthony Wanyoro
for their support, academic guidance and professional input throughout the study.
You have been a great inspiration to me and your devotion to seeing me complete
this thesis has been a great sacrifice and favour to me. God bless you abundantly.
I wish to also thank all diabetic clients who attended clinic at North Kinangop
Catholic Hospital and Engineer sub-County hospital for their co-operation and
participation in the study.
Lastly, my gratitude goes to my friends for their constant encouragement, support
and prayers through my study period. Thank you for your patience and great love.

v
TABLE OF CONTENTS
DECLARATION ......................................................................................................... ii
DEDICATION ............................................................................................................ iii
ACKNOWLEDGEMENTS ....................................................................................... iv
TABLE OF CONTENTS ............................................................................................ v
LIST OF APPENDICES ............................................................................................. x
LIST OF TABLES ...................................................................................................... xi
LIST OF FIGURES ................................................................................................... xii
ABBREVIATIONS AND ACRONYMS ................................................................ xiii
OPERATIONAL DEFINITION OF TERMS ....................................................... xiv
ABSTRACT ............................................................................................................... xv
CHAPTER ONE: INTRODUCTION ........................................................................ 1
1.1 Background to the study .......................................................................................... 1
1.2 Statement of the problem ......................................................................................... 2
1.3 Justification of the study .......................................................................................... 3
1.4 Research questions .................................................................................................. 4
1.5 Null hypothesis ........................................................................................................ 4
1.6 Research Objectives ................................................................................................ 4
1.6.1 Main objective ...................................................................................................... 4
1.6.2 Specific objectives ................................................................................................ 4

vi
1.7 Significance and anticipated outcome ..................................................................... 5
1.8 Conceptual framework ............................................................................................ 5
CHAPTER TWO: LITERATURE REVIEW .......................................................... 6
2.1 Overview of diabetes mellitus. ................................................................................ 7
2.2 Classification of diabetes mellitus ........................................................................... 8
2.2.1 Type 1 diabetes mellitus ....................................................................................... 8
2.2.2 Type 2 diabetes mellitus ....................................................................................... 9
2.2.3 Gestational diabetes mellitus ................................................................................ 9
2.3 Pathogenesis of type 2 diabetes mellitus ............................................................... 10
2.4 Risk factors ............................................................................................................ 11
2.5 Signs and Symptoms of diabetes ........................................................................... 12
2.6 Complications of diabetes ..................................................................................... 13
2.7 Diagnosis of type 2 diabetes mellitus .................................................................... 14
2.7.1 Clinical diagnosis ............................................................................................... 14
2.7.2 Laboratory diagnosis .......................................................................................... 15
2.8 Management of diabetes mellitus .......................................................................... 16
2.8.1 Diet ..................................................................................................................... 16
2.8.2 Physical activity/exercise ................................................................................... 17
2.8.3 Blood glucose control. ........................................................................................ 17
2.8.4 Personal (home) glucose monitoring. ................................................................. 18

vii
2.8.5 Use of anti-diabetic drugs ................................................................................... 19
2.8.5.1 Oral medication. .............................................................................................. 19
2.8.5.2 Use of insulin. .................................................................................................. 19
2.9 Management practices for type 2 diabetes mellitus .............................................. 20
2.10 Influence of socio-demographic factors on type 2 diabetes mellitus .................. 21
2.11 Summary of literature review .............................................................................. 21
CHAPTER THREE: MATERIALS AND METHODS ........................................ 23
3.1 Study design .......................................................................................................... 23
3.2 Study variables ...................................................................................................... 23
3.2.1 Dependent variables ........................................................................................... 23
3.2.2 Independent variables ......................................................................................... 23
3.3 Location of study ................................................................................................... 24
3.4 Study population .................................................................................................... 24
3.5 Inclusion criteria .................................................................................................... 24
3.6 Exclusion criteria ................................................................................................... 25
3.7 Sampling techniques and sample size ................................................................... 25
3.7.1 Sampling techniques ........................................................................................... 25
3.7.2 Sample size determination .................................................................................. 25
3.8 Data collection tool ................................................................................................ 27
3.9 Pre-testing .............................................................................................................. 27

viii
3.9.1 Validity ............................................................................................................... 27
3.9.2 Reliability ........................................................................................................... 27
3.10 Data collection techniques ................................................................................... 28
3.11 Data management and analysis ........................................................................... 28
3.12 Logistical and Ethical considerations .................................................................. 29
CHAPTER FOUR: RESULTS ................................................................................. 30
4.1 Socio-demographic and economic characteristics of study respondents .............. 30
4.1.1 Socio-demographic characteristics of study respondents ................................... 30
4.1.2 Socio-economic characteristics of the study participants ................................... 31
4.2 Knowledge on management interventions for type 2 diabetes mellitus ................ 31
4.2.1 Source of information on diabetes mellitus ........................................................ 31
4.2.2 Screening for diabetes mellitus .......................................................................... 32
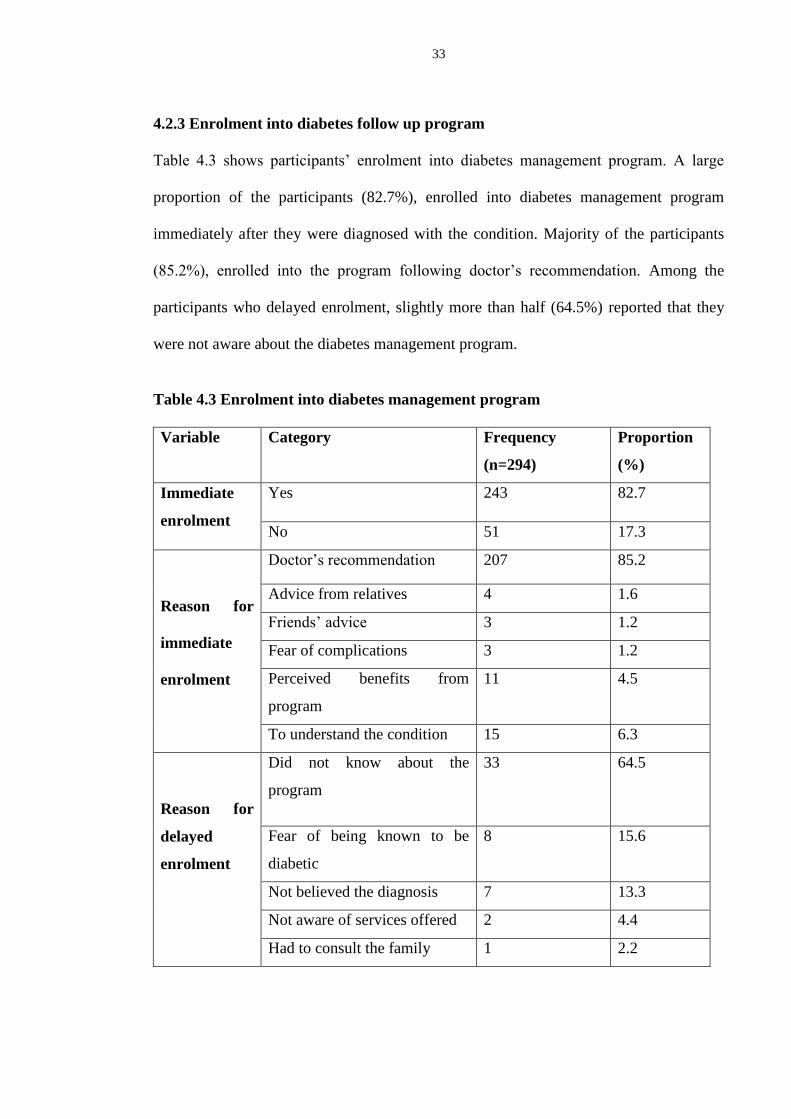
4.2.3 Enrolment into diabetes follow up program ....................................................... 33
4.2.4 Duration on follow up in the diabetes management program ............................ 34
4.2.5 Knowledge on T2DM management interventions among study participants .... 34
4.3 Practices for management of T2DM among study participants ............................ 36
4.3.1 Practice on balanced diet for diabetics ............................................................... 36
4.3.2 Duration of physical activity/exercise session ................................................... 37
4.3.3 Frequency of body weight monitoring ............................................................... 38
4.3.4 Use of anti-diabetic drugs (medication control) ................................................. 38

ix
4.4 Influence of participants’ socio-demographic and economic characteristics
onT2DM management practices .................................................................................. 40
4.4.1 Bivariate analysis of association between socio-demographic characteristics
and management of T2DM .......................................................................................... 40
4.4.2 Bivariate analysis of association between socio-economic characteristics and
management of T2DM ................................................................................................ 42
CHAPTER FIVE:DISCUSSION,CONCLUSION & RECOMMENDATIONS . 43
5.1 Discussion .............................................................................................................. 43
5.1.1 Knowledge on management interventions ......................................................... 43
5.1.2 Practices for management of T2DM .................................................................. 45
5.1.3 Influence of participants’ socio-demographic characteristics on management of
T2DM............................. ............................................................................................. 46
5.2 Conclusions ........................................................................................................... 48
5.3 Recommendations ................................................................................................. 48
5.4 Recommendation for further research ................................................................... 49
REFERENCES .......................................................................................................... 50
APPENDICES ............................................................................................................ 53
x
LIST OF APPENDICES
Appendix I. Informed Consent form ........................................................................... 53
Appendix II. Researcher administered questionnaire .................................................. 55
Appendix III. Kenyatta University Ethical approval letter ......................................... 61
Appendix IV. NACOSTI Research Permit ................................................................. 62
Appendix V. NACOSTI research authorization .......................................................... 63
Appendix VI. Nyandarua County Commissioner research authorization .................. 65
Appendix VII. Nyandarua County Director of Health research authorization ............ 66
Appendix VIII. Nyandarua County Director of Education research authorization .... 67
Appendix IX. Study Area map .................................................................................... 68

xi
LIST OF TABLES
Table 3.1 Proportionate sampling of subjects in the study area .................................. 26
Table 4.1 Socio-demographic characteristics of study participants ............................ 30
Table 4.2 Socio-economic charactersistics of study participants ................................ 31
Table 4.3 Enrolment into diabetes management program ........................................... 33
Table 4.4 Management of T2DM by use of drugs ...................................................... 39
Table 4.5 Association between respondents’socio-demographic and socio-economic
characteristics and management of T2DM .......................................................... 40
Table 4.6 Bivariate analysis of association between socio-demographic
characteristics and management of T2DM .......................................................... 41
Table 4.7 Bivariate analysis of association between socio-economic characteristics
and management of T2DM .................................................................................. 42

xii
LIST OF FIGURES
Figure 1.1 Conceptual framework ................................................................................. 6
Figure 4.1 Participants’ source of information about Diabetes Mellitus ..................... 32
Figure 4.2 Reasons for screening for Diabetes Mellitus ............................................. 32
Figure 4.3 Participants’ duration on follow up in diabetes management program ..... 34
Figure 4.4 Participants’ level of knowledge on T2DM management interventions .... 35
Figure 4.5 Participants’ level of knowledge on T2DM management interventions .... 35
Figure 4.6 Participants’ practice on diabetic balanced diet ......................................... 37
Figure 4.7 Duration of physical activity/exercise sessions in a day ............................ 37
Figure 4.8 Frequency of body weight monitoring by the participants ........................ 38

xiii
ABBREVIATIONS AND ACRONYMS
CDL Chronic Disease of Lifestyle
CGM Continuous Glucose Monitoring
DM Diabetes mellitus
GDM Gestation Diabetes Mellitus
IDF International Diabetes Federation
IGR Impaired Glucose Regulation
IGT Impaired Glucose Tolerance
KDA Kenya diabetes association
KDHS Kenya Demographic and Health Survey
KNDS Kenya National Diabetes Strategy
KUERC Kenyatta University Ethics Review Committee
MDGs Millennium Development Goals
MODY Maturity Onset Diabetes of the Young
MOH Ministry of Health
NACOSTI National Commission for Science, Technology and Innovation
NCDs Non- Communicable Diseases
NIDDM Non-insulin Dependent Diabetes Mellitus
OGTT Oral Glucose Tolerance Test
SPSS Statistical Package for Social Sciences
T2DM Type 2 Diabetes Mellitus
WDF World Diabetes Foundation
WHO World Health Organization

xiv
OPERATIONAL DEFINITION OF TERMS
Diabetic client: Refers to a person with diabetes, 18 years and above, who is on
follow up care through diabetic outpatient clinic in a health facility.
Management of T2DM: Is the ability of a diabetic client to monitor and maintain
their blood glucose within normal levels.
Management interventions Refers to the prescribed approaches for maintaining
blood glucose within levels that do not expose the client to development of
complications.
Long-serving T2DM client: Any T2DM client who has been on follow up for
diabetes management for a period of at least six (6) months.
Good knowledge level: Refers to any client who had a score of 5 and above having
assessed knowledge on causes of poor blood sugar levels, signs of poor blood sugar
level, healthy diabetes diet, maintenance of body weight and diabetes associated
complications.
Average knowledge level: Refers to any client who had a score of between 4 and 5
having assessed knowledge on causes of poor blood sugar levels, signs of poor
blood sugar level, healthy diabetes diet, maintenance of body weight and diabetes
associated complications.
Poor knowledge level: This refers to anyone who had a score of 3 and below
having assessed knowledge on causes of poor blood sugar levels, signs of poor
blood sugar level, healthy diabetes diet, maintenance of body weight and diabetes
associated complications.

xv
ABSTRACT
Type 2 diabetes mellitus (T2DM), is the most common form of diabetes,
characterized by disorders of insulin resistance, insulin secretion, obesity, lipid
abnormalities, hypertension, and cardiovascular diseases. Physical inactivity and
the adoption of sedentary lifestyle often accompanying the transition to modern
diet are key factors leading to this condition. The marked increase of Type 2
Diabetes Mellitus (T2DM) necessitates active development and implementation
of efficient prevention programs as the condition is a major public health
concern in the world. The main objective of the study was to determine
management of T2DM by diabetic clients in North Kinangop Catholic hospital
and Engineer sub-County hospital in Nyandarua South sub-County, Kenya. A
cross-sectional facility based study was carried out in the two facilities. The
study population comprised T2DM clients, residents of the sub-County aged 18
years and above who consented to participate in the study. Data collection was
by use of researcher administered questionnaire. The data was entered, coded
and cleaned in the Microsoft excel software, and then transferred into SPSS
Version 20.0 (SPSS Inc, USA) for analysis. Descriptive statistics were computed
to generate frequencies, mean and median. Relationship between levels of
knowledge on the recommended management interventions, socio-demographic
factors and management practices were examined using chi-square and bivariate
analyses. Majority of the clients were females (59.5%). Majority of participants
(83.3%) had never been screened for DM except at the point of diagnosis during
which screening was initiated by health care providers. Participants delayed
enrolling into DM management program because most of them (64.4%) did not
know about it while 2.2% had to consult their families. A small proportion of the
participants (28%) had good knowledge on T2DM management interventions.
Practices applied by the clients in self-managing T2DM included diet, exercise,
taking diabetic medications and monthly weight monitoring. Socio-demographic
and economic characteristics that were found to be significantly associated with
clients’ management of T2DM were college/university education level (n=294,
df-3, χ2
-4.433, P- 0.035) and income level of Kshs 5,001-10,000 per month
(n=294, df-3, χ2-5.999, P-0.006). Conclusions made from the study are that there
is low level of knowledge on T2DM management interventions, practices for
management of T2DM that participants applied included balanced diabetic diet,
exercise, drug therapy and weight monitoring though fairly undertaken. Level of
education and income significantly influenced clients’ management of T2DM.
The study recommends creation of awareness on T2DM management in
Nyandarua County so as to improve clients’ knowledge of management
interventions for T2DM, health education on T2DM management practices to
empower clients to effectively manage the condition. The national and
Nyandarua County government’s Department of Health to subsidize diabetic
services so as to improve clients’ affordability and utilization.

1
CHAPTER ONE: INTRODUCTION
1.1 Background to the study
Diabetes is one of the commonest non-communicable diseases of the 21st century
(International Diabetes Federation, 2013). In 2013, 382 million people had diabetes
globally with 90% of the cases being type 2 Diabetes Mellitus (WHO, 2013). In 2015,
the global burden of diabetes was estimated to be 415 million people with a global
prevalence of 8.3%, and the IDF estimated that this figure was likely to rise to 642
million by the year 2040 (International Diabetes Federation, 2015). This rise in Type 2
Diabetes Mellitus (T2DM) is associated with demographic and social changes such as
globalization, urbanization, aging population and adoption of unhealthy lifestyles such as
consumption of unhealthy diets and physical inactivity (International Diabetes
Federation, 2015). Type 2 Diabetes Mellitus and its associated complications have been
reported to increase dramatically and this resulted in 1.5 million deaths worldwide in
2012 (WHO, 2013). Globally, in every six (6) seconds, a person dies from diabetes
which has resulted into 5.0 million deaths by 2015 (International Diabetes Federation,
2015).
Africa has the fastest growth rates of overweight and childhood obesity which are risk
factors for T2DM later in life (Rossouw et al., 2012). The youth of sub-Saharan Africa
are particularly vulnerable to T2DM due to a lifetime accumulation of risk factors such
as early weight gain (0-5years), childhood obesity, malnutrition and sedentary lifestyle
(Azevedo, 2008). While childhood diabetes mellitus cases were typically type 1, there
has been a rapid increase in the development of obesity-associated T2DM among
children (Tuei et al., 2010, Lee et al., 1995). Overall diabetes-induced deaths in sub-
Saharan Africa significantly increased from 2.2% in 2000 to 6% in 2010 (International
2
Diabetes Federation, 2012). These rates were highest amongst persons between 20 and
39 years, the most economically productive members of peri-urban populations
(International Diabetes Federation, 2009). In 2010, 43 million children (<5 years) were
overweight globally, with 35 million of these children living in developing countries
(Rossouw et al., 2012).
Type 2 Diabetes Mellitus is rapidly emerging as a major health problem in Kenya
making up over 90% of all reported cases of diabetes which is mainly caused by
sedentary lifestyles (Christensen et al., 2006).
Many children and adolescents remain undiagnosed due to a lack of health education and
services; as well as poor consensus of the diagnostic criteria of metabolic syndrome in
children (Mayosi et al., 2009). This delays initiation of treatment with the clients
developing severe complications (Mayosi et al., 2009). Management of T2DM entails
intensive lifestyle modification for those at risk of diabetes and aggressive treatment for
those with the disease. Ineffective management of the condition increases the occurrence
rate of chronic complications of diabetes that the country’s health care system is ill-
prepared for, both in recurrent expenditure and facilities (KNDS, 2010).
1.2 Statement of the problem
A high proportion of undiagnosed cases of diabetes end up with irreversible
complications imposing a huge economic burden to the individual, family, community
and the health care system (International Diabetes Federation, 2009). In 2012, diabetes
resulted in 1.5 million deaths worldwide making it the 8th
leading cause of death (WHO,
2013). More than 80% of diabetic deaths occur in low and middle-income countries
(Mathers & Loncar, 2006).

3
Globally, the burden of diabetes mellitus was estimated to be 415 million people with a
global prevalence of 8.3%. The IDF estimated that this figure was likely to rise to 642
million by the year 2040 (International Diabetes Federation, 2015). In 2013, 387 million
people had diabetes worldwide with Type 2 diabetes making up about 90% of the cases
which is equal to 8.3% of the adult population with equal rates in both women and men
(WHO, 2013). The prevalence of diabetes in Kenya in 2013 was 4.7% with the former
central province leading with a T2DM prevalence of 11.4% (International Diabetes
Federation, 2013; MOH, 2013). The prevalence of T2DM in Nyandarua South sub-
County was 10.8% which was higher compared to the country’s prevalence (MOH,
2013).
North Kinangop Catholic Hospital and Engineer sub-County Hospital diabetic clinics
records showed a total number of 703 and 547 clients in 2014, respectively who were on
active follow up. The total number of new clients in the year 2014, January – September,
2014 was 74 in both facilities with an average monthly admission of patients with T2DM
complications being 20 and 8 in both facilities respectively. This raises a concern on the
management of T2DM by diabetic clients in Nyandarua South sub-County.
1.3 Justification of the study
Although non communicable diseases such as diabetes are largely preventable, the
epidemic continues due to a lack of widespread public health prevention programmes
and accessible educational resources (Mayosi et al., 2009). Due to increase in newly
diagnosed type 2 diabetes cases in the Nyandarua South sub-County, the study aimed at
determining the levels of diabetic clients’ knowledge on recommended management
interventions and practices for management of T2DM. The study, also, aimed at
generating credible information that will positively influence the management of T2DM

4
thus enabling the clients better manage the condition and prevent themselves from
developing diabetes related complications.
1.4 Research questions
i. What is the level of knowledge on recommended management interventions for type
2 diabetes mellitus among T2DM clients in Nyandarua South sub-County?
ii. What practices for self-management of type 2 diabetes mellitus are applied by T2DM
clients in Nyandarua South sub-County?
iii. What is the influence of socio-demographic factors of type 2 diabetes mellitus clients
on management of T2DM in Nyandarua South sub-County?
1.5 Null hypothesis
Ho - Individual’s socio-demographic characteristics do not influence management of
T2DM in Nyandarua South sub-County, Kenya.
1.6 Research Objectives
1.6.1 Main objective
To determine management of type 2 diabetes mellitus by diabetic clients in Nyandarua
County, Kenya.
1.6.2 Specific objectives
i. To establish the level of knowledge on recommended management interventions for
type 2 diabetes mellitus among T2DM clients in Nyandarua South sub-County.
ii. To establish practices applied by T2DM clients in self-management of type 2
diabetes mellitus in Nyandarua South sub-County.
iii. To determine the influence of socio-demographic factors on management of type 2
diabetes mellitus among T2DM clients in Nyandarua South sub-County.

5
1.7 Significance and anticipated outcome
This study was conducted to determine the level of diabetic clients’ knowledge on
recommended management interventions and practices for management of type 2
diabetes mellitus (T2DM). The findings of the study helps in addressing population
knowledge gaps and behaviour towards T2DM, raising awareness of, identifying and
addressing gaps in the management of T2DM. The clients will benefit from health
education on gaps identified in their knowledge on management interventions and
practices for managing T2DM so as to improve their health status with regard to the
condition. The findings will also inform health policy and decision making processes in
the sub-County aimed at increasing community’s level of knowledge and improving on
the management practices aimed at delaying onset or preventing the development of
T2DM related complications. The information will guide the formulation of
interventions and control programmes for T2DM in the sub-County. Information from
this study will be important to health care workers and policy makers in developing
appropriate health messages for the clients attending diabetic clinics.
1.8 Conceptual framework
Figure 1.1 shows the relationship between factors that influence management of T2DM.
The dependent variable of the study is management of type 2 diabetes mellitus (T2DM).
The independent variables are factors that influence management of T2DM amongst the
clients. The independent variables were divided into three categories:- socio-
demographic and socioeconomic characteristics of the respondents (age, gender, marital
status, education level, employment status and income level), knowledge of the
recommended T2DM management interventions (diet, physical activity/exercise, anti-
diabetic drugs, body weight management), and practices for control of type 2 diabetes

6
mellitus which included; blood glucose control, medication, weight monitoring and self
blood glucose monitoring.
Independent variables
Dependent variable
Figure 1.1 Conceptual framework showing relationship between study variables
Source: (KNDS, 2010, Mayosi et al., 2009, IDF, 2013; Moodley & Rambiritch, 2007)
Socio-demographic characteristics
Age, gender, marital status, education
level, employment, income level
Knowledge on management
interventions - diet, exercise, anti-
diabetics, body weight monitoring
Proper management of
type 2 diabetes mellitus
Practices for managing T2DM
Blood glucose control, activity
medication, glucose monitoring

7
CHAPTER TWO: LITERATURE REVIEW
2.1 Overview of diabetes mellitus.
Diabetes mellitus (DM) is a chronic disorder occurring throughout the world, but more
common (especially type 2) in more developed countries (International Diabetes
Federation, 2013). In 2007, the global burden of diabetes was estimated to be 246
million people and without effective interventions put in place, the prevalence of
diabetes is expected to rise to 592 million people by 2035 (International Diabetes
Federation, 2014). The growing prevalence of diabetes makes it a significant catalyst to
morbidity, premature mortality, and increasing health care costs (Mayosi et al., 2009).
The International Diabetes Federation (IDF) suggests that worldwide rates of diabetes
will escalate by 54% from 2010 to 2030 (284.6 to 438.4 million). For sub-Saharan
Africa, this growth is estimated at 98% (12.1 to 23.9 million) (International Diabetes
Federation, 2009). Notably, glucose intolerance in sub-Saharan countries is also
predicted to rise by 75.8% in the same time frame (26.9 to 47.3 million). This is twofold
the amount of the projected global increase of 37% (International Diabetes Federation,
2009).
According to the Kenya National Diabetes Strategy (KNDS), majority of the people with
diabetes in developing countries are within the productive age range of 45–64 years
(KNDS, 2010). These are the same individuals who are expected to drive the economic
engines of their countries in order to achieve the agreed international development goals.
Besides their reduced productivity, diabetes further imposes a high economic burden in
terms of healthcare expenditure, lost productivity and foregone economic growth
(KNDS, 2010).
8
While T2DM is largely preventable, the prevalence continues to rise due to a lack of
widespread public health prevention programmes and accessible educational resources
(Mayosi et al., 2009). In order to lessen the burden of diabetes, public health interven-
tions are required to prevent diabetes or delay the onset of its complications (KNDS,
2010). This requires intensive lifestyle modification for those at risk of diabetes and
aggressive treatment for those with the disease. A high-risk approach targeting
individuals at risk of diabetes and a population or public health approach aimed at reduc-
ing the risk factors for diabetes at the community level are necessary (KNDS, 2010).
2.2 Classification of Diabetes Mellitus
2.2.1. Type 1 diabetes mellitus
Type 1 diabetes mellitus is also referred to as Insulin Dependent Diabetes or
Autoimmune Diabetes or Juvenile diabetes or early onset diabetes mellitus. This type of
diabetes is as a result of failure of the pancreas to produce insulin and comprises about
10-15% of total diabetes burden (International Diabetes Federation, 2015). Type 1
diabetes mellitus afflicts mainly young children and is perceived to be a chronic
immune-mediated disease with sub-clinical prodrome characterized by selective loss of
insulin producing β-cells in the pancreatic islets in genetically susceptible people (Osei
et al., 2003). The immune system attacks the insulin producing β-cells of the islets of
Langerhans in the pancreas. This leads to a decline in the production of insulin hence
elevated glucose concentration in the blood.
The pre-clinical disease is asymptomatic and may last from a few months to more than
10 years. In acute clinical onset, ketoacidosis and dependency on exogenous insulin are
characteristic features and may lead to absolute dependency on insulin injections or
death (Tuei et al., 2010).

9
2.2.2 Type 2 diabetes mellitus
Type 2 diabetes mellitus (T2DM), also referred to as Non-insulin Dependent or Maturity
onset diabetes, results from failure of the pancreas to produce adequate insulin or failure
of body cell to utilize insulin or both. It accounts for 90% of total diabetes burden
(International Diabetes Federation, 2009). Type 2 Diabetes Mellitus is typically a
metabolic disorder of obese middle aged or old people with slow clinical onset and non-
insulin dependence (Osei et al., 2003). Type 2 Diabetes Mellitus is the most common
form of diabetes characterized by disorders of insulin resistance, insulin secretion,
obesity, lipid abnormalities, hypertension, and cardiovascular diseases (Wylie-Rosett &
Vinicor, 2001). These features are usually present at the time the condition is clinically
manifest (National Institute for Health and Clinical Excellence, 2011).
Between 50 and 65 per cent of T2DM patients remain undiagnosed because of the lack
of specific symptoms (Mollentze, 2012). As a result, a number of T2DM patients are
admitted in hospitals to have their feet or legs amputated, cataracts removed, or to be
treated for kidney failure and stroke due to late diagnoses.
The rise in new cases of T2DM is also a consequence of associated factors such as
dietary changes, increased inactivity, aging populations, and insufficient prevention and
management interventions (Wild et al., 2004). These factors are further compounded by
social obstacles such as poverty, marginalisation, poor education, illiteracy, and a lack of
access to health care (Azevedo, 2008).
2.2.3 Gestational diabetes Mellitus (GDM)
Pregnant women who have never had diabetes before but who have high blood sugar
(glucose) levels during pregnancy are said to have gestational diabetes. Gestational

10
Diabetes Mellitus (GDM) affects about 4% of all pregnant women and starts when the
body is not able to make and use all the insulin it needs for pregnancy. Due to this
insulin insufficiency, available glucose in the circulation cannot leave the bloodstream
for conversion into energy (Osei et al., 2003).
Other forms of diabetes mellitus include; diabetes as part of other endocrine syndromes,
drug induced diabetes, pancreatic disease and monogenic diabetes previously referred to
as Maturity Onset Diabetes of the Young (MODY) (National Institute for Health and
Clinical Excellence, 2011).
2.3 Pathogenesis of type 2 diabetes mellitus
Type 2 diabetes mellitus (T2DM) develops when the body can still make some insulin,
but not enough, or when the insulin that is produced does not work properly (known as
insulin resistance) and in most cases is linked with being overweight. The prevalence of
type 2 diabetes has risen dramatically in the past decade in large part linked to the trends
in obesity and sedentary lifestyle (National Institute for Health and Clinical Excellence,
2011; Stumvoll et al., 2005).
The condition is characterized by hyperglycemia, insulin resistance, and relative
impairment in insulin secretion. When insulin secretion is impaired, the body is unable to
utilize available glucose leading to high glucose level in the circulation (hyperglycemia)
that further alters circulation in the small blood vessels (Adams, 2008). The resulting
hyperglycemia can also impair pancreatic beta-cell function and exacerbate insulin
resistance, leading to a vicious cycle of hyperglycemia causing a worsening metabolic
state (National Institute for Health and Clinical Excellence, 2011). Hyperinsulinemia that

11
occurs in response to insulin resistance may play an important role in the genesis of these
abnormalities.
Type 2 diabetes is often accompanied by other conditions, including hypertension, high
serum low-density lipoprotein (LDL) cholesterol concentrations, and low serum high-
density lipoprotein (HDL) cholesterol concentrations that increase cardiovascular risk
(Stumvoll et al., 2005). This collection of clinical conditions is known as the metabolic
syndrome. If not timely diagnosed and consequently managed, results in serious and
long-term complications including heart disease, stroke, blindness, kidney disease and
amputation leading to disability and premature mortality (Adams, 2008).
2.4 Risk factors
Risk factors for T2DM include;
i. Weight. Being overweight or obese with a waistline greater than 94 cm (37 inches)
for men or greater than 90 cm (35 inches) for men of South Asian origin. For women,
having a waistline greater than 80 cm (31.5 inches), being more than 40 years old,
having a brother or sister with T2DM increase the risk of developing the condition.
The more fatty tissue one has, the more resistant their cells become to insulin and this
places them at greater risk of T2DM (Tuei et al., 2010).
ii. Physical inactivity. The less active a person is, the greater the risk for T2DM since
physical activity helps one control their weight by using up glucose as energy and
making body cells more sensitive to insulin.
iii. Family history. The risk for T2DM increases if a parent or sibling has type 2
diabetes.

12
iv. Race. People who are African-American, Asian-American, Latino-Hispanic-
American, Native American, or Pacific Islander have a greater risk of developing
T2DM than other groups.
v. Age. The risk for T2DM increases with age. This is partly because people tend to
exercise less, lose muscle mass and gain weight as they age though T2DM is also
increasing dramatically among children, adolescents and younger adults (KNDS,
2010).
vi. Gestational diabetes. The risk of developing pre-diabetes and type 2 diabetes later
in life increases if a woman developed gestational diabetes when she was pregnant.
Giving birth to a baby weighing more than 9 pounds (4 kilograms) also increases the
risk of type 2 diabetes among women (KNDS, 2010).
vii. Polycystic ovary syndrome. Women having polycystic ovary syndrome, a condition
characterized by irregular menstrual periods and obesity have a greater risk of
developing type 2 diabetes.
viii. High blood pressure. Having blood pressure over 140/90 mmHg is also linked to an
increased risk of type 2 diabetes.
ix. Abnormal cholesterol and triglyceride levels. Low levels of high-density
lipoprotein (HDL) or good cholesterol increases the risk of type T2DM. People with
high levels of triglycerides also have an increased risk of T2DM (Tuei et al., 2010,
Rheeder, 2006).
2.5 Signs and Symptoms of diabetes
Diabetes mellitus presents with three (3) typical signs including; excessive urine
production (polyuria), excessive thirst (polydypsia) and increased hunger (polyphagia).
Other symptoms include elevated blood sugar level (hyperglycemia), sugar in urine
13
(glycosuria), frequent itching around the genitals, emaciation, dry mouth, unexplained
weight loss, fatigue, blurred vision, headaches and loss of consciousness (Mollentze,
2012).
When severe diabetes is allowed to progress without proper treatment, coma ensues with
weakness and sweet (acetone) odour of breath, nausea, headache, vomiting, dyspnoea,
sense of intoxication, delirium, and deep coma resulting to death (Dropkin, 2010).
2.6 Complications of diabetes
Patients suffering from T2DM are at a great risk of developing complications including:-
i. Eye disease. The development of diabetic retinopathy is strongly related to the
length of time diabetes has been present and the degree of blood glucose control.
Regular eye checkups and treatment can prevent serious eye problems and blindness
caused by diabetic retinopathy. This leads to damage of the eye and affect vision
(Tuei et al., 2010).
ii. Kidney disease. Over time, diabetes can cause damage to the kidneys (diabetic
nephropathy). If the kidneys fail, toxic waste products remain in the body, fluids
build up and the chemical balance is upset. The risk of developing kidney problems
is reduced by managing your blood glucose levels, having regular kidney and blood
pressure checks and leading a healthy lifestyle. Early signs of kidney problems can
be detected through a urine test and treatment at this time can prevent further damage
(Ogbera, 2006).
iii. Nerve damage and lower limb complications. Diabetic neuropathy is the
progressive damage to the nervous system caused by diabetes which can lead to loss
of sensation in the hands and feet. Reduced circulation resulting from high blood
glucose impairs normal wound healing in the extremities thus minor damage can
14
linger and develop into permanent injury. Personal daily foot checks and thorough
annual foot examinations conducted by a doctor will help reduce the risk of lower
limb complications (Ogbera, 2006).
iv. Heart disease and stroke. People with diabetes are at increased risk of heart disease
and stroke due to raised blood glucose levels (BGLs) in association with high blood
pressure and cholesterol. A third of diabetic patients also present with hypertension
and obesity (Mollentze, 2012).
v. Sexual health. Sexual dysfunction is more common in people with diabetes because
poorly controlled diabetes damages blood vessels and nervous system causing
reduced blood flow and loss of sensation in sexual organs. This can contribute to
vaginal dryness in women and erection difficulties in men (Tuei et al., 2010).
Reduction of other risk factors for complications of diabetes, include the early detection
and management of hypertension, drug treatment to modify lipid levels. Monitoring and
early intervention prevents diabetes related complications including cardiovascular
disease, feet problems, eye problems, kidney problems and neuropathy (National
Institute for Clinical Excellence, 2008).
2.7 Diagnosis of type 2 diabetes mellitus
2.7.1 Clinical diagnosis
Health care providers should conduct a full physical and medical examination which
should cover the following areas as;
i. Height and weight measurements
ii. Blood pressure measurements
iii. Thyroid examination
iv. Examination of hands, fingers, feet, and toes for circulatory abnormalities

15
v. Family history of diabetes, cardiovascular disease, and stroke
vi. Prior infections and medical conditions
vii. Current medications including prescribed medications, over-the-counter
medications
viii. Vitamin, mineral or herbal supplements, eating and exercise habits
ix. Smoking history, including encouragement to stop smoking
x. Signs of complications with pregnancy or trying to get pregnant for female
patients
xi. Vision abnormalities, to check for eye health issues
xii. Urination abnormalities, which can indicate kidney disease (Dropkin, 2010;
Walker, 2007).
2.7.2 Laboratory diagnosis
Type 2 diabetes can also be made by an observation of the following parameters:-
i. Random blood sugar test. This test involves taking a person’s blood sample at a
random time. Regardless of when the person last ate, a random blood sugar level of
200 milligrams per decilitre (200 mg/dL) or 11.1 millimoles per litre (mmol/L) or
higher suggests diabetes (Walker, 2007).
ii. Fasting blood sugar test. A blood sample is taken after an overnight fasting and a
blood sugar level of less than 100 mg/dL (5.6 mmol/L) is normal while fasting blood
sugar level from 100 to 125 mg/dL (5.6 to 6.9 mmol/L) is considered pre-diabetes. If
the value is 126 mg/dL (7 mmol/L) or higher on two separate tests person is
considered diabetic (National Institute for Health and Clinical Excellence, 2011).
iii. Oral glucose tolerance test. For this test, one fast overnight and the fasting blood
sugar level is measured. Then drinks a sugary liquid, and blood sugar levels are

16
tested periodically for the next two hours. A blood sugar level of less than 140 mg/dL
(7.8 mmol/L) is considered normal while a reading of more than 200 mg/dL (11.1
mmol/L) after two hours indicates diabetes. A reading between 140 and 199 mg/dL
(7.8 mmol/L and 11.0 mmol/L) indicates pre-diabetes (Walker, 2007).
iv. Glycated hemoglobin (HbA1C) test. This blood test indicates average blood sugar
level for the past three (3) months. It measures the percentage of blood sugar
attached to hemoglobin. The poor the control over the last three months, the higher
the HbA1C (WHO, 2013). Glycated hemoglobin reflects the diabetic client’s level of
control of blood sugar.
2.8 Management of diabetes mellitus
The goals in managing patients with diabetes mellitus are to eliminate symptoms and to
prevent, or at least slow the development of complications (International Diabetes
Federation, 2013). Micro-vascular (eye and kidney disease) risk reduction is
accomplished through control of glycemia and blood pressure; macro-vascular
(coronary, cerebrovascular, peripheral vascular) risk reduction, through control of lipids
and hypertension, smoking cessation, and metabolic and neurologic risk reduction
through control of glycemia. Diabetes care is best provided by a multidisciplinary team
of health professionals with expertise in diabetes, working in collaboration with the
patient and family (Mollentze, 2012).
2.8.1 Diet
Diet management requires control and awareness of the types of nutrients entering the
digestive system, and hence allows indirectly, significant control over changes in blood
glucose levels (Walker, 2007). T2DM patients experience dramatic effects on their blood
sugars through controlling their diet, and some can fully control the disease by dietary

17
modification. As diabetes can lead to many other complications, it is important to
maintain blood sugars as close to normal as possible and diet is the leading factor in this
level of control (Ono, 2008). Therefore, the caloric intake for diabetic persons must be
limited to that which is necessary for maintaining a healthy weight.
2.8.2 Physical activity/exercise
Physical activity/exercise lowers blood sugar level by moving sugar into the cells where
it is used for energy making it easier for a diabetic to control their blood glucose
level. Muscles in turn use glucose without insulin while exercising and as a result, blood
glucose level goes down. It also makes insulin more effective thus insulin resistance goes
down when one exercises and body cells can use the glucose more effectively (Maina et
al., 2011; KNDS, 2010).
Exercise helps people with T2DM avoid long-term complications, including
arteriosclerosis which can lead to a heart attack. The aim of activity is to get at least
thirty (30) minutes of aerobic exercise most days of the week. The exercises include;
walking, jogging/running, swimming, cycling (Knowler et al., 2002).
2.8.3 Blood glucose control.
Proper blood glucose control refers to the diabetic’s ability to maintain their blood
glucose at normal levels (euglycemia) for persons with diabetes mellitus (Adams, 2008).
Many of the long-term complications of diabetes, especially the micro-vascular
complications, result from many years of hyperglycemia (Adams, 2008). Blood sugar
level is measured by means of a glucose meter, with the result either in mg/dL
(milligrams per deciliter in the USA) or mmol/L (millimoles per litre in Canada and
18
Europe) of blood. The average normal person should have a glucose level of between 4.5
to 7.0 mmol/L (80 to 125 mg/dL).
Optimal management of diabetes involves patients measuring and recording their own
blood glucose levels. By keeping a diary of their own blood glucose measurements and
noting the effect of food and exercise, patients can modify their lifestyle to better control
their diabetes (Huang et al., 2007). For patients on insulin, their involvement is
important in achieving effective dosing and timing. Because blood sugar levels fluctuate
throughout the day and glucose records are imperfect indicators of these changes, the
percentage of hemoglobin which is glycosylated is used as a proxy measure of long-term
glycemic control in clinical care of people with diabetes.
Perfect glycemic control would mean that glucose levels were always normal
(70–130 mg/dl, or 3.9-7.2 mmol/L) and indistinguishable from a person without diabetes
(Huang et al., 2007). Poor glycemic control refers to persistently elevated blood glucose
and glycosylated hemoglobin levels, which may range from 200–500 mg/dl (11-
28 mmol/L) and 9-15% or higher over months and years before severe complications
occur (Walker, 2007).
2.8.4 Personal (home) glucose monitoring
Control and outcomes of T2DM may be improved by patients using home glucose
meters to regularly measure their glucose levels (Huang et al., 2007). Glucose
monitoring is both expensive (largely due to the cost of the consumable test strips) and
requires significant commitment on the part of the patient. The effort and expense may
be worthwhile for patients when they use the values to sensibly adjust food, exercise, and
oral medications or insulin.

19
These adjustments are generally made by the patients themselves following training by a
clinician or health care providers trained on diabetes management. This reduces hospital
admission of diabetic patients (Kibriya et al., 1999). However, patients on oral
medication who do not self-adjust their drug dosage will miss many of the benefits of
self-testing. Continuous Glucose Monitoring (CGM) technology has been rapidly
developing to give people living with diabetes an idea about the speed and direction of
their glucose changes (International Diabetes Federation, 2012).
2.8.5 Use of anti-diabetic drugs
2.8.5.1 Oral medication.
The most prevalent form of medication is hypoglycemic treatment by either oral
hypoglycemics including metformin, sulphonylureas, pioglitazone, and/or insulin
therapy (Mealey, 2006). Metformin (Glucophage, Glumetza) is mainly the first
medication prescribed for T2DM. These diabetes medications stimulate the pancreas to
produce and release more insulin, inhibit production and release of glucose by the liver,
thus one will require less insulin to transport sugar into the cells.
Other medications block the action of stomach or intestinal enzymes that break down
carbohydrates or make tissues more sensitive to insulin (National Institute for Health and
Clinical Excellence, 2011). Patient education and compliance with treatment is very
important in managing the disease since improper use of medications and insulin can be
very dangerous causing hypo- or hyper-glycemic episodes.
2.8.5.2 Use of insulin
Some type 2 diabetic patients eventually fail to respond to the oral anti-diabetic
medications and therefore must proceed to insulin therapy. Many types of insulin are

20
available, including rapid-acting insulin, long-acting insulin and intermediate options
(National Institute for Health and Clinical Excellence, 2011). Insulin cannot be taken
orally to lower blood sugar because stomach enzymes interfere with insulin's action.
Often insulin is injected using a fine needle and syringe or an insulin pen.
2.9 Management practices for type 2 diabetes mellitus
Management practices for T2DM include; achieving and maintaining a healthy weight,
effective weight loss programmes, physical activity, cultural appropriateness, integrating
national strategy on non communicable diseases, local joint strategic needs assessment,
developing a local strategy, conveying messages to the whole population, promoting a
healthy diet, promoting physical activity, training those involved in promoting healthy
lifestyles (Dropkin, 2010). Changes on the risk factors are most likely to occur with
effective implementation of a coordinated range of interventions to encourage
individuals to maintain a healthy weight, participate in daily physical activity, and
consume a healthy diet (Dropkin, 2010).
Education is central to implementing such changes and it is more effective when
provided through multiple methods and sites, such as community groups, schools,
workplaces, mass media, religious organizations and health centres (KNDS, 2010).
Educational messages are also more effective if they are reinforced by action (National
Institute for Health and Clinical Excellence, 2011).
However, both in health and economic terms, neglecting chronic diseases such as
diabetes is very expensive. The costs of treatment and loss of productivity undermine
and stunt economic growth and negatively impact on realization of the Millennium

21
Development Goals (MDGs), vision 2030 and other national development targets (WDF,
2007).
2.10 Influence of socio-demographic factors on type 2 diabetes mellitus
The rise in diabetes is associated with demographic and social changes such as
globalization, urbanization, aging population and adoption of unhealthy lifestyles such as
consumption of unhealthy diets and physical inactivity (Wild et al., 2004). For instance,
in the 2014 Kenya Demographic and Health Survey (KDHS) more than 20% of women
and 7% of men in the country were overweight or obese which predisposes to T2DM
(KDHS, 2014).
Secondly, the low level of community knowledge of diabetes reflects on the extent of
health promotion for most chronic non-communicable diseases (Moodley & Rambiritch,
2007). At the moment, there are improved and comprehensive primary care programmes
for diabetes in the country and diabetes health education is done within health facilities
through micro-teaching and only that it targets those with diabetes (KDHS, 2014). This
therefore leaves the rest of the public ignorant of the disease.
2.11 Summary of literature review
Literature reviewed reveals that management of T2DM remains a huge global challenge.
This can be managed by diabetic clients effectively controlling their caloric intake,
consistently taking their anti-diabetic medication and engaging in physical activity which
helps utilize glucose in the body. This will help avoid long-term complications which
result from prolonged periods of elevated blood glucose.
The control outcomes of T2DM can be improved by patients using home glucose meters
to regularly measure their blood glucose levels although it requires significant

22
commitment on the part of the patient. Gaps in literature were apparent on knowledge of
T2DM management interventions, practices for management of T2DM and the extent of
socio-demographic factors that influence management of T2DM among diabetic clients.

23
CHAPTER THREE: MATERIALS AND METHODS
3.1 Study design
A descriptive cross-sectional facility based design was used. This design enabled
description of management of T2DM by the respondents at one point in time, during the
study without influencing their behaviour in any way. The design was appropriate to the
study because screening, enrolment, management and follow up care for diabetic clients
take place within health facilities.
3.2 Study variables
3.2.1 Dependent variables
The dependent variable for the study was management of type 2 diabetes mellitus by
T2DM clients in Nyandarua South Sub-County, Kenya.
3.2.2 Independent variables
The independent variables for the study included;
i. Level of knowledge on management interventions for T2DM (causes and signs of
poor blood sugar, diabetic diet, foods that elevate blood sugar level, body weight
management, complications and their prevention among others).
ii. Practices for management of T2DM (blood glucose control, use anti-diabetic drugs,
self blood glucose monitoring, regular meal composition, exercise, body weight
monitoring).
iii. Socio-demographic and economic characteristics of the respondents (age, gender,
marital status, level of education, employment status and income level).

24
3.3 Location of study
The study was carried out in Nyandarua South sub-County, Nyandarua County
(Appendix 5). Nyandarua County is located in the central part of Kenya with a total
surface area of 3,245.2km² and had a total population of 596,000. The population is
expected to grow to 723,000 by 2017 (KNBS, 2013). The County has five
constituencies; Kipipiri, Ndaragwa, Ol’kalou, Ol’joroOrok and Nyandarua South
(Kinangop). Nyandarua South sub-County is the largest with an area of 822 km². The
total population of the sub-County was 192,000 and is expected to be 233,000 by 2017
(KNBS, 2013). The sub-County has two (2) main health facilities; North Kinangop
Catholic hospital and Engineer sub-County hospital. The facilities serve as the main
centres for provision of care and follow up services to diabetic clients including monthly
clinical review, health education, weight and blood sugar monitoring and nutritional
counseling. The study area had reported increased number of cases of T2DM who in turn
developed severe diabetes complications as it was reflected in the hospitals’ health
records.
3.4 Study population
The study population included adult T2DM clients attending diabetic clinic for their
monthly check up at North Kinangop Catholic hospital and Engineer sub-County
hospital in the sub-County.
3.5 Inclusion criteria
The study included long-serving T2DM clients who were on follow up through the
diabetic clinics for a period of at least six (6) months, residents of Nyandarua South sub-
County (at least six (6) months), aged eighteen (18) years and above, and consented to
participate in the study.

25
3.6 Exclusion criteria
The study excluded T2DM clients who were severely sick during the study period, those
aged below eighteen (18) years, T2DM clients receiving care outside Nyandarua South
sub-County and those who declined consenting for participation in the study.
3.7 Sampling techniques and sample size
3.7.1 Sampling techniques
The study was conducted in two (2) health facilities within Nyandarua South sub-
County. Purposive sampling method was used in the selection of Nyandarua South sub-
County. This was due to the observed increase in the number of T2DM clients admitted
with diabetes related complications. Probability proportionate to size (PPS) strategy was
used to obtain the number of respondents from each facility (Table 3.1). Type 2 Diabetes
Mellitus clients in both facilities were divided into four (4) groups each scheduled to
visit the hospitals for review once every month. Systematic random sampling method,
with an interval of five (5) clients, was used to select consenting respondents as they met
the inclusion criteria until the required sample was obtained.
3.7.2 Sample size determination
The sample size was determined by the formula, n=z²pq/d² as used by Fisher et al.,
(2002) where;
n = desired sample size,
z = standard normal deviate (set at 1.96 which corresponds to the 95% confidence level).
p = proportion in the target population estimated to have the characteristics being
measured (0.5). Represents the proportion of T2DM clients enrolled into the follow up
program.
q=1-p,

26
d= the desired degree of accuracy (0.05)
n=384
Since the estimated total population (N) is less than 10,000 {1,250 being the total
population of T2DM clients receiving care in Nyandarua South sub-County}, (annual
report on T2DM from the hospitals’ health records), the following formula was used to
adjust the sample size; nf= n/1+ {n/N} where;
N = total population of total population of T2DM clients i.e. 1,250.
Where: nf -is the desired sample size (when the population is less than 10,000),
n = desired sample size (when the population is more than 10,000),
N = estimate of the population
Therefore; nf = 384/1+ {384/1,250} =293.7575 nf =294. Thus, the minimum sample size
required for the study was 294.
The sample was proportionately selected as indicated in table 3.1.
Table 3.1 Proportionate sampling of subjects in the study area
Name of facility Number of
T2DM clients
Percentage
required
Number of
clients selected
North Kinangop
Catholic hospital
703 56.24% 165
Engineer sub- County
hospital
547 43.76% 129
Total 1250 100% 294

27
3.8 Data collection tool
Data collection tool for the study was a semi-structured questionnaire (Appendix II)
which was constructed through formulation of relevant questions based on the study
objectives.
3.9 Pre-testing
The data collection tool was pre-tested at Ol’kalou sub-County hospital in Nyandarua
North sub-County. The facility has similar statistics for T2DM and is found in the same
geographical area. Twenty five (25) questionnaires were administered during the pre-
test. Corrections and re-organizations of the data collection tool were then made prior to
the actual data collection.
3.9.1 Validity
Data validity was achieved by ensuring that the data collection tool was formulated
based on the study objectives with adequate number of questions addressing each of the
study variables. The questionnaires were numbered in a sequential order before being
dispatched to the field and confirmed after a day of data collection. The study was
limited to the area of study.
3.9.2 Reliability
Reliability was ensured through the use of a standard well-designed questionnaire and;
proper selection, training and supervision of research assistants on interview techniques.
The research assistants were also involved in pre-testing to ensure they administered the
questionnaires correctly during the actual data collection. Completed questionnaires were
checked at the end of each day of data collection.
28
3.10 Data collection techniques
The data collection tool for the study was a semi-structured questionnaire (Appendix II),
which sought information on the participants’ socio-demographic characteristics, level of
knowledge on recommended management interventions for T2DM and management
practices for T2DM. The interviewer would introduce him/herself to the participant, and
having obtained an informed consent, he/she would read out the questions to the
participant as they were on the questionnaire and allow the participant to respond
appropriately without any influence.
3.11 Data management and analysis
Data was collected, coded and entered in the excel software, Microsoft office Excel
2010. All statistical analyses were performed using statistical package for social sciences
(SPSS) software version 20 (SPSS Inc., USA). Descriptive statistics were computed to
generate frequencies, mean, median and standard deviation. Proportions for categorical
data were computed while mean and standard deviation were reported for age. Chi-
square test was used to examine differences in proportions between socio-demographic
variables and the dependent variable. A P - value of less than 0.05 (P<0.05) at 95% CI
was considered significant for all statistical analysis. Bivariate analysis was computed to
determine the association between socio-demographic characteristics and management of
T2DM.
To determine the level of knowledge, a Likert scale was used. Each correct response
from the cluster questions was assigned a score of 1.0 and each incorrect score was
allocated 0. The overall score for each individual was calculated for all the nine (9)
questions on knowledge. The maximum expected score was 9. The cut off point was 5
out of the maximum 9. The overall mean level of knowledge score on causes, signs,

29
foods increasing blood sugar, complications, prevention, management interventions and
whether one knew that T2DM is controllable was computed. Anyone scoring less than 3
was termed as having poor knowledge, between 4 and 5 as having average knowledge
while above 5 was classified as having good knowledge. The results were summarized
and presented in graphs and tables.
3.12 Logistical and Ethical considerations
This study was approved by Kenyatta University Graduate School and ethical approval
to carry out the study was obtained from Kenyatta University Ethics Review Committee
(Appendix III). Authority to conduct the study was sought from the National
Commission for Science, Technology and Innovation (NACOSTI), (Appendix V).
Administrative authorization to carry out the study was sought from administration of
both North Kinangop Catholic hospital and Engineer sub-County in Nyandarua South
sub-County (Appendix VII). Informed consent was obtained from each prospective
participant prior to their participation (Appendix I). Participants’ identity remained
anonymous throughout the study to guarantee privacy. The study participants were
assured of confidentiality of the information they gave. Copies of signed consent forms
were kept in a lockable cabinet and access controlled by the researcher.

30
CHAPTER FOUR: RESULTS
4.1 Socio-demographic and economic characteristics of study respondents
4.1.1 Socio-demographic characteristics of study respondents
Table 4.1 shows socio-demographic characteristics of the study participants. The
participants’ median (range) age was 64.0 (18-91) with slightly more than half (56.7%)
aged above 60 years. Most of the respondents (59.5%) were females. A larger
proportion of the respondents (43.9%) had primary level of education while those with
college/university education were the least (5.8%). Majority of the participants, (92.2%)
were married.
Table 4.1 Socio-demographic characteristics of study participants
Variable Category Frequency (n=294) Proportion (%)
Age (Years)
Median (range) - 64.0 (18-91)
<20 1 0.3
18 – 29 11 3.9
30 – 39 15 5.1
40 – 49 29 10.0
50 – 59 71 24.0
≥ 60 167 56.7
Gender Male 119 40.5
Female 175 59.5
Marital status
Married 271 92.2
Single 20 6.8
Divorced 3 1.0
Level of education
Non-formal 83 28.2
Primary 129 43.9
Secondary 65 22.1
College/university 17 5.8

31
4.1.2 Socio-economic characteristics of the study participants
Table 4.2 shows participants’ socio-economic characteristics. Majority of the
participants (72.8%), were self-employed while casual labourers, (1.4%) were the least.
A larger proportion of the participants (53.7%) earned less than Kshs 5000 while the
least proportion (5.4 %) earned between Kshs 10,001-15,000 per month.
Table 4.2 Socio-economic characteristics of the study participants
Variable Category Frequency
(n=294)
Proportion
(%)
Employment
status
Employed 26 8.8
Self-employed 214 72.8
Unemployed 50 17.0
Casual labourer 4 1.4
Level of income
per month (Kshs)
< 5000 158 53.7
5001 – 10,000 90 30.6
10,001 – 15,000 16 5.5
≥ 15,000 30 10.2
4.2. Knowledge on management interventions for Type 2 Diabetes Mellitus (T2DM)
4.2.1 Source of information on diabetes mellitus
Figure 4.1 shows participants’ source of information on diabetes mellitus. The highest
proportion of the participants (42.2%), indicated that their first source of information on

32
diabetes mellitus was health talks by health care providers while posters and billboards
were the least (5.0%).
Figure 4.1 Participants’ source of information about diabetes mellitus
4.2.2 Screening for diabetes mellitus
Figure 4.2 shows participants’ reasons for screening for diabetes mellitus. The highest
proportion of the participants (49.0%) indicated that they were screened for T2DM
following health care providers’ initiative at the clinics while (2.1%), screened during
health outreaches.
Figure 4.2 Reasons for screening for diabetes mellitus
10.9%
5.0%
42.2%
10.5%
17.4%14.0%
0.0%
5.0%
10.0%
15.0%
20.0%
25.0%
30.0%
35.0%
40.0%
45.0%
Radio/TV Posters and
billboards
Health
facilities
Own
diagnosis
Friends Relatives
38.8%
6.1% 4.0% 2.1%
49.0%
0.0%
10.0%
20.0%
30.0%
40.0%
50.0%
60.0%
Doctor's recommendation
Media influence Relatives During outreaches
Initiated at the clinic
33
4.2.3 Enrolment into diabetes follow up program
Table 4.3 shows participants’ enrolment into diabetes management program. A large
proportion of the participants (82.7%), enrolled into diabetes management program
immediately after they were diagnosed with the condition. Majority of the participants
(85.2%), enrolled into the program following doctor’s recommendation. Among the
participants who delayed enrolment, slightly more than half (64.5%) reported that they
were not aware about the diabetes management program.
Table 4.3 Enrolment into diabetes management program
Variable Category Frequency
(n=294)
Proportion
(%)
Immediate
enrolment
Yes 243 82.7
No 51 17.3
Reason for
immediate
enrolment
Doctor’s recommendation 207 85.2
Advice from relatives 4 1.6
Friends’ advice 3 1.2
Fear of complications 3 1.2
Perceived benefits from
program
11 4.5
To understand the condition 15 6.3
Reason for
delayed
enrolment
Did not know about the
program
33 64.5
Fear of being known to be
diabetic
8 15.6
Not believed the diagnosis 7 13.3
Not aware of services offered 2 4.4
Had to consult the family 1 2.2

34
4.2.4 Duration on follow up in the diabetes management program
Figure 4.3 shows participants’ duration on follow up in the diabetes management
program. A large proportion of the participants (76.4%), reported to have been on follow
up for T2DM for at least ten (10) years while the least (2.1%), having been on follow up
for more than thirty (30) years.
Figure 4.3 Participants’ duration on follow up in diabetes management program
4.2.5 Knowledge on T2DM management interventions among study participants
Figure 4.4 and 4.5 show participants’ level of knowledge on T2DM management
interventions. Majority of the participants (95.6%) knew that T2DM was controllable.
Regarding the level of knowledge on T2DM management interventions, a large
proportion of the participants (60%), had poor knowledge on signs of poor blood sugar
level while a very low proportion (7.8%) were rated as having good knowledge. A large
proportion of the participants (42.5%) had average knowledge on T2DM complications.
Most of the participants (45.6%) had good knowledge on management of body weight
76.4%
14.6%
6.9%2.1%
0.0%
10.0%
20.0%
30.0%
40.0%
50.0%
60.0%
70.0%
80.0%
90.0%
<10 Years 11- 20 Years 21 - 30 Years > 30 Years

35
while the least (23.5%) had poor knowledge. A small proportion of the participants had
good knowledge on prevention of foot ulcers while the majority (50.3%) had poor
knowledge.
Figure 4.4 Participants’ level of knowledge on T2DM management interventions
55.1%
22.4%
7.8%
29.3%31.3%
35.4%
45.3%
31.3%
42.5%
47.6%
9.5%
32.3%
60.9%
28.2%
21.1%
0.0%
10.0%
20.0%
30.0%
40.0%
50.0%
60.0%
70.0%
Knowledge
on T2DM
management
interventions
Knows causes
of poor blood
sugar
Knows signs
of poor blood
sugar
Knows
complications
of T2DM
Knows
prevention of
T2DM
complications
Good knowledge
Average knowledge
Poor knowledge
Key

36
Figure 4.5 Participants’ level of knowledge on T2DM management interventions
4.3 Practices for management of T2DM among study participants
4.3.1 Practice on balanced diet for diabetics
Figure 4.6 shows participants’ practice on balanced diet for diabetics. A large proportion
of the participants (46.6%) had poor practices while the least (20.1%) indicated good
45.6%
31.6%
20.4%
8.5%
31.0% 31.0% 30.6%
41.2%
23.4%
37.4%
49.0%50.3%
0.0%
10.0%
20.0%
30.0%
40.0%
50.0%
60.0%
Knows practices
to maintain body
weight
Knows T2DM
balanced diet
Knows foods
that increase
blood sugar
Knows
prevention of
foot ulcers
Good knowledge
Average knowledge
Poor knowledge
Key

37
practice. This was rated in reference to the diabetic plate outlining balanced diet for
diabetics in the recommended nutrient proportions.
Figure 4.6 Participants’ practice on balanced diet for diabetics
4.3.2. Duration of physical activity/exercise session
Figure 4.7 shows participants’ duration of physical activity in a day. Slightly more than
half of the participants (56.5%) exercised for at least thirty (30) minutes in a day while
one fifth (20.4%) exercising for 0 - 15 minutes daily.
Figure 4.7 Duration of physical activity/exercise sessions in a day
20.1%
33.3%
46.6%
0.0%
10.0%
20.0%
30.0%
40.0%
50.0%
Good Fair Poor
20.4%23.1%
56.5%
0.0%
10.0%
20.0%
30.0%
40.0%
50.0%
60.0%
0-15 Minutes 16-29 Minutes > 30 Minutes
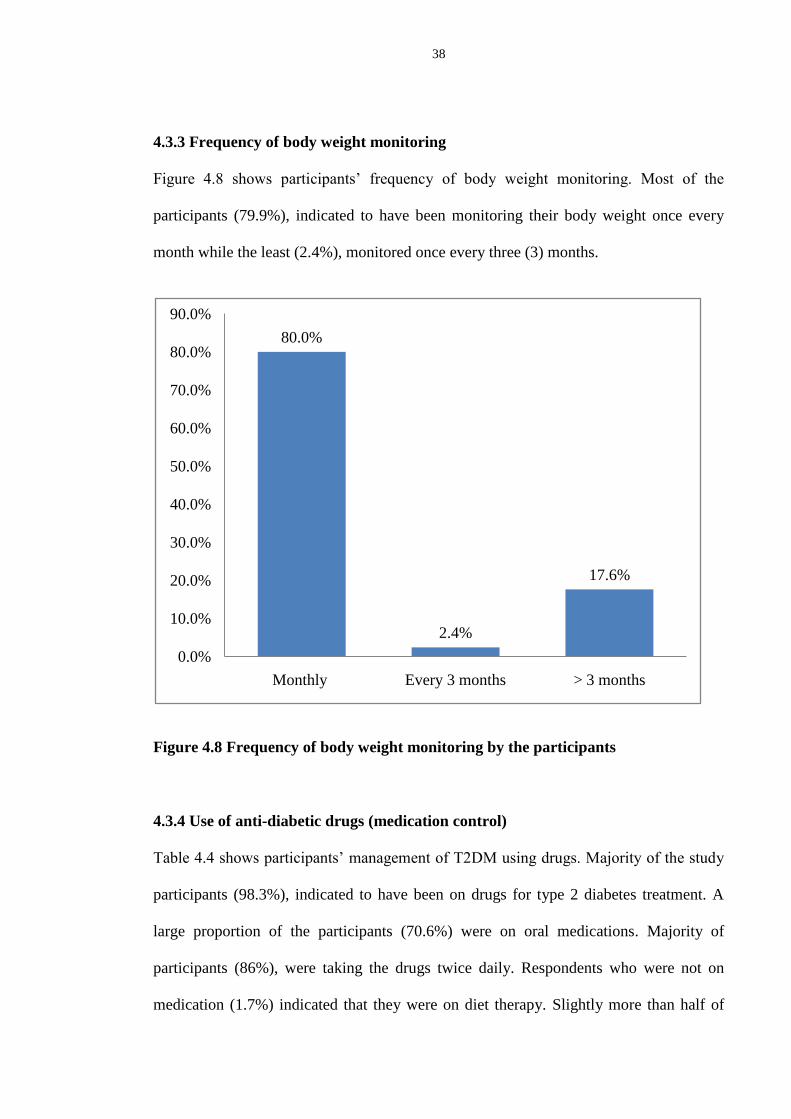
38
4.3.3 Frequency of body weight monitoring
Figure 4.8 shows participants’ frequency of body weight monitoring. Most of the
participants (79.9%), indicated to have been monitoring their body weight once every
month while the least (2.4%), monitored once every three (3) months.
Figure 4.8 Frequency of body weight monitoring by the participants
4.3.4 Use of anti-diabetic drugs (medication control)
Table 4.4 shows participants’ management of T2DM using drugs. Majority of the study
participants (98.3%), indicated to have been on drugs for type 2 diabetes treatment. A
large proportion of the participants (70.6%) were on oral medications. Majority of
participants (86%), were taking the drugs twice daily. Respondents who were not on
medication (1.7%) indicated that they were on diet therapy. Slightly more than half of
80.0%
2.4%
17.6%
0.0%
10.0%
20.0%
30.0%
40.0%
50.0%
60.0%
70.0%
80.0%
90.0%
Monthly Every 3 months > 3 months
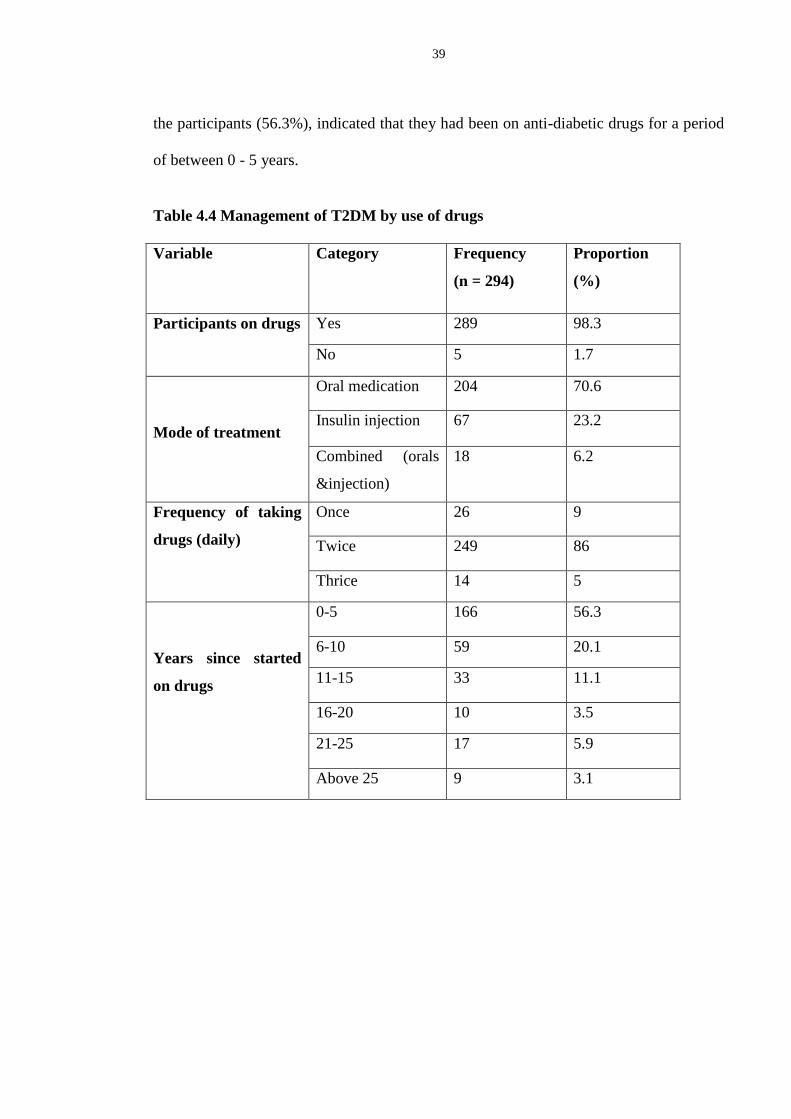
39
the participants (56.3%), indicated that they had been on anti-diabetic drugs for a period
of between 0 - 5 years.
Table 4.4 Management of T2DM by use of drugs
Variable Category Frequency
(n = 294)
Proportion
(%)
Participants on drugs Yes 289 98.3
No 5 1.7
Mode of treatment
Oral medication 204 70.6
Insulin injection 67 23.2
Combined (orals
&injection)
18 6.2
Frequency of taking
drugs (daily)
Once 26 9
Twice 249 86
Thrice 14 5
Years since started
on drugs
0-5 166 56.3
6-10 59 20.1
11-15 33 11.1
16-20 10 3.5
21-25 17 5.9
Above 25 9 3.1

40
4.4. Influence of participants’ socio-demographic and economic characteristics on
T2DM management practices
Table 4.5 shows association between respondents’ socio-demographic and economic
characteristics and management of T2DM. Socio-demographic and socio-economic
characteristics that were found to be significantly associated with management of T2DM
were education level (n = 294, df-3, χ2
-4.433, P- 0.035) and income level (n = 294,
df-3, χ2 -5.999, P - 0.006).
Table 4.5 Association between respondents’ socio-demographic and economic
characteristics and management of T2DM
Variable χ2 -
Value P- value No. of valid
cases
Df
Gender 0.043 0.836
294
1
Marital status 3.131 0.209 2
Education level 4.433 0.035 3
Employment status 0.049 0.825 3
Income level 5.991 0.006 3
4.4.1 Bivariate analysis of association between socio-demographic characteristics
and management of T2DM
Table 4.6 shows bivariate analysis results of socio-demographic characteristics of the
participants. Participants who had College/ university education were 5.4 times more
likely to practice good management of T2DM (OR 5.3666 (1.47-19.58), 95% CI, 1.47-
19.58, P=0.0109) compared to those with non-formal, primary and secondary education

41
levels. There was no significant association between participants’ age, gender and
marital status with good management practice.
Table 4.6 Bivariate analysis of association between socio-demographic
characteristics and management of T2DM
Variable Good
management
(155)
Poor
management
(139)
OR
(95% CI)
P-value
Age - median,
(range)
68.00 (IQR=21) 62.00
(IQR=20.00)
Gender
Male 62 (40.00%) 57 (41.01%) Reference
Female 93 (60.00%) 82 (58.99%) 1.0427
(0.65-1.66)
0.8606
Education level
Primary 69 (44.52%) 60 (43.17%) Reference
Secondary 33 (21.29%) 32 (23.02%) 1.1152
(0.61-2.03)
0.7204
College/
university
14 (10.07 %) 3 (1.94%) 5.3666
(1.47-19.58)
0.0109
Non-formal 50 (32.26%) 33 (23.74%) 0.7590
(0.43-1.33)
0.3340
Marital Status
Single 9 (5.81%) 11 (7.91%) Reference
Married 144 (92.90%) 127 (91.37%) 0.7216
(0.29-1.80)
0.4835
Divorced 2 (1.29%) 1 (0.72%) 0.5337
(0.03-5.28)
0.4933

42
4.4.2 Bivariate analysis of association between socio-economic characteristics and
management of T2DM
Table 4.7 shows bivariate analysis results of socio-economic characteristics of the study
participants. Participants who had an income level of between Kshs 5,001-10,000 per
month were 2.2 times more likely to practice good management of T2DM (OR 2.1562
(1.27-3.66), 95% CI, 1.27-3.66, P = 0.0044).
Table 4.7 Bivariate analysis of association between socio-economic characteristics
and management of T2DM
Variable Good
management
(155)
Poor
management
(139)
OR (95%
CI)
P-value
Employment Status
Self-employed 118 (76.13%) 96 (69.06) Reference
Employed 13 (8.39%) 13 (9.35%) 1.2292
(0.54-2.78)
0.6196
Casual labourer 1 (0.65%) 3 (2.16%) 3.6875
(0.38-36.02)
0.2618
Unemployed 23 (14.84%) 27 (19.42%) 1.44
(0.78-2.68)
0.2448
Monthly income (Kshs)
0 - 5000 92 (59.35%) 64 (46.04%) Reference
5001 -10000 54 (38.85%) 36 (23.23%) 2.1562
(1.27-3.66)
0.0044
10001-15000 9 (5.81%) 7 (5.04%) 1.1181
(0.40-3.16)
0.8331
15001 and above 18 (11.61%) 14 (10.07%) 1.1181
(0.52-2.41)
0.7758
43
CHAPTER FIVE: DISCUSSION, CONCLUSION AND RECOMMENDATIONS
5.1 Discussion
5.1.1 Knowledge on management interventions
The findings from this study show that the level of knowledge on the T2DM
management interventions among the participants was low. This was also reflected in
their knowledge of T2DM management interventions. These findings are similar to those
by the Kenya National Diabetes Strategy which indicated that there is a low level of
public knowledge, (below 30%), about diabetes in Kenya (KNDS, 2010). Majority of
the participants did not know foods which increase blood sugar level as they were not
able to identify examples of the foods. These findings are similar to those from a study
conducted in Mombasa which established that despite listing sugary and starchy foods,
many patients were not able to mention many actual examples of these types of foods
that increase blood sugar (Dropkin, 2010). This is because having good knowledge on
foods which increase blood sugar results in good management of T2DM. Similar
findings were reported in a study conducted in South Africa which indicated that proper
diabetic diet among diabetics require good knowledge and proper control of the types of
nutrients entering their digestive system, and hence allows indirectly, significant control
over changes in blood glucose levels (Mollentze, 2012).
Knowledge on signs and symptoms of T2DM among the participants was poor. A large
proportion of the participants were not able to identify T2DM related signs and
symptoms. This is similar to findings from a study conducted in Sweden which indicated
low level of knowledge on signs and symptoms of diabetes among diabetic clients
(Trepp et al., 2010).

44
Level of knowledge on T2DM complications was poor among the study participants.
Majority of the participants were not able to identify T2DM complications. These results
are similar to those from a study conducted in sub-Saharan Africa which found out that
T2DM clients knew one to three of the proven complications and that educating patients
about the many complications of diabetes is an important step in motivating them to
control their blood sugars (Tuei et al., 2010). This is critical because chronic
complications occur in significant proportions of T2DM clients with both early and sub-
optimally controlled long-standing T2DM. If left untreated or poorly managed, patients
suffering from T2DM are at greater risk of developing cardiovascular disease, diabetic
retinopathy, diabetic neuropathy (resulting in autonomic dysfunction), and potential
complications resulting in lower extremity amputation (Mollentze, 2012).
The study indicated low uptake of screening for T2DM in the area as only a small
proportion of the participants had been screened for diabetes before they were diagnosed
with the condition. The participants reported reasons for not screening including fear of
being known to be diabetic, not feeling like they had the condition, lack of information
on diabetes screening and lack of awareness about screening services. The participants
reported various reasons for screening including doctors’ recommendation, media and
relatives influence as well as health care providers’ initiative at the clinics. Most of
participants had not been screened for T2DM due to fear of being diagnosed with the
condition and consequently being labelled as diabetic. These findings are similar to those
from a study conducted in South Africa which indicated that a large population of T2DM
patients had remained undiagnosed because of the lack of early screening and knowledge
of symptoms (Mash, 2007). This delayed diagnosis is costly to diabetics since most of

45
clients end up being admitted to hospitals for treatment of complications which could
have averted through early screening (Maina et al., 2011).
The participants’ main source of information on diabetes was health talks by health care
providers which was mainly accessible at the hospitals. The findings are similar to those
by the KDHS which indicated that health education talks done within health facilities is a
major source of information only that it targets those with diabetes (KDHS, 2014). The
KNDS also reported that health education is central to implementing changes when
provided through multiple methods and sites, such as community groups, schools,
workplaces, mass media, religious organizations and health centres (KNDS, 2010).
Majority of the participants enrolled into diabetes management program immediately
after diagnosis following doctors’ recommendation. Participants who delayed enrolment
reported that they were not aware about the diabetic management program while others
feared being known to be diabetic. These results are similar to those from a study
conducted in Canada which established that lack of enrolment and consistent follow up
at diabetic management centres was a stumbling block among most diabetics who chose
to keep off follow up due to negative perception and fear of disclosure of their diabetic
status (Huang et al., 2007).
5.1.2 Practices for management of T2DM
A large proportion of the participants knew that T2DM is controllable. However, their
responses on practices for control of the condition rated poorly. The participants reported
to have been undertaking exercise as they could tolerate with slightly more than half of
them reporting to have been exercising for at least thirty (30) minutes daily. This
findings are similar to those by Knowler et al., (2002) who established that exercising for

46
thirty (30) minutes daily, (usually by walking), for at least five (5) days a week would
alleviate severity of the condition.
Most of the participants monitored their blood sugar level once every month during
review clinics. This is not an appropriate approach to monitoring blood sugar because it
only gives the patient a short term picture of their control and general blood sugar level.
Similar findings are found in a study carried in Canada which established that many
T2DM patients check their blood sugar with a glucometer once a month mostly in health
facilities while others tested when they experienced symptoms of high blood sugar
(Huang et al., 2007).
The use of oral hypoglycemics was the main treatment modality for a large proportion of
the study participants. Participants who were not on anti-diabetic drugs indicated that
they were on nutritional therapy. The participants were compliant to the treatment
regimen and did not report any side effects from the drugs. These findings are similar to
those from a study in Armenia which established that the most prevalent form of
medication administration for T2DM treatment was oral administration which was
tolerable and with minimal or no side effects (Mealey, 2006).
5.1.3 Influence of participants’ socio-demographic characteristics on management
of T2DM
On the influence of socio-demographic and socio-economic characteristics on
management of T2DM, the study established a significant association between education
and income levels among the diabetes mellitus clients and management of T2DM. There
was no association between age, gender, marital status and employment and
management practices for T2DM among the clients. Education and income were

47
significantly associated with management of T2DM. Participants with college and
university education were more likely to manage the condition effectively. This finding
is dissimilar to those from a study carried out in Qassim which found out that education
level had no influence on diabetes management (Ahmad & Rasheed, 2014).
Participants’ level of income was also found to be associated with management of
T2DM. Higher income level was associated with good management of T2DM including
consistent access to health care, and improved access to affordable healthful foods. This
was found to be similar to findings from a study carried out in Amman city in Jordan
which established that as the diabetic client’s annual income increased their management
of diabetes was better as they were able to afford new methods of diabetes self-
management. (Mezyed & Yahya, 2013).
48
5.2 Conclusions
i. The study revealed low level of knowledge on T2DM management interventions
among the participants. Most of them did not know the causes of poor blood sugar
level, signs of poor blood sugar control, T2DM healthy dietary measures and
measures prevention of T2DM complications. The major source of information on
diabetes mellitus among the participants was health care facilities.
ii. Practices applied in management of T2DM amongst the participants included anti-
diabetic drugs and tolerable activity leaving out self blood glucose monitoring
eexercise and drug therapy were fairly undertaken by the participants.
iii. Participants’ levels of education and income were found to be significantly
associated with management of T2DM. Participants with College/university
education and higher income level practiced good management of T2DM.
5.3 Recommendations
i. The national and Nyandarua County government’s Department of Health to improve
on creation of awareness on T2DM management interventions and diversify the
media so as to reach most people. This should be standardized across the health
facilities in order to improve the level of knowledge on management interventions
for T2DM among diabetic clients.
ii. The County’s Department of Health to organize for health education sessions on
practices for management of T2DM in the community through community outreach
programs and barazas. This will empower T2DM clients to understand and
effectively apply the practices for good management of T2DM.

49
iii. The County Department of Education to plan for academic seminars through which
to create awareness on the importance of formal education because a higher level of
education significantly influences the management of T2DM.
5.4 Recommendation for further research
Research into the other factors that influence choice of follow up care among T2DM
clients in the study area including cultural attributes, religion, accessibility to the facility,
in order to provide information necessary for planning and improving T2DM
management programs.

50
REFERENCES
Adams, D. D. (2008). Autoimmune destruction of pericytes as the cause of diabetic
retinopathy. Clinical opthalmology , 2 (2), 295-8.
Ahmad, A., & Rasheed, A. (2014). The role of educational level in glycemic control
among patients with type 2 diabetes mellitus. International Journal of Healh Sciences , 8
(2), 177-187.
Azevedo, M. A. (2008). Diabetes in Sub-Saharan Africa: Kenya, Mali, Mozambique,
Nigeria, South Africa and Zambia. InternationaJournal of Diabetes in Developing
Countries , 28 (4), 101-108.
Christensen, D., Mwaniki, D., & Boit, M. (2006). Type 2 diabetes in Kenya: The role of
rural-urban migration,(Abstract A120). Diabetic Med , 239 suppl (4), 55.
Dropkin. (2010). An Approaching Epidemic: Exploring Diabetes Awareness & Care in
Mombasa, Kenya. Independent Study Project (ISP) Collection Paper 820 .
Huang, E., Brown, S., Ewigman, B., Foley, E., & Meltzer, D. (2007). "Patient
Perceptions of Quality of Life With Diabetes-Related Complications and Treatments".
Diabetes Care , 30 (10), 2478-83.
International Diabetes Federation. (2009). Diabetes Atlas, 4th Edition. International
Diabetes Federation.www.idf.org.
International Diabetes Federation. (2012). Global guidelines for type 2 diabetes 2012.
International Diabetes Federation.www.idf.org.
International Diabetes Federation. (2013). Diabetes Atlas, 5th Edition. International
Diabetes Federation. www.idf.org.
International Diabetes Federation. (2014). Diabetes Atlas.6th Edition. International
Diabetes Federation.www.idf.org.
International Diabetes Federation. (2015). Diabetes Atlas, 7th Edition. International
Diabetes Federation.www.idf.org.
KDHS (2014). National Bureau of Statistics-Kenya and ICF International. KDHS Key
Findings. Rockville,Maryland, USA : KNBS and ICF International.
Kibriya, M., Ali, L., Banik, N., & Khan, A. (1999). "Home monitoring of blood glucose
(HMBG) in Type 2 diabetes mellitus in a developing country". Diabetes research and
clinical practice , 46 (3), 253-7.
KNDS. (2010). Kenya National Diabetes Strategy 2010-2015. Nairobi: Ministry of
Public Health and Sanitation.
51
Knowler, W., Barett-Connor, E., & Fowler, S. (2002). Diabetes Prevention Program
Research Group. Reduction in incidence of type 2 diabetes with lifestyle interventions or
metformin. N Engl J Med , 346, 393-403.
Lee, K., Park, J., Kim, S., Lee, M., Kim, G., Park, S., et al. (1995). Prevalence and
associated features of albuminuria in Koreans with NIDDM. Diabetes Care , 18 (6), 793-
9.
Maina, W., Ndegwa, A., Njenja, E., & Muchemi, E. (2011). Knowledge, attitude, and
practices related to diabetes among community members in four provinces in Kenya: a
cross sectional study. African journal of diabetes medicine , 19 (1), 15-18.
Mash, B. (2007). Screening for diabetic retinopathy in primary care with mobile fundal
camera-evaluation of a South African pilot project. S Afr Med journal , 97 (12), 1284-8.
Mathers, C., & Loncar, D. (2006). Projections of global mortality and burden of disease
from 2002 to 2030. PLoS Med , 3 (11), e442.
Mayosi, B. M., Flisher, A. J., Lalloo, U. G., Sitas, F., Tollman, S. M., & Bradshaw, D.
(2009). The burden of non-communicable diseases in South Africa. The Lancet , 374,
934-947.
Mealey, B. L. (2006). "Diabetes Mellitus Management". Diabetes Mellitus and Oral
Health. Armenian Medical Network .
Mezyed, A. A., & Yahya, W. N. (2013). The Relationship between Demogrpahic
Variables and Diabetes Self-Management in Diabetic Patients in Amman City/Jordan.
Glob J Health Sci Mar , 5 (2), 213-220.
MOH. (2013), Ministry Of Health, Nairobi Kenya.
Mollentze, W. (2012). Management of type 2 diabetes in primary healthcare. South
African Journal Of Diabetes and Vascular Disease , 9 (3), 38.
Moodley, L., & Rambiritch, V. (2007). An assessment of the level of knowledge about
diabetes mellitus among diabetic patientsin a primary healthcare setting. South African
Family Practice , 49 (10), 16a-16d.
National Institute for Clinical Excellence. (2008). The management of Type 2 Diabetes.
NICE clinical guidelines 66.
National Institute for Health and Clinical Excellence. (2011). Preventing type 2 diabetes:
population and community-level interventions in high risk groups and the general
population: NICE Public health guidance. London: NICE.
Ogbera, A. O. (2006). An assessment of the disease burden of foot ulcers in patients with
diabetes mellitus attending a teaching hospital in Lagos, Nigeria. Int J Low Extreme
Wound , 5 (4), 244-9.

52
Ono, Y. (2008). "Diet therapy for diabetes and obesity, considering osteoporosis".
Clinical calcium , 18 (5), 662-9.
Osei, K., Schuster, D., Amoah, A., & Owusu, S. (2003). Diabetes in Africa. Pthogenesis
of type 1 and type 2 diabetes mellitus in sub-Saharan Africa:Implications for transitional
populations. J Cardiovasc Risk , 10, 85-96.
Rheeder, P. (2006). Type 2 diabetes: the emerging epidemic. South African Family
Practice , 48 (10), 20.
Rossouw, H. A., Grant, C. C., & Viljoen, M. (2012). Overwight and obesity in children
and adolescents: The South African problem. South African Journal of Sciences , 108, 1-
7.
Trepp, R., Wille, T., Wieland, T., & Reinhart, W. (2010). Diabetes-related knowledge
among medical and nursing house staff. Swiss Med Wkly , 140 (25-26), 370-5.
Tuei, V. C., Maiyoh, G. K., & Ha, C. (2010). Type 2 diabetesmellitus and obesity in sub-
Saharan Africa. Diabetes/Metabolism Research and Reviews , 26, 433-445.
Walker, D. (2007). "Similarity Determination and Case Retrieval in an In telligent
Decision Support System for Diabetes Management".
WDF. (2007). The First African Diabetes Summit Report. World Diabetes Foundation.
Copenhagen, Denmark.
Wild, s., Roglic, G., Green, A., Sicree, R., & King, H. (2004). Global prevalence of
diabetes; Estimates for the year 2000 and projections for 2030. Diab Care , 27, 1047-
1053.
World Health Organization. (2013). "The top 10 causes of death Fact sheet N310".
Wylie-Rosett, J., & Vinicor, F. (2001). Diabetes mellitus. In:. (B. Bowman, & R. M.
Russel, Eds.) Present Knowledge in Nutrition , 552-563.
53
APPENDICES
Appendix I. Informed Consent form
My name is Francis Matheka Muoki. I am a Masters student from Kenyatta University. I
am conducting a study on “MANAGEMENT OF TYPE 2 DIABETES MELLITUS
BY DIABETIC CLIENTS IN NYANDARUA SOUTH SUB-COUNTY, KENYA”
The information gathered will be used by the ministry of health and the Sub-County
health management team in improving the community’s knowledge on management
guidelines and practices for the control of type 2 diabetes mellitus and the prevention of
diabetes related complications among diabetic clients in the Nyandarua South sub-county
community.
Participation. Your participation in this study is voluntary and requires that you fill in
the questions asked in the questionnaire. You will fill the questions with the guidance of
the interviewer. You have the right to refuse participation in this study without any
penalty. You may ask questions for clarification related to the study at any time. You
may as well withdraw from the study at any time without any consequences now or
thereafter.
Benefits. There are no monetary or material benefits from participation in this study.
However, your participation in the study will help us learn more about management of
type 2 diabetes mellitus in the sub-county and the information gathered will help create
more awareness of recommended management guidelines and in the improvement of the
services you receive for better management of the condition. This will thus reduce on
Type 2 diabetes related complications among diabetic clients in the community.
Risks. There are no risks associated with your participation in the study and the
information that you will give will not be used in any way to compromise on the services
you receive from the facility. However, filling out this questionnaire will take you about
10 minutes and in case you are uncomfortable to answer some questions, you are free to
skip them.
Privacy and confidentiality. You are requested to fill this questionnaire in a private
setting and please DO NOT indicate your name on the questionnaire. The questionnaires

54
will be kept in a locked cabinet for safe keeping and the information you will give will
be kept confidential.
If you have any questions you may contact me on 0727 407 039. You can also contact
my supervisors: Dr. Wanyoro on 0722 747 903 or Professor E. Kabiru on 0721 998 558.
You can also contact the Kenyatta University Ethics Review committee secretariat on;
Participant’s declaration. The above information regarding my participation in the
study is clear to me and my participation in this study is voluntary. I understand that the
information I will give will be kept confidential and that I can opt out of the study at any
time. I understand that I will not be penalized or discriminated even if I declined to
participate in this study and that the study has no risks neither will it affect my services
in the facility.
______________________________ _______________
Signature or Thumbprint Date
Investigator’s declaration
I, the undersigned, have explained to the participant in a language he/she understands the
procedures to be followed in the study and the risks and benefits involved.
Name researcher…………………………………..
Researcher signature.................................. Date...................................
55
Appendix II. Researcher administered questionnaire
Section 1.Socio-demographic information
1. How old are you? ______________ (years)
2. Gender: Male Female
3. What is your highest level of education? Tick one that is applicable to you.
Primary
Secondary
College/University
Don’t know
4. What is your marital status? Tick one that is applicable to you.
Single
Married
Divorced
Separated
5. What is your employment status? Tick one that is applicable to you.
Self-employed
Employed
Casual labourer
Unemployed
6. What is your average household income per month (in Kshs)?
Less than 5,000
5,001-10,000
10,001-15,000
Over 15,000
Section 2. Knowledge
7. What was your first source of information about diabetes mellitus?
i. Television
ii. Radio
iii. Newspapers
iv. Magazines

56
v. Healthy facilities fliers
vi. Posters/ billboards
vii. Health talks by health care providers
Vii .Message by attending clinician
ii. Any other (specify)....................................................................................
8. When were you diagnosed with diabetes? ...................................................
9. Had you screened for diabetes before the diagnosis?
YES
NO If NO, skip to question.10
If Yes, what had made screen for diabetes?
a. Doctor’s recommendation
b. Television/ radio/ magazines/ brochures
c. Relative/ friend advice
d. Attend health workshop/ outreach
e. Health care provider initiated it at the clinic
f. It’s a standard/requirement of care at clinic
g. Others (specify)................................................................................
10. Did you enrol into the diabetic management program immediately?
YES
NO If NO, skip to part b.
If Yes, (a) what made you enrol into the diabetes management program immediately?
a. Doctor’s recommendation
b. Relatives recommendations
c. Advised by friends
d. Fear of complications
e. To understand my condition
f. Perceived benefits from the program
g. Better management my blood sugars
Any other (specify).................................................................................

57
(b) What made you delay enrolling into the diabetes management program?
a. Fear of being known to be diabetic
b. I Did not believe the diagnosis
c. I was not sure of the services offered
d. Not aware of the program
e. I had to consult my family
f. I feared being stigmatised
g. Any other (specify)................................................................................
Section 2. Knowledge on T2DM management interventions
11. a. Is diabetes mellitus controllable?
YES
NO If NO, skip to question.12
b. What management interventions for type 2diabetes mellitus do you know?
a. Exercise/activity
b. Diabetic diet therapy
c. Drug therapy
d. Frequent checkups for blood sugar
12. What causes of poor blood sugar control do you know?
a. Not taking drugs/ anti-diabetics
b. Failure to exercise
c. Feeding on high fat diet
d. Taking carbohydrate rich meals
e. Not going for clinical check ups
f. Any other (specify)....................................................................
13. What signs of poor blood glucose do you know?
a. Frequent passage of urine
b. Feeling thirsty
c. Hunger
d. Tremors
e. Sweating
f. Blurred vision

58
g. Heavy headedness
h. Nausea
i. Vomiting
Any other (specify)..........................................................
14. Which complications of Diabetes Mellitus do you know?
a. Loss of sight/blindness
b. Foot ulcers
c. Stroke
d. Heart attack
e. Kidney failure
f. Any other (specify).........................................................
15. Which types of food do you include in your daily meals?
a. ......................................................................................................................
b. ......................................................................................................................
c. ......................................................................................................................
d. ......................................................................................................................
16. Which foods increase blood sugar level the most?
a. ......................................................................................................................
b. ......................................................................................................................
c. ......................................................................................................................
d. ......................................................................................................................
17. How do you prevent yourself from developing foot ulcers?
a. Proper drying after bathing/washing
b. Avoiding injuries
c. Avoid tight shoes
d. Putting on fitting socks
e. Avoiding open shoes
f. Any other (specify).............................................................

59
18. How do you prevent yourself from developing diabetes complications?
a. Exercising regularly
b. Taking medications as instructed
c. Self blood glucose monitoring
d. Attending clinics as appointed
e. Taking meals as instructed by nutritionist
f. Going for regular blood glucose check ups
g. Any other (specify)....................................................
Section 3. Type 2 DM management practices
a. How is your regular meal composition?
i. ......................................................................................................................
ii. ......................................................................................................................
iii. ......................................................................................................................
iv. ......................................................................................................................
v. ......................................................................................................................
(b). Exercise
How often do you exercise? .........................................................................................
How long is your exercise session in a day? (Minutes)
a. 0-5
b. 5- 10
c. 10-15
d. 15- 20
e. 20-30
f. More than 30
(c) Weight monitoring
How often do you go for weight monitoring?
i. Weekly
ii. Monthly
iii. Every three months
iv. Every six months

60
v. Yearly
Any other (specify)......................................................................................
(d). Use of anti-diabetic medications
i. Are you currently on drugs for diabetes treatment?
Yes No
ii. If Yes, which ones are you taking? ......................................................
iii. When were you started on the drugs? ..................................................
iv. How often do you take them? .............................................................
v. Do you experience side effects after taking the drug?
Yes No
If yes, what side effects have you experienced?
a..........................................................................................................................
b..........................................................................................................................
c..........................................................................................................................
d..........................................................................................................................

61
Appendix III. Kenyatta University Ethical approval letter

62
Appendix IV. NACOSTI Research Permit

63
Appendix V. NACOSTI research authorization

64
65
Appendix VI. Nyandarua County Commissioner research authorization

66
Appendix VII. Nyandarua County Director of Health research authorization

67
Appendix VIII. Nyandarua County Director of Education research
authorization

68
Appendix IX. Study Area map
Map of Kenya
Map of Nyandarua South sub-County


![Clinical Effectiveness and Safety of Analog Glargine in Type 1 … · Type 1 Diabetes Mellitus[Text Word]) OR Sudden-Onset Diabetes Mellitus[Text Word]) OR Diabetes Mellitus, Type](https://static.fdocuments.in/doc/165x107/60169f288f8b186d1345140c/clinical-effectiveness-and-safety-of-analog-glargine-in-type-1-type-1-diabetes-mellitustext.jpg)