Management of potassium in California rice systems
27
Management of potassium in California rice systems Bruce Linquist Winter grower meetings Jan 28 and Feb 5, 2013
Transcript of Management of potassium in California rice systems
Management of potassium in California rice systems
Bruce LinquistWinter grower meetingsJan 28 and Feb 5, 2013

Outline
• Cost of K fertilizer• Why plant needs K• Deficiency symptoms• Plant demand for K• K inputs and losses• Results of 2012 study: K status of CA rice soils
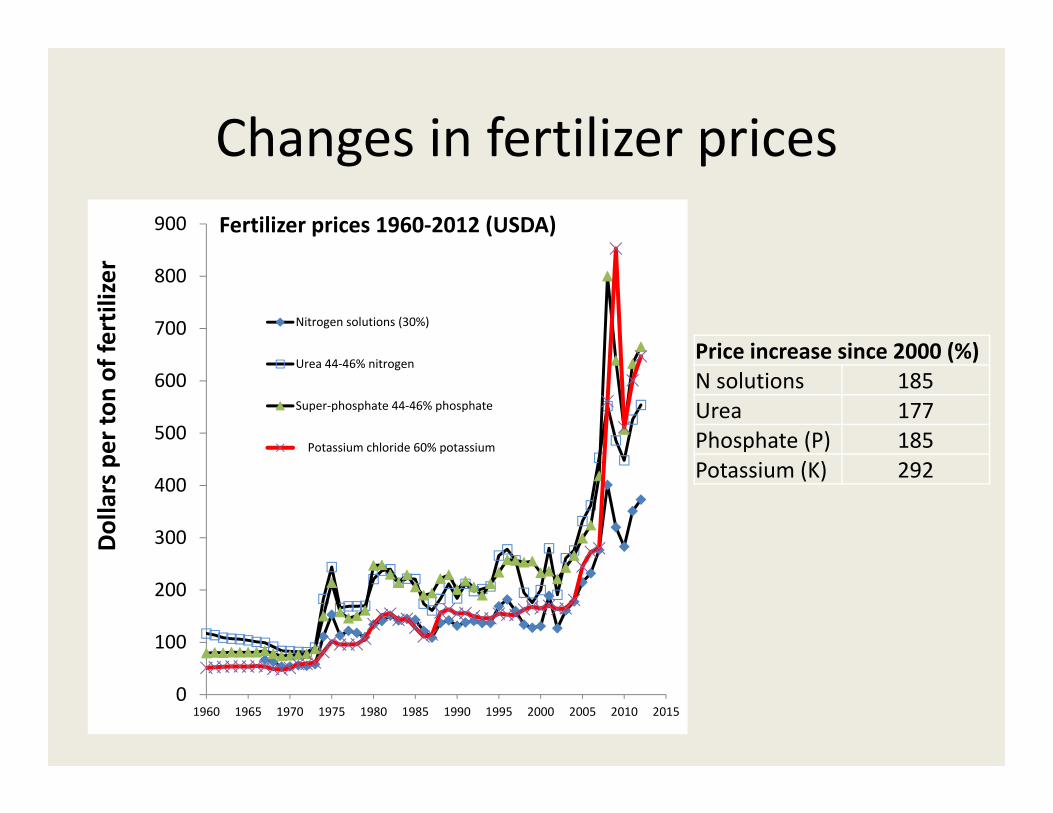
Changes in fertilizer prices
0
100
200
300
400
500
600
700
800
900
1960 1965 1970 1975 1980 1985 1990 1995 2000 2005 2010 2015
Dollars per to
n of fe
rtilizer
Fertilizer prices 1960‐2012 (USDA)
Nitrogen solutions (30%)
Urea 44‐46% nitrogen
Super‐phosphate 44‐46% phosphate
Potassium chloride 60% potassium
Price increase since 2000 (%)N solutions 185 Urea 177 Phosphate (P) 185 Potassium (K) 292

Why does rice need K?• Plant regulation
– Osmoregulation– Enzyme activation– Regulation of cell pH– Cellular cation‐anion balance– Regulation of transpiration– Regulation of assimilate transport
• Whole plant level– K increases leaf area and chlorophyll content– Delays senescence– Increases #spikelet/panicle, % filled grains, and grain weight
• Does not affect tillering

K deficiency
• Inadequate K results in:– An accumulation of sugars and amino acids that are suitable food sources for leaf diseases
• Adequate K improves a plants ability to tolerate adverse climatic conditions, lodging, insects, and diseases.
• Deficiency symptoms first occur in older leaves because K is a mobile nutrient.

Potassium deficiency symptoms
• Older leaf tips are yellowish brown
• Younger leaves can be short and droopy
• Rusty brown spots appear on tips of older leaves and then spreads to entire leaf.
• Symptoms tend to appear during later growth stages.
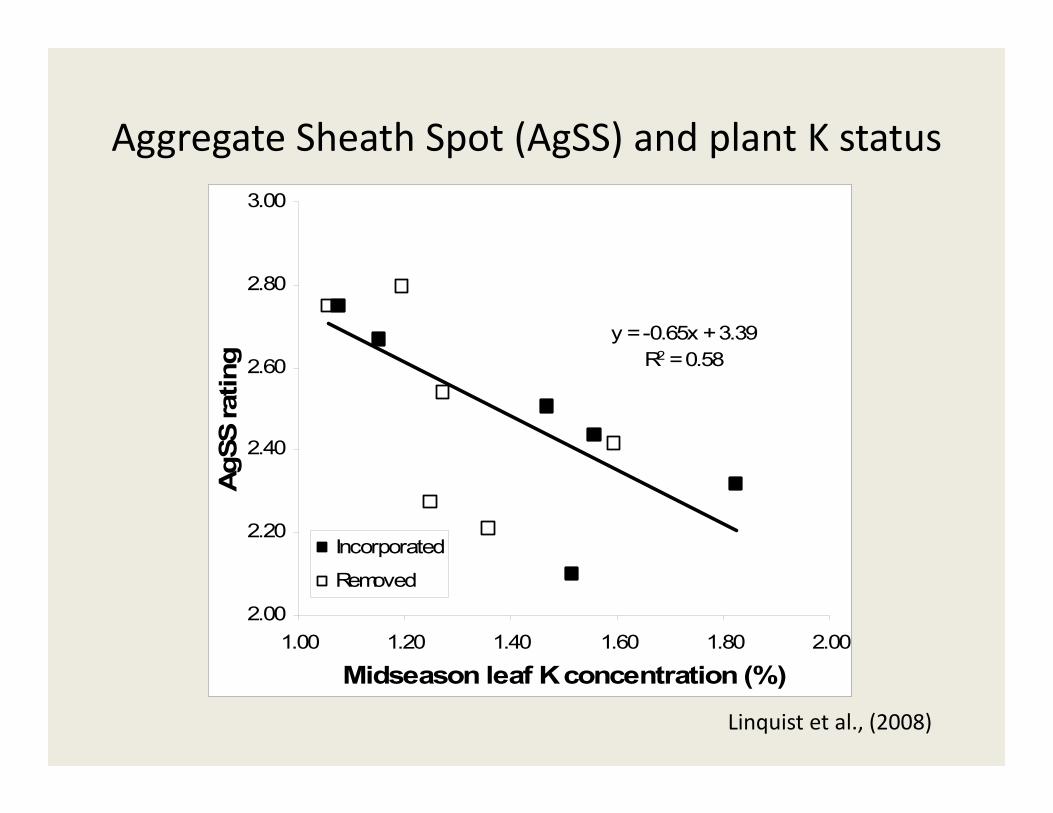
Aggregate Sheath Spot (AgSS) and plant K status
y = -0.65x + 3.39R2 = 0.58
2.00
2.20
2.40
2.60
2.80
3.00
1.00 1.20 1.40 1.60 1.80 2.00
Midseason leaf K concentration (% )
AgS
S ra
ting
Incorporated
Removed
Linquist et al., (2008)
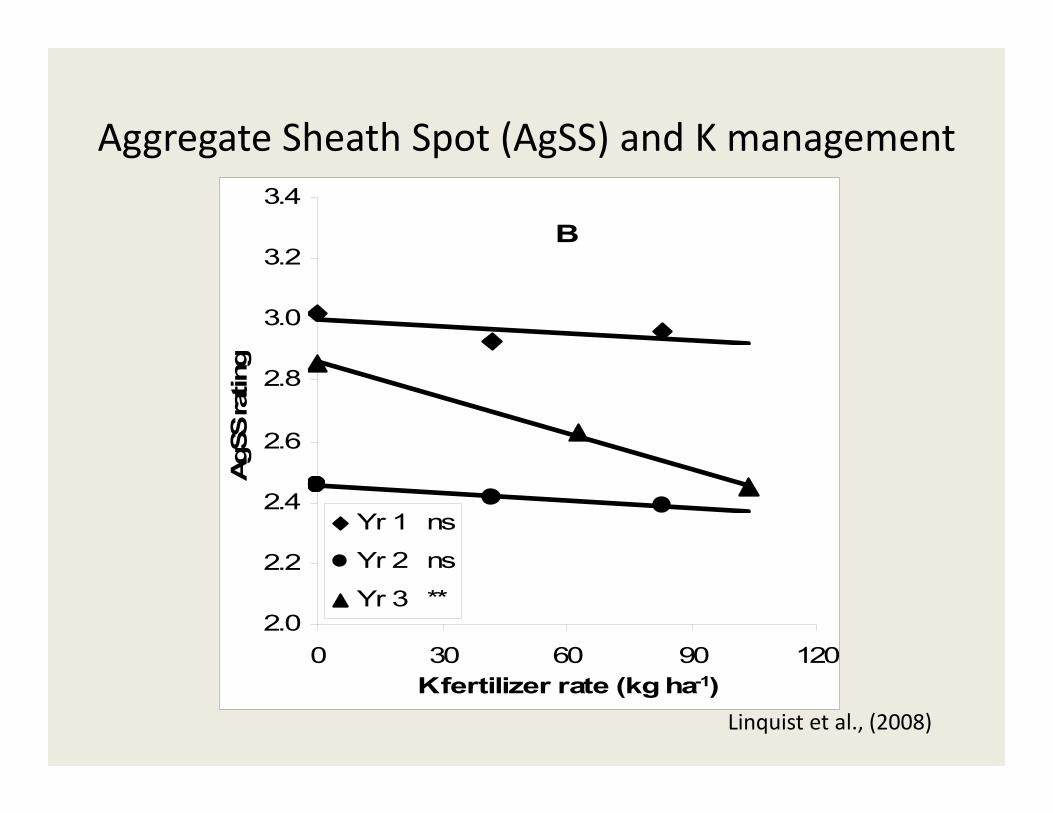
Aggregate Sheath Spot (AgSS) and K management
2.0
2.2
2.4
2.6
2.8
3.0
3.2
3.4
0 30 60 90 120K fertilizer rate (kg ha-1)
AgS
S ra
ting
Yr 1 ns
Yr 2 ns
Yr 3 **
B
Linquist et al., (2008)

How much K does a plant take up?
• K concentration at harvest– Grain: 0.27%– Straw: 1.39%
• Plant uptake (assume a yield of 85 sacks)– Grain: 23 lb K/ac (28 lb K2O/ac)– Straw: 118 (142)– Total: 141 (169)
Inputs and Losses of K in rice systems
• Inputs– Fertilizer– Irrigation water
• Losses– Grain harvest– Straw removal (28/33 lb K/K2O per ton of straw)– Surface water runoff

2012 Field study
• Objective: Determine status of K in CA rice soils• Study
– 31 rice fields– Analyzed 3 checks in each (top, middle, bottom)
• Soil K analysis• Leaf tissue K at heading
– Inlet water analysis (two times)– Grower field history
• Yields, K inputs, winter straw mgmt.• Develop a soil K budget

Summary information• 14/31 fields had applied K fertilizer
– Those that applied ‐ 30 kg K2O/ha (27 lb/ac)• No fields had straw removed regularly• Variability between checks ‐ not consistent• Soil K
– <100 ppm K: 8 fields all on east side of valley• No relationship between soil K and K fertilizer input/output• 4 groups of fields (adequate=100 ppm)
1. (14) Adequate soil K – No K addition2. (9) Adequate soil K – K addition3. (1) Inadequate soil K – No K addition4. (6) Inadequate soil K – K addition

Soil and flag‐leaf K values
0
60
120
180
240
300
360
1 3 5 7 9 11 13 15 17 19 21 23 25 27 29 31 33 35 37 39 41 43 45 47 49 51 53 55 57 59 61 63 65 67 69 71 73 75 77 79 81 83 85 87 89 91
Soil K (ppm
)
+K ‐K
+K+K
0.00
0.60
1.20
1.80
2.40
1 3 5 7 9 11 13 15 17 19 21 23 25 27 29 31 33 35 37 39 41 43 45 47 49 51 53 55 57 59 61 63 65 67 69 71 73 75 77 79 81 83 85 87 89 91
Flag leaf K (%
)
Flag leaf K vs. soil K
1.00
1.20
1.40
1.60
1.80
2.00
2.20
0 30 60 90 120 150 180 210 240 270 300 330 360
Flag leaf K (%
)
Soil K (ppm)
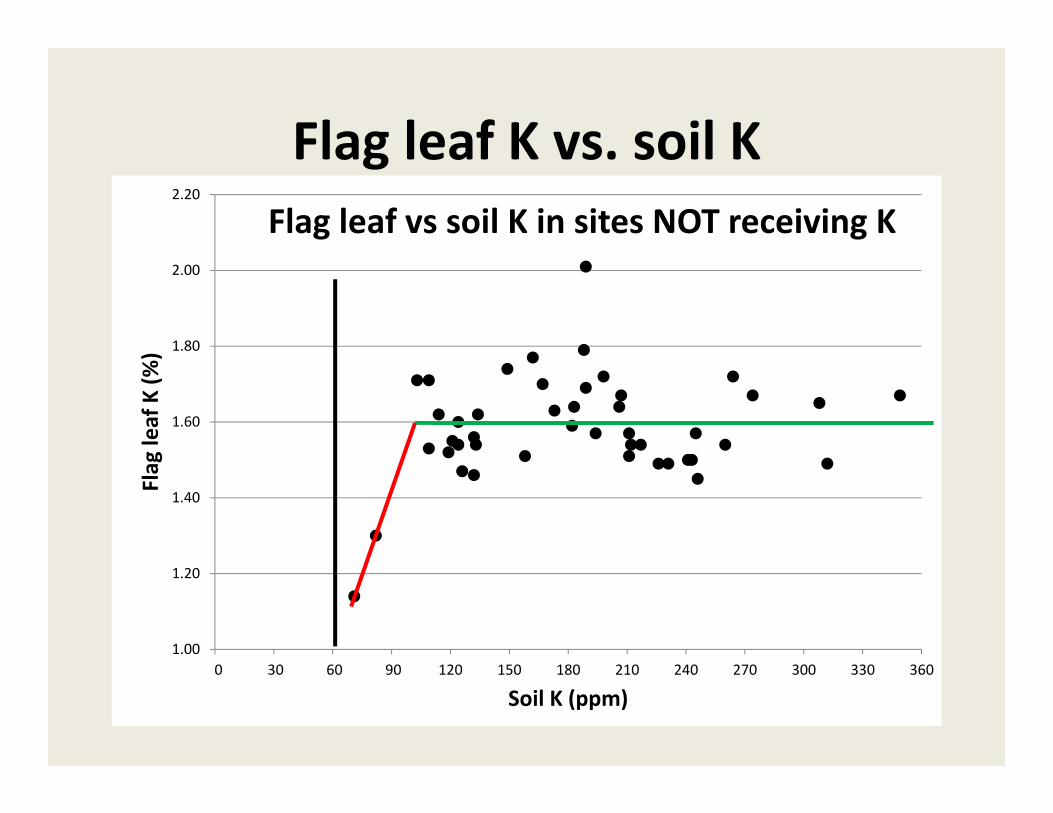
Flag leaf vs soil K in sites NOT receiving K

Flag leaf K vs. soil K
1.00
1.20
1.40
1.60
1.80
2.00
2.20
0 30 60 90 120 150 180 210 240 270 300 330 360
Flag leaf K (%
)
Soil K (ppm)
Flag leaf vs soil K in sites NOT receiving K
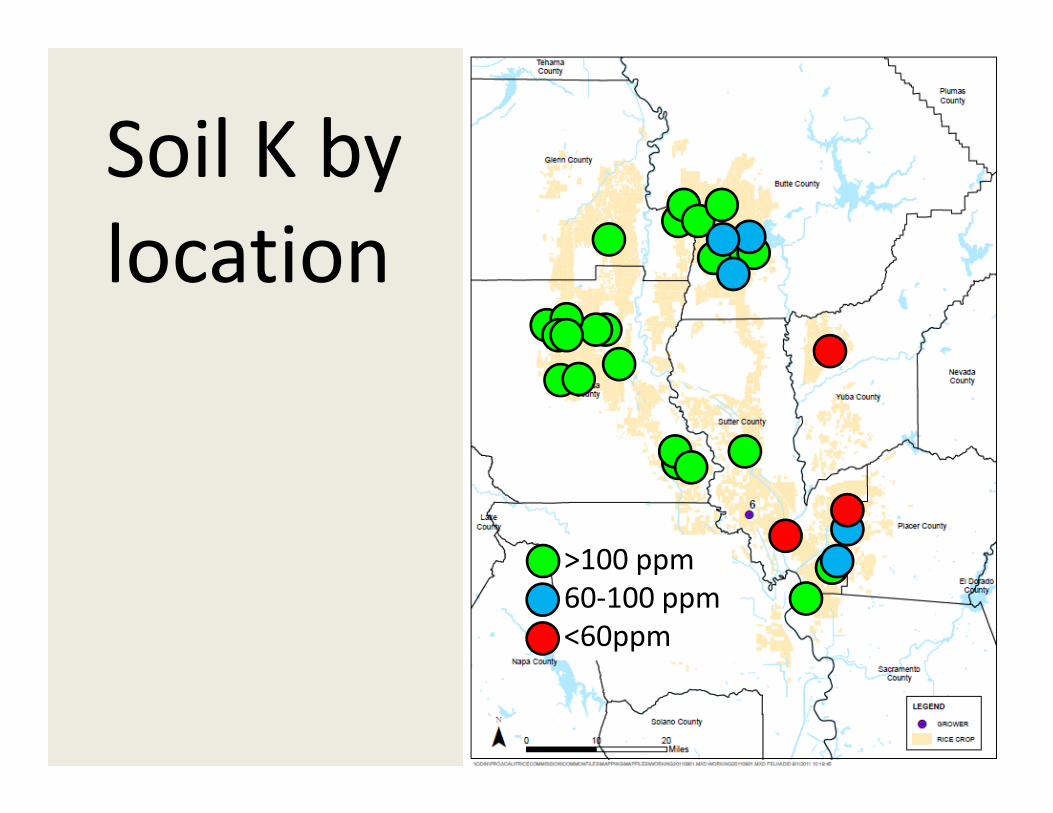
Soil K by location
>100 ppm60‐100 ppm<60ppm
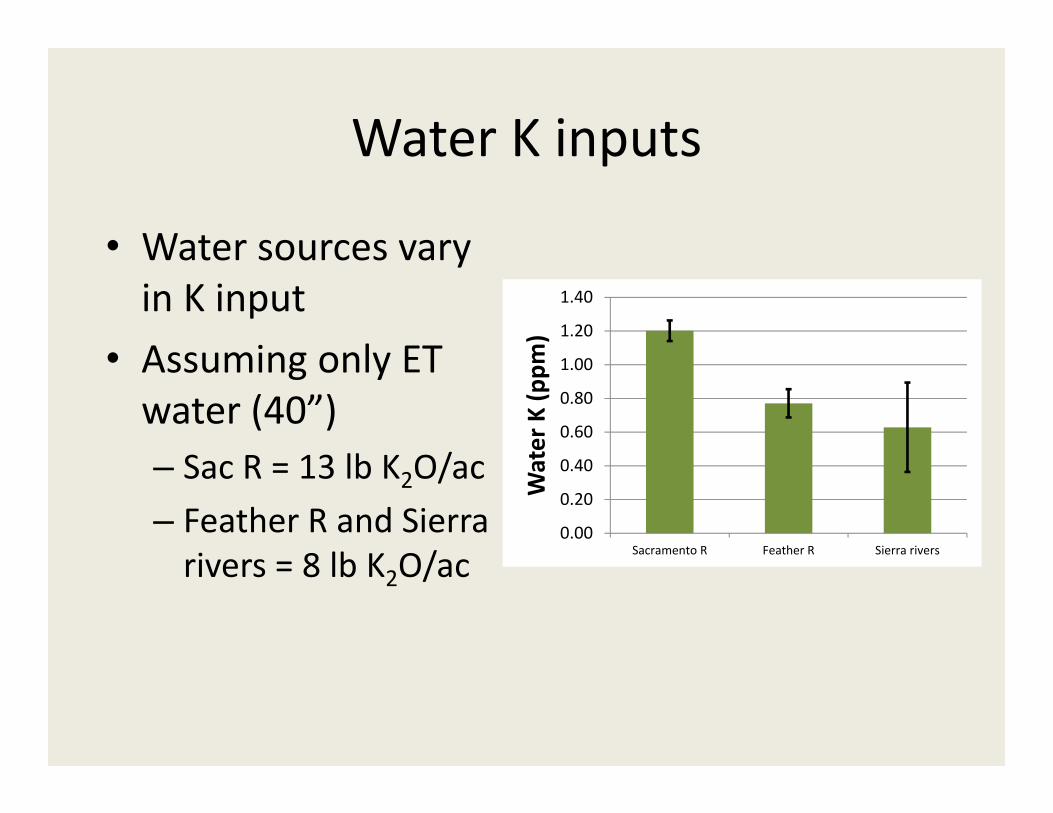
Water K inputs
• Water sources vary in K input
• Assuming only ET water (40”)– Sac R = 13 lb K2O/ac– Feather R and Sierra rivers = 8 lb K2O/ac
0.00
0.20
0.40
0.60
0.80
1.00
1.20
1.40
Sacramento R Feather R Sierra riversWater K (p
pm)

Soil K vs. irrigation water
y = 155.23x + 3.2486R² = 0.3207
0
50
100
150
200
250
300
0.60 0.70 0.80 0.90 1.00 1.10 1.20 1.30
Soil K concen
tration (ppm
)
Irrigation water K concentration (ppm)

Soil K vs. water and K balance
• No relationship between K balance and soil K.
• Suggests that K is not built up in the system
0
50
100
150
200
250
300
‐60.0 ‐40.0 ‐20.0 0.0 20.0 40.0 60.0 80.0
Soil K (ppm
)
Soil K balance (kg K/ha ‐ inputs ‐outputs)
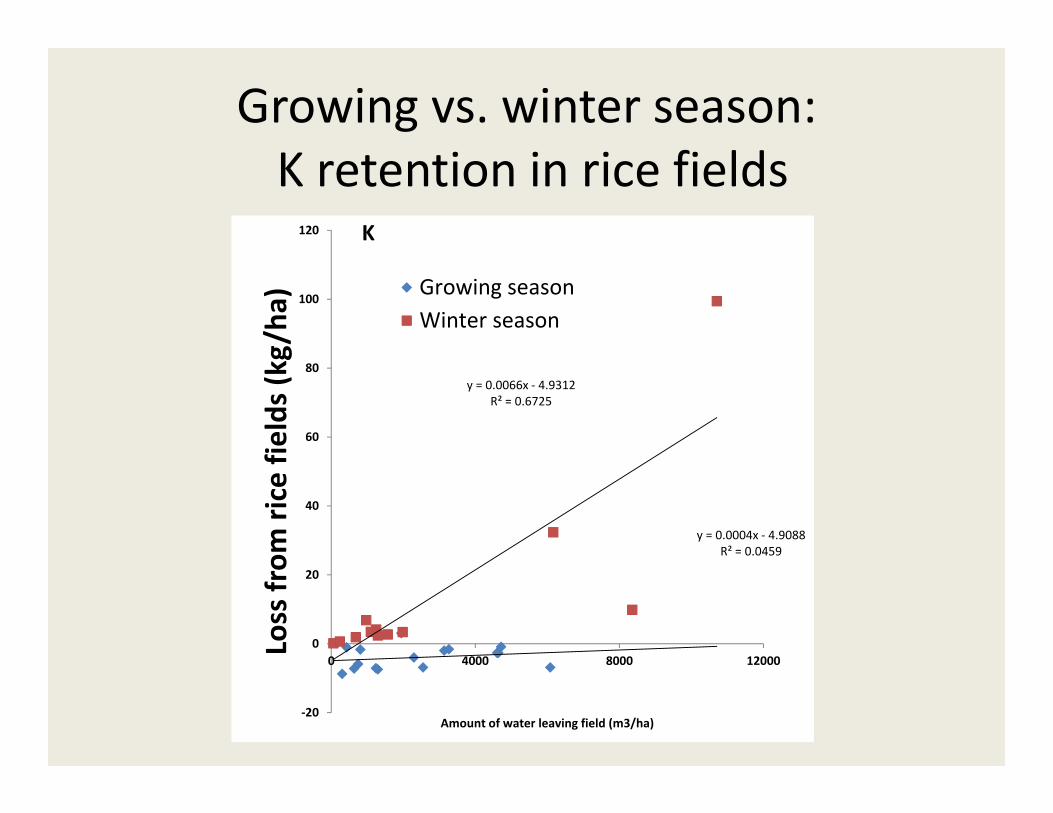
Growing vs. winter season:K retention in rice fields
y = 0.0004x ‐ 4.9088R² = 0.0459
y = 0.0066x ‐ 4.9312R² = 0.6725
‐20
0
20
40
60
80
100
120
0 4000 8000 12000
Loss from
rice fields (k
g/ha
)
Amount of water leaving field (m3/ha)
K
Growing seasonWinter season

Summary
• East side of valley has greater the potential for K deficiency– Related to soil type and irrigation source.
• No observed effect of previous fertilizer history on soil K– Possibly due to effects of winter flood mgmt.– Should not attempt to “build‐up” soil K
• Applications should be made based on soil test• Straw removal has a large effect on K fertility management decisions

Deciding on need for K fertilizer
• Considerations– Soil K
• Critical value is 60 ppm• Most CA soils above this value• Consider applying at least maintenance levels if soil K is below 100 ppm
– K maintenance • Only remove grain
– Apply 25‐30 lb K2O/ac• Remove both grain and ½ straw
– Apply 100 lb K2O/ac

What is this material? 0.7 0.3 1.7


Nutrients (lb) in 1 ton (2000 lb) of rice straw
• N 14 lb• P 6 lb• K 28 lb
• Value (2012 fertilizer prices)
• $31.34

2013 study• Continue 2012 study• Focus on fields:
– East side of Valley– Fields around Gridley– Fields without history
of K fertilizer applications
– Fields where straw is routinely removed
– Fields with groundwater pumps
• Sign up in back if interested
>100 ppm60‐100 ppm<60ppm

2013 study• Continue 2012 study• Focus on fields:
– East side of Valley– Fields around Gridley– Fields without history
of K fertilizer applications
– Fields where straw is routinely removed
– Fields with groundwater pumps
• Sign up in back if interested
>100 ppm60‐100 ppm<60ppm
THANK YOU