Management of Capital Flows - UNCTAD
418
Management of Capital Flows: Comparative experiences and implications for Africa UNITED NATIONS New York and Geneva, April 2003 UNITED NATIONS CONFERENCE ON TRADE AND DEVELOPMENT
Transcript of Management of Capital Flows - UNCTAD

Management of Capital Flows:Comparative experiences and implications for Africa
UNITED NATIONSNew York and Geneva, April 2003
UNITED NATIONS CONFERENCE ON TRADE AND DEVELOPMENT
Note
The views expressed in this book are those of the authors and do notnecessarily reflect the views of the UNCTAD secretariat. Thedesignations employed and the presentation of the material do notimply the expression of any opinion whatsoever on the part of theSecretariat of the United Nations concerning the legal status of anycountry, territory, city or area, or of its authorities, or concerning thedelimitation of its frontiers or boundaries.
*
* *
Material in this publication may be freely quoted; acknowledgement,however, is requested (including reference to the document number).It would be appreciated if a copy of the publication containing thequotation were sent to the Publications Assistant, Macroeconomicand Development Policies Branch, Division on Globalization andDevelopment Strategies, UNCTAD, Palais des Nations, CH-1211Geneva 10.
UNCTAD/GDS/MDPB/2003/1
UNITED NATIONS PUBLICATION
Sales No. E.03.II.D.20
ISBN 92-1-112594-4
Copyright © United Nations, 2003All rights reserved

iii
Acknowledgements
This volume contains seven papers that were presented at a workshopon management of capital flows, organized jointly by the UNCTADsecretariat and the Government of Egypt in Cairo on 20–21 March 2001.The authors of these papers, whom we wish to thank for their time andefforts, extensively revised and updated their research papers in the lightof the discussions held at the workshop.
We would like to express our appreciation to the Government of Egyptfor hosting this event and to the Government of Japan for its financialassistance through project RAF/97/A28, without which the workshop andthe research presented in this volume would not have been possible.
Active participation in the workshop by officials from Egypt and thefollowing African countries enriched the discussions: Algeria, Cameroon,Côte d’Ivore, Ethiopia, Gabon, Ghana, Kenya, the Libyan Arab Jamahiriya,Morocco, Mozambique, Nigeria, Senegal, South Africa, Tunisia, Uganda,the United Republic of Tanzania, Zambia and Zimbabwe. Contributions tothe discussions at the workshop were also made by officials from the UnitedNations Development Programme (UNDP), the Economic Commission forAfrica (ECA) and the International Monetary Fund (IMF).
This project was directed by Yilmaz Akyüz, Director, Division onGlobalization and Development Strategies, UNCTAD, and managed byShigehisa C. Kasahara. Kamran Kousari, UNCTAD’s Special Coordinatorfor Africa, was closely involved in all aspects of the project. Heather Wicksprovided logistical and secretarial support in preparation for, and organizationof, the workshop. Praveen Bhalla edited the final text and Petra Hoffmannwas responsible for its layout and overall presentation. The cover wasdesigned by Diego Oyarzun-Reyes.


v
List of contributors
• Xavier Cirera, Fellow at the Institute of Development Studies,University of Sussex, United Kingdom
• Wei Ge, Professor, Economics Department, Bucknell University,Lewisburg, United States
• Ricardo Gottschalk, Fellow at the Institute of Development Studies andProgramme Director, University of Sussex, United Kingdom
• Stephany Griffith-Jones, Professorial Fellow at the Institute ofDevelopment Studies, University of Sussex, United Kingdom
• Chon Pyo Lee, Professor, School of Economics, Seoul NationalUniversity, Republic of Korea
• Francis M. Mwega, Professor, African Economic Research Consortium,Nairobi, Kenya
• Léonce Ndikumana, Associate Professor, Economics Department,University of Massachusetts, United States
• Indira Rajaraman, Professor, Department of Economics, NationalInstitute of Public Finance and Policy, New Delhi, India
• Delphin G. Rwegasira, Executive Director, African Economic ResearchConsortium, Nairobi, Kenya
• Ajit Singh, Professor, Economics Department, University of Cambridge,United Kingdom
• Alaka Singh, PhD. Student, University of Cambridge, United Kingdom
• Bruce Weisse, PhD. Student, University of Cambridge, United Kingdom


vii
Contents
Abbreviations ............................................................................................ xiiiIntroduction and summary ...................................................................... xvii
CORPORATE GOVERNANCE, COMPETITION, THE NEWINTERNATIONAL FINANCIAL ARCHITECTURE ANDLARGE CORPORATIONS IN EMERGING MARKETSAjit Singh, Alaka Singh and Bruce Weisse
I. Introduction ......................................................................................... 1II. The Asian financial crisis and corporate governance ......................... 4
III. The new international financial architecture andcorporate governance .......................................................................... 7
IV. Corporate governance in emerging markets: the facts ..................... 10A. Patterns of share ownership and control of large corporations
in developed and emerging markets ........................................... 10B. Crony capitalism ......................................................................... 16
V. The theoretical foundations of the OECD/World Bankproposals on corporate governance .................................................. 18A. The LLSV thesis ......................................................................... 18B. The Berglof and von Thadden critique ....................................... 21C. The Glen, Lee and Singh analysis .............................................. 22
VI. Corporate governance and corporate finance in emerging markets:the 1980s versus the 1990s ............................................................... 24A. Corporate finance, the stock market and corporate governance ... 31B. Corporate governance and takeovers .......................................... 33C. Developing country corporations and high gearing ................... 36
VII. Conglomerates and economic efficiency .......................................... 38A. Empirical evidence ..................................................................... 41B. Policy issues: chaebol reform in the Republic of Korea ............ 43
VIII. Competition and corporate governance: theoretical issues .............. 47

viii
IX. Product-market competition in emerging markets ........................... 48X. Developing countries, the World Trade Organization and
competition policy ............................................................................ 54XI. Summary and conclusions ................................................................ 58
Appendix ..................................................................................................... 65Notes ..................................................................................................... 66References .................................................................................................... 67
THE OECD EXPERIENCE WITH CAPITAL ACCOUNT LIBERALIZATIONStephany Griffith-Jones, Ricardo Gottschalk and Xavier Cirera
I. Introduction ....................................................................................... 71II. The Code of Liberalization of Capital Movements:
historical background and instruments ............................................. 73III. Evolution of the OECD Code and patterns of liberalization
among the OECD member countries ................................................ 75IV. Use of derogation and reservations................................................... 83
A. Analysis of derogation in the Code ............................................ 83B. Analysis of reservations in the Code .......................................... 85
V. Experiences of selected countries with capital accountliberalization: a comparative analysis ............................................... 91A. Spain ........................................................................................... 91B. The Czech Republic, Mexico and the Republic of Korea .......... 93C. Lessons ........................................................................................ 96
VI. Conclusion......................................................................................... 97Annex tables .............................................................................................. 100Notes ................................................................................................... 105References .................................................................................................. 106
MANAGEMENT OF THE CAPITAL ACCOUNT:A STUDY OF INDIA AND MALAYSIAIndira Rajaraman
I. Introduction ..................................................................................... 109A. India and Malaysia .................................................................... 109B. The issues .................................................................................. 113C. Outline of the paper .................................................................. 116

ix
II. India................................................................................................. 116A. Introduction ............................................................................... 116B. The balance of payments: an overview .................................... 118C. Invisibles in the current account ............................................... 121D. Capital inflows .......................................................................... 122E. Returning flight capital ............................................................. 130F. The foreign exchange market ................................................... 131G. Financial sector reform ............................................................. 134H. Conclusions ............................................................................... 137
III. Malaysia .......................................................................................... 141A. Introduction ............................................................................... 141B. Capital account management prior to 1997 .............................. 143C. The crisis of 1997 ..................................................................... 147D. The capital controls of 1998–1999 ........................................... 152E. Financial sector reform ............................................................. 158F. Conclusions ............................................................................... 162
IV. Conclusions ..................................................................................... 164Appendix A: External policy milestones: India ......................................... 173Appendix B: External policy milestones: Malaysia .................................. 178Notes ................................................................................................... 182References .................................................................................................. 182
CHINA: MANAGING FINANCIAL INTEGRATIONWei Ge
I. Financial integration and vulnerability ........................................... 185II. The Chinese economy in transition: a brief overview .................... 188
A. Accomplishments in two decades of reform ............................ 189B. Economic reforms and systemic transformation ...................... 190C. Opening up to the outside world............................................... 191
III. The changing pattern of capital inflows ......................................... 193A. The predominance of foreign direct investments ..................... 193B. Growing significance of joint ventures and
foreign-owned firms ................................................................. 196C. Managing the external debt ...................................................... 198D. The role of the “greater Chinese economy” ............................. 200E. Capital outflows and the issue of “round-tripping”.................. 204

x
IV. Financial sector restructuring and management ............................. 206A. The exchange rate system and management ............................ 206B. Operation of equity markets ..................................................... 209C. Financial sector reform and regulation ..................................... 210D. Financial sector weakness and policy responses ...................... 214
V. Concluding remarks ........................................................................ 216Notes ................................................................................................... 222References .................................................................................................. 223
POST-CRISIS FINANCIAL REFORMS IN THE REPUBLIC OF KOREA:PROBLEMS AND PROPOSED REMEDIESChon Pyo Lee
I. Introduction ..................................................................................... 227II. Crisis resolution in the Republic of Korea: four reforms ............... 232
A. Financial sector ......................................................................... 233B. Corporate sector ........................................................................ 234
III. Global standards and evaluation of the post-crisis adjustments ..... 236A. Qualitative standards and their effects...................................... 237B. Quantitative standards and their effects ................................... 239
IV. Public funds and other adjustment efforts ...................................... 242A. Labour ....................................................................................... 242B. Capital: foreign capital ............................................................. 243C. Public funds .............................................................................. 245D. “Big Deal” and work-out programmes ..................................... 247
V. An assessment of three years of restructuring efforts .................... 248VI. Lessons for better restructuring ...................................................... 251
Notes ................................................................................................... 256Bibliography .............................................................................................. 257
PUBLIC DEBT AND MACROECONOMIC MANAGEMENTIN SUB-SAHARAN AFRICADelphin G. Rwegasira and Francis M. Mwega
I. Introduction ..................................................................................... 259II. The debt problem in sub-Saharan Africa ........................................ 260
A. External debt ............................................................................. 260B. Public domestic debt ................................................................. 264
xi
III. The linkages between external and domestic debt ......................... 267IV. Financing budget deficits ................................................................ 279V. The limitations and trade-offs of the various fiscal deficit
financing methods ........................................................................... 281A. Inflationary financing versus other domestic borrowing ......... 281B. Inflationary financing versus external borrowing .................... 284C. External borrowing versus domestic borrowing ...................... 285
VI. Implications of public debt for macroeconomic managementand monetary policy in Africa ........................................................ 286A. Exchange-rate policy ................................................................ 286B. Interest-rate policy .................................................................... 291C. Opening up of the capital account ............................................ 293
VII. Summary and conclusions .............................................................. 296Notes ................................................................................................... 307References .................................................................................................. 310
CAPITAL FLOWS, CAPITAL ACCOUNT REGIMES AND FOREIGNEXCHANGE REGIMES IN AFRICALéonce Ndikumana
I. Introduction ..................................................................................... 313II. Capital flows: recent trends and patterns ........................................ 316
A. FDI “surge” in Africa: an illusion? ........................................... 316B. Other capital flows to Africa .................................................... 322C. Constraints on private capital inflows into Africa .................... 325
III. Capital account regimes: openness and related issues ................... 328A. Recent developments in capital account policies ..................... 328B. Motivations for capital account restrictions in Africa .............. 330
IV. Exchange rate regimes: transitions and implications forcapital mobility ............................................................................... 334A. The global context: regime shifts and the “hollowing-out”
of the middle ground ................................................................. 334B. Exchange rate regime shifts in Africa: asymmetric
transition ................................................................................... 335C. Exchange rate regimes and economic performance:
some casual observations .......................................................... 337D. Further issues related to exchange rate regimes ....................... 348

xii
V. Currency regimes, dollarization/“euroization”, andimplications for capital flows ......................................................... 350A. Dollarization/”euroization”: the new context ........................... 350B. Advantages and disadvantages of dollarization/“euroization” ... 351C. Currency unions in Africa: opportunities and constraints ........ 354
VI. Capital flight from Africa ............................................................... 355A. Magnitude of the problem in African countries ....................... 355B. Conduits, causes and macroeconomic consequences
of capital flight .......................................................................... 358C. Capital account liberalization and capital flight ....................... 359
VII. Summary and policy implications .................................................. 360A. Attracting and monitoring capital flows ................................... 360B. Liberalization and openness: a cautionary note ....................... 361C. Strengthening financial markets ............................................... 361
Appendix ................................................................................................... 363Notes ................................................................................................... 381References .................................................................................................. 381

xiii
Abbreviations
ADRs American Deposit ReceiptsALM asset-liability managementBAFIA Banking and Financial Institutions ActBIS Bank for International SettlementsBLR base lending rateBNM Bank Negara MalaysiaBOP balance of paymentsBSE Bombay Stock ExchangeCAC Capital Account ConvertibilityCBI Cross-Border Initiative (in Eastern and Southern Africa)CBN Central Bank of NigeriaCDRC Corporate Debt Restructuring AgencyCFA Communauté financière africaine (franc zone)CGE computational general equilibriumCLOB Central Limit Order BookCOMESA Common Market for Eastern and Southern AfricaCPI consumer price indexCRAR capital to risk assets ratioCRR cash reserve ratioDRI differential rate of interestECB external commercial borrowingEEC European Economic CommunityEEFC exchange earners’ foreign currencyEMS European Monetary SystemEMU European Monetary UnionERM Exchange Rate Mechanism (of EMS)EU European UnionFCNR(A) Foreign Currency Non-Resident (accounts)FCNR(B) Foreign Currency Non-Resident (banks)FDI foreign direct investment
xiv
FEMA Foreign Exchange Management ActFERA Foreign Exchange Regulation ActFI financial institutionFII foreign institutional investment (or investor)FIPB Foreign Investment Promotion BoardFRA forward rate agreementFSC Financial Supervisory CommissionGDP gross domestic productGDR Global Deposit ReceiptGNP gross national productHIPC heavily indebted poor countryICICI Industrial Credit and Investment Corporation of IndiaIDBI Industrial Development Bank of IndiaIFCI Industrial Finance Corporation of IndiaIMF International Monetary FundIPO initial public offeringIRS interest rate swapKAMCO Korea Asset Management CorporationKDIC Korea Deposit Insurance CorporationLAF Liquidity Adjustment FacilityLDC least developed countryLERMS Liberalized Exchange Rate Management SystemLIBOR London Inter-Bank Offered RateM&A merger and acquisitionMAI multilateral agreement on investmentMIBOR Mumbai Inter-Bank Offered RateMIGA Multilateral Investment Guarantee AgencyNGO non-governmental organizationNIE newly industrializing economyNOFP net open forward positionNPA non-performing assetNPLs non-performing loanNR(E)RA non-resident (external) rupee accountsNR(NR)RD non-resident (non-repatriable) rupee depositsNR(S)RA) non-resident special rupee account
xv
NRI non-resident IndianODA official development assistanceOECD Organisation for Economic Co-operation and DevelopmentOEEC Organisation for European Economic Co-operationPLR prime lending rateRBI Reserve Bank of India (the central bank)RIB Resurgent India BondROA return on assetsRWCR risk-weighted capital requirementSADC Southern African Development CommunitySARB South African Reserve BankSEBI Securities Exchange Board of IndiaSILIC severely indebted low-income countrySLR statutory liquidity ratioSME small and medium-sized enterpriseSOE State-owned enterpriseSRR statutory reserve ratioSSA sub-Saharan AfricaTNC transnational corporationTRIPS Trade-Related Aspects of Intellectual Property Rights (WTO
Agreement)UNCTAD United Nations Conference on Trade and DevelopmentWTO World Trade Organization


INTRODUCTION AND SUMMARY xvii
INTRODUCTION AND SUMMARY
The issue of management of capital flows has been brought into sharpfocus by bouts of financial crises in the developing world and emergingmarket economies. Before the outbreak of the financial crisis in East andSouth-East Asia in 1997, the newly industrializing economies in the regionwere considered to be showcase models of development. Many researchersstudied appropriate ways to replicate their performances in other regions.The UNCTAD secretariat also undertook intensive research on what wereseen as successful development strategies in East Asia, and reported itsanalytical findings in the Trade and Development Report (TDR) 1996.However, as the crisis persisted and its contagion spread, both within andbeyond the region, a heated debate emerged about the appropriateness oftheir development strategies in the context of the increasing internationalmobility of financial capital.
The UNCTAD secretariat has been closely following this debate; itsanalysis of the Asian experiences during and after the crisis were presentedin TDR 1998, with the aim of drawing lessons to help contribute to thedesign of appropriate policies in other developing countries. Part two ofthat report, entitled African Development in a Comparative Perspective,sought to examine development strategies and growth performance inAfrican countries in the light of the East Asian experience.
Increasing international mobility of private financial capital is a majoraspect of the contemporary global economy, where the volume of inter-national financial transactions far exceeds that necessary to finance tradeand investment. Efforts to integrate the African region into the global

MANAGEMENT OF CAPITAL FLOWSxviii
financial system, and to attract private flows through rapid liberalizationof the capital account, have resulted not in increased inflows of such capitalbut in greater volatility, with attendant consequences for exchange rateinstability and misalignments. A number of countries in the region ex-perienced considerable financial instability and payments difficulties, butthese were given little attention by the international community largelybecause, unlike the financial crises in the emerging markets of LatinAmerica and East Asia, they did not pose a serious threat to the stability ofthe international financial markets.
Given this situation, the UNCTAD secretariat considered it useful totake stock of the financial policies and capital account regimes within theregion of sub-Saharan Africa (SSA), and to draw appropriate lessons fromthe ways in which the capital account in other regions was managed. Forthis purpose, seven papers were commissioned by the secretariat anddiscussed at a workshop organized by UNCTAD and hosted by theGovernment of Egypt in Cairo on 20–21 March 2001. The workshop wasattended by policy makers from a selected number of low- and middle-income African countries, many officials and experts from the public andprivate sectors in the host country, as well as representatives from someinternational organizations. The aim of the workshop was to enhanceunderstanding of the complex relationship between external financing,capital account regimes, macroeconomic policies, and trade and devel-opment. Furthermore, it sought to promote dialogue between the researchers(both from developed and developing countries) and African policy makersand to help strengthen the policy relevance and analytical basis for thefuture work of the UNCTAD secretariat with regard to African growth andeconomic development.
* * *

INTRODUCTION AND SUMMARY xix
Three sets of issues emerged from the discussions at the workshop:
(i) The need for and role of foreign capital in developing countries;
(ii) How to manage the capital account so as to limit the potential damagescaused by the instability of international capital flows without reducingthe ability of developing countries to supplement their domesticresources with foreign capital; the latter, through access to inter-national financial markets, necessary for faster accumulation, growthand development; and
(iii) The role of financial institutions, and the possible contribution of glob-al standards and codes on governance, competition and transparencyin promoting stability and growth.
While there was a convergence of views in a number of areas,considerable differences emerged regarding the contribution of domesticinstitutions and policies on the one hand, and external factors on the other,to accumulation, growth, financial instability and crises in emergingmarkets.
Two main reasons for reliance on foreign capital were suggested: forclosing the resource gap and for transfer of technology. It was also pointedout that a reliance on transnational corporations might be necessary forestablishing linkages with global production networks and access tofinancial markets. However, in all these respects, it was recognized thatconsiderable differences existed among developing countries in their needfor foreign capital as well as in the policy approaches pursued.
It was generally agreed that, while there was a need to fill the resourcegap through capital inflows in Africa, and in other regions where incomelevels were too low to generate adequate domestic savings, this was notthe case for a number of East Asian countries where savings rates wereover 30 per cent of gross domestic product (GDP). Again, for many middle-income countries with per capita incomes of over $3,000, there wasconsiderable scope to increase self-reliance by raising domestic savings.It was therefore counterproductive for such countries to pin their hopes on

MANAGEMENT OF CAPITAL FLOWSxx
foreign capital. Furthermore, successful growth and development oftenentailed reducing dependence on capital inflows. This was the case in EastAsia, but not in Latin America and Africa, where savings rates remainedlow even when these regions were experiencing relatively high growthrates in the 1960s and 1970s.
On the type of capital inflows needed, there was a broad preferencefor greenfield investments, as opposed to either mergers and acquisitionsof existing assets, or financial inflows of a speculative nature. It was notedthat the motive pursued by foreign capital was profits, and not development,and that these objectives did not necessarily coincide. Hence there was theneed to place policies on foreign direct investment (FDI) into a broaddevelopment strategy, and to retain policy autonomy in this respect. Withregard to conditions that attract FDI, particularly in the traded-goods sector,it was broadly believed that, except for a few countries rich in naturalresources, the SSA economies did not have the requisite human and physicalinfrastructure and institutions needed to attract FDI, and that foreign capitalinflows to develop such conditions were unlikely.
It was argued that capital account liberalization was neither necessarynor sufficient to attract foreign capital. China was held as an example of acountry that was receiving large amounts of greenfield FDI without pursuingan open capital account regime while many countries in SSA were receivingvery little despite a rapid liberalization of their capital account. And someAsian countries, notably the Republic of Korea, drew on funds frominternational capital markets in the early stages of industrialization, whileretaining strict controls over capital flows. On the other hand, while it waspointed out that liberalization of the capital account could bring some ofthe flight capital back to SSA by allowing it to re-exit, it was also notedthat a considerable amount of flight capital had little to do with economicincentives. Further, capital account openness allowed leakages by theresidents even in the absence of a serious distortion of incentives.
There was also general agreement that official financing should playa greater role in SSA. The Heavily Indebted Poor Countries (HIPCs) Initiativewas seen as having fallen short of expectations. The process was tedious,burdened by excessive conditionality, requiring too much effort and time
INTRODUCTION AND SUMMARY xxi
on the part of debtor countries, and diverting a handful of skilled people toendless preparations and negotiations with little benefit at the end.
On the management of the capital account, there was broad agreementthat developing countries needed strategic, as opposed to full, integrationinto the international financial system. The degree and pattern of integrationwould vary according to the level of economic and institutional devel-opment. The experiences of various countries in Asia, including China,India, Malaysia and the Republic of Korea, showed that successful man-agement of the capital account required a policy approach that differentiatedbetween:
• sources/types of capital (such as FDI, loans, and portfolio and equityflows);
• different maturities;
• different domestic uses;
• actors (residents versus non-residents; different types of borrowerssuch as banks and non-bank corporations); and
• inflows and outflows.
There was also agreement that in terms of its macroeconomic effects,dollarization (or use of foreign currencies in current and capital transactionsamong residents) was not very different from capital account liberalization.
A discussion on the role of sequencing in capital account liberalizationnoted that there are several approaches to the concept. One approachemphasizes sequencing of liberalization among different spheres ofeconomic activity (e.g. trade, domestic financial sector, current accountand capital account). In the sphere of finance, a distinction was madebetween different types of capital flows in the liberalization process (suchas FDI, long-term borrowing and short-term flows). Another approach findsit necessary to sequence capital account liberalization.
The relationship between exchange rate policies and capital flowswas also discussed. While it was agreed that the kind of exchange rateregime adopted has important implications for capital flows, it would be
MANAGEMENT OF CAPITAL FLOWSxxii
difficult to address the question of what constitutes an appropriate exchangerate regime without reference to the underlying regime of the capitalaccount. Attaining exchange rate stability under an open capital accountregime by fixing or floating the currency against major reserve currenciesis not easy. Again, it was emphasized that effective management of capitalflows and the exchange rate also depends on fiscal discipline and the levelof indebtedness of the public sector.
The question was raised as to whether some countries may have gonetoo far in capital account liberalization and whether it was possible toreverse this. While it was felt that restrictions and control in times of crisismay not work, paradoxically governments did not have the incentive toadopt such measures during good times.
The role of regional cooperation for greater financial and exchangerate stability was also taken up in the context of management of the capitalaccount. The Chiang Mai Initiative in East Asia was seen as a small butimportant step towards greater cooperation. It was also noted that theexperience of the European Union provided some important lessons in thisrespect.
Discussions around the role of institutions and global standards andcodes drew significantly on the East Asian experience in the context of thefinancial crisis of 1997–1999. It was observed that there was a tendency toexplain every crisis ex post by ad hoc arguments. The debt crisis of the1980s was attributed to excessive government spending and borrowing.The orthodox view was that external debt and deficits associated with aprivate savings gap should not be a cause for concern. But this view hadbeen quickly discredited by the Mexican crisis, which occurred against abackground of budget surplus. The new explanation was that capital flowshad been used for consumption rather than investment. But this view toohad to be revised after the East Asian crisis, where much of the privateborrowing went into investment. This had prompted suggestions thatcorruption and cronyism (attributed to government failure), led to un-productive investment. It had been argued that, although policies andinstitutions mattered, it often took a debtor and a creditor to create a baddebt and a financial crisis. Even developed countries with sound financial

INTRODUCTION AND SUMMARY xxiii
institutions and policies, such as Sweden, had been seemingly hit byinternational speculators.
While weaknesses in corporate governance and financial institutionsmay often lead to unproductive and excessive investment, whether aninvestment is good or bad also depends on the perceptions of markets andthe macroeconomic environment. When overall economic conditionschange, an investment that initially looked profitable to creditors andinvestors may cease to be viable. Financial bubbles, as occurred in theinformation technology (IT) sector of the United States in recent years,were often created as a result of such investment.
On the nature of discipline that financial markets exert over policymakers, it was argued that financial market pressures can have an adverseimpact on stability and growth. Herd behaviour in these markets, and surgesin capital inflows, can support unsustainable policies, leading eventuallyto currency appreciation and large external deficits. Financial markets canalso put pressure on countries with sound fundamentals through contagion.
It was pointed out that there is no single set of institutions for thefinancial sector and for corporate governance that can be appropriate forall countries. Different models, such as the Japanese, German and Anglo-American systems of finance and corporate governance, may be appropriateunder difference circumstances. Each has its positive aspects and itsdrawbacks, and the international community needs to be aware of the risksof promoting any single model through new sets of international codesand standards.
* * *

MANAGEMENT OF CAPITAL FLOWSxxiv
This volume contains seven papers by researchers commissioned bythe UNCTAD secretariat. The original papers were presented at the Cairoworkshop, and were subsequently revised and updated by their authorsfollowing the workshop, in the light of the discussions held there. Themajor elements and general findings of these papers are presented below.
To place the present debate on financial policies and current accountregimes in the wider development context, particularly that surroundingthe need for improved management of increasingly globalizing trade andinvestment, the first paper covers a range of issues concerning corporategovernance, competition, the new international financial architecture andlarge corporations in emerging markets. Of the remaining six papers, fourexamine the experiences of economies in East and South-East Asia andthose of the Organisation of Economic Co-operation and Development(OECD). These experiences may provide useful lessons to policy makersin the SSA countries. Finally, two papers are concerned with an analysisof the situation in the SSA region, particularly with respect to internalmanagement (i.e. macroeconomic policies related to public debt owed tothe domestic and foreign sectors) and external management (i.e. wide-ranging financial policies related to external account issues).
In their paper entitled Corporate Governance, Competition, the NewInternational Financial Architecture and Large Corporations in EmergingMarkets, Singh, Singh and Weisse examine, from the developing countryperspective, important analytical and policy issues arising from two majortrends: the current international discussions about corporate governancein relation to proposals for a new international financial architecture; andchanges in the international competitive environment as a result of a spateof corporate mergers in advanced countries. The background to the currentinternational discussions is the emergence of corporate governance as akey issue in the current G-7 proposals for a new international financialarchitecture. This emphasis by the G-7 can be traced back to the thesis thatthe “deeper” reasons for the Asian crisis lay in the microeconomic behaviourof corporations and businesses in the affected countries. Alleged failingsin their corporate governance mechanisms and distortions of theircompetitive processes have been subject to particular scrutiny in suchanalyses.

INTRODUCTION AND SUMMARY xxv
The international competitive environment is changing rapidly, as largecorporations in the industrialized countries are in the process of potentially“cartelizing” the world marketplace through numerous cross-border mergersand takeovers. This trend raises serious policy concerns for developingcountries. The authors’ main conclusions are the following. First of all,the thesis that the deeper causes of the Asian crisis were flawed systems ofcorporate governance and a poor competitive environment in the affectedcountries is not supported by evidence. Secondly, the Anglo-Saxon modelof widely-held corporations with dispersed share ownership is the exceptionin developing countries and in much of continental Europe. Empiricalevidence suggests that emerging markets, as well as European countriessuch as Germany, Italy or Sweden, have successful records of rapid, long-term growth with different governance systems to those of the Anglo-Saxoncountries. Thirdly, empirical evidence does not support the view that theAsian crisis of 1997–1999 was caused by crony capitalism. Fourthly,corporate financing patterns in emerging markets in the 1990s were broadlysimilar to those observed in the 1980s. Unlike their counterparts in theindustrialized countries, large, developing-country firms continued to relyoverwhelmingly on external sources to finance their growth. Finally,challenging the widely held claim that developing country conglomeratesare inefficient, financially precarious and necessarily create moral hazard,the authors argue that market competition in emerging market economiesis no less intense than in the industrialized economies.
In their paper, The OECD Experience with Capital Account Liber-alization, Griffth-Jones, Gottschalk and Cirera discuss the OECD Codeof Liberalization of Capital Movements, which aims to promote capitalaccount liberalization among the OECD member countries. Their analysisof the Code and, more generally, of the OECD experience with liber-alization, leads the authors to identify three major historical trends. Initially,liberalization in the OECD area was very gradual, but speeded up in the1980s and 1990s. During the first 25 years, the process was sequenced,with long-term capital flows being liberalized first and short-term flowsonly much later, in the 1980s. Acknowledging the diversity among theOECD member countries, the process initially allowed middle-incomemember countries to pursue liberalization more gradually than the indus-trialized countries. However, this changed later, with new members – all

MANAGEMENT OF CAPITAL FLOWSxxvi
from emerging market economies – facing requirements for much morerapid liberalization as a prerequisite for membership of the organization.
Although they do not ascribe a mechanistic causal link, the authorsraise the concern that, of the six emerging market countries that joined theOECD in the 1990s, three had a large and costly currency crisis shortlyafter they joined. This should be seen as a warning of the risks of aninternationally agreed framework on capital account liberalization, evenif it is carefully designed, for the purpose of supporting orderly liber-alization. If a divergence of interests exists among member countries, ratherthan guaranteeing orderly liberalization, such a framework may result inone group of countries imposing the objective of full capital accountconvertibility on a wide range of countries, most of which are still un-prepared for undertaking such a step. The authors conclude that whilstthere has not been significant progress towards creating a new internationalfinancial architecture that could help avert currency crises or make themless costly, the decision on the pace and timing of capital account liber-alization should be left to individual countries.
In her paper on Management of the Capital Account: A Study of Indiaand Malaysia, Rajaraman compares and contrasts the approaches of thesecountries to capital account management, which, although widely differenthistorically, have arrived at a remarkable convergence following the EastAsian crisis of 1997. The author seeks to demonstrate that there are advan-tages in not requiring a monotonic transition to capital convertibility.Though the paper does not recommend a reversal of convertibility for non-resident capital, which has damaging effects on a country’s reputation, itdoes argue that retention of rights of sovereign control over resident capitalis essential for macroeconomic control over the real sector. In countries withinstitutional weaknesses in the financial sector, it is damaging to focus onthe gains of free capital flows without giving adequate attention to theinstitutional consolidation that would prevent a recurrence of episodes ofvolatility.
India and Malaysia are quite disparate in terms of long-term rates ofgrowth and their degree of openness. Malaysia accepted Article VIII statusunder the IMF (current account convertibility) in November 1968, and the

INTRODUCTION AND SUMMARY xxvii
Malaysian ringgit was floated along with major world currencies in 1973.India, by contrast, accepted Article VIII status only in August 1994,following a single floating rate for the rupee in March 1993. The Malaysianexport/GDP ratio equals, or actually exceeds, 100 per cent. India on theother hand has an export/GDP ratio at the 11–12 per cent level. TheMalaysian response to the currency crisis of 1997 backtracked on whathad been one of the longest traditions of openness on current and capitalaccounts in the developing world. As the capital outflows from Malaysiareached crisis levels, the country famously imposed capital exit barriers,and a policy of lower interest rates that ran directly contrary to the policyproposed for other East Asian countries similarly afflicted. The Indianexternal liquidity crisis in mid-1991 on the other hand, when foreignreserves fell to an all-time low of $1 billion, led to the gradual opening upof the Indian capital account. In both countries today, non-resident capitalinflows enjoy full freedom of repatriation. In Malaysia, a vestigial 10 percent exit levy on portfolio capital gains repatriated within a year after entrywas removed in May 2001. Capital outflows for corporate residents arepermitted within prescribed limits, but all other outflows of capital byresidents are banned.
There is a lesson in this policy convergence of the two countries withvery disparate points of origin in terms of macroeconomic openness.Malaysian policy, whether during the 1993 capital surge, or after the 1997capital outflow, has demonstrated the benefits of imposing temporaryreversals of freedom of cross-border capital flows on residents. The paperexamines in detail what has been done in both India and Malaysia, in termsof controlling the quantum and the composition of capital flows, in the contextof the exchange rate regime in each country. The author concludes with alook at the likely future direction of policy towards the capital account.
In his paper entitled China: Managing Financial Integration, Geexplains that the Chinese economy exhibits many characteristics similarto those of the Asian countries that were affected by the financial crisis,particularly in terms of weaknesses in the financial and corporate sector.Despite this, China not only survived the worst external shock since itsintegration into the world economy – a process that began in 1979 – butactually achieved a very impressive rate of growth. The value of the Chinese

MANAGEMENT OF CAPITAL FLOWSxxviii
currency remained stable as did net capital inflows. How did China manageto accomplish this feat? Put more generally, given all the recognizedstructural and institutional weaknesses that characterize developingcountries and economies in transition, how may a smoother process ofeconomic integration and liberalization be facilitated, while minimizingthe potential costs? The author explores this question in the context of theChinese economy. His study is concerned mainly with the essential issuesconcerning financial sector reforms and capital account management.
Following a brief overview of China’s economic transition since 1979,he examines the changing patterns of capital flows into China. He thengoes on to discuss some of the critical elements and mechanisms thatprevented China from being dragged into the Asian financial crisis,including restructuring of the financial sector, the exchange rate systemand management, and the structure and operation of equity markets. Geconcludes with comments on some potential impacts on China followingits entry into the World Trade Organization.
Lee, in his paper on Post-Crisis Financial Reforms in the Republicof Korea, examines the changes in policy measures aimed at applying globalstandards to Korean financial restructuring efforts after the financial crisis.He points out that existing global standards do not cover all areas, and,where applicable, they are not applied uniformly. Furthermore, the paperstresses that the various ramifications resulting from adjustment should betaken into consideration in the implementation of financial sector reforms.The author draws several important lessons, including cautioning againsta heavy reliance on the external sector as a source of funding for carryingout the needed restructuring of the domestic financial sector.
Public Debt and Macroeconomic Management in Sub-Saharan Africaby Rwegasira and Mwega focuses on external debt and its servicing, whichpose a major problem in SSA, causing a negative impact on investmentand growth. The region’s external debt almost doubled between the mid-1980s and late 1990s. Its external debt as a proportion of GNP and exportswas nearly twice the average for all developing countries, although theexternal debt service ratio was lower due to the concessional terms of muchof its borrowing. Some SSA countries have also accumulated substantial

INTRODUCTION AND SUMMARY xxix
domestic debt since the mid-1980s (e.g. Cameroon and Côte d’Ivoire),which has further aggravated their external balance.
The authors suggest that there is a correlation between the fiscalposition of SSA Governments and the evolution of the external debt ratio.They point out that there are clear limitations and trade-offs with respectto the various fiscal deficit financing methods. Empirical studies, forexample, show seignorage revenue to be relatively modest, while domesticborrowing through the sale of securities is constrained by weak capitaland money markets (with a few exceptions such as those of Côte d’Ivoire,Kenya, Nigeria and Zimbabwe). Deficits have also been financed, in part,by proceeds from the sale of assets (e.g. privatization proceeds) and throughpayments arrears (i.e. delayed payments for goods and services).
The authors argue that public debt has specific implications formacroeconomic management and monetary policy. Large fiscal deficits,for example, undermine the two competing objectives of exchange ratepolicy: control of inflation and improvement in external competitiveness.This is compounded by feedback effects on the budget deficit from changesin the exchange rate. Since the late 1980s, many SSA countries have alsoliberalized their financial systems. However, these reforms have beenundertaken in the context of pervasive macroeconomic instability, contraryto the consensus on the appropriate sequencing of such reforms. Betweenthe 1970s and 1990s there has been an increase in the volatility ofinternational capital flows and in the terms and conditions on which externalfinance has been available. The causes range from changes in donorsentiments to disagreements on policy conditionalities. In addition, swingsin private capital flows may have significant implications on keymacroeconomic variables, notably the exchange rate and interest rate. Theauthors conclude that an opening up of the capital account is likely torender the SSA economies even more vulnerable to these adverse externaldevelopments.
In his paper on Capital Flows, Capital Account Regimes and ForeignExchange Regimes in Africa, Ndikumana first examines capital accountregimes in African countries over the past two decades. Evidence showsthat official lending to Africa has declined. At the same time, the volume

MANAGEMENT OF CAPITAL FLOWSxxx
of private capital flows remains low, and significantly below the levelsobserved in other developing regions. The author argues that since privatecapital inflows to Africa are limited, due to factors such as weakness ofthe macroeconomic environment, underdeveloped financial systems, highcountry risk, and exchange rate misalignments, policy reforms forovercoming the shortage of development finance must be focused onalleviating these constraints.
The author discusses motivations for capital account restrictions inAfrica and highlights recent reforms in capital account regimes there. Whilemany African countries have pursued reforms aimed at liberalizing theircapital account and exchange rate regimes, such liberalization has notalways resulted in income growth, price stability and trade performance.He argues that African countries need to give serious attention to the scope,speed and sequencing of capital account liberalization to minimize thepotential adverse effects of openness. It is desirable for countries to maintainselective discretionary control over capital movements and foreign ex-change markets in order to hedge against adverse shocks to the economyand maintain macroeconomic and financial stability. To attract foreigncapital, any move towards capital account openness and exchange rateliberalization must be supported by reforms aimed at improving thecredibility of macroeconomic policy and establishing an investment-friendly environment. These reforms will not only attract foreign capital,but also encourage domestic investment.
An important aspect of capital movements in Africa is the high levelof capital flight. There is an urgent need for policies to stem further capitaloutflows from Africa and induce the repatriation of private capital heldabroad. This will require not only improvement in the macroeconomicconditions to ameliorate incentives for domestic investment, but also reformof the political and legal systems to improve accountability and credibilityof economic policy. Exploring the implications of recent exchange rateregime transitions for capital mobility and economic performance, the authordiscusses motivations, advantages, and disadvantages of dollarization or“euroization” in the context of increasing financial integration.

CORPORATE GOVERNANCE AND COMPETITION 1
CORPORATE GOVERNANCE, COMPETITION, THENEW INTERNATIONAL FINANCIAL ARCHITECTURE
AND LARGE CORPORATIONS INEMERGING MARKETS
Ajit Singh, Alaka Singh and Bruce Weisse
The proper governance of companies will become as crucial to the worldeconomy as the proper governing of countries. (James Wolfensohn, Presi-dent, World Bank)
I. INTRODUCTION
Since the dramatic events of the Asian financial crisis, followed bythe financial crises in the Russian Federation and Brazil and the associateddifficulties with the highly leveraged United States hedge fund, Long TermCapital Management (LTCM), there has been widespread concern amongthe G-7 industrial countries about the stability of the international financialsystem. In the immediate aftermath of the crises, many initiatives werelaunched to reform the system and establish, what former United StatesTreasury Secretary Robert Rubin termed a “new international financialarchitecture”. However, with the abatement of these crises, any interest inserious reform of the international financial system, if it ever existed,appears to have evaporated.

AJIT SINGH, ALAKA SINGH AND BRUCE WEISSE2
Nevertheless, with the ostensible objective of preventing future crises,the G-7 countries have been continuing to press for reforms of the financialand economic systems in developing countries. The central argument ofthe G-7 is that the proposed reforms in developing countries are essentialfor the proper functioning of the global markets. The implicit suggestionis that the financial crises were not the outcome of market failures, butrather the failure of developing country governments and institutions thatdid not provide accurate and adequate information to markets, and imposedother distortions on them. Many economists have rejected this thesis;nonetheless, such reforms, pressed on the crisis-affected Asian countriesas part of IMF conditionality, are now being advocated for other developingcountries. Whether or not the G-7 analysis is correct, given the distributionof political and economic power in world affairs, developing countrieswould be well advised to acquire a full understanding of the nature of thereforms being proposed and their implications for long-term economicdevelopment.
This paper concentrates on two of the proposed subjects of reform.First is the question of corporate governance: how large enterprises aregoverned and operated in developing countries. Secondly, it is concernedwith the closely connected questions of domestic and internationalcompetition policies in an environment of liberalization and globalization.The paper sets out the main proposals being discussed in these areas andcritically examines their implications, specifically for long-term economicdevelopment. Developing countries are not generally exercised by thesetwo issues in the way developed countries are. A large number of them donot have competition policies at all. Similarly, corporate governance is nothigh on the development agenda of most developing countries. The mainpurpose of this paper is to provide these countries with an appreciation ofthe issues involved in the proposed reforms, so that they can make informedjudgements about the desirability of their implementation, and, if necessary,formulate counter-proposals.
This paper is organized as follows. Section II provides the essentialbackground to the G-7 proposals on corporate governance, which havetheir origins in the perceived structural weaknesses of the Asian econo-mies on the eve of the crisis. This section also sets out the main proposals

CORPORATE GOVERNANCE AND COMPETITION 3
that are currently the subject of attention. Section III provides informationon the systems of corporate governance that prevail in developing coun-tries and how they differ from those in developed economies. Section IVconsiders the role of large corporations in emerging markets, and, specifi-cally, how they are financed – a question that is closely related to corporategovernance. Section V addresses one of the key areas of controversy: theefficiency and viability of large conglomerate organizations found in manydeveloping countries. Should such organizations be forced to become morefocused and shed their conglomerate character? Sections VI-X address thequestion of competition policy and the nature of competition in develop-ing countries; the following specific issues addressed are:
(i) What is the relationship between competition in the product and capitalmarkets, on the one hand, and corporate governance on the other?
(ii) How intense is competition in the product markets of emergingeconomies? How does this compare with competition in developedcountries?
(iii) Do developing countries need a competition policy? If so, should thiscompetition policy be the same as in developed countries? If not, howshould it differ?
(iv) Will competition policy in developing countries be adequate to copewith the implications of the gigantic international merger movementled by developed country firms, which is currently sweeping the worldeconomy.
Finally, Section XI concludes and draws together implications foreconomic policy.

AJIT SINGH, ALAKA SINGH AND BRUCE WEISSE4
II. THE ASIAN FINANCIAL CRISIS ANDCORPORATE GOVERNANCE
The crisis which erupted in Thailand in July 1997 and quickly spreadto other Asian economies provided the impetus for the quest for a newinternational financial architecture. Whereas previous crises had struckeconomies with a history of financial instability and low growth, such asMexico in 1995, the Asian crisis devastated countries that were the fastestgrowing in the world economy and had solid achievements in technologicalupgrading and poverty reduction. The international financial institutionsand private commercial and investment banks had frequently cited theseas prime examples of the benefits of export-led growth and a “market-friendly” approach to development. Policy makers and market participantswere therefore deeply shocked.
After the initial shock had worn off, however, an influential theoryemerged, which argued that the deeper reasons for the crisis could be foundin the institutional structures of the Asian model. This view was succinctlyconveyed by Larry Summers, then Under Secretary of the United StatesTreasury, who argued that the roots of the Asian financial crisis did not liein bad policy management, but in the nature of the economies themselves.Summers was reported to have stated that “[this crisis] is profoundlydifferent because it has roots not in improvidence but in economicstructures. The problems that must be fixed are much more microeconomicthan macroeconomic, and involve the private sector more and the publicsector less” (Financial Times, 19 February, 1998). This view was echoedin slightly different terms by the widely respected Chairman of the UnitedStates Federal Reserve, Alan Greenspan:
In the last decade or so, [the world has observed] a consensus towards, forwant of a better term, the Western form of free-market capitalism as themodel which should govern how each individual country should run itseconomy…We saw the breakdown of the Berlin wall in 1989 and the mas-sive shift away from central planning towards free market capitalist typesof structures. Concurrent to that was the really quite dramatic, very stronggrowth in what appeared to be a competing capitalist-type system in Asia.And as a consequence of that, you had developments of types of struc-tures, which I believe at the end of the day were faulty, but you could notdemonstrate that so long as growth was going at 10 percent a year.(Greenspan, 1998)

CORPORATE GOVERNANCE AND COMPETITION 5
This “structuralist” interpretation of the Asian crisis greatly influencedthe design of the policy response of the International Monetary Fund (IMF).The IMF’s emergency loans were made conditional on deep structuralreforms that went far beyond the usual stabilization measures; theyencompassed fundamental changes in labour regulations, corporate gov-ernance and the relationship between government and business. The scopeof the IMF’s conditionality prompted the conservative economist MartinFeldstein to argue that the IMF “should not use the opportunity to imposeother economic changes that, however helpful they may be, are not nec-essary to deal with the balance of payments problem and are the properresponsibility of the country’s own political system (Feldstein, 1998)”.
In spite of such concerns, the “structuralist” interpretation has con-tinued to underpin policy proposals and has framed the academic debateon the issue. This view consists of several interlinked arguments. The firstof these is that the fragile financial systems resulted from relationshipbanking, weak corporate governance structures and lack of competition.Johnson et al. (2000) argue that measures of corporate governance, and, inparticular, the effectiveness of protection for minority shareholders, explainthe extent of the exchange rate depreciation and stock market decline betterthan do standard macroeconomic measures. Furthermore, the cronyismbetween financial institutions, business and the government shielded thesystem from market discipline and encouraged the overinvestment that ledto the crisis. Second, and related to the first point, the high leverage ratiosof Asian firms heightened their vulnerability and created the conditionsthat precipitated the crisis. Third, the lack of transparency and the poorquality of information in such an insider-dominated system createdinformational asymmetries that exacerbated the crisis. Markets did not haveadequate information about the true financial status of the corporationsand the banks. Thus, once the market began to assess the true facts, therewas a collapse of confidence. As the former managing director of the IMF,Michel Camdessus, argued:
In Korea, for example, opacity had become systemic. The lack of transpar-ency about government, corporate and financial sector operations concealedthe extent of Korea’s problems – so much so that corrective action cametoo late and ultimately could not prevent the collapse of market confi-dence, with the IMF finally being authorised to intervene just days beforepotential bankruptcy. (Speech to Transparency International, reported inIMF Survey, 9 February, 1998)

AJIT SINGH, ALAKA SINGH AND BRUCE WEISSE6
To remedy these alleged faults in the Asian system, reformers sought todissolve the close links between the State and business, create an arm’s-length relationship between banks and businesses, and promote greatertransparency in economic relations.
The “structuralist” interpretation is not, however, the only account ofthe Asian crisis, nor the most persuasive. Singh and Weisse, (1999) haveargued that the “structuralist” interpretation is not credible for severalreasons. First, it does not explain the previous exemplary success of theAsian economies. As Paul Krugman (1999) remarked: “But if the systemwas so flawed, why did it work so well for so long, then fail so suddenly?”Second, it does not explain why countries such as China, and, especiallyIndia, with similar systems, did not experience a crisis.
A more credible explanation for the crisis, that encompasses thesefacts, is that the afflicted economies dismantled their controls over theborrowing of the private sector and embraced financial liberalization. As aconsequence, the private sector built up short-term foreign currency debtthat often found its way into the non-tradable sector and into speculativereal-estate ventures. Accompanying financial liberalization was the“irrational exuberance” and contagion that are always latent in privateinternational financial flows. In sum, Singh and Weisse have argued thatthe crisis occurred not because the Asian model was flawed, but preciselybecause it was not being followed. Thus, while Phelps (1999) associatesthe crisis with the failure of Asian corporatism, it can be argued that inreality this system underpinned the most successful industrialization drivein history and dramatically reduced poverty. However, the system wasvulnerable to the forces unleashed by financial liberalization.
In this paper, two key elements of the Greenspan-Summers “struc-turalist” interpretation will, inter alia, be examined in detail. The first isthe contention that there was poor corporate governance resulting fromcrony capitalism, which, together with the lack of competition in productmarkets, led to a disregard of profits and hence to overinvestment, and,ultimately, to the crisis. The following sections outline the nature of thedifferences in the systems of corporate governance between developingand industrial countries, variations within each group, and implications

CORPORATE GOVERNANCE AND COMPETITION 7
for economic efficiency of these diverse systems/institutions. A later sectionaddresses the second element by examining evidence on the intensity ofcompetition in the product markets of Asian and other developing countries.
III. THE NEW INTERNATIONAL FINANCIAL ARCHITECTUREAND CORPORATE GOVERNANCE
In a move towards defining a new international financial architecture,the G-7 assigned the task of reforming corporate governance to theOrganisation for Economic Co-operation and Development (OECD) andthe World Bank. So far, the main contributions to this initiative have beenthe following:
(i) The OECD Principles of Corporate Governance (see appendix);
(ii) The OECD/World Bank Compact on the Reform of Corporate Governance;
(iii) The Corporate Governance Forum meetings between officials andbusinesspeople;
(iv) “Self-assessment” exercises in corporate governance carried out underthe guidance of the World Bank and the Asian Development Bank; and
(v) Investor surveys of domestic and international investors organized bythe World Bank on the private sector’s response to the progress andcredibility of reform.
The five basic principles of corporate governance promoted by theOECD/World Bank initiative have been summarized in the World Bank’smain document on corporate governance, Corporate Governance: A Frame-work for Implementation (Iskander and Chamlou, 2000). The study pointsout that the principles, outlined below, are based on tenets of “fairness,transparency, accountability and responsibility”.
Protection of shareholder rights to share in company profits,receive information about the company, and influence the firmthrough shareholder meetings and voting.
AJIT SINGH, ALAKA SINGH AND BRUCE WEISSE8
Equitable treatment of shareholders, especially minority andforeign shareholders, with full disclosure of material informationand prohibition of abusive self-dealing and insider trading.
Protection of stakeholder rights as spelled out in contracts andin labour and insolvency laws, in a framework that allows stake-holder participation in performance-enhancing mechanisms, givesstakeholders access to relevant company information, and allowseffective redress for violations of stakeholder rights.
Timely and accurate disclosure and transparency on all mattersmaterial to company performance, as essential to market-basedmonitoring of companies, and shareholders’ ability to exercisevoting rights, with accounting according to quality standards ofdisclosure and audit, and with objective auditing by independentassessors.
Diligent exercise of the board of directors’ responsibilities toguide corporate strategy, to manage the firms’ executive func-tions (such as compensation, business plans, and executiveemployment), to monitor managerial performance and achievean adequate return for investors, to implement systems for com-plying with applicable laws (tax, labour, competition, environ-ment), to prevent conflicts of interest and to balance competingdemands on the company, and with some independence frommanagers to consider the interests of all stakeholders in the com-pany, treat them fairly, and give them access to information.
The World Bank report (Iskander and Chamlou, 2000) has gone tosome lengths to point out that “there is no one-size-fits-all blueprint forcorporate governance”. Furthermore, it explicitly states – although only ina footnote found on careful reading – that the Anglo-Saxon model ofcorporate governance is not the model it seeks to impose elsewhere:
The report does not advocate one form of ownership structure over an-other and certainly not the Anglo-US models. These markets have devel-oped over time in response to investor needs, institutional capacity and theinvesting preferences of the population. They cannot be easily copied inother environments. (footnote 1, p. 53)

CORPORATE GOVERNANCE AND COMPETITION 9
The report also states that the model should be prepared by each countryaccording to the above principles and that it should be “nationally owned”.
However, the entire thrust of the report’s arguments and its definitionof “best practice” structures, detailed in the appendices to the report, belieany assertion that it treats the different models of corporate governanceequally. Indeed, it is difficult to find much difference between the report’sconception of “best practice” and the Anglo-Saxon model of corporategovernance, which leaves little doubt that it is the preferred system. Further-more, the genesis of the corporate governance project was a questionableanalysis of the Asian crisis on which far-reaching policy proposals havebeen based. The overarching theme of this orthodox analysis, as notedearlier, was one based on marketization, arm’s-length relationships andtransparency.
The current “self-assessment” exercises under the guidance of theWorld Bank and the Asian Development Bank have already identifiedsalient problems in corporate governance systems: lack of effective over-sight by boards of directors, poor disclosure, weak compliance withregulatory and statutory requirements, tight insider control, and shareholderand creditor passivity. Further results along these lines can be expectedfollowing the World Bank’s investor surveys of domestic and internationalinvestors on the private sector’s response to the progress and credibility ofreform.
In summary, there is considerable activity in international forums withrespect to identifying best practice codes for corporate governance.Developing countries know from past experience that today’s best practiceoften becomes tomorrow’s conditionality if a country has the misfortuneof requiring IMF assistance. Advanced emerging markets in particular musttherefore proactively engage in the proceedings of the Global CorporateGovernance Forum and the Regional Corporate Governance roundtablesbeing organized jointly by the OECD and the World Bank. One reason fordoing this is that the private sector, which is engaged in these activities inmany countries, does not appear to be fully appreciative of the subtle issuesinvolved in examining the question of corporate governance. It is notunusual to find that business school economists in private sector organi-

AJIT SINGH, ALAKA SINGH AND BRUCE WEISSE10
zations in developing countries, who usually have a narrow view of thesubject, put forward proposals for a market-based system of stock marketgovernance that are even more extreme than those suggested by theinternational financial institutions.1
IV. CORPORATE GOVERNANCE IN EMERGING MARKETS:THE FACTS
The analysis of corporate governance structures in developingcountries has long been hindered by a lack of detailed information. Onebenefit to arise from the Asian crisis and the focus of the internationalfinancial institutions on governance structures has been the assembling ofa large body of evidence on corporate governance structures in developingcountries by the World Bank. This has included information on the structureof share ownership and corporate governance laws, which enables theconstruction of a more informed picture of the governance structures in awide range of developing countries.
A. Patterns of share ownership and control of largecorporations in developed and emerging markets
One of the key insights to emerge from the new empirical studies isthat the widely-held corporation described in the classic study by Berleand Means, (1933) is an Anglo-Saxon phenomenon. As table 1 indicates,in the developing economies of Mexico, Hong Kong (China) and Argentina,for example, the shares of family-controlled2 firms in the top 20 publicly-traded companies are 100 per cent, 70 per cent and 65 per cent respectively.In contrast, in the United Kingdom the top 20 quoted companies are 100-per-cent widely-held. However, among developed countries there is adiversity of structures. In Sweden and Portugal, 45 per cent of publicly-traded firms are family-controlled, while in Greece and Belgium the figureis 50 per cent. Even in the United States, 20 per cent of the top 20 publicly-traded firms are family-controlled.

CORPORATE GOVERNANCE AND COMPETITION 11
Table 1
CONTROL OF PUBLICLY-TRADED FIRMS AROUND THE WORLD, 1996
(Per cent)
Widely- Widely-Widely- Family- State- held held
Economy held owned owned financial corporation
OECD countries(Non-bank borrower)
Australia 65 5 5 . 25Austria 5 15 70 . .Belgium 5 50 5 30 .Canada 60 25 . . 15Denmark 40 35 15 . .Finland 35 10 35 5 5France 60 20 15 5 .Germany 50 10 25 15 .Greece 10 50 30 10 .Ireland 65 10 . . 10Italy 20 15 40 5 10Japan 90 5 5 . .Netherlands 30 20 5 . 10New Zealand 30 25 25 . 20Norway 25 25 35 5 .Portugal 10 45 25 15 0Spain 35 15 30 10 10Sweden 25 45 10 15 .Switzerland 60 3 . 5 .United Kingdom 100 . . . .United States 80 20 . . .
Bank borrowers and others
Argentina . 65 15 5 15Hong Kong, China 10 70 5 5 .Israel 5 50 40 . 5Mexico . 100 . . .Singapore 15 30 45 5 5Korea, Rep. of 55 20 15 . 5
Source: Iskander and Chamlou (2000).

AJIT SINGH, ALAKA SINGH AND BRUCE WEISSE12
In terms of State ownership and control of large firms, the picture issimilarly complex. In Israel and Singapore, nearly half (40 per cent and45 per cent, respectively) of the top 20 publicly-traded firms are Statecontrolled. In the major OECD economies, this figure ranges from zero inthe United States and the United Kingdom to 25 per cent in Germany and40 per cent in Italy. Among the smaller developed economies there is asimilar range, with Austrian State-run corporations controlling a 70 percent share of the top 20 publicly-traded firms. It is therefore not surprisingthat there is now a higher degree of private ownership in the RussianFederation than in many Western European countries.
Table 2 provides evidence from Asian countries assembled byClaessens, Djankov and Lang (2000), which is based on a very large sampleof nearly 3,000 publicly-traded firms in nine countries. It indicates thatwhen 10 per cent equity ownership is defined as control, Japan is the onlycountry with the Berle and Means-style system of dispersed-shareownership (42 per cent of publicly-traded firms), but with an additional38.5 per cent of firms controlled by widely-held financial institutions. Atthe 10-per-cent level, most other countries have systems dominated byfamilies: Indonesia (68.6 per cent), the Republic of Korea (67.9 per cent),Taiwan Province of China (65.6 per cent), Malaysia (57.5 per cent) andThailand (56.5 per cent). When control is defined at the 20 per cent level,the Berle and Means widely-held system becomes more pronounced, asmany firms in Japan, the Republic of Korea and Taiwan Province of Chinahave family ownership of between 10 per cent and 20 per cent of the equity.However, even after redefining control, family-controlled corporations stillaccount for 48.4 per cent of publicly-traded companies in the Republic ofKorea and 48.2 per cent in Taiwan Province of China. Moreover, in othercountries the share of family-controlled firms (as a share of the total numberof firms under “control”) increases when control is redefined: in Indonesia,the class of family-controlled firms increases at the expense of State control,widely-held financial and widely-held corporate control; in Thailand, familycontrol increases from 57.7 per cent to 67.2 per cent, and in Malaysia from57.7 per cent to 67.2 per cent (Claessens, Djankov and Lang, 2000: 104).
An interesting variant is provided by the typical pattern of shareownership and control in large Indian firms – the business groups. Table 3

CORPORATE GOVERNANCE AND COMPETITION 13
Table 2
CONTROL OF PUBLICLY-TRADED FIRMS IN EAST ASIA
Widely- Widely-Number of Widely- Family- State- held held
Country corporations held owned owned financial corporations
10 per cent cutoff
Hong Kong, China 330 0.6 64.7 3.7 7.1 23.9Indonesia 178 0.6 68.6 10.2 3.8 16.8Japan 1 240 42.0 13.1 1.1 38.5 5.3Korea, Rep. of 345 14.3 67.9 5.1 3.5 9.2Malaysia 238 1.0 57.5 18.2 12.1 11.2Philippines 120 1.7 42.1 3.6 16.8 35.9Singapore 221 1.4 52.0 23.6 10.8 12.2Taiwan Prov. of China 141 2.9 65.6 3.0 10.4 18.1Thailand 167 2.2 56.5 7.5 12.8 21.1
20 per cent cutoff
Hong Kong, China 330 7.0 66.7 1.4 5.2 19.8Indonesia 178 5.1 71.5 8.2 2.0 13.2Japan 1 240 79.8 9.7 0.8 6.5 3.2Korea, Rep. of 345 43.2 48.4 1.6 0.7 6.1Malaysia 238 10.3 67.2 13.4 2.3 6.7Philippines 120 19.2 44.6 2.1 7.5 26.7Singapore 221 5.4 55.4 23.5 4.1 11.5Taiwan Prov. of China 141 26.2 48.2 2.8 5.3 17.4Thailand 167 6.6 61.6 8.0 8.6 15.3
Source: Claessens et al. (2000: 103).Note: Newly assembled data for 2,980 publicly -traded corporations (including both financial and non-
financial institutions), based on Worldscope and supplemented with information from country-specific sources. In all cases, Claessens et al. collected the ownership structure as of the end offiscal year 1996 or the closest possible date.
shows that directors and their families held only 22.4 per cent of the sharesof the top 40 companies, and financial institutions and banks held 27.9 percent. All these financial institutions were controlled by the Government,and in many of these largest corporations the Government had, effectively,a controlling shareholding. However, traditionally, Indian financial insti-

AJIT SINGH, ALAKA SINGH AND BRUCE WEISSE14
tutions have supported the owning family unless the company’s per-formance was exceptionally poor.
Evidence also suggests that in Asia, firms controlled by families aremost likely to have a separation between ownership and control. Table 4presents the mean-ratios of cash flow over control rights for a sample ofAsian economies. A low ratio indicates that the control rights exceed thecash-flow rights; it thus provides a measure of the degree of corporate“pyramiding”. The table indicates that in all countries except for Japanand Singapore, family-controlled firms have the greatest separation betweenownership and control. In Japan, firms controlled by financial institutionshave the greatest separation (0.495). The pattern across company size isless clear, but it appears that small firms are most likely to have a largerwedge between cash flow and control rights, regardless of the type ofownership. In three economies, however, (the Republic of Korea, Singaporeand Taiwan Province of China), there is a greater separation of ownershipand control among the 20 largest family-controlled firms.
Table 3
PROPORTION OF OWNERSHIP IN INDIAa
Quartile Foreign Government Corporate Directors Public Total
Quartile 1 16.1 28.9 23.1 1.1 30.8 100
Quartile 2 24.3 25.6 25.6 1.2 23.3 100
Quartile 3 20.7 23.9 17.9 0.7 36.8 100
Quartile 4 22.9 33.0 19.2 1.0 23.8 100
Total 19.0 27.9 22.4 1.1 29.6 100
Source: Original data, Institute for Studies in Industrial Development, New Delhi. We are grateful toDr Surinder Goyal, Director of the Institute, for making this data available.
Note: Foreign refers to foreign institutional investors, and other foreigners and foreign entities, includingnon-resident Indians. Government refers to all public financial institutions, including central andstate banks. Corporate refers to promoters, subsidiary companies and holding companies.Directors refers to directors and relatives. Public refers to general public companies.
a 44 companies.

CORPORATE GOVERNANCE AND COMPETITION 15
Table 4
THE SEPARATION OF OWNERSHIP AND CONTROL ACROSS TYPE OFLARGEST CONTROLLING SHAREHOLDER AND COMPANY SIZE
Widely-held Widely-heldCountry Category Family State financial corporation
Hong Kong, China All firms 0.826 1.000 0.876 0.993Largest 20 0.832 1.000 0.656 n.a.Middle 50 0.886 1.000 1.000 1.000Smallest 50 0.805 1.000 1.000 0.988
Indonesia All firms 0.687 1.000 1.000 0.949Largest 20 0.741 1.000 n.a. 1.000Middle 50 0.677 1.000 1.000 0.927Smallest 50 0.702 n.a. n.a. 1.000
Japan All firms 0.984 1.000 0.495 0.943Largest 20 1.000 1.000 n.a. n.a.Middle 50 1.000 1.000 0.512 0.956Smallest 50 0.983 n.a. 0.446 0.867
Korea, Rep. of All firms 0.833 1.000 1.000 0.986Largest 20 0.619 1.000 n.a. n.a.Middle 50 0.807 1.000 1.000 1.000Smallest 50 0.861 n.a. n.a. 1.000
Malaysia All firms 0.785 0.959 1.000 0.895Largest 20 0.942 0.871 n.a. 1.000Middle 50 0.787 1.000 1.000 0.752Smallest 50 0.795 0.692 1.000 0.789
Philippines All firms 0.819 0.914 0.965 0.956Largest 20 0.878 1.000 n.a. 1.000Middle 50 0.837 1.000 0.932 0.938Smallest 50 0.775 0.742 0.909 0.975
Singapore All firms 0.722 0.685 0.956 0.944Largest 20 0.604 0.794 n.a. n.a.Middle 50 0.693 0.659 1.000 1.000Smallest 50 0.768 0.655 1.000 0.907
Taiwan Prov. of China All firms 0.757 1.000 0.989 0.922Largest 20 0.643 1.000 1.000 1.000Middle 50 0.704 1.000 1.000 0.904Smallest 50 0.763 n.a. 0.969 0.894
Thailand All firms 0.920 1.000 1.000 1.000Largest 20 0.969 1.000 n.a. n.a.Middle 50 0.935 1.000 1.000 1.000Smallest 50 0.859 1.000 1.000 1.000
Source: Claessens et al. (2000: 102).Note: Newly assembled data for publicly traded corporations (including both financial and non-financial
institutions) was collected from Worldscope and supplemented with information from country-specific sources. In all cases, the ownership structure was collected as of end fiscal year 1996 or theclosest possible date. Controlling shareholders are defined at the 20 per cent (benchmark) cutoff.Size refers to the largest 20 firms, the median 50 firms, and the smallest 50 firms in terms of marketcapitalization. Widely-held firms are excluded from the sample. The reported numbers represent themean ratio of cash-flow over control rights. When no firm fits the category, it is marked “n.a.”.

AJIT SINGH, ALAKA SINGH AND BRUCE WEISSE16
B. Crony capitalism
Claessens, Djankov and Lang (2000) also present evidence (reportedin table 5) on the degree to which family-controlled firms account for grossdomestic product (GDP). As noted earlier, the orthodox argument in thewake of the Asian crisis was that “crony capitalism” – the complexrelationships between large capitalist families and their government allies– created the conditions for economic collapse. However, the evidenceindicates that there is no direct link between the share of GDP controlledby family firms and performance. In Hong Kong (China), the top 15 familiescontrolled 84.2 per cent of GDP in 1996, while in Singapore and Malaysiathe respective figures were 48.3 per cent and 76.2 per cent. Hong Kong(China) and Singapore were both able to weather the Asian financial crisis,although Malaysia experienced a sharp downturn and currency crash.Similarly, the top 15 families in Taiwan Province of China controlled 17 percent of GDP and that economy avoided the financial crisis. Yet the Republicof Korea, where the top 15 families accounted for 12.9 per cent of GDP,experienced a sharp contraction and currency depreciation in late 1997and early 1998. Thus, crony capitalism, while it certainly exists, cannot beattributed simplistically to the extent of influence of family-controlledgroups in the economy.
A similar story applies when we measure the influence of the top15 families by their ownership of corporate assets, although in this casethe top 15 families controlled 38.4 per cent of the corporate assets in theRepublic of Korea compared to 20.1 per cent in Taiwan Province of China(this, however, reflects the more concentrated industrial structure in theRepublic of Korea and the dominance of large firms in its stock market). Itshould be noted that such concentrations of economic power in a set offamilies is not necessarily antithetical to the efficient functioning, trans-parency and democratic accountability of the industrial system. Forexample, in Sweden, the highly influential Wallenberg family is believedto control up to 60 per cent of that country’s industrial capital, and, conse-quently, little is done in the country which does not have the family’sapproval. Furthermore, as Berglof and von Thadden (1999) note, cronycapitalism is not a corporate governance problem in a strict sense, since

CORPORATE GOVERNANCE AND COMPETITION 17
family owners are likely to have the right incentives in their firms. Rather,crony capitalism is a product of the complex relations between the businessand political elite, and, in principle, could arise in systems with widelydispersed ownership. Taken collectively, the prevalence of family-controlledfirms in developing economies suggests that they are an effective vehicleof late development and industrialization and that they remain prominentin many developed economies.3
Table 5
HOW CONCENTRATED IS FAMILY CONTROL?
Per cent of total value Per centof listed corporate assets of GDP
Average that families control (1996) 1996numberof firms Top 1 Top 5 Top 10 Top 15 Top 15
Country per family family families families families families
Hong Kong, China 2.36 6.5 26.2 32.2 34.4 84.2
Indonesia 4.09 16.6 40.7 57.7 61.7 21.5
Japan 1.04 0.5 1.8 2.4 2.8 2.1
Korea, Rep. of 2.07 11.4 29.7 36.8 38.4 12.9
Malaysia 1.97 7.4 17.3 24.8 28.3 76.2
Philippines 2.68 17.1 42.8 52.5 55.1 46.7
Singapore 1.26 6.4 19.5 26.6 29.9 48.3
Taiwan Prov. of China 1.17 4.0 14.5 18.4 20.1 17.0
Thailand 1.68 9.4 32.2 46.2 53.3 39.3
Source: Claessens et al. (2000: 108).Note: Newly asembled data for 2,980 publicly traded corporations (including both financial and non-
financial institutions). The data was collected from Worldscope and supplemented withinformation from country-specific sources. In all cases, data on the ownership structure wascollected as of end of fiscal year 1996 or the closest possible date. The “average number of firmsper family” refers only to firms in the sample. To avoid discrepancies in the cross-countrycomparison due to different sample coverage, we have scaled down the control holdings of eachfamily group in the last four columns by assuming that the firms missing from our sample are notcontrolled by any of the largest 15 families. The per cent of total GDP is calculated using marketcapitalization and GDP data from the World Bank.
AJIT SINGH, ALAKA SINGH AND BRUCE WEISSE18
V. THE THEORETICAL FOUNDATIONS OF THE OECD/WORLDBANK PROPOSALS ON CORPORATE GOVERNANCE
The World Bank’s preference for the Anglo-Saxon model of corporategovernance is based on what it regards as “best practice”. Conspicuously,it is not based on systematic theoretical analysis or rigorous empiricalresearch. However, a recent series of papers by La Porta, Lopez-de-Silanes,Schleifer and Vishny (hereafter referred to as LLSV) on law and financehas helped fill these theoretical and empirical lacunae.
A. The LLSV thesis
The central proposition of the fairly extensive literature generated byLLSV and their colleagues is that there is a systematic causal relationshipbetween the legal framework, corporate financing patterns, corporatebehaviour and performances, and overall economic growth.4 Morespecifically, it argues that the greater the protection afforded to minorityshareholders and creditors, the more external financing firms will be ableto obtain. Through a variety of mechanisms this greater access to externalfinance modifies corporate behaviour and improves performance, whichthen has a positive impact on aggregate economic growth.
The LLSV analysis is based on an empirical and theoretical evaluationof different legal systems, the historical origins of which are exogenous(or, in the case of the least developed countries (LDCs), they are a legacyof colonial rule). The studies differentiate between four types of lawsystems: Anglo-Saxon “common law” (as practiced in the United Statesand other former British colonies), French “civil law”, and German andScandinavian legal traditions (which are, in general, closer to the French“civil law” tradition). The main analysis focuses on the differences betweenthe common and civil law traditions.
A distinguishing characteristic of these contributions is their strongempirical emphasis. The empirical results presented by LLSV indicate that

CORPORATE GOVERNANCE AND COMPETITION 19
the predictions of the legal origin model are verified by the data. Spe-cifically, they argue that the lack of protection for minority shareholders,as in the countries governed by French civil law, leads to concentration ofshare ownership, a point indicated by the data as correct. Similarly, theysuggest that, other things being equal, corporations in countries subscribingto common law pay out more dividends and have higher share prices thanfirms in countries subscribing to civil law. In addition, the evidence – inconformity with the theory – indicates that there has been a faster devel-opment of stock markets under the common law system than under thecivil law system. In point of fact, however, their claim is even moreambitious: that the legal system provides a better classification of countriesthan the distinction between “bank-based” and “stock-market-based”financial systems.
Table 6 provides data on the origins of the legal system and investorrights in 49 countries from the LLSV sample. Panels A and B providemeasures of shareholder and creditor protection, respectively, while PanelC reports measures of enforcement capability. It is evident from the tablethat there are clear differences between the countries governed by commonlaw and civil law in all these spheres. Specifically, the evidence reportedindicates that civil law countries have low accounting standards, morecorruption, less efficient judicial systems and poor protection for creditorsand shareholders. These reported inefficiencies, it is argued, lead to poorcorporate governance and lower economic growth.
The policy implication that LLSV draw from this analysis is thatcountries should move towards the more efficient common law systembased on transparency and arm’s-length relationships. It is argued, however,that this would not be easy, given the vested interests connected withconcentrated share ownership that could frustrate any government attemptto dilute their equity stakes. Governments are therefore advised to carryout the reforms in a much more indirect and subtle way that would challengethe influence of the conglomerates.

AJIT SINGH, ALAKA SINGH AND BRUCE WEISSE20Ta
ble
6
LEG
AL
OR
IGIN
AN
D IN
VEST
OR
S R
IGH
TS Lega
l orig
in
Com
mon
Fren
chG
erm
anSc
andi
navi
anW
orld
law
civi
l law
civi
l law
civi
l law
aver
age
Varia
bles
(18
coun
tries
)(2
1 co
untri
es)
(6 c
ount
ries)
(4 c
ount
ries)
(49
coun
tries
)
Pane
l A: M
easu
res
of s
hreh
olde
r pro
tect
ion
Antid
irect
or ri
ghts
inde
x4.
002.
332.
333.
003.
00Pr
oxy
by m
ail (
per c
ent)
395
025
18Sh
ares
not
blo
cked
bef
ore
mee
ting
(per
cen
t)10
057
1710
071
Cum
ulat
ive
votin
g/pr
opor
tiona
l rep
. (pe
r cen
t)28
2933
027
Opp
ress
ed m
inor
ity (p
er c
ent)
9429
500
53Pr
eem
ptiv
e rig
ht to
new
issu
es (p
er c
ent)
4462
3375
53Sh
are
of c
apita
l to
call a
nd E
SM<1
0 (p
er c
ent)
9452
00
78
Pane
l B: M
easu
res
of c
redi
tor p
rote
ctio
n
Cre
dito
r rig
hts
inde
x3.
111.
582.
332.
002.
30N
o au
tom
atic
sta
y on
sec
ured
ass
ets
(per
cen
t)72
2667
2549
Secu
red
cred
itors
firs
t (pe
r cen
t)89
6510
010
081
Paid
rest
rictio
ns fo
r goi
ng in
to re
orga
niza
tion
(per
cen
t)72
4233
7555
Man
agem
ent d
oes
not s
tay
in re
orga
niza
tion
(per
cen
t)78
2633
045
Pane
l C: M
easu
res
of e
nfor
cem
ent
Effi
cien
cy o
f the
judi
cial
sys
tem
8.15
6.56
8.54
10.0
07.
67C
orru
ptio
n7.
065.
848.
0310
.00
6.90
Acco
untin
g st
anda
rds
69.9
251
.17
62.6
774
.00
60.9
3
Sour
ce:
La P
orta
et a
l. (2
000:
10–
11).

CORPORATE GOVERNANCE AND COMPETITION 21
B. The Berglof and von Thadden critique
There are two significant lines of criticism that can be directed againstthis body of thought. The first, articulated by Berglof and von Thadden(1999), finds the theoretical framework presented in LLSV far too limitedfor examining corporate governance issues in developing countries. At anempirical level, they argue that the LLSV characterization of corporategovernance in these countries is not only too narrow but also misleading.
The focus of the analysis on protecting minority shareholders andcreditors is too narrow, Berglof and von Thadden contend, even to beapplied to most European countries, let alone developing countries. LLSVappear to be solely interested in the question of the protection of providersof external finance to the exclusion of other significant stakeholders infirms. In particular, there is no mention of labour laws or, equally vital,the relationships between workers and managers, suppliers and owners/managers, local communities and the corporation, and the government andthe corporation. Thus, any sense of the structures in which the firm isembedded, and which determine its performance and competitiveness, isexpunged from consideration, while a disproportionate weight is given toone – potentially small – aspect of this structure. Berglof and von Thaddendo not regard external finance as the only, or even the principal, constrainton a firm’s growth (see, however, Section VI on this point).
Berglof and von Thadden also note that the reference point for theLLSV study is the widely-held, Berle and Means-type corporation whichis prevalent mainly in the United States and the United Kingdom (as wasindicated by the analysis in section IV). In the developing country context,they point out that the LLSV paradigm is valid and relevant only fortransitional economies, which is not entirely surprising given the fact thatsome of the LLSV authors were intimately involved in Russian reforms inthe 1990s. The former Russian State-owned sector has been dominated byowners/managers who have benefited from insider privatizations; they haveoften effectively expropriated outside investors who played a central rolein the implementation of painful restructuring (Berglof and von Thadden,1999: 24). In this context, Berglof and von Thadden argue, improved

AJIT SINGH, ALAKA SINGH AND BRUCE WEISSE22
investor protection can be useful in attracting outside capital and forcingrestructuring.
The typical firm in developing countries, however, is family-controlledor closely held by block holders (that is, it has concentrated share owner-ship). The important corporate governance problem for this class of firmsis not legal protection for outside shareholders, but rather the problems offamily succession and maintaining of family control while raising fundsfrom outside investors.
The LLSV argument is also susceptible to the fact that the directionof causality between a legal system and a financial structure could runeither way: the legal system may lead to the formation of a certain financialstructure, as LLSV maintain, but it is at least equally plausible that thefinancial structure may also lead to the creation of certain legal norms. Inthe latter view, the law accommodates larger structural changes taking placein the economy, financial markets and politics. Therefore, to argue, as LLSVdo, for the primacy of legal origins in financial market development is toplace the cart before the horse.
It is important to note that even on its own terms, maximizing investorprotection cannot be optimal. It will result in the dilution of efficiencyadvantages deriving from the lower agency costs of concentrated ownership.Moreover, a system which is more oriented towards investor protectionmay also lead to the familiar problems of short-termism, which oftencharacterize firms in the Anglo-Saxon stock market economies, resultingin lower levels of investment and an emphasis on financial engineering(Cosh, Hughes and Singh, 1990; Porter, 1992; Singh, 2000).
C. The Glen, Lee and Singh analysis
The second and rather different critical line of argument against thecentral LLSV thesis has been presented by Glen, Lee and Singh (2000).They suggest that over the past 20 years there have been major changes incorporate financing patterns and in stock market development in emerging

CORPORATE GOVERNANCE AND COMPETITION 23
markets. It would be difficult to attribute these enormous variations, asdetailed below, to changes in corporate law or to legal origin. This will beillustrated by considering the specific experience of India, a pre-eminentlycommon-law-based country. Despite this fact, in accordance with politicaldecisions of the Indian leadership, the stock market played hardly any rolein the economy until 1980. Stock market capitalization as a proportion ofGDP was a mere 5 per cent until then. The Government began to changeits economic policy stance in the early 1980s, implementing financialliberalization internally. However, following the balance-of-payments andliquidity crisis of 1990–1991, the Government initiated a more full-scaleinternal and external liberalization process. The net result was a stockmarket boom: total market capitalization rose from 5 per cent in 1980 to13 per cent in 1990, and to 40 per cent in 1993. There were two millionmutual fund investors in India in 1980, and by 1995 there were over40 million, second only to the United States. The number of companieslisted on the Indian stock markets rose to nearly 8,000 – more than that forthe United States, the largest developed country market. Hundreds ofcompanies made initial public offerings (IPOs) and a large number ofexisting listed companies raised fresh equity finance on the stock market.These enormous changes in stock market development and financing ofIndian corporations occurred within a brief space of time without anyfundamental changes in India’s constitution or basic legal framework (seeSingh, 1998a).
India, however, is not a special case. Other emerging markets (forexample, Taiwan Province of China, Mexico, Thailand and Malaysia) inthe 1980s also recorded enormous increases in stock market activity in thewake of financial liberalization. Again, this was not a response to changesin the basic legal framework from a civil law to a common law regime(Singh, 1997; Singh and Weisse, 1998). Rather it was the result of thedeliberate change in economic policy. Laws were changed to accommodateeconomic policy decisions without altering their fundamental framework.Obviously, there will be examples of the opposite kind, where the legalframework has led to changes in economic institutions. There is thus likelyto be a mutually interactive relationship between laws and economic policy.LLSV greatly overstate their case by asserting a one-way causal relation-ship.
AJIT SINGH, ALAKA SINGH AND BRUCE WEISSE24
The LLSV legal-origin approach is therefore unable to account forthe huge changes in corporate financing patterns and stock marketdevelopment within emerging markets over time. Thus, even if we acceptedthat legal origin may explain some of the cross-sectional variations betweendeveloping countries, it is not helpful for explaining the much moreimportant structural changes that have been taking place in emergingmarkets over the last two decades.
Finally, the LLSV analysis also requires us to accept that countrieswith a civil law tradition and, consequently, offering less protection tooutside investors, have been either willing to accept or are ignorant of theeconomic costs of their legal system. If they had been rational, Germanyand France would have imported a common law system decades ago andeven experienced higher rates of growth. In view of the fact that over thelast century economic growth in Japan and Germany was faster than it wasin France and comparable to that in the Anglo-Saxon economies, such anargument strains credulity.5
VI. CORPORATE GOVERNANCE AND CORPORATEFINANCE IN EMERGING MARKETS:
THE 1980s VERSUS THE 1990s
The previous section touched upon issues of corporate finance in thecontext of a critique of the LLSV approach to law and finance. Here, weshall report more directly on corporate financing patterns in developingcountries. As is implicit in the previous discussion, there is a closerelationship between corporate governance and corporate finance. Indeed,Shleifer and Vishny (1997) define corporate governance in terms of therules and procedures which ensure that external investors and creditors ina company can get their money back and that it will not simply beexpropriated by those who are managing the company.
Two of the first large-scale empirical studies of the financing ofcorporate growth in emerging markets were done by Singh and Hamid(1992) and Singh (1995a) (henceforward, both studies will be referred to

CORPORATE GOVERNANCE AND COMPETITION 25
as S-H). The two studies arrived at surprising conclusions. One wouldhave expected, a priori, that because of the underdevelopment andimperfections of developing country capital markets, firms in thesecountries would largely be self-financing. However, these two studiesproduced results that were quite contrary to these expectations. Largedeveloping country firms, it was found, depended overwhelmingly onexternal rather than internal finance, and used equity financing to asurprisingly large degree (see table 7).
Table 7 suggests that during the 1980s the average company amongthe 100 largest listed manufacturing firms in each country, in a sample of10 emerging markets, financed merely 40 per cent of its growth of net
Table 7
THE FINANCING OF CORPORATE GROWTH IN10 EMERGING MARKETS DURING THE 1980s
External finance External financeCountry Internal finance (equity) LTD
Brazil 56.4 36.0 7.7India 40.5 19.6 39.9Jordan 66.3 22.1 11.6Malaysia 35.6 46.6 17.8Mexico 24.4 66.6 9.0Pakistan 74.0 1.7 24.3Republic of Korea 19.5 49.6 30.9Thailand 27.7 n.a. n.a.Turkey 15.3 65.1 19.6Zimbabwe 58.0 38.8 3.2
All 38.8 39.3 20.8
Fa 20.0* 31.4* 21.2*
Fb 16.69** 18.93** 6.38**
Source: Singh (1995a).a F-statistic for comparison of means across countries. (*) implies rejection of the null hypothesis of
the equality of means.b Bartlett-Box F-statistic for variance across countries. (**) implies rejection of the null hypothesis of
equality of variance.
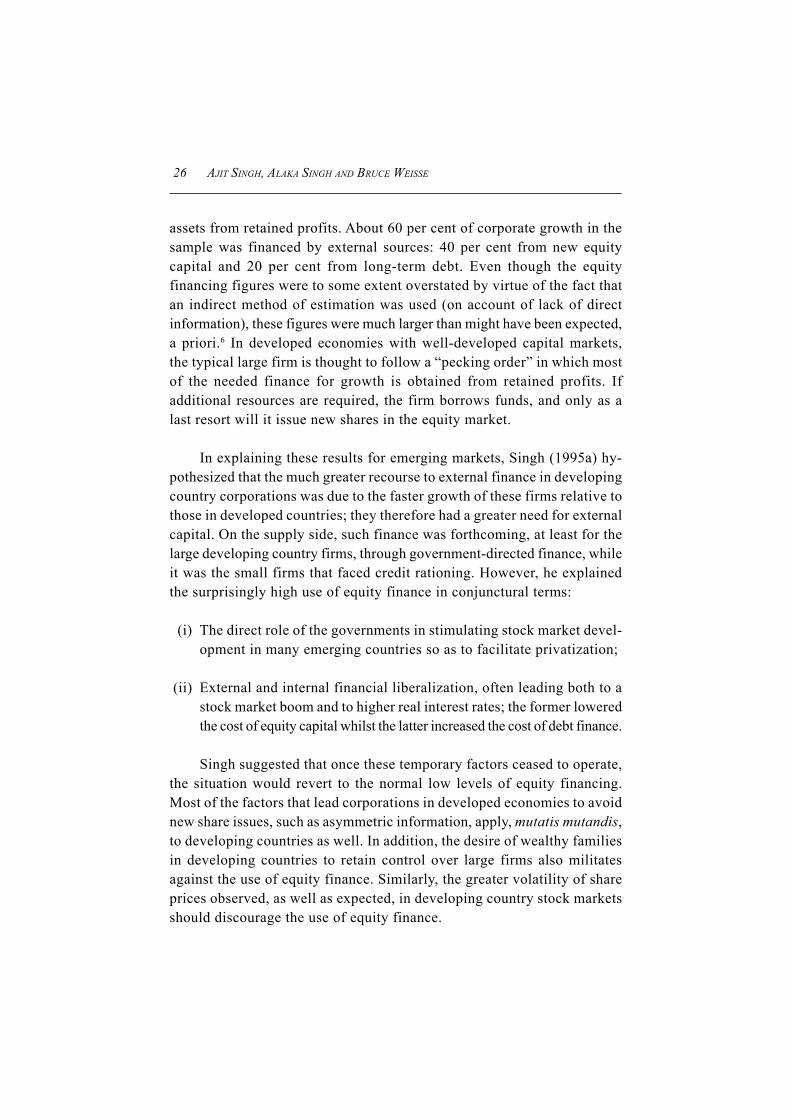
AJIT SINGH, ALAKA SINGH AND BRUCE WEISSE26
assets from retained profits. About 60 per cent of corporate growth in thesample was financed by external sources: 40 per cent from new equitycapital and 20 per cent from long-term debt. Even though the equityfinancing figures were to some extent overstated by virtue of the fact thatan indirect method of estimation was used (on account of lack of directinformation), these figures were much larger than might have been expected,a priori.6 In developed economies with well-developed capital markets,the typical large firm is thought to follow a “pecking order” in which mostof the needed finance for growth is obtained from retained profits. Ifadditional resources are required, the firm borrows funds, and only as alast resort will it issue new shares in the equity market.
In explaining these results for emerging markets, Singh (1995a) hy-pothesized that the much greater recourse to external finance in developingcountry corporations was due to the faster growth of these firms relative tothose in developed countries; they therefore had a greater need for externalcapital. On the supply side, such finance was forthcoming, at least for thelarge developing country firms, through government-directed finance, whileit was the small firms that faced credit rationing. However, he explainedthe surprisingly high use of equity finance in conjunctural terms:
(i) The direct role of the governments in stimulating stock market devel-opment in many emerging countries so as to facilitate privatization;
(ii) External and internal financial liberalization, often leading both to astock market boom and to higher real interest rates; the former loweredthe cost of equity capital whilst the latter increased the cost of debt finance.
Singh suggested that once these temporary factors ceased to operate,the situation would revert to the normal low levels of equity financing.Most of the factors that lead corporations in developed economies to avoidnew share issues, such as asymmetric information, apply, mutatis mutandis,to developing countries as well. In addition, the desire of wealthy familiesin developing countries to retain control over large firms also militatesagainst the use of equity finance. Similarly, the greater volatility of shareprices observed, as well as expected, in developing country stock marketsshould discourage the use of equity finance.

CORPORATE GOVERNANCE AND COMPETITION 27
Have the corporate financing patterns in emerging markets changedin the 1990s compared with the 1980s? If so, have they changed in thedirection indicated above – that is, do they suggest that the conjuncturalfactors have ceased to operate or are less applicable? Tables 8, 9a and 9battempt to answer this question for four emerging markets. The tables arebased on the WorldScope dataset for individual listed corporations for fourcountries, India, the Republic of Korea, Malaysia and Thailand. The datasetprovides information only for the 1990s, so that a direct comparison ofthese results to those of Singh (1995a) and Singh and Hamid (1992) forthe 1980s must be made carefully and with due regard to the intrinsicdifferences in the datasets.
Specifically, the WorldScope dataset makes it possible to measurethe extent of equity financing directly, instead of using the indirect residualmethod employed in the S-H studies because of data limitations. The newdataset also allows us to undertake a more comprehensive analysis ofsources of financing for corporate growth, including both short- and long-term debt and working capital. The S-H studies only examined long-termdebt, which, in the case of developing countries, as subsequent eventsdemonstrated, is not an adequate reflection of their normal indebtedness.This is because developing country corporations use large amounts of short-term debt for long-term investment purposes. Such debt is normally rolledover, turning it into the functional equivalent of long-term debt, but creditorsmay refuse to roll over these debts in crisis situations, as exemplified bythe Asian crisis of 1997–1998. Therefore, the results reported in table 8are based on a methodology that differs from that of S-H in the followingrespects:
(i) It measures the contributing of equity finance directly (as noted above,the WorldScope data provides that information);
(ii) It includes short-term debt and trade credit in external sources offinance. The earlier studies were only concerned with long-term capitalemployed in the firm (i.e. the growth of net assets). The exercise intable 8 includes all sources of finance: short term as well as long term.
(iii) It includes another category for revaluation reserves, minority interests,preferred shares and non-equity reserves.

AJIT SINGH, ALAKA SINGH AND BRUCE WEISSE28
The results in table 8 confirm the main S-H result, that developingcountry firms depend overwhelmingly on external financing to financetheir growth. As expected, the contribution of external finance is, if any-thing, greater than in the S-H studies because of the inclusion of short-termdebt and working capital in the sources of finance. In the Republic of Korea,for example, nearly 95 per cent of the total sources of finance consisted ofexternal finance; in Thailand the corresponding figure was 87 per cent;
Table 8
BALANCED SAMPLE: SOURCES OF FINANCING OFGROWTH OF TOTAL ASSETS, 1992–1996
(Unweighted average, per cent) a
India Malaysia Thailand Rep. of Koreab
Retentions 23.1 25.3 13.3 5.7External finance 76.9 74.7 86.7 94.3Shares 31.2 14.6 9.6 16.1Debt finance 43.3 51.0 70.8 80.6
Source: WorldScope database.a Unweighted averages are the average of the sum (over companies) of each source of finance in
each year divided by the sum of the growth of total assets. The balanced samples for the fourcountries are as follows: India = 115; Malaysia = 130; Thailand = 98; Rep. of Korea = 95.
b Unweighted ratios for the Republic of Korea are calculated over three years: 1994–1996. Someunusually large ratios for 1993 were omitted from the overall average.
Share of financing of total assets
0
20
40
60
80
100
India Malaysia Thailand Rep. of Korea
(Per
cen
t)
Retentions External finance Shares Debt finance

CORPORATE GOVERNANCE AND COMPETITION 29
Table 9a
BALANCED SAMPLE: SOURCES OF FINANCING OFGROWTH OF NET ASSETS: 1992–1996
(Unweighted average, per cent)
India Malaysia Thailand Rep. of Korea
Net asset growth 37.2 32.9 39.7 20.6Retentions 36.9 56.9 48.0 13.7External finance 64.9 46.8 55.6 96.5Long-term debt 40.6 14.4 36.1 67.8Shares 24.0 18.2 15.9 21.1Other 0.3 14.2 3.6 7.6Statistical adjustment -1.9 -3.8 -3.5 -10.2
Source: WorldScope database.Note: The balance samples for the four countries are: India = 115, Malaysia = 130, Thailand = 98,
Republic of Korea = 95. All cases where average annual rates of growth of net assets was lessthan 1 per cent were rejected since low values of growth (the denominator) would lead to highvalues for the whole ratio. Internal and external finance were constrained to those between-100 per cent and +200 per cent (see Singh, 1995a). Internal and external finance were calculatedas in Singh (1995a: 39). Note also that external finance of net assets by equity (new shares) wascalculated directly as against the residual used in Singh, 1995a. The statistical adjustments in thetable arise from the constraints placed on the financial ratios.
Table 9b
BALANCED SAMPLE: SOURCES OF FINANCING OFGROWTH OF NET ASSETS: 1992–1996
(Unweighted average, per cent)
India Malaysia Thailand Rep. of Korea
Retentions 36.9 56.9 48.0 13.7External finance 63.1 43.1 52.0 86.3Long-term debt 40.6 14.4 36.1 67.8Shares 22.5 28.6 15.9 18.5Total 100.0 100.0 100.0 100.0
Source: WorldScope database.Note: The balance samples for the four countries are: India = 115, Malaysia = 130, Thailand = 98,
Republic of Korea = 95. This table was constructed using Singh (1995a), residual method.Retentions and long-term debt were calculated directly and new shares were the residual sourcesof funds.

AJIT SINGH, ALAKA SINGH AND BRUCE WEISSE30
and in Malaysia and India, it was 75 and 77 per cent respectively. Thecontribution of short-term debt to total sources of finance is also striking,ranging as it does from just under 30 per cent in India to well over 45 percent in the Republic of Korea.
However, the results for the equity financing variables are more mixed.Although only a rough comparison can be made, the results show reducedequity financing in some countries in the 1990s compared with the 1980s,and increased equity financing in others. In India, there is a 10 percentagepoint increase in the contribution of new share issues to total sources offinance between the 1980s and 1990s; and in Malaysia and the Republic ofKorea the proportions contributed by new share issues is smaller than inthe S-H studies. Nevertheless, in both countries the contribution of newshare capital is more than 15 per cent which, contrary to the “peckingorder” theory, is greater than the share of retained profits (it is of coursewell above the figure attributed to new share issues in developed economies)(Mayer, 1990; Corbett and Jenkinson, 1994).
The question remains whether the above results can be attributedentirely to the biased measurement of the equity financing variable in thebenchmark S-H studies for the 1980s. To investigate this, both the Singhand Hamid residual method and the direct method were used to calculatethe financing of net assets (i.e. the long-term capital employed in the firm)in a sample of four countries over the 1992–1996 period. The resultsreported in tables 9a and 9b show that the direct method and the S-H residualmethod produced broadly similar results. For both India and the Republicof Korea, the residual method slightly underestimated the contribution ofequity finance while for Malaysia it significantly overestimated its con-tribution; for Thailand, both methods arrived at identical results. Thisanalysis therefore suggests that in three out of four countries the S-H methoddid not overstate the contribution of equity finance. Thus in the case ofthese countries, the observed changes in the corporate financing patternsfrom the 1980s to the 1990s are likely to reflect the substantive factorsdiscussed earlier, rather than measurement bias.
It is useful to discuss the Indian example, where we observed a modestincrease in equity financing in the 1990s compared to the benchmark figure

CORPORATE GOVERNANCE AND COMPETITION 31
in table 8. The early 1990s saw an acceleration of the liberalization reformsprocess, both financial and non-financial, following the balance-of-payments crisis of 1991. A subsequent stock market boom resulted inincreasing price/earnings ratios, and consequently a lower cost of equityfinance relative to debt (as interest rates rose modestly during the period).More companies went to the stock market for finance, with 700 companiesmaking IPOs in 1995–1996. By 1999, which is well beyond the period ofthe WorldScope data examined in this study, IPOs had fallen to almostzero as the stock market declined and price/earnings ratios fell.
A. Corporate finance, the stock market and corporate governance
In view of the large recourse to equity financing by developing countryfirms, the stock markets might be expected to significantly affect theirbehaviour and their corporate governance patterns. It is therefore importantto ask how. The stock market can affect corporate governance and behavioureither directly through movements in share prices, or more indirectly throughthe market for corporate control. We examine each of these in turn below.
Judging from the pattern of finance, stock markets may be expectedto have a significant influence on large developing country corporationsbecause of the scale of finance they obtain from these markets. Whetherthis is a positive or negative development depends, to a large extent, onthe position one takes with regard to the ability of the stock market toefficiently finance corporations. In the traditional textbook treatment ofthe subject, the liquid secondary equity market leads to a better allocationof funds, which results in more efficient and dynamic firms obtaining capitalat lower cost. Less efficient firms or firms in less dynamic industries facea higher cost of equity capital. The movement of funds to more efficient,productive firms results in higher degrees of technological progress andeconomic growth.
However, a more critical literature, originating in the work of JohnMaynard Keynes, has pointed out that the pricing process may not be asefficient as the textbooks suggest, but may instead be dominated by

AJIT SINGH, ALAKA SINGH AND BRUCE WEISSE32
speculation. James Tobin has distinguished two concepts of share priceefficiency on the stock market: informational efficiency (in the sense thatall currently available information is incorporated into the share price)and fundamental valuation efficiency (whereby share prices accuratelyreflect the future discounted earnings of the corporation). While real worldstock market prices may reflect the former, the critical school maintainsthat there are strong reasons to doubt that it attains the latter, moreimportant, criterion of efficiency. The reasons for this are found in thepsychology of stock market participants.7 As Keynes pointed out in hisfamous description of the beauty contest in the General Theory, often theart of the successful investor does not consist in appreciating fundamentalvalues of corporations, but rather in guessing at the likely movements ofother stock market participants. Such a process leads to herding, myopiaand fads that can cause stock market values to diverge significantly fromunderlying values. (For a current example, note the rise and fall of tech-nology shares on international stock markets.) The volatility associatedwith this process further reduces the capacity of share prices to transmitefficient signals to market participants.
Experience from developed countries suggests that the stock marketmay also encourage managers to pursue short-term profits at the expenseof long-term investment, since firms are obliged to meet quarterly or half-yearly earnings per share targets that are determined by market expectations.Any serious fall in performance will quickly be reflected in a lower shareprice, making the firm vulnerable to takeover. In the late 1980s and early1990s, numerous analysts in the United States ascribed that country’srelatively poor comparative performance, vis-à-vis competitors with bank-based financial systems, such as Japan and Germany, to the short-termistdemands of Wall Street, resulting in lower investment in technologicalupgrading and new capacity.8 In a closely related but more general sense,the dominance of stock markets can also result in the ascendancy of financeover productive enterprise. The rules of the game are constructed in such away that companies can rise or fall, depending on their ability to engage infinancial engineering rather than in developing new products or processes.This is often reflected within the firm itself, in the dominance of managerstrained in finance over those who come from other backgrounds such asengineering or marketing.

CORPORATE GOVERNANCE AND COMPETITION 33
Thus the benefits of having large corporations dependent on a highlyliquid equity market are far from being unambiguous, particularly fromthe perspective of good corporate governance (see further Bhide, 1993).
B. Corporate governance and takeovers
The market for corporate control is thought to be the evolutionaryendpoint of stock market development. The ability of an outside group ofinvestors to acquire a corporation, often through a hostile bid, is thehallmark of the stock-market-dominated financial systems of the UnitedStates and the United Kingdom. As noted above, the textbook interpretationof takeovers is that they improve efficiency by transferring corporate assetsto those who can manage them more productively. Consequently, moreeffective managers emerge who can raise the firm’s profitability and shareprice. Even if current managers are not replaced, an active market forcorporate control presents a credible threat that inefficient managers willbe replaced; it thus ensures that the incumbent management actively seeksto maximize shareholder value, thereby raising corporate performance.Even if quoted firms were not directly susceptible to changes in share prices,because they finance themselves almost exclusively from internal finance(as the pecking order theory implies and empirical evidence on developedcountry corporations confirms), the market for corporate control could stilldiscipline managers. Furthermore, even if all firms were on the efficiencyfrontier, the amalgamation of some through takeovers might lead to a bettersocial allocation of resources via synergy.
However, a critical school has developed a multifaceted critique thatincreasingly questions the above textbook version of the market forcorporate control. First, a number of analysts in the critical school havepointed out that in the real world the market for corporate control, even indeveloped economies, has an inherent flaw in its operation: it is far easierfor a large firm to take over a small one than the other way round (Singh,1971; 1975; 1992). In principle, while it is possible that a small efficientfirm may take over a larger and less efficient company (and to a degreethis occurred in the United States takeover wave of the 1980s through “junkbonds”), its incidence is very small (Hughes, 1991).

AJIT SINGH, ALAKA SINGH AND BRUCE WEISSE34
This consideration is particularly important for developing countrieslike India where there are large, potentially predatory conglomerate groups(Singh, 1995a). These could take over smaller, more efficient firms, andthereby reduce potential competition to the detriment of the real economy.In a takeover battle it is the absolute firepower (absolute size) that countsrather than the relative efficiency. Therefore, the development of an activemarket for corporate control may encourage managers to “empire build”,not only to increase their monopoly power, but also to progressively shieldthemselves from takeover by becoming larger (see further Singh, 1975; 1992).
Secondly, the efficient operation of the takeover mechanism requiresthat enormous amounts of information be widely available. Specifically,market participants require information on the profitability of a corporationunder its existing management and on its prospective profitability underan alternative management if it were taken over. It has been noted thatsuch information is not easily available even in developed countries and islikely to be even more scarce in developing countries.
Thirdly, takeovers are a very expensive way of changing management(Peacock and Bannock, 1991). There are huge transaction costs associatedwith them in countries such as the United States and the United Kingdom,which hinder the efficiency of the takeover mechanism. Given the lowerincome levels in developing countries, these costs are likely to beproportionally heavier in these countries. It should also be borne in mindthat highly successful countries such as Japan, Germany and France havenot had an active market for corporate control, and have thus avoided thesecosts while still maintaining systems for disciplining managers. Further-more, there is no evidence that corporate governance necessarily improvesafter takeovers. This is for the simple reason that not all takeovers aredisciplinary; in many of them the acquiring firm is motivated by empire-building considerations or even by asset-stripping.
Fourthly, there is theoretical work (see, for example, Stein, 1989)which suggests that even if managers wish to maximize shareholder wealth,it pays them to be myopic in a world of takeovers and signal-jamming.Thus, takeovers could exacerbate the existing tendencies towards short-termism in a stock-market-based system.
CORPORATE GOVERNANCE AND COMPETITION 35
Fifthly, it has been argued that takeovers can be used as a device toavoid honouring implicit contracts developed between workers and theformer management (Shleifer and Summers, 1988). This abandonment ofimplicit contracts can be argued to be socially harmful in that it discouragesthe accumulation of firm-specific human capital by workers. The absenceof strong worker protection laws in many developing countries means thatsuch considerations may be significant.
These critiques of the market for corporate control have been basedon the experience of developed countries. Nonetheless, there is every reasonto believe that they are likely to be even more relevant to potential take-over markets in developing countries. However, the takeover market indeveloping countries remains rudimentary because of the fact, noted earlier,that shareholding is not widely dispersed and standards of disclosure arenot conducive to takeovers. It is therefore not surprising that hostiletakeovers are rare in developing countries; for example, in the past decadein India there have been only five or six such attempts, not all of whichhave been successful. However, this situation may change if large trans-national corporations (TNCs) are allowed to engage in takeovers indeveloping countries. Domestic firms, with their limited funds and relativelyrestricted access to international capital markets, would not be able eitherto compete or resist the TNCs. In addition, as we will discuss later, theentry of large TNCs in the takeover market may reduce competition inproduct markets in these countries.
There are also other potential factors that could cause financialliberalization and stock markets to have a negative effect on corporategovernance. Financial liberalization establishes a strong link between twopotentially volatile markets: the stock market and the foreign exchangemarket. The Asian crisis of 1997–1998 demonstrated that there could be astrong negative feedback relationship between a falling stock market anda depreciating currency. As the stock market declines, investors pull out ofthe market and move their funds into foreign currency. The depreciatingcurrency then lowers real returns on the stock market, which, in turn,propels the cycle.9 Such a collapse in currency and equity values, of course,ultimately may encourage “fire-sale” type FDI in the form of takeovers(suggesting that the expected rate of return measured in foreign currency
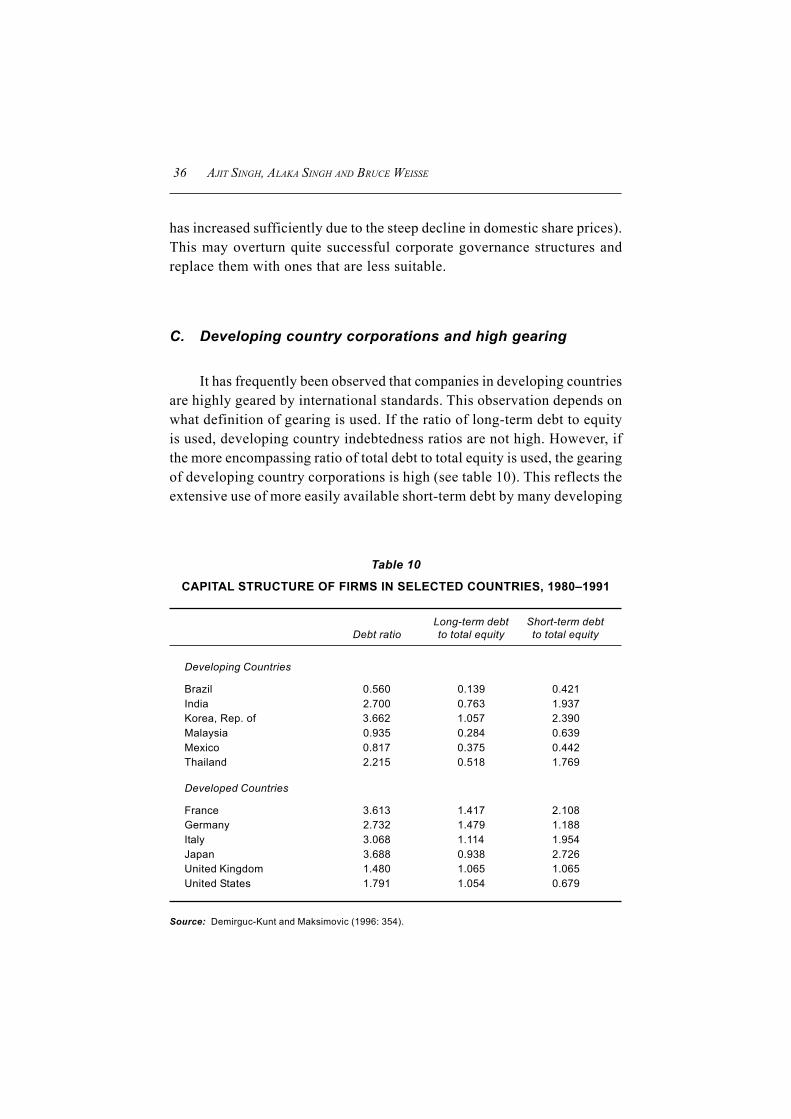
AJIT SINGH, ALAKA SINGH AND BRUCE WEISSE36
has increased sufficiently due to the steep decline in domestic share prices).This may overturn quite successful corporate governance structures andreplace them with ones that are less suitable.
C. Developing country corporations and high gearing
It has frequently been observed that companies in developing countriesare highly geared by international standards. This observation depends onwhat definition of gearing is used. If the ratio of long-term debt to equityis used, developing country indebtedness ratios are not high. However, ifthe more encompassing ratio of total debt to total equity is used, the gearingof developing country corporations is high (see table 10). This reflects theextensive use of more easily available short-term debt by many developing
Table 10
CAPITAL STRUCTURE OF FIRMS IN SELECTED COUNTRIES, 1980–1991
Long-term debt Short-term debtDebt ratio to total equity to total equity
Developing Countries
Brazil 0.560 0.139 0.421India 2.700 0.763 1.937Korea, Rep. of 3.662 1.057 2.390Malaysia 0.935 0.284 0.639Mexico 0.817 0.375 0.442Thailand 2.215 0.518 1.769
Developed Countries
France 3.613 1.417 2.108Germany 2.732 1.479 1.188Italy 3.068 1.114 1.954Japan 3.688 0.938 2.726United Kingdom 1.480 1.065 1.065United States 1.791 1.054 0.679
Source: Demirguc-Kunt and Maksimovic (1996: 354).

CORPORATE GOVERNANCE AND COMPETITION 37
country corporations to finance their often rapid growth. In the wake ofthe Asian crisis and the evidence that the large amount of short-term debtcontracted by conglomerates – particularly in the Republic of Korea, butalso in the other affected economies – increased the vulnerability of thesecountries to a reversal of capital flows, the international financial insti-tutions and governments have been calling for a reduction in gearing ratios.
However, it is possible, a priori, to use high gearing ratios to improveperformance (by creating an optimal contract that bridges the agencyproblem between owners and managers), which enables the creation ofconglomerates in the first place. This is important since, as will be discussedin the next section, large conglomerates are instrumentally effective inlate developing countries. The key question at the heart of this issue iswhat defines the optimal degree of gearing. In theoretical terms this is notdifficult; the optimal gearing ratio is the one that maximizes shareholdervalue. Empirically, however, it is very difficult to determine.
It has also been argued that high gearing ratios are only possiblebecause the conglomerates themselves are considered by the State as “toobig too fail”, and they do not, therefore, have to bear the cost of financialdistress. However, this overlooks the mechanism by which discipline wasinstilled in the system. A failing conglomerate in the Republic of Koreawas not simply dissolved through the market (which might not place avalue on the firm), rather it was taken over by another conglomerate. Theconglomerate thus ceased to have an independent existence and themanagers who ran it were dismissed. Again, in markets which are in-complete such a mechanism is efficient and reduces the losses associatedwith completely dissolving the conglomerate. These countries havemaintained high growth rates despite such supposedly “inefficient” prac-tices.
Following the Asian crisis there has been a chorus of calls for theestablishment of an effective bankruptcy code in these countries. Giventhat capital account liberalization has increased the presence of foreignbanks and investors in Asian corporations, such a development is probablynecessary. However, it does not answer the important question of whichbankruptcy code to establish. Bankruptcy codes are very different

AJIT SINGH, ALAKA SINGH AND BRUCE WEISSE38
throughout the OECD, and developing countries will have to examine themclosely to determine which one is the most effective for their specificcircumstances.
High gearing ratios entail both benefits and costs for the firm. Highratios can help alleviate the agency problem that exists between ownersand managers by compelling the latter to work harder to improve profit-ability and productivity. Furthermore, high gearing ratios also allow familiesthat are reluctant to issue new equity to retain control of companies. Undernormal circumstances, high gearing ratios do not present many problemssince short-term debt is almost always rolled over, making it the functionalequivalent of long-term debt. However, as the Asian crisis demonstrated,high levels of debt can also be a source of vulnerability, especially if thedebt has a short maturity structure and is denominated in foreign currency.In principle, this problem should be attenuated if the debt is contracted inlocal currency because the central bank can expand the money supply toreduce the real financing burden of the corporate sector.
VII. CONGLOMERATES AND ECONOMIC EFFICIENCY
Another issue closely connected with corporate governance andcorporate finance in emerging markets concerns the large family-ownedconglomerates found in many developing economies. These have beenblamed for the Asian crisis because of their lack of transparency, poorcorporate governance, inadequate accounting procedures and lack of focus.The owners are thought to be more interested in empire- building than inpursuing shareholder value. It is also suggested that the giant third worldconglomerates, or business groups, are viewed by their governments asbeing ‘too big to fail’, leading to moral hazard. The high gearing ratios ofdeveloping country conglomerates, such as those in the Republic of Korea,are thought to reflect cronyism between corporations, banks and thegovernment. The business groups often have in-house banks, which, it isalleged, are used by the controlling families to undertake risky debt-financed projects, or to create over-capacity.

CORPORATE GOVERNANCE AND COMPETITION 39
This is, however, only a partial, one-sided picture of business groupsin developing countries, which ignores the most recent theoretical andempirical research on the subject. It also overlooks the salient point, thatsuch firms have been playing a leading role in emerging markets in allcontinents, notwithstanding the differences in institutional structures,cultures and government economic policies. Economic policy towardsdeveloping country conglomerates needs to be based on a full com-prehension of their specificity, rather than simply applying the lessons ofdiversified firms in the United Kingdom and the United States.
The other side of the story is provided by Amsden (1989; 2000), andin a series of papers by Khanna and Palepu (notably 1997; 1999), andKhanna and Yafeh (2000), as well as earlier works of other scholars (see,for example Leff, 1978; 1979). These scholars point out importantdifferences between the third world conglomerates and their westerncounterparts. The latter, particularly in the United States, were products ofthe huge takeover movements of the 1960s. At that time, the Anglo-Saxonstock markets were convinced that conglomerates added value and theybecame the glamour stocks of the period. However, the subsequentlacklustre performance of conglomerate firms by the mid-1980s led stockmarket opinion to move decisively against these diversified firms. Thesame market professionals and investment banks who had made money inthe 1960s on assembling these conglomerates through the takeover processnow profited from disassembling these through the same process – whatScherer (1988) called the “bustup” takeovers. Apart from the social costof these obvious mistakes of the stock markets,10 the significant point isthat developing country conglomerates are a different breed: they arenormally not products of takeovers but in fact have usually grown anddiversified organically. Many of them are, however, engaged in such awide variety of products and industries, with no apparent technologicalconnections between them, that they have been rightly called idiosyncraticconglomerates.11 Historically, today’s developed countries too had diver-sified firms during the course of their economic development. However,this diversification was usually limited to technologically closely-relatedindustries (Chandler 1977; Amsden and Hikino, 1994). The emergingmarket conglomerates are diversified far beyond such technologicallinkages.

AJIT SINGH, ALAKA SINGH AND BRUCE WEISSE40
Amsden (1989; 2000) regards the Republic of Korea’s chaebols asthe engines of that country’s industrial development, contributing to itsenormous success in international markets. Khanna and Palepu, in theirpapers cited earlier, provide the theoretical rationale as to why these bigbusiness groups may be more successful in emerging markets than indeveloped countries. Their argument is straightforward. Developing coun-tries suffer from a large number of market defects. They have incompleteor missing product, labour and capital markets – far more than in developedcountries. In addition, emerging markets do not yet have the whole gamutof information gathering and disseminating private organizations, regu-latory institutions and professional bodies, all of which constitute theeconomic, social and legal institutional framework within which developedcountry markets are embedded. In the absence of such a framework inemerging markets, conglomerate firms help fill this institutional void. Toillustrate, in the absence of trained managers and training institutions forsuch managers, business groups would often have in-house training centresfor their group managers. Tata in India, for example, has a world classtraining programme for all its group managers. Similarly, in view of themany imperfections of developing country capital markets, it is moreefficient for the business group’s central office to allocate capital directlythrough an appropriate internal allocative mechanism. Williamson (1975)is the classic reference on this subject.
In international trade, developing country corporations are at a seriouscompetitive disadvantage vis-à-vis those from developed countries. Thelatter have well-established brand names and huge advertising budgets thatconstitute enormous barriers to entry for developing country firms. Thebusiness group gives these firms an institutional means of at least partiallyovercoming this handicap. Instead of promoting brand names for particularproducts, as developed countries’ corporations do, those in emergingmarkets attempt to build the image and reputation for high quality of thebusiness group as a whole. Thus, the Samsung and Hyundai groups arepromoted – rather than single product lines – as a strategic response to themarket disadvantages which individual or unaffiliated developing countryfirms face. This has, arguably, been a major factor in the success of largeKorean conglomerates in the international market place. So much so thatby 1990 11 Korean firms were listed in Fortune magazine’s ranking of the

CORPORATE GOVERNANCE AND COMPETITION 41
world’s top 500 corporations, the same number as for Switzerland. Twentyyears earlier, there was not a single Korean company in the top 500.12
Amsden and Hikino (1994) have put forward a different kind ofargument to explain the existence and efficiency of privately-ownedbusiness groups in the late industrializing countries. They suggest that inthese countries, business group managers have become adept at choosing,purchasing and adapting relevant technologies from abroad, and that thiskind of expertise is not industry specific; rather, it can be used in manydifferent industries. Support for this hypothesis is provided by the man-agement agency system, which prevailed in India for almost 100 years.Under this system, teams specializing in modern management would offerto run firms on modern lines in different industries for a management fee.The system was ultimately abolished in India after independence, not ongrounds of inefficiency, but rather on grounds of equity; the system wasviewed as promoting monopoly power and at variance with India’s“socialistic” pattern of development. Many of the leading present-dayIndian business groups are direct descendants of the management agencysystem.
There are thus powerful analytical arguments for the existence,survival and efficiency of business groups in developing countries. In theabsence of appropriate institutions and markets, which have taken a longtime to develop, the dominant Anglo-Saxon strategies of “core competence”and “focus” are therefore unlikely to be suitable for business groups inemerging markets.
A. Empirical evidence
Turning now to empirical evidence, how do developing countrybusiness groups perform relative to unaffiliated firms? Are they so idio-syncratically diversified that, despite the reasons outlined above, they are,nevertheless, inefficient and need to be downsized or abolished altogether?Some empirical research on this issue is summarized in table 11. The tablecomes from Khanna and Yafeh’s (2000) careful and painstaking study of

AJIT SINGH, ALAKA SINGH AND BRUCE WEISSE42Ta
ble
11
GR
OU
P A
FFIL
IATI
ON
AR
OU
ND
TH
E W
OR
LD
Med
ian
stan
dard
Med
ian
stan
dard
Med
ian
size
Med
ian
ofM
edia
n of
devi
atio
n of
RO
A,de
viat
ion
of R
OA,
No.
of
of g
roup
RO
A of
gro
upR
OA
of u
n- g
roup
affi
liate
dun
affil
iate
dgr
oup
affil
iate
d fir
ms/
affil
iate
d fir
ms
affil
iate
d fir
ms
firm
sfir
ms
No.
of
affil
iate
dM
edia
n si
ze o
fC
ount
ryYe
arfir
ms
firm
sun
affil
iate
d fir
ms
(Per
cen
t)
Arge
ntin
a19
90–1
997
2511
5.53
3.95
7.78
**3.
674.
91**
Braz
il19
90–1
997
108
512.
503.
301.
85**
4.05
5.07
Chi
le19
89–1
996
225
5018
.71
5.93
2.2*
4.42
4.10
Col
ombi
a19
88–1
997
167
4.54
1.43
0.90
7.40
9.02
Indi
a19
90–1
997
5 44
61
821
4.37
11.7
39.
56*
4.65
4.37
*In
done
sia
1993
–199
523
615
32.
797.
317.
811.
932.
53*
Isra
el19
93–1
995
183
434.
995.
603.
904.
406.
80Ko
rea,
Rep
. of
1991
–199
542
721
83.
634.
855.
121.
882.
58*
Mex
ico
1988
–199
755
192.
298.
226.
084.
894.
92Pe
ru19
88–1
997
215
1.62
7.92
7.86
10.5
19.
98Ph
ilippi
nes
1992
–199
714
837
3.43
7.32
3.98
2.48
2.95
Taiw
an P
rov.
of C
hina
1990
–199
717
879
2.05
5.07
6.22
1.75
2.26
**Th
aila
nd19
92–1
997
415
258
2.33
2.90
4.41
*4.
324.
93**
Turk
ey19
88–1
997
4021
0.96
24.6
226
.32
12.5
212
.37
Vene
zuel
a19
88–1
997
112
1.45
3.68
4.60
6.11
3.90
*Pr
e-w
ar J
apan
1932
–194
358
176.
805.
506.
404.
407.
10Po
st-w
ar J
apan
1977
–199
21
002
948.
503.
413.
632.
232.
29
Sour
ce:
Kha
nna
and
Yaf
eh (2
000)
.N
ote:
The
tabl
e sh
ows
sum
mar
y st
atis
tics
on g
roup
ris
k an
d op
erat
ing
perfo
rman
ce fo
r fif
teen
em
ergi
ng m
arke
ts a
s w
ell a
s fo
r pr
e-an
d po
st-w
as J
apan
. Firm
num
bers
, as
wel
l as
stat
istic
s on
firm
siz
e (to
tal a
sset
s) a
nd m
edia
n re
turn
on
asse
ts (R
OA
) are
all
base
d on
the
year
for w
hich
we
have
max
imal
cov
erag
efo
r the
cou
ntry
in q
uest
ion.
Firm
s w
ith p
rofit
rate
s ab
ove
100
per c
ent o
r bel
ow -1
00 p
er c
ent a
re e
xclu
ded
from
the
anal
ysis
. In
pre-
war
s Ja
pan
grou
p af
filia
tion
refe
rs to
affi
liatio
n in
the
larg
est t
hree
zai
batz
u on
ly. I
n po
st-w
ar J
apan
, gro
up m
embe
rs a
re d
efin
ed a
s m
embe
rs o
f Pre
side
nts’
Clu
b on
ly. S
igni
fican
ce le
vels
for t
he c
ompa
rison
s of
med
ians
are
bas
ed o
n W
ilcox
on s
igne
d-ra
nk te
sts.
* de
note
s si
gnifi
canc
e at
5 p
er c
ent l
evel
and
**de
note
s si
gnifi
canc
e at
10
per c
ent
leve
l.

CORPORATE GOVERNANCE AND COMPETITION 43
business groups from 15 emerging markets. As the definition of whatconstitutes a business group differs between countries in this research, itis defined on the basis of local expert knowledge in each country.13 Thetable pertains to various periods in the 1980s and 1990s. It indicates thatin 9 out of 15 emerging markets, the average rate of return of the group-affiliated firms was greater than that of the unaffiliated firms. In 8 out of15 emerging markets, the average standard deviation of the rate of returnof the affiliated groups was smaller than that of their unaffiliated counter-parts. Nevertheless, only a few of the differences are statistically significant.Khanna and Yafeh (2000) conclude from this evidence that the “provisionof risk sharing, to compensate for underdeveloped capital markets, isprobably not the most important reason for the ubiquity of business groupsaround the world”.
Khanna (2000) provides a review of the empirical studies on theefficiency of business groups. He concludes:
... the existing evidence suggests that the performance effects of groupaffiliation are large and generally positive. There is substantial evidencethat part of this is due to welfare-enhancing functions originating in theidea that groups substitute for missing outside institutions, but that part isalso due to welfare-reducing minority shareholder exploitation. (p. 748)
The last clause in Khanna’s conclusion suggests that there are also negativeeffects of business groups. Specifically, these groups are known to exploitthe minority shareholders of their companies (see further Claessens,Djankov and Lang, 2000; and Johnson et al., 2000). However, notwith-standing anecdotal evidence about rent-seeking and monopolistic behaviourof business groups, there is very little systematic empirical evidence onthis subject.
B. Policy issues: chaebol reform in the Republic of Korea
The most important and immediate policy issues with respect to thebusiness groups in emerging markets arise in relation to the chaebolconglomerates in the Republic of Korea. Chaebol reform constituted an

AJIT SINGH, ALAKA SINGH AND BRUCE WEISSE44
important element in IMF conditionality for the Republic of Koreafollowing the Asian financial crisis of 1997–1998. Reforms involvedimprovements in corporate governance, greater focus, reducing the levelof diversification and reductions in the debt/equity ratio. This was envisagedto be a part of the structural reform of the corporate sector – from closerelationships between the Government, business and the banks, to an arm’s-length relationship between the three entities. After initially hesitating,the new Kim Dae Jung Government evidently supported these reforms(Krause, 2000).
The most serious criticism of the chaebol was that they had investedrecklessly in unprofitable projects on borrowed money. It is indeed truethat the top chaebol had, at the time of the crisis, high debt/equity ratios(see table 12). The top five chaebol had an average debt/equity ratio of458 per cent in 1997. Under the Government’s reorganization plan, thechaebol were required to reduce these ratios to 200 per cent by the end of1999.
It will be appreciated, in the light of the theoretical and empiricaldiscussions above, that the case for such reforms on the grounds ofeconomic efficiency is rather thin. As Khanna and Palepu (1999) noted,abolishing or restricting the chaebol may be inefficient in the absence of arange of market institutions that will take time to develop. There is also noreason to believe that the optimal debt/equity ratio for the top five chaebolsshould necessarily have been 200 per cent, rather than any other arbitrarynumber. Other countries with different financial systems than those of theUnited Kingdom and the United States also have high debt/equity ratios:for example, Norway has 500–538 per cent, Sweden has 555 per cent andFinland has 492 per cent. In Japan the debt/equity ratio in 1991 wasmeasured at 369 per cent, while in France and Italy it measured 361 percent and 307 per cent respectively. Moreover, there is reason to believethat the debt/equity ratios of United States corporations are rising as theyare buying up their own equity by borrowing money (The Economist, 2001).
However, as Singh (1998c) notes, the more significant point in relationto the high debt/equity ratios of the Korean chaebol is that these corporatefinancial arrangements were functional within the traditional Korean

CORPORATE GOVERNANCE AND COMPETITION 45
system. These arrangements were particularly useful during that country’sindustrialization drive, as the corporations were induced by the Governmentto enter into new technological areas involving huge risks. Left to them-selves, these corporations may not have been able to undertake such risks,but with the Government becoming, in effect, a co-partner through thebanking system, such technological risks were effectively “socialized”.However, this system became dysfunctional when the Government intro-duced financial liberalization and abolished economic planning in the early1990s in preparation for its membership of the OECD. By permitting Koreancompanies and banks to raise money abroad without the traditional super-vision and control, the authorities were unable to control – or even monitor– the rapid accumulation of short-term, foreign-currency-denominated debt.
Table 12
DEBT-EQUITY RATIOS OF KOREAN CHAEBOLS(Million won)
Company Total assets Debt Debt/equity ratio
Samsung 50 856.4 37 043.6 268.2Hyundai 53 183.7 43 319.3 439.1Daewoo 34 205.6 26 383.2 337.3Lucky-Goldstar 37 068.4 28 765.6 346.5Hanjin 13 904.5 11 787.7 556.9Kia 14 161.9 11 890.9 523.6Ssanyong 15 807.2 12 701.4 409.0Sunkyong 22 726.6 18 040.3 385.0Hanwha 10 967.7 9 718.8 778.2Daelim 5 793.3 4 586.5 380.1Kumho 7 398.0 6 117.9 477.9Doosan 6 402.0 5 594.0 692.3Halla 6 626.5 6 320.8 2 067.6Sammi 2 515.4 2 593.3 3 329.0Hyosung 4 124.4 3 252.8 373.2Hanil 2 628.1 2 231.8 563.2Dong-Ah Construction 6 287.9 4 905.8 355.0Kohap 3 653.6 3 123.6 589.4Jinro 3 940.5 3 865.2 8 598.7Dongkuk Steel 3 697.5 2 536.4 218.4
Source: Financial Times, 8 August 1997, reproduced in Singh (1998).

AJIT SINGH, ALAKA SINGH AND BRUCE WEISSE46
In this connection, it is interesting to note the case of India, since businessgroups there are also highly geared. However, despite the fact that India’sfundamentals were, if anything, weaker than those in the Republic of Korea,a crisis did not develop because the Government maintained strict controlson the foreign-currency exposure of the private sector. Thus, India’s limitedand deliberate move towards capital account convertibility lessened thevulnerability of the rupee to sudden shifts in investor sentiment and tospeculative attacks.
The empirical evidence in support of the popular view that businessgroups in developing countries must be drastically reformed, or evenabolished, is strikingly thin. In fact there remains theoretical and empiricalsupport for the view that large business groups play a key role in lateindustrialization by compensating for structural gaps in developing countrycapital, product and labour markets. Given the paucity of evidence andstudies in this area, it is appropriate to adopt a more cautious stance withregard to these groups than the current orthodox policy consensus allows.As Khanna notes in the conclusion to his study: “What seems clear is thatan extreme characterization of groups as purely socially harmful or purelysocially welfare enhancing appears unsupported by the evidence.” (Khanna,2000: 756).
It is also pertinent to point out that the charge that business groupsare large bureaucratic organizations which thwart innovation and smallfirm entry is not supported by analysis and evidence. On the contrary,Khanna and Palepu (1999) note that in the absence of specialized venturecapital firms, the business groups in emerging markets help fill thisinstitutional gap. Evidence from India – a country that has successfullydeveloped its information technology (IT) sector – suggests that the top25 Indian exporters and producers of IT were mostly offshoots of bigbusiness groups (Singh, Singh and Weisse, 2000).
Finally, in relation to corporate governance, the IMF’s view is thatthe chaebol should be restructured so as to maximize shareholder value,giving greater power to minority shareholders and increasing the repre-sentation of non-executive directors on the board – in other words, to makethem look more like Anglo-Saxon firms. However, Singh (1998c; 1999)

CORPORATE GOVERNANCE AND COMPETITION 47
and Chang and Park (2000) have argued that this is not the most desirablereform agenda, let alone the only possible one. An alternative reformstrategy is proposed by Singh (1999) which envisages building on the closerelationship between government, business and finance. It is suggestedthat in order to overcome the crisis, these relationships need to be strength-ened further rather than being abandoned. One way to do this would be toextend the government-business relationship to other social sectors,particularly labour and civil society. Such cooperative relationships withrespect to the governance of corporations and society at large are morelikely to help in the current crisis than arm’s-length relationships betweengovernment, business and labour. The latter have a tendency to degenerateinto adversarial relations during times of crisis, that can make the desiredchanges more difficult to achieve.
VIII. COMPETITION AND CORPORATE GOVERNANCE:THEORETICAL ISSUES
Milton Friedman (1953) long ago argued that if there were perfectcompetition in product markets, economists would not have to worry aboutproblems of separation of ownership and control in modern corporationsor about the associated problem of corporate governance. Natural selectionin a competitive market would ensure that only the profit maximizers –and by implication, only the optimal ownership patterns and corporategovernance structures – would survive. However, as Winters (1964) sub-sequently showed rigorously, if competition were imperfect, differentcorporate governance systems could coexist.
The debate then moved to the capital market. In seminal contributions,Alchian and Kessel (1962) and Manne (1965) argued that even if therewere imperfect competition in the product markets, firms would still beforced to maximize profit and adopt the optimal governance structures.Otherwise they would be subject to takeover from those willing to maximizemonopoly profits. The validity of this assertion depends on the existenceof a perfect capital market, including a market for corporate control. In theevent, although there have been huge merger waves during the last century

AJIT SINGH, ALAKA SINGH AND BRUCE WEISSE48
or more (specifically during the 1960s, 1980s and 1990s) in the Anglo-Saxon economies, these have not fulfilled the requirement of a perfectmarket for corporate control. As noted earlier in Section VI, this marketsuffers from fundamental imperfections: it is much easier for a large andprofitable firm to take over a small profitable firm than the other way round.This hypothesis is confirmed by empirical evidence which suggests that inthe real world, the probability of survival for a large unprofitable firm issignificantly higher than it is for a smaller, relatively profitable firm.
In the light of these difficulties with the market for corporate control,the wheel has turned full circle. It is now being suggested that the mainconstraint on the behaviour and governance structure of the large cor-porations is the intense international competition in product markets.Nevertheless, neoclassical economists now recognize that in view of theoligopolistic nature of product-market competition and imperfections inthe market for corporate control, there does exist a governance problem inthe modern corporation: this is modelled in the form of a principal-agentproblem (Jensen and Meckeling, 1976; Jensen, 1988). In this conception,the separation of ownership and control imposes agency costs on thecorporation. The magnitude of this cost varies inversely with the natureand extent of the competition in the product and capital markets. As therelevant aspects of the market for corporate control has already beenexamined, above and in Section VI, we turn now to a discussion of thenature and extent of competition, including international competition, inemerging markets.
IX. PRODUCT-MARKET COMPETITIONIN EMERGING MARKETS
Apart from its significance for the study of corporate governance, itis also important to examine product-market competition in emergingmarkets for other, more practical, reasons. These relate to new developmentsduring the last two decades in the international economy and in the domesticeconomies of developing countries. The implications of these developmentsfor the competitive behaviour of firms and for the intensity of competition

CORPORATE GOVERNANCE AND COMPETITION 49
in emerging markets will be discussed in this section, and those forcompetition policy will be taken up in the next discussion.
(i) There has been a worldwide trend towards privatization of Stateindustry and deregulation that was initiated in the United Kingdomduring the 1980s by former Prime Minister Margaret Thatcher. Theprivatized firms in many of the emerging markets often involve naturalmonopolies. It is therefore important to find out how competition andcompetitive behaviour has changed as a result of the privatization offormer State-owned monopolies and other publicly-owned enterprises.
(ii) The international economy under globalization and liberalization hasbeen subject to a gigantic international merger wave during the lastdecade. There have been large merger waves before in developed coun-tries that have occurred simultaneously in several countries (e.g. themerger wave of the late 1960s), but generally these have not involvedany significant amount of cross-border takeovers. However, the currentmerger wave in the United States and the United Kingdom (the twocountries with the best historical statistics on this subject) is not onlylikely to be the largest ever recorded, in terms of the total value of thecorporation acquired (suitably adjusted for inflation and the size ofGDP), but it also has, for the first time, a large cross-border component.
The cross-border M&A activity has mainly involved corporations indeveloped countries. Nevertheless, there has been considerable M&Aactivity in emerging markets as well (see tables 13a and 13b). The activitieshave mainly involved foreign multinationals (the domestic market forcorporate control in emerging markets is typically very small, if not non-existent). These takeovers by foreign multinationals in emerging marketshave direct implications for the competitive behaviour of firms, and hencefor competition policy. As noted earlier, even the merger activity indeveloped countries has potential consequences for competition andcompetition policy in emerging markets.
Notwithstanding the significance of the subject, there is very littlesystematic information available on the intensity of competition in emergingmarkets on an international comparative basis. There are anecdotal evidence

AJIT SINGH, ALAKA SINGH AND BRUCE WEISSE50
Table 13b
SALES OF CROSS-BORDER M&As IN THE FIVE ASIAN COUNTRIES MOSTAFFECTED BY THE FINANCIAL CRISIS, BY SECTOR, 1990–1999
Sector/industry 1990 1995 1996 1997 1998 1999
Primary 15 76 3 367 146 47Secondary 54 457 935 5 134 5 087 8 125Tertiary 102 1 935 1 619 807 5 633 6 547Total 171 2 468 2 558 6 308 10 866 14 719
Source: UNCTAD (2000).
Table 13a
CROSS-BORDER M&As:a SALES AND PURCHASES, 1998–1999
($ billion)
Sales Purchases
Region/economy 1998 1999 1998 1999
Developed countries 445.1 644.6 511.4 677.3
European Union 187.9 344.5 284.4 497.7United States 209.5 233.0 137.4 112.4Japan 4.0 15.9 1.3 9.8
Developing countries 80.7 63.4 19.2 41.2
Africa 0.7 0.6 0.2 0.4Latin American and the Caribbean 63.9 37.2 12.6 24.9Europe . 0.3 . .Asia 16.1 25.3 6.4 15.9Pacific . 0.1 . .
Central and Eastern Europeb 5.1 10.3 1.0 1.6
Worldc 531.6 720.1 531.6 720.1
Source: UNCTAD, FDI/TNC databasea Cross-border M&As that result in the acquisition of more than 10 per cent equity share.b Includes the countries of the former Yugoslavia.c Includes amounts which cannot be allocated by region.
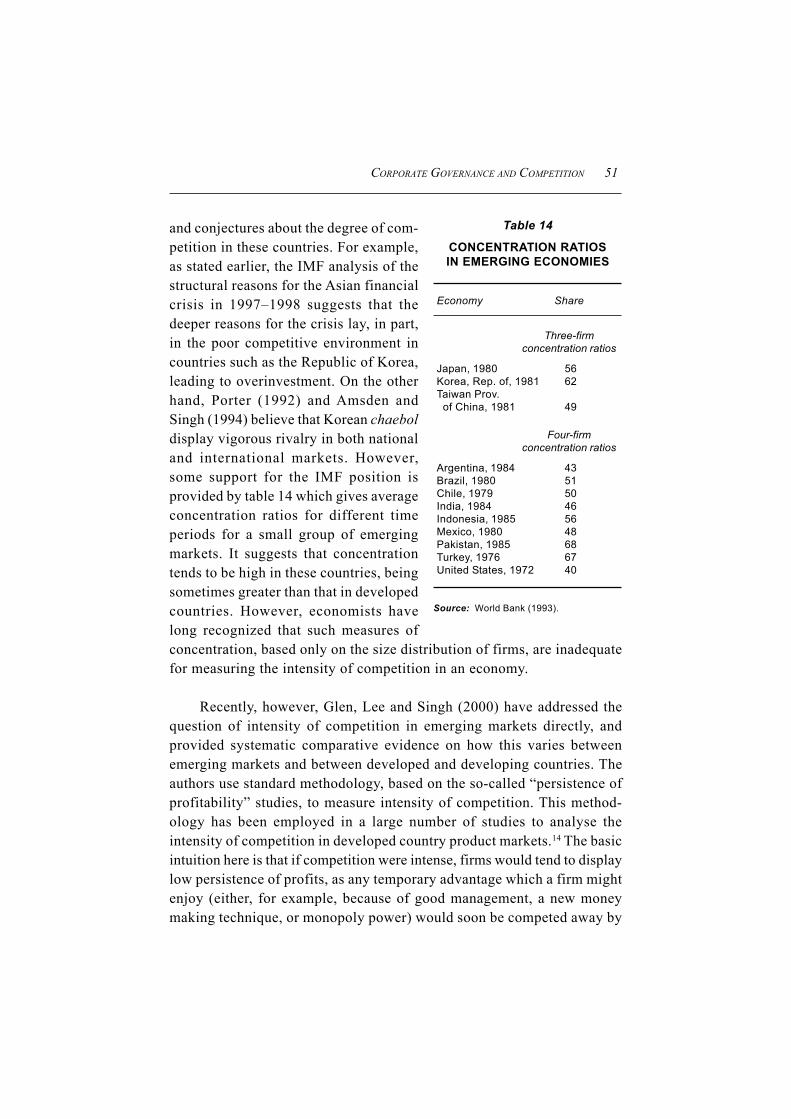
CORPORATE GOVERNANCE AND COMPETITION 51
and conjectures about the degree of com-petition in these countries. For example,as stated earlier, the IMF analysis of thestructural reasons for the Asian financialcrisis in 1997–1998 suggests that thedeeper reasons for the crisis lay, in part,in the poor competitive environment incountries such as the Republic of Korea,leading to overinvestment. On the otherhand, Porter (1992) and Amsden andSingh (1994) believe that Korean chaeboldisplay vigorous rivalry in both nationaland international markets. However,some support for the IMF position isprovided by table 14 which gives averageconcentration ratios for different timeperiods for a small group of emergingmarkets. It suggests that concentrationtends to be high in these countries, beingsometimes greater than that in developedcountries. However, economists havelong recognized that such measures ofconcentration, based only on the size distribution of firms, are inadequatefor measuring the intensity of competition in an economy.
Recently, however, Glen, Lee and Singh (2000) have addressed thequestion of intensity of competition in emerging markets directly, andprovided systematic comparative evidence on how this varies betweenemerging markets and between developed and developing countries. Theauthors use standard methodology, based on the so-called “persistence ofprofitability” studies, to measure intensity of competition. This method-ology has been employed in a large number of studies to analyse theintensity of competition in developed country product markets.14 The basicintuition here is that if competition were intense, firms would tend to displaylow persistence of profits, as any temporary advantage which a firm mightenjoy (either, for example, because of good management, a new moneymaking technique, or monopoly power) would soon be competed away by
Table 14
CONCENTRATION RATIOSIN EMERGING ECONOMIES
Economy Share
Three-firmconcentration ratios
Japan, 1980 56Korea, Rep. of, 1981 62Taiwan Prov. of China, 1981 49
Four-firmconcentration ratios
Argentina, 1984 43Brazil, 1980 51Chile, 1979 50India, 1984 46Indonesia, 1985 56Mexico, 1980 48Pakistan, 1985 68Turkey, 1976 67United States, 1972 40
Source: World Bank (1993).

AJIT SINGH, ALAKA SINGH AND BRUCE WEISSE52
rivals. On the other hand, if thecompetition were not so intense,then those with above averageprofits in one period would con-tinue to have above averageprofits in subsequent periods.
Glen, Lee and Singh havecarried out a time series analysisof profitability for 350 emergingmarket corporations in sevencountries. Their estimated per-sistency coefficients are reported
in table 15. The corresponding coefficients for developed countries, basedon the same methodology, are reported in table 16. A comparison of thetwo tables reveals that, remarkably, the persistency coefficients in emerg-ing markets are systematically lower than those for developed countries.This result is quite unexpected as many economists would assume, a pri-ori, that emerging markets will have less intense market competition thandeveloped countries. Laffont (1999), for example, argues that developingcountry markets are likely to be highly imperfect because of their smallsize, lack of transportation and other infrastructural deficits.
Glen, Lee and Singh argue that their results may be counter-intuitivebut not implausible. Economists have had similar preconceptions aboutcompetition in Japan, which was thought to be less intense than in theUnited States manufacturing industry. However, systematic empiricalresearch has indicated that, in fact, this is not the case; it is true that UnitedStates retailing is more efficient than Japanese retailing, but wholesalemanufacturing goods markets, if anything, display greater intensity ofcompetition in Japan than in the United States. More importantly, Glen,Lee and Singh’s conclusion on the intensity of competition in emergingmarkets is fully in accord with evidence presented in a comprehensivereview article on the efficiency of the third world manufacturing sector byTybout (2000). He observes:
The manufacturing sectors of developing countries have traditionally beenrelatively protected. They have also been subject to heavy regulation, much
Table 15
MEAN VALUES OF λλλλλ , YLR AND 22
Mean λ Mean YLR Mean 22
Brazil 0.013 0.003 0.418India 0.229 0.003 0.282Jordan 0.348 0.050 0.299Korea, Rep. of 0.323 0.005 0.300Malaysia 0.349 0.009 0.302Mexico 0.222 -0.002 0.316Zimbabwe 0.421 0.157 0.249
Source: Glen, Lee and Singh (2000).

CORPORATE GOVERNANCE AND COMPETITION 53Ta
ble
16
PER
SIST
ENC
E O
F PR
OFI
TAB
ILIT
Y ST
UD
IES
FOR
IND
UST
RIA
L C
OU
NTR
IES
Sam
ple
Obs
erva
tions
Num
ber
Sam
ple
mea
nAu
thor
Cou
ntry
perio
dpe
r firm
of f
irms
(Lam
da [i
])
Ger
oski
and
Jac
quem
in (1
988)
Uni
ted
King
dom
1947
–197
729
510.
488
Fran
ce19
65–1
982
1855
0.41
2G
erm
any
1961
–198
121
280.
410
Schw
alba
ch e
t al.
(198
9)a
Ger
man
y19
61–1
982
2229
90.
485
Mue
ller (
1990
)U
nite
d St
ates
1950
–197
223
551
0.18
3
Cub
bin
and
Ger
oski
(199
0)U
nite
d Ki
ngdo
m19
48–1
977
3024
30.
482
Khem
ani a
nd S
hapi
ro (1
990)
Can
ada
1964
–198
219
129
0.42
5
Oda
giri
and
Yam
awak
i (19
90)
Japa
n19
64–1
982
1937
60.
465
Scho
hl (1
990)
bG
erm
any
1961
–198
121
283
0.50
9
War
ing
(199
6)c
Uni
ted
Stat
es19
70–1
989
2012
986
0.54
0
Sour
ce:
God
dard
and
Wils
on (1
999)
.a
Bas
ed o
n no
min
al p
rofit
on
capi
tal,
befo
re ta
x.b
Est
imat
ions
are
for i
ndus
try g
roup
s. E
stim
ates
of l
amda
are
from
a ra
nge
of s
peci
ficat
ions
for t
he p
ersi
sten
ce m
odel
, whi
ch d
iffer
acr
oss
indu
strie
s.c
Est
imat
e ba
sed
on p
oole
d da
ta fo
r 128
indu
stry
gro
ups.
The
mea
n la
mda
has
bee
n es
timat
ed b
y th
e pr
esen
t aut
hors
from
the
data
in ta
ble
3 of
War
ing
(199
6).

AJIT SINGH, ALAKA SINGH AND BRUCE WEISSE54
of which is biased in favour of large enterprises. Accordingly, it is oftenargued that manufacturers in these countries perform poorly in severalrespects: (1) firm productivity dispersion is high; (2) small groups of en-trenched oligopolists exploit monopoly power in product markets; and(3) many small firms are unable or unwilling to grow, so important scaleeconomies go unexploited.
It is important to emphasize that these remarks about the unexpectedlyhigh intensity of competition in emerging markets apply only to themanufacturing sector. Sectors such as banking and retailing are much lessefficient in emerging markets than in developed country markets. Tyboutconcludes:
Indeed, although the issue remains open, the existing empirical literaturedoes not support the notion that LDC manufacturers are relatively stag-nant and inefficient. Turnover rates in plants and jobs are at least as high asthose found in the OECD and the amount of cross-plant dispersion in meas-ured productivity rates is not generally greater. Also, although small-scaleproduction is relatively common in LDCs, there do not appear to be majorpotential gains from better exploitation of scale economies.
X. DEVELOPING COUNTRIES, THE WORLD TRADEORGANIZATION AND COMPETITION POLICY
Apart from their effects on the intensity of competition in emergingmarkets, the new national and international developments detailed in theprevious section also have important implications for competition policy.Even though we have found that product market competition is no lessintense in developing than in developed countries, this does not obviatethe need for a competition policy. Such a policy is required in developingcountries today, not least to counter the potential anti-competitive impactof mergers and acquisitions by large multinationals, both within developingcountries and worldwide.
Many developing countries do not have a competition policy, and, sofar, have not needed one, mainly because of State control of economic
CORPORATE GOVERNANCE AND COMPETITION 55
activities and regulation of various markets. Many governments had thepowers to use direct price controls to restrain monopoly power if necessary.But now, with extensive privatization, a much diminished State sector andderegulation, it is clearly necessary for developing countries to have somepolices to regulate anti-competitive behaviour. The main question is whatkind of competition policy is appropriate for these countries? Should theyadopt the same kind of competition laws as those implemented in the UnitedStates or the United Kingdom? Or should competition policies of developingcountries be different from those of developed countries?
At the World Trade Organization (WTO), developed countries havebeen pressing developing countries to include competition policy in WTOagreements in order to ensure “fair play” and “level playing fields” betweencountries. The argument is simple: if one country allows mergers freelywhile another has a competition policy prohibiting monopoly-creatingmergers, there would not be “fair” competition between firms in the twocountries. This will lead to both a global misallocation of resources andunfair competition between firms in the two countries.15 Most developedcountries have a competition policy of one kind or another, and in theircase it is a matter of harmonizing such policies so that free trade and freecapital flows between countries are unimpeded.
Developing countries have been opposed to the proposal thatcompetition policy should become a part of the WTO disciplines. Theirformal stance has been that since a large number of them do not yet have acompetition policy, whereas developed countries have experience with suchpolicy (some of them for the last 100 years), they cannot be expected toenter into negotiations in an area about which they have little knowledge.The real reason for developing country opposition is that they are againstany new disciplines being included in the WTO agreements because of theprovision of cross-sanctions: a violation in one area may be penalized inanother area by the complaining country (if the complaint is held to bejustified). Developing countries take the view that the Uruguay RoundAgreements, that established the WTO, need to be reviewed for their impacton developing countries before undertaking a new round of tariff cuttingor starting negotiations on new subjects such as competition policy and amultilateral agreement on investment (MAI).
AJIT SINGH, ALAKA SINGH AND BRUCE WEISSE56
As the subject of MAI has been examined elsewhere,16 we confineourselves in this paper to the question of competition policy. At theSingapore Ministerial Meeting of the WTO in 1996, a compromise wasstruck whereby it was agreed that competition policy would be examinedby a study group without prejudice to any future negotiations. It was togive particular attention to the development dimension of competitionpolicy. The term of the study group, duly established at the WTO to examinethe matter, was extended at the Seattle meeting in 1999. Notwithstandingthe justified misgivings of developing countries with respect to anynegotiations on the subject at the WTO, it is important for them to acquirean understanding of the important issues involved in this area, and beprepared to offer counter proposals when appropriate.
The question of competition policy in developing countries is beingstudied not only at the WTO but also by a number of other organizations,including the United Nations Conference on Trade and Development(UNCTAD), the World Bank and the Commonwealth Secretariat. Con-sequently, there is a considerable and growing body of literature on thesubject but, with a few exceptions, much of it is unsatisfactory as it doesnot take into account the development dimension (despite claims to thecontrary).
Singh and Dhumale (1999) provide a trenchant critique of the docu-ments generated by the WTO study group in relation to the developmentdimension. They argue that for adequate recognition of this aspect ofcompetition policy, it is not enough merely to give developing countriesmore time to adjust; rather, new concepts and definitions are needed. TheWTO concepts and rules relating to market access, reciprocity and nationaltreatment appear to be inappropriate for economic development. Spe-cifically, the authors note that the main objective of competition policy indeveloped countries such as the United States is promotion of consumerwelfare. For developing countries, on the other hand, a more appropriateobjective would be to achieve sustained and substantial increases in thetrend rate of growth of productivity. Such an objective was pursued inJapan during the period 1950 to 1973. That country, at the start of theperiod, had a level of per capita income similar to that of many developingcountries today, but it attained exceptionally high growth in the subsequent

CORPORATE GOVERNANCE AND COMPETITION 57
two decades. The Japanese experience of this earlier post-Second WorldWar era with respect to competition and industrial policy is particularlyuseful for developing countries.
Promotion of high rates of growth of productivity necessitates highrates of investment, which, in turn, in a mixed economy, requires main-taining the private sector’s propensity to invest. Singh and Dhumale showthat this needs an optimal degree of competition rather than maximumcompetition. They emphasize, in the case of developing countries, thatkeeping the private sector’s propensity to invest at high levels requires asteady growth of profits. This necessitates government coordination ofinvestment decisions to prevent overcapacity and falling profits. The authorstherefore outline the concept of an optimal combination of competitionand cooperation to achieve fast long-term growth. They also introduce theconcept of simulated competition (i.e. contests for State support), whichcan be as powerful as real market competition.
Singh and Dhumale add that these concepts are new only in relationto the current discourse on the subject at the WTO and other internationalorganizations. The concepts are derived from modern economic theory andhave been tested by empirical evidence. Interestingly, some of them havebeen used in the WTO Agreements themselves, but usually to benefit richrather than poor countries. For example the Agreement on Trade-RelatedAspects of Intellectual Property Rights (TRIPs) allows temporary restrainton free competition in order to promote technical progress. However, theextra patent protection provided under this WTO Agreement benefits mainlyrich countries who hold or produce most of the world’s patents. At onelevel, all that Singh and Dhumale do is to apply such concepts to theadvantage of developing countries in order to promote their economicdevelopment.
To sum up, there are two important implications following from theabove analysis which deserve emphasis. First, developing countries do needa competition policy, but that policy needs to be specific to the relevantstage of a country’s development. Secondly, there is a need for special anddifferential treatment of developing countries in relation to competitionpolicy. This is required in order to truly “level the playing field” in an
AJIT SINGH, ALAKA SINGH AND BRUCE WEISSE58
operational sense. Even large, developing country firms tend to be relativelysmall and handicapped by the many deficits that arise from economicunderdevelopment as compared to the large TNCs from developed coun-tries. In these circumstances, instead of “national treatment” of foreignTNCs, a developing country’s competition authority may prohibit takeoversby such companies operating in the country and yet allow domestic firmsto amalgamate in order to compete better against the larger multinationals.In this instance, non-national treatment may serve both competition andeconomic development.
However, even the development-friendly competition policy sketchedout above may not be adequate to cope with the potential anti-competitiveeffects of the current international merger wave. For this, ideally, aninternational competition authority needs to be able to prevent abuse of adominant position by large multinational firms and other anti-competitionbehaviour. This is needed because even a developed country such as theUnited States, with all its competition laws and extra-territoriality, is unableto prevent price fixing by international cartels. Not too long ago, a Europeancartel of vitamin producers was fined three quarters of a billion dollars forillegally fixing (high) prices. If this can happen to the United States, thereis little to prevent cartelization by subsidiaries of multinational companiesin developing countries and their engaging in similar activities. In the absenceof an international competition authority, which the developed countriesare not yet prepared to accept, developing countries would be better offdealing with anti-competitive behaviour of large multinationals collectivelythrough regional organizations, rather than on an individual basis.17
XI. SUMMARY AND CONCLUSIONS
This study has examined analytical, empirical and policy issuesrelating to corporate governance and competition policy, subjects ofparticular concern for developing countries. These subjects are not currentlyhigh on the agenda of most of these countries, although they are beingconsidered by several international bodies including the WTO, the WorldBank and the OECD in the context of proposals for a new international
CORPORATE GOVERNANCE AND COMPETITION 59
financial architecture and a new liberalized trading system. These inter-national organizations, however, do not always act in the interests ofdeveloping countries. The latter therefore need independent analyses ofthese issues so as to be able to properly assess the proposed reforms fromtheir own perspective and, when necessary, offer alternative proposals. Themain purpose of this paper has been to provide such an independent assess-ment and to raise awareness among developing countries about these issues.
The principal conclusions on corporate governance may be sum-marized as follows:
(i) The main premise of the IMF and leading United States officials, thatthe deeper causes of the Asian crisis were the flawed systems ofcorporate governance and a poor competitive environment in theaffected countries, is not supported by the evidence. The availablefacts are much more in accord with the alternative thesis, that thefundamental reason for the crisis was the precipitous capital accountliberalization that a number of these countries had carried out in theperiod preceding the crisis.
(ii) Despite claims to the contrary, the system of corporate governancefavoured by the OECD and World Bank is the arm’s-length modelfound in the United States and the United Kingdom. The codes ofbest practice and the self-assessment exercises reflect this preference,and it is thus likely to form the basis of these organizations’ advice todeveloping countries, especially when conditionality is imposed intimes of crisis.
(iii) The arm’s-length model of the relationship between businesses, banksand the government, as found in its ideal form in the United Statesand the United Kingdom, is deeply embedded in Anglo-Saxonjurisprudence and corporate law. It is particularly suitable for the Berleand Means corporate law pattern of dispersed-share ownershiptypically observed in large corporations in these countries. The Berleand Means corporation has specific governance problems, derivingfrom the separation of ownership and control. These lead to the well-known problematique of the principal-agent relationships between

AJIT SINGH, ALAKA SINGH AND BRUCE WEISSE60
shareholders and managers, involving agency costs, asymmetricinformation and incomplete contracting.
However, the Berle and Means pattern of ownership is by far theexception in developing countries and in much of continental Europe.In these countries, the most prevalent form of ownership is familycontrol. Corporate governance issues for large firms in these countriesare, therefore, quite different from those of Anglo-Saxon economies.Family-based systems of corporate governance are often associatedwith relationship banking. There is no reason to believe, a priori, thatsuch systems are necessarily inferior to the arm’s length, stock-market-based Anglo-Saxon model. Both have positive and negative features.To the extent that the former systems are better able to resolve agencyproblems and suffer much less from the short-termism and speculativebubbles of the stock-market-based model, they are arguably moreconducive to the long-term economic development of emergingcountries. Empirical evidence suggests that emerging markets, aswell as European countries such as Italy, Sweden or Germany, havesuccessful records of fast long-term growth with these systems thatare indeed superior to those of the Anglo-Saxon countries.
(iv) However, in the wake of the Asian financial crises, family-basedcorporate control systems have been associated with crony capitalism,measured in one important sense in terms of the control of a largeproportion of national wealth by a small number of corporate families.Whether such crony capitalism leads to moral hazard and economicinstability, or instead helps resolve coordination problems ubiquitousin a market economy, is pre-eminently an empirical question.Empirical evidence presented in this paper indicates that there is norelationship between crony capitalism and the Asian economic crisis.Countries both with and without a high incidence of crony capitalismexperienced the crisis. Similarly, there are examples of both kinds ofcountries that escaped the crisis.
(v) The theoretical foundations of the OECD/World Bank proposals canbe found in the contributions of LLSV. The basic proposition of theLLSV approach is that the legal protection afforded to investors

CORPORATE GOVERNANCE AND COMPETITION 61
(primarily minority shareholders) determines the availability ofexternal finance. If minority shareholders are protected, externalfinance will become more prevalent, which will have beneficial effectson investment and, ultimately, on growth. The LLSV studies are animportant contribution to our knowledge of legal systems and corporategovernance structures and their relation to financing and growth.However, it is argued in this study that LLSV’s conclusions areoverstated. In particular, it is argued that the approach is far too narrowto adequately capture the changes taking place in corporate financein developing countries; furthermore, the legal structure and corporatefinance jointly interact, and the direction of causality is not simplyfrom the former to the latter. The LLSV approach also elevatesshareholders and creditors above other stakeholders in the firm andrelegates other important relationships (such as the relationshipsbetween workers and management and suppliers and the firm) tosecondary status.
(vi) Corporate finance patterns in developing countries in the 1990s werebroadly similar to those in the 1980s in a number of important aspects.Large developing country firms continued to rely overwhelmingly onexternal sources to finance their growth of total assets. Contrary tothe “pecking order” theory, many of these large firms financed moreof their growth through issuance of equity on stock markets thanthrough retained profits. Stock markets have thus helped large firmsto raise considerable amounts of external finance, but whether thishas led to higher national saving rates is unclear. The effects of stockmarket development on corporate governance and developmentdepends on two market processes: (a) the nature and efficiency of thetakeover mechanism, and (b) that of the pricing process. This paperhas argued that there is a wealth of evidence that the latter is oftendominated by speculation, herding and fads that undermine its capacityto efficiently direct allocation of resources. It has also suggested thatthe takeover mechanism is inherently flawed and is an expensivemethod of changing corporate governance. Furthermore, it has pointedout that the inadequacies and perverse incentives in both the pricingprocess and the takeover mechanism are likely to be greater indeveloping countries.

AJIT SINGH, ALAKA SINGH AND BRUCE WEISSE62
(vii) In the wake of the Asian crisis, it had been argued that developingcountry conglomerates are inefficient, financially precarious and,because they are “too big to fail”, create moral hazard. The analysisin this paper indicates that, on the contrary, conglomerates are in factan efficient response to the inadequacies in developing country labour,capital and product markets. Far from being inefficient, conglomerateshave been instrumental in overcoming market imperfections andpromoting industrialization. The high leverage of developing countryconglomerates was shown to be not out of line with that of manyfirms in developed country markets, and, given the ambiguities ofwhat constitutes the “optimal” debt/equity ratio, it is difficult to saythat it is necessarily too high. The conglomerates’ difficulties withdebt during the Asian crisis arose from their unmonitored anduncontrolled exposure to short-term external credit rather than fromtheir high debt-equity ratios per se. These elements – governmentmonitoring and control of capital movements – which were central tothe traditional State-guided economic systems in these countries hadbeen abandoned and, as noted earlier, replaced by capital accountliberalization in the period immediately preceding the crises.
(viii) Apart from poor corporate governance, it has been argued thatinadequate competition between large firms in developing countrymarkets was a contributing “deep” reason for the Asian crisis.However, empirical evidence examined in this paper suggests thatthis preconception is also greatly at variance with facts. A comparativeanalysis of the relative persistence of corporate rates of return inemerging markets and in developed economies indicates that theformer displayed lower profits persistency than the latter. This suggeststhat product market competition is no less intense in emerging marketsthan in developed economies, and thus subjects developing countrymanagers to market discipline.
(ix) This paper suggests that despite the competitive environment, de-veloping countries must develop effective competition policies becauseof (a) extensive privatization of State-owned enterprises, includingnatural monopolies; and (b) the current huge international mergerwave. The latter imposes important new challenges to developing

CORPORATE GOVERNANCE AND COMPETITION 63
countries, both to protect themselves from the potentially anti-competitive behaviour of mammoth multinationals and to providespace for their own national firms to grow. In the face of mergersbetween huge multinationals, even developed countries have had toenforce competition policies more diligently. The merger betweenMcDonnell-Douglas and Boeing compelled the European Unioncompetition authorities to intervene, while the cornering of the UnitedStates vitamin market by a European cartel obliged that country’sauthorities to enforce competition by imposing the largest ever anti-trust fine of three-quarters of a billion dollars on the cartel members.Given that large developed economies can be subject to such actualor potential anti-competitive behaviour, smaller and more opendeveloping countries are far more vulnerable.
(x) However, contrary to the approach being advanced by the WTO,which would allow no special or differential treatment of developingcountries, this paper argues that from the perspective of economicdevelopment, these countries must be allowed to tailor their compe-tition policy to suit their specific circumstances. In particular, theyshould not be compelled to extend national treatment to multinationalenterprises, since the presence of these huge concerns in developingcountries may reduce competition by driving smaller nationalcompetitors from the market. The United States model of competitionpolicy stresses maximum competition; whereas the optimal policy fordeveloping countries should contain a more subtle blend of competitionand cooperation.
In sum, this paper has argued that there is a diversity of corporategovernance systems that have proved effective in different nationalcontexts. The continental Europeans and the Japanese have prospered withalternative corporate governance systems that have given a larger voice tostakeholders in the firm and have afforded relatively less protection tooutside investors. The system of corporate governance in the United Statesand the United Kingdom is clearly not the only way to effectively andefficiently run the corporate economy and, indeed, for developing countriesit is far from being the best way. Its reliance on the stock market, andconsequently, on that market’s pricing process and takeover mechanism

AJIT SINGH, ALAKA SINGH AND BRUCE WEISSE64
creates perverse incentives that can undermine long-term growth byaccentuating the influence of short-term considerations.
In place of a drive by international organizations to promote the Anglo-Saxon system of corporate governance around the world, there is need fora genuine recognition that there are many competing systems of corporategovernance and it must be left to developing countries to decide whichone is optimal for their particular circumstances. Above all, an analysis isneeded of corporate governance structures underpinned by a solid factualunderstanding of these systems in economic development. This should befree of the ideology and prejudice that reflexively argues that conglomeratesare bad, that competition in developing markets is inadequate and thatany corporate governance system other than the Anglo-Saxon model isintrinsically flawed.

CORPORATE GOVERNANCE AND COMPETITION 65
APPENDIX
Following is a summary of the set of Principles of Corporate Gov-ernance laid out by the OECD and quoted from Iskander and Chamlou(2000):
• The rights of shareholders (and others) to receive relevant informationabout the company in a timely manner, to have the opportunity toparticipate in decision concerning fundamental corporate changes, andto share in the profits of the corporation, among others. Markets forcorporate control, should be efficient and transparent, and share-holders should consider the costs and benefits of exercising their votingrights.
• Equitable treatment of shareholders, especially minority and foreignshareholders, with full disclosure of material information and prohi-bition of abusive self-dealing and insider trading. All shareholders ofthe same class should be treated equally. Members of the board andmanagers should be required to disclose any material interest intransactions.
• Recognition of the role of stakeholders in corporate governance, asestablished by law. The corporate governance framework shouldencourage active co-operation between corporations and stakeholdersin creating wealth, jobs and financially sound enterprises.
• Timely and accurate disclosure and transparency on all mattersmaterial to company performance, ownership, and governance andrelating to other issues such as employment and stakeholders. Financialinformation should be independently audited and prepared to highstandards of quality.
• The responsibilities of the board for the strategic guidance of thecompany, the effective monitoring of management, and accountingability to the company an shareholders.

AJIT SINGH, ALAKA SINGH AND BRUCE WEISSE66
NOTES
1 See, for example, Confederation of Indian Industry (1998).2 Note that control is defined as a 20 per cent or higher share of equity.3 See also the discussion in the next section, and Amsden (1989; 2000).4 La Porta, Lopez-de-Silanes, Shleifer and Vishny 1997; 1998; 1999; and 2000.5 For a comparison of growth rates in developed economies, see Maddison (1991); the
comparison above was based on Maddison, table 3.1, page 49. French growth over theperiod 1870–1989 was 1.8 per cent (annual average compound growth rate), whichcompares favourably with that of the United Kingdom (1.4 per cent) and the UnitedStates (1.8 per cent).
6 For a fuller discussion of these measurement biases, see Whittington, Saporta and Singh(1997).
7 Graham and Dodd, in their classic work on security analysis noted that “The stockmarket is a voting machine rather than a weighing machine.” (Graham, 1934: 452).
8 See collection of studies in Porter (1992).9 Of course, there is also a positive feedback loop between the two markets, with higher
stock market valuations leading to capital inflows and an appreciating exchange rate. Itis thus possible that a stock market bubble will lead to an overvalued real exchangerate, which, in turn, affects the competitiveness of the tradable sector.
10 See further Ravenscraft and Scherer (1987) on this point.11 This is Guy Pfefferman’s phrase. See Singh (1995a).12 See further Amsden and Hikino (1994); and Singh (1995b)13 In some countries, business groups are organized along the lines of holding companies
(i.e. the leading company, either directly or through pyramiding, holds a controllingequity stake in the affiliated company). In other countries, the affiliated companies arenot bound by large equity stakes, but more by social ties, ethnic origin or firm history(such as the Japanese keiretsu). For a fuller discussion, see Khanna (2000).
14 The classic references here are Mueller (1986) and Mueller (ed.) (1990), the latter com-prising a collection of studies for a large number of developed economies. See alsoWaring (1996) and Goddard and Wilson (1999).
15 Such unfair competition may be ameliorated by a strict enforcement of “national treat-ment”, which is not always observed even in developed countries.
16 For a discussion of MAI see Singh and Zammit (2000).17 An early international “initiative” in this area was the discussion of restrictive business
practices by large multinationals at UNCTAD II in New Delhi in 1968 and at UNCTADIV in Nairobi in 1976. The United Nations General Assembly, in December 1980,adopted, by Resolution 35/63, a “set of Multilaterally Agreed Equitable Principles andRules for the Control of Restrictive Business Practices”. However, this is not a legallybinding document and has not been helpful to developing countries (see Correa, 1999).
CORPORATE GOVERNANCE AND COMPETITION 67
REFERENCES
Alchian AA and Kessel RA (1962). Competition, monopoly and the pursuit of pecuniary gain.Aspects of Labour Economics. Princeton, National Bureau of Economic Research.
Amsden A (1989). Asia’s Next Giant: South Korea and Late Industrialization. New York,Oxford University Press.
Amsden A (2000). The rise of “the rest”: Challenges to the West from late-industrializingeconomies. Oxford, Oxford University Press.
Amsden A and Hikino T (1994). Project executive capability, organisational know-how andconglomerate corporate growth in late-industrialisation. Industry and Corporate Change,3 (1): 111–147.
Amsden A and Singh A (1994). The optimal degree of competition and dynamic efficiency inJapan and Republic of Korea. European Economic Review, 38 (3/4): 941–951.
Berglof E and von Thadden L (1999) The changing corporate governance paradigm: Implica-tions for transition and developing countries. Unpublished Working Paper, StockholmInstitute of Transition Economics, Stockholm, Sweden.
Berle A and Means G (1933). The Modern Corporation and Private Capital. New York,Macmillan.
Bhide A (1993). The hidden cost of stock market liquidity. Journal of Financial Economics,34: 31–51.
Camdessus M (1998). Speech to Transparency International reported in IMF Survey, Wash-ington, DC, International Monetary Fund, 9 February 1988.
Chandler AD (1977). The Visible Hand: The Managerial Revolution in American Business.Cambridge, MA, Harvard University Press.
Chang, H-J and Park, H-J (2000). An alternative perspective on government policy towardsthe chaebol in Korea: Industrial policy, financial regulations, and political democracy.In: Jwa S-H & Lee I, eds., Korean Chaebol in Transition: Road Ahead and Agenda.Seoul, Korea Economic Research Institute.
Claessens S, Djankov S and Lang L (2000). The separation of ownership and control in EastAsian Corporations. Journal of Financial Economics, 58: 81–112.
Confederation of Indian Industry (1998). Desirable Corporate Governance: A Code. NewDelhi, Confederation of Indian Industry.
Corbett J and Jenkinson T (1994). The financing of industry, 1970-89: An international com-parison. Discussion Paper No. 948. London, Centre for Economic Policy Research.
Correa CM (1999). Competition law and development policies. Paper presented at the semi-nar on Issues of International Competition, University of Zurich, Zurich, Switzerland,8–10 July 1999.
Cosh A, Hughes A and Singh A (1990). Take-overs and short-termism in the United Kingdom:Analytical and policy issues in the U.K. economy. London, Institute for Public PolicyResearch.
Demirguc-Kunt A and Maksimovic V (1996). Stock market development and firm financingchoices. World Bank Economic Review, 10(2): 354.
Feldstein M (1998). Trying to do too much. Financial Times, 3 March 1998.

AJIT SINGH, ALAKA SINGH AND BRUCE WEISSE68
Financial Times (1998). US looks to G-7 backing in Asia Crisis. Article written by Baker G.19 February.
Friedman M (1953). Essays in Positive Economics, Chicago. Chicago, IL, The University ofChicago Press.
Glen J, Lee K and Singh A (2000). Competition, corporate governance and financing of corporategrowth in emerging markets. Cambridge Discussion Paper in Accounting and FinanceNo. AF46, Department of Applied Economics, University of Cambridge, United Kingdom.
Goddard JA and Wilson JOS (1999). The persistence of profit: a new empirical interpretation.International Journal of Industrial Organisation, 17(5): 663–687.
Graham B and Dodd D (1934). Securities Analysis. New York, McGraw-Hill.Greenspan A (1998). Testimony before the Committee on Banking and Financial Services,
United States House of Representatives, 30 January 1998.Hughes A (1991). Mergers and Economic Performance in the UK: A Survey of the Empirical
Evidence 1950–1990. In: Fairburn J and Kay JA, eds., Mergers and Merger Policy (2nd
edition). Oxford, Oxford University Press.Iskander MR and Chamlou N (2000). Corporate governance: A framework for implementa-
tion. The World Bank, Washington, DC.Jensen MC (1988). Take-overs: their causes and consequences. Journal of Economic Per-
spectives, 2 (1): 21–48 (winter).Jensen M and Meckeling W (1976). Theory of the firm: Managerial behaviour, agency costs
and ownership structure. Journal of Financial Economics, 3(4): 305–60.Johnson S, Boone P, Breach A and Friedman E (2000). Corporate governance in the Asian
financial crisis. Journal of Financial Economics, 58: 141–186.Khanna T (2000). Business groups and social welfare in emerging markets: Existing evidence
and unanswered questions. European Economic Review 44: 748–761.Khanna T and Palepu K (1997). Why focused strategies may be wrong for emerging markets.
Harvard Business Review, July–August.Khanna T and Palepu K (1999). The right was to restructure conglomerates in emerging mar-
kets. Harvard Business Review, July–August.Khanna T and Yafeh Y (2000). Business groups and risk sharing around the world. Social
Science Research Network (SSRN) Working Paper Series (http://papers.ssrn.com), Janu-ary 25, 2001.
Krause L (2000). The aftermath of the Asian financial crisis for South Republic of Korea. TheJournal of the Republic of Korean Economy, 1(1): 1–22, Spring.
Krugman P (1999). The Return of Depression Economics. Harmondsworth, Penguin.Laffont J (1999). Competition, information, and development. In: Pleskovic B and Stiglitz J,
eds., Annual World Bank Conference on Development Economics Washington, DC, theWorld Bank.
La Porta R, Lopez-de-Silanes F, Shleifer A and Vishny RW (1997). Legal Determinants ofExternal Finance, Journal of Finance, 52: 1131–1150.
La Porta R, Lopez-de-Silanes F, Shleifer A and Vishny RW (1998). Law and finance. Journalof Political Economy, 106: 1113–55
La Porta R, Lopez-de-Silanes F, Shleifer A and Vishny RW (1999). Investor protection: Ori-gins, consequences, reform. Manuscript. Cambridge, MA, Harvard University.

CORPORATE GOVERNANCE AND COMPETITION 69
La Porta R, Lopez-de-Silanes F, Shleifer A and Vishny RW (2000). Agency problems anddividend policies around the world, Journal of Finance.
Leff N (1979). Entrepreneurship and economic development: the problem revisited. Journalof Economic Literature, 17: 46–64.
Leff N (1978). Industrial organization and entrepreneurship in developing countries: the eco-nomic groups. Economic Development and Cultural Change, 4: 661–675.
Maddison A (1991). Dynamic Forces in Capital Development: A Long-Run Perspective. Ox-ford, Oxford University Press.
Manne HG (1965). Mergers and the market for corporate control. Journal of Political Economy,73: 693–706.
Mayer C (1990). Financial systems, corporate finance and economic development. In: HubbardRG, ed., Asymmetric Information, Corporate Finance and Investment. Chicago, Uni-versity of Chicago Press.
Mueller D ed. (1990). The Dynamics of Company Profits: An International Comparison. Cam-bridge, Cambridge University Press.
Mueller D (1986). Profits in the Long Run. Cambridge, Cambridge University Press.Peacock A and Bannock G (1991). Corporate Take-Overs and the Public Interest. Aberdeen,
Aberdeen University Press for the David Hume Institute.Phelps ES (1999). The global crisis of corporatism. Wall Street Journal, 25 March.Porter ME (1992). Capital disadvantage: America’s falling capital investment system. Harvard
Business Review, September–October: 65–82.Ravenscraft DJ and Scherer FM (1987). Mergers, Sell-Offs and Economic Efficiency. Wash-
ington, DC, Brookings Institution.Scherer FM (1988). Corporate take-overs: The efficiency argument. Journal of Economic
Perspectives, 2 (1), winter.Shleifer A and Summers L. (1988). Breach of trust in hostile take-overs. In: Auerbach A, ed.,
Corporate Take-overs: Causes and Consequences. Chicago, University of Chicago.Shleifer A and Vishny RW (1997). A survey of corporate governance. Journal of Finance, 52:
737–783.Singh A (1971). Take-overs, Their Relevance to the Stock Market and the Theory of the Firm.
Cambridge, United Kingdom, Cambridge University Press.Singh A (1975). Take-overs, economic natural selection and the theory of the firm. Economic
Journal, September.Singh A (1992). Corporate takeovers. In: Eatwell, J, Milgate M and Newman P, eds., The New
Palgrave Dictionary of Money and Finance. London:, Macmillan: 480–486.Singh A (1995a). Corporate Financial Patterns in Industrializing Economies: A Comparative Inter-
national Study. Technical paper, International Finance Corporation (IFC), Washington, DC.Singh A (1995b). The causes of fast economic growth in East Asia. UNCTAD Review: 91–127.Singh A (1997). Financial liberalization, stock markets and economic development. Economic
Journal, 107: 771–782.Singh A (1998a). Liberalization, the stock market and the market for corporate control: A
bridge too far for the Indian economy? In: Ahluwalia, IJ and Little IMD, eds., India’sEconomic Reforms and Development: Essays for Manmohan Singh. Oxford, OxfordUniversity Press.

AJIT SINGH, ALAKA SINGH AND BRUCE WEISSE70
Singh A (1998b). Savings, investment and the corporation in the East Asian miracle. TheJournal of Development Studies, 34 (6).
Singh A (1998c). Financial crisis in East Asia: the end of the Asian model? Issues in Develop-ment, Discussion Paper 24, International Labour Office, Geneva.
Singh A (1999). ‘Asian capitalism’ and the financial crisis. In: Michie J and Grieve Smith J,eds., Global Instability: The Political Economy of World Economic Governance, Lon-don, Routledge: 9–36.
Singh A (2000). The Anglo-Saxon market for corporate control: The financial system andinternational competitiveness. In: Howes C and Singh A, eds., Competitiveness Mat-ters: Industry and Economic Performance in the US. Ann Arbor, University of Michi-gan Press.
Singh A and Dhumale R (1999). Competition policy, development and developing countries.T.R.A.D.E. Working Paper 7, South Centre, Geneva.
Singh A and Hamid J (1992). Corporate financial structures in developing countries. Techni-cal paper 1, International Finance Corporation, Washington, DC.
Singh A and Weisse B (1998). Emerging stock markets, portfolio capital flows and long-termeconomic growth: Micro and macro perspectives. World Development, 26 (4): 607–622.
Singh A and Weisse B (1999). The Asian model: A crisis foretold? International Social Sci-ence Journal, 160.
Singh A, Singh A and Weisse B (2000). Information technology, venture capital and the stockmarket. Cambridge Discussion Paper in Accounting and Finance No. AF47, Depart-ment of Applied Economics, University of Cambridge, United Kingdom.
Singh A and Zammit A (2000). International capital flows: Identifying the gender dimension.World Development, 28, (7): 1249–1268.
Stein JC (1989). Efficient stock markets, inefficient firms: A model of myopic corporate be-haviour. Quarterly Journal of Economics, 104: 665–70, November.
The Economist (2001). Survey of Corporate Finance, 22 January–2 February.Tybout J (2000). Manufacturing firms in developing countries: How well do they do and
why? Journal of Economic Literature, 38 (1), March.UNCTAD (2000). World Investment Report 2000: Cross-Border Mergers and Acquisitions
and Development. Geneva and New York, United Nations publication sales no.E.00.II.D.20.
Waring G (1996). Industry differences in the persistence of firm-specific returns. AmericanEconomic Review, 86: 1253–1265, December.
Whittington G, Saporta V and Singh A (1997). The effects of hyper-inflation on accountingratios: Financing of corporate growth in industrialising economies. International Fi-nance Corporation Technical Paper 3, Washington, DC.
Williamson OE (1975). Markets and Hierarchies: Analysis and Antitrust Implications. NewYork, The Free Press.
Winters SG Jr (1964). Economic ‘natural selection’ and the theory of the firm. Yale EconomicEssays. Yale University, Connecticut, Spring.
World Bank (1993). The East Asian Miracle: Economic Growth and Public Policy. New York,Oxford University Press.

THE OECD EXPERIENCE WITH CAPITAL ACCOUNT LIBERALIZATION 71
THE OECD EXPERIENCE WITH CAPITALACCOUNT LIBERALIZATION
Stephany Griffith-Jones, Ricardo Gottschalkand Xavier Cirera*
I. INTRODUCTION
Since the late 1980s a number of developing countries have pursuedrapid capital account liberalization. Some of them have done so in a broadercontext of economic reforms. In most cases the “big-bang” approach ofsimultaneous reforms was adopted, thus departing from the conventionalwisdom which recommended that reforms should be sequenced, with capitalaccount liberalization occurring last (McKinnon, 1991; Williamson andMahar, 1998).
The financial crises of the 1990s, resulting in severe developmentalcosts, have demonstrated the inconvenience of fast and deep capital accountliberalization, particularly among emerging economies. Concerns havebecome widespread about the appropriateness of full capital accountconvertibility. There is a growing view that not only should capital account
* We would like to thank Yilmaz Akyuz and Andrew Cornford for insightful suggestions.We are also grateful to Robert Ley for his valuable support.

STEPHANY GRIFFITH-JONES, RICARDO GOTTSCHALK AND XAVIER CIRERA72
liberalization come last – as the conventional wisdom advocates – but thatit should be gradual and sequenced. Furthermore, for certain developingcountries full capital account liberalization may not be desirable for a verylong time.1
Mexico and the Republic of Korea and, to a lesser extent, the CzechRepublic figured among those emerging economies that undertook rapidcapital account liberalization and experienced financial crises in the 1990s.Their liberalization pattern was largely associated with their recentaccession to the OECD. This was in sharp contrast with the originalmembers of that organization, which undertook gradual liberalization oftheir capital accounts – over 25 years in most cases – a process that wassupported by the OECD Code of Liberalization of Capital Movements.The Code provided the framework that initially gave member countriesthe necessary mechanism for an orderly process of liberalization. Thisimportant fact, however, is neither sufficiently known nor acknowledged.
The objective of this study is to better inform the debate on capitalaccount convertibility. To this end, the study examines the evolution of theOECD Code of Liberalization of Capital Movements since its inception. Itshows that this initially allowed for a long-term, sequenced process thattook due account of the heterogeneity of OECD member countries, butthat it has changed over the past two decades, with a shift in emphasistowards rapid liberalization, irrespective of countries’ conditions andcircumstances.
The analysis of capital account liberalization in the OECD is presentedin six sections. Following this introduction, section II provides a historicalbackground and a short description of the OECD Code of Liberalizationof Capital Movements. Section III describes how the Code has evolvedover time, and identifies different liberalization patterns among the OECDmember countries. Section IV examines the use of instruments providedby the Code that have enabled countries to pursue different liberalizationpaths. Section V compares the liberalization experiences of selectedcountries, highlighting the dissimilarities in their liberalization approachesand the results. Section VI concludes with a discussion of the relevantlessons.
THE OECD EXPERIENCE WITH CAPITAL ACCOUNT LIBERALIZATION 73
II. THE CODE OF LIBERALIZATION OF CAPITAL MOVEMENTS:HISTORICAL BACKGROUND AND INSTRUMENTS
The first years of the post-war period were marked by extensiverestrictions on all sorts of balance-of-payments operations, from trade andservices to capital movements.2 Although they were part of countries’ effortsto reconstruct their economies (OECD, 1993), these restrictions reflected,above all, an economic approach that asserted, as a basic value, the needto preserve autonomy in the conduct of national policies.
Initiatives towards reducing such restrictions began in the late 1940s,with European countries forming the Organisation for European EconomicCo-operation (OEEC) in 1948.3 In the subsequent two years, the OEECmember countries agreed to gradually remove restrictions on trade andcurrent “invisible” operations, as well as to avoid new restrictions on thecurrent account. In 1950, a Code of Trade Liberalization was established,and in 1951 it was extended to include invisible current account operations,especially those related to economic activities and international trade. Laterin the 1950s, restrictions on current payments were dropped in most of theOECD countries (OECD, 1987). Recommendations to liberalize capitalmovements had started slowly and tentatively in the mid-1950s, leadingeventually to the creation of the OEEC Code of Liberalization of CapitalMovements in 1959. Its structure was similar to that of the Code for CurrentInvisible Operations, but with a narrower scope regarding the sorts ofoperations to be liberalized.
In December 1961, the year when the OECD was created,4 the existingCodes were adapted to form the OECD Code of Liberalization of CurrentInvisible Operations and the OECD Code of Liberalization of CapitalMovements. According to the OECD, the latter Code was created as anagreed multilateral framework to promote capital account liberalizationamong the OECD member countries.5 From its originally narrow scope, itexpanded gradually over time. This implied an embedded flexibility, whichpermitted the OECD member countries initially to pursue a gradualliberalization of their capital account in conformity with their specific needsand circumstances. This flexibility was made possible by the existence of

STEPHANY GRIFFITH-JONES, RICARDO GOTTSCHALK AND XAVIER CIRERA74
legal procedures – reservations and derogation – which countries usedextensively in order to dictate their own liberalization path.
Countries aiming to pursue a gradual liberalization process could –and still can – lodge reservations (i.e. restrictions under specified rules)on items covered by the Code. A reservation can be applied when thecountry adheres to the Code, when a new item is included in the Code orwhen a specific item begins to apply to the country concerned.6 The OECDcreated two lists (A and B) in order to prevent countries from keepingreservations in place even when they do not use them. For the items in listA, once such reservations are withdrawn, they cannot be imposed again.For items on list B, countries can reimpose reservations at any time. Withlist B, the OECD hoped that countries would be more inclined to removereservations, as these can be reimposed in the future if need arises.
Countries can also apply derogation, which can be general (Article 7a)or specific (Articles 7a and 7b). General derogation is a dispensation fromall operations specified in the Code, and can be applied if the countryfinds that its economic and financial situation justifies such a course ofaction, with no time specified for its removal. In the past, countries thathave adopted general derogation are Greece, Iceland, Spain, Turkey andPortugal. This has permitted them to liberalize very slowly and over along period of time, in most cases over 20 years. More recently, althoughformally the right to impose a general derogation still exists, countrieshave not used it on joining the OECD. Specific derogation can be appliedin two cases: first, when a country faces economic and financial problemscaused by liberalization (Article 7b), and second, when it faces seriousbalance-of-payments difficulties (Article 7c). The latter kind of derogationis temporary and is expected to be lifted as soon as the problems justifyingits application are overcome. In principle, it is not permitted to last longerthan 18 months.7

THE OECD EXPERIENCE WITH CAPITAL ACCOUNT LIBERALIZATION 75
III. EVOLUTION OF THE OECD CODE AND PATTERNS OFLIBERALIZATION AMONG THE OECD MEMBER COUNTRIES
From its inception in the early 1960s until the late 1980s, the OECDCode of Liberalization of Capital Movements was gradually expanded (seebox 1 for a detailed description of the main items of the Code and majorchanges over time).
In the early 1960s, the main items covered by the Code included inwardforeign direct investment (FDI), long-term portfolio flows, and transactionsrelated to business and trade. Member countries decided not to liberalizeshort-term operations in order to avoid balance-of-payments problemscaused by speculative activities of investors, and to preserve autonomy inthe conduct of their economic policy, particularly with regard to theexchange rate (Poret, 1998).
In the 1970s, an important step towards liberalization was the inclusionof collective securities in the Code. In the 1980s, inward FDI was furtherencouraged, with the adoption of the right of establishment and the inclusionof conditions of reciprocity. Finally, in 1989 a major step towards furtherliberalization was taken with the inclusion in the Code of short-termtransactions in securities and inter-bank markets, short-term financialcredits and loans, and foreign exchange operations (including spot andforward transactions, swaps, futures, options and other innovative instru-ments). The year 1989 can thus be considered a turning point; since thenvirtually all types of capital movements have been covered by the Code.8
Meanwhile, most operations involving portfolio flows have been movedto list A, which, as noted earlier, implies that, once withdrawn, reservationson these operations cannot be reimposed.
Thus, gradualism was an important feature of the initial OECDapproach to capital account liberalization. A second important feature wassequencing: the OECD member countries first liberalized long-term capitalflows, particularly FDI,9 followed by short-term flows, particularly short-term portfolio flows. The latter category of flows was clearly specified inthe Code only in the late 1980s. Gradualism and sequencing were part of a

STEPHANY GRIFFITH-JONES, RICARDO GOTTSCHALK AND XAVIER CIRERA76
Box 1
ITEMS INITIALLY COVERED BY THE CODE ANDMAJOR CHANGES OVER TIME
• Initially, the Code covered the following items: inward and outwardlong-term FDI, liquidation of non-resident-owned FDI,1 personalcapital movements (e.g. exchange authorizations to nationals andforeigners, inheritances, dowries, gifts), use and transfer of non-resident-owned funds, physical movements of securities andbuying and selling of securities.2
• Major changes in the Code occurred in the following years: 1964,1973, 1984 and 1989.
1964: The list was considerably expanded, to include new items:operations in real estate, credits directly linked to internationalcommercial transactions and services, financial credits and loans,admission of securities to capital markets, sureties and guarantees,and physical movements of capital assets other than securities (seetable A.1).
In addition, the existing items were better specified. For example, ondirect investment, the Code permitted long-term loans (of five yearsor more) for the purpose of establishing lasting FDI and removed thepossibility of countries restricting operations if they believed suchoperations to be detrimental to their interests. On physical movementsof capital, the Code introduced a distinction between bonds andsecurities.
Furthermore, a number of items were placed in list B, such as: thetrading of securities in unrecognized security markets, and creditsdirectly linked to international transactions which are short- andmedium-term (up to five years) and provided by (non-financialinstitutions) residents to foreigners, in addition to other outward creditflows not specified in list A.
The changes apparently reflected a desire to better discriminatebetween operations within each category listed in the Code so as to

THE OECD EXPERIENCE WITH CAPITAL ACCOUNT LIBERALIZATION 77
provide countries with the flexibility to impose restrictions on certainoperations, particularly those involving securities and certain kindsof credits and loans. Indeed, most of the member countries havelodged reservations on items of securities placed in list B. As forcredits and loans, a number of restrictions have been imposed onthose not related to international trade. As argued in OECD (1990: 43),countries have targeted such types of credits and loans because theyare seen as being “of less importance to the ‘real’ side of the economy,potentially destabilising, and an easy conduit for circumventing othercontrols”.
1973: The Code was amended to include operations in collectiveinvestment securities in List A. Specifically, buying and selling ofcollective investment securities by residents operating abroad andnon-residents operating in the country concerned were permitted.These operations, however, had to be carried out through authorizedresident agents. Moreover, residents were expected to hold funds andsecurities only through such agents, and the contracting of buyingand selling was permitted only in the spot market.
1984: The definition of inward FDI was expanded to include themain features of the right of establishment, such as licences,concessions, requirements for running an enterprise and the type ofoperating - subsidiary, branch or agency (OECD, 1995: 22). In 1986,the principle of non-discrimination3 was relaxed, with the inclusionin the Code of conditions of reciprocity for inward FDI. Thisamendment allows a country to restrict the conditions under which itpermits access to its markets for a direct investor to those applyingin the investor’s country of origin.
1989: The Code explicitly discriminates between short- and long-term securities and bonds, and covers the new and innovative formsof financing, such as swaps, futures and options. As regards operationsin securities on capital markets, those of more than one year previouslyplaced in list B (see above) are now in list A, while those of less thanone year remain in list B under the new item, “operations on moneymarkets”. The Code is also updated to include in list B other operationsin negotiable instruments and non-securitized claims, as well asoperations of deposit accounts and those in foreign exchange, not
Box 1 (continued)

STEPHANY GRIFFITH-JONES, RICARDO GOTTSCHALK AND XAVIER CIRERA78
widely accepted view in the 1960s and early 1970s on how capital accountliberalization should be pursued. At that time, growth and full employmentwere major policy objectives, and autonomous national policies, whichcould be badly affected by premature liberalization, were seen as a basiccondition to achieve them.
In the 1970s, although further liberalization was carried out throughan expansion of the provisions of the Code, with the inclusion of collectivesecurities, countries remained cautious, reinforcing rather than relaxingtheir restrictions. Evidence of their cautious approach was that theycontinued to maintain fairly numerous regulations (which directly and
specified in list A. Finally, the Code adds financial back-up facilitiesto the item on sureties and guarantees, while those facilities that arenot related to international trade are placed in list B (see table A.2 forchanges).
1 More specifically, the area of FDI covered the creation or extension ofa wholly-owned enterprise, subsidiary or branch, acquisition of fullownership of an existing enterprise, participation in new existingenterprises and long-term loans of five years or more.
2 Physical movements of securities are far more restricted than otheroperations involving securities. For example, in certain cases onlymovements for administrative purposes are permitted and only on atemporary basis. A summary of the 1960 Code list and the amendmentsmade thereafter can be found in table A.1.
3 According to the principle of non-discrimination originally establishedin the Code, a country should not discriminate between membercountries when applying liberalization measures or restrictions. Thishowever can be relaxed when a country, as a member of a specialcustoms or monetary union, applies liberalization measures to othermember countries of the union without extending such measures tonon-members.
Box 1 (concluded)

THE OECD EXPERIENCE WITH CAPITAL ACCOUNT LIBERALIZATION 79
indirectly affected the balance-of-payments operations) and exchangecontrols not captured by the Code, partly in response to the collapse of theBretton Woods system and the first oil crisis.
However, gradualism soon began to wane as a result of a majorideological shift towards greater liberalization in the late 1970s; OECDmember countries no longer followed changes in the Code but ratheranticipated them. Many of them speeded up liberalization by removingtheir reservations and derogation and by dropping restrictions not capturedby the Code. By the late 1980s, when the Code included short-term financialoperations, many countries had almost fully liberalized their capitalaccounts.
Another important influence on capital account liberalization in theOECD area was the process of deregulation in the domestic financial sector.This process, which had begun in OECD countries in the early 1960s,intensified in the late 1970s and early 1980s in search of a higher degreeof efficiency and competition for the sector (OECD, 1989). In addition,membership of the then European Economic Community (EEC, theprecursor to the EU) also influenced the path of liberalization of manyOECD countries at the time; the EEC regime for capital movements,particularly its 1988 directive, represented a significant step towards fullcapital account convertibility. (For a detailed account of the EEC/EU regimefor capital movements, see Akyuz and Cornford, 1994.)
In the 1990s, OECD member countries continued to liberalize further,especially the new members, which faced pressure to catch up quicklywith the original members. Some of these new members probably acceptedtough conditions to join the OECD because of various incentives to do so.For example, becoming an OECD member country gave them a lower riskweight, according to the 1988 Basel Accord, which meant that banks wouldprobably lend more and/or with lower spreads. Paradoxically, though,Mexico, whose risk weight was lowered as a result of its accession to theOECD in 1994, faced a currency crisis that same year.
Thus, another important feature of OECD membership was thatcountries followed different liberalization paths. Three main categories of

STEPHANY GRIFFITH-JONES, RICARDO GOTTSCHALK AND XAVIER CIRERA80
countries can be identified, according to the timing and speed of theirliberalization (see figure 1). The first wave comprised the developedcountries of the OECD area.10 These countries undertook a fairly gradualliberalization path, with a speeding up only from the early 1980s onwards.The second wave constituted those members that were middle-incomecountries at the time of accession to the OECD: Greece, Iceland,11 Portugal,Spain and Turkey. They liberalized very slowly for more than 20 years(due to the prolonged use of the general derogation, as noted above), withsome opening being observed only towards the late 1980s and a speedingup of the process from the early 1990s onwards. Finally, the third wavecomprised the emerging economies that acceded to the OECD morerecently: the Czech Republic, Hungary, Mexico, Poland and the Republicof Korea. These newcomers, though not ready for full liberalization, hadto face tougher liberalization conditions to enter the organization, includingno restrictions on payment transfers, an open and transparent regime forFDI, liberalization of long-term transactions, and a short time frame forfurther liberalization (Poret, 1998).12
Even within each of these categories the speed of liberalizationdiffered, especially among the first-wave countries. In this group the UnitedStates, Switzerland and Canada adopted a more liberal approach in the
Figure 1
SPEED OF LIBERALIZATION, BY GROUPS OF COUNTRIES
Countries/years 1960s 1970s 1980s 1990s
First wave
Second wave
Third wave
Source: Authors’ compilation.Note: White = no liberalization; light shade = slow liberalization; dark shade = fast liberalization.

THE OECD EXPERIENCE WITH CAPITAL ACCOUNT LIBERALIZATION 81
early 1950s, and Germany abolished most of its controls by 1958 (OECD,1993). Therefore these countries began liberalizing even before theiradoption of the OECD Code, though, as discussed below, most of themlater resorted to controls (and benefited from the safeguards of the Code),either in response to balance-of-payments difficulties or to avoid excessivecapital inflows.
Among the remaining countries of the first-wave group, whichconstitute the large majority of members, liberalization was initially verygradual, with restrictions of different sorts being kept during the first 15 to20 years, for the purpose of retaining autonomy to conduct economic andmonetary policies and avoiding macroeconomic instability. After this initialperiod marked by caution, these countries started to liberalize more quickly,but in different ways. For example, Australia, Japan, New Zealand and theUnited Kingdom lifted the remaining extensive restrictions virtually inone sweep. The United Kingdom abolished nearly all its capital controlsin 1979, and Japan did the same in 1980. Australia almost completelyliberalized its capital movements in 1983, and New Zealand in 1984(OECD, 1990: 40–41). Rapid liberalization in that group of countries wasmotivated mainly for ideological reasons, except in Japan. In the lattercase, the quick move towards a liberal capital account reflected a structuralchange in the country’s external sector, which started to witness a growingsurplus in the balance of payments.13 The remaining first-wave countriesspeeded up liberalization but retained a measure of gradualism: theNetherlands completed liberalization by 1986, and Denmark and Francein 1988 and 1989 respectively. Finally, only between 1988 and 1990 didAustria, Ireland, Italy, Norway and Sweden drop a substantial number ofrestrictions.
Among the second-wave category of countries, liberalization was morehomogeneous than among the first-wave countries, as all of them (exceptSpain) made use of a general derogation until the 1980s. Once they removedthe use of that instrument, they pursued a gradual liberalization path, thoughat different speeds. Turkey, for example, dropped the general derogationin 1985, and kept just a few reservations while moving towards a veryopen capital account by the end of the 1980s. This pattern seemed to beassociated with the country’s political developments, marked by an

STEPHANY GRIFFITH-JONES, RICARDO GOTTSCHALK AND XAVIER CIRERA82
ideological shift in the direction of a market-based economic approach.Other countries such as Portugal and Spain, which faced pressures in the1980s to liberalize due to their accession to the EEC, were, nevertheless,more cautious. Portugal dropped its general derogation in 1981, but kept aspecific derogation until 1987 – one year after its entry into the EEC – andinvoked it again between mid-1991 and late 1992 (see below). It also keptin place a large number of reservations throughout the 1980s and until1992, when it undertook broad liberalization. The liberalization pathpursued from then onwards was closely associated with the EEC require-ments for capital account liberalization. As for Spain, it had dropped thegeneral derogation in the early 1960s, but slowed down the liberalizationprocess by relying on a wide variety of reservations and other restrictionsuntil the early 1990s. In the next section, we describe in greater detailSpain’s experience with capital account liberalization.
Finally, as regards the third-wave countries, owing to the requirementsfor obtaining OECD membership, none of them made use of the generalderogation. Therefore, unlike the first- and second-wave countries, thethird-wave countries liberalized their capital accounts very rapidly, eitherbefore or at the time of their entry into the organization. This seemsparticularly surprising in the case of the transition economies, which wereonly just starting to develop the necessary market institutions.
Below we attempt to describe how countries proceeded with liber-alization of their capital accounts through their use of the reservation andderogation instruments. However, a number of caveats are in order whenadopting this approach. On the one hand, resort to derogation and reser-vations over time might merely reflect a precautionary approach, thus notshowing the precise degree of the countries’ capital account liberalization.On the other hand, many countries kept indirect controls over capitalmovements that were not captured by the Code. As argued in OECD(1990: 41), this was particularly true until the mid-1970s, when countriessuch as Belgium, France, Ireland, Italy, Japan, the Netherlands and theUnited Kingdom “allowed certain capital movements to take place onlythrough particular closed-circuit payments channels or alternative exchangemarkets”. Among other kinds of controls also extensively used were restric-tions on the overall positions of financial institutions, reserve requirements
THE OECD EXPERIENCE WITH CAPITAL ACCOUNT LIBERALIZATION 83
and restrictions on interest payments. Germany, for example, imposedreserve requirements on banks’ and non-banks’ external liabilities between1971 and 1974, whereas Switzerland prohibited interest payments on non-residents’ deposits in 1972 (OECD, 1990: 41).
IV. USE OF DEROGATION AND RESERVATIONS
This section provides a more detailed analysis of the pattern ofliberalization among OECD member countries by examining their use ofreservations and derogation. These are the two main instruments they haveused to adjust the Code to their specific policy objectives and needs.
A. Analysis of derogation in the Code
(i) The use of general derogation (Article 7a)
As explained above, derogation can be specific (Articles 7b and 7c),but most importantly it can take the form of a general dispensation fromthe Code (Article 7a). It is thus a powerful measure for determining thetrue pattern of capital account liberalization.
In the past, the OECD member countries that made use of generalderogation at the time of adherence to the Code – the second-wave countries– kept this instrument in force for more than 10 years (excluded Spain),the average being 24.5 years (in sharp contrast with the third-wave countrieswhich did not apply the general derogation at all). Greece and Portugalremoved the general derogation in the early 1980s, Turkey in 1985 andIceland in 1990 (see table A.3). This means that in fact this group ofcountries only started to liberalize their capital accounts in the 1980s.
STEPHANY GRIFFITH-JONES, RICARDO GOTTSCHALK AND XAVIER CIRERA84
(ii) The use of specific derogation (Articles 7b and 7c)
Since then, some of the second-wave countries have applied Articles7b and 7c on a number of occasions (table A.3). As explained above,Article 7b allows for the use of a specific derogation when the countryfaces economic and financial problems caused by liberalization, and Article7c when the country faces serious balance-of-payments difficulties.
Portugal, which removed the general derogation in 1981, already hadspecific derogation in place since 1977. This lasted until 1987 and wasinvoked again between mid-1991 and late 1992. Although specific, thederogation clause covered quite a large number of items relating to bothcapital inflows and outflows (OECD, 1990: 42). Iceland, which removedthe general derogation in December 1990, applied a specific derogation inJanuary 1993. Spain, unlike the other countries, made use of a generalderogation only in the early period of adherence to the Code – from 1959to 1962 – and it applied a specific derogation for three years during the1980s (from mid-1982 to mid-1985).
Most of the first-wave countries have made considerable use of specificderogation over the years. Between the creation of the Code and 1993,their average use of the articles 7b and 7c was 4.5 years. Countries thatsought such a recourse for relatively long periods (five years or more)were Australia, Austria, Finland, Germany, Italy, Norway, Sweden and theUnited States. On the other hand, Belgium, Canada, France, Ireland,Luxembourg, the Netherlands and New Zealand did not apply thederogation clauses (table A.3).
As reported in OECD (1990), in the 1960s and early 1970s countriessuch as the United Kingdom, the United States, Italy and Sweden used thederogation procedure to avoid capital outflows, while in the early 1970sanother group of countries – Australia, Austria, Germany and Japan –applied the derogation clause to prevent excessive capital inflows. In the1980s and 1990s, the use of derogation became far less frequent and wasrestricted to the Scandinavian countries.

THE OECD EXPERIENCE WITH CAPITAL ACCOUNT LIBERALIZATION 85
B. Analysis of reservations in the Code
A first step in the analysis of the use of reservations by the OECDmember countries is to look at the number of items that have been subjectto reservations in each country over time.14 As explained above, these itemsare distributed between lists A and B. In the former list, once withdrawnreservations cannot be reimposed, whereas in the latter they can be.
(i) The first-wave countries
The first-wave countries have exhibited a fairly homogeneous patternin the use of reservations. As can be seen from table 1, initially the numberof reservations each country lodged under the Code increased gradually,reaching a peak in 1978, with an average number of 7.1 against 2.9 in1960. This increase reflected not only the expansion of the Code to includemore items of the capital account, but also a real attempt to imposerestrictions on balance-of-payments movements. The need for suchrestrictions was associated with the problems relating to the Bretton Woodssystem in the late 1960s and early 1970s and with the effects of the 1973oil shock.
From 1978 a gradual decline in the number of reservations can beobserved (table 1). This decline stopped (and was in some cases reversed)at the turn of the 1870s to the 1980s. Two major exceptions to that deservementioning: the United Kingdom and Japan; the former removed all of itsreservations between 1979 and 1982, and the latter reduced reservationsfrom five to two over the same period. This is consistent with the factnoted above, that these two countries almost completely liberalized theircapital accounts at the time, from a previously fairly restrictive regime.
From 1982 onwards, the decline in the number of reservations resumedand accelerated during the decade. It is noteworthy that the number ofrestrictions on list B was larger among the first-wave countries than amongthe second-wave countries, which suggests that for the former (the devel-oped countries) such a recourse was temporary and associated withbalance-of-payments problems.

STEPHANY GRIFFITH-JONES, RICARDO GOTTSCHALK AND XAVIER CIRERA86
Table 1
RESERVATIONS LODGED BY FIRST-WAVE COUNTRIES, 1960–1997
1960 1969 1978 1982 1990 1992 1997
Austria List A 2 3 4 3 1 3 1List B 0 3 4 4 2 4 1Total 2 6 8 7 3 7 2
Australia List A 5 5 4 2 2List B 5 5 5 5 3Total 10 10 9 7 5
Belgium List A 1 2 2 3 3 4List B 1 1 1 1 2 1Total 2 3 3 4 5 5
Canada List A 2 2 2List B 2 1 1Total 4 3 3
Denmark List A 2 3 4 3 1 1 1List B 0 4 4 4 3 1 1Total 2 7 8 7 4 2 2
Finland List A 7 6 5 3 2List B 5 5 5 3 1Total 12 10 9 6 3
France List A 1 2 2 2 3 3List B 2 5 4 1 1 1Total 3 7 6 3 4 4
Germany List A 1 2 2List B 0 1 1Total 1 3 3
Ireland List A 2 4 5 5 4 8 1List B 0 5 5 5 4 8 1Total 2 9 10 10 8 16 2
Italy List A 4 5 6 5 4 3 2List B 0 5 5 5 4 0 0Total 4 10 11 10 8 3 2
Japan List A 4 1 1 1 2 2List B 5 4 1 0 1 1Total 9 5 2 1 3 3
\ ...

THE OECD EXPERIENCE WITH CAPITAL ACCOUNT LIBERALIZATION 87
Luxembourg List A 1 0 0 0 0 0List B 1 0 0 0 0 0Total 2 0 0 0 0 0
Netherlands List A 2 2 2 1 1 1List B 4 4 4 0 0 0Total 6 6 6 1 1 1
New Zealand List A 4 4 2 3 2List B 4 4 1 1 1Total 8 8 3 4 3
Norway List A 3 5 5 5 4 2 2List B 0 5 5 5 5 1 1Total 3 10 10 10 9 3 3
Sweden List A 4 3 4 4 2 2 2List B 0 5 5 5 3 2 1Total 4 8 9 9 5 4 3
Switzerland List A 1 1 1 1 3 2List B 3 3 3 2 3 1Total 4 4 4 3 6 3
United Kingdom List A 3 3 4 0 1 1 1List B 0 5 5 0 0 0 0Total 3 8 9 0 1 1 1
United States List A 1 1 1 1 3 2List B 0 0 0 0 1 0Total 1 1 1 1 4 2
Total List A 20 37 57 49 40 47 34List B 0 48 64 55 38 35 16Total 20 85 121 104 78 82 50
Average List A 2.86 2.64 3.35 2.88 2.11 2.47 1.79List B 0.00 3.43 3.76 3.24 2.00 1.84 0.84Total 2.85 6.07 7.12 6.12 4.11 4.32 2.63
Source: Authors’ compilation, based on the OECD Code of Liberalization of Capital Movements (variousissues).
Note: Totals do not add up due to rounding.
Table 1 (concluded)
RESERVATIONS LODGED BY FIRST-WAVE COUNTRIES, 1960–1997
1960 1969 1978 1982 1990 1992 1997

STEPHANY GRIFFITH-JONES, RICARDO GOTTSCHALK AND XAVIER CIRERA88
(ii) The second-wave countries
Table 2 shows the number of reservations the second-wave countriesapplied between 1960 and 1997. It is clear that they kept quite a largenumber of reservations – more than 10 on average – for most of the periodbetween 1960 and 1992. This means that, on average, each country imposed
Table 2
RESERVATIONS LODGED BY THE SECOND-WAVE COUNTRIES, 1960–1997
1960 1969 1978 1982 1990 1992 1997
Greece List A 11 10 11 2List B 6 5 8 1Total 17 15 19 3
Iceland List A 2List B 1Total 3
Portugal List A 2 7 8 8 6 6 2List B 0 6 6 6 6 9 0Total 2 13 14 14 12 15 2
Spain List A 6 6 6 4 5 2List B 6 6 6 6 8 1Total 12 12 12 10 13 3
Turkey List A 5 4 4List B 5 4 3Total 10 8 7
Total List A 2 13 14 25 25 26 12List B 0 12 12 18 22 29 6Total 2 25 26 43 47 55 18
Average List A 2.00 6.50 7.00 8.30 6.25 6.50 2.40List B 0.00 6.00 6.00 6.00 5.50 7.25 1.20Total 2.00 12.50 13.00 14.30 11.75 13.75 3.60
Source: Authors’ compilation, based on the OECD Code of Liberalization of Capital Movements (variousissues).
Note: Totals do not add up due to rounding.

THE OECD EXPERIENCE WITH CAPITAL ACCOUNT LIBERALIZATION 89
restrictions (total or partial) on at least 10 items of the Code. Until theearly 1980s such reservations coexisted with the use of general derogationin all cases, except for Spain. The reason for this was that reservations hadto be adopted at the time of adherence to the Code and when a new itemwas included. This precautionary approach enabled the countries to havereservations in place during the 1980s, when derogations were dropped.As can be seen from table 2, the number of reservations kept during the1980s was very high, averaging 12 to 14, with a marginal increase from1990 to 1992.
From 1992 onwards an important change occurred: the number ofreservations declined very rapidly, reaching an average of 3.6 in 1997,which is very low, especially if we take into account the fact that derogationhad been removed. For Greece, Portugal and Spain, the speeding up of theliberalization process was probably associated with their accession to theEEC. Turkey, a non-EEC member, however, dropped the general derogationin 1985, and from then until 1997 kept a lower-than-average number ofreservations for most of the time.
Three phases in the liberalization process can thus be identified forthe second-wave countries through the analysis of the use of derogationand reservations. Initially, between the early 1960s and 1980s, due to theuse of general derogation, liberalization was extremely slow, except inSpain. Then, for most of the 1980s, with the removal of the generalderogation but with a significant number of reservations in place, a gradualliberalization process took place. Finally, during the 1990s, with the rapiddecline in the number of reservations, reaching an average of 3.6 percountry, liberalization speeded up considerably for the first time.
(iii) The third-wave countries (or newcomers)
For the emerging-market, third-wave countries, the analysis isrestricted to the year 1997, given that all of them adhered to the Code onlyby about the mid-1990s. According to table 3, at first view the newcomersin 1997 were in a situation similar to that of the second-wave countries inthe 1980s; their number of reservations averaged 11.4. However, in relative

STEPHANY GRIFFITH-JONES, RICARDO GOTTSCHALK AND XAVIER CIRERA90
terms this number is actually lower, given that in the 1990s the Code hadbeen considerably expanded, with the inclusion of items related to short-term portfolio flows.
Thus the third-wave group differs markedly from the second-wavegroup at least in two ways. First the countries in the former group madeless use of reservations at the time of adherence to the Code,15 and second,but more importantly, they did not apply any general derogation. Sincethis recourse was still available, it suggests that they indeed faced consider-able pressure to accept stringent requirements concerning liberalization oftheir capital account as a condition for OECD membership. Also, at leastin some cases, their new governments were committed to rapid capitalaccount liberalization and/or had made such commitments in other contexts(e.g. Mexico with the North American Free Trade Agreement).
Table 3
RESERVATIONS LODGED BY THE THIRD-WAVE COUNTRIES, 1997
Czech Rep. ofRepublic Hungary Mexico Poland Korea Total Average
List A 4 5 6 7 7 29 5.8
List B 2 8 4 7 7 28 5.6
Total 6 13 10 14 14 57 11.4
Source: Authors’ compilation based on the OECD Code of Liberalization of Capital Movements (variousissues).

THE OECD EXPERIENCE WITH CAPITAL ACCOUNT LIBERALIZATION 91
V. EXPERIENCES OF SELECTED COUNTRIES WITHCAPITAL ACCOUNT LIBERALIZATION:
A COMPARATIVE ANALYSIS
This section sheds additional light on the dissimilar liberalization pathsbetween the second- and third-wave countries, by describing the experi-ences of Spain (representative of the second-wave category) and of theCzech Republic, Mexico and the Republic of Korea (representative of thethird-wave countries). It shows the appropriateness of the gradual approachadopted by the second-wave countries and the risks and costs of the “big-bang” approach adopted by the third-wave countries.
A. Spain16
To compensate for the removal of the general derogation in 1962,Spain made extensive use of reservations to restrict capital movements inthe 1960s and 1970s. The country then began a number of structuralreforms, including, initially, trade liberalization, and then labour marketderegulation and domestic financial liberalization, as part of its preparationfor accession to the EEC in 1986.
Between 1982 and 1985, Spain made use of specific derogation whilekeeping a number of reservations in place. Between 1987 and 1989, thecountry witnessed increasing capital inflows, linked mainly to its EECaccession. It responded to these inflows by permitting free entry to mostforms of FDI (believed to be sustainable), and imposing a number ofrestrictions on portfolio and short-term capital inflows, seen as speculativeand therefore easily reversible.17
Such restrictions took various forms and were adopted in steps. InMarch and April 1987, the reserve requirements on domestic bank accountswere extended to include deposits in convertible currency held by non-residents, with non-bearing interest rates for such account balancesexceeding 10 billion pesetas. In July 1987, non-residents were forbidden

STEPHANY GRIFFITH-JONES, RICARDO GOTTSCHALK AND XAVIER CIRERA92
to purchase short-term domestic public assets in the forward market orthose with buy-back clauses. In June 1988, resident borrowers had to obtainauthorization for external financial loans of over 1.5 billion pesetas thathad a maturity of less than three years. And in February 1989, the Govern-ment adopted non-remunerated reserve requirements. The requirementlevels were 30 per cent on foreign loans to physical residents and thecorporate sector, and 20 per cent on the increase in the short-term currencyposition of the banking sector. (Note that the latter measures were theforerunner of the now widely-known Chilean reserve requirements!)
By helping to moderate the volume of capital flowing to the country,especially the more volatile kind, these restrictions facilitated the conductof domestic macroeconomic policies, particularly in the monetary andexchange rate areas, and they contributed to the sustainability of the externalsector. However, by February 1992, the restrictions were phased out inorder to comply with the EEC directives on capital account movements.As these controls were removed, the country started to witness increasingnet inflows of portfolio and short-term capital, which led to the over-valuation of the peseta and, later, made the economy prone to currencyattacks. These attacks materialized in full force during the crisis with theEuropean Monetary System (EMS) in September 1992.
The Spanish response to such speculative attacks was to keep thepeseta within the exchange rate mechanism (ERM) of the EMS afterdevaluing it by 5 per cent. To sustain this new exchange rate, it imposedpunitive restrictions on short-term swap operations involving non-residents.These restrictions took the form of requiring the domestic financial systemto make one-year, non-remunerated deposits in the Bank of Spain equivalentto its total new lending to non-residents. In addition, ceilings were imposedon the foreign currency transactions of foreign banks operating in Spainand of domestic banks having branches abroad. The restriction in the formof deposit requirements on outflows showed a reasonable degree ofeffectiveness, but lasted only a short while, until the 23 November 1992,when the peseta was again devalued, this time by 6 per cent. Since then,Spain has maintained a very liberal regime with regard to capital move-ments.

THE OECD EXPERIENCE WITH CAPITAL ACCOUNT LIBERALIZATION 93
B. The Czech Republic, Mexico and the Republic of Korea
In stark contrast with Spain, all new OECD members liberalized theircapital accounts very rapidly, partly because of the liberalization require-ments imposed as a condition for accession to the OECD, and partly becauseof their own drive towards a market-based economy. The case of the CzechRepublic is a good illustration of the pattern of liberalization adopted bythe economies in transition. The move towards a market-based economyincluded, from the outset, rapid liberalization of the capital account, eventhough it was initially designed to be a gradual process (Klacek, 1999).Liberalization included allowing inflows of direct and portfolio investmentand external credit borrowed by residents.18 By the mid-1990s, the countrybecame a recipient of massive capital flows that reached over 16 per centof its GDP in 1995, much of them short-term. This was despite an initialregulatory attempt to influence their maturity structure. The response tosuch developments was to reform the legislation in order to adapt it to thereality, and to further liberalize capital movements, leaving just a fewrestrictions in place. The Czech authorities discussed the possibility ofintroducing safeguards such as giving discretionary powers to the centralbank to impose interest-free reserve requirements on certain types of creditinflows; however, these were never implemented.19 Furthermore, althoughthe country experienced a “mini” currency crisis in 1997, it did not resortto capital controls; instead, it responded to the crisis with a liquidity squeezeand let the exchange rate float (Dedek, 2002).
Both Mexico and the Republic of Korea joined the OECD in the 1990s,together with the transitional economies, and followed a path of capitalaccount liberalization similar to that of the Czech Republic.
Mexico undertook major liberalization measures in 1989 and 1990.At that time the Government allowed non-residents to buy money marketinstruments, invest in the stock market and hold domestic bonds, includingpublic ones (Griffith-Jones, 1996). As a result, Mexico experienced massiveinflows, averaging nearly 7 per cent of GDP between 1992 and 1994; mostof these were of short-term maturity and were invested in government andequity securities, as well as in private sector instruments (Edwards, 1997).
STEPHANY GRIFFITH-JONES, RICARDO GOTTSCHALK AND XAVIER CIRERA94
Government papers and bonds held by non-residents were a key factor inthe Mexican peso crisis of 1994–1995. Edwards (1997) suggests that thedesire to join the OECD was one reason for Mexico’s liberalization.However, equally, if not more important, may have been the Government’sinterest in joining NAFTA as well as its own free-market preferences.
In the Republic of Korea, broad liberalization started in 1991 and1992, when residents were granted permission to issue securities abroadand foreigners were allowed to invest directly in the Korean stock markets(Park and Song, 1998).20 In 1993, the new government of Kim Young Samaccelerated the pace of capital account liberalization (Chang et al., 1998).Non-residents could hold domestic bank accounts, and later, in 1994, theywere permitted to invest in public bonds. Between then and 1997, additionalderegulation measures were undertaken in the area of capital movements.These included allowing small and medium-sized firms to issue equity-linked bonds and non-guaranteed bonds, and large firms to issue non-guaranteed, long-term bonds, and, most importantly, short-term foreignloans were permitted for different sorts of domestic activities (commercial,infrastructure and FDI-related) that previously had been restricted.
As Wang (2000) notes, the Government maintained some restrictionson the capital account, particularly on some forms of capital inflows, dueto concerns about a surge of capital inflows caused by interest ratedifferentials. The restrictions were mainly in the form of ceilings on foreignportfolio investments in domestic securities and borrowings from abroadby non-banks. However, there were exceptions where liberalizationoccurred far more rapidly, some of which we now know proved harmful.This included trade-related short-term financing for domestic firms. Anotherand particularly problematic area was the short-term foreign currencyborrowings of domestic banks. Finally, control over FDI by domestic firmswas also relaxed (Shin and Wang, 1999).
According to Chang (1998) and Chang et al. (1998) both domesticand foreign pressures played a role in speeding up liberalization in theRepublic of Korea. It is worth pointing out that on the external front boththe United States Government and the OECD are believed to have putstrong pressure on the Korean Government to open up the economy.

THE OECD EXPERIENCE WITH CAPITAL ACCOUNT LIBERALIZATION 95
However, as Wang (2000: 11) reports, in the negotiations over the country’saccession to the OECD in 1996, the Korean Government tried to resist fullcapital account liberalization (although short-term credit had already beenliberalized) for the reasons already mentioned; it intended to delay fullliberalization “until the interest rates would significantly converge”. Butits resistance was weaker than its desire to “show the world” the achieve-ments of the Korean economy, and to prove it by “joining the OECD club”.Thus more rapid capital account liberalization was seen as a price worthpaying for this prize.21
Some of the changes in Korean capital account liberalization wererather subtle, although important. For example, from the early 1990s banksand financial institutions were legally free to borrow short-term capitalfrom abroad; however, till 1994 such borrowings required the Government’sdiscretionary authorization. Similarly, limits on ratios of long-term foreigncurrency loans to short-term currency loans for individual finance werelowered in 1996, which Korean economists now view as having been aserious mistake. The scale of the increase of the short-term debt wasapparently not fully captured in the statistics, as about half of banks’ foreigncurrency operations were handled by overseas branches, whose transactionswere not recorded in the overall Korean data on debt exposure. The Koreanauthorities were reportedly warned by United States regulators in early1997 of this problem and of a maturity mismatch in foreign branches;however, they did not react.
Among the reasons given by the authorities for not controlling short-term loans or taking other measures, was that they had “just joined theOECD and had agreed to liberalize; imposing controls or taxes on short-term flows would imply losing credibility in relation to the OECD”.Furthermore, the fact that the country had joined the OECD was seen bythe authorities to imply that it did not need to worry about the high level ofshort-term debt. However, there were other reasons (not related to OECDaccession) given as to why the Korean authorities did not move to curbexcessive growth; these included, the far lower cost of short-term loans,the fact that banks were inundated with lenders willing to lend, with rolloverratios of 100 per cent – and the perception that the Republic of Korea heldlarge reserves.22

STEPHANY GRIFFITH-JONES, RICARDO GOTTSCHALK AND XAVIER CIRERA96
The liberalization path thus resulted in a large foreign debt, althoughnot so large when measured as a proportion of the country’s GDP (25 percent in early 1997). Also, it was mostly short-term (58 per cent by the endof 1996). This implied a large maturity mismatch, particularly amongmerchant banks, whose borrowings were 64 per cent short-term, and lendingwas 85 per cent long-term (Chang et al., 1998). Short-term foreign debtand maturity (and currency) mismatch were the main causes of the majorcurrency and financial crises in 1997 (Park, 2001; Park and Park, 2002).
C. Lessons
The Spanish experience shows that gradual and sequenced liber-alization gave the country time to build regulatory institutions in thefinancial sector that helped it to maintain macroeconomic stability. Whenthe economy witnessed surges of capital inflows, it managed to reducetheir potentially destabilizing effects with a variety of both quantitativeand price-based restrictions on short-term, speculative flows. Removingsuch restrictions left the country vulnerable to currency attacks. Yet whenthe currency crisis erupted, it had the flexibility to reintroduce restrictions,doing so fairly successfully in terms of taming speculative attacks againstits currency. Restrictions on the balance of payments were imposed in thelate 1980s and early 1990s, when the first-wave countries were undertakingtheir final major steps towards full capital account convertibility. Thisclearly shows that different timing of liberalization was still permittedamong the OECD member countries.
However, the experiences of the Czech Republic, Mexico and theRepublic of Korea with capital account liberalization were quite differentfrom those of Spain as they faced radically different conditions within theOECD. The new members experienced rapid liberalization, a predominanceof short-term over long-term capital flows (in the Mexican and Koreancases) and currency crises. The contrasting experiences and outcomes ofSpain on the one hand, and the Czech Republic, Mexico and the Republicof Korea on the other, strongly point to the need for a new approach towardscapital account liberalization for the emerging economies. This approachshould take account of the positive aspects of the liberalization experience

THE OECD EXPERIENCE WITH CAPITAL ACCOUNT LIBERALIZATION 97
of Spain (and, more generally, of second-wave countries), as well as theearlier experiences of the first-wave industrialized countries. These includegradual liberalization, a cautious approach to short-term capital flows, andthe provision of safeguard mechanisms that can be used effectively in timesof difficulties.
VI. CONCLUSION
A number of important conclusions can be drawn from this study.First, the original OECD member countries initially adopted a gradualapproach to capital account liberalization. Second, the process wassequenced, with long-term capital flows being liberalized first, and short-term capital flows only later when the economies had the strength andinstitutional capacity to absorb such flows. Third, the process initiallyallowed for heterogeneity, with countries being able to shape their ownliberalization pattern in accordance with their structural characteristics andpolicy objectives.
From the adoption of the OECD Code of Liberalization of CapitalMovements in the early 1960s until the 1980s, the developed membercountries of the OECD had, on average, 25 years to pursue orderly capitalaccount liberalization. If we take the end of the Second World War as thestarting point to gauge the time frame of liberalization, then the wholeprocess lasted even longer, 40 years on average. Among the original OECDmembers, that were middle-income countries at the time the OECD wascreated, liberalization started only in the 1980s, as it was recognized thatthese countries needed even more time in order for the process to besustainable. This has changed in the recent past, however. New OECDmembers – emerging economies – have been, if not pushed, at least greatlyencouraged to liberalize more rapidly. As a consequence, they haveundergone premature liberalization, and half of them have experienceddeep and costly financial crises.
In the light of these experiences, it would seem preferable if the OECDreturned to its original mission, which was to support orderly capital account

STEPHANY GRIFFITH-JONES, RICARDO GOTTSCHALK AND XAVIER CIRERA98
liberalization. Accordingly, it should support member countries that preferto relax controls on capital movements gradually, and discourage countriesthat are tempted to open up quickly from doing so. This should applyparticularly to those countries that have weak and badly regulated domesticfinancial systems. A cautious approach should, however, be broad basedto include even those developing countries that are believed to have solidmarket institutions and supervisory frameworks in place, as these can atbest reduce the likelihood, but not entirely prevent, a crisis episode.Particularly short-term and other easily reversible inflows should not befully liberalized.
Given the potentially destabilizing international financial markets,the ultimate aim should be both orderly and sustainable liberalization, anapproach through which financial crises and reversibility of the processcould perhaps be avoided. Nonetheless, capital account liberalization shouldbe sufficiently deep to allow countries to benefit from the positive effectsof capital flows.
Another important lesson that emerges from the study is that no matterhow well designed a multilateral agreed framework may be for the purposeof supporting orderly liberalization, it can become ineffective, and eventurn against the weaker members of the accord, if divergence of interestsexists among member countries. This fact should be seen as a warningabout the risks of an internationally agreed framework on capital accountliberalization. Rather than guaranteeing orderly liberalization, such aframework, even if implemented with carefully designed safeguards, mayresult in one group of countries imposing, through an international body,full capital account convertibility on a wide range of countries, most ofwhich are still unprepared for such a step. This latter problem could possiblybe overcome to the extent that developing countries are properly representedin the international organization implementing capital account liberalization.
More broadly, as long as there is no significant progress on an inter-national financial architecture (including mainly international measures)that would make the occurrence of currency crises far less likely and lesscostly, it seems appropriate that decisions on pace and timing of capitalaccount liberalization (as well as reintroduction of measures to discourage

THE OECD EXPERIENCE WITH CAPITAL ACCOUNT LIBERALIZATION 99
inflows or outflows) should be left to individual countries. As it is thecountry that has mainly to bear the costs of a crisis, should one occur, it isbest, in present circumstances, for the national authorities to be left toweigh the benefits and costs of different paths of capital account liber-alization. International experience or advice can be useful, but autonomousnational decision-making seems clearly more appropriate.
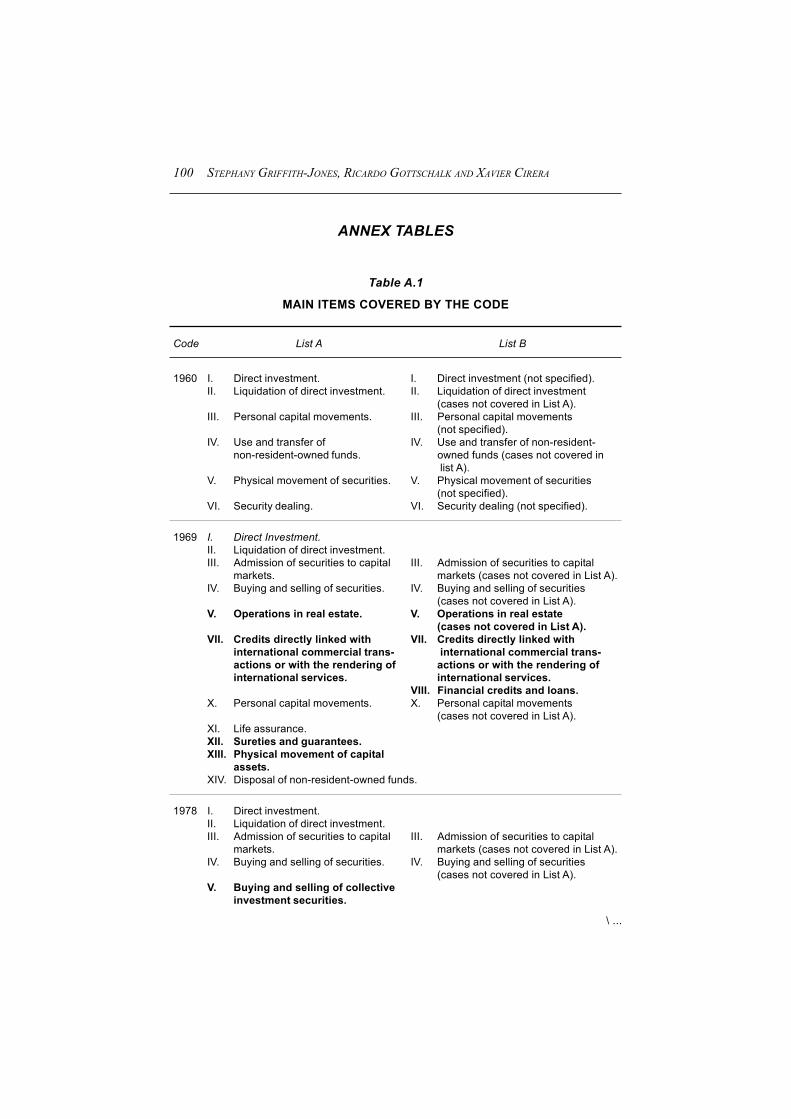
STEPHANY GRIFFITH-JONES, RICARDO GOTTSCHALK AND XAVIER CIRERA100
\ ...
ANNEX TABLES
Table A.1
MAIN ITEMS COVERED BY THE CODE
Code List A List B
1960 I. Direct investment. I. Direct investment (not specified).II. Liquidation of direct investment. II. Liquidation of direct investment
(cases not covered in List A).III. Personal capital movements. III. Personal capital movements
(not specified).IV. Use and transfer of IV. Use and transfer of non-resident-
non-resident-owned funds. owned funds (cases not covered in list A).
V. Physical movement of securities. V. Physical movement of securities(not specified).
VI. Security dealing. VI. Security dealing (not specified).
1969 I. Direct Investment.II. Liquidation of direct investment.III. Admission of securities to capital III. Admission of securities to capital
markets. markets (cases not covered in List A).IV. Buying and selling of securities. IV. Buying and selling of securities
(cases not covered in List A).V. Operations in real estate. V. Operations in real estate
(cases not covered in List A).VII. Credits directly linked with VII. Credits directly linked with
international commercial trans- international commercial trans-actions or with the rendering of actions or with the rendering ofinternational services. international services.
VIII. Financial credits and loans.X. Personal capital movements. X. Personal capital movements
(cases not covered in List A).XI. Life assurance.XII. Sureties and guarantees.XIII. Physical movement of capital
assets.XIV. Disposal of non-resident-owned funds.
1978 I. Direct investment.II. Liquidation of direct investment.III. Admission of securities to capital III. Admission of securities to capital
markets. markets (cases not covered in List A).IV. Buying and selling of securities. IV. Buying and selling of securities
(cases not covered in List A).V. Buying and selling of collective
investment securities.

THE OECD EXPERIENCE WITH CAPITAL ACCOUNT LIBERALIZATION 101
Table A.1 (concluded)
MAIN ITEMS COVERED BY THE CODE
Code List A List B
VI. Operations in real estate. VI. Operations in real estate(cases not covered in List A).
VIII. Credits directly linked with VIII. Credits directly linked withinternational commercial trans- international commercial trans-actions or with the rendering of actions or with the renderinginternational services. of international services
(cases not covered in List A).IX. Financial credits and loans.
XI. Personal capital movements. XI. Personal capital movements(cases not covered in List A).
XII. Life assurance.XIII. Sureties and guarantees.XIV. Physical movement of capital assets.XV. Disposal of non-resident-owned funds.
1990a I. Direct investment.II. Liquidation of direct investment.III. Operations in real estate. III. Operations in real estate
(cases not covered in List A).IV. Operations in securities on capital
markets.V. Operations on money markets.VI. Other operations in negotiable
instruments and non-securitizedclaims.
VII. Operations in collective investmentsecurities.
VIII. Credits directly linked with inter- VIII. Credits directly linked with inter-national commercial transactions or national commercial transactions orwith the rendering of international with the rendering of internationalservices. services.
IX. Financial credits and loans.X. Sureties, guarantees and financial X. Sureties, guarantees and financial
back-up facilities. back-up facilities.XI. Operation of deposit accounts. XI. Operation of deposit accounts.
XII. Operations in foreign exchange.XIII. Life assurance.XIV. Personal capital movements. XIV. Personal capital movements.XV. Physical movement of capital assets.XVI. Disposal of non-resident-owned funds.
Source: Authors’ elaboration based on information obtained from the Code of Liberalization of CapitalMovements 1960, 1969, 1978 and 1990 (revised version). The 1982, 1992 and 1997 editions ofthe Code did not show any change from their preceding ones.
Note: Bold: new items, not included before under another item.Italic: items that have partially or totally changed from one list to the other.
a Revised.
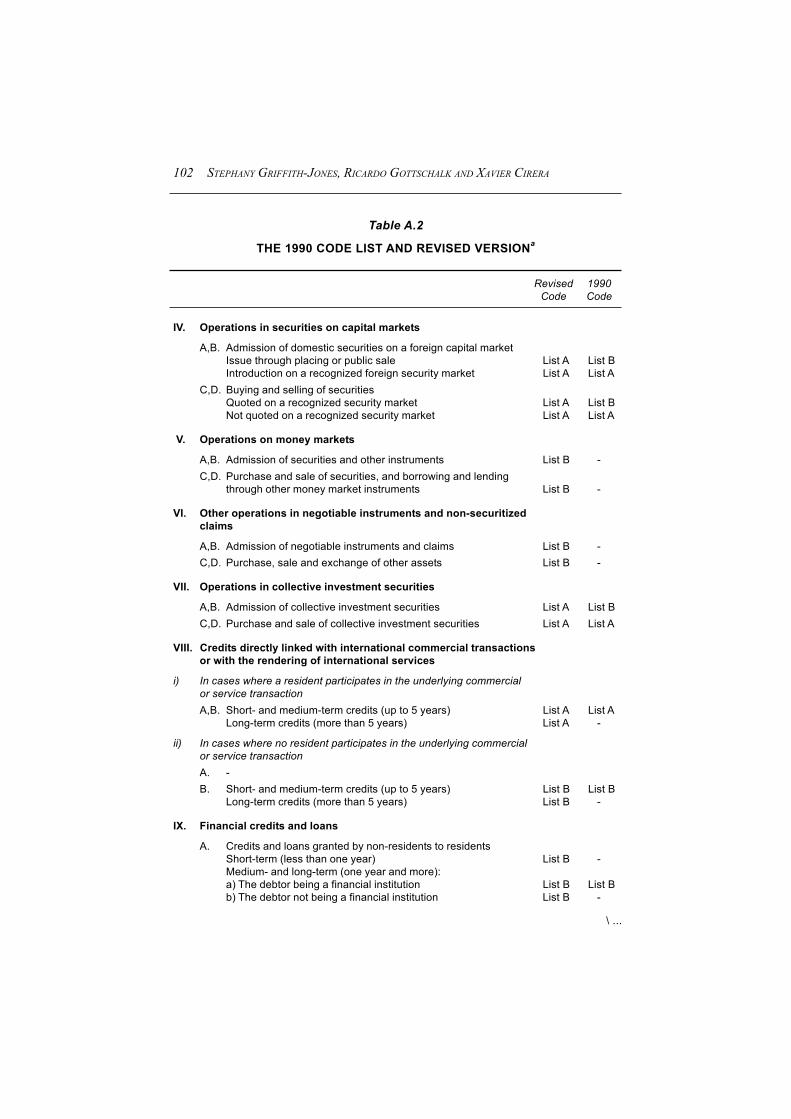
STEPHANY GRIFFITH-JONES, RICARDO GOTTSCHALK AND XAVIER CIRERA102
Table A.2
THE 1990 CODE LIST AND REVISED VERSIONa
Revised 1990Code Code
IV. Operations in securities on capital markets
A,B. Admission of domestic securities on a foreign capital marketIssue through placing or public sale List A List BIntroduction on a recognized foreign security market List A List A
C,D. Buying and selling of securitiesQuoted on a recognized security market List A List BNot quoted on a recognized security market List A List A
V. Operations on money markets
A,B. Admission of securities and other instruments List B -C,D. Purchase and sale of securities, and borrowing and lending
through other money market instruments List B -
VI. Other operations in negotiable instruments and non-securitizedclaims
A,B. Admission of negotiable instruments and claims List B -C,D. Purchase, sale and exchange of other assets List B -
VII. Operations in collective investment securities
A,B. Admission of collective investment securities List A List BC,D. Purchase and sale of collective investment securities List A List A
VIII. Credits directly linked with international commercial transactionsor with the rendering of international services
i) In cases where a resident participates in the underlying commercialor service transactionA,B. Short- and medium-term credits (up to 5 years) List A List A
Long-term credits (more than 5 years) List A -
ii) In cases where no resident participates in the underlying commercialor service transactionA. -B. Short- and medium-term credits (up to 5 years) List B List B
Long-term credits (more than 5 years) List B -
IX. Financial credits and loans
A. Credits and loans granted by non-residents to residentsShort-term (less than one year) List B -Medium- and long-term (one year and more):a) The debtor being a financial institution List B List Bb) The debtor not being a financial institution List B -
\ ...
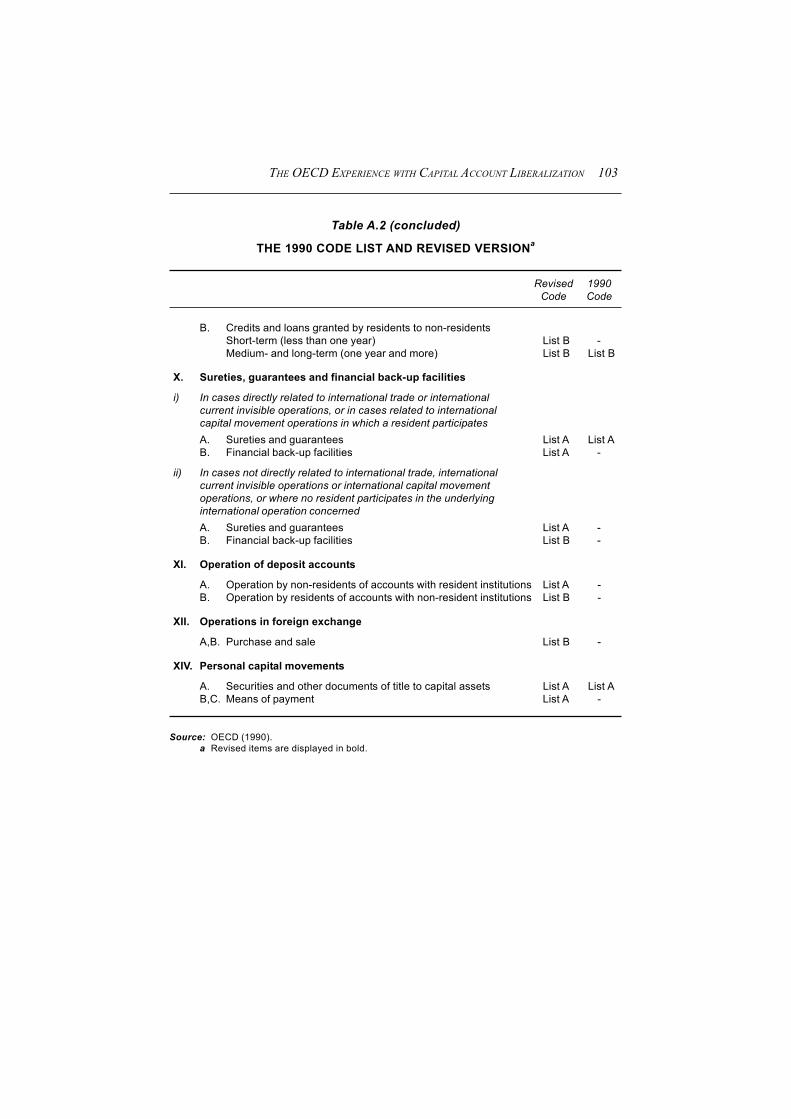
THE OECD EXPERIENCE WITH CAPITAL ACCOUNT LIBERALIZATION 103
B. Credits and loans granted by residents to non-residentsShort-term (less than one year) List B -Medium- and long-term (one year and more) List B List B
X. Sureties, guarantees and financial back-up facilities
i) In cases directly related to international trade or internationalcurrent invisible operations, or in cases related to internationalcapital movement operations in which a resident participatesA. Sureties and guarantees List A List AB. Financial back-up facilities List A -
ii) In cases not directly related to international trade, internationalcurrent invisible operations or international capital movementoperations, or where no resident participates in the underlyinginternational operation concernedA. Sureties and guarantees List A -B. Financial back-up facilities List B -
XI. Operation of deposit accounts
A. Operation by non-residents of accounts with resident institutions List A -B. Operation by residents of accounts with non-resident institutions List B -
XII. Operations in foreign exchange
A,B. Purchase and sale List B -
XIV. Personal capital movements
A. Securities and other documents of title to capital assets List A List AB,C. Means of payment List A -
Source: OECD (1990).a Revised items are displayed in bold.
Table A.2 (concluded)
THE 1990 CODE LIST AND REVISED VERSIONa
Revised 1990Code Code

STEPHANY GRIFFITH-JONES, RICARDO GOTTSCHALK AND XAVIER CIRERA104
Table A.3
DEROGATION INVOKED UNTIL 1993
Invocation of Cessation of Durationderogation invocation (Years)
Australia 09/1972 06/1978 5.75Austria 11/1972 08/1980 7.75Belgium - - 0Canada - - 0Denmark 02/1979 03/1983 4.08Finland 06/1985 01/1991 5.58France - - 0Germany 06/1972 01/1974 1.58Germany 02/1973 11/1980 7.75
Germany (total) 9.33Greece 09/1967a 06/1980 22.75Iceland 1961a 12/1990 29.92Iceland 01/1993 - -Ireland - - 0Italy 04/1969 01/1978 8.66Japan 01/1972 11/1973 1.83Japan 03/1978 02/1979 0.91
Japan (total) 2.74Luxembourg - - 0Netherlands - - 0New Zealand - - 0Norway 11/1984 12/1989 5.08Norway 08/1986 12/1989 3.33
Norway (total) 8.41Portugal 1968a 1981 13Portugal 1977 1981 4Portugal 1983 1987 4Portugal 07/1991 11/1992 1.33
Portugal (total) 22.33Spain 1959a 1962 3Spain 07/1982 06/1985 2.92
Spain (total) 5.92Sweden 09/1969 06/1986 16.75Switzerland 03/1964 10/1966 2.58Switzerland 07/1972 02/1974 1.58Switzerland 02/1978 01/1979 0.92
Switzerland (total) 5.08Turkey 1962a 1985 23United Kingdom 05/1966 03/1971 4.83United States 01/1968 04/1974 6.25
Average years of derogation for countries with general derogation(Greece, Iceland, Portugal, Spain and Turkey)b 20.78
Average years of derogation for countries without general derogation 4.48Average years of derogation for OECD countries until 1993b 7.56
Source: OECD (1993).a General dispensation from the liberalization provisions of the Code.b Without considering second derogation in Iceland.

THE OECD EXPERIENCE WITH CAPITAL ACCOUNT LIBERALIZATION 105
NOTES
1 For a more elaborate discussion on this point, see for example, Akyuz (2000).2 See OECD (1995) for a detailed account of the historical background of the OECD
Code of Liberalization of Capital Movements.3 The OEEC was founded by Austria, Belgium, Denmark, France, Germany, Greece,
Iceland, Ireland, Italy, Luxembourg, the Netherlands, Norway, Portugal, Sweden, Swit-zerland, Turkey and the United Kingdom. Spain and the former Yugoslavia were in-cluded as countries with “special status”, and outside Europe, Canada and the UnitedStates were made “associate members”.
4 The original OECD members were Canada, Spain and the United States, in addition tothe 17 founders of the OEEC listed in the previous footnote. Those that joined nextwere Japan (1964), Finland (1969), Australia (1971) and New Zealand (1973). In the1990s a new wave of accession took place: first with Mexico (1994), then the CzechRepublic (1995), and, finally, the Republic of Korea, Hungary and Poland in 1996.
5 Liberalization here means the abolition of government restrictions on both transactionsand transfers of those operations specified in the Code.
6 For example, there are instances in which certain items of the Code have not beendeveloped in the country’s domestic financial market; hence reservations on these canbe applied only when such items finally come into existence.
7 Reservations and derogation are periodically examined by the Committee on CapitalMovements and Invisible Transactions (CMIT). In the case of reservations, the purposeis to review existing provisions and amendments, as well as to propose their removalwhen they are no longer deemed necessary. This task is conducted on a country-by-country basis. In the case of derogation, the purpose is to restore liberalization as quicklyas possible.
8 The major exceptions are credits and loans from non-residents to residents other thanenterprises. According to OECD (1995: 22), this springs from the desire to protect con-sumers.
9 However, it should be noted that since the early 1960s operations involving easily re-versible flows were permitted, such as physical movements of securities (see box 1).
10 These were: Austria, Belgium, Denmark, France, Germany, Ireland, Italy, Luxembourg,the Netherlands, Sweden, Switzerland, and the United Kingdom, followed by Canada,the United States, Japan, Finland, Australia and New Zealand.
11 Iceland may be an exception, given its relatively high income per capita at the time ofits adherence to the Code.
12 Under such requirements, the newcomers did not apply a general derogation at the timeof accession, even though, in theory, this is still possible, since Article 7a has not beenremoved from the Code. This suggests that there seems to have been a tendency to-wards a growing gap between the formality of the Code and the unwritten rules forcapital account liberalization in the OECD area.
13 For a discussion of the Japanese experience with capital account liberalization, see,inter alia, Mathieson and Rojas-Suarez (1992).

STEPHANY GRIFFITH-JONES, RICARDO GOTTSCHALK AND XAVIER CIRERA106
14 Reservations on items of the Code can be total (i.e. cover the whole item) or partial (i.e.cover just one or a few sub-items).
15 As stressed above, this is true in relative terms. Moreover, if, for comparative purposes,we take the dates when the second-wave countries removed their general derogation(rather than when they adhered to the Code), the number of reservations they used washigher than that used by the third-wave countries; again, this is in relative terms, but forspecific countries in absolute terms as well. Greece, for example, had 17 reservations inplace at the time it dropped its general derogation.
16 This sub-section benefited from Solanes (1999).17 Restrictions on portfolio and short-term outflows were also in place during this period.18 See Dedek (1999) for a detailed account of capital account liberalization in the Czech
Republic.19 The OECD had, on the insistence of the Czech authorities, allowed the use of such
interest-free reserve requirements on inflows for a time-limited period (personal inter-view).
20 In the 1980s, preliminary steps had already been taken , with foreigners being permit-ted to invest in the Korean stock markets through investment trust funds (Park andSong, 1998).
21 Personal communication.22 This paragraph is based on interviews with Korean officials and academics.
REFERENCES
Akyuz Y (2000). The debate on the international financial architecture: reforming the reform-ers. UNCTAD Discussion paper no 148, Geneva, UNCTAD, April.
Akyuz Y and Cornford A (1994). Regimes for international capital movements and someproposals for reform. UNCTAD Discussion paper no 83, Geneva, UNCTAD, May.
Chang H-J (1998). Korea: the misunderstood crisis. World Development, 26(8):1555–1561.Chang H-J et al. (1998). Interpreting the Korean crisis: financial liberalization, industrial
policy and corporate governance. Cambridge Journal of Economics, 22: 735–746.Dedek O (1999). Capital account liberalization in the Czech Republic. In: Drabek Z and
Griffith-Jones S, eds., Managing Capital Flows in Turbulent Times: The Experience ofEurope’s Emerging Market Economies in Global Perspective. Armonk, New York, M.E. Sharpe: 98–115.
Dedek O (2002). Currency shake-up 1997: A case study of the Czech Economy. In: Griffith-Jones S, Gottschalk R and Cailloux J, eds., Capital Flows in Calm and Turbulent Times:The Quest for a New Financial Architecture. Ann Arbor, IL, Universirty of MichiganPress (forthcoming).
Edwards S (1997). The Mexican peso crisis: How much did we know? When did we know it?NBER Working paper 6334, Cambridge, MA, National Bureau of Economic Research,December.

THE OECD EXPERIENCE WITH CAPITAL ACCOUNT LIBERALIZATION 107
Griffith-Jones S (1996). The Mexican peso crisis. IDS Discussion paper 354, Institute ofDevelopment Studies, University of Sussex, Sussex, July.
Klacek J (1999). Economic transformation, exchange rate, and capital inflows in the CzechRepublic. In: Drabek Z and Griffith-Jones S, eds., Managing Capital Flows in Turbu-lent Times. The Experience of Europe’s Emerging Market Economies in Global Per-spective. Armonk, New York, M. E. Sharpe: 78–97.
Mathieson DJ and Rojas-Suarez L (1992). Liberalization of the capital account: experiencesand issues. IMF Working Paper 92/46, International Monetary Fund, Washington, DC,June.
McKinnon R (1991). The Order of Economic Liberalization: Financial Control in the Transi-tion to a Market Economy. Baltimore, MD, Johns Hopkins University Press.
OECD (1995). Introduction to the OECD Codes of Liberalization of Capital Movements andCurrent Invisible Operations. Paris, ECMT, OECD.
OECD (1993). Exchange Control Policy. Paris, OECD.OECD (1990). Liberalization of Capital Movements and Financial Services in theOECD Area. Paris, OECD.OECD (1989). Competition in Banking. Paris, OECD.OECD (1987). Introduction to the OECD Codes of Liberalization. Paris, OECD.OECD (various). Code of Liberalization of Capital Movements, various issues. Paris, OECD.Park W-A (2001). Korea’s management of capital flows in the 1990s. In: Griffith-Jones S,
Montes M and Nasution A, eds., Short-Term Capital Flows and Economic Crises. UNU/WIDER Studies in Development Economics. Oxford, Oxford University Press,
Park YC and Park I (2002). Who destabilized the Korean stock market?. In: Griffith-Jones S,Gottschalk R and Cailloux J, eds., Capital Flows in Calm and Turbulent Times: TheQuest for a New Financial Architecture. Ann Arbor, MI, University of Michigan Press.
Park YC and Song C-Y (1998). Managing foreign capital flows: the experiences of the Re-public of Korea, Thailand, Malaysia and Indonesia. In: Helleiner GK, ed., Capital Ac-count Regimes and the Developing Countries. London, Macmillan Press.
Poret P (1998). The Experience of the OECD with the Code of Liberalization of Capital Movements.Paris, OECD. http://www.oecd.org//daf/investment/legal-instruments/oecdexp.htm.
Shin I and Wang Y (1999). How to sequence capital market liberalization: Lessons from theKorean experience. Working paper 99–30, Korea Institute for International EconomicPolicy, Seoul, Korea.
Solanes JG (1999). International capital flows in the Spanish Economy. Lessons from theexperience of the last ten years. In: Drabek Z and Griffith-Jones S, eds., ManagingCapital Flows in Turbulent Times: The Experience of Europe’s Emerging Market Econo-mies in Global Perspective. Armonk, New York, M. E. Sharpe: 172–212.
Wang, Y. (2000). Getting the sequencing right: The Korean experience in the capital marketliberalization. Mimeo, Korea Institute for International Economic Policy, Seoul, Korea.
Williamson J and Mahar M (1998). A survey of financial liberalization. Essays in Interna-tional Finance, No. 211, November.

MANAGEMENT OF THE CAPITAL ACCOUNT: A STUDY OF INDIA AND MALAYSIA 109
MANAGEMENT OF THE CAPITAL ACCOUNT:A STUDY OF INDIA AND MALAYSIA
Indira Rajaraman
I. INTRODUCTION
A. India and Malaysia
This paper contrasts the approaches of India and Malaysia to capitalaccount management, which, although widely different historically, havearrived at a remarkable convergence after the East Asian crisis of 1997.The paper does not compare Malaysia with its East Asian neighbours interms of post-1997 outcomes or in terms of their relative situations at thetime of the crisis, as this ground is already covered in a large body ofliterature (see for example, Borgini, Claessens and Ferri, 2000; Das, 1999;Furman and Stiglitz, 1998; Radelet and Sachs, 1998).
India and Malaysia are macroeconomically quite disparate. Table 1presents a summary macroeconomic profile that highlights the vastdifferences between the two. Beyond the more obvious differences ineconomic size in terms of total and per capita GDP, there is the historicalgrowth differential. India took birth in 1991 as an open economy after30 years of slow autarkic growth at 3.5 per cent, and some speeding up to

INDIRA RAJARAMAN110Ta
ble
1
MA
CR
OEC
ON
OM
IC P
RO
FILE
FO
R M
ALA
YSIA
AN
D IN
DIA
, 199
7–19
99
Mal
aysi
aIn
dia
1997
1998
1999
1997
1998
1999
GN
Pm
p ($ b
illio
n)94
.868
.673
.541
7.2
426.
544
1.8
Popu
latio
n (m
illio
n)21
.722
.222
.796
2.4
979.
799
7.0
Per c
apita
GN
P (c
urre
nt $
)4
369
3 09
03
237
434
435
443
PPP
(cur
rent
$)
8 55
57
699
7 64
02
019
2 06
02
230
Fore
ign
rese
rves
($ b
illio
n)15
.626
.230
.929
.432
.538
.0Im
port
cove
r (m
onth
s)3.
45.
75.
96.
98.
28.
2
Gro
wth
rate
of G
DP
(rea
l)7.
3-7
.45.
65.
06.
86.
4
Shar
e of
GD
P (p
er c
ent)
Gro
ss d
omes
tic in
vest
men
t43
.026
.622
.326
.223
.423
.3G
ross
dom
estic
sav
ing
43.9
48.5
47.3
24.7
22.3
22.3
Expo
rts (g
oods
& n
on-fa
ctor
ser
vice
s)93
.311
5.2
121.
711
.211
.512
.1
Exte
rnal
deb
t /G
DP
(per
cen
t)60
.656
.757
.824
.423
.522
.0Sh
ort-t
erm
/tota
l ext
erna
l25
.319
.915
.05.
44.
54.
1D
ebt-s
ervi
ce ra
tio5.
56.
75.
819
.018
.016
.0
Fisc
al (p
er c
ent)
Cur
rent
bal
ance
/GD
P7.
54.
34.
0-3
.1-3
.9-3
.8
Infla
tion
rate
(CPI
) (pe
r cen
t)2.
75.
32.
87.
213
.25.
0
Sour
ce:
Dat
a on
GN
P in
cur
rent
and
PPP
$ fr
om W
orld
Ban
k, W
orld
Dev
elop
men
t Ind
icat
ors
2000
; all
othe
r dat
a fro
m c
ount
ry s
ourc
es. F
or M
alay
sia
from
Ban
k N
egar
aM
alay
sia
(BN
M),
Annu
al R
epor
t 199
9, a
nd M
onth
ly S
tatis
tical
Bul
letin
(Jun
e 20
00);
for I
ndia
from
Res
erve
Ban
k of
Indi
a (R
BI),
Ann
ual R
epor
t 200
0, a
nd B
ulle
tin(A
ugus
t 200
0) (e
xcep
t inf
latio
n; s
ee n
otes
to ta
ble
2).
Not
e:In
dian
figu
res
perta
in to
the
Indi
an fi
scal
yea
r, w
hich
runs
from
1 A
pril
to 3
1 M
arch
. The
deb
t sto
ck fi
gure
s (s
hort-
term
sha
re) c
orre
spon
ding
ly p
erta
in to
the
end
of th
e fis
cal y
ear (
i.e. e
nd-M
arch
200
0) fo
r the
yea
r 199
9. T
he fi
scal
bal
ance
for I
ndia
cov
ers
the
cent
ral G
over
nmen
t alo
ne. C
PI=
cons
umer
pric
e in
dex.

MANAGEMENT OF THE CAPITAL ACCOUNT: A STUDY OF INDIA AND MALAYSIA 111
an average growth rate of 5.6 per cent in the period 1980–1990, the decadejust prior to the big-ticket reforms of the 1990s. By contrast in Malaysia, amember of the second-rank quadruplet of Asian tigers, no decade prior tothe1990s saw average growth under 5.2 per cent and no year in the 1990shad growth below 8.9 per cent until 1997, when the rate fell to 7.3 percent. Supporting this historical growth disparity are vast differences insavings as a per cent of GDP, at the 25 per cent mark in India, and at nearlythe 50 per cent mark in Malaysia. The investment rate, historically high inMalaysia but below the savings rate (the obverse of a historically positivebalance on trade in goods and non-factor services) has come down in thepost-crisis years to 22 per cent in 1999, with a corresponding widening ofthe favourable balance of trade. In India, the investment rate lies typicallyat about 1.5 percentage points above the savings rate, the obverse of ahistorically negative balance of trade. The Malaysian Government contri-buted to domestic savings with positive current fiscal balances, whichcontinued throughout the crisis and post-crisis years; in India on the otherhand, the Government dissaves, with negative current fiscal balances onthe central Government account alone amounting to between 3 and 4 percent of GDP.
Clearly the most startling difference between the two economies liesin their degree of openness. Exports in Malaysia have traditionally beenroughly equivalent to GDP, and have actually exceeded GDP in the post-crisis years; India on the other hand had an export/GDP ratio at the11–12 per cent level during the period 1997–1999, a notch up from ratiosusually well below 10 per cent prior to that period.
The Malaysian tradition of openness goes back a long way. Malaysiaaccepted Article VIII status under the IMF (current account convertibility)as far back as November 1968. The Malaysian ringgit was floated at thesame time as the major world currencies, in 1973 (see appendices A and B,which list external policy milestones in India and Malaysia respectively).India, on the other hand, accepted Article VIII status only in August 1994,following a unified floating rate for the rupee in March 1993.
Progress towards capital account convertibility in Malaysia began withthe ringgit float in 1973, with a second major thrust in 1987. By 1990,
INDIRA RAJARAMAN112
there was even an offshore over-the-counter (OTC) market for Malaysianshares in Singapore which reinforced a pre-existing offshore ringgit market,perhaps the only case of an offshore market for a developing countrycurrency. In India, by contrast, capital account convertibility has neverexisted for residents, although non-resident capital inflows are fullyconvertible. The 1997 Reserve Bank of India (Tarapore) Committee recom-mendation of a phased move to full capital account convertibility by 2000(Reserve Bank of India (RBI), 1997) was not adhered to on account offailure to meet its recommended prudential markers on the fiscal andinflation fronts.
The Malaysian response to the currency crisis of 1997 backtrackedon what had been perhaps the longest tradition of openness on current andcapital accounts in the developing world. As the capital outflow crisis inEast Asia hit Malaysia with full force (although Malaysia was inexplicablyexcluded by Summers (2000) from the list of Asian countries affected bythe crises), the country famously imposed capital exit barriers and a policyof lower interest rates that ran directly orthogonal to the policy in otherEast Asian countries similarly afflicted.
By contrast, the Indian external liquidity crisis in mid-1991, whenforeign reserves fell to an all-time low of $1 billion, led to the opening upof the Indian capital account. Following the opening up of the Indianeconomy in 1991, there was a period, mid-decade, when the principalproblem of capital account management arose from too large an inflowrather than too little. This was a problem in Malaysia as well at around thesame period, handled through temporary entry barriers that were soondismantled as the situation turned.
The East Asian crisis of 1997 reaffirmed the possibility of multipleequilibria in currency markets. The issue of whether hedge funds played arole in the crisis is empirically unproven, and is less important than thestrenuous attempts made to investigate the matter might initially suggest.The finding by Brown, Goetzmann and Park (1998), of an absence of anycorrelation between hedge fund short positions in Asian currencies andmovements in exchange rates, had methodological flaws, which yieldedimplausible overestimates of hedge fund short positions. What these

MANAGEMENT OF THE CAPITAL ACCOUNT: A STUDY OF INDIA AND MALAYSIA 113
attempts have served to highlight is the severe paucity of information onhedge funds. Reported figures suggest that hedge funds may be less gearedthan commercial and investment banks, but it is well-known that hedgefunds rely principally on off-balance-sheet techniques to obtain leverage.
Even if market manipulation in its many forms – whether action-based(insider trading), information-based (rumour spreading), or trade-based(cornering markets) – is ruled out as a contributory factor, it is clear thatherd behaviour with positive feedback can precipitate a crash, with sellinglow inducing further herd selling and therefore becoming profitable. Thiscan then be transmitted across markets through pure contagion, where goodmacro-policy and capital markets, characterized by high secondaryliquidity, are no guarantee against infection. On the contrary, high liquiditymay accentuate amenability to infection, as indeed was the case in Malaysia.
B. The issues
This study examines what has been done in both India and Malaysiain terms of controlling the quantum and the composition of capital flows.There are two main relevant issues in composition: debt/equity composition,and the maturity structure of external debt.
In terms of a hierarchy of desired forms of capital inflows, equityinvestment is thought superior to debt inflows because of the sharing ofrisk (for countries as for corporates); and within equity flows, directinvestment is superior to portfolio investment because of the greater stakein the host country. But between portfolio and debt, the relative hierarchyis less clear. The short-term component of external debt is by no means acomplete measure of the scope for short-term capital outflows. Defendantsof portfolio capital tend to dismiss its potential volatility as low, on thegrounds that downward revisions in expectations regarding stocks impingeequally on domestic and foreign investors, so that changes in expectationswould be fully reflected in downward stock market valuations, and not atall (or very little) in foreign investor sale and exit. The East Asian crisishas dramatically shown the falsity of that position. Such a position in one

INDIRA RAJARAMAN114
market leads to pressure on foreign investors to liquidate in third countries,even when stock expectations remain high, resulting in outward capitalflows from these third countries by contagion.
When potential outward capital flows by residents are added on topotential foreign investor outflows, it is clear that the proportion of short-term debt in total external debt is not so much a precipitator of capitaloutflows, as an indicator of how sharp the spike can be, whether precipitatedby contagion or real factors.
In 1999, external debt as a per cent of GDP was higher in Malaysia, at58 per cent (down from 61 per cent at the end of 1997), than in India at22 per cent (table 1). Also, although the Malaysian short-term debt as apercentage of total external debt declined from 25 per cent in 1997 to 15 percent in 1999, it was nevertheless much higher than the Indian short-termdebt of 4 per cent. However, external debt taken as a percentage of exportsalters somewhat the overall picture of greater conservatism in India thanin Malaysia in respect of external borrowing (table 2). India until 1999was above the prudent thumbrule of 200 per cent. Malaysia on the otherhand had an external debt/exports ratio of 44 per cent. The figures forshort-term external debt as a percentage of exports are even more startling:Malaysia’s at 5 per cent was far lower than India’s at 37 per cent at the startof the decade, and, despite a rise thereafter, exceeded India’s only in 1997.
Thus, normalized by exported tradeables rather than by the size ofthe economy aggregating across tradables and non-tradables, Malaysiadisplays greater external prudence than India over the 1990s. The debtservice ratio in Malaysia is correspondingly far lower, despite a much lowerconcessional proportion in total external debt in Malaysia (6 per cent) ascompared to India (41 per cent), a result of the far greater proportion ofexports in GDP (table 1).
Table 2 shows that in the 1990s Malaysia sustained stable annual flowsof FDI in the $2–4 billion range, whereas India saw a very slow climb tolevels of about $2 billion annually. Both countries saw a sharp increasein portfolio inflows mid-decade, which remained subsequently at the$3–4 billion level in India, but turned into net outflows of $10 billion in

MANAGEMENT OF THE CAPITAL ACCOUNT: A STUDY OF INDIA AND MALAYSIA 115Ta
ble
2
EXTE
RN
AL
IND
ICAT
OR
S FO
R M
ALA
YSIA
AN
D IN
DIA
IN T
HE
1990
s
1990
1991
1992
1993
1994
1995
1996
1997
1998
1999
Fore
ign
dire
ct in
vest
men
t ($
billi
on, g
ross
)M
alay
sia
....
..1.
83.
53.
83.
72.
41.
91.
8In
dia
0.2
0.1
0.3
0.6
1.0
2.1
2.4
3.6
2.6
2.2
Fore
ign
portf
olio
inve
stm
ent (
$ bi
llion
, net
)M
alay
sia
-1.0
-0.7
3.0
9.9
5.4
2.1
4.4
-10.
1-0
.30.
3In
dia
0.3
1.4
0.0
2.3
4.7
1.8
4.2
4.0
4.5
3.0
Exte
rnal
deb
t/exp
orts
of g
oods
and
non-
fact
or s
ervi
ces
(per
cen
t)M
alay
sia
51.8
48.5
48.9
50.9
42.3
40.6
42.1
65.0
49.2
44.0
Indi
a36
3.5
366.
838
2.7
337.
631
0.7
238.
022
4.7
209.
120
7.2
181.
8
Shor
t-ter
m d
ebt/e
xpor
ts o
f goo
ds a
ndno
n-fa
ctor
ser
vice
s (p
er c
ent)
Mal
aysi
a5.
06.
811
.512
.88.
27.
710
.816
.59.
86.
7In
dia
37.1
30.4
26.9
13.0
12.9
12.7
16.2
11.2
9.1
7.5
Exch
ange
rate
(per
iod
aver
age
LCU
/$)
Mal
aysi
a2.
72.
82.
62.
62.
62.
52.
52.
83.
93.
8In
dia
17.5
22.7
25.9
30.5
31.4
32.4
35.4
36.3
41.3
43.0
Sour
ce:
Wor
ld B
ank,
Wor
ld D
evel
opm
ent
Indi
cato
rs,
2000
, fo
r In
dia
alon
e, f
or p
roce
ssed
cal
enda
r ye
ar e
stim
ates
fro
m I
ndia
n fis
cal y
ear
(Apr
il-M
arch
) da
ta,
com
para
ble
to th
ose
for M
alay
sia,
whi
ch re
ports
by
cale
ndar
yea
r.N
ote:
Mal
aysi
an c
ount
ry s
ourc
es (s
ee s
ourc
es fo
r tab
le 1
) con
flict
ed s
erio
usly
with
the
Wor
ld B
ank
data
and
wer
e th
eref
ore
chos
en in
all
case
s. D
ata
on F
DI i
n th
efir
st th
ree
year
s w
ere
not a
vaila
ble.
LCU
= lo
cal c
urre
ncy
unit.
INDIRA RAJARAMAN116
1997 in Malaysia. Given the footloose character of portfolio flows, andgiven also the negative real impact of an interest rate hike, which is thestandard macroeconomic market corrective for capital outflows, it is notsurprising that exit barriers to capital outflows have become, and willremain, a component of the menu of policy options to stabilize currencymarkets. The case of Malaysia has incontrovertibly established the realeconomy benefits of temporary suspensions of capital convertibility (seealso Athukorala,1998; and James, 1999).
C. Outline of the paper
In what follows, the approach to capital account management in Indiais examined in section II, and in Malaysia in section III. Section IV presentsconclusions. Appendices A and B list major external policy milestones inIndia and Malaysia respectively.
II. INDIA
A. Introduction
The opening of the Indian economy began in July 1991, in immediateresponse to an external liquidity crisis, with foreign reserves falling to alow of $1 billion and a longer-term dissatisfaction with 40 years of slow,autarkic, growth. Prior to reform, the Indian rupee was not convertible oncurrent account, and was officially set at an undisclosed moving peg to abasket of currencies (see Rajaraman, 1991). Import tariff rates were amongthe most punitive in the world, and capital inflows were largely officialborrowings on concessional terms. Even today concessional debt accountsfor 40 per cent of total external debt. Foreign portfolio investment was notpermissible, and even FDI was regarded with suspicion and permissibleonly through case-by-case approval.

MANAGEMENT OF THE CAPITAL ACCOUNT: A STUDY OF INDIA AND MALAYSIA 117
Since 1991, the external price of the rupee has become market-determined, albeit with periods of intensive intervention by the ReserveBank of India (RBI). There is current account convertibility, with caps oninvisible outflows that vary by category, and there has been increasingfacilitation of foreign direct and portfolio investment. Capital outflowsfrom residents are still prohibited, although some liberalization of outwardFDI by corporates is now possible without prior approval, through shareswaps up to specified limits, and in excess of these limits with specialapproval. All outflows of capital from non-corporate residents remainbanned. Foreign capital inflows, on the other hand, are granted full freedomof repatriation, barring a few channels of inflows for non-resident Indiansthat are non-repatriable. Thus there is capital account convertibility fornon-residents but not for residents.
Since 1 June 2000, the legal regime governing both current and capitalaccount transactions is defined by the Foreign Exchange Management Act(FEMA) of 1999, which replaced the Foreign Exchange Regulation Act(FERA) of 1973. FERA restrictions were not on volume of capital inflowsso much as the denial of parity of treatment in terms of freedom offunctioning between “FERA” companies (those with more than 40 per centforeign equity) and other companies, and there were criminal penalties forcontravention of the ban on foreign exchange outflows from residents.
FEMA is a civil law, a major departure from FERA, and it does notapply to Indian citizens resident outside India, unlike FERA, which appliedto all Indian citizens regardless of the location of their residence. Thus,the passage of FEMA marks a major legal milestone in the opening up ofthe Indian economy. FEMA has a few residual restrictions on currentaccount transactions (7 banned categories; 16 requiring permission only ifa ceiling amount is crossed; and 11 needing permission irrespective ofamount). On the capital account, the FERA amendment of 1993 had alreadylegally enabled liberalization in respect of FDI and portfolio inflows thatwas very gradually introduced over the 1990s. FEMA introduced first-time liberalization of rules in respect of cross-border inheritance of property,and first-time automatic approval for outward FDI by corporates throughstock swap options, subject to sectoral caps, and with possible approvalbeyond those caps.

INDIRA RAJARAMAN118
In what follows, section II.B reviews the structure of the balance ofpayments (BOP) as it has evolved over the 1990s. Section II.C examinesin further detail current invisibles, which have kept the current accountdeficit at well under 1.5 per cent of GDP for all but one year in the decade,and reduced the need for capital inflows. Section II.D examines capitalaccount inflows in respect of foreign equity investment and FDI,commercial borrowings, and special deposit schemes for non-residentIndians (NRIs) – a peculiar feature of the Indian capital account. SectionII.E examines the return of flight capital during the 1990s, motivated bythe progressive liberalization of the current account. Section II.F examinesthe market for foreign exchange in India, and the anatomy of interventionsby the RBI in that market. There are no convertibility restrictions on foreigncapital; thus the willingness of foreign capital to enter is a function of thefundamentals of the Indian economy, and of its political and economicgovernance parameters. A key feature of this, the health of the financialsector, is addressed in section II.G. Section II.H concludes.
Appendix A lists Indian external policy milestones in the 1990s. Indianpolicy in any sphere is characterized by incremental dribble, withpunctuation at frequent intervals; the opening up in the 1990s shares thischaracteristic, although fortunately the moves are directionally monotonic.Instead of listing every change, which would render the Appendix tedious,we record only those which altered the essential parameters of policy, soas to make possible an understanding of the intent of the process at a glance.
B. The balance of payments: an overview
The first notable feature about the Indian current account after 1990/91,the crisis year preceding the introduction of reforms in July 1991, is thatthe deficit on current account has been at worst a little over 1.5 per cent ofGDP, usually well under (table 3). This has been not because of a lowdeficit on trade account, which had grown over the period to the region of$17 billion by 1999/00, but because of an explosion of net invisible inflowsstarting 1994/95, to the region of $13 billion by 1999/00. Clearly the

MANAGEMENT OF THE CAPITAL ACCOUNT: A STUDY OF INDIA AND MALAYSIA 119Ta
ble
3
IND
IA: O
VER
ALL
BA
LAN
CE
OF
PAYM
ENTS
, 199
0–20
00($
bill
ion)
Item
1990
/91
1991
/92
1992
/93
1993
/94
1994
/95
1995
/96
1996
/97
1997
/98
1998
/99
1999
/00
I.M
erch
. tra
de b
alan
ce (A
-B)
-9.4
4-2
.80
-5.4
5-4
.06
-9.0
5-1
1.36
-14.
82-1
5.51
-13.
25-1
7.10
A.
Exp
orts
, f.o
.b.
18.4
818
.27
18.8
722
.68
26.8
632
.31
34.1
335
.68
34.3
038
.29
B.
Impo
rts, c
.i.f.
27.9
121
.06
24.3
226
.74
35.9
043
.67
48.9
551
.19
47.5
455
.38
II.In
visi
bles
, net
-0.2
41.
621.
922.
905.
685.
4510
.20
10.0
19.
2112
.94
III.
Cur
rent
acc
ount
(I+I
I)-9
.68
-1.1
8-3
.53
-1.1
6-3
.37
-5.9
1-4
.62
-5.5
0-4
.04
-4.1
6/G
DP
(per
cen
t)-(
3.20
)-(
0.40
)-(
1.80
)-(
0.40
)-(
1.00
)-(
1.60
)-(
1.20
)-(
1.30
)-(
1.00
)-(
0.90
)IV
.C
apita
l Acc
ount
(A to
F),
net
7.19
3.78
2.94
9.70
9.16
4.69
11.4
110
.01
8.26
10.5
6A
.Fo
reig
n in
vest
men
t0.
100.
130.
564.
244.
814.
816.
155.
392.
415.
19B
.E
xter
nal a
ssis
tanc
e2.
213.
041.
861.
901.
530.
881.
110.
910.
820.
89C
.C
omm
erci
al b
orro
win
gs (m
& lt
)2.
251.
46-0
.36
0.61
1.03
1.28
2.85
4.00
4.36
0.33
D.
Rup
ee d
ebt s
ervi
ce-1
.19
-1.2
4-0
.88
-1.0
5-0
.98
-0.9
5-0
.73
-0.7
7-0
.80
-0.7
1E
.N
RI d
epos
its1.
540.
292.
001.
210.
171.
103.
351.
131.
742.
14F.
1. S
hort
term
trad
e cr
edits
1.08
-0.5
2-1
.08
-0.7
70.
390.
050.
84-0
.10
-0.7
50.
382.
Oth
er c
apita
l1.
200.
620.
833.
572.
21-2
.48
-2.1
6-0
.54
0.48
2.42
V.O
vera
ll B
alan
ce (I
II+IV
)-2
.49
2.60
-0.5
98.
545.
79-1
.22
6.79
4.51
4.22
6.40
VI.
Res
erve
s an
d re
late
d ite
ms
2.49
-2.6
00.
59-8
.54
-5.7
91.
22-6
.79
-4.5
1-4
.22
-6.4
0
IV(A
+C+E
+F)/I
II (p
er c
ent)
(64)
(168
)(5
5)(7
64)
(256
)(8
1)(2
39)
(179
)(2
04)
(251
)
Sour
ce:
Res
erve
Ban
k of
Indi
a, H
andb
ook
of S
tatis
tics
on In
dian
Eco
nom
y, 1
999,
tabl
es 1
22 a
nd 1
95 a
nd R
BI B
ulle
tin, a
ssor
ted
issu
es.
Not
e:S
tarti
ng in
199
0/91
, de
fenc
e im
ports
are
rec
orde
d in
the
yea
r of
impo
rt, w
ith m
ediu
m a
nd lo
ng t
erm
fin
anci
ng c
redi
ts in
clud
ed in
ext
erna
l com
mer
cial
borr
owin
gs; w
hen
defe
nce
impo
rts a
re g
row
ing
over
tim
e, th
e im
port
bill
in th
e im
porti
ng y
ear i
s la
rger
than
whe
n re
cord
ed a
t the
tim
e of
ser
vici
ng th
e cr
edit.
Oth
er c
hang
es m
ade
afte
r 199
0/91
do
not i
mpa
ct u
pon
the
capi
tal a
ccou
nt (s
ee n
otes
to ta
ble
5). “
Rup
ee d
ebt s
ervi
ce” (
item
IV.D
) is
in re
spec
t of r
upee
-de
nom
inat
ed e
xter
nal a
ssis
tanc
e fro
m th
e fo
rmer
CO
ME
CO
N, a
nd in
clud
es in
tere
st. S
hort-
term
trad
e cr
edits
exc
lude
loca
l cur
renc
y-ba
cked
cre
dit t
hrou
ghba
nkin
g ch
anne
ls (s
ee te
xt).
Oth
er c
apita
l inc
lude
s er
rors
and
om
issi
ons.

INDIRA RAJARAMAN120
composition of invisibles is a matter of some importance for an assessmentof whether this growth is sustainable (section II.C).
The low deficit on current account has meant that in most years of theperiod non-official capital flows have well exceeded 100 per cent of theaccount deficit (table 3). Thus, even though net official aid – bothconvertible and rupee-denominated components – has been negligible,except in the early 1990s, the decade has seen a rise in foreign reserves, toa stock of nearly $30 billion at the end of 1998/99 (table 4). This has beenthe single most important indicator of the success of the economic reformprogramme begun in July 1991. Indeed, for a period during the mid-1990s,the chief problem of capital account management arose from too large aninflow rather than too little.
Table 4
INDIA: EXTERNAL RESERVES, 1990–2000($ billion)
Foreign currency assets
End-March Total SDRs Gold Total Change
1990/91 5.83 0.10 3.50 2.24 -1.13
1991/92 9.22 0.09 3.50 5.63 3.40
1992/93 9.83 0.02 3.38 6.43 0.80
1993/94 19.25 0.11 4.08 15.07 8.63
1994/95 25.19 0.01 4.37 20.81 5.74
1995/96 21.69 0.08 4.56 17.04 -3.77
1996/97 26.42 0.00 4.05 22.37 5.32
1997/98 29.37 0.00 3.39 25.98 3.61
1998/99 32.49 0.01 2.96 29.52 3.55
1999/00 38.03 0.00 2.97 35.06 5.54
Source: Ibid., table 136, supplemented by RBI Bulletin, August 2000.Note: The figures in this table are not consistent with the figures from the same source for balance of
payments flow, because of changes in parities between constituent currencies in foreign assets.
MANAGEMENT OF THE CAPITAL ACCOUNT: A STUDY OF INDIA AND MALAYSIA 121
C. Invisibles in the current account
The major prop of the balance of payments in the 1990s has been thespurt of private transfers in the current account to annual inflows of around$12 billion, with two clearly visible discontinuous points of increase.
The first in 1993/94 was on account of the liberalization of goldimports, previously banned. The differential between the international andIndian prices of gold fuelled the infamous hawala channel of conversionof foreign currencies into and out of rupees. Hawala was an unofficial, butefficiently functioning, market whereby rupee assets were convertible intoforeign currencies obtained principally from diverted remittances, but alsofrom misinvoiced trade. With the 1992/93 decision to allow up to 5 kg ofgold per non-resident Indian (NRI) returning to the country, gold importsentered into formally reported imports, with a contra entry in what arenow recorded (implicit) private transfers, thus accounting for the increasein the latter starting in 1993/94. The net direct effect of each such goldimport on the current balance was thus neutral, but secondary effectsimproved the current account balance with the narrowing gap betweenofficial and hawala rates on the dollar, and the consequently reducedattraction of transmitting private transfers through the hawala route. Withthe permissibility, starting October 1997, of gold imports by designatedimporting agents, the domestic price of gold declined still more to paritywith international prices, thus eliminating altogether the market for divertedprivate transfers to finance gold smuggling.
The second discontinuous increase in transfers, starting in 1996/97,is the analogue of a policy change in respect of NRI deposits (see sectionII.E below).1 With the start in 1992/93 of non-repatriable external depositsdenominated in rupees, the first repayments of (non-repatriable) principalthree years down the line in 1996/97 were contra-entered as privatetransfers, although other accounting arrangements might have been devisedfor what are not current account flows. But given this recording convention,private transfers are now in the $10–12 billion range (see table 5). Otherinvisibles sum to zero because of steady outflows of the order of $3 billionon account of interest on external debt. Software exports have grown at

INDIRA RAJARAMAN122
explosive rates from an initial small base to reach present annual flows ofthe order of $4 billion per year.
D. Capital inflows
(i) Equity
The liberalization of FDI, effective as of 24 July 1991, followed soonthereafter by the signing of the Multilateral Investment Guarantee Agency(MIGA) protocol, could be said to mark the start of the big-ticket reformsof the Indian economy. First-time automatic approval up to 51 per centequity in 34 sectors was a major departure from the earlier regime of case-by-case consideration, with equity shares rarely permitted beyond a ceiling
Table 5
INDIA: INVISIBLES BY CATEGORIES OF TRANSACTIONS, 1990–2000($ billion)
Non-factor Factor Private Official Invisibles,services, net services, net transfers, net transfers, net net
Year (I) (II) (III) (IV) (I to IV)
1990/91 0.98 -3.75 2.07 0.46 -0.241991/92 1.21 -3.83 3.78 0.46 1.621992/93 1.13 -3.42 3.85 0.36 1.921993/94 0.54 -3.27 5.27 0.37 2.901994/95 0.60 -3.43 8.09 0.42 5.681995/96 -0.20 -3.21 8.51 0.35 5.451996/97 0.73 -3.31 12.37 0.41 10.201997/98 1.32 -3.52 11.83 0.38 10.011998/99 2.17 -3.54 10.28 0.31 9.211999/00 3.86 -3.56 12.26 0.38 12.94
Source: Ibid., table 124, supplemented by RBI Bulletin, August 2000.Note: Starting 1992/93, data on gold and silver brought in by Indian returning from abroad have been
included under import payments with a corresponding entry in private transfers. Starting 1996/97,repayments of non-resident non-repatriable rupee accounts were contra-entered as privatetransfers in the current account (see RBI Annual Report 1998-99, Box VI.3). Both changes reflectpolicy changes, and therefore do not introduce discontinuities in the data series.

MANAGEMENT OF THE CAPITAL ACCOUNT: A STUDY OF INDIA AND MALAYSIA 123
of 40 per cent, and, when permitted, subject to draconian limits on freedomof functioning prescribed under the FERA of 1973. These limits were doneaway with in January 1993 through amendment of the FERA.
Regulation of capital markets without government control was legallyenabled through statutory empowerment of the Securities Exchange Boardof India (SEBI) in January 1992. This made possible, for the first time,portfolio inflows from foreign institutional investors without case-by-casegovernment approval, subject to registration with SEBI, and an aggregateceiling of 24 per cent of issued share capital. Portfolio investment isrestricted to foreign institutional investors and high-net-worth individuals.Aggregate percentage ceilings have been steadily liberalized to the presentlevel of 40 per cent. Issue of convertible bonds and shares by Indiancompanies on foreign bourses through American Deposit Receipts (ADRs)and Global Deposit Receipts (GDRs) became permissible for the first timein April 1992, subject to government approval. This was an importantdevelopment, supplementing the opening up to foreign institutional in-vestors, because it enabled companies to reach investors unwilling to getembroiled in the settlements mess on Indian stock markets.
A landmark development was the incorporation in June 1996 of theNational Stock Depository, enabling paperless trading for the first time inIndia. Dematerialization remained optional, but with recognition of theNational Stock Depository by the American Securities Exchange Com-mission in August 1997 as an eligible foreign custodian, it became an optionalmost universally exercised by end-December 1999. Retail investors, otherthan foreign institutional investors, may still opt for the ADR/GDR route,but the premium has declined markedly.
Net equity/investment inflows responded to the lifting of these con-straints and touched a peak of $6 billion in 1996/97 (table 6), largely fuelledby portfolio flows. Portfolio inflows have fluctuated thereafter. Cumulativeinvestment by foreign institutional investors in India from 1993 to mid-2000stood at approximately $12 billion. A phased move, starting in June 1998,towards permission for forward exchange cover for foreign institutionalinvestors has progressed to permission for essentially full cover of exposure(in stages; see appendix A).

INDIRA RAJARAMAN124Ta
ble
6
IND
IA: F
OR
EIG
N IN
VEST
MEN
T/EQ
UIT
Y IN
FLO
WS,
199
0–20
00($
bill
ion)
1990
/91
1991
/92
1992
/93
1993
/94
1994
/95
1995
/96
1996
/97
1997
/98
1998
/99
1999
/00
A.D
irect
Inve
stm
ent
0.10
0.13
0.32
0.59
1.31
2.14
2.82
3.56
2.46
2.16
a.W
ith a
ppro
val (
SIA/
FIPB
)-
0.07
0.22
0.28
0.70
1.25
1.92
2.75
1.82
1.41
b.W
ithou
t app
rova
lR
BI-
-0.
040.
090.
170.
170.
140.
200.
180.
17N
RIa
-0.
060.
050.
220.
440.
730.
760.
600.
460.
57
B.P
ortfo
lio In
vest
men
t0.
010.
000.
243.
573.
822.
753.
311.
83-0
.06
3.03
a.G
DR
sb-
-0.
241.
522.
080.
681.
370.
650.
270.
77b.
FIIs
c0.
010.
000.
002.
051.
742.
071.
951.
18-0
.33
2.26
Tota
l (A
+B)
0.10
0.13
0.56
4.16
5.13
4.89
6.13
5.39
2.40
5.18
Sour
ce:
Res
erve
Ban
k of
Indi
a B
ulle
tin, A
ugus
t 200
0, ta
ble
46. T
here
are
dis
crep
anci
es b
etw
een
the
figur
es h
ere
and
thos
e in
the
BO
P s
tate
men
t.N
ote:
SIA
= S
ecre
taria
t for
Indu
stria
l App
rova
ls; F
IPB
= F
orei
gn In
vest
men
t Pro
mot
ion
Boa
rd; F
II =
Fore
ign
inst
itutio
nal i
nves
tmen
t.a
Incl
udes
acq
uisi
tion
of s
hare
s of
Indi
an c
ompa
nies
by
non-
resi
dent
s un
der s
ectio
n 29
of F
ER
A.
bIn
dian
Cor
pora
te is
sues
of G
loba
l Dep
osito
ry R
ecei
pts
(GD
Rs)
and
Am
eric
an D
epos
itory
Rec
eipt
s (A
DR
s).
cIn
clud
es o
ffsho
re fu
nds.

MANAGEMENT OF THE CAPITAL ACCOUNT: A STUDY OF INDIA AND MALAYSIA 125
FDI, on the other hand, has stagnated at around the $2 billion mark,despite the steady expansion of admissible sectors and relaxation ofprocedural requirements. India remains an insignificant destination forglobal FDI flows. Despite automatic FDI entry, possible for the first timein the 1990s, it is entry with approval, for investments crossing sectoralcaps or in sectors requiring licensing, that has remained the dominantcomponent. This may change with the placement in February 2000 of FDIin all sectors, but for a small negative list, in the automatic route.
(ii) Debt
External commercial borrowing is generally understood in India aspertaining to non-trade credit, even though such borrowings may carrysizeable import-earmarked components. There are three main parametersgoverning controls over external commercial borrowing: an aggregate capon such borrowing in any year, with preferences within the cap forinfrastructure and export; restrictions on use for rupee expenditure (i.e.other than foreign currency expenditure on imports), and a ban oninvestment in stock markets and real estate; and minimum maturity limits.
During the mid-1990s surge in capital inflows, the use of externalcommercial borrowing was confined to expenditure as foreign currencyon imports. With the passing of the surge, these rules were gradually easedover time, except at the short-maturity end of the spectrum. Shortermaturities have been discouraged through a lifting of end-use conditionsand approval procedures for longer maturities, subject to caps on theamounts so admissible, which vary directly with the length of the minimummaturity period. Today, end-use restrictions have been lifted altogether,and with that there is a floor maturity of three years. This rules out short-term, non-trade credit altogether.
A peculiar feature of the Indian capital account has been the specialdeposit schemes for non-resident Indians (see box 1), which are accordeda separate row in the balance of payments, distinct from external com-mercial borrowings. Foreign currency deposits carried no exchange riskfor depositors. During the long period until 1997, when deposit rates were

INDIRA RAJARAMAN126
Box 1
DEPOSIT SCHEMES FOR NON-RESIDENT INDIANS
A special deposit schemes for non-resident Indians, NR(E)RA, wasstarted in 1970, during the Bretton Woods era. With the start of amanaged float, a new FCNR(A) scheme was introduced in 1975 withall exchange risk assumed by the RBI. This was replaced in 1993–94by the FCNR(B) scheme, where exchange risk was transferred tocommercial banks. Details on the various schemes and their interestrate structure, are listed below.
Without exchange risk for depositors/banks.FCNR(A) Foreign Currency Non-Resident (Accounts), started
November 1975, closed 15 August 1994.
Without exchange risk for depositors only.FCNR(B) Foreign Currency Non-Resident (Banks), started May
1993.
With exchange risk for depositors.NR(E)RA Non-Resident (External) Rupee Accounts, started
February 1970.NR(NR)RD Non-Resident (Non-Repatriable) Rupee Deposits
(exchange risk only for repatriable interest), startedJune 1992.
NR(S)RA) Non-resident special rupee account with facilitiessimilar to those for resident accounts, introduced inmid-April 1999, but yet to attract inflows.
Interest rates were administratively set untilFCNR(B) 16 April 1997: ceiling rates
22 Oct. 1997: ceiling rate set at LIBOR29 April 1998 : ceiling rate set at
50 basis points > LIBOR for maturity > 1 year; and25 basis points < LIBOR for maturity < 1 year.
Rupee deposits22 April 1992: ceiling rates, usually 100 bp above domestic rates.16 April 1997: rates freed for all but short-term (< 1 yr);
corresponding domestic rates freed in stages betweenOctober 1995 and July 1996.
13 Sept. 1997: rates freed for all (all domestic fixed-term rates> 1 month freed 21 Oct. 1997).

MANAGEMENT OF THE CAPITAL ACCOUNT: A STUDY OF INDIA AND MALAYSIA 127
not linked to world rates, they offered clear arbitrage opportunities varyingfrom year to year as a function of the interest rate margin between theadministratively set deposit rate and world deposit rates, with the addi-tional factor of currency risk only in the case of rupee-denominateddeposits. The aggregate net inflows varied accordingly from year to yearin terms of both total and composition.
The interest rate structure on foreign currency deposits marked thefirst time that short-term deposits were formally discouraged, althoughthe earlier administered-rate regime is thought to have incorporated asimilar tilt in the rate structure. In October 1999, the minimum maturity offoreign currency, non-resident Indian deposits (FCNRB) was lengthenedto one year, from a floor maturity which had all along been set at six months,thus doing away with short-term deposits altogether. What is important tonote is that these policy nudges away from short-term deposits are recent,a clear effect of the 1997 East Asian crisis. The RBI has set up a SteeringCommittee and a Technical Group to work on a risk management modelfor sovereign external liability management in India.
The total stock of external debt has been well under $100 billion inthe 1990s (table 7). Differencing these stock data does not yield annualflows comparable to those in the balance of payments table, however,because of the valuation effect. Additionally, non-resident Indians’ non-repatriable rupee deposits are excluded from external debt stock figures,quite justifiably, perhaps, but this does pose problems of comparabilitywith the balance-of-payments flow data.
Short-term trade credits, and short-term deposits by non-residentIndians (until the October 1999 decision imposing a minimum maturity ofone year) together constitute aggregate external short-term liabilities. Short-term debt in Indian official figures is classified by original, not residual,maturity.
In stock terms, short-term liabilities, aggregating across (suppliers’)trade credits and non-resident Indian deposits, fell from $7.5 billion atend-March 1991 to $4.1 billion at end-March 2000, and in percentage terms,from around 10 per cent to around 4 per cent of total external liabilities.

INDIRA RAJARAMAN128Ta
ble
7
IND
IA: E
XTER
NA
L D
EBT
STO
CK
, 199
1–20
00($
bill
ion)
Long
-term
com
mer
cial
bor
row
ing
Trad
e cr
edits
aN
RI d
epos
itsb
Shor
t-ter
m
Tota
lLo
ans
Bond
scAg
greg
ate
Shor
t-ter
mSh
ort-t
erm
Aggr
egat
eSh
ort-t
erm
Shor
t-ter
mAg
greg
ate
Tota
lEn
d-M
arch
(Per
cen
t)(P
er c
ent)
(Per
cen
t)
1991
83.8
06.
833.
209.
104.
8052
.75
12.9
52.
7421
.16
7.54
9.00
1992
85.2
86.
724.
878.
224.
2351
.46
12.9
22.
8421
.98
7.07
8.29
1993
90.0
26.
495.
157.
282.
9640
.66
14.5
23.
3823
.28
6.34
7.04
1994
92.6
96.
316.
056.
991.
7925
.61
14.4
91.
8312
.63
3.62
3.91
1995
99.0
06.
666.
338.
621.
9923
.09
15.7
63.
3821
.45
5.37
5.42
1996
93.7
37.
236.
647.
532.
1528
.55
14.8
93.
8826
.06
6.03
6.43
1997
93.4
78.
535.
818.
812.
9533
.48
14.7
83.
7725
.51
6.72
7.19
1998
93.5
39.
987.
019.
382.
8530
.40
14.1
02.
1915
.53
5.05
5.40
1999
97.6
710
.34
10.7
58.
982.
1924
.39
14.5
42.
2015
.13
4.39
4.49
2000
98.4
49.
959.
429.
212.
5627
.80
16.0
61.
489.
224.
044.
10
Sour
ce:
Ibid
., ta
ble
137,
cor
rect
ed w
ith re
fere
nce
to R
BI,
Ann
ual R
epor
t 200
0, a
ppen
dix
tabl
e V
I.9.
aU
nlik
e th
e B
OP
tabl
e 12
2, e
xter
nal d
ebt s
tock
s lis
t (m
<)
trad
e cr
edits
sep
arat
ely
from
com
mer
cial
bor
row
ing.
bN
on-r
esid
ent I
ndia
n de
posi
ts h
ere
excl
ude
non-
repa
triab
le ru
pee
deno
min
ated
dep
osits
. Thu
s, th
e flo
ws
obta
ined
by
diffe
renc
ing
the
stoc
k fig
ures
her
e w
illno
t cor
resp
ond
to b
alan
ce o
f pay
men
ts fl
ows,
qui
te a
side
from
the
curr
ency
val
uatio
n ef
fect
.c
Bon
ds a
re a
ll se
curit
ized
bor
row
ings
incl
udin
g ne
t inv
estm
ent b
y 10
0 pe
r cen
t deb
t fun
ds o
f for
eign
inst
itutio
nal i
nves
tors
, and
incl
udin
g th
e R
esur
gent
Indi
aB
onds
issu
e of
199
8.

MANAGEMENT OF THE CAPITAL ACCOUNT: A STUDY OF INDIA AND MALAYSIA 129
The decline was sharpest and most steady in trade credits. Short-term non-resident Indian deposits rose to touch a peak of nearly $ 4 billion beforefalling after 1997, in a clear response to the formal linking of deposit ratesto the London Inter-Bank Offered Rate (LIBOR) established after that (thisshows that whatever attempts were made to curb short maturities beforethat were not very successful). There are no balance-of-payments flowdata on short-term non-resident Indian deposits (table 3). There are onlythe stock data which show a sharp decline after 1997, inclusive of thevaluation effect.
Short-term trade credit inflows as recorded in the balance of payments(table 3) were never exceptionally large, of the order of $1 billion even inthe pre-crisis year, 1990/91. In subsequent years these declined to negativeflows, again only of the order of $1 billion at most in any year. However,these flows are complete only in respect of suppliers’ credits. Short-termcredits of less than six months’ maturity through banking channels, backedby letters of credit, do not appear even in the residual “other capital” row,because commercial banks are not required to report trade credits of lessthan six months’ original maturity, for which no foreign exchange approvalis required.
The Bank for International Settlements (BIS) publishes external debtstock figures which do include short-term credits through banking channels.Despite this, total trade credits reported for India by the BIS are below theIndian figure. There are other areas of incomplete coverage in the BISdata.2 This is unfortunate, since the BIS is the only source on short-termdebt based on residual maturities. Thus the Indian official figures offer theonly series available with full coverage of all debt, and, within the param-eters of their limitations, they show a halving in the proportion of short-termdebt by original maturity over the decade.

INDIRA RAJARAMAN130
E. Returning flight capital
It is clear that there has been return of flight capital in the 1990s on amajor scale, motivated by the progressive liberalization of the currentaccount (including the legalization of gold imports already referred to),leading up to the August 1994 acceptance of IMF Article VIII status. Bymaking possible legitimate purchases of foreign currency and therebyreducing the need for external holdings of foreign currency, current accountliberalization has thus largely financed itself.
The fact of returning flight capital is acknowledged, but there aredifferences of opinion on the particular avenues used. One popular bodyof opinion holds that returning flight capital in India has been largelythrough export overinvoicing (export income throughout the 1990s wasnon-taxable; a first move towards phased taxation of export income wasbegun in April 2000). Somewhat confusingly, the impact of exportoverinvoicing is thought to be statistically evident, not so much in thecurrent account itself, where export figures are entered as declared atcustoms, but in the capital account in the “other capital” row, where foreigncurrency receipts in excess of customs declarations are accommodated.The argument against that holds that the errors and omissions componentof “other capital” is not large enough to suggest export overinvoicing on amassive scale. Another possible channel is through gold imports, althoughit is possible that transfers financing these have only moved to the formalfrom the informal channel, but continue to originate from earnings of non-residents rather than from flight capital of resident Indians.
Non-resident Indian deposits are among the capital account channelsavailable for returning flight capital. The inflows into the non-repatriablerupee schemes in particular are thought to be evidence of flight capitalreturn. The equity issues abroad (ADRs and GDRs) by Indian corporatesand bond issues, most recently Resurgent India Bonds in late 1998, whichraised about $4 billion, offer other avenues for flight capital return.
No official estimates are available of the stock of flight capital (Reddy,2000, denied the existence of it) nor, needless to say, of inflows of returning

MANAGEMENT OF THE CAPITAL ACCOUNT: A STUDY OF INDIA AND MALAYSIA 131
capital since 1991. A popular estimate is $9–10 billion a year, but this isnot rigorously underpinned.
F. The foreign exchange market
The Indian foreign exchange market remains thin, as acknowledgedin the RBI Annual Report, 2000. The price of the rupee has been market-determined ever since March 1993, with no official control over trends, asdistinct from episodes of volatility during which the RBI does activelyintervene. The rupee depreciated nominally, by around 7 per cent annuallyover the period 1995–2000 (see table 8). Although India escaped unscathedduring the Asian crisis of 1997, insulated from contagion effects by thelow exposure of foreign portfolio investors to the country, there have inrecent years been many episodes of volatility – periods of sharp downwardpressure on the rupee – which the RBI has actively intervened to correct.During the period 1999–2000, there were three such episodes: in end-May1999, end-August 1999, and again in end-May 2000.
In correcting these, the RBI’s intervention strategy relied essentiallyon aligning domestic short-term rates, in particular in the call-moneymarket, with interest rates implicit in forward premiums, by using its leversof control over the liquidity in the system so as to remove incentives toarbitrage. The standard levers of control used by central banks anywhere,the bank rate and the cash reserve ratio to be maintained by banks with thecentral bank, have been augmented with a liquidity adjustment facility(LAF), implemented starting June 2000 in a phased manner, wherebyliquidity is injected/removed from the system through reverse repo/repoauctions. The recommendations of the two Narasimham Committees haveserved as templates for financial sector reform in India, and the LAF wasintroduced on the recommendation of the second Narasimham Committee(Government of India, 1998; 1991).
The LAF will eventually completely replace the present set of mecha-nisms involving collateralized short-term lending facilities and a fixed raterepo provision. LAF auctions are conducted daily, and in August 2000 the

INDIRA RAJARAMAN132Ta
ble
8
IND
IA: E
XCH
AN
GE
RAT
ES A
ND
FIN
AN
CIA
L SE
CTO
R IN
DIC
ATO
RS,
199
0–20
00
1990
/91
1991
/92
1992
/93
1993
/94
1994
/95
1995
/96
1996
/97
1997
/98
1998
/99
1999
/00
Exc
hang
e ra
te (R
s/$)
End
per
iod
19.6
431
.23
31.2
431
.37
31.5
34.3
535
.92
39.5
42.4
443
.62
Ave
rage
17.9
424
.47
30.6
531
.37
31.4
33.4
535
.50
37.1
642
.07
42.6
5
Com
mer
cial
ban
k in
tere
st ra
tes
(end
-per
iod)
(per
cen
t)
Dep
osit
rate
(1 y
r.)9.
012
.011
.010
.011
.012
.011
.010
.59.
07.
5LI
BO
R (1
yr.)
8.5
6.3
4.2
3.6
5.6
6.2
5.8
6.1
5.5
5.7
(Dep
. rat
e –
LIB
OR
)0.
55.
76.
86.
45.
45.
85.
24.
43.
51.
8In
flatio
n ra
te13
.413
.66.
88.
39.
98.
210
.27.
29.
05.
0R
eal d
epos
it ra
te-4
.4-1
.64.
21.
71.
13.
80.
83.
30.
02.
5
Lend
ing
rate
s:M
in.
16.0
19.0
17.0
14.0
....
....
....
PLR
....
....
15.0
16.5
14.8
14.0
12.5
12.3
Sour
ce:
RB
I, H
andb
ook
of S
tatis
tics
on In
dian
Eco
nom
y, 1
999,
tabl
es 1
27, 1
56; s
uppl
emen
ted
by R
BI,
Ann
ual R
epor
t 200
0, a
ppen
dix
tabl
e I.2
and
RB
I, M
onth
lyB
ulle
tin; G
over
nmen
t of I
ndia
, Eco
nom
ic S
urve
y, 1
999–
2000
, tab
le 5
.3; a
nd IM
F, In
tern
atio
nal F
inan
cial
Sta
tistic
s fo
r LIB
OR
; ave
rage
Jan
./May
for 2
000.
Not
e:D
epos
it ra
tes
star
ting
from
199
5/96
, and
lend
ing
rate
s st
artin
g fro
m 1
994/
95 w
ere
freed
; the
PLR
cam
e in
to b
eing
effe
ctiv
e O
ctob
er 1
994,
with
the
rate
s he
reth
e of
ficia
lly re
porte
d av
erag
es a
cros
s th
e fiv
e bi
gges
t pub
lic s
ecto
r ban
ks. E
ffect
ive
29 O
ctob
er 1
999,
ban
ks w
ere
freed
from
ben
chm
arki
ng to
the
PLR
for
certa
in c
ateg
orie
s of
adv
ance
s. B
anks
are
requ
ired
to p
resc
ribe
a m
axim
um s
prea
d ov
er P
LR s
ince
199
6/97
, whi
ch th
ey a
re fr
ee to
det
erm
ine.
Infla
tion
rate
sar
e fro
m y
ear/e
nd v
alue
s of
the
CP
I for
urb
an n
on/m
anua
l wor
kers
. LIB
OR
rate
s pe
rtain
to c
alen
dar y
ear a
vera
ges
as re
porte
d in
the
sour
ce, o
verla
ppin
g w
ithth
e In
dian
fisc
al y
ear f
or th
ree
of th
e fo
ur q
uarte
rs.

MANAGEMENT OF THE CAPITAL ACCOUNT: A STUDY OF INDIA AND MALAYSIA 133
tenor of the repos auctioned was extended from one day up to a maximumof seven days. At the same time, the players authorized to participate inrepo auctions (i.e. to borrow from the RBI, and thus to get access to short-term liquid funds) have been steadily expanded to include non-bank entities,after a ban for some years on repos as a consequence of a scam in 1992involving the misuse of funds obtained through repos. The set of approvedmarket makers in both the primary and secondary markets in governmentsecurities, termed primary dealers, now numbers 15. An attempt is beingmade to impose internal control systems and capital adequacy requirementson non-bank primary dealers so as to place them on par with bank primarydealers.
Even with all the widening in levers of control over liquidity in thesystem, the RBI has had to resort to ad hoc direct tampering with interestrates on exports (export credit rates are still controlled by the RBI), andsurcharges on import finance (which are not controlled, hence the use ofsurcharges) in order to achieve targeted outcomes in the foreign exchangemarket.
The abrupt alteration in these during a volatility episode in mid-2000was seen as a hark back to an earlier era of instability in policy parameters.There was particular resentment over the halving in August 2000 of bothbalances in, and permissible accretions to, the exchange earners’ foreigncurrency (EEFC) accounts that exporters could maintain abroad. The EEFCScheme introduced in 1992 allowed exporters for the first time to retain aprescribed percentage of their receipts in foreign exchange with anauthorized dealer in India. The August 2000 ruling was reversed in October,with, however, retention of the new constraint introduced with that ruling,confining EEFC holdings to non-interest-bearing current accounts.
A forward market for foreign exchange now functions. The devel-opment of the forward market was given a major impetus with first-timepermission in April 1997 for forward contracts without documentaryevidence of underlying exposure, and beyond six months, subject, however,to a declaration of exposure and fairly stringent documentation. At thesame time, the case-by-case approval of currency swaps was replaced bypermission for authorized dealers to operate “swap books” within their

INDIRA RAJARAMAN134
open position limits. Forward cover for portfolio investments has beenpermitted starting in June 1998, extending in April 1999 to essentially thefull extent of exposure (appendix A).
G. Financial sector reform
Starting from a pre-reform scenario in which all deposit and lendingrates were prescribed, the interest rate deregulation introduced in October1994 has left only a single vestigial deposit rate still set by the RBI onsavings (non-term) deposits. Banks are now free even to offer floatingrates on term deposits. However, there remain many more controls onlending rates, on small loans (up to Rs 200,000) and subsidized, differentialrate of interest (DRI) loans to deprived sections, and on export credit, whichare prescribed at flat rates or capped. Lending rates on other loans arecapped at a maximum spread over the prime lending rate (PLR), with eachbank free to set both the benchmark PLR and the spread. Since October1997 banks have been free to set term-linked PLRs, and since October1999 they have also been freed from PLR benchmarking for certaincategories of advances.
Interest rate deregulation found banks in India with poor in-houserisk-assessment abilities. Indeed, the requirement of a maximum spread(as set by each bank) over PLR was introduced because banks’ inability toassess risk for sub-prime borrowers led initially to very large margins overthe PLR, far in excess of the underlying credit risk. The only formal liquidityrequirements in place (table 9) are the cash reserve ratio (CRR) and thestatutory liquidity ratio (SLR). During the pre-crisis period, the formerwas set at 15 per cent, while the latter, which provides a captive market forgovernment securities to finance fiscal deficits, was set at 38.5 per cent.Both the CRR and SLR have been brought down in tandem with interestrate deregulation, although banks continue to subscribe to risk-freegovernment securities well in excess of the present SLR of 25 per centbecause of continued in-house lacunae in credit and market risk assessmentcapabilities. The scrapping of CRR and SLR on inter-bank borrowings hasreduced friction in the call-money market and has led to the Mumbai Inter-

MANAGEMENT OF THE CAPITAL ACCOUNT: A STUDY OF INDIA AND MALAYSIA 135
Bank Offered Rate (MIBOR), which could develop into an effectivebenchmark (see also Williamson and Mahar, 1998).
The RBI issued a detailed set of guidelines for putting in place anasset-liability management (ALM) system for commercial banks inFebruary 1999, and for other financial institutions in January 2000. Theguidelines are equipped with periodic reporting requirements to the RBI,albeit without statutory conformity requirements or penal clauses. Mean-while, latitude in respect of fund deployment continues to widen. Sincethe latest liberalization in early September 2000, banks have been permitted5 per cent of total outstanding advances in equity and equity-linkedinstruments in the form of shares, convertible debentures, and units ofmutual funds. This is expected to deepen equity markets, reduce the domi-nance of external portfolio investors and lead to a revival of slow-growthstocks.
Table 9
INDIA: MONETARY CONTROL LEVERS, 1990–2000(Per cent end period)
Bank rate Cash reserve ratio (CRR) Statutory liquidity ratio
1990/91 10.0 15.0 38.51991/92 12.0 15.0 38.5a
1992/93 12.0 15.0 37.3a
1993/94 12.0 14.0 34.8a
1994/95 12.0 15.0 31.5a
1995/96 12.0 14.0 31.5a
1996/97 12.0 10.0 31.5a
1997/98 10.5 10.3 25.01998/99 8.0 10.5 25.01999/2000 8.0 9.0 25.0
Source: RBI, Handbook of Statistics on Indian Economy, 1999, table 36, supplemented by RBI, AnnualReport 2000.
Note: For change after 1 April 2000, see box in text.a These were on the stock of net liabilities on specified dates, with a reduced rate on incremental
liabilities beyond that date.

INDIRA RAJARAMAN136
A large number of initiatives have been undertaken to reduce frictionin the banking system, in payments settlements for both domestic and cross-border settlement. This will, among other beneficial effects, have a loweringeffect over time on rates at the short end of the market for liquidity. Amajor advancement towards enabling hedging of interest rate risks wasmade with the issue of guidelines in July 1999 for two rupee derivativeinstruments, forward rate agreements (FRAs) and interest rate swaps (IRS),permitting even market making participation without underlying exposure,but they are confined to plain vanilla contracts without explicit or implicitoption features such as caps/floors/collars.
Permission to hedge commodity price exposures through participationin futures or options contracts in international exchanges is now grantedby the RBI on a case-by-case basis. The recognition of the loss suffered in2000 on account of unhedged imports of oil at a time of rising internationaloil prices is likely to speed up the pace of deregulation on this front. Majorobstacles, however, are the large public sector presence in internationalcommodity imports and internal constraints on their functioning on accountof audit and vigilance regulations.
The traditional division in India between banks, as providers ofworking capital, and three term-lending financial institutions, as providersof project finance, was removed some years ago. The financial institutionsare gradually being brought under the regulatory mantle of the RBI. At thesmaller end of the size spectrum, non-bank financial institutions, have beenbrought under prudential control for the first time through the ReserveBank Amendment Act of 1997, with a minimum capital requirement forregistration and a higher requirement for the entitlement to accept freshpublic deposits.
The share of non-performing assets (NPAs) in total bank loans hasbeen a cause of worry for some years. Long time series on NPAs are notpossible because there has been a phased alteration of the definition of NPAscompleted only in 1994/95 (see Rajaraman, Bhaumik and Bhatia,1999).The most recent figures available relate to end-March 2000, and show agross NPA percentage of 12.8 per cent, and a corresponding net figure of6.8 per cent (see RBI, 2000). Although lower than the figures recorded at

MANAGEMENT OF THE CAPITAL ACCOUNT: A STUDY OF INDIA AND MALAYSIA 137
end-March 1997 of 15.7 per cent (gross) and 8.1 per cent (net), these arehigh figures by any standards, and clearly far removed from the target of5 per cent gross set by the Tarapore Committee for end-March 2000 as aprior requirement for full capital account convertibility (see RBI, 1997). Aparticularly interesting feature of NPAs in India is the enormous cross-sectional variation between banks as a function of vintage, ownership andregion of operation (for regression results explanatory of cross-sectionalNPA variations for 1996/97, see Rajaraman, Bhaumik and Bhatia, 1999).
A menu of options for the NPA problem has been offered to the bankingsystem through Debt Recovery Tribunals and Settlement AdvisoryCommittees. But these are hampered by an inadequate legal infrastructure(see RBI, Report on Currency and Finance, 1999–2000). The Governmentof India Budget for 2000/01 in February 2000 announced plans to establisha Financial Restructuring Authority to oversee recapitalization of weakbanks in the system.
The minimum capital to risk assets ratio has been raised from 8 to9 per cent effective as of 31 March 2000. The Government has announcedits intention to dilute its shareholding in public sector banks, whichdominate the banking sector, to 33 per cent, and banks are being encouragedto raise the requisite capital through the market rather than through strategictie-ups.
The Insurance Regulatory and Development Authority Act was passedin 1999, whereby banks and non-bank financial companies are permittedto enter the insurance market, breaking a government monopoly in placefor many decades in both life and non-life segments.
H. Conclusions
It is difficult to disentangle the essence of India’s approach to capitalaccount management through the thicket of liberalization notifications thathave been issued in a steady stream since the onset of the opening up ofthe economy in July 1991, bearing the Indian policy hallmark of gradual

INDIRA RAJARAMAN138
incrementalism. What is clearly in evidence, however, is the mono-tonicity of the direction of movement towards liberalization of cross-bordercapital flows.
The capital account today in India carries convertibility for non-residents but not for residents. Capital inflows, whether in the form of FDIor portfolio investment, are granted full freedom of repatriation. Theredoes exist a non-repatriable rupee deposit scheme for non-resident Indians,but it is an option exercised by the depositor, co-existing with repatriableschemes, and is clearly an invitation to returning flight capital. Residents,on the other hand, are not permitted to hold foreign currency accounts,except for exporters and other exchange earners in EEFC accounts. Outwardportfolio investment flows from non-corporate residents are prohibited.Outward investments by corporates through share swaps are permitted underthe new Foreign Exchange Management Act, effective from 1 June 2000,without approval subject to sectoral caps, and with approval otherwise.Under the new Act, contraventions of the ban on outward capital flows aretreated as a civil, rather than criminal, misdemeanour, a major alterationin the legal regime governing the capital account.
Capital account liberalization in India has been slow and cautious.The 1997 Report of the RBI (Tarapore) Committee recommended a three-year phased move to full convertibility by 2000 subject to achievement ofmacro targets (see appendix A) for the (overall) fiscal deficit, inflation,and the debt-service ratio, apart from targets for financial sector indicators.Of these, the fiscal deficit target of 3.5 per cent of GDP in 1999/2000 isnowhere near actuals for the year, which were 5.6 per cent for the centralGovernment alone, and 9.9 per cent combining central and state govern-ments.
The institutional changes needed to improve regulation of the stockmarket without strangulating government control were introduced at theoutset, but arrangements to dematerialize transactions in the share marketwere slow to follow. It is only as recently as April 1999 that the stocktransactions included in the major indices were fully dematerialized. Thisreduction of friction in trading sets the stage for the development of stockmarket derivatives.

MANAGEMENT OF THE CAPITAL ACCOUNT: A STUDY OF INDIA AND MALAYSIA 139
The reform of the economy was motivated by an external liquiditycrisis, with reserves at a low of $1 billion. At end-March 2000, reservesstood at $38 billion, a first attestation of the success of the reform process.
The introduction of current account convertibility in 1994 indisputablybrought flight capital back into the country, but there is some dispute as towhether the avenue of return was the current account (through the financingof newly- permissible gold imports and through export overinvoicing), orthe capital account (through the special deposit schemes and periodicexternal bond issues open to non-resident Indians). Whether fuelled byreturning flight capital or not, the non-governmental flows on capitalaccount amounted in the mid-1990s to well in excess of 100 per cent of thecurrent account balance, so that until as recently as 1997 the capital accountmanagement problem was one of too much rather than too little.
FDI was not among the channels that contributed to the mid-decadesurge. Notwithstanding steady liberalization in terms of required approvalsand export obligations attached to dividend repatriation, FDI has been slowto respond, hampered, not as earlier by national entry obstacles, but by thecontinuing structural rigidities of the Indian economy, and by an absenceof coherence between policy at the national level and procedural obstaclesat the local level (Rajaraman, 1997). It was portfolio inflows, from bothforeign institutional investors and external ADR/GDR share capital issues,that contributed to the mid-decade surge, responding to full repatriabilitywith no lock-in periods.
The problem of excess capital inflows in the mid-1990s was tackledby restricting the end-use of equity capital raised through ADR/GDR issuesand external commercial borrowings to foreign currency expenditure onimports, and by prohibiting use for rupee expenditure within the country(these stalled inflows were recorded as net outflows in the “other capital”row). As a technique of capital account management it was far superior toa more market-based approach of free entry with sterilization, anddemonstrates the effectiveness of capital barriers in handling imbalanceson the capital account. As the capital inflow surge ceased, the end-userestrictions were lifted. Today there are no such restrictions on ADR/GDR

INDIRA RAJARAMAN140
equity capital or on debt inflows above prescribed floor maturities. Thesefloor maturities on non-trade external commercial borrowings have beeneffectively used to contain non-trade short-term debt.
A peculiar feature of external debt inflows into India is the menu ofdeposit schemes offered to non-resident Indians, which during the 1990shave seen a decisive shift towards rupee-denominated, and, within rupee-denominated, non-repatriable deposits (introduced in 1992). With non-repatriable rupee deposits, only the interest is repatriable (with currencyrisk). The foreign currency non-resident Indian deposit schemes lost theirarbitrage advantage when the ceiling on deposit rates in 1997 was set atLIBOR. The first formal discrimination against short-term inflows withinthe non-resident Indian scheme in April 1998 was clearly motivated by theAsian currency crisis of late 1997. The impact on the short-term share ofnon-resident Indian deposits is clearly visible. With the raising of theminimum maturity on such deposits to one year in October 1999, short-term non-resident Indian deposits have been done away with altogether.
On non-repatriable, non-resident Indian rupee deposits, the principalpayable at maturity is contra-entered in the current account as privatetransfers. This accounting artefact has been one of the two major causes ofthe extraordinary increase in private transfers to annual inflows of around$15 billion today. The second is of course the legalization of gold imports,which has resulted in the restoration of private transfers to the formalchannel from informal channels, not only as contra-entries in the firstinstance to legal gold imports, but also as secondary effects of the reducedattractiveness of exchange rates through the informal hawala channel.
The only long-term series available at the time of writing is the officialIndian series from which it seems possible to conclude that there has beenan indisputable fall in short-term trade credit since the early 1990s. Theissue of what has happened in the last few years to short-term trade creditsremains unresolved. BIS figures of short-term debt by residual maturityare uncomfortably inconsistent with the Indian figure by original maturityin terms of both level and direction of movement, but since the BIS figuresexhibit evidence of incompleteness in respect of both the total debt stockand total trade credits, they are not immediately acceptable as the correct

MANAGEMENT OF THE CAPITAL ACCOUNT: A STUDY OF INDIA AND MALAYSIA 141
source on the direction of movement in recent years in respect of short-term trade credit.
Not surprisingly, the market for foreign exchange remains thin, withperiods of volatility that have seen RBI intervention through not merelythe use of monetary levers of control over liquidity in the system, but alsoad hoc tampering with rates charged on export credit, which remain underadministrative control, along with surcharges on import finance, and ahalving (albeit short-lived) of balances in, and permissible accretions to,external (EEFC) accounts, as recently as August 2000. While none of thesecan even remotely be characterized as reversing the direction of themovement towards capital account liberalization, the sudden reversal ofpolicy parameters, for example on EEFC accounts, is seen as a throwbackto the pre-reform era of policy unpredictability.
If there should be another and more pronounced surge in foreign capitalinflows, the process of liberalizing capital outflows may be carried furtherforward, beginning with corporate investment, and proceeding eventuallyto non-corporate portfolio outflows. In the interim, while the reduction infinancial market friction is in itself an encouragement to capital inflows, itis the underlying real economy, and the continued fiscal, infrastructureand labour market bottlenecks that are in need of urgent reform.
III. MALAYSIA
A. Introduction
Malaysia prior to the Asian crisis of 1997 had had a long history ofopenness on both current and capital accounts, unique in the developingworld, and ahead even of some developed countries. Current accountconvertibility under Article VIII of the IMF was accepted as far back asNovember 1968, and the Malaysian ringgit was among the first currenciesto go into a float in May 1973, after the collapse of the Bretton Woodssystem (see appendix B). With the resulting need for hedging instruments,

INDIRA RAJARAMAN142
the greater availability of these in more sophisticated offshore financialmarkets led to the development of an offshore ringgit market, locatedprincipally in Singapore. Malaysian exports and imports were ringgit-denominated, and the burden of hedging was transferred to non-residentcounterparties in the offshore market.
Capital flows were liberalized in three major moves: in 1973, alongwith the ringgit float; in 1987, as part of a policy package to pull out of themid-1980s recession; and in 1994, as part of a package of measures designedto handle excessive capital inflows. The Malaysian response to downwardpressures on the exchange value of the ringgit during the Asian crisis of1997 reversed this traditional openness. The long history of a floatingexchange rate was abruptly terminated by a ringgit peg at 3.8 ringgit to thedollar on 2 September 1998, a day after the announcement of a package offinancial policy measures. These measures were designed to kill the offshoreringgit market and to prevent all access by non-residents to ringgit, as wellas to obstruct outward speculative flows of capital from residents. Theyalso aimed to drive a further wedge between the foreign exchange marketand the domestic imperative to lower interest rates which had been drivenup during the crisis by the imposition of a 12-month stay on portfoliooutflows, though only in respect of the principal. Meanwhile, interest anddividends remained freely repatriable and the current account remainedfree, apart from checks on porosity by requiring repatriation of exportproceeds within six months from the date of export. There was also a limiton exports of foreign currency by residents, which functioned as a cap oninvisible outflows.
As a package, the Malaysian retreat from capital account convertibilityhas to be among the major milestones in recent economic history. Itchallenged the prevailing economic orthodoxy, and was orthogonal to therecovery packages imposed by the multilateral financial institutions onother East Asian countries similarly afflicted. By not curtailing capitalaccount convertibility, and therefore not severing the link between monetarypolicy and exchange markets, the recovery measures meant tight moneyand high interest rates, with devastating consequences for the domesticreal economy in these neighbouring countries.

MANAGEMENT OF THE CAPITAL ACCOUNT: A STUDY OF INDIA AND MALAYSIA 143
In what follows, capital account management in Malaysia prior to1997 is dealt with in section III.B, and the crisis itself in section III.C. Thecapital controls of 1998/99 are dealt with in section III.D, and the post-crisis financial sector reform measures in section III.E. Section III.Fconcludes.
B. Capital account management prior to 1997
Table 10 shows the Malaysian balance of payments in the 1990s. Thetwo most striking features of the Malaysian current account were: (i) theconsistently positive, though small (except in 1998, a recession year),balances on merchandise trade, with large export earnings at $70–80 billiontowards the end of the decade matched by an equivalently large importbill; and (ii) steady outflows on invisibles, now close to $10 billion annually.The current account has thus always been in deficit (except in 1998). Infact, the current account deficit averaged around 7 per cent of GDP in thethree years preceding the crisis.
Buoyant capital inflows more than compensated for the deficit oncurrent account. Indeed, in the first half of the 1990s, non-official capitalinflows exceeded the current account deficit by a factor of 4.5, and foreignreserves jumped from $11 billion at end-1991 to $28 billion at end-1993(table 11), as the central bank, Bank Negara Malaysia (BNM), sought tocontain the appreciation of the ringgit. The short-term component of inflowswas especially large, at around $5 billion in both 1992 and 1993. Inwardcapital controls were introduced in 1994 but withdrawn within the year(appendix B). These restrictions, which covered external borrowing,portfolio investment in Malaysian securities, and forward and swaptransactions by banks, succeeded in reducing non-official capital inflows,and changed the direction of short-term flows from inflows of $5.4 billionin 1993 to outflows of $3.2 billion in 1994 (table 10). The temporary capitalcontrols of 1993/94 were a minor blip, however, in what was, untilSeptember 1998, an unfettered regime for external capital inflows andrelatively few constraints on capital outflows. Indeed, the response to theexcess inflows of 1994 included a further relaxation on outward portfolioinvestment in February 1994.

INDIRA RAJARAMAN144Ta
ble
10
MA
LAYS
IA’S
OVE
RA
LL B
ALA
NC
E O
F PA
YMEN
TS, 1
990–
1998
($ b
illio
n)
Item
1990
1991
1992
1993
1994
1995
1996
1997
1998
I.M
erch
. tra
de b
alan
ce (A
-B)
2.62
0.53
3.38
3.20
1.70
0.04
4.01
3.65
17.5
9A
.E
xpor
ts, f
.o.b
.28
.64
33.5
439
.62
45.9
956
.61
71.5
676
.86
77.3
971
.87
B.
Impo
rts, c
.i.f.
26.0
233
.01
36.2
442
.79
54.9
171
.53
72.8
573
.74
54.2
8
II. I
nvis
ible
s, n
et
-3.5
4 -4
.76
-5.5
9 -6
.28
-7.3
3 -8
.67
-8.4
7 -9
.28
-8.2
1
III.
Cur
rent
Acc
ount
(I+I
I) -0
.92
-4.2
3 -2
.21
-3.0
8 -5
.63
-8.6
3 -4
.46
-5.6
2 9.
38/G
DP
(per
cen
t) -(
2.09
) -(
8.62
) -(
3.73
) -(
4.60
) -(
7.56
) -(
9.73
) -(
4.42
) -(
5.61
) (1
2.93
)
IV.
Cap
ital a
ccou
nt (A
to D
), ne
t2.
905.
488.
7814
.44
2.48
6.88
6.94
1.75
0.89
A.
Priv
ate
long
-term
cap
ital
2.33
4.00
5.18
5.01
4.12
4.17
5.08
5.14
2.16
B.
Offi
cial
long
-term
cap
ital
-1.0
5-0
.24
-1.1
30.
380.
332.
450.
301.
650.
54C
.P
rivat
e sh
ort-t
erm
cap
ital
0.50
1.87
4.69
5.41
-3.2
31.
014.
10-4
.59
-5.2
6D
.E
rror
s an
d om
issi
ons
1.12
-0.1
40.
033.
641.
27-0
.76
-2.5
3-0
.45
3.44
V.O
vera
ll B
alan
ce (I
II+IV
)1.
981.
256.
5711
.36
-3.1
5-1
.76
2.48
-3.8
710
.27
VI.
Res
erve
s an
d re
late
d ite
ms
-1.9
8-1
.25
-6.5
7-1
1.36
3.15
1.76
-2.4
83.
87-1
0.27
IV [A
+C+D
]/III
(per
cen
t)(4
30)
(135
)(4
48)
(456
)(3
8)(5
1)(1
48)
(2)
..
Sour
ce:
Ban
k N
egar
a M
alay
sia
(BN
M),
Mon
thly
Sta
tistic
al B
ulle
tin, J
une
2000
, tab
les
V.6
, VI.3
and
VIII
.1. F
igur
es fo
r 199
9 w
ere
avai
labl
e on
ly u
pto
Q3.
Not
e:Fi
gure
s in
ring
git c
onve
rted
to U
S d
olla
rs u
sing
per
iod
aver
age
exch
ange
rate
s (s
ee ta
ble
12).
The
bala
nce
of p
aym
ents
figu
res
for p
rivat
e lo
ng-te
rm c
apita
lin
clud
e ex
tern
al b
orro
win
gs a
nd a
ccru
ed e
arni
ngs
on F
DI;
and
are
net o
f FD
I out
flow
s. T
here
nee
d th
eref
ore
be n
o ab
solu
te n
or d
irect
iona
l cor
resp
onde
nce
betw
een
thes
e fig
ures
and
the
sum
of g
ross
FD
I inf
low
s an
d ne
t por
tfolio
inflo
ws
in ta
ble
2. F
igur
es in
par
enth
eses
in th
e la
st ro
w p
rese
nt th
e ra
tio o
f tot
alpr
ivat
e ca
pita
l inf
low
s to
the
curr
ent a
ccou
nt d
efic
it in
per
cent
age
term
s; th
ere
is th
eref
ore
no fi
gure
for 1
998
whi
ch h
ad a
cur
rent
acc
ount
sur
plus
.

MANAGEMENT OF THE CAPITAL ACCOUNT: A STUDY OF INDIA AND MALAYSIA 145
The following constituted the configuration of capital account manage-ment prior to the East Asian crisis of 1997:
• Portfolio capital inflows by non-residents were freely permissible intoall types of Malaysian financial instruments (bonds, equities, bankdeposits, and all money market and derivative instruments).
• Primary issue of securities, whether abroad by residents or in Malaysiaby non-residents, required prior approval.
• Portfolio capital outflows were unrestricted for individual residentsand for corporates with no domestic borrowing; for those withdomestic borrowing, prior approval was needed for remittances inexcess of 10 million ringgit per corporate group per year.
Table 11
MALAYSIA: EXTERNAL RESERVES, 1990–2000($ billion)
International reserves
End Special IMF Gold and foreign Gross internationalof period drawing rights drawing rights exchange reserves
1990 0.20 0.23 9.59 10.021991 0.21 0.26 10.72 11.191992 0.11 0.33 17.68 18.121993 0.12 0.31 27.88 28.311994 0.14 0.40 26.13 26.661995 0.15 0.68 24.28 25.111996 0.17 0.69 26.85 27.701997 0.12 0.42 14.67 15.211998 0.21 0.63 25.33 26.171999 0.09 0.83 29.94 30.862000 (June) 0.09 0.89 33.01 34.00
Source: BNM (1999), tables II.6 and II.7, updated with BNM, Monthly Statistical Bulletin, June 2000.Note: IMF drawing rights refer to Malaysia’s quota in the International Monetary Fund, less IMF holdings
of Malaysian currency.
INDIRA RAJARAMAN146
• FDI inflows were not merely freely permissible, although with priorapproval in a few sectors, but were welcomed with tax incentives andother kinds of incentives.
• FDI outflows were freely permissible.
• External borrowing was unrestricted for authorized dealers, includinginvestment banks, with no restrictions on on-lending to residents ornon-residents, subject to prudential limits on net open positions. Directexternal borrowing by residents was subject to approval abovesanctioned limits.
Overall, the package added up to a well-structured liberalization ofcapital flows, with limits and checks at critically necessary points, such asat the point of primary issue of securities, both inward and outward; ondomestically leveraged large outward portfolio flows; and on direct externalborrowing by non-institutional residents (see also Cole, Scott andWellans,1995).
The second major push in 1987 towards liberalizing the external capitalflows regime was followed by financial sector reform and strengtheningof prudential controls during the period 1989–1995. New legislation in1989 strengthened regulatory and prudential provisions relating to loanclassification, provisioning and disclosure, capital adequacy, and exposurerisk, and extended the regulatory mantle of Bank Negara beyond com-mercial banks to include finance companies and merchant banks. Creditrating agencies were established, and measures were taken to deepenfinancial markets – principally the inter-bank money market, the foreignexchange market, and in particular the stock market – with the establishmentof a Securities Commission in 1993, which led to improvements in tradingand settlement systems. The only financial market which remainedrelatively underdeveloped was the bond market, because of the surprisingretention of high minimum liquid asset requirements for banks (similar tothe Indian statutory liquidity ratio).
Rate deregulation accompanied prudential control. By February 1991,banking institutions were free to set deposit rates and a base lending rate

MANAGEMENT OF THE CAPITAL ACCOUNT: A STUDY OF INDIA AND MALAYSIA 147
(BLR), subject to a standardized formula benchmarked on deposit rates.The lack of incentive in such a system for banks to improve their internalefficiency was corrected in November 1995, when banks became free toset a BLR subject to a ceiling, benchmarked on the three-month inter-bankrate. A cap of 4 per cent above BLR remained on the maximum lendingrate.
The sound configuration of capital account convertibility in Malaysiais especially important to keep in mind against the background of the capitalcontrols introduced after the external account crisis. These controls wereintroduced in a country that had a background of prudently liberal, ratherthan reckless, capital account openness.
The strength of Malaysian macro fundamentals has already beencommented on in section I. Malaysia was a country with high growth rates,of not less than 9 per cent in any year after 1988; the crisis of 1997 was thefirst year in a whole decade which saw growth dipping well below 9 percent, to 7.3 per cent. This growth record was accompanied by remarkablylow rates of inflation, at well under 5 per cent, a high savings rate in excessof 40 per cent, fiscal surpluses on current account, and remarkably lowlevels of external debt – both total and short-term – as a percentage ofexports.
C. The crisis of 1997
Table 12 shows the stability in the value of the ringgit against the USdollar in the 1990s. There were some upward pressures on the ringgit mid-decade, with a rise in its value from 2.7 ringgit to the dollar in 1990 to asteady 2.5 ringgit to the dollar in 1994–1996 – three years immediatelypreceding the crisis – despite high current account/GDP ratios.
For a country as open as Malaysia, with exports equal to or greaterthan GDP, the exchange rate is the most important price. For that price tobe plunged by forces beyond its control was a critical vulnerability thatthe country could not afford to ignore. Yet another vulnerability is the

INDIRA RAJARAMAN148Ta
ble
12
MA
LAYS
IA: E
XCH
AN
GE
RAT
ES A
ND
EXP
OR
TS, 1
990–
2000
1990
1991
1992
1993
1994
1995
1996
1997
1998
1999
2000
Exch
ange
rate
(RM
/$)
End
per
iod
2.7
2.7
2.6
2.7
2.6
2.5
2.5
3.9
3.8
3.8
3.8
Per
iod
aver
age
2.7
2.8
2.6
2.6
2.6
2.5
2.5
2.8
3.9
3.8
3.8
Shar
es in
tota
l man
ufac
ture
dex
port
s (p
er c
ent)
Ele
ctro
nic
and
elec
trica
l tot
al56
.658
.058
.261
.563
.565
.765
.866
.568
.171
.872
.0(o
f whi
ch e
lect
roni
c):
32.8
31.8
32.5
34.4
35.4
38.6
40.8
45.1
48.0
53.3
53.0
Sem
icon
duct
ors
24.9
21.3
20.1
20.9
20.7
22.5
22.4
22.8
22.9
24.1
21.8
Ele
ctro
nic
equi
pmen
t7.
810
.512
.413
.514
.816
.018
.422
.325
.129
.231
.2To
tal m
anfd
. exp
orts
100.
010
0.0
100.
010
0.0
100.
010
0.0
100.
010
0.0
100.
010
0.0
100.
0
Sour
ce:
Ibid
., ta
bles
V.6
and
VIII
.5.
Not
e:Th
e fig
ures
for t
he y
ear 2
000
rela
te to
the
perio
d Ja
nuar
y–M
ay 2
000.
RM
=M
alay
sian
ring
git.

MANAGEMENT OF THE CAPITAL ACCOUNT: A STUDY OF INDIA AND MALAYSIA 149
excessive dependence on electronics in manufactured exports, whichaccount for 85 per cent of the total export basket. Electronic and electricalexports accounted for more than half of total manufactured exports at thebeginning of the 1990s, and by end-decade the share had risen to morethan 70 per cent. Malaysia was not unique among its neighbours in thisrespect. The figures for the first half of 2000 show shares for electronicsexports of 58 per cent (Malaysia), 56 per cent (Singapore, excluding re-exports), 45 per cent (Taiwan Province of China) and 37 per cent (Republicof Korea).
A nominal depreciation of the ringgit to some degree was clearlynecessary to maintain export competitiveness at a time of steep currencydepreciation in the Asian competitive neighbourhood; but it was theaccompanying rise in domestic interest rates with the build-up of speculativedemand for the ringgit that was the major real threat, and clearly called forcontainment. The challenge posed was the need to reduce interest rateswithout precipitating a further decline in ringgit value.
After years of positive portfolio inflows, there was a net outflow in1997 of $10 billion (table 2), although FDI continued to hold steady, withinflows of $2.4 billion in 1997. Speculative pressure on the ringgit builtup, financed by ringgit obtained offshore. This was initially sought to becontained in August 1997 through an offer-side limit on currency swaps(sale of ringgit) with non-resident banks, fairly generously set at $2 millionper bank. This was a very limited response to the speculative pressures of1997, and the swap limit did very little to contain the slide in the ringgit(which fell to a low of 4.88/$ in January 1998) or the decline in foreignexchange reserves to $15 billion by end-December 1997.
Although contagion without any aggravation from weak fundamentalscould entirely have led to external crisis, there was an export decelerationin 1997, after sustained export growth since 1990 of about 18 per centannually in US dollars (figures in table 10). There also appears to havebeen some structural deterioration in the quality of bank loan portfolios inMalaysia as a result of rapid credit expansion and the collapse of the assetbubble, notwithstanding the controls in the system on loan quality. Table 13shows that after a long period of monotonic decline in the percentage of

INDIRA RAJARAMAN150Ta
ble
13
MA
LAYS
IA: F
INA
NC
IAL
SEC
TOR
IND
ICAT
OR
S, 1
990–
2000
(Per
cen
t)
1990
1991
1992
1993
1994
1995
1996
1997
1998
1999
2000
Adj.
Adj.
Adj.
Adj.
Gro
ssN
etgr
oss
Net
gros
sN
etgr
oss
Net
gros
s
Non
-per
form
ing/
tota
l loa
ns (e
nd-p
erio
d)C
omm
erci
al b
anks
20.1
15.7
14.7
12.6
6.9
4.9
3.6
3.2
10.5
5.9
15.3
5.7
16.2
5.5
14.4
Fina
nce
com
pani
es21
.315
.815
.613
.09.
96.
64.
76.
513
.911
.928
.88.
623
.98.
923
.2M
erch
ant b
anks
12.6
8.7
6.9
5.0
9.5
7.8
1.7
3.5
10.6
10.9
22.5
12.3
27.0
12.5
27.8
Bank
ing
syst
em (o
vera
ll)20
.015
.414
.512
.37.
85.
53.
74.
19.
77.
518
.96.
618
.46.
516
.9
Com
mer
cial
ban
k in
tere
stra
tes
(ave
rage
yea
r-en
d)D
epos
it ra
te (1
yr.)
7.2
8.2
7.8
6.3
6.2
6.9
7.3
.9.
3.
5.7
.4.
0.
3.9
LIBO
R (1
yr.)
8.5
6.3
4.2
3.6
5.6
6.2
5.8
.6.
1.
5.5
.5.
7.
6.9
(Dep
. rat
e - L
IBO
R)
-1.2
1.9
3.6
2.7
0.6
0.6
1.5
.3.
3.
0.2
.-1
.7.
-3.0
Infla
tion
rate
3.1
4.4
4.7
3.6
3.7
3.4
3.5
.2.
7.
5.3
.2.
8.
1.3
(Rea
l dep
osit
rate
)4.
13.
83.
12.
72.
53.
53.
8.
6.6
.0.
4.
1.2
.2.
6
Lend
ing
rate
sBa
se (B
LR)
7.5
8.7
9.3
8.2
6.8
8.0
9.2
.10
.3.
8.0
.6.
8.
6.8
Aver
age
9.0
9.7
10.3
9.7
8.2
9.3
10.1
.11
.5.
9.7
.7.
8.
7.7
Sour
ce:
Ibid
., ta
bles
III.1
5-III
.18,
V.1
and
VI.1
3 fo
r Mal
aysi
a; IM
F, In
tern
atio
nal F
inan
cial
Sta
tistic
s fo
r LIB
OR
; ave
rage
Jan
uary
–May
for 2
000.
Not
e:•
The
NP
L fig
ures
for 2
000
rela
te to
end
-May
. The
inte
rest
rate
s fo
r 200
0 ar
e fo
r Jun
e 20
00.
•B
egin
ning
Dec
embe
r 199
7, n
on-p
erfo
rmin
g lo
ans
wer
e re
porte
d ne
t, as
a p
erce
nt o
f net
loan
s. T
o re
gain
com
para
bilit
y w
ith e
arlie
r yea
rs, t
he a
djus
ted
gros
ssh
are
of g
ross
loan
s is
con
stru
cted
from
repo
rted
figur
es o
f pro
visi
onin
g. F
urth
er, i
n th
e fir
st s
ix m
onth
s of
199
8, th
e pe
riod
of n
on-p
erfo
rman
ce fo
r the
repo
rted
figur
es w
as s
horte
ned
from
six
to th
ree
mon
ths.
Afte
r mid
-199
8, b
oth
sets
of f
igur
es a
re re
porte
d. T
he fi
gure
s in
this
tabl
e fo
r 199
8 an
d su
bseq
uent
year
s ar
e th
e si
x-m
onth
figu
res,
to re
tain
com
para
bilit
y w
ith e
arlie
r yea
rs.
•Th
e in
flatio
n ra
te is
from
the
Con
sum
er P
rice
Inde
x (C
PI).

MANAGEMENT OF THE CAPITAL ACCOUNT: A STUDY OF INDIA AND MALAYSIA 151
non-performing loans (NPLs) in the banking system as a whole, from 20 percent in 1990 to 3.7 per cent in 1996, there was a rise to 4.1 per cent in thereported figure for 1997. This figure, however, understates the true increasebecause of the switch in the official reporting system from gross to netshares starting in December 1997 (NPLs also saw other definitionalvolatility over the period; see notes to table 13). Using the officially reportedfigures for loan provisioning, the adjusted gross share at end-1997 wasclose to 10 per cent, and by end-1998 this had risen to 19 per cent (see alsoGhani and Sood, 1999).
The early effects of depreciation pressures and ringgit selling werefelt in the offshore ringgit market. Speculative demand for ringgit forconversion into dollars in anticipation of a crash in ringgit value led to adramatic rise in offshore ringgit deposit rates, which by April 1998 hadrisen above 30 per cent. This was transmitted to the domestic market throughcapital outflows in response to the rise in offshore ringgit rates.
Domestic ringgit interest rates rose in response (table 13). The 12-monthdeposit rate towards end-1997, at 9.3 per cent, offered a real return todepositors of 6.6 per cent over what remained a low inflation rate, and theexcess over the 12-month dollar LIBOR rose to 3.3 per cent. The averagelending rate by the end of 1997 had risen to 11.5 per cent, in a countrywhere the average lending rate had not risen above 10 per cent after financialrestructuring, and this despite the November 1995 freeing of the BLR ofbanks subject to a cap (see appendix B). Real contraction followed. Thereal growth rate of the economy in 1998 worsened steadily to -10.1 percent in the third quarter. This in turn led to a deterioration in bank loanportfolios. However, the differential impact of recession on the differentsubsectors of the banking system show that the incidence of structuralweakness within the system was not uniform. The increase in NPLs wassharper among merchant banks and finance companies than amongcommercial banks. By the end of 1998, finance companies and merchantbanks had (net reported) NPLs of nearly 12 and 11 per cent respectively,corresponding in gross terms to 29 and 22.5 per cent respectively (table 13,for the extended period up to 2000, see table 14).
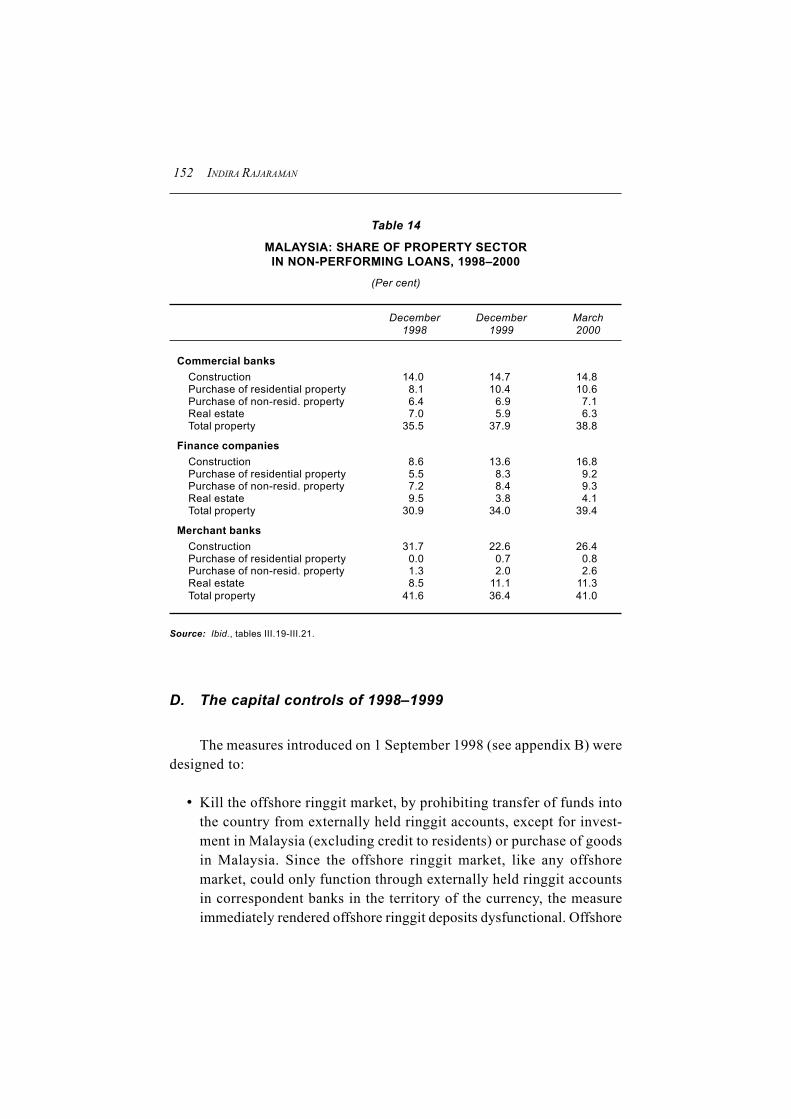
INDIRA RAJARAMAN152
D. The capital controls of 1998–1999
The measures introduced on 1 September 1998 (see appendix B) weredesigned to:
• Kill the offshore ringgit market, by prohibiting transfer of funds intothe country from externally held ringgit accounts, except for invest-ment in Malaysia (excluding credit to residents) or purchase of goodsin Malaysia. Since the offshore ringgit market, like any offshoremarket, could only function through externally held ringgit accountsin correspondent banks in the territory of the currency, the measureimmediately rendered offshore ringgit deposits dysfunctional. Offshore
Table 14
MALAYSIA: SHARE OF PROPERTY SECTORIN NON-PERFORMING LOANS, 1998–2000
(Per cent)
December December March1998 1999 2000
Commercial banksConstruction 14.0 14.7 14.8Purchase of residential property 8.1 10.4 10.6Purchase of non-resid. property 6.4 6.9 7.1Real estate 7.0 5.9 6.3Total property 35.5 37.9 38.8
Finance companiesConstruction 8.6 13.6 16.8Purchase of residential property 5.5 8.3 9.2Purchase of non-resid. property 7.2 8.4 9.3Real estate 9.5 3.8 4.1Total property 30.9 34.0 39.4
Merchant banksConstruction 31.7 22.6 26.4Purchase of residential property 0.0 0.7 0.8Purchase of non-resid. property 1.3 2.0 2.6Real estate 8.5 11.1 11.3Total property 41.6 36.4 41.0
Source: Ibid., tables III.19-III.21.
MANAGEMENT OF THE CAPITAL ACCOUNT: A STUDY OF INDIA AND MALAYSIA 153
banks required access to freely usable onshore ringgit bank accountsto match their ringgit liabilities, and the new ruling eliminated freeusability. Holders of these deposits were given a month within whichto repatriate them to Malaysia. But it is important to note that thiswas not a requirement so much as a consequence of the controls onexternal ringgit accounts. This eliminated a major source of ringgitfor speculative buying of US dollars in anticipation of a ringgit crash.A corollary measure, demonetization of large-denomination ringgitnotes was announced, and later followed through, so as to curb thecirculation of ringgit outside Malaysia.
• Close off access of non-residents to domestic ringgit sources byprohibiting ringgit credit facilities to them, requiring that all tradetransactions be settled in foreign currencies, and mandating authorizeddepository institutions through which alone transactions in ringgit-denominated financial assets became permissible.
• Close the offshore market in Malaysian shares conducted through amechanism known as the Central Limit Order Book (CLOB).
• Obstruct speculative outward capital flows by imposing the require-ment of prior approval for residents to invest abroad in any form, andsetting tight limits on exports of foreign currency by residents forother than valid current account purposes.
• Protect the value of the ringgit and shore up foreign exchange reservesby requiring repatriation of export proceeds within six months of thedate of export.
• Drive a further wedge between the foreign exchange market and theimperative need of the hour for monetary easing, and thus regainmonetary independence by imposing a 12-month stay on outflows ofexternal portfolio capital (only the principal, interest and dividendpayments were freely repatriable).
International rating agencies responded uniformly to the capital controlmeasures by downgrading Malaysia’s credit and sovereign risk ratings. As
INDIRA RAJARAMAN154
the success of the package became undeniable, it was attributed toenvironmental factors, among them:
• Adequacy of foreign exchange reserves; and
• The underlying strong fundamentals of the Malaysian economy.
What is notable about the package was its thoroughness, and the cleverchoice of policies designed to control foreign exchange outflows andspeculation against the ringgit by non-residents and residents. It was thusthe absence of discrimination against foreign investors, the clear evidenceof sound economic logic underlying the package, and the effectiveness ofits enforcement by Bank Negara, which accounted for the success of thecapital controls as much as the enabling environment and the underlyingstrength of the Malaysian economy.
The severing of the link between domestic interest rates and theexternal sector was a major motivation underlying the entire exercise. Thestatutory reserve ratio (SRR) was brought down sharply from 13.5 percent – to which it had been raised in 1996/1997 to contain liquidity in thesystem as part of an initially orthodox response to downward pressures onthe currency – to 4 per cent in 1998, where it now remains (table 15). Thebenchmark for setting the ceiling on the base lending rate (BLR) of banks,hitherto the three-month inter-bank rate,3 was further shifted to the BNMintervention rate, with the same formula as before, so as to enhance BNMleverage over lending rates, with the permissible margin above thebenchmark reduced from 2.5 to 2.25 percentage points. There was also areduction in the cap on the maximum lending rate, which was reduced forthe first time since financial deregulation, from a spread of 4 per cent abovethe BLR to 2.5 per cent. The impact of these reductions is clearly visiblein table 13. The average lending rate fell from 11.5 per cent at end-1997 to9.7 per cent by end-1998, and the real one-year deposit rate fell from 6.6 percent at end-1997 to 0.4 per cent by end-1998. With a further fall in inflationrates in subsequent years from what for Malaysia was a high inflation rateof 5.3 per cent in 1998, the real interest rate has subsequently risen to2.6 per cent today.
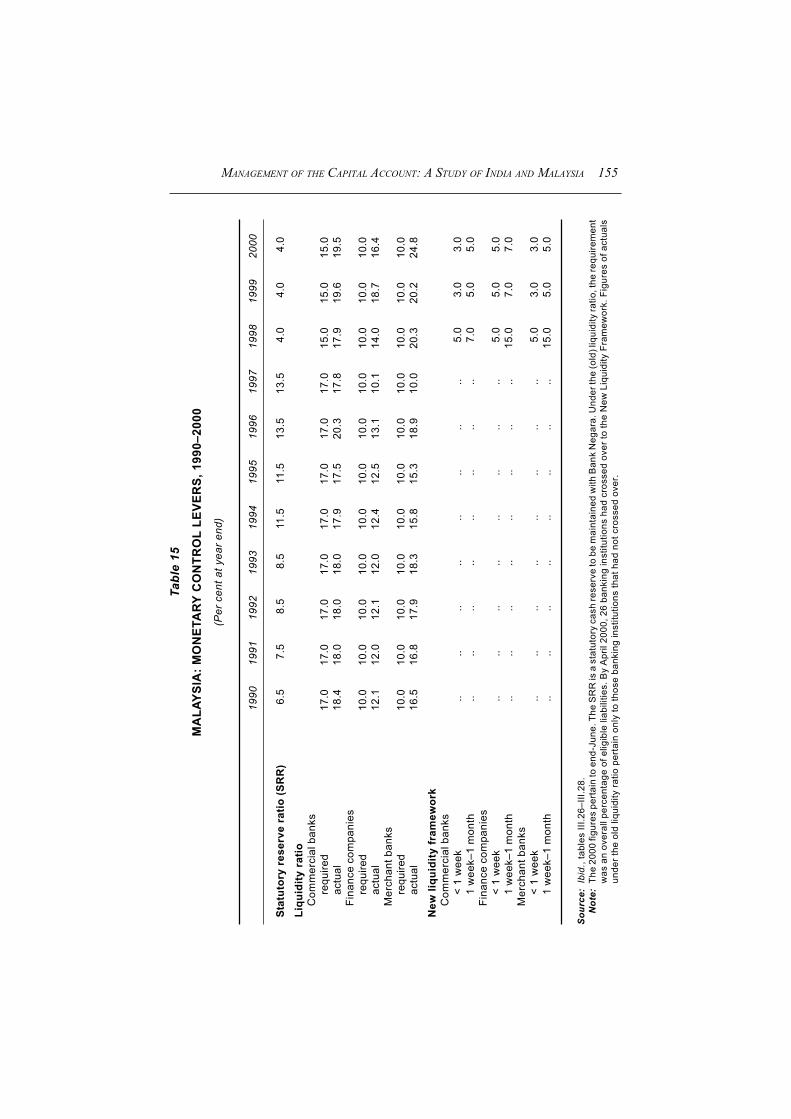
MANAGEMENT OF THE CAPITAL ACCOUNT: A STUDY OF INDIA AND MALAYSIA 155Ta
ble
15
MA
LAYS
IA: M
ON
ETA
RY C
ON
TRO
L LE
VER
S, 1
990–
2000
(Per
cen
t at y
ear e
nd)
1990
1991
1992
1993
1994
1995
1996
1997
1998
1999
2000
Stat
utor
y re
serv
e ra
tio (S
RR
)6.
57.
58.
58.
511
.511
.513
.513
.54.
04.
04.
0
Liqu
idity
rat
ioC
omm
erci
al b
anks
requ
ired
17.0
17.0
17.0
17.0
17.0
17.0
17.0
17.0
15.0
15.0
15.0
actu
al18
.418
.018
.018
.017
.917
.520
.317
.817
.919
.619
.5Fi
nanc
e co
mpa
nies
requ
ired
10.0
10.0
10.0
10.0
10.0
10.0
10.0
10.0
10.0
10.0
10.0
actu
al12
.112
.012
.112
.012
.412
.513
.110
.114
.018
.716
.4M
erch
ant b
anks
requ
ired
10.0
10.0
10.0
10.0
10.0
10.0
10.0
10.0
10.0
10.0
10.0
actu
al16
.516
.817
.918
.315
.815
.318
.910
.020
.320
.224
.8
New
liqu
idity
fram
ewor
kC
omm
erci
al b
anks
< 1
wee
k..
....
....
....
..5.
03.
03.
01
wee
k–1
mon
th..
....
....
....
..7.
05.
05.
0Fi
nanc
e co
mpa
nies
< 1
wee
k..
....
....
....
..5.
05.
05.
01
wee
k–1
mon
th..
....
....
....
..15
.07.
07.
0M
erch
ant b
anks
< 1
wee
k..
....
....
....
..5.
03.
03.
01
wee
k–1
mon
th..
....
....
....
..15
.05.
05.
0
Sour
ce:
Ibid
., ta
bles
III.2
6–III
.28.
Not
e:Th
e 20
00 fi
gure
s pe
rtain
to e
nd-J
une.
The
SR
R is
a s
tatu
tory
cas
h re
serv
e to
be
mai
ntai
ned
with
Ban
k N
egar
a. U
nder
the
(old
) liq
uidi
ty ra
tio, t
he re
quire
men
tw
as a
n ov
eral
l per
cent
age
of e
ligib
le li
abili
ties.
By
Apr
il 20
00, 2
6 ba
nkin
g in
stitu
tions
had
cro
ssed
ove
r to
the
New
Liq
uidi
ty F
ram
ewor
k. F
igur
es o
f act
uals
unde
r the
old
liqu
idity
ratio
per
tain
onl
y to
thos
e ba
nkin
g in
stitu
tions
that
had
not
cro
ssed
ove
r.
INDIRA RAJARAMAN156
The reaction of received orthodoxy to the Malaysian package wasthat the Malaysian recovery was no stronger than that of other East Asiancountries. However, the incremental impact of the package can only beassessed with respect to a Malaysian counterfactual, since the othercountries differed in terms of their fundamentals at the time of the crisis. Aformal counterfactual exercise, which requires a quarterly computationalgeneral equilibrium (CGE) model for the Malaysian economy, is beyondthe scope of this paper. What is undeniable is the speed of real correctionin the economy, from -10.6 per cent in the last six months of 1998 to -1.5 percent in the first quarter of 1999, and positive growth in all subsequentquarters. Even critics of the Malaysian capital controls had to concedethat the reduction in interest rates helped contain the increase in NPLs ofthe banking system that would surely have been a feature of anycounterfactual scenario. Standard and Poor’s is reported to have estimatedthat the NPLs would have risen to 30 per cent if interest rates had notfallen as sharply as they did (IMF, 1999). Also, the Federation of MalaysianManufacturers is quoted as having reported that the exchange rate peg andreduced interest rates lowered corporate uncertainty and made businessplanning easier (IMF, 1999).
The measures of September 1998 imposed, inter alia, a 12-monthwaiting period for repatriation of proceeds from liquidation of externalportfolio investments. In order to pre-empt possible large-scale outflowsat the conclusion of that period in September 1999, the waiting period wasreplaced as of 15 February 1999 by a system of graduated exit levies, withseparate regimes for capital already in the country and for capital broughtin after that date. For capital already in the country, there was a price onexit inversely proportional to duration of stay within the earlier stipulatedperiod of 12 months. Therefore capital that had entered the country morethan a year previously, before 15 February 1998, was free to leave at azero exit price. For capital yet to come in, there was a levy only on profits,defined to exclude dividends and interest, also graduated by length of stay.In effect, profits for the purpose of the new Malaysian rules were definedto equal realized capital gains. Accompanying clarifications were issuedin respect of repatriation of funds relating to investment in immovableproperty and FDI. Also investments in the newly-established, over-the-counter share market, MESDAQ, were exempted.

MANAGEMENT OF THE CAPITAL ACCOUNT: A STUDY OF INDIA AND MALAYSIA 157
Although the replacement of the earlier controls with exit levies wasinternationally welcomed, there was also criticism of the new package. Asa levy applicable only at the time of conversion of ringgit proceeds intoforeign exchange, and therefore not a capital gains tax, it could not beoffset through double taxation agreements. The 10 per cent levy on profits,even on funds invested for a period over 12 months, was seen as generallydiscouraging portfolio capital inflows, and equity investments in particular,since interest and dividends are exempted. The higher levy of 30 per cent,applicable on gains on investments of less than a year’s duration, attractedespecially heavy criticism on the grounds that potential investors wouldapply the higher levy rate of 30 per cent to all investments, regardless oftheir expected maturity, because of the “last in, first out” rule (IMF, 1999).On 21 September 1999, the higher levy was eliminated, leaving in placeonly a single rate of 10 per cent on capital gains regardless of duration ofinvestment. In a further relaxation, the 10 per cent levy on capital gainswas retained, effective from 1 February 2001, only for capital in the countryfor a duration of less than one year. This too was done away with on 2 May2001.
The very criticism directed at the new package helped identify whatwas good about it and, more importantly, underlined why it could prove ofenduring worth in reducing volatility in capital flows. It is true that thelevy reduced the expected rate of return on equity to foreign investors, andthus raised the required pre-levy rate of return needed relative to othermarkets. This was an intended effort to reduce casual entry into Malaysia,and to ensure that capital would enter only when the fundamentals justifiedthe expectation of a higher pre-levy rate of return. By December 1999,international rating agencies had begun restoring the credit rating forMalaysia. The final benediction was bestowed when the Malaysian marketwas included as a component of the Morgan Stanley Capital InternationalIndices in May 2000.
The institutional origin of the capital control measures is unclear. BankNegara believes in cooperation with the Government rather than inde-pendence, a tradition said to have been laid down by the first MalaysianGovernor of Bank Negara, Tun Ismail Mohamed Ali. The facts on record,which show that, effective 1 September 1998, there was a change in the
INDIRA RAJARAMAN158
leadership of the team charged with implementing the new package ofselective exchange controls, suggest that the measures may not haveoriginated with the central bank.
The exchange control measures of September 1998 (other than theprohibition on portfolio repatriation) remain substantially in place, exceptfor some relaxation in respect of credit facilities in ringgit by residents tonon-residents, which are now permissible as long as the credit facility isnot used to purchase immovable property in Malaysia, up to a limit of200,000 ringgit, well below the earlier pre-1998 limit of 5 million ringgit.
E. Financial sector reform
In terms of the institutional requirements of the effort to insulate thecountry on a long-term basis from recurrences of external volatility, it wasclear that financial restructuring would have to come first, given that thiswas the foremost structural weakness in what was otherwise a soundlymanaged macroeconomic scenario at the time of the crisis. The weaknessof finance companies, and merchant banks in particular as evidenced bythe much sharper increase in their non-performing loans (NPLs), wasalready referred to in section III.C.
Bank Negara has exhibited exemplary awareness of the need forinstitutional strengthening in the financial sector. Listed below are theavenues along which initiatives have already begun.
(i) Bank restructuring
Begun in early 1998 and continuing under a four-pronged approach:
• Danaharta, an asset management company, was established for pur-chase of NPLs, exchanged against issue of zero-coupon, government-guaranteed bonds with five-year maturity and an additional rolloveroption of five years; yields are approximately the same as MalaysianGovernment security yields.

MANAGEMENT OF THE CAPITAL ACCOUNT: A STUDY OF INDIA AND MALAYSIA 159
• Danamodal, a scheme for recapitalization of banks, was introduced.It was a clearly needed accompaniment to Danaharta purchases ofNPLs at a discount from banks. Danamodal itself was financedthrough the generalized issue of zero-coupon bonds, in the firstinstance to banking institutions themselves, with secondary trad-ability among corporate houses, special status as Class-1 liquefiableassets under the new liquidity framework, and zero risk weight forcapital adequacy purposes.
• Bank consolidation. Initiated in January 1998 for finance companiesalone, this was extended to all banking institutions in July 1999.By 1 September 2000, 54 financial institutions were consolidatedinto 10 new entities led by hand-picked anchor banks. There was,however, a negative stock market reaction to some of these mergerson news of an element of official coercion (Straits Times, 2000).
• Corporate Debt Restructuring Agency (CDRC). This was set up toprovide a platform for borrowers and creditors to work out debtrestructuring schemes.
(ii) Banks capacities for risk management
Begun as far back as 1995, banks are being nudged towards in-housecontrol mechanisms for management of the additional dimensions of marketrisk involved in cross-border transactions, and evidence of an appropriateinternal control structure is a requirement for banks to use financialderivatives. Since March 1998, banks have been required to conductmonthly stress simulation tests under a variety of scenarios and to reportto Bank Negara on a quarterly basis.
(iii) Prudential limits on sectoral exposure
Notwithstanding the effort to shore up banks’ internal capacities forrisk assessment, there was an unquestioned need for limits on exposure toproperty lending, given the central role this had played in structuralweakening of the financial sector (for an excellent account of the gen-esis of bank credit flows to the property sector, see UNCTAD, 1998). In

INDIRA RAJARAMAN160
October 1995 limits on maximum financing margins on purchase of high-end properties were introduced for the first time (see BNM, 1999), whilenot controlling lending for construction – the supply end. Predictably,margins on purchase had to be abolished in 1998 in a bid to clear the excesssupply of high-end properties. A 20 per cent limit on total outstandingloans to the broad property sector was imposed in April 1997, just beforethe exchange rate crisis (the limit excluded low-end residential properties,infrastructure and industrial projects). It was only in January 1999 thatlending for the construction of high-end residential properties includingresorts, hotels, golf courses and commercial properties, was prohibitedaltogether. This response to a serious oversupply problem, if enacted fiveyears earlier, might possibly have averted the exchange rate crisis of 1997altogether.
(iv) Limits on connected lending
Effective 1 April 1998:
• Single customer credit is limited at 25 per cent of capital funds,down from 30 per cent.
• Country exposure limits are set on a bank-specific basis.
• Credit facilities on large loans, defined as those exceeding 10 percent of total capital, are limited to 50 per cent in aggregate.
• There is prohibition on lending to directors, officers and employees,and to firms in which such persons have an interest of more than 5per cent.
Effective 1 April 1999:
Lending to large shareholders with shares of 20 per cent or more inthe bank making the loan is prohibited. This was the first time thatlending to owners was explicitly prohibited, although it is thoughtthat since sizeable stakeholders are likely also to be directors, the1998 prohibition went most of the way.

MANAGEMENT OF THE CAPITAL ACCOUNT: A STUDY OF INDIA AND MALAYSIA 161
(v) Prudential limits on liquidity risk
Beginning January 1999, a new liquidity framework based on amaturity ladder approach was introduced in place of the earlier overallliquidity requirement, with banking institutions given the freedom to crossover to the new system. By April 2000, 26 institutions had opted for it. Inessence, the new liquidity framework breaks down liquid assets by degreeof liquidity.
(vi) Prudential limits on cross-border risks
Limits to banks’ exposure to foreign currency loans have been set at50 per cent of equity capital. These are prudential limits without penalties,but are in any case so generously set that they are in no danger of beingcrossed, and could perhaps be tightened.
(vii) Incorporating risks in loan classification, provisioning, capitaladequacy and disclosure
• Off-balance-sheet items have been incorporated in loan classi-fication and provisioning requirements since March 1998.
• The minimum risk-weighted capital requirement is still 8 per cent.Capital adequacy requirements are expected to move towards abank-specific configuration as a function of internal controls andsectoral exposure.
• Quarterly public disclosure requirements imposed in early 1998were relaxed in September 1998 along with the capital controlsthen introduced. A return to tighter disclosure norms was considerednecessary for restoration of discipline and market confidence.

INDIRA RAJARAMAN162
F. Conclusions
Malaysia had so free a capital account regime leading up to the 1997crisis was so free that there was even an offshore market in ringgit, perhapsthe only case of an offshore market in an emerging market currency. Theadvantage the offshore ringgit market gave foreign investors, in terms offine-tuning risk-management through access to the more diversifiedfinancial hedging products and instruments available offshore, paled incomparison with the exchange rate turbulence it facilitated in 1997.Eliminating the offshore market had to be an essential feature of any policypackage designed to drive a wedge between the foreign exchange marketand the imperative monetary policy need at the time of the crisis, whichwas to lower interest rates. The rise in ringgit interest rates was transmittedonshore from offshore speculative borrowing of ringgit to fund movementinto dollars in anticipation of a crash in the ringgit value, and had potentiallydevastating consequences for the domestic real economy and for what wasalready a structurally weak financial sector, overexposed to propertylending. The offshore ringgit market has now been wiped out, and thus theprincipal intent of the capital control measures introduced in September1998 has been fully achieved. The frozen Central Limit Order Book (CLOB)offshore shares, a residual problem after closure of the offshore ringgitmarket, is on the way to resolution through an offer menu that accom-modates shareholders at all ends of the liquidity spectrum. There remainno loose ends on the offshore front.
The exchange controls introduced in September 1998 remain largelyin place with the single exception of the 12-month holding period onrepatriation of portfolio principal, which after September 1999 was reducedto just a 10 per cent levy on capital gains. This was further confined,effective February 2001, to capital repatriated after a duration of less thana year in the country. On 2 May 2001, even this vestigial hurdle on financialexit from Malaysia was removed altogether.
The overwhelming need for financial sector consolidation is fullyrecognized and being addressed. Until that process is complete, Malaysiawould be ill-advised to open up its financial borders again. The exchangecontrols still in place obstruct free access to ringgit for non-residents as

MANAGEMENT OF THE CAPITAL ACCOUNT: A STUDY OF INDIA AND MALAYSIA 163
part of the effort to prevent resurrection of an offshore ringgit market.Free movement from ringgit into dollars for residents is still possible, butthese dollars must be held in foreign exchange accounts in Malaysia. Thedifference from the point of view of control over the capital account, isthat the foreign exchange accounts are held by banking institutions withinthe regulatory ambit of Bank Negara. What is not permitted is export ofdollars outside the country. An officially-approved foreign currencyoffshore banking centre has been developed in Labuan. Outward portfolioflows, whether from corporates or resident individuals, require approval,which is rarely granted. But as in all approval-driven systems, the barrierscould be relaxed over time without a formal change of regime.
The overhang of NPLs is being handled through a set of interconnectedagencies. Stepping back from the complexity of the arrangements, what isbeing attempted is assistance to banks in loan rescheduling and manage-ment, offloading of bad loans at a discount to an asset management agency,and recapitalization of the worst-hit banks through bonds subscribed to bystronger banks in the system. Other planks in the financial restructuringprogramme included the mergers of what were 54 banks into 10 units by1 September 2000, which provoked negative stock market reactions onaccount of there having been some measure of official coercion.
The share of gross NPLs has come down somewhat since the worstpeak at end-1998 in the banking system as a whole and in all componentsof it except merchant banks. The property sector continues to account for40 per cent of NPLs. The controls introduced in the system in 1999 toprohibit lending for construction of high-end properties came five yearstoo late to avert the financial sector softening that was a contributory, ifnot the precipitating, factor in the 1997 crisis. Controls on connectedlending, now in place, again came five years too late.
With the continued dollar peg on the ringgit, the need for developinga domestic market for hedging instruments has taken a back seat, althoughit is clear that such markets will have to be developed over the long term.It has to be remembered that the offshore ringgit market developed inresponse to the need of non-residents for hedging instruments at a timewhen import and export settlements were denominated in ringgit, so that
INDIRA RAJARAMAN164
resident importers and exporters were relieved from the need to hedge.With import and export settlements now denominated in dollars, as part ofthe package of exchange control measures of September 1998, there willeventually be a need for hedging instruments once the peg is removed.Statements by the Malaysian Prime Minister on the occasion of the country’sNational Day on 31 August 2000 suggest the ringgit peg is here to stay,notwithstanding market estimates that the peg undervalues the ringgit, andthat higher import prices lead to lower investment than would be the caseunder a ringgit float (the 1998 drop of 20 percentage points in the investmentrate continued into 1999). The larger need remains for Malaysia to adoptan exchange rate policy that carries greater flexibility and adaptability tomonetary policy requirements. While this is recognized, there is littleevidence that the ringgit will go off the peg, or even be re-pegged, in theforeseeable future.
IV. CONCLUSIONS
India and Malaysia share a similarity of capital account regimes todaythat would have been unthinkable a decade earlier. The capital controlsintroduced in Malaysia in response to the external liquidity crisis of 1997,and the gradual capital account liberalization in India, also motivated byan external liquidity crisis in 1991, have brought about a remarkableconvergence between the capital account regimes in the two countries. Inboth countries non-resident capital inflows enjoy full freedom ofrepatriation. Outward capital flows for corporate residents are permissible,but controlled within prescribed limits. All other outflows of capital fromresidents are banned. There is a lesson in this that carries validity beyondthe specifics of the two countries studied.
The advantages of free cross-border flows of capital and of access toa global savings pool remain unquestionably valid. However, in emergingmarkets with institutional weaknesses in the financial sector, it is dam-aging to focus on the gains of free capital flows without the institutionalconsolidation that would prevent a recurrence of episodes of volatility.

MANAGEMENT OF THE CAPITAL ACCOUNT: A STUDY OF INDIA AND MALAYSIA 165
The purpose of this paper is not to deliver a verdict on whether full capitalaccount convertibility should be an eventual world objective, issues in anycase already ably addressed in Cooper (1998) and others. Rather, the paperseeks to demonstrate that the transition to full capital convertibility neednot necessarily be monotonic at all times, and that retention of rights ofsovereign control over policy with respect to resident capital is essentialfor macroeconomic control over the real sector, especially in developingcountries (see also Schneider, 2000).
India in 1990 did not have current account convertibility; the rupeewas administered at a moving basket-peg; inward FDI was possible onlyon a case-by-case approval basis, subject to equity caps, curtailments onfreedom of functioning beyond those caps, and dividend repatriation linkedto export obligations; portfolio inflows were unknown; and outward FDIby corporates, although not unknown, was subject to an extended case-by-case approval basis. All other outward capital flows were banned, withcriminal penalties for contravention of the ban. An informal hawala channelfor capital outflows thrived, notwithstanding these penalties, with dollarsupplies from diverted private remittances.
Malaysia in 1990 had had current account convertibility for over twodecades; the ringgit had been a floating currency for 17 years, and therewas a flourishing offshore ringgit market in Singapore; inward FDI andportfolio capital inflows were unfettered, with approval needed only forflotation of issues on foreign bourses; and outward capital flows were freefor corporates, except those with large domestic borrowings. Outwardcapital flows from non-corporate residents were further freed in 1994 aspart of an attempt to contain an inward capital surge.
The overall policy framework for management of the capital account,the exchange rate and macroeconomic policy
The present Malaysian capital account regime is remarkably similarto the Indian, despite their very diverse historical points of origin. Outwardinvestment for corporate residents is permissible up to a limit, and beyondthat with approval, again similar to the newly liberalized Indian regime;
INDIRA RAJARAMAN166
although in all approval-driven systems, it is the manner in which theapproval is exercised that determines the substance of the regime.
Inward capital flows into Malaysia continue to be free and unfettered,as always, for both FDI and portfolio investment. Flotation of issues onforeign bourses has always required government approval. Thus thereremains full capital account convertibility for non-residents. Among themeasures introduced in September 1998 was the ban on any use ofexternally-held ringgit accounts in domestic banks other than towardspurchases of Malaysian financial or real assets. This was introduced tocurb the flourishing offshore ringgit market, which fuelled speculativemovements in exchange markets in 1997 and 1998. To that degree, thefreedom earlier enjoyed by non-residents to operate ringgit-denominatedaccounts outside Malaysia has been curtailed. But non-residents remainfree to hold such accounts in Malaysia, subject to the ban on direct creditto residents from such accounts.
The legal regime in India for capital account transactions has seen amajor alteration, effective as of 1 June 2000, with the introduction of FEMA,under which contraventions of the ban on capital outflows from residentsno longer invite criminal penalties. The Act also grants first-time automaticapproval for outward FDI by corporates through stock swap options, subjectto sectoral caps and with possible approval beyond those caps. All otheroutflows of capital from residents remain banned. Non-resident capitalinflows enjoy full freedom of repatriation, and effective from March 2000,face very few sector-specific entry barriers. Flotation of shares on foreignbourses remains subject to government approval.
Policy in India towards the capital account over the 1990s has beensteady in terms of both direction (liberalization of capital inflows) andpace (gradual). The slow pace of liberalization of inflows in the capitalaccount was undoubtedly an outcome, to some degree, of buoyant inflowsof current invisibles, private remittances in particular, in response to theearly moves towards current account liberalization. The routing of privateremittances through official channels, away from hawala, was an outcome,inter alia, of lifting the ban on gold imports. Other elements of currentaccount liberalization, by making possible legitimate purchases of foreign

MANAGEMENT OF THE CAPITAL ACCOUNT: A STUDY OF INDIA AND MALAYSIA 167
currency, brought back flight capital through the mix of current and capitalaccount channels described in section II. However, no objective estimatesof the quantum of returning flight capital are available. With the return offlight capital, current account convertibility more than paid for itself.External reserves are now in the region of $40 billion (approximately8 months’ import cover), up from $1 billion, the crisis level in June 1991,immediately preceding reform.
Malaysian policy during the 1990s, from a starting point of free capitalaccount convertibility, has also demonstrated steadiness of purpose.Whether during the 1993 capital surge, or the 1997 capital outflows,Malaysian policy has asserted the sovereign right to impose temporaryreversals of freedom of cross-border capital flows, and thus to have capitalaccount convertibility on a reversible, rather than an irreversible, basis.During the 1993 capital inflow surge, which had a large short-termcomponent, restrictions were imposed on external borrowing, portfolioinvestment in Malaysian securities, and forward and swap transactions bybanks. These measures were reversed within a period of 8–12 months aspressures on the ringgit eased, with an outflow of short-term capital. ThusMalaysia rode out the inflow surge without the domestic monetaryturbulence of trying to sterilize free inflows.
The measures imposed in September 1998 have had a longer duration,and continue to remain in place, except for the phased reversal over a yearof the controls on portfolio repatriation. With the exception of the vestigial10 per cent levy on profits on portfolio capital in the country for less thanone year, which was removed in May 2001, and the successful killing ofthe offshore ringgit market through limits placed on permissible uses ofnon-resident accounts, these measures have curbed freedom of cross-borderflows for residents rather than non-residents. Although current accounttransactions do not carry category-specific caps, the tight limit imposed inSeptember 1998 on export of foreign currency by residents functions as auniform cap on outflows on both current and capital accounts. Malaysiahas decisively established its right to manage its capital account in such away as to impose a wedge if need arises, between the external value of theringgit and its sovereignty over domestic monetary policy.

INDIRA RAJARAMAN168
The exchange value of the ringgit remains at the peg of $1 = 3.8 ringgit,introduced in September 1998. The paradox is that the ringgit peg waspart of a package of measures designed to spur real growth through lowerdomestic interest rates – which had risen in response to speculative demandfor ringgit – and that today the peg undervalues the ringgit, so that pricesof imported capital goods are higher and investment lower than would bethe case in the absence of the peg. There is clearly a longer-term need toalign exchange rate policy with monetary policy. Even if this is recognizedwithin Bank Negara, the central bank is not free to introduce a unilateralchange of regime. At the same time, there is no expressed need for suchindependence. Macroeconomic policy is seen as an interlinked whole, tobe worked out in cooperation between the central bank and the executivearm of the Government.
The Indian rupee is market-determined in respect of trends. No otherpolicy is possible, given the inflation differential between India and itsmajor trading partners. However, the foreign exchange market remainsthin, and there are anywhere from one to three episodes of volatility in atypical year, in which the Reserve Bank of India (RBI) intervenes activelythrough alteration of liquidity conditions in the call-money market. Withthe introduction by the RBI of a Liquidity Adjustment Facility, and itscontinued efforts to improve depth in the call-money market, theseinterventions might become less jerky and ad hoc than they have been,noticeably during a major episode in mid-2000.
There is a coherent process of financial sector consolidation in placein India, and official recognition of the need for fiscal tightening, withoutwhich no lowering of domestic interest rates can take place. Financial sectorreforms remain snagged in the absence of any progress for establishing alegal framework for speedy liquidation of loss-making enterprises, whichin turn requires decisions that are difficult in the present political scenarioof coalition government.
Financial sector consolidation in Malaysia has received very carefulpolicy attention; it was begun in early 1998, well before the capital controlmeasures that came in September, with a four-pronged approach encom-passing asset management, bank recapitalization, loan management and

MANAGEMENT OF THE CAPITAL ACCOUNT: A STUDY OF INDIA AND MALAYSIA 169
debt restructuring, and bank consolidation. There is a clear recognition ofthe damage done by uncontrolled lending to the property sector, whichwas finally halted in 1999 at the supply end after some unfruitful fumblingwith demand-end controls. Controls were also introduced in 1998 and 1999on connected lending. Impressive attempts are under way to improve banks’in-house capacities for management of credit and market risk, with banksrequired to conduct monthly stress simulation tests under a variety ofscenarios, and to report to Bank Negara at quarterly intervals. All of thesewould be promising were it not for occasional evidence of coercion inpolicy implementation, as, for example, in the ongoing process of bankconsolidation – where the mergers into 10 consolidated entities may havebrought together unwilling partners – and the possibility that enforcedsubscription to bonds for recapitalization of the worst-hit banks might carryadverse incentives for well-managed banks in the system (for other issuesthat arise in connection with banking regulation in relation to a newfinancial architecture, see Cornford, 1999).
The Extent to which the different regimes in recent years have contributedto more stable capital movements
Short-term debt as a percentage of the total debt stock has shown amarked fall over the 1990s in India, particularly after the 1997 changesdiscouraging short maturities in the deposit schemes offered to non-residentIndians. These deposit schemes, a peculiar feature of the Indian capitalaccount, have now moved to a more sensible configuration of deposit rates,benchmarked to LIBOR for foreign currency deposits, in place of theprevious configuration which offered arbitrage opportunities bordering onthe scandalous. With the new maturity floors on non-resident Indian depositsand non-trade commercial debt, short-term debt will henceforth be purelytrade-related.
To the extent that Indian liberalization of capital inflows has so farmoved at a faster pace for portfolio investments than for FDI, the regimehas not contributed to stable capital movements as much as if FDI hadbeen more rapidly facilitated. Portfolio capital is inherently volatile,although this has been retarded to some degree in India by the proceduraldifficulties of entry and exit. However, with dematerialized trading finally

INDIRA RAJARAMAN170
having captured the bulk of traded stocks, there has been a dramatic fall intransaction costs of both entry and exit. While this is good in general forreduction of friction in the system, it might lead to greater volatility inportfolio flows, in much the same way in which the liquidity of Malaysiancapital markets, both onshore and offshore, facilitated contagion. Fortu-nately, there was a further liberalization of entry for FDI in March 2000,with the move to a small negative list of sectors needing approval, insteadof, as previously, a listing of open sectors.
Malaysian short-term debt as a share of total debt is higher than forIndia, but normalized to exports it has historically been far lower. However,with the decline in Indian short-term debt, the two are now roughly at par.Malaysia unquestionably stabilized capital inflows during the mid-decadesurge, with entry obstructions that reversed the heavy short-term inflowsin particular, and with liberalization of portfolio outflows for residents.The regime change in 1998, however, was not directed principally atexternal capital, since it was introduced in September 1998 after portfoliooutflows of $10 billion had already taken place in 1997. At the time, it wasdesigned principally to stabilize the ringgit and, by imposing barriers toexit of resident capital, to sever the link between exchange markets andthe monetary policy need of the hour, which was to lower interest rates. Tothe extent that lower interest rates succeeded in containing the recessionof 1998 and facilitating real growth of 5.6 per cent in 1999, the measuressucceeded in stabilizing the macroeconomic system, and, as a corollary,sustained the stability of FDI inflows within the neighbourhood of $2 billionthroughout 1998 and 1999.
Thus the Malaysian regime in place since 1998 has achieved greaterstabilization of capital flows than what would have obtained in thecounterfactual, but a historically different configuration of policies mightpossibly have secured greater insulation against contagion in the first place.Thus the development of a market in foreign exchange derivatives inMalaysia would have pre-empted the development of the offshore ringgitmarket, which arose in response to the hedging needs of counterparties toringgit-denominated trade with Malaysia; the offshore market was wherenon-residents were able to obtain ringgit-denominated credit for speculationduring the currency crisis outside the reach of controls applicable on credit

MANAGEMENT OF THE CAPITAL ACCOUNT: A STUDY OF INDIA AND MALAYSIA 171
to non-residents within Malaysia. Again, the controls on lending forconstruction of upmarket resorts and commercial properties, if enacted in1994 rather than in 1999, would have prevented the financial sectorsoftening that, along with export deceleration, precipitated capital outflowsin 1997. But after the onset of the crisis, the Malaysian response was awell-judged, macro-stabilization package with a focus on the real sectorcorrective called for at the time.
Likely future direction of policy and major influences
Malaysia is politically stable, with a Prime Minister firmly in controlof economic policy, and not due to face parliamentary elections until 2004.It is likely that the capital controls will remain in place until then. On theoccasion of Malaysia’s National Day on 31 August 2000, the Prime Ministerreaffirmed his commitment to the peg, despite widespread consensus thatthe ringgit is undervalued at the peg. There is worry that FDI may fall offin some years, and that the continuation of inflows at around the $2 billionlevel seen right through 1998 and 1999 merely represented a follow-throughon projects begun before the crisis. Thus, although the medium-term outlookis stable, both politically and in terms of the capital account regime, thereis an underlying apprehension about the peg and the eventual need for aregime that permits mutual compatibility between exchange rate andmonetary policy.
The likely economic policy direction in India is somewhat less certainthan in Malaysia because of the greater political uncertainty, despiteagreement across the political spectrum on the obstacles that must beaddressed if economic fundamentals are to be strengthened: the fiscaloverhang and the need for investment in infrastructure. There is broad-spectrum consensus that external capital must be wooed for infrastructureand other investments, so that the opening up to capital inflows of the1990s will continue regardless of the political configuration. What remainimpaled on the political scenario, however, are the ideologically-sensitivedecisions on cutting fiscal subsidies, which are critically necessary forcutting interest rates and thus for facilitating the real growth without whichno sustainable financial sector reform is possible. The import liberali-zation, which will be fully completed according to the WTO timetable by

INDIRA RAJARAMAN172
March 2001, has left in its wake defeated domestic competitors, and thelegal reform necessary to enable liquidation of loss-making enterprises isa function of the political strength of pro-reform elements in theGovernment. The national Government, if it lives out its full term, is duefor a change only in 2004. Cutting fiscal subsidies on petroleum products,food and electricity will raise cost-push inflation even as it engenders realgrowth (through reduction in the fiscal deficit and thereby domestic interestrates), so that with or without fiscal reform there is no immediate prospectof achieving the macroeconomic markers necessary for full convertibilityon capital account.

MANAGEMENT OF THE CAPITAL ACCOUNT: A STUDY OF INDIA AND MALAYSIA 173
APPENDIX A
EXTERNAL POLICY MILESTONES: INDIA
Exchange rate regime/current account
1 March 1992: Dual exchange rates, administered/market-determined,under the Liberalized Exchange Rate ManagementSystem (LERMS).
1 March 1993: Unification of dual exchange rates into single-market-determined rate.
20 Aug. 1994: Current account convertibility (IMF Article VIII), withnotified, category-specific caps on outflows.
9 Jan. 1997: Caps on trade-related outflows removed.
31 March 2000: Quantitative restrictions removed on 714 out of 1,429imported items; remainder slated for removal by31 March 2001.
Capital account
Institutional/legal framework
30 Jan. 1992: Statutory empowerment of Securities Exchange Boardof India (SEBI) for regulation of stock markets.
8 Jan. 1993: Major alterations in Foreign Exchange Regulation Act(FERA) of 1973 granting parity of status to foreign andIndian-owned companies, and liberalizing outwardinvestments by Indian companies in joint venturesoverseas.

INDIRA RAJARAMAN174
23 July 1996: Legislation passed in Parliament for setting up of theNational Stock Depository enabling first-time paperlesstrading on the capital market.
30 May 1997: Report of the (Tarapore) Committee on Capital AccountConvertibility (CAC) recommending a three-year phasedmove to CAC, subject to macro targets: Gross fiscaldeficit/GDP 3.5 per cent (1999–2000); inflation rates3–5 per cent (1997–2000); debt service ratio of 20 percent (1999–2000).
5 April 1999: All trading in India’s two main stock indices, Nifty(NSE–50 stock index) and Sensex (BSE-30 stock index)dematerialized.
1 June 2000: Replacement of FERA by Foreign Exchange Manage-ment Act (FEMA); contraventions hereafter to be dealtwith under civil, not criminal, law.
Foreign direct investment
24 July 1991: Under new industrial policy, first-time automatic approval(with export obligations) of FDI up to 51 per cent in34 specified sectors, higher than 51 per cent permissiblewith approval; in place of earlier case-by-case approvalsubject to 40 per cent ceiling in all but high-technologyor export-oriented projects.
13 April 1992: India signs Multilateral Investment Guarantee AgencyProtocol (MIGA) for protection of foreign investments.
31 March 2000: All FDI placed under automatic route except for a smallnegative list for sectors still requiring licensing (forboth domestic and foreign investment) or for foreigninvestment exceeding notified sectoral caps.

MANAGEMENT OF THE CAPITAL ACCOUNT: A STUDY OF INDIA AND MALAYSIA 175
Foreign equity inflows
Foreign Institutional Investors (FIIs)
30 Jan. 1992: FIIs allowed to invest with full repatriability of principaland income in primary/secondary markets, subject toregistration with SEBI; aggregate ceiling of 24 per centof issued share capital; and individual ceiling of 5 percent.
22 July 1996: Individual ceiling raised from 5 to 10 per cent.
4 April 1997: Aggregate ceiling raised from 24 to 30 per cent.
24 April 2000: Aggregate ceiling raised from 30 to 40 per cent.
Capital issues on foreign bourses
1 April 1992: a Indian companies permitted to issue, subject to govern-ment approval, Foreign Currency Convertible Bonds andordinary shares through Global/American DepositoryReceipts (GDRs and ADRs) on Overseas Stock/Over theCounter Exchanges, with full repatriation benefits andno lock-in period, but with end-use restrictions.
22 May 1998: All end-use restrictions lifted except for ban on use ofGDR/ ADR issue proceeds for investment in real estate/stock market.
External commercial borrowing (ECB)
Subject to an overall annual ceiling with preference for infrastructure andexport sector financing, and restrictions on utilization for rupee expenditureb
relaxed for:

INDIRA RAJARAMAN176
18 May 1995: Manufacturing companies:Limit: $1 millionMinimum maturity: 3 years
8 Jan. 1996: Non-manufacturing companies:Same limits as for manufacturing
19 June 1996: Limit: $3 million
31 March 1997: Long-term limit : $100–$200 millionMinimum maturity : 10–20 years.
31 March 1997: Inward remittance of funds for imports permissible withutilization lag of up to one year.
16 June 1998: Loans with minimum average maturity of 10 years out-side aggregate cap on ECB.
22 May 1998: No end-use restrictions. Minimum maturity between3 years (simple) to 5 years (average) varying directlywith amount borrowed; 8–16 years for long-term win-dow.
Forex financial c markets
7 April 1997: Scrapping of CRR and SLR on inter-bank borrowingsleads to MIBOR.
15 April 1997: 1. First-time permission for forward foreign exchangecontracts without documentary evidence of underlyingexposure, and beyond six months; subject to a decla-ration of exposure supported by average export/importturnover of last two years.
2. Case-by-case approval of rupee/foreign currencyswaps replaced by permission for authorized dealersto operate “swap book” within their open positionlimits.

MANAGEMENT OF THE CAPITAL ACCOUNT: A STUDY OF INDIA AND MALAYSIA 177
11 June 1998: First-time permission for forward exchange cover to FIIsto the extent of 15 per cent of outstanding investmentsas on that date.
24 April 1999: Limit for forward cover: 15 per cent of investments ason 31 March 1999 (with utilization, further extension ofcover possible); entire incremental investment thereafter.
Foreign currency holdings (banned in general for residents)
1 April 1993: Exchange Earners Foreign Currency (EEFC) Schemeunder which exporters permitted to retain part of theirearnings in accounts held abroad.
14 Aug. 2000: Halving of EEFC balances effective 23 August 2000.
10 Oct. 2000: EEFC ruling reversed.
Source: RBI, Annual Reports (various).a The notification was issued on 12 November 1993, but with backdated
effect from 1 April 1992.b As distinct from use for import financing; rupee expenditure on
investment in stock markets/real estate is prohibited.c Deregulation dates for domestic bank deposit rates are given in notes to
table 7, along with deregulation details on NRI deposits.
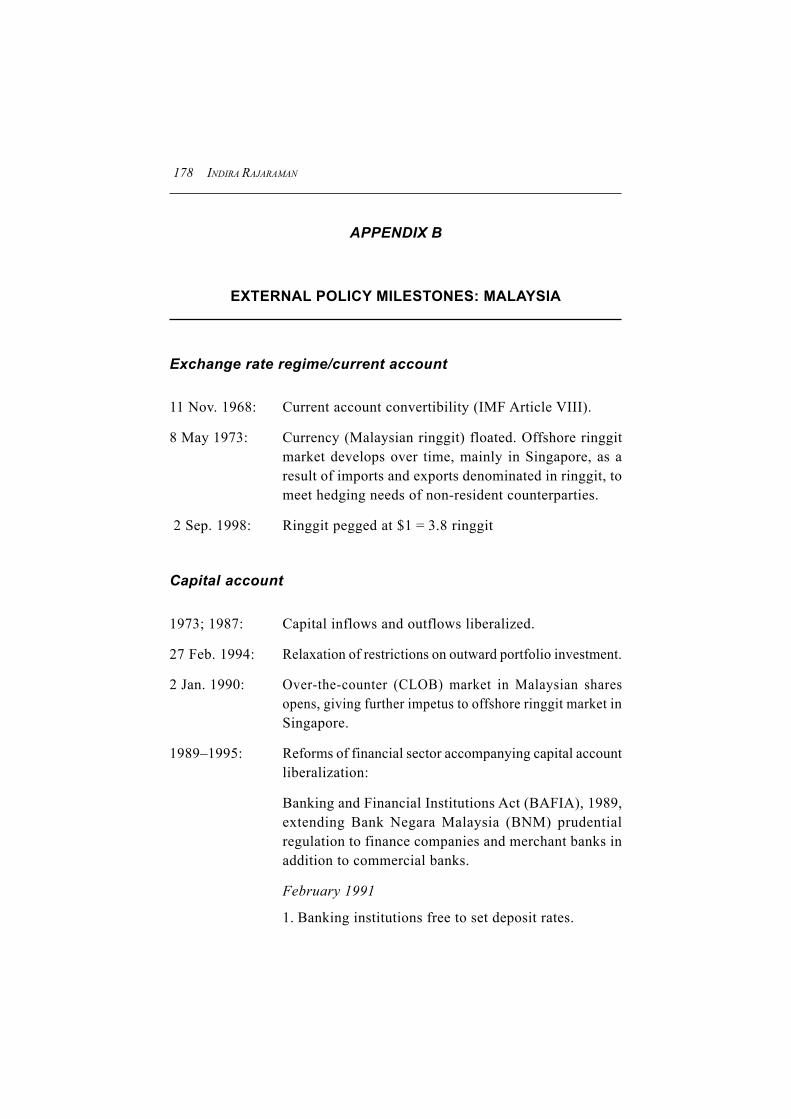
INDIRA RAJARAMAN178
APPENDIX B
EXTERNAL POLICY MILESTONES: MALAYSIA
Exchange rate regime/current account
11 Nov. 1968: Current account convertibility (IMF Article VIII).
8 May 1973: Currency (Malaysian ringgit) floated. Offshore ringgitmarket develops over time, mainly in Singapore, as aresult of imports and exports denominated in ringgit, tomeet hedging needs of non-resident counterparties.
2 Sep. 1998: Ringgit pegged at $1 = 3.8 ringgit
Capital account
1973; 1987: Capital inflows and outflows liberalized.
27 Feb. 1994: Relaxation of restrictions on outward portfolio investment.
2 Jan. 1990: Over-the-counter (CLOB) market in Malaysian sharesopens, giving further impetus to offshore ringgit market inSingapore.
1989–1995: Reforms of financial sector accompanying capital accountliberalization:
Banking and Financial Institutions Act (BAFIA), 1989,extending Bank Negara Malaysia (BNM) prudentialregulation to finance companies and merchant banks inaddition to commercial banks.
February 1991
1. Banking institutions free to set deposit rates.

MANAGEMENT OF THE CAPITAL ACCOUNT: A STUDY OF INDIA AND MALAYSIA 179
2. Base lending rate (BLR) of each bank subject tostandardized formula benchmarked on deposit rates.
3. Maximum lending rate capped at 4 per cent above BLR.
November 1995
Banks free to set BLR subject to ceiling (benchmarkedon 3-month interbank rate + 2.5 per cent margin).
Inward capital controls (temporary)
17 Jan. 1994–20 Jan. 1995: Ceiling on foreign borrowing by domestic banks (ex-
cluding trade-related and direct investment).24 Jan.–12 Aug. 1994: Restrictions on portfolio investment in Malaysian secu-
rities.23 Feb.–16 Aug. 1994: Restrictions on forward and swap transactions by banks.
Controls on outward capital/closure of non-resident accessto ringgit
4 Aug. 1997: Currency swap limit of $2 million per bank group onoffer side (sale of ringgit) on transactions other thancurrent account with non-residents.
1 Sep. 1998: 1. Prohibition on transfer of funds from externally-heldringgit accounts except for:
i. Purchase of ringgit-denominated assets includingimmovable property in Malaysia but excludingringgit credit to residents.
ii. Expenditure on administrative expenses/purchaseof goods and services in Malaysia. With the conse-quent immobilization of offshore ringgit deposits,holders of offshore ringgit holdings were permitted
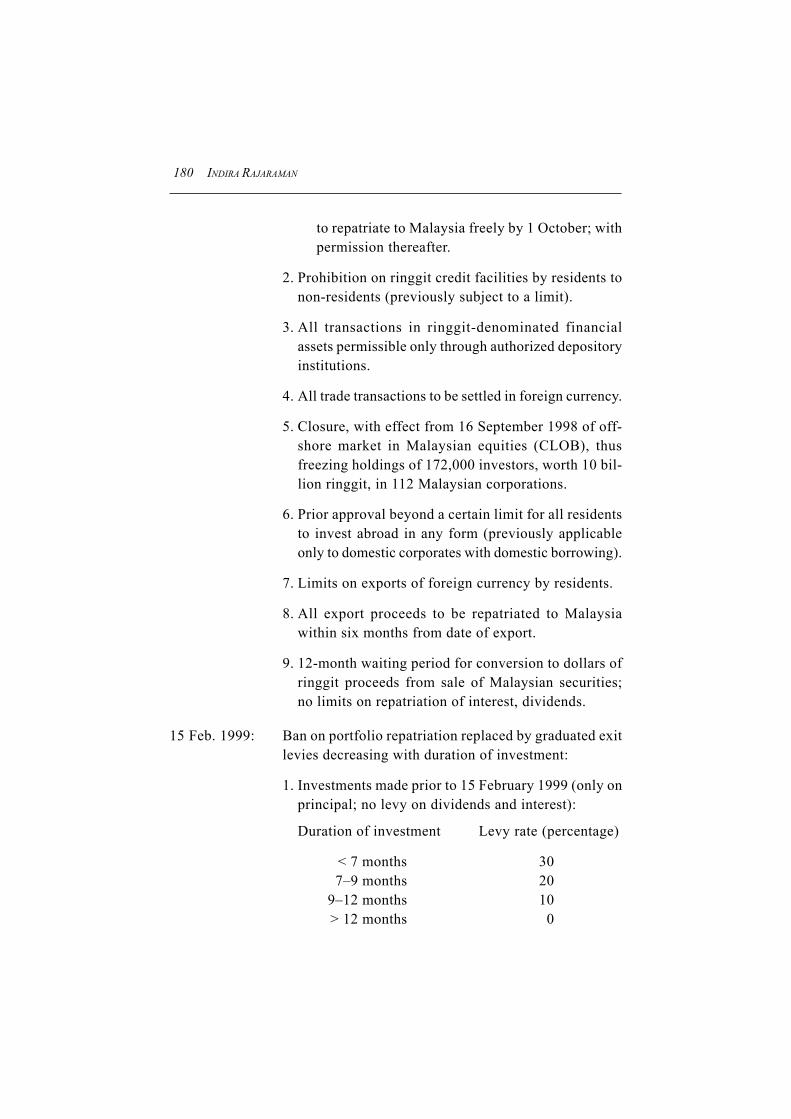
INDIRA RAJARAMAN180
to repatriate to Malaysia freely by 1 October; withpermission thereafter.
2. Prohibition on ringgit credit facilities by residents tonon-residents (previously subject to a limit).
3. All transactions in ringgit-denominated financialassets permissible only through authorized depositoryinstitutions.
4. All trade transactions to be settled in foreign currency.
5. Closure, with effect from 16 September 1998 of off-shore market in Malaysian equities (CLOB), thusfreezing holdings of 172,000 investors, worth 10 bil-lion ringgit, in 112 Malaysian corporations.
6. Prior approval beyond a certain limit for all residentsto invest abroad in any form (previously applicableonly to domestic corporates with domestic borrowing).
7. Limits on exports of foreign currency by residents.
8. All export proceeds to be repatriated to Malaysiawithin six months from date of export.
9. 12-month waiting period for conversion to dollars ofringgit proceeds from sale of Malaysian securities;no limits on repatriation of interest, dividends.
15 Feb. 1999: Ban on portfolio repatriation replaced by graduated exitlevies decreasing with duration of investment:
1. Investments made prior to 15 February 1999 (only onprincipal; no levy on dividends and interest):
Duration of investment Levy rate (percentage)
< 7 months 307–9 months 20
9–12 months 10> 12 months 0

MANAGEMENT OF THE CAPITAL ACCOUNT: A STUDY OF INDIA AND MALAYSIA 181
2. Investments after 15 February 1999 (only on capitalgains; no levy on principal, dividends or interest):
Duration of investment Levy rate
< 12 months 30> 12 months 10
21 Sep.1999: Flat 10 per cent exit levy on capital gains on portfolioinvestment irrespective of duration of investment.
1 Feb. 2001: 10 per cent exit levy applicable only on duration ofinvestment < 12 months removed effective 2 May 2001.
Related changes not directly targeted at capital flows
12 Sep. 1998: Demonetization of large-denomination ringgit notes(1,000 ringgit and 500 ringgit) effective 1 July 1999.
1 Sep. 1998: 1. Maximum BLR benchmarked on BNM interventionrate in place of inter-bank rate, with 2.25 per centmargin.
2. Maximum margin above BLR of banks lowered from4 to 2.5 percentage points.
3. Enactment of Pengurusan Danaharta Nasional BerhadAct to set up Danaharta, an asset management company.
Source: BNM (1999) and BNM, Annual Reports (various) supplemented by IMF(1999).

INDIRA RAJARAMAN182
NOTES
1 A further one-off $1 billion inflow into private transfers in 1996/97 was from redemptionto residents in India of the India Development Bonds floated in the late 1980s.
2 The Resurgent India Bonds (RIB) issued by India in late 1998, which raised in excessof $4 billion, have not been entered in the BIS aggregate for debt securities.
3 The benchmark was actually 0.8 (three-month inter-bank rate)/(1-SRR) as reported byBNM (1999).
REFERENCES
Athukorala P (1998). Swimming against the tide: Crisis management in Malaysia. ASEANEconomic Bulletin, 15: 3 (December): 281–289.
Bank Negara Malaysia (1999). The Central Bank and the Financial System in Malaysia:A Decade of Change, 1989–1999. Kuala Lumpur, Bank Negara Malaysia.
Bank Negara Malaysia (2000). Monthly Statistical Bulletin, June. Kuala Lumpur, Bank Negara,Malaysia.
Bank Negara Malaysia (various) Annual Reports, 1997, 1998 and 1999. Kuala Lumpur, BankNegara, Malaysia.
Borgini P, Claessens S and Ferri G (2000). Political economy of distress in East Asian financialinstitutions. World Bank Policy Research Working Paper 2265. Washington, DC, WorldBank.
Brown SJ, Goetzmann WN and Park J (1998). Hedge funds and the Asian currency crisis of1997. Working paper no. 6427, National Bureau of Economic Research, Cambridge, MA.
Cole DS, Scott HS and Wellons PA (1995). Asian Money Markets. New York, Oxford UniversityPress.
Cooper R (1998). Should capital account convertibility be a world objective? In: Kenen P,ed., Should the IMF Pursue Capital Account Convertibility? Princeton Essays inInternational Finance. 207 (May): 11–19.
Cornford A (1999) Some remarks on banking regulation and supervision and their limitationsin relation to a new financial architecture. Paper presented at the Conference on Structure,Instability and the World Economy: Reflections on the Economics of Hyman P. Minsky.The Jerome Levy Economics Institute, Blithewood, NY, 21–23 April.
Das T (1999). East Asian economic crisis and lessons for debt management. In: Vasudevan A,ed., External Debt Management: Issues, Lessons and Preventive Measures. Mumbai,Reserve Bank of India: 77–95.
Furman J and Stiglitz J (1998). Economic crises: Evidence and insights from East Asia.Brookings Papers on Economic Activity. 2: 1–135.
Ghani E and Sood V (1999). Productivity growth, capital accumulation and the banking sector:Some lessons from Malaysia. World Bank Policy Research Working Paper, 2252.
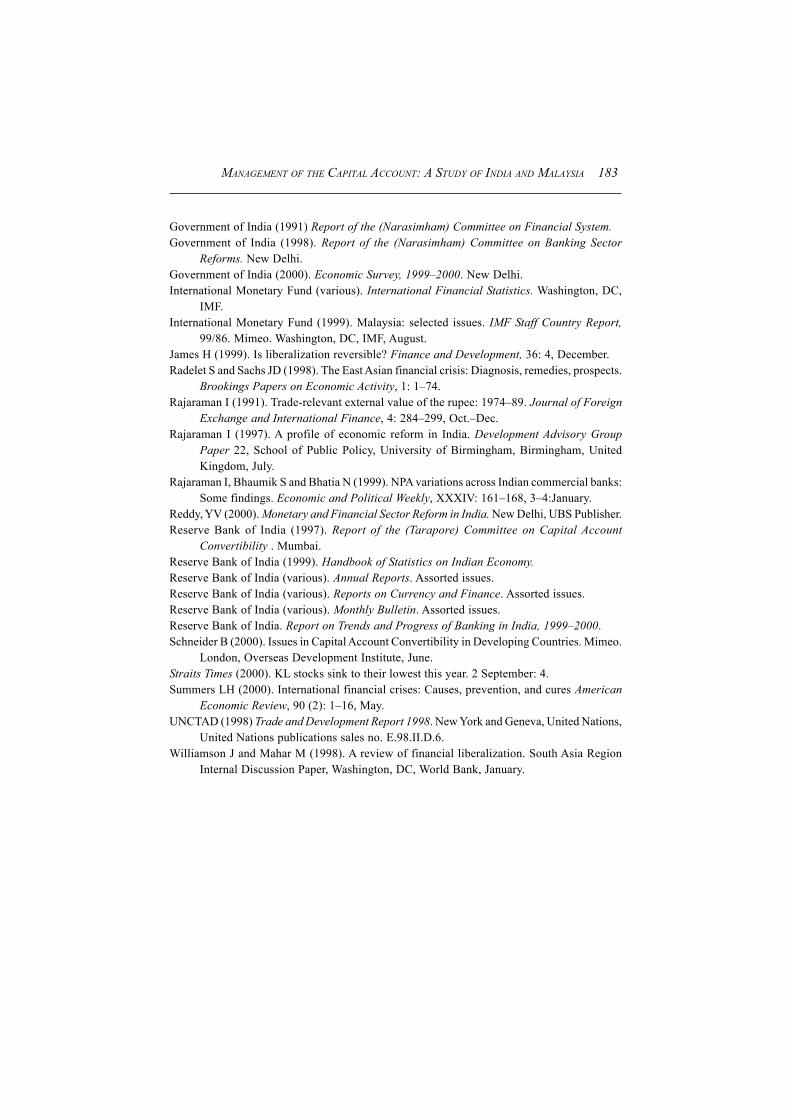
MANAGEMENT OF THE CAPITAL ACCOUNT: A STUDY OF INDIA AND MALAYSIA 183
Government of India (1991) Report of the (Narasimham) Committee on Financial System.Government of India (1998). Report of the (Narasimham) Committee on Banking Sector
Reforms. New Delhi.Government of India (2000). Economic Survey, 1999–2000. New Delhi.International Monetary Fund (various). International Financial Statistics. Washington, DC,
IMF.International Monetary Fund (1999). Malaysia: selected issues. IMF Staff Country Report,
99/86. Mimeo. Washington, DC, IMF, August.James H (1999). Is liberalization reversible? Finance and Development, 36: 4, December.Radelet S and Sachs JD (1998). The East Asian financial crisis: Diagnosis, remedies, prospects.
Brookings Papers on Economic Activity, 1: 1–74.Rajaraman I (1991). Trade-relevant external value of the rupee: 1974–89. Journal of Foreign
Exchange and International Finance, 4: 284–299, Oct.–Dec.Rajaraman I (1997). A profile of economic reform in India. Development Advisory Group
Paper 22, School of Public Policy, University of Birmingham, Birmingham, UnitedKingdom, July.
Rajaraman I, Bhaumik S and Bhatia N (1999). NPA variations across Indian commercial banks:Some findings. Economic and Political Weekly, XXXIV: 161–168, 3–4:January.
Reddy, YV (2000). Monetary and Financial Sector Reform in India. New Delhi, UBS Publisher.Reserve Bank of India (1997). Report of the (Tarapore) Committee on Capital Account
Convertibility . Mumbai.Reserve Bank of India (1999). Handbook of Statistics on Indian Economy.Reserve Bank of India (various). Annual Reports. Assorted issues.Reserve Bank of India (various). Reports on Currency and Finance. Assorted issues.Reserve Bank of India (various). Monthly Bulletin. Assorted issues.Reserve Bank of India. Report on Trends and Progress of Banking in India, 1999–2000.Schneider B (2000). Issues in Capital Account Convertibility in Developing Countries. Mimeo.
London, Overseas Development Institute, June.Straits Times (2000). KL stocks sink to their lowest this year. 2 September: 4.Summers LH (2000). International financial crises: Causes, prevention, and cures American
Economic Review, 90 (2): 1–16, May.UNCTAD (1998) Trade and Development Report 1998. New York and Geneva, United Nations,
United Nations publications sales no. E.98.II.D.6.Williamson J and Mahar M (1998). A review of financial liberalization. South Asia Region
Internal Discussion Paper, Washington, DC, World Bank, January.


CHINA: MANAGING FINANCIAL INTEGRATION 185
CHINA: MANAGING FINANCIAL INTEGRATION
Wei Ge
I. FINANCIAL INTEGRATION AND VULNERABILITY
The outbreak of the Asian financial crisis in 1997 and its devastatingaftermath have brought to light a host of issues concerning capital accountmanagement, liberalization and its implications for overall economicdevelopment. As a group of once high-performing, “miracle” economiesin Asia1 – notably Indonesia, Malaysia, the Republic of Korea and Thailand– were suddenly trapped into a sharp economic downturn and suffered theconsequences of enormous income and welfare losses. An immediatequestion raised by policy makers and in academic circles was “What wentwrong?” The subsequent contagion effects of the crisis, reaching not onlysome economies in the Asia-Pacific region but also countries as far awayas Brazil and the Russian Federation, extended the inquiry into a closelyrelated question: “What can be done, both domestically and inter-nationally?”
Scholarly investigation of the issues involved has been wide ranging.Concerning the first question, a set of factors attributable to a varyingdegree to the outbreak of the crisis has been identified. Broadly, theseinclude: macroeconomic management, particularly in the presence of anon-sustainable resource gap, and the manner in which it is financed; theleverage and governance of corporate and financial sectors; accounting

WEI GE186
and disclosure standards; regulatory and policy transparencies; therelationship between government and businesses, and between financialintermediaries and corporations; the behaviour of alternative types of cross-border capital flows and their implications for a receiving country; exchangerate regimes and their management; the conduct of sectoral policies andresulting structural imbalances; and too fast a pace of financial liberalizationin the absence of prudent regulations. Weaknesses in these areas and theirinterrelationships are considered to be the main reasons why the crisis-affected economies were so vulnerable to external shocks, and they helpexplain what might have triggered a crisis of this magnitude in the firstplace. Studies on the second question have thus far focused on severalinterconnected aspects. What are the policy objectives and instrumentsneeded for a proper handling of the crisis and its contagion effects? Howmay these policies be coordinated at the micro, macro, and internationallevels? What are the useful indicators that may signal an impending crisiswith some degree of reliability? What forms of institutional infrastructureand monitoring framework, both domestic and international, do we needin order to reduce the potential risks associated with financial liberalizationand sustain economic development in the increasingly integrated globaleconomic environment?2
As to individual economies, the answers to these questions rest heavilyon the diagnosis of the specific problems at hand, which tend to be highlycase-sensitive. Financial and banking difficulties are not new phenomena,and are certainly not limited to developing countries and economies intransition. The banking problems encountered by some industrializedcountries,3 as well as by certain newly industrializing economies (NIEs) –such as Hong Kong (China), Singapore and Taiwan Province of China –are just a few well-known examples in recent memory. Of the crisis-affectedAsian economies, Malaysia, the Philippines and Thailand had all experiencedfinancial and banking difficulties prior to the 1997 crash. Likewise, theproblem of external debt and corporate leverage was not unfamiliar to policymakers in the Republic of Korea. By most international standards – andthose practised in some NIEs – perhaps none of today’s developingcountries and transitional economies can be considered free of at leastsome of the above-cited “vulnerabilities”. Many of these economies have,since 1997, either steered clear of the financial storm or managed to weather
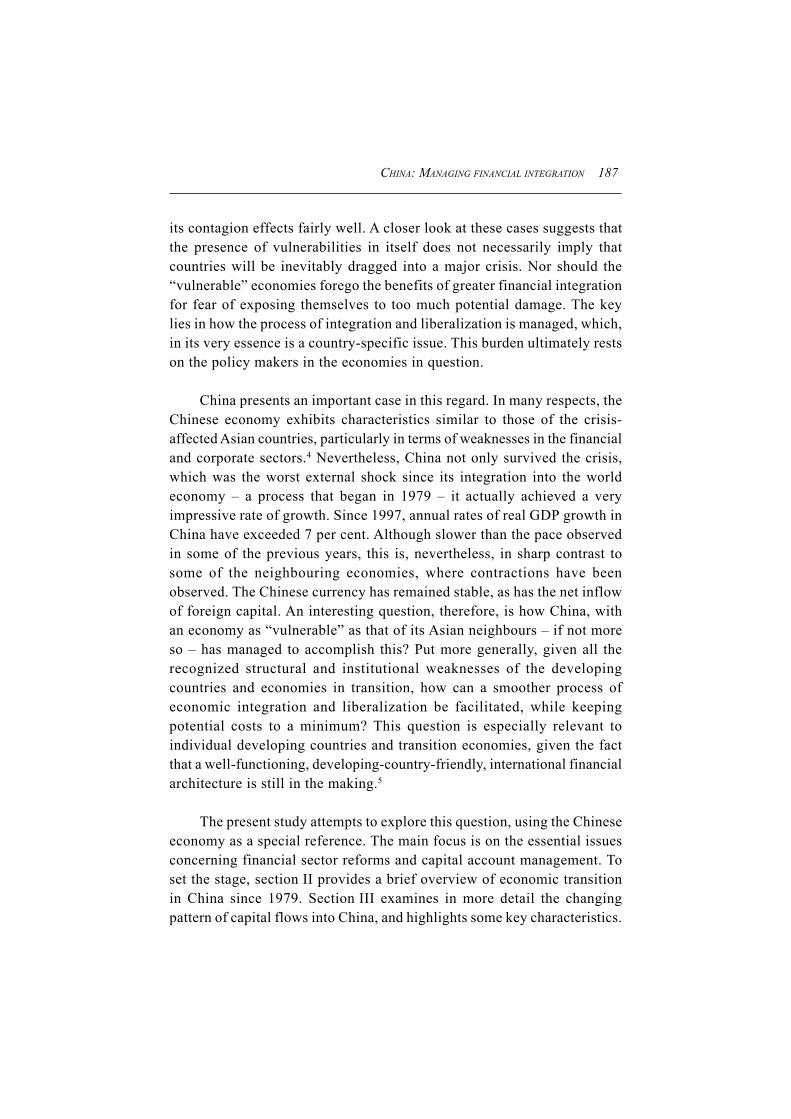
CHINA: MANAGING FINANCIAL INTEGRATION 187
its contagion effects fairly well. A closer look at these cases suggests thatthe presence of vulnerabilities in itself does not necessarily imply thatcountries will be inevitably dragged into a major crisis. Nor should the“vulnerable” economies forego the benefits of greater financial integrationfor fear of exposing themselves to too much potential damage. The keylies in how the process of integration and liberalization is managed, which,in its very essence is a country-specific issue. This burden ultimately restson the policy makers in the economies in question.
China presents an important case in this regard. In many respects, theChinese economy exhibits characteristics similar to those of the crisis-affected Asian countries, particularly in terms of weaknesses in the financialand corporate sectors.4 Nevertheless, China not only survived the crisis,which was the worst external shock since its integration into the worldeconomy – a process that began in 1979 – it actually achieved a veryimpressive rate of growth. Since 1997, annual rates of real GDP growth inChina have exceeded 7 per cent. Although slower than the pace observedin some of the previous years, this is, nevertheless, in sharp contrast tosome of the neighbouring economies, where contractions have beenobserved. The Chinese currency has remained stable, as has the net inflowof foreign capital. An interesting question, therefore, is how China, withan economy as “vulnerable” as that of its Asian neighbours – if not moreso – has managed to accomplish this? Put more generally, given all therecognized structural and institutional weaknesses of the developingcountries and economies in transition, how can a smoother process ofeconomic integration and liberalization be facilitated, while keepingpotential costs to a minimum? This question is especially relevant toindividual developing countries and transition economies, given the factthat a well-functioning, developing-country-friendly, international financialarchitecture is still in the making.5
The present study attempts to explore this question, using the Chineseeconomy as a special reference. The main focus is on the essential issuesconcerning financial sector reforms and capital account management. Toset the stage, section II provides a brief overview of economic transitionin China since 1979. Section III examines in more detail the changingpattern of capital flows into China, and highlights some key characteristics.
WEI GE188
Certain critical elements and mechanisms that have prevented China frombeing dragged into the Asian financial crisis are discussed in section IV.These include restructuring of the financial sector, the exchange rate systemand management, and the structure and operation of equity markets. SectionV concludes the study with some final remarks on the potential impacts onChina of its entry into the World Trade Organization (WTO). The discussiondoes not attempt to provide a comprehensive assessment of all the above-mentioned areas in every detail, but rather to concentrate on those aspectsthat best fit the purpose of this study.
II. THE CHINESE ECONOMY IN TRANSITION:A BRIEF OVERVIEW6
The founding of the People’s Republic on 1 October 1949 marked thebeginning of modern economic development in China. Its subsequentdevelopment may be divided into two phases, according to the economicsystem installed, the strategies pursued and the country’s economicrelationship with the outside world. The first phase covers a 30-year period,from late 1949 to the end of 1978. The second phase began in 1979, whenthe leadership set out to reform and open up the economy.7
The development strategy implemented in the first phase wasessentially one that called for rapid industrialization by concentrating onpromoting heavy industry and economic independence. Economic activitieswere organized and managed under a central planning system similar tothat of the former Soviet Union. The degree of reliance on foreign marketsand assistance was kept low, with an emphasis on economic self-sufficiency.Since 1979, however, dramatic changes have taken place in China: thecountry is undergoing a period of rapid transition, turning away from thecentral planning system and moving towards a more market-orientedconfiguration. The pattern of economic growth has since been morebalanced in terms of the sectoral structure of production and the relationshipbetween accumulation and consumption. Equally important, China hasbecome much more outward looking and is increasingly integrating intothe international community.

CHINA: MANAGING FINANCIAL INTEGRATION 189
A. Accomplishments in two decades of reform
Reforms introduced in China since 1979 have accelerated the processof industrialization and urbanization, and brought about impressive growthin production, trade and the standard of living. Despite the internal andexternal difficulties that the country has encountered, as well as theenormous social, political and economic challenges it still faces, thetransition process has been, on average, remarkably smooth so far and,judging by most social and economic indicators, outstandingly successful.
During the period 1979–1999, real GDP in China grew at an averagerate of about 8 per cent per annum – unmatched in any period in China’shistory and unparalleled by any other economy in transition. The countryemerged as the most dynamic and fastest growing economy in the worldand one of the most powerful driving forces in the development of theAsia-Pacific region. During this period, inflation was generally kept incheck, productivity growth accelerated, and output and trade soared. Asrecently as 1996, industrial production was more than seven times higherthan in 1978, and total trade 14 times higher. These upward trends havesince been strengthened. In two decades, the overall size of the economyhas increased more than fourfold.
This dynamic growth has been widely spread across most of thecountry. It has been estimated that if each of China’s 30 municipalities,provinces and autonomous regions8 were treated as an individual economy,then the 20 fastest growing economies in the world in the past two decadeswould have been Chinese (World Bank, 1997a: 3).9 The result of this rapidexpansion has been a substantial improvement in the standard of living forthe population at large. Real income per capita in China has more thanquadrupled during the period. In this respect, China has achieved intwo generations what took industrialized countries centuries. More than200 million people – the equivalent of about 4 per cent of the total worldpopulation – have been lifted out of absolute poverty during this shortperiod (World Bank, 1997a: footnote 9). At the same time, the economyhas largely avoided the unsustainable swings that are common to thedeveloping countries that have undergone rapid economic expansion.

WEI GE190
B. Economic reforms and systemic transformation
The robust growth over the past two decades has been both a causeand a consequence of China’s ongoing process of economic reform andsystemic transformation. China has made remarkable progress in reshapingits once highly centralized economic management system: the scope ofcentral planning has been greatly reduced and market forces are playingan increasingly significant role in the country’s economy. Less than 5 percent of industrial production is now under central government planning,down drastically from more than 70 per cent in 1978. Virtually all consumergoods are sold at market prices, compared to less than 5 per cent two decadesago.
In the rural area, the commune system of collective farming wasabolished in the early 1980s and replaced by the household production/responsibility system, which later developed into the household contractsystem. The reform has boosted agricultural production and productivitygrowth. Sweeping reforms have also been carried out in a wide range ofareas, including taxation, investment financing, banking, foreign exchangemanagement and trade, wages, prices and in various social security andwelfare systems. Private ownership is encouraged; the private sector hasbeen playing an increasingly important role in the economy. Small andmedium-sized, collectively-owned enterprises flourish in both rural andurban areas. The non-State-owned sector now contributes more than 50 percent to the country’s total industrial production, and commands a significantshare in tertiary markets. Reforms in large-scale, State-owned sectors arewell under way. Markets for capital, labour, raw materials and real estate,as well as for bonds, stocks, futures trading and insurance, are developingat an accelerating pace. Macroeconomic management has shifted fromdepending heavily on administrative controls to increasingly relying onindirect, market-oriented methods. The financial and banking sectors havebeen restructured and enhanced, and the legal and institutional frameworkhas been formulated and strengthened.

CHINA: MANAGING FINANCIAL INTEGRATION 191
C. Opening up to the outside world
The reforms have gone hand-in-hand with promotion of greatereconomic openness, bringing the country’s foreign trade and exchange ratesystem closer in line with international practice, and substantially helpingto promote foreign trade. On 1 January 1994 the practice of multipleexchange rates was abolished and a unitary exchange rate system put inplace. Strict controls over foreign exchange transactions have been relaxed,trade in foreign exchange on the current account is now permitted,10 andextension to liberalized items on the capital account is on the agenda. Moreand more tariffs and quotas, once levied on traded goods, have either beenlifted or are being reduced. To meet conditions for entry into WTO, Chinahas slashed tariffs on imported items four times since the end of 1992,lowering the country’s average tariff rate to 17 per cent from the previousaverage of 43.2 per cent.11 Progress has also been made in removing non-tariff barriers. Regulations and procedures concerning foreign transactionsare being clarified and simplified. With the accession of China to WTO,the scope and depth of its opening-up efforts are expected to be even morefar-reaching.12
China’s degree of openness has increased significantly since 1979.Total merchandise trade (exports plus imports) surged to $323.9 billion in1998 from a mere $20.6 billion in 1978, and accounted for more than 35 percent of China’s GDP. While it ranked thirty-second in 1978, China emergedin 1993 as the eleventh largest trading nation in the world, and now, just afew years later, it has advanced further to figure among the top 10. Itsbooming economy has attracted investors from all over the world. In 1998,for example, FDI in China stood at $45.5 billion, having grown more than10 times since 1986, and even more significantly from its negligible levelof $6 billion for the period 1978–1982, when the process of economicreform and opening had just begun. In 1993 China already ranked as thesecond largest FDI recipient in the world after the United States. Thatranking has since remained unchanged.
Since the mid-1980s (and especially the early 1990s) more sectorsand geographical regions in China have been opened up to foreign

WEI GE192
investment and participation. The sectors include those that were previouslyprohibited, such as energy exploration and production, infrastructureconstruction, telecommunications and banking and financial services.Geographically, FDI has expanded from a few designated small areas inthe south-east provinces of Guangdong and Fijian in the late 1970s to thecountry’s vast hinterland. The number of foreign-funded firms establishedin China has increased substantially over the past 20 years. The investingfirms have brought not only the physical capital, but also technical,managerial and marketing know-how, thus enhancing China’s efficiencyin production and competitiveness in the world marketplace.
While active in attracting FDI, China has exercised greater caution inmanaging foreign commercial borrowing and portfolio investment inflows.As detailed in sections III and IV below, this is reflected both in its externaldebt management and in the way in which the Chinese equity marketsoperate. Nevertheless, capital inflows from these sources have increased.In addition, significant funds have been raised in foreign stock and bondmarkets, including Hong Kong (China), in recent years. Apart from privatesources, loans obtained from foreign governments have contributed tocapital inflows to China. This is in addition to the funds furnished byinternational financial institutions, such as the World Bank and the AsianDevelopment Bank. As the process of opening up continues, Chineseenterprises are becoming more actively involved in investing overseas.The significantly greater economic openness has reinforced efforts towardssystemic reforms as well as deepened and accelerated the pace of overalleconomic transition.
CHINA: MANAGING FINANCIAL INTEGRATION 193
III. THE CHANGING PATTERN OF CAPITAL INFLOWS
Table 1 provides information on actual (paid-in) utilization of foreigncapital in China, with a breakdown by category, for the period 1983–1998.Several observations may be made on the changing pattern of foreign capitalinflows.
A. The predominance of foreign direct investments
The amount of total inflows has grown significantly during the period.As the second column of table 1 shows, the total amount of actual utilizedforeign capital increased nearly 30 times during this period, from a mere$2 billion in 1983 to $58.6 billion in 1998, and the upward trend of foreigncapital inflows was fairly smooth. This was the case not only for totalinflows, but also for foreign loans, and especially for FDI. These twocategories are shown in the third and fifth columns respectively, of table 1.
Interestingly, the relative importance of each category shifted duringthe period. The change in the share of foreign loans, as opposed to that ofFDI, is particularly noteworthy. Foreign loans accounted for more thanhalf of total foreign capital inflows to China throughout the 1980s, andreached a peak in 1986 at 68.5 per cent. The situation did not take anoticeable turn until 1992, when the share of foreign loans fell to 41.2 percent of the total. The decline in percentage shares in this category continuedthereafter, ending the period at 18.8 per cent – which is comparable to thelowest share of 18.6 per cent posted in 1997. In contrast, FDI gainedenormous momentum, especially after 1992. In that year, the share of FDIin total inflows exceeded, for the first time, that of foreign loans. Thereafter,there was a surge in FDI to the extent that it accounted for more than70 per cent of total inflows each year.
Other foreign investment inflows were rather small in absolute terms,and their share declined during much of the period. This is shown in thelast two columns of table 1. The foreign investments that fall into this

WEI GE194
category include international leasing, compensation trade, and processingand assembling. From the Chinese standpoint, these types of investmentsare less useful in terms of acquiring more advanced foreign technologies,but are beneficial in terms of job creation, particularly for the unskilledlabour force. Relative to its diminishing weight in the later part of theperiod (with the exception of 1997 and, to a lesser extent, 1998), thiscategory played a somewhat greater role during the preliminary stage ofChina’s economic opening, when domestic and overseas investors werestill getting to know to each other.
Table 1
CHINA: ACTUAL UTILIZATION OF FOREIGN CAPITAL BY TYPE, 1983–1998($ billion; percentage)
Other foreignForeign loans FDI investment
Percentage Percentage PercentageTotal Amount of total Amount of total Amount of total
1983 2.0 1.1 55.0 0.6 30.0 0.3 15.01984 2.7 1.3 48.2 1.3 48.2 0.2 3.61985 4.7 2.7 57.5 1.7 36.2 0.3 6.31986 7.3 5.0 68.5 1.9 26.0 0.4 5.51987 8.5 5.8 68.2 2.3 27.1 0.3 4.71988 10.2 6.5 63.7 3.2 31.4 0.6 4.91989 10.1 6.3 62.4 3.4 33.7 0.4 3.91990 10.3 6.5 63.1 3.5 34.0 0.3 2.91991 11.6 6.9 59.5 4.4 37.9 0.3 2.61992 19.2 7.9 41.2 11.0 57.3 0.3 1.51993 39.0 11.2 28.7 27.5 70.5 0.3 0.81994 43.2 9.3 21.5 33.8 78.2 0.2 0.31995 48.1 10.3 21.4 37.5 78.0 0.3 0.61996 54.8 12.7 23.2 41.7 76.1 0.4 0.71997 64.4 12.0 18.6 45.3 70.3 7.1 11.11998 58.6 11.0 18.8 45.5 77.7 2.1 3.5
Source: Author’s calculations, based on State Statistical Bureau (1994: 527; 1997: 605; 1999: 577).

CHINA: MANAGING FINANCIAL INTEGRATION 195
Interestingly, the upward movement of foreign capital inflows wasnot interrupted to any significant degree by the social unrest in 1989 andthe subsequent economic sanctions that were imposed on China by somewestern countries. This event had some impact on the inflow of foreignloans, notably those from foreign governments. It might also have scaredaway some small investors. However, the impact was only marginal. Theamount of foreign loans in 1989 declined to $6.3 billion from $6.5 billionin the previous year, and that of other foreign investments fell to $0.4 bil-lion in 1989 from $0.6 billion in 1988. In contrast, the inflow of FDIcontinued: it reached $3.4 billion in 1989, up by more than 6 per cent from1988. This increase in FDI offset most of the losses incurred in othercategories. As a result, the total amount of foreign capital inflow in 1989declined only slightly from the previous year: down by less than 1 percent, as the table indicates. Driven largely by the continued increase inFDI, total inflows recovered quickly in 1991, and have since shown astrongly upward trend. Thus, as far as foreign capital inflow is concerned,the political event of 1989 apparently did very little harm to China, andthe economic sanctions that followed were completely ineffective.
One of the possible reasons for this somewhat surprising observationmay have to do with the structure of foreign capital inflows into China.FDI, especially by multinational firms, tends to be forward-looking andmotivated by long-term business considerations. This type of inflow maythus be less volatile, and comparatively less sensitive to a one-off, short-lived political shock. A relatively greater reliance on FDI, among otherfactors, appears to have enabled China to sustain a smooth stream of foreigncapital inflows during this difficult period. The same argument applies tothe period covering the Asian financial crisis and its contagion. As thetable shows, the level of FDI in both 1997 and 1998 exceeded that of 1996,thus preventing a marked decline in total inflows.
The increase in “other foreign investments” between 1997 and 1998was due mainly to a surge of inflows from Taiwan Province of China andthe United States. This category of inflows from these economies jumpedin 1998 by 157 per cent and 23.9 per cent respectively, from their corres-ponding 1997 levels. The moderate decrease in foreign loans in 1998 fromtheir level of the previous year was primarily a result of the decline in
WEI GE196
intergovernmental loans (-20 per cent), commercial loans (-26 per cent),and in China’s overseas bond issuance (-59 per cent). In contrast, loansfrom international financial institutions and export credits provided byforeign entities increased in 1998 by 84 per cent and 43 per cent respectively,from their 1997 levels, offsetting the above-mentioned loan declines (StateStatistical Bureau of China, 1999: 596–8).
B. Growing significance of joint ventures and foreign-ownedfirms
Over time, joint ventures and wholly foreign-owned enterprises haveemerged as the dominant types of FDI in China, as table 2 suggests. In theupper portion of the table, we compute, on a contracted base, the shares ofFDI under alternative arrangements between 1992 and 1998 – the periodduring which the surge in FDI inflows was strongest. As the table shows,FDI under the arrangements of joint ventures and wholly foreign-ownedenterprises, taken together, typically accounted for nearly 80 per cent ofthe total during the period. In comparison, the share of co-production inthe total was relatively small. Of the three types of arrangements considered,joint ventures were the most popular for most of the period, accounting formore than 40 per cent of the total. But the significance of this form of FDIdeclined, as its share fell from 50.1 per cent in 1992 to 33.2 per cent of thetotal in 1998. Meanwhile, the share of wholly foreign-owned enterprisesgained considerable strength, rising from 27 per cent in 1992 to 41.8 percent in 1998.
Despite varying degrees of importance, the average size of FDI perproject in all three kinds of FDI has increased significantly, as seen in thelower portion of table 2. A comparison of the figures for 1992 with thosefor 1998 shows that the average size per project under joint venturesincreased to $2.13 million in 1998 from a mere $0.85 million in 1992,more than double. Similarly, the average size of wholly foreign-ownedenterprises also increased strongly, up from $1.81 million per project in1992 to $2.25 million in 1998. And the co-production category saw anincrease in average project size from $2.32 million in 1992 to $5.82 million

CHINA: MANAGING FINANCIAL INTEGRATION 197
in 1998, again more than double. Taking FDI as a whole, the averageamount per project rose some 2.2 times during this period, from $1.19 mil-lion in 1992 to $2.63 million in 1998.
The growth in average size of foreign-invested projects suggests,among other things, that there might have been a shift in investor mix.Over time, small and medium-sized, sometimes foot-loose, investors, wereincreasingly replaced by larger-scale, multinational firms with longer-terminvestment and business development strategies. An increase in capitaland technology intensities accompanied the expansion of FDI and theenlarged average size of investment projects. Simple processing andassembling, labour-intensive projects gradually gave away to more capital-intensive ones with higher technology content, ranging from automobileand aircraft production to computer software development. The sectoral
Table 2
CHINA: CONTRACTED FDI BY TYPE AND SIZE, 1992–1998
1992 1993 1994 1995 1996 1997 1998
As percentage of total FDI(Total FDI = 100)
Joint ventures 50.1 49.5 48.6 43.5 43.5 40.6 33.2Co-production 22.8 22.9 24.6 19.5 19.5 23.6 22.4Foreign enterprises 27.0 27.3 26.6 36.9 35.2 34.6 41.8
Average investment per project($ million)
Joint ventures 0.85 1.02 1.44 1.94 2.52 2.30 2.13Co-production 2.32 2.44 3.06 3.72 5.02 5.09 5.82Foreign enterprises 1.81 1.61 1.69 2.86 2.96 1.84 2.25Total FDI 1.19 1.34 1.74 2.47 2.98 2.43 2.63
Source: Author’s calculations, based on State Statistical Bureau (various years).Note: The sum of each column is not equal to 100 due to the omission of FDI inflows that are classified
as “co-developments” and “foreign investment share enterprises” in the Chinese statistics. Thecategories, which are rather insignificant, account for about 2 per cent of the total in the periodunder consideration.

WEI GE198
destination of FDI was also extended, from agricultural and manufacturingundertakings to projects in energy, transportation, communications andinfrastructure development from the secondary sector, and to such tertiaryactivities as retailing, accounting, banking, insurance, financial and businessconsulting, and foreign trade and investment-related services. In theprocess, China has become much more sophisticated in screening foreigninvestment projects. Before the late 1980s, practically all types of foreigninvestment projects were welcomed. In more recent years, however, muchattention has been paid to the quality, and not just quantity, of foreigninvestments. Foreign investment projects that fail to meet certain technicaland environmental standards, that fall into the category of sunset industries,and that are inconsistent with the country’s overall industrial policies aremost likely to be rejected.
C. Managing the external debt
The external debt has grown significantly since 1979, from beingnearly non-existent to $146 billion at the end of 1998.13 Despite the surgein absolute amounts, the composition of the external debt, as well as debt-related risk indicators, appears to be quite manageable, suggesting a fairlyconservative attitude towards the handling of the external debt.
As shown in table 3, loans from foreign governments and internationalfinancial institutions remained fairly stable, at about 30 per cent of thetotal between 1988 and 1998, and increased moderately from the early1990s. Commercial loans accounted for about 50 per cent of the total, andloans from other sources made up the remaining 20 per cent, on average.Of the total loans made during the period, more than 86 per cent, on average,were long-term loans (i.e. with a maturity date of one year or longer), asindicated in the last two columns of table 3.
Table 4 shows three risk indicators of external debt for the period1985–1998. The debt service ratio (shown in the second column of thetable) is defined as the ratio of the payment of principal and interest onforeign debt to the foreign exchange receipts from foreign trade and non-

CHINA: MANAGING FINANCIAL INTEGRATION 199
trade services. Liability ratio is the balance of foreign debt as a percentageshare of GDP. Foreign debt ratio refers to the ratio of the balance of foreigndebt to foreign exchange receipts from foreign trade and non-trade services.Clearly, all three indicators have been kept very much in line with thecommonly perceived “safety” ranges.14
It is important to note that, in spite of the rising foreign capital in-flows over the past two decades, China has relied much more on domesticsources for funding its vast investment needs. As table 5 indicates, thecontribution of foreign investment to the development of fixed assets inChina since 1981 has been relatively minor. It accounted for less than 10 percent per annum of the total investment in fixed capital for most of theperiod under consideration, except 1995–1997 when it exceeded 10 per
Table 3
CHINA: COMPOSITION OF EXTERNAL DEBT BALANCE, 1988–1998(Percentage)
By type of debt By repayment terms(Total debt = 100.0) (Total debt = 100.0)
Loans fromLoans from international International
foreign financial commercial Long-term Short-termgovernments institutions loans Other debt debt
1988 16.6 10.6 47.5 25.3 81.7 18.31989 16.8 12.9 52.5 17.8 89.7 10.31990 16.0 12.0 55.5 16.5 87.1 12.91991 15.7 11.7 52.1 20.5 83.0 17.01992 16.6 12.1 51.2 20.1 84.4 15.61993 17.1 12.5 49.2 21.2 83.8 16.21994 21.1 14.0 51.0 13.9 88.8 11.21995 20.7 13.9 49.4 16.0 88.8 11.21996 19.1 14.4 49.0 17.5 87.9 12.11997 15.9 14.7 49.4 20.0 86.1 13.91998 15.4 15.7 46.7 22.2 88.1 11.9
Source: State Statistical Bureau (various years).

WEI GE200
cent. The same observation alsoapplies to the public-sector debtstructure. This is shown in ta-ble 6, which computes the shareof foreign borrowing in totalgovernment debt, and the shareof principal and interest pay-ments on foreign debt by theChinese Government during theperiod 1981–1998. These sharesdeclined substantially in the sec-ond half of the 1990s. By 1998the Government’s foreign debtobligation was negligible.
The information providedin tables 5 and 6, combined withthe characteristics of the capi-tal inflow structure outlinedabove, suggests that even if therewere to be a sudden massivewithdrawal of short-term “hot”
capital, its impact on the Chinese economy would probably be insignifi-cant. But are there institutional mechanisms and regulatory frameworksthat could prevent the economy from being exposed to such a possibilityin the first place, and that would protect it if a sudden flight of capitalwere to occur? We turn to these questions in the next section, which dealswith some relevant features of the financial sector and capital accountmanagement in China.
D. The role of the “greater Chinese economy”
Definitions of the “greater Chinese economy” vary. The narrowestone covers the mainland, Hong Kong (China) and Taiwan Province ofChina; whether Macao (China) is included depends on the purpose of the
Table 4
CHINA: RISK INDICATORS OF FOREIGNDEBT, 1985–1998
(Percentage of GDP)
Debt service Liability Foreign debtratio ratio ratio
1985 2.7 5.2 56.01986 15.4 7.3 72.11987 9.0 9.4 77.11988 6.5 10.0 87.11989 8.3 9.2 86.41990 8.7 13.5 91.61991 8.5 14.9 91.91992 7.1 14.4 87.91993 10.2 13.9 96.51994 9.1 17.1 78.01995 7.6 15.2 72.41996 6.0 14.2 67.71997 7.3 14.5 63.21998 10.9 15.2 70.4
Source: State Statistical Bureau (various years).

CHINA: MANAGING FINANCIAL INTEGRATION 201
study.15 The broader classification extends the coverage to the overseasChinese business communities in the rest of the Asia-Pacific region, andsometimes also includes those in the rest of the world. Hong Kong (China)has played the most significant role since 1979 as the financier of theeconomic boom on the mainland. Its highly visible, long-standing functionis as China’s major gateway to the world commodity markets.
Table 7 shows the source of foreign capital inflows to China between1992 and 1998 on a paid-in basis. The figures provided in the table com-bine the three categories considered in table 1. Hong Kong (China) stands
Table 5
CHINA: TOTAL INVESTMENT IN FIXED ASSETSBY SOURCE OF FINANCING, 1981–1998
(Percentage of total investment)
State budgetary Domestic Foreign Self-raisedappropriation loans investment funds
1981 28.1 12.7 3.8 55.41982 22.7 14.3 4.9 58.11983 23.8 12.3 4.7 59.21984 23.0 14.1 3.9 59.01985 16.0 20.1 3.6 60.31986 14.6 21.1 4.4 59.91987 13.1 23.0 4.8 59.11988 9.3 21.0 5.9 63.81989 8.3 17.3 6.6 67.81990 8.7 19.6 6.3 65.41991 6.8 23.5 5.7 64.01992 4.3 27.4 5.8 62.51993 3.7 23.5 7.3 65.51994 3.0 22.4 9.9 64.71995 3.0 20.5 11.2 65.31996 2.7 19.6 11.8 66.01997 2.8 18.9 10.3 67.71998 4.2 19.3 9.1 67.4
Source: State Statistical Bureau (1999: 185).

WEI GE202
out as the largest source of capi-tal inflows throughout the entireperiod (except 1996), contribut-ing more than 40 per cent, andsometimes much higher, to thetotal. When Hong Kong (China),Macao (China), and Taiwan Prov-ince of China are grouped to-gether, they account, on aver-age, for about 50 per cent of to-tal inflows during the periodconsidered. Annual shares varywithin a range of 46–58 percent. This has surpassed theshares of inflows from Japan,Singapore and the United Statescombined – the other three mainsources – by a considerably largemargin for each year during theseven-year period. Most of theinvestments on the mainland bythe three Chinese-speaking ter-ritories fall into the categoriesof FDI and other foreign invest-ments.The trends have beenfairly stable,16 with 1998 as the
only exception, when a noticeable decline from its peak level of 1997 wasrecorded.
It is useful to note that the sources of foreign capital inflows to Chinahave become more diversified in recent years. A comparison of the figuresin 1998 with those in 1992 shows that inflows from non-traditionalcountries, both within and outside the Asia-Pacific region, have gainedstrength, albeit varying from country to country. For example, the sharesof the Netherlands, Singapore, the United Kingdom and the United Statesin 1992 accounted for 0.7 per cent, 1.1 per cent, 0.2 per cent, and 3.0 percent of the total, respectively. By 1998, the corresponding shares had
Table 6
CHINA: GOVERNMENT DEBTFINANCING, 1981–1998
(Percentage)
Share of foreignShare of foreign debt servicing inborrowing in total total governmentgovernment debt debt payment
1981 60.0 92.11982 47.7 89.41983 47.6 86.11984 45.0 78.71985 32.5 82.41986 54.8 68.81987 47.6 65.11988 51.2 55.51989 35.3 63.31990 47.5 35.81991 39.0 32.51992 40.9 18.31993 48.4 26.51994 12.5 21.51995 2.5 8.21996 6.1 4.61997 2.6 3.71998 2.5 3.3
Source: Author’s calculation, based on State StatisticalBureau (1999: 284).

CHINA: MANAGING FINANCIAL INTEGRATION 203Ta
ble
7
CH
INA
: AC
TUA
L U
TILI
ZATI
ON
OF
FOR
EIG
N C
API
TAL
BY
SELE
CTE
D S
OU
RC
ES, 1
992–
1998
($ m
illio
n)
1992
1993
1994
1995
1996
1997
1998
Asi
a Hon
g K
ong
(Chi
na)
8 41
6.5
18 8
93.0
19 8
35.7
20 4
01.8
20 8
73.0
21 5
51.1
19 3
99.8
Indo
nesi
a20
.265
.811
5.7
111.
693
.580
.069
.0Ja
pan
3 17
9.9
4 90
6.0
3 06
0.9
5 11
3.3
6 09
7.0
4 39
0.4
3 44
4.1
Mac
ao (C
hina
)27
3.4
624.
450
9.4
439.
860
6.3
403.
343
9.2
Mal
aysi
a24
.791
.420
1.0
259.
046
0.0
381.
834
0.6
Phi
lippi
nes
19.1
122.
514
0.4
105.
855
.115
5.6
179.
3R
epub
lic o
f Kor
ea12
0.3
384.
579
4.9
1 19
0.5
1 56
6.1
2 22
7.6
1 80
4.3
Sin
gapo
re14
0.7
674.
81
179.
61
860.
62
247.
22
607.
03
404.
0Ta
iwan
Pro
v. o
f Chi
na1
053.
43
139.
13
391.
33
165.
23
482.
03
342.
33
051.
2Th
aila
nd84
.323
4.4
234.
928
8.2
328.
219
4.0
205.
4
Eur
ope
Fran
ce77
7.0
774.
873
3.8
716.
392
0.7
475.
971
4.9
Ger
man
y25
6.7
274.
558
3.7
527.
51
130.
51
008.
673
6.7
Net
herla
nds
37.5
134.
212
2.9
147.
015
4.6
413.
871
8.8
Rus
sian
Fed
erat
ion
16.3
41.9
35.8
22.9
19.8
18.0
19.4
Uni
ted
Kin
gdom
215.
557
0.7
1 08
5.8
1 00
9.3
1 40
0.2
1 85
7.6
1 17
4.9
Nor
th A
mer
ica
Can
ada
275.
036
1.8
640.
761
9.7
479.
734
4.1
316.
5U
nite
d St
ates
581.
12
662.
53
026.
93
134.
75
050.
73
461.
24
173.
6
Tota
l19
202
.338
959
.743
212
.848
132
.754
804
.252
387
.347
557
.5
Sour
ce:
Sta
te S
tatis
tical
Bur
eau
(var
ious
yea
rs).
Not
e:Th
e su
m o
f eac
h co
lum
n is
not
equ
al to
the
tota
l due
to th
e om
issi
on o
f inv
estm
ents
from
the
rest
of t
he w
orld
.

WEI GE204
reached 7.2 per cent, 2.5 per cent, 1.5 per cent, and 8.8 per cent, as seen intable 7. The more diversified pattern helped to prevent overall foreigncapital inflows from falling too fast when the Asian financial crisis hit. Astable 7 indicates, with the onset of the crisis, investments by the crisis-affected economies in China decelerated, while other countries picked upthe pace. As a result, the total capital inflow in 1997 and 1998 declined, ona year-on-year basis, by 4.4 per cent and 9.2 per cent, respectively; thefigures would otherwise have been larger.
E. Capital outflows and the issue of “round-tripping”
Discussion of the capital account thus far has centred on capitalinflows. Outflows also exist, as table 8 suggests. Two types are worthy ofcomment. The first has been a direct result of China’s increased economicopenness over the past two decades. In their attempt to diversify tradeflows and to secure regional markets for both inputs and outputs, anincreasing number of Chinese enterprises have sought to engage in overseasproduction and related activities. The Government has encouraged suchactivities, and the intensity of Chinese overseas undertakings has surgedmarkedly in recent years. In 1998, for example, the number of such contractsreached about 26,000, with a total value approaching $11.8 billion (StateStatistical Bureau of China, 1999: 603). This activity is often carried outin the form of FDI, with funds being furnished either at home or abroadunder the authorization and supervision of the concerned governmententities.
The second type of capital outflows tends to be more irregular, and,in some cases, illegal. These may either include foreign bank deposits orpurchases of foreign equity shares by domestic entities, mainly institutions.Foreign exchange is sometimes obtained by the institutions through illegalchannels, including through corrupt bank officials, as news reports haveperiodically revealed.
“Round-tripping” is another issue that has complicated capital accountmanagement in China. Typically, a domestic entity may obtain foreign

CHINA: MANAGING FINANCIAL INTEGRATION 205
exchange by overstating invoices of its trade transactions, use the funds toregister a dummy company outside China – often in Hong Kong (China) –and then re-enter the country as a “foreign investor”. These round-trippingactivities are estimated by some sources to comprise about 20 per cent oftotal inflows (World Bank, 1997b). The preferential treatment of foreigninvestments is a key motive behind round-tripping flows, and the magnitudeof these flows is expected to shrink as China extends its recent experimentwith granting national status to foreign-invested firms.
These complications are reflected in table 8, in particular under theitems “capital flows not elsewhere included” and “errors and omissions”.Since 1998, the authorities have stepped up measures to tighten controlover irregular capital outflows, in addition to cracking down decisively onfaulty reporting on items under current account transactions. Since 1979China has enacted numerous laws and regulations governing activities in
Table 8
CHINA: BALANCE OF PAYMENTS – SELECTED ITEMS, 1990–1997($ billion)
1990 1991 1992 1993 1994 1995 1996 1997
Net direct investment 2.7 3.5 7.2 23.1 31.8 33.8 38.1 41.7Net long-term borrowing 6.3 4.5 11.3 12.8 9.8 12.9 10.8 12.5Net short-term capital -3.2 0.4 -0.9 -3.9 -3.1 0.4 0.1 -11.4Capital flows not included elsewhere -3.0 -0.8 -17.8 -8.6 -5.9 -8.5 -9.1 -20.0Errors and omissions -3.2 -6.8 -8.2 -10.1 -9.1 -17.8 -15.5 -16.8Change in net reserves -12.1 -14.1 2.1 -1.8 -30.5 -22.5 -31.7 -35.9Nominal official exchange rates
(average yuan per $) 4.8 5.3 5.5 5.8 8.6 8.4 8.3 8.3Index of real effective
exchange rates 37.3 32.4 31.3 30.7 33.5 35.3 37.0 41.4Resource balance 10.7 11.5 5.0 -11.8 7.7 12.0 17.6 40.5
Source: IMF (various years).

WEI GE206
financial, banking and trade areas. The loopholes that have permitted theabove-mentioned irregularities are mainly a result of inadequate enforce-ment of the law and regulations. Developing a competent law enforcementinstitution is one of the keys to eliminating these irregularities.
IV. FINANCIAL SECTOR RESTRUCTURINGAND MANAGEMENT
Financial sector reforms began in the early 1980s, and recently havetaken the centre stage in China’s overall economic transition. The reformsinstituted thus far have been broad based, placing the financial sector in amuch more advanced and complex system than it was two decades ago.Three main aspects are considered below: (i) the exchange rate systemand its management, (ii) operation of equity markets, and (iii) elements offinancial sector restructuring relevant to management of the capital account.Focus is placed on those elements of the system that might have shelteredthe Chinese economy from major external shocks. The shocks consideredhere take the form of speculative currency attacks, massive reversal ofshort-term capital inflows, and the collapse of equity prices under the weightof changing foreign sentiments – the crucial factors that contributed to thederailing of the crisis-affected economies in Asia.
A. The exchange rate system and management
When economic transition was initiated, the exchange rate system inChina was subject to tight government controls. The conduct of foreignexchange transactions was limited to authorized institutions and admin-istered in such a way as to protect those transactions from market influencesand to adhere closely to foreign exchange plans. The official exchangerate of the Chinese currency, the yuan, was derived as a weighted averageof a basket of internationally traded currencies, with weights chosen toreflect the relative values of these currencies in the international markets

CHINA: MANAGING FINANCIAL INTEGRATION 207
and their relative importance in China’s external settlements. The Bank ofChina, the only authorized financial body at the time, served as the clearinghouse and broker for settling foreign-currency-denominated transactionsamong State-owned foreign trade corporations and other concerned entities.
To break away from the State monopoly of foreign trade, selecteddomestic enterprises engaging in the production of exportables were soonallowed to market their products directly overseas and to retain a certainpercentage of their foreign exchange earnings. This was intended to providean incentive to exporters as retained funds could be used to finance theirimport requirements. The experiment with the foreign exchange retentionsystem, which began as early as January 1981, proved to be quite a successin boosting foreign trade, and the practice was subsequently adoptednationwide. The reform, however, necessitated an adjustment of foreignexchange holdings among participating enterprises, and this need furtherincreased as foreign-invested firms in China started to grow. To meetdemand, Foreign Exchange Adjustment Centres (sometimes referred to as“swap centres”) were established in November 1986 at various locations,allowing foreign exchange transactions to be conducted at rates agreedupon between buyers and sellers. The swap centres’ prevailing rates werenot required to be the same as officially-determined ones. As a result, a“dual-track” exchange rate system emerged.
From the second half of the 1980s, foreign exchange retention quotaswere gradually liberalized, and swap centres bloomed. By the early 1990s,the majority of foreign exchange transactions taking place through the swapcentres were at market-determined rates. Transactions based on officialrates, which were substantially lower than the swap market rates, lost theirattractiveness and were limited to non-trading official settlements. On1 January 1994, the monetary authority unified exchange rates at theprevailing swap market rates and terminated the issuance of retentionquotas. The regional swap centres were integrated into a nationwide singlemarket, known as the China Foreign Exchange Trade System. The exchangerate system in China has since been characterized as a managed float.
Under the current exchange rate regime, domestic entities are requiredto conduct their sales and purchases of foreign exchange through authorized

WEI GE208
financial institutions, mainly banks. Following the guidelines issued bythe monetary authority – in particular the State Administration for ExchangeControl – banks are responsible for verifying that proper documentationis provided by the domestic entities to justify the purchase of foreignexchange. Financing of items under the current account are approved undernormal circumstances, including the currency requirements of individualresidents for touring overseas and income repatriation by foreign-investedfirms. For purposes of servicing external debt, domestic borrowers withforeign-currency-denominated loans may obtain the foreign exchangeneeded to fulfil their debt obligations when the principal or interest paymentbecomes due. Foreign-invested firms in China may choose either to retaintheir entire foreign exchange with banks or to enter the foreign exchangemarket, provided that the trading is in line with their pre-submitted foreignexchange plans. This applies to both initially invested funds and subsequentforeign-currency-denominated earnings.
Domestic banks may sell and buy foreign currencies for their clientsin the foreign exchange market. Selling is permitted if the banks haveforeign exchange holdings in excess of a required minimum. This require-ment compels the banks to assume a foreign exchange risk position, sincethey have to hold liquid funds in order to meet unforeseen contingenciesarising from retail transactions.17 Foreign banks may conduct currencytransactions in the foreign exchange market on behalf of foreign-investedfirms and they can sell foreign currencies against the yuan in the market.Their yuan accounts have to be maintained with the central bank, thePeople’s Bank of China. Foreign banks, however, are not permitted to enterthe domestic money market, either to borrow from domestic residents orto offer yuan-denominated loans to domestic entities.
Interventions by the central bank are triggered when the market ratesof the yuan against major foreign currencies (particularly the US dollar),fluctuate beyond a pre-determined, narrow band and when the rates beginto show signs of appreciating. The action taken by the central bank is notvisible to other market participants.18 The set-up of the exchange ratemanagement system effectively precludes currency speculation, since itleaves little room for market participants to act on their own expectationsconcerning the future value of the yuan, or to assume short positions.

CHINA: MANAGING FINANCIAL INTEGRATION 209
Furthermore, foreign banks and foreign-invested firms tend to act as sellers,not buyers, in the foreign exchange market.
B. Operation of equity markets
In line with its market-oriented economic transition, China openedtwo stock exchanges in the early 1990s: one located in Shanghai and theother in the Shenzhen Special Economic Zone. Soon after, qualified ChineseState-owned enterprises (SOEs) (known as “red chip” companies) beganto list in the Hong Kong (China) stock exchanges (“H shares”), while otherslisted in overseas stock markets, including New York (“N shares”).
In the Chinese stock exchanges, domestic companies are listedseparately under the so-called “A share” and “B share” categories. A sharesare issued to domestic investors and priced in the local currency, whereasB shares are reserved for foreign investors and priced in foreign currencies(US dollar-denominated issuance in Shanghai, and Hong Kong dollar-denominated shares in Shenzhen). In some cases, Chinese companies maychoose to be listed jointly under the A and B share categories (thus labelledA&B shares), but accounts under the two categories must be maintainedseparately. Table 9 provides information on shares issued and capital raisedin the two Chinese stock exchanges since their establishment. Figuresconcerning H shares are also given in the table. By and large, a rapidexpansion is evident, as are large swings recorded under nearly all of theshare categories.
Three interesting observations may be made here. First, both the sharesissued and capital raised under the B share category were insignificantduring the period under consideration, indicating rather limited foreignparticipation. Second, since B shares are traded in foreign currencies byforeign investors, market exit is considerably limited by market entry: thatis, a would-be seller under the B share category cannot exit the marketunless there are potential buyers who are willing to hold the foreign-currency-denominated shares (Lardy, 1998). Third, a changing marketsentiment in B share trading has no direct impact on that of A shares, and

WEI GE210
thus yuan-denominated equity transactions are insulated from outsideinfluences. Although trading under A&B shares has grown significantlysince 1997, a large portion of the shares is still yuan-denominated. Thesecharacteristics of equity market operation, together with the exchange ratemanagement system discussed above, help to explain why the Chinesecurrency and equity markets have tended to be much less sensitive tochanging external conditions.
C. Financial sector reform and regulation
China had a mono-banking system in the pre-reform era, when thePeople’s Bank of China functioned as both a central and commercial bank.It carried out the traditional functions of a central bank in issuing currency,managing foreign exchange reserves and allocating credits. It also played
Table 9
CHINA: STOCK ISSUANCE, 1991–1998
1991 1992 1993 1994 1995 1996 1997 1998
Shares issued(Billions of shares) 5.0 20.8 95.8 91.3 31.6 86.1 267.6 105.6
A shares 5.0 10.0 42.6 11.0 5.3 38.3 105.7 82.8H shares - - 40.4 69.9 15.4 31.8 136.9 12.9B shares - 10.8 12.8 10.4 10.9 16.1 25.1 9.9
Capital raised(Millions of yuan) 5.0 94.1 375.5 326.8 150.3 425.1 1 293.8 841.5
A shares 5.0 50.0 194.8 49.6 22.7 224.5 655.1 443.1H shares - - 60.9 188.7 31.5 83.6 360.0 38.0B shares - 44.1 38.1 38.3 33.4 47.2 80.8 25.6A&B shares - - 81.6 50.2 62.8 69.9 198.0 335.0
Source: State Statistical Bureau of China (1999: 628).Note: The sum of the sub-categories may not be equal to the total owing to rounding.

CHINA: MANAGING FINANCIAL INTEGRATION 211
the role of a commercial bank in terms of receiving deposits, making loansand providing clearance services to its institutional and individual cus-tomers. Since the early 1980s, the banking sector has been undergoingnumerous changes, and, as a result the overall financial system in Chinahas emerged as a bank-centred multifunctional complex. The structure ofthe Chinese financial management system is highlighted in figure 1.Working closely together, the People’s Bank of China, the Ministry ofFinance, the Committee on Monetary Policies, and other designatedcommissions (for example, the Securities Regulatory Commission and theState Administration for Exchange Control) implement policy directivesset forth by the State Council, and supervise and monitor the activities ofpolicy banks, State and shareholding commercial banks, investment banks,non-bank financial institutions and credit cooperatives.
Aimed at tightening the so-called “soft” budget constraint of SOEs,the enterprise-funding source was shifted in the early 1980s from gov-ernment budgetary appropriation to interest-bearing bank loans. To facilitatethis development, four State-owned commercial banks were established,which took over the commercial banking business from the People’s Bankof China. This also paved the way for the People’s Bank of China to betransformed into a real central bank. Since the mid-1980s, shareholdingcommercial banks, both at the national and regional levels, began to surfacealong with various non-bank financial institutions. To meet the financialneeds of collectively-owned, small and medium-sized enterprises, creditcooperatives also mushroomed in both the rural and urban areas. To furtherliberalize State-owned commercial banks and to allow them to performbanking functions on more commercial terms, three policy banks were setup in 1994 to assume the responsibility of carrying out policy loans, aswell as to manage funds obtained from international financial institutions.The policy banks, like the State-owned commercial banks, were structuredto specialize in certain types of financial dealings. However, the distinctionbetween the business territories of these financial institutions – both bankand non-bank, State-owned and non-State-owned – has become increasinglyvague in more recent years, as competition among these institutions isencouraged. The operation of foreign banks has so far been limited to certainbusiness lines and confined to specified geographic regions. As a result,head-on competition between domestic and foreign financial institutions

WEI GE212
Figure 1
THE FINANCIAL MANAGEMENT SYSTEM IN CHINA
Source: National authorities.
State Council
The Central Bank
(People’s Bankof China)
Ministry of Finance Committee onMonetary Policies
Other regulatory and administrative entities
(e.g. Securities Regulatory Com-mission, and State Administration for Exchange Control)
Policy banks:
State Development Bank, Agricultural Development Bank,Export-Import Bank
State-ownedcommercial banks:
Industrial and Commercial Bank,Agricultural Bank,People’s Construction Bank,Bank of China
Nationwide (share-holding)commercial banks:
(e.g. Bank of Communication,CITIC Industrial Bank, China Everbright Bank,Hua Xia Bank, andMin Sheng Bank)
Regional (share-holding)commercial banks:
(e.g. Guangdong Development Bank, Shenzhen Development Bank, Pudong Development Bank, Fujian Industrial Bank, and Yangtai Housing Savings Bank)
Non-bank financial institutions:
(e.g. trust and investment companies,financial companies, financial leasing companies, security companies, andinsurance companies)
Urban and ruralcredit cooperatives

CHINA: MANAGING FINANCIAL INTEGRATION 213
tends to be, at best, very weak. The situation, however, is expected to changeas a result of China’s accession to WTO. According to the bilateral WTOagreement of 1999 between China and the United States, for instance,foreign banks will be allowed to handle business in local currency withChinese enterprises two years after the accession, and with residents fiveyears after. Within designated areas and for servicing certain customergroups, foreign banks will be granted domestic status; but the geographicand customer restrictions will be removed only five years after accession.
The domestic banks command a rather large proportion of totalfinancial assets, with the four State-owned commercial banks dominatingthe Chinese banking sector. For example, during the period 1993–1997the assets of the State-owned commercial banks amounted, on average,to 78 per cent of the total assets held by all financial institutions in China.The shares of other banks, credit cooperatives and non-bank financialinstitutions were only 6.6 per cent, 14.5 per cent and 0.7 per cent respec-tively, during the same period. In terms of the holding of foreign assets,the four State-owned commercial banks captured 87.7 per cent of the totalduring that period, with the remaining 12.3 per cent going to other banks.Foreign assets held by non-bank financial institutions were negligible, andthere were no such holdings by credit cooperatives. Household savingsare the largest liability of the banking sector, and have grown enormouslysince the economic transition began in 1979, as shown in table 10.Enterprises, particularly State-owned ones, make up the largest groupamong bank borrowers; consumption loans did not exist until very recently.
To strengthen the legal framework for financial sector operation andmonetary management, in 1995 China enacted a set of laws, including theLaw of the People’s Bank of China and the Law of Commercial Banks.The former provides the legal ground for the People’s Bank of China toact as a fully-fledged modern central bank, while the latter sets detailedstandards for commercial banking.19 These standards include, for example,capital adequacy requirements, consisting of the Bank for InternationalSettlements’ Basel Standards, entry criteria, and asset diversification re-quirements. The law also separates commercial banking from investmentbanking; commercial banks are not allowed to engage in securities tradingand underwriting or to invest in non-bank financial institutions and trust

WEI GE214
funds. The separation reduces the risks associated with overexposure tospeculative lending, and thus improves the quality of bank assets.
D. Financial sector weakness and policy responses
The close ties between the banks and their corporate borrowers giverise to some serious concerns about the health of the banking sector. Forinstance, the lending policy of the State-owned commercial banks is subjectto the influence of government policies, instead of being based solely oncommercial considerations. To replace the mandatory credit plans undercentral planning, a credit quota system has been put in place since the late1980s for financial resource allocations. Through credit rationing, the
Table 10
CHINA: HOUSEHOLD SAVINGS, 1985–1998
Year-end outstanding Annual increase Annual rates ofas percentage of GDP as percentage of GDP real GDP growth
(GDP = 100.0) (GDP = 100.0) (Percentage)
1985 18.1 4.6 13.51986 21.9 6.0 8.81987 25.7 7.0 11.61988 25.5 4.9 11.31989 30.4 8.0 4.11990 37.9 10.2 3.81991 42.1 9.6 9.21992 43.3 9.2 14.21993 42.6 9.3 13.51994 46.0 14.5 12.61995 50.7 13.9 10.51996 56.8 13.1 9.61997 62.2 10.4 8.81998 67.3 9.6 7.8
Source: Author’s calculations, based on State Statistical Bureau (1999: 55, 57 and 318).
CHINA: MANAGING FINANCIAL INTEGRATION 215
system promotes priority projects, sectors and regions in accordance withoverall industrial policies. It also provides the authority with a powerfultool for controlling broad money. However, the system tends to increasethe banks’ lending risks, as pre-set credit quotas may not be adjusted quicklyin response to a changing economic environment. As many SOEs continuefor various reasons to suffer losses, their ability to repay loans has beengreatly undermined; this adds to the burdens on the banks. Even so, bankloans continue to be directed towards these enterprises in order to keepthem afloat so as to prevent unemployment from rising too fast andthreatening social and political order. Briefly, the resulting high ratio ofnon-performing and under-performing loans, coupled with inadequate loanclassifications, low loan-loss reserves, and collateral rather than cash-flow-based lending practices, are just a few factors contributing to the financialweakness of the Chinese banking sector.20 The situation in the non-bankfinancial institutions tends to be more serious owing to a weaker supervisoryframework and regulation-enforcement mechanism.
Since 1998 the Chinese monetary authority has introduced a set ofpolicy measures and made a series of institutional changes to tackle theseproblems. In the banking sector, national financial accounting standardshave been introduced, and a risk-based loan classification system adopted.Credit quotas are non-binding and indicative. A system of asset and liabilitymanagement has been established; several asset management companieshave been set up to clean up the non-performing loans of banks and otherfinancial institutions. Billions worth of funds, raised through the issuanceof long-term, non-tradable Treasury bonds, have been injected into theState-owned commercial banks, boosting their capital base to meet therequirements of the Chinese Commercial Bank Law and the Basel Stand-ards. The State banks can now write off an increased amount of bad loans.Troubled regional commercial banks are either being closed or mergedwith stronger ones. The recent closure of the Hainan Development Bank isa good example. It shows that the authorities are taking decisive steps inaddressing the issue of moral hazard that has afflicted the Chinese bankingsector, and signals that the days of unconditional government bailout areabout to come to an end. To enhance competition, certain foreign bankshave recently been allowed to carry out domestic currency-based operationsand to participate in the Chinese inter-bank market. To improve the

WEI GE216
effectiveness of monetary management, the institutional set-up has alsobeen strengthened. The central bank has been restructured along the linesof the United States Federal Reserve to reduce the influence of localauthorities in monetary policy-making and implementation.
Many non-bank financial institutions have suffered losses in recentyears as a result of unregulated expansion and overreaching in speculativeinvestments. To clean up the loss-making institutions, mergers andacquisitions have become more frequent and a decision to shut down theinsolvent ones has been forcefully implemented. This includes the closureof the Guangdong International Trust and Investment Corporation, thesecond largest foreign, debt-issuing international trust and investmentcompany in China,21 which reportedly had incurred an estimated 2 billionshortfall in repayments before shutting down. In addition, the supervisionof credit cooperatives has been strengthened as has the legal frameworkgoverning the operation of equity markets, as demonstrated by the passageof the Security Law in December 1998. Steps are also being taken topromote long-term institutional investment; including the recent licensingof mutual funds.22
V. CONCLUDING REMARKS
The above discussion leads to several important observations. First,in spite of the remarkable progress that has been made in achieving greatereconomic openness over the past two decades, the Chinese economyremains largely domestically based. A high proportion of foreign tradeconsists of import processing. Foreign capital inflows have played only aminor role in meeting domestic investment needs. The complicationsresulting from capital outflows have further undermined the significanceof net external financing. The domestic financial sector is fairly insulatedfrom foreign influence and competition. A heavy reliance on domesticprivate savings, which have been among the highest in the world, preventsthe economy from being overly exposed to the risks of a sudden change inexternal influences; it also eases the burden of conducting monetary

CHINA: MANAGING FINANCIAL INTEGRATION 217
policies, as changing interest rates in the international markets have only alimited impact on the domestic economic environment.
Second, the composition of foreign capital inflows provides additionalprotection to the domestic economy. Large inflows of FDI and the avoid-ance of excessive exposure to short-term commercial flows contribute to asteady capital inflow. The stable pattern of the inflow is also attributableto China’s reasonably sound macroeconomic fundamentals and its orderly,evolutionary process of economic opening.
Third, the system of exchange rate management and the operation ofequity markets tend to insulate the domestic currency and stock pricesfrom external impacts, and leave little room for foreign speculation in thesemarkets. It also provides a mechanism through which potential outflowscan be monitored and, if necessary, curbed. This set-up, however, has notundermined foreign trade and trade-related service activities, nor has itaffected capital inflows.
Fourth, in the context of the Asian financial crisis and its contagioneffects, China did not run an unsustainable resource gap. Unlike some ofthe crisis-affected economies, the current account balance in China hasbeen positive in recent years (see table 11), precluding the need for sizeablenet external financing. The foreign exchange reserve position has beenfairly strong, allowing the country to cover more than 10 months of itsimports in 1997, and external debt services have remained manageable(table 12).
Fifth, the pattern of China’s economic integration and liberalizationhas an interesting feature. The process began with the opening up of thetrade account, together with allowing FDI inflows. The opening of the restof the current account followed, as did the entry of foreign commercialand portfolio flows. In this respect, the pattern represents an alternativesequence to economic liberalization from the one that calls for the openingup of the current account to precede that of the capital account, as oftencited in the literature and within policy-making circles.23 The evolvingpattern has been the result of trial and error, and the process has beenaccompanied by careful monitoring. Policies, instruments, the regulatory
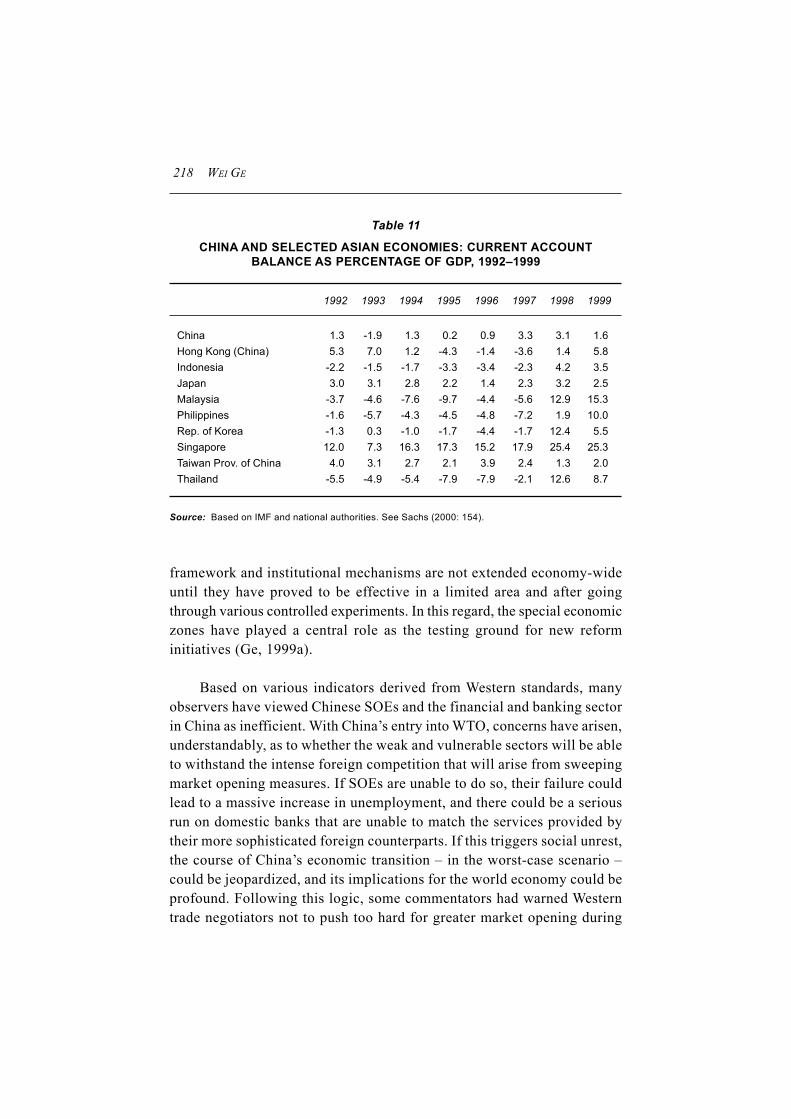
WEI GE218
framework and institutional mechanisms are not extended economy-wideuntil they have proved to be effective in a limited area and after goingthrough various controlled experiments. In this regard, the special economiczones have played a central role as the testing ground for new reforminitiatives (Ge, 1999a).
Based on various indicators derived from Western standards, manyobservers have viewed Chinese SOEs and the financial and banking sectorin China as inefficient. With China’s entry into WTO, concerns have arisen,understandably, as to whether the weak and vulnerable sectors will be ableto withstand the intense foreign competition that will arise from sweepingmarket opening measures. If SOEs are unable to do so, their failure couldlead to a massive increase in unemployment, and there could be a seriousrun on domestic banks that are unable to match the services provided bytheir more sophisticated foreign counterparts. If this triggers social unrest,the course of China’s economic transition – in the worst-case scenario –could be jeopardized, and its implications for the world economy could beprofound. Following this logic, some commentators had warned Westerntrade negotiators not to push too hard for greater market opening during
Table 11
CHINA AND SELECTED ASIAN ECONOMIES: CURRENT ACCOUNTBALANCE AS PERCENTAGE OF GDP, 1992–1999
1992 1993 1994 1995 1996 1997 1998 1999
China 1.3 -1.9 1.3 0.2 0.9 3.3 3.1 1.6Hong Kong (China) 5.3 7.0 1.2 -4.3 -1.4 -3.6 1.4 5.8Indonesia -2.2 -1.5 -1.7 -3.3 -3.4 -2.3 4.2 3.5Japan 3.0 3.1 2.8 2.2 1.4 2.3 3.2 2.5Malaysia -3.7 -4.6 -7.6 -9.7 -4.4 -5.6 12.9 15.3Philippines -1.6 -5.7 -4.3 -4.5 -4.8 -7.2 1.9 10.0Rep. of Korea -1.3 0.3 -1.0 -1.7 -4.4 -1.7 12.4 5.5Singapore 12.0 7.3 16.3 17.3 15.2 17.9 25.4 25.3Taiwan Prov. of China 4.0 3.1 2.7 2.1 3.9 2.4 1.3 2.0Thailand -5.5 -4.9 -5.4 -7.9 -7.9 -2.1 12.6 8.7
Source: Based on IMF and national authorities. See Sachs (2000: 154).

CHINA: MANAGING FINANCIAL INTEGRATION 219
negotiations for China’s entry into WTO. Such views were not uncommon,both within and outside China, as often aired in news reports. A fullerdiscussion of the related issues is beyond the scope of this study. However,several points may briefly be made in this regard.
Table 12
CHINA AND SELECTED ASIAN ECONOMIES:EXTERNAL DEBT-RELATED INDICATORS, 1995–1997
(Percentage)
Rep.China Indonesia Malaysia Philippines of Korea Thailand
Debt-GDP ratio1995 15.2 61.6 38.6 50.9 16.0 49.51996 14.2 56.7 39.5 50.6 31.6 49.81997 14.5 62.2 44.8 55.2 33.2 62.0
Debt-exports ratio1995 71.6 262.4 48.0 216.5 62.9 149.31996 77.0 257.0 51.8 203.9 126.4 165.61997 71.7 238.0 57.9 180.0 114.1 164.7
Short-term debt-GDP ratio1995 1.7 12.8 8.2 7.1 9.2 24.51996 1.7 14.2 11.0 8.7 17.9 20.71997 2.0 18.0 13.0 10.2 13.3 23.1
Short-term debt-export ratio1995 8.0 54.8 10.2 30.3 36.4 73.81996 9.3 64.2 14.4 35.1 71.5 68.81997 9.9 68.7 16.8 33.3 45.6 61.4
Short-term debt-foreignexchange reserve ratio1995 16.2 177.0 28.6 69.5 138.5 111.11996 13.4 168.5 39.8 62.1 280.1 97.21997 13.0 221.8 62.2 97.7 309.8 129.0
Import coverage of foreignexchange reserves(months)1995 6.7 4.0 4.3 3.4 3.0 6.31996 9.1 5.1 4.6 4.4 2.7 6.61997 11.8 4.8 3.4 2.8 1.7 5.3
Source: HSBC (2000).

WEI GE220
Overstaffing and the excessive burden of various social responsibilitieshave long been recognized as key factors undermining the performance ofChina’s SOEs. Allowing these enterprises to rationalize their input structureand to remove non-business responsibilities could, in principle, improvetheir performance indicators. This, in turn, would lighten the burden ofnon-performing and underperforming loans shouldered by the State-ownedcommercial banks, consequently enhancing their solvency. Taking theeconomy as a whole, the pace at which SOEs may be revitalized isconstrained by the development of social safety nets and the expansion ofnon-State sectors. These issues need to be tackled in a coordinated manner.Given the complexities involved, it is unrealistic to expect either SOEs orthe State banks to meet international best practices in the near future. Owingto the time and resources required to build up adequate human capital inthese sectors, upgrading cannot take place overnight; thus the “vulner-ability” of SOEs and the State banks is likely to persist for some time tocome.
How serious, then, is the potential impact of WTO membership? Asspeculative as it is, the following is useful to keep in mind. First, thebusiness performance indicators used in Western market economies maynot be appropriate for assessing SOEs. For example, these enterprisestypically provide employees with housing at subsidized rates; many alsoprovide childcare, medical service, training and schooling, and culturaland entertainment facilities, to name a few. These services are providednot only to employees but also to their extended families. These outlayscount as expenditures and, as such, do not reflect the value of the socialbenefits they provide. Similarly, a considerably large proportion of SOEoperating costs incurred consists of wage payments to redundant workers,who, depending on the sectors, account for an estimated 30 to 50 per centof the current employees on the payroll. In the absence of a well functioningsocial safety net, the “cost” to SOEs may be better understood, from asocial viewpoint, as welfare benefits. These social returns generated bySOE operations need to be taken into consideration when evaluating the“true” efficiency of these enterprises. The same argument applies to theState banking sector as well. Viewed in this light, concluding that the Statesector in China is grossly underperforming may be an overstatement.

CHINA: MANAGING FINANCIAL INTEGRATION 221
Second, a successful business venture requires, among other things,proper adaptation to local market conditions, taking into account consumerpreferences and expectations, which tend to differ from location to location.What might have worked, say, in Switzerland, does not guarantee that itwill work equally well in Barbados. Learning to adapt is a time-consumingprocess, and requires deliberate efforts and real resources. Recognizingthis, the extent to which foreign firms and banks may pose a threat to theirChinese counterparts needs to be discounted, and their superiority incompeting successfully on the Chinese market may have been exaggerated.Evidently, even after a long period of operation, some foreign-investedfirms in China are still making losses. The fear that the State’s weak sectors– SOEs and banks alike – may collapse under the weight of forthcomingintense foreign competition is pure speculation.
It is worth pointing out that the State banking sector in China is large;its operation covers a wide range of businesses and a vast geographicaland customer base. The confidence of domestic savers in the banks hasbeen and continues to remain high. It is very unlikely that the entry offoreign banks and other financial institutions will substantially alter thesituation, especially within a short time frame. Instead of forcing thedomestic banks to go out of business, the intensified competition broughtabout by further market opening may serve as a strong force in motivatingthe State banks, which are still in their infancy, to upgrade and mature.The overall positive picture of economic transition and development, asdepicted in the past two decades, is unlikely to turn negative followingChina’s entry into WTO. The resilience and adaptability of Chinese society,as demonstrated in its long history, should not be underestimated, nor shouldthe competence of Chinese policy makers in managing the economy.
China’s experience has shown that adapting a pragmatic, step-by-stepapproach, suitable to local conditions, is critical in managing a smoothprocess of economic integration and liberalization. The criterion used inassessing the success of its integration and liberalization should be theextent to which these contribute to overall economic development, andnot the reverse.

WEI GE222
NOTES
1 The use of the term “miracle” to describe the progress in certain Asian economies in the1990s was made popular following the publication of a policy research report by theWorld Bank. The study provided a comprehensive assessment of the contributing factorsunderlying the remarkable accomplishments of Hong Kong (China), Indonesia, Malaysia,the Republic of Korea, Singapore, Taiwan Province of China, and Thailand, amongothers (World Bank, 1993). Alternative views exist. For more recent studies, for instance,see Akyüz (1999).
2 There are many studies on various aspects of the Asian financial crisis. See, for example,Akyüz (1998); Fischer (1998); Klein (1997); Stiglitz (1998a and 1998b); Sugisaki (1998);UNCTAD (1998, chaps. III and IV: 53–110); UNCTAD and ICC (1998); and WorldBank (1998).
3 These include, for instance, the cases of Finland, Japan, Norway, Sweden and the UnitedStates.
4 For a more detailed discussion on the “vulnerabilities” of the financial sector and State-owned enterprises in China see Lardy (1998). Assessments of various financial marketsand institutions in China are provided, among others, by Chen et al. (2000).
5 Related issues have been the subject of heavy debate in recent years, prompted, in part,by the outbreak of the Asian financial crisis. For some recent discussion see, for example,Akyüz and Cornford (1999); and Akyüz (2000).
6 A detailed overview of economic developments in China since 1949 is provided byGe (1999a).
7 The beginning of the second phase is usually considered to be the Third Plenum of theCentral Committee of the Chinese Communist Party, held in December 1978. At thatmeeting, economic development was made the top national priority, and economic reformand opening up were established as complementary long-term policies. It should benoted, however, that efforts to reform and open up the economy actually began in 1977,within limited areas and sectors.
8 The 30 municipalities, provinces and autonomous regions considered here do not include:Chong Qing municipality, which was established on 1 July 1997; Hong Kong and MacaoSpecial Administrative Regions (returned to China in 1997 and 1999 respectively); andTaiwan Province of China.
9 Note that certain other Asian countries, such as the Republic of Korea, also registeredimpressive growth during this period; hence the term “high-performing economies”.
10 As noted in an official announcement, since 1 December 1996 China has assumedobligations under Article VIII of the IMF Agreement and made the Chinese currencyconvertible in current account transactions.
11 See People’s Daily, 26 September 1997: 1.12 For details on market opening, interested readers are referred to the bilateral WTO
agreement between China and the United States reached in November 1999. Since thesigning of the agreement, the Chinese authorities have been busy re-examining related

CHINA: MANAGING FINANCIAL INTEGRATION 223
policies, regulations and legislation so as to bring them more closely in line withinternational norms and WTO rules.
13 The changing attitude in China towards debt financing and foreign investment has beenprofound since the economic transition began in 1979, as evidenced by the followingofficial statement reported in the People’s Daily, the official newspaper of the ChineseCommunist Party, on 2 January 1977: “We never permit the use of foreign capital todevelop our domestic resources as the Soviet revisionists do, never run undertakings inconcert with other countries and also never accept foreign loans. China has neitherdomestic nor external debts”. See Kleinberg (1990: 1).
14 For example, the debt service ratio falls consistently below the creditworthy gauge of20 per cent, and the liability and foreign debt ratios are well below 100 per cent.
15 For studies on the greater Chinese economy, and the economic relationships betweenChina and Hong Kong (China), and between China and Taiwan Province of China, see,inter alia, Naughton (1997) and Klein and Yu (1994).
16 Macao (China) is less so, when compared with Hong Kong (China) and Taiwan Provinceof China.
17 The point is well made by Mehran et al. (1996).18 Ibid. for a detailed discussion of earlier developments in these areas. Details of more
recent developments may be obtained from various country reports and studies publishedby the World Bank and IMF, in addition to research reports and releases by the Chinesemonetary authority.
19 For a comprehensive review of the laws and international comparisons, see Mehran etal. (1996: 18–23).
20 A detailed analysis of these weaknesses is provided by, for example, Lardy (1998).21 A more detailed discussion on the development of trust and investment companies in
China is provided, among others, by the World Bank (1997c).22 See World Bank (1999) and various issues of country updates.23 For discussions on related issues, see Woo, Parker and Sachs, eds. (1997); Ge (1999b);
and Feng (2000: 87–107).
REFERENCES
AKYÜZ Y (1998). The East Asian Financial Crisis: Back to the Future? Geneva, UNCTAD,March.
AKYÜZ Y, ed. (1999). East Asian Development: New Perspectives. London, Frank CassPublishers.
AKYÜZ Y (2000). The debate on the international financial architecture: Reforming thereformers. UNCTAD Discussion Papers, No. 148. Geneva, UNCTAD, April
AKYÜZ Y and CORNFORD A (1999). Capital flows to developing countries and the reformof the international financial system. UNCTAD Discussion Papers, No. 143. Geneva,UNCTAD, November.

WEI GE224
CHEN B, DIETRICH JK and FENG Y, eds. (2000). Financial Market Reform in China:Progress, Problems, and Prospects. Boulder, CO, Westview Press.
FENG Y (2000). Capital account liberalization: Sequencing and implications. In: Chen B,Dietrich JK and Feng Y, eds. Financial Market Reform in China: Progress, Problems,and Prospects. Boulder, CO, Westview Press: 87–107.
FISCHER S (1998). The Asian crisis: A view from the IMF. Paper presented at the MidwinterConference of the Bankers’ Association for Foreign Trade, Washington, DC, 22 January.
GE W (1999a). Special economic zones and the economic transition in China. In: Klein LR,ed. Economic Ideas Leading to the 21st Century, Vol. 5. (University of Pennsylvania)Singapore, World Scientific Publishing Co.
GE W (1999b). Special economic zones and the opening of the Chinese economy: Somelessons for economic liberalization. World Development, 27(7): 1267–1285.
HSBC (2000). The View: Asia’s Bond Markets. London, Hong Kong and Shanghai BankingCorporation, April.
IMF (various years). International Financial Statistics. Washington, DC, InternationalMonetary Fund.
KLEIN LR (1997). Financial liberalization and world trade. Invited lecture, United Nations1997 Fall Conference of Project LINK, Kuala Lumpur, 22–26 September.
KLEIN LE and YU CT, eds. (1994). Economic Development of ROC and the Pacific Rim inthe 1990s and Beyond. Singapore, World Scientific Publishing Co.
KLEINBERG R (1990). China’s “Opening” to the Outside World: The Experiment with ForeignCapitalism. Boulder, CO, Westview Press.
LARDY NR (1998). China’s Unfinished Economic Revolution. Washington, DC, The BrookingsInstitution.
MEHRAN H, QUINTYN M, NORDMAN T and LAURENS B (1996). Monetary and exchangesystem reforms in China: An experiment in gradualism. IMF Occasional Paper, No.141. Washington, DC, International Monetary Fund, September.
NAUGHTON B, ed. (1997). The China Circle: Economics and Technology in the PRC, Taiwan,and Hong Kong. Washington, DC, Brookings Institution Press.
SACHS J (2000). Emerging Markets Economics Quarterly, March.STATE STATISTICAL BUREAU OF CHINA (various years). Statistical Yearbook of China.
Beijing, China Statistical Publisher.STIGLITZ J (1998a). Sound finance and sustainable development in Asia. Keynote address
to Asian Development Forum, Manila, 2 March.STIGLITZ J (1998b). The East Asian crisis and its implications for India. Commemorative
lecture for the Golden Jubilee Year Celebration of Industrial Finance, New Delhi, 19 May.SUGISAKI S (1998). Economic Crises in Asia. Address to the Harvard Asia Business
Conference, Harvard Business School, Cambridge, MA, 30 January.UNCTAD (1998). Trade and Development Report, 1998. United Nations publication, sales
no. E.98.II.D.6, New and Geneva.UNCTAD and ICC (1998). The Financial Crisis in Asia and Foreign Direct Investment. Geneva,
United Nations, June.WOO WT, PARKER S and SACHS JD, eds. (1997). Economies in Transition: Comparing
Asia and Europe. Cambridge, MA, The MIT Press.

CHINA: MANAGING FINANCIAL INTEGRATION 225
WORLD BANK (1993). The East Asian Miracle: Economic Growth and Public Policy. NewYork, Oxford University Press.
WORLD BANK (1997a). China 2020: Development Challenges in the New Century.Washington, DC, World Bank.
WORLD BANK (1997b). China Engaged. Washington, DC, World Bank.WORLD BANK (1997c). China’s Non-Bank Financial Institutions: Trust and Investment
Companies. Washington, DC, World Bank.WORLD BANK (1998). East Asia: The Road to Recovery. Washington, DC, World Bank.WORLD BANK (1999). China: Weathering the Storm and Learning the Lessons. Washington,
DC, World Bank, July.


POST-CRISIS FINANCIAL REFORMS IN THE REPUBLIC OF KOREA 227
POST-CRISIS FINANCIAL REFORMS IN THEREPUBLIC OF KOREA: PROBLEMS AND
PROPOSED REMEDIES
Chon Pyo Lee
I. INTRODUCTION
This paper considers changes in economic policy measures undertakenover time by the Government of the Republic of Korea to conform withglobal standards. It draws a few lessons from the Korean experience thatwarn against an excessively rigid application of such standards, as discussedin the literature on sequencing of economic liberalization. The paper dealswith the question of the optimal order of financial transformation, ofparticular relevance to the discussions about the Asian financial crisis. Itsuggests alternative policy options for structural adjustment by the KoreanGovernment that have been presented in a number of academic andjournalistic circles.
It is now evident that the Republic of Korea recovered from the crisisbetter than the other crisis-hit Asian economies: its growth rate was 10.9 percent in 1999 and was estimated to be 8.8 per cent in 2000; its inflation ratewas about 3 per cent and its foreign exchange reserves stood at more thanUS$ 96.2 billion at the end of 2000 – the largest in its history. Its presentrate of economic growth resembles its remarkable pre-crisis performance

CHON PYO LEE228
– for more than 35 years the country had experienced rapid growth with anaverage growth rate of 8 per cent.
Many observers have sought to determine whether the crisis wascaused by some fundamental factors inherent in the Korean economy orby unfavourable consequences of changes, especially financial ones, inthe international economic system. Earlier, the Republic of Korea had beenperforming well in terms of traditional fundamentals such as growth rates,inflation rates and balance of payments. However, its economic system,involving excessive investments by its chaebol and the latent socioculturalinstitutions associated with them, was considered unsound. In addition, itsuffered from the contagion effects of the South-East Asian financial crisis.
Some observers may attribute the Republic of Korea’s recent strongrecovery and the return to its previous high growth performance to itsvarious adjustment efforts. In fact, however, there have been seriousindications of some undesirable side effects of its recovery efforts, whichhave prompted suggestions that there might be better alternatives. Thispaper discusses possible lessons from the Republic of Korea’s reformprocess. It argues that some aspects of the global standards as norms forreform are insufficiently defined to be operational, while others are toorigid and lead to a credit crunch and a vicious circle. It points out pitfallsin the rigid application of global standards arising from the dynamics ofthe reform process. Although the reform programmes have comprisedmultidimensional changes, this paper focuses on only one dimension,namely that of financial reform, which is a central element in the overallreforms.
Two building blocks of the financial structure of society are directfinancing based on the capital market, and indirect financing based onbanking. An economy may lean, in relative terms, towards either direct orindirect financing. For example, the United States economy, with a well-developed capital market, is primarily based on direct financing, whilemost other economies are mainly dependent on indirect financing. Eachhas its advantages and disadvantages. Since no economy can drasticallychange its financial structure within a short period of time, it is best toproceed incrementally whenever there is a shift of emphasis between the

POST-CRISIS FINANCIAL REFORMS IN THE REPUBLIC OF KOREA 229
two. It can be observed that many late-starters among developing economiesrelied heavily on indirect financing.
Alan Greenspan, Chairman of the United States Federal Reserve, inhis speech at the annual meeting in 1999 of the International MonetaryFund (IMF) and World Bank, stressed the importance of a well-developedcapital market. He observed that almost all economies which had recentlyexperienced a financial crisis had an underdeveloped capital market and afinancial structure that depended heavily on banking. He stressed theimportance of capital markets, particularly when the banking sectorunderperformed.
We concur with Greenspan that an economy, particularly a developingone, should have a balanced mix of direct and indirect financing, so that asituation of non-performing loans may be improved by funds from thecapital market. It would do better to change from a structure of dominantlyindirect financing to one of diversified financing from both the capital andthe banking market. Indeed, a report issued in December 1999 by the KoreanInstitute of Finance on financial restructuring agreed on the need for moredirect financing with the aim of increasing the relative share of the capitalmarket to 60 per cent from its current level of 30 per cent (Korea Instituteof Finance, 1999).1
However, such a balanced mix of direct and indirect financing cannoteasily be achieved. Especially for late-starters of economic development,it is hard to build the infrastructure necessary for supporting a balancedfinancial structure, as many institutional factors cannot be put in placeover a short period of time. Within a limited period of time, what can bedone is to make the best use of the resources mobilized to expand therelatively smaller area of direct financing. Hence the short-term outcomewould at best be more direct financing schemes on the way to a morebalanced financial structure.
The effort towards more direct financing does not necessarily implythat the banking system, thus far extensively utilized, should be suppressedand a capital market artificially created. Social custom, which cannot bechanged rapidly, would tend to deter a drastic overhaul of the existing

CHON PYO LEE230
system, if not preventing it altogether. Society needs time to accept a newsystem, however desirable it may be. Hence, in conceptualizing the mix ofthe two financing mechanisms, there should be some optimal sequenceand speed in transforming the existing financial structure. Moreover, theschedule of the transformation process should be realistic, bearing in mindthe internally available resources and the conditions of the externalenvironment. Otherwise the transitory period would involve considerablewelfare losses that would harm many creditors and debtors, both internaland external.
Immediately after the outbreak of the Asian financial crisis in 1997the Government of the Republic of Korea tried to restructure its economyon all fronts. Its main thrust was to rapidly secure a balanced financialreform – the very point made by Greenspan – but it did not give dueattention to its various inherent limitations in the transformation process.
The Government has so far placed considerable emphasis on globalstandards. The major causes of the crisis were said to be so-called cronycapitalism involving the chaebol, and non-transparent corporate governancein the Korean economy, along with many other features associated withmoral hazard. The business practices through crony capitalism were seenas deviating from the global standards. Consequently, it was proposed thatthe undesirable practices be reduced by adopting these standards. How-ever, what constitutes global standards was not made explicit. Morefundamentally, insufficient attention was given to the question of whetherglobal standards exist for every economic aspect, and whether the Koreaneconomy had the ability to conform with the global standards and correctthe supposedly undesirable elements within a specified short adjustmentperiod.
Various kinds of global standards were suggested, but not all of themhave been enforced with equal strength. Some of them have been stronglyand consistently implemented, while others have been merely discussed.The two most distinctive global standards selected by the Government arethe Bank of International Settlements (BIS) ratio and the leverage ratio.Both are intimately related to the financial structure. The Republic ofKorea’s financial firms were required to attain the BIS ratio of over 8 per

POST-CRISIS FINANCIAL REFORMS IN THE REPUBLIC OF KOREA 231
cent within a year following the outbreak of the financial crisis, and allconglomerate groups were to reduce their leverage ratio to below 200 percent by the end of 1999. The aim of these measures was make the financialstructure of the firms concerned consistent with the global standards.However, the announcement of these standards came as a shock to all thefirms targeted for reform, as their attainment appeared to be extremelydifficult – if not impossible – within the specified period imposed by theauthorities. Moreover, there was no guarantee that governance and man-agement would change in parallel with the changes in the financial structure.These standards also induced an economy-wide financial crunch: therewas a drastic contraction in bank lending, and a significant number ofbankruptcies of illiquid firms, with only a moderate increase in share issuingand trading.
At times of unfavourable external shocks, such as an oil price hike ora deterioration in the terms of trade, policy measures should be altered tomitigate their adverse effects. When new internal factors are identified asadditional elements that exacerbate the effects of a crisis (such as hugenon-performing loans to major companies belonging to the Daewoo group),the policy stance also needs to be modified. When the policy measuresundertaken turn out to have unexpected effects, additional measures areneeded to address these.
As with economic liberalization, financial transformation, to besuccessful, should be pursued progressively. In the light of the Koreanexperience with the recent crisis, this paper suggests some lessons thatfavour a gradual and sustainable transformation for a small economy, suchas the Republic of Korea, with a large indirect financing scheme at thebeginning of the transformation. Section II sketches the plans that aimedat resolving the crisis facing the Republic of Korea. Section III evaluatesthe global standards proposed as the norms and the adjustment effortsundertaken for the resolution of the crisis. Section IV discusses publicfunding and labour market reform. Section V examines the changes thattook place till the end of 2000. And finally, section VI suggests overalllessons.

CHON PYO LEE232
II. CRISIS RESOLUTION IN THE REPUBLIC OF KOREA:FOUR REFORMS
Numerous studies on the Korean financial crisis of 1997 haveidentified its principal causes: the increase in labour costs outpacing thatof productivity; the appreciation of the Korean won, partly due to capitalinflows resulting from capital account liberalization; the excessive build-up of short-term foreign currency liabilities on the balance sheets ofcompanies; and the contagion effects from the crisis-ridden South-EastAsian countries.
The causes of the crisis can be grouped into external and internalfactors. The external factors included: massive and volatile capital move-ments in recent years; inadequacies in the global financial architecture foravoiding systemic risks; an inappropriate system for determining theexchange rate; and self-fulfilling expectations and the herding behaviourof international bankers and investors. The internal factors includedstructural ones such as insufficient transparency, endemic moral hazard,and lack of market discipline, reportedly prevalent in the non-financialsector of the Korean economy. Specifically, these were identified asexcessive corporate leverage, poor corporate governance, an inadequatemonitoring mechanism to impose accountability and transparency onmanagement, improper practices associated with cross-holdings and cross-subsidization within the chaebol, and the misconceived notion that thesecompanies were “too big to fail”. All these were seen to result in encouraginghigh-risk businesses and excessive investments away from market-basedlogic. Other internal factors in the financial sector seen to have precipitatedthe crisis included commercial bank operations implicitly guided by theGovernment rather than by profit-oriented management principles, andlending practices based on collateral instead of strict project evaluation.
Korean corporate establishments, whether in the financial or non-financial sector, have lacked adequate governance and thus the transparencyassociated with a good accounting system. And they have not necessarilybeen oriented towards profit maximization. Prior to the crisis, the de factopublic role of financial institutions in assisting the Government’s com-

POST-CRISIS FINANCIAL REFORMS IN THE REPUBLIC OF KOREA 233
mercial policies, together with the latter’s inappropriate macro management,resulted in an overvalued local currency. The existing supervisory systemwas improper: it allowed large short-term liabilities and caused massivematurity mismatching.
As a small country with little influence on its external environment,the Republic of Korea, particularly its financial sector, is vulnerable to themoods of international lenders. Since all possible remedies to rectifyexternal factors were beyond its reach, its only option was to correct itsinternal weaknesses. The Government also decided to dispense with moral-hazard-driven lending that often led to excessive investments motivatedby hidden subsidies.
In order to obtain immediate liquidity, the Korean Government ex-tended the maturity of short-term external debts with de facto governmentguarantee of commercial bank debts, and then issued global bonds to ensurethe country’s access to international financial markets. Subsequently, theGovernment launched reform programmes for each of the financial,corporate, public and labour sectors (Ministry of Finance and Economy,1999). The following sections describe these reform programmes in boththe financial and non-financial corporate sectors.
A. Financial sector
For the financial sector, 15 legislative reform measures were intro-duced to make the Korean financial system conform to the norms set bythe Organisation for Economic Co-operation and Development (OECD),supposedly for enhancing its efficiency, transparency and soundness.2 Anew Financial Supervisory Commission (FSC) was established for moreeffective financial supervision. Disclosure was strengthened by obligingfinancial firms to comply with the disclosure requirements of internationalaccounting standards, especially those regarding off-balance-sheet trans-actions, asset classification and special disclosures such as those related tounusual losses and contingent liabilities. Governance-related corporatereforms for financial firms were also introduced.

CHON PYO LEE234
For establishing a sound banking system, many critical measures wereundertaken. Weak institutions were either closed or consolidated withstronger ones. The Basel Committee’s Core Principles were adopted, withemphasis on the guidelines for transparency and disclosure. In addition,more stringent loan classification standards and provisioning requirementswere adopted. Public funds were utilized to rehabilitate troubled institutionsand to help them attain a capital adequacy ratio above the Basel norm of8 per cent. Banks were advised to seek foreign investments. The privatesector made serious attempts, with the Government’s guidance, to findforeign strategic partners who could inject both new capital andmanagement expertise.
The reform drive was extended to the capital market, following thediagnosis that bank-dominated indirect financing had contributed to thecrisis. The shallow investment base was seen as inhibiting structuralimprovements in corporate finance, and the weakness in the domestic bondmarket was considered an impediment to the improvement of corporatedebt. High priority was therefore given to the advancement of the nationalcapital market, and, in parallel, new financial commodities such as asset-based securities and mutual funds were introduced.
B. Corporate sector
High corporate debt and weak governance had resulted in excessivedebt-financed expansion by Korea’s conglomerates, and this had raisedthe country’s vulnerability to a financial crisis. Implicit risk-sharing bythe Government, together with inadequate corporate governance, had ledbank borrowers to become overly dependent on debts (the mirror image ofover-burdened lenders with non-recoverable loans) and to make excessiveinvestments. The overall situation had made both the banks and businessesextremely vulnerable to bad shocks.
In order to overcome the syndrome of over-borrowing, the Governmentsaw the need to conform to international standards. Specific provisions tothis end included: (i) strengthening the accountability of controlling

POST-CRISIS FINANCIAL REFORMS IN THE REPUBLIC OF KOREA 235
shareholders and management to improve corporate governance; (ii) en-hancing the transparency of management; (iii) eliminating cross-debtguarantee between firms affiliated with chaebol; (iv) improving the capitalstructure of firms, focusing on their core competences; (v) introducingoutside directors to participate in important corporate decision-makingto protect the interests of general shareholders against the controllingshareholders who monopolized decisions; (vi) recommending the utili-zation of economic value-added and cash flows in business operations;(vii) strengthening the legal rights of small shareholders to detailedinformation on corporate operations; and (viii) augmenting internal audi-tors’ functions.
For carrying out the corporate restructuring, the creditor bankswere assigned a catalytic role. Three different approaches were adoptedcorresponding to the restructuring requirements of three groups differ-entiated by size: the top five chaebol and their affiliates, other smallerconglomerates, and small and medium-sized enterprises (SMEs). The topfive were allowed to pursue their self-designed restructuring, as they werebelieved to have the capacity to absorb any resulting losses. Other con-glomerate groups, ranked from 6 to 65, were made to enter into “debtwork-out” arrangements with financial institutions, based on the principleof burden-sharing. The SMEs were supported with restructuring funds byfinancial institutions.
To facilitate rehabilitation, additional measures were taken. All formsof mergers and acquisitions (M&As), including hostile takeovers, wereliberalized, and the 25-per-cent ceiling on equity investments by chaebol-affiliated companies in other companies within the group were also lifted.It was recommended that private firms adopt the Code of Best Practices ofCorporate Governance, established by the Committee on ImprovingCorporate Governance composed of private experts.
It is useful to remember that, as a byproduct of the indirect financingtradition, Korean firms, in general, had high debt leverage. To reduce theirexcessive leverage, thereby improving their balance sheets, a phasedreduction of their debt-to-equity ratio was contemplated. Specifically, inDecember 1998 the top five chaebol reached an agreement that they would

CHON PYO LEE236
reduce their debt-to-equity ratio from 400 per cent to 200 per cent on aconsolidated basis by the end of 1999.
Another reform programme was business swaps, with the goal ofenhancing core competence. The business swaps, commonly called “BigDeal”, were extended to semiconductors, oil refining, aircraft, railroadrolling stocks, power generation facilities and vessel engines, and petro-chemicals. The restructuring programmes also involved selling off sub-sidiaries to more competitive companies, or spinning off the subsidiariesto independent companies. It was hoped that these measures would con-tribute to enhancing international competitiveness in those sectors by notonly eliminating overlapping and excessive capacities, but also achievingeconomies of scale.
III. GLOBAL STANDARDS AND EVALUATION OF THEPOST-CRISIS ADJUSTMENTS
At the end of 1999 the Republic of Korea’s foreign exchange reservesamounted to more than US$ 73 billion, compared to less than US$ 9 billionat the end of 1997. With this remarkable improvement in exchange reserves,the country’s President proclaimed, “… in less than two years since theoutbreak of the financial crisis, Korea has reemerged more quickly andstrongly than anyone expected, demonstrating its resolve and resilience toovercome such a huge adverse shock ...”.
The Korean adjustment sketched above has been claimed to be aprocess of adapting previous practices to so-called “global standards”.However, the question is whether there are global standards for all aspectsof economic life. Even where such standards exist, it is one thing to talkabout them and another to adopt and implement them. As some globalstandards are foreign to Korean business tradition, they cannot be appliedrapidly in the adjustment process without causing difficulties.
Some global standards are quantitative, but others are qualitative andnot easily quantifiable. Quantitative standards, such as the BIS ratio and
POST-CRISIS FINANCIAL REFORMS IN THE REPUBLIC OF KOREA 237
the leverage ratio, are easily measured, and therefore can be objectivelymonitored. However, in the absence of a good yardstick for the qualitativeor unquantifiable standards, monitoring and regulation concerning theirimplementation becomes difficult. Indeed, this distinction is very significantin the case of the Republic of Korea, since, in practice, the quantitativestandards have been aggressively enforced.
A. Qualitative standards and their effects
Some qualitative standards do not have definite norms or criteria toadopt and follow, while others are in the process of revision andmodification in the global community in the light of new developmentsmade during last few years following the East Asian crisis. This impliesthat the mechanical enforcement of qualitative global standards, some ofwhich are subject to somewhat arbitrary interpretation, cannot be imple-mented exactly and might not produce the intended results.
(i) Accounting standards
In the name of international accounting standards the KoreanGovernment has demanded that all conglomerates present combinedfinancial statements of all related firms. However, it is well known thatthere is no single international accounting standard; it is, at present, underdiscussion in the OECD. Moreover, its main contents seem somewhatdifferent from those of the American Accounting Standard, and thesedifferences need to be resolved, an exercise that is likely to take sometime. Therefore, it sounds hollow to talk about a single global standard inaccounting, not to mention the mechanical and stringent enforcement ofits implementation.
(ii) Transparency
To serve the customers of global markets more successfully, suppliersneed to be much more transparent than before. However, it is not clear

CHON PYO LEE238
whether there is a yardstick to measure the degree of transparency ofindividual firms or that of a national economy consisting of numerous firms.As noted above, Korean firms, especially those belonging to chaebol, havebeen not very transparent, as they have been engaged in internal tradingmingled with transfer pricing, cross-dealing, cross-subsidization and cross-holding of shares. While often criticized, the old practice of creatingeconomic rents through interest-rate controls and allocating them todesignated areas was accepted as normal. It is now generally agreed thatmore transparency is needed in the Republic of Korea. However, thepatterns of corporate behaviour cannot be overhauled in one day; they canbe improved, but only incrementally. How can firms be expected to attaina certain level of transparency within a certain period of time when therequired level is not made clear to them or when they know they cannotattain it? In the United States, the failed Long Term Capital Management(LTCM) fund, which had two Nobel laureates as advisers and a successfulWall Street fund manager as its chairman, demonstrated a probable lack oftransparency and adequate risk-prevention measures. The fact that achievingtransparency still remains an enormous task in the Republic of Korea, afterthree years of vigorous adjustment efforts, implies that it cannot be attainedwithin a short period of time.
(iii) Corporate governance
Corporate governance is an issue of considerable concern, particularlyafter witnessing the past behaviour of firms in terms of excessiveinvestments. The factors generally identified as contributing to the failureof corporate governance include: (a) issues relating to control andownership; (b) inadequate financial information; (c) no credible exit policy;(d) lack of monitoring of financial institutions; (e) few legal rights orprotection for minority shareholders; and (f) no substantial role fordirectors. Moreover, until 1997 there were no well-recognized bankruptcyprocedures, with few, if any, insolvency procedures for large firms.
Many measures have been taken to address these deficiencies. In-formation disclosure requirements have been made more extensive andfrequent; firms now have to report on more items, and accountability is

POST-CRISIS FINANCIAL REFORMS IN THE REPUBLIC OF KOREA 239
being enforced with the requirement that independent accountants beresponsible for the credibility and accuracy of their financial statements.To facilitate the exit of non-viable firms, the Company Reorganization Actwas amended to add an economic test, a time test and a mandatory reductionof shares.3 A cumulative voting system for boards of directors – togetherwith more outside directors playing an enhanced role – in all listed firmswas instituted, and the controlling shareholders were made de facto directorslegally accountable in case of mismanagement. Consequently, many firmshave installed outside directors who work for the shareholders, althoughtheir influence is not particularly satisfactory. As with transparency, it willtake more time for this qualitative standard to become well established.
B. Quantitative standards and their effects
Many elements associated with the qualitative global standards areneither clearly defined nor expected to produce the desirable results rapidlyif and when implemented. Requirements for such standards have been of arhetorical nature, and their implementation has proved impractical. Theyhave been neither strictly observed nor have they been able to substantiallytransform Korean business practices, even though they have been frequentlyand strongly stressed by the Government.
As for the quantitative standards, the Korean Government introducedthe BIS capital adequacy ratio for financial firms and the debt-to-equityratio for non-financial firms. As mentioned above, the Governmentdemanded that banks raise the BIS ratio to over 8 per cent and that non-financial firms lower the debt-to-equity ratio below 200 per cent, and ithas closely monitored the attainment of these targets.
(i) The BIS ratio
The BIS ratio was devised by the international community in 1988,originally as an operational yardstick in order to level the playing field forall internationally active banks from diverse traditions and customary

CHON PYO LEE240
practices. Moreover, it was designed to take care of credit risk. It was notassociated with market risk, let alone counter-party risk or systemic risk.In other words, it aims at preventing these banks from taking excessiverisks in their lending activities. In a strict sense, this ratio does not have tobe uniform for all banks; it can differ among institutions depending ontheir history, business strategy, line of business and size. Recently, variouscountries have begun to allow their banks to have their own risk-management models in place of the BIS ratio. This may be an indicationthat the BIS ratio has limitations in handling all kinds of risks faced byfinancial firms.4, 5
Yet in the Republic of Korea, the BIS ratio was enforced uniformlyfor all Korean banks, including those not involved in international businessactivities. In the implementation process the Korean banks were advisedto raise their ratio above 8 per cent.6 Those failing to meet this requirementwere threatened with closure. It was believed that the higher the ratio ofthe bank, the better equipped it would be to allay foreigners’ fears aboutthe Korean economy. In any case, in order not to lose their licence, allKorean banks had to satisfy the ratio requirement at all costs.
The Korean financial situation turned worse with the surfacing ofsudden and substantial increases in bad debts owing to the work-outdecisions of firms belonging to the Daewoo conglomerate and by theadoption of more stringent guidelines for discerning bad debts through theintroduction of so-called “forward looking criteria”. These increased thenumber of non-performing loans and/or considerably worsened the credit-worthiness of many outstanding loans of banks and other institutions,thereby causing them additional hardship in meeting the required BIS ratio.
The 1997 IMF structural reform programme that prescribed, amongothers, high interest rates and strengthened prudential regulation, caused acredit crunch, made worse by the enforcement of the BIS ratio. Every bank,struggling to survive at the worst time during the crisis, was forced toreduce its lending at whatever cost. Furthermore, ill-timed work-outdecisions and the sudden introduction of the “forward looking criteria”further intensified the credit crunch. In retrospect, insufficient considerationwas given to the issue of timing in introducing reform measures.

POST-CRISIS FINANCIAL REFORMS IN THE REPUBLIC OF KOREA 241
Recently, some measures have been introduced to modify the mechani-cal application of the BIS ratio. These will be discussed later.
(ii) Debt-to-equity ratio
A similar inadequacy was observed with respect to the debt-to-equityratio requirement for business firms. As noted above, all conglomeratefirms were required to reduce their leverage ratio to below 200 per cent bythe end of 1999. However, the reasons for this numerical target were unclear.Firms that could not meet the target were under threat of work-out orclosure.7 Consequently, in view of the difficulties in raising new money inthe crisis situation, they were forced to reduce their liabilities, and, cor-respondingly, to rearrange their asset items.
In general, firms can reduce their debt-to-equity ratio by selling offsubsidiaries or assets (e.g. closing failing businesses) or by issuing newstocks. Of these options, the most natural reaction is to eliminate variousassets, preferably with the less indispensable items being removed first.But if these cannot be sold, the more valuable assets have to go. Sometimeshighly liquid assets must be abandoned, resulting in a shortage of cash,despite the fact that they might have been maintained at their minimumlevels. As a result, the lack of liquid assets can interrupt normal businessoperations. The credit crunch and interruptions in business operations canconsiderably intensify the liquidity squeeze. Consequently, many firms,faced with difficulties in securing working capital, are forced to sell theirmost valuable assets, thereby reducing their prices and values of collateral.Such a situation is likely to result in a further increase in bad loans.
Indeed, in the Republic of Korea, not all bad loans encountered expost were bad loans ex ante; most were merely outcomes of the crisis,associated with the currency depreciation and liquidity squeeze. A numberof projects could not be completed due to falling investments as a result ofthe recession, currency depreciation and interest-rate hikes. A number offinancial intermediaries liquidated their instruments prematurely, affectedas they were by a self-fulfilling loss of confidence. This caused a furtherfall in investments and worsened the liquidity squeeze, thereby intensifying

CHON PYO LEE242
the recession and leading to a further currency depreciation and anotherincrease in interest rates. An attempt to limit real currency depreciationcaused a decline in output, which only served to validate the collapse ofconfidence, thereby accelerating the vicious circle.
Along with the pressure to meet the BIS and leverage ratios, the saleof shares or firms to foreigners was emphasized as a top priority. However,the possibility of “fire sales” caused considerable anxiety among manyKoreans, as such sales would have caused welfare losses. As it turned out,no substantial fire sales took place owing to a boom in the stock market in1999 which provided an easier way out through the issue of stocks. Thusthe chaebol managed to meet the debt-to-equity ratio requirement by theend of 1999, not through a major reduction of debts, but rather throughnew issues of equities. The stock market boom contributed to increasingdirect financing, but did not significantly lower the level of debts or alterthe business practices of indirect financing institutions to make them moreprudent than before. As a result, the subsequent burst of the stock marketbubble and the decline in equity prices throughout 2000 caused the firmswith large debts to once again experience difficulties in satisfying therequired ratio.
IV. PUBLIC FUNDS AND OTHER ADJUSTMENT EFFORTS
In addition to the application of global standards to two carriers ofproduction – firms and financial institutions – other reforms were introducedin the form of “Big Deal” and work-out measures related to the factors ofproduction (i.e. labour and capital) and direct intervention, althoughemphasis on them was weak.
A. Labour
The Republic of Korea has achieved some progress in labour marketreform by revising the Labour Standards Act, which legalized layoffs by

POST-CRISIS FINANCIAL REFORMS IN THE REPUBLIC OF KOREA 243
management. In January 1998 the Tripartite Commission was establishedto enhance labour market flexibility, and cooperation between labour,management and the Government. Intended to resolve difficult problemsthrough consensus, it resulted in employment reduction immediately afterthe crisis. But its long-term usefulness remains to be seen, as the mereexistence of the institution does not necessarily ensure cooperation betweenlabour and management. In addition, manpower-leasing businesses wereintroduced in July 1998 to provide workers with a broader range of jobsthrough the “worker dispatch scheme”.8
B. Capital: foreign capital
New resources (external and internal) needed to be injected into thetroubled banks and firms for meeting the targets of the BIS ratio and thedebt-to-equity ratio respectively. The Korean Government initially intendedto rely mainly on external resources. The principal strategy was to be thesale of companies, particularly good ones, despite complaints over possible“fire sales”. The Government argued that this was because bad companiescould not be sold. Confronted with unfavorable comments by foreignerson the credibility of Korean firms, sometimes related to the very sale ofthe companies, and, without any objective criterion, the sale price of firmswas decided almost entirely by foreigners. Thus a buyers’ market for Koreanfirms was created as a result of the Korean Government’s desperate needfor foreign capital.
This need prompted the Government to allow hostile takeovers, forthe first time in the country’s history, as part of the terms of the standbyagreement reached in 1997 with the IMF. Prior to that, hostile M&As wereconsidered a taboo; they were seen as being harmful to the entrepreneurswho had nurtured companies in a difficult environment. However, foreigninvestment banks advised that hostile M&As were indispensable forobtaining the needed foreign capital.
Some of the M&As were initiated not by demand in the market place,but as a result of pressure from the Regulatory Commission, with what

CHON PYO LEE244
appears to have been government guidance reminiscent of its industrialrestructuring attempts of the 1970s and 1980s. However, not much attentionwas paid to the diversity of the different chaebol groups and to thedifferences among industries. The restructuring policies seem to have beensuperficial, lacking in detail and inconsistent, with an emphasis on marketmechanisms, particularly evidenced in the many M&As that took place.Table 1 shows the recent trends in capital inflows. The absolute magnitudesincreased over the three years immediately following the crisis, but theirratios to GDP were still smaller than those of such economies as the UnitedSates, the United Kingdom, China and some South-East Asian countries.The shares of the foreign capital inflows (FDI and portfolio investments)in gross investments in the Republic of Korea were 9.6 per cent in 1997,4.9 per cent in 1998, 16.2 per cent in 1999 and 17 per cent in 2000.
It seems optimistic to have expected the Republic of Korea to attracteven the same amount of foreign capital as the Nordic countries managed
Table 1
FOREIGN CAPITAL INFLOWS AND GROSS INVESTMENTS
1997 1998 1999 2000
Foreign direct investment:Reported 69.7 88.5 155.4 156.9Arrivals 30.9 52.2 106.1 102.6
Foreign indirect investment 122.9 -2.9 69.9 119.6
Foreign capital inflows 153.8 49.3 176.0 222.2
Gross investments(Billion won) 15 177.3 94 054.8 128 771.2 148 202.5
Year-average exchange rate 951.1 1 398.9 1 189.5 1 130.6
Gross investments(US$100 million) 1 595.7 672.4 1 082.6 1 330.8
Foreign capital inflows/gross investments(Per cent) 9.6 4.9 16.2 17.0
Source: Ministry of Industry and Resources for FDI; Bank of Korea for indirect investments.

POST-CRISIS FINANCIAL REFORMS IN THE REPUBLIC OF KOREA 245
during their crises in the early 1990s (the proportion of foreign capital inthese countries was estimated to be about 20 per cent),9 given that thelatter are regarded as very transparent, while the Republic of Korea hasbeen criticized for its lack of transparency. At best, foreign capital mighthave amounted to about 20 per cent of the total new resources needed.Assuming that all gross investments made at that time were utilizedexclusively for purposes of structural adjustment, the calculated ratios abovesuggest that the extent of contributions of foreign capital for Koreanrestructuring did not deviate from what could be expected based on theexperience of the Nordic economies. There is an obvious limit to the amountof foreign resources that can be attracted for restructuring, especially bydeveloping economies, and therefore, new and effective ways of mobilizingunderemployed internal resources need to be developed.
C. Public funds
In the Republic of Korea, given the difficulty in mobilizing under-utilized internal private resources, the easier option was to use publicresources. Thanks to fiscal soundness inherited from the pre-crisis era, theKorean Government was able to mobilize sizeable public resources to shoreup the capital adequacy position of major financial institutions. Theinjection of public funds was carried out in a front-loaded manner in thehope of quickly restoring confidence in the market, thereby raising mostbanks’ BIS ratio well above 10 per cent. This also provided the Governmentwith room to lower the interest rate and thus mitigate a credit crunch.
The main vehicles for the injection of public funds for restructuringare the Korea Asset Management Corporation (KAMCO) and the KoreaDeposit Insurance Corporation (KDIC). The KAMCO purchased anddisposed of impaired assets from financial institutions, while the KDIC’sfunction was to create a system of deposit insurance based on limitedguarantees for depositors, with the premium linked to prudential soundnessof each insured institution. But it also participated in the restructuringprocess by providing recapitalization funds to targeted banks and reim-bursing depositors in other institutions.10

CHON PYO LEE246
With the help of public funds, banks were transformed into a vehicleused extensively as the main corporate creditor for corporate sector reform.However, the injection of public funds created new problems. First of all,it changed the former private banks into de facto public entities. When theliabilities of banks were guaranteed in 1997 for maturity extension, thisresulted in the “socialization of private debts”. Many banks were in a sensenationalized, despite outside pressure to rely on the market mechanismand private initiative. Thus with the injection of public funds, the trendtowards nationalization of private enterprises was further intensified.
These public funds were expected to be paid back. The sharespurchased in exchange for the KDIC debt certificate to raise the capitaladequacy ratio were required to be sold, and the money from the sale usedto pay for liquidating the debt certificate. However, in reality it is not clearwhen the money will be repaid. In the meantime, the financial injectionimplies an increase in public expenditure to finance the interest paymentson the debt certificates, possibly risking inflation. Moreover, the debtcertificates exchanged for banks’ shares are valuable assets for the banksto further utilize, as they can issue new liabilities based on those certificates.However, their utilization may amplify the inflationary potential. So farthis kind of potential danger has been averted.
The Government initially projected that the total amount of publicfunds to be injected would be 64 trillion won,11 for recapitalizing financialfirms and paying the banks’ depositors on their behalf. However, after theinjection of the public funds, there appeared to be a further financial needfor recapitalizing financial firms whose non-performing loans had increaseddue either to bankruptcies of their borrowers, or to a deterioration of thequality of the loans. In October 2000, the Ministry of Finance and Econom-ics requested the National Assembly to authorize an additional 40 trillionwon. The planned use of this new money was not very different from thatof previous funds: investments into banks to strengthen their capital baseand the BIS ratio, and investments into the Seoul Guarantee Company,several credit unions and credit cooperatives to augment their respectiveloss provisions. Moreover, many feared that the 40 trillion won would notbe the final injection of this kind. Indeed, by the end of 2001, the totalamount of public funds injected was reportedly 156 trillion won. This

POST-CRISIS FINANCIAL REFORMS IN THE REPUBLIC OF KOREA 247
included not only the original funds of 64 trillion won and the additional40 trillion won, but also other special purpose public funds and the reusedfunds from the repayment by the institutions that had used the originalpublic funds for restructuring purpose.
At around the same time, it was revealed that 45 trillion won of theinitial 64 trillion won was unlikely to be recovered, and the net interestpayments accumulated during the past four years on the total public fundswas estimated to be 44 trillion won. As a result, the congressional hearingon this matter disclosed that the total national burden from the operationof the public funds amounted to 89 trillion won. In order to avoid theproblems associated with such use of public funds, it is obvious that thereneeds to be a more active utilization of private money.
D. “Big Deal” and work-out programmes
A “Big Deal” was introduced through which production facilities ofbig firms were supposed to be swapped and their overcapacity curtailed.However, the Government determined which businesses would have to beswapped without any consultation with the firms involved, and it offeredno room for compromise. But the swaps required many conditions andcompromises on the part of the chaebol groups concerned. The conditionswere hard to meet and compromises even harder, in spite of pressure fromthe Government. Hence, the “Big Deal” turned out to be a failure in thesense that the initial plan was not implemented as intended, and the problemof overcapacity resulting from the past excessive investments has neverbeen resolved.
There have also been work-out programmes for several firms, withsomewhat favourable aid packages offered to them. The rationale for theseprogrammes was to provide liquidity to those firms deemed solvent butexperiencing temporary liquidity problems. In other words, if short-termliquidity was provided, the firms under the work-out programmes wereexpected to become normal. Even with the good intention of the work-outprogrammes not many firms returned to normal even with the rescue
CHON PYO LEE248
financing, and some of them had to be either liquidated or financed further.The work-out programmes therefore have been criticized as having beentoo lenient in the sense that they included too many firms (including non-viable ones) and that the aid packages discriminated against other goodfirms that were not part of the work-out programmes.
V. AN ASSESSMENT OF THREE YEARSOF RESTRUCTURING EFFORTS
Upon entering 2001, three years after the Republic of Korea initiatedits restructuring efforts, the evaluation by foreigners of the outlook of theKorean economy differs from that of many Koreans. According to a surveyof 2000 foreign firms running businesses in Korea, conducted by the KoreaTrade and Investment Corporation in the first half of December 2000, 53 percent of foreign firms were optimistic about the Korean economy andintended to increase their investments in the country. In contrast, Koreanswere less optimistic, according to other surveys done by variousnewspapers; Koreans expected a further deterioration not only because ofworsening external conditions, but also because of the discrepanciesbetween the restructuring plan and its actual implementation.
In this context, we examine a few new developments since the end of2000. First, many quarters of the economy, including the Korean Chamberof Commerce and Industry, have severely criticized the Government’sobsession with the BIS ratio. Even the Bank of Korea has argued that theBIS ratio should be applied differently to different banks (especiallydepending on whether they are from an advanced economy or not). Inaddition, the Financial Supervisory Commission (FSC) revealed that itmight not be preoccupied with the BIS ratio per se, and would be moreconcerned with other yardsticks, including profitability indicators such asthe rates of return on assets and on equities. These changing views, thatbanks should not be too tightly constrained in lending so as to mitigate theprevailing financial crunch and serious financial dis-intermediation,seem quite different from three years earlier when the authorities werepreoccupied with the BIS ratio.

POST-CRISIS FINANCIAL REFORMS IN THE REPUBLIC OF KOREA 249
As explained earlier, the task of reducing the debt-to-equity ratio forthe chaebol to below 200 per cent by the end of 1999 was met, not byreducing debts but by increasing equities, helped by the stock market boomin 1999. However, with the decline in stock prices during the second halfof 2000, firms with a satisfactory debt-to-equity ratio began to suffer dueto the remaining obligation of interest payments. Indeed, the absolute sizeof debts on which the interest was paid had not been reduced even with theimprovement of the ratio in 1999. This suggests an urgent need to findmore direct ways of lowering cash outflows and debt liabilities rather thanusing indirect ways of lowering the debt-to-equity ratio (and thereuponthe debt burden).
The experience with the work-out programmes indicates that simplechannelling of liquidity to loosely selected firms does not always transformthem for the better. The point is that firms’ debts should be dealt with byreducing their interest payment obligations in addition to the removal ofmoral-hazard-inducing misdemeanors. Thus before the injection ofliquidity, there should be an assurance that their debts will be cleaned beforetheir resumption of normal operation. The cleaning would better precedeany injection of funds, irrespective of whether these are provided by work-out programmes or public funds. Hence, a debt-equity swap, which compelsthe reduction of debts, could be an effective solution.
As a response to the criticism that even insolvent firms were keptalive because of the lenient criteria in the loose work-out programmes, thecreditor institutions have, since November 2000, applied more stringentcriteria for discerning firms for credit supply, especially those firmsregarded by the earlier lenient criteria as normal or “too big to fail”. Theyhave been pressured to identify as candidates for exit the firms that havehad interest compensation ratios of under one for the last three consecutiveyears and the firms that are unable to pay the normal operating bills intheir main trading areas. This surely has served to distinguish viable firmsfrom the others and to facilitate a few experiments in debt-equity swaps.However, such experiments cannot be sufficient unless debts are sub-stantially decreased or the swaps are extended to a wide range of firms,with each undergoing a market test for determining the swap rate.

CHON PYO LEE250
Since the strengthening of the criteria, however, a few firms havebeen forced out of the work-out programmes, and many others havemanaged to receive liquidity by remaining in the work-out programmes,even against the will of creditor banks. Actually these banks have oftenbeen forced to finance aid packages. In such cases, the Government’sinvolvement in and domination over the banks’ decision-making have notbeen consistent with its proclamation of encouraging private initiative.The Government has justified its intervention on the grounds that thisprevents market disruptions. Some officials have argued that the inter-vention has been indispensable since some markets would have collapsedwithout it. Recently, such cases have increased substantially. In thecorporate bond market, the FSC has forced banks, even against their will,to underwrite the corporate bonds of liquidity-short companies. In themarket of investment trusts, the Government has allocated to banks,irrespective of their preferences in portfolio selection and management,bonds issued by corporations that are of virtual junk bond status. TheGovernment has also strongly encouraged bank mergers on the groundsthat the enlarged banks would be able to handle the existing non-performingloans more effectively. Indeed, the bank mergers had become a symbol offinancial restructuring even before the public could clearly understand andaccept the rationale behind this approach. For the first bank merger, theGovernment selected two banks engaged mainly in retail banking and withrelatively negligible non-performing loans, as they had not been involvedin wholesale financing in the past. This initiative prompted a strike bybank employees. Since then, forced mergers have been severely criticized,especially in the academic community, as an improper way of restructuring.
All these cases of government intervention have deviated from theprinciple of market mechanism and global standards. Apart from themergers, the privatization of banks, as the fundamental task for financialstabilization and restructuring, has been set aside. Critics have stronglyupheld the idea of removing undue government influence with the aim ofimproved corporate governance. In fact, such interference renders theprevious insistence on global standards rather weak.

POST-CRISIS FINANCIAL REFORMS IN THE REPUBLIC OF KOREA 251
VI. LESSONS FOR BETTER RESTRUCTURING
The attention to qualitative standards and the rather rigid enforcementof two quantitative standards have contributed remarkably to economicrecovery in the Republic of Korea, as mentioned in the introductory section.However, the strict adherence to the quantitative standards has also broughtabout undesirable side effects, including a credit crunch, resulting in aneconomy-wide vicious circle. Consequently, the Korean business com-munity has complained that governmental involvement has createdunnecessary hardship as well as being largely inconsistent with theproclaimed market principles and global standards. The misgivings aboutfinancial restructuring could have been avoided if the rigid enforcementof a few ratios had been a little flexible. In this context, the followingsection discusses a few lessons learned from the restructuring.
(i) The dynamics of transformation should to be taken into account insecuring qualitative and quantitative objectives of restructuring.
The qualitative objective can be attained over time only when there isan appropriate infrastructure, while the attainment of the quantitativeobjectives can better be managed flexibly according to developments inthe market and other relevant measures. It should be remembered that anadequate balance should be maintained between the formal legal structureand the realities of governance and management.
For nurturing a deficient, if not a missing, capital market in emergingeconomies, the Government should, in addition to various qualitative factorsassociated with it, encourage the participation of well-developed institutionalinvestors, such as mutual funds, pension funds, insurance companies, and,most importantly, investment banks. These institutions should form a systemenabling reliable credit evaluation and reasonable portfolio allocation.Securing an exchange rate system with due regard to capital flows suitedto such emerging economies should also be a prerequisite.
But all these elements require an ability for constant adjustment.Indeed, the underlying dynamics of financial transformation are very
CHON PYO LEE252
complex; they are affected by such factors as the changes in externalconditions, government policies, the conduct of numerous private entitiesand expectations. The injection of public funds, for example, is just onegovernment policy along with all these elements. Even if they are disbursedas scheduled, the dynamics could shift in unexpected directions as a resultof variations in the other factors. In other words, the dynamics cannot befully controlled. In the Republic of Korea, besides the sudden liquidationof loans due to the abrupt imposition of the BIS ratio, the collapse ofconfidence, continuous currency depreciations and interest rate alterationsinvoking balance sheet difficulties all contributed to the vicious circlediscussed above. And once the vicious circle appears, it is not easy toovercome due to the difficulty in forecasting all elements affecting it.Hence, in order to adequately respond to these uncertain dynamics,government responses need to be flexible. One or a few drastic measuresthat could partially and temporarily break the inherent dynamics cannotbe relied upon completely in an uncertain dynamic environment, even ifthe measures, for all their good intentions, retain the convenience of easyand objective monitoring, such as the application of the BIS ratio or theinjection of public funds.
(ii) New resources need to be injected along with the cleaning up of badassets and liabilities in the balance sheet.
The Korean Government pursued, as a practical approach, the optionof injecting public funds rather than mobilizing private funds. However,this prompted the criticism that the Government preferred a simple butineffective solution that failed to achieve its intended goal.12 The failedoutcome suggests that simply injecting public funds into banks withoutcleaning up the sources of their loan portfolio and without considering thepossibility of newly-arising bad assets in corporations that are confrontedwith a worsening economic situation, cannot normalize the financial sector.
In the Republic of Korea, the initial injection of 64 trillion won wasdetermined on the assumption that this would take care of 50 per cent ofthe then existing bad assets on the balance sheets of firms, provided thatthe remaining 50 per cent would be absorbed by the firms themselves fromother external resources. However, as noted above, the actual funds injected

POST-CRISIS FINANCIAL REFORMS IN THE REPUBLIC OF KOREA 253
turned out to be 156 trillion won, including the addition of 40 trillion wonto take care of the new criteria for non-performing loans and the unexpectedbankruptcy of Daewoo. This demonstrates that even the injection of hugeamounts of public funds failed to control the uncertain dynamics of theKorean financial reform process.
In order to halt the dynamics associated with bad assets in firms andfinancial institutions, such assets have to be written off, with a corre-sponding reduction of their capital base. Thereafter, in order to restore agood portfolio balance, the liabilities should also be reduced, and at thesame time the capital base should be strengthened. The most appropriateand direct means of accomplishing this is through debt-equity swaps, asexplained below. Indeed, the best short cut to breaking the vicious circle isby cleaning the balance sheets of the widest range of firms and financialcompanies to the maximum extent possible. The restructuring of firms inthe financial sector should be accompanied by the restructuring of firms inthe real sector.
In passing, it should be pointed out that the implementation of debt-equity swaps is more difficult when the stock market is booming than whenit is depressed. Also, it is important to avoid too much reliance on foreigncapital. Foreign capital is an attractive new financial source for developmentand/or restructuring, but it has its own logic in international movements.As the Feldstein-Horioka puzzle explains, there need to be limits to thecontribution of foreign capital to domestic capital formation, say up to20 per cent, although the limit would differ depending on the stage ofdevelopment and restructuring.
(iii) Debt-equity swaps need to be tried in parallel with the establishmentof a junk bond market.
As mentioned above, in 1998 the Korean Government, in addition tothe policy of attracting foreign capital, introduced measures to mobilizeinternal resources especially by activating direct financing channels. Mutualfunds are now allowed to mobilize savings withdrawn from bank depositsdue to their low interest compensation or to investors’ lack of confidencein directly investing on their own in the securities market. Mutual funds

CHON PYO LEE254
are, indeed, a new financial product in the Korean economy. However,they have been limited to the closed-end type, which puts a limit on theirgrowth. Also, pension funds have been encouraged to invest in the securitiesmarket, which is less conservative than mutual funds. Vulture funds werediscussed, but so far there do not seem to have been any noticeable activitiesby such funds.
None of these means have been sufficient to mobilize capital andchannel it to capital-strapped companies. Hence new ways must be devisedfor mobilizing those internal resources that are regarded as underutilized.Owing to the inadequacy of public funds, underutilized private domesticresources need to be mobilized for corporate restructuring of both thefinancial and real sectors. For achieving this objective, first of allunderutilized private domestic resources need to be identified. Since thecredit-rating of most firms would consider them not “investment-worthy”,the activation of a junk bond market was suggested as an instrument formobilizing domestic resources. This market was expected to widen theportfolio selection for idle liquidities. For the same purpose, in parallelwith the junk bond market, the debt-equity swaps could be employed.Indeed, the swap of banks’ liabilities (i.e. deposits by the depositors) withtheir capital (i.e. bank shares) could reduce their liabilities, thereby easingthe pressure on them to meet the required BIS ratio. Similarly, the swap ofliabilities of firms (i.e. bank loans to firms) with the firms’ capital (i.e.firms’ shares) could reduce their liabilities, and thus ease the pressure onthem to reduce their leverage ratio.
However, incentives are needed to encourage such debt-equity swaps.In the process of providing such incentives, the share prices of both firmsand banks would have to be discounted.13 Indeed, the discount implies avirtual cleaning up of troubled companies. The extent of the discount (andthereupon the swap rate) must be determined by the market. In order tocreate a market for numerous debt-equity swaps, investment banks, togetherwith vulture funds and corporate restructuring companies, have to beactivated.
Debt-equity swaps have a number of merits (relevant in the light ofthe misgivings expressed in the Korean reform process). First of all, they

POST-CRISIS FINANCIAL REFORMS IN THE REPUBLIC OF KOREA 255
rely mainly on internal resources, thereby allaying the fear of “fire sales”to foreigners. Secondly, they rely on private resources mobilized throughthe market mechanism, which reduces the potentially undesirable effectsof using public funds. Thirdly, they contribute to the cleaning up process,since they improve the financial state of the companies concerned byreducing the size of their liabilities. They are a more direct way of resolvingthe debt trap than the indirect way using the BIS ratio or the debt-to-equityratio. Fourthly, by increasing the proportion of direct financing, they addressthe problem of an unbalanced financial mix of the kind associated with the1997 financial crisis. Fifthly, they make investment banks more consciousof the need for securitization of their finance.
Debt-equity swaps do not directly improve corporate governance oruphold the quality of management in troubled firms. Yet with the variousswaps, the shares of firms are more widely distributed and the excessiveinfluence of dominant owners is thus reduced. Similarly, through theprocesses of investment banking deals and auctions, an increasing numberof stockholders will take an interest in the operation and management oftheir companies, necessitating greater information disclosure, which in turnwill enhance the degree of transparency.
Recently, there appear to have been movements in this direction inthe Republic of Korea, with strong pressure for the establishment anddevelopment of a junk bond market and aggressive attempts at corporaterestructuring of companies.

CHON PYO LEE256
NOTES
1 There is no indication of how the figures of 30 per cent and 60 per cent are obtained,but it does suggest that the role of the capital market needs to be considerably increased.
2 These include: the Bank of Korea Act, the Act for Establishing a Financial SupervisoryCommission, the Bank Act, the Depositor Protection Act, the Act for Restructuring ofthe Financial Industry and others.
3 The economic test is an examination of profit-making in the short-run, whereas the timetest examines whether profitability can be sustained over time. These tests wereintroduced in response to the recognition that many firms did not care much aboutshort-term profitability.
4 When the BIS ratio equivalents were calculated for the first class banks that have theirown risk management model, the results reportedly indicated a range between 1 percent and 30 per cent (The Economist, 1–7 May 1999, “Banking regulation; Basle brush”).As this range is rather wide, the 8 per cent ratio may not be the most representative one.Even the BIS has discussed a possible revision of the ratio. One key issue is that theratio does not properly reflect the alternative phases of the business cycle such that itremains the same across booms and recessions; it must be bigger to contain creditexpansion in boom times and smaller to stimulate credit during recessions. Furthermore,the fact that the risk-weight for government agencies of lower-tier OECD countries islower than that for the first class firms of upper-tier OECD countries has been pointedout as another sign of its inadequacy. Another shortcoming noted is the requirementthat short-term lending be associated with less capital provisioning than long-term lending.
5 Barry Johnson of the IMF emphasized in his unpublished paper, Use and Liberalizationof Capital Control, presented at the Sogang Institute of International and Area Studies,that the establishment of a risk management system with constant attention to risks wasmuch more important than adhering to the BIS ratio.
6 It was reported that the average BIS ratio for deposit banks was 7.04 per cent at the endof 1997, and it increased to 10.83 per cent at the end of 1999, reflecting the obsession toachieve a higher BIS ratio.
7 Work-out programmes are less formal, less costly and speedier than liquidation andbankruptcy procedures, and thus they usually lead to maturity extension, deferredpayment and/or a reduction of the principal and interest. During informal work-outprogrammes, the debtor firm and its creditors can negotiate rescheduling or restructuringin a flexible fashion.
8 Before the introduction of this scheme, all employees who had undergone two or threemonths of training in companies were considered de facto lifetime employees.
9 Personal communication with an economist of the Swedish central bank at the seminar,Banking Crisis Resolution Issues: International Lessons for Korea, organized by theWorld Bank and the Korea Institute of Finance, 15–16 May 1998.
10 Malaysia, which voluntarily carried out reforms without IMF loans, has similarinstitutions. The Danharta, which bought non-performing loans and assists banks tomake their assets more sound, is equivalent to the KAMCO; the Dadamodal, whichprovided public funds for recapitalization, is equivalent to the KDIC; and the role of

POST-CRISIS FINANCIAL REFORMS IN THE REPUBLIC OF KOREA 257
the Corporate Debt Restructuring Committee, which led the restructuring of corporations,is similar to the de facto role played by the Financial Supervisory Commission.
11 US$ 1 billion is approximately 1.2 trillion Korean won.12 Almost three years after the initial injection of public funds in early 1998, the Korean
restructuring policy stance changed: a debt-equity swap was arranged for firms identifiedas being viable based on various criteria. This implied an injection of private funds,instead of public funds, to those firms.
13 It was realized that when the public resources were utilized for those banks that hadnon-performing loans in troubled companies – thus leaving such loans untouched – thebanks would not necessarily become clean unless the companies themselves were cleanedup. Hence, two-and-a-half years after the start of the reforms it was recognized thatboth financial firms (lenders) and non-financial firms (borrowers) needed to be cleanedsimultaneously.
BIBLIOGRAPHY
Edwards S (1984). The order of liberalization of the external sector in developing countries.Essays in International Finance, No. 156.
Eichengreen B (1999). Toward a New International Financial Architecture: A Practical Post-Asia Agenda. Washington, DC, Institute for International Economics.
Feldstein M (1999). Self-protection for emerging market economies. Working paper No.6907,National Bureau of Economic Research, Cambridge, MA.
Frenkel J (1982). The order of economic liberalization: a comment. In: Brunner K and MeltzerA, eds., Economic Policy in a World of Change. Amsterdam, Elsevier Science PublishersBV (North-Holland).
Garten J (1998). In this economic chaos, a global central bank can help. International HeraldTribune, September 25.
Kaufman H (1998). Preventing the next global financial crisis. Washington Post, January 28.Kindleberger C (1987). International Capital Movements. Cambridge, United Kingdom,
Cambridge University Press.The Korea Institute of Finance (1999). Measures for Restructuring of the Korean Financial
System (in Korean). Seoul.Krugman P (1987). The narrow moving band, the Dutch disease, and the competitive
consequences of Mrs. Thatcher: Notes on trade in the presence of dynamic scaleeconomies. Journal of Development Economics, 27: 41–56.
Lee C (1992). Preconditions for a successful financial liberalization and a feedback processof managing progressive liberalization. In: Ow-Taylor CH, Korea-U.S. Financial Issues.Washington, DC, Korean Economic Institute of America.
McKinnon R (1982). The order of economic liberalization: Lessons from Chile and Argentina.In: Brunner K and Meltzer A, eds., Economic Policy in a World of Change. Amsterdam,Elsevier Science Publishers BV (North-Holland).

CHON PYO LEE258
McKinnon R (1991). The Order of Economic Liberalization, Baltimore, MA, Johns HopkinsUniversity Press.
Michealy M (1986). The timing and sequencing of a trade liberalization policy. In: Choksi Aand Papageorgiou D, eds., Economic Liberalization in Developing Countries, New YorkNY, Basil Blackwell.
Sachs J (1995). Do we need and international lender of last resort? Frank Graham MemorialLecture, Princeton University.

PUBLIC DEBT AND MACROECONOMIC MANAGEMENT IN SUB-SAHARAN AFRICA 259
PUBLIC DEBT AND MACROECONOMICMANAGEMENT IN SUB-SAHARAN AFRICA
Delphin G. Rwegasira and Francis M. Mwega
I. INTRODUCTION
This paper analyses the nature of public debt in Africa. It exploresdifferences between external and domestic public debt, the factors thatcontribute to their accumulation, and associated problems that arise fromthe opening up of the capital account and the removal of impediments toasset substitution. The paper focuses on the problems that government debtcauses in macroeconomic management, including policies on exchangerates and interest rates, and the impact of debt on an economy’s vulnerabilityto external shocks. One important factor in public debt accumulation thatreceives some attention in the paper is the shift from central bank financingof public deficits to financing via private markets, including the questionof whether this shift has brought about greater fiscal discipline and bettermonetary control as intended.
The analysis is undertaken for sub-Saharan Africa (SSA) in general,with examples drawn from a group of 10 African countries: Cameroon,Côte d’Ivoire, Ghana, Kenya, Malawi, Nigeria, Uganda, the UnitedRepublic of Tanzania, Zambia and Zimbabwe, from the mid-1980s to thelate-1990s. Except for Kenya and Zimbabwe, which the World Bank

DELPHIN G. RWEGASIRA AND FRANCIS M. MWEGA260
classifies as moderately externally indebted, the remaining eight countriesare classified as severely externally indebted countries (World Bank, 1999).
The remainder of the paper is organized as follows. Section II describesthe public debt problem in SSA. Section III discusses the linkages betweenexternal and domestic debt as well as the factors that contribute to theiraccumulation. Section IV analyses the financing of budget deficits, andSection V presents the limitations and trade-offs of the various financingmethods in SSA. Section VI discusses the implications of public debt formacroeconomic management and monetary policy in SSA, and section VIIconcludes.1
II. THE DEBT PROBLEM IN SUB-SAHARAN AFRICA
A. External debt
External debt imposes a heavy burden in much of SSA. Table 1 showsSSA’s external indebtedness in both current US dollars and in relation togross national product (GNP) and exports. Africa’s debt about doubled,from US$ 107 billion in 1985 to US$ 226 billion in 1998. Relative to thesize of the regional economy, external debt increased from 56.3 per centof GNP in 1985 to 68.3 per cent of GNP in 1998. Relative to the region’sdebt servicing capacity, it increased from 171.0 per cent of exports in 1985to 232.1 per cent in 1998. The table shows that the external debt burdenreached a peak in 1993–1994, with some welcome decline thereafter. Thiswas partly due to improved growth, leading to an improvement in thestandard debt indicators. After nearly two decades of poor performancethere has been some recovery in Africa since the mid-1990s. However, therecovery has been hesitant, weak and patchy. The improvement in theexternal debt indicators in the second half of the 1990s may also beexplained by provisions of debt relief, for example, under Paris Club debtreschedulings, some commercial debt buy-backs, and the more recentHeavily Indebted Poor Countries (HIPC) Debt Initiative of the World Bankand International Monetary Fund (IMF). The overall decline in aid levels

PUBLIC DEBT AND MACROECONOMIC MANAGEMENT IN SUB-SAHARAN AFRICA 261
(discussed later) has also meant a slowing down in the build-up ofindebtedness (and consequently in the obligations to repay).
The evolution of the external debt in SSA is reproduced in table 2 forselected African countries. By the mid-1980s, only Côte d’Ivoire andNigeria faced a problem (Azam, 1997), but thereafter the problem spreadto other countries in the region. Relative to the size of the economies asmeasured by the external debt-GNP ratio, only Uganda and Zimbabwemaintained their external debt levels below the average for SSA during theperiod 1985–1997. Cameroon and Ghana, which started with relativelylow ratios, accumulated debt to levels above the average for the region.The remaining countries in the sample, both at the beginning and at theend of the period under study (i.e. 1985 to 1998) (except Uganda and
Table 1
SUB-SAHARAN AFRICA: EXTERNAL DEBT AND SERVICING, 1985–1998
Total debt / External Arrears:exports of debt principal
Total debt Total debt/ goods and service and Principalstocks GNP services ratio interest rescheduled
Year ($ billion) (Per cent) (Per cent) (Per cent) ($ billion) ($ billion)
1985 107.3 56.3 171.0 17.5 10.7 1.61986 121.0 58.0 213.5 17.2 8.2 3.21987 148.1 62.4 226.2 13.5 12.2 4.51988 150.6 60.9 220.7 14.8 19.6 1.51989 157.4 62.7 217.8 13.1 21.0 4.81990 177.4 64.7 209.8 12.9 26.9 4.01991 184.0 65.9 225.6 12.5 32.2 2.71992 183.2 66.3 222.5 12.2 38.8 2.01993 195.4 73.8 246.0 9.2 48.7 0.51994 219.7 83.9 272.7 14.7 54.1 3.11995 233.8 80.9 242.7 15.4 62.0 1.71996 229.6 74.4 215.4 14.2 60.4 2.81997 219.4 68.0 201.7 12.8 56.4 2.11998 225.8 68.3 232.1 14.9 .. ..
Source: World Bank (1999).

DELPHIN G. RWEGASIRA AND FRANCIS M. MWEGA262Ta
ble
2
SUB
-SA
HA
RA
N A
FRIC
A: E
XTER
NA
L D
EBT/
GN
P A
ND
DO
MES
TIC
DEB
T/G
NP,
198
5–19
99(P
er c
ent)
Côt
eU
nite
d R
ep.
Cam
eroo
nd’
Ivoi
reG
hana
Ken
yaM
alaw
iN
iger
iaU
gand
aof
Tan
zani
aZa
mbi
aZi
mba
bwe
Year
EX
TD
OM
EX
TD
OM
EX
TD
OM
EX
TD
OM
EX
TD
OM
EX
TD
OM
EX
TD
OM
EX
T D
OM
EX
TD
OM
EX
TD
OM
1985
40.2
3.5
153.
4..
51.0
15.7
70.7
12.0
94.6
23.4
68.1
114.
335
.55.
2..
18.3
230.
46.
543
.927
.319
8639
.64.
813
5.2
2.0
49.4
6.0
65.7
16.0
103.
324
.711
8.2
86.3
36.4
3.8
..23
.842
3.0
5.5
43.6
29.7
1987
39.3
6.4
147.
66.
067
.16.
775
.127
.812
3.8
30.4
137.
943
.530
.81.
8..
12.5
346.
03.
943
.633
.319
8839
.34.
214
3.4
6.0
61.8
9.0
70.9
27.1
106.
119
.713
2.6
46.4
29.8
0.8
122.
010
.320
6.8
3.4
35.1
32.7
1989
49.8
4.8
177.
07.
266
.26.
073
.326
.095
.813
.013
8.4
35.6
42.0
1.0
128.
08.
118
7.6
0.2
34.6
31.6
1990
61.0
4.7
187.
310
.267
.15.
387
.224
.688
.68.
013
0.7
40.9
61.1
0.7
160.
67.
324
1.5
0.1
38.2
30.7
1991
56.8
10.4
199.
28.
967
.53.
098
.326
.977
.27.
213
4.9
48.0
85.1
0.8
151.
26.
424
5.1
0.0
41.1
27.4
1992
68.9
13.3
189.
1..
71.3
7.0
91.3
25.9
97.1
8.3
97.5
31.2
105.
62.
414
2.9
4.8
243.
10.
062
.924
.219
9366
.811
.821
1.0
..83
.32.
813
3.4
33.5
90.0
8.1
161.
560
.395
.51.
215
6.3
3.9
225.
00.
068
.122
.219
9411
4.0
29.1
252.
434
.510
2.4
3.8
106.
127
.217
9.2
9.7
155.
363
.285
.6..
178.
74.
921
1.6
0.7
68.8
24.0
1995
125.
738
.320
9.9
27.4
92.5
9.6
84.8
24.9
158.
213
.713
1.7
43.9
62.8
..14
1.2
11.3
210.
70.
874
.241
.919
9611
2.0
..19
9.5
22.7
90.4
6.3
76.8
21.5
103.
611
.195
.033
.760
.5..
113.
78.
823
2.3
0.7
60.7
38.4
1997
109.
3..
165.
319
.488
.611
.464
.722
.489
.09.
575
.643
.656
.51.
397
.24.
418
4.6
0.6
58.5
30.1
1998
....
..17
.2..
14.8
..21
.2..
....
63.8
..1.
7..
4.4
..0.
4..
..19
99..
....
....
....
20.4
....
....
....
....
....
....
Sour
ce:
For e
xter
nal d
ebt:
Wor
ld B
ank
(199
9); f
or d
omes
tic d
ebt:
IMF
(199
9) a
nd IM
F, G
over
nmen
t Fin
ance
Sta
tistic
s (v
ario
us is
sues
). S
ome
data
to fi
ll ga
ps o
ndo
mes
tic d
ebt w
ere
deriv
ed fr
om c
ount
ry p
ublic
atio
ns (t
hese
incl
ude
Gha
na, Q
uarte
rly E
cono
mic
Bul
letin
, var
ious
issu
es; C
entra
l Ban
k of
Ken
ya, A
nnua
lR
epor
t, va
rious
issu
es; M
alaw
i, Fi
nanc
ial a
nd E
cono
mic
Rev
iew
, 31(
1) 1
999;
Cen
tral B
ank
of N
iger
ia, A
nnua
l Rep
ort,
vario
us is
sues
; Uni
ted
Rep
ublic
of
Tanz
ania
, Eco
nom
ic B
ulle
tin, 1
996
and
1999
; and
Ban
k of
Uga
nda,
Eco
nom
ic a
nd F
inan
cial
Indi
cato
rs, N
ovem
ber 1
999)
.N
ote:
.. =
not a
vaila
ble

PUBLIC DEBT AND MACROECONOMIC MANAGEMENT IN SUB-SAHARAN AFRICA 263
Zimbabwe, and Kenya in the latter half of the period), experienced a worseexternal burden than that for the region as a whole.2 Kenya’s external debt,for example, peaked at US$ 7.5 billion in 1993, but has since declined toUS$ 6.9 billion in 1996, with much of the debt being aid-related (O’Brienand Ryan, 1999).
The external debt as a proportion of GNP and exports in Africa wasnearly double the average for all developing countries, as shown by thefollowing data for 1998 (World Bank, 1999):
Africa Developing countries
Debt as a percentage of GNP 68 37Debt as a percentage of export earnings 232 146Debt service as a percentage of export earnings 15 18
The external debt service ratio was, however, lower in Africa (by3 percentage points) due to the concessionary terms of much of itsborrowing. Table 1 shows that this ratio declined from 17.5 per cent in1985 to 14.9 per cent in 1998.
The stock of external debt and its servicing therefore poses a majorproblem in many SSA countries. This is for three major reasons. First, asseen above, the external debt stock is large relative to the size of the SSAeconomies. The large debt overhang creates uncertainties and reducesincentives for investment. Second, as debt servicing constitutes a largeproportion of export earnings and government expenditures, it reduces theresources available for imports, investment and socioeconomic develop-ment.3 Third, large external debt and its servicing undermines the credibilityof domestic policies. It causes, for example, a deterioration in the relationsbetween African countries and creditors, hence reducing the amount oftrade financing that could be obtained. It also increases macroeconomicuncertainty, causing investors to exercise their option of waiting until theuncertainty is resolved or the returns are high enough to compensate forthe risk of investing. The outcome is that capital formation tends to bedominated by short-term investments in trading activities with quick returns

DELPHIN G. RWEGASIRA AND FRANCIS M. MWEGA264
rather than long-term physical investment (Elbadawi, Ndulu and Ndung’u,1997). Further, countries in the region have experienced problems meetingtheir external debt obligations, reflected in accumulating payment arrearsand debt reschedulings (table 1). By 1997, payment arrears on the principaland interest amounted to US$ 56.4 billion, while scheduled loans amountedto US$ 2.1 billion.
There is substantial evidence that a large external debt and its servicinghave a negative impact on investment and growth (Greene and Villanueva,1990; Elbadawi, Ndulu and Ndung’u, 1997; and Serven, 1997). Forexample, Fosu (1996), using data on a sample of 29 countries covering theperiod 1970–1986, found that annual economic growth declined by anaverage of 1.1 percentage points if a country was classified as highlyexternally indebted, via reduced productivity of investment. In a morerecent study, Fosu (1999) estimated that SSA’s economic growth rate wouldhave been 50 per cent higher without the net external debt burden.
B. Public domestic debt
Some SSA countries have also accumulated substantial publicdomestic debt (see table 2), although this is not as large as the externaldebt. Reasons for this accumulation include increasing budget deficits anda greater reliance on domestic financing to compensate for the shortfallcaused by the decline (cut-off) in the supply of foreign aid. In Kenya, forexample, real foreign aid flows in the late-1990s fell to below the levelsprevailing in the second half of the 1980s following suspension ofprogramme support in 1991–1993 and in 1997–1999 (O’Brien and Ryan,1999). In general, accumulation of domestic debt has reflected the size ofthe budget deficit (table 10) and the extent to which SSA countries havebeen able to borrow externally (table 11).4
Country experiences vary with respect to the evolution of the stockof domestic debt in the study period. As table 2 shows, some haveexperienced fairly systematic increases in domestic debt (e.g. the CFAeconomies of Cameroon and Côte d’Ivoire, which have been constrained

PUBLIC DEBT AND MACROECONOMIC MANAGEMENT IN SUB-SAHARAN AFRICA 265
in the use of the nominal exchange policy to restructure their economies);others have experienced a U-pattern of domestic debt accumulation sincethe mid-1980s (e.g. Ghana and Nigeria that reversed some of their structuraladjustment policies); and yet others have experienced an inverted U-patternof domestic debt accumulation (e.g. the on-off reformers in Kenya andZimbabwe). Some countries that have undertaken systematic reforms haveexperienced a fairly consistent reduction in the domestic debt burden (e.g.Malawi, Uganda, the United Republic of Tanzania and Zambia).
Cameroon’s domestic debt, for example, increased from 3.5 per centof GNP in 1985 to 38.3 per cent in 1995, while that of Côte d’Ivoireincreased from 2.0 per cent in 1986 to 17.2 per cent in 1998. Among SSAcountries with a U-pattern of domestic debt accumulation since the mid-1980s, Ghana’s domestic debt, for example, declined from 15.7 per centof GNP in 1985 to 3.0 per cent in 1991 before it increased again to 14.8 percent in 1998; that of Nigeria declined from 114.3 per cent in 1985 to 31.2 percent in 1992 before increasing to 63.8 per cent in 1998.
Among countries with an inverted U-pattern of domestic debtaccumulation, Kenya’s domestic debt rose from 12.0 per cent of GNP in1985 to a peak of 33.5 per cent in 1993 before declining to 20.4 per cent in1999; that of Zimbabwe increased from 27.3 per cent in 1985 to 33.3 percent in 1987 to 41.9 per cent in 1995 and then declined to 30.1 per cent in1997. A number of countries have substantially reduced their domesticdebt burden: Malawi’s domestic debt declined from 23.4 per cent of GNPin 1985 to 9.5 per cent in 1997, Tanzania’s declined from 18.3 per cent ofGNP in 1985 to 4.4 per cent in 1998, Uganda’s declined from 5.2 per centof GNP in 1985 to 1.7 per cent in 1998, and Zambia’s declined from 6.5 percent of GNP in 1985 to 0.4 per cent in 1997.
With domestic debt generally more expensive to acquire than externaldebt,5 the impact has been an increase in debt service payments in totalgovernment expenditures, thereby worsening the budget deficit. In Kenya’s1999/2000 budget, for example, funds allocated for servicing the domesticdebt (21.5 billion Kenya shillings) were more than double those allocatedfor servicing the external debt (9.5 billion Kenya shillings), even thoughthe stock of external debt was about three times the stock of domestic
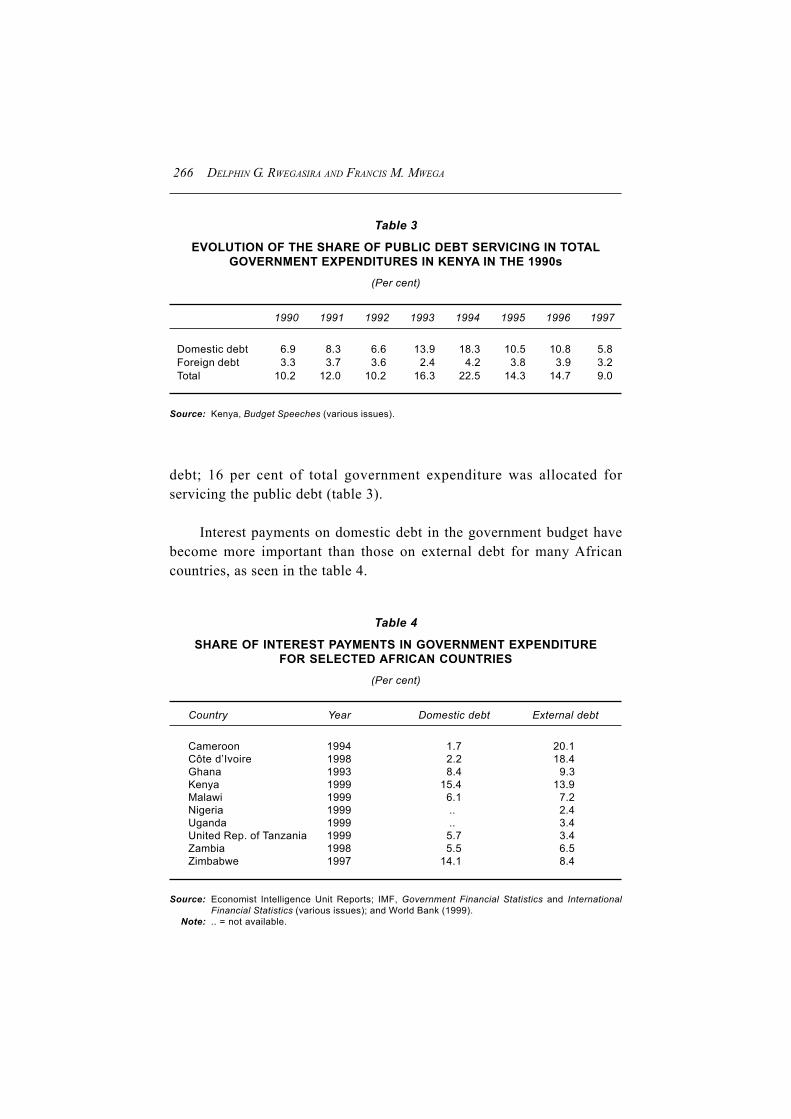
DELPHIN G. RWEGASIRA AND FRANCIS M. MWEGA266
debt; 16 per cent of total government expenditure was allocated forservicing the public debt (table 3).
Interest payments on domestic debt in the government budget havebecome more important than those on external debt for many Africancountries, as seen in the table 4.
Table 3
EVOLUTION OF THE SHARE OF PUBLIC DEBT SERVICING IN TOTALGOVERNMENT EXPENDITURES IN KENYA IN THE 1990s
(Per cent)
1990 1991 1992 1993 1994 1995 1996 1997
Domestic debt 6.9 8.3 6.6 13.9 18.3 10.5 10.8 5.8Foreign debt 3.3 3.7 3.6 2.4 4.2 3.8 3.9 3.2Total 10.2 12.0 10.2 16.3 22.5 14.3 14.7 9.0
Source: Kenya, Budget Speeches (various issues).
Table 4
SHARE OF INTEREST PAYMENTS IN GOVERNMENT EXPENDITUREFOR SELECTED AFRICAN COUNTRIES
(Per cent)
Country Year Domestic debt External debt
Cameroon 1994 1.7 20.1Côte d’Ivoire 1998 2.2 18.4Ghana 1993 8.4 9.3Kenya 1999 15.4 13.9Malawi 1999 6.1 7.2Nigeria 1999 .. 2.4Uganda 1999 .. 3.4United Rep. of Tanzania 1999 5.7 3.4Zambia 1998 5.5 6.5Zimbabwe 1997 14.1 8.4
Source: Economist Intelligence Unit Reports; IMF, Government Financial Statistics and InternationalFinancial Statistics (various issues); and World Bank (1999).
Note: .. = not available.

PUBLIC DEBT AND MACROECONOMIC MANAGEMENT IN SUB-SAHARAN AFRICA 267
III. THE LINKAGES BETWEEN EXTERNALAND DOMESTIC DEBT
There is a close linkage between accumulation of external debt anddomestic debt, as economic agents borrow to fill the private savings-investment gap, the fiscal gap and or the foreign-exchange gap. Theapplication of this gap-filling approach was most evident during the 1960sand 1970s, when governments were encouraged by donors to preparedevelopment plans that provided estimates of exogenous savings neededto achieve given rates of economic growth.
The external debt crisis in SSA is largely a fiscal problem; a majorcause of external debt accumulation is the large fiscal deficits incurred bythe public sector. An overwhelming proportion of these debts is owned bythe public sector, either directly or indirectly through public sectorguarantees. Public finances and external debt are closely linked, as foreignaid – the largest component of the SSA debt – has been growing fasterthan all other financial flows, to the extent that by 1985 it accounted for90 per cent of all net flows, and it has grown more rapidly than in otherparts of the world (Roe and Griggs, 1990). To the extent that many Africancountries draw on external grants and loans to finance their activities, mostof them have become dependent mainly on net official capital inflows. Inaddition, governments have either explicitly or implicitly guaranteed someof the loans of their private sectors, so that some part of the negative nettransfers associated with these loans have found their way into the totalfiscal or quasi-fiscal deficits.
Table 5 shows the composition of outstanding external debt: privatenon-guaranteed, public and publicly-guaranteed, and short-term. Much ofthe external debt in SSA (unlike Latin America) is public and publicly-guaranteed, with private non-guaranteed debt generally accounting for lessthan 5 per cent of the total debt during the period 1985–1999. The externaldebt is primarily owed to governments and multilateral organizations. Alarge proportion of the debt is therefore obtained from official sources –national governments or their agencies – and from multilateral agenciessuch as the World Bank and the IMF. Only a small proportion is obtained

DELPHIN G. RWEGASIRA AND FRANCIS M. MWEGA268
from private creditors, including the euro-dollar loans, suppliers’ creditand loans from private commercial banks.
Table 6 (last column) shows that on average the net flows from officialsources accounted for nearly 85 per cent of the aggregate net resourceflows between the mid-1980s and mid-1990s, although the share declinedfrom 90 per cent in 1985 to an average of 68 per cent over the period1996–1998. Table 6 also shows other terms of external borrowing. Theaverage grace period was 6 to 7 years, the average grant element was30–50 per cent, the average interest rate was 3–6 per cent (it generallydeclined during the period 1985–1997) and the average maturity periodwas 22–27 years. Sub-Saharan Africa is not an undifferentiated whole;terms of external borrowing vary significantly from country to country(tables 7 and 8). For example, Nigeria and Côte d’Ivoire have borrowedsubstantially from commercial sources so that their shares of concessionary
Table 5
COMPOSITION OF EXTERNAL DEBT IN SUB-SAHARAN AFRICA, 1985–1998(Per cent)
Private Public and Short-term debtYear non-guaranteed publicly-guaranteed outstanding
1985 5.35 76.92 17.721986 4.04 84.18 11.781987 3.41 86.95 9.641988 3.35 86.39 10.261989 3.29 85.76 10.941990 3.09 84.64 12.271991 3.05 84.55 12.411992 2.88 82.69 14.431993 2.70 81.65 15.651994 4.81 78.09 17.091995 4.44 77.39 18.171996 3.81 76.81 19.381997 3.68 77.00 19.331998 3.41 77.17 19.42
Source: World Bank (1999).
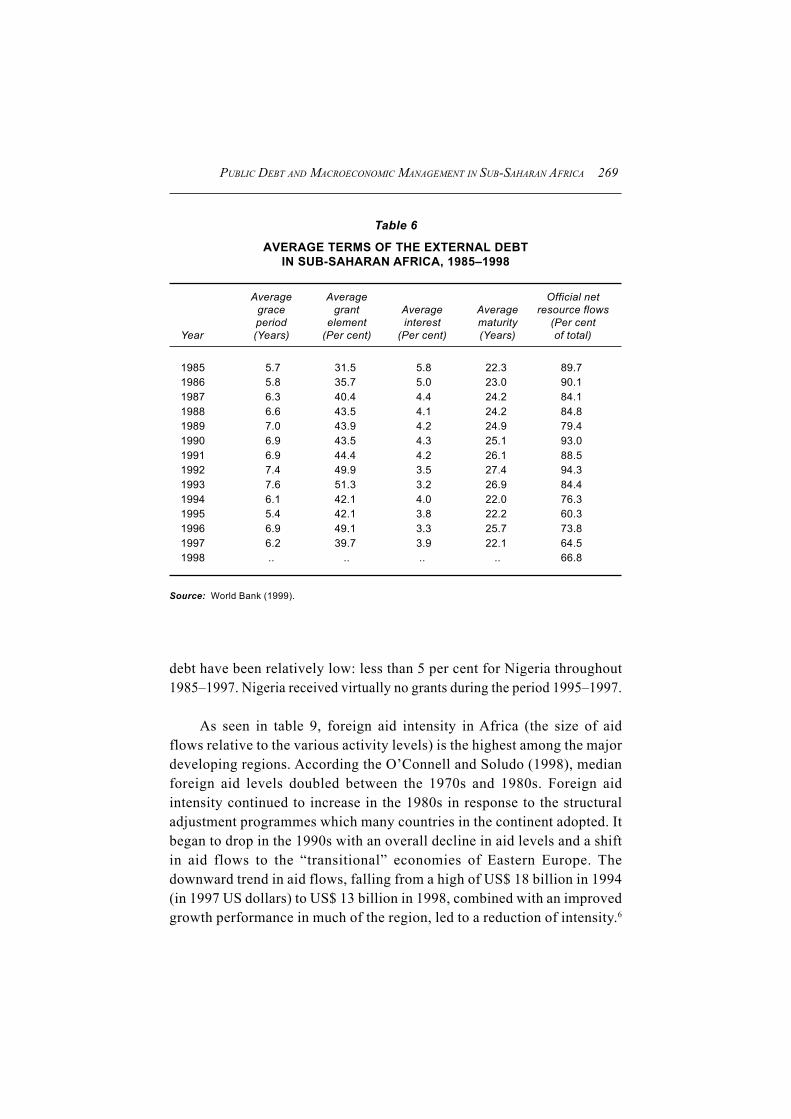
PUBLIC DEBT AND MACROECONOMIC MANAGEMENT IN SUB-SAHARAN AFRICA 269
debt have been relatively low: less than 5 per cent for Nigeria throughout1985–1997. Nigeria received virtually no grants during the period 1995–1997.
As seen in table 9, foreign aid intensity in Africa (the size of aidflows relative to the various activity levels) is the highest among the majordeveloping regions. According the O’Connell and Soludo (1998), medianforeign aid levels doubled between the 1970s and 1980s. Foreign aidintensity continued to increase in the 1980s in response to the structuraladjustment programmes which many countries in the continent adopted. Itbegan to drop in the 1990s with an overall decline in aid levels and a shiftin aid flows to the “transitional” economies of Eastern Europe. Thedownward trend in aid flows, falling from a high of US$ 18 billion in 1994(in 1997 US dollars) to US$ 13 billion in 1998, combined with an improvedgrowth performance in much of the region, led to a reduction of intensity.6
Table 6
AVERAGE TERMS OF THE EXTERNAL DEBTIN SUB-SAHARAN AFRICA, 1985–1998
Average Average Official netgrace grant Average Average resource flowsperiod element interest maturity (Per cent
Year (Years) (Per cent) (Per cent) (Years) of total)
1985 5.7 31.5 5.8 22.3 89.71986 5.8 35.7 5.0 23.0 90.11987 6.3 40.4 4.4 24.2 84.11988 6.6 43.5 4.1 24.2 84.81989 7.0 43.9 4.2 24.9 79.41990 6.9 43.5 4.3 25.1 93.01991 6.9 44.4 4.2 26.1 88.51992 7.4 49.9 3.5 27.4 94.31993 7.6 51.3 3.2 26.9 84.41994 6.1 42.1 4.0 22.0 76.31995 5.4 42.1 3.8 22.2 60.31996 6.9 49.1 3.3 25.7 73.81997 6.2 39.7 3.9 22.1 64.51998 .. .. .. .. 66.8
Source: World Bank (1999).

DELPHIN G. RWEGASIRA AND FRANCIS M. MWEGA270Ta
ble
7
CO
NC
ESSI
ON
AL
EXTE
RN
AL
DEB
T/TO
TAL
EXTE
RN
AL
DEB
T, 1
985–
1997
(Per
cen
t)
Côt
eU
nite
d R
epC
amer
oon
d’Iv
oire
Gha
naK
enya
Mal
awi
Nig
eria
Sen
egal
Uga
nda
of T
anza
nia
Zam
bia
Zim
babw
e
1985
34.0
7.0
41.1
30.2
47.9
1.9
37.5
38.5
38.1
26.6
15.7
1986
30.2
15.9
44.5
33.6
55.0
1.8
42.5
41.5
52.9
25.3
19.7
1987
29.6
16.5
49.0
32.5
59.0
1.5
47.1
44.3
49.7
26.3
25.0
1988
28.1
14.7
52.0
35.1
63.7
1.5
52.1
46.4
53.1
26.2
27.9
1989
29.5
14.6
53.8
33.8
65.2
1.5
52.9
52.9
54.2
23.6
28.2
1990
27.4
17.9
54.8
34.1
67.5
1.6
52.7
56.2
53.8
31.2
27.9
1991
27.0
18.7
54.5
36.7
73.7
2.9
54.5
58.5
54.5
36.6
27.7
1992
31.5
18.9
57.2
40.7
76.7
3.3
56.7
61.7
57.5
37.5
27.0
1993
33.2
19.4
59.3
43.7
82.2
3.6
55.5
70.3
59.0
41.2
28.4
1994
42.0
22.3
61.2
47.3
83.0
3.9
57.5
72.8
60.1
47.9
32.0
1995
43.9
24.2
63.6
52.5
84.6
4.0
58.3
77.5
59.8
50.2
30.1
1996
43.5
24.6
63.9
56.8
84.0
4.3
62.4
78.3
60.5
53.2
28.7
1997
42.5
28.9
66.5
57.5
88.2
4.6
65.2
79.5
70.9
56.2
28.2
Sour
ce:
Wor
ld B
ank
(199
9).

PUBLIC DEBT AND MACROECONOMIC MANAGEMENT IN SUB-SAHARAN AFRICA 271Ta
ble
8
AVE
RA
GE
TER
MS
OF
THE
EXTE
RN
AL
DEB
T: A
VER
AG
E G
RA
NT
ELEM
ENT,
198
5–19
97(P
er c
ent)
Côt
eU
nite
d R
ep.
Cam
eroo
nd’
Ivoi
reG
hana
Ken
yaM
alaw
iN
iger
iaS
eneg
alU
gand
aof
Tan
zani
aZa
mbi
aZi
mba
bwe
1985
14.9
2.0
54.8
24.0
70.5
6.9
34.7
49.0
32.2
62.1
32.2
1986
18.2
14.6
39.3
34.1
50.5
7.3
52.3
19.5
62.6
26.1
34.2
1987
24.7
22.8
59.2
38.2
71.8
7.5
53.1
42.8
57.1
50.9
28.2
1988
26.5
20.2
70.2
44.8
67.3
13.1
66.4
68.8
58.1
30.6
23.6
1989
19.7
19.1
54.8
52.6
73.2
20.2
68.8
46.3
51.6
21.9
19.1
1990
21.2
27.4
58.5
46.0
73.4
23.6
66.1
68.7
72.0
13.0
21.0
1991
25.5
31.5
57.7
44.2
60.6
27.8
49.2
63.3
74.5
76.0
21.7
1992
37.7
30.6
65.3
71.1
80.5
40.2
67.5
68.5
65.8
72.6
41.2
1993
36.2
38.5
54.5
63.6
70.5
48.4
65.9
67.0
67.1
74.6
52.4
1994
63.7
64.0
45.1
62.0
60.2
16.0
76.8
78.5
73.8
73.1
22.2
1995
58.7
63.7
55.6
39.0
78.2
0.0
76.0
80.4
48.3
70.8
35.4
1996
71.6
65.1
80.4
75.2
75.9
0.0
61.5
80.5
72.7
80.5
53.5
1997
81.5
65.8
54.9
81.0
81.3
0.0
75.6
82.8
79.0
64.2
29.1
Sour
ce:
Wor
ld B
ank
(199
9).

DELPHIN G. RWEGASIRA AND FRANCIS M. MWEGA272
In Kenya, for example, net official development assistance, excluding debtrelief, declined from a peak of US$ 1,053 million in 1990 to US$ 606 mil-lion in 1996 (O’Brien and Ryan, 1999).
Concessional borrowing or grants in SSA are used to finance pro-grammes for macroeconomic and sectoral reforms as well as technicalassistance, discrete investment projects, and external debt relief. In Kenya,for example, official development assistance for budgetary and balance-of-payments support was about US$ 960 million in 1990–1996; technicalassistance was about US$ 1,579.4 million (or 35.8 per cent of total grants);and debt relief was US$ 150 million (O’Brien and Ryan, 1999).
However, distinguishing programme from project aid is misleadingbecause foreign aid is “fungible” as it can be used to fund activities thatthe recipient government intended to finance in the absence of aid.Devarajan, Rajkumar and Swaroop (1998), based on a panel data of 18 SSAcountries for the period 1971–1995, found that foreign aid (excludingtechnical assistance) boosted government expenditure by nearly the sameamount as the foreign aid (90 per cent), of which about a third was used to
Table 9
AID INTENSITY IN DEVELOPING REGIONS(REGIONAL MEDIANS OF COUNTRY AVERAGES), 1990–1995
TechnicalNet ODA cooperation
Net ODA Net ODA as per cent as per centRegion or Real $ ODA as per cent as per cent government of governmentcountry per capita GNP importsa expenditures wages
Latin America 24.30 1.66 1.70 3.19 12.62South Asia 15.89 6.96 21.24 20.49 28.09HPAEb 4.10 0.22 0.23 1.70 5.68SSA 51.59 14.41 28.38 49.70 37.25
Source: O’Connell and Soludo (1998).Note: All Official Development Assistance (ODA) is net of interest payments. The data are drawn from
the World Bank and OECD and do not include private funding by non-governmental organizations(NGOs). However, government aid through NGOs is captured in these data.
a Excluding technical assistance.b High Performing Asian Economies.

PUBLIC DEBT AND MACROECONOMIC MANAGEMENT IN SUB-SAHARAN AFRICA 273
fund external debt repayments. The balance was divided equally betweenfunding new capital projects and current government expenditures. Nearlya third of the foreign aid flows were used, in effect, for external debtrepayments. Thus much of the debt involved a “ponzi” process, wherebygovernments sought new foreign aid mainly to service the existing stockof debt.7
In country case studies, Saasa and Mwanawina (1998) found thatforeign aid was highly fungible in Zambia except for the agriculture,education and transport sectors; a quarter of it was used to finance recurrentspending. Ssemogerere and Kalema (1998) found that a 1 per cent increasein ODA growth led to a 0.8 per cent increase in government spending,with aid becoming more fungible over time. They attribute this to anincrease in the share of programme aid in overall foreign aid flows and toan increase in the number of donors involved, making it difficult forindividual donors to monitor how their aid is spent.
Conceptually, the linkage between fiscal deficits and accumulationof external debt can be seen from the national accounts identity: (Sp-Ip) +(M-X) = (G+Ig-T), where Sp is private savings, Ip is private investment,M is imports, X is exports, G is government consumption expenditure, Igis government investment expenditure and T is tax revenue. According tothis identity, the private sector deficit (Ip-Sp) plus public sector deficit(G+Ip-T) is a reflection of the country’s current account deficit (M-X) inthe balance of payments. An increase in the fiscal deficit will therefore bereflected in: (i) an increase in the balance of payments’ current accountdeficit (this is postulated to be a one-for-one relationship under the so-called fiscal approach to the balance of payments, if the private sectorbalance is assumed to be small and stable); (ii) an increase in private savings(which may be a one-for-one relationship under Ricardo Equivalence);and/or (iii) a decrease in private investment. Which of the three componentsbear the burden of higher budget deficits depends on the flexibility andsophistication of the domestic financial markets, the source of domesticfinancing (money or bonds), the future expectations of economic agents,access to external finances and the composition of the deficit. Empiricalevidence suggests that fiscal deficits mainly spill over into the externalaccount deficit and also reduce private investment by raising real interest

DELPHIN G. RWEGASIRA AND FRANCIS M. MWEGA274
rates (Easterly and Schmidt-Hebbel, 1993). Some estimates suggest thatabout 75 per cent of any increase in the fiscal deficit feeds through into thecurrent external account, irrespective of the method of finance chosen(Balassa, 1988). Fiscal deficits result in increased external borrowing orthey force the private sector into increased borrowing, leading to anaccumulation of external debt over time.8
There is likely to be a two-way relationship between the fiscal andcurrent account deficits. Reduction in the availability of external financingwill force either a fiscal contraction or inflationary financing. Conversely,a government receiving external resources is likely to spend it, adjustingits budget accordingly. When external resources are spent on goods andservices within the country, they generate multiplier effects which have apositive impact on the fiscal balance. Large amounts of these external flowsare also likely to change economic behavior in ways that may lead to awidening of the fiscal gap to be filled. Large foreign aid inflows have forexample led many SSA governments to expand their activities withoutexpanding the domestic economy or their tax revenues.9
Table 10 shows the evolution of budget deficits/surpluses and table 11shows the proportion of foreign financing of budget deficits in selectedAfrican countries.10 Cameroon has maintained fairly modest fiscal deficits,which accounted for less than 3 per cent of GDP in 1985–1997 (except for1990–1991 when they were slightly more than 5 per cent of GDP) with thebudget deficits in the early 1990s mainly financed from foreign sources.The Government of Cameroon has been praised for having bought foreignassets with its oil revenues to smooth its investment over time and to avoidDutch disease, although some observers postulate that such resources wouldhave earned higher returns if invested domestically (Azam, 1997).
Côte d’Ivoire, which was regarded as exemplary for adjustmentperformance, with most performance indicators being met (Azam, 1997),had a low budget deficit during the period 1985–1987. The adjustment,however, was achieved by a reduction in public investment, and wasfollowed by a commodity crash in 1987 that reflected a sharp decline inthe terms of trade, and it was further compounded by a decision not to sellthe 1988 cocoa crop. This was followed by multi-party elections in 1990
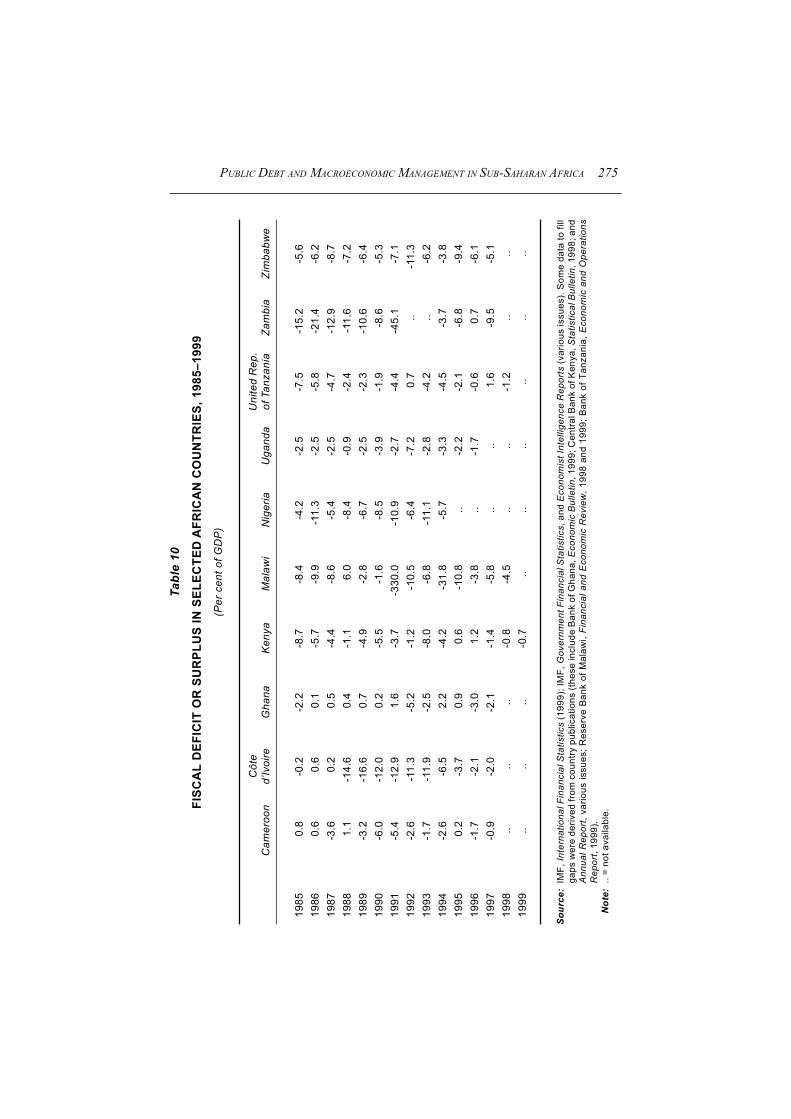
PUBLIC DEBT AND MACROECONOMIC MANAGEMENT IN SUB-SAHARAN AFRICA 275Ta
ble
10
FISC
AL
DEF
ICIT
OR
SU
RPL
US
IN S
ELEC
TED
AFR
ICA
N C
OU
NTR
IES,
198
5–19
99(P
er c
ent o
f GD
P)
Côt
eU
nite
d R
ep.
Cam
eroo
nd’
Ivoi
reG
hana
Ken
yaM
alaw
iN
iger
iaU
gand
aof
Tan
zani
aZa
mbi
aZi
mba
bwe
1985
0.8
-0.2
-2.2
-8.7
-8.4
-4.2
-2.5
-7.5
-15.
2-5
.619
860.
60.
60.
1-5
.7-9
.9-1
1.3
-2.5
-5.8
-21.
4-6
.219
87-3
.60.
20.
5-4
.4-8
.6-5
.4-2
.5-4
.7-1
2.9
-8.7
1988
1.1
-14.
60.
4-1
.16.
0-8
.4-0
.9-2
.4-1
1.6
-7.2
1989
-3.2
-16.
60.
7-4
.9-2
.8-6
.7-2
.5-2
.3-1
0.6
-6.4
1990
-6.0
-12.
00.
2-5
.5-1
.6-8
.5-3
.9-1
.9-8
.6-5
.319
91-5
.4-1
2.9
1.6
-3.7
-330
.0-1
0.9
-2.7
-4.4
-45.
1-7
.119
92-2
.6-1
1.3
-5.2
-1.2
-10.
5-6
.4-7
.20.
7..
-11.
319
93-1
.7-1
1.9
-2.5
-8.0
-6.8
-11.
1-2
.8-4
.2 ..
-6.2
1994
-2.6
-6.5
2.2
-4.2
-31.
8-5
.7-3
.3-4
.5-3
.7-3
.819
950.
2-3
.70.
90.
6-1
0.8
..-2
.2-2
.1-6
.8-9
.419
96-1
.7-2
.1-3
.01.
2-3
.8..
-1.7
-0.6
0.7
-6.1
1997
-0.9
-2.0
-2.1
-1.4
-5.8
....
1.6
-9.5
-5.1
1998
....
..-0
.8-4
.5..
..-1
.2..
..19
99..
....
-0.7
....
....
....
Sour
ce:
IMF,
Inte
rnat
iona
l Fin
anci
al S
tatis
tics
(199
9); I
MF,
Gov
ernm
ent F
inan
cial
Sta
tistic
s, a
nd E
cono
mis
t Int
ellig
ence
Rep
orts
(var
ious
issu
es).
Som
e da
ta to
fill
gaps
wer
e de
rived
from
cou
ntry
pub
licat
ions
(the
se in
clud
e B
ank
of G
hana
, Eco
nom
ic B
ulle
tin, 1
999;
Cen
tral B
ank
of K
enya
, Sta
tistic
al B
ulle
tin, 1
998;
and
Ann
ual R
epor
t, va
rious
issu
es; R
eser
ve B
ank
of M
alaw
i, Fi
nanc
ial a
nd E
cono
mic
Rev
iew
, 199
8 an
d 19
99; B
ank
of T
anza
nia,
Eco
nom
ic a
nd O
pera
tions
Rep
ort,
1999
).N
ote:
.. =
not a
vaila
ble.

DELPHIN G. RWEGASIRA AND FRANCIS M. MWEGA276Ta
ble
11
FOR
EIG
N F
INA
NC
ING
AS
A PR
OPO
RTI
ON
OF
BU
DG
ET D
EFIC
ITS
IN S
ELEC
TED
AFR
ICA
N C
OU
NTR
IES,
198
5–19
99(P
er c
ent)
Côt
eU
nite
d R
ep.
Cam
eroo
nd’
Ivoi
reG
hana
Ken
yaM
alaw
iN
iger
iaU
gand
aof
Tan
zani
aZa
mbi
aZi
mba
bwe
1985
....
46.5
-25.
641
.834
.421
.45.
070
.195
.219
86..
....
-29.
712
2.9
8.6
28.9
0.1
85.1
40.7
1987
46.5
....
-31.
669
.314
.124
.520
.174
.421
.719
88..
52.1
..-1
0.1
171.
615
.710
.112
2.9
34.9
17.5
1989
86.8
63.3
..17
.064
.937
.865
.6-4
4.2
55.6
11.6
1990
88.7
95.8
..48
.729
3.7
7.1
147.
319
.412
.217
.719
9180
.784
.5..
33.8
109.
10.
810
4.8
37.4
48.8
28.7
1992
131.
586
.70.
232
.545
.730
.053
3.0
..0.
265
.819
9311
1.7
63.0
53.3
35.0
95.6
15.7
176.
938
.867
.151
.619
9412
2.0
156.
6..
-53.
928
.911
.914
3.2
61.2
267.
717
.119
95..
113.
2..
..27
.984
.116
0.9
4.6
356.
717
.119
9617
.614
1.8
58.3
..10
3.6
..18
5.5
-164
.119
4.8
22.8
1997
33.3
50.0
144.
6-7
6.0
52.2
267.
719
2.5
63.6
158.
1-1
.819
98..
418.
435
.9-1
35.8
58.4
124.
516
1.6
94.6
84.8
2.2
1999
..1
047.
322
.811
2.5
....
....
..-5
4.5
Sour
ce:
IMF,
Inte
rnat
iona
l Fin
anci
al S
tatis
tics
(199
9), I
MF,
Gov
ernm
ent F
inan
cial
Sta
tistic
s an
d E
cono
mis
t Int
ellig
ence
Rep
orts
(var
ious
issu
es).
To fi
ll ga
ps s
ome
data
wer
e de
rived
from
cou
ntry
pub
licat
ions
(the
se in
clud
e B
ank
of G
hana
, Eco
nom
ic B
ulle
tin, 1
999;
Cen
tral B
ank
of K
enya
, Sta
tistic
al B
ulle
tin, 1
998;
and
Ann
ual R
epor
t, va
rious
issu
es; R
eser
ve B
ank
of M
alaw
i, Fi
nanc
ial a
nd E
cono
mic
Rev
iew
, 199
8 an
d 19
99; a
nd B
ank
of T
anza
nia,
Eco
nom
ic a
nd O
pera
tions
Rep
ort,
1999
).N
ote:
.. =
not a
vaila
ble
or th
e co
untry
had
a b
udge
t sur
plus
that
yea
r. N
egat
ive
figur
es o
ccur
, for
exa
mpl
e, w
here
a b
udge
t def
icit
(sur
plus
) is
acco
mpa
nied
by
nega
tive
(pos
itive
) ext
erna
l fin
anci
ng. F
igur
es o
f mor
e th
an 1
00 p
er c
ent o
ccur
whe
n th
e ex
tern
al fi
nanc
ing
exce
eds
the
size
of t
he b
udge
t def
icit.
PUBLIC DEBT AND MACROECONOMIC MANAGEMENT IN SUB-SAHARAN AFRICA 277
and the suspension of World Bank disbursements in 1993, all resulting inlarge budget deficits between 1988 and 1993. A more effective stabilizationwas achieved during the period 1994–1997, following the January 1994devaluation along with other measures such as debt relief and the adop-tion of new structural adjustment agreements with the Bretton Woodsinstitutions.
Compared with the other SSA countries, Ghana’s fiscal performancehas been exemplary, with budget surpluses during most of the period understudy. The adjustment programmes begun in 1983 relied mainly on externalfinances, much of this provided in grant form. Omitting interestexpenditures, the so-called primary budget balance was in surplus fromthe mid-1980s, averaging about 2.4 per cent of GDP. This situation,however, may be misleading as suggested by the occurrence of high andunstable inflation rates (which declined to 10 per cent in 1992 and increasedto about 70 per cent in 1995), persistent current account deficits (whichincreased to a peak of 12 per cent of GDP in 1993), nominal exchange ratedepreciation and accumulation of public debt (Amoako-Tuffour, 1999). Astudy by Amoako-Tuffour found that the conventional budget balance inGhana understated the broad deficit, on average by about 4 per cent ofGDP between 1983 and 1995, by including programme grants and divesturereceipts as regular government revenue. This obscured the reality, thatprimary expenditures needed for basic government functions had becomeunsustainable by conventional tax revenues since 1992.
After macroeconomic stabilization in 1982–1984 following a militarycoup attempt, Kenya’s fiscal management weakened in the second half ofthe 1980s and the early 1990s, with the fiscal deficit averaging about 5 percent of GDP, but the deficit declined to an average of about 1.2 per cent in1995–1998. Uganda and the United Republic of Tanzania experienced fairlymodest deficits since the beginning of their economic reform programmesafter the mid-1980s, with fiscal deficits generally less than 5 per cent ofGDP in the period 1987–1998. Zambia experienced generally higher budgetdeficits (of more that 10 per cent of GDP in the late 1980s and early 1990s)which declined in the second half of the 1990s. In Zimbabwe, deficitsfluctuated between 5 and11 per cent of GDP throughout the period understudy.11

DELPHIN G. RWEGASIRA AND FRANCIS M. MWEGA278Ta
ble
12
CU
RR
ENT
AC
CO
UN
T D
EFIC
IT O
R S
UR
PLU
S IN
SEL
ECTE
D A
FRIC
AN
CO
UN
TRIE
S, 1
985–
1997
(Per
cen
t of G
DP
)
Côt
eU
nite
d R
ep.
Cam
eroo
nd’
Ivoi
reG
hana
Ken
yaM
alaw
iN
iger
iaU
gand
aof
Tan
zani
aZa
mbi
aZi
mba
bwe
1985
-3.9
90.
97-2
.97
-1.8
8-1
1.17
9.16
-2.5
3..
-17.
55-1
.14
1986
-3.2
6-3
.25
-1.4
9-0
.62
-7.1
91.
040.
00..
-20.
890.
2719
87-7
.59
-9.6
0-1
.93
-6.3
0-5
.22
-0.3
1-2
.24
..-1
0.84
0.86
1988
-3.4
7-1
2.08
-1.2
9-5
.53
-6.5
1-1
.30
-4.5
3-7
.02
-7.8
71.
6019
89-0
.35
-9.9
0-1
.79
-7.0
8-3
.37
4.57
-6.8
7-7
.02
-5.4
70.
2019
90-2
.03
-11.
25-3
.79
-6.1
8-4
.78
17.5
2-9
.97
-13.
24-1
8.08
-1.5
919
91-0
.13
-10.
24-3
.82
-2.6
5-1
0.33
4.40
-13.
52-1
5.53
-9.0
5-5
.29
1992
-1.7
6-9
.08
-5.8
8-2
.27
-15.
836.
93-1
1.81
-14.
57..
-8.9
419
93-5
.21
-8.5
7-9
.38
1.24
-8.0
0-3
.65
-11.
82-1
9.66
..-1
.76
1994
-4.1
7-0
.17
-4.6
81.
37-3
8.32
-8.9
9-6
.62
-15.
13..
-6.1
719
95-0
.79
-4.9
3-2
.24
-4.4
2..
-9.1
7-7
.73
-12.
75..
..19
96-2
.39
-0.6
3-4
.67
-0.8
0..
9.93
-8.1
7-7
.05
....
1997
-1.3
20.
34..
-3.6
8..
1.38
-7.9
1-7
.87
....
Sour
ce:
Wor
ld B
ank,
Wor
ld D
evel
opm
ent I
ndic
ator
s (v
ario
us).
Not
e:..
= no
t ava
ilabl
e.

PUBLIC DEBT AND MACROECONOMIC MANAGEMENT IN SUB-SAHARAN AFRICA 279
There is a large body of empirical literature on the causes of externaldebt accumulation. For example, Ajayi (1991) and Mbire and Atingi (1997)found terms of trade, the effective real exchange rate and the fiscal positionof the governments significantly correlated with the evolution of theexternal debt-GNP ratios in Nigeria and Uganda. They found fiscalperformance to be one of the most important determinants (based on betacoefficients) of external indebtedness, along with changes in the realeffective exchange rate and terms of trade. Other factors postulated as beingimportant by empirical studies include overlending by banks, high foreigninterest rates and a decline in world demand (Greene and Khan, 1990).
Table 12 shows the evolution of current account deficits. The paneldata in tables 10 and 12 show a strong statistical correlation between budgetdeficits and current account deficits, with a significant causality from theformer to the latter.12
IV. FINANCING BUDGET DEFICITS
Reducing a budget deficit calls for restriction on government ex-penditure and an increase in tax revenue. To contain the growth ingovernment expenditure, the government needs to identify high-priorityprojects for funding and implementation, postpone or cancel low-priorityprojects, and ensure that recurrent resources are available in the future tooperate and maintain completed priority projects and generally to improvethe utilization of completed facilities. New projects should be funded onlyif they pass stringent tests of high productivity and cost effectiveness.
The budget deficit can also be reduced through an increase ingovernment tax revenue and appropriations-in-aid.13 Tax revenue can beincreased by improving the tax administration and reforming the taxstructure. Non-tax revenue can be boosted by the policy of “cost-sharing”:the charging of fees for the services provided by the public sector, notablyin education and health. Since the 1980s, many African countries haveundertaken tax modernization programmes to broaden the governmentrevenue base and to increase the elasticity of the tax system. This has

DELPHIN G. RWEGASIRA AND FRANCIS M. MWEGA280
entailed changes in tax rates, tax bands and coverage of taxation, as wellas the revamping of the major collection departments, especially throughthe setting up of independent tax authorities.
Expansionary fiscal policy, which is not accompanied by a reductionin resources used by the private sector, affects output, prices and the balanceof payments. The extent to which these variables are affected depends onthe conditions in the country as well as the way the deficit is financed.There are three main ways of financing a fiscal deficit (Roe and Griggs1990): (i) through money creation (“inflationary” financing); (ii) throughsales of government securities; and (iii) through external borrowing.Financing from these three sources is combined to derive a “financiabledeficit” compatible with the targets for inflation, output growth andsustainable internal and external debts (Wijnbergen, 1989).
The government may also finance a budget deficit through proceedsfrom the sale of assets, such as foreign exchange reserves and privatizationproceeds. It might also flexibly borrow by building up arrears throughdeferred payment to its employees and the private sector and parastatalsfor goods and services provided. This delayed payment of outstandingobligations, either to employees or to suppliers of goods and services, maybe an important source of government financing. In Kenya, for example,pending bills (arrears) increased from an estimated 3.0 per cent to anestimated 4.6 per cent of the stock of domestic debt between 1990 and1998 (O’Brien and Ryan, 1999). In Ghana, unpaid bills to suppliers ofgoods and services amounted to about 4.6 per cent of total expenditures in1995 (Amoako-Tuffour, 1999). Building payment arrears imposes animplicit tax as interest is not paid on outstanding balances. However,government delinquency on bills sets a bad example, undermining respectfor the law of contract; it may also lead to economic agents not making thepayments required of them, such as payment of tax obligations, with adverseeffects on revenue collection (Roe and Griggs, 1990). Moreover, suppliersmay bid up prices knowing that delays will take place, which in turn couldincrease the budget deficit. Parastatals may also incur deficits that aresupported by the budget, thus increasing inflationary pressures.

PUBLIC DEBT AND MACROECONOMIC MANAGEMENT IN SUB-SAHARAN AFRICA 281
V. THE LIMITATIONS AND TRADE-OFFS OF THE VARIOUSFISCAL DEFICIT FINANCING METHODS
A. Inflationary financing versus other domestic borrowing
Another means of financing is through the government borrowing fromthe central bank to finance a budget deficit, which directly increases moneysupply. Furthermore, the central bank could extend credit to parastatals atconcessionary rates, which also increases money supply indirectly.Financing through monetary expansion creates excess liquidity in the handsof the public, increasing the demand for goods and services as well asassets. The extent to which the government can use seignorage (a claim onreal resources from financing a budget deficit by printing money) thereforedepends on the level and evolution of the demand for high-powered money.If the supply of money exceeds demand, this will lead to an increase inprices or to a deterioration in the balance of payments. If the exchangerate is allowed to vary, this will also lead to its depreciation. The inflationthus generated in turn reduces the demand for money, resulting in aninverted-U “Laffer curve” in the relationship between the seignorage taxrevenue and the inflation rate.
There are clear limits to “inflationary finance”. Empirical evidencestrongly suggests that monetary financing of a budget deficit will accelerateinflation (Easterly and Schmidt-Hebbel, 1993). Excessive use of theinflation tax therefore reduces the demand for high-powered money onwhich that tax is based. At low rates of money supply growth, seignoragewill increase as the impact on inflation will be small. This is because theeconomy initially adjusts only slowly to monetary growth due to inertiaand the differing expectations among economic agents on how the fiscaldeficit will be financed. As monetary growth is accelerated, seignoragerevenue reaches its optimal level and then declines (Roe and Griggs, 1990).First, high inflation rates (20–30 per cent) are accompanied by increasedvolatility, discouraging investment and economic growth, and hencereducing the demand for money. Second, the Olivera-Tanzi effect may comeinto play, widening the budget deficit, and hence accentuating the in-flationary process by reducing the conventional tax revenues due to lags

DELPHIN G. RWEGASIRA AND FRANCIS M. MWEGA282
in tax collection, with expenditures more responsive to inflation than taxrevenues. Third, inflation has an adverse effect on the distribution ofincome, which may retard growth. Fourth, governments, until recently,have repressed their financial systems (through such measures as taxesand controls on interest rates, credit ceilings and directed credit pro-grammes), which has reduced the demand for money and has thus limitedthe amount of seignorage revenue that can be generated.
There have been a few estimates of seignorage revenue in SSAcountries. Adam, Ndulu and Sowa (1996) estimated average seignoragerevenues of 0.4 per cent of GDP in 1986–1990 and -0.2 per cent of GDP in1991–1993 for Kenya; 0.6 per cent and 0.4 per cent respectively, for theUnited Republic of Tanzania; and 0.3 per cent and 0.8 per cent respectively,for Ghana. Adam (1992) estimated the seignorage-maximizing rate ofinflation of 13.5 per cent for Kenya over the same period.14, 15 If governmentsare severely limited in the size of the deficits that they can finance usingthe inflationary method, the question arises as to whether non-inflationarydomestic borrowing offers an alternative to this method.
Domestic borrowing mainly occurs through the sale of securities tothe public. The extent to which this mechanism is utilized depends on thesize and sophistication of the country’s capital market and the interest ratepolicy being followed. The small capital and money markets in many SSAcountries (with a few exceptions such as Côte d’Ivoire, Kenya, Nigeriaand Zimbabwe) implies that only limited deficits can be financed in thisway. Due to the high interest rates required to place domestic debt,liberalizing the financial system in the presence of large budget deficitswill increase the stock of domestic debt, especially when economic growthis sluggish. As a consequence, the share of interest payments in governmentexpenditure will increase, with the deficit feeding itself. Therefore financialliberalization needs to be accompanied by a reduction in budget deficits.
Financing the fiscal deficit excessively through borrowing from thedomestic financial sector may also adversely affect the balance of paymentsif this undermines the credibility of domestic financial assets because ofincreased risk of government default, leading to a substitution fromdomestic to foreign bonds (Tanzi and Blejer, 1984). Moreover, expectations

PUBLIC DEBT AND MACROECONOMIC MANAGEMENT IN SUB-SAHARAN AFRICA 283
of exchange rate depreciation may lead to capital flight, worsening boththe capital and current accounts. This need not occur if domestic interestrates increase to restore portfolio equilibrium, although this may reduceinvestment and growth. If government bonds are treated as net wealth, alarger budget deficit will increase consumption and imports and worsenthe balance of payments. The demand for foreign bonds may also increase,worsening the capital account.
For a given budget deficit, a shift from central-bank financing of publicdeficits to financing through private markets entails, to a large extent, ashift from a high inflation regime to a high real interest rates regime.Whether this shift would bring about greater fiscal discipline and bettermonetary control depends on the political economy of the two outcomes.Since the losers from inflation (general public) are likely to be less vocaland politically weaker than the losers from high real interest rates(borrowers and their lobby groups), the shift may bring about greater fiscaldiscipline and better monetary control, reflected in lower fiscal deficits.
Many SSA governments have used compulsory mechanisms in orderto facilitate domestic borrowing. To the extent that these mechanismsinvolve interest rates below market levels, they entail a tax on the holdersof the debt instruments, particularly the financial system, causing financialrepression. These compulsory mechanisms may take various forms (Roeand Griggs, 1990) such as cash reserve requirements with zero or very lowinterest rates paid on these reserves (which is an important instrument of acountry’s monetary policy), application of ceilings on growth of credit byfinancial institutions, and purchase of government securities by captiveinstitutions at market or controlled interest rates. The captive institutions,such as national social security funds, are required by law to buygovernment securities, and, to the extent that interest rates are below marketrates, this constitutes a tax on them. These institutions, however, may incurdeficits that are financed by the State, which amounts to receiving a subsidy.
Consider the use of cash reserve requirements to reduce the inflationaryeffects of borrowing from the central bank. Based on the standard moneymultiplier model, an increase in the required reserves ratio reduces theability of financial institutions to create credit, and hence reduces the

DELPHIN G. RWEGASIRA AND FRANCIS M. MWEGA284
inflationary effects of a given government borrowing from the central bank.Reserve requirements, however, are in effect a tax on financial institutionsand cause financial repression. An increase in the required reserves ratioincreases the excess reserves held by financial institutions. It thus requireshigher lending-deposit margins to compensate for reduced profitability,and hence a reduction in the tax base for inflation tax (Roe and Griggs, 1990).
Initially, an increase in the required reserves ratio will enable a givenbudget deficit to be financed using less money creation. However, as thecash reserve ratio is increased, the lending-deposit rates which financialinstitutions need in order to achieve a given profit margin also rise. Thiscauses the public to reduce its demand for loans in response to the highercosts, and to reduce its supply of deposits. Beyond some level, furtherincreases in the required reserves ratio are self-defeating as far as effortsto raise seignorage revenue is concerned. Beyond this level inflation risesfor a given budget deficit, thus limiting the amount of funds that canmobilized.
Financial repression will worsen this trade-off. Control on interestrates on lending results in a reduction in deposit rates or an increase inexcess reserves, thereby reducing the base for monetary creation. Accessto foreign financing by the government will also lower the U-relationshipbetween the inflation rate and the required reserves ratio, as there is now alower residual deficit to be financed. However, increased access to externalfinancing by the private sector may shift the trade-off relationship upwardsas it further reduces the demand for domestic loans. This would also reducethe supply for deposits (and demand for money) and hence result in higherinflation for a given budget deficit.
B. Inflationary financing versus external borrowing
Direct borrowing from abroad to finance a budget deficit, if fullymonetized, will have a similar effect as a central-bank-financed budget.However, foreign borrowing permits imports of goods and services toincrease. Hence such borrowing is likely to be less inflationary if used by

PUBLIC DEBT AND MACROECONOMIC MANAGEMENT IN SUB-SAHARAN AFRICA 285
the government to purchase tradable goods or for direct imports. Externalborrowing, however, may be for the purpose of increasing foreign exchangereserves and strengthening domestic confidence. The government may alsoborrow on behalf of the private sector because it can obtain better accessand better terms (hence this borrowing is similar to the acquisition of tradeand suppliers’ credit). In any case, the accumulation of external debt islikely to cause the foreign savings supply function to shift upwards,reducing the availability of funds and worsening the terms of externalborrowing (Roe and Griggs, 1990).16
The trade-off between inflationary financing versus external borrowingcan be seen from the national income identity discussed above. For a givenfiscal deficit, a reduction of borrowing would mean a reduced currentaccount deficit, implying increased dependence on inflationary tax forachieving equilibrium. Conversely, a lower reliance on inflation tax impliesa greater reliance on external borrowing to finance a given fiscal deficit.Thus, for a given budget deficit, there is a conflict between reducinginflation and improving the balance of payments current account deficit.It is therefore imperative to reduce the budget deficit if the two are to beachieved in an adjustment programme. To replace the inflation tax, it isnecessary to increase tax revenues, reduce expenditures or increase externalborrowing. This implies acceptance of a higher balance-of-payments currentaccount deficit. The size of this trade-off is an issue for further research.
C. External borrowing versus domestic borrowing
Many African countries finance payments of their external debt byissuing much more expensive domestic debt, through, for example, debtswaps whereby domestic debts are sold to retire an equivalent amount ofexternal debt. This substitution of one debt instrument with another hasbudgetary implications. If the domestic interest rates are higher than theaverage cost of external debt, increasing the interest rate burden worsensthe budgetary situation, hence calling for a fiscal adjustment or inflationaryfinancing. This substitution need not be a straight asset swap; it can occuras a result of policies that improve the private or government savings-

DELPHIN G. RWEGASIRA AND FRANCIS M. MWEGA286
investment balance. Improving the private sector balance requires anincrease in real interest rates, but increasing the cost of servicing domesticdebt may be bad for the budget deficit. As mentioned above, such asubstitution therefore requires a fiscal adjustment, but this may be biggerthan for a straight asset swap (Wijnbergen, 1989).
VI. IMPLICATIONS OF PUBLIC DEBT FOR MACROECONOMICMANAGEMENT AND MONETARY POLICY IN AFRICA17
Here we discuss the problems that government debt causes formacroeconomic management, including exchange-rate and interest-ratepolicies. We also discuss the feedback effects of exchange rate depreciationand financial liberalization on fiscal deficits, and hence on public debt.While fiscal deficits make it difficult to implement appropriate policies inthese directions, failures in the same areas may adversely affect the size ofthe budget deficit that needs to be financed. We also look at the implicationsfor public debt management from opening up the capital account and theimpact of the large public debt on the economy’s vulnerability to externalshocks.
A. Exchange-rate policy
The exchange rate in SSA has increasingly become an important toolfor economic management and stabilization. Non-CFA countries haveliberalized their exchange rate regimes and have typically moved from afixed exchange rate regime to a crawling peg/floating rate regime, resultingin a more depreciated real effective exchange rate (table 13). In most ofthe countries that have opted for the floating rate regime, however, thefloat has been supplemented by interventions in the market to smooth outadverse exchange rate movements. During the period 1967–1980, forexample, the United Republic of Tanzania adhered closely to maintaininga stable nominal exchange rate (Ndulu and Kimei, 1996). With the adventof stabilization programmes in 1981–1986, the government focused on

PUBLIC DEBT AND MACROECONOMIC MANAGEMENT IN SUB-SAHARAN AFRICA 287Ta
ble
13
REA
L EF
FEC
TIVE
EXC
HA
NG
E R
ATES
IN S
ELEC
TED
AFR
ICA
N C
OU
NTR
IES,
a 198
5–19
99
Côt
eU
nite
d R
ep.
Cam
eroo
n d’
Ivoi
re
Gha
na
Ken
ya
Mal
awi
Nig
eria
U
gand
a of
Tan
zani
a Za
mbi
a Zi
mba
bwe
1985
130.
710
8.3
342.
812
9.1
177.
856
8.7
177.
550
1.9
125.
116
4.2
1986
144.
713
0.2
197.
011
3.0
159.
631
0.5
186.
534
7.4
61.3
151.
219
8716
1.9
144.
615
1.6
104.
514
8.2
99.0
238.
017
0.9
66.9
144.
119
8815
7.8
147.
914
5.7
99.3
158.
099
.521
7.0
134.
010
1.5
133.
619
8914
5.5
139.
613
6.8
97.7
167.
188
.618
3.1
117.
312
9.3
126.
819
9014
9.6
141.
313
6.1
90.1
165.
882
.211
2.4
90.1
106.
811
1.0
1991
143.
113
6.3
139.
288
.217
1.7
70.0
82.9
96.4
99.8
92.7
1992
144.
314
2.4
123.
092
.615
8.1
58.0
76.9
82.2
95.7
83.5
1993
134.
514
0.4
108.
080
.016
1.4
63.6
82.2
78.1
108.
688
.419
9486
.686
.586
.910
0.5
114.
611
8.0
102.
291
.610
4.5
83.7
1995
100.
010
0.0
100.
010
0.0
100.
010
0.0
100.
010
0.0
100.
010
0.0
1996
101.
510
0.5
109.
097
.913
7.6
123.
799
.797
.910
4.6
92.7
1997
96.9
98.9
115.
688
.015
2.9
142.
010
7.0
88.0
125.
391
.719
9810
2.2
105.
512
5.1
..11
1.2
155.
794
.6..
114.
5..
1999
109.
910
3.5
125.
9..
110.
482
.088
.1..
112.
0..
Sour
ce:
IMF,
Inte
rnat
iona
l Fin
anci
al S
tatis
tics;
Wor
ld B
ank,
Afri
can
Dev
elop
men
t Ind
icat
ors
(var
ious
issu
es).
aA
n in
crea
se in
the
real
effe
ctiv
e ex
chan
ge ra
te in
dex
deno
tes
a re
al a
ppre
ciat
ion.
It is
def
ined
as
a no
min
al e
ffect
ive
exch
ange
rate
inde
x ad
just
ed fo
r rel
ativ
em
ovem
ents
in n
atio
nal p
rice
or c
ost i
ndic
ator
s of
the
hom
e co
untry
and
sel
ecte
d co
untri
es. T
he n
omin
al e
ffect
ive
exch
ange
rate
inde
x, o
n th
e ot
her h
and,
repr
esen
ts th
e ra
tio o
f an
inde
x of
the
perio
d av
erag
e ex
chan
ge ra
te o
f the
cur
renc
y in
que
stio
n to
a w
eigh
ted
aver
age
of e
xcha
nge
rate
s fo
r the
cur
renc
yof
sel
ecte
d co
untri
es.

DELPHIN G. RWEGASIRA AND FRANCIS M. MWEGA288
correcting the accumulated misalignment of the real exchange rate. Since1993, the exchange rate has been determined by the market, with theunification of the various sections of the foreign exchange market.
For the countries of the Communauté financière africaine (CFA),which use a common currency guaranteed by the French Treasury, theexchange rate was fixed at 50 CFA francs = 1 French franc from 1948 to1994 when there was a 100 per cent devaluation of the CFA franc. Beforethe 1980s, the CFA franc zone member countries performed well (M’Bet,1996). With limited exchange controls, the zone experienced low inflationand large net inflows of capital. However, from the early 1980s up to thedevaluation of 1994 the region’s performance deteriorated as the realexchange rate appreciated in the context of deteriorating terms of tradeand other shocks leading to a loss in competitiveness (see table 13).
Policy makers can potentially manage the exchange rate to achievetwo different objectives. First, the exchange rate can be directed at achievinga real target, such as maintaining external competitiveness. Second, it canbe used domestically as a nominal anchor to contain inflation at low levels.These two objectives present a policy dilemma in terms of how a countrycan maintain a competitive exchange rate and at the same time avoid ahigh rate of inflation. Nominal devaluation, for example, is an effectiveinstrument for correcting real exchange misalignment but it may adverselyaffect the inflation rate.
Large fiscal deficits undermine these two objectives and fiscal rulesin the CFA zone have not prevented the countries from generating fiscaldeficits. Budget deficits lead to increased inflation, which is compoundedby exchange rate liberalization. Further, exchange rate liberalizationchanges the inflation profile, leading to higher inflation as the economyloses a nominal anchor to tie down prices. Mwega and Ndung’u (1996),for example, show that moving from a fixed exchange rate regime to acrawling peg/floating rate regime increases the inflationary consequencesof a given budget deficit and raises the inertial (underlying) inflation.
Large budget deficits tend to lead to misalignments of the realexchange rate, undermining the competitiveness of economies. Sustained

PUBLIC DEBT AND MACROECONOMIC MANAGEMENT IN SUB-SAHARAN AFRICA 289
misalignment undermines economic performance and generates internaland external imbalances. M’Bet (1996), for example, found that over-valuation of the real exchange rate had a significant negative impact onGDP and exports, while it significantly increased the demand for importsin both Côte d’Ivoire and Burkina Faso.
Large budget deficits cause misalignment of the real exchange rate invarious ways. In a number of African countries (e.g. Kenya and the UnitedRepublic of Tanzania), empirical evidence shows government expenditures(both on consumption and investment), which are mainly expended on non-tradables, appreciate the real exchange rate and thus undermine externalcompetitiveness (Mwega and Ndung’u, 1997). More specifically, expan-sionary macroeconomic policies in Africa have led to an appreciation ofthe real exchange rate (see, for example, Mlambo and Ncube, 1996,concerning Zimbabwe), so that the goal of a competitive exchange ratehas a bearing on the government’s policy of fiscal restraint.
Budget deficits may also increase short-term capital inflows by raisingdomestic interest rates relative to foreign interest rates. Short-term capitalflows, attracted by this interest rate differential, put pressure on theexchange rate to appreciate and this complicates exchange rate managementand the goal of a stable exchange rate. In francophone countries, con-vertibility and a fixed exchange rate have led to capital flight when themacroeconomic environment has worsened and indebtedness and inflationrates have increased.
Therefore the implications of large public debts on exchange ratesand interest rates call for better policies aimed at improving the financialsystem in general. In order to contain inflation and enhance externalcompetitiveness, overly expansionary policies must be avoided throughbetter planning and changes in public debt and money supply consistentwith pre-determined exchange rate targets. It is also necessary to reversethe financial repression of the past, in part through containing publicdeficits, in order to allow, in particular, positive real deposit rates. Financialliberalization should, however, be undertaken in a sequenced manner,initially emphasizing macroeconomic balance and the development of asupportive institutional framework.

DELPHIN G. RWEGASIRA AND FRANCIS M. MWEGA290
Exchange-rate depreciation (real or nominal), on the other hand, mayaffect the size of the budget deficit in various ways (Roe and Griggs 1990,Amoako-Tuffour 1999). First, exchange rate depreciation, by raising therelative price of tradables vis-à-vis non-tradables, will affect the governmentbudgetary position depending on the extent it is a net buyer or seller oftradable goods. If the government is a net importer, it will incur higherlocal currency expenditures following a depreciation. If the share ofgovernment imports is large, the burden from a currency depreciation onthe government may be quite high, with large budgetary implications.Second, currency depreciation will increase the debt-income ratio and theexpenditures associated with external debt servicing, thereby worseningthe fiscal deficit. Third, depreciation could be accompanied by policiesthat reduce the budget deficit, such as replacing non-tariff barriers by tariffsand/or imposing or increasing taxes on exporters who benefit from thedepreciation. Improved resource allocation arising from an exchange-raterealignment to reduce overvaluation (e.g. improved export performance)may also boost growth and hence government revenues (Wijnbergen,1989).Fourth, overvaluation may induce a shift from formal to informal/illegalactivities, which shrink the country’s tax base and reduce governmentrevenues. Currency depreciation and liberalization of markets may bringthese activities into official channels and into the tax net, thereby increasinggovernment revenues.
All in all, it is therefore difficult to predict, a priori, the fiscalconsequences of a currency depreciation. Focusing on the impact ofcurrency depreciation on external debt servicing, Amoako-Tuffour (1999)found that if the government had met all its foreign interest payments,currency depreciation would have added, on average, 0.5 per cent of GDPannually to Ghana’s budget deficit in the 1983–1995 period, accountingfor about 34 per cent of total foreign interest payments for this period. Thedeficit increased from 0.17 per cent of GDP in 1984, when there were tightexchange controls, to nearly 1 per cent in 1987, when the exchange rateregime was substantially liberalized, before stabilizing at an average of0.3 per cent of GDP in 1988–1992 and 0.7 per cent in 1993–1995.
PUBLIC DEBT AND MACROECONOMIC MANAGEMENT IN SUB-SAHARAN AFRICA 291
B. Interest-rate policy
In the past, large budget deficits have induced African governmentsto repress their financial systems in order to contain the cost of domesticdebt. This financial repression has been characterized by low or negativereal interest rates, high reserve requirements (sometimes of 20–25 per centcompared to 5–6 per cent in developed countries), mandatory credit ceilings,and heavy government ownership and management of financial institutions,with considerable credit given on the basis of political rather thancommercial considerations. That has given rise to a relatively large pile ofnon-performing loans in banks’ portfolios. There has also been limitedcompetition, with government and parastatals remaining the majorborrowers.
Since the early 1990s, countries have liberalized their financialsystems. An important component of financial sector reforms has beeninterest rate liberalization. Other components have included: (i) reducingdirect and indirect taxation of financial institutions through changes inreserve requirements, mandatory credit ceilings and credit allocationguidelines; (ii) reducing barriers to competition in the financial sector byscaling down government ownership through privatization, and facilitatingentry into the sector by domestic and foreign firms; and (iii) restructuringand liquidation of solvent banks (Inanga, 1995).
According to the World Bank (1994), however, the actual experienceof many African countries with financial reforms has been of limitedsuccess. This has been mainly because of failure of real deposit rates toremain consistently positive, and continued repression as a result of therelatively high fiscal deficits which have characterized these countries andaccelerated inflation when financed mainly by borrowing from the centralbank.18 The situation has not changed much since the early 1990s. TheWorld Bank study (1994), for example, judged a country to have a “good”fiscal stance if it had a budget deficit of less than 1.5 per cent. It can beseen from table 10 that it was only Cameroon, Kenya and the UnitedRepublic of Tanzania in our sample that could be judged to satisfy thiscriterion in the second half of the 1990s. It was therefore difficult for mostof the countries to raise real deposit interest rates.

DELPHIN G. RWEGASIRA AND FRANCIS M. MWEGA292
Financial sector reforms in African countries have therefore beenundertaken in the context of pervasive macroeconomic instability, contraryto the advice that “postponing the removal of interest rate regulation maybe appropriate until ... the situation has been stabilized and bankingsupervision strengthened (Villanueva and Mirakhor, 1990)”. The successfulsequencing of financial liberalization requires macroeconomic stability(control of inflation) and fiscal discipline (reduction of fiscal deficit) inaddition to improved legal, accounting and regulatory systems for thefinancial sector, a tax system that does not discriminate against the sector,and the management of sequencing so that, for example, capital inflows fromliberalization do not offset macroeconomic stability (World Bank, 1989).19
When interest rates are controlled, the government reaps substantialrevenue from the implicit tax on financial assets arising from repressingthe financial system. Such revenue depends on its tax rate as measured bythe difference between the domestic cost of borrowing and the shadowcost of the funds; and its tax base as measured by the stock of domesticdebt outside the central bank. Therefore, financial liberalization may haveadverse effects on the budget deficit (Roe and Griggs, 1990). When budgetdeficits are large, financial liberalization will entail very high nominalinterest rates, including a premium for expected inflation, with adverseeffects on the productive sectors. This may widen the budget deficit becauseof the increased interest payments on government borrowing, but alsobecause of the increased need for expenditures to support the distressedproductive enterprises. In a sample of 10 developing countries, Easterlyand Schmidt-Hebbel (1993), for example, found a high correlation betweendomestic debt financing and interest rates. Osei (1995) also attributed therapid accumulation of domestic debt to the high nominal interest rates inGhana in the 1980s and 1990s. However, Amoako-Tuffour (1999) foundthat while interest payments on domestic debt increased markedly in Ghana,inflation also substantially reduced the value of outstanding debt; heestimated that about 30 per cent of interest payments between 1991 and1997 represented compensation, rather than income, to debt holders forthe nominal capital losses due to inflation.
Realistic interest rates, however, may reduce or reverse capital flight,making more funds available for government domestic borrowing (at

PUBLIC DEBT AND MACROECONOMIC MANAGEMENT IN SUB-SAHARAN AFRICA 293
lowered inflation rates and lower implicit tax on the financial system).High interest rates on real deposits (arising from increased debt financing)may also increase financial savings and expand the base for the inflation tax.
C. Opening up of the capital account
The linkage between the fiscal deficit and the current account deficitincreases the more open the capital account. According to UNCTAD (2000),capital outflows to Africa have increased as countries in the region haveliberalized their capital account and become more integrated into the globalfinancial system. By liberalizing outward capital flows, African countrieshave facilitated the acquisition of assets abroad.20 However, capital accountliberalization has also increased the volatility of net capital inflows, nottheir magnitude, with attendant consequences for exchange rate instability.This has also induced countries to build up foreign exchange reserves as asafeguard against a discontinuation or reversal of capital flows andspeculative attacks on the currency (thus tying up resources that could beutilized to finance growth). According to UNCTAD (2000), while SSAimports increased by 8 per cent between 1995 and 1998, foreign exchangereserves increased by 50 per cent. This was most pronounced in countriessuch as Kenya and Uganda, which have liberalized their capital account.For the above reasons, less than 60 per cent of each dollar mobilized abroadfor Africa had been allocated to real resource transfers.
As discussed earlier, the extent to which the government can useseignorage revenue depends on the demand for high-powered money.Opening up of the capital account increases the elasticity of the demandfor money with respect to open economy variables such as the exchangerate and foreign interest rates, thus reducing the base for seignoragerevenues.
Similarly, since domestic borrowing is limited by the small size ofSSA countries’ capital markets, governments have utilized capital controlsto facilitate such borrowing. Opening up of the capital account thereforeincreases the degree of substitution between domestic and foreign bonds,

DELPHIN G. RWEGASIRA AND FRANCIS M. MWEGA294
leading to a potential deterioration in balance of payments and limitingthe amount that can be borrowed for given interest rates and currentaccount deficits (Tanzi and Blejer,1984). Lastly, openness facilitates foreignborrowing and hence accumulation of external debt.
As indicated earlier, the financial openness that characterized thedomestic “official sector” in SSA countries translated portions of the publicdeficit into growing official external indebtedness. Simply put, this resultedin the problem of an unsustainable debt situation, which not onlycomplicated the formulation and implementation of future public policybut also introduced serious uncertainties as to the external viability of theeconomies. The uncertainties would remain significant even if theproportion of concessional debt in the total were comparatively high, as ithas been in SSA.
The main problems due to the opening up of the capital account in thecontext of high country debt ratios (as in SSA) revolve around the issuesof uncertainty and related expectations (Roe and Griggs, 1990). First, theenlarged external public debt may generate expectations of higher futuretaxation and thus encourage transfers of wealth abroad. Second, the sameenlarged debt might generate expectations of currency devaluation forboosting export revenues, which in turn would also encourage capital flight.Third, high debt ratios, particularly in an environment of weak domesticpolicies, may convince economic agents that the public sector has, in effect,lost access to external funds; this would provoke both capital flight andreduced investment, as economic agents seek ways to protect their incomesand wealth abroad. For these and related reasons, it has been argued thatdebt-reduction initiatives for the highly indebted poor countries are justifiednot only on humanitarian (poverty reduction) grounds but also from theviewpoint of counteracting the undesirable incentives to capital flight andreduced investment. Conducive domestic policies are, of course, a criticalcomponent of debt-reduction efforts if poverty alleviation and aggregategrowth have to be sustained (in part by reasonable investment expansion).
Opening up of the capital account also renders the economy financiallyvulnerable to adverse external developments. As has been observed in recentstudies on increased global financial integration, in developing countries

PUBLIC DEBT AND MACROECONOMIC MANAGEMENT IN SUB-SAHARAN AFRICA 295
there were wide swings from the 1970s to the 1990s in the volume ofinternational capital flows and in the terms and conditions on which externalfinance was made available. Given this instability and the associatedeconomic damage, questions have been raised about the wisdom ofundeterred liberalization of capital flows. And although there is broadconsensus, supported by empirical research, about the positive outcome ofpro-trade policies, the same cannot be said with equal conviction aboutliberalization of capital flows (Eichengreen and Mussa, 1998). This maybe attributed to economic distortions arising from problems of asymmetricinformation (thought to be typically more severe in financial markets vis-à-vis product markets), such as adverse selection, moral hazard and herdingbehaviour (Mussa, 2000).
For an average African country with typical debt ratios, the swings inthe volume of incoming external capital flows are, arguably, likely to beassociated with changes in official flows, given the past pattern ofborrowing. Thus, for various reasons, an economy may suffer fromdependence on official external capital through unanticipated reductionsin such capital. The reasons may range from changes in donor sentimentsor on the aid system in general (vis-à-vis supporting a given country) todisagreements on conditionality, or policy prescriptions. In addition to thisrather straightforward source of instability, however, swings in privatecapital flows may have significant implications on key macroeconomicvariables, notably the exchange rate and interest rate. Private capital flowsare relatively small for an average African country; however, they are largein terms of domestic private transactions in the foreign exchange and moneymarkets. Thus a significant reduction in external private flows is likely tolead to domestic currency depreciation and to exert upward pressure oninterest rates. These two developments may not be consistent with theunderlying conditions or desirable macroeconomic directions.
The changing cost of external capital may also affect an economy inundesirable ways, particularly if the changes are not related to changes inexport prices or the terms of trade. Although most countries in SSA nowrely on concessional financing, upward changes in the cost of official capital(for whatever reasons) may strain the balance of payments and worsen thepublic sector deficit. Some governments and their public sectors in general

DELPHIN G. RWEGASIRA AND FRANCIS M. MWEGA296
have also been borrowing from the external private sector, often on a short-term basis, thus further exposing their economies to strains from that source.Indeed interest-rate shocks from external financial markets could havesignificant effects on domestic interest rates and the exchange rate.
It may be concluded in respect of an opening up of the capital account,given the circumstances in Africa, that particular policy attention wouldhave to be paid to the potential risks of a worsening capital flight problemand of depressing investments. In practical terms, that implies the openingof the account in a phased and measured manner: it is estimated that 70 percent of Africa’s non-land wealth is already held abroad (Collier andGunning, 1998). Beyond this, public deficits would need to be carefullyplanned, given the overall macroeconomic context, and their specificsources of financing (including desirable external funding) determined.Short-term external borrowing, whether by the public or private sector,would need to be contained – given the recent experiences of crises inAsia and elsewhere – and closely related to levels of foreign reserves for agiven country. In addition, proper regulation and supervision of the domesticfinancial system would have to remain a central priority of public policy,given the general experience with private capital flows in developingcountries and the fact that the government has to serve as ultimate guarantorof the solvency of a country’s financial system.
VII. SUMMARY AND CONCLUSIONS
This paper has analysed the relationship between external and domesticpublic debt in SSA, factors that contributed to the accumulation of bothtypes of debt, their impact on macroeconomic management – includingexchange-rate and interest-rate policies – as well as those problems arisingfrom the opening up of the capital account in the context of a large publicdebt burden, among them increased vulnerability to external shocks.
SSA’s external debt about doubled between 1985 and 1998. Theexternal debt burden reached a peak in 1993–1994 and declined thereafter,partly due to improved growth, debt relief and rescheduling, commercial

PUBLIC DEBT AND MACROECONOMIC MANAGEMENT IN SUB-SAHARAN AFRICA 297
debt buy-backs and a decline in overall aid levels. By the late1990s, externaldebt as a proportion of GNP and exports in SSA was nearly double theaverage for all developing countries although the external debt serviceratio was lower in Africa due to the concessionary terms of much of itsborrowing.
The stock of external debt and its servicing therefore poses a majorproblem in SSA countries, and there is substantial empirical evidence thatthis has had a negative impact on investment and growth. The debt stock islarge relative to the size of the SSA economies, with the debt overhangdiscouraging investment. Debt servicing is a large proportion of exportearnings and government expenditures, which reduces the resourcesavailable for imports, investment and socioeconomic development. Thecapacity to service the debt has been low, as reflected in the substantialaccumulation of arrears. Large external debt and its servicing have alsoundermined the credibility of domestic policies and contributed to macro-economic instability.
Some SSA countries have accumulated substantial domestic debt sincethe mid-1980s (e.g. Cameroon and Côte d’Ivoire) due to large budgetdeficits and reduced access to external finance. In contrast, other reformingSSA countries have substantially reduced their domestic debt burdens (e.g.Malawi, Uganda and the United Republic of Tanzania). Yet in othercountries domestic debt declined and then increased (e.g. Ghana andNigeria) due to slippage in budgetary discipline, while in the late-reformersit increased and then declined (e.g. Kenya and Zimbabwe). With domesticdebt generally more expensive to acquire than external debt, heavy domesticborrowing has resulted in an increase in the share of interest payments intotal government expenditure, thus causing a vicious cycle with a worseningof the budget deficit.
A major cause of external debt accumulation in SSA has been thelarge fiscal deficits incurred by the public sector. Fiscal deficits resultedin increased external borrowing, or they forced the private sector intoincreased borrowing from that source. An overwhelming proportion of theseexternal debts is owed by the public sector. And, overall, foreign aidintensity in Africa is the highest of any major developing region. The impact
DELPHIN G. RWEGASIRA AND FRANCIS M. MWEGA298
of the budget deficits on external debt accumulation in SSA is supportedby empirical literature, which finds the fiscal position of the governmentsignificantly correlated with the evolution of the external debt ratios, alongwith other factors such as the real effective exchange rate and the terms oftrade. Given this evidence, therefore, it can be concluded that policies aimedat improved macroeconomic management must address the question of theappropriate level of the fiscal deficit and external debt for a given economy.
SSA governments have financed budget deficits in three main ways:through money creation, through sales of government securities, andthrough external borrowing. Deficits have also been financed in part byproceeds from the sale of assets (e.g. foreign exchange reserves andprivatization proceeds) and through payments arrears (delayed paymentsfor goods and services).
There are, however, clear limitations and trade-offs with the variousmethods of financing the fiscal deficit. Borrowing from the central bankmay be inflationary, and empirical studies have shown that the amount ofseignorage revenue that can be generated relative to the national incomein a typical African country is quite modest. Inflation in turn reduces thedemand for money, generating an inverted-U “Laffer curve” in therelationship between the seignorage tax revenue and the inflation rate. Thisis exacerbated by other factors. For example, high inflation rates (20–30 percent) may be more volatile, discouraging investment and economic growth.Inflation also tends to adversely affect conventional tax revenues due tolags in tax collection, with expenditures more responsive than tax revenuesto inflation (the Olivera-Tanzi effect). And of course, inflation may havean adverse effect on the distribution of income, which may retard growth.
Domestic borrowing through sale of securities to the public, on theother hand, is constrained by the small capital and money markets in manySSA countries (with a few exceptions, such as Côte d’Ivoire, Kenya, Nigeriaand Zimbabwe). Liberalizing the financial system in the presence of largebudget deficits, therefore, could tend to unduly raise interest rates. As aconsequence, the share of interest payments in government expenditurewould increase, with the deficit feeding on itself.
PUBLIC DEBT AND MACROECONOMIC MANAGEMENT IN SUB-SAHARAN AFRICA 299
For a given budget deficit, a shift from central bank financing of apublic deficit to financing via private markets entails, to a large extent, ashift from a regime of high inflation to one of high real interest rates.Whether this shift would bring about greater fiscal discipline and bettermonetary control is an empirical question. Since the losers from inflation(general public) are likely to be less vocal and politically weaker thanlosers from high real interest rates (borrowers and their lobbying groups),the shift may bring about greater fiscal discipline and better monetarycontrol, reflected in lower fiscal deficits.
Given the limitations of both inflationary finance and domesticborrowing in the African context, it is clear that appropriate levels of publicdebt for a given country must reckon with those constraints if a stablemacroeconomic environment is to be achieved and maintained.
Public debt has further specific implications for macroeconomicmanagement and monetary policy. Large fiscal deficits, for example,undermine the two objectives of exchange rate policy: the maintenance ofa nominal anchor to control inflation and improvement in externalcompetitiveness. Empirical evidence shows that large budget deficits tendto lead to increased inflation, which may be compounded by exchangerate liberalization. Exchange rate liberalization changes the inflation profile,leading to higher inflation as the economy loses a nominal anchor to tieprices down. Moving from a fixed exchange rate regime to a crawling peg/floating rate regime increases the inflationary consequences of a givenbudget deficit and raises the inertial (underlying) inflation.
Budget deficits also increase the possibilities of real exchange ratemisalignment. In a number of African countries (e.g. Kenya and the UnitedRepublic of Tanzania), empirical evidence shows that government expendi-tures (both on consumption and investment), which are mainly expendedon non-tradables, tend to lead to a real exchange rate appreciation. Morespecifically, expansionary macroeconomic policies tend to lead to anappreciation of the real exchange rate. Budget deficits may also increaseshort-term capital inflows by raising domestic interest rates, and the inflowsmay lead to exchange rate appreciation.

DELPHIN G. RWEGASIRA AND FRANCIS M. MWEGA300
Exchange rate depreciation (real or nominal), on the other hand, mayaffect the size of the budget deficit in various ways. First, exchange ratedepreciation, by raising the relative price of tradables vis-à-vis non-tradables, would affect the government budgetary position, depending onthe extent to which it is a net buyer or seller of tradable goods. Second,depreciation would increase the debt-income ratio and the expendituresassociated with external debt servicing, tending to worsen the fiscal deficit.Third, depreciation is likely to eliminate the revenues from use of hightariffs for managing the balance of payments. That, however, could beaccompanied by policies that compensate for the losses. Fourth, currencydepreciation and liberalization of markets may bring informal/illegalactivities into official channels and into the tax net, thereby increasinggovernment revenues.
With respect to interest rates, it may be noted that since the late 1980s,SSA countries have liberalized their financial systems, with an importantcomponent being the liberalization of interest rates. However, the actualexperience of many countries with financial reforms has been one of limitedsuccess. This is mainly because of the failure of real deposit rates to remainconsistently positive due to the relatively high fiscal deficits that havecharacterized these countries. The situation has not changed much sincethe early 1990s. Financial sector reforms in African countries have alsobeen undertaken in the context of pervasive macroeconomic instability,contrary to the emerging consensus on appropriate sequencing of suchreforms.
When budget deficits are large, financial liberalization entails highnominal interest rates, including a premium for expected inflation; thishas adverse effects on the productive sectors. The high rates may widenthe budget deficit not only because of increased interest payments on thegovernment borrowing, but also because of the need for expenditures tosupport the distressed productive enterprises. Realistic interest rates,however, may reduce or reverse capital flight, making more funds availablefor government domestic borrowing (at lowered inflation rates and a lowerimplicit tax on the financial system). Positive real deposit interest rates(arising from increased debt financing) may also increase financial savingsand expand the base for the inflation tax.

PUBLIC DEBT AND MACROECONOMIC MANAGEMENT IN SUB-SAHARAN AFRICA 301
The implications of large public debts on the exchange rate and interestrates therefore call for better policies aimed at improving the financialsystem in general. In order to contain inflation and enhance externalcompetitiveness, overly expansionary policies should be avoided throughbetter planning and changes in public debt and money supply consistentwith pre-determined exchange rate targets. It is also necessary to reversethe financial repression of the past, in part through containing public deficitsin order to allow, in particular, positive real deposit rates. Financialliberalization should, however, be undertaken in a sequenced manner,initially emphasizing macroeconomic balance and the development of asupportive institutional framework.
Turning to public debt and the problems that may arise from theopening up of the capital account, it should be noted that the linkagebetween the fiscal deficit and the current account deficit increases as thecapital account becomes more open. Opening up of the capital accountincreases the elasticity of the demand for money with respect to openeconomy variables such as exchange rate and foreign interest rates, thusreducing the base for seignorage revenues. Similarly, opening up the capitalaccount increases the degree of substitution between domestic and foreignbonds; this leads to a deterioration in balance of payments and limits theamount that can be borrowed for given interest rates and current accountdeficits. The main problems due to opening up of the capital account in thecontext of high country debt ratios (as in SSA) revolve around the issuesof uncertainty and related expectations. First, the enlarged external publicdebt may generate expectations of higher future taxation and thus encouragetransfers of wealth abroad. Second, the same enlarged debt might generateexpectations of a currency devaluation for boosting export revenues, whichin turn would also encourage capital flight. Third, debt ratios that are toohigh, particularly in an environment of weak domestic policies, mayconvince economic agents that the public sector has in effect lost access toexternal funds; this would provoke both capital flight and reduced invest-ment as economic agents seek ways to protect their incomes and wealthabroad.
Moreover, opening up of the capital account renders the economyvulnerable to adverse external developments. As has been observed in recent

DELPHIN G. RWEGASIRA AND FRANCIS M. MWEGA302
studies on increased global financial integration, for developing countriesthere have been wide swings through the 1970s and the 1990s in the volumeof international capital flows and in the terms and conditions on whichexternal finance has been available.
In the circumstances of an average SSA African country with typicaldebt ratios, the reasons for these swings may range from changes in donorsentiments (towards supporting a given country) or the aid system ingeneral, to disagreements on policy conditionalities. In addition to theserather straightforward sources of instability, however, swings in privatecapital flows may have significant implications on key macroeconomicvariables, notably the exchange rate and interest rate. Private capital flowsare relatively small for an average SSA African country; however, theyare large in terms of domestic private transactions in the foreign exchangeand money markets. Thus, a significant reduction in external private flowsor an increase in their cost is likely to lead to domestic currency depreciationand to exert upward pressure on interest rates. These developments maynot be consistent with the underlying conditions or with desirablemacroeconomic directions.
The key point to emphasize in respect of an opening up of the capitalaccount in the context of SSA is that particular policy attention should bepaid to the potential risks of exacerbating the capital flight problem and ofdepressing investment.

PUBLIC DEBT AND MACROECONOMIC MANAGEMENT IN SUB-SAHARAN AFRICA 303Ta
ble
A.1
CEN
TRA
L B
AN
K N
OM
INA
L D
ISC
OU
NT
INTE
RES
T R
ATES
IN S
ELEC
TED
AFR
ICA
N C
OU
NTR
IES,
198
5–19
99
Côt
eU
nite
d R
ep.
Cam
eroo
nd’
Ivoi
reG
hana
Ken
yaM
alaw
iN
iger
iaU
gand
aaof
Tan
zani
aZa
mbi
aZi
mba
bweb
1985
9.0
10.5
18.5
12.5
11.0
10.0
24.0
5.0
25.0
9.0
1986
8.0
8.5
20.5
12.5
11.0
10.0
36.0
8.0
30.0
9.0
1987
8.0
8.5
23.5
12.5
14.0
12.8
31.0
12.5
15.0
9.0
1988
9.5
9.5
26.0
16.0
11.0
12.8
45.0
14.5
15.0
9.0
1989
10.0
11.0
26.0
16.5
11.0
18.5
55.0
15.5
..9.
019
9011
.011
.033
.019
.414
.018
.550
.0 ..
..10
.319
9110
.811
.020
.020
.313
.015
.546
.0 ..
..20
.019
9212
.012
.530
.020
.520
.017
.541
.014
.547
.029
.519
9311
.510
.535
.045
.525
.026
.024
.014
.572
.528
.519
947.
810
.033
.021
.540
.013
.515
.067
.520
.529
.519
958.
67.
545
.024
.550
.013
.513
.347
.940
.229
.519
967.
86.
545
.026
.927
.013
.515
.919
.047
.027
.019
977.
56.
045
.032
.323
.013
.514
.116
.217
.731
.519
987.
06.
337
.017
.143
.013
.59.
117
.6 ..
39.5
1999
7.3
5.8
27.0
26.5
47.0
13.5
15.8
20.2
.. ..
Sour
ce:
IMF
(199
9).
Not
e: ..
= n
ot a
vaila
ble.
aB
ank
rate
.b
Red
isco
unt r
ate.

DELPHIN G. RWEGASIRA AND FRANCIS M. MWEGA304Ta
ble
A.2
OTH
ER IN
TER
EST
RAT
ES A
ND
INFL
ATIO
N IN
SEL
ECTE
D A
FRIC
AN
CO
UN
TRIE
S, 1
985–
1999
1985
1986
1987
1988
1989
1990
1991
1992
1993
1994
1995
1996
1997
1998
1999
Cam
eroo
nD
epos
it ra
te7.
507.
357.
157.
217.
507.
507.
507.
507.
758.
085.
505.
385.
045.
005.
00Le
ndin
g ra
te14
.50
13.5
013
.00
13.4
615
.00
18.5
018
.15
17.7
717
.46
17.5
016
.00
22.0
022
.00
22.0
022
.00
Infla
tion
8.51
7.77
13.1
41.
68-1
.67
1.10
0.06
-0.0
2-3
.21
35.0
913
.92
4.67
1.04
0.10
..
Côt
e d’
Ivoi
reM
oney
mar
ket r
ate:
over
nigh
t adv
ance
s10
.66
8.58
8.37
8.72
10.0
710
.98
10.9
411
.44
....
....
..4.
814.
95D
epos
it ra
te7.
256.
085.
255.
256.
427.
007.
007.
75..
....
....
3.50
3.50
Infla
tion
1.86
9.68
6.94
6.93
1.05
-0.8
11.
684.
232.
1626
.08
14.3
02.
484.
024.
690.
79
Gha
naTr
easu
ry b
ill ra
te17
.13
18.4
721
.71
19.7
619
.84
21.7
829
.23
19.3
830
.95
27.7
235
.38
41.6
442
.77
34.3
326
.37
Dep
osit
rate
(3 m
onth
s)15
.75
17.0
017
.58
16.5
0..
..21
.32
16.3
223
.63
23.1
528
.73
34.5
035
.76
32.0
523
.67
Infla
tion
10.3
124
.57
39.8
231
.36
25.2
237
.26
18.0
310
.06
24.9
624
.87
59.4
646
.56
27.8
914
.62
..
Ken
yaTr
easu
ry b
ill ra
te13
.90
13.2
312
.86
13.4
813
.86
14.7
816
.59
16.5
349
.80
23.3
218
.29
22.2
522
.87
22.8
313
.87
Dep
osit
rate
(max
. 3–6
mon
ths)
11.2
511
.25
10.3
110
.33
12.0
013
.67
....
....
13.6
017
.59
16.7
218
.40
9.55
Lend
ing
rate
(max
imum
)14
.00
14.0
014
.00
15.0
017
.25
18.7
519
.00
21.0
729
.99
36.2
428
.80
33.7
930
.25
29.4
922
.38
Infla
tion
13.0
14.
807.
6211
.20
12.9
415
.59
19.8
229
.55
45.8
029
.01
0.79
8.82
12.0
25.
812.
64 /...

PUBLIC DEBT AND MACROECONOMIC MANAGEMENT IN SUB-SAHARAN AFRICA 305Ta
ble
A.2
(con
tinue
d)
OTH
ER IN
TER
EST
RAT
ES A
ND
INFL
ATIO
N IN
SEL
ECTE
D A
FRIC
AN
CO
UN
TRIE
S, 1
985–
1999
1985
1986
1987
1988
1989
1990
1991
1992
1993
1994
1995
1996
1997
1998
1999
Mal
awi
Trea
sury
bill
rate
12.3
112
.75
14.2
515
.75
15.7
512
.92
11.5
015
.62
23.5
427
.68
46.3
030
.83
18.3
132
.98
42.8
5D
epos
it ra
te(C
B 3
mon
ths
fixed
rate
)12
.50
12.7
514
.25
13.5
012
.75
12.1
012
.50
16.5
021
.75
25.0
037
.27
26.3
310
.21
19.0
633
.21
Lend
ing
rate
(max
. CB
rate
)18
.38
19.0
019
.50
22.2
523
.00
21.0
020
.00
22.0
029
.50
31.0
047
.33
45.3
328
.25
37.6
753
.58
Gov
ernm
ent b
ond
yiel
d11
.50
11.5
011
.50
11.5
011
.50
11.5
011
.50
....
23.5
038
.58
42.6
739
.25
....
Infla
tion
10.5
214
.05
25.1
833
.88
12.4
611
.81
12.6
223
.75
22.7
734
.65
83.3
337
.60
9.14
29.7
5..
Nig
eria
Dep
osit
rate
(3 m
onth
s)9.
129.
2413
.09
12.9
514
.68
19.7
814
.92
18.0
423
.24
13.0
913
.53
13.0
47.
31..
..Le
ndin
g ra
te(fi
rst c
lass
adv
ance
s)9.
439.
9613
.96
16.6
220
.44
25.3
020
.04
24.7
631
.65
20.4
820
.23
20.3
220
.41
....
Infla
tion
7.44
5.72
11.2
954
.51
50.4
77.
3613
.01
44.5
957
.17
57.0
372
.81
29.2
98.
2110
.32
..
Uga
nda
Trea
sury
bill
rate
22.0
030
.67
30.5
033
.00
42.1
741
.00
34.1
7..
21.3
012
.52
8.75
11.7
110
.59
7.77
7.43
Dep
osit
rate
20.0
023
.33
20.0
021
.50
32.1
731
.25
31.1
735
.83
16.2
69.
997.
6110
.62
11.8
411
.36
7.83
Lend
ing
rate
(exp
orts
and
man
ufac
turin
g)24
.00
33.3
334
.67
35.0
040
.00
38.6
734
.42
....
..20
.16
20.2
921
.37
20.8
621
.57
Infla
tion
157.
6516
0.98
200.
0319
6.12
61.4
433
.12
28.0
752
.44
6.08
9.73
8.59
7.22
6.93
-0.0
26.
35 .../..
.

DELPHIN G. RWEGASIRA AND FRANCIS M. MWEGA306Ta
ble
A.2
(con
clud
ed)
OTH
ER IN
TER
EST
RAT
ES A
ND
INFL
ATIO
N IN
SEL
ECTE
D A
FRIC
AN
CO
UN
TRIE
S, 1
985–
1999
1985
1986
1987
1988
1989
1990
1991
1992
1993
1994
1995
1996
1997
1998
1999
Uni
t. R
ep. o
f Tan
zani
aTr
easu
ry b
ill ra
te..
....
....
....
..34
.00
35.0
940
.33
15.3
09.
5911
.83
10.0
5D
epos
it ra
te(C
B 3–
6 m
onth
s)4.
508.
5015
.75
17.4
617
.00
....
....
..24
.63
13.5
97.
837.
757.
75Le
ndin
g ra
te(C
B le
ndin
g up
per
mar
gin)
12.2
918
.50
27.5
029
.63
31.0
0..
....
31.0
039
.00
42.8
337
.21
29.2
326
.67
29.8
3In
flatio
n33
.28
32.4
329
.95
31.1
925
.85
35.8
328
.70
21.8
525
.28
33.0
928
.38
20.9
816
.09
12.8
07.
89Za
mbi
aTr
easu
ry b
ill ra
te13
.21
24.2
516
.50
15.1
718
.50
25.9
2..
..12
4.03
74.2
139
.81
52.7
829
.48
24.9
436
.22
Dep
osit
rate
(tim
e 3–
6 m
onth
s)15
.33
17.7
413
.23
11.4
411
.44
25.6
5..
48.5
0..
46.1
430
.24
42.1
334
.48
13.0
820
.27
Lend
ing
rate
18.6
027
.40
21.2
018
.39
18.3
935
.10
..54
.57
113.
3170
.56
45.5
353
.78
46.6
931
.80
40.3
6In
flatio
n..
55.8
347
.05
51.0
012
3.40
107.
0293
.21
169.
0518
8.05
53.6
134
.20
46.2
724
.81
....
Zim
babw
eM
oney
mar
ket r
ate
8.80
9.10
9.30
9.08
8.73
8.68
17.4
934
.77
34.1
830
.90
29.6
426
.18
25.1
537
.22
..Tr
easu
ry b
ill ra
te8.
488.
718.
738.
388.
358.
3914
.44
26.1
633
.04
29.2
227
.98
24.5
322
.07
32.7
8..
Dep
osit
rate
(3 m
onth
s)10
.04
10.2
89.
589.
688.
858.
8014
.20
28.6
329
.45
26.7
525
.92
21.5
818
.60
29.0
6..
Lend
ing
rate
17.1
713
.00
13.0
013
.00
13.0
011
.71
15.5
019
.77
36.3
334
.86
34.7
334
.23
32.5
542
.06
..G
over
nmen
t bon
d yi
eld
13.2
613
.20
13.8
714
.00
14.0
015
.24
17.2
717
.40
....
....
....
..In
flatio
n8.
4914
.33
12.4
77.
4212
.88
17.3
623
.34
42.0
627
.59
22.2
622
.59
21.4
318
.74
31.8
2..
Sour
ce:
IMF
(199
9).
Not
e: ..
= n
ot a
vaila
ble.

PUBLIC DEBT AND MACROECONOMIC MANAGEMENT IN SUB-SAHARAN AFRICA 307
NOTES
1 In our analysis, we did not use new or original data; we relied mainly on the IMF/World Bank databases. It was not possible to obtain from local sources national statisticalpublications and data (in series covering the period since the mid-1980s) for all the10 sample countries we selected for our detailed analysis. We used information anddata from the Economist Intelligence Unit and other country reports, where available.
2 There are obviously major practical problems in analysing external debt (Ajayi, 1991).First, currency changes can significantly influence the dollar amount of debt outstanding.Second, the composition of debt, which is not captured by these data, is important fordebt management. Third, there are large inconsistencies in debt figures across the varioussources. For convenience, we rely mainly on the World Bank (1999).
3 In this paper, we do not discuss in detail the issue of the extent to which rising publicdebt servicing has crowded out real spending on government services.
4 Overall, data on domestic public debt and budget deficit financing (both mainly fromthe IMF’s International Financial Statistics) are weak and contain major gaps. Thedata, for example, only distinguish between domestic and foreign financing (the basisof table 11) but do not distinguish between the various types of domestic financing,which makes it difficult to tell a complete story on shifts in the structure of the financingof government deficits.
5 For the nominal domestic discount rates in selected countries, see table A.1; for theaverage interest rates on external debt, see table 6.
6 UNCTAD (2000) has called for a massive increase in foreign aid to Africa to accelerateand maintain growth at levels higher than in the past (about 6 per cent per annum) for asufficiently long period (10–12 years). Combined with appropriate policies that includeenhancing market incentives, streamlining the role of the State, and building institutions,this would reduce aid dependence by increasing savings and by attracting private capital,thereby gradually reducing the reliance on foreign aid.
7 This ponzi scheme is seen clearly in Kenya where the Government planned to makeprincipal repayments of public debt over 1999/2003 from new external debts (41.6 percent), new domestic debt (33.9 per cent), fiscal surplus (8.4 per cent), and privatizationproceeds (16.2 per cent) (Kenya, Fiscal Strategy Paper, 2000–2003, 2000). Hence avery large proportion of new debts were to be utilized to repay existing public debt.
8 UNCTAD (2000) has argued that these gaps have widened since the early 1980s becauseof, among other factors, adverse terms of trade and increased imports due to tradeliberalization.
9 Foreign aid is usually intended to augment investment and to improve the policyenvironment through conditionalities. Recent literature on foreign aid, however, hassuggested that foreign aid is translated mostly into consumption, not investment (Boone,1994; Obstfeld, 1995). This means that foreign aid will, on average, act as a substitutefor domestic savings by easing liquidity constraints or by inducing Dutch disease effects.Elbadawi and Mwega (2000) found foreign aid to Granger-cause (in the precedencesense) a reduction in both savings and investment rates in SSA. The investment rate,

DELPHIN G. RWEGASIRA AND FRANCIS M. MWEGA308
however, Granger-caused an increase in foreign aid, so that countries that increasedtheir investment rates received more foreign aid inflows. In a structural pooled panelmodel, the study found that the foreign aid-income ratio had a negative impact on theprivate savings rate, with an almost one-for-one offset relationship. Dollar (1992) alsofound no significant relationship between foreign aid and the quality of policies.
10 These data are mainly from the IMF (1999) which defines the fiscal deficit as: (revenue+ grants) minus (expenditure on goods and services + transfer payments + net lending).The definition, therefore, emphasizes cash flow rather than accrual concepts of revenuesand expenditures. This is the definition most relevant in a discussion of the connectionbetween the fiscal deficit and the balance of payments. The definition, however, hasvarious shortcomings (Tanzi and Blejer,1984). First, cash flows may not reflect theunderlying trends, making it difficult, for example, to link the size of budget deficitsand the degree of external financing (as in tables 9 and 10). For example, if a governmentincurs payment arrears, this cash concept may not reveal that expenditures are takingplace. Second, the classification of grants as revenues (rather than a financing item) isproblematic as grants may not be a permanent way of financing deficits, and they mayfluctuate from year to year. Third, inflation makes it difficult to distinguish, in aneconomic (rather than legal) sense, interest payments from amortization charges.
11 It is important to distinguish the actual from the structural (or core) deficit. The structuraldeficit is derived by correcting the actual deficit for the effects of economic fluctuationsand temporary measures. These temporary measures include: (i) expectations of futuretaxes from some taxpayers; (ii) use of occasional tax amnesties that allow tax payerswho have evaded taxes in the past to “clean their slate” by making a once-for-all paymentequal to some fraction of tax due; (iii) campaigns to collect tax arrears; (iv) use oftemporary taxes or surcharges; (v) postponement of payments to suppliers; (vi) post-ponement of paying wages to workers and of increasing their wages; (vii) temporarytaxes or surcharges; and (viii) an increase in the sale of public properties, includingexploration rights. Even though the fiscal policy should be geared towards the structuralrather than the actual deficit, we focus on the latter as it is easier to measure.
12 The analysis is based on Granger-causality tests utilizing three lags and random effectestimation. The sum of coefficients of causality from budget to current account deficits(0.006) was significant, at the 1 per cent level (p-value = 0.000), while the sum ofcoefficients of causality from current account to budget deficits (0.057) was insignificant,at least at the 20 per cent level (p-value = 0.397).
13 Appropriations-in-aid are levies charged and collected by government ministries anddepartments to at least partly finance their activities (e.g. user charges in governmenthospitals and schools).
14 The seignorage-maximizing rate of inflation is estimated in the following manner.Suppose the seignorage revenue is given by r = π.m, where π is the rate of inflation (taxrate) and m is the real demand for high powered money (tax base). Suppose the demandfor money is given by m = ϕe-δπ. The seignorage-maximizing rate of inflation is thereforeπ* = 1/δ. Adjusting for growth of income which increases the generated seignoragerevenue, we get π* + my.gy = 1/δ, where my is the income elasticity of money demandand gy is the average real growth rate.

PUBLIC DEBT AND MACROECONOMIC MANAGEMENT IN SUB-SAHARAN AFRICA 309
15 Based on estimates of δ = 6.5, my = 1 and gy=0.03.16 It is important to distinguish between grants and concessional financing on the one
hand, and commercial credit on the other. The deleterious effects of grants andconcessional financing on the economy are likely to be relatively small. These resourcescan be used to finance imports or government expenditure. The authorities, however,should be concerned about the implications of these expenditures (e.g. pensions,consumer subsidies and a larger bureaucracy) on the future budget in the event of theprovision of concessional funds being reduced or terminated.
17 Little research has been done on the issues addressed in this and the previous section.More research is required on the direct implications for the SSA economies, and thevalidity of the theoretical analyses, within the African context, of the various deficitfinancing mechanisms and their trade-offs. The implications of public debt formacroeconomic management and monetary policy, including the impact of capitalliberalization on the domestic financial system and the cost of servicing the public debtalso require further research. This may entail country-specific studies from which generallessons for the region can be drawn. What we do in the paper is basically to hypothesizeon possible relationships and impacts and to summarize the empirical evidence (if any)that is available.
18 A major problem in many African countries (e.g. Kenya, Uganda and the United Republicof Tanzania) is that in the 1990s they switched to an indirect monetary policy wherebudget deficits were mainly financed by the sale of securities, which pushed real interestrates very high, with nominal rates generally much higher than the inflation rate (seetable A.2).
19 In this paper, we do not delve into the debate on the merits or otherwise of a highinterest rate policy. While a moderately positive real interest rate may be good forresource mobilization and efficiency, a highly positive real interest rate may beproblematic for the economy. Very high interest rates, for example, may be stagflationaryby increasing the cost of working capital and by reducing real wages, aggregate demandand investment. They may also induce capital inflows and an overvaluation of the realexchange rate, with consequent Dutch-disease effects. They may also increase banklosses and distress of the financial system as clients become unable to service loans,leading to curtailment of bank credit (African Development Bank, 1994). Because ofinformation asymmetry between lenders and borrowers (information possessed by theborrowers, but not availed by the lenders), higher rates would tend to attract more riskyprojects, worsen the portfolio of financial institutions and increase the cost of monitoringthe loans.Experience with intervention and liberalization policies suggests that while financialrepression has retarded the development of financial sectors in Africa and Latin America,such repression and directed credit schemes, advocated by the imperfect informationparadigm, have been skillfully utilized to promote economic growth and transformationin South-East Asia. The outcomes therefore depend on the nature of interventions andimplementation; they can have positive and welfare-enhancing effects or negative anddeleterious effects (Nissanke et al., 1995).

DELPHIN G. RWEGASIRA AND FRANCIS M. MWEGA310
20 The UNCTAD report, however, cautions that such outflows can also take place undercontrolled capital account regimes, particularly when such controls are ineffective andincentives for capital flight are strong.
REFERENCES
Adam CS (1992). On the dynamic specification of money demand in Kenya. Journal of AfricanEconomies, 1(1): 233–270, August.
Adam CS, Ndulu B and Nii Sowa (1996). Liberalization and seignorage revenue in Kenya,Ghana and Tanzania. Journal of Development Studies, 32 (4): 531–553.
African Development Bank (1994). African Development Report 1994. Abidjan, Côte d’Ivoire.Ajayi SI (1991). Macroeconomic approach to external debt: the case of Nigeria. AERC Research
Paper, No. 8. Nairobi, Kenya, African Economic Research Consortium. December.Amoako-Tuffour J (1999). Government fiscal deficits: how small or how large? Journal of
African Economies, 8(1): 1–30, March.Azam J-P (1997). Public debt and the exchange rate in the CFA franc zone. Journal of African
Economies, 6(1): 45–85 March.Balassa B (1988). Public finance and economic development. PPR Working Paper 31,
Washington DC, World Bank.Boone P (1994). The impact of foreign aid on savings and growth. Mimeo. London, London
School of Economics, June.Collier P and Gunning JW (1998). Globalization: implications for Africa. In: Iqbal Z and
Khan MS eds., Trade Reform and Regional Integration in Africa. Washington, DC,International Monetary Fund: 147–181.
Devarajan S, Rajkumar AS and Swaroop V (1998). What Does Aid Finance? FrameworkPaper for the AERC Collaborative Research Project, Managing Transition from AidDependence in Sub-Saharan Africa. Mimeo. Nairobi, Kenya.
Easterly W and Schmidt-Hebbel K (1993). Fiscal deficits and macroeconomic performance indeveloping countries. The World Bank Research Observer 8(2): 69–94. Washinton, DC,World Bank.
Eichengreen B and Mussa M (1998). Capital account liberalisation: Theoretical and practicalaspects. International Monetary Fund Occasional Paper No. 172, Washington, DC, IMF.
Elbadawi IE and Mwega FM (2000). Can Africa’s saving collapse be reverted? The WorldBank Economic Review, 14 (1).
Elbadawi I, Ndulu B and Ndung’u N (1997). Debt overhang and economic in sub-SaharanAfrica. In: Iqbal Z and Kanbur, R, eds., External Financing for Low Income Countries,Washington DC, IMF: 49–76.
Fosu AK (1996). The impact of external debt on economic growth in sub-Saharan Africa.Journal of Economic Development, 21(1): 93–118. June.
Fosu AK (1999). The international dimension and African growth. Background paper for theAERC Collaborative Research Project, Explaining African Economic Growth Performance.Nairobi, Kenya, African Economic Research Consortium.

PUBLIC DEBT AND MACROECONOMIC MANAGEMENT IN SUB-SAHARAN AFRICA 311
Greene JE and Khan MS (1990). The African Debt Crisis. AERC Special Paper No. 3. Nairobi,Kenya, African Economic Research Consortium.
Greene J and Villanueva D (1990). Private investment in developing countries: an empiricalanalysis. IMF Staff Working Paper, No. WP/90/40. Washington, DC, IMF.
International Monetary Fund (IMF) (1999). International Financial Statistics. Washington,DC, IMF.
Inanga EL (1995). Financial sector reforms in sub-Sahara Africa. Paper presented at the XIWorld Congress of the International Economic Association in Tunis, December 18–22.
Mbire B and Atingi M (1997). Growth and Foreign Debt: the Ugandan Experience. AERCResearch Paper No. 66. Nairobi, Kenya, African Economic Research Consortium.
Mlambo K and Mthuli Ncube (1996). Real Exchange Rate and Economic Performance inZimbabwe. Report of an AERC/ICEG Collaborative Project on Macroeconomic Policiesand Exchange Rate Management in African Countries. Nairobi, Kenya, African EconomicResearch Consortium.
Mussa M (2000). Meeting the challenges of globalisation. Paper prepared for the plenarysession of the AERC Biannual Research Workshop, Nairobi, May.
Mwega FM and Ndung’u NS (1996). Macroeconomic Policies and Exchange Rate ManagementKenya. Report of an AERC/ICEG Collaborative Project on Macroeconomic Policiesand Exchange Rate Management in African Countries. Nairobi, Kenya, AfricanEconomic Research Consortium.
Mwega FM and Ndung’u NS (1997). Macroeconomic Policies and Exchange Rate Managementin African Economies. Report of an AERC/ICEG Collaborative Project on Macro-economic Policies and Exchange Rate Management in African Countries, prepared forthe Third AERC Senior Policy Seminar in Accra, Ghana, 27–29 October 1997.
M’Bet A (1996). Macroeconomic Policies and Exchange Rate Management in AfricanEconomies: Côte D’Ivoire and Burkina Faso. Report of an AERC/ICEG CollaborativeProject on Macroeconomic Policies and Exchange Rate Management in AfricanCountries. Nairobi, Kenya, African Economic Research Consortium.
Ndulu BJ and Charles Kimei (1996). Macroeconomic and Exchange Rate Policies in Tanzania.Report of an AERC/ICEG Collaborative Project on Macroeconomic Policies andExchange Rate Management in African Countries. Nairobi, Kenya, African EconomicResearch Consortium.
Nissanke M, Aryeetey E, Hettige H, and Steel WF (1995). Financial Integration andDevelopment in Sub-Saharan Africa. Washington DC, World Bank.
Obstfeld M. (1995). Effects of foreign resource inflows on saving: a methodological overview.Mimeo. Washington, DC, World Bank.
O’Brien FS and TCI Ryan (1999). Aid and reform in Africa: Kenya case study. Mimeo.Washington, DC, World Bank.
O’Connell S and Charles Soludo (1998). Aid intensity. Framework Paper for the AERCCollaborative Research Project, Managing Transition from Aid Dependence in Sub-Saharan Africa. Nairobi, Kenya, African Economic Research Consortium.
Osei B (1995). Ghana: The Burden of Debt Service Payments Under Structural Adjustment.AERC Research Paper No. 33. Nairobi, Kenya, African Economic Research Consortium.

DELPHIN G. RWEGASIRA AND FRANCIS M. MWEGA312
Roe AR and Griggs J (1990). Internal debt management in Africa. AERC Special Paper No. 4.Nairobi, Kenya, African Economic Research Consortium.
Saasa O and Mwanawina I (1998). Zambia – Country Case Study for the AERC CollaborativeResearch Project, Managing Transition from Aid Dependence in Sub-Saharan Africa.Nairobi, Kenya, African Economic Research Consortium.
Serven L (1997). Irreversibility, uncertainty and private investment: Analytical issues and somelessons from Africa. Journal of African Economies, Supplement to Vol 6(3): 229–268.
Ssemogerere G and Kalema W (1998). Uganda – Country case study for the AERCCollaborative Research Project, Managing Transition from Aid Dependence in Sub-Saharan Africa. Nairobi, Kenya, African Economic Research Consortium.
Tanzi V and Blejer Mario I (1984). Fiscal deficits and balance of payments disequilibrium inIMF Adjustment Programmes. In: Joaquin M, ed., Adjustment, Conditionality andInternational Financing. Washington, DC, IMF.
UNCTAD (2000). Capital Flows and Growth in Africa. UNCTAD/GDS/MDPB/7. Geneva,United Nations.
Villanueva D and Mirakhor A (1990). Strategies for financial reforms. IMF Staff Papers,37(3). Washington, DC, International Monetary Fund.
Wijnbergen SV (1989). External debt, inflation and the public sector: Toward fiscal policy forsustained growth. The World Bank Economic Review, 3(3): 297–320.
World Bank (1994). Adjustment in Africa: Reforms, Results and the Road Ahead. New York,Oxford University Press.
World Bank (1989). World Development Report 1989. New York, Oxford University Press.World Bank (1999). Global Development Finance, Washington, DC, World Bank.
CAPITAL FLOWS, CAPITAL ACCOUNT REGIMES AND FOREIGN EXCHANGE REGIMES IN AFRICA 313
CAPITAL FLOWS, CAPITAL ACCOUNT REGIMESAND FOREIGN EXCHANGE REGIMES
IN AFRICA
Léonce Ndikumana*
I. INTRODUCTION
Until recently, the economics literature had paid relatively littleattention to international private capital flows to Africa; most of the dis-cussions focused on official aid (Kasekende, Kitabire and Martin, 1999).However, recent studies have revealed important empirical and policy issuesassociated with private capital flows to Africa, but research in this area isstill severely constrained by the scarcity of data. The existing data on capitalinflows to Africa are fragmented and inconsistent, which makes it difficultto assess the nature, the term structure (long-term versus short-term) andthe sectoral distribution of foreign capital (Bhinda et al., 1999). As a result,it is still difficult to formulate consistent policy recommendations.
* The author is grateful for constructive comments from Kamran Kousari and S.C. Kasahara.He also appreciates research assistance from Ayman Taha.

LÉONCE NDIKUMANA314
This paper investigates a number of issues related to capital accountregimes in Africa over the past two decades. First, recent studies havepointed to a “surge” of private capital inflows to Africa, especially in the1990s (Bhinda et al., 1999). However, the volume of private capital flowsis still small relative to domestic capital formation. Unlike in other devel-oping regions, private capital flows to Africa have not increased enough tooffset the recent decline in grants and official lending. This study discussessome of the factors that constrain private capital inflows to Africancountries.
Second, to varying degrees, African countries have pursued liber-alization of their capital accounts. In some countries, capital accounttransactions have been fully liberalized (see appendix). However, liber-alization has not been accompanied by improvement in macroeconomicperformance. The economic situation in some countries (such as Kenya)has actually deteriorated under liberalization due to excessive speed andpoor sequencing of liberalization. While liberalization can attract inter-national capital, the process can also have adverse effects on the economyin the presence of structural macroeconomic imbalances.
Third, the exchange rate regime shifts around the world have beencharacterized by a “hollowing out” of the middle of the exchange-regimespectrum, where countries are moving from intermediate exchange rateregimes (pegged but managed, or “soft pegs”) to either hard pegs orindependently floating regimes. For African countries, however, thetransition has been asymmetric, mostly involving countries moving fromsoft pegs to independently floating regimes with virtually no movementfrom soft to hard pegs. Most countries still have a relatively weak economicbase, including an underdeveloped financial system, and a weak regulatoryenvironment. Given these conditions, the transition by African countriesto independently floating exchange regimes is puzzling.
Fourth, the establishment of the European Monetary Union (EMU)and the adoption of the euro as the common currency in most of Europehave revived the debate over currency regimes. Some scholars havesuggested that given the increasing globalization of finance and trade,countries should abandon exchange rate management and adopt a strong

CAPITAL FLOWS, CAPITAL ACCOUNT REGIMES AND FOREIGN EXCHANGE REGIMES IN AFRICA 315
currency as legal tender (Berg and Borensztein, 2000; Calvo and Reinhart,1999). For African countries, this could involve dollarization, or – withthe creation of the euro – “euroization”, or possibly the adoption of a strongAfrican currency (e.g. the South African rand) or a regional currency. Thisstudy discusses the benefits and costs such a regime shift would entail oncapital mobility and macroeconomic stability.
Fifth, an important aspect of capital movements in Africa is the highlevel of capital flight. According to recent studies, Africa as a region hasthe highest proportion of private assets held abroad (as a percentage oftotal assets or GDP) compared to other developing regions (Collier, Hoefflerand Pattillo, 1999). Capital flight has been pervasive in the severelyindebted low-income countries, exacerbating a situation already over-burdened by high levels of debt (Boyce and Ndikumana, 2001; Ndikumanaand Boyce, 2002). Capital flight has imposed high costs on Africaneconomies, and it must be regarded as an urgent matter of concern. Capitalflight can be interpreted as the outcome of international portfolio choice,as private actors seek to maximize returns on assets and minimize risk. Itcan also arise from illegal acquisition and use of national resources forprivate enrichment by private individuals and public officials. Controllingcapital flight will require not only the improvement of the macroeconomicconditions to ameliorate incentives for domestic investment, but also thereform of the political and legal systems to improve accountability.
The remainder of the paper is organized as follows. Section II presentsthe trends and patterns of capital flows to Africa over the past two decades,and discusses the constraints to private capital inflows. Section III highlightsrecent reforms of capital account regimes and discusses motivations forcapital account restrictions in Africa. Section IV discusses exchange rateregime transitions, their implications for capital mobility and economicperformance. Section V examines the motivations, advantages, anddisadvantages of dollarization for African countries. Section VI presentssome estimates of capital flight, and discusses the conduits, causes andconsequences of capital flight, as well as implications of capital accountliberalization for capital flight. And finally, section VII summarizes anddiscusses some policy implications.

LÉONCE NDIKUMANA316
II. CAPITAL FLOWS: RECENT TRENDS AND PATTERNS
A. FDI “surge” in Africa: an illusion?
From 1990 to 1999, private net resource flows to all developingcountries increased almost sixfold, from $42 billion to about $239 billion(World Bank, 2000a). Private capital flows increased substantially,bypassing official capital flows. This “surge” in flows to developingcountries has been interpreted as a by-product of global financial integration(World Bank, 1997b). International investors penetrate markets in thedeveloping world in search of investment opportunities that can yield higherreturns and as a way of minimizing risk through portfolio diversification.At the same time, recent economic reforms undertaken by developingcountries have contributed to attracting private capital (Singh, 1999; Singhand Weisse, 1998). Financial integration is supposed to benefit developingcountries by allowing them to tap the pool of global capital and achievehigher economic growth from improved resource allocation throughfinancial markets (Fischer, 1999).
At first glance, capital account movements in Africa share somesimilarities with these global trends. The volume of foreign directinvestment (FDI) has increased substantially over the past decade. AnnualFDI flows to Africa, excluding South Africa, increased from an average of$1.2 billion in the 1981–1985 period to $2.9 billion in 1986–1991, and$5.3 billion in the 1992–1998 period (UNCTAD, 1995a; 1998; 2000).However, a closer look at the recent increase in FDI flows to Africa showsthat it is not as substantial as it appears; it appears to be a “surge” onlybecause the initial levels of flows to most African countries until the early1980s were extremely low (table 1). For example, the average annual FDIinflows to Zimbabwe were only $0.2 million in 1981–1985, increasingto $125 million in 1992–1998; over the same periods, in Zambia theyincreased from $19 million to $108 million, and in Ghana from $8.5 millionto $107 million.
Moreover, FDI still makes a relatively small contribution to capitalformation in African countries. In the 1992–1998 period, FDI as a

CAPITAL FLOWS, CAPITAL ACCOUNT REGIMES AND FOREIGN EXCHANGE REGIMES IN AFRICA 317
Table 1
FDI INFLOWS: VOLUME AND SHARE OFGROSS DOMESTIC INVESTMENT, 1981–1998
($ million and per cent)
FDI inflows FDI as per cent of gross(annual average) domestic investment
1981– 1986– 1992– 1981– 1986– 1992–Country 1985 1991 1998 1985 1991 1998
Algeria -7.9 8.0 9.0 0.0 0.0 0.1Angola 278.0 169.0 420.0 22.5 14.4 33.3Benin 0.5 3.0 16.0 0.3 1.3 4.6Botswana 49.8 59.0 4.0 14.3 7.2 0.3Burkina Faso 1.3 2.0 12.0 0.5 0.4 2.2Burundi 0.5 1.0 1.0 0.3 0.6 0.9Cameroon 158.9 -16.0 23.0 8.1 -0.7 1.6Central African Republic 5.5 2.0 0.0 6.9 1.3 0.2Chad n.a. 12.0 15.0 n.a. 11.2 7.9Congo, Dem. Rep. of -17.8 -10.0 2.0 -1.7 -1.0 0.3Congo 34.0 15.0 26.0 3.9 3.3 3.2Côte d’Ivoire 33.7 49.0 187.0 2.4 4.9 14.5Egypt 688.7 932.0 772.0 8.5 8.7 7.0Ethiopia n.a. n.a. 62.0 n.a. n.a. 6.6Gabon 64.3 53.0 67.0 5.0 4.1 5.3Ghana 8.5 11.0 107.0 3.5 1.6 7.8Guinea 0.2 18.0 12.0 n.a. 4.3 1.7Kenya 15.9 35.0 20.0 1.3 2.2 1.4Lesotho 3.9 11.0 198.0 2.8 3.8 32.0Liberia 20.8 200.0 15.0 15.5 190.5 n.a.Libya -272.2 45.0 -39.0 -3.3 n.a. n.a.Madagascar 2.2 12.0 13.0 0.7 3.7 3.3Malawi 7.6 15.0 26.0 3.4 5.3 8.7Mali 4.3 n.a. 38.0 2.2 n.a. 6.8Mauritania 8.9 3.0 6.0 4.2 1.3 3.0Mauritius 3.4 24.0 25.0 1.5 3.8 2.4Morocco 50.4 132.0 509.0 1.4 2.6 7.4Mozambique n.a. 8.0 70.0 n.a. 2.4 13.7Namibia n.a. 26.0 102.0 n.a. 6.8 16.2Niger 3.1 16.0 14.0 1.2 5.9 8.9Nigeria 400.3 728.0 1 352.0 5.8 17.0 23.6Rwanda 15.9 14.0 3.0 6.7 4.3 1.4Senegal 8.2 13.0 54.0 2.7 2.1 6.8Seychelles 10.1 20.0 34.0 25.2 28.1 20.4Sierra Leone -2.2 -10.0 -1.0 -5.6 -12.3 -1.1South Africa n.a. -27.0 965.0 n.a. -0.2 4.5Sudan n.a. -4.0 94.0 n.a. -0.1 n.a.Swaziland 6.9 53.0 22.0 4.4 37.0 6.7Tanzania, United Rep. of 8.8 n.a. 102.0 n.a. n.a. 8.9Togo 6.9 10.0 21.0 4.3 3.8 10.4Tunisia 207.6 83.0 474.0 7.6 2.9 10.0Uganda n.a. n.a. 111.0 n.a. n.a. 14.2Zambia 19.2 100.0 108.0 3.7 24.3 22.6Zimbabwe 0.2 10.0 125.0 0.0 0.7 8.6
Source: UNCTAD (1995a, 1998 and 2000).

LÉONCE NDIKUMANA318
percentage of gross domestic investment was less than 5 per cent for 17 ofthe 41 countries in the sample in table 1 or less than 10 per cent for 30 ofthose countries (excluding countries with missing data). The notableexceptions were Nigeria, Seychelles and Zambia with ratios over 20 percent, and Angola and Lesotho with ratios over 30 per cent. These countriesalso had high gross investment rates. For instance, the share of grossdomestic investment in GDP for the 1992–1998 period was 23 per cent forAngola, 77 per cent for Lesotho and 39 per cent for Seychelles (WorldBank, 2000b).
(i) Africa’s shrinking share of FDI flows to developing countries
Africa’s share in total FDI flows to developing countries has beendeclining since the second half of the 1980s, while the absolute volumehas been increasing (figure 1 and table 2). In 1999, sub-Saharan Africa(SSA) received only 4.3 per cent of total FDI inflows to the developingworld, down from an average of 10.5 per cent in the 1981–1989 period. Itis clear that Africa has not benefited substantially from this global increasein capital flows as much as other developing countries. The low levels ofFDI to Africa cannot be fully explained by rates-of-return considerations,as such rates have been comparable to or even higher than those in otherdeveloping regions (figure 2).
(ii) The changing distribution of FDI in Africa
FDI flows to Africa have traditionally been concentrated in extractiveindustries. The top 10 beneficiaries of FDI inflows accounted for 82 percent of total FDI inflows to Africa (excluding South Africa) in the 1992–1998 period (figure 3). Oil exporters have been the main beneficiaries.However, their share has declined over the years, from 70 per cent of totalinflows into Africa in the second half of the 1980s to 59 per cent in the 1990s.
While the initial drive behind FDI flows to Africa was the extractionof primary resources, especially oil and minerals, the destination for foreigncapital seems to be changing slowly. Capital inflows are low, stagnating,

CAPITAL FLOWS, CAPITAL ACCOUNT REGIMES AND FOREIGN EXCHANGE REGIMES IN AFRICA 319
Figure 1
CAPITAL FLOWS TO AFRICA:VOLUME AND SHARE IN DEVELOPING COUNTRIES
Source: World Bank (1997a and 2000a); for FDI: UNCTAD (1995a,1998, 2000).Note: SSA = sub-Saharan Africa; DC = developing countries.
Net flow of long-term debt, 1989–1999
-1 000
0
1 000
2 000
3 000
4 000
5 000
6 000
7 000
8 000
1989 '91 '93 '95 '97 '99
Milli
on 1
995
$
-5
0
5
10
15
20
Shar
e (p
er c
ent)SSA
SSA's share
Portfolio equity, 1989–1999
0
1 000
2 000
3 000
4 000
5 000
6 000
1989 '91 '93 '95 '97 '99
Milli
on 1
995
$
0
5
10
15
Shar
e (p
er c
ent)
SSA
SSA's share
FDI inflows (excluding South Africa), 1981–1999
0
1 000
2 000
3 000
4 000
5 000
6 000
7 000
8 000
9 000
10 000
1981 '84 '87 '90 '93 '96 '99
Milli
on 1
995
$
0
5
10
15
20
Shar
e (p
er c
ent)
Real volume
Africa's share
Share of private net resource flows, 1970–1999
46
37
7
40 41
5258
43
79 82
0
10
20
30
40
50
60
70
80
90
100
1970 '80 '90 '95 '99
Per c
ent
SSADC

LÉONCE NDIKUMANA320Ta
ble
2
INTE
RN
ATIO
NA
L C
API
TAL
FLO
WS
TO S
UB
-SA
HA
RA
N A
FRIC
A:
VOLU
ME
AN
D S
HA
RE
IN D
EVEL
OPI
NG
CO
UN
TRIE
S, 1
989–
1999
(Mill
ions
of
cons
tant
199
5 do
llars
)
Indi
cato
r19
8919
9019
9119
9219
9319
9419
9519
9619
9719
9819
99
Long
-term
deb
ta
Volu
me
7 05
54
306
3 70
53
709
5 24
54
520
3 97
382
12
246
-428
1 34
7Sh
are
(per
cen
t)17
.39.
27.
85.
86.
86.
94.
80.
82.
0n.
a.3.
0
Gra
nts
(exc
l. te
ch. c
oope
ratio
n)Vo
lum
e10
711
13 0
4811
893
12 0
9110
890
12 3
9611
414
9 98
99
464
10 2
7410
127
Shar
e (p
er c
ent)
49.8
41.7
29.7
36.0
36.6
36.6
34.9
36.5
37.3
37.8
38.3
FDI
Volu
me
5 33
52
361
2 99
83
377
3 82
65
835
4 69
95
399
6 74
37
540
8 97
4Sh
are
(per
cen
t)16
.86.
56.
96.
25.
05.
44.
23.
83.
94.
24.
3
Portf
olio
equ
ity in
vest
men
tVo
lum
e0
00
153
183
891
4 86
81
967
1 47
468
149
3Sh
are
(per
cen
t)0.
00.
00.
01.
30.
32.
413
.54.
15.
04.
41.
8
Net
priv
ate
reso
urce
flow
sVo
lum
en.
a.1
377
n.a.
n.a.
2 88
75
087
9 50
15
424
9 39
63
461
7 26
4Sh
are
(per
cen
t)n.
a.3.
0n.
a.n.
a.1.
72.
84.
61.
93.
21.
33.
0
Sour
ce:
Wor
ld B
ank
(199
7a, 2
000a
); U
NC
TAD
(199
8; 2
000)
.N
ote:
Nom
inal
val
ues
are
conv
erte
d in
to re
al v
alue
s us
ing
the
Uni
ted
Sta
tes
prod
ucer
pric
e in
dex.
aN
et fl
ows
of lo
ng-te
rm d
ebt,
excl
udin
g IM
F cr
edit.

CAPITAL FLOWS, CAPITAL ACCOUNT REGIMES AND FOREIGN EXCHANGE REGIMES IN AFRICA 321
and even declining in some oil exporters such as Cameroon, Congo andGabon (table 3). At the same time, some “newcomers” are attractingincreasing attention from international investors (figure 4). Noteworthycases are Mozambique, Uganda, the United Republic of Tanzania, Zambia,
Figure 2
RATES OF RETURNS ON UNITED STATES FDI, 1980–1997a
(Per cent)
Source: UNCTAD (1995a, and 1998).a The rate of return is net income of United States foreign affiliates divided by the average of the
beginning-of-year and end-of-year FDI stock.
Rates of return in Africa by sector, 1980–1996
0
10
20
30
40
50
60
70
1980 1982 1984 1986 1988 1990 1992 1994 1996
Per c
ent
Primary Manufacturing Tertiary
Rates of return by region, 1980–1997
05
101520253035404550
1980 1982 1984 1986 1988 1990 1992 1994 1996
Per c
ent
Africa Asia Latin America LDCs

LÉONCE NDIKUMANA322
and Zimbabwe. These are also among the African countries that have madesignificant progress in economic policy reforms over the last decade, whichhave contributed to price stability, fiscal discipline, improvement of theeconomic infrastructure, and the creation of a better environment for privateinvestment. There is also evidence that the returns to investment in theextractive sectors are not higher than those in the manufacturing sector(figure 2), which may partly explain the increasing sectoral diversificationof FDI.
B. Other capital flows to Africa
Private capital flows to developing countries have increased sig-nificantly relative to official capital flows over the last two decades. Theshare of private capital flows in total net resource flows to all developingcountries increased from 58 per cent in 1980 to 82 per cent in 1999. By
Figure 3
DISTRIBUTION ON FDI INFLOWS IN AFRICAa
(Per cent)
Source: UNCTAD, World Investment Report (various).a Excluding South Africa.
107.5
88.882.085.3
70.459.2
0
25
50
75
100
125
1981–1985 1986–1991 1992–1998
Per c
ent
Top 10 share Oil exporters share

CAPITAL FLOWS, CAPITAL ACCOUNT REGIMES AND FOREIGN EXCHANGE REGIMES IN AFRICA 323Ta
ble
3
FDI F
LOW
S TO
SEL
ECTE
D A
FRIC
AN
CO
UN
TRIE
S, 1
986–
1999
(Mill
ions
of
cons
tant
199
5 do
llars
)
Cou
ntry
1986
1987
1988
1989
1990
1991
1992
1993
1994
1995
1996
1997
1998
1999
Oil
expo
rtin
g co
untr
ies
Ango
la78
112
153
222
-360
712
307
317
176
472
177
403
1 11
71
803
Cam
eroo
n24
1578
0-6
7-1
631
5-9
734
4450
40C
ongo
2752
103
85
415
65
38
94
5Eg
ypt
1 51
61
150
1 38
81
389
788
271
489
517
1 30
159
662
386
81
080
1 49
1G
abon
137
109
155
-34
79-5
913
5-1
20-1
04-1
1330
514
021
219
9N
iger
ia20
873
244
02
092
631
762
955
1 41
12
030
1 07
91
558
1 50
51
054
1 39
2Tu
nisi
a78
112
7188
8013
456
048
558
637
834
335
867
236
6
Oth
ers
Bots
wan
a87
138
4747
41-9
-2-3
01-1
570
6998
9011
1C
ôte
d’Iv
oire
8810
761
2123
17-2
4692
122
268
295
440
315
277
Keny
a41
520
6961
206
24
3213
3942
42Le
soth
o2
724
1418
93
1628
327
528
026
326
313
5M
aurit
ius
921
2840
4420
1616
2119
3654
1249
Moz
ambi
que
00
63
1025
2734
3645
7163
214
382
Seyc
helle
s17
2327
2629
2110
2031
4029
5355
60So
uth
Afric
a-6
6-9
151
41
517
1 88
322
7-4
5-2
039
41
241
800
3 73
256
31
368
Tanz
ania
, Uni
ted
Rep
. of
-10
-15
7-3
313
2152
150
146
155
172
182
Uga
nda
00
-5-7
-16
13
5891
125
117
171
211
179
Zam
bia
3591
108
182
218
3648
5541
9711
420
219
916
2Zi
mba
bwe
10-3
8-2
1-1
1-1
33
2140
4211
879
132
445
59
Sour
ce:
UN
CTA
D, W
orld
Inve
stm
ent R
epor
t (va
rious
edi
tions
, 199
2 to
200
0). N
omin
al v
alue
s ar
e co
nver
ted
into
real
val
ues
usin
g th
e U
nite
d St
ates
pro
duce
r pric
e in
dex.
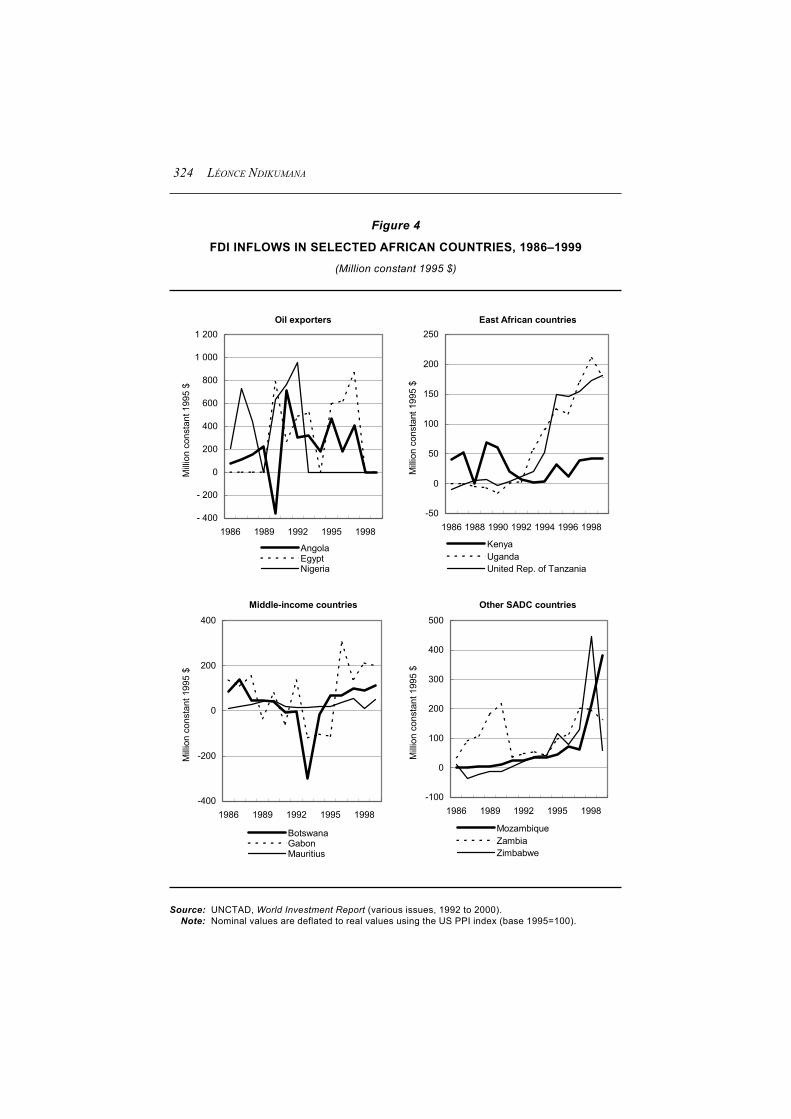
LÉONCE NDIKUMANA324
Figure 4
FDI INFLOWS IN SELECTED AFRICAN COUNTRIES, 1986–1999(Million constant 1995 $)
Source: UNCTAD, World Investment Report (various issues, 1992 to 2000).Note: Nominal values are deflated to real values using the US PPI index (base 1995=100).
Oil exporters
- 400
- 200
0
200
400
600
800
1 000
1 200
1986 1989 1992 1995 1998
Milli
on c
onst
ant 1
995
$
AngolaEgyptNigeria
East African countries
-50
0
50
100
150
200
250
1986 1988 1990 1992 1994 1996 1998
Milli
on c
onst
ant 1
995
$
KenyaUgandaUnited Rep. of Tanzania
Middle-income countries
-400
-200
0
200
400
1986 1989 1992 1995 1998
Milli
on c
onst
ant 1
995
$
BotswanaGabonMauritius
Other SADC countries
-100
0
100
200
300
400
500
1986 1989 1992 1995 1998
Milli
on c
onst
ant 1
995
$
MozambiqueZambiaZimbabwe
CAPITAL FLOWS, CAPITAL ACCOUNT REGIMES AND FOREIGN EXCHANGE REGIMES IN AFRICA 325
comparison, over the same period, the ratio for sub-Saharan Africa (SSA)increased only slightly, from 37 per cent to 41 per cent (figure 1).
The volume of official capital inflows to SSA has also decreased sincethe 1980s. Net long-term lending has declined both in absolute volumeand as a share of total net lending to all developing countries. SSA’s sharein grants has slightly declined, although not as markedly as long-termlending. The decline in official long-term lending and grants has not beencompensated by any increase in private lending. Sub-Saharan Africa’s sharein long-term lending to developing countries declined from 17 per cent in1989 to just 3 per cent in 1999. The increase in FDI flows to Africa inrecent years has been lower compared to other regions, and other privatecapital flows, such as equity portfolio investments, have declined afterreaching a peak in 1995 (figure 1 and table 2). In 1999, portfolio equityinvestment in SSA was only $493 million in nominal terms, compared to$1.1 billion for South Asia and $3.6 billion for Latin America and theCaribbean (World Bank, 2000a). After increasing substantially from 1992to 1995 (from $153 million to $4.9 billion in constant 1995 dollars), thevolume of portfolio investment in SSA declined sharply thereafter. Privatenet resource flows declined between 1980 and 1990 and then increased,while official net resource flows declined. This explains the increase inthe share of private net resource flows after 1990 (figure 1).
C. Constraints on private capital inflows into Africa
Among the many constraints on the expansion of private capitalinflows into Africa are the weakness of the macroeconomic environment,underdeveloped financial systems, high country risk, and exchange ratemisalignment.
(i) The weak macroeconomic environment
The weakness of the macroeconomic environment in African countriesis the result of a range of factors including low resource endowment,

LÉONCE NDIKUMANA326
exogenous shocks, and misguided macroeconomic policies that haveaccentuated the adverse effects of exogenous shocks. Economic perfor-mance has been dismal in many countries, especially since the 1980s(Collier and Gunning, 1999a; 1999b). However, evidence shows thatcountries that have consistently pursued economic reforms aimed atredressing economic imbalances have experienced an improvement ineconomic performance, which has increased investor confidence. This mayexplain the recent increase in foreign capital inflows into countries suchas Mozambique, Uganda and the United Republic of Tanzania (table 3).
(ii) Underdeveloped financial systems
The level of sophistication of the financial system is an importantdeterminant both of the ability of a country to attract international capitaland the ability of the financial system to withstand shocks to global capitalflows. With the exception of a few countries, such as South Africa, Egypt,Morocco, and probably Kenya, Mauritius and Nigeria, most Africancountries still have an underdeveloped financial system.1 The followingfeatures are especially worth emphasizing:
• Size and depth: In most African countries, financial systems are stillshallow. With the exception of South Africa, African financial marketsoffer a limited range of financial products. Bank lending is predomi-nantly short term, government securities are mostly of short maturity,banks in many countries do not issue credit cards (issued in only15 sub-Saharan countries in 1997), and inter-bank lending is stillunderdeveloped (Gelbard and Leite, 1999).
• Low stock market development: The majority of African countries donot have active stock markets; most of them, where they exist,including the long-established stock markets such as the EgyptianStock Exchange, are still small and illiquid (Ndikumana, 2001).
• Poor performance: The banking sector in African countries is stillcharacterized by inefficiencies in credit allocation and poor loanrepayment enforcement mechanisms, which result in a high proportion

CAPITAL FLOWS, CAPITAL ACCOUNT REGIMES AND FOREIGN EXCHANGE REGIMES IN AFRICA 327
of non-performing loans. Gelbard and Leite (1999) reported an averageshare of non-performing loans of over 20 percent in a sample of 38 sub-Saharan countries in 1997.
• Weak regulatory and supervisory framework: Some of the basicinstitutional requirements for effective banking supervision (e.g.modern banking laws, central bank autonomy) and prudentialregulation (e.g. establishment and enforcement of minimum bankcapitalization ratios, deposit insurance) are still non-existent in manycountries (Gelbard and Leite, 1999; Mehran et al., 1998; Nissankeand Aryeetey, 1998).
In the context of adjustment programmes, some countries have madesignificant progress in reforming their banking systems, in particular, byestablishing new banking laws or reforming existing ones to improvesupervision and prudential regulation. Moreover, the participation of theState in the banking sector has decreased as a result of the privatization ofState-owned banks and the easing of licensing requirements, which haveaccelerated the creation of new private banks. To the extent that thesereforms are supported by market-friendly macroeconomic policies(especially fiscal discipline and non-inflationary monetary policy), theywill enhance investor confidence and attract more foreign private capital.
(iii) High country risk
Africa has traditionally been considered as being “atypically risky”with a “capital-hostile environment” (Collier and Pattillo, 2000: 3). Surveysreveal that investors (foreign as well as local) view the main obstacles toinvestment as being fear of political instability and the risk of policyreversal. High country risk is also attributable to weak and volatilemacroeconomic fundamentals, such as variable inflation rates, exchangerate instability and chronic fiscal deficits. Another important factor of highinvestment risk in Africa is effective distance as perceived by internationalinvestors, which is influenced by geographic distance, transactions costsand cultural/psychological distance.

LÉONCE NDIKUMANA328
African countries can improve their risk ratings through sustainedeconomic reform. It should be noted, however, that international ratingagencies tend to rate Africa as being riskier than is warranted by objectiveconditions (Haque, Mark and Mathieson, 2000). As a result, the impact ofeconomic reforms on risk rating for a particular country may be retardedby a “bad neighbourhood” effect.
III. CAPITAL ACCOUNT REGIMES:OPENNESS AND RELATED ISSUES
A. Recent developments in capital account policies
(i) Towards greater openness
In the context of the macroeconomic reforms initiated in the 1980s,which accelerated in the 1990s, many African countries moved towardsgreater capital account openness by abolishing or relaxing existing capitalcontrols. The text in the appendix and table A.1 provide a summary ofimportant recent reforms for some countries. The following is a non-exhaustive list of samples of recent reforms in the current account regimes.
• Limits to foreigners’ participation in domestic investment have beenrelaxed and even abolished in some countries. However, governmentshave maintained controls in strategic sectors, such as crude oil andgas in the case of Nigeria.
• Countries have relaxed or abolished restrictions on non-residents’ability to repatriate dividends, interest income, and proceeds of salesor liquidation of the initial investments.
• Investment by residents in foreign-currency-denominated assetslocally and abroad is now allowed in a number of countries. However,even in countries with relatively liberal regimes, some limitations aremaintained for strategic reasons. For example, in South Africa, the
CAPITAL FLOWS, CAPITAL ACCOUNT REGIMES AND FOREIGN EXCHANGE REGIMES IN AFRICA 329
Government maintains a limit on the amount of investment abroad byresidents. Corporations can invest up to 250 million rand within theSouthern African Development Community (SADC) region (there areno limits for Lesotho, Namibia, and Swaziland) and 50 million randelsewhere. Domestic/resident institutional investors are allowed toinvest abroad up to 15 per cent of their assets, while the maximumallowed for individuals is 750,000 rand.
• Recent reforms have allowed non-residents to purchase stocks andgovernment securities. Kenya and South Africa are the leadingreformers in capital account liberalization.
(ii) Liberalization in the context of regional arrangements
Liberalization of capital account regimes has also accelerated in thecontext of new or existing regional arrangements. With the exception ofthe Communauté financière africaine (CFA), which is an integratedmonetary union, African regional arrangements have traditionally empha-sized trade integration. Recently, countries have pursued greater capitalmobility. A noteworthy example is the Cross-Border Initiative in Easternand Southern Africa (CBI) (Fajgenbaum et al., 1999). However, in thecase of overlapping regional arrangements, economic incentives can bedistorted when obligations under the various bodies are inconsistent. Forexample, it is not clear how countries that belong to both the CBI andSADC can reconcile discrepancies in tariff arrangements, since some ofthese are different between the two bodies. Harmonization of obligationsacross regional entities is necessary to allow countries to take full advantageof regional integration.
(iii) Scope, speed and sequencing of liberalization
Three important points are worth emphasizing with respect to recentcapital account liberalization in Africa. First, despite the visible trendtowards liberalization, there is still a wide diversity in capital accountopenness across the continent. Some countries have very open capital

LÉONCE NDIKUMANA330
accounts, such as Kenya and South Africa, with few restrictions on FDIand other capital account transactions by individuals and firms. In othercountries, transactions are tightly controlled, including restrictions basedon the sectoral allocation of FDI (table A.1).
Second, countries must pay serious attention to the scope, speed andsequencing of capital account liberalization to minimize potential adverseeffects of openness. Evidence shows that speedy liberalization results inmacroeconomic instability, generating effects that are opposite to theintended objectives of liberalization. A compelling example is Kenya.Facing an imminent crisis at the end of the 1980s, the Kenyan Governmentembarked on a set of aggressive reforms, including the opening up of thecapital account and liberalization of the foreign exchange market. However,the crisis continued throughout the 1990s as a result of severe macro-economic imbalances. Capital account liberalization ultimately increasedthe country’s vulnerability to fluctuations in capital flows, especially byproviding “legal” channels of capital flight (Ariyoshi et al., 2000: 67).
Third, to attract foreign capital, capital account openness must besupported by broad-based macroeconomic reforms aimed at improving theinvestment environment. In particular, countries need to pursue fiscaldiscipline, responsible monetary policy committed to price stability,2 andinstitutional reforms aimed at fostering a legal and regulatory environmentthat is conducive to financial intermediation. There is evidence thatcountries that have made progress in economic and institutional reformand have improved the credibility of their macroeconomic policy are alsoattracting greater attention among international investors.
B. Motivations for capital account restrictions in Africa
(i) Why liberalize the capital account?
Proponents of capital account liberalization have advanced two mainarguments in its favour (Fischer, 1999). The first is that capital accountliberalization is an “inevitable step on the path of development which cannot

CAPITAL FLOWS, CAPITAL ACCOUNT REGIMES AND FOREIGN EXCHANGE REGIMES IN AFRICA 331
be avoided and should be embraced” (Fischer, 1999: 2). Historical evidencedemonstrates, so the argument goes, that the most advanced economieshave open capital accounts. The second, and arguably more powerful,motivation for capital account liberalization is that the potential benefitsof liberalization outweigh the costs. Potential benefits include increasedaccess to a larger and more diversified pool of funds by investors (localand foreign), resulting in greater opportunities for portfolio diversification.
However, even proponents of capital account liberalization acknowl-edge important risks associated with it (Fischer, 1999: 2–3). Internationalcapital flows – especially short-term flows – tend to be highly volatile andcapital reversals are costly. Capital markets tend to react erraticallyfollowing shocks to the economy. Through contagion and spillover effects,capital market shocks tend to spread quickly across countries, oftenirrationally, reflecting herd behaviour among investors. The risks associatedwith capital account openness are particularly high for countries with weakmacroeconomic fundamentals, underdeveloped financial systems and poorbanking regulatory institutional infrastructure. African countries shouldtherefore exercise great caution in liberalizing their capital accounts.
(ii) Capital controls versus capital restrictions
The literature on the management of international capital flows hasfocused primarily on the desirability and effects of capital controls.However, as Cooper (1999) points out, capital controls are a subset of alarger set of policy options for managing international capital flows. Suchcontrols are typically quantitative limitations on capital flows. There are,however, administrative and price penalties on capital movements that mayhave similar effects as capital controls. These include differential reserverequirements on assets, and tax preferential treatment of certain categoriesof capital deemed favourable for economic growth (such as FDI, as opposedto short-term portfolio equity investment). Therefore, countries have morethan the option of imposing or not imposing capital controls. They canalso select and sequence various strategies in order to manage the volumeand distribution of capital inflows and the volume of capital outflows.
LÉONCE NDIKUMANA332
The debate over capital restrictions is almost ironic in the context ofAfrican countries. Because capital inflows are still low, one may arguethat African countries need to attract them, not control them. However,there are good reasons for a proactive approach to capital accountmanagement in African countries. The conditions for full liberalization ofcapital movements are very hard to meet, and they are largely lacking inmost African countries. These conditions include low barriers to inter-national trade, a well-developed, well-diversified and well-regulatedfinancial system, and no large differences between a country’s and theworld’s tax regime relating to capital (Cooper 1999: 124). The followingare some of the reasons why African countries should selectively imposecertain restrictions on capital flows.
Argument 1: Protecting domestic financial systems
A surge in international capital inflows can destabilize domesticfinancial systems. This is particularly the case for short-term capital andother forms of capital flows that have a high propensity for quick andsudden reversal. Given that financial systems are still underdeveloped inmost African countries and that the regulatory framework is still weak, itmay be necessary to adopt a selectively proactive approach to capitalaccount management. For example, South Africa suffered from the conta-gion effects of the Asian financial crisis in 1997–1998, whereby shakeninvestor confidence caused large capital outflows and a depreciation ofthe rand.
Argument 2: Shaping industrial growth
Evidence shows that private capital inflows to African countries stillprimarily target extractive activities, which contributes to perpetuating thedependence on the primary sector. Because extractive activities arepredominantly capital-intensive, capital inflows in those areas have littlecontribution to employment creation. It is desirable to design policies thatcan redirect foreign capital into new, growth-promoting activities. Suchpolicies include imposing a minimum stay requirement on foreign capital,establishing differential reserve requirements in favour of growth-promoting

CAPITAL FLOWS, CAPITAL ACCOUNT REGIMES AND FOREIGN EXCHANGE REGIMES IN AFRICA 333
capital, and providing preferential tax treatment to foreign capital that isdirected to new employment-creating and growth-promoting activities.
Argument 3: Redistributive capital restrictions
In Africa, as in other developed and developing countries, participationin capital markets is heavily skewed in favour of the wealthiest segmentsof the population. The majority of citizens are bystanders who seldombenefit from financial market booms, yet they often bear disproportionatelyhigh costs of financial fragility. African countries can devise policies aimedat redistributing the gains from expansion of the capital market, which cancontribute to improving the living standards of the population. For example,taxation of capital gains with the aim of increasing funding for sociallyproductive public investment (e.g. health, education and nutrition) caninduce significant progressive effects.
Argument 4: Protecting export performance
Unregulated capital flows can result in sharp fluctuations in exchangerates that can damage export performance. High capital inflows that resultin an appreciation of the national currency will discourage internationaldemand for national exports while encouraging imports of foreign goods;this will depress the current account balance. For emerging marketeconomies in Africa and others that have experienced a substantial increasein capital inflows, national authorities must consider options for activemanagement of capital flows to minimize the potential adverse effects ofthose flows on trade.

LÉONCE NDIKUMANA334
IV. EXCHANGE RATE REGIMES: TRANSITIONS ANDIMPLICATIONS FOR CAPITAL MOBILITY
A. The global context: regime shifts and the “hollowing-out”of the middle ground
Recent studies have observed marked shifts in exchange rate regimesaround the world. These shifts are characterized by a “hollowing out” ofthe middle of the exchange rate regime spectrum; countries are movingfrom intermediate regimes (“soft pegs”) to very hard pegs and independentlyfloating regimes (Fischer, 2001; Mussa, et al., 2000; Calvo and Reinhart,2000).3 These developments have been interpreted as the natural outcomeof the increasingly global integration of finance and trade. The recent crisesexperienced by emerging market economies have motivated research onthe connections between the chances and severity of capital account crisesand the exchange rate regimes. Some scholars have concluded that, withfew exceptions, the effects of these crises were the worst in those emergingmarket economies that had either explicitly fixed exchange rate pegs orwhere movements in exchange rates were artificially constrained. Incontrast, the argument goes, emerging market economies that allowedflexibility of exchange rates fared better during crises (Mussa et al.,2000: 21).
Whether the recent experiences of crises in emerging marketeconomies constitute evidence for a causal relationship between financialcrises and exchange rate regimes remains unclear. Nonetheless, the natureof the exchange rate regime is relevant because it can determine the abilityof a country to hedge against a crisis, and the magnitude of the crisis maydepend on the particular exchange rate regime in place. In practice,however, sorting out the effects attributable to the exchange rate regime isdifficult, partly because in many cases financial market disturbances onlyamplify the effects of shocks that originate from the real side or fromfundamental domestic policy misalignments. Recent experiences show thatthe main causes of financial crises are: the weakness of the domesticfinancial system (as in the Russian Federation and Brazil) and excessive
CAPITAL FLOWS, CAPITAL ACCOUNT REGIMES AND FOREIGN EXCHANGE REGIMES IN AFRICA 335
foreign-currency-denominated borrowing in the corporate sector (as in theRepublic of Korea and Thailand), the loss in competitiveness of the exportsector, and other changes in the fundamental aspects of the economy.Nevertheless, for countries that are significantly integrated in the globalfinancial markets, the choice of the exchange rate regime matters. Inparticular, such countries may find it costly to maintain rigidly fixedexchange rates.
B. Exchange rate regime shifts in Africa: asymmetrictransition
Many African countries have liberalized their foreign exchangemarkets and moved away from soft pegs towards independently floatingor managed floating exchange rate regimes (table A.2). However, thesetransitions have been asymmetric. While countries have moved out of themiddle of the exchange regime spectrum, there has been virtually nomovement out of or into the category of hard-peg regimes (table A.2 andfigure 5). Out of 51 African countries, 53 per cent were classified as havingsoft-peg regimes in 1991. In 1999, only 24 per cent of the countries are inthis category. In contrast, while the category of independently floatingexchange rates counted only 9 countries (or 18 per cent of the sample) in1991, the number had increased to 24 (or 47 per cent of the sample) in1999. Only Guinea-Bissau moved from the intermediate category to thehard-pegs category. The transition matrix in table 4 indicates that over55 per cent of the countries (15 out of 27 countries) that were in the soft-pegs category in 1991 had adopted an independent floating regime by 1999.In contrast, no shifts – with a single exception of Namibia which shiftedfrom a hard peg to a soft peg – occurred among countries in both extremesof the exchange regime spectrum. The countries in the hard-pegs categoryin 1999 are older members of the CFA zone, again except for Namibia,and Guinea-Bissau which joined the CFA zone in 1997. Similarly, all ninecountries in the independent-float category in 1991 were still in the samecategory in 1999. The existing evidence on African countries is inconclusiveas to the relative advantages and disadvantages of alternative exchangerate regimes. Some of the findings are discussed below.

LÉONCE NDIKUMANA336
Figure 5
EXCHANGE RATE REGIME TRANSITION IN AFRICAAND OTHER REGIONS FROM 1991 TO 1999
(Number of countries by regime and share in the sample)
Source: Fischer (2001).Note: Figures in square brackets indicate the number of countries in the corresponding exchange rate
regime category.a Excluding emerging markets.b Excluding developing countries and emerging markets.
Africaa
32
53
15
32
21
47
0
10
20
30
40
50
60
70
80
90
100
Hard pegs Soft pegs Floats
Per c
ent
1991 share 1999 share
[15] [15]
[25]
[10][7]
[22]
All Africa
29
53
18
2924
47
0
10
20
30
40
50
60
70
80
90
100
Hard pegs Soft pegs Floats
Per c
ent
1991 share 1999 share
All IMF membersb
21
60
1924
37 39
0
10
20
30
40
50
60
70
80
90
100
Hard pegs Soft pegs Floats
Per c
ent
1991 share 1999 share
[22] [31]
[62]
[48]
[20]
[51]
All IMF members
16
62
2324
34
42
0
10
20
30
40
50
60
70
80
90
100
Hard pegs Soft pegs Floats
Per c
ent
1991 share 1999 share
[25]
[45]
[98]
[63]
[36]
[77]
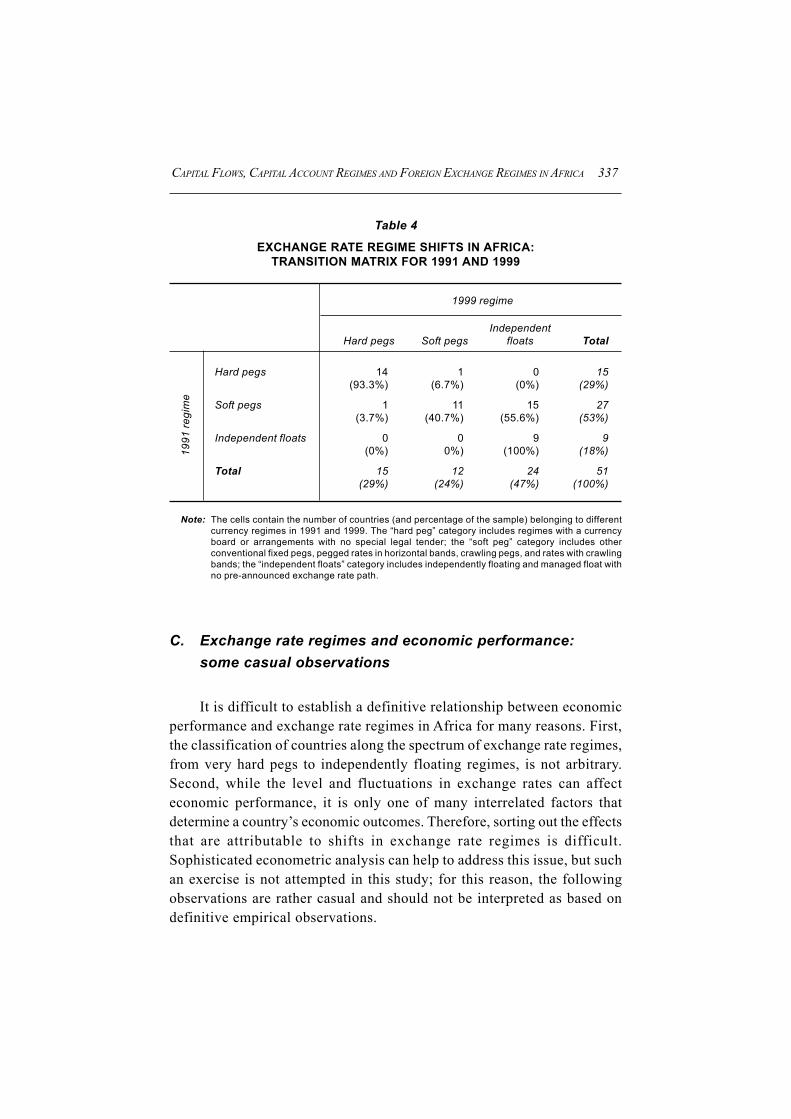
CAPITAL FLOWS, CAPITAL ACCOUNT REGIMES AND FOREIGN EXCHANGE REGIMES IN AFRICA 337
C. Exchange rate regimes and economic performance:some casual observations
It is difficult to establish a definitive relationship between economicperformance and exchange rate regimes in Africa for many reasons. First,the classification of countries along the spectrum of exchange rate regimes,from very hard pegs to independently floating regimes, is not arbitrary.Second, while the level and fluctuations in exchange rates can affecteconomic performance, it is only one of many interrelated factors thatdetermine a country’s economic outcomes. Therefore, sorting out the effectsthat are attributable to shifts in exchange rate regimes is difficult.Sophisticated econometric analysis can help to address this issue, but suchan exercise is not attempted in this study; for this reason, the followingobservations are rather casual and should not be interpreted as based ondefinitive empirical observations.
Table 4
EXCHANGE RATE REGIME SHIFTS IN AFRICA:TRANSITION MATRIX FOR 1991 AND 1999
1999 regime
IndependentHard pegs Soft pegs floats Total
Hard pegs 14 1 0 15(93.3%) (6.7%) (0%) (29%)
Soft pegs 1 11 15 27(3.7%) (40.7%) (55.6%) (53%)
Independent floats 0 0 9 9(0%) 0%) (100%) (18%)
Total 15 12 24 51(29%) (24%) (47%) (100%)
Note: The cells contain the number of countries (and percentage of the sample) belonging to differentcurrency regimes in 1991 and 1999. The “hard peg” category includes regimes with a currencyboard or arrangements with no special legal tender; the “soft peg” category includes otherconventional fixed pegs, pegged rates in horizontal bands, crawling pegs, and rates with crawlingbands; the “independent floats” category includes independently floating and managed float withno pre-announced exchange rate path.
1991
regi
me

LÉONCE NDIKUMANA338
Tables 5 and 6 present some indicators of economic performance forAfrican countries classified by exchange rate regime. The results showthat performance indicators have varied widely within different regimecategories. The information is summarized in table 7, which presents thepercentage of countries in each category whose economic indicatorsimproved in the 1990s compared to the 1980s.
For the majority of countries in the hard-peg category (CFA zonemembers), there was little improvement in the growth of per capita GDPfrom the 1980s to the 1990s. While 50 per cent of the countries in thisgroup had a positive growth rate in the 1990s, the growth rate was higherthan in the 1980s for only 36 per cent of these countries. Furthermore,inflation was higher and trade lower in the 1990s compared to the 1980sfor 71 per cent of the countries in this group. However, two importantempirical facts are worth emphasizing for the CFA zone. First, countriesin this group experienced much lower inflation rates than countries in theother groups, both in the 1980s and the 1990s. Virtually all the countriesin the hard-peg group had single-digit inflation rates (except for Guinea-Bissau, which joined the CFA zone in 1997). Second, as the data in table 8show, countries in the CFA zone experienced some improvement ineconomic performance following the devaluation of the CFA franc in 1994.4
The average annual growth rate of GDP per capita for the group was higherin 1995–1998, at 2.3 per cent, than in 1990–1994, at -2.8 per cent. Exportsalso were higher in 1995–1998 for all the countries in the group, with theexport-to-GDP ratio averaging 36 per cent in 1995–1998 compared to 28 percent in 1990–1994. No similar patterns are observed in other regionalgroupings on the continent (see table 9 for the SADC group).5
In the soft-pegs category, a larger proportion of countries (82 per cent)achieved positive GDP growth, although growth was positive and higherin the 1990s than in the 1980s for only 36 per cent of these countries. Thisgroup also experienced improvement in inflation (lower in 82 per cent ofthe countries), in the current account balance (which improved in 60 percent of the countries) and in international reserves (with a higher stock ofreserves in 80 per cent of the countries).
The proportion of countries showing improvements in GDP growthwas lowest in the independent floats category. Inflation was higher in more

CAPITAL FLOWS, CAPITAL ACCOUNT REGIMES AND FOREIGN EXCHANGE REGIMES IN AFRICA 339Ta
ble
5
GD
P G
RO
WTH
, CU
RR
ENT
AC
CO
UN
T, IN
TER
NAT
ION
AL
RES
ERVE
S A
ND
INFL
ATIO
N IN
AFR
ICA
N C
OU
NTR
IES
BY
EXC
HA
NG
E R
ATE
REG
IME,
198
0–19
98
Gro
wth
of p
er c
apita
GD
PC
urre
nt a
ccou
nt b
alan
ceN
et in
tern
atio
nal r
eser
ves
Infla
tion
(Ave
rage
ann
ual p
erce
ntag
e(A
nnua
l per
cent
age)
a (P
erce
ntag
e of
GD
P)
(Per
cent
age
of G
DP
)ch
ange
in G
DP
def
lato
r)
Cou
ntry
/regi
me,
199
919
80–1
989
1990
–199
819
80–1
989
1990
–199
819
80–1
989
1990
–199
819
80–1
989
1990
–199
8
Gro
up I
– H
ard
pegs
Ben
in-0
.51.
7-6
.6-2
.20.
711
.42.
97.
9B
urki
na F
aso
1.4
1.1
-2.1
-4.6
8.9
14.3
4.6
4.8
Cam
eroo
n1.
6-2
.1-4
.2-2
.71.
30.
16.
24.
8C
entra
l Afri
can
Rep
ublic
-0.8
-0.6
-4.6
-5.6
7.5
14.4
9.3
4.2
Cha
d3.
9-0
.9-0
.6-4
.83.
27.
02.
77.
5C
ongo
0.9
-1.9
-13.
1-2
4.5
1.5
1.4
4.4
4.4
Côt
e d’
Ivoi
re-2
.90.
6-9
.7-5
.40.
13.
13.
56.
2D
jibou
tin.
a.-5
.3n.
a.-1
0.0
15.5
17.1
n.a.
4.1
Equ
ator
ial G
uine
a-1
.414
.3-1
7.3
-37.
03.
42.
1-0
.89.
3G
abon
-2.9
0.7
-3.6
1.8
4.0
3.2
3.5
6.2
Gui
nea-
Bis
sau
1.7
-1.2
-41.
0-2
1.1
6.2
6.7
57.7
41.3
Mal
i-1
.80.
8-1
0.4
-8.7
1.7
13.1
5.3
7.6
Nig
er-3
.6-1
.3-7
.7-8
.37.
16.
73.
34.
8S
eneg
al0.
30.
2-1
1.4
-5.4
0.3
4.0
6.7
4.4
Togo
-1.5
-0.7
-4.9
-8.5
23.1
12.7
5.6
7.5
/...

LÉONCE NDIKUMANA340Ta
ble
5 (c
ontin
ued)
GD
P G
RO
WTH
, CU
RR
ENT
AC
CO
UN
T, IN
TER
NAT
ION
AL
RES
ERVE
S A
ND
INFL
ATIO
N IN
AFR
ICA
N C
OU
NTR
IES
BY
EXC
HA
NG
E R
ATE
REG
IME,
198
0–19
98
Gro
wth
of p
er c
apita
GD
PC
urre
nt a
ccou
nt b
alan
ceN
et in
tern
atio
nal r
eser
ves
Infla
tion
(Ave
rage
ann
ual p
erce
ntag
e(A
nnua
l per
cent
age)
a (P
erce
ntag
e of
GD
P)
(Per
cent
age
of G
DP
)ch
ange
in G
DP
def
lato
r)
Cou
ntry
/regi
me,
199
919
80–1
989
1990
–199
819
80–1
989
1990
–199
819
80–1
989
1990
–199
819
80–1
989
1990
–199
8
Gro
up II
– S
oft p
egs
Bot
swan
a6.
41.
70.
36.
856
.910
2.0
12.7
9.2
Cap
e Ve
rde
4.4
2.7
-1.2
-6.8
27.7
13.9
5.4
4.0
Com
oros
0.3
-3.2
-9.8
-7.5
9.9
17.5
7.6
3.6
Egy
pt2.
82.
2-5
.82.
13.
122
.112
.810
.8Le
soth
o1.
34.
73.
4-9
.815
.442
.213
.88.
1Li
byan
Ara
b Ja
mah
iriya
n.a.
n.a.
-1.8
n.a.
23.7
n.a.
n.a.
n.a.
Mor
occo
2.0
0.4
-5.4
-1.4
1.5
11.7
7.2
3.7
Nam
ibia
-1.8
0.8
n.a.
3.4
n.a.
6.0
13.6
9.0
Sey
chel
les
2.6
1.4
-13.
6-7
.96.
25.
74.
21.
6S
waz
iland
3.3
-0.2
-6.5
-0.1
20.2
25.3
10.5
11.2
Tuni
sia
0.6
2.7
-4.8
-4.5
6.2
8.0
8.4
4.9
Zim
babw
e-0
.10.
0-2
.0-4
.81.
84.
312
.422
.4
Gro
up II
I – In
depe
nden
t flo
atA
lger
ia0.
0-1
.0-0
.73.
74.
26.
97.
923
.3A
ngol
a0.
8-3
.2-0
.6-4
.3n.
a.4.
94.
21
254.
1B
urun
di1.
6-5
.6-4
.5-4
.05.
314
.74.
311
.1C
ongo
, Dem
. Rep
. of
-1.2
-8.4
-4.4
-8.4
1.8
1.7
63.8
4 01
0.7
Erit
rea
n.a.
2.4
n.a.
-5.6
n.a.
n.a.
n.a.
11.2
Eth
iopi
a-2
.12.
6-5
.4-6
.42.
27.
25.
48.
2G
ambi
a0.
0-1
.0-5
.1-0
.94.
524
.516
.65.
3
.../..
.
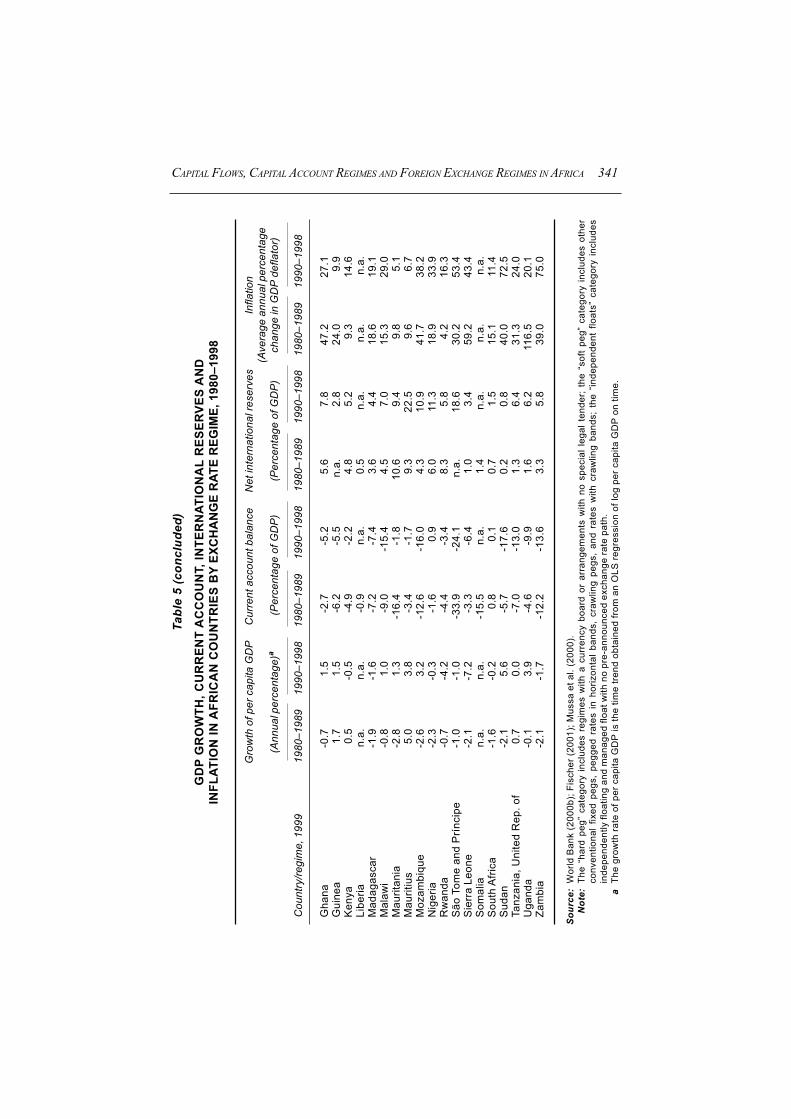
CAPITAL FLOWS, CAPITAL ACCOUNT REGIMES AND FOREIGN EXCHANGE REGIMES IN AFRICA 341Ta
ble
5 (c
oncl
uded
)
GD
P G
RO
WTH
, CU
RR
ENT
AC
CO
UN
T, IN
TER
NAT
ION
AL
RES
ERVE
S A
ND
INFL
ATIO
N IN
AFR
ICA
N C
OU
NTR
IES
BY
EXC
HA
NG
E R
ATE
REG
IME,
198
0–19
98
Gro
wth
of p
er c
apita
GD
PC
urre
nt a
ccou
nt b
alan
ceN
et in
tern
atio
nal r
eser
ves
Infla
tion
(Ave
rage
ann
ual p
erce
ntag
e(A
nnua
l per
cent
age)
a (P
erce
ntag
e of
GD
P)
(Per
cent
age
of G
DP
)ch
ange
in G
DP
def
lato
r)
Cou
ntry
/regi
me,
199
919
80–1
989
1990
–199
819
80–1
989
1990
–199
819
80–1
989
1990
–199
819
80–1
989
1990
–199
8
Gha
na-0
.71.
5-2
.7-5
.25.
67.
847
.227
.1G
uine
a1.
71.
5-6
.2-5
.5n.
a.2.
824
.09.
9K
enya
0.5
-0.5
-4.9
-2.2
4.8
5.2
9.3
14.6
Libe
rian.
a.n.
a.-0
.9n.
a.0.
5n.
a.n.
a.n.
a.M
adag
asca
r-1
.9-1
.6-7
.2-7
.43.
64.
418
.619
.1M
alaw
i-0
.81.
0-9
.0-1
5.4
4.5
7.0
15.3
29.0
Mau
ritan
ia-2
.81.
3-1
6.4
-1.8
10.6
9.4
9.8
5.1
Mau
ritiu
s5.
03.
8-3
.4-1
.79.
322
.59.
66.
7M
ozam
biqu
e-2
.63.
2-1
2.6
-16.
04.
310
.941
.738
.2N
iger
ia-2
.3-0
.3-1
.60.
96.
011
.318
.933
.9R
wan
da-0
.7-4
.2-4
.4-3
.48.
35.
84.
216
.3S
ão T
ome
and
Prín
cipe
-1.0
-1.0
-33.
9-2
4.1
n.a.
18.6
30.2
53.4
Sie
rra
Leon
e-2
.1-7
.2-3
.3-6
.41.
03.
459
.243
.4S
omal
ian.
a.n.
a.-1
5.5
n.a.
1.4
n.a.
n.a.
n.a.
Sou
th A
frica
-1.6
-0.2
0.8
0.1
0.7
1.5
15.1
11.4
Sud
an-2
.15.
6-5
.7-1
7.6
0.2
0.8
40.0
72.5
Tanz
ania
, Uni
ted
Rep
. of
0.7
0.0
-7.0
-13.
01.
36.
431
.324
.0U
gand
a-0
.13.
9-4
.6-9
.91.
66.
211
6.5
20.1
Zam
bia
-2.1
-1.7
-12.
2-1
3.6
3.3
5.8
39.0
75.0
Sour
ce:
Wor
ld B
ank
(200
0b);
Fisc
her (
2001
); M
ussa
et a
l. (2
000)
.N
ote:
The
“har
d pe
g” c
ateg
ory
incl
udes
reg
imes
with
a c
urre
ncy
boar
d or
arr
ange
men
ts w
ith n
o sp
ecia
l leg
al t
ende
r; th
e “s
oft
peg”
cat
egor
y in
clud
es o
ther
conv
entio
nal f
ixed
peg
s, p
egge
d ra
tes
in h
oriz
onta
l ban
ds,
craw
ling
pegs
, an
d ra
tes
with
cra
wlin
g ba
nds;
the
“in
depe
nden
t flo
ats”
cat
egor
y in
clud
esin
depe
nden
tly fl
oatin
g an
d m
anag
ed fl
oat w
ith n
o pr
e-an
noun
ced
exch
ange
rate
pat
h.a
The
grow
th ra
te o
f per
cap
ita G
DP
is th
e tim
e tre
nd o
btai
ned
from
an
OLS
regr
essi
on o
f log
per
cap
ita G
DP
on
time.

LÉONCE NDIKUMANA342Ta
ble
6
EXC
HA
NG
E R
ATES
AN
D T
RA
DE
BY
EXC
HA
NG
E R
ATE
REG
IME,
198
0–19
98
Nom
inal
exc
hang
e ra
teR
eal e
xcha
nge
rate
Exp
orts
Aver
age
trade
(Nat
. cur
r./U
S$)
(Inde
x 19
95=1
00)a
(Per
cent
age
of G
DP
)(P
erce
ntag
e of
GD
P)b
Cou
ntrie
s/re
gim
e 19
9919
80–1
989
1990
–199
819
80–1
989
1990
–199
819
80–1
989
1990
–199
819
80–1
989
1990
–199
8
Gro
up I
– H
ard
pegs
Ben
in33
4.3
426.
9n.
a.10
0.7
26.2
24.5
33.2
29.0
Bur
kina
Fas
o33
4.3
426.
914
0.4
118.
010
.412
.120
.719
.6C
amer
oon
334.
342
6.9
113.
111
2.7
26.4
22.2
26.3
20.8
Cen
tral A
frica
n R
epub
lic33
4.3
426.
915
4.3
111.
520
.516
.726
.520
.8C
had
334.
342
6.9
132.
911
6.7
14.3
15.8
21.0
23.1
Con
go33
4.3
426.
991
.398
.852
.057
.452
.360
.7C
ôte
d’Iv
oire
334.
342
6.9
117.
610
9.7
37.1
38.2
35.5
35.5
Djib
outi
177.
717
7.7
n.a.
n.a.
n.a.
44.9
n.a.
56.6
Equ
ator
ial G
uine
a33
4.3
426.
9n.
a.n.
a.35
.959
.150
.282
.2G
abon
334.
342
6.9
152.
311
8.8
53.3
53.8
48.5
45.0
Gui
nea-
Bis
sau
6.3
267.
514
6.9
112.
59.
912
.026
.424
.6M
ali
334.
342
6.9
152.
611
6.6
15.8
20.0
24.6
27.6
Nig
er33
4.3
426.
918
3.7
113.
921
.016
.125
.019
.1S
eneg
al33
4.3
426.
913
6.8
113.
328
.729
.634
.732
.7To
go33
4.3
426.
913
0.5
106.
346
.131
.649
.735
.3
Gro
up II
– S
oft p
egs
Bot
swan
a1.
42.
899
.293
.458
.948
.352
.643
.7C
ape
Verd
e69
.880
.377
.994
.515
.517
.430
.034
.7C
omor
os33
4.3
350.
8n.
a.n.
a.14
.718
.531
.330
.1
/...

CAPITAL FLOWS, CAPITAL ACCOUNT REGIMES AND FOREIGN EXCHANGE REGIMES IN AFRICA 343
.../..
.
Egy
pt0.
73.
115
3.1
98.1
22.2
23.0
28.8
26.0
Leso
tho
1.7
3.7
96.3
95.8
15.6
23.0
75.0
74.9
Liby
an A
rab
Jam
ahiri
ya0.
30.
3n.
a.n.
a.54
.7n.
a.44
.5n.
a.M
oroc
co7.
58.
995
.791
.517
.819
.123
.223
.4N
amib
ia1.
73.
710
4.8
93.0
58.6
53.8
62.2
57.3
Sey
chel
les
6.3
5.1
90.2
94.4
62.1
59.7
63.3
63.9
Sw
azila
nd1.
73.
710
1.6
91.4
70.7
83.0
77.5
85.2
Tuni
sia
0.7
1.0
91.4
93.3
36.9
42.4
40.0
44.7
Zim
babw
e1.
38.
915
6.7
96.3
21.4
33.1
21.8
34.6
Gro
up II
I – In
depe
nden
t flo
ats
Alg
eria
5.1
36.3
245.
111
7.2
23.8
26.0
23.0
25.4
Ang
ola
0.0
83 6
33.9
n.a.
55.1
34.7
59.2
30.2
56.9
Bur
undi
114.
026
7.7
135.
296
.010
.49.
217
.116
.8C
ongo
, Dem
. Rep
. of
0.0
1 37
0.2
220.
912
0.2
21.4
22.6
21.8
21.8
Erit
rea
n.a.
n.a.
n.a.
n.a.
n.a.
27.8
n.a.
54.1
Eth
iopi
a2.
14.
918
9.0
139.
29.
310
.513
.015
.1G
ambi
a4.
49.
410
7.3
96.9
47.8
53.7
54.4
60.8
Gha
na82
.31
104.
358
9.4
108.
611
.221
.312
.726
.7G
uine
a19
6.2
952.
9n.
a.n.
a.29
.722
.329
.523
.9
Tabl
e 6
(con
tinue
d)
EXC
HA
NG
E R
ATES
AN
D T
RA
DE
BY
EXC
HA
NG
E R
ATE
REG
IME,
198
0–19
98
Nom
inal
exc
hang
e ra
teR
eal e
xcha
nge
rate
Exp
orts
Aver
age
trade
(Nat
. cur
r./U
S$)
(Inde
x 19
95=1
00)a
(Per
cent
age
of G
DP
)(P
erce
ntag
e of
GD
P)b
Cou
ntrie
s/re
gim
e 19
9919
80–1
989
1990
–199
819
80–1
989
1990
–199
819
80–1
989
1990
–199
819
80–1
989
1990
–199
8

LÉONCE NDIKUMANA344
Ken
ya14
.347
.110
3.9
92.3
24.7
31.4
26.9
32.7
Libe
ria1.
01.
0n.
a.n.
a.47
.3n.
a.46
.0n.
a.M
adag
asca
r72
5.8
3 22
6.0
178.
610
6.1
13.6
19.6
17.2
23.5
Mal
awi
1.6
11.2
146.
613
0.1
23.9
24.8
27.3
31.2
Mau
ritan
ia64
.812
2.4
128.
911
0.9
42.2
42.8
52.9
48.4
Mau
ritiu
s12
.318
.098
.793
.954
.662
.056
.264
.1M
ozam
biqu
e18
3.2
6 50
3.2
218.
411
6.3
6.8
12.8
15.9
26.0
Nig
eria
2.2
18.5
117.
979
.821
.440
.920
.938
.7R
wan
da89
.820
8.5
123.
810
0.3
10.4
6.0
15.5
16.1
São
Tom
e an
d P
rínci
pe54
.91
250.
6n.
a.n.
a.29
.823
.456
.255
.9S
ierr
a Le
one
15.5
702.
412
5.4
94.4
11.5
23.1
14.0
23.3
Som
alia
93.7
n.a.
n.a.
n.a.
15.5
9.8
33.0
23.8
Sou
th A
frica
1.7
3.7
96.7
94.3
28.3
23.3
25.9
21.9
Sud
an2.
166
3.7
185.
119
5.7
8.2
n.a.
12.8
n.a.
Tanz
ania
, Uni
ted
Rep
. of
40.9
450.
925
5.9
106.
710
.016
.719
.526
.6U
gand
a39
.997
8.8
334.
588
.911
.69.
614
.715
.4Za
mbi
a4.
873
7.5
79.7
100.
734
.434
.035
.436
.9
Sour
ce:
Wor
ld B
ank
(200
0b).
aTh
e re
al e
xcha
nge
rate
is c
ompu
ted
as: (
coun
try’s
CP
I)/(
Uni
ted
Sta
tes’
CP
I)x
Offi
cial
exc
hang
e ra
te.
bA
vera
ge tr
ade
is th
e av
erag
e of
exp
orts
and
impo
rts a
s a
perc
enta
ge o
f GD
P.
Tabl
e 6
(con
clud
ed)
EXC
HA
NG
E R
ATES
AN
D T
RA
DE
BY
EXC
HA
NG
E R
ATE
REG
IME,
198
0–19
98
Nom
inal
exc
hang
e ra
teR
eal e
xcha
nge
rate
Exp
orts
Aver
age
trade
(Nat
. cur
r./U
S$)
(Inde
x 19
95=1
00)a
(Per
cent
age
of G
DP
)(P
erce
ntag
e of
GD
P)b
Cou
ntrie
s/re
gim
e 19
9919
80–1
989
1990
–199
819
80–1
989
1990
–199
819
80–1
989
1990
–199
819
80–1
989
1990
–199
8

CAPITAL FLOWS, CAPITAL ACCOUNT REGIMES AND FOREIGN EXCHANGE REGIMES IN AFRICA 345Ta
ble
7
EXC
HA
NG
E R
ATE
REG
IMES
AN
D M
AC
RO
ECO
NO
MIC
PER
FOR
MA
NC
E:IM
PRO
VEM
ENTS
FR
OM
198
0–19
89 T
O 1
990–
1998
(Per
cent
age)
Cur
rent
acc
ount
Gro
wth
in 1
990–
1998
Infla
tion
in 1
990–
1998
Trad
eba
lanc
eR
eser
ves
Pos
itive
Hig
her t
han
Belo
wLo
wer
than
Cat
egor
yR
egim
esgr
owth
1980
–198
910
per
cen
t19
80–1
989
Hig
her
Impr
oved
Hig
her
Non
-shi
fters
Har
d pe
gs50
.035
.792
.928
.628
.650
.057
.1
Soft
pegs
81.8
36.4
72.7
81.8
54.5
60.0
80.0
Inde
pend
ent
Gro
up47
.830
.421
.743
.572
.747
.885
.0flo
ats
(with
out c
onfli
ct c
ount
ries)
a(5
7.9)
(36.
8)(2
6.3)
(50.
0)(7
2.2)
(47.
4)(8
8.2)
Shift
ers
Shift
ing
from
Gro
up53
.838
.515
.423
.183
.346
.290
.9so
ft pe
gs to
(with
out c
onfli
ctin
depe
nden
tco
untri
es)a
(70.
0)(5
0.0)
(20.
0)(3
0.0)
(88.
9)(4
0.0)
(100
.0)
float
s
Sour
ce:
Wor
ld B
ank
(200
0b).
Not
e:Th
is ta
ble
sum
mar
izes
info
rmat
ion
from
tabl
es 5
and
6. T
able
A.2
pre
sent
s in
form
atio
n on
cou
ntrie
s th
at s
hifte
d fro
m s
oft p
egs
to in
depe
nden
t flo
at u
sed
inth
is ta
ble.
Djib
outi,
Erit
rea,
Lib
eria
, Lib
yan
Ara
b Ja
mah
iriya
and
Som
alia
are
not
incl
uded
in th
is s
umm
ary
tabl
e du
e to
lack
of d
ata.
a“C
onfli
ct c
ount
ries”
in th
e flo
atin
g re
gim
es c
ateg
ory
are
Ang
ola,
Bur
undi
, Rw
anda
and
Sie
rra
Leon
e (a
nd S
omal
ia, w
hich
is e
xclu
ded
due
to la
ck o
f dat
a).

LÉONCE NDIKUMANA346Ta
ble
8
GD
P G
RO
WTH
, EXP
OR
TS A
ND
INFL
ATIO
N IN
CFA
CO
UN
TRIE
S, 1
980–
1998
Exp
orts
Infla
tion
in C
PI i
ndex
Gro
wth
of p
er c
apita
GD
Pa
(Per
cent
age
of G
DP
) (A
vera
ge a
nnua
l cha
nge)
Cou
ntry
1980
–198
919
90–1
994
1995
–199
819
80–1
989
1990
–199
419
95–1
998
1980
–198
919
90–1
994
1995
–199
8
Beni
n-0
.40.
92.
226
.224
.125
.1n.
a.19
.57.
1Bu
rkin
a Fa
so1.
4-0
.12.
710
.411
.912
.21.
75.
15.
2C
amer
oon
1.8
-6.4
1.8
26.4
20.0
25.0
9.0
6.6
6.7
Cen
tral A
frica
n R
epub
lic-0
.9-3
.01.
320
.515
.418
.33.
73.
55.
7C
had
4.0
-1.4
1.2
14.3
13.2
19.1
3.0
6.9
9.8
Con
go2.
7-2
.90.
152
.049
.866
.97.
611
.610
.6C
ôte
d’Iv
oire
-2.6
-2.9
3.7
37.1
33.1
44.7
5.9
6.7
6.4
Equa
toria
l Gui
nea
-1.9
2.6
31.7
35.9
39.3
83.9
n.a.
n.a.
n.a.
Gab
on-1
.5-0
.11.
753
.350
.058
.55.
84.
64.
8G
uine
a-Bi
ssau
2.9
1.4
-5.6
9.9
10.0
14.5
70.5
44.7
38.3
Mal
i-1
.5-1
.42.
415
.817
.922
.5-0
.13.
86.
0N
iger
-2.9
-3.2
0.9
21.0
15.6
16.6
2.8
4.3
5.8
Sene
gal
0.3
-1.3
2.4
28.7
26.1
33.9
6.7
6.0
3.4
Togo
-1.7
-4.0
2.1
46.1
29.8
34.0
4.2
8.2
7.6
Sam
pleb
-0.4
-2.8
2.3
31.7
27.9
35.6
6.7
9.7
9.1
Sour
ce:
Wor
ld B
ank
(200
0b).
aTh
e gr
owth
rate
in a
per
iod
is th
e si
mpl
e av
erag
e of
ann
ual g
row
th ra
tes
of re
al p
er c
apita
GD
P (c
onst
ant 1
995
$).
bTh
e sa
mpl
e gr
owth
rate
of p
er c
apita
GD
P is
the
aver
age
grow
th ra
te o
f the
pop
ulat
ion-
wei
ghte
d re
al p
er c
apita
GD
P. T
he s
ampl
e av
erag
e ex
port/
GD
P ra
tioan
d in
flatio
n ar
e w
eigh
ted
by re
al G
DP
.

CAPITAL FLOWS, CAPITAL ACCOUNT REGIMES AND FOREIGN EXCHANGE REGIMES IN AFRICA 347Ta
ble
9
GD
P G
RO
WTH
, EXP
OR
TS A
ND
INFL
ATIO
N IN
SA
DC
CO
UN
TRIE
S, 1
980–
1998
Exp
orts
Infla
tion
in C
PI i
ndex
Gro
wth
of p
er c
apita
GD
Pa
(Per
cent
age
of G
DP
) (A
vera
ge a
nnua
l cha
nge)
Cou
ntry
1980
–198
919
90–1
994
1995
–199
819
80–1
989
1990
–199
419
95–1
998
1980
–198
919
90–1
994
1995
–199
8
Ang
ola
-0.1
-8.6
5.4
34.7
55.4
63.9
n.a.
876.
13
174.
5B
otsw
ana
6.7
1.7
2.5
58.9
50.4
45.6
10.5
12.8
9.0
Leso
tho
2.0
2.6
4.3
15.6
18.8
28.2
13.6
13.6
9.3
Mal
awi
-1.3
-1.6
5.3
23.9
23.4
26.6
16.8
21.1
40.0
Mau
ritiu
s5.
04.
24.
354
.661
.063
.37.
78.
66.
6M
ozam
biqu
e-1
.20.
96.
16.
812
.113
.745
.146
.235
.0N
amib
ia-1
.81.
3-0
.258
.652
.755
.213
.012
.28.
3S
outh
Afri
ca-0
.9-1
.90.
628
.322
.424
.514
.712
.57.
8S
waz
iland
3.1
0.7
-0.1
70.7
79.8
86.9
14.7
11.1
8.5
Tanz
ania
, Uni
ted
Rep
. of
0.7
-0.2
0.8
10.0
14.0
20.1
30.1
28.9
19.6
Zam
bia
-1.8
-2.7
-1.1
34.4
34.7
33.1
69.3
122.
235
.1Zi
mba
bwe
0.8
-0.3
1.5
21.4
27.9
39.6
13.6
26.5
23.6
Sam
pleb
-2.9
-2.1
0.6
29.4
25.7
28.5
18.2
72.5
304.
9(1
8.2)
b(2
8.7)
b(1
8.0)
b
Sour
ce:
Wor
ld B
ank
(200
0b).
aTh
e gr
owth
rate
in a
per
iod
is th
e si
mpl
e av
erag
e of
ann
ual g
row
th ra
tes
of re
al p
er c
apita
GD
P (c
onst
ant 1
995
$).
bTh
e sa
mpl
e gr
owth
rate
of p
er c
apita
GD
P is
the
aver
age
grow
th ra
te o
f the
pop
ulat
ion-
wei
ghte
d re
al p
er c
apita
GD
P. T
he s
ampl
e av
erag
e ex
port/
GD
P ra
tioan
d in
flatio
n ar
e w
eigh
ted
by re
al G
DP
. Exc
ludi
ng A
ngol
a, th
e sa
mpl
e av
erag
e in
flatio
n ra
te fo
r 199
5–19
98 is
9.3
per
cen
t.

LÉONCE NDIKUMANA348
than half of the countries in this group (54 per cent). However, the majorityof the countries in this group showed better performance in trade (73 percent) and international reserves (85 per cent).
In examining the links between exchange rate regimes and economicperformance, the group of countries that shifted from one regime to anothermay provide better information than those countries whose regimesremained unchanged over the investigation period. Looking at the groupof countries that shifted from soft pegs to independent floats, the shift wasnot associated with much gain in terms of output growth, while inflationand the current account were worse than in the three categories of “non-shifters”. However, this category had the highest proportion of countrieswith improved performance in trade and international reserves.
Overall, these casual observations reveal no systematic relationshipbetween indicators of economic performance and patterns of exchange rateregime shifts. The transition toward floating regimes was not accompaniedby much gain in GDP growth, while inflation and current accountperformance worsened for the majority of regime shifters. In the case ofthe CFA-zone countries, the realignment of the CFA exchange rate in 1994was followed by significant improvements in output growth and trade. Dueto the ill-advised delayed adjustment in the exchange rate of the CFA franc,price stability was achieved at the cost of lower output growth and lowertrade performance. Much more empirical work is needed to establishempirical regularities about the relationship between economic performanceand exchange rate regimes in African countries.
D. Further issues related to exchange rate regimes
(i) The exchange rate as a nominal anchor
As African countries move towards liberalization of their exchangerate regimes, they confront some important policy questions. In particular,under a flexible regime the exchange rate no longer plays the role of anominal anchor of monetary policy. National authorities must then

CAPITAL FLOWS, CAPITAL ACCOUNT REGIMES AND FOREIGN EXCHANGE REGIMES IN AFRICA 349
determine a credible alternative nominal anchor. One alternative is to targetinflation. This option appears to have worked fairly well in industrializedcountries. However, important institutional conditions are necessary forthis alternative to work. In particular, successful inflation targeting requiresa high degree of instrument independence of the central bank;6 monetarypolicy must be free from fiscal policy pressures and political intrusion.Moreover, inflation targeting requires a sound information base inforecasting inflation and output. These conditions are typically not met inmost African countries. Furthermore, inflation targeting is difficult whenthe economy is hit frequently by supply shocks. The majority of Africaneconomies have experienced frequent supply shocks, which include bothdomestic shocks (e.g. natural disasters, such as drought) and internationalshocks (e.g. energy crisis and commodity price shocks). These effects canbe hard to disentangle, which makes it difficult to determine whetherinflation is the outcome of policy mistakes or the result of purely exogenousshocks, or a combination of these factors.
(ii) No exchange regime is good for all, all of the time
When the economy is predominantly subject to real/supply shocks, arigidly fixed exchange regime can be destabilizing as it prevents the normaladjustment of the current and capital accounts to the shocks. A number ofscholars support the following prescription: “if shocks are mostly real,float; otherwise fix” (Calvo and Reinhart, 1999; Berg and Borensztein,2000). In some ways, the experience of the CFA zone lends some supportto this view. Failure to adjust the exchange rate as the economies in thezone were hit by exogenous real shocks (e.g. terms of trade shocks, energycrisis) proved to be costly for these economies. However, as Calvo andReinhart (1999) indicate, in some recent crises, shocks have come throughthe capital account, thus containing real as well as nominal components.African countries that opt for fixed exchange rate regimes should preserveenough flexibility to respond to shocks in a timely manner by adjustingthe official exchange rate.
Many scholars have argued that along the spectrum of exchange rateregimes, between a very hard peg and a freely floating regime, those in the

LÉONCE NDIKUMANA350
intermediate range (or soft pegs) are not viable beyond the short term(Obstfeld and Rogoff, 1995; Mussa, et al., 2000; Fischer, 2001). Forcountries that are significantly integrated into the world financial markets,so the argument goes, the only viable option is a flexible (possibly managed)exchange rate regime. However, for African countries that are not integratedinto the international financial markets, a hard peg seems to be a sensibleoption. The recent transition of African countries towards floating exchangerate regimes is puzzling. Except probably for emerging market countries(Egypt, Morocco, Nigeria, and South Africa), African countries do notseem to have the institutional and infrastructural conditions required tobenefit from fully flexible exchange rate regimes.
V. CURRENCY REGIMES, DOLLARIZATION/“EUROIZATION”,AND IMPLICATIONS FOR CAPITAL FLOWS
A. Dollarization/”euroization”: the new context
The increasing interest in the topic of currency regimes and dol-larization (and, more recently, “euroization”) is, to a large extent, motivatedby the changing international environment; the newly emergingenvironment has cast doubts on the adequacy of many of the traditionalpolicy prescriptions with regard to the management of international trade,foreign exchange markets and international capital flows. Here, three ofthe important new developments that have changed the international contextof policy-making in the domain of currency regimes are discussed.
The first change in the global environment is the fact that inflationcrises around the world have abated significantly since the early 1990s.With the decline and stabilization of inflation in many countries, thetraditional argument for using exchange rate management as a stabilizationtool has lost momentum. However, since inflation is still a significant prob-lem for many African countries, exchange rate management should remainan important means of economic stabilization for these countries.

CAPITAL FLOWS, CAPITAL ACCOUNT REGIMES AND FOREIGN EXCHANGE REGIMES IN AFRICA 351
The second development is the recent surge in cross-border capitalmobility around the world. This phenomenon has revived the debate overthe choice of exchange rate regime. Two views have emerged on thissubject. The first view (the bipolar view) is that only very hard pegs andindependently flexible exchange rate regimes are viable in a financiallyintegrating world (Fischer, 2001). The second view suggests that countriesshould simply abandon national currencies and adopt a strong and stableinternational currency, especially since, in today’s global capital markets,it is unwise to peg the exchange rate because it is too costly to defend.Obstfeld and Rogoff (1995: 74) suggest that “for most countries, it is follyto try to recapture the lost innocence of fixed exchange rates”. Calvo andReinhart (1999: 13) echo the proposition by arguing that “the limitedeffectiveness of capital controls provides the basis for reassessing therelative merits of fixed and flexible exchange rate policies. Dollarizationmay offer emerging market economies a viable and more market-friendlyalternative to capital controls”. Below, we discuss the advantages anddisadvantages of dollarization.
The third development is the creation of the European Monetary Union(EMU) and the adoption of the euro. The question is whether the creationof the EMU will spark more interest in the strengthening of monetary unionsin Africa or the creation of new ones, or even the establishment of acontinent-wide African monetary union (AMU).
B. Advantages and disadvantages of dollarization/“euroization”
(i) Advantages of dollarization
Proponents of dollarization have suggested a number of advantagesthat countries may derive from adopting a strong foreign currency. Herewe elaborate on four of these (see Berg and Borensztein, 2000 for moredetails).7 The first benefit from dollarization is that it shields the nationaleconomy from the adverse effects of sharp fluctuations in exchange rates.The second advantage is that it raises international investors’ confidencein the economy by lowering the risks arising from currency fluctuations,

LÉONCE NDIKUMANA352
and thus stimulates capital inflows. Dollarization also reduces the spreadbetween domestic and international interest rates by lowering domesticinterest rates, which stimulates private domestic investment.
However, critiques of dollarization point out that while dollarizationeliminates the risk of currency devaluation, it does not eliminate country-specific or sovereign risk. In fact, it may even increase sovereign risk incountries that are not fully dollarized (Berg and Borensztein, 2000). In thecase of African countries, sovereign risk is likely to remain high due toweak economic fundamentals, loose macroeconomic policies and aturbulent political environment. Dollarization or “euroization” cannot bean insurance against fundamental political uncertainty or the adverse effectsof bad macroeconomic policies.
The third alleged advantage of dollarization is that it facilitatesintegration into the world economy, especially by reducing uncertaintyand transaction costs associated with the divergence in cross-countryexchange rates.
Finally, proponents of dollarization argue that it can serve as anexternal agent of fiscal and monetary discipline and foster sound financialpolicies. The adoption of a foreign currency amounts to surrendering theoption of monetary financing of government deficits as well as thepossibility of using monetary policy for macroeconomic stabilization.However, evidence suggests that currency unions are not an antidote tofiscal indiscipline or political intrusion in the financial system. As shall bediscussed further below, the experience of the CFA-zone countries in the1980s testifies to this point.
(ii) Disadvantages of dollarization
There are many disadvantages of dollarization, of which four areemphasized here. The first is the loss of a national currency; this is likelyto face political resistance because a national currency is a symbol ofnational sovereignty.

CAPITAL FLOWS, CAPITAL ACCOUNT REGIMES AND FOREIGN EXCHANGE REGIMES IN AFRICA 353
Second, dollarization implies a loss of seignorage revenue, that isthe resources created from printing interest-free cash in exchange forgovernment securities. The adoption of dollarization or “euroization”implies that all the seignorage revenue accrues to the United States or tothe EMU members respectively, which amounts to free credit by thedollarizing countries to the United States or the EMU countries, with theexception of the provision of these currencies through official developmentassistance (ODA). In principle, it is possible to design a scheme throughwhich the United States or the EMU can share the seignorage revenueswith members of the currency zone, but as of today there are no clearguidelines for the design of such a scheme.
The third disadvantage of dollarization is its high degree of irrevers-ibility, or the lack of an “exit option”. Unlike other currency arrangements(such as a currency board) where countries can elect to exit whenever theysee fit, the costs of exiting from dollarization are rather prohibitive (Bergand Borensztein, 2000). The reintroduction of a national currency ispossible, but it is likely to absorb substantial administrative and logisticalresources. Most importantly, it is likely that the new currency will beperceived as weaker than the dollar (or the euro), which, among other things,will adversely affect investor sentiment and probably depress capitalinflows while fuelling capital outflows.
The fourth disadvantage of dollarization is that the country relinquishesa large part of its autonomy for macroeconomic policy by losing threeimportant policy tools: devaluation as a tool of current account and capitalaccount management, the lender-of-last-resort function of the central bank,and monetary policy as a tool of macroeconomic stabilization. With respectto the lender-of-last-resort function, the inability of national authorities tointervene to protect the financial sector against adverse internal and externalshocks is a high price to pay for dollarization. It is possible to argue thatthe increased presence of highly capitalized foreign banks that is likely toaccompany dollarization can serve as an alternative potential rescuemechanism in the event of a liquidity crisis in the domestic banking sector.Another alternative rescue mechanism would be direct intervention of thecentral bank of the guarantor country (the United States or EMU countries).However, this leaves open the question of whether the penetration of foreign

LÉONCE NDIKUMANA354
banks is necessarily desirable and whether the United States or EMUcountries have the incentives to intervene to rescue troubled financialinstitutions in the dollarizing/ “euroizing” country.
C. Currency unions in Africa: opportunities and constraints
In this subsection, we explore three questions related to currencyregimes in Africa. First, are currency areas or monetary integration themeans towards greater trade integration? One of the potential advantagesof currency unions is that they can foster trade among their members.However, evidence from African countries shows that currency unions andregional integration in general have not promoted trade. For example, intra-zone trade in the CFA area represented less than 7 per cent of total externaltrade of CFA countries between 1994 and 2000, down from 9 per centbetween 1970 and 1993 (Hadjimichael and Galy, 1997: 30).8 Low intra-regional trade in sub-Saharan Africa is due to a range of structural con-straints, including lack of complementarity in production across countriesand weak infrastructural linkages. Therefore, the adoption of a commoncurrency does not necessarily increase intraregional trade.
Second, are currency unions a means to fiscal discipline, efficiencyand stability of the financial system? In principle, transferring financialand monetary policy to a supranational institution can foster financialstability by reducing political pressure on credit allocation. However,evidence from the CFA zone is not compelling in this regard either. Theoperating structure of the CFA zone, which delegates monetary and financialpolicies to two regional central banks, has not insulated the economiesfrom fiscal indiscipline and intrusive manipulation of credit allocationby member governments, especially through lending to State-ownedenterprises, regional organizations and government suppliers (Honohanand Lane, 2000). These loans have been characterized by very high defaultrates. As a result, the banking system was in severe crisis by the mid-1980s. African countries cannot count on successfully “outsourcing” fiscaland monetary policy by simply delegating it to regional monetaryorganizations. Nor can they expect dollarization or “euroization” to be asubstitute for fiscal and financial reform.

CAPITAL FLOWS, CAPITAL ACCOUNT REGIMES AND FOREIGN EXCHANGE REGIMES IN AFRICA 355
Third, can currency unions foster international capital inflows? Thecreation of a currency union is expected to be accompanied by an expansionof markets, and, possibly, a reduction of country risk, which would increaseinternational capital inflows. One potential negative effect is that with theexpansion of the markets, African economies may no longer be “below theradar screen of international speculators” (Honohan and Lane, 2000). Thisimplies a need for efficient management of capital flows to reduce the riskof financial fragility.
VI. CAPITAL FLIGHT FROM AFRICA
A. Magnitude of the problem in African countries
The problem of capital flight from African countries has attractedmuch attention in the academic literature (for surveys, see Ajayi and Khan,2000; Boyce and Ndikumana, 2001; Ndikumana and Boyce, 2002). Existingstudies show that African countries have experienced massive capitalflight over time. Let us present estimates of capital flight for a sample of30 African countries for the period 1970–1996, using the methodologydeveloped by Boyce and Ndikumana (2001) who compute capital flight asfollows:
KFit = ∆DEBTADJit + DFIit – (CAit + ∆RESit) + MISINVit,
where ∆DEBTADJ is the change in debt adjusted for cross-currencyexchange rate fluctuations, taking into account the fact that a country’sdebt is denominated in various currencies; DFI is direct foreign investment,CA is the current account balance, ∆RES is the change in the stock ofinternational reserves, and MISINV is net trade misinvoicing. Twomodifications are made to the value obtained with the above equation.First nominal values of capital flight are deflated to real values using theUnited States producer price index (base 1996 = 100). Second, theaccumulated stock of capital flight is computed by imputing interestearnings to past capital flight using the United States Treasury Bill rate.

LÉONCE NDIKUMANA356
Table 10 presents capital flight estimates for 30 sub-Saharan Africancountries. The table contains estimates of total real capital flight from 1970to 1996 in constant 1996 US dollars (column II), the stock of accumulatedcapital flight including interest earnings on past capital flight (columnsIII–V), and calculated net external assets (column VI) obtained bysubtracting the stock of external debt in 1996 from the stock of accumulatedcapital flight with imputed interest earnings.
The results indicate that for the 30 African countries, real capital flightover the 26-year period amounted to about $182 billion. Including interestearnings, the accumulated stock of capital flight was $272 billion for theperiod. Total capital flight was higher if we consider only severely indebtedlow-income countries (SILIC). For this group, the estimates were$189.7 billion and $281 billion for total real capital flight and the ac-cumulated stock of capital flight respectively. The sample as a whole wasa “net creditor to the world” in the sense that private assets held abroad, asmeasured by capital flight, exceeded total liabilities, as measured by thestock of debt. Estimated net external assets amounted to $81.7 billion forthe entire sample of 30 African countries and $102.7 billion for the SILICgroup.
The magnitude of capital flight varied significantly across Africancountries. Angola, Cameroon, Côte d’Ivoire, the Democratic Republic ofCongo and Nigeria had particularly high levels of capital flight, with asmuch as $86.8 billion for Nigeria. The capital-flight/GDP ratio exceeded200 per cent for nine countries in the sample. The data also indicate a highper capita burden of capital flight, amounting to several multiples of percapita income (comparing columns I and V in table 10).
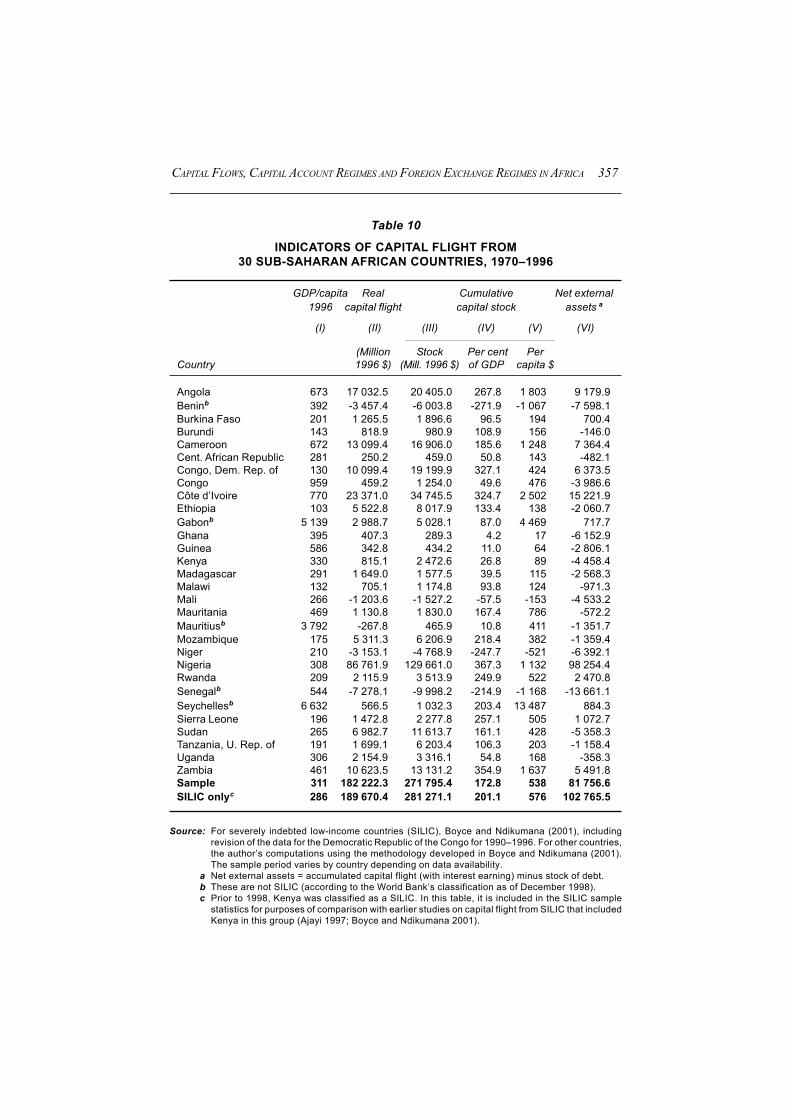
CAPITAL FLOWS, CAPITAL ACCOUNT REGIMES AND FOREIGN EXCHANGE REGIMES IN AFRICA 357
Table 10
INDICATORS OF CAPITAL FLIGHT FROM30 SUB-SAHARAN AFRICAN COUNTRIES, 1970–1996
GDP/capita Real Cumulative Net external1996 capital flight capital stock assets a
(I) (II) (III) (IV) (V) (VI)
(Million Stock Per cent PerCountry 1996 $) (Mill. 1996 $) of GDP capita $
Angola 673 17 032.5 20 405.0 267.8 1 803 9 179.9Beninb 392 -3 457.4 -6 003.8 -271.9 -1 067 -7 598.1Burkina Faso 201 1 265.5 1 896.6 96.5 194 700.4Burundi 143 818.9 980.9 108.9 156 -146.0Cameroon 672 13 099.4 16 906.0 185.6 1 248 7 364.4Cent. African Republic 281 250.2 459.0 50.8 143 -482.1Congo, Dem. Rep. of 130 10 099.4 19 199.9 327.1 424 6 373.5Congo 959 459.2 1 254.0 49.6 476 -3 986.6Côte d’Ivoire 770 23 371.0 34 745.5 324.7 2 502 15 221.9Ethiopia 103 5 522.8 8 017.9 133.4 138 -2 060.7Gabonb 5 139 2 988.7 5 028.1 87.0 4 469 717.7Ghana 395 407.3 289.3 4.2 17 -6 152.9Guinea 586 342.8 434.2 11.0 64 -2 806.1Kenya 330 815.1 2 472.6 26.8 89 -4 458.4Madagascar 291 1 649.0 1 577.5 39.5 115 -2 568.3Malawi 132 705.1 1 174.8 93.8 124 -971.3Mali 266 -1 203.6 -1 527.2 -57.5 -153 -4 533.2Mauritania 469 1 130.8 1 830.0 167.4 786 -572.2Mauritiusb 3 792 -267.8 465.9 10.8 411 -1 351.7Mozambique 175 5 311.3 6 206.9 218.4 382 -1 359.4Niger 210 -3 153.1 -4 768.9 -247.7 -521 -6 392.1Nigeria 308 86 761.9 129 661.0 367.3 1 132 98 254.4Rwanda 209 2 115.9 3 513.9 249.9 522 2 470.8Senegalb 544 -7 278.1 -9 998.2 -214.9 -1 168 -13 661.1Seychellesb 6 632 566.5 1 032.3 203.4 13 487 884.3Sierra Leone 196 1 472.8 2 277.8 257.1 505 1 072.7Sudan 265 6 982.7 11 613.7 161.1 428 -5 358.3Tanzania, U. Rep. of 191 1 699.1 6 203.4 106.3 203 -1 158.4Uganda 306 2 154.9 3 316.1 54.8 168 -358.3Zambia 461 10 623.5 13 131.2 354.9 1 637 5 491.8Sample 311 182 222.3 271 795.4 172.8 538 81 756.6SILIC onlyc 286 189 670.4 281 271.1 201.1 576 102 765.5
Source: For severely indebted low-income countries (SILIC), Boyce and Ndikumana (2001), includingrevision of the data for the Democratic Republic of the Congo for 1990–1996. For other countries,the author’s computations using the methodology developed in Boyce and Ndikumana (2001).The sample period varies by country depending on data availability.
a Net external assets = accumulated capital flight (with interest earning) minus stock of debt.b These are not SILIC (according to the World Bank’s classification as of December 1998).c Prior to 1998, Kenya was classified as a SILIC. In this table, it is included in the SILIC sample
statistics for purposes of comparison with earlier studies on capital flight from SILIC that includedKenya in this group (Ajayi 1997; Boyce and Ndikumana 2001).

LÉONCE NDIKUMANA358
B. Conduits, causes and macroeconomic consequences ofcapital flight
There are various conduits through which private actors can channelcapital abroad illegally. Capital flight occurs through illicit bank transfers,embezzlement of exports of minerals and other natural resources, andmisinvoicing of exports and imports. The amounts are notoriously highfor such countries as Nigeria with $23.6 billion, the Democratic Republicof the Congo with $7.4 billion, and Côte d’Ivoire with $6.7 billion (Boyceand Ndikumana, 2002).
Some studies have investigated the causes or determinants of capitalflight using both cross-country data and country case studies. In examiningthe determinants of capital flight from 30 sub-Saharan African countries,Ndikumana and Boyce (2002) have found that external borrowing ispositively and significantly related to capital flight; this suggests that to alarge extent capital flight is debt-fuelled. Their results also indicate thatcapital flight exhibits a high degree of persistence in the sense that pastcapital flight is correlated with current and future capital flight. Further-more, the growth rate of per capita GDP and an index of voice andaccountability are negatively related to capital flight. These findings areconsistent with the results from studies on smaller samples and from countrycase studies. For example Lensink, Hermes and Murinde (2000) foundthat capital flight was higher in countries with high corruption, badgovernance and high political instability. Olopoenia (2000) found thatcapital flight from Uganda was higher during the periods of political andeconomic instability in the 1970s and the first half of the 1980s. Nyoni(2000) found that the black market premium, which is an indicator of marketdistortions, significantly and positively influenced the level of capital flight.And Lensink, Hermes, and Murinde (1998) found that capital flight declinedfollowing financial liberalization, indicating that reducing market distortionscan contribute to reducing capital flight.
Compared to other developing regions, sub-Saharan Africa hasexperienced a relatively higher level of capital flight. Collier, Hoefflerand Pattillo (1999) found that Africa has the highest proportion of private

CAPITAL FLOWS, CAPITAL ACCOUNT REGIMES AND FOREIGN EXCHANGE REGIMES IN AFRICA 359
capital held abroad (as a percentage of total private assets or GDP). Usinga portfolio choice approach, these authors found econometric resultssuggesting that high capital flight from Africa was due, among other things,to overvalued exchange rates, high country-specific risk and high indebt-edness.
Capital flight implies a high opportunity cost for the economy and aheavy burden on the population. A high level of capital flight implies thatscarce resources are used to channel private assets abroad instead offinancing imports of investment equipment or consumption goods. It alsoputs pressure on the exchange rate by increasing the demand for foreigncurrency to funnel wealth abroad. Furthermore, it constitutes a drain onnational resources, and thus reduces the current and future growth potentialof the country. It contributes to increasing macroeconomic uncertainty,which depresses lending and investment. Market participants may interpreta high level of capital flight as a signal of loss of control of economicpolicy by national authorities. Through herd effects, capital flight can leadto more capital flight, as agents seek to minimize expected portfolio lossesin the face of an uncertain future political and economic environment.
C. Capital account liberalization and capital flight
The net effects of capital account liberalization on capital flight areunpredictable. It can curtail capital flight by removing market distortions,but only if it is part of a broader reform agenda aimed at fostering anenvironment that is conducive to investment.
Three issues are worth emphasizing with regard to capital accountliberalization. First, it has adverse effects when financial markets arerepressed. If domestic interest rates are significantly lower than foreigninterest rates due to financial repression, then profit-maximizing saversprefer to hold their wealth in foreign assets. Substantially repressed interestrates can lead to disintermediation, as savings are channelled abroad andbanks refuse to lend at negative real interest rates. The implication of thishighly stylized argument is that African countries need to coordinate their

LÉONCE NDIKUMANA360
capital account liberalization programmes with financial reforms toeliminate interest rate repression. There is some evidence that financialliberalization can in fact play an important role in curtailing capital flight(Lensink, Hermes and Murinde, 1998).
Second, the liberalization of capital account operations in the contextof overvalued exchange rates can cause greater capital flight and can havedetrimental effects on the current account. An overvalued exchange rateinduces agents to underinvoice exports while overinvoicing imports, whichincreases capital flight. African countries need to coordinate capital accountliberalization with exchange regime liberalization to avoid costly marketdistortions.
Third, political instability causes capital flight as agents seek tominimize the risk of expropriation and future portfolio losses due to politicalcrisis. Current account liberalization or any other economic reform wouldhave little effect on reducing capital flight in the presence of high politicaluncertainty. Therefore economic liberalization must go hand in hand withinstitutional reforms aimed at fostering transparent and accountablegovernance.
VII. SUMMARY AND POLICY IMPLICATIONS
A. Attracting and monitoring capital flows
African countries need to design strategies to attract foreign privatecapital to compensate for the recent decline in official lending. The evidencesuggests that private capital flows are responsive to the macroeconomicpolicy environment. The focus should be on reforms aimed at improvingfiscal discipline, controlling inflation and creating an investment-friendlyenvironment. Indeed countries that have made progress in economic reformhave also experienced an increase in capital inflows (e.g. Mozambique,the United Republic of Tanzania and Uganda).

CAPITAL FLOWS, CAPITAL ACCOUNT REGIMES AND FOREIGN EXCHANGE REGIMES IN AFRICA 361
Gauging the effects of capital flows on macroeconomic performanceand designing appropriate policy responses requires good information onthe nature, magnitude, sectoral distribution and variability of capital flows.Unfortunately such information is still scarce in African countries. Africangovernments need to invest financial and human resources to establishmechanisms for systematic monitoring of the inflows and outflows ofcapital. This could include the creation or strengthening of specializeddivisions within central banks and national bureaus of statistics, whosemission would be to compile and disseminate information on capitalmovements.
B. Liberalization and openness: a cautionary note
Two points are worth emphasizing with regard to the recent movestowards greater flexibility of exchange rates and openness of capital accountregimes in African countries. First, liberalization of current and capitalaccounts will enhance economic performance only if it is supported byappropriate macroeconomic and sectoral policies, especially disciplinedfiscal and monetary policies committed to price stability. Second, to avoidpotential adverse effects of capital account liberalization, African countriesneed to undertake the necessary steps to reduce market distortions.
C. Strengthening financial markets
Underdeveloped financial markets constitute an enormous constrainton private capital inflows into Africa, especially because of the lack ofopportunities for portfolio diversification. At the same time, withunderdeveloped financial markets and a weak regulatory infrastructure,African countries are ill-equipped to absorb large and sudden surges incapital inflows. Among other things, these countries need to pursue reformsaimed at enforcing creditor and investor rights and improving the efficiencyof the clearing system. These measures would both facilitate financialdevelopment and encourage capital inflows.
LÉONCE NDIKUMANA362
The role of stock markets in attracting private capital to Africa is atopic that deserves careful investigation. The evidence shows that countriessuch as Kenya and Zimbabwe have failed to attract significant capitalinflows despite the fact that they have long-established stock markets. Thus,while stock markets can contribute to attracting private capital, they arenot a sufficient condition. African countries need to pursue policies aimedat facilitating financial intermediation in general, which will promote thebanking sector as well as equity markets. A solid banking system is essentialto the development of the stock market because stock market developmentand banking development are complementary (Levine and Zervos, 1998).
Given the small size of national stock markets in Africa (with theexception of South Africa), they are not yet in a position to attract sizeableforeign capital. And the creation of national stock markets involves highcosts (infrastructure and administrative costs) that small economies cannotafford in the short run. The development of regional stock exchanges couldcontribute to alleviating the small-size constraint. Operating rules (suchas accounting rules and prudential regulation rules) need to be coordinatedacross countries to facilitate cross-border listings and increase the benefitof regional integration.

CAPITAL FLOWS, CAPITAL ACCOUNT REGIMES AND FOREIGN EXCHANGE REGIMES IN AFRICA 363
APPENDIX
CAPITAL ACCOUNTS AND FOREIGN EXCHANGE REGIMES:RECENT DEVELOPMENTS IN SOME AFRICAN COUNTRIES
1. Egypt
a. Capital flows
Egypt experienced a surge in capital inflows during the 1990s,motivated primarily by increased confidence among foreign investors inthe Egyptian economy following economic reform. Noteworthy devel-opments included successful fiscal adjustment and the curbing of inflationunder a relatively liberal capital account regime. However, the surge incapital inflows has raised some concerns regarding their impact on thestability and performance of the economy, especially because high capitalinflows cause pressure on the exchange rate, which undermines exportperformance.
b. Exchange rate regime
The exchange rate regime in Egypt underwent significant shifts inthe early 1990s. Starting in 1969, Egypt instituted a system of multipleexchange rates and maintained an “official” parallel market to attractworkers’ remittances and encourage tourism. The exchange rate policiespursued in the 1970s and 1980s resulted in a substantial appreciation ofthe Egyptian pound and undermined export competitiveness. As part ofthe reform programme, the Government established a free market in foreignexchange for current account transactions in 1991, and eased capital accountrestrictions further in 1992. The real exchange rate continued to appreciateafter 1991, partly as a result of nominal appreciation and partly as a resultof the differential in inflation between Egypt and its trading partners(Subramaniam and Handy, 1997; Mongardini, 1998). There is no evidenceto suggest that the real appreciation reflected productivity gains. Thecountry did not experience any improvement in trade performance. In fact

LÉONCE NDIKUMANA364
non-oil exports declined at the end of the decade. The Egyptian poundmay continue to appreciate in the future if capital inflows remain at theirpresent levels (keeping reserves high). Debt forgiveness and debt resched-uling may further improve the external reserves position, thus contributingto further real exchange rate appreciation.
c. The financial system
The Egyptian stock market is one of the oldest in the world. However,the stock exchange was largely dormant for over four decades followingthe policy shifts of the 1950s with the nationalization of industry and theadoption of central planning (Mecagni and Sourial, 1999). The 1990s sawa marked expansion of the stock market, with an increase in the number oflisted companies, market capitalization and liquidity. Much improvementis still needed, however, to provide an environment that allows the capitalmarket to channel and allocate resources efficiently, especially by enforcinginformation disclosure by firms and by strengthening the legal environmentto protect creditor and investor rights.
2. Kenya
a. Symptoms of a crisis in the late 1980s
Towards the end of the 1980s (especially starting in 1987), the Kenyaneconomy showed signs of a pending crisis: real GDP slowed down froman already weak position, the budget deficit was high (about 6 per cent ofGDP in 1987), and inflation rose from 4.8 per cent in 1986 to 7.6 per centin 1987 and continued to climb in the subsequent years. At the same time,the policy stance was characterized by considerable regulation of foreignexchange markets, trade and the financial system (including differentialcredit ceilings, interest rate controls and political intrusion in creditallocation). By the end of the decade, it was clear that in the absence ofmajor reforms, economic collapse would be inevitable. Here, only policyreforms in the areas of foreign exchange markets, and current and capitalaccounts are summarized (see Ariyoshi et al., 2000 and Krichene, 1998 forfurther details on recent policy reforms in Kenya).

CAPITAL FLOWS, CAPITAL ACCOUNT REGIMES AND FOREIGN EXCHANGE REGIMES IN AFRICA 365
b. Important policy reforms in exchange rates, the current accountand capital account
• In 1989, Kenya began the process of liberalization of the financialsystem. Interest rate ceilings were gradually removed and interest ratesfully liberalized by 1991.
• In 1991, liberalization of the current and capital accounts was initiatedwith the introduction of “foreign exchange bearer certificates of de-posits”, which could be used in current and capital account trans-actions. These certificates, available to residents and non-residents,could be freely traded in the secondary market and redeemed at thecentral bank at face value.
• Since 1991, some companies have been allowed to hold foreign-currency-denominated bank accounts abroad and domestically, andbanks have been allowed to conduct transactions in foreign exchangedirectly. Forward foreign exchange contracts have been allowed atmarket rates, albeit with some restrictions on the amount and the term.
• In the fourth quarter of 1993, the exchange rate regime shifted from acurrency composite peg to an independently floating regime.
• In 1994, the Kenyan shilling became fully convertible.
• In 1995, all remaining exchange controls were removed. Also removedwere restrictions on the purchase of shares and government securitiesby non-residents.
c. Crisis amidst (speedy) liberalization
Despite the liberalization efforts, the crisis that had begun at the endof the 1980s continued throughout the 1990s. Inflation rose from 19.8 percent in 1991 to 45 per cent in 1993. It started declining in 1994 and droppedto single-digit levels again later in the decade (5.8 per cent in 1998).
Due to the continued deterioration of the economic situation, theGovernment moved in, tightening both monetary and fiscal policy.

LÉONCE NDIKUMANA366
However, the tight policy stance may have contributed to suffocating analready weak economy by undermining domestic demand. Liberalizationin Kenya did not achieve the intended objectives of stabilizing the economyand boosting production. An IMF study concluded that “rapid and wide-ranging liberalization in the context of continued major macroeconomicimbalances may have increased the country’s vulnerability to capital flowsby providing legal channels for capital flight (the latter reflecting both adeterioration in private sector confidence and corruption)” (Ariyoshi etal., 2000: 67).
3. Malawi
a. Exchange rate and capital account regimes
Until May 2000, Malawi had actively managed its foreign exchangemarkets, which resulted in a large depreciation of the kwacha as well assevere distortions of economic incentives (IMF, 2001). The country dataindicate large depreciations of the kwacha, especially in 1994, 1998 (by40 per cent), and 2000 (by another 40 per cent). Even during periods ofrelative stability of the exchange rate (between 1994 and 1998), highinflation rates led to substantial real depreciation of the currency. May2000 marked a major policy shift, when the central bank stopped quotingan explicit exchange rate and reduced substantially its intervention fordetermining the exchange rate, thus making the exchange rate fully flexible.Since 1995, Malawi has moved towards liberalization of capital accounttransactions. For example, non-residents are allowed to repatriateinvestment proceeds without restriction (registration is required only forstatistical purposes).
b. Implications of membership in regional arrangements
Malawi is a member of various regional bodies, including SADC, theCommon Market for Eastern and Southern Africa (COMESA), and theCross-Border Initiative in Eastern and Southern Africa (CBI) (Fajgenbaumet al., 1999). It is one of the best performing participants in CBI andCOMESA with respect to trade liberalization. One important concern is

CAPITAL FLOWS, CAPITAL ACCOUNT REGIMES AND FOREIGN EXCHANGE REGIMES IN AFRICA 367
that its membership in various regional bodies could produce distortedeconomic incentives and create administrative problems when obligationsunder the various bodies are inconsistent. A structural constraint for Malawiis its weak productive capacity, which limits the gains from multilateralarrangements. Another important constraint is the poor development of itsfinancial system. The banking sector is heavily concentrated, with the twolargest banks accounting for 90 per cent of deposits. These banks lend to alimited number of companies, many of which own large shares of the banks’capital. This promotes insider lending, which results in inefficient allocationof credit.
4. Nigeria
a. Exchange rate regime
Over the years, Nigeria has applied a variety of foreign exchangearrangements, including fixed official exchange rates, market-determinedexchange rates, dual systems of fixed official rates, and rates based oninter-bank exchange (IMF, 1998). Before 1986 (the beginning of structuraladjustment), the official rate was fixed without any link to the market rateor inflation, resulting in a high premium. After 1986, the Governmentpursued a de facto indexation of the official exchange rate by adjusting theofficial exchange rate in response to changes in the parallel market toprevent the premium from being too large. The evidence shows that theofficial and parallel exchange rates moved together after 1986 (Azam,1999).
With the “abandonment” of the adjustment programme in 1994, theNigerian Government reinstated – among other controls – foreign exchangecontrols with an artificially fixed exchange rate. However, by the end of1994 it was clear that attempts to stabilize the naira by administrative meanshad failed. In 1995, the Government did a turnaround by resuming theeconomic liberalization programme. Since then, it has pursued policiesaimed at allowing the exchange rates to reflect market conditions, whileusing monetary policy to contain pressures on foreign exchange markets.In January 1999, the Government abolished the official exchange rate (fixedat 22 naira per dollar since 1993), and the Central Bank of Nigeria (CBN)

LÉONCE NDIKUMANA368
gradually shifted its intervention from weekly allocation of foreignexchange through the Autonomous Foreign Exchange Market (AFEM) toexclusive reliance on continuous buying and selling in the Interbank ForeignExchange Market (IFEM). This has eliminated the multiple exchange ratesarising from the spread between the rates in the two markets.
b. Liberalization of the capital account
Since 1995, Nigeria has embarked on a process of liberalization ofcontrols of capital movements. The following are some of the recentmeasures intended to encourage foreign capital inflows:
• The Foreign Exchange Monitoring and Miscellaneous ProvisionsDecree of July 1995 (retroactively effective as of January 1995)permits individuals and businesses to invest in any firm through anaccredited dealer in the AFEM.
• There is guaranteed transferability in convertible currency fordividends, profits, debt service and proceeds from whole or partialsale or liquidation of an initial investment.
• Nationals are allowed to invest in securities abroad, provided properdocumentation is used. However, nationals are not permitted to simplymake deposits abroad, as officials are concerned that this may be aconduit for capital flight.
• Earlier “indigenization” measures that required majority Nigerianownership of foreign enterprises have been abolished. There are nolimits to foreigners’ participation in any sector of the economy, exceptfor crude oil and gas.
The authorities still face two interrelated and serious issues, namely ahigh debt burden and capital flight. There is evidence of progress ineconomic reforms, which will contribute to improving the overall macro-economic environment. In particular, the country has embarked on acomprehensive programme of reform of the financial system aimed atstrengthening the regulatory and supervisory framework (e.g. more
CAPITAL FLOWS, CAPITAL ACCOUNT REGIMES AND FOREIGN EXCHANGE REGIMES IN AFRICA 369
independence for the CBN) and improving the stability of the bankingsector (through enforcement of capital adequacy rules and systematicmonitoring of banks). These measures, coupled with improvements inpolitical stability, are likely to improve investor confidence, which couldattract more capital into the country.
5. South Africa
a. Turbulence in financial markets and foreign exchange markets
The South African foreign exchange market and the financial systemsuffered the effects of the Asian financial crisis in mid-1998. Deteriorationin investor sentiment caused substantial capital outflows and a depreciationof the rand. The authorities responded by tightening monetary policy andby intervening in the foreign exchange market (IMF, 2000b). The financialturbulence receded at the end of 1998, and the South African Reserve Bank(SARB) allowed interest rates to decline. Low inflation expectations andprudent fiscal policy contributed to rejuvenating market confidence,resulting in a substantial return of international capital.
b. Liberalization of the capital account
Since 1994, the South African Government has been committed toprogressively abolishing controls on capital account transactions.Liberalization has covered transactions by non-residents and residents,banks and non-financial firms, private and public enterprises, as well asprivate individuals. Some of the important changes since 1995 are thefollowing:
• Dismantling of restrictions on capital account and foreign exchangetransactions by residents and non-residents. Non-residents are nowallowed to purchase shares, bonds and other assets, and to repatriatedividends, interest receipts, profits as well as initial investment capitalwith little or no restrictions.
• Restrictions on exchange transactions by residents have been sub-stantially relaxed. While capital and current account transactions by

LÉONCE NDIKUMANA370
residents are subject to quantitative restrictions, the quantitative capshave been progressively raised, and some have been abolished.
• However, the authorities maintain prudential regulation on foreignexchange by authorized dealers, with no quantitative limits.
• Investment abroad by residents is allowed within some limits. Forcorporations, the limit is 250 million rand for investments within theSADC region (no limits for Namibia, Lesotho and Swaziland, whichare members of the Common Monetary Area) and 50 million randelsewhere. Institutional investors are allowed to invest up to 15 percent of their assets abroad. Private individuals can invest up to750,000 rand abroad.
c. Foreign exchange policy: the “forward book”
The SARB has intervened in the foreign exchange market since the1960s. The Bank has often maintained a large net open forward position(NOFP) whereby the Bank’s forward US dollar liabilities exceed its forwarddollar assets. The official objective of this policy is to absorb speculativepressures on the rand, preventing sharp depreciations and mitigatingincreases in the interest rate. The objective is not to defend a predeterminedvalue of the rand but to ease (market-driven) adjustment of the exchangerate.
The experience of the 1990s suggests that the effectiveness of theSARB’s intervention in the foreign exchange market in dampeningpressures on the exchange rate was minimal and short-lived at best. Incontrast, the evidence tends to support the view that high NOFPs lead tohigher risk-premiums on investments in South Africa, as the market isdoubtful about the ability of the SARB to sustain a large uncovered forwardbook.
CAPITAL FLOWS, CAPITAL ACCOUNT REGIMES AND FOREIGN EXCHANGE REGIMES IN AFRICA 371
6. Uganda
a. Exchange rate regime
The Ugandan Government is committed to moving towards liberalforeign exchange and trade regimes. In particular, it is committed to notresisting fluctuations in the exchange rate due to changes in economicfundamentals, and to supporting liberalization of the foreign exchangeregime with appropriate fiscal and monetary policies. Recently the Ugandanshilling has been relatively more stable than it was in the 1980s and early1990s, and compared to neighbouring countries (Krichene, 1998).
b. Promoting a capital-friendly environment
The Ugandan Government has been noted for its commitment topursuing macroeconomic policy reforms (especially fiscal and monetarypolicies). This will allow it to establish policy credibility and to achievemacroeconomic stability, which will help to attract new private foreigncapital. The Government has also pursued policies aimed at strengtheningthe financial system, including privatization of State-owned banks,enhancing banking supervision and regulation (including granting increasedautonomy to the central bank), restructuring and recapitalization of weakbanks, and the establishment of a capital market infrastructure. Evidenceof credible commitment to economic reform and improvements in themacroeconomic environment will increase investor confidence andstimulate capital inflows.
7. The CFA zone
a. Origins
The CFA zone is the outcome of the political and economic relationsbetween France and its former West and Central African colonies. In the1930s and 1940s, France established currencies in its colonies that werepegged to the French franc (FF). At the end of the second world war, thesecurrencies were consolidated into the Franc des Colonies Françaises

LÉONCE NDIKUMANA372
d’Afrique (or CFA franc). Until the end of colonization, the currency wasissued by the Caisse Centrale de la France d’Outre Mer. After inde-pendence, the two regional central banks of the CFA zone, the BanqueCentrale des Etats de l’Afrique de l’Ouest (BCEAO) and the Banque desEtats de l’Afrique Centrale (BEAC), took over issuance of the CFA franc.
The CFA zone comprises 14 countries, including 12 former Frenchcolonies and 2 new member: Equatorial Guinea (since 1985) and Guinea-Bissau (since 1997). The zone comprises two regions: eight West AfricanStates (Benin, Burkina Faso, Côte d’Ivoire, Guinea-Bissau, Mali, Niger,Senegal and Togo) and six Central African States (Cameroon, the CentralAfrican Republic, Chad, Congo, Equatorial Guinea, and Gabon). The firstgroup of countries belongs to the West African Monetary Union (WAMU)and the second belongs to the Central African Monetary Area (CAMA).
b. Exchange rate and monetary arrangements
The two regional central banks operate independently and issue twoseparate CFA currencies: the franc de la Communauté Financière del’Afrique and the franc de la Coopération Financière Africaine. But sincethe two currencies have the same parity to the FF, they are equivalent, forall practical purposes, and the zone is in fact a common currency area.Any decision to change the parity of the currencies requires the unanimoussupport of all member States of the entire zone.
The parity of the CFA franc to the FF was established in October1948 at 0.5 CFA francs per FF. However, in 1968 the parity was adjustedfollowing the introduction of a new FF equivalent to 100 of the old FF.The value of the CFA franc relative to the FF did not change, but its absolutevalue was raised to 50 CFA francs per FF. Following the continueddeterioration of economic conditions in the 1980s and early 1990s, theCFA franc, which had been overvalued for years, was finally devaluatedby 50 per cent in February 1994.
Today, the CFA franc is fully convertible and there is free capitalmobility between the two regions and France. Full convertibility of theCFA franc is guaranteed by the French Treasury, rather than the central
CAPITAL FLOWS, CAPITAL ACCOUNT REGIMES AND FOREIGN EXCHANGE REGIMES IN AFRICA 373
bank of France. Therefore the arrangement is of a budgetary rather thanmonetary nature. This feature facilitated the shift of the parity from the FFto the euro when the EMU was established, as it did not require the approvalof other members of the EMU. This shift has left the operating structuresof the CFA zone and the relationships between the group and France funda-mentally unchanged. The current fixed rate is 100 CFAF per 0.8385 euro.(For further details on the CFA zone and the implications of the EMU see,among others, Hadjimichael and Galy, 1997, and Honohan and Lane, 2000).
Under the fixed exchange regime, zone member countries have beenable to maintain inflation rates that are lower than those of other comparablesub-Saharan African countries. However price stability has been achievedat significant costs. The inability to adjust the exchange rate has resultedin higher sensitivity of economic growth to real shocks, especially terms-of-trade fluctuations. Most observers conclude that CFA zone countrieswould have been better off having flexibility to use exchange rate adjust-ments in the presence of external shocks (Savvides, 1996).

LÉONCE NDIKUMANA374Ta
ble
A.1
CO
NTR
OLS
ON
FO
REI
GN
EXC
HA
NG
E A
ND
CA
PITA
L A
CC
OU
NT
TRA
NSA
CTI
ON
SIN
SO
ME
AFR
ICA
N C
OU
NTR
IES
AS
OF
1999
Con
trols
on
FDI
Lim
its o
n op
enR
esid
ent a
ccou
nts
Ban
ks b
orro
win
gfo
reig
n ex
chan
geC
ount
ryIn
war
d FD
IO
utw
ard
FDI
abro
adpo
sitio
nH
eld
dom
estic
ally
Hel
d ab
road
Ango
laEf
fect
ive
May
199
9:C
itize
ns a
llow
ed to
Allo
wed
Dai
ly o
pen
posi
tion
Dep
osits
allo
wed
Cle
aran
ce n
eede
d fo
r-
min
imum
of
inve
st a
broa
dup
to $
500,
000
for
with
out d
ecla
ring
ente
rpris
es; n
o$6
0,00
0 fo
r FD
Iba
nks;
$15
0,00
0so
urce
of f
unds
appr
oval
nee
ded
for
-up
to $
25,0
00:
for f
orei
gn e
xcha
nge
indi
vidu
als
cent
ral b
ank
bure
aus.
clea
ranc
e re
quire
d-
abov
e $2
5,00
0:go
vern
men
t app
rova
lre
quire
d
Beni
nR
epor
ting
requ
ired
Subj
ect t
o ap
prov
al;
Aut
horiz
edN
o pr
uden
tial r
atio
sSu
bjec
t to
prio
rAl
low
ed w
ith p
rior
only
for s
tatis
tical
max
imum
of 7
5%in
term
edia
ries
auth
oriz
atio
nau
thor
izat
ion
by M
OF
purp
oses
may
be
finan
ced
bym
ay b
orro
w fr
eely
by M
OF
and
appr
oval
of t
hefo
reig
n lo
ans.
abro
adBC
EAO
Bots
wan
an.
a.N
o lim
itsn.
a.O
vera
ll lim
it of
30%
No
limits
on
No
rest
rictio
nsof
uni
mpa
ired
amou
nts
bank
’s c
apita
l
Com
oros
Con
trolle
dS
ubje
ct to
app
rova
lC
ontro
lled
n.a.
Allo
wed
, app
rova
lAl
low
ed, a
ppro
val
on u
nder
lyin
g tra
ns-
requ
ired
requ
ired
actio
ns
Con
go,
Subj
ect t
o lic
ense
Subj
ect t
o lic
ense
Con
trolle
dC
eilin
g fo
r eac
h ba
nkIn
aut
horiz
ed b
anks
,Al
low
ed fo
r pub
lic a
nd D
em. R
ep.
from
cen
tral b
ank
from
cen
tral b
ank
auth
oriz
ed b
y ce
ntra
lno
app
rova
l by
cent
ral
sem
i-pub
lic e
nter
pris
es,
bank
bank
subj
ect t
o ce
ntra
l ban
k’s
appr
oval
/...

CAPITAL FLOWS, CAPITAL ACCOUNT REGIMES AND FOREIGN EXCHANGE REGIMES IN AFRICA 375
Egyp
tN
on-b
ank
fore
ign
n.a.
n.a.
Tota
l for
eign
ass
ets
toAl
low
edAl
low
edex
chan
ge d
eale
rsto
tal f
orei
gn li
abili
ties
mus
t be
entir
ely
not t
o ex
ceed
105
%Eg
yptia
n-ow
ned
Ethi
opia
Fore
igne
rs c
an h
old
n.a.
Subj
ect t
o ce
ntra
lM
axim
um 1
5% o
f aAl
low
ed fo
r exp
orte
rsN
ot a
llow
edup
to 1
00%
of s
hare
sba
nk’s
aut
horiz
atio
nba
nk’s
cap
ital a
t end
of
with
cen
tral b
ank’
sin
any
ven
ture
s, e
xclu
d.bu
sine
ss d
ay o
n ea
chap
prov
alba
nkin
g, in
sura
nce,
Frid
ayan
d tra
nspo
rt;In
vest
men
t res
trict
ed in
som
e se
ctor
s;ta
x in
cent
ives
for F
DI
Gab
onM
inim
um n
atio
nal
Mus
t be
decl
ared
n.a.
n.a.
Not
allo
wed
Allo
wed
with
prio
rsh
areh
oldi
ng o
f 10%
at M
OFB
Pap
prov
alof
cap
ital
Gha
naM
inim
um a
mou
nts
of:
Appr
oval
on
the
Allo
wed
with
prio
rAl
low
ed b
ased
on
Allo
wed
Perm
itted
with
prio
r-
$10,
000
if jo
int
basi
s of
mer
itno
tific
atio
n of
the
volu
me
of fo
reig
nap
prov
alve
ntur
e is
with
ace
ntra
l ban
kex
chan
ge tr
ansa
ctio
nsG
hana
ian
partn
erby
ban
ks; s
ubje
ct to
-$5
0,00
0 w
hen
who
llype
riodi
c re
view
fore
ign-
owne
d-
$300
,000
if e
mpl
oys
atle
ast 1
0 G
hana
ians
and
who
lly o
r par
tlyfo
reig
n-ow
ned
Tabl
e A
.1 (c
ontin
ued)
CO
NTR
OLS
ON
FO
REI
GN
EXC
HA
NG
E A
ND
CA
PITA
L A
CC
OU
NT
TRA
NSA
CTI
ON
SIN
SO
ME
AFR
ICA
N C
OU
NTR
IES
AS
OF
1999
Con
trols
on
FDI
Lim
its o
n op
enR
esid
ent a
ccou
nts
Ban
ks b
orro
win
gfo
reig
n ex
chan
geC
ount
ryIn
war
d FD
IO
utw
ard
FDI
abro
adpo
sitio
nH
eld
dom
estic
ally
Hel
d ab
road
.../..
.

LÉONCE NDIKUMANA376
.../..
.
Keny
aN
o co
ntro
lsN
o co
ntro
lsN
o co
ntro
lsAl
low
ed u
p to
20%
No
cont
rols
No
cont
rols
of p
aid-
up c
apita
l
Mau
ritiu
sC
ontro
lled
n.a.
n.a.
Dai
ly m
axim
um o
f 15%
Allo
wed
for c
ompa
nies
Con
trolle
dof
Tie
r I c
apita
lan
d in
divi
dual
s
Moz
ambi
que
-In
itial
cap
ital r
e-C
ontro
lled
Borr
owin
g m
ust b
eLi
mits
set
as
%Al
low
edO
peni
ng m
ust b
e re
porte
dpa
triat
ion
guar
ante
ere
gist
ered
with
of c
ore
capi
tal
to c
entra
l ban
k-
sele
ctiv
e in
vest
men
tce
ntra
l ban
kin
cent
ives
Nam
ibia
Free
inw
ard
trans
fers
Appl
icat
ion
cons
ider
edAl
low
ed fo
r aut
horiz
edM
axim
um o
f 15%
of
Allo
wed
with
prio
rAl
low
ed fo
r im
port/
expo
rtof
cap
ital f
or e
quity
on m
erit;
lim
its o
fde
aler
s fo
r app
rove
dba
nk’s
sha
re c
apita
lap
prov
alco
mpa
nies
, app
rova
lin
vest
men
t fro
mN
$50
mill
ion
outs
ide
purp
oses
and
unim
paire
dre
quire
dno
n-C
MA
coun
tries
of S
ADC
, N$2
50 m
illion
rese
rves
(res
iden
ts in
side
SAD
C.
and
non-
resi
dent
s)
Nig
eria
No
ceili
ng fo
r for
eign
n.a.
n.a.
With
lim
itsAl
low
ed w
ithN
ot a
llow
edca
pita
l par
ticip
atio
n; re
-au
thor
ized
dea
lers
stric
tions
in p
riorit
y ar
eas
(cru
de o
il an
d ga
s)
Seyc
helle
sFr
ee, e
xcep
t for
n.a.
n.a.
n.a.
Allo
wed
; app
rova
lAl
low
ed; a
ppro
val
owne
rshi
p of
land
requ
ired
requ
ired
Tabl
e A
.1 (c
ontin
ued)
CO
NTR
OLS
ON
FO
REI
GN
EXC
HA
NG
E A
ND
CA
PITA
L A
CC
OU
NT
TRA
NSA
CTI
ON
SIN
SO
ME
AFR
ICA
N C
OU
NTR
IES
AS
OF
1999
Con
trols
on
FDI
Lim
its o
n op
enR
esid
ent a
ccou
nts
Ban
ks b
orro
win
gfo
reig
n ex
chan
geC
ount
ryIn
war
d FD
IO
utw
ard
FDI
abro
adpo
sitio
nH
eld
dom
estic
ally
Hel
d ab
road

CAPITAL FLOWS, CAPITAL ACCOUNT REGIMES AND FOREIGN EXCHANGE REGIMES IN AFRICA 377
Sout
h Af
rica
n.a.
Lim
its fo
r com
pani
es:
Prio
r app
rova
l for
Max
imum
of 1
5% o
fLi
mite
d to
R50
,000
for
Mer
it-ba
sed
appr
oval
;R
250
mill
ion
with
inm
ediu
m- a
nd lo
ng-
net q
ualif
ying
cap
ital
indi
vidu
als;
the
max
.m
ax. R
750,
000;
SAD
C (n
o lim
it fo
r CAM
term
bor
row
ing
and
rese
rves
allo
wed
FD
I of
indi
vidu
als
may
reta
inco
untri
es),
R50
mill
ion
R75
0,00
0 m
ay b
e he
ldfo
reig
n-ea
rned
inco
me
else
whe
re; R
750,
000
in d
omes
tic a
ccou
nts
abro
adfo
r ind
ivid
uals
Tanz
ania
,Ap
prov
al re
quire
d;Su
bjec
t to
appr
oval
by
Borr
owin
g re
gula
ted,
Max
imum
20%
of
Allo
wed
For i
ndiv
idua
ls n
oU
nite
d R
ep.
som
e ar
eas
rest
ricte
dce
ntra
l ban
kbu
t ban
ks p
erm
itted
toco
re c
apita
lre
stric
tions
on
mon
eyof
to p
ublic
sec
tors
, som
eop
erat
e cr
edit
lines
with
acqu
ired
abro
ad; f
orto
Tan
zani
an c
itize
nsco
rres
pond
ents
ban
ks, n
o re
stric
tions
on o
pera
tions
with
corr
espo
nden
ts
Tuni
sia
Free
in m
ost s
ecto
rs;
Cen
tral b
ank’s
app
rova
lFr
ee u
p to
D10
mill
ion
Glo
bal l
imit
of 2
0%Al
low
ed; s
ubje
ct to
Subj
ect t
o ap
prov
al fo
rap
prov
al re
quire
d in
requ
ired
for t
rans
fers
of
of b
ank’
s ne
t equ
ityre
gula
tions
indi
vidu
als;
free
for
som
e se
rvic
e se
ctor
sca
pita
l; “fr
ee” (
with
in lim
its)
capi
tal i
n al
l cur
renc
ies
resi
dent
ban
kstra
nsfe
r of f
unds
by
ex-
(max
imum
of 1
0% in
porte
rs to
cov
er in
stal
latio
n,ea
ch c
urre
ncy)
mai
nten
ance
and
ope
ratin
gco
sts
of s
ubsi
diar
ies
Uga
nda
No
cont
rols
No
cont
rols
n.a.
Max
imum
20%
of
Allo
wed
Allo
wed
core
cap
ital
Tabl
e A
.1 (c
ontin
ued)
CO
NTR
OLS
ON
FO
REI
GN
EXC
HA
NG
E A
ND
CA
PITA
L A
CC
OU
NT
TRA
NSA
CTI
ON
SIN
SO
ME
AFR
ICA
N C
OU
NTR
IES
AS
OF
1999
Con
trols
on
FDI
Lim
its o
n op
enR
esid
ent a
ccou
nts
Ban
ks b
orro
win
gfo
reig
n ex
chan
geC
ount
ryIn
war
d FD
IO
utw
ard
FDI
abro
adpo
sitio
nH
eld
dom
estic
ally
Hel
d ab
road
.../..
.

LÉONCE NDIKUMANA378
Zam
bia
No
cont
rols
No
cont
rols
No
cont
rols
n.a.
Allo
wed
Allo
wed
(rep
ortin
g fo
r sta
tistic
alpu
rpos
es)
Zim
babw
eAp
prov
al b
y ZI
C; m
ax.
n.a.
Subj
ect t
o ex
chan
geFo
r aut
horiz
ed d
eale
rs,
Allo
wed
Allo
wed
, sub
ject
to p
rior
fore
ign-
owne
rshi
p: u
pco
ntro
lsm
axim
um o
fap
prov
alto
100%
in “p
riorit
yU
S$2
mill
ion
orse
ctor
s” (m
anuf
actu
ring,
10%
of c
apita
lm
inin
g, h
otel
s), 7
0% in
spec
ializ
ed s
ervi
ces;
35%
in p
artn
ersh
ipw
ith n
atio
nals
in“r
eser
ve s
ecto
rs”
Sour
ce:
IMF
(200
0b).
Not
e:M
OF
= M
inis
try o
f Fin
ance
; BC
EA
O =
Ban
que
Cen
trale
des
Eta
ts d
e l’A
friqu
e de
l’O
uest
(Cen
tral B
ank
of W
est A
frica
n S
tate
s); C
MA
= C
omm
on M
onet
ary
Are
a (c
ompr
isin
g Le
soth
o, N
amib
ia, S
outh
Afri
ca, S
waz
iland
); S
AD
C =
Sou
ther
n A
frica
n D
evel
opm
ent C
omm
unity
; ZIC
= Z
imba
bwe
Inve
stm
ent C
entre
.
Tabl
e A
.1 (c
oncl
uded
)
CO
NTR
OLS
ON
FO
REI
GN
EXC
HA
NG
E A
ND
CA
PITA
L A
CC
OU
NT
TRA
NSA
CTI
ON
SIN
SO
ME
AFR
ICA
N C
OU
NTR
IES
AS
OF
1999
Con
trols
on
FDI
Lim
its o
n op
enR
esid
ent a
ccou
nts
Ban
ks b
orro
win
gfo
reig
n ex
chan
geC
ount
ryIn
war
d FD
IO
utw
ard
FDI
abro
adpo
sitio
nH
eld
dom
estic
ally
Hel
d ab
road

CAPITAL FLOWS, CAPITAL ACCOUNT REGIMES AND FOREIGN EXCHANGE REGIMES IN AFRICA 379
Table A.2
EXCHANGE RATE REGIMES IN 1991 AND 1999(Grouped by the exchange rate regimes in 1991)
Regime Category Regime Category Currency pegCountry 1991 1991 1999 1999 1999
Benin NS/CBA Hard peg NS/CBA Hard peg French francBurkina Faso NS/CBA Hard peg NS/CBA Hard peg French francCameroon NS/CBA Hard peg NS/CBA Hard peg French francCentral African
Republic NS/CBA Hard peg NS/CBA Hard peg French francChad NS/CBA Hard peg NS/CBA Hard peg French francCongo NS/CBA Hard peg NS/CBA Hard peg French francCôte d’Ivoire NS/CBA Hard peg NS/CBA Hard peg French francDjibouti NS/CBA Hard peg NS/CBA Hard peg French francEquatorial Guinea NS/CBA Hard peg NS/CBA Hard peg French francGabon NS/CBA Hard peg NS/CBA Hard peg French francGuinea-Bissau CP Soft peg NS/CBA Hard peg French francMali NS/CBA Hard peg NS/CBA Hard peg French francNiger NS/CBA Hard peg NS/CBA Hard peg French francSenegal NS/CBA Hard peg NS/CBA Hard peg French francTogo NS/CBA Hard peg NS/CBA Hard peg French franc
Botswana FP Soft peg FP Soft peg BasketaCape Verde FP Soft peg FP Soft peg EscudoComoros FP Soft peg FP Soft peg French francEgypt FP Soft peg FP Soft peg US$Lesotho FP Soft peg FP Soft peg RandLibyan Arab
Jamahiriya HB Soft peg HB Soft peg SDRMorocco FP Soft peg FP Soft peg BasketbNamibia NS/CBA Hard peg FP Soft peg RandSeychelles FP Soft peg FP Soft peg BasketcSwaziland FP Soft peg FP Soft peg RandTunisia CP Soft peg CP Soft peg CPZimbabwe FP Soft peg FP Soft peg US$
Algeria FP Soft peg MF Independent MFfloat
Angola FP Soft peg IF Independent IFfloat
Burundi FP Soft peg MF Independent MFfloat
Congo, IF Independent IF Independent IFDem. Rep. of float float
Eritrea IF Independent IFfloat
Ethiopia FP Soft peg MF Independent MFfloat
Gambia IF Independent IFfloat
/...

LÉONCE NDIKUMANA380
Ghana IF Independent IF Independent IFfloat float
Guinea MF Independent IF Independent IFfloat float
Kenya FP Soft peg MF Independent MFfloat
Liberia FP Soft peg IF Independent IFfloat
Madagascar FP Soft peg IF Independent IFfloat
Malawi FP Soft peg MF Independent MFfloat
Mauritania MF Independent MF Independent MFfloat float
Mauritius FP Soft peg IF Independent IFfloat
Mozambique MF Independent IF Independent IFfloat float
Nigeria MF Independent MF Independent MFfloat float
Rwanda FP Soft peg IF Independent IFfloat
Sao Tome CP Soft peg IF Independent IFand Principe float
Sierra Leone IF Independent IF Independent IFfloat float
Somalia CP Soft peg IF Independent IFfloat
South Africa MF Independent IF Independent IFfloat float
Sudan FP Soft peg IF Independent IFfloat
Tanzania, FP Soft peg IF Independent IFUnited Rep. of float
Uganda FP Soft peg IF Independent IFfloat
Zambia MF Independent IF Independent IFfloat float
Source: Fischer (2001); IMF (2000a).Note: Abbreviations: CP = Crawling pegs; FP = other conventional fixed pegs; HB = pegged rate in
horizontal band; IF = independently floating; MF = managed float with no pre-announcedexchange rate path; CB = rates within crawling bands; NS = arrangements with no separate legaltender; CBA = currency board; SDR = special drawing rights.
a SDR, rand.b US$, SDR, £.c Euro, yen, £, US$, Singapore $, rand.
Table A.2 (concluded)
EXCHANGE RATE REGIMES IN 1991 AND 1999(Grouped by the exchange rate regimes in 1991)
Regime Category Regime Category Currency pegCountry 1991 1991 1999 1999 1999

CAPITAL FLOWS, CAPITAL ACCOUNT REGIMES AND FOREIGN EXCHANGE REGIMES IN AFRICA 381
NOTES
1 For further discussion of financial development in Africa, see Ndikumana (2001), Gelbardand Leite (1999), Nissanke and Aryeetey (1998), and Mehran et al. (1998).
2 Commitment of monetary policy to price stability does not necessarily amount to sur-render by the national authoritiies of the right to use monetary policy to respond toexogenous shocks. The idea is to foster disciplined discretion in monetary policy, espe-cially by shielding monetary policy from fiscal pressures.
3 The “hard pegs” category includes regimes with a currency board, or arrangementswith no special legal tender; the “soft pegs” category includes other conventional fixedpegs, pegged rates in horizontal bands, crawling pegs, and pegged rates with crawlingbands. The “independent floats” category includes independently floating and man-aged float with no pre-announced exchange rate path (Fischer, 2001).
4 For a brief history of the CFA zone and its operational structure, see the text in theappendix. Also see Honohan and Lane (2000), and Guillaumont, Guillaumont and Plane(1988) for quantitative analyses of economic performance in the CFA zone. The findingof low inflation in countries with fixed-peg regimes is consistent with the results fromexisting cross-country studies (see Ghosh et al., 1997).
5 The choice of the year 1994 to split the 1990s decade for the SADC group is primarilyfor comparison purposes with CFA zone countries. For South Africa, 1994 is histori-cally important as it marks the end of the apartheid era, and the year is therefore anatural break point for that country.
6 Instrument independence of the central bank refers to the freedom to choose the mon-etary policy instruments needed to meet given macroeconomic objectives. Goal inde-pendence means the central bank’s freedom to set the ultimate goals of monetary policy.In practice, the independence of the central bank is generally limited to instrumentindependence.
7 Note that the arguments in favour of or against dollarization discussed here apply alsoto “euroization”.
8 The average for the 1994–2000 period is computed from data in IMF, Direction ofTrade Statistics 2001. See Yeats (1999); Aryeetey et al. (1996); and Asante (1997) forin-depth discussions of trade and regionalism in Africa.
REFERENCES
Ajayi I and Khan M, eds. (2000). External Debt and Capital Flight in Sub-Saharan Africa.Washington, DC, The IMF Institute.
Ariyoshi A, Habermeier K, Laurens B, Tker-Robe I, Canales-Kriljenko JI, Kirilenko A (2000).Capital controls: Country experiences with their use and liberalization. IMF OccasionalPaper 190, Washington, DC, IMF.
LÉONCE NDIKUMANA382
Aryeetey E, Robinson P, Lyakurwa W, and Mistry P (1996). Regionalism and the GlobalEconomy. The Case of Africa. The Hague, FONDAD.
Asante SKB (1997). Regionalism and Africa’s Development. Expectations, Reality, andChallenges. New York, St. Martin Press.
Azam J-P (1999). Dollars for sale: Exchange rate policy and inflation in Africa. WorldDevelopment, 27 (10): 1843–1859.
Berg A and Borensztein E (2000). The pros and cons of full dollarization. IMF Working Paper00/50. Washington, DC, International Monetary Fund.
Bhinda N, Griffith-Jones S, Leape J and Martin M (1999). Private Capital Flows to Africa.Perceptions and Reality. The Hague, FONDAD.
Boyce J and Ndikumana L (2001). Is Africa a net creditor? New estimates of capital flightfrom severely indebted sub-Saharan African countries, 1970–1996. Journal ofDevelopment Studies, 38 (2): 27–56, December.
Calvo G and Reinhart C (1999). Capital flow reversals, the exchange rate debate, anddollarization. Finance and Development, September: 13–15.
Calvo G and Reinhart C (2000). Fear of floating. Working Paper 7993, National Bureau ofEconomic Research, Cambridge, MA.
Collier P and J W Gunning (1999a) Explaining African economic performance. Journal ofEconomic Literature, 37(1): 64–111.
Collier P and J W Gunning (1999b). Why has Africa grown slowly? Journal of EconomicPerspectives, 13(3): 3–22.
Collier P, Hoeffler A and Pattillo C (1999). Flight capital as a portfolio choice. Unpublishedmanuscript, World Bank, Washington, DC.
Collier P and Pattillo C (2000). Investment and risk in Africa. In: Collier P and Pattillo C, eds.,Investment and Risk in Africa. New York, St. Martin Press: 3–30.
Cooper R (1999). Should capital controls be banished? Brookings Papers on Economic Activity1: 89–141.
Fajgenbaum J, Sharer R, Thugge K, and DeZoysa H (1999). The Cross-Border Initiative inEastern and Southern Africa. Washington, DC, International Monetary Fund, July 14.
Fischer S (1999). Capital account liberalization and the role of the IMF. Essays in InternationalFinance: Should the IMF Pursue Capital-Account Convertibility? No. 207. Princeton,NJ, Princeton University: 1–10.
Fischer S (2001). Exchange rate regimes: Is the bipolar view correct? Journal of EconomicPerspectives, 15 (2): 3–24.
Gelbard E and Leite SP (1999). Measuring financial development in sub-Saharan Africa.Working Paper 99/105, International Monetary Fund, Washington, DC.
Ghosh A, Guld A-M, Ostry J, Wolf H (1997). Does the nominal exchange rate regime matter?NBER Working paper 5874, National Bureau of Economic Research, Cambridge, MA.
Guillaumont P, Guillaumont S and Plane P (1988). Participating in African monetary unions:An alternative evaluation. World Development 16(5): 569–576.
Hadjimichael M and Galy M (1997). The CFA franc zone and the EMU. Working paper 97/156, International Monetary Fund, Washington, DC.
Honohan P and Lane P (2000). Will the euro trigger more monetary unions in Africa? Workingpaper 2393, World Bank, Washington, DC.
CAPITAL FLOWS, CAPITAL ACCOUNT REGIMES AND FOREIGN EXCHANGE REGIMES IN AFRICA 383
IMF (1998). Nigeria: Selected issues and statistical appendix. Staff Country Report no. 98/78,International Monetary Fund, Washington, DC.
IMF (2000a). Annual Report on Exchange Arrangements and Exchange Restrictions.Washington, DC, International Monetary Fund.
IMF (2000b). South Africa: Selected Issues. Staff Country Report no. 00/42, InternationalMonetary Fund, Washington, DC
IMF (2001). Malawi: Selected issues and statistical appendix. Country Report no. 01/32,International Monetary Fund, Washington, DC.
Kasekende L, Kitabire D and Martin M (1999). Capital flows and macroeconomic policy insub-Saharan Africa. In: Helleiner GK, ed., Capital Account Regimes and the DevelopingCountries. New York, St. Martin Press: 141–183.
Krichene N (1998). Purchasing power parities in five East African countries: Burundi, Kenya,Rwanda, Tanzania, and Uganda. IMF Working Paper 98/148. Washington, DC,International Monetary Fund.
Lensink R, Hermes N and Murinde V (1998). The effect of financial liberalization on capitalflight in African economies, World Development 26(7): 1349–1368.
Lensink R, Hermes N and Murinde V (2000). Capital flight and political risk. Journal ofInternational Money and Finance, 19: 73–92.
Levine R and Zervos S (1998). Stock markets, banks, and economic growth. AmericanEconomic Review, 88 (3): 537–557.
Mecagni M and Sourial M (1999). The Egyptian stock market: Efficiency tests and volatilityeffects. IMF Working Paper 99/48. Washington, DC, International Monetary Fund.
Mehran H, Ugolini P, Briffaux JP, Iden G, Lybek T, Swaray S and Hayward P (1998). Financialsector development in sub-Saharan African countries. IMF Occasional Paper 169.Washington, DC, International Monetary Fund.
Mongardini J (1998). Estimating Egypt’s equilibrium real exchange rate. IMF Working Paper98/5, Washington, DC, International Monetary Fund.
Mussa M, et al. (2000). Exchange rate regimes in an increasingly integrated world economy.IMF Occasional Paper no. 193. Washington, DC, International Monetary Fund.
Ndikumana L (2001). Financial markets and economic development in Africa. Working paper17, Political Economy Research Institute, University of Massachusetts, Cambridge, MA.
Ndikumana L and Boyce JK (1998). Congo’s odious debt: External borrowing and capitalflight in Zaïre. Development and Change, 29: 1995–217.
Ndikumana L and Boyce JK (2001). Public debts and private assets: Explaining capital flightfrom sub-Saharan African countries. Mimeo, Department of Economics, University ofMassachusetts.
Nissanke M and Aryeetey E (1998). Financial Integration and Development in Sub-SaharanAfrica. London, Routledge.
Nyoni T (2000). Capital flight from Tanzania. In: Ajayi I and Khan M, eds. External Debt andCapital Flight in Sub-Saharan Africa. Washington, DC, IMF Institute: 265–299.
Obstfeld M and Rogoff K (1995). The mirage of fixed exchange rates. Journal of EconomicPerspectives, 9(4): 73–96.
Olopoenia R (2000). Capital flight from Uganda, 1971-94. In: Ajayi I and Khan M, eds. ExternalDebt and Capital Flight in Sub-Saharan Africa. Washington, DC, IMF Institute: 238–264.

LÉONCE NDIKUMANA384
Saviddes, A (1996). CFA franc zone membership and exchange rate variability. Journal ofAfrican Economies, 5(1): 52–68.
Singh A (1999). Should Africa promote stock market capitalism? Journal of InternationalDevelopment, 11: 343–365.
Singh, A and Weisse B (1998). Emerging stock markets, portfolio capital flows and long-termeconomic growth: Micro and macroeconomic perspectives. World Development, 26(4):607–622.
Subramaniam A and Handy H (1997). The Egyptian stabilization experience: An analyticalretrospective. Working paper 97/105, International Monetary Fund, Washington, DC.
Ul Haque H, Mark N and Mathieson D (2000). Rating Africa: The economic and politicalcontent of risk indicators. In: Collier P and Pattillo C, eds., Investment and Risk inAfrica. New York, St. Martin Press, 33–70.
UNCTAD (1992) World Investment Report 1992: Transnational Corporations as Engines ofGrowth. New York, United Nations, Publication sales no E.92.II.A.19.
UNCTAD (1993). World Investment Report 1993: Transnational Corporations and IntegratedInternational Production. New York and Geneva, United Nations Publication sales noE.93.II.A.14.
UNCTAD (1994) World Investment Report 1994: Transnational Corporations, Employmentand the Workplace. New York and Geneva, United Nations Publication sales noE.94.II.A.14.
UNCTAD (1995a). Foreign Direct Investment in Africa. Current Studies, Series, A, No. 28.United Nations Publication sales no E.95.II.A.6
UNCTAD (1995b). World Investment Report 1995: Transnational Corporations andCompetitiveness. New York and Geneva, United Nations Publication sales no E.95.II.A.9
UNCTAD (1996). World Investment Report 1996: Investment, Trade and International PolicyArrangements. New York and Geneva, United Nations Publication sales no E. 96.2.A.14.
UNCTAD (1997). World Investment Report 1997: Transnational Corporations, MarketStructure and Competition Policy. New York and Geneva, United Nations Publicationsales no E.97.II.D.10.
UNCTAD (1998) World Investment Report 1998: Trends and Determinants. New York andGeneva, United Nations Publication sales no E.98.II.D.5.
UNCTAD (1999) World Investment Report 1999: Foreign Direct Investment and the Challengeof Development. New York and Geneva, United Nations Publication sales no E.99.II.D.3.
UNCTAD (2000) World Investment Report 2000: Cross-Border Mergers and Acquisitions,and Development. New York and Geneva, United Nations Publication sales noE.99.II.D.20.
World Bank (1997a). Global Development Finance (CD-ROM editions). Washington, DC,World Bank.
World Bank (1997b). Private Capital Flows to Developing Countries. The Road to FinancialIntegration. New York, Oxford University Press for the World Bank.
World Bank (2000a). Global Development Finance (CD-ROM editions). Washington, DC,World Bank.
World Bank (2000b). World Development Indicators 2000. Washington, DC, World Bank.Yeats A (1999). What can be expected from African regional trade arrangements? Working
paper 2004, World Bank, Washington, DC.

Palais des NationsCH-1211 GENEVA 10
Switzerland(www.unctad.org)
UNITED NATIONS CONFERENCEON TRADE AND DEVELOPMENT
Selected UNCTAD Publications
Trade and Development Report, 2002United Nations publication, sales no. E.02.II.D.2ISBN 92-1-112549-9
Part One Global Trends and ProspectsI The World Economy: Performance and Prospects
II The Multilateral Trading System After Doha
Part Two Developing Countries in World TradeIII Export Dynamism and Industrialization in Developing CountriesIV Competition and the Fallacy of CompositionV China’s Accession to WTO: Managing Integration and Industrialization
Trade and Development Report, 2001United Nations publication, sales no. E.01.II.D.10ISBN 92-1-112520-0
Part One Global Trends and ProspectsI The World Economy: Performance and Prospects
II International Trade and Finance
Part Two Reform of the International Financial ArchitectureIII Towards Reform of the International Financial Architecture:
Which Way Forward?IV Standards and RegulationV Exchange Rate Regimes and the Scope for Regional Cooperation
VI Crisis Management and Burden Sharing

386
These publications may be obtained from bookstores and distributors throughout theworld. Consult your bookstore or write to United Nations Publications/Sales Section,Palais des Nations, CH-1211 Geneva 10, Switzerland (Fax: +41-22-917.0027; E-mail:[email protected]; Internet: www.un.org/publications); or from United NationsPublications, Two UN Plaza, Room DC2-853, Dept. PERS, New York, NY 10017,USA (Tel. +1-212-963.8302 or +1-800-253.9646; Fax +1-212-963.3489; E-mail:[email protected]).
******
Trade and Development Report, 2000United Nations publication, sales no. E.00.II.D.19ISBN 92-1-112489-1
I The Current Global Recovery and Imbalances in a Longer-termPerspective
II The World Economy: Performance and ProspectsIII International MarketsIV Crisis and Recovery in East Asia
Trade and Development Report, 1999United Nations publication, sales no. E.99.II.D.1ISBN 92-1-112438-7
Part One The World Economy: Fragile Recovery with Downside RisksI The World Economy: Performance and Prospects
II International Trade and the Trading SystemIII International Financial Markets: Instability, Trends and Prospects
Part Two Trade, External Financing and Economic Growth in DevelopingCountriesIntroduction
IV Payments Deficits, Liberalization and Growth in DevelopingCountries
V Capital Flows to Developing CountriesVI Rethinking Policies for Development

387
G-24 Discussion Paper SeriesResearch papers for the IntergovernmentalGroup of Twenty-Four on International Monetary Affairs
No. 20 Feb. 2003 D. KAPUR Do As I Say Not As I Do: A Critique ofG-7 Proposals on Reforming the Multi-lateral Development Banks
No. 19 Dec. 2002 R. KANBUR International Financial Institutions andInternational Public Goods: OperationalImplications for the World Bank
No. 18 Sept. 2002 A. SINGH Competition and Competition Policy inEmerging Markets: International andDevelopmental Dimensions
No. 17 April 2002 F. LÓPEZ-DE- The Politics of Legal ReformSILANES
No. 16 Jan. 2002 G. ESQUIVEL and The Impact of G-3 Exchange RateF. LARRAÍN B. Volatility on Developing Countries
No. 15 Dec. 2001 P. EVANS and Organizational Reform and the Expan-M. FINNEMORE sion of the South’s Voice at the Fund
No. 14 Sept. 2001 C. WYPLOSZ How Risky is Financial Liberalizationin the Developing Countries?
No. 13 July 2001 J. A. OCAMPO Recasting the International FinancialAgenda
No. 12 July 2001 Y.C. PARK and Reform of the International FinancialY. WANG System and Institutions in Light of the
Asian Financial Crisis
No. 11 April 2001 A.A. MOHAMMED The Future Role of the InternationalMonetary Fund
No. 10 March 2001 JOMO K.S. Growth After the Asian Crisis: WhatRemains of the East Asian Model?
No. 9 Feb. 2001 G.H. HANSON Should Countries Promote ForeignDirect Investment?
No. 8 Jan. 2001 I. GOLDFAJN and Can Flexible Exchange Rates StillG. OLIVARES “Work” in Financially Open Economies?
No. 7 Dec. 2000 A. CORNFORD Commentary on the Financial StabilityForum’s Report of the Working Groupon Capital Flows

388
No. 6 Aug. 2000 D. KAPUR and Governance-related Conditionalities ofR. WEBB the International Financial Institutions
No. 5 June 2000 A. VELASCO Exchange-rate Policies for DevelopingCountries: What Have We Learned?What Do We Still Not Know?
No. 4 June 2000 K. PISTOR The Standardization of Law and ItsEffect on Developing Economies
No. 3 May 2000 A. CORNFORD The Basle Committee’s Proposals forRevised Capital Standards: Rationale,Design and Possible Incidence
No. 2 May 2000 T.A. OYEJIDE Interests and Options of Developing andLeast-developed Countries in a NewRound of Multilateral Trade Negotia-tions
No. 1 March 2000 A. PANAGARIYA The Millennium Round and Develop-ing Countries: Negotiating Strategiesand Areas of Benefits
G-24 Discussion Paper SeriesResearch papers for the IntergovernmentalGroup of Twenty-Four on International Monetary Affairs
G-24 Discussion Paper Series are available on the website at: www.unctad.org. Copies ofG-24 Discussion Paper Series may be obtained from the Publications Assistant, Macroeconomicand Development Policies Branch, Division on Globalization and Development Strategies, UnitedNations Conference on Trade and Development (UNCTAD), Palais des Nations, CH-1211 Geneva 10, Switzerland (Fax: +41-22-907.0274; E-mail: [email protected]).
******