Management accounting system problems in context of Lean
25
This article was downloaded by: 10.3.98.104 On: 07 Jan 2022 Access details: subscription number Publisher: Routledge Informa Ltd Registered in England and Wales Registered Number: 1072954 Registered office: 5 Howick Place, London SW1P 1WG, UK The Routledge Companion to Cost Management Falconer Mitchell, Hanne Nørreklit, Morten Jakobsen Management accounting system problems in context of Lean Publication details https://www.routledgehandbooks.com/doi/10.4324/9780203101261.ch3 Thomas Borup Kristensen, Poul Israelsen Published online on: 05 Oct 2012 How to cite :- Thomas Borup Kristensen, Poul Israelsen. 05 Oct 2012, Management accounting system problems in context of Lean from: The Routledge Companion to Cost Management Routledge Accessed on: 07 Jan 2022 https://www.routledgehandbooks.com/doi/10.4324/9780203101261.ch3 PLEASE SCROLL DOWN FOR DOCUMENT Full terms and conditions of use: https://www.routledgehandbooks.com/legal-notices/terms This Document PDF may be used for research, teaching and private study purposes. Any substantial or systematic reproductions, re-distribution, re-selling, loan or sub-licensing, systematic supply or distribution in any form to anyone is expressly forbidden. The publisher does not give any warranty express or implied or make any representation that the contents will be complete or accurate or up to date. The publisher shall not be liable for an loss, actions, claims, proceedings, demand or costs or damages whatsoever or howsoever caused arising directly or indirectly in connection with or arising out of the use of this material.
Transcript of Management accounting system problems in context of Lean

This article was downloaded by: 10.3.98.104On: 07 Jan 2022Access details: subscription numberPublisher: RoutledgeInforma Ltd Registered in England and Wales Registered Number: 1072954 Registered office: 5 Howick Place, London SW1P 1WG, UK
The Routledge Companion to Cost Management
Falconer Mitchell, Hanne Nørreklit, Morten Jakobsen
Management accounting system problems in context of Lean
Publication detailshttps://www.routledgehandbooks.com/doi/10.4324/9780203101261.ch3
Thomas Borup Kristensen, Poul IsraelsenPublished online on: 05 Oct 2012
How to cite :- Thomas Borup Kristensen, Poul Israelsen. 05 Oct 2012, Management accountingsystem problems in context of Lean from: The Routledge Companion to Cost Management RoutledgeAccessed on: 07 Jan 2022https://www.routledgehandbooks.com/doi/10.4324/9780203101261.ch3
PLEASE SCROLL DOWN FOR DOCUMENT
Full terms and conditions of use: https://www.routledgehandbooks.com/legal-notices/terms
This Document PDF may be used for research, teaching and private study purposes. Any substantial or systematic reproductions,re-distribution, re-selling, loan or sub-licensing, systematic supply or distribution in any form to anyone is expressly forbidden.
The publisher does not give any warranty express or implied or make any representation that the contents will be complete oraccurate or up to date. The publisher shall not be liable for an loss, actions, claims, proceedings, demand or costs or damageswhatsoever or howsoever caused arising directly or indirectly in connection with or arising out of the use of this material.

Dow
nloa
ded
By:
10.
3.98
.104
At:
14:1
2 07
Jan
202
2; F
or: 9
7802
0310
1261
, cha
pter
3, 1
0.43
24/9
7802
0310
1261
.ch3
32
3
Management accounting system problems in context of LeanDevelopment of a proposed solution
Thomas Borup Kristensen and Poul Israelsen
Introduction
Lean manufacturing philosophy, based on Toyota’s production system, has been around for years (Schonberger, 1986, 1990, 1996; Womack et al., 1991) and forwarded as an ideal – world-class manufacturing – system to enable companies to compete on quality, product variety, and timeliness in a cost-effective and profi table manner. As a manufacturing philosophy it combines Just In Time (JIT), total quality management (TQM), and total preventive maintenance (TPM). In this paper we are interested in how implementation of Lean interacts with the company’s management accounting system.
In the words of Åhlström and Karlsson (1996) there are seven main principles of Lean manu-facturing: (i) elimination of waste (i.e. all non-value-adding activities, e.g. inventory, transporta-tion, unnecessary movements), (ii) striving for zero defects as a prerequisite for JIT, (iii) pulling instead of push manufacturing (i.e. production to order as opposed to forecast), (iv) creation of multifunctional teams around product-dedicated production cells (as opposed to single-skilled employees in a functional machine layout), (v) decentralization of responsibility to these multi-skilled teams (i.e. delegation of procurement, materials handling, planning and control, main-tenance, and quality control), (vi) creation of vertical and horizontal information systems that provide timely information continuously and directly in the production fl ow, and fi nally (vii) creation of a continuous improvement culture where improvement towards perfection is the goal.
In these Lean principles there is no or very little mention of the implications for the company’s cost and management accounting system. However, if we look into the authorship of Schonberger, cost accounting can actually be abandoned: “non-monetary process data are the lifeblood of improvement projects – [they] tell what needs to be done and, to a very large extent, prioritize those needs. Cost data are not part of that improvement methodology” (1996: 104), and further: “Don’t try to pin down all cost. . . . Instead, drive costs down and quality, response time, and fl exibility up by plotting quality, cycle time, set-up time etc. on large visible screens on the wall. This is the cost effective way there is for upper managers and line employees alike to size up results . . .” (1996: 113). In the eyes of Schonberger, cost accounting is a problem rather than a solution to Lean implementation (Mouritsen and Hansen, 2006: 271). In this reasoning non-

Dow
nloa
ded
By:
10.
3.98
.104
At:
14:1
2 07
Jan
202
2; F
or: 9
7802
0310
1261
, cha
pter
3, 1
0.43
24/9
7802
0310
1261
.ch3
33
Management accounting system problems in context of Lean
fi nancial process, data form input for decision-making on improvements and cost reductions will automatically follow. This is puzzling: is it always the case that improvement decisions based on non-fi nancial performance measures will lead to cost effi cient cost reductions? Will it lead to the same type of improvement initiatives as if the decisions had been informed by cost calculations? If fi nancial as well as non-fi nancial measures are in use at the cell level what happens if they are in confl ict, and how can this confl ict be resolved?
Extant case-based research papers on the interaction between Lean implementation and management accounting change are limited. Among these are three in-depth single case studies by Åhlström and Karlsson (1996), Lind (2001), and Kennedy and Widener (2008). These studies report on changes made during Lean implementation encompassing, for example, organizational structure (e.g. functional vs. product groups), control forms (e.g. output, behavioral vs. social controls), and elements of the costing system (e.g. standard vs. actual cost). In none of the companies have the cost accounting system been abandoned, but changes have been made. All three studies directly or indirectly confi rm that responsibility accounting must shift from the performance of the individual and individual machines to the cell level/team to align the decision authority and aggregation level of information. All companies also have a mix of fi nancial and non-fi nancial performance measures, and Lind (2001: 61) concludes that “Non-fi nancial measures became dominant for day-to-day control; for long-term control both fi nancial and non-fi nancial measures were used”. This is part of our intellectual puzzle: does short-term control using non-fi nancial performance measures automatically align with long-term fi nancial measures? Additionally, in one of the studies (Kennedy and Widener, 2008) standard cost was given up in favor of using only actual cost whereas in the two other studies standard cost was kept but changed to accommodate the cellular structure. This widens our puzzle: why is standard costing a potential problem in Lean settings?
The above leads to our research questions: what are the problems that companies encounter when Lean implementation meets the company’s cost and management accounting system? And based on this, which changes can be made to have the goals of Lean and the fi nancial measures of the management accounting system better cohere?
In addition, we fi nd our endeavor justifi ed by Lindsay and Kalagnanam (1993) forwarding the concern that if management accounting is not able to measure the consequences of Just In Time and Lean, there is a danger that it will become a potential blocker of Lean.
The remainder of the paper is organized as follows. In the following section we introduce the research design – case method – and the three case companies investigated in this paper. The following section summarizes across cases the interaction problems identifi ed between Lean and the companies’ management accounting systems. Then, the main section, develops and describes a new cost measurement system which is coherent with Lean – Lean fi nancial accounting. This new model is contrasted to value stream mapping (usually used in Lean) and traditional cost models in relation to the decision support they provide. The fi nal section sums up the paper, identifi es limitations of the model developed and points to avenues of further research.
Method
The case study method is chosen to allow us to thoroughly understand which interaction problems between Lean control and management accounting control companies face. Yin (2003) defi nes case study as an investigation of a contemporary phenomenon within its real-life context with the benefi ts of prior theoretical development to guide data collection and analysis. In this paper the “contemporary phenomenon” is the interaction between Lean and a company’s management accounting system. These particular case studies have the advantage

Dow
nloa
ded
By:
10.
3.98
.104
At:
14:1
2 07
Jan
202
2; F
or: 9
7802
0310
1261
, cha
pter
3, 1
0.43
24/9
7802
0310
1261
.ch3
Kristensen and Israelsen
34
of being longitudinal and the researchers spent three years collaborating with the companies. It has taken many hours of dialog (approximately 200 hours) with different company actors to understand how their Lean control package and management accounting system clashes, and why they believed they needed to be integrated and adapted to fi t their specifi c context. Using a longitudinal approach we have witnessed the development of the actors’ understanding of the Lean and management accounting system interaction as implementation of Lean is an ongoing process. We entered all companies at the point where they began to discuss the research topic, and it soon became obvious that they all had somewhat similar discussions on how to measure the Lean implementation, and how to guide the implementation in a fi nancially informed way.
Common to the selected companies is that they are concerned with their ability to measure the profi tability of their Lean efforts. While still convinced of having substantial Lean benefi t they have recognized what they believed to be shortcomings within their existing management accounting and control systems. In understanding and dealing with this we are inspired by seeing this as a fi rst step in researching “a real problem” (Nørreklit et al., 2006), i.e. it is neither just a practical nor solely a theoretical problem (Henriksen et al., 2004). If this was the case, and it merely comprised a practical problem, the actors would already have found suitable tools for solving it, and yet it is not only a theoretical problem as the actors see it.
In order to work in a manner consistent with fi nding real problems in the interaction between the cost models used and Lean, we employ Merchant’s (2006) six general criteria for a complete measurement system. In addition, we use the theory of coherent systems (Nørreklit, 2000) in understanding these problems.
Speaking of cost models, i.e. how they are constructed and used in the Lean organization, we use this term interchangeably with management accounting system (MAS). According to Chenhall (2003) MAS refers to a collection of practices – such as costing – used to achieve goals. In this paper the goals are those of Lean. This focus on MAS leaves out discussions of other controls, such as clan or personal control, referred to as organizational control (Chenhall, 2003).
Merchant (2006) presents six criteria against which a management accounting system may be evaluated. These criteria are used to understand how well a particular MAS is developed to comply with them. There may be trade-offs among the criteria in question, and if so, they can be used to understand the weight put on each. In the paper, we use the six criteria to describe why particular MAS causes problems when interacting with Lean.
The use of coherence theory serves the same purpose, i.e. understanding the problems caused by management accounting systems in the Lean organization, and indicating how to develop solutions.
The six criteria that Merchant (2006) believes to be generic are whether: (i) the MAS is congruent with the organizational objectives, (ii) it is controllable by the manager whose behavior is being infl uenced; and whether or not the information is (iii) timely, (iv) accurate, (v) understandable, and (vi) cost-effective.
Merchant (2006) argues that goal congruence is the most important of these criteria, since “good” actions should cause an increase in the measured performance, while the reverse ought to be the case for “bad” actions. If this criterion is not fulfi lled, then all the other criteria seem irrelevant (Otley, 1999). It is important to note that it is not only necessary for the measure-ment to be congruent with one of the organizational objectives, ideally speaking; it should be congruent with all of them.
The second criterion describes the importance of controllability by the manager. If a manager or team is not able to control the level of a measure it cannot provide information on the desirability of actions. The third criterion, timeliness, is about closing the time-lag between actions and measurement feedback. Accuracy is the fourth criterion and consists of two

Dow
nloa
ded
By:
10.
3.98
.104
At:
14:1
2 07
Jan
202
2; F
or: 9
7802
0310
1261
, cha
pter
3, 1
0.43
24/9
7802
0310
1261
.ch3
35
dimensions: precision and objectivity. A measure is precise if it is free of noise. Noise is random variation in the level of the measure that cannot be attributed to a systematic change in actions. Objectivity refers to the freedom from bias, such as the ability to manipulate the measure. The ability to withstand manipulation would strengthen the accuracy of the measure in question. The measure should also be readily understandable, which is the fi fth criterion. It should be clear what the measure conveys and how it is calculated. Furthermore, it should be clear how the actors infl uence the measure, i.e. how they can improve it. The last criterion involves the cost-effectiveness of the measure. Preferably, the cost of producing the measures should be as low as possible, and the benefi ts should exceed the costs of obtaining them.
As mentioned in the introduction we would expect the Lean organization in manufacturing to use a mix of fi nancial and non-fi nancial performance measures. It is this paper’s intention to fi nd out if these measures induce decision-making and improve behavior in the same direction – if they work together, if they cohere. For example, lead time is often an important measure in Lean (Kennedy and Brewer, 2005), but improved lead time does not always cause improved labor consumption variance in a standard cost model. On the one hand, while increasing the number of manpower hours on the production line will often cause improved lead time, it can also cause increased unfavorable time consumption variance, mainly due to increased available capacity not being used. On the other hand, a higher unfavorable time variance does not necessarily cause an improved lead time, as the faster processing time might just result in a longer stock time. Therefore, lead time and time consumption clearly have to be considered simultaneously in a balanced manner if the overall profi t goal is to be improved. When the actors understand the nature of the mutual logical dependencies, and act to balance these in order to increase the overall goals, these relations become coherent (Nørreklit, 2000).
Research site selection
Space does not allow a thorough account of the case companies and our case-individual fi ndings.1 We introduce each of the three companies with a few lines below, and provide in section 3 a summary of fi ndings across companies.
Case company A
Company A is the smallest of the three case companies, with around 2,000 employees. The headquarters
is located in Scandinavia while its production facilities are located in Scandinavia, Eastern Europe,
and the US. Company A produces a range of small electronic equipment for business customers. It
is a family-owned company that has expanded immensely since the present owner introduced new
products in the 1970s.
Since 2003, when several Lean tools such as JIT, Kanban, 5S, Lean offi ce, Kaizen etc. were implemented,
the company has been dedicated to Lean. The company also changed its organizational structure at
this point in time. The new structure involved a product line for each product group resembling value
streams even though all product groups still have some functions, inventory and packaging in common.
Case company B
With around 20,000 employees worldwide, case company B has its headquarters in the same country
as the other two case companies. Company B is, unlike Company A, listed on the stock exchange.
Management accounting system problems in context of Lean

Dow
nloa
ded
By:
10.
3.98
.104
At:
14:1
2 07
Jan
202
2; F
or: 9
7802
0310
1261
, cha
pter
3, 1
0.43
24/9
7802
0310
1261
.ch3
Kristensen and Israelsen
36
While the company had a lot of fi nancial diffi culties a few years ago, today it is a profi table, heavy-duty
industrial company with production facilities and sales offi ces in most regions of the world. In this case
study we only focus on one of its production divisions employing around 2,500.
The company has been much engaged in Lean since 2005. In 2008 it won a prize for productivity
improvement made through transition from birdcage production to fl owline production. The company
is working with most of the tools in the Lean tool-box (Bicheno, 2004), and Lean is perceived to be
a necessary strategy if the company is to create sustainable growth. Although the company’s value
chain begins by casting some of the components themselves, it still buys approximately 90% of all
components from outside, which end up in assembly and on-site delivery. Even though most of the
value chain is controlled by Company B, it still has thousands of suppliers. With the implementation of
a Lean strategy, Company B has accomplished many of its goals, such as major lead time reduction and
increases in stock turns.
Case company C
Case Company C is in the fashion industry, employing around 10,000 workers worldwide, and has
its headquarters in Scandinavia too. The company has a long value chain within its own legal control.
Originally it also bred the very raw materials, animals, used in the leather tanneries under its control.
Today, its control of the value chain begins in the tanneries and ends in its private consumer shops
around the world. The business has been successful for many years and is well known for the quality
of its products. In this case company our focus is on the factories at the end of the value chain, which
have responsibility for the fi nal four major process steps to fi nish the fi nal product. Company C has to
introduce new product collections twice a year in keeping with the trend amongst its competitors and
the expectations of its customers. While some of the products may be in the product portfolio for several
years, most are changed completely each season.
Having worked with Lean initiatives for several years, Company C is very aware of adopting a
bottom-up approach to Lean implementation by educating many of its local employees to become
Lean experts. Company C has tried to create a strong focus on the payback of Lean and has even hired
a Lean controller to assess the general profi tability of Lean. As within Companies A and B, Company
C has had many internal discussions about the economic impact of Lean. Company C could see some
improvements in lead time as various WIP stocks were reduced, but struggled to trace the lead time
effects to improved cost effi ciency. In this case, Lean implementation included a broad range of the Lean
tools, primarily value stream mapping, Kanban, 5S, visual boards, Kaizen events and single piece-fl ow.
Identifi ed interaction problems between Lean and MAS
The analysis of the three case companies can be summarized in a number of points. The ten points below cover the problems with the current cost models in the three case companies vis-à-vis Merchant’s six principles and the theory of coherence. Points 9 and 10 identify the main behavioral effects.
1. The companies have diffi culty in measuring the profi t improvement achieved through Lean.
2. Companies have diffi culty in measuring Lean progress in fi nancial terms through multiple periods during which standard costs are inevitably changed.

Dow
nloa
ded
By:
10.
3.98
.104
At:
14:1
2 07
Jan
202
2; F
or: 9
7802
0310
1261
, cha
pter
3, 1
0.43
24/9
7802
0310
1261
.ch3
37
3. Cost of quality in their currently implemented cost model does not contain all waste categories of Lean, and traditional notions of waste are not always equivalent to the concepts of waste forwarded by Lean thinking.
4. Cost of capital does not include imputed cost which hampers costing of lead time, e.g. stocks.
5. Some capacity costs are misleadingly allocated to the unit level, e.g. cost of water spiders, which impedes insights as to what drives costs. (Water spiders are personnel mostly working in the productions cells as helpers, planners and transporters.)
6. The rich data on deviations from takt time shown on the takt time boards (also called Andon boards) at the shop fl oor is not picked up and used in the management accounting system. (Takt time is the time between fi nished products leaving the production cell.)
7. Detailed process information, especially on waste, collected in the value stream maps, VSMs, is not used in the management accounting system. (VSM includes important information regarding process time, lead time, takt time, stock sizes, shared resources, shifts, and the process- and planning-fl ow (Rother and Shook, 1999).)
8. Normal learning curve effects are mixed with Lean improvements. 9. Line operators have no access to information stated in the traditional variance reports and,
consequently, have no sense of ownership of the data registered to produce these reports, hampering data quality.
10. Traditional standard cost models support a management-by-exception way of thinking as opposed to Lean’s continuous improvement; standard cost models focus on unexpected cost of waste whereas Lean looks for expected as well as unexpected cost of waste.
The case companies’ currently used cost models are variations of textbook cost models, i.e. standard cost models and variance reporting. Thus, the fi ndings offer some general cost model problems in which traditional cost models fail to fully complement the Lean journey. These shortcomings can be overcome using a new Lean fi nancial model, outlined below.
Improved costing to support and assess Lean
The solution developed and presented is based on problems with the measurement systems found in the three companies. The solution presented uses a modifi ed example from one of the case companies. The solution has been discussed in plenary sessions with representatives from all three companies, who found it useful as a source of inspiration, and contributed to making the proposed solution even more solid.
The example begins in Figure 3.1 with a fl ow layout providing the overview of how the products are physically moved and how machines and labor are located. In Table 3.1 an activity path is presented, describing in numbers what happens in the production fl ow. A visual board on a numerical example week (Table 3.2) presents all the problems the workers experienced during the week. The information on the visual board and in the activity path (together with input data in appendix 1) is the foundation of three different types of reporting: (i) a traditional cost- of-waste fi nancial report, (ii) a regular Lean report showing lead time, and (iii) our developed Lean fi nancial model showing more cost-of-waste categories than the traditional fi nancial model. The latter guides the decision-makers towards relevant Lean waste types, and the enhanced insights obtained by the Lean fi nancial model eliminate the problems identifi ed with the two other models.
Figure 3.1’s drawing of the production layout shows that the site consists of three buildings: stock 1, stock 2, and factory 1. Stocks, as well as the factory fl oor, are split between value streams
Management accounting system problems in context of Lean

Dow
nloa
ded
By:
10.
3.98
.104
At:
14:1
2 07
Jan
202
2; F
or: 9
7802
0310
1261
, cha
pter
3, 1
0.43
24/9
7802
0310
1261
.ch3
Kristensen and Israelsen
38
1 and 2. The value streams are dedicated to products and thus a value stream refers to the processes and assets dedicated to producing products within a product group. Maskell (2004) describes this as the Lean way to organize, where resources are dedicated to individual value streams. In turn, these value streams are defi ned by products that have similar fl ow patterns. “Monuments”, for example a machine, refers to shared resources across two or more value streams and are to be avoided in Lean as they will cause a “batch and queue” production (mass production [Womack et al., 1991]) instead of single-piece fl ow production. In order to keep the example short we focus on value stream 1 only.
The activity path, Table 3.1, shows the process steps to make the fi nal products out of the raw materials. It shows the standard labor and materials consumption required to make each unit or batch. Labor is divided between that of operators and water spiders (grey in the layout diagram). As previously mentioned, water spiders mostly work in the cells as helpers, planners and transporters. The data on the activity path is part of the company’s detailed value stream map, VSM, jointly created by operators and Lean change agents. They also jointly carry out the necessary updates as the VSM is improved.
In the traditional reporting presently employed within the companies, consisting of regular standard cost system output (Horngren et al., 1997; Horngren et al., 2010), the degree of infor-mation regarding the detailed processes within the individual cells is very modest. In fact, the company’s traditional reporting only uses the total standard time registered for each cell. The reason is that the costing system is not integrated with the information contained in the detailed value stream map. According to the current system, the cell is considered the unit of responsibility and measured in terms of variances from the standard.
It is worth noting that cell operator 1 is the pacemaker (bottleneck) of value stream 1, as operator 1 is responsible for the process step with the longest time consumption, and that in traditional reporting the work carried out within the cells is termed “direct hours” and all other labor activities are considered indirect in nature.
Figure 3.1 The fl ow layout and activity path in the example

Dow
nloa
ded
By:
10.
3.98
.104
At:
14:1
2 07
Jan
202
2; F
or: 9
7802
0310
1261
, cha
pter
3, 1
0.43
24/9
7802
0310
1261
.ch3
39
Table 3.1 The activity path for value stream 1
Resource Activity path for value stream 1 Standard
Per unit – if not otherwise statedStock 1 Stock 1 storage 5 daysWater spider Transport of materials per batch 180 secFactory 1 Storage (average time) 1 hourWater spider Scheduling and planning per batch 2,500 secWater spider Expected extra scheduling – rescheduling (rework) once every
5 batches2,000 sec
Materials Bill of Materials per unit 1 pcCell 1 activities (per unit) – bottleneck (special tools)
Operator 1 1. Shaping components 310 secOperator 2 2. Getting special power tools (movement) 10 secOperator 2 3. Surface treatment 250 secOperator 2 4. Transport materials to WIP 10 secOperator 2 5. Time expected for screwdriver problems (incorrect
process)10 sec
Operator 2 Cell 1 imbalance (1) (2+3+4+5) 30 secCell 1 total standard time 620 sec
Factory 1 WIP storage 2 hoursWater spider Moving WIP into cell 2 15 sec
Cell 2 activitiesOperator 1 1. Drilling holes 280 secOperator 1 2. Moving between two power tools 7 secOperator 2 3. Montage 200 secOperator 2 4. Moving around the product unit to get in right position 15 secOperator 3 5. Welding 300 secWater spider 6. Inspection 25 secWater spider 7. Transport materials to WIP 20 secOperator 2 8. Time expected for power tool problems (incorrect process.) 20 secOperator 1+2 Cell 2 imbalance (5) (1+2)+(5)-(3+4+8) 78 sec
Cell 2 total standard time 945 secOperator 1+2+3 Cell 1 and 2 imbalance (bottleneck process time 310 sec) 30 secFactory 1 WIP storage (average time) 1 hour
Machine 1 (23 painting slots in machine per batch)Water spider Moving WIP into machine 1 – per Batch 300 secOperator Loading machine with paint per batch 200 secOperator Set-up of machine per batch 200 secMachine 1 Machine 1– painting the batch 4,500 secOperator Managing and steering the machine per batch 4,500 secOperator/machine 1 Machine breakdown time expected per batch (waiting time) 200 secWater spider Inspection of fi nished goods per batch 100 sec
Machine 1 total standard time per batch 5,500 secMachine 1 (Imbalance with cells) available time on machine 1 per
batch2,030 sec
Materials Paint used per batch in machine 1 10,000 mlMaterials Paint wasted inside machine – not usable 2% per batch 20 mlOperator Adjusting – reworking some of the units per unit 13 secWater spider Transport of fi nished goods to stock 2 per batch 300 secStock 2 Storage (average time) 10 daysMaterials Scrap of fi nished goods by inspection per batch 1 pc
(Continued)
Management accounting system problems in context of Lean

Dow
nloa
ded
By:
10.
3.98
.104
At:
14:1
2 07
Jan
202
2; F
or: 9
7802
0310
1261
, cha
pter
3, 1
0.43
24/9
7802
0310
1261
.ch3
Kristensen and Israelsen
40
Resource Activity path for value stream 1 Standard
Traditional reportingDirect hours Total operator/water spider direct (hours) standard
time per unit – sec1,795
Lean reportingUnit hours Total operator/water spider standard time per unit
without waste – sec1,340
Batch hours Total operator/water spider standard time per batch without waste – sec
7,200
Table 3.1 (continued)
Visual board data of the example week
In the example, the company has now implemented visual boards on the shop fl oor. The visual boards are used by operators and foremen to follow on an hourly basis whether they are ahead of or behind their planned production targets, based on the takt time. They also use the boards in discussing how to handle deviations from plans. Hence, the visual board is a working tool in co-ordinating and fi xing problems. In the process they also collect information on the nature (cause) of deviations. During discussions they write down their immediate analyses of causes of deviations. All these data are collected by the water spider and entered into the costing function of the company’s ERP system to be used in relation to cost reporting weekly. This data collection is part of our solution. Hence, information is not lost when the visual boards are erased at the end of the week, and there is no need to have other types of registration in order to gather shop-fl oor data on deviations. In addition, the information gained from the visual boards is more precise, as operators and foremen themselves use this information to improve their work, which is therefore less prone to manipulation. Integration of the visual board and cost reporting also creates a more coherent reporting system as deviations refl ected on the visual board are aligned with the cost reporting refl ecting reality in a similar manner. As operators and foremen believe the data to be precise, cost reporting can also be used to improve decision-making at shop-fl oor level from a profi tability (mainly cost-saving) perspective.2
Visual board data are very simple and cost-effi cient to use in the company’s cost accounting system – particularly since it is only necessary to register deviations, which is readily done as visual boards are a compulsory activity/tool in a Lean environment.
Table 3.2 The visual board
Visual board of this week’s actual consumptionValue stream 1Actual fi nished units (including scrap) 322Actual fi nished batches 14Scrap per batch 2Total operator hours actual (6 operators, 8 hours a day, 5 days) 240Total water spider hours actual (2 water spiders, 8 hours a day, 5 days) 80Actual paint consumed less standard ml 100Reported visual board deviations Problems with tools in cell 1 (incorrect processing) – working slower – 1 batch missed 2 hours Cell 2 had trouble keeping up the pace and was 400 sec slower on one batch (no lost batch as this is not a bottleneck)
400 sec

Dow
nloa
ded
By:
10.
3.98
.104
At:
14:1
2 07
Jan
202
2; F
or: 9
7802
0310
1261
, cha
pter
3, 1
0.43
24/9
7802
0310
1261
.ch3
41
In the example, the visual board shows that 322 units are completed in 14 batches. Scrapped are two pieces per batch compared to a standard scrap value of one per batch according to the activity path. Total hours for operators and water spiders are equivalent to the number of hours for which they are paid. Another registration in Table 3.2 shows that they had used 100 ml more paint than specifi ed in the activity path. Furthermore, the foreman recorded a major problem with the tools in cell 1 (the pacemaker process) which caused them to work slower, hence missing a batch of 15 pieces of the product. Cell 2 reported some small problems with keeping up the pace of 400 seconds.
Traditional profi t reporting
Table 3.3 shows what traditional reporting involves. This report is common to the three case companies and is an almost complete copy of the one used in Company C. Additionally, it is similar to that reported in a traditional standard cost regime (Atkinson et al., 2007; Cheatam and Cheatam, 1996).
Column 3 is the budget, column 1 the actual costs, and column 2 the fl exible budget. The difference between columns 2 and 3 is caused by a lower number of units produced, as column 2 is calculated on the basis of the actual production volume multiplied by the standard costs per unit. The difference between columns 1 and 2 is the difference between actual and standard consumption for the actual volume. Appendix 1 contains the input data used to make the calculations.
The actual numbers come from the visual board. This is not the case in Company B, for example, where a scanning system of completed products provides the feed-in data for the calculations. However, we use the visual board data in the following to keep the comparison between the traditional and our new reporting simple.
Table 3.3 The traditional reporting format
Value stream 1
1 2 3
Actual production volume x actual price (consumption)
Actual production volume x standard price (consumption)
Scheduled volume x standard price
Revenue (equal production) 29,400 29,400 33,000Direct labor (operator – water
spider in cells)3,718 3,666 4,115
Materials (bom + paint) 2,515 2,515 2,755Contribution margin 1 23,166 23,219 26,131Indirect variable costs (operators –
water spiders)3,932 4,160 3,599
Contribution margin 2 19,234 19,059 22,532Materials loss (paint) 29 28 30Scrap (materials) 234 117 125Scrap (labor) 349 175 287Contribution margin 3 18,622 18,740 22,090Capacity costs 1,000 1,000 1,000Depreciations 1,000 1,000 1,000Profi t before interest 16,622 16,740 20,090
Management accounting system problems in context of Lean

Dow
nloa
ded
By:
10.
3.98
.104
At:
14:1
2 07
Jan
202
2; F
or: 9
7802
0310
1261
, cha
pter
3, 1
0.43
24/9
7802
0310
1261
.ch3
Kristensen and Israelsen
42
In the traditional regime, costs of scrap materials (materials used in the units not usable for sales), materials loss (paint not applied to the product units and “lost” in the machine or too much applied) and labor scrap (that used in completing scrapped units) constitute cost of waste. Notice, increase in indirect variable labor would be perceived as waste. This approach would lead to the cost of waste expressed in Table 3.4, where we differentiate between expected and unexpected. The standards multiplied by actual production volume (column 2’s fl exible budget) are an expression of expected costs. Consequently, unexpected costs are additional costs. Unexpected costs are unfavorable variances. Information regarding the cost of waste guides future Lean initiatives towards certain waste types and focus areas.
Viewing the cost of waste in the manner of Table 3.4 constitutes the predominant structure of the three case companies. It mainly perceives waste as something caused by failures or some-thing going “wrong”. Expected paint loss (materials loss) is the only exception to this, as this is a direct result of following process specifi cations and cannot be avoided no matter how much caution is pursued during execution or how much quality focus is exhibited in the process.
This report would guide Lean activities towards the increase in indirect costs and the fact that one batch was missed leading to a lower productivity level than standard. The latter would be interpreted as unexpected time consumption caused by the batch that was “lost” due to tool problems in cell 1. It would also provide focus for improving the unexpected waste of direct labor which has consumed more time than that specifi ed in the standard. It would point to scrap being the main cost of waste from the traditional perspective.
In case company B the direct/indirect cost ratio was used as an expression of value-added vs. waste. In the current example, this ratio is 48.6% (3,718/(3,718+3,932)), as direct labor constitutes almost half the total number of hours. The example clearly shows that this does not refl ect the available capacity, as presented in the section on Lean fi nancial reporting below. In addition, it assumes that direct labor is entirely value-added, i.e. not waste, which is an incorrect assumption in terms of waste defi ned in Lean.
Value stream reporting from a strict Lean perspective
A strict Lean perspective would focus on non-fi nancial measures. According to one of the founding fathers of the Activity Based Costing model, Johnson (1992), this model or any other fi nancial model (Schonberger, 1990, 1996) is irrelevant, as this type of accounting information is too late, too aggregated and too distorted to be relevant for a manager’s planning and control activity. This
Table 3.4 Cost of waste – traditional perspective
Cost of waste from a traditional perspective
1 – 2 Direct labor (unexpected) fi xing prod stop 532 Materials loss (expected) 281 – 2 Materials loss (unexpected) 12 Materials scrap (expected) 1171 – 2 Materials scrap (unexpected) 1172 Labor scrap (expected) 1751 – 2 Labor scrap (unexpected) 1751 – 3 Increase indirect labor (unexpected) 1 batch “lost” 334
Total expected cost of waste 319Total unexpected cost of waste 679Total cost of waste 998

Dow
nloa
ded
By:
10.
3.98
.104
At:
14:1
2 07
Jan
202
2; F
or: 9
7802
0310
1261
, cha
pter
3, 1
0.43
24/9
7802
0310
1261
.ch3
43
approach is equivalent to that presented in the Toyota house, where Lean tools are the foundation and pillars of improved profi tability (Liker, 2004, 2006; see Appendix 2 for a picture of the house). And none of the Lean tools are management accounting tools. A main analytical tool in Lean is the value stream map (Rother and Shook, 1999), which focuses on lead time. However, lead time does not cost the same from one process to another; for example, a product sitting for one minute in inventory is much less costly than a minute in machining (Friis et al., 2007).
Using the lead time indicators in Table 3.5, Lean activities would focus on stocks, seeing that this entails by far the largest lead time. However, as a chief controller in Company B said: “These Lean activities always seem to be addressing lead time and this is easiest to cut either in terms of work-in-progress or fi nished goods but the cost impact is either low or diffi cult to trace.”
Based on traditional cost reporting we concluded that Lean activities should focus on scrap. This is different to value stream mapping that would focus on reducing lead time in relation to both the materials and fi nished goods stock – or WIP. The economic benefi ts of reducing stock are diffi cult to track on the basis of traditional cost reporting. Evidently these two reporting tools are not working coherently; they have different perspectives on what are the best Lean initiatives to take, and hence create confusion within the organization.
Lean fi nancial reporting – cost of waste from a Lean perspective
In the last 15 years new approaches to accounting for Lean have evolved based on critiques of the standard cost model (Kennedy and Widener, 2008; Kaplan and Cooper, 1998; Cunningham, 2003; Huntzinger, 2007; Fry et al., 1995). Maskell and Baggaley (2004), especially, create a costing model based on actual costs instead of standard costs in their approach to Lean accounting, and focus on the value stream as cost object. This approach is found to suit Lean in Kennedy and Widener’s recent study (2008).
Contrary to Johnson (e.g. 1992) and Schonberger (1990, 1996), the approach by Maskell and Baggaley (2004) recognizes the fact that a cost model cannot be excluded from the Lean organization, but rather that the right fi t would be an actual cost model.
There are two main types of critique against the standard cost model’s fi t with Lean. First, it motivates non-Lean goal-congruent behavior (Maskell and Baggaley, 2004). However, this critique is implicitly based on the assumption that the cost model is used in a coercive manner according to Kristensen and Israelsen (2010). They show that this assumption is not valid in all circumstances as the standard cost model can be used in an enabling manner, leading to Lean goal-congruent behavior.
The second critique of standard costing is that the technique is misleading in itself due to a confusing allocation of non-unit cost to the unit level. This critique assumes that standard costing is used in the full cost version and creates the over/under costing phenomenon we are familiar with from, e.g., ABC’s critique of traditional full costing (Kaplan and Cooper, 1998). Yet, in the three case companies standard costing is not used in a full cost version for management accounting purposes.
Table 3.5 Lean KPI reporting
LEAN KPI reporting
Lead time stock (materials and fi nished goods stock) 15 daysLead time WIP storage 4 hoursLead time process 2.1 hours
Management accounting system problems in context of Lean

Dow
nloa
ded
By:
10.
3.98
.104
At:
14:1
2 07
Jan
202
2; F
or: 9
7802
0310
1261
, cha
pter
3, 1
0.43
24/9
7802
0310
1261
.ch3
Kristensen and Israelsen
44
In a third critique, standard costing is criticized for hiding waste within standards (Maskell and Baggaley, 2004). It is true that standards are often set without a distinction between the waste types known in Lean. This is similar to our observations in the three case companies. This is not a critique, we will argue, that cannot be solved within a model that works with standards. In our solution we present a model, Table 3.6, based on the principles of using standards which entail separate categories for each waste type in Lean.
In Table 6 we have incorporated the seven waste types presented by Liker (2006): rework/scrap, movement, transport, waiting time, incorrect processing, overproduction and inventory. In addition, we have added imbalance time – which is a form of waiting time – and inspection, which is sometimes also considered waste in Lean (Bicheno, 2004). We have also included set-up as a waste category even though we generally accept that without set-ups there can only be single-product production (Kaplan and Cooper, 1998). However, reduction of set-up time is essential in making Just In Time work, and in Lean certain tools have been developed to reduce set-up time, especially single-minute-exchange-of-die, SMED (Bicheno, 2004).
As depicted in the last two columns of Table 3.6 standards are clearly needed if we are to successfully complete budgets in which cost of waste is stated. Standards are formed within the value stream analysis which we labelled the “activity path” of a VSM. In order to understand how the cost of waste changes just because we change the product mix and volume in response to a given budget change, it is necessary to have standards. And, without standards it is not possible to assess how much capacity is available compared to process consumption and waste. Since the system of scanning actual time consumption has been abandoned we can only use standards and visual board information on exceptions in assessing available capacity.3
Cost of capital is introduced to address the problem of not having income statement conse-quences of stocks. This cost of capital does not refl ect costs that can be traced back to company expenses – as do other costs; on the contrary, it is the rate of return required by investors and loan providers: weighted average cost of capital, WACC. The approach is similar to that of the residual income model. In our example the cost of capital is 15%. In calculating the cost of capital per value stream it is possible to address the fi nancial value of reducing stock and thereby represent the fi nancial value of lead time in stocks. Additionally, it is possible to evaluate the fi nancial impact of lead time changes and to assess whether or not a reduction would result in suffi cient gains in fi nancial value compared to those achieved through adjustment of other waste types.
The Lean fi nancial model also differentiates between unit-level cost drivers and batch-level cost drivers of waste, viz. Table 3.6. This is done in order to avoid the weaknesses in the tradi-tional full cost model critiqued, for example, in the ABC (Kaplan and Cooper, 1998) and vari-ability accounting literature (Israelsen, 1993, 1994). This way it is easier to predict the fi nancial outcome of differently focused Lean kaizen events. Furthermore, it is possible to understand ex post why the cost of waste changes at batch level simply because of changes in the number of batches initiated.
A main advantage of our Lean fi nancial model is the way in which it fully and clearly defi nes all waste types.4 Addressing different waste types calls for the application of different Lean tools. For example, while reduction of stocks calls for increased work with Just In Time, reduction of scrap and rework requires improved human attention – poka yoke (Carriera, 2005). As we have seen in our case companies, every company must decide which aspects of Lean they wish to emphasize on their Lean journey. Resources for implementing Lean will always be scarce, therefore it is necessary to have the right decision-making support to optimize cost-benefi t trade-offs. Without this guidance it is a blindfolded decision process.
Johnson’s (1992) point of view is that all Lean tools constitute the right way to do things in any given situation. Even if one agrees with this proposition, we would still need some guidance

Dow
nloa
ded
By:
10.
3.98
.104
At:
14:1
2 07
Jan
202
2; F
or: 9
7802
0310
1261
, cha
pter
3, 1
0.43
24/9
7802
0310
1261
.ch3
45
Table 3.6 Lean fi nancial reporting
Value stream 1
1 2 3
Actual production volume x actual price (consumption)
Actual production volume x standard price (consumption)
Scheduled volume x standard price
Revenue 29,400 29,400 33,000Unit-level labor (operators – water spider) 2,739 2,736 3,071Unit-level materials (bom & paint) 2,515 2,515 2,755Unit-level contribution margin 1 24,146 24,149 27,174Unit-level materials loss (paint) 29 28 30Scrap (materials) 234 117 125Unit-level inspection 56 56 60Unit-level movement 105 105 113Unit-level transport 67 67 72Unit-level scrap (labor) 261 130 140Unit-level rework 29 29 31Unit-level waiting time 350 0 0Unit-level incorrect processing 117 67 72Unit-level imbalance 309 309 331Unit-level contribution margin 2 22,590 23,241 26,202Batch-level labor (operators – water spiders) 700 700 750Batch margin 1 21,890 22,541 25,452Set-up 19 19 21Batch-level inspection 10 10 10Batch-level movement 29 29 31Batch-level transport 47 47 50Batch-level rework and rescheduling 39 39 42Batch-level waiting time 19 19 21Batch-level incorrect processing 0 0 0Batch-level imbalance with cells 197 197 211Batch margin 2 21,529 22,180 25,065Value stream sustaining (avoidable operators) 1,425 1,425 1,425Available labor operators – not bottleneck cell 56 345 58Available labor operators on bottleneck cell (1) 28 172 29Value-stream sustaining – (avoidable water
spiders)1,398 1,498 1,468
Depreciation for available machine time 240 290 240Depreciation for wasted machine time 322 272 292Depreciation for machine time consumed 438 438 469Value stream capacity costs (engineer) 1,000 1,000 1,000Profi t before imputed interest 16,622 16,740 20,090Raw materials stock – cost of capital 4 4 4WIP storage materials – cost of capital 1 0 1Finished goods – cost of capital 8 7 8Stock facilities – cost of capital 87 81 87Machine assets – cost of capital 29 29 29Factory occupancy – cost of capital 288 288 288Profi t after imputed interest 16,206 16,330 19,674
Management accounting system problems in context of Lean

Dow
nloa
ded
By:
10.
3.98
.104
At:
14:1
2 07
Jan
202
2; F
or: 9
7802
0310
1261
, cha
pter
3, 1
0.43
24/9
7802
0310
1261
.ch3
Kristensen and Israelsen
46
on where to begin with Lean to achieve the biggest fi nancial impact, and on how intensely each tool should be implemented. Stretching all Lean tools to their limit in every company would be the equivalent of perceiving Lean to be universally profi table. This is not true, of course, as companies work under different contingencies and need to adapt to these in different ways, which in turn involves different weighting of Lean tools. The waste types incorporated are those that Lean claim to be able to reduce by means of different tools. This is similar to knowing which actions (tools) will affect costs in a certain way, and this involves the controllability and accuracy principles of Merchant’s approach. The goal of Lean is to reduce waste and monitor the progress of these reductions, something that can be rendered explicit by the measurements of the Lean fi nancial model.
Finally, it is important to bear in mind that our Lean fi nancial model is not aimed at supporting a “management by exception” culture. On the contrary, it aims to support a continuous improvement approach, for which reason we have made the expected cost of waste explicit in standards, as it is just as important to manage and focus on these in Lean activities as it is to manage and focus on the unexpected cost of waste. This way, it is possible to determine which Lean initiatives would be the best to pursue and where in the processes they ought to be activated in order to make the greatest fi nancial impact.
The relativity measure as an indicator of Lean progress
While studying the three case companies it became apparent that they faced challenges in fi nding fi nancial KPIs for their Lean progress. Assessing Lean progress from a traditional standard costing model perspective is diffi cult over multiple periods as standards change. Alternatively, actual costs could be compared to revenues or number of units (Maskell and Baggaley, 2004). Yet this too is diffi cult to compare, as we may experience product mix changes. Furthermore, costs are subject to infl ation and if this varies over the years cost-to-unit/revenue ratios are affected.
Another diffi culty using this ratio in measuring Lean progress is the non-explicit handling of available capacity. This is especially problematic during the fi rst couple of years of Lean implementation where the effect of Lean mainly creates available capacity not yet consumed by sales growth (Cunningham, 2003). This aspect of making the cost of available capacity explicit is part of measuring Lean progress, as Lean is not about laying people off but rather a cost-effi cient growth strategy (Womack and Jones, 2003).
Moreover, it may be diffi cult to compare revenues with actual costs as a measure of Lean progress if the company has powerful customers or the market is tightly controlled by competi-tors with successful Lean programs (Cooper and Slagmulder, 1999). In these situations it is likely that cost improvements will be more benefi cial to customers than to the company itself (Lewis, 2000). So the result would be a reduction in revenues compared to costs, and the Lean progress would be perceived as unsuccessful – i.e. the margins of the company would not increase.
A fi nal disadvantage of using actual costs as a Lean progress indicator is the lack of ability to identify areas in which the company could benefi t the most from Lean initiatives. If the cost model does not show the cost of all waste types it cannot effectively show where Lean tools can potentially remove waste and which tools to pick for the job.
Inspired by Maskell and Baggaley (2004), we introduce the relativity measure. This consists of the relative percentage of costs for:
1. process consumed costs (neither available nor waste) – i.e. value-added;2. cost of waste;

Dow
nloa
ded
By:
10.
3.98
.104
At:
14:1
2 07
Jan
202
2; F
or: 9
7802
0310
1261
, cha
pter
3, 1
0.43
24/9
7802
0310
1261
.ch3
47
Table 3.7 Cost of waste according to the Lean fi nancial model and the relativity measure
Unexpected Expected Relativity measure
1. Process consumed (not available nor waste)Materials 0 2,515 90.5%Labor (slower pace) 3 3,436 43.0%Machine time 0 450 43.8%
2. Cost of WasteMaterials loss (paint) 1 28Scrap (materials) 117 117
Cost of waste materials 9.5%Inspection 0 66Movement 0 134Transport 0 114Scrap (labor) 130 130Rework 0 68Waiting time 350 19Incorrect processing 50 67Set-up 0 19
Cost of waste labor 14.4%Wasted machine time 50 280 32.1%Stock cost 7 92 100.0%
3. AvailableBottleneck cell available labor (operators) –144 172 0.3%Imbalance labor 0 506 6.3%Machine available –50 299 24.2%Other labor operators available –289 345 0.7%
4. Value-stream sustainingOperators 0 1,425 17.8%Water spiders –100 1,498 17.5%
Total cost of waste 1,840
3. cost of available capacity;4. value stream sustaining costs.
The process consumed costs are those found in the activity path as neither available nor waste. The cost of waste is based on the waste registered in Lean. The available capacity consists of both idle time at the bottleneck resource in cell 1 and idle labor in the other cells. Furthermore, the time assigned to imbalance time is also perceived as available time. The value stream sustaining costs consists of time consumed by activities such as breaks, meetings and the like. This time is standard and assigned according to Appendix 1. These activities could also be analyzed further in the same style as costs in the activity path; however, we do not pursue this as it would be more a study of Lean in administrative processes.
Our example reporting of the relativity measure is shown in Table 3.7 and summarized in Table 3.8.
Table 3.7 separates expected and unexpected costs and shows in some cases “negative” unex-pected cost. This happens for instance in “bottleneck cell available labor” as a consequence of
Management accounting system problems in context of Lean

Dow
nloa
ded
By:
10.
3.98
.104
At:
14:1
2 07
Jan
202
2; F
or: 9
7802
0310
1261
, cha
pter
3, 1
0.43
24/9
7802
0310
1261
.ch3
Kristensen and Israelsen
48
decreased costs. The actual costs are 144 less than the fl exible budget costs. This means that the actual costs are 28 (172–144, fi gures from Table 3.6). We expected these costs to be 172 in the fl exible budget column but the actual costs were 28. Hence, we have a (favorable) difference of 144.
Our relativity measure is divided between resource types, as opposed to Maskell and Baggaley (2004). In our example, we focus on two of these: “materials” and “labor”. The division is necessary as the price per resource may have different infl ation rates and thus separate effects.
The company can use the relativity measure to measure the progress of Lean over multiple periods from a cost perspective, and improvements are signalled in an increased percentage of resources used in the “process consumed” category, and a decreasing percentage in the cost-of-waste category in particular.
The Lean fi nancial model and subsequent relativity measures make it easier to track changes arising from “lead time” registered in the cost model. The lead time measure can be tracked over multiple periods as one non-fi nancial trend indicator of Lean progress (Maskell and Baggaley, 2004). Using the Lean fi nancial model’s relativity measure we can now compare cost improvements indicated by this measure (stock waste) with the lead time trend. This way, we are linking the logic between the costing scheme and the lead time measure, increasing coherence between these two measures in the control package.
The relativity measure can also help in analyzing Lean progress independently of the organization’s normal learning curves. It is regularly assumed that operators learn how to work faster over time as they gain more practice. This effect is quite pronounced in Company C as, twice a year, it introduces new products which operators need some time to learn to operate in order to produce more rapidly. Let us assume that learning how to work faster would include both process-consuming (value-adding) and wasteful activities in the activity path, with equal pace. From this perspective the learning curve effect would not remove waste, just complete the wasteful activities faster. So, while total time consumed in completing a product unit would be reduced, the proportion of cost-of-process time and wasteful activities remains. . This is the reason why the relativity measure is unaffected (or only modestly affected) by the normal learning curve effect and therefore a strong measure of Lean activity benefi ts which in turn primarily directs improvement efforts to cost-of-waste categories. Subsequently, this would shift the relative distribution between the cost of waste and cost of process consumed towards more time being spent on the latter.
Comparing Tables 3.4 and 3.7 it is obvious that the total cost of waste is higher in our Lean fi nancial model. According to traditional reporting the total cost of waste is 998 while in Lean fi nancial reporting it is 1,840 (all expected and unexpected cost in Table 3.7’s “2. Cost of Waste”). Lean fi nancial reporting indicates a higher cost of waste as the standards are now transparent with regards to waste. According to Lean fi nancial reporting, “movements”, in the example, constitute the major type of waste. Movements could be the focus of Lean, addressed
Table 3.8 Summary of relativity measure
Material Labor Machine Stock
Process consumed 90.5% 43.0% 43.8%Cost of waste 9.5% 14.4% 32.1% 100.0%Available 7.4% 24.2%Value stream sustaining 35.3%Total 100.0% 100.0% 100.0% 100.0%

Dow
nloa
ded
By:
10.
3.98
.104
At:
14:1
2 07
Jan
202
2; F
or: 9
7802
0310
1261
, cha
pter
3, 1
0.43
24/9
7802
0310
1261
.ch3
49
by specifi c tools such as cell layout and single piece-fl ow without WIP stocks (Liker, 2006). This constitutes a different focus compared to the one resulting from the conclusion of the value stream map (i.e., in the example, lead time on stocks), not to mention that arising from traditional fi nancial reporting (i.e. scrap). Logically, Lean fi nancial reporting forces decision-making to encompass a concern with all waste types, something which Lean is created to reduce and therefore increase the goal congruence between the analysis of Lean and the goals of Lean.
Available capacity and opportunity cost of waste
The Lean fi nancial model renders different types of available capacity explicit. This is done intentionally in order to understand the potential use of this capacity. Acting on this we can improve time consumption.
We distinguish between available bottleneck capacity (cell 1 in the example), other labor-available capacity and imbalance capacity. Other labor-available capacity is the capacity available in non-bottleneck labor resources, and the imbalance idle capacity comes from the activity path in which cells cannot be balanced completely with each other, or in which cells cannot be balanced internally. Only if there is available capacity at the bottleneck is it possible to increase value stream activity. In the example schedule there is very little available capacity at the bottleneck resource, and not enough to run another batch. Therefore, as the tool problems registered on the visual board in cell 1 arise, and the cell loses time equal to one batch, it may be argued that the cost of waste in our model fails to represent the opportunity costs. Opportunity costs are by defi nition equal to the contribution margin lost with the above-mentioned batch. The increased scrap level reduces the contribution margin as there are (potential) customers for these goods. This in turn changes the cost of waste so that it becomes the opportunity cost of waste including the lost contribution margin. A calculation of opportunity costs would be fruitful in assessing the total cost of waste. Nonetheless, to keep the example simple we have not included the explicit calculations in this presentation.
Encoding activities as VA or NVA in the costing system or not – the literature debate
A main element of the Lean fi nancial model presented is based on encoding actions that are perceived as waste within the Lean philosophy; it has been shown how the model benefi ts from this categorization. However, we acknowledge the literature debate on this topic and will briefl y address it.
Banker et al (2008) confi rm their hypothesis that the impact of Activity Based Costing on performance is mediated by world-class manufacturing (WCM, Lean). They argue that ABC facilitates a more accurate identifi cation of cost drivers associated with non-value-adding manufacturing activities and as a result supports a better implementation of WCM through a more focused resource allocation and cost control. Kaplan and Cooper (1998) argue that encoding activities, in the form of value-adding or non-value-adding, are not enhancing decisions on cost reductions, the reason being that the cost reduction of value-adding activities is worth just as much as the cost reduction of non-value-adding activities. In addition, they believe it is no easier – a priori – to reduce the costs of non-value-adding activities than of value-adding activities, e.g. industrial engineers reduce costs in value-adding activities on a daily basis by increasing machine speed. Instead, they propose a four-category approach which divides the activities between those required by the products and those not required. The required activities are divided into whether they can be optimized or not, and the non-required activities
Management accounting system problems in context of Lean
Dow
nloa
ded
By:
10.
3.98
.104
At:
14:1
2 07
Jan
202
2; F
or: 9
7802
0310
1261
, cha
pter
3, 1
0.43
24/9
7802
0310
1261
.ch3
Kristensen and Israelsen
50
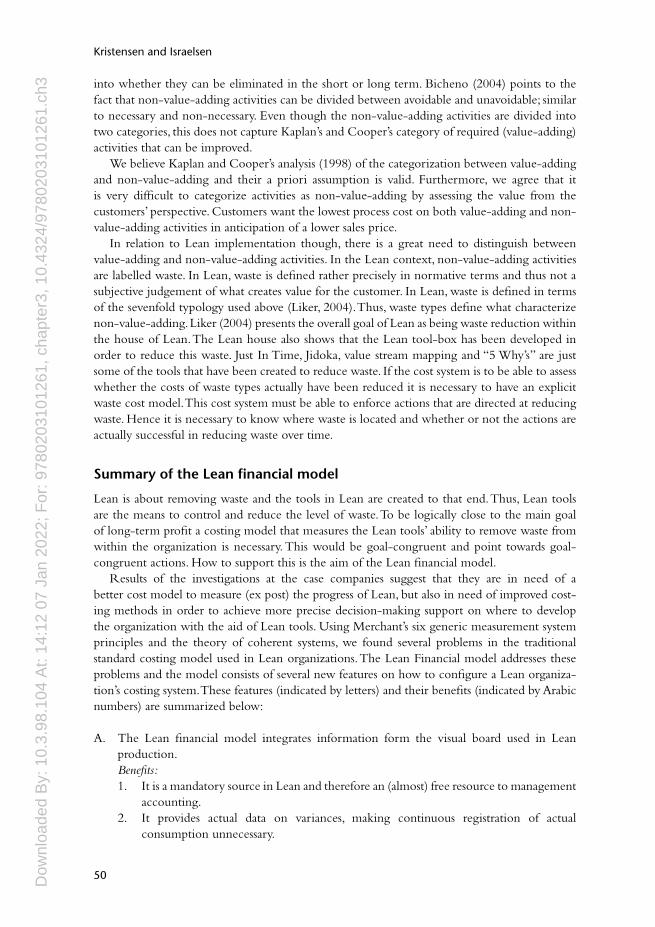
into whether they can be eliminated in the short or long term. Bicheno (2004) points to the fact that non-value-adding activities can be divided between avoidable and unavoidable; similar to necessary and non-necessary. Even though the non-value-adding activities are divided into two categories, this does not capture Kaplan’s and Cooper’s category of required (value-adding) activities that can be improved.
We believe Kaplan and Cooper’s analysis (1998) of the categorization between value-adding and non-value-adding and their a priori assumption is valid. Furthermore, we agree that it is very diffi cult to categorize activities as non-value-adding by assessing the value from the customers’ perspective. Customers want the lowest process cost on both value-adding and non-value-adding activities in anticipation of a lower sales price.
In relation to Lean implementation though, there is a great need to distinguish between value-adding and non-value-adding activities. In the Lean context, non-value-adding activities are labelled waste. In Lean, waste is defi ned rather precisely in normative terms and thus not a subjective judgement of what creates value for the customer. In Lean, waste is defi ned in terms of the sevenfold typology used above (Liker, 2004). Thus, waste types defi ne what characterize non-value-adding. Liker (2004) presents the overall goal of Lean as being waste reduction within the house of Lean. The Lean house also shows that the Lean tool-box has been developed in order to reduce this waste. Just In Time, Jidoka, value stream mapping and “5 Why’s” are just some of the tools that have been created to reduce waste. If the cost system is to be able to assess whether the costs of waste types actually have been reduced it is necessary to have an explicit waste cost model. This cost system must be able to enforce actions that are directed at reducing waste. Hence it is necessary to know where waste is located and whether or not the actions are actually successful in reducing waste over time.
Summary of the Lean fi nancial model
Lean is about removing waste and the tools in Lean are created to that end. Thus, Lean tools are the means to control and reduce the level of waste. To be logically close to the main goal of long-term profi t a costing model that measures the Lean tools’ ability to remove waste from within the organization is necessary. This would be goal-congruent and point towards goal-congruent actions. How to support this is the aim of the Lean fi nancial model.
Results of the investigations at the case companies suggest that they are in need of a better cost model to measure (ex post) the progress of Lean, but also in need of improved cost-ing methods in order to achieve more precise decision-making support on where to develop the organization with the aid of Lean tools. Using Merchant’s six generic measurement system principles and the theory of coherent systems, we found several problems in the traditional standard costing model used in Lean organizations. The Lean Financial model addresses these problems and the model consists of several new features on how to confi gure a Lean organiza-tion’s costing system. These features (indicated by letters) and their benefi ts (indicated by Arabic numbers) are summarized below:
A. The Lean fi nancial model integrates information form the visual board used in Lean production.
Benefi ts: 1. It is a mandatory source in Lean and therefore an (almost) free resource to management
accounting. 2. It provides actual data on variances, making continuous registration of actual
consumption unnecessary.

Dow
nloa
ded
By:
10.
3.98
.104
At:
14:1
2 07
Jan
202
2; F
or: 9
7802
0310
1261
, cha
pter
3, 1
0.43
24/9
7802
0310
1261
.ch3
51
3. It improves data quality and creates one coherent system of variance calculations and increased chances of “one story of variance explanations”.
4. It supports shop-fl oor people with information on cost-saving potential per waste type.
B. The Lean fi nancial model’s input on standards comes from value stream maps, VSMs. Benefi ts: 5. VSM is mandatory in Lean and therefore cost-effi cient to use in the management
accounting system. 6. VSMs often contain detailed information on waste providing opportunity to calculate
standards/expected cost of waste in many categories. 7. With the information from the visual board (item 1) and standards, the Lean fi nancial
model calculates unexpected variances.C. Lean fi nancial model vis-à-vis a traditional standard cost model: a. The Lean fi nancial model splits total cost and total variance into four main categories:
(i) process-consumed costs (ii) cost of waste (iii) cost of available capacity (iv) value stream sustaining costs. b. Within the waste category the model is open in resource categories (materials and
labor) and in all Lean categories of waste (inspection, movement, rework etc.) showing maximum attainable cost savings per waste type.
c. Within the availability category the model distinguishes between (i) available capacity at the potential bottleneck (pacemaker), (ii) at other resources due to imbalance between resource workloads, and (iii) at resources other than the bottleneck.
d. Imputed interest is used to cast lead time in stocks in cost terms. e. It separates unit and batch cost. f. Water-spider costs are separate from labor cost to avoid confusion. Benefi ts: 8. The four-category division in C-a provides the advantage of measuring Lean progress
in terms of cost effects which comes logically closer to the overall long-term profi t of the company than does any non-fi nancial Lean KPI.
9. A relativity measure based on the four categories in C-a makes it possible to measure Lean progress over multiple periods.
10. The three availability categories in C-c are important measures in the Lean journey as there might be time-lags between creations of more availability and the productive use of this through increased sales.
11. Separating unit and batch cost in C-e is important since Lean entails a journey towards reducing batch sizes.
12. The model rules out most of the normal learning curve effects and therefore provides a more accurate measure of Lean progress.
Limitations and future research
As with most models there are also limitations to the Lean fi nancial model presented. A potential limitation is the way it handles product mix changes stemming from introduction of new products to the value streams. New products may change the relative distribution between the four categories (viz. Tables 3.7 and 3.8), as some products may be designed to create less waste. The model implicitly assumes that new products in the same value stream entail approximately
Management accounting system problems in context of Lean

Dow
nloa
ded
By:
10.
3.98
.104
At:
14:1
2 07
Jan
202
2; F
or: 9
7802
0310
1261
, cha
pter
3, 1
0.43
24/9
7802
0310
1261
.ch3
Kristensen and Israelsen
52
the same relative distribution of costs between the four categories (see the vertical dimension in Table 8) of each resource type as the existing products. If new products contain less relative waste it will cause the value stream relativity measure to improve. And this improvement is not caused by operational improvements; it may be the result of more focus on Lean-“friendly” product developed in the R&D department.
Another limitation of our model is that is has not passed the ‘put to use test’ yet. However, we must think of different degrees of use, actually somewhat like companies using Activity Based Costing models. The simplest use is a stand-alone model in one department with manual data feed. A more advanced application involves a number of departments with the model using automated data feeds from ERP systems. The ultimate implementation is where the Lean fi nancial model substitutes the previous traditional standard cost system and is totally integrated into the company’s ERP system. For the latter to happen, however, every shop fl oor should use visual boards; this is Lean implemented company-wide. Even in the biggest and most well-run Lean companies this is rare. Hence, it is the more modest implementation we can hope for.

Dow
nloa
ded
By:
10.
3.98
.104
At:
14:1
2 07
Jan
202
2; F
or: 9
7802
0310
1261
, cha
pter
3, 1
0.43
24/9
7802
0310
1261
.ch3
53
Appendices
Appendix 3.1 The inputs to computations in the example
Budget no. of batches 15Budget fi nished unit (without scrap – scrap 15 units) 330Operator indirect activities standard time – hours (value stream sustaining) 57Bill of materials – 1pc EUR 4Paint 1000 ml, EUR 10Operator/water spider hourly wage EUR 25Batch size, pcs 23sales price per pc (no deviation between budget and actual) 1001 engineer dedicated to each value stream – weekly costs 1,000Depreciation – machine 1 1,000Factory (building) 1 value EUR 50% of total value – driver = square meters 100,000Machine 1 value 100% – dedicated to this value stream 10,000Stock 1 materials value (5 days of production including scrap) 1,380Stock 2 materials value (10 days of production without scrap) 2,700WIP storage materials value (4 hours) 184Stock 1 & 2 building value (50% of total value as standard-cost driver is square meters) 3,000Total asset value – dedicated and allocated 144,264
Appendix 3.2 Toyota production system house
Levelled Production (Heijunka)
Stable and Standardized Processes
Visual Management
The Toyota Way Philosophy
Best Quality – Lowest Cost – Shortest Lead time – Best Safety – High Moralethrough shortening the production fl ow by eliminating waste
Just In TimeRight part, right amountRight time
• Takt time planning• Continous fl ow• Pull system• Quick changeover• Integrated logistics
Jidoka(In-station quality)Make problems visible
• Automatic stops• Andon• Person–machine
separation• Error-proofi ng• In-station quality
control• Solve root cause
(5 Why’s)
People & Teamwork• Selection • Ringi decision-making• Common goals • Cross-trained
Waste Reduction• Genchi Genbutsu • Eyes for Waste• 5 Why’s • Problem-solving
Continuous Improvement
Source: Liker (2004), p. 33.
Management accounting system problems in context of Lean

Dow
nloa
ded
By:
10.
3.98
.104
At:
14:1
2 07
Jan
202
2; F
or: 9
7802
0310
1261
, cha
pter
3, 1
0.43
24/9
7802
0310
1261
.ch3
Kristensen and Israelsen
54
Notes
1 A ten-page account of our fi ndings in the individual companies can be obtained by contacting the relevant author.
2 In Company C operators are taught about different types of waste cost to facilitate their decision-making process. This is similar to the fi ndings of Lind (2001), in which a world-class manufacturing company decided not to abandon its budgeting system, while its shop-fl oor-level subordinates are able to discuss their daily activities with their superiors in budget terms, voicing budgetary arguments if necessary.
3 In our discussion of the relativity measure below, we point to the fact that Maskell and Baggaley (2004) employ something similar when they calculate available capacity. But as they operate solely with actual accounting, devoid of any form of time registration, they believe in using the value stream map to calculate available capacity. However, as the VSM does not contain any costing fi gures it would seem diffi cult to obtain a cost value for available capacity from the above without using standards as we do.
4 For illustrative purposes, the costs of waste presented in the Lean fi nancial model can be drawn in a cost-time diagram as recommend by Bicheno (2004). The lead time would be represented on the x-axis and the accumulated cost of waste on the y-axis. All the data are available in the activity path and Lean fi nancial model.
Bibliography
Åhlström, P., Karlsson, C. 1996. Change processes towards lean production. The role of the management accounting system. International Journal of Operations & Production, 16 (11), 42–56.
Atkinson, A., Kaplan, R.S., Matsumura, E.M., Young, M.S., 2007. Management Accounting. Upper Saddle River, NJ: Pearson Education.
Anderson, S., Widener, S., 2007. Doing Quantitative Field Studies. In Chapman, C.S., Hopwood, A., Shields, M.D. (eds), Handbook of Management Accounting Research, Oxford: Elsevier, 319–341.
Banker, R.D., Bardhan, I.R., Chen, T-Y. (2008). The role of manufacturing practices in mediating the impact of activity-based costing. Accounting, Organizations and Society, 33 (1), 1–19.
Bicheno, J., 2004. The New Lean Toolbox – Towards Fast, Flexible Flow. Buckingham: Picsie books.Carreira, B., 2005. Lean Manufacturing that Works Powerful Tools for Dramatically Reducing Waste and Maximizing
Profi ts. Amacom: American Management Association.Cheatam, C.B., Cheatam, L.B., 1996. Redesigning cost systems: is standard costing obsolete? Accounting
Horizons 10 (4), 23–31.Chenhall, R., 2003. Management control systems design within its organizational context: fi ndings from
contingency-based research and directions for the future. Accounting, Organizations and Society, 28 (2–3), 127–168.
Cooper, R., Slagmulder, R., 1999. Supply Chain Development for the Lean Enterprise. Portland: Productivity.Cunningham, J.E., Fiume, O.J., 2003. Real Numbers Management Accounting in a Lean Organization. Managing
Times Press, USA.Friis, I., Hansen, A., Vámosi, T., 2007. Koordination i en LEAN-virksomhed: grænser for værdistrømsanalysen
som koordinationsmekanisme. Økonomistyring & Informatik 23(1), 33–68.Henriksen, L.B., Nørreklit, L., Jørgensen, K.M., Christensen, J.B., O’Donell, B., 2004. Dimensions of
Change: Conceptualizing Reality in Organizational Research. Copenhagen: Copenhagen Business School Press.
Horngren, C.T., Foster, G., Datar, S.M., 1997. Cost Accounting – A Managerial Emphasis. Upper Saddle River, NJ: Simon & Schuster, 9th international edition.
Horngren, C., Sundem, G.L., Straton, W.O., Burgstahler, D., Schatzberg, J., 2010. Introduction to Management Accounting, 15ed. Boston: Pearson Prentice Hall
Huntzinger, J.R., 2007. Lean Cost Management: Accounting for Lean by Establishing Flow. Plantation, FL: Timothy J. Ross Publications.
Israelsen, P., 1993. Activity- versus Variability-Based Management Accounting. Copenhagen: DJOF Publishing.Israelsen, P., 1994. ABC and variability accounting: differences and potential benefi ts of integra tion.
Europe an Accounting Review, 3 (1), 15–48.Johnson, H.T., 1992. Relevance Regained. New York: The Free Press.Kaplan, R.S., Cooper, R., 1998. Cost and Effect: Using Integrated Cost Systems to Drive Profi tability and
Performance. Boston: Harvard Business School Press.

Dow
nloa
ded
By:
10.
3.98
.104
At:
14:1
2 07
Jan
202
2; F
or: 9
7802
0310
1261
, cha
pter
3, 1
0.43
24/9
7802
0310
1261
.ch3
55
Kaplan, R.S., Norton, D.P., 1996. The Balanced Scorecard – Translating Strategy into Action. Boston: Harvard Business School Press.
Kennedy, F.A., Brewer P., 2005. Lean accounting: what’s it all about? Strategic Finance, 87 (5), 26–34.Kennedy, F.A., Widener, S.K., 2008. A control framework: insights from evidence on Lean accounting.
Management Accounting Research, 19 (4), 301–323.Lindsay, R.M., Kalagnanam, S.S., 1993. The Adoption of Just-In-Time Production Systems in Canada and their
Association with Management Control Practices. Hamilton, Ont.: The Society of Management Accountants of Canada.
Kristensen, T.B., Israelsen, P., 2010. Standard costing in Lean organizations: enabling or coercive? Paper presented at MAR 2010 (EIASM), Ghent, June 20–23.
Lewis, M.A., 2000. Lean production and sustainable competitive advantage. International Journal of Operations & Production Management, 20 (8), 959–978.
Liker, J., 2004. The Toyota Way, USA: McGraw-Hill.Liker, J., Meier, D., 2006. The Toyota Way Fieldbook. USA: McGraw-Hill.Lind, J., 2001. Control in world-class manufacturing: a longitudinal case study. Management Accounting
Research, 12 (1), 41–74.Maskell, B., Baggaley, B., 2004. Practical Lean Accounting. USA: Productivity Press.Merchant, K.A., 2006. Measuring general managers’performances: market, accounting and combination-
of-measures systems. Accounting, Auditing & Accountability Journal, 19 (6), 893–917.Mouritsen, J., Hansen, A., 2006. Management Accounting, Operations, and Network Relations: Debating
the Lateral Dimension. In Bhimani, A. (ed.), Contemporary Issues in Management Accounting. Oxford: Oxford University Press, 266–290.
Nørreklit, H., 2000. The balance on the Balanced Scorecard: a critical analysis of some of its assumptions. Management Accounting Research, 11 (1), 65–88.
Nørreklit, L., Nørreklit, H., Israelsen, P., 2006. The validity of management control: towards constructivist pragmatism. Management Accounting Research, 17 (1), 42–71.
Otley, D., 1999. Performance management: a framework for management control systems research. Management Accounting Research, 10 (4), 363–382.
Rother, M., Shook, J., 1999. Learning to See: Value Stream Mapping to Add Value and Eliminate MUDA. Cambridge, MA: The Lean Enterprise Institute Inc.
Schonberger, R.J., 1986. World-Class Manufacturing: the Lessons of Simplicity Applied. New York: The Free Press.
Schonberger, R.J., 1990. Building a Chain of Customers: Linking Business Functions to Create the World-Class Company. New York: Hutchinson Business Books.
Schonberger, R.J., 1996. World-Class Manufacturing: the Next Decade. Building Power, Strength and Value. New York: The Free Press.
Fry, T.D., Steele, D.C., Saladin, B.A., 1995. The role of management accounting in the development of a manufacturing strategy. International Journal of Operations & Production Management, 15 (12), 21–31.
Womack, J.P., Jones, D.T., Roos, D., 1991. The Machine that Changed the World. New York: HarperCollins Publishers.
Womack, J.P., Jones, D.T., 2003. Lean Thinking: Banish Waste and Create Wealth in your Corporation. UK: Simon & Schuster.
Yin, R.K., 2003. Case Study Research: Design and Methods. Thousand Oaks, CA: Sage Publications.
Management accounting system problems in context of Lean