Management Accounting Guidelines - Evidence-based · PDF fileIdentify the Strategic...
47
MANAGEMENT ACCOUNTING GUIDELINE (MAG ® ) By Bernard Marr Evidence-based Decision Making: Using Business Intelligence to Drive Value Published by The Society of Management Accountants of Canada, the American Institute of Certified Public Accountants and The Chartered Institute of Management Accountants.
Transcript of Management Accounting Guidelines - Evidence-based · PDF fileIdentify the Strategic...
MANAGEMENT ACCOUNTING GUIDELINE (MAG ®)
By Bernard Marr
Evidence-based Decision Making: Using BusinessIntelligence to Drive Value
Published by The Society of Management Accountants of Canada, theAmerican Institute of Certified Public Accountants and The CharteredInstitute of Management Accountants.

Notice to Readers
The material contained in the Management Accounting Guideline
(MAG®) Evidence-based Decision Making: Using Business
Intelligence to Drive Value is designed to provide illustrative
information with respect to the subject matter covered. It does
not establish standards or preferred practices. This material has
not been considered or acted upon by any senior or technical
committees or the board of directors of either the AICPA, CIMA or
CMA Canada and does not represent an official opinion or position
of either the AICPA, CIMA or CMA Canada.
Copyright © 2009 by The Society of Management Accountants of Canada (CMA Canada), the American Institute of Certified Public Accountants, Inc. (AICPA)and The Chartered Institute of Management Accountants (CIMA). All RightsReserved. ® Registered Trade-Mark is owned by The Society of ManagementAccountants of Canada.
No part of this publication may be reproduced, stored in a retrieval system ortransmitted, in any form or by any means, without the prior written consent of thepublisher or a licence from The Canadian Copyright Licensing Agency (AccessCopyright). For an Access Copyright Licence, visit www.accesscopyright.ca or calltoll free to 1 800 893 5777.
ISBN: 1-55302-236-X

Contents
Executive Summary ................................................................................................................................... 4
Introduction ................................................................................................................................................ 4What is Evidence-based Management? ....................................................................................... 6The Roots of Evidence-based Management................................................................................. 7Aim of this MAG............................................................................................................................ 7Why is this MAG Relevant to Management Accountants? .......................................................... 7
The Evidence-Based Management Model ................................................................................................. 8
1. Defining Objectives and Information Needs .......................................................................................... 10Identify the Strategic Objective/Information Need ....................................................................... 12Identify Who has the Information Need........................................................................................ 13Clarify What Questions They Want Answered ............................................................................. 13Clarify What Decisions Need to be Taken..................................................................................... 14
2. Collecting Data ....................................................................................................................................... 15What is Good Evidence? ............................................................................................................... 16Qualitative vs. Quantitative Data Collection Methods .................................................................. 16Collecting Evidence and Data........................................................................................................ 17Ensuring Data Quality.................................................................................................................... 18Planning Your Data Collection ....................................................................................................... 18Role of IT Infrastructure and Applications in Collecting Data........................................................ 19
3. Analyzing Data........................................................................................................................................ 22Analysis to Support Strategy......................................................................................................... 22Analysis to Test Your Strategy ...................................................................................................... 23Experimentation as a Way Forward .............................................................................................. 24Role of IT Infrastructure and Applications in Analyzing Data ........................................................ 25
4. Presenting Information........................................................................................................................... 27Visualizing Data ............................................................................................................................. 28Headlines and Narratives .............................................................................................................. 29Performance Dashboards.............................................................................................................. 29Role of IT Infrastructure and Applications in Presenting Information ........................................... 32
5. Making Evidence-Based Decisions ........................................................................................................ 32The Best Use of Information......................................................................................................... 33The Knowing-doing Gap................................................................................................................ 35Seven Steps to Creating a Knowledge-to-Action Culture ............................................................. 35
Conclusion.................................................................................................................................................. 39
Appendix 1: Data Collection Methods........................................................................................................ 39
Useful Websites ......................................................................................................................................... 42
Endnotes .................................................................................................................................................. 42
Bibliography and Further Reading .............................................................................................................. 43
About the Author........................................................................................................................................ 45
Review Committee .................................................................................................................................... 46

Evidence-based Decision Making:
Using Business Intelligence to Drive Value
Executive Summary
Business success depends on two abilities – to gain new insights faster than the competition, and to turn those insights into good decision making. The bestdecisions are those supported by good data. However, while most organizations are drowning in data, they often thirst for relevant information that can support keydecisions. This is where evidence-based management (EbM) comes in. Leadingorganizations use this approach to ensure that they collect the most relevantinformation to support key decisions. Although the idea is intuitively understood andstraightforward, most organizations seem to struggle with (a) collecting relevantand reliable information, (b) finding relevant data among the overwhelming availableamount of data, and (c) using the data to turn it into information and knowledge thatallows the organization to act on it. This management accounting guideline (MAG)provides an overview of how to apply EbM in organizations by outlining a practicalfive-step framework that discusses the following elements:
1. how to define the real information needs,
2. how to collect the right data,
3. how to turn data into information,
4. how to present and communicate that information, and
5. how to turn that information into better decisions and actions.
Throughout this MAG, we will also discuss how the critical role of IT infrastructureand Business Intelligence (BI) applications can support EbM.
Introduction
A cursory glance into the operations of most organizations shows a commonchallenge, irrespective of the industry or sector in which these firms compete.Most struggle to turn the mass of data flowing around the enterprise (which isstored in myriad systems and databases) into the mission-critical knowledgerequired to win in today’s fiercely competitive and highly unpredictable markets.
Thanks to a decade or so of breathtaking advancements in information andcommunications technologies, we now live in a world in which data, in all its forms,can be transmitted simultaneously to large numbers of people across the world bya single click of a button – and at the speed of light. Moreover, as a result of equallystunning technological improvements in data storage, much of the mass of datatransmitted between employees resides somewhere in the enterprise – indatabases, computer systems, or in other devices. Within most medium- to large-sized enterprises, the amount of data being exchanged and stored on a daily basisis almost incalculable – as is its value.
4 Evidence-based Decision Making: Using Business Intelligence to Drive Value

If organizations are struggling today to extract the greatest competitive benefitsfrom their available data, we can be in no doubt that the scale of the challenge willgrow significantly going forward, as year after year our capabilities to store andcommunicate data increases exponentially. Yet recent research predicts that justthree years from now, the world’s information base will double in size every elevenhours. We are experiencing an almost unimaginable information explosion.
As a result, decision makers are bombarded by an ever-expanding supply of data,which places them and their organizations under great strain. The more data that is available, the easier it is to miss the most crucial bits of information. A usefulanalogy is to picture a business leader today as a 19th century gold prospector. Justas those prospectors had to pan tons of worthless silt to find those few nuggets ofgold, today’s business leaders are expected to pan masses of essentially worthless(or background) data for those few golden nuggets of information that providerelevant insights that lead it to better decision making and, ultimately, tocompetitive advantage.
That said, many organizations still fail to grasp the fact that there is a need tosystematically extract those “golden nuggets.” Research shows that manyorganizations are content to hoard data, in the mistaken belief that simply having it available in and of itself adds value, leaving it up to individual decision makers topan for those golden nuggets of information. Management writer David Apgar iscorrect when he says that, although new technologies such as faster processors,bigger storage, and optical fibers have made data storage easier, relevance hasbecome less important. “Cheap information has tempted us to neglect relevanceand led us into some bad habits,” he says.1
But not all organizations have fallen into bad habits. A Hackett Group study foundthat those finance organizations judged as world-class EPM (enterprise performancemanagement) performers generate significantly less reports – namely 691 reportsper year per US$ billion in revenues – compared to 1,474 for the non world-classgroup, and the formers’ reports were also much shorter.2 On first reading, itappears that the world-class group was less productive and less value-adding.However, deeper analysis tells a very different story. The finance staff of the world-class group spent considerable time to ensure that the reports they provided tobusiness leaders homed in on the critical information that was required for decisionmaking. They weren’t just throwing a mass of data at business leaders, instructingbesieged managers to find something of value somewhere in the mass of deliveredpages. The world-class group recognized their core responsibility to apply theiranalytical skills to translate raw data into golden nuggets of knowledge. And therewards to their firms for doing so were considerable. The research found that, overa three-year period, the world-class group generated industry-relative equity returnsthat were more than twice that of the non world-class group.
The likelihood of greater stock market returns as a consequence of better analyticswas confirmed by research published in 2008 by the management consultant firmAccenture.3 A survey of 371 companies found that 65% of top performers said theyhad significant decision-making support or real-time analytical capabilities – versus
5
“Cheap informationhas tempted us toneglect relevance
and led us into some bad habits”
David Apgar

23% of low performers. The same study found that 40% of top performers useanalytics across the whole organization, compared to 23% of low performers.
This performance comparison, of great importance to shareholders, is as compellingas it is logical. Get the right information to the right people at the right time, and you significantly increase the likelihood that they will make better decisions andhelp the organization win in your markets. Such top performers are leading the wayin ensuring that they marshal and analyze available data in a way that can (a) addsignificant value to the organization, and therefore (b) deliver marked andsustainable competitive advantage. They achieve this by applying well-honedanalytical skills which, according to repeated research, are currently in limitedsupply within most organizations.
To overcome the skills shortage that had led to this situation, many organizationshave turned to information technology solutions in the belief that this will solve theproblem. In 2007 alone, organizations spent more than $4 billion on license fees for so-called Business Intelligence tools (software applications that allow people to analyze data). In spite of these massive investments, organizations still fail toconvert data into strategically valuable knowledge. The fact is that software alonewill not solve the decision-support crisis that organizations are facing. To be fullyeffective, information technology and applications have to be closely aligned with(a) the organization’s business goals, and (b) the information and analysis needs ofits people.
What is Evidence-based Management?
Many pioneering organizations throughout the world are using an emergingdiscipline called Evidence-based Management (EbM) as a way to improve theircompetitive positions.Through EbM, organizations explicitly use evidence (the bestand most appropriate information) to guide the decision-making processes toextract maximum value and competitive advantage from their data and information.Crucially, however, EbM involves much more than just the collection and storage of data and information in large quantities – it also requires building competitivestrategies around data-driven insights (see Text Box 1 for an overview of keyterms).
Stanford University Professor Robert Sutton argues that “Evidence-basedmanagement is a simple idea. It just means finding the best evidence that you can, facing those facts, and acting on those facts – rather than doing what everyoneelse does, what you have always done, or what you thought was true. It isn’t anexcuse for inaction. Leaders of organizations must have the courage to act on thebest facts they have right now, and the humility to change what they do as betterinformation is found. It isn’t a new idea and isn’t an original idea. Yet surprisinglyfew leaders and organizations actually do it – and those that do trump thecompetition.”4
6 Evidence-based Decision Making: Using Business Intelligence to Drive Value
“Evidence-based management is a
simple idea. It just means finding the
best evidence that you can, facing those
facts, and acting on those facts. Yet surprisingly
few leaders and organizations actually
do it – and those that do trump
the competition.”Robert Sutton

EbM is therefore not only about business intelligence technology, and it is not just about analytical processes. EbM calls for an organizational approachtowards learning and decision making based on the best available data. Bothbusiness intelligence and analytics are therefore necessary sub-components ofEbM. However, having business intelligence and analytics capabilities in place is not of itself sufficient to create EbM – you also need an organizational culture thatsupports and values fact-based decision making, rather than making decisionspurely on gut feel.
The Roots of Evidence-Based Management
Although EbM is a new approach for most organizations, its roots can be found inevidence-based medicine (EBM), a quality movement that applies the scientificmethod to medical practice. The scientific method is a well-established practice that refers to techniques for investigating phenomena, acquiring new knowledge,or correcting and integrating previous knowledge. To be termed scientific, a methodof inquiry must be based on gathering observable, empirical, and measurableevidence derived from specific principles of reasoning. Applying the scientificmethod calls for collecting data through observation and experimentation, andformulating and testing hypotheses.
The ideas behind the scientific method and EBM can be effectively deployedthrough the EbM approach to significantly improve the quality of decision makingwithin any organization. EbM, therefore, conforms to the requirements andmeaning of the scientific method. It is therefore not a new fad, but rather afundamental process on which humans have based their learning for centuries.
Aim of this MAG
The aim of this MAG is to provide management guidelines on how to properly apply EbM. Using practical examples and clear step-by-step illustrations, this MAGexplains how to create an environment in which decision makers in firms applyanalytics and business intelligence to turn data into value-added information andknowledge to guide decision making. This MAG has been written to be relevantalso to small-and medium- sized firms that (a) might not have a massive budget forthe latest business intelligence tools, and (b) are facing even greater challenges inrelation to skills shortage and the need for better decision making. This MAG willtherefore provide a number of practical insights and techniques in each section.These can be applied without the need for an expensive IT infrastructure, so thatsmall-and medium-sized organizations (as well as business units and departmentsof larger organizations) can gain tangible value from this MAG.
Why is this MAG Relevant to Management Accountants?
Providing evidence in the form of financial reports and related managementinformation has long been the basis for accountants’ role in decision making.However, over recent years, management’s information requirements haveexpanded in terms of the range of data, level of analysis, and expected presentation
7
Text Box 1: Defining some key
terms
Data comes in a myriad of forms. It includes numbers, words, sounds,or pictures, but without context (e.g. 15/3, 5, 68).
Information is a collection of words,numbers, sounds, or pictures thathave meaning (e.g., on the 15th ofMarch at 5 p.m., we were all at No. 68 Victoria Street).
Knowledge is acquired when wetake in and understand informationabout a subject, which then allows us to form judgments to supportdecision making, and then act on it.We do this by using rules about howthe world works that we worked outbased on lots of information from the past.
Business Intelligence refers totechnologies, applications, andpractices for collecting, integrating,analyzing, and presenting businessinformation.
Analytics refers to the use of (a) data and evidence, (b) statistical,quantitative, and qualitative analysis,(c) explanatory and predictive models,and (d) fact-based management todrive decision making.

format. BI vendors have responded by acquiring accounting applications tointegrate with their company-wide BI offerings. Although BI may threaten someaccountants’ traditional roles in generating reports, it could enable them to providebetter information and analysis to support decision making. It could also releasesome management accountants’ capacity to combine financial expertise andbusiness understanding to help improve performance.
The Evidence-Based Management Model
There are five steps for the effective deployment of EbM (See Figure 1), which wedescribe fully within this MAG. This begins with Step 1 – Defining Objectives andInformation Needs. During this step, these questions are asked: “What are ourstrategic aims?” and “Based on those aims, what do we need to know?” This vitalfirst step ensures that we clearly articulate the real information needs, and clarifywho needs to know what, when, and why. Step 2 – Collecting Data – calls forgathering and organizing the right data. The emphasis here is on meaningful andrelevant data to meet the information needs identified in Step 1. Organizationsneed to (a) assess whether the needed data is already held somewhere in theorganization, or (b) know how to devise the best way to collect the data. Step 3 –Analyzing Data – focuses on turning data into relevant insights. Data has to beanalyzed and put into context to extract information. Step 4 – PresentingInformation – focuses on communicating the information and insights extracted inStep 3. The main focus here is to get the information, in its most appropriate form,to the decision makers. Step 5 – Making Evidence-Based Decisions – is concernedwith turning information into knowledge and decisions. The emphasis here is onmaking sure that the available evidence is used to make the best decisions. Here, itis important to create a knowledge-to-action culture and avoid the knowing-doinggap so prevalent in many organizations today.
8 Evidence-based Decision Making: Using Business Intelligence to Drive Value
1. DefiningObjectives and
InformationNeeds
What are ourstrategic aims?
Based on thoseaims, what do we
need to know?
Can we clearlyarticulate ourinformation
needs?
Who needs toknow what,
when and why?
2. Collecting Data
Do we have orcan we collectmeaningful andrelevant data to meet ourinformation
needs?
3. Analyzing Data
How can we turnthe data into
relevant insights?
How can we put the data
into context andextract
information?
4. PresentingInformation
How can we best present
and communicatethe insights
and information to inform
decision makers?
5. MakingEvidence-Based
Decisions
How do weensure that the
availableevidence is usedto make the best
decisions?
How do we create a
knowledgeable-to-action culture?
How do we avoid the
knowing-doinggap?
IT Infrastructure and Business Intelligence Applications as Enablers
How do we best leverage our information technologyinfrastructure and our business intelligence applications
to support evidence-based decision making?
Figure 1: Evidence-Based Management Framework
▲ ▲ ▲ ▲
▲▲ ▲▲ ▲▲

The five sequential steps of this framework provide a blueprint for evidence-baseddecision making. However, the logic of good evidence-based decision making is notjust linear (from Step 1 to Step 5), as there is a feedback loop between the last andthe first step (from Step 5 to Step 1). After learning has taken place and decisionshave been made, they in turn inform future informational needs. This is indicated bythe arrow at the base of the diagram.
As one can see from the framework, there is a sixth box – IT Infrastructure andBusiness Intelligence Applications as Enablers. IT and Business Intelligence play a crucial role in evidence-based decision making. However, they cannot make thishappen alone, but rather must be used to support the steps outlined here. ITinfrastructure and applications are critical enablers of the data collection process,data analysis, and the presentation and dissemination of information. Although ITInfrastructure and Business Intelligence applications are important elements ofevidence-based decision making, we decided not to make them a step in thisframework. As much as anything, this is to highlight the importance of identifyingthe right steps, therefore helping to veer organizations away from being seducedinto the belief that all they need is a state-of-the-art BI infrastructure.
This belief, that all that is required to serve information needs is a technologyapplication, is of long standing. As far back as 1963, an article in Business Weekpredicted that, “the great day – when all the information for solving a managementproblem is only a push button away – is closer than you think.” Fully 45 years later,we are still waiting for this “great day”’ to arrive. The sensible among us realize thatit never will.
That said, investments in technology continue apace. In its report: Making theDifference: The 2008 CIO Agenda, Gartner (the world’s leading informationtechnology research and advisory company) finds that BI (a) was the number onetechnology priority for the third year in a row, and (b) is seen as supporting the topthree business priorities of improving business processes, attracting newcustomers, and retaining them.
The deployment of BI will only be optimally effective if the business managementand IT parts of the organization collaborate closely. Stanford Professor ThomasDavenport and Jeanne Harris make the valuable point that organizations that areserious about analytics and evidence-based management require the support of afully committed IT organization. However, they stress that the IT departments mustplay an enabling and not an ownership role. Simply put, the outcome of the jointanalytics/BI effort is the knowledge to make and act upon decisions. This has to beowned by the business.
Management accountants should consider the potential for BI in their businesses,and be prepared to champion BI projects where appropriate. It could enable themto provide a wider range of information in more accessible formats. In addition toreporting and monitoring, they could provide more forward-looking analysis that isbased on a combination of both financial and non-financial information. It could alsorelease many accountants from the rigor of the reporting cycle to take on decision-support roles.
9
As far back as 1963, anarticle in Business
Week predicted that“the great day – whenall the information for
solving a managementproblem is only a push
button away – is closerthan you think.” We
are still waiting for this“great day” to arrive.

Management accountants should therefore work more closely with theircolleagues in IT to help develop and implement a BI strategy For example:
• They can work with IT to develop a BI strategy and the business case forinvesting in BI. They should help determine the actions to be taken and risks tobe managed, so that the expected benefits can be realized.
• They can support BI implementation, ensuring the application of changemanagement and project management disciplines.
• They can help ensure data quality, perhaps taking responsibility for this oftenunclaimed problem area.
• They can help to articulate the business’s information needs for decision making,and support performance management with metrics that reflect value creation.
• They can support less quantitatively oriented or financially articulate colleagueswith analysis and modelling of financial and non-financial data to assessperformance and enable evidence-based decision making.
We will now discuss each of the five steps in more detail, and outline the role of IT infrastructure and software applications as part of Steps 2 to 4.
1. Defining Objectives and Information Needs
Successfully negotiating Step 1: “Defining Objectives and Information Needs”requires careful answering of one key question: “What do you want to know?” This is a vitally important question, and an appropriate place to start creating a data-driven strategy. In most organizations, the use of BI and analytics is driven more bythe information that is available than by the information needed to make essentialbusiness decisions. This is clearly back-to-front. Effective EbM should be driven by the needs of the organization’s information recipients and decision makers. Inessence, identify the information that the recipient is looking for and apply BI andanalytical capabilities accordingly.
10 Evidence-based Decision Making: Using Business Intelligence to Drive Value
1. DefiningObjectives and
InformationNeeds
What are ourstrategic aims?
Based on thoseaims, what do we
need to know?
Can we clearlyarticulate ourinformation
needs?
Who needs toknow what,
when and why?
2. Collecting Data
Do we have orcan we collectmeaningful andrelevant data to meet ourinformation
needs?
3. Analyzing Data
How can we turnthe data into
relevant insights?
How can we put the data
into context andextract
information?
4. PresentingInformation
How can we best present
and communicatethe insights
and information to inform
decision makers?
5. MakingEvidence-Based
Decisions
How do weensure that the
availableevidence is usedto make the best
decisions?
How do we create a
knowledgeable-to-action culture?
How do we avoid the
knowing-doinggap?
IT Infrastructure and Business Intelligence Applications as Enablers
How do we best leverage our information technologyinfrastructure and our business intelligence applications
to support evidence-based decision making?
▲ ▲ ▲ ▲
▲▲ ▲▲ ▲▲

The cited Hackett study found that world-class organizations spent time identifyingthe needs of the business before doing the analytics. As a powerful case exampleof switching the emphasis from focusing on available data to focusing on the needsof the business, consider Purolator, Canada’s leading courier company.5 Purolator’sfinance organizations successfully completed a program to transition from a“scorekeeper” to a business partner. At the outset of the transformation journey, itconducted a survey with internal customers (mostly decision makers) to ascertainhow Finance was viewed and what improvements were required. From theviewpoint of this MAG, the following survey findings were telling:
“What the feedback process discovered was that although internal customerswere generally satisfied with finance they were also looking for less broad-basedreports, and more focused analysis and recommended actions,” explained Deb Craven, then vice-president, finance and administration.
The fat ring binder, bulging with every conceivable financial analysis, graph, andtable that Finance believed might be useful (sent once a month to each divisionalbusiness leader) exemplified the information overload management complainedabout.
“We were trying to give them data to address every potential question,” explained Craven, “but the feedback that came from the business was that ‘we’re overwhelmed with the sheer volume of data and unsure as to what to dowith it.’ They were telling us they wanted the information to be interpreted, tobe action-oriented. We thought we were being useful by giving the business allthis data, but in fact all we were giving them was stress.”
The study stated that to a certain extent the creation of a fat ring binder wasunderstandable, as along with investment in systems and technologicalimprovements came an avalanche of new data. “The challenge was to turn that data into actionable information that would drive the right decisions,” saysCraven. “In the old finance organization, it would have been tempting to simplyincrease the amount of data and create more binders. However, we are told by the business that they are getting a smaller volume of data, and that what theyreceive is substantially more useful for decision-support purposes.”
A useful approach to establishing the objectives and information needs is thefollowing four-phase methodology for identifying why the data is needed, for whatpurposes, and by whom:
i. Identify the strategic objective/information need.
ii. Identify who has the information need.
iii. Clarify what questions they want answered.
iv. Clarify what decisions need to be taken.
We will consider each phase in turn.
11
“In the old financeorganization, it would
have been tempting tosimply increase theamount of data and
create more binders.However, we are told
by the business thatthey are getting asmaller volume of
data, and that whatthey receive is
substantially moreuseful for decision-support purposes.”
Deb Craven

Identify the Strategic Objective/Information Need
In today’s turbulent, unpredictable markets it has become not only important butessential to link the data that organizations collect to the most important drivers ofvalue and performance. By doing so, we ensure that the analytics we generate (a) are relevant to the organization’s competitive positioning, (b) support its greatestinformation needs, and (c) are not wasted on irrelevant “interesting to know” issues.
In recent years, several models have emerged to help business leaders to identifyand articulate their core strategic objectives and the way they drive businesssuccess. For instance, consider the Balanced Scorecard-based Strategy Mappingapproach, developed by Harvard Business School Professor Robert Kaplan and Dr.David Norton. A traditional Balanced Scorecard framework comprises the four inter-related perspectives of financial, customer, internal processes, and learning andgrowth for which organizations define their strategic objectives.6
Another model that can be used to map strategy is a Value Creation Map based onvalue-driver analysis. Following the logic of the Balanced Scorecard-based StrategyMaps, it provides the following framework for understanding an organization’s valueproposition, its core activities, and its enabling value drivers:
• The value proposition (or output deliverables) identifies an organization’spurpose, and its roles and deliverables. It also identifies the key output for thestakeholders of the organization and the value delivered to them.
• The core activities are the vital few things an organization has to excel at todeliver its value proposition. They essentially define (a) what an organizationshould focus on, and (b) what differentiates it from others.
• The enabling strategic elements (or value drivers) are the other strategicelements or objectives an organization requires to perform its core activities andto deliver its value proposition.
The objectives in these three perspectives are then placed in relationship with eachother and displayed on a single piece of paper to create a completely integrated andcoherent picture of the strategy. As with the Balanced Scorecard, a properlyarchitected Value Creation Map enables the whole of the organization to focus on,and be aligned to, the critical few objectives that will drive success in meetingstrategic goals.
Organizations that clearly understand the building blocks of strategic success canensure they are focusing on the data that is relevant to the strategic journey. Thedata-driven strategy is then hardwired to the strategy of the organization. Allanalytics aggregate upwards to these core strategic objectives.
But what many organization overlook when rushing to build strategy frameworks is that such frameworks, when first designed, represent a hypothesis. That is, they are an assumption by the senior team of what drives strategic success – it is a best guess. Such a hypothesis must be tested through implementation orexperimentation. This takes us back to the “construct hypotheses and test themthrough experimentation” components of the scientific method in which EbM is
12 Evidence-based Decision Making: Using Business Intelligence to Drive Value
Organizations that clearly understand the building blocks
of strategic success can ensure they arefocusing on the data
that is relevant to the strategic journey.
grounded. Indeed, the value of any scientific theory lies not in anyone’s ability to tellthat it’s true, but in the ability to put it to a test, find errors, and improve it.
From the viewpoint of EbM, it is important to use analytics to ensure the crafting ofa strategic objective that will drive competitive success. In a decision-supporthierarchy, it is crucial that the highest level organizational objectives are robust andcorrect, otherwise the supporting data-driven strategy will have considerably lessvalue than it should – if it has any value at all.
Identify Who has the Information Need
The second phase of the model is to identify who needs the information. Here it is important to define the target audience (information customers). Informationcustomers can be groups of people such as the board of directors, seniormanagers, the HR department, the marketing managers, or a single person. It iscritical to clarify who requires the information, because different audiences havevastly different needs, even in relation to a single strategic objective. For example,there might be an overarching strategic objective to improve customer engagement.But the analytics required by the marketing department (who will be interested inproduct performance/brand perceptions) will differ substantially from the humanresources department (who will want to know what internal training is required toimprove the customer relationship).
As part of gaining an understanding of the customers of data and their informationalneeds, it a good idea to consider the following questions:
• What do they know about the issue? People’s understanding of an issue willvary widely. It’s crucial to take the time to discover the depth of their knowledge,as this ensures that time is not wasted seeking and presenting unnecessaryinformation.
• What do they want to know? This identifies the requirement to probe theaudience to discover the exact elements of the issue they are most interestedin.
• What do they expect to see? How would they like the data delivered –graphically, numerically, or through commentary? This helps to understand howthey prefer to receive analytics.
• What will they do with the information? This identifies how the audience will usethe information provided. How will they use this new-found knowledge fordecision making?
Clarify what Questions They Want Answered
Here you want to identify exactly what questions the target audience wants ananswer to. The previous step provides a broad understanding of the requirementsof various audiences, but we now need to delve much deeper to ensure that theanalytics provide the knowledge that will enable the recipients to make the mostappropriate and focused market decisions.
13
It is crucial that the highest level
organizational objectives are
robust and correct, otherwise
the supporting data-driven
strategy will haveconsiderably less
value than it should – if it has any value at all.

Often, however, recipients don’t fully know their exact requirements. A powerful tool for guiding audiences to identifying their specificrequirements is to formulate Key Analytics Questions (KAQs). This isbased on the concept of Key Performance Questions (KPQs).7 Inessence, a KAQ makes sure that we know what it is that we want toknow – that we fully appreciate the exact performance issue that we are grappling with.
It is understood in the context of this four-step process that the high-level strategic objective/information need (as identified through aframework such as the Balanced Scorecard or Value Creation Map) is filtered through the requirements of different audiences. The KAQthen becomes a very narrow and focused operational question. We canargue that it is by finding and implementing the answers to KAQs thatwe are fully able to understand what data is required to operationalizethe corporate strategy.
In constructing a KAQ, it is important to keep it relatively short and clear.A KAQ should only contain one question. Asking a string of questionsmakes it much harder to guide meaningful and focused data collection.The KAQ should not contain any jargon or abbreviations that might notbe understood. Likewise, ensure that the question uses language thatthose in your organization (and those consulted outside) are comfortableand familiar with.
KAQs should focus on both the present and future. For example, ask“How effective are our attempts to increase our market share?” insteadof “Has our market share increased?” By focusing on the future, weopen up a dialogue that allows us to “do” something about the future.We then look at data in a different light, trying to understand what thedata and management information means for the future. This helps withdata interpretation, and ensures that we collect data that helps to informour decision making (see Text Box 2 for examples). After a KAQ isidentified, then the user can move to the next step.
Clarify What Decisions Need to be Taken
Because the KAQ significantly narrows the information needs, it betterenables decision makers to identify the performance data that will helpto improve their decision making. However, although a KAQ narrows thepossible data and indicators that can be used, it still leaves manypossible indicators to choose from. Another question can be used tonarrow the range of possible indicators even further. This questionseeks to clearly identify any important decisions the data would support(See Text Box 3 for examples). By articulating the question and thepossible decisions performance data will help to address, it is possibleto reduce the potential number of indicators from an almost endlessnumber to a smaller and more focused set of possible indicators.
14 Evidence-based Decision Making: Using Business Intelligence to Drive Value
Text Box 2: Examples of Key Analytics
Questions
• Who are going to be our most profitablecustomers?
• What is the level of brand recognition amongcustomer group X?
• Which product or service attributes docustomers value the most?
• How do people click through our website?
• What are the best routes for our deliveryvehicles?
• What is our optimal inventory stock?
• Which customers have the highest lifetimevalue to us?
• What is the ideal product configuration tomaximize our turnover?
• To what extent is our international reputationimpacting on financial performance?
• How well are we sharing our knowledge?
• To what extent are we retaining the righttalent in our organization?
• How well are we promoting our services?
• How do our customers perceive our service?
• How effective are we in managing ourrelationships with key suppliers?
• How well are we communicating within ourorganization?
• How well are we working in teams?
• How well are we building our newcompetencies in X?
• To what extent are we continuing to attractthe right people?
• How well are we fostering a culture ofinnovation and continuous improvement?
• To what extent do people feel passionateabout working for our organization?
• How motivated is our staff?

A good example of how to apply the ideas presented here is Google – oneof today’s most successful and most admired companies. Google appliesthe principles of asking questions. CEO Eric Schmidt says:
“We run the company by questions, not by answers. So in the strategyprocess we’ve so far formulated 30 questions that we have to answer[…] You ask it as a question, rather than a pithy answer, and thatstimulates conversation. Out of the conversation comes innovation.Innovation is not something that I just wake up one day and say ‘I wantto innovate.’ I think you get a better innovative culture if you ask it as aquestion.”8
After identifying the information needs, it is important then to ascertainwhether the data is readily available and of the right quality. If not, aprogram must be launched to collect and capture that data. If the data isavailable, we can theoretically move on to Part 3 of the model. However,it makes sense to read Part 2 to assess the quality of the data. If the datais not available or of the right quality, you need to move on to the secondpart and gather the right information.
2. Collecting Data
An essential component of EbM is having the right data, and data of the rightquality. An effective data-driven strategy is predicated on the ability to collect,analyze, and turn data into information. This information in turn is translated intoknowledge, as described in the EbM framework. If the data is not appropriate or ofthe requisite quality, then the data-driven strategy will be compromised. This willlead to a potentially severe effect on the organization’s ability to (a) make importantdecisions, or (b) implement corporate strategies or any other interventions launchedto win in crowded and competitive markets.
15
Text Box 3: Examples of possible
decisions:
• We need to decide what customers to target.
• We want to decide how best to redesign our website.
• We want to decide the best route for ourdelivery trucks.
• We want to decide which part of ourbranding to invest in.
• We want to decide how best to package ourservice offerings.
• We want to decide which people to recruit.
• We want to decide which part of our production process we need to furtheroptimize.
1. DefiningObjectives and
InformationNeeds
What are ourstrategic aims?
Based on thoseaims, what do we
need to know?
Can we clearlyarticulate ourinformation
needs?
Who needs toknow what,
when and why?
2. Collecting Data
Do we have orcan we collectmeaningful andrelevant data to meet ourinformation
needs?
3. Analyzing Data
How can we turnthe data into
relevant insights?
How can we put the data
into context andextract
information?
4. PresentingInformation
How can we best present
and communicatethe insights
and information to inform
decision makers?
5. MakingEvidence-Based
Decisions
How do weensure that the
availableevidence is usedto make the best
decisions?
How do we create a
knowledgeable-to-action culture?
How do we avoid the
knowing-doinggap?
IT Infrastructure and Business Intelligence Applications as Enablers
How do we best leverage our information technologyinfrastructure and our business intelligence applications
to support evidence-based decision making?
▲ ▲ ▲ ▲
▲▲ ▲▲ ▲▲

This section focuses on providing a thorough understanding of the importance of collecting and organizing the right data (that is, the requisite data to supportstrategic objectives and/or the needs of a specified target audience).
What is Good Evidence?
By rigorously deploying the EbM framework, organizationsexplicitly use evidence to guide their decision making. But whatdo we mean by evidence? In its broadest sense, evidenceincludes any data or information that might be used to determinethe truth of an assertion (this serves as a core process within thejudicial system, for instance).
Within the context of the EbM framework, we narrow thedefinition to “scientific evidence.” Such evidence either supportsor counters an established hypothesis. Scientific evidence mustbe empirical (that is, derived from careful observations orexperiments rather than from speculation or theory), and properlydocumented in accordance with the earlier described scientificmethod.
Building evidence requires the careful collection of the right data.And yet our understanding of the word “data” is confused.People often wrongly believe that the word “data” has a narrownumeric definition. This is incorrect. Data comes in myriad forms– sounds, text, graphics, and pictures are as much data as arenumbers.
Consequently, it is important to become familiar with the availabledata collection methodologies. These approaches are usuallydescribed as either quantitative (being concerned with thecollection of numerical data) or qualitative (concerned with thecollection of non-numerical data). Both approaches have differentpurposes, and each has identifiable strengths and weaknesses,as we now explain.
Qualitative vs. Quantitative Data Collection Methods
The aim of quantitative data collection methodologies is toclassify features, count them, and then construct statisticalmodels in an attempt to explain what is observed. Quantitativedata is usually collected automatically from operations, or throughstructured questionnaires that incorporate mainly closedquestions, with specified answer choices.
Although qualitative and quantitative methods differ (see Text Box 4), a complete polarization of qualitative and quantitative datais not necessarily useful, because it obscures the fact that
16 Evidence-based Decision Making: Using Business Intelligence to Drive Value
Text Box 4: Qualitative vs. Quantitative Data
For decision-support purposes, an observed strength ofquantitative data is that its numerical form allowsrelatively straightforward analysis and graphicalpresentation. Moreover, quantitative data readily lendsitself to performance comparisons across departmentsor business units. For example, one unit’s customersatisfaction score can be easily compared to another’s.
A weakness of quantitative data is that it lacks richnessor context. It might, for instance, tell you that customersare dissatisfied, but will not indicate why, or providemuch in the way of direction on how to remedy theproblem.
Providing such context is an observed strength ofqualitative data. By analyzing qualitative data, we are able to gain insights into what is driving or influencing an individual’s feeling and behaviors. For example,qualitative data will provide insight into why a customeris dissatisfied.
Qualitative data is captured through myriad approaches.These include (a) in-depth interviews (both individualinterviews – i.e., one-on-one – as well as “group”interviews, including focus groups); (b) direct observation(through which the observer does not actively query the respondent); and (c) written documents (which can include newspapers, magazines, books, websites,memos, transcripts of conversations, annual reports, and so on). Usually, written documents are analyzedusing some form of content analysis approach (a socialsciences methodology for studying the content ofcommunication).
A weakness of qualitative data is that, unlike quantitativedata, it can be more demanding to (a) analyze, (b) presentgraphically, or (c) draw statistical comparisons acrossunits. Moreover, there is always a danger of introducingbias into the interpretation of qualitative data (it is mucheasier to put a spin on a collection of perceptions orobservations than it is on hard numbers).

qualitative and quantitative data are intimatelyrelated: Most quantitative data is based uponqualitative judgments; and all qualitative data canbe described and manipulated numerically.
In Appendix I, we look at some of the mostcommon methods for collecting data, such as surveys, interviews, focus groups, etc.Before deploying any of these mechanisms,organizations must first be clear as to thepurpose for doing so (e.g., how will the findingssupport organizational implementation ofcorporate strategies and whose informationneeds does this serve). Organizations must takecare that they do not simply collect data for thesake of it, or only collect what is easy tomeasure.
Collecting Evidence and Data
By collecting both quantitative and qualitativedata, we are then able to begin assigningmeaning to the data. The systematic approachstarts with describing the attributes of a variableusing values. To explain, a variable might beparty affiliation; the different attributes could beDemocrat, Republican, or Independent. Valuesare then assigned to capture the data, e.g., 1 forDemocrat, 2 for Republican.
After data is captured numerically, the next stepis to understand what is called the “level ofmeasurement.” This refers to the relationshipamong the values that are assigned to theattributes for a variable. There are typically fourlevels of measurement (see Text Box 5):nominal, ordinal, interval, and ratio.
It’s important to recognize that the level ofmeasurement implies a hierarchy. At lowerlevels of measurement, assumptions tend to beless restrictive, and data analyses tend to beless sensitive. However, at each level up thehierarchy, the current level includes all of thequalities of the one below it, but also contributessomething new and value-adding. In general,higher levels of measurement (e.g., interval or ratio) are more desirable than lower levels(e.g., nominal or ordinal).
17
Text Box 5: Levels of Measurement
Nominal measurement: A party allegiance example characterizes anominal level of measurement, where the numerical values just “name”the attributes. No ordering or prioritization is implied. Numbers one andtwo for instance have no meaning, other than being shorthand forRepublican and Democrat. One is not superior to two, as two is notsuperior to three.
Ordinal measurement: When it comes to ordinal measurement,however, the attributes can be rank-ordered. So one might well besuperior to two, for instance, which might in turn be superior to three.That said, the intervals between the numbers are not necessarily equal. A good example is the star ratings of hotels (1-5 stars). In this measure,higher numbers mean better quality and more luxury. But the distancefrom 0 to 1 is not the same as from 3 to 4. The interval between values isnot interpretable in an ordinal measure. Likert scaling is an example of anordinal measurement that is used extensively within organizations. Likertscaling is a bipolar scaling method, measuring either positive or negativeresponses to a statement. Respondents might be asked to rate thefollowing on a five point scale ‘‘This supplier will go the extra mile for thecustomer.”
1 = Strongly disagree; 2 = Disagree; 3 = Neither agree or disagree; 4 = Agree; 5 = Strongly agree. Other scales such as 1-7 are alsocommonly used.
Interval Measurement: In interval measurement, the distance betweenattributes does have meaning. A good example is the Fahrenheit scale fortemperature. Here, equal differences on this scale represent equaldifferences in temperature, and the distance from 30-40 is same as thedistance from 70-80. The interval between values is interpretable.
Note, though, that Interval scales do not have a “true” zero point; it istherefore not possible to make statements about how many times higherone score is than another. Returning to the Fahrenheit example, atemperature of 30 degrees is not twice as warm as one of 15 degrees.
Ratio Measurement: In a ratio measurement, however, there is alwaysan absolute zero that is meaningful. It now becomes possible to constructa meaningful fraction (or ratio) with a ratio variable. Weight is a ratiovariable. In applied social research, most “count” variables are ratiomeasurements, for example, the number of clients in the past sixmonths. This is because you can have zero clients and it is meaningful tosay that “We had twice as many clients in the past six months as we didin the previous six months.” Other examples of ratio scales are length ortime, as well as temperature measured on a Kelvin scale. Thus, atemperature of 300 Kelvin is twice as high as a temperature of 150 Kelvin.

Ensuring Data Quality
At the outset of Step 2, we stated that data has to beof the right quality for it to become useful. Assessingits quality requires a robust assessment of itsreliability and validity (See also Text Box 6).
Reliability and validity can be substantially heightenedthrough applying the idea of “triangulation.” Simplyput, this involves collecting data using varioustechniques (e.g., interviews with board members,middle managers, and front-line workers) andmethodologies (e.g., survey 70% of your suppliersand interview 30%). This allows organizations tocontrast and compare the information gathered fromuse of the different techniques. The rationale behindthis is that the more information we have from asmany possible sources, the greater the likelihood thatit is reliable.
Meaningful sampling is another method of ensuring data quality. Indeed, in mostsurveys access to the entire population is almost impossible. However, the resultsfrom a survey with a carefully selected sample will reflect, extremely closely, those that would have been obtained had the entire population provided the data.Sampling, therefore, is a very important part of the data collection design process. Ifyou have surveyed using an appropriate sampling technique, you can be confidentthat your results can be generalized to the population in question. If the samplewere biased in any way, for example if the selection technique made selection ofolder people more likely than a selection of younger people, it would be inadvisableto generalize from the findings.
Planning Your Data Collection
Having a good understanding of the available data collection techniques, and beingaware of the importance of the levels of measurement, organizations can nowmove into the careful planning of their data collection strategy. This comprisesseveral decisions:
• Decide on the data collection method.
• Decide on the source of the data.
• Decide when the data will be collected, and in what sequence and frequency.
• Decide who is responsible for collecting the data.
• Decide who measures and reviews the data.
Decide on the data collection method: Before deciding how to collect the data,it is important to establish whether or not existing data can be used. It is important,though, to make sure that the existing data is of the appropriate quality. If appropriate
18 Evidence-based Decision Making: Using Business Intelligence to Drive Value
Text Box 6: Validity and Reliability
Validity is the degree to which a measurement actually measureswhat it is supposed to measure.
Reliability is the extent to which the same result is achieved when ameasure is repeatedly applied.
• • • •
. . . .. . . . .. . . . .. . . .
. . . . . . .. . . . .. . .... .
. . . . . .
. . .
. ..
. .
.. ... . .
.
. . . . . .
. . . .. .
. . . ..
. . .
. . . . . . . .. . . . ... . . .. . . . ..... ..
. . . .. . . . .. . . . . . . . . . . . ... ..
Reliable Valid Neither Reliable Both ReliableNot Valid Not Reliable Not Valid and Valid

data is not available or needs to be supplemented with more evidence, we canchoose the most appropriate data collection method from the suite of instrumentslisted in the Appendix.
Decide on the source of the data: At this stage, it is crucially important for thedesigner of an indicator to think about access to data (existing or new), and answerquestions such as: Is the data readily available? Is it feasible to collect it? Will thedata collection method, for example interviews with senior managers, providehonest information? If not, it might be appropriate to combine various datacollection methods.
Decide when the data should be collected, and in what sequence and
frequency: Here, the designer of an indicator thinks about when and how often the data for that indicator should be collected. Some indicators are collectedcontinuously, others hourly, daily, monthly, or even annually. It is important to decidewhat frequency provides sufficient data to answer the key analytics questions (as described in Step 1 of the model) and helps to support decision making.
Decide on who is responsible for collecting the data:
Here we identify the person, function, or external agency responsible for datacollection and data updates. The person responsible for measuring could be aninternal person or function within your organization or, increasingly, it can beexternal agencies, since many organizations outsource the collection of specificindicators. This is especially common for indicators such as customer satisfaction,reputation, brand awareness, and employee satisfaction.
Decide who measures and reviews the data: At this point, we identify theperson, function, or external agency responsible for data measurement and review.It is also important here to clarify whether there are any review or sign-off cycles. Itis common, for example, for one person to input the data and for another person tocross-check it or sign it off before release.
Role of IT Infrastructure and Applications in Collecting Data
The main role of IT infrastructure and software applications in collecting data is this.Software applications can help collect data, and data repositories are used to storethe data after collection. For example, software applications and web interfaces can be used to create survey tools that help to collect data directly from users.Furthermore, tools like sensors and applications can be used to collect operationaldata automatically. This can include, for example, automatic quality checks duringmanufacturing. A more innovative example come from a retailer who is using heatsensors to automatically detect the number of people waiting at the supermarketcheckout. If the system detects that the queues are getting too long, it sends amessage to staff to open more checkouts.
19
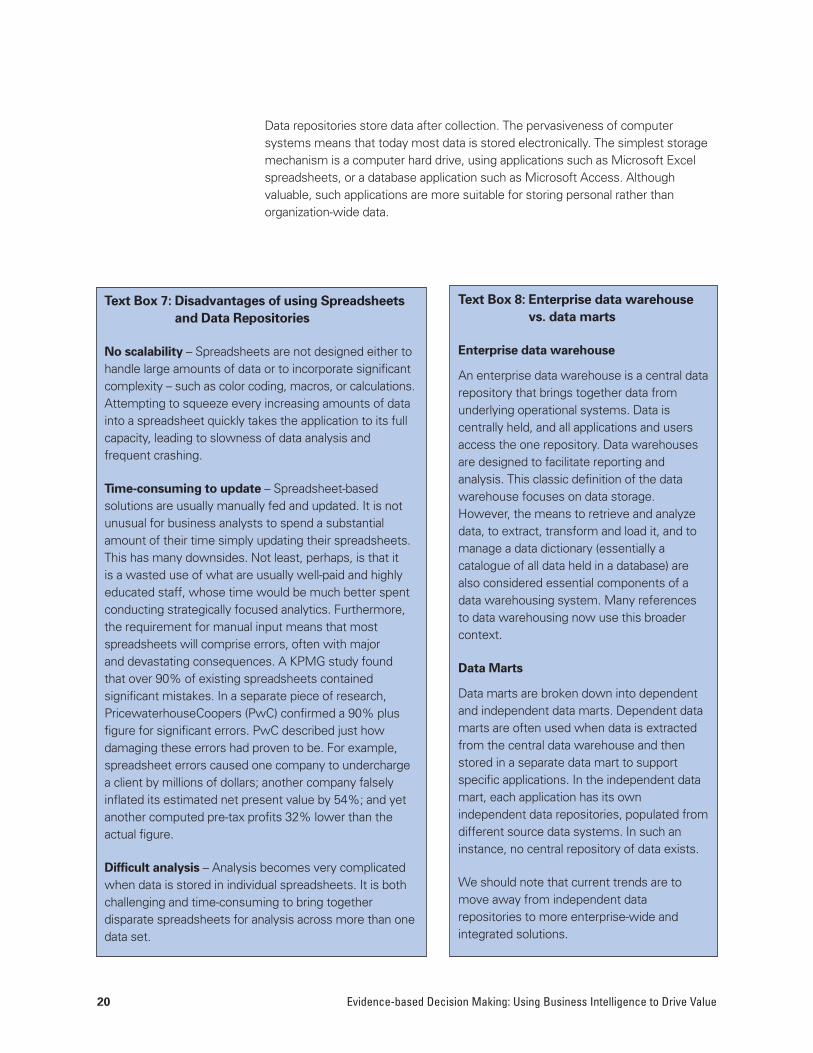
Data repositories store data after collection. The pervasiveness of computersystems means that today most data is stored electronically. The simplest storagemechanism is a computer hard drive, using applications such as Microsoft Excelspreadsheets, or a database application such as Microsoft Access. Althoughvaluable, such applications are more suitable for storing personal rather thanorganization-wide data.
20 Evidence-based Decision Making: Using Business Intelligence to Drive Value
Text Box 8: Enterprise data warehouse
vs. data marts
Enterprise data warehouse
An enterprise data warehouse is a central datarepository that brings together data fromunderlying operational systems. Data iscentrally held, and all applications and usersaccess the one repository. Data warehousesare designed to facilitate reporting andanalysis. This classic definition of the datawarehouse focuses on data storage.However, the means to retrieve and analyzedata, to extract, transform and load it, and tomanage a data dictionary (essentially acatalogue of all data held in a database) arealso considered essential components of adata warehousing system. Many referencesto data warehousing now use this broadercontext.
Data Marts
Data marts are broken down into dependentand independent data marts. Dependent datamarts are often used when data is extractedfrom the central data warehouse and thenstored in a separate data mart to supportspecific applications. In the independent datamart, each application has its ownindependent data repositories, populated fromdifferent source data systems. In such aninstance, no central repository of data exists.
We should note that current trends are tomove away from independent datarepositories to more enterprise-wide andintegrated solutions.
Text Box 7: Disadvantages of using Spreadsheets
and Data Repositories
No scalability – Spreadsheets are not designed either tohandle large amounts of data or to incorporate significantcomplexity – such as color coding, macros, or calculations.Attempting to squeeze every increasing amounts of datainto a spreadsheet quickly takes the application to its fullcapacity, leading to slowness of data analysis andfrequent crashing.
Time-consuming to update – Spreadsheet-basedsolutions are usually manually fed and updated. It is notunusual for business analysts to spend a substantialamount of their time simply updating their spreadsheets.This has many downsides. Not least, perhaps, is that it is a wasted use of what are usually well-paid and highlyeducated staff, whose time would be much better spentconducting strategically focused analytics. Furthermore, the requirement for manual input means that mostspreadsheets will comprise errors, often with major and devastating consequences. A KPMG study found that over 90% of existing spreadsheets containedsignificant mistakes. In a separate piece of research,PricewaterhouseCoopers (PwC) confirmed a 90% plusfigure for significant errors. PwC described just howdamaging these errors had proven to be. For example,spreadsheet errors caused one company to underchargea client by millions of dollars; another company falselyinflated its estimated net present value by 54%; and yetanother computed pre-tax profits 32% lower than theactual figure.
Difficult analysis – Analysis becomes very complicatedwhen data is stored in individual spreadsheets. It is bothchallenging and time-consuming to bring togetherdisparate spreadsheets for analysis across more than onedata set.

And yet, somewhat shockingly, research findings show that the vast majority oforganizations in both commercial and governmental (local and central) settings stillrely heavily on spreadsheet applications for their data storage needs. A quicksummation of the disadvantages to organizations of doing so, provided in Text Box 7, should discourage the reader from adopting or continuing this practice.
Today, data is usually stored in what we call a data warehouse. A data warehouse is a repository of an organization’s electronically stored data, making it moremanageable and accessible. Data warehouses essentially come in two formats: theEnterprise Data Warehouse (used by different parts of the organization for multiplepurposes), and the Data Mart (typically a single-function data warehouse used by asingle part of the organization, which exists dependent on or independent of theEnterprise data warehouse) (see also Text Box 8).
Organizations should ensure that their data warehouses do not become datadumps. It is important that stored data stays meaningful, and that people can easilyretrieve information that is relevant to their needs. We therefore recommendadoption of good practices, such as using logical groupings and data aggregation.As with physical warehouses, things that are not properly labeled will be difficult to find. Furthermore, although we want to avoid data redundancies and datareplication, we do need adequate replication for security purposes. It’s also importantthat security systems and processes ensure that the data – an extremely valuableasset in any EbM organization – remains safe.
21

3. Analyzing Data
After ensuring that we are collecting the right data, we need to turn this data intoinsights and information. Step 3 of the five-step EbM framework focuses on turningdata into information. To put data into context, we need to analyze it. Data analysisis a core requirement in creating evidence used for decision making. Yet repeatedresearch shows that most organizations are still more focused on simply collectingand distributing data than they are in doing any meaningful analysis. Research bythe Hackett Group finds that while world-class finance organizations (classified astop quartile performers in both the effectiveness and efficiency dimensions) spend40% less time collecting and compiling data than they do analyzing data. non-worldclass organizations spend less time on analysis than on data collection.
Analysis to Support Strategy
In Step 1 of the EbM framework, we stressed the importance of ensuring thatanalysis supports a core strategic objective of the enterprise. A powerful caseexample of this is provided by the US leading car rental company, Enterprise Rent-A-Car. Enterprise Rent-A-Car has an unmovable conviction that only through thedelivery of outstanding customer service will it secure sustainable competitiveadvantage in what is a very crowded and competitive market. The organizationdoes not want to be the biggest in the business, but the best in the eyes of thecustomer. A commitment to customer service excellence has been a hallmark ofthe organization since its founding in 1957. Indeed, the market researchorganizations, J.D. Power and Associates and Market Metrix, have repeatedlynamed Enterprise Rent-A-Car number one in customer satisfaction in the car rentalindustry. The organization has created a unique way to measure customersatisfaction. It has created an Enterprise Service Quality index (ESQi) that hinges ontwo simple words: completely satisfied. Each month, the organization measurescustomer satisfaction at each local branch through telephone surveys of hundreds
22 Evidence-based Decision Making: Using Business Intelligence to Drive Value
1. DefiningObjectives and
InformationNeeds
What are ourstrategic aims?
Based on thoseaims, what do we
need to know?
Can we clearlyarticulate ourinformation
needs?
Who needs toknow what,
when and why?
2. Collecting Data
Do we have orcan we collectmeaningful andrelevant data to meet ourinformation
needs?
3. Analyzing Data
How can we turnthe data into
relevant insights?
How can we put the data
into context andextract
information?
4. PresentingInformation
How can we best present
and communicatethe insights
and information to inform
decision makers?
5. MakingEvidence-Based
Decisions
How do weensure that the
availableevidence is usedto make the best
decisions?
How do we create a
knowledgeable-to-action culture?
How do we avoid the
knowing-doinggap?
IT Infrastructure and Business Intelligence Applications as Enablers
How do we best leverage our information technologyinfrastructure and our business intelligence applications
to support evidence-based decision making?
▲ ▲ ▲ ▲
▲▲ ▲▲ ▲▲
of thousands of customers. Using a 5-point scale (see information on the Linkertscale in the previous step), the organization asks a simple question: “How satisfiedwere you with your last experience?”
Each branch earns a ranking based on the percentage of its customers who saythey were completely satisfied. The organization calls that ranking “top box,” andthat becomes the standard of excellence it sets for itself when working withcustomers. Note, however, that in its analysis Enterprise Rent-A-Car only countsthe respondents who are completely satisfied. Internal research had shown thatcustomers that are completely satisfied are three times more likely to return as acustomer. The company now focuses on driving up the frequency of this responseto this question. Having validated the results over time, the company now doesn’tneed to store the responses to the other four scale items.9
Recognizing that there is a difference between customers who are completelysatisfied (or in the following case, who are very satisfied) and those who are justsatisfied was uncovered as early as the mid-1990s by research by Rank Xerox (thenthe European arm of the Xerox Corporation). Rank Xerox found that a significantpercentage of customers who said they were satisfied still defected to theircompetitors at the end of the contract. This was not so of very satisfied customers,the vast majority of whom remained loyal. Deeper analysis found that certaincharacteristics of the relationship that very satisfied customers had with Rank Xeroxsignificantly heightened the likelihood of their continuing their patronage. Armedwith this knowledge, Rank Xerox could then work to imbue those characteristicsmore widely into its relationship with customers.
Both the Enterprise Rent-A-Car and Rank Xerox examples highlight a commonproblem with the ordinal measurement scale. Too often, companies lump togethersatisfied and very satisfied data in the mistaken belief that characteristics of the twogroups are similar. They are not – and believing that they are can lead to grievouserrors in decision making. Indeed, in many instances the distance between satisfiedand very satisfied might be substantially greater than the distance from neutral tosatisfied.
The Text Boxes 9a and 9b in this section outline a number of analytical techniquesthat might be applied as part of EbM.
Analysis to Test Your Strategy
A practical illustration of how an organization’s hypothesis regarding the drivers ofstrategic success proved false (as observed through implementation), considerBanking 365, the remote banking arm of the Bank of Ireland, launched in 1995 andtherefore an early example of a remote bank. Banking 365’s senior team crafted astrategy based on a person-to-person, differentiated service – essentially ensuringthat its operations delivered outstanding services to its customers, which they didconsistently.
Although this strategic focus led to extremely high levels of customer satisfaction,the downside was that costs became unacceptably high. There was a disconnect
23

between customer satisfaction and financial success. So the leaders ofBanking 365 faced a conundrum. How could they continue to achieveexceptionally high customer satisfaction scores while keeping costs toan acceptable level?
Banking 365 therefore introduced self-service options for customers(almost unheard of in the mid-1990s), who could still deal with anoperator directly if they wished. The Operations Director commentedthat it was through the use of a strategy framework that they werequickly able to detect a problem with the strategy. “Therefore we wereable to introduce a different strategic approach early on and monitor itssuccess,” he said.
Experimentation as a Way Forward
In applying the scientific method that underpins the EbM framework,we are much more interested in the creation of scientific evidence than in just evidence (see definitions in the previous step). A usefuldemonstration of the difference between evidence and scientificevidence-based analysis was provided by Bill James in his bookMoneyball. James focused his research on the sport of baseball. Hechallenges the long-held notion that baseball experts and talent scoutscould spot the best talent simply by watching them play. Put anotherway, he questioned the conventional wisdom that the naked eye of anexpert provided sufficient evidence of the ability level of a baseballplayer.
James argued that simple observation was not it itself sufficient todifferentiate a .300 hitter from a .275 hitter (for non-baseball enthusiasts,this is a difference of one hit every two weeks), claiming that ifsomeone watched a game during the season, there would be a 40%chance that the .275 hitter will have more hits than the .300 hitter in thatgame.
James instead created a new formula that put much more emphasis ona player’s on-base percentage, which gives higher ratings to thoseplayers who tend to walk more often. His formula was: Runs Created =(hits + walks) x total bases / (at bats + walks). The validity of thisapproach was shown when the general manager of the baseball teamthe Oakland As decided to work with James and track new talent basedon hard (or scientific) evidence. This allowed the Oakland As to hireplayers like Jeremy Brown, who were considered by traditional scoutsas “too fat,” who then proved to perform well.
Essentially, James ran an experiment to test an assumption – in thiscase that the naked eye (even an expert’s naked eye) was sufficient toidentify great ball players.
24 Evidence-based Decision Making: Using Business Intelligence to Drive Value
Text Box 9a: Practical Analysis Examples (1)
Marketing and Sales Analysis: Here,organizations are using analytics to betterunderstand their markets and their customers.Examples here include retailers like Tesco, one of the big success stories in the industry. Tesco is a very active user of its club card data (a verysuccessful loyalty card scheme that allows Tescoto collect detailed data on each of their users),which allows the retailer to understand changingconsumer trends and buying patterns. It alsoallows Tesco to tempt individual customers withmuch more targeted and customized offers.
Click Stream Analysis: Web sites are able togenerate large amounts of click stream data tounderstand how each visitor has navigated(clicked) through their site, what buttons they hit,how much time they spend on each page, etc.No traditional organization is able to collect thatsame level of detail about how customersbrowse its store, the exact route they take beforethey make (for example) a purchasing decision,where they pause, and even the exact pointwhen they might change their minds or abandontransactions. Click stream analysis can lead tovery powerful insights that allow organizations tooptimize their websites.
Quality Analysis: Since the awakening of thetotal quality movement in the 1980s, qualityanalysis has been an important component in most firms. Based on data from massmanufacturing, tools such as Six Sigma are now also used in service organizations. Itbasically uses statistics to understand variationsin performance levels. This then allowsorganizations to set much more precise qualitytargets, and understand (a) what levels areacceptable, and (b) normal fluctuations in quality.Tools such as statistical process control, SixSigma, and other quality analytics are not justused to monitor an organization’s ownperformance, but also to design and measureperformance contracts with suppliers using, forexample, service level agreements.

Organizations should conduct many more experiments to test assumptions. Inapplying the EbM framework, testing or experimenting is essential to our ability toprove or disprove a hypothesis. Scientific testing requires the complete removal ofbias (it is clear to see how people who have spent much time developing a newproposition, service, or product might be inclined – even unconsciously – to a biassufficient to “prove” their hypotheses).
Organizations can learn much from long-established experimenting approachesused within medical industries, such as pharmaceuticals. In a medical trial, theeffectiveness of a new drug or medicine is tested scientifically. The newdrug/medicine is administered to one group of patients suffering from thecondition. Another group of sufferers (the control group) receives a placebo. The results from both groups provide an unbiased view of the drug/medicine’sbenefits. Such experimentation can lead to surprising findings. For example, thedrug Buproprion (marketed under several names, one being Zyban) was developedas an anti-depressant. However, medical trials found that some of the patientswho had taken the drug were able to stop smoking. It was later certified for saleas an aid for those who wished to stop smoking, as well as an anti-depressant.
A best practice example of an organization that makes good use of experiments isYahoo! Inc. The organization receives many millions of hits to its home page eachhour. To test new assumptions (in this case that making a certain alteration to thehome page will change behaviors of visitors) they randomly assign one or twohundred thousand users to an experimental group and have several million othervisitors as a control group. By doing so, they can quickly see whether or not thealterations to the home page leads to the assumed change in the behavior of thecustomer. This in turn allows them to optimize their offerings to enhance revenuesand profits. The results of these experiments can often be seen within minutes,and Yahoo! typically runs about 20 experiments at any given time. This way, theresults of the analysis drive behaviours, cutting out lengthy discussions aboutwebsite design best practices, which of course can be extremely subjective and biased.
Role of IT Infrastructure and Applications in Analyzing Data
Since first becoming available in the late 1980s/early 1990s, BI applications havebeen used to enable the analysis of, and the extraction of insights from, data. Some generic BI applications enable consistent and reliable data manipulation andreporting capability. However, many tailored applications are now available toperform specific analysis in areas such as customer profitability and supply chainoptimization.
An early decision is whether to purchase a BI application (that is, a packagedsolution that is purchased from a vendor and comes with preconfigured software,data transformation, management, and access in a single package, usually withbusiness models), or to build your own. The make or buy decision hinges onwhether the required packaged solution exists, and whether the level of skillsrequired to build your own exist within the organization. But research shows that
25
Text Box 9b: Practical Analysis
Examples (2)
Budgeting and Planning: The rightanalytics allow organizations to producemuch more precise forecasts andbetter predict future revenues, profits,cash flows, etc. For example, Hewlett-Packard has created a sophisticatedalgorithm to better predict monthly andquarterly revenues. Their (then) CFOnoted, “It is reassuring to have a solidprojection algorithm. It’s crisper andcleaner, it has rigor and methodologyas opposed to my own algorithm.”
Reporting and Consolidation: Havingthe right available data and appropriateanalytics capabilities can enableorganizations to consolidate theirinformation and automate theirreporting. A good example ismultinational IT company Dell, who isable to “close their books” in just oneworking day, and is able to produce theconsolidated accounts after eachworking day.
Value Driver Modelling: One type ofanalytics that is becoming increasinglypopular is value-driver modelling.Organizations have realized over theyears that financial indicators such asearnings per share, net income, oreconomic return on invested capital arenot reliable predictors of futureperformance (e.g. market value of acompany). Many organizations havestarted to create more comprehensivemodels of value creation to includesome of the more intangible drivers offuture performance. They useapproaches such as multiple regressionanalysis to understand how variouselements such as brand reputation,customer service, or staff engagementmight drive future performance.

it generally pays to go for packaged applications. According to the IT research firmIDC, projects that implement packaged analytical applications yield a median ROI of 140%, while custom-built analytical applications yield a much lower 104% ROI.
BI tools are a type of application software designed to report, analyze, and presentdata. The tools generally read data that have been previously stored in a datawarehouse, a data mart, or in some other facility.
BI tools allow users to perform the types of analysis we referred to in Part 3 of thisMAG. Examples include:
• Reporting and querying software (tools that extract, sort, summarize, andpresent selected data)
• Dashboards - these can be a simple and static visual display of performance, butin their most advanced forms are fully interactive, allowing drill-down analysis.Advanced dashboards are often tightly integrated with OLAP tools.
• OLAP (usually used by advanced users, they make it easy for users to look atthe data from multiple dimensions) – see Text Box 10.
• Data mining (used for finding correlation among different factors).
• Text mining tools (allow companies to extract key elements from largeunstructured datasets, mainly text, discover relationships, and summarize theinformation. Text accounts for about 85% of an organization’s information store.
Analytical software tools enable an effective and comprehensive analysis of data.Such software provides the data analyst with many capabilities. Forinstance,interactive drill-down capabilities provide a simple and intuitive way of exploringand analyzing performance data. Moreover, many of the software applicationscome with powerful graphics capabilities that go far beyond what ordinaryspreadsheet applications can deliver. We explained in Step 3 that being able tovisualize data is powerful for data presentation reasons; it is also of great value atthe analysis stage.
Other important capabilities offered through BI software include the ability (a) toconduct root-cause analysis (that is, it finds the root cause of a problem), and also(b) to model and assess correlations or regressions in causal models. So, if anorganization has built causal models (at the highest level), it might model thedrivers of strategic success as described in a framework such as the ValueCreation Map or a balanced scorecard. BI tools can be used to test and validateassumed relationships. As a simple example, how true is our assumption thatincreases in staff customer service training positively impact customer loyalty? Insome of the analytical applications, users are able to create simulations based ontheir cause-and-effect logics, but note that a lot of quantitative data is required tomake such simulations meaningful.
Often, data has to be viewed from different perspectives, and a sophisticatedtechnique is needed to explore accumulated data. Multidimensional analysis toolsusually perform this task, enabling the easy visualizing and analyzing of business
26 Evidence-based Decision Making: Using Business Intelligence to Drive Value
Text Box 10: OLAP Analysis tools
OLAP (On-Line Analytical Processing)tools are often used to make sense ofmultidimensional data. Author andconsultant Nigel Pendse has coined theacronym FASMI (Fast Analysis ofShared Multidimensional Information)to describe OLAP capabilities.
FAST means that the system istargeted to deliver most responses tousers in less than five seconds, withthe simplest analyses taking no morethan one second and very few takingmore than 20. Although Pendse saysthat this often proved problematic inorganizations, he asks, ”If Google cansearch a large proportion of all the on-line information in the world in aquarter of a second, why shouldrelatively tiny amounts of managementinformation take orders of magnitudelonger to query?”
ANALYSIS means that the system can(a) cope with any business logic andstatistical analysis that is relevant forthe application and the user, and (b) keep it easy enough for the targetuser to understand.
SHARED means that the systemimplements all the securityrequirements for confidentiality.
MULTIDIMENSIONAL. The systemmust provide a multidimensionalconceptual view of the data, includingfull support for hierarchies and multiplehierarchies, as this is the most logicalway to analyze businesses andorganizations.
INFORMATION is all of the data andderived information needed, whereverit is, and however much of it is relevantfor the application.

metrics across different points of view. These tools are linked to a graphical userinterface that presents the results on the computer screen in tables or graphs.
Multidimensional technology plays a significant role in BI by enabling users to make business decisions. This is done by creating data models that reflect thecomplexities found in real-life structures and relationships. It consolidates andpresents summarized corporate information from a multitude of sources.
4. Presenting Information
We will now consider Step 4, presenting information. We stress throughout thisMAG that it is crucial, when analyzing data, to keep the target audiences and theirspecific needs in mind. After all, organizations gain competitive advantage whenthe right information is delivered to the right people at the right time.
In Step 2, we described the core responsibilities of the people who designperformance indicators. The designer must identify the main audiences for the dataand their exact information needs. It is important to note that indicators can havedifferent audiences, with different needs. It is therefore usually sensible to identifyprimary, secondary, and tertiary audiences. The primary audience will be thosedirectly involved in the decision making related to the strategic element beingassessed. The secondary audience might be other parts of the organization thatwould benefit from seeing the data. A possible tertiary audience could be externalstakeholders.
But it is crucial that the information presented is relevant to that audience. Earlier inthis MAG, we cited the Hackett Group’s view that world-class finance organizationsprepare smaller, more focused reports than do their peers. It is far too easy tocreate large reports for different groups, and reports that are too detailed. The fatring-binders that were once popular at the Canadian courier Purolator are still thenorm in many organizations.
27
1. DefiningObjectives and
InformationNeeds
What are ourstrategic aims?
Based on thoseaims, what do we
need to know?
Can we clearlyarticulate ourinformation
needs?
Who needs toknow what,
when and why?
2. Collecting Data
Do we have orcan we collectmeaningful andrelevant data to meet ourinformation
needs?
3. Analyzing Data
How can we turnthe data into
relevant insights?
How can we put the data
into context andextract
information?
4. PresentingInformation
How can we best present
and communicatethe insights
and information to inform
decision makers?
5. MakingEvidence-Based
Decisions
How do weensure that the
availableevidence is usedto make the best
decisions?
How do we create a
knowledgeable-to-action culture?
How do we avoid the
knowing-doinggap?
IT Infrastructure and Business Intelligence Applications as Enablers
How do we best leverage our information technologyinfrastructure and our business intelligence applications
to support evidence-based decision making?
▲ ▲ ▲ ▲
▲▲ ▲▲ ▲▲

Earlier, we outlined the importance of the right reporting frequency; a great indicatoris of little use if that information gets to its audience too late for timely decisionmaking. The designer of the indicator must also consider reporting channels – thatis, the identification of the outlets or reports that are to be used to communicatethe data. An indicator can, for example, be included in the monthly performancereport to the executive management committee, or included in the quarterlyperformance report to the board. It might be required for the weekly performancereports to heads of service, or might be reported on the organizational Intranet, ormade available to external stakeholders through external reports or the website.
It is important to cross-check the identified reporting channels with the reportingand measurement frequency to ensure that they are aligned and that data isavailable in time.
The designers of indicators must also consider reporting formats, thus decidinghow best to present the data. As examples, data can be shown as a number, anarrative, a table, a graph, or a chart.
The designers of indicators might also consider notifications and workflows. Toexplain, workflows are predefined and automated business processes in whichdocuments, information, or tasks are passed from one person or group of personsto others. Notifications are predefined and automated messages that point perfor-mance data, messages, or alarm notifications directly to predefined individuals or
groups. Defining possible workflows and notifications is especiallyuseful as a first step toward automation, using performancemanagement software applications. For example, e-mail notificationsor workflows could be automatically triggered (a) if an indicatorrequires updating, or (b) to tell a specific audience that new data isavailable or that an indicator has moved over or below a predefinedthreshold
Visualizing Data
Let’s look in more detail at presentation formats. We will stress that,in engaging the minds of the target audience, it is crucial that thevisual presentation tools are clear, informative and compelling. Keepin mind that about 70% of the sense receptors in our body arededicated to vision. “Vision is by far our most powerful sense.Seeing and thinking are intimately connected.” 10
In displaying information, we would recommend always starting withthe key analytics question (KAQ) that the data/information sets out toanswer. This provides context to what will follow. It should alsoensure that the report is focused squarely on meeting a criticalinformation need of the target audience, thus avoiding any inclinationto focus on “interesting” rather than “valuable” information.
The KAQ should be followed by meaningful graphs and charts.Graphs are the most widely used visual display tools used in
28 Evidence-based Decision Making: Using Business Intelligence to Drive Value
Text Box 11: When to use which graph
Bar graphs, which can display multiple instances,provide for easy comparison between adjacentvalues. They are particularly good for nominal orordinal scales.
Line graphs can best display time series data, e.g.,the share price or quality fluctuations over a givenperiod. However, a line graph is not suitable for datain nominal or ordinal scales. What it does do well isshow trends, fluctuations, cycles, rates of change,and comparing two data sets over time.
Pie charts highlight various data as a percentage ofthe total data, each segment representing aparticular category. They are generally not suitablefor more than six components or when the values ofeach component are similar, because it makes it toodifficult to distinguish between the values.
Scatter plots are useful for depicting the correlationbetween two sets of data and showing the strengthand direction of that relationship.

organizations. Many different types of graphs can be deployed to conveyinformation. These include, for example, pictographs, tally charts, bar graphs,histograms, scatter plots, line graphs, and pie charts.
Each chart has a different purpose, and should therefore be used appropriately. See Text Box 11.
Graphs provide many benefits for conveying information. They are quick and direct,highlight the most important facts, facilitate an easy understanding of the data, andcan be easily remembered. Here are some more generic tips for producing graphs:
• Keep them simple and focus on the message the user needs to receive.
• Try to avoid 3-dimensional graphs – they are harder to read.
• Use emphasis colors (e.g., bright red, yellow, orange, or green) rarely, and onlywhere you want to highlight specific issues.
• Don’t use too many different varieties of graphs, because an analysis acrossdifferent graphs is difficult.
• Try to avoid any unnecessary decorations, background colors, etc. Any additionaland unnecessary elements just distract us and make it harder to extract theinsights.
Placing a graph directly after a KAQ is a great of way of quickly showing progress inanswering that question. Note, however, that graphs should not be used when thedata is widely dispersed, when there is not enough data (one, two, or three datapoints), when the data is very numerous, or when the data shows little or novariation.
Headlines and Narratives
Flowing down from the graphs, a good report should then use narratives and“headlines.” A headline summarizes the main finding from the data, whereas the narrative puts context around and provides meaning to it. Using graphs andnarrative together enable the telling of the story, which neither can fully do inisolation. For instance, a graph containing past performance is extremely useful for analyzing trends over time, but a narrative can put context to the graphicalinformation – explaining why the trend is as it is. This highlights the importance ofusing both quantitative and qualitative data. If you feel you need to include the rawdata in numbers and tables, keep them separate, for example in an appendix).
Performance Dashboards
Over the past few years, we have seen the growth in use of performancedashboards. These are visual displays of “The most important information neededto achieve one or more objectives which fit entirely on a single computer screen so it can be monitored at a glance.”11
29
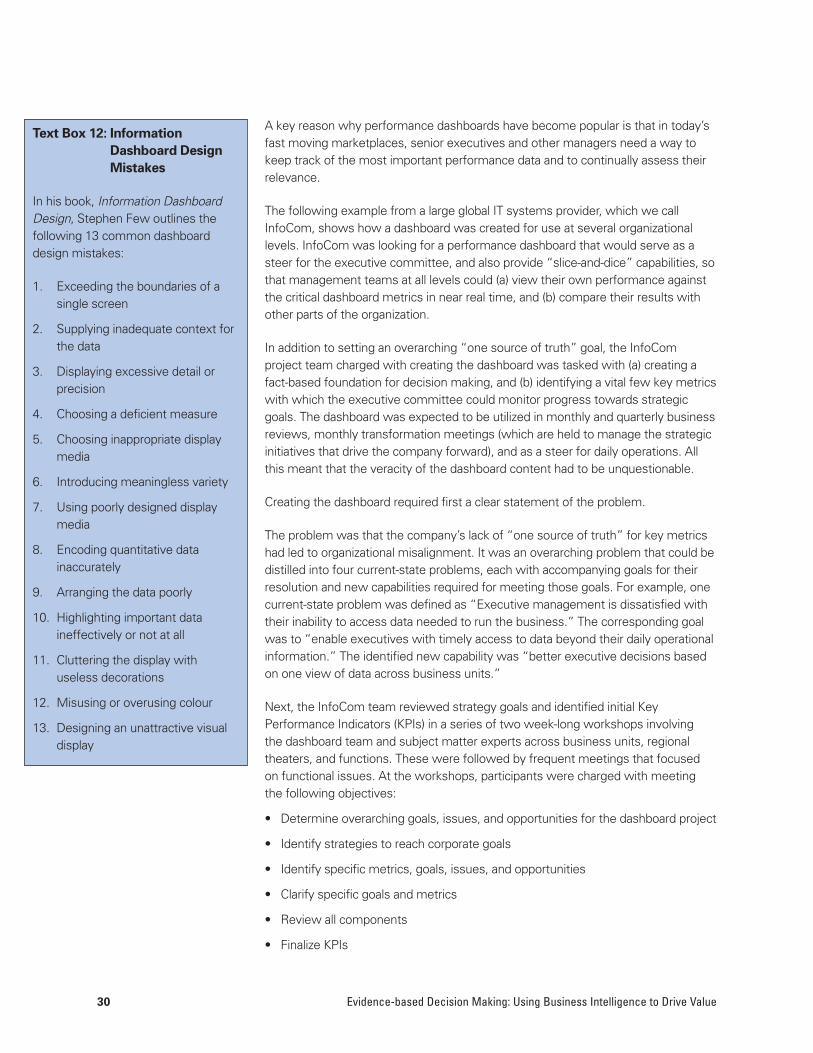
A key reason why performance dashboards have become popular is that in today’sfast moving marketplaces, senior executives and other managers need a way tokeep track of the most important performance data and to continually assess theirrelevance.
The following example from a large global IT systems provider, which we callInfoCom, shows how a dashboard was created for use at several organizationallevels. InfoCom was looking for a performance dashboard that would serve as asteer for the executive committee, and also provide “slice-and-dice” capabilities, sothat management teams at all levels could (a) view their own performance againstthe critical dashboard metrics in near real time, and (b) compare their results withother parts of the organization.
In addition to setting an overarching “one source of truth” goal, the InfoComproject team charged with creating the dashboard was tasked with (a) creating afact-based foundation for decision making, and (b) identifying a vital few key metricswith which the executive committee could monitor progress towards strategicgoals. The dashboard was expected to be utilized in monthly and quarterly businessreviews, monthly transformation meetings (which are held to manage the strategicinitiatives that drive the company forward), and as a steer for daily operations. Allthis meant that the veracity of the dashboard content had to be unquestionable.
Creating the dashboard required first a clear statement of the problem.
The problem was that the company’s lack of “one source of truth” for key metricshad led to organizational misalignment. It was an overarching problem that could bedistilled into four current-state problems, each with accompanying goals for theirresolution and new capabilities required for meeting those goals. For example, onecurrent-state problem was defined as “Executive management is dissatisfied withtheir inability to access data needed to run the business.” The corresponding goalwas to “enable executives with timely access to data beyond their daily operationalinformation.” The identified new capability was “better executive decisions basedon one view of data across business units.”
Next, the InfoCom team reviewed strategy goals and identified initial KeyPerformance Indicators (KPIs) in a series of two week-long workshops involving the dashboard team and subject matter experts across business units, regionaltheaters, and functions. These were followed by frequent meetings that focusedon functional issues. At the workshops, participants were charged with meeting the following objectives:
• Determine overarching goals, issues, and opportunities for the dashboard project
• Identify strategies to reach corporate goals
• Identify specific metrics, goals, issues, and opportunities
• Clarify specific goals and metrics
• Review all components
• Finalize KPIs
30 Evidence-based Decision Making: Using Business Intelligence to Drive Value
Text Box 12: Information
Dashboard Design
Mistakes
In his book, Information DashboardDesign, Stephen Few outlines thefollowing 13 common dashboarddesign mistakes:
1. Exceeding the boundaries of asingle screen
2. Supplying inadequate context forthe data
3. Displaying excessive detail orprecision
4. Choosing a deficient measure
5. Choosing inappropriate displaymedia
6. Introducing meaningless variety
7. Using poorly designed displaymedia
8. Encoding quantitative datainaccurately
9. Arranging the data poorly
10. Highlighting important dataineffectively or not at all
11. Cluttering the display withuseless decorations
12. Misusing or overusing colour
13. Designing an unattractive visualdisplay

An important function of the workshop team was to formulate standard definitionsof measures. For instance, although everyone thinks they know what “revenue”means, creating a very specific definition is actually quite challenging. The teamrecognized, however, that it was very important to reach a consensus if thedashboard were to work effectively.
Furthermore, for each metric (a) a target was set, (b) the data source identified, (c) the extraction frequency defined, (d) how the metric could be sliced (e.g., bybusiness unit, theater), and (e) a contact name for that metric listed determined.
In the end, the balanced dashboard created in the workshops comprised the fourperspectives:
• Sales: metrics such as pipeline dollars and win-rate percentage dollars
• Finance: metrics such as customer revenue and forecasted orders for newbusiness
• Human Resources: metrics such as open requisitions and attrition
• Transformation: metrics such as those used for enterprise-wide strategicprojects
InfoCom has created a browser-based dashboard that runs on Internet Explorer. Itenables a daily cross-theater, cross-business unit, and cross-functional performancesnapshot of the company. About 80% of the metrics are updated each day, andpeople can see performance from multiple “slices and dices” based on theirrequirements. It is now possible for managers and executives to view theperformance of individual units, or to see performance comparisons betweenbusiness units and theaters, or any combination they wish.
Given the speed of change in the markets in which InfoCom operates, thedashboard cannot be cast in stone, and will need to change in the future. For thisreason, a steering committee of high-ranking company managers has beenappointed to oversee its usage. A key role of this senior team is to control theamount of information in the dashboard, attempting to limit it to between 30 and 40 metrics. And as new metrics come in, others are cycled out to keep thedashboard relevant and strategically focused.
Tracking performance to dashboard objectives and metrics is usually done throughthe use of traffic lights or speedometer dials. The red, amber, green traffic lightconvention has become a popular way to show whether an organization is ahead oftarget (green), within a specified target (amber), or below target (red). A key benefitof traffic lighting is that identifying where performance is off target can trigger anexception report and an initiative to improve performance.
As an example, the City of Christchurch Council, New Zealand, has an on-linedashboard that includes a traffic light reporting component, which helps focus thereports delivered to the executive team. The senior team receives a high level one-page overview of performance, followed by a detailed list of exceptions (resultsflagged as amber or red, plus options and recommendations provided by managers
31

to deal with these results). This focuses leadership on the “vital few” pieces ofinformation that must drive decisions.12
Role of IT Infrastructure and applications in presenting information
The key role of IT and software applications is to help engage people in theinformation. Data and information can be brought to life through powerfulcommunication and collaboration features that use graphical user interfaces. For example, dashboards can be used to create visually rich displays so that userscan understand information at a glance. These displays are often automaticallyupdated based on the latest available data. Color coding and intuitive displays allowusers to understand the key messages. Most of the applications available today are web-based, which means that only an internet browser is needed to view theinformation. Many of the tools have powerful graphics engines to enable users toproduce a number of different charts and graphs in order to present the informationin the most appropriate and easy to understand format.
5. Making Evidence-Based Decisions
In this final step, we look at how to turn the information into (a) knowledge, and (b) better decisions that we can act on. Let’s look at an example. In the last fiveyears, the apple crop in Somerset, England has grown by 10% per annum. Overthe next year, the crop is predicted to grow by a further 10%. Therefore, theorganization has to find markets for the 10% more apples that will be grown. Theinformation (trend analysis data of five years of growth in the apple crop) has beenused as the basis for deciding to predict the same percentage crop growth over the following year. Both the decision and prediction can be correctly described as“knowledge,” in that they are outcomes of an analysis of available information.
32 Evidence-based Decision Making: Using Business Intelligence to Drive Value
1. DefiningObjectives and
InformationNeeds
What are ourstrategic aims?
Based on thoseaims, what do we
need to know?
Can we clearlyarticulate ourinformation
needs?
Who needs toknow what,
when and why?
2. Collecting Data
Do we have orcan we collectmeaningful andrelevant data to meet ourinformation
needs?
3. Analyzing Data
How can we turnthe data into
relevant insights?
How can we put the data
into context andextract
information?
4. PresentingInformation
How can we best present
and communicatethe insights
and information to inform
decision makers?
5. MakingEvidence-Based
Decisions
How do weensure that the
availableevidence is usedto make the best
decisions?
How do we create a
knowledgeable-to-action culture?
How do we avoid the
knowing-doinggap?
IT Infrastructure and Business Intelligence Applications as Enablers
How do we best leverage our information technologyinfrastructure and our business intelligence applications
to support evidence-based decision making?
▲ ▲ ▲ ▲
▲▲ ▲▲ ▲▲
The Best Use of Information
Yet, just as we caution care in how organizations analyze data sources (for example,that they should not be overly concerned with quantitative data only), we alsosuggest a certain circumspection in the use of information for decision making. We often find a predisposition to make important decisions based on a very narrowinformation set. Consequently, erroneous decisions can be made that havedamaging, and sometimes catastrophic, consequences. Often, managers are insuch a rush to gain performance advantages from “proven” approaches that theyfail to ensure consideration of other information when making decisions.
This failure was well illustrated by Stanford University Professors Jeffrey Pfefferand Robert Sutton in their seminal 2006 book on EbM. Based on observing thepractices of many organizations, the authors point to a number of poor decisionsthat might result from relying too heavily on a narrow field of information. Forinstance, they highlighted mistakes made by firms within the US automotiveindustry in the use of process benchmarking (through which an organization studiesand replicates, for its own use, a best practice process of another firm) to learn thebasis for the successes of their Japanese counterparts. Note that with their marketshare and profit margins under great pressure from the successes of far eastern carmanufacturers, US companies were certainly keen to understand, capture, andreplicate the successes of their Asian competitions.
The authors described how the US companies tried to embrace Toyota’s totalquality management approach (which is called the Toyota Production Systems –TPS – and which works systemically to eliminate waste, implement make-to-use,and have the people who know the work solve the problems). However, in theirhaste the US organizations ignored critical performance facts that were much widerthan the techniques and practices they observed, thus leading to either failure or atbest partial success. The fact is that the TPS techniques that the US visitors saw ontheir benchmarking tours – the kanban cards, andon cords, and quality circles (asexamples) – represented only the surface of TPS but not its soul. The ToyotaProduction System is more about philosophy and perspective, taking into accountpeople, processes, quality, and continuous improvement. To an extent, it is acultural mindset and not just a set of easily replicable techniques or practices. Inthis instance, the US companies were interested only in information pertaining toprocess steps. As a result, they did not gain enough information to see the wholepicture – which would have enabled knowledge-based decision making.
Process benchmarking can, however, be a powerful aid to decision making.Sometimes, through, this requires thinking “outside the box.” A good example isthe US-headquartered facilities management firm, Johnson Controls, which hasbuilt a robust 15-step process benchmarking model to drive world-class innovation.Johnson Controls had a client that wanted to improve its landscaping activities.Rather than look at the available examples from the campuses of other commercialorganizations, Johnson Controls studied and adopted the best practices from a golfcourse – because landscaping was their core business. It therefore looked morewidely for information to turn into knowledge.
33
Often, managers are in such a rush to
gain performanceadvantages from
“proven” approachesthat they fail to ensureconsideration of other
information whenmaking decisions.

Other inappropriate practices that Pfeffer and Sutton identify in the use ofinformation for decision making include doing what (seems to have) worked in the past and following deeply accepted yet unexamined ideologies.
Knowledge must be drawn from the best available information, which will likelycome from many sources. In their book, Pfeffer and Sutton provide a powerfulexample of turning information into actions. However, this example comes not froma company, but rather from the personal experience of a celebrated organizationalleader.
Until 2005, Dr. Andy Grove was chairman of the microcomputer giant Intel – andhad previously been its CEO – and indeed was one of its first employees. In 2005,Dr Grove was diagnosed with prostrate cancer. His response was to assiduouslytrack down all the data he could find to compare the treatment options for theillness with their risks and benefits. From this analysis of a wide pool of data, heplaced himself in the best position to decide on an appropriate course of treatment.This is EbM in practice. He didn’t just simply follow a prescribed course, but rather analyzed all the available data and information to find the best fit for hiscircumstances and requirements. Today, Dr. Grove serves as an advisor to theexecutive leadership of organizations and is a board member of the Prostate CancerFoundation. In another arena, Dr Grove made a comment that should be taken intoaccount by any organization that wishes to take EbM seriously. “Let’s think forourselves. Let’s not repeat mindlessly ... suppositions that are true merely becausesomebody else says they are.”13
Dr. Grove’s comment fits nicely with the following quotation, which serves as a useful description of how EbM is not simply a step-by-step process fortransforming known data in knowledge, but rather represents a mindset shift inhow organizations seek and apply data. “Evidence-based management requires amindset with two critical components: first, willingness to put aside belief andconventional wisdom – the dangerous half-truths many embrace – and instead hearand act on the facts; second, an unrelenting commitment to gather the facts andinformation necessary to make more informed and intelligent decisions, and tokeep pace with new evidence and use the known facts to update practices.”14
But amassing knowledge, however insightful or compelling in and of itself, is oflittle value unless it is turned into action. Put in stark terms, if knowledge is notturned into action, then the entire effort expended in sequencing through theprevious steps in the EbM framework would have been a pointless exercise and a waste of resources. Decisions have to be made and acted upon.
As a useful and simple example (and this illustration may or may not be apocryphal,but is nonetheless powerful), a US supermarket analyzed the buying patterns of itscustomers. Examination of the data revealed a curious relationship. It discoveredthat men who go shopping on Friday night to buy beer also tend to buy diapers (orvice versa). This is a fascinating and perhaps surprising piece of information, butunless something is done with these insights then the findings are worthless. Ofthe endless options here, the supermarkets might (a) put the beer and diapers (ornappies as they are termed in the UK) adjacent to each other to make their mutual
34 Evidence-based Decision Making: Using Business Intelligence to Drive Value
Amassing knowledge,however insightful
or compelling in and of itself, is of littlevalue unless it is
turned into action.

purchasing easier, (b) putting them as far apart as possible to tempt shoppers tobuy other things en route from one purchase to the other, (c) provide a packagedeal, or (d) reduce the price of one to attract customers and raise the price of theother to generate profits. Simply put, this fascinating piece of information is onlyuseful if one of the above options is implemented.
The Knowing Doing Gap
In their book The Knowing-Doing Gap: How Smart Companies Turn Knowledge into Action, Professors Pfeffer and Sutton explain why many organizations thatpossess plentiful knowledge fail to turn that knowledge into action. The authorsargue that the knowing doing gap (where knowledge is not implemented) is themost menacing phenomenon that most organizations face today. This phenomenon,they rightly claim, costs organizations billions of dollars and leads to a wide array offailures in strategic implementation and other failures. Their book resulted from afour-year research program that set out to identify a common malady that theauthors had observed in organizations, and which they articulated as the knowingdoing problem – that is, the challenge of turning knowledge about how to enhanceorganizational performance into actions consistent with that knowledge.
The most destructive aspect of the knowing-doing gap, the authors argue, is whatthey call the “smart talk trap,” where talk becomes a substitution for action, andwhere myriad members of the organizations make decisions that change nothing.Other reasons for the gap are entrenched and outdated culture, fear of change,internal competition, and measurements that lead nowhere.
Consequently, closing this knowledge-doing gap often requires a wholesalereworking of the process for turning knowledge into action – a reworking that hascultural as well as process, structural, and technological components.
Indeed, as with any major transformation efforts launched by organizations, thecultural challenge is probably the most daunting. Most change programs failbecause of inappropriate culture, not because of the other dimensions.
Seven Steps to Creating a Knowledge-to-Action Culture
For creating a culture that is conducive for transforming knowledge into action, we recommend that organizations use the following seven steps, each of whichwe will consider in turn.
i. Have passion for learning and improvement
ii. Ensure leadership buy-in
iii. Develop widespread analytical capabilities throughout the organization
iv. Use judgment
v. Share information
vi. Reward EbM
vii. Build appropriate IT infrastructure
35

i. Have passion for learning and improvement
The most important ingredient, which is why it is the first on the list, is to create an organization-wide passion for learning and improvement. Of course, this isextremely cultural. A good case example of making this happen is Canada’s ClaricaLife insurance. Steered by Executive Vice-President Strategic Capabilities, HubertSaint-Onge, in the late 1990s and early years of this decade, Clarica (now part ofSun Life Insurance Company of Canada) was a pioneer in implementing knowledgemanagement and learning organization practices. Within Clarica, people were (a)encouraged to form the mindset that “work is learning” and “learning is work,” and(b) provided the space and tools to make this mindset a practical reality. E-learningtools and communities of practices were used extensively for making learning andimprovement an organization-wide passion. Within the EbM framework, learningmust be based on asking the right questions (following the principle of the keyanalytics questions that should steer all data collection and analysis – see earliersteps) and collecting evidence to answer them – therefore leading to decisions and actions.
ii. Ensure leadership buy-in
To make EbM a reality, senior level buy-in and support is important. Thomas Davenport and Jeanne Harris (the authors of the Accenture study described in the introduction) argue in their book Competing on Analytics: If the CEO or asignificant faction of the senior executive team doesn’t understand or appreciate at least the outputs of quantitative analysis or the process of fact-based decisionmaking, analysts are going to be relegated to the back office, and competition willbe based on guesswork and gut feel, not analytics.” It is therefore important for the senior leaders in an organization to believe in evidence-based decision making.It helps if they have some appreciation about what makes good evidence and what makes good analysis, and they should be able and willing to act on thefindings resulting from the analysis. Organizational leaders have to show visiblecommitment to EbM and analytics, and need to explain the importance and role ofevidence-based management in their organization-wide communications.
iii. Develop widespread analytical capabilities throughout the organization
In the introduction to this MAG, we provided research evidence to show thatanalytical capabilities are generally lacking in most organizations, and that wherethey are evident, widespread enterprise-wide sustainable competitive advantage ismore likely to be achieved than where these capabilities are absent. Companiessuch as Marriott, Google, Yahoo! Inc, Amazon, and Procter & Gamble areexceptionally capable in their ability to systematically turn their data analysis intoinsights and actions that lead to significant competitive advantage. They are,however, still counted within a group that we can label the exception rather thanthe norm. As Davenport and Harris write: “The overwhelming majority oforganizations…. have neither a finely honed analytical capability nor a detailed planto develop one.”15 Supporting our comment about the challenges of culture changemade earlier, Davenport and Harris continue on to say that changing employees’behaviours is one of the most difficult and time-consuming elements of creating an
36 Evidence-based Decision Making: Using Business Intelligence to Drive Value

analytics capability. “When most people visualize business analytics, they think ofcomputers, software, and printouts or screens full of numbers. What they shouldbe envisioning, however, are their fellow human beings. It is people who makeanalytics work and who are the scarce ingredient in analytical competition.” Putanother way, it is the employees of an organization who need to take insights fromthe analysis and turn them into actionable knowledge. We stated in the introductionthat organizations often see an investment in BI tools as being the proper responseto the challenge of analyzing data. This is plainly mistaken. It is people who makeanalytics work, not systems.
iv. Use judgment
Bringing people into the equation brings with it a dimension to building evidencethat we have not yet described. That is, in making analytics work, employees (at alllevels) must balance facts and judgment. William Perez, former CEO of Nike, puts itnicely: “I am a data man – I like to know what the facts are… [but] judgment is veryimportant. Feel is very important. You can’t replace that with facts. But you can usedata to guide you.” As a powerful example of this, a few years ago the author ofthis MAG attended an analytics course run by the software provider, SAS Institute.During a data mining session, it became strangely evident that there was a strongcorrelation between the share price of the company being analyzed and the lengthof the lawn outside the corporate headquarters – the share price seemed to behigher when the grass was long than when the grass was short. Even though theanalysis suggest a relationship between these two variables, common sense tellsus that there is obviously no relationship, and that we shouldn’t conclude thatlonger grass will lead to improved share performance. This would represent afailure to apply judgment to information provided through data analysis.
v. Share information
Despite more than a decade of consultants peddling the latest and greatestapproaches to knowledge management, the fact is that in a large number oforganizations employees are still reluctant to share information. And technology is failing to provide the answer. A 2008 research report by Atos Consulting, forinstance, found that less than one-third of study participants strongly agreed/agreedwith the statement that: “The deployment of technology has greatly improvedenterprise-wide strategic learning processes.” Just as worrying, research finds thatemployee groups seem much more interested in gaining ownership of informationthan in figuring how to share it to secure competitive advantage. According to a recently published report, finance, IT and marketing departments in manyorganizations are fighting one another for responsibility to manage the company’sinformation. Those working in IT believe that they have the most clearly definedrole. Eighty percent of those in Finance felt that they had a more clearly definedrole, while 67% of marketing specialists felt that they had the most clearly definedrole. For EbM to be effective, the message has to get out, loud and clear, thatinformation belongs to the enterprise, and that all employees should be focused noton its ownership but on working together to create the richness of differentperspectives that can turn this information into golden nuggets of knowledge
37

vi. Reward EbM
“What gets measured gets done. What gets rewarded gets done well.” is a well-known management maxim that is typically attributed to Peter Drucker, but whoseorigin is actually obscure. But the fact is, rewards – most powerfully financial butalso non-financial – tend to quickly make a new idea or approach uppermost in themind of an employee at any level. In planning their strategy for implementing theEbM framework, organizations should look to weaving in some form of supportingreward strategy, as it is important to recognize and reward EbM attempts. This willshow that organizations take the approach seriously, and value those trying to makeit a practical reality. This can start with a simple thank-you and sharing of successstories.
vii. Build appropriate IT infrastructure
You can have a wealth of analytical intentions and skills, but you also need the toolsto put them into practice. Organizations need the right IT Infrastructure. Essentially,this comprises (a) databases, data warehouses, data marts, etc. to store the data;(b) networks and connections to share the information and to make is accessible;and (c) the software to analyze and share the data.
38 Evidence-based Decision Making: Using Business Intelligence to Drive Value

Conclusion
What makes organizations succeed in today’s competitive and unpredictable world is the ability to learn faster than the competition, and the ability to act on any insights to drive competitive advantage. In this MAG, we have outlined howEbM can enable organizations to do exactly that. Any organization can boost itscompetitive position by aligning the data collection to the strategic value drivers,and collecting the best available evidence, by using this evidence to extract valuableinsights and by communicating the information in a way that allows acting on those insights. The tips, tools, and templates presented as part of the five-part EbM model should enable organizations to become more evidence-based in theirdecision making, and avoid the traps of making decisions based on anecdotal dataor dangerous half-truths.
Appendix 1: Data Collection Methods
This appendix provides an overview of some of the key data collection methods.
Surveys and Questionnaires
Surveys and questionnaires are probably the most extensively used method of data collection. This is not surprising, as it can be a relatively inexpensive way ofcollecting valuable performance data. For instance, at minimal cost an employeeengagement survey can be distributed electronically to many thousands ofemployees throughout the world.
Surveys and questionnaires first became widely popular in the early 1990s.Organizational enthusiasm was galvanized by the then-emerging total qualitymovement, which encouraged a more customer or quality focus to operations.Consequently, large numbers of organizations began to use survey instruments(then paper-based) to seek information on customer satisfaction and customers’perception of service and quality, among other things.
However, such enthusiasm soon led to difficulties. Organizations began to receivemany questionnaires from many suppliers, and soon grew tired of having todedicate not insignificant amounts of time to their completion. Today, therefore, it is much harder to solicit customer feedback than it was, say, a decade ago. Someorganizations even have a policy of not completing surveys, due to the timepreviously been spent in doing so.
That said, surveys and questionnaires should still be used, where appropriate, tocapture performance data relating to customers, employees, or suppliers. But inorder to increase relevance and reduce time, organizations should ensure that thepurpose of the survey is well articulated (e.g., how will it help decision making) andthat the content of the survey is easy to understand and, crucially, is quick tocomplete.
39

A good questionnaire should conform to the following requirements:
• Include a good brief (why we are doing this survey)
• Ensure that the function of each question is clear (why we are asking thisquestion)
• Use clear phrasing (avoid ambiguity, which is one the major weaknesses ofquestionnaires – and perhaps the most annoying)
• Use simple language (avoid difficult words, complex sentences, jargon)
• Make them easy to complete (avoid too-long questionnaires and include clearinstructions)
• Make the survey attractive (professional looking with good use of spacing, etc.)
Interviews
Interviews are another popular way to collect data. These can be very structuredand just a verbal way of collecting survey data, or they can be semi-structured orunstructured, in which case interviews are more qualitative in nature. Being guided conversations, they are deployed to provide insights into the feelings orexperiences of the interviewees. This therefore involves the use of open-ended(how, why, what ) questions in a conversational, friendly, and non-threateningmanner.
Iinterviews are usually face-to-face or telephone-based. But organizations shouldlook to leverage online capabilities to extract deeper insights than can normally besecured from interviews. From our experience, the following two approaches mightprovide outstanding qualitative data, if managed appropriately.
• Bulletin boards: Setting up a bulletin board allows threads of a discussion todevelop over time. Regular interaction with respondents allows an idea orconcept to grow over many weeks or even months. The German carmanufacturer BMW employs user forums to identify new trends as well asexisting problems with their cars.
• Blogs: Diaries are a great tool, and blogs can be even better. Personal blogsallow access to respondents’ innermost thoughts and can be constantlyreplenished and updated with pictures, texts, and graphics. Asking people tokeep diaries for specific areas of their work has long been used in managementresearch.
Focus Groups
Focus groups are facilitated group discussions (usually 5-20 participants) in whichparticipants can express and share their ideas, opinions, and experiences. Theyprovide an interactive way to gather information, and allow the collection of rich,qualitative information. Focus groups are good ways of assessing employee andcustomer-related performance indicators, such as customer experience, customeror staff engagement, team-working, organizational culture, or trust.
40 Evidence-based Decision Making: Using Business Intelligence to Drive Value

Mystery Shopping
Mystery shopping is the assessment of a service by a “secret shopper” posing as aclient or customer. Some organizations have in-house “mystery shoppers,” whileothers hire external suppliers. Many organizations have started using mysteryshopping to assess customer experiences. Trained “mystery shoppers” can also beused for many other internal performance assessments, such as organizationalculture or atmosphere.
External Assessments
External organizations and institutions can provide independent performanceassessments and indicators. Independent surveys that measure brand recognition,customer awareness, or market share in specific segments are good examples ofexternal assessments. An independent company creates a set of criteria, and thenmeasures everyone against these criteria
Peer- to-Peer Assessments
Peer-to-peer evaluation means the assessment by participants of each other’sperformance. This can be done either openly or anonymously, and enables peopleto learn from each other and to consider their own performance from theperspective of their colleagues. Peer-to-peer evaluations have been successfullyused to gauge elements such as (a) trust, (b) knowledge and experience, (c) teamwork, and (d) relationships.
Observations
Observations allow the collection of information by observing situations or activitieswith little or no manipulation of the environment. “The power of using observationmethods is that it engages all of our senses not just our sight. It enables us to takein and make sense of the entire experience through our nose (smell), eyes (sight),ears (hearing), mouth (taste), and body (touch). Unlike other data collectionmethods, observation data can provide us with a more holistic understanding of thephenomenon we’re studying.”16 Observation outputs can take the form of scoresheets, checklists, narrative reports, and video or audio taping. Observations havebeen successfully used in assessing organizational culture, skill and experiencelevels of employees, emotional intelligence, and creativity, to give a few examples.
41

Useful Websites
The Advanced Performance Institute: www.ap-institute.com
Evidence-Based Management: www.evidence-basedmanagement.com
Endnotes
1 David Apgar, Relevance, Hitting your Goals by Knowing What Matters, San Francisco (CA): Jossey-Bass, 2008.
2 This is based on research in 2006 by the US-headquartered benchmarking firm The Hackett Group.
3 2008 Accenture survey of analytics capabilities among large U.S. firms.
4 Source: www.evidence-basedmanagement.com
5 A Case Study within Creating a World-Class Finance Function, James Creelman,Business Intelligence 2005.
6 See e.g. Robert Kaplan and David Norton, The Balanced Scorecard, Boston(MA): Harvard Business School Press, 2006.
7 See Bernard Marr, What are Key Performance Questions, API ManagementWhite Paper, 2008 (www.ap-institute.com), or Bernard Marr, Managing andDelivering Performance, Oxford: Butterworth Heinemann, 2009.
8 Eric Schmidt in an interview with Jeremy Caplan for TIME, October 02, 2006.
9 For more information see: Jeffrey Pfeffer and Robert I Sutton, Hard Facts,Dangerous Half-Truths & Total Nonsense: Profiting From Evidence-BasedManagement, Boston (MA): Harvard Business School Press, 2006.
10 Source: Stephen Few, Information Dashboard Design: The Effective VisualCommunication of Data, Sebastopol (CA): O’Reilly, 2006, page 78.
11 Ibid., page 34.
12 Bernard Marr and James Creelman, Outcome-Based Performance Management:Christchurch City Council Drives Towards a Long-Term Strategic Horizon,Management Case Study, The Advanced Performance Institute, 2008 (www.ap-institute.com).
13 Richard S. Tedlow, “The Education of Andy Grove,” Fortune, CNNMoney.com(December 12, 2005), http://money.cnn.com/magazines/fortune/fortune_archive/2005/12/12/8363124/index.htm.
42 Evidence-based Decision Making: Using Business Intelligence to Drive Value

14 Jeffrey Pfeffer and Robert I. Sutton, Hard Facts, Dangerous Half-Truths & TotalNonsense: Profiting From Evidence-Based Management, Boston (MA): HarvardBusiness School Press, 2006.
15 Thomas H. Davenport and Jeanne G. Harris, Competing on Analytics: The NewScience of Winning, Boston (MA): Harvard Business School Press, 2007.
16 Darlene Russ-Eft and Hallie Preskill, Evaluation in Organization: A SystematicApproach to Enhancing Learning, Performance, and Change, Cambridge (MA):Perseus, 2001.
Bibliography and Further Reading
Together with proprietary and web-based research, the following references havebeen used to provide material for this MAG. Many examples, supporting materialand cases have been extracted from these books.
Alexander, Jack. Performance Dashboards and Analysis for Value Creation,Hoboken (NJ): Wiley Finance, 2007.
Apgar, David. Relevance. Hitting your Goals by Knowing What Matters, SanFrancisco (CA): Jossey-Bass, 2008.
Ayres, Ian. Super Crunchers, Why Thinking by Numbers is the Way to be Smart,New York (NY): Bantam Dell, 2007.
Bensoussan, Babette E. and Fleisher, Craig. Analysis without Paralysis: 10 Tools toMake Better Decisions, Upper Saddle River (NJ): FT Prentice Hall, 2008.
Caplan, Jeremy. “Google’s Chief Looks Ahead,” Time.com (October 2, 2006),http://www.time.com/time/business/article/0.8599.1541446.00.html.
Coveney, Michael, Ganster, Dennis, Hartlen, Brian, and King, Dave. The StrategyGap: Leveraging Technology to Execute Winning Strategies, Hoboken (NJ): Wiley & Sons, 2003.
Creelman, James. Creating a World-Class Finance Function, Business IntelligenceReport, Optima Publishing Limited, 2005.
Davenport, Thomas H. and Harris, Jeanne G. Competing on Analytics: The NewScience of Winning, Boston (MA): Harvard Business School Press, 2007.
Few, Stephen. Information Dashboard Design: The Effective Visual Communicationof Data, Sebastopol (CA): O’Reilly, 2006.
Few, Stephen. Show me the Numbers: Designing Tables and Graphs to Enlighten,Oakland (CA): Analytics Press, 2004.
43

Kaplan, Robert and Norton, David. The Balanced Scorecard, Boston (MA): HarvardBusiness School Press, 2006.
Marr, Bernard. Managing and Delivering Performance, Oxford: ButterworthHeinemann, 2009.
Marr, Bernard. Strategic Performance Management, Oxford: ButterworthHeinemann, 2006.
Marr, Bernard. What are Key Performance Questions, Management White Paper,The Advanced Performance Institute, 2008, www.ap-institute.com.
Marr, Bernard and Creelman, James. Outcome-Based Performance Management:Christchurch City Council Drives Towards a Long-Term Strategic Horizon,Management Case Study, The Advanced Performance Institute, 2008, www.ap-institute.com.
Pfeffer, Jeffrey and Sutton, Robert I. Hard Facts, Dangerous Half-Truths & TotalNonsense: Profiting From Evidence-Based Management, Boston (MA): HarvardBusiness School Press, 2006.
Pfeffer, Jeffrey and Sutton, Robert I. The Knowing-Doing Gap: How SmartCompanies Turn Knowledge into Action, Boston (MA): Harvard Business SchoolPress, 2000.
Redman, Thomas C. Data Driven: Profiting from Your Most Important BusinessAssets, Boston (MA): Harvard Business School Press, 2008.
Russ-Eft, Darlene and Preskill, Hallie. Evaluation in Organizations: A SystematicApproach to Enhancing Learning, Performance, and Change, Cambridge (MA):Perseus Books, 2001.
Tedlow, Richard S. “The Education of Andy Grove,” Fortune, CNNMoney.com(December 12, 2005), http://money.cnn.com/magazines/fortune/fortune_archive/2005/12/12/8363124/index.htm.
Williams, Steve and Williams, Nancy. The Profit Impact of Business Intelligence,San Francisco (CA): Morgan Kaufmann, 2007.
44 Evidence-based Decision Making: Using Business Intelligence to Drive Value

About the Author:
Bernard Marr is a global authority and a bestselling author on strategic performancemanagement. In this capacity, he regularly advises leading companies, organizationsand governments across the world, which makes him an acclaimed keynotespeaker, researcher, consultant, and teacher. Bernard Marr is acknowledged by the CEO Journal as one of today’s leading business brains.
He has produced a number of seminal books and over 200 reports, studies, andarticles on performance management and performance measurement (includingthe best-sellers Strategic Performance Management and Managing and DeliveringPerformance, a number of Gartner Reports on Performance ManagementSoftware, and the world’s largest research studies on the topic). Organizations he has advised include Accenture, Astra Zeneca, the Bank of England, Barclays, BP, DHL, Fujitsu, Gartner, HSBC, Mars, the Ministry of Defence, the Home Office,Tetley, the Royal Air Force, and Royal Dutch Shell.
Prior to his current role as chief executive and director of research at the AdvancedPerformance Institute (API), Bernard Marr held influential positions at the Universityof Cambridge and at Cranfield School of Management. Today, Bernard Marr alsoholds a number of visiting professorships and editorial board memberships at manyleading journals in the field.
Bernard Marr’s expert comments on performance management have been used in a range of high-profile publications, including in the Financial Times, the SundayTimes, Financial Management, the CFO magazine, and the Wall Street Journal.
Bernard Marr can be contacted at: [email protected].
45

Review Committee
This Management Accounting Guideline was prepared with the advice and counsel of:
Pete Bandtock, ACMAVP Finance New Forwarding EnvironmentDHL Global Forwarding
Shobhik ChaudhuriPartner, Global Public SectorGrant Thornton LLP
Narinder Kaur, MScBusiness ImprovementDiageo PLC
Denise Metcalf, MBAManager, Innovation and DevelopmentCIMA
David Powell, FCMA, BScSenior Director Global Finance ProcessesAstraZeneca
Todd Scaletta, MBA, CMA, FCMADirector, Knowledge ManagementCMA Canada
Peter Simons, ACMAInnovation and Development SpecialistCIMA
Alan Verico, CPAHead of Strategic Cost MeasurementBarclays UK Retail Banking
Kenneth W. Witt, CPATechnical Manager, Business, Industry & GovernmentAICPA
The views expressed in this Management Accounting Guideline do not necessarilyreflect those of the individuals listed above or the organizations to which theyare affiliated.
46 Evidence-based Decision Making: Using Business Intelligence to Drive Value

In Canada:
The Society of Management Accountants of CanadaMississauga Executive CentreOne Robert Speck Parkway, Suite 1400Mississauga, ON L4Z 3M3 CanadaTel 905 949 4200Fax 905 949 0888www.cma-canada.org
In the U.S.A.:
American Institute of Certified Public Accountants1211 Avenue of the AmericasNew York, NY 10036-8775 USATel (888) 777 7077Fax (800) 362 5066www.aicpa.orgVisit the AICPA store at www.cpa2biz.com
In the United Kingdom:
The Chartered Institute of Management Accountants26 Chapter Street London SW1P 4NP United KingdomTel +44 (0)20 7663 5441Fax +44 (0)20 7663 5442www.cimaglobal.comEmail Technical Information Services at [email protected]
For more information on other products available contact: