Management 183 Financial Markets Investments 2 (stocks)
58
Management 183 Financial Markets Investments 2 (stocks)
-
Upload
blaise-brice-higgins -
Category
Documents
-
view
237 -
download
3
Transcript of Management 183 Financial Markets Investments 2 (stocks)

Management 183Financial Markets
Investments 2(stocks)

Fundamental Stock AnalysisFundamental Stock Analysis
I. Introduction to Securities Analysis
II. Value Vs. Growth Investing
III. Balance Sheet Valuation Methods
IV. Analytical Factors: Growth Rates
V. Intrinsic Valuation Methods

Common Stocks
• Residual Owners: o Stockholders of a firm are entitled to dividend
income derived from the firm’s earnings.– Stocks may provide a steady stream of current
income through dividends.– Stocks may increase in value over time through
capital gains.


Market Performance
• Routine Decline: a drop of 5% or more in one of the major market indexes, like the Dow Jones Industrial Average (DJIA)
• Correction: a drop of 10% or more in one of the major market indexes
• Bear Market: a drop of 20% or more in one of the major market indexes

• Stock Returns:
Both price changes, called capital gains, and dividend income:– Over past 50 years, stock returns have ranged
from +48.28% in 1954 to -21.45% in 1974
– Stock returns over past 50 years have averaged around 11%
– From 1998 through mid-’03, DJIA averaged 1.7%

• Provide opportunity for higher returns than other investments
• Over past 50 years, stocks averaged 11% and high-grade corporate bonds averaged 6%
• Good inflation hedge since returns typically exceed the rate of inflation
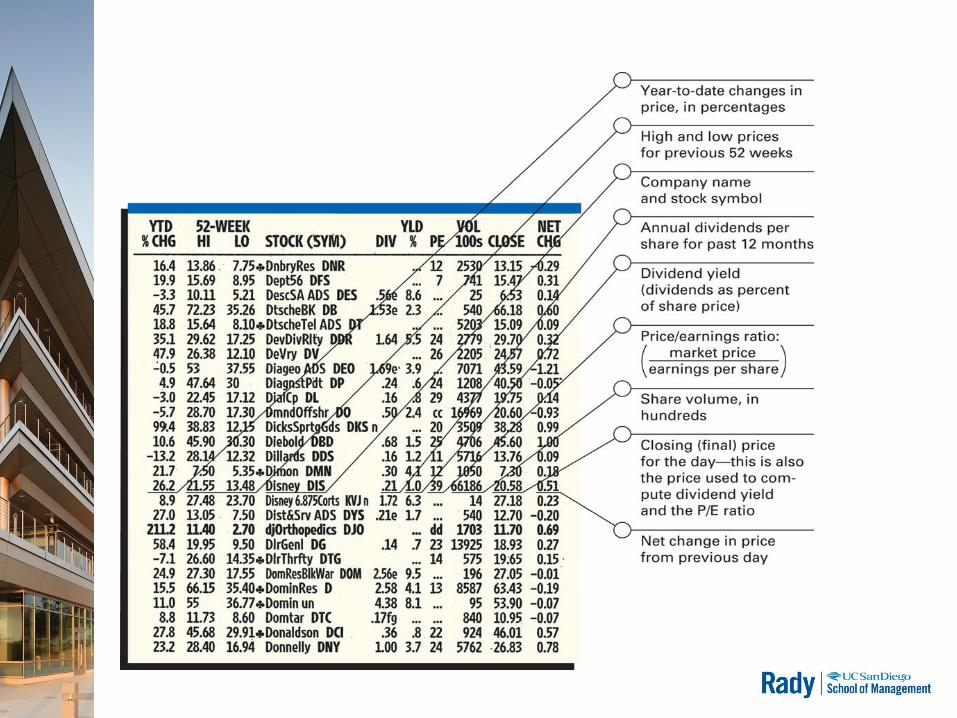
• Easy to buy and sell stocks• Price and market information is easy to find in
financial media• Unit cost per share of stock is low enough to
encourage ownership


• Stocks are subject to many different kinds of risk:– Business risk– Financial risk– Market risk– Event risk
• Hard to predict which stocks will go up in value due to wide swings in profits and general stock market performance
• Low current income compared to other investment alternatives


• Stock Split: when a company increases the number of shares outstanding by exchanging a specified number of new shares of stock for each outstanding share– Usually done to lower the stock price to make it
more attractive to investors– Stockholders end up with more shares of stock
that sells for a lower price– Investor with 200 shares in a 2-for-1 stock split
would have 400 shares after the stock split– If the stock price was $100 before the split, the
price would be near $50 after the split

• Treasury Stock: shares of stock that were originally sold by the company and have been repurchased by the company. Share repurchases are often called “buybacks.”– Reduces the number of shares outstanding to public– Companies buyback when they believe stock is
undervalued and a good buy– Companies may try to raise undervalued stock price or
prop up overvalued stock price– May be used for employee stock option plans

• Classified Common Stock: common stock issued in different classes, each of which offers different privileges and benefits to its holders– Different shares may have different voting rights– Often used to allow a relatively small group to
control the voting of a publicly-trade company– Ford family owns “B” shares and other investors
own “A” shares; Ford family controls 40% of Ford Motor Company
– May have different dividend payout schedules

• Par Value: the stated, or face, value of a stock– Mainly an accounting term and not very useful
to investors
• Book Value: the amount of stockholders’ equity– The difference between the company’s assets
minus the company’s liabilities and preferred stock
• Market Value: the current price of the stock in the stock market

• Market Capitalization: the overall current value of the company in the stock market – Total number of shares outstanding multiplied by
the market value per share
• Investment Value: the amount that investors believe the stock should be trading for, or what they think it’s worth– Probably the most important measure for a
stockholder

• Earnings Per Share: the amount of annual earnings available to common stockholders, stated on a per-share basis
EPS
Net profitafter taxes
Preferred dividends
Number of shares ofcommon stock outstanding

Dividends
• Dividend income is one of the two basic sources of return to investors.
• Dividend income is more predictable than capital gains, so preferred by investors seeking lower risk.
• Dividends are taxed at maximum 15% tax rate, same as capital gains.
• Dividends tend to increase over time as companies’ earnings grow; increases average 3-5% per year.
• Dividends represent the return of part of the profit of the company to the owners, the stockholders.

• Dividend Payout Ratio: the portion of earnings per share (EPS) that a firm pays out as dividends– Companies are not required to pay dividends– Some companies have high EPS, but reinvest all
money back into company
Dividend payout ratio Dividends per share
Earnings per share

Key Dates for Dividends

Dividends and Dividend Yield
• Dividend Yield: a measure to relate dividends to share price on a percentage basis– Indicates the rate of current income earned on
the investment dollar– Convenient method to compare income return to
other investment alternatives
Dividend yield Annual dividends received per share
Current market price of the stock

• Stock Dividend: payment of a dividend in the form of additional shares of stock
• Dividend Reinvestment Plans (DRIPs): plans where cash dividends are automatically reinvested into additional shares of the firm’s common stock– Over 1,000 companies offer DRIPs– Usually have no brokerage fees– Uses dollar-cost averaging

• Blue Chip Stocks: financially strong, high-quality stocks with long and stable records of earnings and dividends– Companies are leaders in their industries– Relatively lower risk due to financial stability
of company– Popular with investing public looking for steady
growth potential, perhaps dividend income– Provide shelter during unsettled markets– Examples: Wal-Mart, Proctor & Gamble,
Microsoft, United Parcel Service, Pfizer and 3M Company

• Income Stocks: stocks with long and sustained records of paying higher-than average dividends– Dividends tend to increase over time (unlike interest
payments on bonds)– Examples: Verizon, Conagra Foods, Pitney Bowes.


Growth Stocks: stocks that experience high rates of growth in operations and earnings Investors expect higher price appreciation due
to increasing earnings; pay little or no dividends Examples: Lowe’s, Harley-Davidson, Starbucks,
Kohls


Speculative Stocks: stocks that offer potential for substantial price appreciation, usually due to some special situation such as a new product. Examples: P.F. Chang’s, Quicksilver.


• Tech Stocks: stocks representing the technology sector of the market– Small companies that have never shown a profit and blue
chip stocks of large companies that are growth-oriented– Difficult to put value on due to erratic or no earnings– Examples: Microsoft, Cisco Systems, Dell.

• Cyclical Stocks: stocks whose earnings and overall market performance are closely linked to the general state of the economy– Best for investors willing to move in and out of market as
economy changes– Examples: Caterpillar, Maytag Corp.


Defensive Stocks: stocks that tend to hold their value, and even do well, when the economy starts to falter Stock price remains stable or increases when
general economy is slowing Products are staples that people use in good
times and bad times, such as electricity, beverages, foods and drugs; Gold stocks.
Best for aggressive investors looking for “parking place” during slow economy
Examples: Proctor & Gamble, WD-40


Market Capitalization
• Small-Cap Stocks: under $1 billion
• Mid-Cap Stocks: $1 billion to $4 or $5 billion
• Large-Cap Stocks: more than $4 or $5 billion

• Small-Cap Stocks: small companies with market capitalizations less than $1 billion– Provide opportunity for above-average returns
(or losses)– Usually do not have a financial track record– Earnings tend to grow in spurts and can have
dramatic impact on stock price– Usually not widely-traded; liquidity is issue– Examples: Rubio’s, Hot Topic, Sonic Corp.
• Mid-Cap Stocks: medium-sized companies with market capitalizations between $1 billion and $4 or $5 billion– Provide opportunity for greater capital
appreciation than Large-Cap stocks, but less price volatility than Small-Cap stocks
– Usually have long-term track records for profits and stock valuation
– “Baby Blues” offer same characteristics of Blue Chip stocks except size
– Examples: Wendy’s, Barnes & Noble, Petsmart, Cheesecake Factory

• Large-Cap Stocks: large companies with market capitalizations over $4 or $5 billion– Number of companies is smaller, but account for
80% to 90% of the total market value of all U.S. equities
– Bigger is not necessarily better– Tend to lag behind small-cap and mid-cap stocks,
but typically have less volatility– Examples: AT&T, General Motors, Microsoft

Investing in Foreign Stocks
• Globalization of financial markets is growing– U.S. equity market is less than 50% of world
equity markets– Six countries make up 80% of world equity
market– U.S. market remains largest and one of best
performing equity markets– Much of performance of non-U.S. markets is due
to changes in currency exchange rates

Going Global
• International investing is more complex and riskier than domestic investing
• International investing requires investors to be right on more factors:– Must pick right stock– Must pick right market– Must pick correct direction for currency
exchange rate fluctuations

Returns on International Investments
• Stronger U.S. dollar has negative impact on foreign investments
• Weaker U.S. dollar has positive impact on foreign investments
Total return(in U.S. dollars)
Current income
(dividends)
Capital gains(or losses)
Changes in currency
exchange rates

Stock Investment Strategies
• Buy-and-Hold– Investors buy high-quality stocks and hold them
for extended time periods– Goal may be current income and/or
capital gains– Investors often add to existing stocks over time– Very conservative approach; value-oriented

Strategies
• Current Income– Investors buy stocks that have high dividend
yields– Safety of principal and stability of income are
primary goals– May be preferable to bonds because dividends
levels tend to increase over time– Often used to provide to supplement other
income, such as in retirement

Strategies
• Quality Long-Term Growth– Investors buy high-quality growth stocks, mid-
cap stocks and tech stocks– Capital gains are primary goal– Higher level of risk due to emphasis on capital
gains– Significant trading of stocks may occur over time– Diversification is used to spread risk– “Total Return Approach” is version that
emphasizes both capital gains and high income

Strategies
• Aggressive Stock Management– Investors buy high-quality growth stocks, blue
chip stocks, mid-cap stocks, tech stocks and cyclical stocks
– Capital gains are primary goal– High level of risk due to emphasis on capital
gains– Investors aggressively trade in and out of stocks,
often holding for short periods– Timing the market is key element– Time consuming to manage

Strategies
• Speculation and Short-Term Trading– Also called “day trading” – Buy speculative stocks, small-cap stocks and tech
stocks– Capital gains are primary goal– High risk due to emphasis on capital gains in
short time period– Trade in and out of stocks, often holding for
extremely short periods– Looking for “big score” on unknown stock– Time consuming & high trading costs
Analysis
• Security Analysis: determining correct value of a security in the market place.
How do analysts choose the stock and other securities to hold in their portfolio?
– Macroeconomic Analysis– Sector Selection– Industry Analysis– Company Selection– Security Analysis– Technical Analysis

• Fundamental Analysis: Research to find the appropriate time, place, company, and stock.
Focuses on determinants of sales and earnings, risks and expectations for future company performance.
Attempt to find mis-priced securities.
• Technical Analysis: Research to find recurrent and predictable stock price patterns, proxies for buy or sell pressure in the market.

• The Changing Paradigm.
– In long run, earnings are the most important factor in determining stock value.
– In the short run, however, changes in market sentiment and consumer confidence are equally if not more important.

• Security prices reflect information ?
– Global news – economic and political
– Domestic news
– Industry news - trends
– Firm news – marketing, products, management.

• Economic Analysis
– Structural economic changes.• Demographic trends.• Lifestyle changes• Technological changes.• Politics and Regulation.

• Economic Analysis– Cyclical Changes - business cycle
• Financial companies tend to bottom just prior to the business cycle troughs and peak before the peak of a business cycle.
• At troughs, stock of consumer durable goods companies tend to bottom and peak at the peak.
• Capital goods companies tend to bottom shortly following a trough and peak when there is evidence the economy is weakening.
• As the economy enters into a recession investors tend to gravitate towards consumer staple companies.

• Industry Analysis – Porter Five– threats of new entrants– Rivalry among existing competitors– Threat of substitutes– Buyer’s bargaining power– Supplier’s bargaining power
– By considering each of these five elements of industry structure an analyst will develop a better estimate of how the industry is likely to fare in the future.
• Industry Analysis – Life Cycle Analysis
– Pioneering development– Rapid accelerating growth– Mature growth– Stabilization and market maturity– Deceleration of growth

• Company Analysis– Choosing particular companies:
• Growth rates
• Price to Earning Ratio
• Price to Book Ratio
• Intrinsic Valuation Models

Value Vs. Growth Investing
• Two factions within Fundamental analysis
– Value investors believes that securities should be purchased only when the underlying fundamentals (macroeconomic information, industry news, and a firm’s financial statements) justify the purchase.
– Growth investors seek steadily growing companies. Growth traders are willing to pay more than might seem reasonable because they like the stock’s future prospects; they are buying future earnings that may or may not develop.