manage The use of chemical pesticides S by the Australian ......estate represents around 1% of that...
184
SUSTAINABLE FOREST MANAGEMENT PROJECT NUMBER: PN06.4016 The use of chemical pesticides by the Australian plantation forest industry This release can also be viewed on the FWPRDC website www.fwprdc.org.au FWPRDC PO Box 69, World Trade Centre Melbourne 8005, Victoria T +61 3 9614 7544 F +61 3 9614 6822 SEPTEMBER 2006
Transcript of manage The use of chemical pesticides S by the Australian ......estate represents around 1% of that...

SuSt
ain
able
fo
reS
t m
anag
emen
tP
ro
jec
t n
um
be
r: P
n06
.401
6 The use of chemical pesticides by the Australian plantationforest industry
This
rel
ease
can
als
o b
e vi
ewed
on
th
e FW
PRD
C w
ebsi
te
ww
w.f
wp
rdc.
org
.au
FWPR
DC
PO B
ox 6
9, W
orld
Tra
de C
entr
eM
elbo
urne
800
5, V
icto
riaT
+61
3 9
614
7544
F +
61 3
961
4 68
22 SEPTEMBER 2006

© 2006 Forest & Wood Products Research & Development Corporation All rights reserved.
Publication: The use of chemical pesticides by the Australian plantation forest industry The Forest and Wood Products Research and Development Corporation (“FWPRDC”) makes no warranties or assurances with respect to this publication including merchantability, fitness for purpose or otherwise. FWPRDC and all persons associated with it exclude all liability (including liability for negligence) in relation to any opinion, advice or information contained in this publication or for any consequences arising from the use of such opinion, advice or information. This work is copyright and protected under the Copyright Act 1968 (Cth). All material except the FWPRDC logo may be reproduced in whole or in part, provided that it is not sold or used for commercial benefit and its source (Forest and Wood Products Research and Development Corporation) is acknowledged. Reproduction or copying for other purposes, which is strictly reserved only for the owner or licensee of copyright under the Copyright Act, is prohibited without the prior written consent of the Forest and Wood Products Research and Development Corporation. Project no: PN06.4016 Researchers: B.M. Jenkin Sylva Systems Pty. Ltd. P.O. Box 1175, Warragul, Vic 3820 B. Tomkins GreenTree Forestry Services 8 Caddy Drive, Creswick, Vic 3363
Final report received by the FWPRDC in September 2006
Forest and Wood Products Research and Development Corporation PO Box 69, World Trade Centre, Victoria 8005 Phone: 03 9614 7544 Fax: 03 9614 6822 Email: [email protected]: www.fwprdc.org.au
- 1 -

The FWPRDC is jointly funded by the Australian forest and wood products industry and the Australian Government.
- 2 -
The use of chemical pesticides by the Australian plantation forest industry
Prepared for the
Forest & Wood Products Research & Development Corporation
by
B.M. Jenkin and B. Tomkins

Dedication The origins of this study (in part) start in 1983, when Dr Les T. Carron emphasised to his
Australian National University D48 (Forest Policy, Administration and Management) students
the need for all professional foresters to have an armoury of cocktail party figures at their
finger tips to both counter and inform those with whom they come into contact.
- 3 -

Chemical pesticide usage by Australian forest plantation industries
Acronyms
1R First rotation
2R Second rotation
a.c. Active constituent
a.i. Active ingredient
AAAA Aerial Agricultural Association of Australia
ABARE Australian Bureau of Agricultural and Resource Economics
ABS Australian Bureau of Statistics
AFS Australian Forestry Standard
APVMA Australian Pesticides and Veterinary Medicines Authority
CDA Control droplet application
DSE Dry sheep equivalent
EHS Environmental health and safety
FSC Forest Stewardship Council
FWPRDC Forest and Wood Products Research and Development Corporation
GDP Gross domestic product
GRWE Gross roundwood equivalents
MAI Mean annual increment
ME Metabolisable energy
MSDS Material safety data sheet
NFI National Forest Inventory
NRA National Registration Authority
OHS Occupational Health and Safety
PEFC Programme for the Endorsement of Forest Certification
PGR Plant growth regulator
PIRI Pesticide impact rating index
PISC Primary Industries Standing Committee
SA Standards Australia
SD Statistical Division
ULV Ultra low volumes
VRT Variable rate technology
WDH Water dispersible herbicide
- 4 -

Chemical pesticide usage by Australian forest plantation industries
Executive summary It is important to provide an informed contextual framework for any discussion or debate concerning the
Australian plantation forestry industry. Recent studies have considered socio-economic and water related
issues as they relate to the operations and effects of the industry on rural and regional areas. The use of
chemical pesticides by the Australian plantation forestry industry is another issue requiring the same level
of analysis and understanding. The Forest and Wood Products Research and Development Corporation
(FWPRDC) with industry support, initiated this study to develop such an understanding.
The study utilised published information on a range of issues relating to chemical pesticide use and
attributes, made contact with industry experts and conducted a comprehensive and confidential industry
survey. The industry survey collected responses from plantation forestry managers covering over 92% of
the Australian plantation forestry estate. The information provided gave details of the type, rates of
application and scale of use across a range of species and sites. The information was used to help profile
the active ingredients (a.i.) and rates used by the industry. It was also the basis of the development of
comprehensive chemical pesticide use models for six zones across Australia. The six zones were defined
based on combined National Forest Inventory (NFI) zones and the Statistical Divisions (SD) used by the
Australian Bureau of Statistics (ABS) to report on farming practices. The NPI zones and ABS SD maps
were overlayed to determine the logical combinations of the two sets of spatial data into the six combined
zones. The combined zone mapping was then commissioned to be produced by the NPI. The farming
data for the ABS SD was purchased and aggregated based on the six combined zones.
The scale of the Australian plantation industry is 1,716,173 net ha of plantations as of December, 2005 as
reported by the NFI. The ABS census reports on 440,109,578 ha (capturing data for 99.3% of that area)
Of the 168 million hectares of non-rangeland management land across Australia, the plantation forestry
estate represents around 1% of that area. The main land uses are meat cattle (42.1%), sheep and lambs
(13.3%), cereals for grain (11.9%) and dairy cattle (1.5%). The balance of the land (30.2%) is used for a
range of horticulture and other agricultural pursuits.
The regulatory framework for chemical pesticide use in Australia was considered. Information was
collected from the Australian Pesticides and Veterinary Medicines Authority (APVMA) on the process of
chemical registration and label controlled use. The APVMA is the body responsible for agricultural and
veterinary chemicals. The process applied by the APVMA is consistent across all uses and users of
chemical pesticides. Registration of an a.i. involves three years of field testing and analysis for a new a.i.
and two years of testing to register a new use of an existing a.i.. In the case of the a.i. used by the
Australian plantation forestry industry, only one (sulfometuron methyl) was not developed for agricultural
production systems. With the exception stated, all other a.i. used by the plantation forestry industry are
used by agriculture for food production. Of the 13 most used a.i. (based on spend) five are available for
unrestricted purchase from hardware stores and supermarkets. A key driver of the need for the plantation
forestry industry to adapt for use a.i. developed for other uses is that the scale of the plantation forestry
market is too small to warrant the significant cost of specific a.i. development and registration.
- 5 -

Chemical pesticide usage by Australian forest plantation industries
There has been a large volume of scientific and published (peer reviewed) research considering the issue
of weed and pest control in plantation forestry. Weeds in a plantation may compete for water, nutrients
and space. Pest insects and browsing animals may defoliate or eat the entire planted tree. The two key
issues addressed have been the impact on survival of the planted trees and where the trees do survive,
the change in growth rates due to competition and physical damage. For example, effective weed control
has been shown to improve growth rates by 120% over an untreated control as assessed by volume in a
softwood plantation. In the case of 66% insect defoliation in eucalypt seedlings, a loss of growth resulted
where the defoliation occurred multiple times in the one season.
The plantation forestry industry has focussed research and development on how to use the a.i. developed
for other uses. This has included the adaptation of application technology and the development of new
technology. Delivery systems such as dry granule application were introduced utilising proprietary a.i.
mixes to be applied over the top of the planted trees. The granules activate once they become moist and
begin to release the a.i. contained within. Plantation forestry specific systems have been developed to
address issues such as culling non-crop trees within plantations (e.g. silver wattle in a radiata pine
plantation).
Plantation forestry varies in scale and intent across Australia, and with that variation in estate size, the
realistic options to manage or react to issues will vary. In the case of small estates, it may be possible to
conduct manual / non-chemical pesticide forestry (e.g. hand weeding or tree guards to stop browsing
animals). Whereas in a large scale industrial plantation (scale of the tasks and the limited window of
opportunity), mechanical application of chemical pesticides is required. Further, the production rates (area
treated per hour) of aerial application methods allow rapid response to pest insect out-breaks or to apply
herbicides during limited fine weather (e.g. in autumn). Once the trees are planted, access restrictions
due to the “crop height” further makes aerial application an invaluable tool. A total of 10 million hectares
per year is treated by aerial application across Australia, and of that area, less than 0.5% is for the
plantation forestry industry.
The usual chemical pesticide regime as applied to forest plantations is to apply herbicides in the first two
years and insecticides in response to pest out-breaks. The a.i. used is a function of the target pest, the
crop tree species and the climate. A range of regimes is discussed. Weed control usually takes place pre-
plant as an initial site clean-up to remove difficult to kill species prior to planting the crop trees. This is
usually applied broadcast. After cultivation works, the planting lines may be strip sprayed (e.g. treating
50% of the net planted area) or the site broadcast sprayed. Once planted and depending on weed
growth, follow-up weed control may be required in the same planting season or later in the following year.
The a.i. used and the rates will be a function of the a.i. and rates of the previous treatment. That is, if a
site is well cleaned up initially, there may be reduced need to do other applications.
The plantation forestry approach contrasts with the annual use of chemical pesticides in agriculture (in
many crops). Specific analysis is included in the report to compare the chemical pesticide inputs to
- 6 -

Chemical pesticide usage by Australian forest plantation industries
manage a Tasmanian blue gum plantation, compared to a banana plantation and an onion growing
enterprise. In the case of the Tasmanian blue gum plantation, weed control occurs in the first two years
and then does not occur again till the crop is harvested and a new crop planted in the eleventh year after
the initial plantation development. In the scenario presented, the plantation required insecticide
application at age 3 years. Contrast this to a banana plantation with annual repeated applications of
herbicides, insecticides and fungicides over the seven years of the crop, or an annual onion enterprise
with multiple applications of herbicides, insecticides and fungicides. If an estate is developed of the three
crops by planting 100 ha per year for 10 years (up to a total estate of 1,000 ha), the total chemical
pesticide input for the three crops would be:
• Tasmanian blue gum plantation: $10,918 /yr (or $10.92 /ha/yr);
• Onions: $933,340 /yr (or $933.34 /ha/yr);
• Banana plantations: $1,979,081 /yr (or ($1,911.08 /ha/yr).
The rate of application of chemical pesticides is legally controlled by the requirements stipulated on the
product label. The label rates are the maximum rates allowed. In practice, the plantation forestry industry
has developed regimes that may utilise the a.i. up to that maximum rate, but the financial imperative to
reduce the cost of inputs means that often the application is at less than that allowed maximum. The
results of the industry survey indicated that for all a.i. in use (except simazine), the actual application rate
was at less than 50% of the allowed maximum in more than 50% of applications considered. In the case
of simazine, more than 50% of the applications considered were at less than 70% the maximum allowed.
The true measure of chemical pesticide use is the rate per hectare combined with the total hectares
treated. For atrazine, the maximum allowed rate for plantation forestry is 8 kg a.i./ha. The survey showed
a maximum use rate of 5.6 kg a.i./ha. For canola cropping in Western Australia, for example, it may be
applied twice per crop at 1.0 kg a.i./ha. For 2005, the industry survey showed that the W.A. plantation
industry used 7,444 kg a.i. of atrazine. The W.A. canola industry for 2003 - 04 produced 318,002 ha of
crops, to which an estimated 636,000 kg a.i. of atrazine may have been applied or greater than 80 times
the amount used by the plantation forestry industry in W.A.
The APVMA maintains and reports on the total chemical pesticide market in Australia. For 2004, the total
spend on chemical pesticides was $2.45 billion. This total includes uses such as domestic insecticides
($105.4 million). The information is not presented on a sector basis. In order to estimate the plantation
forestry use within that framework, the following was undertaken:
• Analysis of the industry survey: total spend for 2005 $16.2 million after pro rata adjustment to
100% of the estate;
• A simple model of plantation forestry spend to estimate the maximum (based on maximum
product label rates and /or industry best practice): total spend for 2005 of $20.9 million;
• Detailed models of each of the six zones aggregated into an estimated total spend for 2005 of
$16.4 million.
- 7 -

Chemical pesticide usage by Australian forest plantation industries
The analysis showed that the total spend by the plantation forestry industry is around 0.7% of the total
Australian spend. The results of the analysis further indicates that the Australian plantation forestry
industry frequently uses chemical pesticides at less than the label maximums allowable.
In terms of the use of sodium fluoroacetate (1080), 200 kg was used across Australia in 2003 – 04. The
industry survey indicated that the plantation forestry sector use was 5.5 kg in 2005 to destroy declared
pest animals (e.g. rabbits) and native browsing animals which damage plantations trees. An additional 8.8
kg of 1080 was used to destroy foxes and pigs to comply with legal requirements and to effect good land
management.
Water monitoring is a tool used to detect a.i. movement after chemical pesticide applications. The
Tasmanian Department of Primary Industries and Water (DPIW) has a comprehensive set of 54 water
monitoring sites across Tasmania and water samples are collected to test for 19 a.i.. The sample sites
cover all land uses in the catchments tested. Sampling commenced in January 2005 with nil detections.
Samples are taken on a quarterly basis and up to seven rounds have been concluded with four detections
(see the report for details). A similar initiative in the cotton growing areas of Queensland showed a 100%
(13 samples) rate detection of atrazine for 2000 – 01. Time series data for cotton production areas of the
Macintyre, Gwydir, Namoi and Macquarie valleys showed a decline in the detection rate for atrazine from
46% in 1991 – 92 (296 samples) down to 19.8% in 2002 – 03 (348 samples). Individual plantation forestry
managers conduct water samples associated with operations and report these as part of sustainable
forest management reports.
The plantation forestry industry continues to develop alternatives to chemical pesticide use. This is to
comply with the requirements of forest certification and to reduce the cost of production. Innovations such
as mechanical barriers to insect pests on seedlings have been implemented. Given the potential for new
pests, in particular insects, it is imperative that the plantation forestry industry maintains access to a
range of a.i. and products able to be applied by a range of techniques. This imperative is reinforced by
the need for plantation managers to move into new areas with new species to continue to expand the
Australian plantation estate.
- 8 -

Chemical pesticide usage by Australian forest plantation industries
Table of contents
ACRONYMS................................................................................................................................................. 4 EXECUTIVE SUMMARY.............................................................................................................................. 5 INTRODUCTION ........................................................................................................................................ 12
AN ENHANCED UNDERSTANDING................................................................................................................. 12 CHEMICAL INPUTS DEFINED........................................................................................................................ 12 PREVIOUS STUDIES IN AUSTRALIA .............................................................................................................. 13
METHODS.................................................................................................................................................. 14 ANALYSIS BASIS ........................................................................................................................................ 14 GENERAL INFORMATION............................................................................................................................. 14 LAND USE AREAS....................................................................................................................................... 14 INDUSTRY SURVEY .................................................................................................................................... 14 CHEMICAL PESTICIDE INPUTS ..................................................................................................................... 15
FOREST PLANTATIONS OVERVIEW IN THE NATIONAL LAND USE CONTEXT ............................... 18 AUSTRALIAN LAND USE .............................................................................................................................. 18 PLANTATIONS: A SIGNIFICANT CONTRIBUTION.............................................................................................. 19 PLANTATION FORESTRY ESTATE................................................................................................................. 20 AGRICULTURE ........................................................................................................................................... 22
A PRODUCTION IMPERATIVE................................................................................................................. 25 SILVICULTURE ........................................................................................................................................... 25 PLANTATION SCALE ................................................................................................................................... 27 PLANTATION PRODUCTIVITY ....................................................................................................................... 28
THE REGULATORY ENVIRONMENT IN AUSTRALIA............................................................................ 30 BASIS OF REGULATION............................................................................................................................... 30 REGISTRATION PROCESS ........................................................................................................................... 31 IMPLEMENTATION OF THE REGULATORY ENVIRONMENT................................................................................ 31 CERTIFICATION.......................................................................................................................................... 32
APPLICATION RATES .............................................................................................................................. 33 LABEL RATES ............................................................................................................................................ 33 ACTUAL RATES.......................................................................................................................................... 33
A HISTORY OF PESTICIDE USE AND TECHNOLOGICAL DEVELOPMENT........................................ 35 EVOLUTION OF HERBICIDE USE................................................................................................................... 35 PRODUCT TECHNOLOGY ............................................................................................................................ 37 APPLICATION TECHNOLOGY........................................................................................................................ 38
CURRENT PRACTICE - GROUND APPLICATION EQUIPMENT ........................................................... 39 GRANULE APPLICATORS............................................................................................................................. 39 LIQUID MIXTURES ...................................................................................................................................... 39 MANUAL SPRAYING EQUIPMENT.................................................................................................................. 40 WICK WIPERS............................................................................................................................................ 41 STEM TREATMENTS ................................................................................................................................... 42
CURRENT PRACTICE – AERIAL APPLICATION.................................................................................... 43 INDUSTRY OVERVIEW................................................................................................................................. 43 FIXED WING APPLICATION........................................................................................................................... 43 HELICOPTER APPLICATION ......................................................................................................................... 44 COST BENEFIT OF APPLICATION METHODS................................................................................................... 47 PLANTATION RETURNS............................................................................................................................... 49
SPRAY DRIFT............................................................................................................................................ 51 AERIAL APPLICATION.................................................................................................................................. 51
- 9 -

Chemical pesticide usage by Australian forest plantation industries
REGULATION............................................................................................................................................. 51 APPLICATION............................................................................................................................................. 52
ANALYSING CHEMICAL USAGE............................................................................................................. 53 AREA TREATED.......................................................................................................................................... 53 CHEMICAL ATTRIBUTES .............................................................................................................................. 53
GENERAL HERBICIDE PRESCRIPTIONS............................................................................................... 55 TEMPERATE EUCALYPTS ............................................................................................................................ 55 SUB-TROPICAL/TROPICAL HARDWOODS ..................................................................................................... 56 TEMPERATE SOFTWOODS .......................................................................................................................... 57 TROPICAL AND SUB-TROPICAL SOFTWOODS ................................................................................................ 58
PESTICIDE USE OVER A CROP LIFE ..................................................................................................... 60 BASIS OF ANALYSIS ................................................................................................................................... 60 A SINGLE CROP ......................................................................................................................................... 60 ESTATE DEVELOPMENT.............................................................................................................................. 65 TOTAL ESTATE PESTICIDE INPUTS............................................................................................................... 68
AUSTRALIAN CHEMICAL PESTICIDE USE............................................................................................ 69 INTRODUCTION.......................................................................................................................................... 69 TOTAL MARKET.......................................................................................................................................... 69 HOUSEHOLD AND INDUSTRIAL USE.............................................................................................................. 71 PLANTATION FORESTRY ............................................................................................................................. 71 MARKET DATA REVISED.............................................................................................................................. 75
A DETAILED MODEL OF CHEMICAL PESTICIDE USE ......................................................................... 76 INDIVIDUAL ZONES ..................................................................................................................................... 76 TOTAL SPEND............................................................................................................................................ 76 COMPARISON TO THE APVMA/ABARE DATA ............................................................................................. 76 PLANTATIONS IN DETAIL ............................................................................................................................. 77 ZONE SUMMARIES ..................................................................................................................................... 78
RISK MANAGEMENT................................................................................................................................ 79 WATER MONITORING.................................................................................................................................. 79 CHEMICAL REMEDIATION............................................................................................................................ 82 RISK ASSESSMENT .................................................................................................................................... 82
ALTERNATIVES TO CHEMICAL USE...................................................................................................... 84 A CONTINUING NEED.................................................................................................................................. 84 ONGOING DEVELOPMENT ........................................................................................................................... 84 AUSTRALIAN PLANTATION INDUSTRY EXPERIENCE........................................................................................ 84
FUTURE TRENDS ..................................................................................................................................... 86 POTENTIAL FUTURE PESTS......................................................................................................................... 86 LIKELY CHANGES TO THE CONTEXT OF CHEMICAL USE ................................................................................. 86 EMERGING CHEMICAL TECHNOLOGIES ........................................................................................................ 86 PLANTATION INDUSTRY WILLINGNESS TO ADOPT NEW CHEMICALS AND ALTERNATIVES ................................... 86
CONCLUSIONS ......................................................................................................................................... 87 REFERENCES ........................................................................................................................................... 89 BIBLIOGRAPHY FOR AGRICULTURAL CROP MODELS...................................................................... 95 APPENDIX A INDUSTRY SURVEY................................................................................................... 102 APPENDIX B LAND USE DATA FOR 2004 - 05 .............................................................................. 106 APPENDIX C AUSTRALIA’S PLANTATION EXPANSION.............................................................. 108 APPENDIX D CHEMICAL PESTICIDES PROFILES ........................................................................ 110 APPENDIX E PLANTATION FORESTRY APPLICATION RATES.................................................. 119
- 10 -

Chemical pesticide usage by Australian forest plantation industries
APPENDIX F SPRAY TECHNOLOGY – NOZZLES......................................................................... 125 APPENDIX G COST AS A PROXY TO USAGE................................................................................ 128 APPENDIX H STANDARD REGIMES............................................................................................... 131 APPENDIX I HOUSEHOLD CHEMICAL PESTICIDES ................................................................... 140 APPENDIX J TOTAL AUSTRALIAN CHEMICAL PESTICIDE ESTIMATES .................................. 143 ZONE A DETAILS.................................................................................................................................... 147 ZONE B DETAILS.................................................................................................................................... 153 ZONE C DETAILS.................................................................................................................................... 159 ZONE D DETAILS.................................................................................................................................... 165 ZONE E DETAILS.................................................................................................................................... 171 ZONE F DETAILS .................................................................................................................................... 177
- 11 -

Chemical pesticide usage by Australian forest plantation industries
Introduction
An enhanced understanding
The plantation forestry industry has developed a series of key reports to help inform the industry and the
wider community. For example, socio-economic studies such as Petheram et al. (2000) and more
recently Schirmer et al. (2005), have contributed greatly to understanding the benefits of plantation
forestry in a regional context. Water use by forest plantations and associated issues were reviewed by
Keenan et al. (2004). The use of chemical pesticides is sometimes a matter of public scrutiny. An
understanding of chemical pesticide input statistics for plantation forestry is therefore important to add to
the contextual framework for informed discussion. Chemical pesticide use is a function of legal, crop and
pest issues. To help in understanding, the ability to compare chemical pesticide input statistics for
plantation forestry to other land uses adds to the contextual framework. Application technique (ground or
aerial) and coverage (target plant, spot, strip or broadcast) varies with situation (crop and pest) and
overall crop management. This study reviewed and assessed the:
• Regulatory controls at Federal, State and Local Government levels;
• The evolution of and change in chemical pesticide use by Australian agriculture and in plantations
to provide a historical/contextual framework;
• Use in plantation and agricultural crops industries;
• Potential management regimes.
Chemical inputs defined
The Oxford Dictionary (Pearsall and Trumble, 1996) defines a “pesticide” as:
“A substance used for destroying insects or other organisms harmful to cultivated plants or to
animals.”
It is necessary to further define the term ‘pesticide’ used in the context of plantation forestry. A broad
definition used in this report is:
Any chemical or chemical mixture used for controlling weeds, insects, fungi, nematodes and
animals, which adversely affect growth (quantity and quality) and the health of plantations.
Pesticides are usually subdivided into groups depending on target organisms, or by their action on living
organisms. The main subdivisions are:
• Herbicides;
• Insecticides (including miticides, nematicides, molluscicides);
• Fungicides;
• Rodenticides;
- 12 -

Chemical pesticide usage by Australian forest plantation industries
• Plant regulators;
• Defoliants;
• Desiccants and anti-transpirants;
• Other types of poisons and repellents;
• Adjuvants (all additives to chemical pesticides mixtures);
• Animal health products.
In some instances pesticides are mixed with adjuvants. The role of an adjuvant is to enhance the action
of the pesticide on the target organism.
The pesticide chemical that is active (i.e. affects the outcome) is called the “active ingredient” (a.i.) or
active constituent (a.c.) (a.i. will be used in this report). It is usually mixed with other ingredients (e.g.
solvents, fillers, surfactants, emulsifiers, dyes, etc) which commonly have no pesticide activity
themselves. The purpose of the other ingredients is to act as carriers or to enhance the effectiveness of
the a.i. Therefore, most preparations are less than 100% a.i. It is important to understand that many
products with the same a.i. may have different concentrations of the a.i. Hence in this report, chemicals
will be reported on an a.i. basis unless otherwise specified. For example, a glyphosate product may be
purchased at 7.2, 360, or 450 g/L of a.i. of glyphosate salt.
Previous studies in Australia
Flinn and Fagg (1984) reviewed weed control practices in Australian radiata pine (Pinus radiata)
plantations, and the costs for six State forest agencies and nine companies, representing 95% of the
plantation area at that time. The review covered the major weed problems, herbicides then in use, and
the techniques of application. Much has changed, however, in the more than 20 years since that review,
especially in relation to new herbicides, new application technology, greater emphasis on OH & S and
stricter regulation and environmental controls.
Hall (1987) reviewed weed control practices in Australian forestry, with a substantial section of the review
centred on plantation forestry. He noted that there was a lack of data on the effects of chemical weed
treatment on long-term plantation growth, and that forestry represented only a small market for chemicals,
leading to a lack of interest in product development and registration by the chemical companies at that
time. Forestry weed research was identified as being very ad hoc and applied, and the extrapolation and
identification of general principles as difficult.
Lewty (1993) reviewed aspects of plantation weed control in Australia, in particular looking at the
practices then current, research activities and future directions. He also identified areas of deficiencies in
plantation weed control and a number of emerging areas. Important among these was ‘a developing trend
where there is a lack of research capacity (e.g. staff) to fully evaluate new products’. Another
development has been the trend away from ‘open’ research leading to the peer reviewed publication of
results in the scientific literature, to research conducted on a commercial basis, supported by State
forestry organisations and companies, and the chemical companies.
- 13 -

Chemical pesticide usage by Australian forest plantation industries
Methods
Analysis basis
The outcomes reported are split into two areas: a comprehensive set of overall plantation forestry
chemical pesticide use information and an estimate of the specific use across a series of zones to provide
a “local” contextual framework of comparative use. To undertake the analysis, data were required on land
use areas and the chemical pesticide inputs required. In order to build up a profile to put plantation
forestry use patterns into context, the following approach was taken in the report (based on Jenkin, 2004).
Chemical pesticide use = the area treated * units/ha
General information
A wide range of sources of general information was used in the study and these are identified throughout
the report.
Land use areas
In order to generate regional chemical pesticide use profiles, the study utilised Australian Bureau of
Statistics (ABS) and National Forest Inventory (NFI) land divisions to create six zones. Plantation forestry
total estate areas and new plantation area statistics were sourced from the NFI report (based on 15
zones: Wood et al., 2001). The NFI regions cross state boundaries. Map 1 shows the NFI zones and
Table 1 the region names. Agricultural land use statistics were purchased from the ABS. The statistics
were from the 2003 – 04 farm census. Farm census surveys are sent to all registered farms and it is
mandatory to complete and return the forms. The data is collected every 2 years. (For full details, visit the
ABS web site www.abs.gov.au.) The land use statistics were collected at the Statistical Division (SD)
level.
The SD level data spatial arrangement does not correspond with the NFI zones. To address this issue,
the NFI zones were combined based on logical boundaries to match combined ABS SDs zones. Map 1
and Table 2 shows the combined zones used in the study. It must be noted that where NFI plantations
were shown in an ABS SD, all the SD was included in that zone.
Industry Survey
A commercial in confidence survey was conducted of a wide range of plantation managers to determine
the nature of chemical pesticide use. The survey collected data on the active ingredients used, the areas
treated and the costs. The survey respondents manage in excess of 92% of the Australian plantation
forestry estate. Appendix A contains the survey details and respondents.
- 14 -

Chemical pesticide usage by Australian forest plantation industries
Map 1 A summary of the NFI/SD combined zones for market analysis and reporting. (Based on Wood et al., 2001).
Zone F
Zone D
Zone E
Zone A
Zone C
Zone B
Chemical pesticide inputs
Plantation forestry
The industry survey provided detailed information on chemical pesticide use. This was followed up with
interviews with industry to identify chemical pesticide management regimes for softwood and hardwood
plantations in the different regions. As well, based on industry specific experience, the survey and
interview data were combined to generate the plantation management chemical pesticide regimes. The
hardwood regimes were split into short rotations (e.g. Tasmanian blue gums: Eucalyptus globulus,
pulpwood only crops with a 10 year rotation) and long rotation (e.g. shining gum: E. nitens, solid wood
and veneer crops with a 25 year rotation). The softwood regime is a longer rotation crop to produce
sawlogs (e.g. radiata pine 30 years).
- 15 -

Chemical pesticide usage by Australian forest plantation industries
Table 1 NFI zone codes as shown in Map 1 and based on Wood et al. (2001) Name
1 WA
2 Tasmania
3 Green Triangle
4 Lofty Block
5 Central Victoria
6 Murray Valley
7 Central Gippsland
8 East Gippsland/Bombala
9 Southern Tablelands
10 Central Tablelands
11 Northern Tablelands
12 North Coast
13 SE Queensland
14 North Queensland
15 Northern Territory
Crops and horticulture
Generic crop management regimes were sourced covering the main agricultural crops in the different
zones. The main source of information was from State Government agencies published gross margin
reports (e.g. DoA WA, 2006a; DoA WA, 2006b: canola cropping in Western Australia, the Department of
Agricultures web site at www.agric.wa.gov.au). As part of the gross margin analysis, chemical pesticides
inputs are defined (in some instances with the specific product listed and in others, as a generic cost).
Chemical pesticide inputs collated were herbicides, insecticides, fungicides and animal health products.
The gross margins used were matched as closely as possible to the conditions of the six zones in the
absence of a crop and zone specific gross margin. It is acknowledged that this was a generic approach,
but it allowed the development of broad statistics.
Livestock
The ABS provided data on livestock numbers in the SDs. To convert the livestock numbers to an area
basis requires details of stocking rates. Animal stocking rates are driven by the ability to feed (energy
requirements) and water the livestock. Energy requirements are expressed as metabolisable energy (ME)
measured in megajoules (MJ). A common practice is to express stocking rates based on a standard
animal for a set period of time. The benchmark unit is a dry sheep equivalent (DSE) (Malcolm et al.,
1996). For example, Malcolm et al. (1996) lists a 450 kg dry beef animal as having a DSE rating of 6, or 6
standard sheep animals. Specific carrying capacity data was collected from the range of agricultural
references as listed.
- 16 -

Chemical pesticide usage by Australian forest plantation industries
Table 2 The combined NFI and ABS spatial data units to give the zones used in this analysis.
Report zones NFI Zones ABS Code State Statistical Division
A 1 505 WA Perth 510 WA South West 515 WA Lower Great Southern 520 WA Upper Great Southern 525 WA Midlands 530 WA South East
B 3,4,5 210 Vic Barwon 215 Vic Western District 220 Vic Central Highlands 225 Vic Wimmera 230 Vic Mallee 235 Vic Loddon 405 SA Adelaide 410 SA Outer Adelaide 415 SA Yorke and Lower North 420 SA Murray lands 425 SA South East 430 SA Eyre 435 SA Northern
C 2 605 Tas Greater Hobart 610 Tas Southern 615 Tas Northern 620 Tas Mersey - Lyell
D 6,7,8,9,10 115 NSW Illawarra 135 NSW North Western 140 NSW Central West 145 NSW South Eastern 150 NSW Murrumbidgee 155 NSW Murray 205 Vic Melbourne 240 Vic Goulbourn 245 Vic Ovens - Murray 250 Vic East Gippsland 255 Vic Gippsland 805 ACT Canberra 810 ACT ACT balance
E 11,12,13 105 NSW Sydney 110 NSW Hunter 120 NSW Richmond - Tweed 125 NSW Mid North Coast 130 NSW Northern 305 Qld Brisbane 310 Qld Moreton 315 Qld Wide Bay - Burnett 320 Qld Darling Downs
F 14,15 330 Qld Fitzroy 340 Qld Mackay 345 Qld Northern 350 Qld Far North 705 NT Darwin 710 NT NT Balance
- 17 -

Chemical pesticide usage by Australian forest plantation industries
Forest plantations overview in the national land use context
Australian land use
The total area of Australia is 7,692,024 km2 or 769 million ha (Geosciences Australia, 2006). The
Australian Bureau of Statistics (ABS) reports on an area of 440,109,578 ha, and has captured land use
data for 437,107,239 ha for 2003 - 04 (ABS, 2006). It is estimated based on ABS specific statistics (for
non-livestock enterprises) and by applying stocking rates to ABS livestock numbers, and by using the NFI
data (Parsons et al., 2006) that 168 million hectares is used for more intensive land management than
occurs in the rangeland estate (Figure 1). It shows that plantations make up a small component of the
overall Australian land use, with 1,716,173 hectares (1.0%). Appendix B contains details of the specific
agricultural enterprises as reported by ABS (2006a) and Parsons et al. (2006)
Plantations1.0%
Other agricultural land uses
30.2%
Cereals for grain 11.9%
Sheep and lambs13.3%Dairy cattle
1.5%
Meat cattle 42.1%
Figure 1 A breakdown of Australia’s land use over the 168 million hectares of non-rangeland land use based on ABS
(2006a) for 2003 – 04 and Parsons et al. (2006) as at December, 2005.
- 18 -

Chemical pesticide usage by Australian forest plantation industries
Plantations: a significant contribution
The forest industry sector is a significant contributor to the Australian economy. In 2004 - 05, the rural
sector contributed $23.7 billion towards Australia’s gross domestic product (GDP) of $863.7 billion
(Australian Bureau of Agricultural and Resource Economics: ABARE, 2005a). The gross value of the rural
sector production was $39.8 billion in 2004 – 05 (farming: $36.2 billion, forestry roundwood sales: $1.6
billion and fisheries: $2.0 billion) (ABARE, 2006a). The total forestry roundwood sales gross value
consisted of: native hardwood: $649 million, plantation hardwood: $150 million, and plantation softwood:
$837 million (ABARE, 2006b). For 2004 – 05, the trade in forest products was $4.1 billion imports
(ABARE, 2006c) and $2.1 exports (ABARE, 2006d) or a deficit of $2.0 billion. Figure 2 shows a
breakdown of Australia’s exports split into the farming and forestry sectors (ABARE, 2005b). Farm
exports make a significant contribution to the balance of payments. Figure 3 shows direct employment in
the farm and forestry sectors and the farm sector is a significant employer (ABARE, 2006e).
$0
$5,000
$10,000
$15,000
$20,000
$25,000
$30,000
$35,000
1990-91
1991-92
1992-93
1993-94
1994-95
1995-96
1996-97
1997-98
1998-99
1999-00
2000-01
2001-02
2002-03
2003-04
2004-05
Valu
e of
exp
orts
($m
illio
n/yr
)
Forestry
Farm
Figure 2 A summary of the value of Australia’s exports from the farm and the forestry sectors (based on ABARE, 2005b).
- 19 -

Chemical pesticide usage by Australian forest plantation industries
0
50,000
100,000
150,000
200,000
250,000
300,000
350,000
400,000
450,000
2000-01 2001-02 2002-03 2003-04 2004-05 2005-06
Empl
oym
ent (
pero
ns/y
r)
Forestry
Agriculture
Figure 3 A summary of the employment in the farm and forestry sectors (based on ABARE, 2006e).
Expressed in units of gross roundwood equivalents (GRWE: round measure of true log volume under
bark), Australia consumed a total of 22,641,000 m3 in 2004-05 or 1.11 m3/capita from all sources
(ABARE, 2006f). The total GRWE removal (harvested logs) from all sources was 27,413,000 m3 for 2004-
05: 2,934,000 m3 from hardwood plantations and 14,446,000 m3 from softwood plantations (ABARE,
2006g). The total value of the plantation sourced GRWE as delivered to the “mill door” or “wharf gate”
was $987.6 million for 2004-05 (ABARE, 2006b). The softwood GRWE production for 2004-05 was
divided as 63.6% to saw and veneer logs, 25.2% to paper and paperboard production and 8.7% to wood
based panel products (ABARE, 2006g). The hardwood plantation GRWE production for 2004-05 was
divided as 90.0% to paper and paperboard production, 9.2% to saw and veneer logs, and 0.8% others
(ABARE, 2006g).
Plantation forestry estate
The 2005 plantation estate of 1,729,769 hectares is further segmented into hardwood and softwood
species by State (Figure 4) based on the NFI (Parsons et al., 2006). The estate was composed of
989,609 ha of softwoods and 740,160 ha of hardwoods. The softwood estate is more mature than the
hardwood estate in that the cycle of harvest and replant continues. Figure 5 shows the new (first rotation
1R: additional areas) of plantation established in 2005 based on Parsons et al. (2006). The majority of the
1R plantations were hardwoods. Over 1995 to 2005 the rate of expansion of the plantation estate
averaged 61,618 ha/yr (NFI, 2002; NFI, 2003; NFI, 2004; NFI, 2005; Parsons et al., 2006; Wood et al.,
2000; Wood et al., 2001). The rate of expansion of the softwood estate has been slower than the rate of
expansion of the hardwood estate (see Appendix C for details).
- 20 -

Chemical pesticide usage by Australian forest plantation industries
0
50,000
100,000
150,000
200,000
250,000
300,000
350,000
400,000
ACT NSW NT Qld SA Tas Vic WA
Tota
l are
a (h
a)
Hardw ood
Softw ood
Figure 4 Australia’s plantation estate as of December 2005 as reported by Parsons et al. (2006).
0
5,000
10,000
15,000
20,000
25,000
ACT NSW NT Qld SA Tas Vic WA
Tota
l are
a (h
a)
Hardw ood
Softw ood
Figure 5 The area of new (1R) plantations planted in 2005 as reported by Parsons et al. (2006).
- 21 -

Chemical pesticide usage by Australian forest plantation industries
The NFI does not report on the areas harvested and replanted within the current forest plantation estate
(e.g. second rotation: 2R or greater: note that throughout the report, 2R is used to indicate areas
harvested and re-planted, regardless of whether they are second or subsequent rotations). Based on an
assumed 30 year rotation, the softwood estate would be planting around 33,000 ha/yr of post first rotation
crops. The hardwood estate harvest is on a smaller but expanding scale as the mid 1990’s Tasmanian
blue gum crops come on stream. The area of hardwood plantations harvested can be estimated based on
the 2004-05 yield of 2,934,000 m3 GRWE of which 2,640,000 m3 GRWE was reported to be pulpwood
(ABARE, 2006g). Assuming a yield of 200 m3/ha (based on a short rotation pulpwood crop) and that the
current harvest is a clearfall regime, the area harvested is estimated to be 14,670 ha/yr.
Agriculture
As shown in Figure 1, agriculture is a significant Australian land use. Figures 6 and 7 show a more
detailed breakdown of the major crops based on ABARE (2006h). The main crops are wheat and barley.
Figure 8 shows the national major livestock statistics (based on ABARE, 2006h: statistics on the poultry
industry are not reported in this reportt). Sheep are the dominant livestock, with pigs and the dairy herd as
the minor component.
Figure 9 shows the value of physical inputs into the Australian farm sector based on ABARE data. It
shows that the farm sector spend on chemical inputs (includes animal health products) was $1.7 billion in
2004 - 05, and for 2005 - 06 it is estimated to be $1.7 billion (ABARE, 2006i) (note: based on ABS data,
not the Australian Pesticides and Veterinary Medicines Authority: APVMA, data).
- 22 -

Chemical pesticide usage by Australian forest plantation industries
0
5,000,000
10,000,000
15,000,000
20,000,000
25,000,000
2001-02 2002-03 2003-04 2004-05 2005-06
Are
a (h
a/yr
)
Triticale
Sugar cane
Lupins
Oats
Sorghum
Canola
Barley
Wheat
Figure 6 A summary of Australia’s agricultural crops based on ABARE (2006h). This chart shows the major crops (area greater than 300,000 ha: 2005 - 06 estimated by ABARE).
0
200,000
400,000
600,000
800,000
1,000,000
1,200,000
1,400,000
1,600,000
2001-02 2002-03 2003-04 2004-05 2005-06
Area (ha/yr)
Soybeans Other oilseeds Maize Sunflowerseed Chickpeas Rice Wine grapes Cotton Field peas
Figure 7 A summary of Australia’s agricultural crops based on ABARE (2006h). This chart shows the major crops (areas less than 300,000 ha: 2005 - 06: estimated by ABARE).
- 23 -

Chemical pesticide usage by Australian forest plantation industries
0
20,000,000
40,000,000
60,000,000
80,000,000
100,000,000
120,000,000
140,000,000
160,000,000
2001-02 2002-03 2003-04 2004-05 2005-06
Hea
d of
live
stoc
k (n
umbe
rs/y
r)
Pigs
Dairy
Beef
Sheep
Figure 8 A summary of the Australia’s livestock numbers based on ABARE (2006h). (2005 - 06 is as estimated by
ABARE.)
$0
$1,000
$2,000
$3,000
$4,000
$5,000
$6,000
$7,000
$8,000
$9,000
$10,000
$11,000
$12,000
$13,000
2001-02 2002-03 2003-04 2004-05 2005-06
Ann
ual s
pend
($m
illio
n/yr
)
Seed and fodder
Repairs and maintenance
Fuel and lubricants
Fertiliser
Chemicals
Figure 9 The annual spend on the inputs shown for farming across Australia based on ABARE (2006i). (Note: figures
for 2005 - 06 are an ABARE estimate.)
- 24 -

Chemical pesticide usage by Australian forest plantation industries
A production imperative
Silviculture
Plantation silviculture involves inputs to achieve tree growth outcomes matching management objectives
of the particular plantation. It can be achieved via a number of combinations of inputs, to respond to the
needs of a tree species as they relate to a specific site. The options are limited by:
• Legal restrictions (e.g. Occupational Health and Safety: OHS, chemical registration, local
planning laws etc);
• Financial constraints;
• Labour availability (quantity and skills);
• Time available for the operation (if reactive to a threat, this can be a significant issue);
• Plantation manager skills and knowledge;
• Past practice (in the absence of an objective assessment of the options);
• Equipment availability.
Figure 10 shows generic inputs to manage a plantation through to rotation.
• Initial site clean-up may remove impediments (e.g. old fences), or treat difficult to kill pest plants
with broad-scale application of an appropriate herbicide mixture;
• Cultivation may be used to address specific site issues (e.g. ripping of hardpans or mounding in
wet areas);
• Pre-plant herbicide application can be broadcast, in strips over the planting lines or spots to
control current vegetation and / or likely future vegetation (e.g. the use of residual herbicides);
• The trees are then planted after any required plant back period;
• Post-plant herbicides may be required to treat areas with competition regrowth;
• At this point the plantation may be fertilised to provide starter nutrients to the trees;
• After canopy closure, the trees may shade out any weed growth, and no further herbicide is
required. Depending on tree growth and management requirements, the plantation may be
further fertilised. If the plantation is thinned, crown cover will be reduced, with a potential for weed
development, which may require treatment;
• In some instances, it may be advantageous to pre-clearfall treat a plantation to control weeds
such as bracken or blackberry as the first step to the next rotation;
• Throughout the plantation rotation, there is potential for out-breaks of insects or pathogens.
Depending on the expected impact of the insect or pathogen, there may be an imperative to treat
the plantation.
- 25 -

Chemical pesticide usage by Australian forest plantation industries
Clearfall
Canopy closure
Fertiliser application
Planting
Cultivation works
Initial site clean-up
2R site
Post-plant weed control
Previous land use
Thinning
Pre-plant weed control
Fertiliser application
Figure 10 A generic plantation silvicultural regime showing the broad inputs and the sequence of those inputs.
- 26 -
Chemical pesticide usage by Australian forest plantation industries
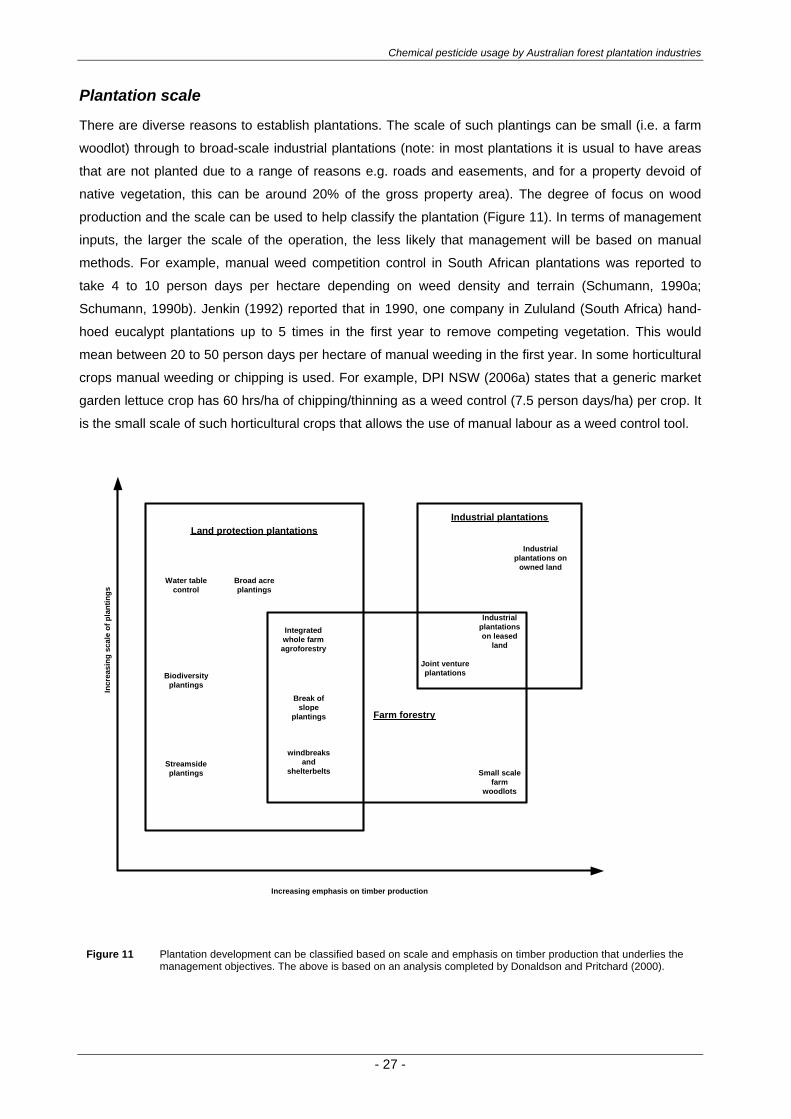
Plantation scale
There are diverse reasons to establish plantations. The scale of such plantings can be small (i.e. a farm
woodlot) through to broad-scale industrial plantations (note: in most plantations it is usual to have areas
that are not planted due to a range of reasons e.g. roads and easements, and for a property devoid of
native vegetation, this can be around 20% of the gross property area). The degree of focus on wood
production and the scale can be used to help classify the plantation (Figure 11). In terms of management
inputs, the larger the scale of the operation, the less likely that management will be based on manual
methods. For example, manual weed competition control in South African plantations was reported to
take 4 to 10 person days per hectare depending on weed density and terrain (Schumann, 1990a;
Schumann, 1990b). Jenkin (1992) reported that in 1990, one company in Zululand (South Africa) hand-
hoed eucalypt plantations up to 5 times in the first year to remove competing vegetation. This would
mean between 20 to 50 person days per hectare of manual weeding in the first year. In some horticultural
crops manual weeding or chipping is used. For example, DPI NSW (2006a) states that a generic market
garden lettuce crop has 60 hrs/ha of chipping/thinning as a weed control (7.5 person days/ha) per crop. It
is the small scale of such horticultural crops that allows the use of manual labour as a weed control tool.
Industrialplantationson leased
land
Joint ventureplantations
Industrialplantations on
owned land
Small scalefarm
woodlots
Industrial plantations
windbreaksand
shelterbelts
Break ofslope
plantings
Integratedwhole farmagroforestry
Land protection plantations
Farm forestry
Water tablecontrol
Broad acreplantings
Streamsideplantings
Biodiversityplantings
Increasing emphasis on timber production
Incr
easi
ng s
cale
of p
lant
ings
Figure 11 Plantation development can be classified based on scale and emphasis on timber production that underlies the
management objectives. The above is based on an analysis completed by Donaldson and Pritchard (2000).
- 27 -

Chemical pesticide usage by Australian forest plantation industries
Plantation productivity
Competition control
Forest vegetation management has been defined (Walstad and Gjerstad, 1984) as the practice of
efficiently channelling limited site resources into the crop rather than associated non-commercial species.
The key limited resources are water, light and nutrients (Richardson, 1993; Florence, 1996). As well,
some competing species may physically damage the crop trees e.g. in New Zealand, pampas grass can
damage radiata pine (Richardson, 1993). Eucalypts are well documented as having growth buds sensitive
to mechanical damage (e.g. Jacobs, 1955), which can be damaged by species such as bracken fern.
The impact of weed competition in reducing plantation productivity is well documented (Squire, 1977;
Cellier and Stephens, 1980; Nambiar and Zed, 1980; Balneaves, 1982; Turvey et al., 1983; Sands and
Nambiar, 1984; Schonau, 1984; West, 1984; Ellis et al., 1985; Turvey and Cameron, 1986; Squire et al.,
1987; Baker et al., 1988; Balneaves and Christie, 1988; Ray et al., 1989; Smethurst and Nambiar, 1989;
Balneaves and McCord, 1990; Messina, 1990; Wilkinson et al., 1990; Richardson, 1993; Wilkinson et al.,
1993). Reduction in productivity can be via reduced growth due to competition, or due to the death of the
planted trees and areas remaining un-productive. For example, Wilkinson et al. (1993) examined the use
of hexazinone for grass and woody weed control in the establishment and long-term growth of radiata
pine on a number of replicated sites in Tasmania. Their conclusions:
• On grassy sites, poor survival of radiata pine made weed control essential;
• For woody weed dominated sites, significant tree growth gains (30% volume gain over controls at
age 14 years) were obtained with the use of hexazinone. Volume growth gains persisted to at
least 14-16 years;
• Thinning to release the final crop could be carried out at least 2 years earlier in treated compared
to untreated stands.
Baker et al. (1988) examined the use of mixed hexazinone, amitrole plus atrazine and found that there
was a close relationship between weed cover and tree volume:
• When weed cover was reduced from 80% to 10%, tree volume increased about 120%, with the
highest marginal gains being achieved when weed cover was reduced from 30% to 10%.
Competition from weeds may cause eucalypt seedlings to become spindly: stem diameter and crown
volume is affected more than height (Florence, 1996). Following treatment with herbicides, eucalypt
seedlings were up to 275% taller after 11 months, with crown diameters nearly five times wider than those
of the untreated controls (Schumann, 1989).
Insect damage
Insect damage can reduce plantation productivity through impact on stocking, growth rates, and induce
malformation or degrade of log quality at any stage of the plantation growth (Lewis and Ferguson, 1993).
- 28 -

Chemical pesticide usage by Australian forest plantation industries
As with the impact of weed competition on tree growth, the impact of insect damage has been assessed
for commercially important eucalypt species: (E. delegatensis (Alpine ash) (Mazanec, 1966); E. grandis
(Flooded gum) (Wilkins, 1990; Carne et al., 1974); E. marginata (Jarrah) (Abbott et al., 1993); E. nitens
(Shining gum) (Candy, 1999); E. regnans (Mountain ash) (Candy et al., 1992; Cremer, 1972; Cremer,
1973; Elliot et al., 1992); Tasmanian blue gum (Collett and Neumann, 2002)).
In most studies impact was only measured in the immediate period, usually one to two years, after the
damage event. There is little published data on the impact of insect damage over the life of a plantation
(Jenkin et al., in press). Jenkin et al. (in press) noted that:
• Defoliation intensity, frequency and timing as well as tree species, influenced the impact of
damage on tree growth and survival;
• In general for commercial species of eucalypts once-off defoliation of less than approximately 50-
60% usually has no measurable impact on growth increment;
• For E. regnans Candy et al. (1992) found that artificial defoliation rates of 33% over summer had
no impact on growth, and defoliation rates of 66% only had a significant impact on growth when
defoliation was repeated either within the season or in following years;
• Using 1.7 year old, irrigated Tasmanian blue gum, Collett and Neumann (2002) found that while
repeated 100% total crown defoliation events between December and January suppressed height
increment, 100% lower crown defoliation boosted growth throughout the post defoliation period;
• While out-break species like stick insects (Phasmatidae) (Mazanec, 1966) can potentially
damage trees of any age, severe defoliation in the first three to four years of a plantation
(generally the period prior to canopy closure) is thought to be the most serious threat to plantation
profitability (Collett and Neumann, 2002).
There are over 300 species of insects listed as associated with radiata pine (Rawlings, 1960; Ohmart,
1982: in Lewis and Ferguson, 1993), including predators and parasites of harmful species, but as yet,
only a dozen or so have become regarded as pests (Lewis and Ferguson, 1993). Neumann and Marks
(1976) prepared a synopsis of the insect pests of radiata pine in Australia. The main pest insect of radiata
pine is the Sirex wasp. It can be responsible for widespread mortality in radiata pine stands of almost any
age.
Pathogens
Diseases are caused by infectious organisms which result in abnormalities of growth or function of the
plant (tree) (Lewis and Ferguson, 1993). There is a wide-range of pathogens which can attack plantation
grown trees. Keane et al., (2000) present a summary of the pathogens and diseases associated with
eucalypts. In the case of radiata pine, all diseases of any significance are fungal. The main radiata pine
disease issues are caused by (Dothistroma needle blight: Dothistroma pini; Needle casts fungi:
Cyclaneusma minus; diplodia blight: (Diplodia pinea) (Lewis and Ferguson, 1993).
- 29 -

Chemical pesticide usage by Australian forest plantation industries
The Regulatory Environment in Australia
Basis of regulation
Australia has an advanced system of regulation for pesticides and fertilisers which has evolved over
several decades, although at a community level, there appears to be a poor understanding of the way
chemicals are regulated. There are four national chemical assessment and registration schemes. The
schemes operate in a complementary manner to ensure there is no duplication or unnecessary regulation
(NICNAS, 2006). The schemes are:
• Agricultural and veterinary chemicals (e.g. chemicals which generally destroy/repel pests or
plants, or veterinary products used to prevent, diagnose or treat diseases in animals);
• Industrial chemicals (e.g. dyes, solvents, adhesives, plastics and laboratory chemicals);
• Medicines and medicinal products (e.g. therapeutic goods including prescription and non-
prescription medicines);
• Food additives, contaminants and natural toxins (e.g. food additives to enhance processing such
as colouring or flavouring).
Until the (then) National Registration Authority (NRA) was established under Commonwealth legislation in
the mid-1990’s, the States and Territories were responsible for all regulation. However, there was an
agreement to move to national regulation, with the States and Territories ceding power to the
Commonwealth to control regulation of pesticides and veterinary medicines up to the point of retail sale.
The States and Territories retain control of the regulation of fertilisers.
The NRA is now known as the Australian Pesticides and Veterinary Medicines Authority (APVMA). The
APVMA as the statutory body is responsible for all matters relating to agricultural pesticides and animal
health products to point of retail, when State or Territory legislation takes over. AVPMA powers are
derived from the following Commonwealth Acts:
• Agricultural and Veterinary Chemicals Act 1994: This Act sets out the functions and powers of the
APVMA;
• Agricultural and Veterinary Chemicals Code Act 1994: The Schedule to this Act incorporates the
Agricultural and Veterinary Chemicals Code (the AgVet Code), which deals with the approval and
registration of chemical products and their constituents (controlled by the APVMA), as well as the
control of chemical products in relation to their supply;
• Agricultural and Veterinary Chemicals Code Regulations 1995: This covers various matters
outlined in the Agricultural and Veterinary Chemicals Code Act 1994.
- 30 -

Chemical pesticide usage by Australian forest plantation industries
Registration process
All chemical pesticide products used in agriculture, horticulture, viticulture, non-crop industrial situations
(e.g. roads, railways), domestically and in plantation forestry are registered by the APVMA. Three years
of research (field trials) are usually required for the registration of a new chemical pesticide. For an
existing registered chemical pesticide, usually at least two years are required to evaluate a new use.
These trials are governed by a permit system under the APVMA. (See the APVMA web site
www.apvma.gov.au.) It often takes more than the minimum three years of research to gain registration for
a new chemical in a product. Such chemicals and chemical products are usually already registered for
use in other countries. If the APVMA is not satisfied with the submissions, it may reject registration until
the concerns are addressed by further trial work.
Registration of a chemical pesticide requires the submission of data for evaluation. Several sections
apply, including data relating to OHS and environmental health and safety (EHS), and must include
environmental data from testing in Australian conditions. A draft label must be supplied relating to use, as
well as a Material Safety Data Sheet (MSDS). The MSDS for chemical products contain product
formulation and physical properties, effects, first aid, basic toxicity data (LD50), flammability, storage and
transport, and spills and disposal. It is not required to be provided with the label, but must be available if
requested from the supplier.
Once approved, the label is a legally enforceable document that specifies information as to what purpose
(e.g., crops, target weeds or insect pests) the product may be used for and at what rates. Labels are
highly prescriptive documents which include necessary precautionary information. Products may also be
used under APVMA permits, which are temporary and are designed to lead to the use being placed on
the label.
Implementation of the regulatory environment
State and Territory legislation controls the use of pesticides and fertilisers, under Control of Use Acts and
Regulations. These Acts and Regulations vary between States and Territories and legislation is regularly
updated. Additionally, there are regulatory requirements that come under other State and Territory Acts.
Examples of these Acts include:
• Health or Occupational Health and Safety Acts;
• Environment Protection Acts;
• Poisons or Drugs, Poisons and Controlled Substances Acts;
• Dangerous Goods Acts;
• Transport Acts;
• Environmentally Hazardous Chemicals Acts;
• Lands Protection Acts;
• Weed Management Acts;
• Conservation or Heritage Acts.
- 31 -

Chemical pesticide usage by Australian forest plantation industries
Local Government Planning Acts may also impose some requirements in relation to plantation
establishment. The States and Territories also have Codes of Practice for forestry or timber production.
These have specific clauses relating to, for example, waterways and drainage lines, good neighbour
policies etc.
Applications of pesticides to forest plantations are typically carried out by contractors. All States and
Territories license such contractors. Their equipment is subject to inspection by relevant authorities that
have the power to order repair of faulty machinery. Where licensed contractors are used, this gives the
plantation forestry industry an added level of regulation compared to using internal labour. The
prescriptions applied are decided by the forestry organization, and must be within the legal limits, and the
products applied must be those registered or allowed for the purpose.
Certification There are two international sustainable forest management certification schemes. Certification under
these schemes is voluntary and, in theory, driven by market demand. The largest scheme in terms of the
area of forest managed by certified entities is the Programme for the Endorsement of Forest Certification
Schemes (PEFC) with 191.5 million hectares (as at 2006). This scheme is an umbrella approach and it
recognises national certification schemes. The Australian Forest Certification Scheme (AFCS) which
encompasses the Australian Forestry Standard (AFS) is endorsed by the PEFC. A number of large
Australian plantation growers are certified against the AFS. Under the AFS, Criterion 1 requires the forest
managers to reduce reliance on chemical pesticides, while recognising the need to maintain critical forest
management outcomes (Standards Australia, 2003). The other major certification system is the Forest
Stewardship Council (FSC). Some 76.5 million hectares of forest are managed by FSC certified entities
(as at 2006) including some of the major plantation managers in Australia. The FSC also requires
compliance with legislation, including with regard to chemical use. However, the FSC also prohibits the
use of certain FSC-designated ‘highly hazardous’ chemical pesticides, although it is possible for forest
managers to obtain "derogations' from the FSC for continued use of certain chemicals on the ’highly
hazardous’ list under certain circumstances. There is contention about the transparency and objectivity of
the process of adding chemical pesticides to this list. A recent submission to the FSC by the Australian
certified companies and supported by New Zealand organisations challenges the lack of the usual risk-
management objective and the lack of scientific credibility, on the basis of criticisms by Tomkins (2004).
- 32 -

Chemical pesticide usage by Australian forest plantation industries
Application rates
Label rates
Application rates refer to the legal maximum at which a chemical pesticide can be applied to the treated
area (as noted previously, it is likely that the net planted area of a property is at most, 80% of the gross
property area). They are presented on the packaging either as a fixed label or an attached booklet (and in
many cases obtainable from the web.) The maximum rates at which chemical pesticides are applied may
be altered by the granting of a permit to use the chemical at other rates. The application rates are
expressed in units of product per hectare or per volume of carrier (i.e. water). For example, simazine
application rates:
• Eucalypt plantations: applied at 1.6 to 6.7 kg/ha of product with 900 g/kg a.i. or 1.7 to 6.0 kg
a.i./applied ha;
• A product with 900 g/kg a.i. can be applied to canola crops at 1.1 to 2.2 kg/ha of product or 1.0 to
2.0 kg a.i./applied ha;
• A domestic garden formulation to once a year weed paths has simazine at 150 g/kg a.i. and is
applied at 100 g/ 20m2 or 7.5 kg a.i./applied ha.
Table 3 presents a summary of the main plantation forestry chemical pesticides, other labelled uses, and
the maximum application rates (see Appendix D an overview of active ingredients). To place the atrazine
use rates into context, consider canola cropping in WA may apply 1 kg a.i./ha twice per canola crop (DoA,
2006a; DoA, 2006b). In 2003/04, 318,000 ha of canola were cropped in WA (ABS, 2006) with an
estimated atrazine use of around 636,000 kg a.i., compared to the plantation industry (industry survey)
result of 7,444 kg a.i. in 2005. Though plantation forestry applied rates are higher, the scale and multiple
applications in cropping, means that (e.g. WA) cropping is estimated to use annually greater than 80
times as much atrazine as the plantation forestry industry.
Actual rates
Data on actual regimes applied to agricultural crops is not usually published. The actual application rates
in plantation forestry reported for the main active ingredients have been summarized based on the
industry survey results (Appendix E). A frequency distribution was generated for the derived application
rates (based on the a.i. concentration used). Data for 2003, 2004 and 2005 were included where
provided. The frequency distribution is presented on a 10% graduated unit “x” axis of the maximum label
rate active ingredient. That is, for glyphosate, the maximum a.i. rate is 3.6 kg/ha, so the graduated units
are “0.36”. Based on the analysis, with the exception of simazine, the plantation industry uses the a.i. shown at less than 50% the maximum rate in more than 50% of the cases considered. In 50% of the
cases of simazine use reported in the industry survey, it was at less than 70% of the maximum rate.
Table 3 presents the maximum application rate reported in the industry survey for each of the a.i. shown.
- 33 -

Chemical pesticide usage by Australian forest plantation industries
Table 4 Plantation chemical pesticide active ingredients showing the a.i. used, and the other uses of the chemicals.
The rates shown are based on the labels of products that contain the a.i. listed. Active ingredient
Current active ingredient use Application rate
Label Industry maximum
(a.i. g/ha) (a.i. g/ha) Amitrole Eucalypt plantations 250 - 1,500 1,600 Radiata pine (silver wattle control) plantation 1,400 - 2,000 Water couch: in drains, channels, margins of streams, lakes & dams 990 Pre-planting rye grass & wild oats control in wheat & barley 1,232 Pre-harvest preparation for potatoes. 2,750 Vineyards and orchards 4,000 Atrazine Eucalypts 4,500 - 8,000 5,600 Radiata pine 4,500 - 8,000 Canola 2,000 Sorghum, maize, sweetcorn, sugar cane and roadsides 2,970 Clopyralid Radiata pine (silver wattle control) 2,550 2,000 Eucalypts 150 -180 Barley, oats, triticale & wheat in combination with MCPA amine 150 Pastures and fallow land 600 - 1,200 Fluroxypyr Sugar cane for specific weed control 300 500 Woody weeds in all non-crop areas and rights of way 600 Woody weeds in forests 600 Softwood plantations 159 - 848 Hops, citrus and a range of orchard species 424 - 848 Glyphosate Plantation forestry 360 - 2,160 3,200 Broad acre control of a range of grasses and bracken fern 3,240 Pasture manipulation 495 - 2,160 Sugar cane - control of ratoons 2,160 - 3,240 Haloxyfop Plantation forestry 208 - 416 330 Couch and rhodes grass control 208 - 416 Control of a wide range of grasses in agriculture, horticulture etc. 104 - 416 Vineyards, various orchards 208 - 416 Hexazinone Radiata pine 1,500 - 3,750 3,800 Commercial and industrial areas 3,000 - 6,000 The combination with diuron is used in sugar cane 1,872 Metosulam Plantation forestry 3.6 - 7.0 7 Wild radish control in lupins 3.6 - 7.0 Metsulfuron Plantation forestry on ex-pastures Up to 9 60 methyl Established pastures: control of paterson's curse 9 Common bracken 36 Wheat, barley, triticale and cereal rye: A range of weeds 3 to 4 For woody weed on second rotation plantation sites 60 Blackberry control on native pastures, rights of way, industrial areas 96 Simazine Plantation forestry 1,440 -6,030 6,000 Pome fruit, apples and pears 3,600 Summer rainfall areas, non-crop residual control of grasses /
broadleaved weeds 43,200
Sulfometuron Proprietary mixture, lower rates otherwise 52.5 60 methyl Grass / broadleaved weed control for wide range of industrial purposes 150 - 600 Triclopyr In sorghum: control of prickly paddy melon 48 2,880 Fallow cropping land: control of prickly paddy melon 96 Broadcast blackberry 2,880
- 34 -

Chemical pesticide usage by Australian forest plantation industries
A history of pesticide use and technological development
Evolution of herbicide use
A snapshot
Figure 12 presents a snapshot of the adaptation and introduction of specific a.i. into plantation forestry
from other land management activities (principally agriculture) over the last 40 plus years. Appendix D
contains an outline of the main a.i. in use.
The past 50 years have seen significant technological development applied to the application of chemical
pesticides in plantation forests. These developments have been very successful in addressing a number
of core objectives including:
1. Improved efficacy in control of target pests;
2. Reduced environmental impacts eg on non target organisms, water quality etc;
3. Improved occupational health and safety environment for operators;
4. Reduced costs.
A brief summary of the major technological developments is provided below.
1960’s 1970’s 1980’s 1990’s 2000’s
Amitrole Atrazine
Glyphosate Hexazinone Siloxane surfactants Simazine Metsulfuron methyl Clopyralid Fluazifop Haloxyfop Sulfometuron methyl Terbacil
Figure 12 A snapshot of the introduction of the a.i. used in plantation forestry in Australia.
The 1960s
Prior to the 1960's the establishment of radiata pine was essentially a planting operation only. It usually
involved the initial clearing and burning of native forest. Herbicides began to be developed in the early
- 35 -
Chemical pesticide usage by Australian forest plantation industries
1960's for use in radiata pine plantations. Early research was carried out by Dr David Boomsma for the
Woods and Forests Department (South Australia) in the Mt Gambier region. Dr Boomsma developed
amitrole/atrazine for the control of grasses (ex-pasture sites) on sandy soils (Boomsma, 2005), which was
very effective but did not control the opportunistic invasion of perennial broadleaved weeds such as
flatweed or cat's ear (Hypochoeris radicata) and sorrel (Rumex acetosella). Early use rates of atrazine
were far higher than today and resulted in a fertiliser effect because the chemical has high nitrogen
content and breaks down to ammonia.
The 1970s
In 1976 Dr Boomsma, working with Mr Kel Stokes of DuPont, began to adapt hexazinone for control of
perennial weeds including many woody weed species. This was done in combination with atrazine for
residual control of grasses and broadleaves (Boomsma, 2005). The introduction of glyphosate in the late
1970’s allowed early site clean-up procedures to be developed. Glyphosate was used to control bracken
and sorrel, with the introduction of siloxane surfactants for improved glyphosate performance (Boomsma,
2005). Simazine and atrazine were trialled for use in eucalypt plantations as a residual herbicide, along
with a range of chemicals (Cremer et al., 1978).
The 1980s
The mid-80's saw the introduction of the sulfonyl ureas and one, metsulfuron methyl was developed for
control of brush weeds such as bracken fern (Dutkowski and Boomsma 1990; Karjalainen and Boomsma,
1989). Improved granular formulations for residual chemicals were developed (Boomsma, 2005) and
sulfometuron methyl followed a year or so later.
The 1990s
The 90's saw the rapid expansion of hardwood plantations (mainly Tasmanian blue gum for export
woodchips). The use of simazine as the mainstay residual herbicide, and the introduction of grass specific
herbicides such as haloxyfop and fluazifop followed. For second season weed control in Tasmanian blue
gum, amitrole was further developed as an under spray, in combinations with simazine and sulfometuron
methyl. Sulfometuron methyl was also beginning to be used in some pre-planting mixtures. APM Forestry
Pty Limited in Gippsland developed a recovery prescription for late first season weed control in eucalypts,
that was a mixture of haloxyfop, simazine and clopyralid. Clopyralid had previously been used for aerial
treatment of silver wattle (Acacia dealbata) in radiata pine, but at very high rates.
In the late 90's a series of screening trials supported collaboratively by forestry organisations and
chemicals companies commenced. Several promising companion herbicides have been identified.
Macspred Pty Ltd developed two Eucmix products in the late 90's, Eucmix GR®, a dry granule for second
season weed control and Eucmix PrePlant WDH® (WDH: water dispersible herbicide). These residual
herbicide products contain terbacil, developed from an orchard herbicide, and sulfometuron methyl, which
controls grasses and broadleaves such as sorrel.
- 36 -

Chemical pesticide usage by Australian forest plantation industries
The 2000’s
Post 1990’s has seen increasing technological sophistication in application technology, the development
of Codes of Practice that bear on chemical use, and increasing scrutiny and regulation.
Whilst this brief background has concentrated on weed control, there has also been development in
insecticide technology. Older, more toxic insecticides including certain organophosphates (OP’s) are
being or have been replaced by newer, less toxic chemicals. This trend follows evolution of agricultural
practices.
The biologically based insecticides such as Bacillus thuringiensis, spinosad and tebufenozide require very
careful timing in their application, but are regarded as being ‘softer’ in their environmental ‘footprint’ (Elek,
2006). The first two are of organic origin whereas tebufenozide mimics a naturally occurring organic
compound with insecticidal activity. The products are registered for forestry and have greater specificity to
target pest insects. They are generally less toxic to benign, non-target or beneficial insects. They also
have low environmental toxicity, and are less persistent, breaking down rapidly. Other insecticides are
sprayed similarly to agricultural operations, usually at ultra low volumes (ULV) rates of spray mix per
hectare e.g. as low as 5 L/ha.
The current system of pesticide classification does not rate toxicity to the environment. Elek (2006) has
suggested that the industry needs a system for assessing environmental risk of pesticides, which
probably should be operationally based.
Product technology
Plantation forestry has adapted use of a number of agricultural a.i. via product form and application
technology to meet the specific needs of plantation managers.
The 1970s
The late 70’s saw the introduction of dry granular products. These are applied at prescribed rates per
hectare and begin to release the chemical only after activation by an adequate amount of rainfall.
The 1980s
DuPont initiated granule production in Australia in 1986, following wide acceptance of the technology in
1982-83. The development of dry granular herbicides (Velmac G® which contains hexazinone, and Forest
Mix G®, a combination of atrazine and hexazinone) for radiata pine establishment followed.
The 1990s
The WDH products were introduced by Macspred in the late 90’s - early 2000’s. These are a pre-
packaged per hectare product in water-soluble plastic bags, which only have to be transferred to the
spray tank for mixing, eliminating direct human contact with the concentrated chemical products.
- 37 -

Chemical pesticide usage by Australian forest plantation industries
The 2000’s
Further development included a Controlled Release (CR) granule, Velmac CR®, which releases chemical
more slowly than Velmac G®. A product is to be introduced into the forestry market by Bayer
Environmental Science late in 2006 (following 6 years of field trials) which incorporates the insecticide
imidacloprid into a fertiliser tablet containing NPK and Mg, which is placed in the planting hole before the
tree is planted (Kaapro, 2006). The tablet contains 20% of the insecticide, which is systemic, and
provides upwards of one year of protection for the growing tree. Trials in eucalypts have demonstrated a
synergistic growth response from the combination (Collett, 2006). Modification of the poti-putki® planting
tool to deliver the tablet after soil penetration and before the tree is planted is under development. This
eliminates/reduces the requirement for aerial insecticide application during establishment, reduces insect
monitoring requirements, targets fertiliser delivery, reduces risk of fertiliser movement in water, and
reduces replanting, while giving improved tree growth.
Application technology
The evolution of new product technology was paralleled by the development of new application
technology. In the case of granule technology:
• During 1981-82 aerial fixed wing trial applications of granules were conducted, and helicopter
application began in 1987 (Boomsma, 2005);
• Manual devices such as the “Weed-A-Metre®” and the “Swissmex®” knapsack applicators were
developed to apply a fixed quantity of granules over the top of planted trees in a spot;
• Motorised air blast applicators were developed as back-pack, tractor and helicopter mounted
models;
• Bulk transfer equipment for helicopter and fixed wing application have been developed to
eliminate manual handling of bags of granules.
A recent Macspred development was that of a 1000 L re-usable shuttle, fitted for direct transfer (pumping)
of spray mix, into which is placed the prescribed amount of WDH product at the factory. The shuttles are
transported to the site, filled with water and the mix and rinsing liquid are pumped into the spray tank. The
latest developments of application technology include:
• Precision in herbicide application;
• Ground based and aerial methods refined;
• Monitoring of water quality.
- 38 -

Chemical pesticide usage by Australian forest plantation industries
Current practice - ground application equipment
Granule applicators
Weed-a-metre®
The Weed-a-metre®, developed at the (former) New Zealand Forestry Research Institute, is designed to
place an accurate dose of granular herbicide within a 1 to 1.4 m diameter circle, with the diameter of the
circle being dependent on the height above ground at which the Weed-a-metre® is operated. It consists of
a granule container which releases a given dose over a slotted cone. It is lightweight (about 0.25 kg) and
easy to use. Different trigger settings give different doses ranging from 1.5 g to 4.4 g. Use at a height of
0.9 m, set using a training rod, gives a spot diameter of 1 m (based on Pers. com. 1 and industry
experience).
Swissmex® knapsack applicator
Granules are loaded into a hopper on the knapsack, which has a pump action compressor and a wand
with a distribution head. The application is governed by the number of shots fired. The machine is
calibrated to provide, on average, 2.5 g using Velmac G® with a single shot, which is equivalent to 15
kg/ha on the spot area that is treated. When using Forest Mix G®, two shots of product per treated spot is
equivalent to 30 kg/ha. The spot area approximates to 1.2 m x 1.4 m (based on Pers. com. 1 and industry
experience).
Macspred Forest Mac granule applicator
The Forest Mac® is a motorised back-pack, air blast granule applicator, powered by a Stihl Power
Blower® adapted to apply granular products. Rate of application is adjusted with a metering disc, fine-
tuned by altering the idle speed of the motor. The machine is used to apply granules in a strip with an
operating swathe of 1.5 m to 2 m (based on Pers. com. 1 and industry experience).
Macspred Forest Pack® granule applicator
This applicator is towed by tractor or 4WD. An electronically powered, hydraulically operated variable
speed fan blows granules from a metering box into a drop tube which then blows the granules out. The
applicator can be adjusted for either single or dual row, or broadcast application as required (based on
Pers. com. 1 and industry experience).
Liquid mixtures
Vehicle mounted systems
Tractor mounted boom sprays are the conventional method of applying herbicides. The equipment
basically consists of a spray tank, pump and boom mounted integrally in a 3-point linkage carrying frame.
- 39 -

Chemical pesticide usage by Australian forest plantation industries
The pump is driven off the tractor by a power take-off (PTO) shaft, and there is an in-line filter in the
system on the vacuum side of the pump (based on Pers. com. 1 and industry experience).
Jets for the boom are plastic, stainless steel or brass, and have a spraying angle of between 60o and 110o
(see Appendix F for an overview of jet technology). Application rate and proposed speed of the tractor
must be known before the correct size jets can be selected. The speed of the tractor is generally
determined by the terrain and normally does not exceed 6 to 8 km/hr for 1R sites and 3 to 4 km/hr for 2R
sites. On rough sites, tractor or skidder speeds must be low for safety reasons and to prevent
unnecessary wear and tear on the equipment. The jet size is the final factor to be determined in obtaining
the desired application rate. Two factors to be considered for selection of jets are wind drift and jet
blockages. If both of these factors are to be minimised, the jet size selected will need to be increased.
The height of the boom is set to give a double overlap spray pattern. Complete spray units are available
from several suppliers, but modifications for plantation forestry use may be required (based on Pers. com.
1 and industry experience).
Boomless nozzles (boomjets) are also used to spray in wide swathes (e.g. used to spray bracken under
maturing radiata pine that can cover up to five rows at a time) (based on Pers. com. 1 and industry
experience).
4WD agricultural bike / all terrain vehicle (ATV) or larger machine mounted mini-systems can be trailed
behind such machines. Tank size on the agricultural bike is 100 L. Pressure nozzle boom sprayer kits
come with fixed 2 and 3 m booms and folding 3, 4, and 6 m booms. Larger booms up to 18 m for towing
by utilities and tractors are also available for pressure nozzle or control droplet application (CDA)
application (based on Pers. com. 1 and industry experience).
Manual spraying equipment
Knapsacks
Hand knapsacks are used for difficult work which cannot be achieved by using a trailed boom spray e.g.
for spraying around individual trees in areas not accessible to tractors and for noxious weed control. The
semi-pressurised sprayer usually holds 15 L of spray mixture. Pressure is provided in a small pressure
dome by semi-continuous pumping while spraying. The main volume of spray is not under pressure, and
the knapsack is moulded in a comfortable shape. There are three types of nozzles usually supplied with
knapsack sprayers - these are flat fan, solid cone and hollow cone. The flat fan nozzle provides a more
even spray distribution and is generally preferred. Hollow cone nozzles are used more for insecticide and
fungicide application. To avoid drift, the nozzle is held close to the target and it is important to keep the
pressure in the knapsack constant by steady pumping. Soluble dyes are available to indicate where
spraying has occurred (based on Pers. com. 1 and industry experience).
- 40 -

Chemical pesticide usage by Australian forest plantation industries
Spot sprayers
The DuPont Velpar 'Forestry Spot Gun®' is a controlled dose applicator based on the principle of a drench
gun, in that it applies a measured volume of chemical pesticide mixtures through a spray wand to the
target species. For ease of use the spot gun is attached to a lightweight plastic back-pack. Mixed
chemical pesticides are usually sprayed through a solid cone nozzle, but it can be applied as a solid
stream with drenching, or a 'soil spear' attachment for injecting chemicals such as hexazinone and
clopyralid into the soil at the base of woody weeds. For spraying, the area of application can be varied to
some extent by varying the height of application. Rather than adjusting the volume applied, the rate is
usually adjusted by dilution. The equipment is used for spot spray application for controlling young short
wattle, eucalypt and other woody weeds and grasses, and for weed control in less accessible areas. It is
also used for 'slash and squirt' herbicide application to small cut stumps (based on Pers. com. 1 and
industry experience).
Controlled Droplet Applicators (CDA) for ULV use
CDA equipment or rotary atomisation delivers very small droplets at a high concentration of chemical
pesticides. Often the chemical requires little, if any dilution, and mixture application rates can be varied
from 0.05 to 30 L/ha. The method is suitable for pre- and post-planting ULV spraying along planting lines.
Where soil conditions make use of heavy machinery impossible e.g. on wet sites with duplex soils, CDA
has been used instead. Marker dyes allow identification of sprayed areas (based on Pers. com. 1 and
industry experience).
The Micron Herbi® is a CDA applicator for special situations in forestry use. It has a spinning disc
powered by batteries in the battery handle. The motor is governed so that the disc rotates at a constant
1,700 rpm. Flow rates can be varied by the use of different colour-coded nozzles. The applicator
produces droplets in the range of 250 to 280 µm, and is suitable for applying chemical pesticides, in a
controlled swathe. ATV mounted units may be used for applications of herbicides in situations otherwise
inaccessible to larger equipment (based on Pers. com. 1 and industry experience).
Wick wipers
Trailed wick wipers
Ropewick applicators may be used when applying chemical pesticides at high rates. There are also
‘brush roller’ types, and carpet and ropewick wipers useful for the application of herbicides such as
metsulfuron methyl or glyphosate to bracken fern, where the stomata are on the back of the fronds.
Sensors may be used to determine the moisture level of the wick. A low pressure pump cuts in to keep
the level relatively constant, thus removing the effect of vehicle speed from consideration (based on Pers.
com. 1 and industry experience).
- 41 -

Chemical pesticide usage by Australian forest plantation industries
Hand-held weed wipers
Hand-held weed wipers are more of a domestic tool, but may be useful where trees are susceptible to
herbicide damage by drift. Herbicides (e.g. glyphosate) is usually applied, by wiping unwanted vegetation
in two directions with a saturated wick, kept wet by gravity feed from a bottle of herbicide attached to the
top of the handle. A concentrated herbicide is usually applied so that it is important to avoid contact of the
wick with young trees. Weed wipers are suitable for grasses and broadleaved weeds, but not blackberry
which will quickly ruin the wick (based on Pers. com. 1 and industry experience).
Stem treatments
Frill treatment and stem injection
This equipment is used to inject herbicide directly into the sapwood to kill unwanted trees (from saplings
to large trees) or to apply systemic insecticides. Holes are bored or punched into the sapwood and
systemic chemical (herbicide or insecticide) poured or injected into the holes. The correct dosage is
achieved by an accurately calibrated applicator. Application can be either basal or at breast height,
depending on the equipment being used. Horizontal cuts at intervals of the circumference are made
through the bark at an angle to the sapstream of woody weeds, and a controlled dose of liquid herbicides
such as glyphosate, triclopyr or picloram is injected. Injection may be through an axe head (based on
Pers. com. 1 and industry experience).
For example, the Sirax® stem injector developed by Mr Bill Kerruish at CSIRO, is designed for dense
young forest stands where many small trees must be treated. The injection hatchet can treat stems as
small as 20 mm in diameter. Air pressure drives the chemical storage/pressure cylinder, which injects 1
mL of chemical into the tree under a pressure of 150 to 600 kPa. Alternatively, the Velpar Spot Gun® is
commonly used after notching the tree with an axe (based on Pers. com. 1 and industry experience).
Cut stump treatments
If a suitable herbicide is applied to newly cut stumps, many woody species can be effectively controlled.
The stump should be cut as low as possible and treated within a few minutes of cutting because xylem
vessels plug very quickly, thereby preventing absorption. Spraying stumps with a knapsack, drench gun
or swabbing liberally with herbicide using a paint brush are effective methods, but sufficient herbicide
must be applied to thoroughly wet the sides of the stump as well (based on Pers. com. 1 and industry
experience).
Basal bark treatments
This is often used to control woody weed regrowth in plantation forestry situations. Application is usually
carried out by means of a back-pack with variable stream nozzles at low pressure to reduce deflection of
solution. The whole circumference of the trunk of the woody weed is treated low to the ground, and often
diesel oil is used as a carrier for triclopyr and picloram herbicides (based on Pers. com. 1 and industry
experience).
- 42 -

Chemical pesticide usage by Australian forest plantation industries
Current practice – aerial application
Industry overview
The first use of aerial application in agriculture in Australia occurred in 1947 (AAAA, 2006a). The area
treated annually has grown to over 10 million ha/yr, with around 130 operators Australia wide (Mackay,
2004). The industry peak body is the Aerial Agricultural Association of Australia (AAAA) and members
undertake over 90% of all air agricultural operations (Mackay, 2004). The AAAA has a chemical
application policy which covers the aerial application of agricultural inputs (AAAA, 2001). Aerial
application of chemical pesticides is critical to bananas, cotton, sugar cane, potatoes and is used for
pasture top dressing (AAAA, 2006b).
The Industry survey results indicated that around 23,000 ha/yr and 1,500 ha/yr are treated with herbicides
and insecticides respectively by plantation forestry managers using aerial application as a tool (the total
area of forest plantations reported to be treated with insecticides varied from 25,540 ha in 2003, 32,695
ha in 2004 and 31,112 ha in 2005). There is some use of aerial application of fertiliser. (Note: the industry
survey for the aerial component did not cover the same percentage as the main survey.) Even if the
actual area treated aerially is 50,000 ha/yr, plantation forestry would represent less than 0.5% of the
aerial application occurring across Australia each year.
Aerial application allows effective pesticide application where:
• Ground conditions restrict machine access due to slope, wet conditions and rough surfaces;
• There is a limited window of opportunity due to weather and maximum application speed is
required;
• Where there is the need for a rapid response to a pest out-break;
• Where crop heights restricts access.
Fixed wing application
The history of fixed wing application is one of innovation, and much of this has revolved around Field Air
based at Ballarat (established in 1963). Around 30 years ago Pawnee aircraft could deliver payloads of
about 50 kg at speeds of 120-150kph. Today a variety of Air Tractor aircraft (AT 402, 502, 602 and 802)
can deliver payloads of up to 3 tonnes, at speeds of 200 to 250 kph. Applications of fertilisers, chemical
pesticides, seed and baits as well as fire-bombing are possible operations (based on information
collected from Pers. com. 2 and industry knowledge).
Trials and applications
Fixed wing application is cheaper and generally faster than helicopters but more often is used where
there are large contiguous areas of plantation in relatively flat terrain. Field Air was the operator in trials
carried out in association with the SA Woods and Forests Department and Dr David Boomsma in the
1960’s. Extensive trial work was also carried out in association with State Forests of NSW. This involved
- 43 -

Chemical pesticide usage by Australian forest plantation industries
extensive pattern testing for spray deposition and solids application, and the determination of coefficient
of variance (CV) spreading patterns. Strict contract specifications were a result of this work and Standard
Operating Procedures (SOP’s) that are constantly reviewed, became an intrinsic part of operations. Field
Air annually completes independent spreader pattern testing to achieve the best possible CV spreading
patterns (based on information collected from Pers. com. 2 and industry knowledge).
Technology development and application
Satellite marking with global positioning systems (GPS) differential correction and geographic information
systems (GIS) mapping and data logging compatible with mapping have become routine, so that accurate
overlays of swathes are automatically generated. Nozzle development for spraying has seen a change
from micronairs, used up until about 10 years ago, to the versatile CP (CP Products Inc. USA) hydraulic
nozzles that allow a variable but controlled spectrum of droplets with less fine droplets. These are the
most popular aircraft nozzles, which can be changed to alter droplet size and application rate at the
nozzle. Change is effected by altering the angular deflection to break up droplets, and by altering the
aperture size. One development that has not been widely adopted by forestry is variable rate technology
(VRT) application for solids including fertilisers and herbicide granules. This is widely used in agriculture
for fertilisers but requires soil monitoring and nutrient testing beforehand. However, there is potential for
its use in plantation forestry, including variable rate application of granular herbicide products, and of
liquid applications. Bulk loading and handling equipment is also used. For example, Field Air spray
loading equipment consists of 8 and 3 tonne spray truck units with specific chemical agitation equipment.
Other loading equipment includes a purpose built bulka-bag crane to handle 1 tonne bulka-bags (based
on information collected from Pers. com. 2 and industry knowledge).
Helicopter application
Background need
In 1981, radiata pine plantation failures on the west side of the ACT (Kowen Forest) were related to boron
deficiency. The logical questions were - what were the appropriate boron products and how were they to
be applied? A forester, Colin Johnston, trialled fixed wing aerial application, without success. Helicopter
application was then attempted, but the operator had no forestry experience and again the work was a
failure. In Victoria, prior to 1987 there had been some helicopter application of hexazinone to radiata pine
in the NE of the State, but there were no standard procedures and only a basic understanding of the
method. Because there was off-target damage, the State government placed a moratorium on aerial
herbicide application in radiata pine (based on information collected from Pers. com. 3 and industry
knowledge).
Development process
Johnston tried aerial weed control treatments but again, poor equipment led to failures. Consequently, he
purchased equipment, built booms with improved nozzles and carried out pattern trials. He took the
equipment to the Centre for Pesticide Application and Safety at Gatton College, Toowoomba Qld, where
- 44 -

Chemical pesticide usage by Australian forest plantation industries
further pattern trials with Dr Nick Woods were conducted in 1983-84 (based on information collected from
Pers. com. 3 and industry knowledge).
For boron application, Johnston rebuilt the buckets and spinners and helicopter boron application
problems were overcome, with a set of stringent specifications included. The combined development of
this equipment allowed applications of high analysis fertilisers as well as spraying operations. Trials with
Monsanto were conducted in 1983-84 and included the first applications of glyphosate and metsulfuron
methyl combinations for the control of blackberry and pine wildlings (based on information collected from
Pers. com. 3 and industry knowledge).
In 1984 at a forestry management conference in Canberra (Landsberg and Parsons, 1984) Johnston’s
equipment was demonstrated at a field day. Subsequently, a proposal was put to the Victorian
Department of Conservation, Forests and Lands to aerially treat up to 3,000 wattle infested hectares of
radiata pine plantation in the North East and Strzelecki Ranges near Yarram. With stringent
specifications, Johnston was contracted as consultant/supervisor and the operation eventually proceeded
successfully, after the moratorium on aerial spraying was lifted in 1987 (based on information collected
from Pers. com. 3 and industry knowledge).
Forest Air Helicopters
Johnston bought a helicopter and founded Forest Air Helicopters Pty Ltd (FAH) in 1988 (FAH, 2006). FAH
today operates out of Albury. The technological developments in helicopter applications for plantation
forestry have been largely brought about by FAH (based on information collected from Pers. com. 3 and
industry knowledge).
Granule technology
In 1989, Mr Ray Fremlin of Conservation and Land Management (CALM) in Western Australia organised
a demonstration of helicopter application. A community campaign, objecting to land acquisition by CALM,
included opposition to aerial spraying. However, while the community pressure was successful against
liquid spraying, DuPont and Johnston were able to successfully launch the herbicide granule technology
with the introduction of a specialist spreader from the USA. DuPont supplied the equipment and technical
advice to conduct a trial with a 90% active hexazinone granule. This initial trial was the embryo of what is
now normal silvicultural practice with granules supplied by Macspred (based on information collected from
Pers. com. 3 and industry knowledge).
Broader application
Fixed wing trials in SA were alluded to earlier, but Mr Mike Bleby (SA Woods and Forests Department)
organised trial work in 1990 with FAH. In 1990, CSIRO in Tasmania contracted FAH for fertiliser work in
eucalypt native forest in the Huon Valley. Also in 1991, Australian Newsprint Mills, Forestry Commission
Tasmania and APPM contracted FAH to successfully overcome previous seeding problems in native
forests. Up until 1996, FAH were carrying out spraying, fertilizing and seeding operations in Tasmania
with the Forestry Commission Tasmania, ANM and CSIRO. However, the period 1989-94 was also
- 45 -

Chemical pesticide usage by Australian forest plantation industries
marked by considerable community unrest about aerial spraying in plantations, particularly in WA and
Victoria. In 1991, FAH conducted successful strip trials, and pre-plant and granular trials in SA. In Victoria
it was becoming a normal silvicultural operation for FAH to aerially apply herbicides in autumn and spring.
Similar work commenced at Tumut for State Forests NSW in 1989 and has now expanded to up to 8,000
hectares per annum total with autumn, spring and summer applications (based on information collected
from Pers. com. 3 and industry knowledge).
Technology evolution - application technology
Dothistroma septospora was epidemic in 1991, and treatment with copper oxychloride at high volumes
was applied in the Armidale/Tamworth region of northern NSW. FAH asked Micronair in the UK to build
hydraulic micronairs, which led to FAH being able to apply 1.6 kg/ha of high analysis copper oxychloride
in a mainly oil plus some water spray at 5 L/ha spray volume. 12,000 ha were treated. The ULV technique
was based on information from the New Zealand Forest Research Institute (Dr John Ray) but in NZ, the
application was at 5 L/ha. FAH are the only operators in Australia whose machines are fitted with
hydraulic micronairs. The hydraulic drive units provide a constant cage rpm at the lower airspeeds of
helicopter application, unlike the wind-driven units that are designed for fixed wing application. The
hydraulic micronairs have allowed low volume (30-50 L/ha) pre- and post-planting herbicide applications.
Higher volume rates may be achieved using flat fan nozzles (up to 80 L/ha), and other operators can
spray at 100 to 150 L/ha using Accuflow® nozzles. In 1994, FAH conducted successful ULV trials for
Monsanto with neat glyphosate at 6 to 9 L/ha. For fertiliser applications, FAH developed their own
spinners (centrifugal application) and these allow pattern changes during applications (based on
information collected from Pers. com. 3 and industry knowledge).
Technology evolution - product technology
The mid-90’s saw the development of a relationship with Macspred, which since 2001 has involved Mr
John Campbell (Macspred) carrying out site assessments and writing prescriptions for aerial applications
by FAH, and particularly granular herbicide applications (based on information collected from Pers. com.
3 and industry knowledge).
Technology evolution - data logging and guidance
By 1989, FAH had installed a Microwave Electronic Guidance System in its machine although this was
first used in fixed wing in SA. The system gave very good results in providing an accurate means of
treating specified areas. In 1992, FAH installed GPS units in their machines, and had a ground station for
differential correction. This increased flexibility and allowed the development of logging and mapping
systems. In 1996, MapInfo and Arcview software (GIS) was introduced. Software development has
continued and flight (treatment) information is directly logged into the MapInfo package. FAH write their
own programs. The most recent development has been the fitting to the front of the helicopters a weather
meter probe that automatically records and logs all important weather parameters including wind speed
and direction, temperature and relative humidity (based on information collected from Pers. com. 3 and
industry knowledge).
- 46 -
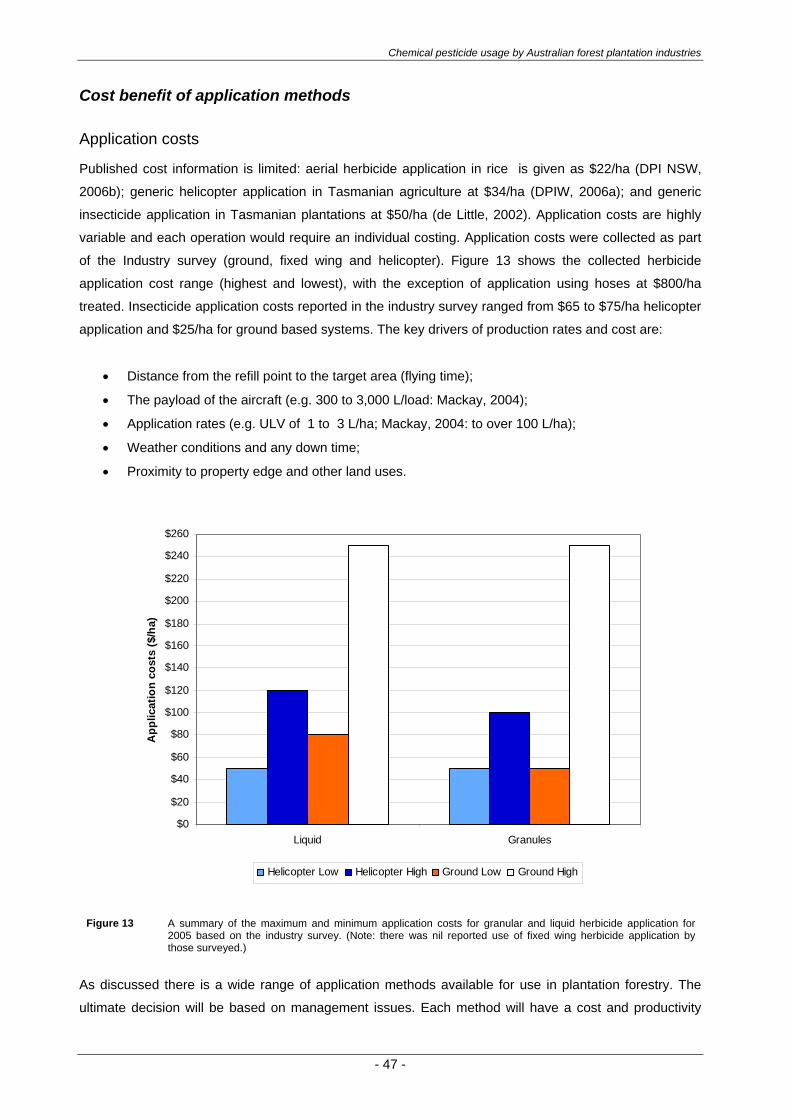
Chemical pesticide usage by Australian forest plantation industries
Cost benefit of application methods
Application costs
Published cost information is limited: aerial herbicide application in rice is given as $22/ha (DPI NSW,
2006b); generic helicopter application in Tasmanian agriculture at $34/ha (DPIW, 2006a); and generic
insecticide application in Tasmanian plantations at $50/ha (de Little, 2002). Application costs are highly
variable and each operation would require an individual costing. Application costs were collected as part
of the Industry survey (ground, fixed wing and helicopter). Figure 13 shows the collected herbicide
application cost range (highest and lowest), with the exception of application using hoses at $800/ha
treated. Insecticide application costs reported in the industry survey ranged from $65 to $75/ha helicopter
application and $25/ha for ground based systems. The key drivers of production rates and cost are:
• Distance from the refill point to the target area (flying time);
• The payload of the aircraft (e.g. 300 to 3,000 L/load: Mackay, 2004);
• Application rates (e.g. ULV of 1 to 3 L/ha; Mackay, 2004: to over 100 L/ha);
• Weather conditions and any down time;
• Proximity to property edge and other land uses.
$0
$20
$40
$60
$80
$100
$120
$140
$160
$180
$200
$220
$240
$260
Liquid Granules
App
licat
ion
cost
s ($
/ha)
Helicopter Low Helicopter High Ground Low Ground High
Figure 13 A summary of the maximum and minimum application costs for granular and liquid herbicide application for 2005 based on the industry survey. (Note: there was nil reported use of fixed wing herbicide application by those surveyed.)
As discussed there is a wide range of application methods available for use in plantation forestry. The
ultimate decision will be based on management issues. Each method will have a cost and productivity
- 47 -

Chemical pesticide usage by Australian forest plantation industries
profile specific to the individual operation, and each operation would need to be assessed on that basis. If
chemical pesticides cannot be used, and manual weeding is required at establishment, then a production
rate of 0.0082 ha/person hr per weeding (taking 122 person hrs/ha) or a cost of around $2,000 /ha. In the
absence of the option to use mechanised chemical pesticide application, it can cost up to $800/ha for
manual application using long hoses from a 4WD ute (data from the industry survey). Figure 14 shows
indicative production rates and the costs of application based on the following assumptions for the aerial
options.
• Fixed wing aircraft application was based on a 2,000 L payload, 10 minutes flying to and from the
airstrip and loading, 15 minutes application at 50 L/ha and 10 minutes application at 100 L/ha;
• Helicopter application was based on a 300 L payload, 7 minutes (assumes that the helicopter is
loaded onsite) loading and application at 50 L/ha and 100 L/ha.
Figure 14 demonstrates the impact of time constraints. For example, if a plantation manager must spray
1,000 ha at 100 L/ha, using any of the methods shown in Figure 14, it would take 17 hours by fixed wing,
39 hours by helicopter, and 400 hours with a 4WD ute or 800 hours by skidder. With a two week window
of opportunity (maximum spray time of 14 days by 6 hours/day = 84 hours) it would require one fixed wing
or helicopter operation, or at least 5 utes or 10 skidders. (The choice of application depends on the exact
nature of the operation.)
0
10
20
30
40
50
60
70
80
90
100
110
Fixed wing
Fixed wing
Helicopter
Helicopter
4WD
ute
Skidder
Manual
granules
Manual
backpacks
(50 L/ha) (100 L/ha) (50 L/ha) (100 L/ha) (100 L/ha) (100 L/ha) NA NA
Prod
uctio
n ra
tes
(ha/
hr)
$0$20$40$60$80$100$120$140$160$180$200$220$240$260$280
Cos
ts ($
/ha)
Production rate Application costs
Figure 14 Generic production rates for the application methods shown and the costs of each method (with +/- 10% deviation shown). In general, the slower the process, the higher the cost per hectare treated. The information shown is based on the industry survey; Pers. com. 5; de Little, 2002, Mackay, 2004; industry experience.
- 48 -

Chemical pesticide usage by Australian forest plantation industries
Plantation returns
Insect out-breaks can cause varying degrees of damage to the crop trees (Jenkin et al. in press). To test
the importance of helicopter application the following scenario is applied;
• A high productivity plantation site in difficult terrain is expected to yield 300 m3/ha at age 10 years
(mean annual increment: MAI = 30 m3/ha/yr);
• The site has been established and has grown well with the trees up to well over 1 m tall at age six
months.
Figure 15 shows the result of an insect pest out-break in the first summer. In the first instance the attack
is a 30% defoliation in early summer. If the out-break is detected and is not expected to continue, it may
result in only a minor production loss over the rotation. However, the plantation manager would need to
be very confident of the decision to not act, as if the 30% defoliation continues to 80% in early summer or
a subsequent defoliation of 80% later that summer, would cause a significant production loss. If at the first
detection of the insect pest the damage was light, it could lead to again more complete defoliation later in
the summer, again causing a significant production loss. If the plantation manager treats the pest straight
away, the increased costs are far out weighed by the potential loss avoided.
Base case with nil attack
MAI = 30 IRR = 8.5%
MAI = 30IRR = 8.5%
Late summer yr 1 80% defoliation
MAI = 22.6 IRR = 4.8%
Early summer yr 130% defoliation
Early summer yr 1 80% defoliation
MAI = 22.7IRR = 4.9%
Detect insect pest out- break and treat
MAI = 30 IRR = 8.2%
Figure 15 The modelled impact of an insect pest out-break showing possible outcomes to productivity and financial returns.
A key issue is that the use of a helicopter to apply the insecticide gave a rapid treatment. For a 100 ha
coupe, given the right weather conditions the treatment would have taken around 2 hours. If the site had
- 49 -

Chemical pesticide usage by Australian forest plantation industries
poor machine access and manual methods required, it would take around 500 hrs or 83 days for one
person (6 hrs/day spraying).
- 50 -

Chemical pesticide usage by Australian forest plantation industries
Spray drift Concerns are often raised about chemical spray drift from ground-based or aerial application. The method
of application is often ground-based; however in steep terrain or over large contiguous areas of
plantations, aerial application is commonly used.
Pesticides need to be applied under suitable conditions to ensure intended outcomes are achieved.
Ground-based spraying does not usually result in any significant drift, because spraying should only be
carried out under the most favourable conditions, and in accordance with relevant legislation and codes of
practice. In the second season autumn or later after planting of eucalypts, ground-based treatments may
be applied to the rows and inter-rows using directed nozzles and/or a dual sprayer, and pose little risk of
spray drift, as the trees themselves constitute a significant barrier for chemical spray drift.
Aerial application
Aerial spraying by helicopter usually has a very low probability of drift, given legal constraints on aerial
spraying, the low speed of the aircraft and the configuration of the spray equipment. The likelihood of
spray drift from aerial applications is further minimised by the preference of plantation forestry companies
to use helicopters (as they are more accurate and minimise the likelihood of off-site spray drift). There is a
greater probability of spray drift from applications of pesticides by fixed wing aircraft, because speeds are
higher. Fixed wing aircraft are usually only used in plantations where there are large contiguous areas of
relatively flat terrain, such as in the pine plantation region of the south west of Victoria and south east of
South Australia. Development of spray nozzle technology has been shown to reduce spray drift
(Richardson et al., 1996).
Regulation
To fully scope regulation, the APVMA released a discussion paper relating to spray drift risk in 2006 that
outlined operating principles and registration requirements (APVMA, 2006). Spray drift usually comes
under Control of Use Acts. Section 40 of the Victorian Act, for example, makes it an offence to cause
damage from spray drift by agricultural spraying which:
• Injuriously affects any plants or stock outside the target area;
• Injuriously affects any land outside the target area, so that growing plants or keeping stock on that
land could be reasonably expected to result in contamination of the stock or of the agricultural
produce.
This regulation applies to all chemical users (company, government, professional) and all types of spray
application (aerial, spot spraying, misters, ground driven boom sprays etc). There are licensing
requirements for ground-based application, and for the aerial application of agricultural chemicals in all
States and Territories.
- 51 -

Chemical pesticide usage by Australian forest plantation industries
Application
Specific reports have been prepared (e.g. PISC, 2002) and provide strategies to minimise the risk of
spray drift. They include comprehensive detail on operation planning and implementation. For aerial
application, the Centre for Pesticide Application and Safety at Gatton College, University of Queensland,
Toowoomba conducts week-long advanced training.
It must be emphasised that aerial applications in plantation forestry are small in comparison to other
industries. Multiple applications of fungicides are used in the growing of some varieties of potatoes. For
example, one variety potato grown around Ballarat and used for crisp production is routinely treated with
a rotation of two fungicides up to five times at 10 to 14 day intervals, by helicopter. Similar chemical
regimes apply in other Australian states. As noted elsewhere, there are also extensive aerial treatments
with chemical pesticides applied annually to crops such as rice, cotton, wheat and grain crops and
canola.
- 52 -

Chemical pesticide usage by Australian forest plantation industries
Analysing chemical usage
Area treated
There are three basic spray treatment spatial arrangements and the land units are expressed on the
actual area treated or the area planted. The three basic arrangements are:
1. 100% coverage or broadcast spraying of all the area under the trees (planted = treated area);
2. Strip spraying on a line either on the mounds or in the inter-row. A 2 m wide strip treated with
rows 4 m apart would spray 0.5 ha / ha planted giving 50% treatment;
3. Spot spraying around the planted tree. A 2 m diameter circular spot would spray 3.1 m2/spot. At
1,000 stems/ha, this would spray 0.3 ha / ha planted or 30% treatment.
Chemical attributes
The chemical pesticides used in plantation forestry and agriculture in Australia have a wide range of a.i. and concentrations. However, the number of individual chemicals used in plantation forestry is far more
limited than in agriculture. A fundamental basis of any analysis is the units to be used. Table 4 shows a
range of chemical pesticides with details of the a.i., the a.i. concentrations and generic costs (note: the
costs are based on local supplier prices in Victoria, in 2006). (A complete list of product names for each
a.i. can be sourced on the APVMA web site.) Of more importance are the rates at which the products are
used. Rates are expressed on a per hectare treated basis. Label application minimum and maximum
rates were recorded for the a.i. shown in Table 4 and these were plotted against the product price per unit
sold (volume or weight) to test whether chemical pesticide spending is a reasonable index of pesticide
use. (See Appendix G.) In the pesticides analysed, in general, as the price per unit increases, the
application rate (a.i./ha) decreases. The main exception is hexazinone, which is a major softwood
plantation forestry chemical pesticide.
- 53 -

Chemical pesticide usage by Australian forest plantation industries
Table 4 A break down of product costs per unit, concentration and cost per a.i.. Cost data is based on a Victorian supplier
for 2006.
Broad group a.i. a.i. a.i. Product
(name) (units) (quantity) (units) ($/unit) ($/kg a.i.)
Fungicides
Benomyl
kg/L 0.500
L $73.60
$147.20
Copper oxychloride
kg/L 0.500
L $13.30
$26.60
Mancozeb
kg/kg 0.800 kg $7.50 $9.38
Mancozeb/metalaxyl
kg/kg 0.640 kg $20.50 $32.03
Herbicides 2,4 - D amine
kg/L 0.625 L $7.75 $12.40
Amitrole
kg/L 0.250 L $8.34 $33.36
Atrazine
kg/kg 0.900 kg $7.20 $8.00
Clopyralid
kg/kg 0.750
kg
$133.00
$177.33
Clopyralid
kg/L 0.300
L
$53.20
$177.33
Diquat
kg/L 0.200 L $21.75 $108.75
Fluroxypyr
kg/L 0.200
L
$21.10
$105.50
Glyphosate
kg/L 0.450 L $3.90 $8.67
Haloxyfop
kg/L 0.520 L $160.00 $307.69
Hexazinone
kg/kg 0.750 kg $89.00 $118.67
Linuron
kg/kg 0.500 kg
$42.50 $85.00
Metsulfuron methyl
kg/kg 0.600 kg
$90.00 $150.00
Oxyfluorfen
kg/L 0.240 L $29.50 $122.92
Paraquat
kg/L 0.200 L $10.25 $51.25
Pendimathalin
kg/L 0.455
L $7.20
$15.82
Simazine
kg/kg 0.900 kg
$7.20 $8.00
s-metolachlor
kg/L 0.960 L $23.00 $23.96
Sulfometuron methyl kg/kg 0.750 kg
$235.00 $313.33
Insecticides
Alpha-cypermethrin
kg/kg 0.100
kg
$11.40
$114.00
Carbaryl
kg/kg 0.500 kg $10.62 $21.24
Chlorpyrifos
kg/kg 0.500 kg
$9.00 $18.00
Dimethoate
kg/L 0.400
L
$6.98
$17.45
Fipronil
kg/L 0.200 L
$318.27 $1,591.35
Imidacloprid
kg/L 0.200 L
$240.00 $1,200.00
Maldison kg/L 0.500 L $7.70 $15.40
- 54 -

Chemical pesticide usage by Australian forest plantation industries
General herbicide prescriptions Investment in herbicides in a plantation crop is a function of site, crop and management objectives. A
plantation manager must develop site specific regimes to match the site’s needs and the management
objectives. The following present typical plantation competition control regimes for hardwood and
softwood plantations in Australia (following the inputs shown in Figure 10) as an example of the range of
options currently implemented. The information is split between temperate and sub-tropical/tropical
Australia. Information presented is based on industry experience, Pers. com. 6 and Pers. com. 7.
Appendix H contains details of the typical regimes and flow charts of the regimes for Tasmanian blue gum
and radiata pine. Appendix D presents a summary of the specific a.i. used in plantation forestry. As a
convention, application rates of 100 g a.i./ha or less are expressed as XX g a.i./ha, and greater than 100
g a.i./ha are expressed as XX kg a.i./ha.
Temperate eucalypts
Initial site clean-up
This is usually either an application of glyphosate or a tank mixture of glyphosate, metsulfuron methyl and
an organosilicone surfactant. On first rotation pasture sites in southern Australia, a typical broad acre
prescription could be 0.72 to 1.44 kg a.i./ha of glyphosate, 6 to 9 g a.i./ha metsulfuron methyl, plus an
organosilicone surfactant at 0.2% v/v. Sometimes oxyfluorfen is added at 18 g a.i./ha as a swathe marker.
Pre-plant weed control
There are two main prescriptions in southern Australia, both usually applied to the rows (or mounds).
Glyphosate and metsulfuron methyl can be omitted if the mounds are weed free. If weed is present,
usually glyphosate use at 0.72 to 1.08 kg a.i./ha is sufficient. Metsulfuron methyl is usually applied at 6 to
9 g a.i./ha, and sulfometuron methyl if used either instead of metsulfuron methyl or in addition, at no more
than about 22 g a.i./ha. If the site is thistle prone, or has a major capeweed problem, clopyralid is added
at 0.15 to 0.60 kg a.i./ha. However, the high rates of clopyralid are usually to control some weeds better
controlled by low rates of other herbicides.
The second prescription is a propriety WDH product which contains terbacil and sulfometuron methyl. It is
a pre-packaged 1 kg/ha product in a water soluble bag which contains 880 g terbacil and 40 g
sulfometuron methyl. It is also usually only applied to the mounds. It may also be mixed with glyphosate
and clopyralid at the rates indicated in the previous prescription description. It is not as well favoured on
sandy soils because chemical, particularly sulfometuron methyl, is too easily lost through leaching.
Post-plant weed control
On ex-pasture sites, these are usually recovery treatments arising from the breakdown of the pre-planting
treatment. Typically, a combination of haloxyfop with clopyralid is used, often with simazine. The
haloxyfop rate depends on the grass density and development and is usually in the range of 0.10 to 0.42
kg a.i./ha. The clopyralid rate is usually in the range of 90 g a.i./ha to 0.18 kg a.i./ha, and simazine if
- 55 -

Chemical pesticide usage by Australian forest plantation industries
added is usually at rates of 1.50 to 2.5 kg a.i./ha. Sometimes the presence of wild radish or wild turnip
requires the addition of metosulam at rates of 5 to 7 g a.i./ha.
Maintenance
Maintenance works are reactive to the development of pest weeds post the establishment year.
Treatments to Tasmanian blue gum include a directed spray application to the mounds, a granular
treatment (also to the mounds), and a separate treatment to the inter-rows. For spray applications, dual
sprayers are commonly used, with a mound treatment by directed spray comprising a mixture of amitrole
or glyphosate, simazine and sulfometuron methyl. Amitrole is usually at 0.25 to 0.50 kg a.i./ha or
glyphosate at 0.36 to 0.72 kg a.i./ha. Both result in a certain amount of bottom leaf scorch with a transient
effect. Simazine is usually applied at a total rate to mounds and inter-rows of 2.50 to 4.00 kg a.i./ha.
Sulfometuron methyl, usually applied only to the mounds, is at rates of around 20 to 40 g a.i./ha.
A proprietary granular treatment is a dry granule at 30 kg/ha of product, delivering 1.32 kg a.i./ha of
terbacil and 60 g a.i./ha of sulfometuron methyl. The granules require up to 50 mm of rainfall for
activation, and this slows chemical release. The granules can also be applied aerially by helicopter on a
row basis, or by ground-based methods, including spot treatments to individual trees.
Sub-tropical/Tropical Hardwoods
Initial site clean-up
This is usually either an application of glyphosate or a tank mixture of glyphosate, metsulfuron methyl and
an organosilicone surfactant, or fluroxypyr. Farm forestry treatments for eucalypt establishment in
Queensland can include (for woody weed problems), fluroxypyr at 0.40 kg a.i./ha applied with glyphosate
once pre-planting and pre-site preparation. Alternatively, triclopyr at 90 g/100L plus picloram at 30 g/100L
may be applied once, pre-planting and pre-site preparation. For woody weed control on eucalypt sites,
metsulfuron methyl at 24 to 36 g a.i./ha is applied, or glyphosate at 1.44 kg a.i./ha with 0.20 kg a.i./ha
fluroxypyr for mullein (tobacco weed) control.
Pre-plant weed control
For eucalypt establishment in northern New South Wales, after ripping and mounding and a second
cultivation of the mounds, glyphosate at 1.44 kg a.i./ha, simazine at 2.50 kg a.i./ha and s-metolachlor at
1.44 kg a.i./ha is a standard prescription (under APVMA permit). Farm forestry treatments for eucalypt
establishment in Queensland can include one or two strip (row) treatments with glyphosate at a rate of
1.80 kg a.i./ha (applied to half the area with a 2 m inter-row spacing), plus (for the immediate pre-planting
treatment) 4.80 to 6.00 kg a.i./ha of simazine.
Post-plant weed control
Vegetation is usually retained on the inter-row. However, a second post-planting application may be
made in either the first or second seasons by shielded spray. Haloxyfop plus clopyralid is applied outside
the shield onto the mounds, and inside the shield glyphosate at up to 1.44 kg a.i./ha plus fluroxypyr at
- 56 -

Chemical pesticide usage by Australian forest plantation industries
0.96 kg a.i./ha is applied to the outside of the mounds and part of the inter-row. Slashing may be used
instead of the inside application.
In northern New South Wales, post-planting treatments to eucalypts are similar to the late first season
treatment to hardwood plantations. Haloxyfop at 0.130 kg a.i./ha plus clopryalid at 0.30 kg a.i./ha with or
without simazine at 2.50 kg a.i./ha is a standard prescription. The addition of simazine depends on the
amount of bare ground and the time of treatment. In Queensland, glyphosate/fluroxypyr mix (2.70 kg
a.i./ha glyphosate plus 0.40 kg a.i./ha fluroxypyr) is used as a directed spray. For some site-specific
problems such as brassica or thistles, a permit for diflufenican has been requested based on trial
demonstration of efficacy.
Maintenance
Farm forestry post-planting treatments to eucalypts in Queensland can include up to three or four directed
row applications of glyphosate at 1.80 kg a.i./ha plus simazine at 4.80 to 6.00 kg a.i./ha in the first year
and a further one to two applications in the second year. In a small percentage of cases, fluazifop-p-
butyl can replace glyphosate in one to two first year treatments at a rate of 0.37 kg a.i./ha. Oils and
surfactants are commonly used, such as canola oil with glyphosate and alcohol alkoxylates (with
fluazifop), both at about 20 mL/10 L of spray mix. Fluroxypyr may be applied once to control woody
weeds when the plantation is more than 3 years old; alternatively, triclopyr at 90 g/100L plus picloram at
30 g/100L may be applied once in northern Queensland eucalypts.
Temperate softwoods
Initial site clean-up
On 1R pasture sites in southern Australia, a typical broad acre prescription could be 0.72 to 1.44 kg
a.i./ha of glyphosate, 6 to 9 g a.i./ha metsulfuron methyl, plus an organosilicone surfactant at 0.2% v/v.
Sometimes oxyfluorfen is added at 18 g a.i./ha as a swathe marker. On 2R radiata pine sites, woody
weeds including native species are usually a major consideration, as well as pine regeneration.
Glyphosate rates are usually as high as permitted, e.g. 2.16 kg a.i./ha, together with metsulfuron methyl
at 60 to 96 g a.i./ha plus organosilicone surfactant at 0.2% v/v. Fluorinate and carfentrazone are being
developed in combinations with glyphosate and metsulfuron to control pine wildlings.
Pre-plant weed control
More often herbicide treatments are applied post-planting in radiata pine depending on initial site clean-
up. However, hexazinone is the main pre-planting herbicide, applied at rates of 1.50 to 3.80 kg a.i./ha
depending on site factors. The low rates are used on ex-pasture sites and the highest rate on woody
weed sites, about 1 month before planting. The products used are either dry granules or a Dry Flowable
(DF) spray mix.
- 57 -

Chemical pesticide usage by Australian forest plantation industries
Post-plant weed control
Post-plant weed control is more usual than pre-plant. The chemicals used as spray or granular treatments
include hexazinone, atrazine, amitrole and clopyralid. Treatments with hexazinone or hexazinone/atrazine
combinations are usually about one to two months after planting. If used alone, the hexazinone rate
varies from about 1.50 to 3.80 kg a.i./ha, depending on the site and weed characteristics. If used in
combination with atrazine, the rates are usually 1.50 to 2.00 kg a.i./ha, with the major granular product
and WDH formulations being 1.50 kg a.i./ha plus 4.50 kg a.i./ha of atrazine. Forests NSW have
experimented with a rate of 0.75 kg a.i./ha in combination with atrazine.
There have been extensive plantings of maritime pine (Pinus pinaster) on nutritionally poor sands in
Western Australia in recent years. There is little or no weed control at establishment. Instead the rows are
scalped and the trees planted. At about age one year, in cold conditions in mid-winter, the trees may be
over sprayed, usually with 0.36 kg a.i./ha glyphosate, but sometimes with chlorsulfuron (related to
sulfometuron and metsulfuron) at low rates of about 12 to 24 g a.i./ha
Maintenance
Clopyralid is usually applied later in the early stages of plantation development to control emergent or
suckering silver wattle. Use rates for clopyralid vary from 0.15 to 2.55 kg a.i./ha, depending on the growth
stage of the wattle, and whether clopyralid is being applied as a pre-emergence treatment. The high rates
are only applied for silver wattle control at 6 to 7 years and close to canopy closure. Amitrole is used in
South Australia and has been used in New South Wales, in combination with atrazine as an aerial second
season treatment. The amitrole rate is usually in the range 0.37 to 0.50 kg a.i./ha with atrazine at 4.50 kg
a.i./ha.
Tropical and sub-tropical softwoods
Initial site clean-up
In northern New South Wales, pre-planting clean-up treatments for exotic pine species (including hybrids)
include skidder or aerial application of glyphosate at 2.16 kg a.i./ha plus metsulfuron methyl at 60 g
a.i./ha. For hoop pine (Araucaria cunninghamii), pre-site preparation treatment is glyphosate at 2.16 kg
a.i./ha plus metsulfuron methyl at 60 g a.i./ha, in order to control wildlings as well as other weeds. In
Queensland, pre-planting treatment for the establishment of exotic tropical pines is usually an aerial
application of glyphosate at 2.70 kg a.i./ha plus fluroxypyr at 0.40 kg a.i./ha. For woody weeds, triclopyr or
triclopyr/picloram applications are used, and for wildling pine, 2,4-D isopropylamine is preferred, because
results have shown that glufosinate-ammonium is not effective all year round.
Pre-plant weed control
In northern New South Wales pre-planting treatments for exotic pine species can be either glyphosate at
1.44 kg a.i./ha plus sulfometuron methyl at 75 g a.i./ha aerially, or if to bare soil, only the sulfometuron
methyl component. For hoop pine, pre-planting treatment is with glyphosate at 1.44 kg a.i./ha plus
simazine at 5.00 kg a.i./ha plus fluroxypyr at 1.44 kg a.i./ha.
- 58 -

Chemical pesticide usage by Australian forest plantation industries
Post plant weed control
In northern New South Wales, post-planting treatment to the exotic pines includes haloxyfop at 0.13 kg
a.i./ha plus clopyralid at to 0.30 kg a.i./ha. Post-planting treatments in Queensland are usually either
simazine at 4.50 kg a.i./ha over the trees, or combined with 1.35 kg a.i./ha of glyphosate by directed
spray.
Maintenance
Further applications of the post-planting treatment may be required within the first two years.
- 59 -

Chemical pesticide usage by Australian forest plantation industries
Pesticide use over a crop life
Basis of analysis
Any discussion of chemical pesticide use needs to be based on an understanding of the application
regime over the life of a crop. (Appendix H contains details of typical plantation forestry regimes based on
a combination of information from the industry survey, operational and research experience.) In order to
compare with agricultural crops, “standard crop regimes” were explored. Gross margin analysis is a
method of comparing agricultural crops: between crops or between years for a single crop. The analysis
presents the variable inputs costs, which often gives very detailed information on the chemical pesticide
regime applied. Gross margins for a wide range of crops, in different regions, are prepared by State
Government agricultural departments and published on the web (with periodic updates). It is recognised
that gross margin analysis is a generic approach, but was considered as appropriate for the broad scale
comparisons as follows.
A single crop
Crops vary in their chemical pesticide inputs each year and the inputs over the life of a crop. Plantation
forestry differs from many other agricultural crops. In general plantation forestry has the majority of
chemical pesticide inputs in the first two years, with other inputs over the balance of the crop life on a
reactive basis (i.e. to treat a pest out-break). Table 5 presents a generic regime to grow a first rotation
(1R ex-pasture site) Tasmanian blue gum crop. The regime assumes a high degree of weed control. It
also includes a reactive insecticide treatment to control an out-break of autumn gum moth (Mnesampela
privata) at age 3 years. Based on the industry survey, the most commonly used insecticide is alpha-
cypermethrin, and it was assumed to be used at the registered maximum rate of 300 mL/ha for this pest.
Figure 16 presents the inputs to age 10 years when the crop is clearfallen and re-planted in the same
year (the 2R crop). (If a coppice crop is used, then herbicide inputs would be minimal.)
Table 6 and Figure 17 shows the chemical pesticide inputs for an onion crop growing in Tasmania (DPIW,
2006b) where all the inputs are in the one year for a single crop. Table 7 and Figure 18 show the
chemical pesticide inputs required to grow a banana crop on the Atherton Tablelands in far north
Queensland (DPI Qld, 1999). The banana enterprise has a one year plant crop followed by six years of
“ratoon” crops (regrown from the plant crop) to give a total crop life cycle of 7 years. It is difficult to make
a meaningful comparison between the three crop regimes due to differences in the quantity and actual a.i.
used, and the timing and degree of repetition of application. This can be addressed by considering the
management of an estate of each crop.
- 60 -

Chemical pesticide usage by Australian forest plantation industries
Table 5 A generic regime used in a 1R Tasmanian blue gum plantation.
Operation Year Active ingredient Rate $/ha planted Comments
Pre-planting clean-up
1 Glyphosate 720.0 g a.i./ha $12.26 Broadcast 100% of area
Metsulfuron methyl
6.0 g a.i./ha
Adjuvant 0.2 L/ha Pre-planting residual plus knockdown
1 Glyphosate 720.0 g a.i./ha $25.05 Strip application (50% coverage) to 100% of the area
Simazine 4.0 kg a.i./ha Sulfometuron
methyl 22.5 g a.i./ha
Adjuvant 0.2 L/ha Post-planting recovery
1 Haloxyfop 130.0 g a.i./ha $80.84 Recovery operation strip (50% coverage) to 100% of area
Simazine 4.0 kg a.i./ha Clopyralid 180.0 g a.i./ha Post-planting 2 Amitrole 500.0 g a.i./ha $28.96 Strip application (50% coverage) to 100% of the
area Simazine 4.0 kg a.i./ha Sulfometuron
methyl 22.5 g a.i./ha
Reactive insect control
3 Alpha-cypermethrin
30.0 g a.i./ha $5.00 Autumn gum moth attack in year 3, treating 100% of the planting.
$0
$20
$40
$60
$80
$100
$120
1 2 3 4 5 6 7 8 9 10 11 12 13 14 15 16 17 18 19 20
Crop year
Ann
ual s
pend
($/h
a/yr
)
Insecticdes
Hebicides
Figure 16 The pesticide inputs to a single 1R crop of Tasmanian blue gums on an ex-pasture site and then to
develop a planted 2R crop on the same site. (Costs are as per Table 5.) The first crop is harvested and re-established in year 11.
- 61 -

Chemical pesticide usage by Australian forest plantation industries
Table 6 The chemical pesticide inputs to grow a single crop of onions in Tasmania (taken from DPIW, 2006b).
a.i. a.i. a.i. Product Units/spray Applications Total units a.i. Total
(name) (units) (quantity) (units) (units/ha) (No./ha/crop) (Units/ha) (a.i./ha) ($/ha/crop)
Herbicides Propachlor kg/L 0.48 L 9.00 1 9.00 4.32
Diquat kg/L 0.20 L 1.50 1 1.50 0.30
Paraquat kg/L 0.20 L 1.50 1 1.50 0.30
Ethofumesate kg/L 0.50 L 0.80 1 0.80 0.40
Paraquat kg/L 0.20 L 2.00 1 2.00 0.40
Methabenzthiazuron kg/kg 0.70 kg 0.30 3 0.90 0.63
Ioxynil kg/L 0.25 L 0.50 3 1.50 0.38
Total 11 $400.75
Insecticides Dimethoate kg/L 0.40 L 0.80 2 1.60 0.64
Alpha-cypermethrin kg/kg 0.10 kg 0.25 1 0.25 0.03
Total 3 $37.49
Fungicides Mancozeb kg/L 0.80 L 2.20 5 11.00 8.80
Mancozeb/metalaxyl kg/L 0.64 L 2.50 2 5.00 3.20
Benomyl kg/kg 0.50 kg 1.00 2 2.00 1.00
Copper oxychloride kg/kg 0.50 kg 1.00 3 3.00 1.50
Total 12 12 $495.10
- 62 -

Chemical pesticide usage by Australian forest plantation industries
$0
$100
$200
$300
$400
$500
$600
$700
$800
$900
$1,000
Each crop
Cos
ts ($
/ha/
yr)
Fungicides
Insecticides
Herbicides
Figure 17 The pesticide inputs to grow a single crop of onions in Tasmanian (based on DPIW, 2006b).
- 63 -

Chemical pesticide usage by Australian forest plantation industries
Table 7 A standard regime to manage a banana plantation in northern Queensland based on DPI Qld (1999), with the costs based on the references listed and industry data. a.i. a.i. a.i. Product Units/spray Applications Total units a.i. Total (name) (units) (quantity) (units) (units/ha) (Number/ha/yr) (Units/ha/yr) (a.i./ha/yr) ($/ha/yr)
Plant crop Herbicides Glufosinate-ammonium kg/L 0.200 L 4 4 16.0 3.20 Oryzalin kg/L 0.500 L 4 1 4.0 2.00 Totals 5 $467.94 Fungicides Oil L L 5 6 30.0 Totals $88.68 Insecticides Fenbutatin oxide kg/L 0.550 L 0.37 1 0.4 0.20 Mancozeb kg/kg 0.125 kg 2.5 6 15.0 1.88 Chlorpyrifos kg/L 0.500 L 0.14 1 0.1 0.07 Chlorpyrifos kg/kg 0.010 kg 8.5 1 8.5 0.09 Totals $168.70
Ratoon crop Herbicides Glufosinate-ammonium kg/L 0.200 L 4 2 8.0 1.60 Totals $159.61 Fungicides Propiconazole kg/L 0.250 L 0.4 2 0.8 0.20 Oil L L 5 12 60.0 Mancozeb kg/kg 0.125 kg 2.5 10 25.0 3.13 Totals $442.66 Insecticides Fenbutatin oxide kg/L 0.550 L 0.37 2 0.7 0.41 Clofentezine kg/L 0.500 L 0.25 1 0.3 0.13 Chlorpyrifos kg/L 0.500 L 0.14 1 0.1 0.07 Chlorpyrifos kg/kg 0.010 kg 8.5 1 8.5 0.09 Cadusafos kg/L 0.100 L 36 2 72.0 7.20 Cadusafos kg/L 0.100 L 54 1 54.0 5.40 Chlorpyrifos kg/L 0.500 L 1.5 1 1.5 0.75 Prothiofos kg/L 0.500 L 1 1 1.0 0.50 Totals $1,440.56
- 64 -

Chemical pesticide usage by Australian forest plantation industries
$0
$200
$400
$600
$800
$1,000
$1,200
$1,400
$1,600
$1,800
$2,000
$2,200
1 2 3 4 5 6 7 8
Crop year
Che
mic
al in
puts
($/h
a/yr
)
Fungicides
Insecticides
Herbicides
Figure 18 The chemical pesticide inputs to grow a plant crop and six years of ratoons of bananas in far north Queensland (based Table 7).
Estate development
Given the irregular nature of chemical pesticide inputs to a plantation (in the case shown it was a eucalypt
plantation, but similar patterns occur in a softwood plantation), it is important to examine the pattern of
pesticide inputs to an estate. In a “normal forest”, there are a number of similar areas of trees, planted
over successive years, so that the area harvested is re-planted that same year to give a uniform
woodflow. Assume that 100 ha of eucalypt plantations are established each year for 10 successive years.
In the first year there are 100 ha of plantations in a single stand. After the next year, there is one stand of
100 ha age one year and one stand of 100 ha of newly planted trees (a total estate of 200 ha). By year
ten, there is a total estate of 1,000 ha of trees composed of 10 stands of 100 ha each. Taking the regime
shown in Figure 16, the herbicide inputs for the establishment year (year 1) cost $118.15 /ha ($11,815 for
the stand). In year 2, another $28.96 /ha ($2,896 for the stand) of herbicides are required for the first 100
ha planted, as well as herbicide inputs cost of $118.15 /ha ($11,815 for the stand) for the next 100 ha
planted. The totals estate costs for year two are $11,815 plus $2,896 = $14,711, but spread over 200 ha
to give an estate cost of $73.55 /ha. The total costs are spread over a bigger area, effectively diluting the
herbicide spend. The cycle continues. Figure 19 shows the development of the estate up to a total of
1,000 ha, after which it remains stable as the areas harvested are replanted. All the pesticides used on
the estate each year are totalled (i.e. successive applications of the regime shown in Table 4 and Figure
16) and then divided by the estate area gives an average input per hectare of the estate (Figure 19). With
each successive planting year and the estate expansion, the average pesticide spend is diluted down to
- 65 -

Chemical pesticide usage by Australian forest plantation industries
$10.92 /ha/yr. Contrastingly, if the same is applied to an onion and banana crop building up to an estate
of 1,000 ha, due to the annual pesticide inputs (see Tables 6 and 7 and Figures 20 and 21), the inputs to
the estate increases each year, up to a spend of $933.34 /ha/yr for the onions and $1,911.08 /ha/yr for
the banana crop.
0
200
400
600
800
1,000
1,200
2006
2007
2008
2009
2010
2011
2012
2013
2014
2015
2016
2017
2018
2019
2020
2021
2022
2023
2024
2025
Esta
te (h
a)
$0
$10
$20
$30
$40
$50
$60
$70
$80
$90
$100
$110
$120
$130
Cos
ts ($
/ha)
Estate area ($/ha estate)
Figure 19 The development of a eucalypt plantation estate by increasing the area planted each year by 100 ha up to a total estate of 1,000 ha. The estate average chemical pesticide spend is shown.
- 66 -

Chemical pesticide usage by Australian forest plantation industries
0
200
400
600
800
1,000
1,200
2006
2007
2008
2009
2010
2011
2012
2013
2014
2015
2016
2017
2018
2019
2020
2021
2022
2023
2024
2025
Esta
te (h
a)
$0
$100
$200
$300
$400
$500
$600
$700
$800
$900
$1,000
Cos
ts ($
/ha)
Estate area ($/ha estate)
Figure 20 The development of an onion production enterprise by increasing the area planted each year by 100 ha up to a total enterprise of 1,000 ha. The enterprise average pesticide spend is shown assuming one crop per year is grown.
0
200
400
600
800
1,000
1,200
2006
2007
2008
2009
2010
2011
2012
2013
2014
2015
2016
2017
2018
2019
2020
2021
2022
2023
2024
2025
Esta
te (h
a)
$0
$200
$400
$600
$800
$1,000
$1,200
$1,400
$1,600
$1,800
$2,000
$2,200
Cos
ts ($
/ha)
Estate area ($/ha estate)
Figure 21 The development of a banana plantation by increasing the area planted each year by 100 ha up to a total estate of 1,000 ha. The plantation average pesticide spend is shown.
- 67 -

Chemical pesticide usage by Australian forest plantation industries
Total estate pesticide inputs
It is useful to consider total estate gross chemical pesticide inputs (estate average $/ha * the estate ha).
Figure 22 shows the total estate pesticide inputs to manage the Tasmanian blue gum plantation, the
onion crops and the banana plantation. It shows the development of the estate up to the total of 1,000 ha
for each of the crops discussed previously.
$0
$200,000
$400,000
$600,000
$800,000
$1,000,000
$1,200,000
$1,400,000
$1,600,000
$1,800,000
$2,000,000
20062007200820092010201120122013201420152016201720182019202020212022202320242025
Year
Esta
te c
hem
ical
spe
nd ($
/yr)
Bananas
Onions
Eucalypts
Figure 22 The total annual spend on chemical pesticide inputs for the three crops shown ramping up as the estate
expands up to a total estate area of 1,000 ha.
- 68 -

Chemical pesticide usage by Australian forest plantation industries
Australian chemical pesticide use
Introduction
Any discussion of the plantation forestry pesticide use must be in the context of the overall Australian
market. It is important to consider the total Australian chemical pesticide spend, as it gives an indication
of the wide use of a range of chemical pesticides and the degree of penetration of use down to the
households level. Specific pesticide use data is published by the APVMA and ABARE. ABARE data are
part based on APVMA and ABS data and other analysis (see ABARE, 2005c for details). Specific
plantation forestry industry chemical pesticide use data are not collated or reported.
Total market
Based on APVMA data (APVMA, 2005a), Australia’s total spend on chemical pesticides for 2004 was
$2.45 billion (see Table 8 for a breakdown). The APVMA data are collected from industry supplied sales
data. To protect commercial confidentiality, the data are aggregated into the classes shown. Table 8 is
aggregated into the ABARE reported categories (to show the composition of the ABARE) and the
additional categories reported by the APVMA. It is acknowledged that the ABARE aggregation of
“insecticides” included products that are not strictly insecticides (i.e. nematicides; molluscicides;
miticides). ABARE lists Australian sales and prices of chemicals, by product type under “Farm Inputs” in
Australian Commodity Statistics (ABARE, 2005c) for 2004 with a total spend of $2.15 billion (Figure 23). It
shows a steady growth in the use of chemical pesticides since 1990. The total market data include
plantation forestry use and will be further discussed in a later section.
Vertebrate poisons include sodium fluoroacetate (1080) and pindone. The use of 1080 is currently under
review by the APVMA and they have published an environmental assessment (APVMA, 2005b). The
report states that the total Australian 1080 use is around 200 kg/yr and that the main use of 1080 is to
control rabbits and the second highest use is to control wild dogs. Foxes, feral pigs, feral cats and rodents
are also controlled using 1080 and in some cases marsupials (APVMA, 2005b).
- 69 -

Chemical pesticide usage by Australian forest plantation industries
Table 8 A full breakdown of the Australian 2004 pesticide market based on APVMA (2005a), with the ABARE (2005c)
assumed market split and the balance of the market.
Broad classifications APVMA classifications
Herbicides1 Herbicides $996,719,444 $996,719,444
Fungicides/PGR1 Plant regulators $7,231,128
Fungicides $149,644,993
Growth promoters/regulators $13,230,397 $170,106,518
Insecticides1 Nematicides $3,283,494
Molluscicides $7,680,661
Miticides $15,799,369
Mixed function pesticides $59,278,105
Insecticides $288,152,121 $374,193,750
Animal health1 $607,747,775 $607,747,775 $2,148,767,487
Additives Surfactants $5,242,950
Wetting agents $16,343,295
Adjuvants $23,214,853 $44,801,098
Domestic / recreation Pool products / algicides $53,753,503
Household insecticides $105,446,874 $159,200,377
Industrial Wood preservatives $2,232,445
Disinfectants $3,843,100
Dairy cleaners $10,093,733
Antifouling boat $10,834,361
Seed treatment $50,085,447 $77,089,086
Others Repellents dogs/birds etc $939,212
Hormones $79,610
Miscellaneous $5,018,382 $6,037,204
Vertebrate poisons2 Vertebrate poisons $15,325,621 $15,325,621 $302,453,386
Totals $2,451,220,873
1 Note: the allocation of nematicides, molluscicides and miticides to “insecticides” is not strictly correct, but has been done
so to match the ABARE applied classifications;
2 Vertebrate poisons includes sodium fluroacetate (1080) and pindone.
- 70 -

Chemical pesticide usage by Australian forest plantation industries
$0
$500
$1,000
$1,500
$2,000
$2,500
1990
1991
1992
1993
1994
1995
1996
1997
1998
1999
2000
2001
2002
2003
2004
Annual spend (million $/yr)
Animal health
Fungicides/PGR
Insecticides Herbicides
Figure 23 The Australian chemical pesticide total spend based on ABARE (2005c). (Note: PGR = plant growth regulators.) The data shown excludes some APVMA classes.
Household and industrial use
APVMA (2005a) (Table 8) splits out household insecticide use ($105,446,874 for 2004), but bulks all
other household chemical pesticides into the other categories (i.e. domestic garden herbicides). Appendix
I is a snapshot of the range of chemical pesticides used by households based on spot surveys of major
hardware shops and supermarkets. All the products are available off the shelf and include directions for
use. No training is required for the use of these products. Some of the constituent chemicals are used in
plantation forestry, for example, the herbicides amitrole/ammonium thiocyanate, simazine, glyphosate,
and triclopyr (with picloram for basal bark treatments of woody weeds in radiata pine). Insecticide
examples include, carbaryl (as a bait for wingless grasshopper) and dimethoate (under permit in South
Australia). For further information on household chemical use, see Selinger (1999). Industrial (non-
plantation forestry) herbicide use is reported to be reducing as infrastructure managers opt for knockdown
only herbicide regimes (Pers. com. 4.)
Plantation forestry
Given the lack of plantation data on chemical pesticide use by the Australian plantation industry,
estimates have been prepared based on three approaches:
- 71 -

Chemical pesticide usage by Australian forest plantation industries
1. A simple model approach based on broad generic regimes;
2. Data from the industry survey;
3. A detailed modelling approach based on 1 and 2.
A simple model
A simple model approach is important to cross check a more sophisticated approach by estimating the
maximum theoretical chemical pesticide use. Appendix H presents a summary of softwood and hardwood
standard herbicide regimes cost per hectare to cover the establishment and first year maintenance
herbicide inputs. Insecticide inputs were based on the costs shown in Table 5 and assuming a 5%
hardwood and nil softwood estate treatment rate. (Note: the rates assumed are based on the industry
survey results and specific follow-up with the main plantation managers. In the event of a new pest insect
or the out-break of an existing pest insect, the areas sprayed could be larger.) These were applied to the
NFI data for the 2005 estate (see Table 9), to give an estimated total maximum spend of $20.9 million
for 2005 or $12.08 /ha/yr for the Australia’s plantation estate (softwoods = $9.84 /ha/yr; hardwoods =
$15.08 /ha/yr: note, this rate is higher than shown in Figure 19, as the hardwood estate is still expanding).
Table 9
An estimate of the maximum 2005 Australian plantation forestry industry spend on chemical pesticides. Note: the estimates assumes similar planting in 2004 to cover establishment and first year maintenance costs.
Area1 Costs (ha) ($/ha) ($/yr) Herbicides Hardwood2 1R 65,551 $143.31 $9,459,665 Estate 14,670 $103.61 $1,519,959 Total 80,101 $10,979,624 Softwood3 1R 6,477 $160.76 $1,041,243 Estate 32,771 $265.40 $8,697,512 Total 39,477 $9,738,754 All plantations Total 100,290 $20,718,378 Treated4 Area Costs5 (% estate) (ha) ($/ha) Insecticides Hardwood 5.0% 37,008 $5.00 $185,040
Softwood 0.0% 0 $5.00 $0 Total 37,008 $185,040
Total $20,903,418
1 Based on Figures 4 and 5 and estimated estate areas. 2 Hardwood plantation costs based on Appendix H: 1R = 100% use of options A, B, D, and E; Estate = 100% use
of options G, H, K and 50% of option J. 3 Softwood plantation costs based on Appendix H: 1R = 100% use of options A and C; Estate = 100% use of
options G, 50% option H, 40% option I and 10% option L. 4 Based on the industry survey and follow-up industry information. 5 Based on Table 5 to cover softwood and hardwood.
- 72 -

Chemical pesticide usage by Australian forest plantation industries
The industry survey
The outcome of the industry survey was an estimate of the total spend on chemical pesticides for 2005 of
$14.9 million by the forestry plantation industry for the survey participants. The industry survey captured
data covering 92% of the Australian plantation forestry estate. Therefore, to estimate the total estate
spend, the industry survey result has been increased on a pro rata basis to give an estimate of the full
estate spend of $16.2 million (Table 10). The survey results for 2005 indicated that the plantation forestry
industry spent zero dollars on fungicides and nematicides for use in the field (excluding nursery use). The
industry survey provided details of the chemical pesticides used. Figures 24 and 25 show the market
percentage for the a.i. used based on the value of the spend on each. Comparing the result of the simple
analysis (shown in Table 9) and the industry survey result, this would indicate that the actual regimes
applied in practice by forest plantation managers are less costly than those in the simple model estimate.
This would indicate the use of chemical pesticides at lower rates than the maximums allowed per the
label (this is supported by the results of the industry survey as shown in Appendix E).
Table 10
A summary of the plantation industry survey results showing chemical pesticide use in 2005. The industry survey captured 92% of the Australian plantation forestry estate, hence the results have been adjusted on a pro rata basis to cover 100% of the estate.
($/yr) Industry survey result for 92% of the estate Herbicides $14,006,475
Adjuvants $704,037 Insecticides $152,638 Total $14,863,150
Pro rata up to 100% of the estate Herbicides $15,224,429 Adjuvants $765,258 Insecticides $165,911 Total $16,155,598
1080 is used in a variety of products at a range of a.i. rates (e.g. 140 to 670 mg/kg of carrots for rabbit
control or 2.7 to 4.4 mg/bait for fox control: APVMA, 2005b), it is reported on a kilograms of a.i. basis. The
industry survey results showed two separate 1080 uses. The first was to control feral carnivores such as
foxes, pigs and wild dogs. Such animals (mostly) do not impact on tree growth and control is undertaken
for legal compliance and as part of good neighbour policy. The environmental benefits include reduction
of predator pressures on native animals within the plantation estate (e.g. in retained native vegetation).
For 2005, 8.8 kg of 1080 was used in meat based baits by plantation forestry managers. The second use
of 1080 is to control herbivores (feral and native) as a means of reducing browse pressure at
establishment, or to control feral animals such as rabbits. For 2005, 5.5 kg of 1080 was used in herbivore
targeted baits by plantation forestry managers.
- 73 -

Chemical pesticide usage by Australian forest plantation industries
Terbacil1.9%
Alpha-cypermethrin0.8%
Others2.7%
Glyphosate17.4%
Clopyralid6.4%
Fluazifop5.5%
Haloxyfop9.6%
Simazine13.1%
Hexazinone19.8%
Adjuvants4.8%
Fluroxypyr 4.2%
Atrazine3.5%
Sulfometuron methyl3.2% Triclopyr
2.9%Metsulfuron methyl
2.5%
Amitrole2.0%
Figure 24 A breakdown of the industry survey results to show the a.i. used by the Australian plantation forestry sector.
Herbicides are shown in “yellow” and “white”, and insecticides are shown in “red”.
Fipronil2.9%
Carbaryl2.2%
Dimethoate1.6%
Others2.0%
Chlorsulfuron3.4%
Terbuthyalazine2.4%
Metosulam4.1%
Pendimethalin14.9%
2,4-D21.8%
Clethodim24.7%
Picloram13.7%
Glufosinate ammonium
6.2%
Figure 25 A break down of the minor / other a.i. in use and shown in Figure 24 as “others”. Herbicides are shown in
“yellow” and “white”, and insecticides are shown in “red”.
- 74 -

Chemical pesticide usage by Australian forest plantation industries
Market data revised
There is a need to reconcile total Australian chemical pesticide spend to demonstrate the context of the
plantation industry use. This is important to add a check to any detailed estimate. The APVMA (APVMA,
2005a) gives a total chemical pesticide market of $2.45 billion for 2004 (as stated, APVMA data is
sourced from chemical pesticide suppliers). This is the best estimate of the total market. The following
points are:
• ABARE lists farm chemical inputs for 2003 – 04 as $1.649 billion (see Figure 4: ABARE, 2006i:).
The data are referenced back to ABS (Australian National Accounts, National Income and
Expenditure Cat. No. 5204.0 and 5206.0);
• As stated, ABARE lists Australian sales and prices of chemicals, by product type under “Farm
Inputs” (ABARE, 2005c: Figure 23). For 2004 a total spend of $2.15 billion;
• Even though it is reported under “Farm Inputs”, it reflects the total market for herbicides, non-
domestic insecticides and fungicides. Household insecticides are excluded;
• ABARE (2005c) states that the source is the APVMA;
In conclusion, there is some confusion as to the total farm spend on chemical pesticides. In order to get a
better indication of the herbicide market, it is necessary to estimate non-agricultural and non-plantation
forestry use:
• 2004 total herbicides sales = $996,719,444 (APVMA, 2005a);
• Assume domestic use @ $70,000,000 (7,638,200 households, which includes flats: ABS, 2006b;
using around $10 /yr of domestic herbicides i.e. a 1 litre of premix glyphosate);
• Assume industrial use (e.g. around factories and railways) at $15,000,000 /yr (Pers. com. 4);
• Assume turf management (golf courses, sports grounds etc) at $6,500,000 /yr (Pers. com. 8).
Therefore, the combined agricultural and plantation forestry spend on herbicides is likely to be around
$905 million per year (compared to total sales of $996 million per year).
- 75 -

Chemical pesticide usage by Australian forest plantation industries
A detailed model of chemical pesticide use
Individual zones
Detailed models of the six zones (see Map 1) were prepared and Appendix J contains the aggregated
stand-alone result of the analysis to give a total for Australia for the area covered by the zones. The
results are presented on a total spend and dollars per hectare per year basis for the ABS identified crops.
The following is an aggregation of the six zones data to give an Australia wide summary.
Total spend
This study has estimated that the Australian plantation forestry spend on chemical pesticides was
approximately $16.4 million in 2004 - 05. This equates to approximately 0.7% of the total $2.45 billion
APVMA reported, market spend (see Table 8). Figure 26 shows the relative spend of plantation forestry
and the balance of the market. This estimate matches the industry survey results of the total spend. The
balance of the market relating to agriculture has been accounted for in the specific Zone models (see the
Zone details in the appendices).
APVMA total market (excluding plantation forestry)
99.3%
Plantation forestry0.7%
Figure 26 A summary of proportion of the overall chemical pesticide market attributable to plantation forestry.
Comparison to the APVMA/ABARE data
Figure 27 shows a break down of the agricultural and plantation forestry chemical pesticides use in
Australia estimated by this study compared to the APVMA/ABARE data. The following comments are
made:
- 76 -

Chemical pesticide usage by Australian forest plantation industries
• The gap shown in the herbicide spend relates to the domestic, turf and industrial markets as
discussed previously;
• The insecticide and fungicide spend is close to the stated totals;
• The difference in the animal health spend is explained by this study accounting for 89.9% of the
sheep and 72.4% of the cattle in Australia (as reported by the ABS, 2006a) by the study zones
used.
$0
$100,000,000
$200,000,000
$300,000,000
$400,000,000
$500,000,000
$600,000,000
$700,000,000
$800,000,000
$900,000,000
$1,000,000,000
$1,100,000,000
Herbicides Insecticides Fungicides Animal health
Spen
d ($
/yr)
APVMA/ABARE This study
Figure 27 A comparison of the 2004 APVMA/ABARE stated (see Table 8 and Figure 23) chemical pesticide market and this study’s estimate.
Plantations in detail
A key finding of the analysis is that the majority of the plantation industry spend on chemical pesticides is
for herbicides (Figure 28). The majority of the spend is in the mature softwood plantation estate, while the
hardwood estate spend occurs mostly in short rotation pulpwood crops. In the analysis, it was assumed
that 5% of the hardwood estate and 0% of the softwood estate is treated each year for insect pests
(based on the industry survey and the follow-up with industry). This may mean a slightly higher rate than
is actually occurring, but it shows that the spend on such insecticides is low. There is nil to little annual
spend on fungicides. That spend will generally be in reaction to pest out-breaks and could be higher from
year to year.
- 77 -

Chemical pesticide usage by Australian forest plantation industries
$0
$1,000,000
$2,000,000
$3,000,000
$4,000,000
$5,000,000
$6,000,000
$7,000,000
$8,000,000
$9,000,000
Hardw ood long rotation Hardw ood shortrotation
Softw ood long rotation
Ann
ual s
pend
($/y
r)
Insecticides
Herbicides
Figure 28 A break down of the estimated plantation forestry spend on chemical pesticides for short rotation hardwood (pulpwood crops), long rotation hardwoods (sawlog crops) and long rotation softwoods (sawlog crop).
Zone summaries
Detailed results of the six zones are shown in the zone summaries.
- 78 -

Chemical pesticide usage by Australian forest plantation industries
Risk management
Water monitoring
The main developments in environmental monitoring have centred around water quality. Claims are often
made that plantation forestry use of agricultural chemical pesticides has resulted in significant and
frequent contamination of streams and water supplies. Whilst it is undeniable that there have been some
episodes, it is also true that many claims have been wildly exaggerated, and that the levels detected have
been very low and often close to the limits of detection.
Tasmanian state wide assessment
In response to community concerns over the use of chemical pesticides, the then Department of Primary
Industries, Water and Environment (Note: now the Department of Primary Industries and Water or DPIW)
set up a system of stream monitoring in 2005. The program includes the most commonly used agricultural
and forestry chemical pesticides, and others with high toxicity or potential mobility. The baseline
monitoring program commenced in January 2005 at 28 sites. The scale of the monitoring was expanded
to 54 sites by July, 2005. The sites include a wide range of catchments across the north and east of the
state, covering agricultural and plantation forestry land use (DPIW, 2006c). DPIW uses the following
definitions in the presentation of the monitoring results:
Limits of detection: The lowest level of a pesticide that can be reliably detected and reported
using the particular analytical method and instrumentation.
Guideline Value: The level published in the Australian Drinking Water Guidelines at which steps
should be taken to determine the source and to stop further contamination. In terms of drinking
water, exceeding the guideline value indicates that undesirable contamination has occurred and
advice from the relevant health authority should be sought. It does not necessarily indicate a
hazard to public health.
Health Value: The level published in the Australian Drinking Water Guidelines for use by health
authorities in managing the health risks associated with inadvertent exposure, such as a spill or
misuse of a pesticide. The values are set at about 10% of the acceptable daily intake (ADI) for an
adult of 70 kg consuming 2 litres of water per day. The values are very conservative and include
a range of safety factors.
At the time preparation of this report, six rounds of monitoring had been conducted, over up to 54 sites
testing for up to 19 chemical pesticides (note: a micrograms of pesticide per litre of water (µg/L) is 1
millionth of a gram or 10-6 grams per litre):
• Baseline monitoring (January, 2005 over 28 sites) with no detections of chemical pesticides;
- 79 -

Chemical pesticide usage by Australian forest plantation industries
• April, 2005 over 28 sites, one detection on the Montague River at Stuarts Road of 0.07 µg/L of
simazine (limit of detection 0.05 µg/L; guideline value 0.5 µg/L; health values 20 µg/L);
• July, 2005 over 28 sites, one detection on the Rubicon River at the tidal limit of 0.14 µg/L of
atrazine (limit of detection 0.05 µg/L; guideline value 0.1 µg/L; health values 40 µg/L);
• October, 2005 over 54 sites, one detection on the South Esk (upstream of Macquarie River at
Perth) of 2.2 µg/L of simazine (limit of detection 0.05 µg/L; guideline value 0.5 µg/L; health values
20 µg/L);
• October, 2005 over 54 sites, one detection on the South Esk (upstream of Macquarie River at
Perth) of 0.1 µg/L of terbacil (limit of detection 0.1 µg/L; guideline value 10.0 µg/L; health values
30 µg/L);
• Januaray, 2006, there were no detections at the 54 sites.
In the flood monitoring program, where a number of samples are taken when stream levels are rising
(events), four streams have been intensively monitored. In 40 events, and 430 samples, there has been
one detection event (23rd June to 27th June, 2005) of terbacil peaking at *0.32 µg/L (limit of detection 0.1
µg/L; guideline value 10.0 µg/L; health values 30 µg/L). These results are publicly reported, quarterly on
the DPIW website, by media statement, and notices to Health, Water Authorities and Local Councils
(Mollison, 2006). Such exercises are inevitably very expensive, and time consuming.
Individual monitoring
As part of quality assurance and to meet other management objectives, individual plantation managers
may conduct water quality monitoring. For example, Hancock Victorian Plantations Pty Ltd conducts
water sampling pre-application, immediate post-application and after the first rainfall events, for specific
herbicide operations (Pers. com. 9). In another example, Forestry Tasmania conducts water sampling at
the time of the operation (pre- and post-application) and after the first significant rainfall event for each
chemical pesticide application operation (Forestry Tasmania, 2005). Gunns Limited conducts water
monitoring where chemical residues have the potential to move off-site. As with Forestry Tasmania, water
samples are taken prior to and immediately after spraying, and then after the first significant rainfall event.
Of the 761 samples taken and tested in 2004 - 05, none of the tested results exceeded Australian
Drinking Water Health Guidelines (Gunns, 2006a).
Other crops
Pest management in cotton crops is a critical issue and the industry publishes a pest management guide
each year (Farrell and Johnson, 2005) and the industry uses a range of chemical pesticides (e.g. DPI
NSW, 2006c). A broad water monitoring program (The Central and North West Regions Water Quality
Program: CNWRWQP) for up to 34 agricultural chemical pesticides is applied to the Macintyre, Gwydir,
Namoi and Macquarie valleys (Mawhinney, 2004). Figure 29 shows the number of samples per year and
Figure 30 the percentage of samples showing detection of the chemical pesticides shown.
- 80 - * In the original version of this report placed on the web site on 23/10/06 this figure was inadvertently given as 33 µg/L. This correction was made on 3/11/06.

Chemical pesticide usage by Australian forest plantation industries
0
50
100
150
200
250
300
350
400
450
500
1991/92
1992/93
1993/94
1994/95
1995/96
1996/97
1997/98
1998/99
1999/00
2000/01
2001/02
2002/03
Sam
ple
(num
ber/y
r)
Figure 29 The number of water samples tested for chemical pesticides in the Macintyre, Gwydir, Namoi and Macquarie
valleys (Mawhinney, 2004).
0%
10%
20%
30%
40%
50%
60%
70%1991/92
1992/93
1993/94
1994/95
1995/96
1996/97
1997/98
1998/99
1999/00
2000/01
2001/02
2002/03
Det
ectio
n ra
te (%
of s
ampl
es)
Endosulfan Atrazine Diuron Fluometuron
Metochlor Prometryn Simazine
Figure 30 The detection rates for the chemical pesticides shown in the water samples shown in Figure 29 (Mawhinney, 2004).
- 81 -

Chemical pesticide usage by Australian forest plantation industries
Waters (2004) reported on water quality in Queensland catchments and the cotton industry. Water
monitoring was undertaken in the Loudoun and Chinchilla Weirs over eight seasons for 52 chemical
pesticides. For 2000 – 01 (13 samples), the percentage of sample with detections were: 0% for
endosulfans; 38.5% for simazine; 46.1% for prometryn; 92% for metolachlor; 100% for atrazine. Waters
(2004) concluded that storms and sediment are the main two factors affecting movement of chemical
pesticides off-site. In the region considered, mean sediment concentration leaving the cotton tail drains
ranges from 3 to 9 g/L in storm and irrigation run-off. Mawhinney (2004) added spray drift and vapour
transport as mechanisms of chemical pesticide transport into the river systems and that such
mechanisms contribute low level but almost continuous inputs.
Chemical remediation
One practice that probably does not receive sufficient attention by some plantation growers is that of
cross-draining. This simple procedure diverts drainage from table drains back into plantation or buffer
areas at appropriate points. A recent development from Orica has been the use of an enzymatic clean-up
with a point source treatment e.g. a drain (Richardson, 2006a). A product is already available for the
insecticide diazinon (not used in forestry), and another triazine herbicide enzyme is expected to be
commercialised within 18 months. These enzymes accelerate the breakdown of the pesticide to
metabolites within a matter of minutes. The triazine enzyme will work in both soil and water (Richardson,
2006a). The challenge will be for forestry to adopt this technology where the risk is considered to be
high, or where there is an accidental spill, for example.
Risk assessment
Spray drift
The current major approaches to spray drift management are common to agriculture and forestry. They
include:
• Control of droplet size;
• Wind speed limits for use;
• Spray release height;
• Protective buffer zones;
• Equipment type and arrangement.
There are a number of predictive models for assessing the potential for spray drift. These include the
AgDRIFT Model for all uses up to 800 metres, and AGDISP (Loschke, 2006). Ensis has developed
Spraysafe Manager, an aerial application Decision Support System which also uses AGDISP and
Arcview (Richardson, 2006b).
The Pesticide Impact Rating Index
The Pesticide Impact Rating Index (PIRI) program was developed by CSIRO for agriculture, and now has
some global exposure (Kookana and Correll, 2006). It can be used to identify safe windows for chemical
- 82 -

Chemical pesticide usage by Australian forest plantation industries
pesticide spray operations, designing chemical pesticide-monitoring programs and in identifying chemical
pesticides that need to be targeted for better management. PIRI combines information about toxicity to
aquatic organisms with information about the potential for chemical pesticides to move off-site and pollute
adjacent waterways (Kookana and Correll, 2005). It has an in-built database for about 300 chemical
pesticides, but can be used with other data. It has built-in toxicity data on (Kookana and Correll, 2006):
• Fish (rainbow trout);
• Waterflea (daphnia);
• Algae (limited information);
• USEPA Health Advisory Levels;
• User defined (e.g. water quality guidelines).
The Risk factors included in PIRI are:
• Chemical pesticide amount and method of application;
• Timing of application (soil dryness state/index);
• Pesticide properties (half-life, sorption);
• Site conditions (hydrology, slope, soil loss);
• Soil properties (organic matter, texture);
• Pathway of movement (runoff, drift);
• Weather conditions (rainfall, temperature);
• Climate (temperate vs tropical);
• Toxicological considerations (fish, flea, algae, mammals, humans).
Corroboration studies have been conducted in cotton crops, in the Murray Irrigation Area, and in the
SA/Victorian Riverland, with a correct assessment in 80% of cases. Forestry Tasmania has begun using
PIRI (Elek, 2006) and other forestry organizations (e.g. SA Forestry Corporation) are evaluating it. Some
development may be required to adapt PIRI fully for plantation use (Mcguire, 2006). A further program
that may have applicability is SAFEGAGE, developed for use in Queensland for sugar cane. It has some
similar features to PIRI but some useful differences (Mcguire, 2006). Predictive tools such as these will
undoubtedly become part of the standard management tools in the future.
- 83 -

Chemical pesticide usage by Australian forest plantation industries
Alternatives to chemical use
A continuing need
When large-scale industrial plantation development is the aim, there does not appear to be any
technology that will eliminate the need for the use of chemical pesticides for pest control in the
foreseeable future. This may be qualified for small-scale woodlots where it may be practicable to use
manual methods, in the same way that a home gardener controls weeds and possibly other pests such as
snails. For plantation weed control, various mulching methods and weed mats have been tried, but costs
are excessive when translated to a large scale. Another example is heat sterilisation of soil for weed
control using gas burners or steam, which has a very high energy use, as well as burning fuel which
produces greenhouse gases. Mechanical methods of weed control can damage trees and cost of
machinery operation in extensive plantations is prohibitive.
Ongoing development
There is currently a program to develop a biological control for the pine aphid (Hopkins, 2006). However,
there are so many weed and insect pests that biological control can be expected to control a few at most,
and development times and quarantine to prevent escape of organisms that may have potential
deleterious consequences must be considered. The unintended escape of the rabbit Calicivirus is a
salutary lesson, although the consequences in that case appear to have been beneficial, at least in the
short term. One current program in New Zealand is investigating the use of the leaf eating weevils
(Cleopus japonicus) to control buddleja (Buddleja davidii): an ornamental tree that has become a woody
weed and it is the biggest pest plant in New Zealand plantations (Ensis, 2006).
Tree breeding to give faster early growth may in time reduce the need for second season weed control in
eucalypts. Genetic manipulation to enable commercial tree species to express chemicals that defend
against insect or fungal attack, or to prevent weed emergence, may lie in the future. However, the
emphasis in genetically modified (GM) crops at this time is to provide protection for the use of specific
herbicides.
Biomimetic chemicals are another possibility, for example, the insecticide tebufenazide. However, it is
foolish to imagine that all such chemicals will necessarily be benign and non-toxic to non-target species
or will not have other undesirable consequences (Elek 2006). There is a herbicide developed from a root
exudate of an Australian native plant which one of the authors is evaluating for possible use in plantation
establishment, and there are examples of apparent allelopathic effects from other species.
Australian plantation industry experience
The best complementary methods for weed control are already generally practised. These include
chopper rolling (mulching) of 2R slash in pine plantations (e.g. Dumbrell, 2006), spray topping with low
rates of herbicide to prevent annual weed seed set on pasture sites during the spring the year before
planting, whole site ploughing or mounding late spring-early summer, cover cropping during the summer,
- 84 -

Chemical pesticide usage by Australian forest plantation industries
and inter-row grazing when the trees are beyond damage from grazing animals. One practice adopted in
WA is to scalp away the grass mat to create a furrow for softwood establishment, but there can be an
increased risk of phytotoxicity (Dumbrell, 2006).
Site preparation techniques have also been developed over the decades that aim to manipulate weed
populations. Examples include pre-site preparation broadcast treatments, sometimes on ex-pasture in the
spring the year before planting to prevent annual weed seed set, and mounding which buries some of the
seed bank too deeply for germination, and also increases the nutrient available to the growing trees. In
radiata pine, slash retention after harvesting the previous crop is now a routine procedure. The harvesting
residues are chopper rolled to provide mulch, which suppresses weeds and retain moisture as well as
nutrients.
There have been a few successes with biological controls. For example the Sirex wood wasp control
program uses predatory nematode inoculation in trap trees deliberately stressed by sub-lethal injections
of herbicide, which attract adult wasps.
A mechanical barrier to African black beetle (Heteronychus arator) has been developed for use with
eucalypt seedlings. The beetle feeds on the seedling stems and can cause significant losses. A plastic
mesh is placed over the seedling at planting to form a mechanical barrier to beetle attack (Bulinski and
Alexander, 2002).
- 85 -

Chemical pesticide usage by Australian forest plantation industries
Future trends
Potential future pests
Potential pests are legion, particularly where insects are concerned, but many troublesome weeds are
also introduced species. The Asian gypsy moth (Lymantria dispar) is an insect which has the potential to
devastate multiple tree species should it ever become established. The environs of Auckland in New
Zealand were sprayed in recent years after species of tussock moths, which could threaten New
Zealand’s forests and plantations, were discovered. Guava rust (Puccinia psidii) attacks the shoots of
juvenile trees, coppice and seedlings and can kill up to 90% of young eucalypts in plantations
(Tommerup, 2002). There are many potential threats to the health of radiata pine plantations; so far,
significant damage has only been caused periodically or before control measures were introduced by
Sirex wood wasp, the Monterey pine aphid (Essigella californica) and a needle cast fungus (Dothistroma
septospora). Minor problems were also experienced with a bark beetle, (Ips grandicollis), which mainly
affects edge trees. Buddleja could take hold in Australian plantations.
Likely changes to the context of chemical use
The experience in pine plantation establishment indicates that different problems will be experienced as
rotations are completed and sites replanted. On ex-pasture sites, other non-pasture weeds such as
blackberry are introduced by birds and become significant problems. This will require changes in pre-
planting site clean-up procedures and herbicide prescriptions. This is already the situation for post-first
rotation pine sites.
Emerging chemical technologies
Some of these have already been mentioned, for example the development of water dispersible herbicide
packaging (WDH), the bulk shuttle, the slow release granular technology, and the fertiliser/insecticide
Initiator tablet. Other technologies may prevent any off-site movement of chemicals, for example, the
emerging use of enzymes to break down pesticides in run-off water (Richardson, 2006a).
Plantation industry willingness to adopt new chemicals and alternatives
Plantation forest managers have the combined drivers of cost reductions, legal and social obligations
which focus attention on the need to develop and adopt improvements in all operations. Where an
organisation has made a commitment to a formal certification process such as the Australian Forestry
Standard, there is added impetus towards development of alternatives provided such introductions are
cost-effective and provide the same or better efficacy. In order to expand the area under management,
plantation forestry managers are considering new species in old areas, and new species in new areas as
the available land in such areas becomes too expensive. Such a trend provides an impetus to a clear
focus by the plantation forestry managers to identify and adopt new practices.
- 86 -

Chemical pesticide usage by Australian forest plantation industries
Conclusions The following are the key conclusions resulting from this study.
Plantation forestry is a minor component of Australian chemical pesticide use, its estimated
$16.4–20.9 million expenditure in 2003-04, accounting for 0.7 per cent of the $2.4 billion national
total;
Australian plantation forestry chemical pesticide spending is estimated to be 99.0 per cent on
herbicides (including adjuvants) and 1.0 per cent on insecticides;
The chemical pesticides used by plantation forestry in Australia have been developed for other
uses and have been adapted to the needs of the plantation industry;
All chemical pesticides used by the Australian plantation forest industry are also used in food
production systems by Australian agriculture with the exception of sulfometuron methyl, which is
approved for other industrial uses in Australia;
Of the 13 major herbicides used (based on expenditure) by the Australian plantation industry, five
are also available for purchase ‘off the shelf’ in hardware stores and/or supermarkets;
The adaptation and use of chemical pesticides by the Australian plantation industry is regulated
under the same framework as all other chemical pesticide users. Because of the general use of
licensed application contractors, plantation forestry has an additional regulatory overlay for the
use of chemical pesticides compared to the greater use of unregulated operators in other
industries;
There are fundamental differences in the way chemical pesticides are used by the Australian
plantation industry compared to agriculture. Use in plantations is usually confined to the first two
years of a plantation crop cycle (for example a 10-year crop cycle for pulpwood or a 30-year crop
cycle for softwood sawlogs). For the rest of the life of the plantation chemical pesticide application
is very limited and generally only occurs in reaction to pest or disease out-breaks. Agricultural
crops tend to have a higher frequency of use, and in some cases, have multiple applications in
each year or for each crop;
The area over which chemical pesticides may be applied within a plantation can vary from 100
per cent to about 30 per cent of the planted area, depending on the management objective;
Industry survey results indicate most chemical pesticides are used at less than 50 per cent of the
maximum label rate;
- 87 -

Chemical pesticide usage by Australian forest plantation industries
The Australian plantation forest industry has developed and adapted a range of application
technologies to meet industry needs;
Aerial application of chemical pesticides by the plantation forest industry accounts for a maximum
of 0.5 per cent of the total 10 million hectares of land aerially treated with a range of chemical
products each year across Australia; and
Environmental monitoring is generally conducted on a risk management basis by individual
plantation managers. Where conducted on a systematic basis, water monitoring on a whole-of-
catchment basis in Tasmania has shown few detections of chemical pesticides from any source.
- 88 -

Chemical pesticide usage by Australian forest plantation industries
References Abbott, I., Van-Heurck, P. and Burbridge, T. (1993) Impact of frequency and intensity of defoliation on growth of Jarrah (Eucalyptus marginata): an experimental study with saplings. For. Ecol. and Mgt. 56: 175 – 183. Aerial Agricultural Association of Australia (2001) Chemical application policy. September, 2001. Aerial Agricultural Association of Australia (2006a) The history and the aircraft. Downloaded from www.aerialag.co.au on 05/09/06. Aerial Agricultural Association of Australia (2006b) The need for aerial agriculture. Downloaded from www.aerialag.co.au on 05/09/06. AKD Softwoods (2006) Plantation resources. Downloaded from www.akd.com.au on 08/09/06. Albany Plantation Forest Company of Australia (2006) Company profile. Downloaded from www.apfl.com.au on 09/09/06. Auspine Limited (2005) Auspine annual report 2005. Downloaded from www.auspine.com.au 09/09/06. Australian Bureau of Agricultural and Resource Economics (2005a) Australian commodities: Table 1: Australian gross product by sector. Canberra. Australian Bureau of Agricultural and Resource Economics (2005b) Australian commodities: Table 4: Value of Australian exports by sector. Canberra. Australian Bureau of Agricultural and Resource Economics (2005c) Australian commodity statistics 2005: Table 105: Australian sales and prices of chemicals by product type. Canberra. Australian Bureau of Agricultural and Resource Economics (2006a) Australian commodities: June quarter, 2006: Table 21: Gross value of Australian farm, forestry and fisheries production. Canberra. Downloaded from www.abare.gov.au. Australian Bureau of Agricultural and Resource Economics (2006b) Australian forest and wood product statistics: September and December quarters, 2005: Table 53: Estimated gross value of forest production. Canberra. Australian Bureau of Agricultural and Resource Economics (2006c) Australian forest and wood product statistics: September and December quarters, 2005: Table 3: Imports. Canberra. Australian Bureau of Agricultural and Resource Economics (2006d) Australian forest and wood product statistics: September and December quarters, 2005: Table 6: Exports. Canberra. Australian Bureau of Agricultural and Resource Economics (2006e) Australian commodities: June quarter, 2006: Table 10: Employment. Canberra. Downloaded from www.abare.gov.au. Australian Bureau of Agricultural and Resource Economics (2006f) Australian forest and wood product statistics: September and December quarters, 2005: Table 46: Roundwood consumed. Canberra. Australian Bureau of Agricultural and Resource Economics (2006g) Australian forest and wood product statistics: September and December quarters, 2005: Table 47: Roundwood removals. Canberra. Australian Bureau of Agricultural and Resource Economics (2006h) Australian commodities: June quarter, 2006: Table 22: Crop areas and livestock numbers. Canberra. Downloaded from www.abare.gov.au. Australian Bureau of Agricultural and Resource Economics (2006i) Australian commodities: June quarter, 2006: Table 3: Farm costs and returns. Canberra. Downloaded from www.abare.gov.au. Australian Bureau of Statistics (2006a) Purchased statistics: 2003 – 04 Farm Census results. Australian Bureau of Statistics (2006b) 1301.0 – Year book Australia, 2006. Downloaded from www.abs.gov.au on 05/07/06. Australian Pesticides and Veterinary Medicines Authority (2005a) Agricultural chemical product sales for the calendar year 2004. Commonwealth of Australia Gazette No. 12, 6th December, 2005. Australian Pesticides and Veterinary Medicines Authority (2005b) The reconsideration of registration of products containing sodium fluroacetate (1080) and their associated labels. Vol. 2: Preliminary review findings – technical report: Environmental Assessment. APVMA, Canberra, Australia. Downloaded from www.apvma.gov.au. Australian Pesticides and Veterinary Medicines Authority (2006) Operating principles and proposed registration requirements in relation to spray drift risk. APVMA, 24th July, 2006. Canberra, Australia. Downloaded from www.apvma.gov.au. Baker, T.G., Cameron, J.N. Fagg, P.C. and Matthews, D. (1988) Effect of timing and rate of hexazinone application on weed control and early growth of Pinus radiata on two contrasting sites. Aust. For. 51(2): pp92-97. Balneaves, J.M. (1982) Grass control for radiata pine establishment on droughty sites. N.Z. J. For. 27: pp259 – 276. Balneaves, J.M. and Christie, M. (1988) Long term growth response of radiata pine to herbaceous weed control at establishment. N.Z. For. 33: pp 24 – 25.
- 89 -

Chemical pesticide usage by Australian forest plantation industries
Balneaves, J.M. and McCord, A.R. (1990) Gorse control: a trying experience at Ashley Forest. In: Alternatives to the chemical control of weeds. Proceedings of an International Conference, 25 – 27 July, 1989. Rotorua, New Zealand. Bassetts, C., Whitehouse, L.J. and Zabkiewicz, J.A. Forest Research Institute, Rotorua, New Zealand. FRI Bull. 155. pp 150 – 156. Balneaves, J.M., Gaskin, R.E. and Zabkiewicz, J.A (1993) The effect of varying rates of glyphosate and an organosilicone surfactant on the control of gorse. Ann. Appl. Biol. 122: pp531 – 536. Boomsma, D. (2005) Presentation at a Macspred industry field day. Bulinski, J. and Alexander, R. (2002) Non-chemical control of African black beetle. In: Private forestry – sustainable, accountable and profitable. Proc. Australian Forest Growers 2002 National Conference. 13 to 16 October, 2002. Candy, S.G. (1999) Predictive models for the integrated pest management of leaf beetle Chrysophtharta bimaculata in Eucalyptus nitens plantations in Tasmania. Unpublished PhD thesis University of Tasmania. Candy, S.G., Elliott, H.J. Bashford, R. and Greener, A. (1992) Modelling the impact of defoliation by the leaf beetle Chrysophtharta bimaculata (Coleoptera: Chrysomelidae), on height growth of Eucalyptus regnans. For. Ecol. and Mgt. 54: 69 – 87. Carne, P.B., Greaves, R.T.G. and Mcinnes, R.S. (1974) Insect damage to plantation-grown eucalypts in north coastal New South Wales, with particular reference to Christmas beetles (Coleoptera: Scarabaeidae). J. of Aust. Ento. Soc. 13: 189 – 206. Carnegie, A. J., Stone, C., Lawson, S. and Matsuki, M. (2005) Can we grow certified eucalypt plantations in sub-tropical Australia? NZ J. For. Sci. 35 (2/3): 223-245. Cellier, K.M. and Stephens, C.G. (1980) Effect of fertilizer and weed control on early growth of Pinus radiata D.Don in Southern Australia. Aust. For. Res. 10: 141 – 153. Collett, N. (2006) Managing establishment insect pests in eucalypt plantations using a tabular form of insecticide delivery. Presentation at the 4th Plantation Pest Control Seminar, Mt Gambier, 28 February to 2 March, 2006. Collett, N.G. and Neumann, F.G. (2002) Effects of simulated chronic defoliation in summer on growth and survival of blue gum (Eucalyptus globulus Labill.) within young plantations in northern Victoria. Aust. For. 65(2): 99 – 1-4. Cremer, K.W. (1972) Effect of partial defoliation and disbudding on height growth of Eucalyptus regnans saplings. Aust. For. Res. 6(1): 41 – 42. Cremer, K.W. (1973) Ability of Eucalyptus regnans and associated evergreen hardwoods to recover from cutting or complete defoliation in different seasons. Aust. For. Res. 6: 9 – 22. Cremer, K.W., Cromer, R.N. and Florence, R.G. (1978) Stand establishment. Ch. 4 In: Eucalypts for wood production. Hillis, W.E. and Brown, A.G. eds. CRIRO / Academic Press. Davey and Maynard Agricultural Consulting (2003) Rural land use trends in Tasmania. Report commissioned by the Department of Infrastructure, Energy and resources, Tasmania. Down loaded from www.dier.tas.gov.au on 02/05/06. de Little, D. (2002) Forest health: a proactive approach to pest and disease problems in plantations. Special Liftout No. 61. Australian Forest Grower 25(3): Spring 2002. Department of Primary industries and Water, Tasmania (2006a) Cash crop enterprise budgets: High rainfall districts – Tasmania 2005 – 2006: Machinery operations. Down loaded from www.dpiw.tas.gov.au. May, 2006. Department of Primary industries and Water, Tasmania (2006b) Cash crop enterprise budgets: High rainfall districts – Tasmania 2005 – 2006: Onions. Down loaded from www.dpiw.tas.gov.au. May, 2006. Department of Primary industries and Water, Tasmania (2006c) Monitoring water quality: pesticides in water catchments. Down loaded from www.dpiw.tas.gov.au. 25/08/06. Department of Primary Industries NSW (2006a) Lettuce - fresh: furrow irrigated. Farm Enterprise Budget Series, 2001. NSW DPI Farm Enterprise Budgets. Downloaded from www.agric.nsw.gov.au. June, 2006. Department of Primary Industries NSW (2006b) Rice – medium grain (aerial sown). Farm Enterprise Budget Series, Murrumbidgee Valley 2005 - 2006. NSW DPI Farm Enterprise Budgets. Downloaded from www.agric.nsw.gov.au. June, 2006. Department of Primary Industries NSW (2006c) Surface irrigated cotton. Farm Enterprise Budget Series, Northern Zone - West, NSW. Summer, 2005 - 2006. NSW DPI Farm Enterprise Budgets. Downloaded from www.agric.nsw.gov.au. June, 2006. Department of Primary Industries Queensland (1999) Banana economics. Information series Q199050, Centre for Tropical Agriculture. Department of Agriculture, WA (2006a) Gross margins guide 2005 Western Australia: Example canola gross margin. South Coast, after pasture. Downloaded from www.agric.wa.gov.au. May, 2006. Department of Agriculture, WA (2006b) Gross margins guide 2005 Western Australia: Example canola gross margin, following cereal: Great Southern. Downloaded from www.agric.wa.gov.au. May, 2006.
- 90 -

Chemical pesticide usage by Australian forest plantation industries
Donaldson, J.D. and Pritchard, P. (2000) Farm forest policy in Australia – A working paper. In: Proceedings of the IUFRO 2000 Conf. Cairns. Dumbrell, I. (2006) Current challenges in plantation weed control in Western Australia. Presentation at the 4th Plantation Pest Control Seminar, Mt Gambier, 28 February to 2 March, 2006. Dutkowski, G. and Boomsma, D. (1990) Bracken control and tree growth in plantations of radiata pine in the lower south-east of South Australia. In: Thomson, J.A. and Smith, R.T. (Eds.) Bracken Biology and Management. Australian Institute of Agricultural Science AIAS Occasional Publication No. 40 July 1990. pp. 277-290. Elek, J. A. (1998). Treatment of adult Coleoptera with a chitin synthesis inhibitor affects mortality and development time of their progeny. Entomologia experimentalis et applicata 88, 31-39. Elek, J. (2006) Challenges in capturing the social benefits of using insecticides with lower environmental impacts in plantations. Presentation at the 4th Plantation Pest Control Seminar, Mt Gambier, 28 February to 2 March, 2006. Elek, J. A. and Beveridge, N. (1999) Effect of a Bacillus thuringiensis subsp. tenebrionis insecticidal spray on the mortality, feeding and development rates of larval Tasmanian eucalyptus leaf beetles (Coleoptera: Chrysomelidae). J of Economic Ento 92(5), 1062-1071.
Elek, J, Matsuki, M, and Allen, GR, (2003) Recolonisation of Insects into Eucalyptus Plantations following Spraying with Alpha-Cypermethrin and Spinosad. In: Program and Extracts, 34th Australian Entomological Society/6th Invertebrate Biodiversity & Conservation Combined Conference. The Corus Hotel, Hobart, Tasmania. Elliott, H.J. Bashford, R., Greener, A. and Candy, S.G. (1992) Integrated pest management of the Tasmanian eucalyptus leaf beetle, Chrysophtharata bimaculata (Oliver) (Coleoptera: Chrysomelidae). For. Ecol. and Mgt. 53: 29 – 38. Ellis, R.C., Webb, D.P. Graley, A.M. and Rout, A.F. (1985) The effect of weed competition and N nutrition on the growth of seedlings of Eucalyptus delegatensis in the highland area of Tasmania. Aust. For. Res. 15: 395 – 408. Ensis (2006) Biological solutions to forest weeds. Ensis Link March, 2006. Farrell, T. and Johnson, A. (2005) Cotton pest management guide 2005/06. Australian Cotton research Institute. Flinn, D.W. and Fagg, P.C. (1984) Review of weed control practices in radiata pine plantations in Australia. Proceedings of the 7th Aust. Weeds Conference, Vol. 1, Perth W.A., September 1984, pp. 220-232. Florence, R.G. (1996) Ecology and silviculture of eucalypt forests. CSIRO Publishing. pp 413. Forest Air Helicopters (2006) Forest Air Helicopters. Downloaded from www.forestair.com.au on 05/09/06. Forest Enterprises Australia Limited (2006) About FEA Ltd. Downloaded from www.forestenterprise.com on 07/09/06. Forest Stewardship Council (2006) FSC certified forests. Downloaded from www.fsc.org on 14/09/06. Forestry Tasmania (2005) Sustainable forest management report 2003-2004. Downloaded from www.forestrytas.com.au on 07/09/07. Geosciences Australia (2006) Area of Australia, States, and Territories. Downloaded from www.ga.gov.au on 14/09/06. Great Southern Plantations Limited (2006b) About us. Downloaded from www.great-southern.com.au on 07/09/06. Gunns Limited (2006a) Sustainable forest management report 2004-2005. Downloaded from www.gunns.com.au on 07/09/07. Gunns Limited (2006b) Forest Division: plantations. Downloaded from www.gunns.com.au on 07/09/07. Hall, M. (1987) Review of weed control in Australian forestry: practice and priorities. In: Proceedings of the 8th Aust. Weeds Conference, Sydney, 1987, Lemerle, D and Leys, A.R. (Eds), published by the Weed Society of N.S.W. for the Council of Australian Weed Science Societies, pp. 418-426. Hancock Victorian Plantations Pty Limited (2006) Plantation management plan (2004). Downloaded from www.hancockvicplantations.com.au on 07/09/06. Hopkins, D. (2006) Biocontrol of pine aphid. Presentation at the 4th Plantation Pest Control Seminar, Mt Gambier, 28 February to 2 March, 2006. ITC Limited (2006) ITC Limited. Downloaded from www.treecrop.com.au on 07/09/06. Jacobs, M.R. (1955) Growth habit of the eucalypts. Forestry and Timber Bureau. Jenkin, B.M. (1992) Eucalypt plantation silvicultural regimes. 1990 Gottstein Fellowship report. Jenkin, B.M. (2004) Figures to take with you to a cocktail party. Australian Forest Grower, Spring, 2004. pp 32-33. Jenkin, B.M., M. Matsuki, G.S. Farrell and R.B. Floyd (in press) Economic cost of insect damage in the Murray Valley. Ch 7 In: Impact of insects on eucalypt plantations in the Murray Valley. A CSIRO Division of Entomology edited RIRDC publication.
- 91 -

Chemical pesticide usage by Australian forest plantation industries
Kaapro, J. (2006) ‘Initiator’ Tree Tablet. Presentation at the 4th Plantation Pest Control Seminar, Mt Gambier, 28 February to 2 March, 2006. Karjalainen, U. and Boomsma, D. (1989) Bracken fern control for radiata pine plantations in South Australia. Aust. For. 52 (1). pp 37-44. Keane, P.J., Kile, G.A. Podger, F.D. and Brown, B.N. (eds) (2000) Diseases and pathogens of eucalypts. A CSIRO Press publication. Keenan, R.J., Parsons, M., O’Loughlin, E., Gerrand, A., Beavis, S., Gunawardana, D., Gavran, M. and Bugg, A. (2004) Plantations and water use: A review. FWPRDC Project no: PN04.4005. Kookana, R., Correll, R. and Miller, R. (2005) Pesticide impact rating index (PIRI): for minimising off-site impact of pesticides. In: Pesticide use in the 6th Creek sub-catchment, Mt Lofty Ranges, S.A. and assessment of risk of 0ff-site movement using Pesticide Impact Rating Index (PIRI). Appendix 1. CSIRO Land and Water Tech. Rep. 11/05. July, 2005. Kookana, R. and Correll, R. (2006) Minimising off-site migration of pesticides: A risk based approach. Presentation at the 4th Plantation Pest Control Seminar, Mt Gambier, 28 February to 2 March, 2006. Landsberg, J.J. and Parsons, W. (eds). (1984) Research for Forest Management: Proceedings of a Conference Organised by the Division of Forest Research, CSIRO, 21-25 May 1984, Canberra, Australia CSIRO, Canberra. Lewis, N.B. and Ferguson, I.S. (1993) Management of radiata pine. Inkata Press, Melbourne and Sydney. Lewty, M.J. (1993) Plantation weed control in Australia: An overview of current practices, research activities and future direction. In: Proceedings of Research Working Group No 5, Plantation Silviculture, Traralgon, April 1993. Loschke, D. (2006) Current major approaches to spray drift risk management. Presentation at the 4th Plantation Pest Control Seminar, Mt Gambier, 28 February to 2 March, 2006. Mackay, P. (2004) Aerial application technology. Presentation at the 3rd Plantation Pest Control Seminar, Creswick, March, 2004. Malcolm, B., Sale, P., and Egan, A. (1996) Agriculture in Australia: An introduction. Oxford University Press. Mawhinney. W. (2004) Case study, catchment water quality and cotton: northern NSW. Section 6.1. In: Waterpak: a guide for irrigation management in cotton. Cotton Catchment Communities CRC. Down loaded from www.mv.pi.csiro.au on 14/09/06. Mazanec, Z. (1966) The effect of defoliation by Didymuria violescens (Phasmatidae) on the growth of alpine ash. Aust. For. 30: 125 – 130. Mcguire, D. (2006) Risk assessment and management of herbicide movement. Presentation at the 4th Plantation Pest Control Seminar, Mt Gambier, 28 February to 2 March, 2006. Messina, M.G. (1990) Herbicides increase growth responses to fertiliser in a 5-year-old Eucalyptus regnans plantation. N.Z. J. For. Sci. 20: 168 – 175. Mollison, J. (2006) Pesticides and water quality issues in Tasmania. Presentation at the 4th Plantation Pest Control Seminar, Mt Gambier, 28 February to 2 March, 2006. Nambiar, E.K.S. and Zed, P.G. (1980) Influence of weeds on water potential, nutrient content and growth of young radiata pine. Aust. For. Res. 10: 279 – 288. National Forest Inventory (2000) National Plantation Inventory tabular report - March, 2000. Bureau of Rural Sciences, Canberra. National Forest Inventory (2002) National Plantation Inventory tabular report - March, 2002. Bureau of Rural Sciences, Canberra. National Forest Inventory (2003) National Plantation Inventory annual update - March, 2003. Bureau of Rural Sciences, Canberra. National Forest Inventory (2004) National Plantation Inventory update - March, 2004. Bureau of Rural Sciences, Canberra. National Forest Inventory (2005) National Plantation Inventory 2005 update. Bureau of Rural Sciences, Canberra. National Forest Inventory (2006) Contract preparation of mapping for the project. BRS team. National Industrial Chemicals Notification and Assessment Scheme (2006) Chemicals in Australia: Chemical schemes at a glance. Downloaded from www.nicnas.gov.au on 06/09/06. Neumann, F.G. and Marks, G.C. (1976) A synopsis of important pests and diseases in Australian forests and forest nurseries. Aust. For. 39 (2). Ohmart, C.P. (1982) Insects associated with Pinus radiata throughout the world: an annotated bibliography. Divisional Report No.9. Div. of Forest Research, CSIRO, Australia. Programme for the Endorsement of Forest Certification (2006) PEFC Council information register: Statistic figures on PEFC certification. Downloaded from www.pefc.org on 06/09/06.
- 92 -

Chemical pesticide usage by Australian forest plantation industries
Parsons, M., Gavran, M and Davidson, J. (2006) Australia’s plantations 2006. National Forest Inventory, Bureau of Rural Sciences, Canberra. Pearsall, J. and Trumble, B. (1996) The Oxford English reference dictionary. Oxford University Press. Pers. com. 1 Mr Karl Liffmann, Accredited ChemCert provider. Pers. com. 2 Mr Peter Mackay, Field Air Group of Companies. Pers. com. 3 Mr Col Johnston, Field Air Helicopters Pers. com. 4 Macspred Pty Limited Pers. com. 5 Mr Bill Lawrence, For Mans Pty Limited Pers. com. 6 Mr Graeme Sonter, Forests NSW Pers. com. 7 Dr Geoff Dickinson, DPI&F Queensland Pers. com. 8 Mr Craig Wood, Sales and Marketing Manager – Forestry/IVM, Bayer Environmental Science. Pers. com. 9 Mr Phil Whiteman, Planning Manager, Grand Ridge Plantations Pty Limited Pers. com. 10 Mr Peter Alexander, TeeJet Australasia Pty Limited Petheram, R.J., Patterson, A., Williams, K., Jenkin, B. and Nettle, R. (2000) Socioeconomic impact of changing land use in south west Victoria. Institute of Land and Food Resources / University of Melbourne Report prepared for the Green Triangle Regional Plantation Committee. Plantations International Limited (2006) Introduction. Downloaded from www.plantationsinternational.com.au on 07/09/06. Primary Industries Standing Committee (2002) Spray drift management: principles, strategies and supporting information. PISC (SCARM) Report No: 82. CSIRO Publishing. Rawlings, G.B. (1960) Fungi and insects associated with Pinus radiata. In: Scott, C.W. (1960) Pinus radiata. Forests and Forest Products Study 14, F.A.O., Rome Italy. Ray, J. Davenhill, N. and Vanner, A. (1989) Cost-effective herbicides for Yorkshire fog control. Proc. N.Z. Weed and Pest Conf. 42: 124 – 126. Richardson, B. (1993) Vegetation management practices in plantation forests of Australia and New Zealand. Can. J. For. Res. (23). pp 1989 – 2005. Richardson, R. (2006a) Enzymes for the safer disposal of pesticides. Presentation at the 4th Plantation Pest Control Seminar, Mt Gambier, 28 February to 2 March, 2006. Richardson, B. (2006b) Research to manage risks from forest weeds. Presentation at the 4th Plantation Pest Control Seminar, Mt Gambier, 28 February to 2 March, 2006. Richardson, B., Ray, J., Vanner, A., Davenhill, N. and Miller, K. (1996) Nozzles for minimising aerial herbicide spray drift. NZ J. For. Sci. 26(3): pp438-48. Sands, R. and Nambiar, E.K.S. (1984) Water relations of Pinus radiata in competition with weeds. Can. J. For. Res. 14: 233 – 237. Schonau, A.P.G. (1984) Silvicultural considerations for high productivity of Eucalyptus grandis. For. Ecol. Mgt. 9: 295 – 314. Schumann, A.W. (1989) Weed research. In: Institute for Commercial Forestry Research Annual Report 1989. pp 64 – 72. Pietermaritzburg, South Africa. Schumann, A.W. (1990a) Selecting weed control systems for an E. grandis stand. In: Institute for Commercial Forestry Research Annual Report 1990. pp 265 – 275. Pietermaritzburg, South Africa. Schumann, A.W. (1990b) Reporting on herbicide screening trials: a preliminary of thirty-eight herbicides for utilization in afforestation of eucalypts, pine and wattles in South Africa. In: Institute for Commercial Forestry Research Annual Report 1990. pp 276 – 291. Pietermaritzburg, South Africa. Schirmer, J., Parsons, M., Charalambou, C. and Gavran, M. (2005) Socio-economic impacts of plantation forestry in the Great Southern region of WA, 1991 to 2004. FWPRDC Project no: PN04.4007. Selinger, B. (1999) Chemistry in the market place. 5th Ed. Allen and Unwin Press. Smethurst, P.J. and Nambiar, E.K.S. (1989) Role of weeds in the management of nitrogen in young Pinus radiata plantations. New For. 3: 203 – 224. Squire, R.O. (1977) Interacting effects of grass competition, fertilizing and cultivation on the early growth of Pinus radiata D. Don. Aust. For. Res. 7: 247 – 252.
- 93 -

Chemical pesticide usage by Australian forest plantation industries
Squire, R.O., Attiwill, P.M. and Neales, T.F. (1987) Effects of changes of available water and nutrients on growth, root development and water use in Pinus radiata seedlings. Aust. For. Res. 17: 99 – 11. Standards Australia (2003) The Australian forestry standard. Interim Standard: AS 4708(Int)-2003. Timbercorp Limited (2006) Who is Timbercorp Securities Limited? Downloaded from www.timbercorp.com.au on 07/09/06. Tomkins, I. B. 2004. A critique of the Forest Stewardship Council chemicals criteria for certification of plantation forestry. Aust. For. 67 (1), pp 68-73. Tommerup, I. (2002) Guava rust – the next big thing for Australia eucalypt plantations and forests. Australian Forest Grower. Spring, 2002. Turvey, N.D. and Cameron, J.N. (1986) Site preparation for a second rotation of radiata pine: soil and foliage chemistry, and the effect on tree growth. Aust. For. Res. 16: 9 – 19. Turvey, N.D., Attiwill, P.M., Cameron, J.N. and Smethurst. P.J. (1983) Growth of planted pine trees in response to variations in the densities of naturally regenerating acacias. For. Ecol. and Mgt. 7: 103 – 117. WA Plantation Resources Pty Limited (2006) How does WA Plantation Resources fit into the picture? Downloaded from www.wapres.com.au on 08/09/06. Walstad, J.D. and Gjerstad, D.H. (1984) Concepts of forest vegetation management. In: Integrated Forest and Pest management Symposium Proceedings, Athens GA. USA. Waters, D. (2004) Water quality in Queensland catchments and the cotton industry. Section 6.3. In: Waterpak: a guide for irrigation management in cotton. Cotton Catchment Communities CRC. Down loaded from www.mv.pi.csiro.au on 14/09/06. West, G.G. (1984) Establishment requirements of Pinus radiata cuttings and seedlings compared. N.Z. J. For. Sci. 14: 41 – 52. Wilkins, A.P. (1990) Influence of silvicultural treatment on growth and wood density of Eucalyptus grandis on previous pasture sites. Aust. For. 53: 168 – 172. Wilkinson, G.R. and Neilson, W.A. (1990) Effect of herbicides on woody weed control and growth of plantation eucalypt seedlings. Aust. For. 53 (2). pp 69 – 78. Wilkinson, G.R., Neilson, W.A. and Edwards, I. (1993) Hexazinone use for grass and woody weed control in establishing long term growth of Pinus radiata plantations. N.Z. J. For. Sci. 22(1), pp12-24. Willmott Forests Limited (2006) About Willmott Forests. Downloaded from www.willmottforests.com.au on 09/09/06. Wood, M.S., Stephens, N.C., Allison, B.K., and Howell, C.I. (2001) Plantations of Australia – a report from the National Plantation Inventory and the National Farm Forest Inventory. National Forest Inventory, Bureau of Rural Sciences, Canberra.
- 94 -

Chemical pesticide usage by Australian forest plantation industries
Bibliography for agricultural crop models The following are the reference material sources for the data and information used to construct the
regional crop profiles. It is organised based on the crop type, rather that by author.
Cropping
Barley Department of Agriculture, WA (2006) Gross margins guide 2005 Western Australia: Example of feed barley gross margin, following cereal: Central South Coast. Downloaded from www.agric.wa.gov.au. May, 2006. Department of Agriculture, WA (2006) Gross margins guide 2005 Western Australia: Example barley gross margin, following cereal: Northern District. Downloaded from www.agric.wa.gov.au. May, 2006. Department of Agriculture, WA (2006) Gross margins guide 2005 Western Australia: Example barley gross margin, following cereal: Great Southern. Downloaded from www.agric.wa.gov.au. May, 2006. Department of Primary industries and Water, Tasmania (2006) Cash crop enterprise budgets: Low rainfall districts – Tasmania 2005 – 2006: Barley – feed (Franklin) dryland. Down loaded from www.dpiw.tas.gov.au. May, 2006. Department of Primary industries and Water, Tasmania (2006) Cash crop enterprise budgets: High rainfall districts – Tasmania 2005 – 2006: Barley – feed (Franklin) dryland. Down loaded from www.dpiw.tas.gov.au. May, 2006. Department of Primary Industries NSW (2006) Dryland barley (long fallow, minimum till, feed). Farm Enterprise Budget Series - North East, NSW. NSW DPI Farm Enterprise Budgets. Downloaded from www.agric.nsw.gov.au. June, 2006. Department of Primary Industries NSW (2006) Dryland barley (minimum tillage). Farm Enterprise Budget Series - North West, NSW. NSW DPI Farm Enterprise Budgets. Downloaded from www.agric.nsw.gov.au. June, 2006. Department of Primary Industries NSW (2006) Dryland barley: Short fallow. Farm Enterprise Budget Series – Southern Zone - East, NSW. NSW DPI Farm Enterprise Budgets. Downloaded from www.agric.nsw.gov.au. June, 2006. Department of Primary Industries NSW (2006) Dryland barley: Short fallow. Farm Enterprise Budget Series – Central Zone - West, NSW. Winter 2006. NSW DPI Farm Enterprise Budgets. Downloaded from www.agric.nsw.gov.au. June, 2006. Rural Solutions SA (2006) Farm gross margin guide: A gross margin template for crop and livestock enterprises: Malting Barley Gross Margin. A Rural Solutions SA Publication. Rural Solutions SA (2006) Farm gross margin guide: A gross margin template for crop and livestock enterprises: Feed Barley Gross Margin. A Rural Solutions SA Publication. Canola Department of Agriculture, WA (2006) Gross margins guide 2005 Western Australia: Example canola gross margin, following cereal: Great Southern. Downloaded from www.agric.wa.gov.au. May, 2006. Department of Agriculture, WA (2006) Gross margins guide 2005 Western Australia: Example canola gross margin. South Coast, after pasture. Downloaded from www.agric.wa.gov.au. May, 2006. Department of Primary Industries NSW (2006) Canola: after cereal. Farm Enterprise Budget Series, Southern Zone – east. Dryland winter, 2006. NSW DPI Farm Enterprise Budgets. Downloaded from www.agric.nsw.gov.au. June, 2006. Department of Primary Industries NSW (2006) Canola: long fallow. Farm Enterprise Budget Series, Central Zone – east. Winter, 2006. NSW DPI Farm Enterprise Budgets. Downloaded from www.agric.nsw.gov.au. June, 2006. Department of Primary Industries NSW (2006) Canola: long fallow. Farm Enterprise Budget Series, Central Zone – West. Winter, 2006. NSW DPI Farm Enterprise Budgets. Downloaded from www.agric.nsw.gov.au. June, 2006. Department of Primary Industries NSW (2006) Canola: long fallow. Farm Enterprise Budget Series, Southern Zone – West. Dryland Winter, 2006. NSW DPI Farm Enterprise Budgets. Downloaded from www.agric.nsw.gov.au. June, 2006. Department of Primary Industries NSW (2006) Dryland canola (no till). Farm Enterprise Budget Series, North East Zone. Winter, 2006. NSW DPI Farm Enterprise Budgets. Downloaded from www.agric.nsw.gov.au. June, 2006. Department of Primary Industries NSW (2006) Canola: short fallow. Farm Enterprise Budget Series, Central Zone – east. Winter, 2006. NSW DPI Farm Enterprise Budgets. Downloaded from www.agric.nsw.gov.au. June, 2006. Department of Primary Industries NSW (2006) Canola: shot fallow (no till). Farm Enterprise Budget Series, Central Zone – west. Winter, 2006. NSW DPI Farm Enterprise Budgets. Downloaded from www.agric.nsw.gov.au. June, 2006.
- 95 -

Chemical pesticide usage by Australian forest plantation industries
Department of Primary Industries NSW (2006) Dryland Canola (no till). Farm Enterprise Budget Series, North West Zone NSW. Winter, 2006. NSW DPI Farm Enterprise Budgets. Downloaded from www.agric.nsw.gov.au. June, 2006. Rural Solutions SA (2006) Farm gross margin guide: A gross margin template for crop and livestock enterprises: Canola Gross Margin. A Rural Solutions SA Publication. Chickpeas, faba beans, mung beans and soybeans Department of Primary Industries NSW Dryland chickpeas (no till). Farm Enterprise Budget Series, North West, NSW. Winter, 2006. NSW DPI Farm Enterprise Budgets. Downloaded from www.agric.nsw.gov.au. June, 2006. Department of Primary Industries NSW Dryland chickpeas (no till). Farm Enterprise Budget Series, North East, NSW. Winter, 2006. NSW DPI Farm Enterprise Budgets. Downloaded from www.agric.nsw.gov.au. June, 2006. Department of Primary Industries NSW (2006) Chickpeas: Short fallow. Farm Enterprise Budget Series, Central Zone - East, NSW. Winter, 2006. NSW DPI Farm Enterprise Budgets. Downloaded from www.agric.nsw.gov.au. June, 2006. Department of Primary Industries NSW (2006) Chickpeas: Short fallow (No-till and conventional). Farm Enterprise Budget Series, Central Zone - West, NSW. Winter, 2006. NSW DPI Farm Enterprise Budgets. Downloaded from www.agric.nsw.gov.au. June, 2006. Department of Primary Industries NSW (2006) Dryland mungbeans (no till). Farm Enterprise Budget Series, North East Zone, NSW. Winter, 2006. NSW DPI Farm Enterprise Budgets. Downloaded from www.agric.nsw.gov.au. June, 2006. Department of Primary Industries NSW (2006) Spray irrigated mungbeans (no till). Farm Enterprise Budget Series, Northern Zone, NSW. Winter, 2006. NSW DPI Farm Enterprise Budgets. Downloaded from www.agric.nsw.gov.au. June, 2006. Department of Primary Industries NSW (2006) Surface irrigated soybeans. Farm Enterprise Budget Series, Northern Zone, NSW. Winter, 2006. NSW DPI Farm Enterprise Budgets. Downloaded from www.agric.nsw.gov.au. June, 2006. Department of Primary Industries NSW (2006) Dryalnd soybeans. Farm Enterprise Budget Series, North East Zone, NSW. Winter, 2006. NSW DPI Farm Enterprise Budgets. Downloaded from www.agric.nsw.gov.au. June, 2006. Rural Solutions SA (2006) Farm gross margin guide: A gross margin template for crop and livestock enterprises: Faba beans Gross Margin. A Rural Solutions SA Publication. Cotton Department of Primary Industries NSW (2006) Surface irrigated cotton. Farm Enterprise Budget Series, Northern Zone - West, NSW. Summer, 2005 - 2006. NSW DPI Farm Enterprise Budgets. Downloaded from www.agric.nsw.gov.au. June, 2006. Department of Primary Industries NSW (2006) Surface irrigated cotton. Farm Enterprise Budget Series, Northern Zone, NSW. Summer, 2004 - 2005. NSW DPI Farm Enterprise Budgets. Downloaded from www.agric.nsw.gov.au. June, 2006. Department of Primary Industries NSW (2006) Dryland cotton (double skip row). Farm Enterprise Budget Series, North East Zone, NSW. Summer, 2005 - 2006. NSW DPI Farm Enterprise Budgets. Downloaded from www.agric.nsw.gov.au. June, 2006. Department of Primary Industries NSW (2006) Cotton (Bollgard II® single skip row). Farm Enterprise Budget Series, Northern Zone - West, NSW. Summer, 2005 - 2006. NSW DPI Farm Enterprise Budgets. Downloaded from www.agric.nsw.gov.au. June, 2006. Lupins Department of Agriculture, WA (2006) Gross margins guide 2005 Western Australia: Example of lupins gross margin, following cereal: Great Southern. Downloaded from www.agric.wa.gov.au. May, 2006. Department of Agriculture, WA (2006) Gross margins guide 2005 Western Australia: Example of lupins gross margin, following cereal: 2004 Northern District. Downloaded from www.agric.wa.gov.au. May, 2006. Department of Primary Industries NSW (2006) Dryland Lupins: Short fallow. North West NSW. Farm Enterprise Budget Series - Winter 2006 NSW DPI Farm Enterprise Budgets. Downloaded from www.agric.nsw.gov.au. June, 2006. Department of Primary Industries NSW (2006) Narrow leaf and Albus Lupins: Short fallow (conventional). Farm Enterprise Budget Series - Central Zone - West. Winter 2006. NSW DPI Farm Enterprise Budgets. Downloaded from www.agric.nsw.gov.au. June, 2006. Department of Primary Industries NSW (2006) Narrow leaf Lupins: After Cereal. Southern Zone West NSW. Farm Enterprise Budget Series - Winter 2006 NSW DPI Farm Enterprise Budgets. Downloaded from www.agric.nsw.gov.au. June, 2006. Department of Primary Industries NSW (2006) Narrow leaf Lupins: After Cereal (Direct Drill). Farm Enterprise Budget Series - Southern Zone East NSW. February 2006. NSW DPI Farm Enterprise Budgets. Downloaded from www.agric.nsw.gov.au. June, 2006. Rural Solutions SA (2006) Farm gross margin guide: A gross margin template for crop and livestock enterprises: Lupins Gross Margin. A Rural Solutions SA Publication.
- 96 -

Chemical pesticide usage by Australian forest plantation industries
Maize Department of Primary Industries NSW (2006) Dryland maize (no till). Farm Enterprise Budget Series - North East NSW. February 2006. NSW DPI Farm Enterprise Budgets. Downloaded from www.agric.nsw.gov.au. June, 2006. Department of Primary Industries NSW (2006) Surface irrigated maize. Farm Enterprise Budget Series - Northern Zone NSW. February 2006. NSW DPI Farm Enterprise Budgets. Downloaded from www.agric.nsw.gov.au. June, 2006. Millet and sorghum Department of Primary Industries NSW (2006) Millet – Shirohie – Border Creek. Farm Enterprise Budget Series – Murray Valley, NSW. Summer 2005 - 2006. NSW DPI Farm Enterprise Budgets. Downloaded from www.agric.nsw.gov.au. June, 2006. Department of Primary Industries NSW (2006) Dryalnd grain sorghum (no till). Farm Enterprise Budget Series – North East Zone NSW. Summer 2005 - 2006. NSW DPI Farm Enterprise Budgets. Downloaded from www.agric.nsw.gov.au. June, 2006. Department of Primary Industries NSW (2006) Surface irrigated sorghum. Farm Enterprise Budget Series – Northern Zone NSW. Summer 2004 - 2005. NSW DPI Farm Enterprise Budgets. Downloaded from www.agric.nsw.gov.au. June, 2006. Oats Department of Agriculture, WA (2006) Gross margins guide 2005 Western Australia: Example of oats gross margin: after two years of cereals: 2005 Merredin Region. Downloaded from www.agric.wa.gov.au. May, 2006. Department of Agriculture, WA (2006) Gross margins guide 2005 Western Australia: Example of oats for grain gross margin: Great Southern Region. Downloaded from www.agric.wa.gov.au. May, 2006. Department of Primary industries and Water, Tasmania (2006) Cash crop enterprise budgets: Low rainfall districts – Tasmania 2005 – 2006: Oats (Quarmby) Dryland (spring sown). Down loaded from www.dpiw.tas.gov.au. May, 2006. Department of Primary industries and Water, Tasmania (2006) Cash crop enterprise budgets: Low rainfall districts – Tasmania 2005 – 2006: Oats (Esk) Dryland (Autumn sown). Down loaded from www.dpiw.tas.gov.au. May, 2006. Department of Primary Industries NSW (2006) Dryland oats: (minimum till). Farm Enterprise Budget Series, North east. NSW. Winter, 2006. NSW DPI Farm Enterprise Budgets. Downloaded from www.agric.nsw.gov.au. June, 2006. Department of Primary Industries NSW (2006) Dryland forage oats. Farm Enterprise Budget Series, North East Zone – West. NSW. Winter, 2006. NSW DPI Farm Enterprise Budgets. Downloaded from www.agric.nsw.gov.au. June, 2006. Department of Primary Industries NSW (2006) Dryland oats: grain grazing/grain (short fallow). Farm Enterprise Budget Series, North east Zone – West. NSW. Dryland winter, 2006. NSW DPI Farm Enterprise Budgets. Downloaded from www.agric.nsw.gov.au. June, 2006. Department of Primary Industries NSW (2006) Oats for grain: short fallow. Farm Enterprise Budget Series, Southern Zone – east. NSW. Dryland winter, 2006. NSW DPI Farm Enterprise Budgets. Downloaded from www.agric.nsw.gov.au. June, 2006. Department of Primary Industries NSW (2006) Oats: grain (short fallow). Farm Enterprise Budget Series, Southern Zone – West. NSW. Dryland winter, 2006. NSW DPI Farm Enterprise Budgets. Downloaded from www.agric.nsw.gov.au. June, 2006. Department of Primary Industries NSW (2006) Oats: grain (short fallow). Farm Enterprise Budget Series, Central Zone – East. NSW. Dryland winter, 2006. NSW DPI Farm Enterprise Budgets. Downloaded from www.agric.nsw.gov.au. June, 2006. Department of Primary Industries NSW (2006) Oats: grain (short fallow). Farm Enterprise Budget Series, Central Zone – West. NSW. Dryland winter, 2006. NSW DPI Farm Enterprise Budgets. Downloaded from www.agric.nsw.gov.au. June, 2006. Rural Solutions SA (2006) Farm gross margin guide: A gross margin template for crop and livestock enterprises: Feed oats Gross Margin. A Rural Solutions SA Publication. Rice Department of Primary Industries NSW (2006) Rice – medium grain (aerial sown). Farm Enterprise Budget Series, Murrumbidgee Valley 2005 - 2006. NSW DPI Farm Enterprise Budgets. Downloaded from www.agric.nsw.gov.au. June, 2006. Tritacale Department of Primary industries and Water, Tasmania (2006) Cash crop enterprise budgets: Low rainfall districts – Tasmania 2005 – 2006: Triticale. Down loaded from www.dpiw.tas.gov.au. May, 2006. Department of Primary Industries NSW (2006) Triticale: short fallow. Farm Enterprise Budget Series, Dryland Winter Southern Zone - east. 2006 NSW DPI Farm Enterprise Budgets. Downloaded from www.agric.nsw.gov.au. June, 2006. Rural Solutions SA (2006) Farm gross margin guide: A gross margin template for crop and livestock enterprises: Triticale Gross Margin. A Rural Solutions SA Publication.
- 97 -

Chemical pesticide usage by Australian forest plantation industries
Wheat Department of Agriculture, WA (2006) Gross margins guide 2005 Western Australia: Example of wheat gross margin, following lupin: 2004 Kellerberrin Region. Downloaded from www.agric.wa.gov.au. May, 2006. Department of Agriculture, WA (2006) Gross margins guide 2005 Western Australia: Example of APW wheat gross margin, following lupin: 2004 Narrogin District. Downloaded from www.agric.wa.gov.au. May, 2006. Department of Primary industries and Water, Tasmania (2006) Cash crop enterprise budgets: High rainfall districts – Tasmania 2005 – 2006: Wheat (Longbow). Down loaded from www.dpiw.tas.gov.au. May, 2006. Department of Primary industries and Water, Tasmania (2006) Cash crop enterprise budgets: Low rainfall districts – Tasmania 2005 – 2006: Wheat (Longbow): No urea topdressing. Down loaded from www.dpiw.tas.gov.au. May, 2006. Department of Primary industries and Water, Tasmania (2006) Cash crop enterprise budgets: Low rainfall districts – Tasmania 2005 – 2006: Wheat (Longbow): Two applications of urea topdressing. Down loaded from www.dpiw.tas.gov.au. May, 2006. Department of Primary industries and Water, Tasmania (2006) Cash crop enterprise budgets: Low rainfall districts – Tasmania 2005 – 2006: Wheat (Australian varieties). Down loaded from www.dpiw.tas.gov.au. May, 2006. Department of Primary Industries NSW (2006) Dryland wheat: (Long fallow, minimum till, after sorghum). Farm Enterprise Budget Series, North east. NSW. Winter, 2006. NSW DPI Farm Enterprise Budgets. Downloaded from www.agric.nsw.gov.au. June, 2006. Department of Primary Industries NSW (2006) Dryland wheat: (Long fallow, no till). Farm Enterprise Budget Series, North west. NSW. Winter, 2006. NSW DPI Farm Enterprise Budgets. Downloaded from www.agric.nsw.gov.au. June, 2006. Department of Primary Industries NSW (2006) Dryland wheat: (Short fallow, no till). Farm Enterprise Budget Series, North east. NSW. Winter, 2006. NSW DPI Farm Enterprise Budgets. Downloaded from www.agric.nsw.gov.au. June, 2006. Department of Primary Industries NSW (2006) Wheat: (Long fallow). Farm Enterprise Budget Series, Central Zone east. NSW. Winter, 2006. NSW DPI Farm Enterprise Budgets. Downloaded from www.agric.nsw.gov.au. June, 2006. Department of Primary Industries NSW (2006) Wheat: (Short fallow). Farm Enterprise Budget Series, Central Zone west. NSW. Winter, 2006. NSW DPI Farm Enterprise Budgets. Downloaded from www.agric.nsw.gov.au. June, 2006. Department of Primary Industries NSW (2006) Wheat: Chemical fallow (ASW / APW / AH: Following pasture). Farm Enterprise Budget Series, Southern Zone east. NSW. Dryland Winter, 2006. NSW DPI Farm Enterprise Budgets. Downloaded from www.agric.nsw.gov.au. June, 2006. Department of Primary Industries NSW (2006) Wheat: Long fallow (ASW / APW / AH). Farm Enterprise Budget Series, Southern Zone west. NSW. Dryland Winter, 2006. NSW DPI Farm Enterprise Budgets. Downloaded from www.agric.nsw.gov.au. June, 2006. Department of Primary Industries NSW (2006) Wheat: Long fallow. Farm Enterprise Budget Series, Central Zone west. NSW. Winter, 2006. NSW DPI Farm Enterprise Budgets. Downloaded from www.agric.nsw.gov.au. June, 2006. Rural Solutions SA (2006) Farm gross margin guide: A gross margin template for crop and livestock enterprises: APW wheat Gross Margin. A Rural Solutions SA Publication. Vegetables Department of Primary industries and Water, Tasmania (2006) Cash crop enterprise budgets: High rainfall districts – Tasmania 2005 – 2006: Brussels sprouts. Down loaded from www.dpiw.tas.gov.au. May, 2006. Department of Primary industries and Water, Tasmania (2006) Cash crop enterprise budgets: High rainfall districts – Tasmania 2005 – 2006: Cauliflower. Down loaded from www.dpiw.tas.gov.au. May, 2006. Department of Primary industries and Water, Tasmania (2006) Cash crop enterprise budgets: High rainfall districts – Tasmania 2005 – 2006: Broccoli – Autumn main crop. Down loaded from www.dpiw.tas.gov.au. May, 2006. Department of Primary industries and Water, Tasmania (2006) Cash crop enterprise budgets: High rainfall districts – Tasmania 2005 – 2006: Carrots - baby. Down loaded from www.dpiw.tas.gov.au. May, 2006. Department of Primary industries and Water, Tasmania (2006) Cash crop enterprise budgets: High rainfall districts – Tasmania 2005 – 2006: Potatoes for processing (Shepody). Down loaded from www.dpiw.tas.gov.au. May, 2006. Department of Primary industries and Water, Tasmania (2006) Cash crop enterprise budgets: High rainfall districts – Tasmania 2005 – 2006: Potatoes for processing (Russet Burbank). Down loaded from www.dpiw.tas.gov.au. May, 2006. Department of Primary industries and Water, Tasmania (2006) Cash crop enterprise budgets: High rainfall districts – Tasmania 2005 – 2006: Potatoes - seed (Russet Burbank). Down loaded from www.dpiw.tas.gov.au. May, 2006. Department of Primary industries and Water, Tasmania (2006) Cash crop enterprise budgets: High rainfall districts – Tasmania 2005 – 2006: Potatoes - seed (Shepody). Down loaded from www.dpiw.tas.gov.au. May, 2006. Department of Primary industries and Water, Tasmania (2006) Cash crop enterprise budgets: High rainfall districts – Tasmania 2005 – 2006: Green peas. Down loaded from www.dpiw.tas.gov.au. May, 2006.
- 98 -

Chemical pesticide usage by Australian forest plantation industries
Department of Primary industries and Water, Tasmania (2006) Cash crop enterprise budgets: High rainfall districts – Tasmania 2005 – 2006: Green beans - slicing. Down loaded from www.dpiw.tas.gov.au. May, 2006. Department of Primary industries and Water, Tasmania (2006) Cash crop enterprise budgets: High rainfall districts – Tasmania 2005 – 2006: Broad beans. Down loaded from www.dpiw.tas.gov.au. May, 2006. Department of Primary industries and Water, Tasmania (2006a) Cash crop enterprise budgets: High rainfall districts – Tasmania 2005 – 2006: Onions. Down loaded from www.dpiw.tas.gov.au. May, 2006. Department of Primary Industries NSW (2006) Asparagus – fresh: spray irrigated. Farm Enterprise Budget Series, 2001. NSW DPI Farm Enterprise Budgets. Downloaded from www.agric.nsw.gov.au. June, 2006. Department of Primary Industries NSW (2006) Broccoli furrow irrigation. Farm Enterprise Budget Series, NSW. 2001. NSW DPI Farm Enterprise Budgets. Downloaded from www.agric.nsw.gov.au. June, 2006. Department of Primary Industries NSW (2006) Carrots - fresh. Farm Enterprise Budget Series, NSW. 2001. NSW DPI Farm Enterprise Budgets. Downloaded from www.agric.nsw.gov.au. June, 2006. Department of Primary Industries NSW (2006) Capsicum: furrow irrigated. Farm Enterprise Budget Series, NSW. 2001. NSW DPI Farm Enterprise Budgets. Downloaded from www.agric.nsw.gov.au. June, 2006. Department of Primary Industries NSW (2006) Cauliflower – fresh: furrow irrigated. Farm Enterprise Budget Series, 2001. NSW DPI Farm Enterprise Budgets. Downloaded from www.agric.nsw.gov.au. June, 2006. Department of Primary Industries NSW (2006) Lettuce - fresh: furrow irrigated. Farm Enterprise Budget Series, 2001. NSW DPI Farm Enterprise Budgets. Downloaded from www.agric.nsw.gov.au. June, 2006. Department of Primary Industries NSW (2006) Onions – mechanical harvest: furrow irrigated. Farm Enterprise Budget Series, 2001. NSW DPI Farm Enterprise Budgets. Downloaded from www.agric.nsw.gov.au. June, 2006. Department of Primary Industries NSW (2006) Potato – fresh: summer crop spray irrigated. Farm Enterprise Budget Series, 2001. NSW DPI Farm Enterprise Budgets. Downloaded from www.agric.nsw.gov.au. June, 2006. Department of Primary Industries NSW (2006) Potato – fresh: summer crop spray irrigated. Farm Enterprise Budget Series, 2001. NSW DPI Farm Enterprise Budgets. Downloaded from www.agric.nsw.gov.au. June, 2006. Department of Primary Industries NSW (2006) Pumpkin - Jarradale: furrow irrigated. Farm Enterprise Budget Series, 2001. NSW DPI Farm Enterprise Budgets. Downloaded from www.agric.nsw.gov.au. June, 2006. Department of Primary Industries NSW (2006) Rockmellon: furrow irrigated. Farm Enterprise Budget Series, 2001. NSW DPI Farm Enterprise Budgets. Downloaded from www.agric.nsw.gov.au. June, 2006. Department of Primary Industries NSW (2006) Sweet corn - processing: furrow irrigated. Farm Enterprise Budget Series, 2001. NSW DPI Farm Enterprise Budgets. Downloaded from www.agric.nsw.gov.au. June, 2006. Department of Primary Industries NSW (2006) Sweet corn - processing: furrow irrigated. Farm Enterprise Budget Series, 2001. NSW DPI Farm Enterprise Budgets. Downloaded from www.agric.nsw.gov.au. June, 2006. Department of Primary Industries NSW (2006) Sweet corn - fresh: furrow irrigated. Farm Enterprise Budget Series, 2001. NSW DPI Farm Enterprise Budgets. Downloaded from www.agric.nsw.gov.au. June, 2006. Department of Primary Industries NSW (2006) Tomato - fresh. Farm Enterprise Budget Series. NSW. 2001. NSW DPI Farm Enterprise Budgets. Downloaded from www.agric.nsw.gov.au. June, 2006. Department of Primary Industries NSW (2006) Tomato - processing. Farm Enterprise Budget Series. NSW. 2001. NSW DPI Farm Enterprise Budgets. Downloaded from www.agric.nsw.gov.au. June, 2006. Department of Primary Industries NSW (2006) Watermelon: furrow irrigated. Farm Enterprise Budget Series. NSW. 2001. NSW DPI Farm Enterprise Budgets. Downloaded from www.agric.nsw.gov.au. June, 2006. Department of Primary Industries NSW (2006) Zucchini: spray irrigated. Farm Enterprise Budget Series, 2001. NSW DPI Farm Enterprise Budgets. Downloaded from www.agric.nsw.gov.au. June, 2006. Graham, M. (2005) Growing tomatoes in the south-west. Farmnote No. 45/94. WA Dept. of Agriculture. Other crops Department of Primary Industries Queensland (1999) Banana economics. Information series Q199050, Centre for Tropical Agriculture. Department of Primary Industries Queensland (1999) Sugar. Information series Q199050, Centre for Tropical Agriculture. Department of Primary industries and Water, Tasmania (2006) Livestock enterprise budgets: High rainfall districts – Tasmania 2002 – 2003: Poppies. Down loaded from www.dpiw.tas.gov.au. May, 2006. Pastures and hay
- 99 -

Chemical pesticide usage by Australian forest plantation industries
Department of Agriculture, WA (2006) Gross margins guide 2005 Western Australia: Example of export hay gross margin: Narrogin District. Downloaded from www.agric.wa.gov.au. May, 2006. Department of Primary industries and Water, Tasmania (2006) Cash crop enterprise budgets: Low rainfall districts – Tasmania 2005 – 2006: Lucerne. Down loaded from www.dpiw.tas.gov.au. May, 2006. Department of Primary industries and Water, Tasmania (2006) Livestock enterprise budgets: High rainfall districts – Tasmania 2002 – 2003: Appendix IX: Pasture and feed costs. Down loaded from www.dpiw.tas.gov.au. May, 2006. Department of Primary industries and Water, Tasmania (2006) Livestock enterprise budgets: Low rainfall districts – Tasmania 2002 – 2003: Appendix IX: Pasture and feed costs. Down loaded from www.dpiw.tas.gov.au. May, 2006. Department of Primary Industries NSW (2006) Dryland oats: grain grazing/grain (short fallow). Farm Enterprise Budget Series, North east Zone – West. NSW. Dryland winter, 2006. NSW DPI Farm Enterprise Budgets. Downloaded from www.agric.nsw.gov.au. June, 2006. Department of Primary Industries NSW (2006) Oaten hay: Short fallow. Farm Enterprise Budget Series, Southern Zone west. NSW. Dryland Winter, 2006. NSW DPI Farm Enterprise Budgets. Downloaded from www.agric.nsw.gov.au. June, 2006. Department of Primary Industries NSW (2006) Perennial tropical grass pasture. Farm Enterprise Budget Series, Northern Zone. NSW. Summer: 2005-2006. NSW DPI Farm Enterprise Budgets. Downloaded from www.agric.nsw.gov.au. June, 2006. Department of Primary Industries NSW (2006) Summer perennial pasture: white clover / ryegrass (establishment and maintenance). Farm Enterprise Budget Series, Murrumbidgee Valley and Murray Valley. NSW. Winter, 2006. NSW DPI Farm Enterprise Budgets. Downloaded from www.agric.nsw.gov.au. June, 2006. Department of Primary Industries NSW (2006) Surface irrigated lucerne. Farm Enterprise Budget Series, Northern Zone. NSW. Dryland Summer: 2005-2006. NSW DPI Farm Enterprise Budgets. Downloaded from www.agric.nsw.gov.au. June, 2006. Rural Solutions SA (2006) Farm gross margin guide: A gross margin template for crop and livestock enterprises: Export oaten hay Gross Margin. A Rural Solutions SA Publication. Livestock General Department of Primary industries and Water, Tasmania (2006) Livestock enterprise budgets: High rainfall districts – Tasmania 2002 – 2003: Appendix V: Animal health costs. Down loaded from www.dpiw.tas.gov.au. May, 2006. Department of Primary industries and Water, Tasmania (2006) Livestock enterprise budgets: Low rainfall districts – Tasmania 2002 – 2003: Appendix V: Animal health costs. Down loaded from www.dpiw.tas.gov.au. May, 2006. Beef and dairy Department of Primary industries and Water, Tasmania (2006) Livestock enterprise budgets: High rainfall districts – Tasmania 2002 – 2003: Appendix V: Animal health costs. Down loaded from www.dpiw.tas.gov.au. May, 2006. Department of Primary industries and Water, Tasmania (2006) Livestock enterprise budgets: High rainfall districts – Tasmania 2002 – 2003: Beef breeding – vealer production. Down loaded from www.dpiw.tas.gov.au. May, 2006. Department of Primary Industries NSW (2004) Livestock health (Ch. 6). In: NSW Department of Primary Industries Beef Enterprise Budgets. Department of Primary Industries NSW. December, 2004 Department of Primary Industries NSW (2005) Using DSEs and carrying capacity to compare beef enterprises. Downloaded from www.agric.nsw.gov.au. May, 2006. Department of Primary Industries NSW (2006) Beef cattle gross margin budget: North coast weaners 1 (unimproved country) - stores. Farm Enterprise Budget Series. NSW. 2006. NSW DPI Farm Enterprise Budgets. Downloaded from www.agric.nsw.gov.au. June, 2006. Department of Primary Industries NSW (2006) Beef cattle gross margin budget: North coast weaners 2 (improved country) - stores. Farm Enterprise Budget Series. NSW. 2006. NSW DPI Farm Enterprise Budgets. Downloaded from www.agric.nsw.gov.au. June, 2006. Pers. com. 11 Mr Craig McWhinney, Agricultural Consultant, Ag Challenge Consulting Pty Limited. Sheep Department of Agriculture, WA (2006) Gross margins guide 2005 Western Australia: Example of Sheep gross margin (self replacing ewe flock) Great Southern. Downloaded from www.agric.wa.gov.au. May, 2006. Department of Agriculture, WA (2006) Gross margins guide 2005 Western Australia: Example of Sheep gross margin 2004 (self replacing merino ewe flock wool production) Central South Coast. Downloaded from www.agric.wa.gov.au. May, 2006. Department of Agriculture, WA (2006) Gross margins guide 2005 Western Australia: Example of Sheep gross margin (cross bred prime lamb flock) Great Southern. Downloaded from www.agric.wa.gov.au. May, 2006.
- 100 -

Chemical pesticide usage by Australian forest plantation industries
Department of Primary Industries NSW (2006) Merino ewes (21 micron): 75% to Merino rams, 25% to terminal rams. Farm Enterprise Budget Series. NSW. 2006. NSW DPI Farm Enterprise Budgets. Downloaded from www.agric.nsw.gov.au. June, 2006. Rural Solutions SA (2006) Farm gross margin guide: A gross margin template for crop and livestock enterprises: Self replacing merino flock – high rainfall (450mm+). A Rural Solutions SA Publication. Rural Solutions SA (2006) Farm gross margin guide: A gross margin template for crop and livestock enterprises: Beef cattle – high rainfall (450mm+). A Rural Solutions SA Publication. Citrus, orchards and grapes NSW Agriculture (2003) Citrus Farm budget handbook – 2003 (EV 1.0): Oranges – Early Navel. NSW Dept. of Agriculture. NSW Agriculture (2003) Citrus Farm budget handbook – 2003 (EV 1.0): Oranges – Washington Navel. NSW Dept. of Agriculture. NSW Agriculture (2003) Citrus Farm budget handbook – 2003 (EV 1.0): Oranges – Valencia. NSW Dept. of Agriculture. NSW Agriculture (2003) Citrus Farm budget handbook – 2003 (EV 1.0): Mandarin – Clementine. NSW Dept. of Agriculture. NSW Agriculture (2003) Citrus Farm budget handbook – 2003 (EV 1.0): Lemons – (Standard density planting). NSW Dept. of Agriculture. Department of Primary Industries Victoria (2005) Loddon Murray region Horticulture Gross Margins 2005 - 06: Apples - packed. Department of Sustainability and Environment, Victoria. Department of Primary Industries Victoria (2005) Loddon Murray region Horticulture Gross Margins 2005 - 06: Apricots - packed. Department of Sustainability and Environment, Victoria. Department of Primary Industries Victoria (2005) Loddon Murray region Horticulture Gross Margins 2005 - 06: Wine grapes. Department of Sustainability and Environment, Victoria. Department of Primary Industries Queensland (1999) Banana economics. Information series Q199050, Centre for Tropical Agriculture. Department of Primary Industries Queensland (1999) Sugar. Information series Q199052, Centre for Tropical Agriculture. Department of Infrastructure, Energy and Resources (2003) Rural land use trends in Tasmania 2003, DIER – Forests Tasmania: Section 3: Land use trends. Downloaded from www.dier.tas.gov.au on 02/05/2006.
- 101 -

Chemical pesticide usage by Australian forest plantation industries
Appendix A Industry Survey
Confidential industry survey covering note
The project
Development of comparative chemical pesticide input statistics for various land management industries is
important to provide a contextual framework for informed discussion. Chemical pesticide use will be a
function of legal, crop and pest issues. Application technique (ground or aerial) and coverage (target
plant, spot, strip or broadcast) varies with situation (crop and pest) and overall crop management. This
project aims to review and/or consider:
• The evolution of and change in chemical pesticide use by Australian agriculture and in plantations
to provide a historical/contextual framework;
• A confidential chemical pesticide use survey of the major plantation organizations;
• Regulatory controls at Federal, State and Local Government levels;
• Plantation and agricultural crops industry codes of practice;
• Chemical free alternatives in the context of the situation where used;
• Potential future chemical use trends;
• Potential management regimes;
• Some chemicals may be de-registered and others will be developed;
• Emerging “new generation options” such as biological agents.
It is proposed to develop broad chemical pesticide use profiles based on the National Forest Inventory
(NFI) zones. Comparisons to “neighbouring” land chemical pesticide use will be included. In some
instances, crops and plantation species are similar and zones will be combined. Major agricultural zones
not covered will be addressed for the main crops grown. A comprehensive report will be prepared for
FWPRDC review and publication.
The project was undertaken by Braden Jenkin (Sylva Systems Pty Ltd) and Dr Barry Tomkins (GreenTree
Forestry Services).
A confidential survey
The following notes accompany the attached Excel® spreadsheet-based chemical pesticide and fertiliser
use survey of your organisation. The information collected will be done so in strict “commercial in
confidence”. Data is to be aggregated by NFI zones (see Figure A.1). Within each NFI zone, the data will
be further aggregated to give tonnes of active ingredient (a.i.) and total value of the chemical pesticides
used split into:
• Herbicides;
• Insecticides;
- 102 -

Chemical pesticide usage by Australian forest plantation industries
• Fungicides;
• Adjuvants;
• Nematicides;
• Baits and poisons.
National Forest Inventory (NFI) zones (taken from National Forest Inventory (2004) Plantations of Australia Information CD, Bureau of Rural Sciences, Canberra.).
Figure A.1
Survey headings
Company / organisation
Please fill in the name of your organisation.
Region
Please fill in the number of the NFI region as shown in the map in Figure A.1. If your operations are
outside NFI regions, please list the area. Note: please complete a separate survey file for each NFI zone
in which your organisation operates.
- 103 -

Chemical pesticide usage by Australian forest plantation industries
Active Ingredient
Individual product (by trade name) use is not requested in most cases. Data are to be aggregated based
on active ingredient (a.i.). Please fill data lines for each a.i. shown. Where an a.i. used is not listed, please
fill in the spaces provided (“other – please name”). Certain propriety products (named) contain a.i.
mixtures. Please fill in the quantity of the named product, and the a.i. quantities will be determined later.
Year
If available, please provide data on chemical use for the calendar years 2003, 2004 and 2005.
A.I./unit product
Please indicate the product concentration as per the container labels in grams per unit (please specify the
units e.g. litres or kilograms).
For example, glyphosate 360, 450, or 540 g/L product.
A.I. used or Product used
Please provide the gross quantity of chemical used either by a.i. (a.i. kg/yr) or units of product (product
units/year). If you do not wish to calculate total a.i. used, please give product quantity/year.
Area treated
Please indicate the total area (ha) per year treated by the chemicals indicated. Whilst the a.i. use and
area treated will allow a mean a.i. per hectare application rate to be calculated, use rates vary depending
on locality, and will not indicate individual regimes.
Indicative cost
Please provide indicative cost of the chemical type (i.e. herbicides, fungicides etc) purchased for the
years shown ($000's/yr). An aggregate cost for all chemicals is essential for an accurate assessment of
total chemical pesticides used in Australian plantations.
Acknowledgement
Your assistance with this survey will be acknowledged in the report.
Industry survey participants
The industry survey was sent out to the main Australian plantation forestry organisations. Each
organisation was contacted by telephone in the first instance to identify the most appropriate contact
person and to discuss the study. An electronic survey spreadsheet was sent by email to the identified
person. Table A.1 presents a list of the organisations that provided a response to the survey.
- 104 -

Chemical pesticide usage by Australian forest plantation industries
Table A.1 A summary of the industry survey respondents. Note: the aggregated area statement was used where the
plantation managers did not have area statements in the public domain. The percentage shown is against the total plantation forestry estate as of December 2005.
EnvironmentACT (Public) 9,500 Parsons et al. (2006) Forest Products Commission (WA) (Public) 106,172 Parsons et al. (2006) Forestry Plantations Queensland (Public) 193,407 Parsons et al. (2006) Forestry Tasmania (Public) 85,100 Parsons et al. (2006) Forests NSW (Public) 250,113 Parsons et al. (2006) SA Forestry Corporation (Public) 87,000 Parsons et al. (2006)
Public estate total 731,292 42.3% AKD Softwoods (Private) 4,000 AKD (2006) Albany Plantation Company of Australia Pty Limited (Private) 23,000 APFL (2006) Auspine Limited (Private) 35,181 Auspine (2005) Forest Enterprises Australia Limited (Private) 32,000 FEA (2006) Great Southern Plantations Limited (Private) 110,000 GSP (2006) Gunns Limited (Private) 110,000 Gunns (2006) Hancocks Victorian Plantations Pty Limited and Grand Ridge Plantations (Private) 169,000 HVP (2006) ITC Limited (Private) 140,000 ITC (2006) Timbercorp Limited (Private) 80,000 Timbercorp (2006) WA Plantation Resources Pty Limited (Private) 33,000 WAPRES (2006) Willmott Forests Limited (Private) 30,000 Willmott (2006)
Private estate (with published areas) 766,181 44.3% Green Triangle Forest Products; Insignis Forestry Services; Midway Pty Ltd; Norske Skog; South East Fibre Exports; Plantations International Limited; Tumba Pine Pty Limited; Woollybutt Pty Limited.
(Private) 95,000 5.5%
1,592,473 92.1% Total plantation forestry estate of identified hardwood and softwood as at December, 2005 (Parsons et al., 2006)
1,730,195
Other information and survey responses were collected from a range of the Regional Private Forestry
Committees and other farm forestry groups.
Data management and analysis
The industry survey participant’s data sets were received as filled in survey spreadsheets, available
internal presentation/format or by telephone discussions. All data were converted into a data set. The
completed industry survey spreadsheets were converted into lines of data. Where data were incomplete,
they were either followed up with the responding organisation or deduced based on the data provided and
chemical product information. If a respondent provided information in internal company format, the data
were converted into the study database format. Incomplete data were amended based on telephone
follow-up or determined based on product information. In the cases where data were provided verbally,
they were entered into the database. The datasets were then available for analysis based on the
information shown.
- 105 -

Chemical pesticide usage by Australian forest plantation industries
Appendix B Land use data
0 5,000,000
10,000,000
15,000,000
20,000,000
25,000,000
30,000,000
35,000,000
40,000,000
45,000,000
50,000,000
55,000,000
60,000,000
65,000,000
70,000,000
75,000,000
Meat cattle
Sheep and lambs
Wheat for grain
Area (ha)
Figure B.1 ABS (2006a) land use data for Australia for the six zones included in this study.
0 500,000
1,000,000
1,500,000
2,000,000
2,500,000
3,000,000
3,500,000
4,000,000
4,500,000
5,000,000
Barley for grain
Dairy cattle
Canola
Oats for grain
Hay & silage - Pastures cut for hay
Softw ood (total)
Hardw ood (total)
Lupins for grain
Crops cut for hay
Sugar cane
Triticale for grain
Area (ha)
ABS (2006a) and Parsons et al. (2006) land use data for Australia for the six zones included in this study. Figure B.2
- 106 -

Chemical pesticide usage by Australian forest plantation industries
0 20,000
40,000
60,000
80,000
100,000
120,000
140,000
160,000
180,000
Faba beans (incl. tick horse and broad)
Grapes
Cotton - irrigated
Rice for grain
Hardw ood short rotation (1R)
Maize for grain
Chickpeas
Potatoes
Mung and other f ield beans
Soybeans
Total citrus
Area (ha)
Figure B.3 ABS (2006a), Parsons et al. (2006) and Davey and Maynard (2003) land use data for Australia for the six zones included in this study.
0 2,000
4,000
6,000
8,000
10,000
12,000
14,000
16,000
18,000
20,000
PoppiesBananas
Caulif low erApples
TomatoesSoftw ood long rotation (1R)
LettuceCarrot standard
BroccoliGreen peas
Hardw ood long rotation (1R)Pumpkins
Beans slicingMellons
Sw eetcornPotatoes for seed
Millet for grain (incl. panicum and canary seed)Onions
CapsicumGreen beans slicing
AsparagusCherriesZucchini
Carrot fresh marketCarrots - baby
Apricots
Area (ha)
ABS (2006a) and Parsons et al. (2006) land use data for Australia for the six zones included in this study. Figure B.4
- 107 -

Chemical pesticide usage by Australian forest plantation industries
Appendix C Australia’s plantation expansion
0
20,000
40,000
60,000
80,000
100,000
120,000
140,000
1999 2000 2001 2002 2003 2004 2005
Ann
ual 1
R p
lant
ing
(ha/
yr)
0
200,000
400,000
600,000
800,000
1,000,000
1,200,000
1,400,000
1,600,000
1,800,000
2,000,000
Tota
l est
ate
(ha)
New plantings Total area
Figure C.1 A summary of the Australian plantation estate expansion (NFI, 2000; NFI, 2002; NFI, 2003; NFI, 2004; NFI, 2005; Parsons, et al., 2006; Wood et al., 2001).
0
2,000
4,000
6,000
8,000
10,000
12,000
1999 2000 2001 2002 2003 2004 2005
Ann
ual 1
R p
lant
ing
(ha/
yr)
0
200,000
400,000
600,000
800,000
1,000,000
1,200,000
Tota
l est
ate
(ha)
New plantings Total area
Figure C.2 A summary of the Australian softwood plantation estate expansion (NFI, 2000; NFI, 2002; NFI, 2003; NFI, 2004; NFI, 2005; Parsons, et al., 2006; Wood et al., 2001).
- 108 -

Chemical pesticide usage by Australian forest plantation industries
0
20,000
40,000
60,000
80,000
100,000
120,000
140,000
1999 2000 2001 2002 2003 2004 2005
Ann
ual 1
R p
lant
ing
(ha/
yr)
0
100,000
200,000
300,000
400,000
500,000
600,000
700,000
800,000
Tota
l est
ate
(ha)
New plantings Total area
Figure C.3 A summary of the Australian hardwood plantation estate expansion (NFI, 2000; NFI, 2002; NFI, 2003; NFI, 2004; NFI, 2005; Parsons, et al., 2006; Wood et al., 2001).
- 109 -

Chemical pesticide usage by Australian forest plantation industries
Appendix D Chemical pesticide profiles
Herbicides
2,4-D isopropyl amine salt
2,4-D is a foliar active systemic auxin type herbicide, causing initial distortion and twisting of leaves and
stems. Products are usually 0.225 g a.i./L. It is used in Queensland for tropical pine wildling control.
Amitrole
Amitrole is a broad spectrum rather slow acting systemic foliar herbicide, with only very slight soil residual
activity. The products contain 250 g a.i./L plus 220 g a.i./L ammonium thiocyanate. It has a forestry
registration for radiata pine but the use rates are considerably out-of-date. It is used in the second season
in both radiata pine and eucalypt. In radiata pine, it has been applied aerially in South Australia at 250 to
500 g a.i./ha in combination with atrazine at 4.5 kg a.i./ha. In second season Tasmanian blue gum, it is
applied at 250 to 500 g a.i./ha in combination with simazine and/or sulfometuron methyl as a row
treatment by directed spray.
Atrazine
Atrazine is a triazine herbicide. For plantation forestry use, the formulations are 600 g a.i./L and 900 g
a.i./kg. There are many products. Registered use rates for plantations of pine and eucalypts are up to 8
kg a.i./ha, but there is a 4.5 kg a.i./ha limit for sandy soils or soils described as highly erodible. It is used
in combination with hexazinone in certain propriety forestry herbicide products, which are a 150 g a.i./kg
dry granule (G), or a 625 g a.i./kg Water Dispersible Herbicide (WDH) pre-packaged in water-soluble
plastic bags on a per hectare basis. Atrazine is a soil residual systemic herbicide that controls grasses
and some broadleaved weeds. It has a weak foliar effect if sprayed onto weed. It is predominantly used in
establishing pine plantations, although it also registered for use in eucalypts. It is not particularly soil fast
and can be rapidly lost from sandy soils through leaching. Triazines should not be applied to waterlogged
soils.
Carfentrazone-ethyl
Carfentrazone-ethyl is contact herbicide being developed for pine wildling control,. The product is a 240 g
a.i./L emulsifiable concentrate (EC). It will be used in combination with glyphosate and metsulfuron methyl
similarly to glufosinate-ammonium later on. Carfentrazone responds to light, which suggests why it is
more effective in the increasing daylight hours in spring. Use rates for radiata pine wildling control will be
from 24 to 36 g a.i./ha.
Clethodim
Clethodim is one of a group of grass specific foliar active systemic ‘dim’ herbicides. The product is a 240
g a.i./L EC. There is a general forestry registration at 120 g a.i./ha. Clethodim is not widely used - mainly
in eucalypts on ex-pasture. There is potential for increased use, particularly at half-rate in combination
with a ‘fop’ grass herbicide also at half-rate. This is often more effective than either at full rate. For
- 110 -

Chemical pesticide usage by Australian forest plantation industries
example, in southern central NSW, a typical post-planting prescription applied to rows includes clethodim
at 60 g a.i./ha with haloxyfop at 104 g a.i./ha (with simazine and clopyralid).
Clopyralid
Clopyralid is both a foliar active and soil residual systemic herbicide. Products include 240 g a.i./L and
750 g a.i./kg formulations. There is a specific forestry product (750 g a.i./kg) which is supplied as a WDH
formulation in a water soluble plastic bag. Clopyralid is used differently in pine and eucalypts. In radiata
pine it is applied at rates of 1.8 kg a.i. to 2.55 kg a.i./ha to control silver wattle (Acacia dealbata). In ex-
pasture situations for Tasmanian blue gum establishment it is used at much lower rates (150 g a.i. to 200
g a.i./ha) both pre- and post-planting to control a range of broadleaved pasture weeds. It is particularly
effective for the control of capeweed (Arctotheca calendula) and many thistles, both as a foliar
knockdown and soil residual herbicide. In Queensland it is used for vine control at 150 g a.i./ha, for most
wattles at 375 g a.i./ha and for Acacia mangium in the north at 900 g a.i./ha.
Dicamba
Dicamba is a pre- and post-emergence, selective translocated herbicide, foliar absorbed and with soil
residual activity. Products are 200 g a.i./L, and are used infrequently for stem injection of trap trees for
survey and control of Sirex wood wasp in un-thinned radiata pine plantations of intermediate age.
Diflufenican
Diflufenican has been undergoing development for potential forestry use for some years. The product is a
500 g a.i./L suspension concentrate (SC). Its use rate in agriculture is 100 g a.i./ha to control small
Brassica weeds such as wild radish (Raphanus raphanistrum) and wild turnip (Rapistrum rugosum), but it
is also effective on thistles in Queensland, where a permit has been applied for this site-specific use. It
can only be used pre-planting (unless possibly by directed spray) because it is a phytotoxic bleaching
chemical if applied to foliage.
Fluazifop-p-butyl
Fluazifop-p-butyl is registered for use in three tropical pine species in Queensland and is undergoing re-
registration for general forestry use. It is one of the ‘fop’ group of systemic foliar active grass specific
herbicides. The product is a 128 g a.i./L EC. The use rate ranges from 159 to 845 g a.i./ha. It is
sometimes used ‘off-label’ in Tasmanian blue gum plantations in Victoria to control summer active
grasses (where such use is allowed under certain conditions).
Fluroxypyr methylheptyl ester
Fluroxypyr is a foliar active systemic herbicide used primarily in Queensland under permit for pre-planting
site preparation for tropical pine species and eucalypts both aerially and ground-based, and also as a
directed spray post-planting, usually in combination with glyphosate (in certain conditions). Full plantation
forestry registration is anticipated in the near future. The products are 200 g a.i./L EC’s. The use rate is
typically 200 to 600 g a.i./ha.
- 111 -

Chemical pesticide usage by Australian forest plantation industries
Glufosinate-ammonium
Glufosinate-ammonium is not yet registered for forestry, but is being developed for pine wildling control
on 2R or later rotation sites. The product is a 200 g a.i./L formulation, and the chemical is a contact
herbicide with only slight systemic activity; it passes into the needles and ‘cooks’ the foliage through the
release of ammonia. Use rates for pine wildling control will be from 600 to 1000 g a.i./ha, usually in
combination with glyphosate and metsulfuron methyl to control other weeds. It is effective on sub-tropical
pine species as well as radiata pine, but 2,4-D is preferred in Queensland because glufosinate does not
have all-year round efficacy. On radiata pine it appears to be more effective in summer and autumn but
extreme drought conditions appear to limit its effectiveness.. Its effectiveness is enhanced by a specific
surfactant that will be designated on the forestry label.
Glyphosate
There are many glyphosate products registered for various uses in Australia. For plantation forestry use,
the main ones are formulations with 360 g a.i./L, 450 g a.i./L, 510 g a.i./ha, 540 g a.i./L and 850 g a.i./kg.
Glyphosate products are salts and are formulated with a number of cations. In Australia, these cations
include ammonium, isopropyl-ammonium, sodium, and potassium. Use rates for glyphosate range
generally from as low as 360 g a.i./ha to 2.16 kg a.i./ha, and sometimes higher. Glyphosate is a broad-
spectrum foliar knockdown systemic herbicide, which controls many grasses and broadleaved weeds,
and many woody weeds at higher rates. Although it is very soil-fast, it does not have soil residual activity.
There are a few common pasture weeds not well controlled at lower rates by glyphosate. These include
sorrel and docks (Rumex spp.) and some clovers (Trifolium spp.). For pre-site preparation clean-up
procedures in Southern Australia, glyphosate is often applied in mixture with metsulfuron methyl and an
organosilicone surfactant. In Northern Australia, fluroxypyr may replace metsulfuron methyl.
Haloxyfop
Haloxyfop R-methyl ester is another of the grass specific foliar active systemic ‘fop’ herbicides. Products
are 520 g a.i./L EC’s. There is a general forestry registration. Haloxyfop is used mainly in Tasmanian blue
gum establishment, late in the first season to control a wide range of annual and perennial grasses, in
combination with clopyralid and/or simazine. It also controls one broadleaved weed – storksbillls (Erodium
spp.). Use rates vary from 104 g a.i./ha to 416 g a.i./ha depending on grass species and grass weed
density. It is also used in northern Queensland for grass control, usually at rates of 216 to 260 g a.i./ha.
Hexazinone
Hexazinone belongs to the same group of herbicides as atrazine, but is a triazinone. Formulations for
radiata pine plantations are a 750 g a.i./kg Dry Flowable (DF) product for spray application, and dry soil
applied granular products at 200 g a.i./kg or 167 g a.i./kg. In combination with atrazine in granular
products, the formulations are 67 g a.i./kg, 50 g a.i./kg and 25 g a.i./kg. In a WDH combination with
atrazine, the concentration is 208 g a.i./kg. Hexazinone is a broad-spectrum systemic herbicide with both
foliar and soil knockdown and soil residual properties, but it is primarily used for its residual effect. Use
rates range from 0.75 kg a.i./ha to 3.8 kg a.i./ha. The lower rates are predominantly on ex-pasture sites or
- 112 -

Chemical pesticide usage by Australian forest plantation industries
sites low in woody weed, and the higher rates for sites with some or considerable woody weed. It is quite
mobile, but is a mainstay for the establishment particularly of radiata pine.
Metosulam
Metosulam is used mainly in ex-pasture situations. There is a specific forestry product that is a 714 g
a.i./kg Dry Flowable (DF). Metosulam is a foliar active systemic herbicide with some soil residual activity.
It is specifically used to control wild radish, wild turnip and other Brassica spp. at rates of 5 to 7 g a.i./ha.
Metsulfuron methyl
Metsulfuron methyl is a sulfonyl urea herbicide. There are several products, mostly 600 g a.i./kg
formulations. A specific forestry product is a 200 g a.i./kg formulation. Use rates can be as low as a few g
a.i./ha in pasture site preparation to as high as 96 g a.i./ha to control hard-to-kill woody weeds.
Metsulfuron methyl is used primarily as a foliar knockdown systemic herbicide, but it has some soil
residual activity. Plant-back periods, that is, the time from application to when trees are planted, depend
on climatic and soil edaphic factors, but are usually about 1 to 2 days per g of 600 g a.i./ha product
applied. Pasture use rates are low because metsulfuron methyl provides very effective control of sorrel,
docks and clovers at low rates. High rates are used to control hard-to-kill woody weeds such as
blackberry and some native species. Two products combine glyphosate and metsulfuron methyl. These
differ in their composition but both are supplied in water-soluble satchels, pre-measured for application to
a given area. One contains glyphosate at 835 g a.i./kg and metsulfuron methyl at 10 g a.i./kg, and the
other contains 760 g a.i./kg and 63 g a.i./kg respectively. For foliar effectiveness, metsulfuron methyl
application requires the addition of an organosilicone surfactant, usually at a rate of 0.2% of the spray
volume (200 mL of surfactant per 100 L of spray mix).
Oxyfluorfen
Oxyfluorfen is a soil surface active, systemic pre-emergence or immediate post-emergence soil residual
herbicide. Many products are 240 g a.i./L EC’s, but the forestry product will be a 480 g a.i./L Soluble
Concentrate (SC). It is not widely used, but recent developments suggest that it is effective in controlling
blackberry nightshade (Solanum nigrum) emergence when applied over Tasmanian blue gum late in the
first season. It is also used at very low (sub-lethal, 18 g a.i./ha) rates in combination with glyphosate
applications because it rapidly browns out grasses and broadleaves, and is a very effective indicator of
swathe. Oxyfluorfen is in the process of being registered for use in pine and eucalypt establishment, in
combination with other herbicides at a use rate of 0.72 to 0.96 kg a.i./ha. However, it is phytotoxic to
Tasmanian blue gum if applied at or about planting on sandy soils (particularly those low in organic
matter), when it can leach into the root zone. On other soils it is extremely soil fast and does not leach. It
is not phytotoxic to radiata pine at the above rate.
Pendimethalin
Pendimethalin is a soil residual root contact herbicide with no systemic activity or knockdown effect.
Product formulations are 330 g a.i./L EC and a 445 g a.i./L aqueous concentrate. It is registered for use in
eucalypts at 2.97 kg a.i. to 3.96 kg a.i./ha. It is effective only when applied to bare soil for the control of
- 113 -

Chemical pesticide usage by Australian forest plantation industries
some weeds and the suppression of many weeds. It is particularly effective for the control of wireweed
(Polygonum aviculare) at rates of 1.32 to 1.98 kg a.i./ha and also for rye grasses (Lolium spp.). It is not
widely used in eucalypt plantations, but has found use in irrigated plantations of spotted gum (Corymbia
maculata) and flooded gum (E. grandis) in the Murray River irrigation areas, and for the establishment of
oil mallee plantations and farm forestry plantations in southern central NSW. It is also being used for
Wireweed control in some Tasmanian blue gum plantations in the Green Triangle region of south west
Victoria and south east South Australia.
Picloram
Picloram is a selective systemic post-emergence herbicide with foliar and soil activity. Products used are
usually in combination with triclopyr (see next), and include picloram at 50 g a.i./L. It produces an auxin-
type response – twisting and curling of leaves and stems in most broadleaved plants, but has no activity
on grasses. It is soluble and mobile with often extended soil residual activity. It is primarily used for basal
bark treatment of wattles and eucalypts in radiata pine (in combination with triclopyr), and in Queensland
in pre-planting site preparation in combination with triclopyr to control woody weeds.
s-Metolachlor
s-Metolachlor is used pre-planting under permit in combination with glyphosate and simazine in the
establishment of eucalypts on the north coast of NSW. It has both foliar and some residual activity. The
product is a 960 g a.i./L formulation. The use rate is usually 1440 g a.i./ha.
Simazine
Simazine is used in Queensland for post-planting weed control in tropical pines and eucalypts at 4.5 kg
a.i./ha over the trees alone, or by directed spray in combination with glyphosate at 1.45 kg a.i./ha.
Simazine is also a triazine herbicide. For plantation eucalypt establishment, the formulation is 900 g
a.i./kg. There are many products. The registered use rate range for eucalypt plantations is 1.44 kg a.i./ha
to 6 kg a.i./ha. It is commonly used at between 2 and 5 kg a.i./ha. Simazine is a soil residual systemic
herbicide that controls grasses and some broadleaved weeds. It is predominantly used in establishing
eucalypt plantations although it also registered for use in pines. It is more soil fast than atrazine.
Sulfometuron methyl
Sulfometuron methyl is a sulfonyl urea herbicide. There are several products, mostly 750 g a.i./kg
formulations. There is a specific dry granular forestry product which is a 2 g a.i./kg formulation, and a
WDH product in combination with terbacil which contains 40 g/kg. Use rates can be as low as a few g
a.i./ha to as high as 60 g a.i./ha in ex-pasture sites. It is not used in agriculture; rather it is an industrial
weed control chemical and is used at much higher rates (150-600 g a.i./ha) for railway lines, roadsides,
and around factories for example. Sulfometuron methyl has both foliar and soil residual systemic activity,
but is used only for its soil residual effect. It is used in both first and second season in eucalypts but has
limited use, primarily in South Australia, in second and third season radiata pine. It is very mobile and
care has to be taken with its use. It controls a widen range of pasture weeds, including grasses, sorrel
and docks.
- 114 -

Chemical pesticide usage by Australian forest plantation industries
Terbacil
Terbacil is a component of two propriety products used for establishment of Tasmanian blue gum, shining
gum (E. nitens) and mountain ash (E. regnans). In both, the other component is sulfometuron methyl.
One product is a WDH formulation with 880 g a.i./kg of terbacil, used pre-planting, and the other is a dry
granule with 44 g a.i./kg used in the second season after planting. These products are registered only for
Tasmanian blue gum, shining gum and mountain ash. Developed for plantation eucalypts from an orchard
herbicide, terbacil is a soil residual systemic herbicide that in combination with sulfometuron methyl
controls a wide range of pasture grasses and broadleaved weeds in the establishment of plantations of
the above three eucalypt spp.
Terbuthylazine
Terbuthylazine is a triazine herbicide. There will shortly be a specific forestry product that is an 850 g
a.i./kg WDH in a water-soluble plastic bag. Terbuthylazine is the mainstay triazine herbicide in plantation
forestry in New Zealand. Its properties are similar in some respects to atrazine and simazine, but it has
more foliar knockdown effect on existing weed. Use rates are similar to atrazine and simazine
Triclopyr
Triclopyr is also a selective systemic post-emergence herbicide with foliar activity but little soil activity.
Products used are usually in combination with picloram, and include triclopyr at 100 g a.i. and 150 g a.i./L.
It also produces an auxin-type response. Its main use is as for picloram, but both these herbicides are
also used for the control of woody weeds such as blackberry and gorse, and can be used for stem
injection. In Queensland it is used alone in pre-planting site preparation or in combination with picloram to
control woody weeds.
Insecticides
Alpha-cypermethrin
The cypermethrins are synthetic pyrethroid (SP) insecticides. Alpha-cypermethrin products contain two
cypermethrin isomers, and the main products used in plantations are 100 g a.i./L formulations. These are
usually used in 0.5 to 1% spray mixes. There are also ULV (Ultra Low Volume) formulations at 16 and 40
g a.i./L., which are applied undiluted. Application is usually aerial. Alpha-cypermethrin is a contact and
stomach poison with some anti-feeding action, effective against a wide range of chewing and sucking
insects, particularly of the orders Lepidoptera, Coleoptera and Hemiptera in eucalypt plantations.
Carbaryl
Carbaryl is a carbamate insecticide. Products are often 500 g a.i./L SC’s (soluble concentrates), and are
used in 0.2% or higher aqueous preparations e.g. 20 mL of 500 g a.i./L product per 5 L of spray mix. It is
also applied in baits for control of wingless grasshopper. Carbaryl is a contact and stomach poison with
slight systemic activity. It is effective in eucalypt plantations against chewing insects (wingless
grasshoppers, locusts, leaf rollers, leaf feeding moths, beetle larvae), sucking insects (aphids, leaf
- 115 -

Chemical pesticide usage by Australian forest plantation industries
hoppers and thrips), leaf miners (leaf blister sawfly), and soil borne larvae including cut worms and
scarabs.
Dimethoate
Dimethoate is a organophosphate (OP) insecticide. Products are often 400 g a.i./L EC’s. Aqueous
preparations are usually at 0.03% (75 mL of 400 g a.i./L product in 100 L). Dimethoate has contact and
stomach action, inhibiting the nervous system. It has residual activity, and has been used in eucalypt
plantations; it is under permit in South Australia. It is effective against a wide range of foliage feeding
insects and mites (Acarina), especially leaf miners, psyllids, sawfly, scale, aphids, leaf hoppers, thrips and
mealy bugs.
Fipronil
Fipronil is a 200 g a.i./L product with low water solubility. It is a contact, respiratory and stomach poison,
with moderate systemic activity. It is used aerially at 50 mL/ha of product in spray mix. It is effective
against wingless grasshopper. Plantations only need to be sprayed around the perimeter in a band, or
striped. After contact, grasshoppers stop eating and die within 2 days. It has a residual effect for up to a
month, and can be used in plantations generally.
Imidacloprid
Imidacloprid is a systemic insecticide, which targets only the insects which feed on the trees and so is
less harmful to non-target insects than some other insecticides. Trial work has been conducted for the
control of a range of insect pests in eucalypt plantations in southern and sub-tropical Australia (Carnegie
et al., 2005). Its systemic absorption into trees is also being developed in combination with fertiliser in
tablet form, applied at planting, and as a soil drench after planting. The tablet product is currently
undergoing registration for use in eucalypt plantations.
Methidathion
Methidathion is a organophosphate (OP) insecticide, but is rarely used because it has the highest Poison
Schedule (S7). The products are 400 g a.i./ha EC’s. Methidathion is prescribed on label for forestry
situations under ‘Ornamentals, Trees, Shrubs, Annuals’ for the control of scale insects, caterpillars,
sawflies, leaf miners, plant bugs, aphids, thrips, lerps and coccids. The use rate is usually 50 g a.i./100 L
of spray volume.
Spinosad
Spinosad is a bio-insecticide, consisting of spinosyn A and D. It is short lived on plant surfaces. For
plantations, it is only registered for chrysomelids which are rarely controlled in sub-tropical Australia.
There is only a small window of opportunity to spray, requiring monitoring and knowledge of this window.
It has potential for control of chrysomelid leaf beetles in southern Australia (Carnegie et al., 2005), and
has undergone extensive trial work in Tasmania (Elek et al., 2003)
- 116 -

Chemical pesticide usage by Australian forest plantation industries
Tebufenozide
Tebufenozide is a biomimetic insecticide, that is, it mimics the actions of naturally occurring insecticides.
Tebufenozide lethally accelerates the moulting process in insects. It controls Lepidopteran larvae at rates
of about 34 g a.i./ha to 340 g a.i./ha. It has low to moderate soil persistence.
Bacillus thuringiensis var. tenebrionis & subsp. kurstaki
These are biotic insecticides. They are not routinely used in Australian plantations due, in part, to their
specific environmental/climatic conditions necessary for effective control (Carnegie et al., in press, see
above). The var. tenebrionis has been trialled in eucalypt plantations in Tasmania (Elek, 1998; Elek and
Beveridge, 1999). A product containing the subsp. kurstaki is registered for use against Lepidopteran
larvae in forestry.
Adjuvants
This is a term used to describe any addition to a spray mix designed to improve the efficacy of a
pesticide. It includes surfactants and spray oils which lower the surface tension and allow the spray mix to
spread out on leaf surfaces, anti-antagonists which prevent antagonism between pesticides, buffering
agents to adjust pH’s, dyes and marking agents.
Alcohol alkoxylate – surfactants
There are a number of similar products, usually at about 1000g/L of the alcohol alkoxylate. Use rates are
usually 0.1 to 0.2% of spray volume.
Dodecyl benzene sulphonate
The product is an ionic surfactant used to improve the spreading and wetting of picloram and triclopyr
herbicides.
Dyes and marking agents
Marker dyes are usually a solution of Rhodamine B in diethylene glycol, and are used with herbicides for
spot applications and as a colouring agent in broad acre swathe marking. Foam markers are a foam liquid
concentrate used also for swathe marking. As noted above, a low rate of the herbicide oxyfluorfen can
also be used, particularly with glyphosate applications.
Organosilicones
Again there are a number of similar products, which are usually about 1000 g a.i./L of a polyalkyleneoxide
modified polydimethyl siloxane. Organosilicone surfactants have also been shown to improve uptake of
glyphosate through the leaf stomata (Balneaves et al., 1993), and are usually used with metsulfuron
methyl products and often with glyphosate. Use rates are usually 0.1 to 0.2% of spray volume, but may
be up to 0.5%.
- 117 -

Chemical pesticide usage by Australian forest plantation industries
Phospholipids
The product is a mixture of 345 g/L phospholipids and 355 g/L propanoic acid. It is used at rates of 0.1%
of spray volume for pH reduction (of hard water) and at 0.25 to 0.5% as a penetrant.
Synthetic latex
Synthetic latex is used as a sticker, extender and deposition agent for use with contact mode of action
pesticides. The product is a 450 g a.i./L synthetic latex. It protects against chemical loss from rainfall,
sunlight and wind.
Spray oils
Products are sometimes oils only, but there are products that include wetting agents also. Petroleum oils
are usually about 700 to 900 g/L liquid hydrocarbons. They are used as anti-evaporant wetting agents
and carriers for herbicide applications. They can improve targeting, spreading, wetting, and penetrative
action of herbicides, insecticides and fungicides. Vegetable oils have similar properties to the petroleum
oils, and are usually canola oils.
Fungicides
Copper oxychloride
This inorganic fungicide is applied aerially at 1.66 kg Cu/ha in copper oxychloride to control the pine
fungal infection Dothistroma septospora. It is used to treat plantations up to 15 years of age, and can be
re-sprayed after 250 mm of rainfall if required. It is also used to treat Diplodia pinea (a needle cast fungal
infection) in pine plantations.
Phosphonate
This inorganic fungicide could be used to treat Phytopthora cinnamomi in plantations. (It is used in native
forest areas in Western Australia to treat this pathogen). The products are usually 200 g/L or 400 g/L
solutions of phosphoric acid plus 200 to 400 g/L potassium hydroxide.
- 118 -

Chemical pesticide usage by Australian forest plantation industries
Appendix E Plantation forestry application rates The following charts are a summary of the application rate data from analysis of the confidential industry
survey. The charts show use rate frequency data with increments of 10% of the maximum a.i. label rate
for plantation application. The maximum label rate is indicated on the charts as the last use rate class,
and any use at above that rate is greater than the maximum allowed. For example, in Figure E.1 for
amitrole, the maximum allowed application rate is 2.0 kg a.i./ha, and so the frequency distribution classes
are in units of 0.2 kg a.i./ha. Any use greater than 2.0 kg a.i./ha (> 2.0) is in excess of the label maximum
rate. The data shown is not weighted for area, as it represents the industry survey rates reported for 2003
to 2005.
0%
10%
20%
30%
40%
50%
60%
0.2 0.4 0.6 0.8 1.0 1.2 1.4 1.6 1.8 2.0 > 2.0
Use rates (kg a.i./ha)
Freq
uenc
y (%
/cas
es)
Figure E.1 Analysis of the data provided by the confidential industry survey of plantation managers’ chemical pesticide use
for amitrole. Most use is at less than 50% of the maximum rate.
- 119 -

Chemical pesticide usage by Australian forest plantation industries
0%
5%
10%
15%
20%
25%
0.8 1.6 2.4 3.2 4.0 4.8 5.6 6.4 7.2 8.0 > 8.0
Use rates (kg a.i./ha)
Freq
uenc
y (%
/cas
es)
Figure E.2 Analysis of the data provided by the confidential industry survey of plantation managers’ chemical pesticide use for atrazine. Most use is less than 50% of the maximum label rate.
0%
5%
10%
15%
20%
25%
30%
35%
40%
45%
50%
0.3 0.5 0.8 1.0 1.3 1.5 1.8 2.0 2.3 2.6 > 2.6
Use rates (kg a.i./ha)
Freq
uenc
y (%
/cas
es)
Figure E.3 Analysis of the data provided by the confidential Industry survey of plantation managers’ chemical
pesticide use for clopyralid. Most use is less than 50% of the maximum label rate.
- 120 -

Chemical pesticide usage by Australian forest plantation industries
0%
10%
20%
30%
40%
50%
60%
0.1 0.1 0.2 0.2 0.3 0.4 0.4 0.5 0.5 0.6 > 0.6
Use rates (kg a.i./ha)
Freq
uenc
y (%
/cas
es)
Figure E.4 Analysis of the data provided by the confidential industry survey of plantation managers’ chemical
pesticide use for fluroxypyr. Most use is at low rates.
0%
5%
10%
15%
20%
25%
30%
35%
0.3 0.6 1.0 1.3 1.6 1.9 2.2 2.6 2.9 3.2 > 3.2
Use rates (kg a.i./ha)
Freq
uenc
y (%
/cas
es)
Figure E.5 Analysis of the data provided by the confidential Industry survey of plantation managers’ chemical pesticide use for glyphosate. Most use is at below the maximum label rate.
- 121 -

Chemical pesticide usage by Australian forest plantation industries
0%
5%
10%
15%
20%
25%
30%
0.04 0.08 0.12 0.17 0.21 0.25 0.29 0.33 0.37 0.42 > 0.42
Use rates (kg a.i./ha)
Freq
uenc
y (%
/cas
es)
Figure E.6 Analysis of the data provided by the confidential industry survey of plantation managers’ chemical pesticide use for haloxyfop. Most use is at below 50% of the maximum label rate.
0%
5%
10%
15%
20%
25%
0.38 0.76 1.14 1.52 1.90 2.28 2.66 3.04 3.42 3.80 > 3.80
Use rates (kg a.i./ha)
Freq
uenc
y (%
/cas
es)
Figure E.7 Analysis of the data provided by the confidential industry survey of plantation managers’ chemical pesticide use for hexazinone. Most use is at less than the maximum label rate.
- 122 -

Chemical pesticide usage by Australian forest plantation industries
0%
5%
10%
15%
20%
25%
30%
35%
40%
0.009 0.018 0.027 0.036 0.045 0.054 0.063 0.072 0.081 0.090 > 0.09
Use rates (kg a.i./ha)
Freq
uenc
y (%
/cas
es)
Figure E.8 Analysis of the data provided by the confidential industry survey of plantation managers‘ chemical pesticide use for metsulfuron methyl. Most use is below 50% of the label maximum rate.
0%
5%
10%
15%
20%
25%
30%
0.6 1.2 1.8 2.4 3.0 3.6 4.2 4.8 5.4 6.0 > 6.0
Use rates (kg a.i./ha)
Freq
uenc
y (%
/cas
es)
Figure E.9 Analysis of the data provided by the confidential industry survey of plantation managers’ chemical pesticide use for simazine. Most use is at less than the label maximum rate.
- 123 -

Chemical pesticide usage by Australian forest plantation industries
0%
5%
10%
15%
20%
25%
30%
35%
40%
0.006 0.012 0.018 0.024 0.030 0.036 0.042 0.048 0.054 0.060 > 0.060
Use rates (kg a.i./ha)
Freq
uenc
y (%
/cas
es)
Figure E.10 Analysis of the data provided by the confidential industry survey of plantation managers’ chemical pesticide use for sulfometuron methyl. Most use is at less than 50% of the label maximum rate.
0%
5%
10%
15%
20%
25%
30%
35%
40%
45%
50%
0.3 0.6 0.9 1.2 1.5 1.8 2.1 2.4 2.7 3.0 > 3.0
Use rates (kg a.i./ha)
Freq
uenc
y (%
/cas
es)
Figure E.11 Analysis of the data provided by the confidential industry survey of plantation managers’ chemical pesticide use for triclopyr. Most use is at below 50% of the maximum label rate.
- 124 -

Chemical pesticide usage by Australian forest plantation industries
Appendix F Spray technology – nozzles The following case study has been adapted from information provided by Peter Alexander, (Pers. com. 10
TeeJet Australasia Pty Ltd) an expert in nozzle technology.
Pre 1940
As early as 1900, horse drawn sprayers were used to apply a range of chemical pesticides in Australian
agriculture. These used either manually or ground driven pumps to supply the mixture to full cone
nozzles, either mounted on a crude boom, or attached to a hand wand. In the 30’s and 40’s, the pumps
were motorised and horses were replaced by tractors.
1940’s-1970’s
Spraying Systems Co (USA) is credited in developing the first flat fan nozzle in 1947 in response to the
introduction of the herbicide 2,4-D. This was the TeeJet TP brass flat-fan nozzle, still available (and
widely used in some markets) today. The TP gained widespread acceptance globally in the 1950 and
60’s, especially as the popularity of the phenoxy acetic acid herbicides (2,4-D and MCPA) increased
worldwide. However, issues of spray drift, pesticide resistance, accuracy, standards and usability were
not considered in those early days, so for nearly 30 years, (apart from the introduction of alternative
materials to brass such as stainless steel and sintered aluminium), the standard flat fan was the nozzle of
choice.
1970’s – 1980’s
Public concern in relation to chemical pesticide use dramatically increased in the late 60’s and early 70’s.
DDT, dioxins, food residues, Agent-Orange, cancer clusters, etc became household concerns. Until the
mid 70’s most nozzle design focused on spray distribution and pattern quality. Spray drift was recognised
as a significant issue and became a focus of anti-chemical pesticide lobbies. In response, the early 80’s
saw a shift to larger drop producing nozzles and minimising small drift-prone droplets. The first of these
was the Low Pressure (LP) flat fan nozzle. Subtle internal geometry changes to the TP inlet orifice
enabled lower operating pressures and larger droplets without reduction of spray angle or distribution
quality.
In 1986 the Extended Range (XR) nozzle was introduced. The XR TeeJet quickly became popular
globally because of its ability to operate over an extended range of pressures which provided droplet size
flexibility. It could be used to apply pre-emergent fertiliser or herbicides at low pressures minimising drift.
It could also be used at higher pressures for post emergent applications where canopy coverage and
penetration is required. The XR TeeJet remains today the industry standard, and is often cited in studies
as the baseline by which spray nozzles and spray campaigns are measured and compared. In addition to
the XR, flat fan nozzles that used a pre-orifice were developed around this time. The pre-orifice performs
the primary flow metering function whilst the larger exit orifice provides secondary metering and pattern
formation. The droplet size (VMD) is typically 20-40% coarser than the equivalent XR nozzle. Examples
- 125 -

Chemical pesticide usage by Australian forest plantation industries
include the TeeJet DG (Drift Guard). In the 80’s, techniques were developed to manufacture flat fan tips
in harder wearing materials such as ceramic and injection moulded plastics. At the same time, Spraying
Systems Co developed the VisiFlo® colour-coding system for flow rate identification of spray tips. It is
now the ISO standard used by every nozzle manufacturer.
1990’s - 2000’s
As herbicide chemistry became more selective, glyphosate resistant genetically modified crops (GM)
crops became widespread and society became more litigious, resulting in spray drift became the most
significant factor facing the industry worldwide. International standards to define spray quality (or drop
size distribution) were developed in the 1990’s. Though continually being refined, these standards provide
a framework for end-users to compare and select nozzles based on chemical label requirements. Other
standards to define drift reduction capabilities and spray distribution/uniformity were also introduced. In
terms of nozzle developments, advancements in plastic moulding allowed for new non-conventional
geometry and moulded pre-orifices. The first of these was the TT (Turbo TeeJet) released in the mid 90’s,
a flat fan/anvil hybrid with a very wide pressure range, less fines, and excellent distribution and blockage
resistance. The TT remains the most popular “low-drift” flat fan nozzle used in Australia today.
2000 and beyond
Spray drift continued to be the driving force behind nozzle development, though the widely accepted view
that coarse droplets result in poor coverage (and therefore poor efficacy) generated a lot of interest in air
induction nozzles. First developed in the 60’s as a foaming nozzle (for spraying detergents), air induction
nozzles have gained widespread acceptance in mainstream agriculture. Designed to draw air into the
liquid stream (through a venturi), these flat fan nozzles can (depending on the chemical/surfactant load)
produce larger air-included/filled droplets that shatter on impact. In effect, drift reduction benefits of
applying large droplets, without significant sacrifices in coverage. The next generation AI nozzles are
more compact, produce larger drops, and operate at lower pressures. An example is the TTI (Turbo
TeeJet Induction) that produce very coarse droplets and unlike other designs, the percentages of fine
droplets do not increase with pressure.
- 126 -

Chemical pesticide usage by Australian forest plantation industries
Table F.1 The evolution of the T-jet spray nozzle for chemical pesticide application.
1940’s-1970’s The standard fan TeeJet.
In 1986 the XR (or Extended Range) nozzle was introduced.
An evolution of the XR nozzle was the addition of a pre-orifice in the nozzle
design.
During 1990 to 2000, Turbo TeeJet was introduced to help address spray drift.
A foaming nozzle first developed in the 1960’s aims to reduce spray drift.
The latest evolution is nozzles designed to produce large droplets such as the
Tubo TeeJet Induction nozzle.
- 127 -

Chemical pesticide usage by Australian forest plantation industries
Appendix G Cost as a proxy to usage
0.0
0.1
0.2
0.3
0.4
0.5
0.6
0.7
0.8
$0 $10 $20 $30 $40 $50 $60 $70 $80 $90 $100
Product costs ($/ha)
App
licat
ion
rate
(a.
i./ha
)
Figure G.1 An analysis of the relationship between herbicide product costs and the lowest label rate of a.i. applied / ha. In
general, the greater the product cost, the less applied a.i. /ha. The outlier is hexazinone, which has a longer duration of effect than the other chemicals shown.
- 128 -

Chemical pesticide usage by Australian forest plantation industries
0.0
1.0
2.0
3.0
4.0
5.0
6.0
7.0
8.0
9.0
$0 $100 $200 $300 $400 $500 $600 $700 $800
Product costs ($/ha)
App
licat
ion
rate
(a.
i./ha
)
Figure G.2 An analysis of the relationship between herbicide product costs and the highest label rate of a.i. applied / ha. In general, the greater the product cost, the less applied a.i. /ha. The outlier is hexazinone, which has a longer duration of effect than the other chemicals shown.
0.000
0.010
0.020
0.030
0.040
0.050
0.060
0.070
0.080
$0.00 $0.20 $0.40 $0.60 $0.80 $1.00 $1.20
Product costs ($/ha)
App
licat
ion
rate
(a.
i./ha
)
Figure G.3 An analysis of the relationship between fungicide product costs and the lowest label rate of a.i. applied / ha. In general, the product cost has little impact on the applied a.i. /ha.
- 129 -

Chemical pesticide usage by Australian forest plantation industries
0.0
0.5
1.0
1.5
2.0
2.5
3.0
3.5
$0 $10 $20 $30 $40 $50 $60
Product costs ($/ha)
App
licat
ion
rate
(a.
i./ha
)
Figure G.4 An analysis of the relationship between fungicide product costs and the highest label rate of a.i. applied / ha. In general, as product cost per hectare increases, so does the applied a.i. /ha.
0.0
0.5
1.0
1.5
2.0
2.5
3.0
$0 $10 $20 $30 $40 $50 $60
Pesticide costs ($/ha)
App
licat
ion
rate
(a.
i./ha
)
Low est rate Highest rate
Figure G.5 An analysis of the relationship between insecticide product costs and the lowest and highest label rate of a.i. applied / ha.
- 130 -

Chemical pesticide usage by Australian forest plantation industries
Appendix H Standard regimes
Radiata pine
Table H.1 A summary of generic regimes applied to 1R radiata pine plantations. The regimes shown are the maximum likely chemical pesticides to be used.
Previous land use Code Operation Year Active ingredient Rate Coverage Planted ($/ha)
Grass (1R site) A Pre-planting clean-up 0 Glyphosate 720.0 g a.i./ha Broadcast $12.26
Metsulfuron methyl 6.0 g a.i./ha Pulse 0.2 L/ha B Post-planting residual 1 Hexazinone 3.0 kg a.i./ha Strip $178.00
C Post-planting residual 1 Hexazinone 1.5 kg a.i./ha Strip $148.50
Atrazine 4.5 kg a.i./ha
D Post-planting residual 2 Hexazinone 1.5 kg a.i./ha Strip $178.00
E Post-planting residual 2 Hexazinone 1.5 kg a.i./ha Strip $148.50 Atrazine 4.5 kg a.i./ha
F Post-planting residual 2 Hexazinone 3.0 kg a.i./ha Spot $32.04
- 131 -

Chemical pesticide usage by Australian forest plantation industries
Table H.2 A summary of generic regimes applied to 2R radiata pine plantations. The regimes shown are the maximum likely chemical pesticides to be used.
Previous land use Code Operation Year Active ingredient Rate Coverage Planted
($/ha)
Pine plantation (2R site) G Pre-planting clean-up 0 Glyphosate 1,800.0 g a.i./ha Broadcast $12.70
Metsulfuron methyl 36.0 g a.i./ha
Pulse 0.2 L/ha
H Post-planting residual 1 Hexazinone 3.0 kg a.i./ha Broadcast $356.00
I Post-planting residual 1 Hexazinone 3.0 kg a.i./ha Strip $178.00
J Post-planting residual 2 Hexazinone 3.0 kg a.i./ha Broadcast $356.00
K Post-planting residual 2 Hexazinone 3.0 kg a.i./ha Strip $178.00
L Post-planting residual 2 Hexazinone 3.0 kg a.i./ha Spot $33.46
- 132 -

Chemical pesticide usage by Australian forest plantation industries
D % of estate Cost per planted hectare
Grass (1R site)
Post-planting residual 22.5% $82.86$178.00
B E % of estate Cost per planted hectareGrass (1R site) Grass (1R site)
Post-planting residual Post-planting residual 22.5% $76.22
$178.00 $148.50
F % of estate Cost per planted hectare
Grass (1R site)
Post-planting residual 5.0% $11.12
A $32.04
Grass (1R site)Pre-planting clean-up
$12.26 D % of estate Cost per planted hectareGrass (1R site)
Post-planting residual 22.5% $76.22
$178.00
C E % of estate Cost per planted hectareGrass (1R site) Grass (1R site)
Post-planting residual Post-planting residual 22.5% $69.58
$148.50 $148.50
F % of estate Cost per planted hectare
Grass (1R site) ($ha)
Post-planting residual 5.0% $9.64 $325.64$32.04
Figure H.1 The costs of the various combinations which make up a herbicide regime for 1R radiata pine. (Note: costs are as per Table H.1)
- 133 -

Chemical pesticide usage by Australian forest plantation industries
J % of estate Cost per planted hectare
Pine plantation (2R site)
Post-planting residual 0.0% $0.00$356.00
H K % of estate Cost per planted hectarePine plantation (2R site) Pine plantation (2R site)
Post-planting residual Post-planting residual 45.0% $246.02
$356.00 $178.00
L % of estate Cost per planted hectare
Pine plantation (2R site)
Post-planting residual 5.0% $20.11
G $33.46Pine plantation (2R site)
Pre-planting clean-up$12.70 J % of estate Cost per planted hectare
Pine plantation (2R site)Post-planting residual 0.0% $0.00
$356.00
I K % of estate Cost per planted hectare
Pine plantation (2R site) Pine plantation (2R site)
Post-planting residual Post-planting residual 45.0% $165.92$178.00 $178.00
L % of estate Cost per planted hectare
Pine plantation (2R site) ($ha)Post-planting residual 5.0% $11.21 $443.25
$33.46 Figure H.2 The costs of the various combinations which make up a herbicide regime for 2R radiata pine. (Note: costs are as per Table H.2)
- 134 -

Chemical pesticide usage by Australian forest plantation industries
Tasmanian blue gums
Table H.3 A summary of generic herbicide regimes for 1R Tasmanian blue gum plantations. The regimes shown are the maximum likely chemical pesticides to be used.
Previous land use Code Operation Year Active ingredient Rate $/ha planted Coverage
Pasture (1R site) A Pre-planting clean-up 1 Glyphosate 720.0 g a.i./ha $12.26 Broadcast 100% of area
Metsulfuron methyl 6.0 g a.i./ha Adjuvants 0.2 L/ha B Pre-planting residual
plus knockdown 1 Glyphosate 720.0 g a.i./ha $22.25 Strip application (50% coverage)
Simazine 4.0 kg a.i./ha Sulfometuron methyl 22.5 g a.i./ha C Pre-planting residual
plus knockdown 1 Glyphosate 720.0 g a.i./ha $21.97 Strip application (50% coverage)
Simazine 4.0 kg a.i./ha Metsulfuron methyl 6.0 g a.i./ha Adjuvant 0.2 L/ha D Post-planting recovery 1 Haloxyfop 130.0 g a.i./ha $80.84 Recovery operation strip (50% coverage) Simazine 4.0 kg a.i./ha Clopyralid 180.0 g a.i./ha E Post-planting 2 Amitrole 500.0 g a.i./ha $28.96 Strip application with 50% coverage. Simazine 4.0 kg a.i./ha Sulfometuron methyl 22.5 g a.i./ha F Post-planting 2 Amitrole 500.0 g a.i./ha $13.12 Strip application with 50% coverage. Sulfometuron methyl 22.5 g a.i./ha
- 135 -

Chemical pesticide usage by Australian forest plantation industries
Table H.4 A summary of generic herbicide regimes for 2R Tasmanian blue gum plantations. The regimes shown are the maximum likely chemical pesticides to be used.
Previous land use Code Operation Year Active ingredient Rate $/ha planted Coverage
Ex eucalypt plantation (2R) G Pre-planting clean-up 1 Glyphosate 720.0 g a.i./ha $12.26 Broadcast 100% of area to kill coppice
Metsulfuron methyl 6.0 g a.i./ha
Adjuvant 0.2 L/ha
H Pre-planting residual plus knockdown
1 Glyphosate 720.0 g a.i./ha $21.97 Strip application
Simazine 4.0 kg a.i./ha
Metsulfuron methyl 6.0 g a.i./ha
Adjuvant 0.2 L/ha
I Pre-planting residual plus knockdown
1 Glyphosate 720.0 g a.i./ha $22.25 Strip application (50% coverage)
Simazine 4.0 kg a.i./ha
Sulfometuron methyl 22.5 g a.i./ha
J Post-planting recovery
1 Haloxyfop 130.0 g a.i./ha $80.84 Recovery operation strip (50% coverage)
Simazine 4.0 kg a.i./ha
Clopyralid 180.0 g a.i./ha
K Post-planting 2 Amitrole 500.0 g a.i./ha $28.96 Strip application with 50% coverage.
Simazine 4.0 kg a.i./ha
Sulfometuron methyl 22.5 g a.i./ha
L Post-planting 2 Amitrole 500.0 g a.i./ha $13.12 Strip application with 50% coverage.
Sulfometuron methyl 22.5 g a.i./ha
- 136 -

Chemical pesticide usage by Australian forest plantation industries
Table H.4 cont. A summary of generic herbicide regimes for 2R Tasmanian blue gum plantations. The regimes shown are the maximum likely chemical pesticides to be used.
Ex eucalypt plantation (2R coppice)
M Spot clean-up 1 Glyphosate 720.0 g a.i./ha $1.23 Spot treat 10% of area to kill weeds
Metsulfuron methyl 6.0 g a.i./ha
Adjuvant 0.2 L/ha
- 137 -

Chemical pesticide usage by Australian forest plantation industries
E % of estate ($/ha)
Pasture (1R site)
Post-planting 12.50% $18.04
D $28.96
Pasture (1R site)
Post-planting recovery F % of estate ($/ha)
B $80.84 Pasture (1R site)
Pasture (1R site) Post-planting 12.50% $16.06
Pre-planting residual plus knockdown $13.12
$22.25
E % of estate ($/ha)
Pasture (1R site)
Post-planting 12.50% $18.04
$28.96
A F % of estate ($/ha)
Pasture (1R site) Pasture (1R site)
Pre-planting clean-up Post-planting 12.50% $5.95
$12.26 $13.12
E % of estate ($/ha)
Pasture (1R site)
D Post-planting 12.50% $18.00
Pasture (1R site) $28.96
Post-planting recovery
$80.84 F % of estate ($/ha)
C Pasture (1R site)
Pasture (1R site) Post-planting 12.50% $5.92
Pre-planting residual plus knockdown $13.12
$21.97
E % of estate ($/ha)
Pasture (1R site)
Post-planting 12.50% $7.90
$28.96
F % of estate ($/ha)
Pasture (1R site) ($ha)
Post-planting 12.50% $5.92 $95.82
$13.12 Figure H.3 A summary of the various herbicide regime options for a generic Tasmanian blue gum crop on a 1R site.
- 138 -

Chemical pesticide usage by Australian forest plantation industries
K % of estate ($/ha)
Ex eucalypt plantation (2R)Post-planting 2.38% $3.42
J $28.96
Ex eucalypt plantation (2R)Post-planting recovery L % of estate ($/ha)
H $80.84 Ex eucalypt plantation (2R)Ex eucalypt plantation (2R) Post-planting 2.38% $3.04
Pre-planting residual plus knockdown $13.12
$21.97
K % of estate ($/ha)
Ex eucalypt plantation (2R)
Post-planting 21.38% $30.79$28.96
G L % of estate ($/ha)Ex eucalypt plantation
(2R) Ex eucalypt plantation (2R)
Pre-planting clean-up Post-planting 21.38% $10.12$12.26 $13.12
K % of estate ($/ha)Ex eucalypt plantation
(2R)
J Post-planting 2.38% $3.43Ex eucalypt plantation
(2R)$28.96
Post-planting recovery
$80.84 L % of estate ($/ha)I Ex eucalypt plantation
(2R)Ex eucalypt plantation (2R) Post-planting 2.38% $1.13
Pre-planting residual plus knockdown $13.12
$22.25K % of estate ($/ha)
Ex eucalypt plantation (2R)
Post-planting 21.38% $13.56$28.96
L % of estate ($/ha)Ex eucalypt plantation
(2R)
Post-planting 21.38% $10.18$13.12
M % of estate ($/ha)Ex eucalypt plantation
(2R) ($ha)
Spot clean-up 5.00% $0.06 $75.73$1.23
Figure H.4 A summary of the various herbicide regime options for a generic Tasmanian blue gum crop on a 2R site.
- 139 -

Chemical pesticide usage by Australian forest plantation industries
Appendix I Household chemical pesticides Table I.1 A summary of the chemical pesticides available for household use and available off the shelf for sale at large retail hardware stores and supermarkets.
Pesticide Active ingredient(s) Units Units Comments
Fungicides Benomyl g/kg 500 Garden fungicide Fungicides Bitertanol g/L 0.75 Rose & ornamental spray Fungicides Copper oxychloride g/kg Bordeaux mixture Fungicides Copper oxychloride + elemental sulphur g/kg 40 + 400 Tomato dust Fungicides Copper oxychloride + elemental sulphur + carbaryl g/kg 120 + 200 Tomato spray Fungicides Furalaxyl g/kg 250 Systemic fungicide, Pythium, Phytophthora for ornamental plants
Fungicides Mancozeb g/kg 40 Rose dust with sulphur and rotenone insecticide Fungicides Myclobutanil g/L 0.05 Rose fungicide - combined with tau-fluvalinate insecticide Fungicides Myclobutanil g/L 4.4 Rose fungicide - combined with tau-fluvalinate insecticide Fungicides Phosphorus acid (mono-di potassium phosphate) g/L 200 Systemic fungicide, for downy mildew, Phytophthora etc Fungicides Triadimefon g/kg 50 Powdery mildew, black spot, butt rots etc - wide range Fungicides Triforine g/L 19 Rose treatment Fungicides Triforine g/L Powdery mildews, rusts, black spot, lawn fungal diseases etc
Pesticide Active ingredient(s) Units Units Comments
Herbicides Amitrole + ammonium thiocyanate g/L 200 + 220 Herbicides Amitrole + ammonium thiocyanate g/L 250 + 220 Oxalis control Herbicides Amitrole + ammonium thiocyanate + simazine g/L 20.5 + 36.9 + 18 Once a year path weeder Herbicides Amitrole + ammonium thiocyanate + simazine g/L 50.0 + 208.0 + 150.0 Once a year path weeder Herbicides Amitrole + ammonium thiocyanate + simazine g/L 9 + 5 + 4.4 Once a year path weeder Herbicides Glyphosate (various salts) g/L 7.2 Broad spectrum foliar knockdown Herbicides Glyphosate (various salts) g/L 360 Broad spectrum foliar knockdown Herbicides Glyphosate (various salts) g/L 490 Broad spectrum foliar knockdown Herbicides Glyphosate (various salts) g/L 540 Broad spectrum foliar knockdown Herbicides MCPA + bromoxynil g/L 200 + 200 Herbicides MCPA + dicamba g/L 15 + 2.3 Lawn weeder-feeders, mixed with fertiliser Herbicides MCPA + dicamba g/L 23 + 3.5 Lawn weeder-feeders, mixed with fertiliser Herbicides MCPA + dicamba g/L 340 + 80 Broadleaf weed control Herbicides MCPA + dicamba + bertazone g/L 112 + 19 + 192 Multi weeding of lawns Herbicides Mecoprop + dicamba g/L 240 + 40 Lawn weed killer Herbicides Propyzamide g/kg 100 Grass control Herbicides Triclopyr g/L 60 Tree and blackberry killer
- 140 -

Chemical pesticide usage by Australian forest plantation industries
Table I.1 (cont) A summary of the chemical pesticides available for household use and available off the shelf for sale at large retail hardware stores and supermarkets.
Pesticide Active ingredient(s) Units Units Comments
Insecticides Bacillus thuringiensis Moth killer Insecticides Bifenthrin g/L 0.03 Broad range of insects Insecticides Bifenthrin g/L 0.5 Broad range of insects Insecticides Bioallethrin + bioresmethrin g/kg 2.09 + 0.39 Insect fly spray Insecticides Bioallethrin + bioresmethrin g/kg 3.7 + 0.7 Household and public health insect control, insect coils, wide range etc Insecticides Carbaryl g/kg 25 Tomato dust Insecticides Carbaryl g/kg 80 Tomato spray with fungicides Insecticides Carbaryl g/kg 800 Insecticides Chlorpyrifos g/kg 10 Lawn beetle, grubs, ant and roach dust Insecticides Chlorpyrifos g/kg 40 Lawn beetle killer Insecticides Chlorpyrifos g/kg 30-50 Ant control Insecticides Cyfluthrin g/kg 0.2 Lawn grub and garden insects Insecticides Cyfluthrin g/L 12.5 Lawn grub and garden insects Insecticides Deltamethrin g/L 0.3 Insecticides Dimethoate g/L 100 Insecticides Fenthion g/L 100 Insect pests in fruit, vegetables - wide range Insecticides Imadacloprid g/kg 15 Lawn damaging and leaf chewing insect Insecticides Malathion g/L 100 Anti-scale, also includes petroleum oil Insecticides Malathion g/L 500 CRC Malathion Insecticides Metaldehyde g/kg 15 Snail pellets Insecticides Methiocarb g/kg 20 Snail and slug bait Insecticides Omethoate g/kg 2 Aphids, caterpillars, scale insects etc Insecticides Permethrin g/L 3.0 Ant and roach spray & dusts Insecticides Permethrin g/kg 10 Ant and roach spray & dusts Insecticides Permethrin g/L 100 Insecticides Permethrin + tetramethrin g/kg 2.7 + 1.38 Odourless Surface Spray Insecticides Petroleum oil g/kg 150 Summer Oil Insecticides Pyrethrin g/L 1.0 + 10.0 Insecticidal pet shampoo Insecticides Pyrethrin + petroleum oil g/L 1.2 + 0.3 + 20 Leaf scale treatment Insecticides Pyrethrins g/L 0.3 + 1.2 Wide range of insects Insecticides Tetramethrin + phenothrin g/kg 10 + 3.5 + 0.18 Fly and insect killer Insecticides Propoxur g/kg 10 Household insecticide dust Insecticides Rotenone g/kg 5 Rose dust, insecticide and acaricide
- 141 -

Chemical pesticide usage by Australian forest plantation industries
Table I.1 (cont) A summary of the chemical pesticides available for household use and available off the shelf for sale at large retail hardware stores and supermarkets.
Pesticide Active ingredient(s) Units Units Comments
Insecticides Rotenone g/kg 7.5 Rose dust, insecticide and acaricide Insecticides Spinosad g/L 10 Leaf chewing insects Insecticides Tau-fluvalinate g/L 0.1 Wide range of insects Insecticides Tau-fluvalinate g/L 7.5 Wide range of insects Insecticides Tau-fluvalinate g/L 10 Wide range of insects Insecticides Tetramethrin + s-bioallethrin + bioresmethrin g/kg 3.82 + 1.1 + 0.75 Knockdown insect spray Insecticides Trichlofon g/L 500 Lawn grub killer
Rodenticide Brodifacoun g/kg 0.05 Rodent killer
- 142 -

Chemical pesticide usage by Australian forest plantation industries
Appendix J Australian chemical pesticide estimates The Figures in this Appendix show the estimated Australian chemical pesticide use by the crops shown in
the six zones as per Map 1. In the case of the plantation crops, they are presented on softwood and
hardwood split into:
• Inputs for the 1R crops areas;
• Inputs for the existing estate (harvested and replanted) and the 1R areas as a total estimate.
The total for each plantation type that is the best comparison of the relative chemical pesticide inputs
compared to the other crops shown.
The information is structured as follows:
• Figures J.1 to J.4 show the estimated chemical pesticide use for each of the land uses shown;
• Figures J.5 to J.7 show the per hectare chemical pesticide use for each of the land uses shown.
$0 $50,000,000
$100,000,000
$150,000,000
$200,000,000
$250,000,000
$300,000,000
$350,000,000
$400,000,000
$450,000,000
$500,000,000
Wheat for grain
Meat cattle
Sheep and lambs
Barley for grain
Dairy cattle
Grapes
Cotton - irrigated
Hay & silage - Pastures cut for hay
Canola
Sugar cane
Faba beans (incl. tick horse and broad)
Bananas
Oats for grain
Annual spend ($/yr)
Herbicides Insecticides Fungicides Animal health
Figure J.1 The estimated spend on chemical pesticides for the six zones modelled.
- 143 -

Chemical pesticide usage by Australian forest plantation industries
$0 $2,000,000
$4,000,000
$6,000,000
$8,000,000
$10,000,000
$12,000,000
$14,000,000
$16,000,000
$18,000,000
$20,000,000
Crops cut for hay Rice for grain
Lupins for grainPotatoes
Triticale for grainSoftw ood (total)Hardw ood (total)
Hardw ood short rotation (1R)Apples
Chickpeas Caulif low er
PoppiesTotal citrus
Tomatoes
Annual spend ($/yr)
Herbicides Insecticides Fungicides Animal health
Figure J.2 The estimated spend on chemical pesticides for the six zones modelled.
$0 $500,000
$1,000,000
$1,500,000
$2,000,000
$2,500,000
$3,000,000
$3,500,000
$4,000,000
$4,500,000
$5,000,000
Tomatoes
Lettuce
Maize for grain
Mung and other f ield beans
Onions
Soybeans
Broccoli
Mellons
Capsicum
Carrot standard
Softw ood long rotation (1R)
Potatoes for seed
Sw eetcorn
Pumpkins
Hardw ood long rotation (1R)
Cherries
Annual spend ($/yr)
Herbicides Insecticides Fungicides Animal health
Figure J.3 The estimated spend on chemical pesticides for the six zones modelled.
- 144 -

Chemical pesticide usage by Australian forest plantation industries
$0 $50,000
$100,000
$150,000
$200,000
$250,000
$300,000
$350,000
$400,000
$450,000
Green peas
Asparagus
Beans slicing
Green beans slicing
Millet for grain (incl. panicum and canary seed)
Carrot fresh market
Apricots
Zucchini
Carrots - baby
Annual spend ($/yr)
Herbicides Insecticides Fungicides Animal health
Figure J.4 The estimated spend on chemical pesticides for the six zones modelled.
$0 $200
$400
$600
$800
$1,000
$1,200
$1,400
$1,600
$1,800
$2,000
Bananas
Onions
Apples
Tomatoes
Grapes
Apricots
Cherries
Lettuce
Cotton - irrigated
Spend ($/ha/yr)
Herbicides Insecticides Fungicides Animal health
Figure J.5 The estimated spend on chemical pesticides for the six zones modelled.
- 145 -

Chemical pesticide usage by Australian forest plantation industries
$0 $10
$20
$30
$40
$50
$60
$70
$80
$90
$100
Mung and other f ield beansSoybeans
Green peasSugar cane
Green beans slicingMaize for grain
Beans slicingHay & silage - Pastures cut for hay
Dairy cattleCanola
Wheat for grainCrops cut for hay
Barley for grainLupins for grain
Triticale for grainOats for grain
Millet for grain (incl. panicum and canary seed)Sheep and lambsHardw ood (total)Softw ood (total)
Meat cattle
Spend ($/ha/yr)
Herbicides Insecticides Fungicides Animal health
Figure J.6 The estimated spend on chemical pesticides for the six zones modelled.
$0 $20
$40
$60
$80
$100
$120
Mung and other field beansSoybeans
Green peasSugar cane
Green beans slicingMaize for grain
Beans slicingHay & silage - Pastures cut for hay
Dairy cattleCanola
Wheat for grainCrops cut for hay
Barley for grainLupins for grain
Triticale for grainOats for grain
Millet for grain (incl. panicum and canary seed)Sheep and lambsHardw ood (total)Softw ood (total)
Meat cattle
Spend ($/ha/yr)
Herbicides Insecticides Fungicides Animal health
Figure J.7 The estimated spend on chemical pesticides for the six zones modelled.
- 146 -

Chemical pesticide usage by Australian forest plantation industries
Zone A details
• Map A shows the areas covered by Zone A and defines the NFI zones and the ABS SD’s;
• Figures A.1 to A.3 show the area of each land use in the zones based on the NFI (Parsons et al.,
2006) and ABS data (ABS, 2006);
• Figures A.4 to A.6 show the estimated total chemical pesticide use for each of the land uses shown;
• Figures A.7 to A.8 show the per hectare chemical pesticide use for each of the land uses shown.
- 147 -

Chemical pesticide usage by Australian forest plantation industries
Map A An outline of the area covered by Zone A. The map shows the NFI zones and the ABS SD’s (prepared by NFI, 2006)
- 148 -

Chemical pesticide usage by Australian forest plantation industries
0 500,000
1,000,000
1,500,000
2,000,000
2,500,000
3,000,000
3,500,000
4,000,000
Wheat for grain
Sheep and lambs
Meat cattle
Barley for grain
Lupins for grain
Oats for grain
Canola
Area (ha)
A breakdown of the zone land use based on ABS (2006a) and Parsons et al. (2006). Figure A.1
0 50,000
100,000
150,000
200,000
250,000
300,000
Hardw ood (total)
Crops cut for hay
Dairy cattle
Softw ood (total)
Hay & silage - Pasturescut for hay
Area (ha)
A breakdown of the zone land use based on ABS (2006a) and Parsons et al. (2006). Figure A.2
- 149 -

Chemical pesticide usage by Australian forest plantation industries
0 2,000
4,000
6,000
8,000
10,000
12,000
14,000
16,000
18,000
20,000
22,000
24,000
Hardw ood short rotation (1R)
Grapes
Potatoes
Carrot standard
Caulif low er
Apples
Softw ood long rotation (1R)
Broccoli
Total citrus
Lettuce
Potatoes for seed
Pumpkins
Onions
Tomatoes
Area (ha)
A breakdown of the zone land use based on ABS (2006a) and Parsons et al. (2006). Figure A.3
$0 $20,000,000
$40,000,000
$60,000,000
$80,000,000
$100,000,000
$120,000,000
$140,000,000
$160,000,000
$180,000,000
Wheat for grain
Sheep and lambs
Barley for grain
Meat cattle
Oats for grain
Total spend ($/yr)
Herbicides Insecticides Fungicides Animal health
Figure A.4 The modelled results of the total chemical pesticide inputs to grow the crops shown in the zone.
- 150 -

Chemical pesticide usage by Australian forest plantation industries
$0 $2,000,000
$4,000,000
$6,000,000
$8,000,000
$10,000,000
$12,000,000
Lupins for grain
Grapes
Crops cut for hay
Canola
Dairy cattle
Hay & silage - Pastures cut for hay
Hardw ood (total)
Hardw ood short rotation (1R)
Potatoes
Apples
Total spend ($/yr)
Herbicides Insecticides Fungicides Animal health
Figure A.5 The modelled results of the total chemical pesticide inputs to grow the crops shown in the zone.
$0 $50,000
$100,000
$150,000
$200,000
$250,000
$300,000
$350,000
Lettuce
Carrot standard
Total citrus
Softw ood (total)
Onions
Broccoli
Softw ood long rotation (estate)
Caulif low er
Potatoes for seed
Hardw ood short rotation (estate)
Tomatoes
Softw ood long rotation (1R)
Pumpkins
Total spend ($/yr)
Herbicides Insecticides Fungicides Animal health
Figure A.6 The modelled results of the total chemical pesticide inputs to grow the crops shown in the zone.
- 151 -

Chemical pesticide usage by Australian forest plantation industries
$0 $100
$200
$300
$400
$500
$600
$700
$800
$900
$1,000
Onions Apples
Potatoes Grapes Lettuce
Tomatoes Total citrus
Softwood long rotation (1R) Broccoli
Potatoes for seed Carrot standard
Cauliflower Pumpkins
Hardwood short rotation (1R)
Chemical pesticide spend ($/ha/yr)
Herbicides Insecticides Fungicides Animal health
Figure A.7 The modelled results of the per hectare chemical pesticide inputs to grow the crops shown in the zone.
$0 $10
$20
$30
$40
$50
$60
Hay & silage - Pastures cut for hay Crops cut for hay
Dairy cattle Wheat for grain
Oats for grain Barley for grain Lupins for grain
Canola Meat cattle
Hardwood (total) Sheep and lambs Softwood (total)
Chemical pesticide spend ($/ha/yr)
Herbicides Insecticides Fungicides Animal health
Figure A.8 The modelled results of the per hectare chemical pesticide inputs to grow the crops shown in the zone.
- 152 -

Chemical pesticide usage by Australian forest plantation industries
Zone B details
• Map B shows the areas covered by Zone B and defines the NFI zones and the ABS SD’s;
• Figures B.1 to BA.3 show the area of each land use in the zones based on the NFI (Parsons et al.,
2006) and ABS data (ABS, 2006);
• Figures B.4 to B.6 show the estimated total chemical pesticide use for each of the land uses shown;
• Figures B.7 to B.8 show the per hectare chemical pesticide use for each of the land uses shown.
- 153 -

Chemical pesticide usage by Australian forest plantation industries
Map B An outline of the area covered by Zone B. The map shows the NFI zones and the ABS SD’s (prepared by NFI, 2006)
- 154 -

Chemical pesticide usage by Australian forest plantation industries
0 1,000,000
2,000,000
3,000,000
4,000,000
5,000,000
6,000,000
7,000,000
8,000,000
9,000,000
10,000,000
Sheep and lambs
Wheat for grain
Meat cattle
Barley for grain
Dairy cattle
Canola
Hay & silage - Pasturescut for hay
Area (ha)
Figure B.1 A breakdown of the zone land use based on ABS (2006a) and Parsons et al. (2006).
0 20,000
40,000
60,000
80,000
100,000
120,000
140,000
160,000
180,000
200,000
220,000
240,000
260,000
280,000
Oats for grain
Softw ood (total)
Triticale for grain
Crops cut for hay
Hardw ood (total)
Faba beans (incl. tick horse and broad)
Lupins for grain
Grapes
Area (ha)
A breakdown of the zone land use based on ABS (2006a) and Parsons et al. (2006). Figure B.2
- 155 -

Chemical pesticide usage by Australian forest plantation industries
0 2,000
4,000
6,000
8,000
10,000
12,000
14,000
16,000
Hardw ood short rotation (1R)
Potatoes
Total citrus
Carrot standard
Apples
Potatoes for seed
Lettuce
Tomatoes
Softw ood long rotation (1R)
Broccoli
Caulif low er
Onions
Area (ha)
Figure B.3 A breakdown of the zone land use based on ABS (2006a) and Parsons et al. (2006).
$0 $10,000,000
$20,000,000
$30,000,000
$40,000,000
$50,000,000
$60,000,000
$70,000,000
$80,000,000
$90,000,000
$100,000,000
$110,000,000
Sheep and lambs
Wheat for grain
Grapes
Dairy cattle
Barley for grain
Meat cattle
Hay & silage - Pastures cut for hay
Canola
Faba beans (incl. tick horse and broad)
Crops cut for hay
Total spend ($/yr)
Herbicides Insecticides Fungicides Animal health
Figure B.4 The modelled results of the total chemical pesticide inputs to grow the crops shown in the zone.
- 156 -

Chemical pesticide usage by Australian forest plantation industries
$0 $500,000
$1,000,000
$1,500,000
$2,000,000
$2,500,000
$3,000,000
$3,500,000
Total citrus
Triticale for grain
Lupins for grain
Softw ood (total)
Potatoes
Hardw ood (total)
Hardw ood short rotation (1R)
Oats for grain
Apples
Total spend ($/yr)
Herbicides Insecticides Fungicides Animal health
Figure B.5 The modelled results of the total chemical pesticide inputs to grow the crops shown in the zone. $0 $100,000
$200,000
$300,000
$400,000
$500,000
Lettuce
Carrot standard
Tomatoes
Potatoes for seed
Broccoli
Onions
Softw ood long rotation(1R)
Caulif low er
Total spend ($/yr)
Herbicides Insecticides Fungicides Animal health
Figure B.6 The modelled results of the total chemical pesticide inputs to grow the crops shown in the zone.
- 157 -

Chemical pesticide usage by Australian forest plantation industries
$0 $100
$200
$300
$400
$500
$600
$700
$800
$900
Apples
Onions
Grapes
Lettuce
Tomatoes
Total citrus
Softw ood long rotation (1R)
Broccoli
Potatoes for seed
Caulif low er
Carrot standard
Potatoes
Chemical pesiticide spend ($/ha/yr)
Herbicides Insecticides Fungicides Animal health
Figure B.7 The modelled results of the per hectare chemical pesticide inputs to grow the crops shown in the zone.
$0 $10
$20
$30
$40
$50
$60
$70
$80
$90
$100
Hardw ood short rotation (1R)
Hay & silage - Pastures cut for hay
Dairy cattle
Canola
Crops cut for hay
Wheat for grain
Lupins for grain
Barley for grain
Meat cattle
Triticale for grain
Hardw ood (total)
Softw ood (total)
Oats for grain
Sheep and lambs
Chemical pesiticide spend ($/ha/yr)
Herbicides Insecticides Fungicides Animal health
Figure B.8 The modelled results of the per hectare chemical pesticide inputs to grow the crops shown in the zone.
- 158 -

Chemical pesticide usage by Australian forest plantation industries
Zone C details
• Map C shows the areas covered by Zone C and defines the NFI zones and the ABS SD’s;
• Figures C.1 to C.2 show the area of each land use in the zones based on the NFI (Parsons et al.,
2006) and ABS data (ABS, 2006);
• Figures C.3 to C.5 show the estimated total chemical pesticide use for each of the land uses shown;
• Figures C.6 to C.7 show the per hectare chemical pesticide use for each of the land uses shown.
- 159 -

Chemical pesticide usage by Australian forest plantation industries
Map C An outline of the area covered by Zone C. The map shows the NFI zones and the ABS SD’s (prepared by NFI, 2006)
- 160 -

Chemical pesticide usage by Australian forest plantation industries
0 50,000
100,000
150,000
200,000
250,000
300,000
350,000
400,000
450,000
500,000
Meat cattle
Sheep and lambs
Dairy cattle
Hardw ood (total)
Softw ood (total)
Hay & silage - Pasturescut for hay
Area (ha)
A breakdown of the zone land use based on ABS (2006a) and Parsons et al. (2006). Figure C.1
0 2,000
4,000
6,000
8,000
10,000
12,000
14,000
16,000
18,000
20,000
PoppiesBarley for grainWheat for grain
PotatoesGreen peas
Hardw ood long rotation (1R)Hardw ood short rotation (1R)
Oats for grainCrops cut for hay
ApplesTriticale for grain
Green beans slicingOnionsGrapesBroccoliCherries
Potatoes for seed Caulif low er
Carrot fresh marketCarrot standardCarrots - baby
Apricots
Area (ha)
Figure C.2 A breakdown of the zone land use based on ABS (2006a) and Parsons et al. (2006).
- 161 -

Chemical pesticide usage by Australian forest plantation industries
$0 $1,000,000
$2,000,000
$3,000,000
$4,000,000
$5,000,000
$6,000,000
$7,000,000
$8,000,000
$9,000,000
$10,000,000
$11,000,000
Dairy cattle
Meat cattle
Potatoes
Poppies
Apples
Sheep and lambs
Hardw ood (total)
Onions
Total spend ($/yr)
Herbicides Insecticides Fungicides Animal health
Figure C.3 The modelled results of the total chemical pesticide inputs to grow the crops shown in the zone.
$0 $100,000
$200,000
$300,000
$400,000
$500,000
$600,000
$700,000
$800,000
Grapes
Hardw ood long rotation (1R)
Hardw ood short rotation (1R)
Hay & silage - Pastures cut for hay
Cherries
Green peas
Softw ood (total)
Wheat for grain
Barley for grain
Broccoli
Green beans slicing
Total spend ($/yr)
Herbicides Insecticides Fungicides Animal health
Figure C.4 The modelled results of the total chemical pesticide inputs to grow the crops shown in the zone.
- 162 -

Chemical pesticide usage by Australian forest plantation industries
$0 $10,000
$20,000
$30,000
$40,000
$50,000
$60,000
$70,000
$80,000
$90,000
$100,000
$110,000
Oats for grain
Crops cut for hay
Potatoes for seed
Carrot standard
Carrot fresh market
Apricots
Carrots - baby
Triticale for grain
Caulif low er
Total spend ($/yr)
Herbicides Insecticides Fungicides Animal health
Figure C.5 The modelled results of the total chemical pesticide inputs to grow the crops shown in the zone.
$0 $50
$100
$150
$200
$250
Carrot standard
Carrot fresh market
Broccoli
Potatoes for seed
Carrots - baby
Hardw ood long rotation (1R)
Hardw ood short rotation (1R)
Green peas
Caulif low er
Green beans slicing
Dairy cattle
Chemical pesiticide spend ($/ha/yr)
Herbicides Insecticides Fungicides Animal health
Figure C.6 The modelled results of the per hectare chemical pesticide inputs to grow the crops shown in the zone.
- 163 -

Chemical pesticide usage by Australian forest plantation industries
$0 $5 $10
$15
$20
$25
$30
Wheat for grain
Crops cut for hay
Oats for grain
Barley for grain
Triticale for grain
Meat cattle
Hay & silage - Pastures cut for hay
Hardw ood (total)
Softw ood (total)
Sheep and lambs
Chemical pesiticide spend ($/ha/yr)
Herbicides Insecticides Fungicides Animal health
Figure C.7 The modelled results of the per hectare chemical pesticide inputs to grow the crops shown in the zone.
- 164 -

Chemical pesticide usage by Australian forest plantation industries
Zone D details
• Map D shows the areas covered by Zone D and defines the NFI zones and the ABS SD’s;
• Figures D.1 to D.3 show the area of each land use in the zones based on the NFI (Parsons et al.,
2006) and ABS data (ABS, 2006);
• Figures D.4 to D.6 show the estimated total chemical pesticide use for each of the land uses shown;
• Figures D.7 to D.8 show the per hectare chemical pesticide use for each of the land uses shown.
- 165 -

Chemical pesticide usage by Australian forest plantation industries
Map D An outline of the area covered by Zone D. The map shows the NFI zones and the ABS SD’s (prepared by NFI, 2006)
- 166 -

Chemical pesticide usage by Australian forest plantation industries
0 1,000,000
2,000,000
3,000,000
4,000,000
5,000,000
6,000,000
7,000,000
8,000,000
9,000,000
10,000,000
Meat cattle
Sheep and lambs
Wheat for grain
Dairy cattle
Barley for grain
Area (ha)
A breakdown of the zone land use based on ABS (2006a) and Parsons et al. (2006). Figure D.1
0 50,000
100,000
150,000
200,000
250,000
300,000
350,000
400,000
450,000
Oats for grain
Hay & silage - Pastures cut for hay
Canola
Softw ood (total)
Triticale for grain
Crops cut for hay
Lupins for grain
Rice for grain
Hardw ood (total)
Grapes
Faba beans (incl. tick horse and broad)
Chickpeas
Area (ha)
A breakdown of the zone land use based on ABS (2006a) and Parsons et al. (2006). Figure D.2
- 167 -

Chemical pesticide usage by Australian forest plantation industries
0 1,000
2,000
3,000
4,000
5,000
6,000
7,000
8,000
9,000
10,000
Total citrus
Potatoes
Softw ood long rotation (1R)
Tomatoes
Sw eetcorn
Apples
Broccoli
Hardw ood short rotation (1R)
Lettuce
Carrot standard
Asparagus
Potatoes for seed
Onions
Pumpkins
Caulif low er
Area (ha)
A breakdown of the zone land use based on ABS (2006a) and Parsons et al. (2006). Figure D.3
$0 $10,000,000
$20,000,000
$30,000,000
$40,000,000
$50,000,000
$60,000,000
$70,000,000
$80,000,000
$90,000,000
$100,000,000
$110,000,000
$120,000,000
$130,000,000
Wheat for grain
Sheep and lambs
Meat cattle
Dairy cattle
Grapes
Canola
Barley for grain
Hay & silage - Pastures cut for hay
Faba beans (incl. tick horse and broad)
Rice for grain
Total spend ($/yr)
Herbicides Insecticides Fungicides Animal health
Figure D.4 The modelled results of the total chemical pesticide inputs to grow the crops shown in the zone.
- 168 -
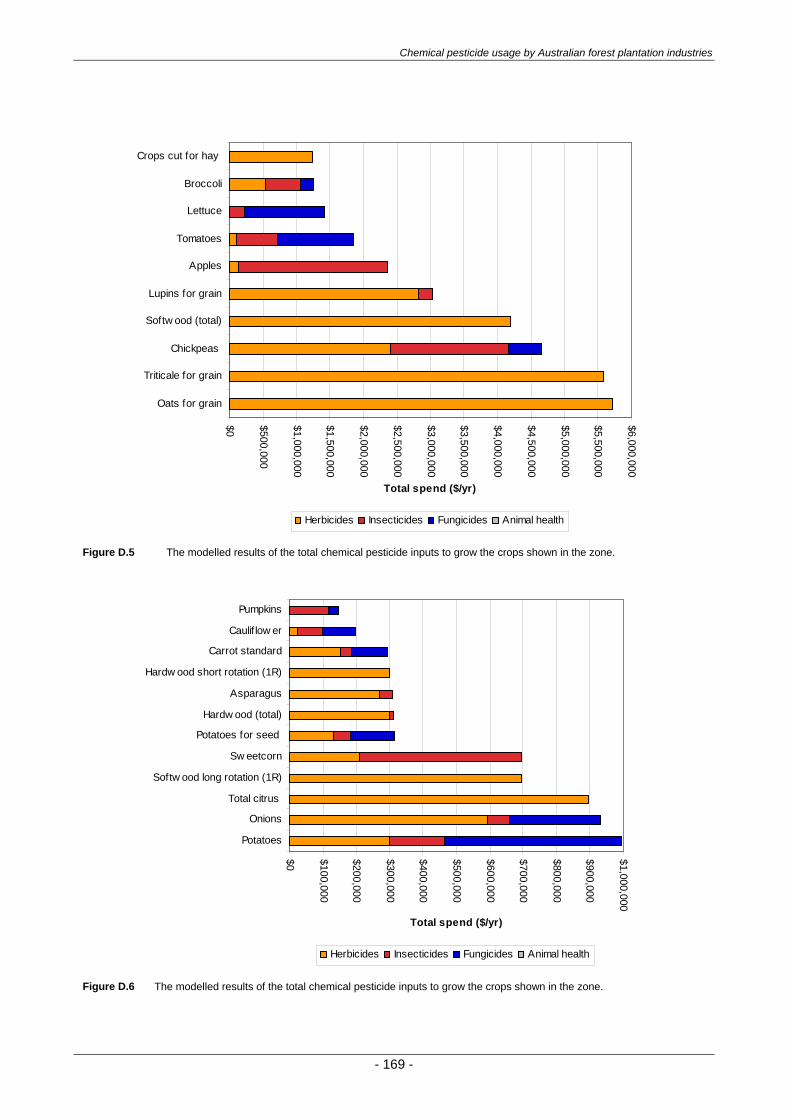
Chemical pesticide usage by Australian forest plantation industries
$0 $500,000
$1,000,000
$1,500,000
$2,000,000
$2,500,000
$3,000,000
$3,500,000
$4,000,000
$4,500,000
$5,000,000
$5,500,000
$6,000,000
Oats for grain
Triticale for grain
Chickpeas
Softw ood (total)
Lupins for grain
Apples
Tomatoes
Lettuce
Broccoli
Crops cut for hay
Total spend ($/yr)
Herbicides Insecticides Fungicides Animal health
Figure D.5 The modelled results of the total chemical pesticide inputs to grow the crops shown in the zone.
$0 $100,000
$200,000
$300,000
$400,000
$500,000
$600,000
$700,000
$800,000
$900,000
$1,000,000
Potatoes
Onions
Total citrus
Softw ood long rotation (1R)
Sw eetcorn
Potatoes for seed
Hardw ood (total)
Asparagus
Hardw ood short rotation (1R)
Carrot standard
Caulif low er
Pumpkins
Total spend ($/yr)
Herbicides Insecticides Fungicides Animal health
Figure D.6 The modelled results of the total chemical pesticide inputs to grow the crops shown in the zone.
- 169 -

Chemical pesticide usage by Australian forest plantation industries
$0 $50
$100
$150
$200
$250
$300
$350
$400
$450
$500
$550
$600
$650
$700
$750
$800
Onions
Apples
Grapes
Lettuce
Faba beans (incl. tick horse and broad)
Tomatoes
Broccoli
Softw ood long rotation (1R)
Rice for grain
Potatoes for seed
Chemical pesiticide spend ($/ha/yr)
Herbicides Insecticides Fungicides Animal health
Figure D.7 The modelled results of the per hectare chemical pesticide inputs to grow the crops shown in the zone.
$0 $20
$40
$60
$80
$100
$120
$140
$160
$180
$200
AsparagusCaulif low erSw eetcorn
Carrot standardChickpeas
PotatoesPumpkins
Total citrus Hardw ood short rotation (1R)
Canola Hay & silage - Pastures cut for hay
Dairy cattleLupins for grainWheat for grainBarley for grain
Triticale for grainMeat cattle
Oats for grainSoftw ood (total)
Crops cut for hay Hardw ood (total)Sheep and lambs
Chemical pesiticide spend ($/ha/yr)
Herbicides Insecticides Fungicides Animal health
Figure D.8 The modelled results of the per hectare chemical pesticide inputs to grow the crops shown in the zone.
- 170 -

Chemical pesticide usage by Australian forest plantation industries
Zone E details
• Map E shows the areas covered by Zone E and defines the NFI zones and the ABS SD’s;
• Figures E.1 to E.3 show the area of each land use in the zones based on the NFI (Parsons et al.,
2006) and ABS data (ABS, 2006);
• Figures E.4 to E.6 show the estimated total chemical pesticide use for each of the land uses shown;
• Figures E.7 to E.8 show the per hectare chemical pesticide use for each of the land uses shown.
- 171 -

Chemical pesticide usage by Australian forest plantation industries
Map E An outline of the area covered by Zone E. The map shows the NFI zones and the ABS SD’s (prepared by NFI, 2006)
- 172 -

Chemical pesticide usage by Australian forest plantation industries
0 2,000,000
4,000,000
6,000,000
8,000,000
10,000,000
12,000,000
Meat cattle
Sheep and lambs
Wheat for grain
Area (ha)
Figure E.1 A breakdown of the zone land use based on ABS (2006a) and Parsons et al. (2006).
0 50,000
100,000
150,000
200,000
250,000
300,000
350,000
400,000
450,000
500,000
Dairy cattle
Barley for grain
Softw ood (total)
Softw ood long rotation (estate)
Sugar cane
Cotton - irrigated
Hardw ood (total)
Hardw ood short rotation (estate)
Hay & silage - Pastures cut for hay
Area (ha)
Figure E.2 A breakdown of the zone land use based on ABS (2006a) and Parsons et al. (2006).
- 173 -

Chemical pesticide usage by Australian forest plantation industries
0 5,000
10,000
15,000
20,000
25,000
30,000
35,000
40,000
45,000
Oats for grain
Maize for grain
Soybeans
Canola
Mung and other f ield beans
Hardw ood short rotation (1R)
Grapes
Potatoes
Beans slicing
Bananas
Lettuce
Pumpkins
Mellons
Capsicum
Softw ood long rotation (1R)
Area (ha)
A breakdown of the zone land use based on ABS (2006a) and Parsons et al. (2006). Figure E.3
$0 $10,000,000
$20,000,000
$30,000,000
$40,000,000
$50,000,000
$60,000,000
$70,000,000
$80,000,000
$90,000,000
$100,000,000
$110,000,000
$120,000,000
Meat cattle
Wheat for grain
Cotton - irrigated
Sheep and lambs
Barley for grain
Dairy cattle
Sugar cane
Total spend ($/yr)
Herbicides Insecticides Fungicides Animal health
Figure E.4 The modelled results of the total chemical pesticide inputs to grow the crops shown in the zone.
- 174 -

Chemical pesticide usage by Australian forest plantation industries
$0 $500,000
$1,000,000
$1,500,000
$2,000,000
$2,500,000
$3,000,000
$3,500,000
$4,000,000
$4,500,000
$5,000,000
Grapes
Bananas
Hay & silage - Pastures cut for hay
Canola
Hardw ood (total)
Maize for grain
Soybeans
Hardw ood short rotation (1R)
Mung and other f ield beans
Lettuce
Softw ood (total)
Total spend ($/yr)
Herbicides Insecticides Fungicides Animal health
Figure E.5 The modelled results of the total chemical pesticide inputs to grow the crops shown in the zone.
$0 $100,000
$200,000
$300,000
$400,000
$500,000
$600,000
$700,000
$800,000
$900,000
$1,000,000
Oats for grain
Mellons
Capsicum
Potatoes
Pumpkins
Beans slicing
Softw ood long rotation (1R)
Total spend ($/yr)
Herbicides Insecticides Fungicides Animal health
Figure E.6 The modelled results of the total chemical pesticide inputs to grow the crops shown in the zone.
- 175 -

Chemical pesticide usage by Australian forest plantation industries
$0 $100
$200
$300
$400
$500
$600
$700
$800
$900
$1,000
$1,100
$1,200
$1,300
$1,400
$1,500
$1,600
$1,700
$1,800
$1,900
$2,000
Bananas
Grapes
Lettuce
Cotton - irrigated
Capsicum
Canola
Mellons
Chemical pesiticide spend ($/ha/yr)
Herbicides Insecticides Fungicides
Figure E.7 The modelled results of the per hectare chemical pesticide inputs to grow the crops shown in the zone.
$0 $20
$40
$60
$80
$100
$120
$140
$160
$180
Hardw ood short rotation (1R)PumpkinsPotatoes
Mung and other f ield beansSoybeans
Sugar cane Maize for grain
Hay & silage - Pastures cut for hayBeans slicing
Barley for grainWheat for grain
Dairy cattleOats for grain
Hardw ood (total)Meat cattle
Sheep and lambsSoftw ood (total)
Softw ood long rotation (1R)
Chemical pesiticide spend ($/ha/yr)
Herbicides Insecticides Fungicides Animal health
Figure E.8 The modelled results of the per hectare chemical pesticide inputs to grow the crops shown in the zone.
- 176 -

Chemical pesticide usage by Australian forest plantation industries
Zone F details
• Map F shows the areas covered by Zone F and defines the NFI zones and the ABS SD’s;
• Figures F.1 to F.3 show the area of each land use in the zones based on the NFI (Parsons et al.,
2006) and ABS data (ABS, 2006);
• Figures F.4 to F.6 show the estimated total chemical pesticide use for each of the land uses shown;
• Figures F.7 to F.8 show the per hectare chemical pesticide use for each of the land uses shown.
- 177 -

Chemical pesticide usage by Australian forest plantation industries
Map F An outline of the area covered by Zone F. The map shows the NFI zones and the ABS SD’s (prepared by NFI, 2006)
- 178 -

Chemical pesticide usage by Australian forest plantation industries
0 5,000,000
10,000,000
15,000,000
20,000,000
25,000,000
30,000,000
35,000,000
40,000,000
45,000,000
50,000,000
Meat cattle
Sugar cane
Area (ha)
A breakdown of the zone land use based on ABS (2006a) and Parsons et al. (2006). Figure F.1 0 50,000
100,000
150,000
200,000
250,000
300,000
350,000
400,000
450,000
Sugar cane
Wheat for grain
Dairy cattle
Hay & silage - Pasturescut for hay
Softw ood (total)
Maize for grain
Sheep and lambs
Area (ha)
Figure F.2 A breakdown of the zone land use based on ABS (2006a) and Parsons et al. (2006).
- 179 -

Chemical pesticide usage by Australian forest plantation industries
0 2,000
4,000
6,000
8,000
10,000
12,000
14,000
16,000
18,000
20,000
Chickpeas Crops cut for hay Hardw ood (total)
BananasCaulif low er
Mung and other f ield beansHardw ood short rotation (1R)
Barley for grainMillet for grain (incl. panicum and canary seed)
MellonsPotatoes
TomatoesPumpkins
Beans slicingCapsicum
Total citrus Soybeans
GrapesZucchini
Sw eetcorn
Area (ha)
Figure F.3 The modelled results of the total chemical pesticide inputs to grow the crops shown in the zone.
$0 $5,000,000
$10,000,000
$15,000,000
$20,000,000
$25,000,000
$30,000,000
$35,000,000
$40,000,000
$45,000,000
$50,000,000
$55,000,000
$60,000,000
Meat cattle
Sugar cane
Bananas
Total spend ($/yr)
Herbicides Insecticides Fungicides Animal health
Figure F.4 The modelled results of the total chemical pesticide inputs to grow the crops shown in the zone.
- 180 -

Chemical pesticide usage by Australian forest plantation industries
$0 $500,000
$1,000,000
$1,500,000
$2,000,000
$2,500,000
$3,000,000
$3,500,000
$4,000,000
$4,500,000
$5,000,000
Caulif low erWheat for grain
Chickpeas Dairy cattle
TomatoesHay & silage - Pastures cut
Maize for grainMung and other f ield beans
MellonsGrapes
CapsicumHardw ood (total)
Hardw ood short rotation (1R)Total citrus
Sheep and lambsBarley for grain
PotatoesSoftw ood (total)
Crops cut for hay
Total spend ($/yr)
Herbicides Insecticides Fungicides Animal health
Figure F.5 The modelled results of the total chemical pesticide inputs to grow the crops shown in the zone.
$0 $50,000
$100,000
$150,000
$200,000
$250,000
$300,000
Softw ood (total)
Crops cut for hay
Pumpkins
Soybeans
Beans slicing
Millet for grain (incl.panicum and canary seed)
Zucchini
Sw eetcorn
Total spend ($/yr)
Herbicides Insecticides Fungicides Animal health
Figure F.6 The modelled results of the total chemical pesticide inputs to grow the crops shown in the zone.
- 181 -

Chemical pesticide usage by Australian forest plantation industries
$0 $200
$400
$600
$800
$1,000
$1,200
$1,400
$1,600
$1,800
$2,000
Bananas
Tomatoes
Grapes
Caulif low er
Capsicum
Total citrus
Mellons
Sw eetcorn
Pumpkins
Zucchini
Potatoes
Chickpeas
Chemical pesiticide spend ($/ha/yr)
Herbicides Insecticides Fungicides Animal health
Figure F.7 The modelled results of the per hectare chemical pesticide inputs to grow the crops shown in the zone.
$0 $10
$20
$30
$40
$50
$60
$70
$80
$90
$100
Mung and other f ield beansHardw ood short rotation (1R)
SoybeansBarley for grain
Sugar cane Hay & silage - Pastures cut for hay
Maize for grainBeans slicing
Wheat for grainDairy cattle
Hardw ood (total)Millet for grain (incl. panicum and canary seed)
Crops cut for hay Meat cattle
Softw ood (total)Sheep and lambs
Softw ood long rotation (1R)
Chemical pesiticide spend ($/ha/yr)
Herbicides Insecticides Fungicides Animal health
Figure F.8 The modelled results of the per hectare chemical pesticide inputs to grow the crops shown in the zone.
- 182 -
Chemical pesticide usage by Australian forest plantation industries
Acknowledgements
The authors wish to acknowledge assistance in preparing this report: industry survey participants; Mark
Parsons, Mijo Gavran and Robert Dillon of the National Forest Inventory for preparation of zone mapping;
Paul Curtis of the Australian Bureau of Statistics for assistance with and the provision of ABS data sets; the
many industry contacts who provided a valuable checks of the information generated by this study.
- 183 -

![[XLS] · Web view6117 4 4.3 6120 4 4.3 6125 13 13.3 6130 13 13.3 6135 13 13.3 6140 13 13.3 6145 13 13.3 6150 13 13.3 6160 13 13.3 6210 4 4.3 6220 13 13.3 6230 4 4.3 6240 4 4.3 6250](https://static.fdocuments.in/doc/165x107/5b2a094f7f8b9a251e8b792d/xls-web-view6117-4-43-6120-4-43-6125-13-133-6130-13-133-6135-13-133-6140.jpg)