Socioeconomic Determinants of Body Mass Index of Adult Chinese in the 1990s
Master thesis
M&As wealth effects and their determinants: The Chinese banking
industry between 2006-2013
By
Xiao Wu
ANR: 786873
M.S.D. Dwarkasing BSc. MSc, Supervisor
A thesis submitted in partial fulfillment
Of the requirements for the degree
Master of Science in Finance
School of Economics and Management
Tilburg University
-August 2014-

1
Contents 1. Introduction ....................................................................................................................................... 2
2. Literature review ............................................................................................................................... 5
2.1 Why do banks merge? ................................................................................................................. 5
2.2 Where are developing countries? ............................................................................................. 12
3. A brief history of Chinese banking industry .................................................................................... 14
4. Merger and bank data ..................................................................................................................... 16
5. Shareholder value creations in banking M&As ............................................................................... 19
5.1 The Event studies model and value creations in banking M&As .............................................. 20
5.2 Value creations of different types of M&As .............................................................................. 24
6. Determinants of wealth effects in banking M&As .......................................................................... 27
6.1 The regression model and determinants of excess returns ...................................................... 28
6.2 Robustness tests ........................................................................................................................ 31
7. Conclusion ....................................................................................................................................... 34
References .............................................................................................................................................. 37

2
1. Introduction
This paper studies the wealth effects of mergers and acquisitions and their determinants in
Chinese banking between 2006 and 2013. Over the last three decades, the financial services
industry has experienced profound consolidation waves in developed countries with the progresses
in technologies, releases of regulations and deepness of globalization. According to Securities Data
Corporation, the value of American deals totaled 673 billion Euros compared with around €1
trillion in Europe between January 2006 and December 2013. More recently, M&As in Chinese
banking have started to catch up. In the post-crisis era, the economic downturn in China associated
with potential credit losses and excess capacity in the banking industry imposes massive
profitability pressures on Chinese banks in the foreseeable future 1 . The attenuation of the
boundaries that limit foreign financial institutions operating in the mainland market is expected to
lead to fiercer bank competition. Under the serious competition, the Chinese banking industry is
experiencing an unprecedented M&A wave. There are more than 200 mergers announced or
completed in the Chinese banking sector over 2006-20132, totaling 27 million Euros in deal values.
Up to present, most of the available knowledge on M&As in the banking industry comes from
researches on developed economies, mainly the United States and the European Union. DeYoung
et al. (2009) review more than 150 empirical literature studies after 2000 concerning the industrial
countries. The authors summarize that North American bank mergers appear to be efficiency
improving, although the event-study literature presents a mixed picture regarding shareholder
value creations. And European bank mergers seemingly result in both efficiency gains and
shareholder wealth enhancements. Chinese M&A deals, while being important, have however
attracted less attention. This may be due to the recent trend of consolidations on the domestic
banking sector (2006-now) and difficulties in collecting data for Chinese banks. Besides, the
results found in industrial economies may not be similar in China because of the different industry
structure and regulations (Cybo-Ottone and Murgia, 2000).
1 Standard Poor’s: Diverging credit quality could result in varying degrees of resilience for the top 50 banks, China’s Top 50 Banks, September 2013. 2 The Chinese Banker, volume 2, 2013.
3
However, such an analysis of the Chinese experience is important for a number of reasons.
China has undoubtedly enormous economic impacts on the world. National GDP ranked number
two, and the annual GDP growth rate was 7.7% for 20133. Unlike the western markets, regulated
degrees of the most important and profitable industries in China, such as energy, communication
and finance, are extremely soaring. As a result of heavy regulations, banks have become the main
active players that dominate the financial industry. The high-inefficiency level caused by the lack
of competition of Chinese banks makes it attractive for potential acquirers to enter the market and
process consolidations (Berger et al., 2009). Whatever past experience is available would be useful
for players who are planning to drive a consolidation deal or campaign. To this aspect, experiences
from developed countries cannot be automatically applied to the Chinese environment where
regulations are much more restrict.
On the other hand, Andrade, Michell and Stafford (2001) propose that mergers and acquisitions
come in waves and concentrate in one specific industry, which are mainly caused by unexpected
industry-level shocks. This argument makes the research years from 2006 to 2013 become
crucially relevant. Within the sample period, occasional financial crisis occurred in 2008 and swept
across all around the world. Almost every active economy struggled with sovereign debt crisis,
weakened banking industries, low-consumption demands and high-unemployment rates. This
unexpected shock may accelerate the restructuring pace of the Chinese banking industry. Besides
the crisis, the domestic economic transformation welcomes the second phase where the emphasis
has shifted from partial privatization to excess capacity elimination. Foreign banks have more
freedom on the mainland market to open up new branches and merge with domestic banks. Hence,
domestic banks may choose consolidations to compete efficiently under the ailing economy.
This paper studies 82 completed mergers and acquisitions occurred in the Chinese banking
sector over 2006-2013. By means of event study methodology, the paper studies wealth creations
from M&As in a relatively short period (three months before the announcements and one month
after). Later on, regulatory arbitrage is examined by comparing excess returns between domestic
deals and foreign deals. The same methodology is applied to examine size effects by comparing
excess returns between large deals and small deals. Multivariate regressions regressing possible
3 Source: The National Bureau of Statistics of China
4
determinants on excess returns are conducted to explore what operating factors explain wealth
effects. Characteristics of banks are measured at various aspects: profitability, cost efficiency,
credit risk, liquidity risks, size, change in size and capital reserves. Performances of post-merger
banks are not examined in this paper due to the limitation of the data availability.
Two recent papers analyze minority-state takeovers in the partial privatization process of the
Chinese state-owned banks. Berger et al. (2009) apply a dynamic analysis on 38 Chinese banks
during 1994-2003, the results show that state-owned banks are the least efficient and foreign banks
are the most efficient. Taking minority foreign ownership of the state-owned Chinese banks will
improve ex-post performances significantly. Following the same approach, Lin and Zhang (2009)
analyze bank ownership reforms in China involving with 60 banks over 1997-2004. However, the
authors fail to find evidence that banks which are undergoing a foreign acquisition or public listing
gain performance improvements after ownership changes, which may be caused by fewer subsidies
from the government following ownership changes.
This paper finds favorable evidence for mergers and acquisitions in Chinese banking sector from
the view of shareholders. The findings suggest slight positive excess returns surrounding the
announcement date for both targets and acquirers, but the average excess returns for targets around
the announcement day [t-1, t+1] is -0.26%. An enormous run-up effect that 70% of excess returns
for the window [t-30, t+1] is achieved within one month prior to the announcement date indicating
the existence of information leaking in the Chinese market. No additional-excess returns are gained
in the post-announcement period for both acquirers and targets. As for determinants for value-
creation performances in M&As, engaging banks with higher profitability, cost efficiency, growth
rate, larger capital reserves and size appear to experience robust positive excess returns. Whereas,
credit risks negatively affect value-creation performances. The influence of liquidity risk on excess
returns is ambiguous.
The rest of the paper is organized as follows. Section 2 is a literature review on mergers and
acquisitions in the financial industry. Section 3 extends the review with the history of Chinese
banking industry. Section 4 describes the data sources and presents summary descriptive statistics.
Section 5 deals with the analysis and discussion based on the empirical result of the event studies.
5
Section 6 presents an extended discussion and analysis based on the multivariate regressions. And
section 7 concludes.
2. Literature review
This section reviews relevant literatures from two aspects: (1) Section 2.1 provides empirical
papers relating to various economic theories to explain why banks merge, such as shareholder
value maximization, performance improvements, product- and geographic diversification,
managerial incentives and governance regulations. (2) Section 2.2 goes through studies analyzing
cases in the Asian banking industry after the Crisis in 1997 to see the effects of M&As in
developing countries.
2.1 Why do banks merge?
Why do banks merge? Economic theory has provided considerable possible explanations.
Through consolidations, post-merger firms could achieve economies of scale and other synergies;
gain larger market powers, and perhaps form monopolies and oligopolies, therefore, become too-
big-to-fail (TBTF) corporations. Besides efficiency-related theory, relaxing of market disciplines
and self-serving attempts of managers could also make consolidations occur. Among all literatures
studying the reason why corporations merge, Mitchell and Mulherin (1996) build their model
based on a duplicating empirical feature: mergers come in wave, and are strongly clustered by
industry. This feature suggests that mergers might occur as reactions to unexpected shocks on
industry structure, such as an eruption of the financial crisis or an introduction of a new discipline.
Empirically, the American banking industry witnessed an unprecedented merger wave in twenty
century after the introduction of the Riegle-Neal Interstate Banking and Branching Efficiency Act4
4 Riegle-Neal Interstate Banking and Branching Efficiency Act allowed U.S. banks to branch interstate by consolidating out-of-state bank subsidiaries into a branch network and/or by acquiring banks of individual branches of banks through mergers or acquisitions

6
(Cornett, McNutt, & Tehranian, 2006). European financial markets experienced an M&A upsurge
after the introduction of the Euro (Huizinga, Nelissen, & Vennet, 2001).
2.1.1 Value creations and post-merger performances in America before 2000
The pervasive view regarding value creations generated from M&As in the 1980s and 1990s is
that, on average, target’s stockholders gained robust excess returns whereas acquirer’s
shareholders experience negative excess returns (Berger et al. 1999, Houston et al., 2001). Hudgins
and Seifert (1996) find that, in mergers and acquisitions, only targets receive abnormal gains, and
acquirers do not earn or lose at the announcement date. Pilloff (1996) analyzes 48 American
mergers involving publicly traded banking institutions over 1982-1991. The findings indicate that
performances and consolidated abnormal returns appear to have no changes on average, in which
performances are measured by profitability, cost efficiency, financial condition, investment
strategy, and funding methods. However, results from related literature published since 2000
diverge from the pre-2000 consensus. In general, the recent studies suggest that both American
and European post-merger banks experienced efficiency improvements, but only European banks
gained value enhancements from M&As.
2.1.2 Value creations and post-merger performances in America after 2000
Among literatures that analyze value creations from M&As in America after 2000, Knapp et al.
(2005) find negative excess returns for shareholders in 80 large consolidations over 1980-1990.
Becher and Campbell (2005) examine 443 mergers between publicly traded banks announced
during the 1990s. The findings indicate that mergers involving a high degree of branch overlaps
experience significant wealth gains around the announcement in the pre-deregulation 1990s.
However, consolidated banks realize significant losses in the post-deregulation 1990s. The results
are in line with the hypothesis that an economic shock can materially accelerate the restructuring
of the industry and efficiently reallocate industry assets through M&As. In addition, Delong (2001)
notes that mergers focusing on both activity and geography enhance shareholder value by around

7
3% whereas the other types do not create value. In another paper, DeLong and DeYoung (2007)
find that positive excess returns to M&A announcements dissipate rather quickly, in general,
mergers did not improve post-merger financial performances, and investors are unable to
accurately predict the future performance of the consolidated bank.
Some literatures provide compelling evidences of efficiency improvements in American M&As.
Knapp et al. (2005) find profitability, credit quality and fee incomes of post-merger banks are
below the average level of the industry. Hagendorff and Keasey (2009) use accounting data to
compare M&As in American and European financial markets and find that post-merger banks
witness no improvements in profitability and cost efficiency although the American banks tend to
focus on revenue generation. However, Cornett et al. (2006) note that industry-adjusted operating
performances of merged banks experience significant increases after consolidations, as
consequences of both revenue enhancements and cost reduction activities. Moreover, the authors
also document a size effect, in that large bank mergers produce greater financial performance gains
than small bank mergers.
2.1.3 Value creations and post-merger performances in Europe after 2000
Empirical results in Europe present a more promising picture of banking mergers and
acquisitions. For wealth effects in European M&As, Beitel et al. (2004) note that more than 60%
of all 98 transactions occurred over 1985-2000 in Europe create value. The value creations for
target shareholders, as well as the improvements in financial performances, mainly result from
enrichments in management skills. Resti and Siciliano (2001) find positive shareholder wealth
effects on M&As by applying event study analysis of Italian bank mergers over 1992 and 1997.
Campa and Hernando (2005) analyze 66 successful mergers and acquisitions occurred between
1998 and 2002 in European financial industry. The authors find that target firms appear to obtain
positive excess returns while acquiring banks appear to suffer losses. Besides, the results indicate
that the wealth changes are mostly realized around the announcement days, and only 5% of the
wealth effect is generated one month prior to the announcement. Cybo-Ottone and Murgia (2000)
study 54 relatively large European mergers (assets in excess of $100 billion) occurred in banks,

8
insurance companies and security firms over 1988-1997. The results show positive abnormal
returns associated with the announcement of mergers between banks and bank to insurance deals.
A large volume of literatures provides empirical evidence of efficiency improvements in
European mergers and acquisitions. Huizinga et al. (2001) analyze consolidated banks’
performances after introducing the Euro. Cost efficiency of post-merger banks on average rises,
whereas, profitability decreases for large banks and increases for small banks. Fritsch (2007)
studies the long-term effects on targets involved with 84 M&A deals in 17 Central and Eastern
European countries. Applying median difference tests, the author finds that post-merger
corporations realize gains in profitability and cost efficiency compared to the ex-ante phase,
though the absolute values of profitability and cost-efficiency of post-merger bank in three years
after the acquisitions do not differ from those domestic banks without mergers and acquisitions.
Other literatures focusing on European financial M&As find performance improvements in
profitability and/or cost efficiency in the post-merger phase (Diaz et al, 2004, Campa and
Hernando, 2005, Altunbas and Marques, 2008).
The distinct results on M&As’ performances between America and Europe have attracted
attentions from many researchers. DeLong and DeYoung (2007) analyze the long-run financial
performances of 216 M&As in American which were announced and completed between 1987
and 1999. The authors observe that the short-run post-merger financial performances, as well as
the long-run post-merger financial performances are positively related to the numbers of M&As
that took place in the years prior to the deal announcements. The spillover knowledge in M&As,
characterized as “learning-by-observing”, is consistent with the generally moderate post-merger
performances in America during the 1990s and the gradually improved financial performances in
Europe during the 2000s. Besides the “learning-by-observing”, several literatures, such as Cybo-
Ottone and Murgia (2000), explain the different results between European market and American
market stemming from the differences in industry structures and regulations. Although some recent
studies suggest that consolidations may enhance revenues, Amel et al. (2004) argue that the gains
appear limited in magnitude, and vary by countries, industries and deals analyzed.
9
2.1.4 Other possible motivations for mergers and acquisitions
The failure of finding strong evidence of performance improvements in the post-merger period
has encouraged researchers to investigate alternative explanations behind the depressed results,
paying particular attention to alternative diversification, managerial and governance motives.
Greater product- and geographical diversification have accompanied the consolidation wave of
the financial sector. Conglomerates might have greater diversification to perform the tradeoff
between risks and expected returns better. Cornett et al. (2006) observe the merger wave in
American banking industry after introducing the Riegle-Neal Act. The authors find that activity-
focusing mergers realize greater performance gains than activity-diversifying mergers, and
geographical-focusing mergers perform better than geographical-diversifying mergers after
consolidations. A similar conclusion is documented in Cornett et al. (2003) that focusing
acquisitions realize higher excess returns than diversified acquisitions for acquirers. Lepetit et al.
(2006) note that banks engaged in cross-product diversification experience positive and significant
market reactions. Allen and Jagtiani (2000) find that nonbank activities, such as insurance and
securities, reduce the overall risk to the bank but increase systematic market risk. However,
diversification benefits are not sufficiently large to justify expanding bank powers into nonbank
securities and insurance underwriting activities. Whereas, Estrella (2001) observes that banks and
insurance companies have some important common factors that are highly correlated, and this
suggests that the corresponding mergers may have no favorable diversification outcomes.
Empirical results for geographic diversification are ambiguous. Berger et al. (2001) fail to find
evidence in cost efficiency improvements in cross-border mergers and acquisitions. However,
Elsas et al. (2010) document the improvements in profit efficiency and accounting returns for
cross-border deals in nine countries over 1996-2003. Altunbas and Marques (2008) focus on
influences of European banks’ strategic similarities on post-merger performances. The results
suggest that it is quite costly for domestic acquirers to integrate dissimilar institutions in terms of
loan portfolios, profitability and cost efficiency level, and size strategies. For cross-border mergers,
diversified effects on different loan and credit strategies between acquirers and targets appear to
conduct better post-merger performances, whereas dissimilar capital and cost structures tend to
negatively affect performances of consolidated corporations.

10
Managers may pursue their own objections ahead of shareholders’ interests. Self-serving
managers may want consolidations for empire building since their executive compensations are
based on firm sizes (Rosen, 2004). A positive relationship between total post-merger CEO
compensation and anticipated gains from mergers surrounding the announcement date is found in
the American large consolidation deals (Anderson, Becher, & Campbell, 2004). Meanwhile,
managerial hubris associated with firm sizes is likely to drive a higher probability of taking
mergers, as well as damage shareholder values in consolidations. Malmendier and Tate (2008) find
that the probability of making an acquisition is 65% higher for overconfident CEOs than non-
overconfident CEOs. Meanwhile, the market reaction at merger announcement made by over-
confident CEOs is significantly more negative than for non-overconfident CEOs. Moeller et al.
(2004) observe that excess returns for small firms exceeds excess returns for large firms by 2.24%
around the announcement date, and large firms offer much more acquisition premiums than small
firms and enter acquisitions with negative synergy gains. The findings are in line with managerial
hubris. Similar results are documented in Schmid and Walter (2009), Brewer and Jagtiani (2007)
and Cybo-Ottone and Murgia (2000).
Although merging decisions are mainly motivated to maximize shareholder values, in practice,
governance regulations often affect consolidation occurrences more directly. Governments tend to
limit large mergers and acquisitions for avoiding over-concentrated markets and too-big-to-fail
(TBTF) institutions5. Once a bank develops to be mega-large and viewed as TBTF, it may have
the opportunity to exploit safety net subsidies (Mishkin, 2006). Shull and Hanweck (2001) observe
that the ten largest American banks pay less for funds than smaller banks and operate with lower
capitalization rates, which suggest that these banks enjoy advantages of TBTF implicit guarantees.
Penas and Unal (2004) find that the adjusted returns of merging banks’ bonds are positive and
significant across pre-merger and at-the-announcement period, which are primarily achieved from
gains by forming TBTF institutions. In contrast, consolidations are encouraged by the government
when the economy is shirking, as Malaysia in 1998 (Sufian, 2004). However, Hadlock et al. (1999)
find little evidence that governance is related to the probability of being acquired.
5 Trends in international migration annual report, OECD, 2007

11
Besides the economic situation, regulations and supervisions may also affect M&A decisions.
Regulatory arbitrage arises with cross-border consolidations when banks tend to change their
regulatory environment. There are two possible consequences of regulatory arbitrage for involved
banks: on the one hand, banks engaged in cross-border mergers can maximize shareholder values
and improve capital allocations through pursuing profitable investment opportunities which are
not allowed in their home country because of certain high risks. On the other hand, banks may
acquire targets in weakly regulated districts to invest in excessive risk-taking projects which have
a potential threat on shareholder values. Existing researches have shown that tough regulatory
restrictions on bank activities and barriers to foreign entry hurt banking sector performances (Barth,
Caprio, & Levine, 2006). In a recent paper, Houston et al. (2012) find a harmful “race to the
bottom” characteristic in cash flows that international bank tend to predominantly transfer funds
from countries with strict regulations to countries with fewer supervisions. The results indicate the
existence of regulatory arbitrage. In a relating paper, Ongena et al. (2013) note that banks from
countries with strict regulations on bank activities and capital reserve requirements appear to make
riskier loans abroad, which is consistent with the race-to-the-bottom view. A consistent result is
found in Fritsch (2007). The findings indicate that large acquirers from western countries with
restricted regulations intend to acquire targets in countries with a high GDP growth rate, as well
as low corporate income tax rates.
The effects of regulation arbitrage on cross-border mergers’ post-merger performances are
ambiguous in empirical works. Karolyi and Taboada (2014) analyze a sample of 916 majority
cross-border acquisitions combined with 7297 domestic consolidations announced between 1995
and 2012. The results show that target banks’ excess returns are significantly correlated with
differences between targets and acquirers in the quality of bank regulations. Targets realize higher
abnormal returns when acquirers are from countries with more restrictions on bank activities,
stricter capital requirements, strong private monitoring, and better regulatory quality. In contrast,
Hudgins and Seifert (1996) document that there is no significant difference in abnormal returns
based on whether the acquirer is domestic or foreign. Additionally, some papers hold the
indistinctive view that banks involved with cross-border deals may pursue the same benefits
associated with domestic deals, such as economics of scale and scope, rises in efficiency and

12
diversification between risks and revenues (Cornett and Tehranian, 1992; Berger et al., 1993;
Pilloff and Santomero, 1998).
2.1.5 Determinants of post-merger performances
Some papers link the shareholder gains with firm-specific factors to explain determinants of
gains in post-merger performances. Olson and Pagano (2005) identify that shareholder gains and
long-term performances are significantly determined by the acquirers’ sustainable growth rate
prior to the acquisition, post-acquisition changes in growth rate, and dividend payout. Fritsch
(2007) finds that higher profitability and cost efficiency of acquirers tend to strictly improve post-
merger performances of consolidated corporations. And loan growth after acquisitions is mainly
driven by country-specific factors. Penas and Unal (2004) analyze bond returns and bond credit
spreads around the announcements of mergers over 1991-1998. The results show that bondholders
of acquirers and targets gain significant positive bond returns, which is caused by the reductions
of cost of debts in the post-merger banks. The positive and statistically significant relation between
announcement-month bond and equity returns indicates that bank mergers do no shift wealth from
shareholders to bondholders. Focarelli et al. (2002) separately study 135 mergers and 66
acquisitions occurred in Italian banking industry between 1984 and 1996. By the means of
predicting pro forma balance sheet by consolidating the balance sheet of the banks involved in the
mergers, the authors find that mergers seek to improve incomes from providing a wider range of
services, but the improvements are offset by higher labor costs. After M&As, acquisitions aim to
restructure the loan portfolios of the target banks, and as a result, consolidated banks realize higher
profits.
2.2 Where are developing countries?
Unlike industrial economies, the consolidation pace of the financial industry is slow in
developing countries, as a result of heavy supervisions in the 1990s. However, this pace has been
accelerated with the development in economy, deepness in globalization and releases of
13
regulations. The first consolidation wave came in 1997 after the Asian financial crisis. From the
aspect of value creations, Crouzille and Lepetit (2008) analyze stock market reactions to the
announcement of bank M&As in eight East Asian countries over the 1997-2003 period. The results
show that engaged banks realize significantly negative excess returns during the crisis period
(1997-2000). The negative relations are mostly found in less mature banking systems which are
mainly led by local governments. Goddard et al. (2012) study 132 M&As involving banks in
emerging markets in Asia and Latin America from 1998 to 2009. The authors find that M&As
create shareholder values for targets. On the other hand, acquirers benefit from geographical
diversification and underperforming targets.
Empirical results on post-merger performances show favorable evidence for M&As in
developing economies. Sufian (2004) find that post-merger banks’ average efficiency level is
higher than the pre-merger period for Malaysia banks over 1998-2003, despite the fact that these
banks’ overall efficiency deteriorates significantly during the consolidation process. A size effect
is documented that banks with small or medium size benefit the most from M&As while the post-
merger large banks are still suffering from scale inefficiency. Ariff and Can (2009) study post-
restructured outcomes in banks which received restructuring subsidies from the IMF after the
Asian crisis. The authors find that East Asian banking efficiency improves in the post-IMF period,
but the magnitude of the recovery is limited to their pre-IMF level. In general, the restructured
banks are not significantly more efficient than their un-restructured counterparts. Perhaps more
importantly, they observe that bank efficiency is significantly affected by the measures of
restructuring. Bank recapitalization or partial privatization generates efficiency gains in short-run
period. Mergers and acquisitions, in contrast, experience efficiency losses in a short term. The
positive but insignificant improvements in foreign ownership entries may suggest that the potential
synergies in cross-section deals may accrue over a longer period that they do not test. An Indian
case provides favorable evidence for M&As that the market share of post-merger banks increases
(Goyal & Joshi, 2011).
Unfortunately, literature on Chinese mergers and acquisitions in the banking industry is
extremely scarce. Most relating studies focus on bank ownership reforms and corresponding
performances, because partial privatization associated with taking on minority foreign ownership

14
dominates the first phase of the Chinese banking transformation started from 1990s. Berger et al.
(2009) apply a dynamic analysis on 38 Chinese banks during 1994-2003, and they find that state-
owned banks are the least efficient and foreign banks are the most efficient. Taking minority
foreign ownership of the state-owned Chinese banks will improve ex-post performances
significantly. Following the same approach, Lin and Zhang (2009) analyze bank ownership
reforms involving with 60 banks over 1997-2004. They fail to find evidence that banks that
undergo a foreign acquisition or public listing gain performance improvements after ownership
changes, which may be caused by fewer subsidies from the government following acquisition or a
public listing. A selection effect is observed that, in ex-ante ownership-change phase, the Chinese
banks that are partially acquired by foreign firms or those that go public significantly outperform
compared to those that do not take ownership reforms. The findings suggest that the government
sells the equity of better banks first to attract foreign investors, which may help the process of
ownership reforms in China.
3. A brief history of Chinese banking industry
With the development of the economy, the modern Chinese banking system experienced three
stages in transformations. In the pre-1990s, the central government heavily controlled the banking
sector, and the state-owned banks were the only players on the financial market. During the 1990s
until 2001 when China entered the WTO, the market allowed for competition, resulting in the
establishments of city commercial banks and rural development banks. After 2001, the emphasis
in economic transformation focused on ownership reforms for state-owned banks and operating
allowances for foreign banks. However, the reform and openness of Chinese banking system are,
even though progressive, still slow.
Following the former Soviet Union model 6 , the Chinese socialist banking system was
established in the late 1940s. The central bank named People’s Bank of China (PBOC) was set up
6 Soviet Union Banking Model: there were only one central bank and several mono-banks. The central bank was the only dominant in the financial system which were in charge of making economic policies, issuing currencies, depositing, and granting of loans etc.. Mono-banks were ultimately under the orders of the same central authorities as the central bank, and allowed to operate in the assigned field.

15
in 1948 according to the mono-bank model. It played the double roles of both central and
commercial banks before 1966. During the Cultural Revolution, PBOC was temporarily stripped
of its currency issues and monetary control functions. Lately, it regained these obligations. China
began its first financial system reform in 1978. PBOC was split into four big state-owned banks,
Bank of China (BOC); China Construction Bank (CCB); Agricultural Bank of China (ABC) and
Industrial and Commercial Bank of China (ICBC), known as the Big Four nowadays. They were
initially restricted to only one sector of the economy as indicated in their names. The Big Four
started to compete after the releases of restrictions in 1985. Early or later, twelve national
shareholding commercial banks were set up to meet the ever growing demands in financial services.
During the period from 1990 until 2001, the Chinese banking system witnessed its second-round
reform. To solve the problematic loans that banks lent to state-owned enterprises, three policy
banks were set up in 1994 to play the role of policy lender. Later on, the Minister of Finance issued
32.6 billion Chinese yuans of 30-year government special bonds to recapitalize the Big Four. In
1995, according to the central bank law, urban and rural credit cooperatives were issued aiming at
encouraging establishments of city-level commercial banks in China. However, those city
commercial banks were still conducted by the state. At the same time, Chinese government
allowed foreign investors to acquire a quite small portion of equities of state-owned banks. As a
result of the first minority-shares takeovers in the Chinese banking sector, China Everbright bank
became the first domestic joint-equity bank.
Following the promised agenda after China entered the WTO, the government was expected to
release pegged interest rate, levy fair tax rate among bank players, reduce restrictions on ownership
takeovers and M&As, and greater freedom of operational and geographical scope in the Chinese
banking industry. However, these restrictions are still working since the government deemed that
it was not the best time for the domestic banking sector to open up perfectly. Hence, foreign banks
that wanted to enter the Chinese banking market slowed down and tried to look for solutions
through mergers and acquisitions. Meanwhile, a growing number of Chinese banks began to list
on the stock markets to finance its growing investments. In order to supervise the economic
reforming progresses, the Chinese government established the Chinese Banking Regulatory
Commission (CBRC) in 2003. In the same year, CBRC upgraded foreign investment limitations
16
up to 25% of any domestic bank, as well as ownership allowance up to 20% for personal investors,
subject to regulatory approval. Under the encouragements associated with limitations on foreign
banks’ operations in the mainland markets, many foreign banks started to purchase the stake of
healthy and promising domestic commercial banks. Due to the potential credit losses in the
Chinese banking industry and the non-performing loans that banks lent to the real-estate sector,
the Chinese Securities Regulatory Commission (CSRC) stopped approving domestic banks’ IPO
requests from year 2007 till now. This suspension of IPOs has slowed down the pace of M&As’
wave in the Chinese banking sector in recent years to some extent.
4. Merger and bank data
This section describes the data sources and presents summary descriptive statistics for the event
study analysis and multivariate regressions. The paper identifies 82 successful M&As involving
41 banks in the Chinese financial market. The relatively small size reflects the underdevelopment
of stock markets in the world largest nation. Many mergers and acquisitions cannot be examined
using event study methodology because the involved banks are not listed on the stock markets.
Some widely used criteria on mergers’ sample selections are relaxed in order to realize a sample
size sufficiently large to allow statistical analysis, such as investigating cases where acquirers take
full controls of targets, or where both targets and acquirers are listed banks.
The principal data sources which are eligible for inclusion of mergers and acquisitions in the
sample are Datastream and Zephyr. Daily stock prices adjusted for dividends from listed banks are
collected from Datastream. Meanwhile, Zephyr offers information about M&As in the Chinese
banking industry with the target and acquirer’s name, the announcement date, the completion date
and the amount of the deal. The deal value is defined by Zephyr as the consideration paid for the
actual stake acquired, excluding fees and expenses. Transactions are selected if they occurred in
China with the announcement date between 2006 and 2013. More restrictions are that (1) the
transaction is completed before the 31st December 2013, (2) either the target or the acquirer is a
Chinese bank, and (3) at least the acquirer is a public firm listed on the local stock exchange market.
17
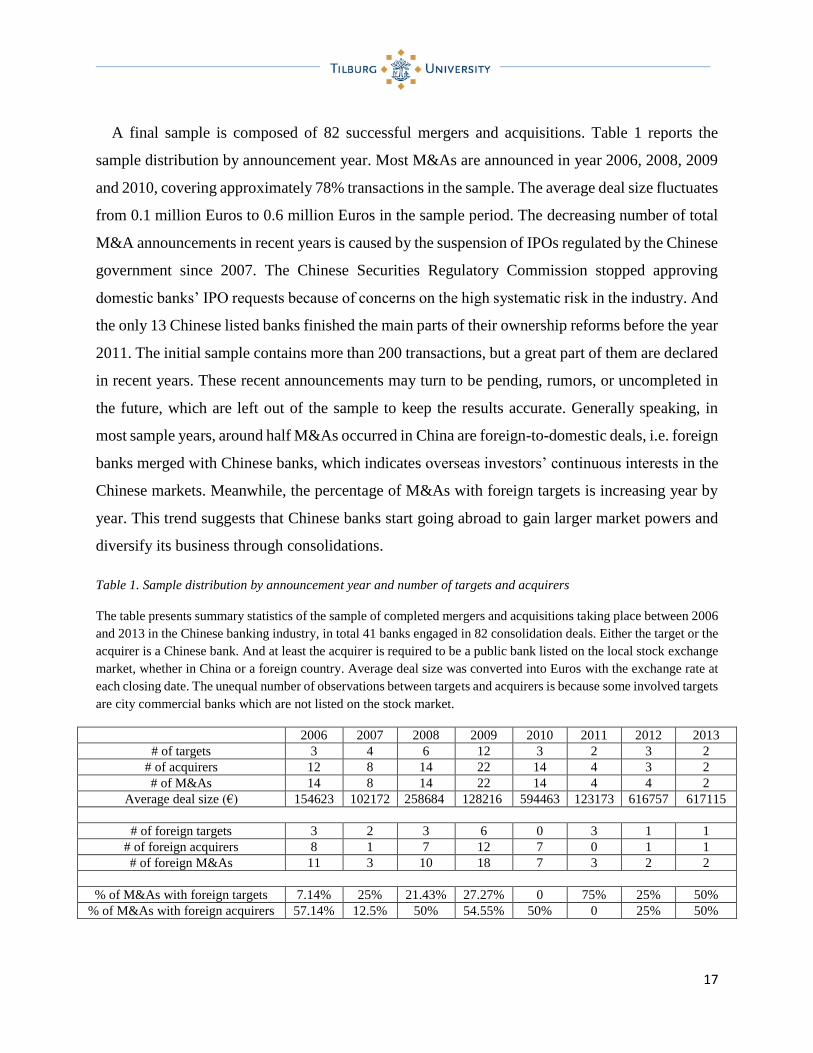
A final sample is composed of 82 successful mergers and acquisitions. Table 1 reports the
sample distribution by announcement year. Most M&As are announced in year 2006, 2008, 2009
and 2010, covering approximately 78% transactions in the sample. The average deal size fluctuates
from 0.1 million Euros to 0.6 million Euros in the sample period. The decreasing number of total
M&A announcements in recent years is caused by the suspension of IPOs regulated by the Chinese
government since 2007. The Chinese Securities Regulatory Commission stopped approving
domestic banks’ IPO requests because of concerns on the high systematic risk in the industry. And
the only 13 Chinese listed banks finished the main parts of their ownership reforms before the year
2011. The initial sample contains more than 200 transactions, but a great part of them are declared
in recent years. These recent announcements may turn to be pending, rumors, or uncompleted in
the future, which are left out of the sample to keep the results accurate. Generally speaking, in
most sample years, around half M&As occurred in China are foreign-to-domestic deals, i.e. foreign
banks merged with Chinese banks, which indicates overseas investors’ continuous interests in the
Chinese markets. Meanwhile, the percentage of M&As with foreign targets is increasing year by
year. This trend suggests that Chinese banks start going abroad to gain larger market powers and
diversify its business through consolidations.
Table 1. Sample distribution by announcement year and number of targets and acquirers
The table presents summary statistics of the sample of completed mergers and acquisitions taking place between 2006
and 2013 in the Chinese banking industry, in total 41 banks engaged in 82 consolidation deals. Either the target or the
acquirer is a Chinese bank. And at least the acquirer is required to be a public bank listed on the local stock exchange
market, whether in China or a foreign country. Average deal size was converted into Euros with the exchange rate at
each closing date. The unequal number of observations between targets and acquirers is because some involved targets
are city commercial banks which are not listed on the stock market.
2006 2007 2008 2009 2010 2011 2012 2013
# of targets 3 4 6 12 3 2 3 2
# of acquirers 12 8 14 22 14 4 3 2
# of M&As 14 8 14 22 14 4 4 2
Average deal size (€) 154623 102172 258684 128216 594463 123173 616757 617115
# of foreign targets 3 2 3 6 0 3 1 1
# of foreign acquirers 8 1 7 12 7 0 1 1
# of foreign M&As 11 3 10 18 7 3 2 2
% of M&As with foreign targets 7.14% 25% 21.43% 27.27% 0 75% 25% 50%
% of M&As with foreign acquirers 57.14% 12.5% 50% 54.55% 50% 0 25% 50%

18
The data for multivariate regressions come from two sources: excess returns for each event
window which are estimated using event studies, and balance-sheet-based indicators taken from
Bankscope. Profitability is measured by return on average equities (ROAE). Operating cost,
defined as operating cost over gross margin, captures cost efficiency. Following the motivations
proposed by Forcarelli et al. (2002), loan losses and interbank ratio measure credit risk and
liquidity risk respectively. Two indicators are designed to capture size effects: total assets and
change in size. Total assets indicate how large the involved bank is compared to other banks in the
industry. As for change in size, calculated as total assets in the announcement year (t) divided by
total assets in the year (t-1), exhibits how fast the involved bank is growing. Lastly, the capital
ratio measures how sufficient the involved bank is in capital reserves. The descriptive statistics of
the sample are presented in table 2 for both targets and acquirers before M&As.
Table 2.Descriptive statistics of balance-sheet-based indicators of target and acquirer banks before M&As
The table presents summary statistics on ex-ante merger announcement balance-sheet-based indicators for 41 listed
banks engaged in mergers and acquisitions in my sample. These balance-sheet-indicators include: total assets, change
in size, return on average equity, loan losses, interbank ratio, operating cost and capital ratio. Change in size is
calculated as total asset one year prior to the announcement over total asset in the year when announcement is declared.
Loan losses are defined as loan losses divided by total lending. Operating cost is operating cost divided by gross
margin. All the other indicators follow the definitions of Bankscope. Total assets are converted into Euros and in the
unit of millions.
Ex-ante characteristics of target banks
Mean 25th percentile Median 75th percentile
Total asset (million €) 252806 108426 229976 229976
Change in size 1.26 1.22 1.28 1.28
Return on average equity 20.348 15.52 19.01 28.35
Loan losses 2.27 2.13 2.47 2.49
Interbank ratio 207.29 152.14 203.82 247051
Operating cost 0.87 0.59 0.86 1.15
Capital ratio 11.987 11.34 11.34 13.34
Ex-ante characteristics of acquirer banks
Mean 25th percentile Median 75th percentile
Total asset (million €) 1160493 179471 1188879 1894157
Change in size 1.17 1.028 1.209 1.236
Return on average equity 7.23 8.49 16.14 20.82
Loan losses 2.06 1.27 2.46 2.79
Interbank ratio 153.61 46.60 129.45 246.86
Operating cost 0.64 0.53 0.65 0.83
Capital reserves 13.93 12.27 13.09 15.00

19
For banks involved in consolidations, targets were more profitable and grew faster than
acquirers on average prior to announcements. Whereas, acquirers outperformed than targets on
cost efficiency, credit risk and liquidity risk managements. As expected, the acquirers were around
4.5 times the size of targets on average, which may partially explain the more sufficient capital
reserves in acquirers than targets. The relatively higher growth rates and better performances in
profitability of glamour banks made them easier become targets on the merger markets. Value
banks are frequently larger banks with abundant capital reserves, which have better managerial
skills in cost efficiency, credit and liquidity risks, and tend to become acquirers in consolidations.
Similar results are concluded in Wheelock and Wilson (2000), who state that banks with low
capitalizations, high loan losses ratios, poor-quality loan portfolios, low earnings, and inefficient
managerial skills reflected in measures of cost inefficiency have a high probability to be acquired.
The selected sample has some limitations. As documented above, the size of the sample is
restricted because of the relative underdeveloped stock market in China. Although some widely
used criteria in M&A studies have been relaxed to make the sample exercisable, the asymmetric
distribution, associated with a relatively small size, may lead toward biases in estimating excess
returns. Data availability makes it impossible to observe post-merger performances in terms of
efficiency improvements. Moreover, focusing on the Chinese financial market may weaken the
findings on foreign deals because of limitations on observations.
5. Shareholder value creations in banking M&As
This section consists of two parts. The first part explains the settings for event studies and reports
results of excess returns for both targets and acquirers within different event windows. The second
part examines whether excess returns vary by types of mergers. Two subsamples are constructed,
which focus on domestic deals versus foreign deals and large deals versus small deals. Excess
returns, the differences between groups and their corresponding are reported.

20
5.1 The Event studies model and value creations in banking M&As
Under the semi-strong efficient markets hypothesis, stocks prices react positively (negatively)
to all publicly available information (e.g. announcements on mergers) that notified investors
expect will increase (decrease) long-run firm value. Event studies around the announcement date
(t) of mergers and acquisitions are performed here in order to observe stock market reactions facing
consolidations. Excess returns for targets and acquirers are analyzed through three distinct periods
around the announcement date: pre-announcement period (windows [t-90, t-1] and [t-30, t-1]),
announcement period (windows [t-1, t+1] and [t-30, t+1]), post-announcement period (window [t-
1, t+30]) and a robustness indicator that covers an extended event window ([t-30, t+30]). Excess
returns are defined as the difference between achieved shareholder returns of the involved banks
during the event window minus the expected normal returns as if these banks did not consolidate.
An estimation window of 120 days is taken from 220 days to 100 days prior to the announcement
to estimate expected returns using CAPM. Long-term effects are not taken into consideration since
it is believed that stock prices could be affected by too many other factors in a relatively longer
period besides M&A announcements. A further analysis is designed to measure whether there are
different performances between M&A types and deal sizes.
Table 3. Differences in Average Excess Returns by Window Length
The table reports means, medians, and percentages of negative values of excess returns by different window length.
Excess returns are calculated as the difference between returns after mergers and acquisitions and normal returns if
without M&As, measured using the CAPM. Symmetric risk indicator is calculated with OLS regressions over the
estimation window [t-220, t-100].
CAARs Median CAARs % negative
Targets Acquirers Targets Acquirers Targets Acquirers
Pre-announcement a
(t-30,t-1) 0.60% -0.79% -1.24% -0.87% 65.2% 63.2%
(t-90,t-1) 1.17% 0,48% 1.17% -1.44%* 39.1% 56.1%
Announcement a
(t-1,t+1) -0.26% 0.46% -0.14% 0.13% 52.2% 45.6%
(t-30,t+1) 0.85% 0.06% -0.72% -1.54%* 60.9% 57.9%
Post-announcement and the robustness indicator
(t-1,t+30) -3.53%** c -0.43% -1.75% -1.24% 60.9% 54.4%
(t-30,t+30) -3.36% c -1.24% -2.68% -4.19%* 60.9% 63.2%
- */**/*** denote significant at the 10%, 5% and 1%, reactively.

21
- An outlier is left out for these two windows. Excess returns for this transaction are respectively 0.51 and 1.32,
which are relatively too larger compared to the average reported in the table. The unusual results may be
caused by the selection of data. The target involved in this transaction is AIG finance (HONK KONG) limited,
which is not listed on the stock market. The stock prices of AIG are used instead.
The results of event studies on the whole sample are represented in table 3. Target companies
experience positive cumulative average excess returns surrounding the announcements of the
consolidations but a negative cumulative average excess return (-0.26%) around three days of
the announcement. Unlike Campa and Hernando (2005) which study European market and find a
tiny run-up effect, there is an enormous run-up effect that approximately 70% of positive excess
return in the window of [t-30, t+1] is realized in the period up to the day prior to the announcement
in the Chinese market. The existence of information leaking in the Chinese market may be a
potential reason behind this phenomenon. Under the circumstance of weak supervisions, it is easy
for financial consultants to access inside information. Therefore, they have incentives, and are
capable of taking arbitrages from M&A deals by buying in target firm stocks before the
announcement then selling it out on the announcement day since they believe that the market
usually gives positive reactions to the target firms in consolidations. The negative CAAR on [t-1,
t+1] may indicate that arbitragers dominate the market prices than individual investors. The
enormous amount of closing out the targets’ stocks lower the prices though many individual
investors buy in the targets on the announcement day. Confounding events may be another reason
for the enormous run-up effect. Stock prices may be affected by other confounding activities
happened in the event period, such as publications of annual reports. Notably, the cumulative
average excess return slowly decreases by 0.57% during sixty days prior to the announcement7,
but the difference is statistically insignificant. Overall, targets experience a negative cumulative
average return with the value of -3.36% in the window [t-30, t+30]. The massive negative CAAR
is mainly due to the sharp decreases in the post-announcement period. Due to the asymmetric
distribution of excess returns, medians are reported in table 3 to give a more comprehensive picture
of the results. The median excess returns tend to be smaller than the mean at each event window
7 The equality between the average excess returns for the window [t-90,t-1] and [t-30,t-1] fails to reject at any significant level, with a p-value of 0.7568.
22
in pre- and at- announcement period. However, the proportion of transactions experience negative
excess returns for targets strongly fluctuated from 39% to 65%, depending on the event window.
Unlike general results that are usually found in most literatures, acquirers experience slight
positive cumulative average excess returns of the order of 0.5% around the announcement except
the CAAR equals to -0.79% within the window [t-30, t-1]. The unusual negative cumulative
average excess return in one month prior to the announcement may also be due to information
leakages and arbitragers. Owing to the fact that irrational investments are more serious in China
compared to other developed economies, acquirers experience a positive average excess return on
the announcement day. Self-attributing, which continuous works on both arbitrageurs and
individual investors, makes misjudgments repeatedly happen.
The findings indicate that both targets and acquirers realize value creations from M&As in
China, and in general, shareholders of targets benefit more than shareholders of acquirers except
on the announcement day, which suggests that the M&As investigated in this paper can be regarded
as economically successful from the perspective of shareholders. The results of targets are in line
with most literatures, but inconsistent for acquirers. Andrade et al. (2001) analyze a comprehensive
sample totaling 8512 mergers between 1973 and 1998 in America. The results show positive
abnormal returns for targets but insignificant negative excess returns for acquirers. However, they
observed a 16% average abnormal return for targets around the announcement [t-1, t+1], which is
quite different from these findings. Campa and Hernando (2005) uncover that shareholder returns
to the target companies are positive on average upon the announcement of the transaction while
returns to shareholders of the acquiring companies are slightly negative in the European banking
industry over 1998-2002. Moreover, unlike the enormous run-up effect (70%) for targets in my
sample, they observe that most of this return is realized on the days surrounding the announcement,
with a small run-up effect up (around 5%) to three months prior to the announcement. This serious
information-leaking problem in Asian countries has been documented in previous literature
(Goddard et al., 2012).
The lack of statistical significance in table 3 might arise because of two reasons: the deal
characteristics and the small sample associated with asymmetric distributions. Deal characteristics
refer to that some mergers are minority-stake takeovers among the 82 deals in the sample, which
23
means that acquirers have less control power or even cannot control targets. It would be difficult
for the consolidated banks to minimizing operating costs by rationalizing the branch of networks,
improving management skills and achieving higher economies of scale. For this type of M&As,
investors may lower their expectations of post-merger performances on consolidated banks, and
forasmuch, passively react to the announcements on the stock market. The excess returns on
minority-stake takeovers would statistically be lower than majority-stake takeovers. Moreover,
average and median values substantially differ as a result of the highly asymmetric distribution of
excess returns, which jointly with a small sample size, may explain the lack of statistically
significance in most cases.
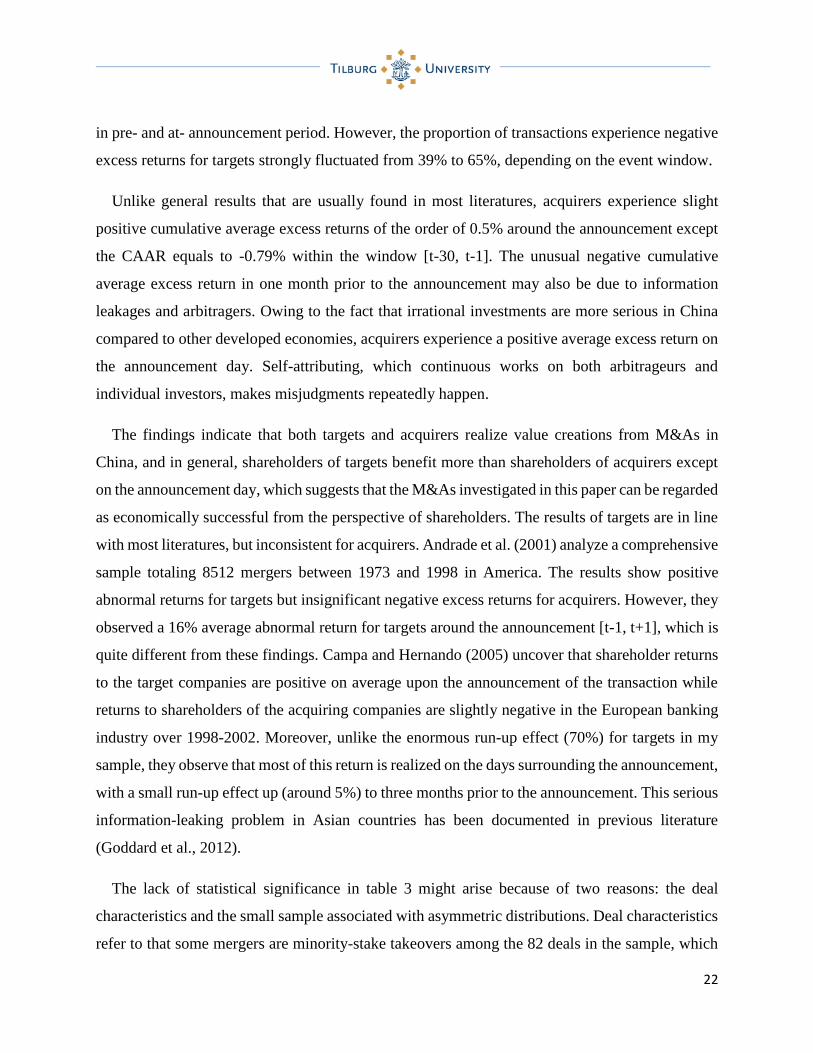
Another smaller sample is constructed where the acquisitions with minority-stake takeovers less
than 50% are left out, trying to eliminate the problem of deal characteristics. The new restriction
yields a smaller sample of 32 transactions. The result of value-weighted excess returns from the
smaller sample is reported in table 4. There are no separations between targets and acquirers
because of the limited observations (less than 30 if separated). Following the argument of M&A
study methodologies in Piloff and Santomero (1998), the value-weighted excess returns are used
instead of average excess returns to capture value creations in consolidations.
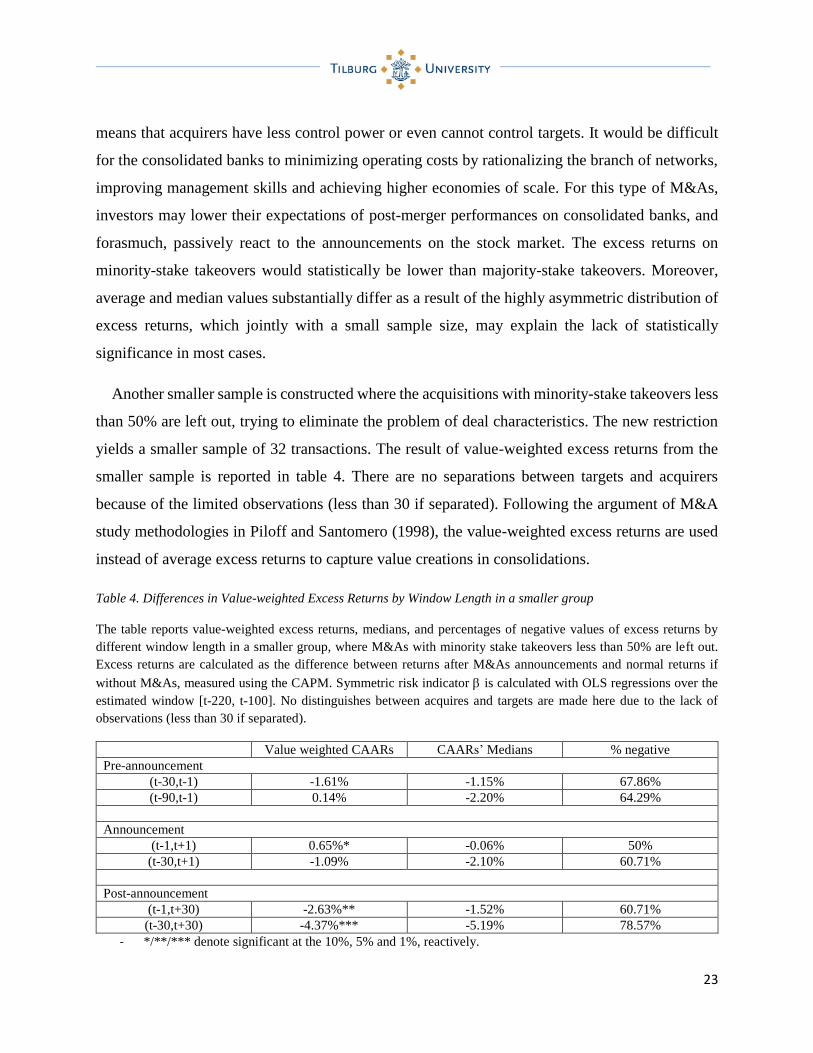
Table 4. Differences in Value-weighted Excess Returns by Window Length in a smaller group
The table reports value-weighted excess returns, medians, and percentages of negative values of excess returns by
different window length in a smaller group, where M&As with minority stake takeovers less than 50% are left out.
Excess returns are calculated as the difference between returns after M&As announcements and normal returns if
without M&As, measured using the CAPM. Symmetric risk indicator is calculated with OLS regressions over the
estimated window [t-220, t-100]. No distinguishes between acquires and targets are made here due to the lack of
observations (less than 30 if separated).
Value weighted CAARs CAARs’ Medians % negative
Pre-announcement
(t-30,t-1) -1.61% -1.15% 67.86%
(t-90,t-1) 0.14% -2.20% 64.29%
Announcement
(t-1,t+1) 0.65%* -0.06% 50%
(t-30,t+1) -1.09% -2.10% 60.71%
Post-announcement
(t-1,t+30) -2.63%** -1.52% 60.71%
(t-30,t+30) -4.37%*** -5.19% 78.57%
- */**/*** denote significant at the 10%, 5% and 1%, reactively.
24
From table 4, merger and acquisition firms experience a positive cumulative average excess
return within three days around the announcement with the value of 0.65%, which is significant at
10% level, indicating a possible positive synergy effect. However, the negative cumulative average
excess return of -1.61% within the window [t-30, t-1] may suggest information leakages. Value
destroying after the announcements seems serious in this case. The value-weighted excess returns
decrease by 3.28%8 in one month after the announcements. A similar result is documented in
Cybo-Ottone and Murgia (2000). After analyzing 54 M&As in 14 European financial markets over
1988-1997, they observe that combined abnormal returns of acquirer and target witness a positive
and significant market reaction around a short period of eleven days [t-5, t+5] surrounding the
announcement date. The only positive excess returns on the announcement day suggest that
positive excess returns to M&A announcements dissipate rather quickly, which is in line with the
hypothesis proposed by DeLong and Deyoung (2007) that investors are unable to accurately
predict the future performances of the consolidated bank.
5.2 Value creations of different types of M&As
This section analyzes whether the market expectations vary for different types of mergers. Two
different types of mergers are examined: foreign deals versus domestic deals, and large deals
versus small deals.
Favorable evidence on foreign advantage hypothesis has been documented in Berger et al. (2009)
that foreign stake-takeovers benefit Chinese banks on efficient performances. It is believed that
the entry of foreign investors can bring advanced managerial skills and better diversification
between returns and risks. However, it is argued that there exists barriers, such as differences in
languages, cultures and currencies, which obstruct the full realization of potential synergies in
foreign M&As (Berger et al., 2001). Hence, targets may benefit from domestic acquisitions since
acquirers know the local markets and customers better, and are able to rationally restructure
8 Differences in both post-announcement window ([t-1, t+30] - [t-1 t+1]) and robustness test ([t-30, t+30] - [t-30, t+1]) with the window of [t-30, t+30] are the same here with a value of -3.28, which are significant at 5% level.

25
business to eliminate overlaps on products and branches. This argument is classified as home
advantage hypothesis.
Besides home/foreign advantage hypothesis, regulatory arbitrage may arise in cross-border
merger and acquisition activities. Banks may engage in cross-border mergers in order to pursue
profitable opportunities if the banks come from heavily regulated countries where they are not
allowed to engage in certain risks, but value-creating activities. On the contrary, banks may acquire
targets in weakly regulated districts for searching high-risk investments, which may threaten
shareholder values (Karolyi & Taboada, 2014). To further explore whether cross-border deals
realize different excess returns than domestic deals, the sample is correspondingly separated into
two subgroups: foreign deals and domestic deals. If both the target and acquirer are Chinese banks,
the deal is defined as a domestic deal. And if either target or acquirer is a foreign bank, it is treated
as a foreign deal. The results are reported in the upper panel of table 5.
Table 5. Differences in Cumulative Average Abnormal Returns by type of Merger
The upper panel of the table reports average excess returns for foreign and domestic deals. Domestic deal is defined
as, in an M&A, both targets and acquirers are Chinese banks. The merger is regarded as foreign deal if either target
or acquirer is a foreign bank. The bottom panel reports average returns for large and small deals. Small and large deals
are determined by the deal value over total assets of the involved bank’s total assets in the announcement year. If the
ratio is larger than the median ratio, the deal is classified as a large deal. Otherwise, it is classified as a small deal.
Excess returns are calculated as the difference between returns after mergers and acquisitions announcements and
normal returns if without M&As, measured using the CAPM. Symmetric risk indicator is calculated with OLS
regressions over the estimated window [t-220, t-100].
(t-30,t-1) (t-90,t-1) (t-1,t+1) (t-30,t+1) (t-1,t+30) (t-30,t+30)
A. Domestic vs. Foreign a
Targets Foreign 3.60% 2.29% -0.45% -0.70% b -1.80% b -1.58% b
Domestic -0.75% 4.71% 0.65% 1.28% -10.38%*** -9.75%***
Difference 4.35% -2.42% -1.1% -1.98% 8.58%** 8.17%*
p-value 0.6252 0.7111 0.5966 0.6615 0.0361 0.0773
Acquirers Foreign -1.48% 0.48% -0.67% -1.42% -1.52% -3.57%
Domestic 1.56% 0.37% 2.99%*** 3.54%* 0.91% 1.46%
Difference -3.04% 0.11% -3.66%** -4.96%* -2.43% -5.03%
p-value 0.2859 0.4563 0.0215 0.0937 0.4772 0.2804
B. Small deals vs. Large deals a
Targets Large deals -0.56% 3.99% 0.26% -1.28% -3.86%* -5.40%*
Small deals 6.79% 2.34% 1.15%* 7.41% 1.59% 12.47%
Difference -7.36% 1.66% -0.89% -8.69% -5.44% -17.87%
p-value 0.2915 0.7450 0.6109 0.2828 0.3666 0.1689

26
Acquirers Large deals -1.23% -1.18% 0.31% -0.84% -0.53% -2.54%
Small deals -0.55% -0.81% 0.61% 1.08% 0.63% 0.35%
Difference -0.68% 1.99% -0.30% -1.92% -1.15% -2.89%
p-value 0.7901 0.5577 0.8397 0.4748 0.7083 0.4869
a. */**/*** denote significant at the 10%, 5% and 1%, reactively.
b. An outlier is left out for these three windows. Excess returns for this transaction are respectively 0.78%, 0.51%
and 1.32%, which are relatively too larger compared to the average reported in the table. The unusual results
may be caused by the selection of data. The target involved in this transaction is AIG finance (HONG KONG)
limited, which is not listed on the stock market. The stock prices of AIG are used instead.
Within the announcement window, domestic acquirers experience positive excess returns, while
foreign acquirers realize negative ones. And on the announcement date (window [t-1, t+1]),
domestic acquirers appear to yield 3.66% higher excess returns than foreign acquirers9. The
findings are in line with home advantage hypothesis that domestic acquirers have better knowledge
on local markets and customers. A domestic merger could timely benefit the acquirer on achieving
potential synergies that realize economies of scales and scopes, gain larger market powers and
better diversified. During the post-announcement period, excess returns decrease for both national
and foreign acquirers, but the difference is still negative indicating that national acquirers
outperform than foreign acquirers on equity markets. For targets, a similar result holds around the
announcement date, consistently with home advantage hypothesis. However, foreign targets gain
higher excess returns than domestic targets within the post-announcement period10.
The lower excess returns for foreign deals compared to domestic deals are in line with a great
volume of literatures (Amel et al., 2004; Correa, 2009; and Vennet, 2002). In contrast with Hudgins
and Seifert (1996), there are statistically significant differences in excess returns between domestic
and foreign mergers. However, it is ambiguous whether the differences come from country barriers
or regulatory arbitrage. Foreign deals may pursue the same benefits associated with domestic deals
(Berger et al., 1993), but the existent barriers obstruct the full realization of potential synergies in
foreign M&As. In this case, home advantage hypothesis dominates the wealth effects in M&As.
On the other hand, the non-significant destroying of value for foreign deals may suggest another
reason that regulatory arbitrage is working in the negative direction in China. Foreign acquirers
that merge with domestic targets and domestic targets that merge with foreign acquirers may take
9 The equality between the foreign excess return and the domestic excess return is rejected at 5% significant level. 10 The significantly large negative excess returns for domestic targets within post-merger announcement window are caused by the few observations with relatively larger excess returns.

27
excessive risk-taking investments in the targets’ countries. Since these investments are not allowed
in their home countries because of the certain high risks. As a result, foreign deals experience
negative excess returns because that shareholder values are threatened to decrease in the future.
Following the method in Campa and Hernando (2005), the sample is split into two subgroups
depending on the size of the deal in order to observe whether different sizes of deals affect excess
returns. Banks engaged in large deals are expected to experience lower excess returns surrounding
the announcements. The post-merger bank may face insufficient funds to finance its investments
and restructure the consolidated firm since the mergers will cost too much. Size of the deal
measures whether the merger is big or small compared to the total assets of engaged firms on the
announcement date. If the ratio of deal value over total assets is larger than the median in the
sample, the deal is classified as a large deal. If the ratio is smaller than the median, it is classified
as a small deal. The results are reported in the bottom panel of table 5.
Targets engaged in small deals experience positive excess returns around the announcement
date, while targets engaged in large deals generally realize negative excess returns. A similar result
holds for acquirers that small deals generate higher excess returns than large deals. The great
differences on excess returns between targets engaged in large and small deals in post-
announcement phase provides favorable evidence of the hypothesis that acquirers may spend too
much on M&As and will have insufficient funds to finance restructuring and investments
following consolidations. The results are in line with Moeller et al. (2004) to some extent, who
finds that a few very large M&A deals result in large destruction on value of shareholders.
6. Determinants of wealth effects in banking M&As
This section consists of two parts and aims to explore determinants of value creations
surrounding announcement dates. The first part represents methodology and results associated
with the analysis. The second part provides robustness tests by controlling for bank-fixed effects,
year-fixed effects and bank-year-fixed effects.

28
6.1 The regression model and determinants of excess returns
The event studies exhibited above only measure returns during a short period around the merger
announcements and are based solely on market expectations of consolidation announcements. To
further explore the determinants of value reactions surrounding announcement dates, multivariate
regressions are applied with balance-sheet indicators based on cumulative excess returns generated
from event studies. The basic regression is
𝐶𝐴𝑅𝑖,𝑗,𝑡 = 𝛼0 + 𝛼1 ∗ 𝑅𝑂𝐴𝐸𝑗,𝑡 + 𝛼2 ∗ 𝐴𝑠𝑠𝑒𝑡𝑠𝑗,𝑡 + 𝛼3 ∗ 𝐶ℎ𝑎𝑛𝑔𝑒 𝑖𝑛 𝑠𝑖𝑧𝑒𝑗,𝑡 + 𝛼4
∗ 𝑂𝑝𝑒𝑟𝑎𝑡𝑖𝑛𝑔 𝑐𝑜𝑠𝑡𝑠𝑗,𝑡 + 𝛼5 ∗ 𝐿𝑜𝑎𝑛 𝑙𝑜𝑠𝑠𝑒𝑠𝑗,𝑡 + 𝛼6 ∗ 𝐼𝑛𝑡𝑒𝑟𝑏𝑎𝑛𝑘 𝑟𝑎𝑡𝑖𝑜𝑗,𝑡 + 𝛼7
∗ 𝐶𝑎𝑝𝑖𝑡𝑎𝑙 𝑟𝑒𝑠𝑒𝑟𝑣𝑒𝑠𝑗,𝑡 + 𝛼8 ∗ 𝐷𝑜𝑚𝑒𝑠𝑡𝑖𝑐 𝑑𝑒𝑎𝑙𝑖,𝑡 + 𝛼9 ∗ 𝐿𝑎𝑟𝑔𝑒 𝑑𝑒𝑎𝑙𝑖,𝑡 + ℰ𝑖,𝑗,𝑡
Where i represents an M&A transaction, j represents a bank, and t represents a year. Dependent
variable is cumulative excess returns for each transaction at every event window, which are
generated using event studies. Independent variables are characteristic indicators for each bank in
the announcement-declared year.
Various balance-sheet-based indicators measure different firm-specific characteristics. Returns
on average equities intend to measure the profitability of corporations. Total assets in the form of
natural log measure the sizes of involved banks in the merging year. Olson and Pagano (2005)
identify that shareholder gains are significantly determined by the acquirers’ sustainable growth
rate to the acquisition. Change in size is designed to examine the growth-generating-value
hypothesis, which is calculated by total assets in the announcement year divided by total assets in
one year before the announcement. This is different and weakly correlated with total assets11. If a
change in size of the firm is high, it means that this firm is in the growing path, which provides
them more incentives and extra funds to finance an M&A. Investors may also expect the
consolidated firms will experience growth after the M&A by enjoying its advanced management
skills and operating cost controls etc., and, therefore, a change in size is positively related with
CARs. In line with Campa and Hernando (2005), operating costs, which are calculated by
11 The correlation between total assets and change in size is -0.4 and significant at 1% level for the sample of acquirers. The correlation drops to -0.2 for target sample and is statistically insignificant at any conventional level.
29
operating costs over gross margins, are used to assess cost efficiency. Operating costs allow us to
see how costs are associated with revenue-generating activities and whether or not the business
can be operated more efficiently. Credit risks are estimated by loan losses of the involved bank in
the announcement year. Net interbank ratios are designed to appraise liquidity risks. If the bank is
lack of liquidities, it needs to borrow from other banks for financing its investments. Hence, the
interbank ratio would be high. Capital reserves aim at ensuring that the corporation has adequate
funds to at least partially finance its investment projects. Domestic dummy is a variable set to one
if both the acquirer and target are Chinese banks, and set to zero otherwise. Large dummy is a
variable set to one if the deal value over the involved bank’s assets is larger than the median in the
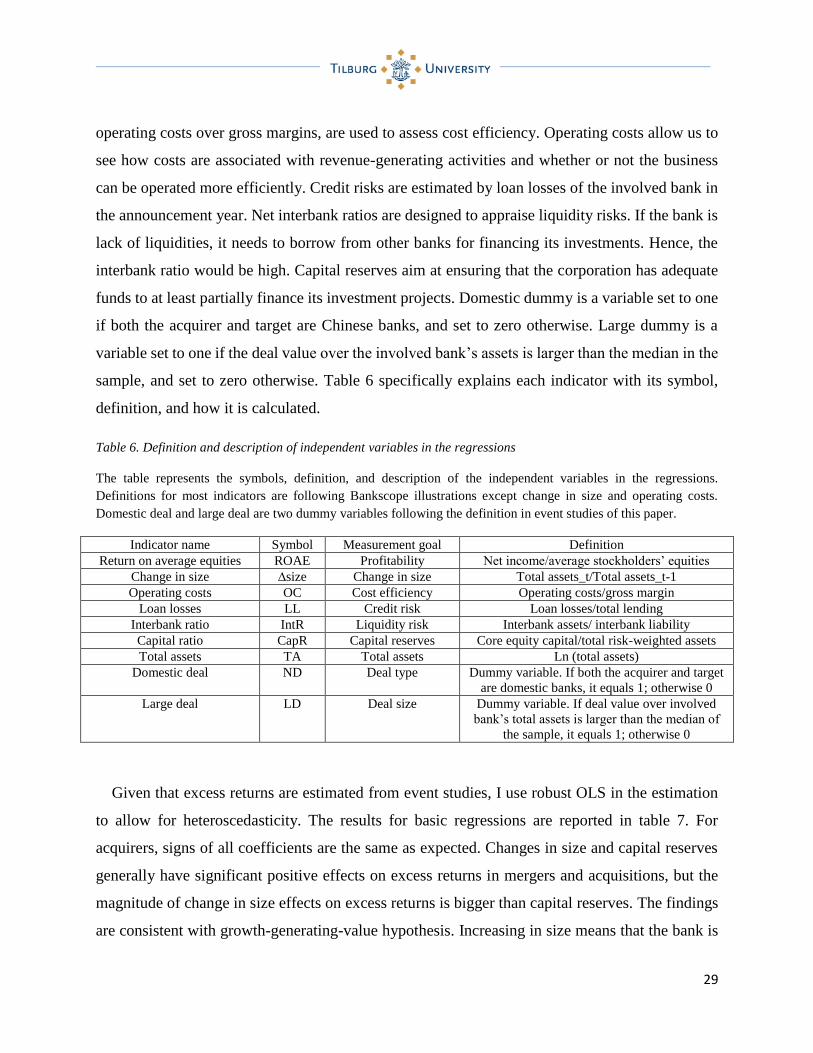
sample, and set to zero otherwise. Table 6 specifically explains each indicator with its symbol,
definition, and how it is calculated.
Table 6. Definition and description of independent variables in the regressions
The table represents the symbols, definition, and description of the independent variables in the regressions.
Definitions for most indicators are following Bankscope illustrations except change in size and operating costs.
Domestic deal and large deal are two dummy variables following the definition in event studies of this paper.
Indicator name Symbol Measurement goal Definition
Return on average equities ROAE Profitability Net income/average stockholders’ equities
Change in size ∆size Change in size Total assets_t/Total assets_t-1
Operating costs OC Cost efficiency Operating costs/gross margin
Loan losses LL Credit risk Loan losses/total lending
Interbank ratio IntR Liquidity risk Interbank assets/ interbank liability
Capital ratio CapR Capital reserves Core equity capital/total risk-weighted assets
Total assets TA Total assets Ln (total assets)
Domestic deal ND Deal type Dummy variable. If both the acquirer and target
are domestic banks, it equals 1; otherwise 0
Large deal LD Deal size Dummy variable. If deal value over involved
bank’s total assets is larger than the median of
the sample, it equals 1; otherwise 0
Given that excess returns are estimated from event studies, I use robust OLS in the estimation
to allow for heteroscedasticity. The results for basic regressions are reported in table 7. For
acquirers, signs of all coefficients are the same as expected. Changes in size and capital reserves
generally have significant positive effects on excess returns in mergers and acquisitions, but the
magnitude of change in size effects on excess returns is bigger than capital reserves. The findings
are consistent with growth-generating-value hypothesis. Increasing in size means that the bank is

30
in fast-growing path, accordingly, the bank has more incentives and is capable of taking M&As
and corresponding restructurings and investments. Meanwhile, investors may have greater faiths
that the consolidated bank can create higher shareholder values in the foreseeable future, and,
therefore, invest in the involved firms. Large capital reserves imply the bank has sufficient money
to finance its investments, including M&As and restructuring processes after consolidations.
Hence, sufficient capital reserves encourage investors to positively react to engaged banks. Within
the event window [t-1, t+1], profitability, cost efficiency and total assets are positively correlated
with excess returns at any conventional significant level. In contrast, loan losses imply lower
excess returns. As for size effects, unlike results documented in most papers (e.g. Moeller et al.,
2004), larger acquirers tend to realize higher excess returns than smaller acquirers at any event
window. And all the results are significant at 1% level. In general, liquidity risk does not dominate
in mergers since interbank ratio has no crucial effects on excess returns. Unfortunately, no results
for the domestic dummy or the large deal dummy are statistically significant.
Table 7. Regression exploring determinations of excess returns in M&As12
This table represents results of robust OLS regressions for each event window with clustering by bank ID. The
dependent variable in all regressions is estimated average excess returns over different window in days indicated in
each column. Independent variables are aiming at capturing characteristic for each bank at different aspects: ROAE
measures for profitability; Change in size assesses the growth rate of the bank; operating costs demonstrates cost
efficiency; loan losses show credit risks while interbank ratio measures liquidity risks. Capital reserves indicate
whether the involved bank has sufficient fund to finance its investments. National dummy is a variable set to one if
both the acquirer and target are Chinese banks, and set to zero otherwise. Large dummy is a variable set to one if the
deal value over the involved bank’s assets is larger than the median in the sample, and set to one otherwise. Total
assets are in the form of natural log of assets as control variable.
Acquirers Targets
(1) (2) (3) (4) (5) (6)
Event Window (t-30,t-1) (t-1,t+1) (t-30,t+30) (t-30,t-1) (t-1,t+1) (t-30,t+30)
ROAE 0.001 0.004*** -0.004** 0.022*** -0.005 0.028***
Ln(asset) 0.048*** 0.018*** 0.084*** -0.025 -0.017 0.01
Change in size 0.539*** 0.153*** 0.602** -0.431 0.017 0.351
Operating cost -0.089* 0.041* -0.153 -0.428*** 0.189 -0.275***
Loan loss -0.046 -0.05** -0.048 -0.047** -0.02 -0.071
Interbank ratio -0.001 -0.001** -0.001 0.001** -0.001 0.001***
Capital reserve 0.033*** 0.013*** 0.026* -0.022** 0.008 0.022
Domestic deal 0.007 0.017 -0.022 -0.035 0.064*** -0.098***
Large deal 0.01 -0.006 0.01 -0.007 0.009 -0.018
12 Results of only three windows are presented here for saving rooms. Similar results remain for the rest windows but with lower R-squares. The whole results can be provided upon requests.
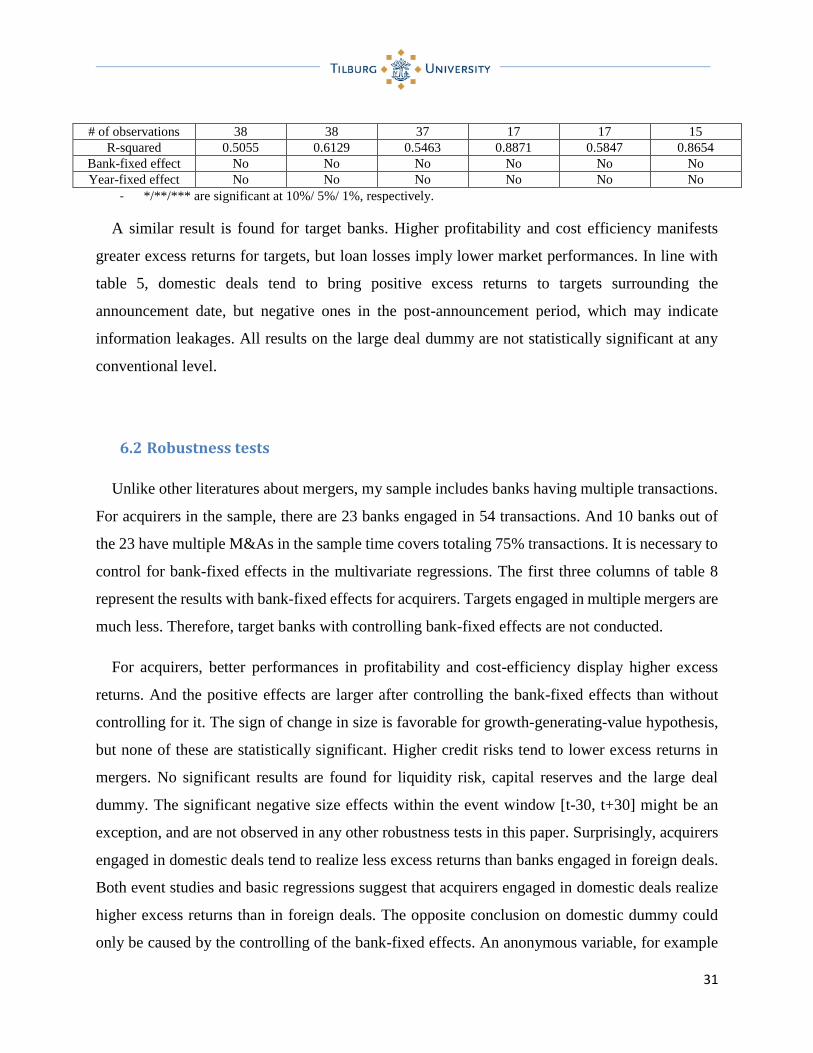
31
# of observations 38 38 37 17 17 15
R-squared 0.5055 0.6129 0.5463 0.8871 0.5847 0.8654
Bank-fixed effect No No No No No No
Year-fixed effect No No No No No No
- */**/*** are significant at 10%/ 5%/ 1%, respectively.
A similar result is found for target banks. Higher profitability and cost efficiency manifests
greater excess returns for targets, but loan losses imply lower market performances. In line with
table 5, domestic deals tend to bring positive excess returns to targets surrounding the
announcement date, but negative ones in the post-announcement period, which may indicate
information leakages. All results on the large deal dummy are not statistically significant at any
conventional level.
6.2 Robustness tests
Unlike other literatures about mergers, my sample includes banks having multiple transactions.
For acquirers in the sample, there are 23 banks engaged in 54 transactions. And 10 banks out of
the 23 have multiple M&As in the sample time covers totaling 75% transactions. It is necessary to
control for bank-fixed effects in the multivariate regressions. The first three columns of table 8
represent the results with bank-fixed effects for acquirers. Targets engaged in multiple mergers are
much less. Therefore, target banks with controlling bank-fixed effects are not conducted.
For acquirers, better performances in profitability and cost-efficiency display higher excess
returns. And the positive effects are larger after controlling the bank-fixed effects than without
controlling for it. The sign of change in size is favorable for growth-generating-value hypothesis,
but none of these are statistically significant. Higher credit risks tend to lower excess returns in
mergers. No significant results are found for liquidity risk, capital reserves and the large deal
dummy. The significant negative size effects within the event window [t-30, t+30] might be an
exception, and are not observed in any other robustness tests in this paper. Surprisingly, acquirers
engaged in domestic deals tend to realize less excess returns than banks engaged in foreign deals.
Both event studies and basic regressions suggest that acquirers engaged in domestic deals realize
higher excess returns than in foreign deals. The opposite conclusion on domestic dummy could
only be caused by the controlling of the bank-fixed effects. An anonymous variable, for example

32
information of local customers, may cause the opposite sign on the coefficient of the domestic
dummy variable. This finding provides a new source for further analysis.
Table 8. Regression exploring determinations of excess returns in M&As for acquirers with controlling for bank-
fixed effects or year-fixed effects13
This table represents results of robust OLS regressions of acquirers for each event window with clustering by bank
ID. The dependent variable in all regressions is estimated average excess returns over different window in days
indicated in each column. Independent variables are aiming at capturing characteristic for each bank at different
aspects: ROAE measures for profitability; Change in size assesses the growth rate of the bank; operating costs
demonstrates cost efficiency; loan losses show credit risks while interbank ratio measures liquidity risks. Capital
reserves indicate whether the involved bank has sufficient fund to finance its investments. National dummy is a
variable set to one if both the acquirer and target are Chinese banks, and set to zero otherwise. Large dummy is a
variable set to one if the deal value over the involved bank’s assets is larger than the median in the sample, and set to
one otherwise. Total assets are in the form of natural log of assets as control variable. The first three columns show
the results for acquirers after controlling for bank-fixed effects. And the last three columns report the results for
acquirers after controlling for year-fixed effects.
(1) (2) (3) (4) (5) (6)
Event Window (t-30,t-1) (t-1,t+1) (t-30,t+30) (t-30,t-1) (t-1,t+1) (t-30,t+30)
ROAE 0.008** 0.004* -0.001 0.001 0.005*** -0.005
Ln(asset) -0.412 -0.128 -1.017** 0.042** 0.028*** 0.068
Change in size 0.096 0.272 0.031 0.512** 0.241** 0.522
Operating cost -0.389*** 0.051 -0.709*** -0.107* 0.014 -0.245
Loan loss -0.396 -0.109 -1.267*** -0.069 -0.074*** -0.05
Interbank 0.001 0.001 0.002 0.001 -0.001 0.001
Capital reserve -0.001 0.015 -0.002 0.032** 0.02** 0.031
Domestic deal -0.04*** 0.004 -0.158*** -0.025 0.009 -0.107*
Large deal -0.012 -0.008 -0.044 0.022 -0.004 0.008
# of observations 38 38 37 38 38 37
R-squared 0.7466 0.7227 0.8105 0.6552 0.6727 0.6501
Bank-fixed effect Yes Yes Yes No No No
Year-fixed effect No No No Yes Yes Yes
- */**/*** are significant at 10%/ 5%/ 1%, respectively.
The sample analyzed in this paper covers the year 2006 to 2013, during which Global Financial
Crisis happened. After the eruption of the Crisis, financial markets dramatically fell, and investors
lost their trusts in stock markets, which may tremendously affect value creations of mergers and
acquisitions. Therefore, it is necessary to control for year-fixed effects.
13 Results of only three windows are presented here due to space limitations. Similar results remain for the other windows but with lower R-squares. These results can be provided upon requests.

33
Column (4)-(6) of table 8 displays results of year-fixed effect for acquirers over year 2006 to
2013. Consistently with basic regression, profitability, cost efficiency, change in size and capital
reserves are positively related with excess returns for acquirers, and change in size dominates the
positive influence. Whereas, as expected, loan losses exhibit lower excess returns. No statistically
significant results are found for liquidity risks and the large deal dummy. The negative effects of
domestic deals strengthen my hypothesis about omitted bank-specific variables bias.
Table 9. Regression exploring determinants of excess returns of M&As for acquirers controlling for bank-fixed
effects and year-fixed effects14
This table represents results of robust OLS regressions for each event window with clustering by bank ID after
controlling bank-fixed effect and year-fixed effect. The dependent variable in all regressions is estimated average
excess returns over different window in days indicated in each column for the acquirers. Independent variables are
aiming at capturing characteristic for each bank at different aspects: ROAE measures for profitability; Change in size
assesses the growth rate of the bank; operating costs demonstrates cost efficiency; loan losses show credit risks while
interbank ratio measures liquidity risks. Capital reserves indicate whether the involved bank has sufficient fund to
finance its investments. National dummy is a variable set to one if both the acquirer and target are Chinese banks, and
set to zero otherwise. Large dummy is a variable set to one if the deal value over the involved bank’s assets is larger
than the median in the sample, and set to one otherwise. Total assets are in the form of natural log of assets as control
variable. Capital reserve is omitted because of collinearity.
(1) (2) (3)
Event Window (t-30,t-1) (t-1,t+1) (t-30,t+30)
ROAE 0.014 0.012*** -0.004
Ln(asset) 0.176 0.127*** 0.099
Change in size 0.214 0.146*** 0.462
Operating cost -0.317** -0.031* -0.191
Loan loss -0.682 -0.627*** 0.119
Interbank 0.002* 0.002*** -0.001***
Domestic deal -0.043 -0.018** -0.206*
Large deal -0.013 -0.02 -0.058
# of observations 39 39 38
R-squared 0.7650 0.7638 0.8221
Bank-fixed effect Yes Yes Yes
Year-fixed effect Yes Yes Yes
- */**/*** are significant at 10%/ 5%/ 1%, respectively.
Lastly, regressions controlling for both bank-fixed and year-fixed effects are conducted for
robustness check. The results are reported in table 9. Capital reserve is omitted because of
14 Results of only three windows are presented here due to space limitations. Similar results remain for the other windows but with lower R-squares. These results can be provided upon requests.

34
collinearity15. On the announcement date [t-1, t+1], higher profitability, cost efficiency and lower
credit risks exhibit greater excess returns, and domestic deals tend to reduce excess returns by
0.018 points, which is statistically significant at 5% level. Acquirer banks with higher growth rates
tend to outperform than slow-growth acquirers on equity markets. That all domestic deal dummies
have negative signs suggest the existence of omitted variables bias.
Important to note is that balance-sheet-based indicators are drawn from the year when the
announcement was made. However, some announcements are declared at the start of the year while
some at the end of the year. For deals announced at the start of the year, indicators are not accurate.
Therefore, changes in performances may be caused by the announcement or the other way around.
Quarterly data was my first selection. Equally weighted quarter indicators that are drawn from four
seasons prior to the announcement will conduct a more accurate result and eliminate the reverse
causality problem. However, Bankscope is lack of observations of quarterly data for Chinese banks.
Another possibility would have been to include as regressors balance sheet data with an extra lag,
one year before the announcement date.
7. Conclusion
Given the economic downturn in China associated with the excess capacity in the banking sector,
Chinese banks face potential credit losses in the foreseeable future. Besides, the risks coming from
the recent credit boom in the mainland appear to be rising to the surface of the country’s banks.
Meanwhile, the releases of limitations on operating in the Chinese market for foreign financial
institutions lead to fiercer bank competition. A growing number of banks are trying to compete
efficiently through mergers and acquisitions. With the progresses of technologies, development in
financial engineering, releases of deregulations and deepness of globalization, the consolidation
waves in the Chinese banking sector are expected to remain and probably grow for a long time. It
is crucial to investigate whether banks could achieve potential synergies and create values through
mergers. Although there are some papers studying the bank ownership reforms in the Chinese
15 The correlation between change in size and capital reserves is -0.7855 and it is statistically significant at any conventional level.
35
banking sector, this paper, to my best knowledge, is the first one to analyze performances of M&As
occurred in China. Studying results may provide a few enlightenments for both investors and
policy makers.
The paper analyzes 82 completed mergers and acquisitions occurred between 2006 and 2013,
involved with 43 domestic and international banks. Wealth effects from M&As in a relatively short
period (three months prior to the announcement and one month after) are examined through event
study methodologies. In addition, the sample is split into domestic deals versus foreign deals to
see if there are different effects on value creations. Deal size effects are examined as well following
the same methodology that splits the sample into small deals versus large deals. To further explore
which factors determine excess returns in M&As, multivariate regressions are conducted by
regressing CARs on bank-specific factors. Regressions control for bank-fixed effects and year-
fixed effects in robustness analysis.
For wealth creations from M&As, the results suggest that both acquirer and target banks
experience positive excess returns surrounding the announcement dates. Consistently with most
relevant literatures, the realized value creations are smaller for acquirers than targets. An enormous
run-up effect in targets is observed that 70% of excess returns on the window [t-30, t+1] are
generated in the one month prior to the announcement, which suggests the existence of information
leaking.
The findings on excess returns of different deal types show that banks engaged in domestic deals
realize higher excess returns than foreign deals, which are favorable on home advantage hypothesis.
However, the causes are not ambiguous. On the one hand, there might be existing barriers
(languages, cultures, currencies) that obstruct full realization of potential synergies for foreign
mergers and acquisitions. On the other hand, regulatory arbitrage may work in the negative
direction in China. Banks may acquire targets in weakly regulated districts to search for high-risk
investments which are not allowed in their home countries because of certain risks, and hence
threaten shareholder values.
The deal size effect observed in the event studies identifies that banks engaged in small deals
appear to realize higher excess returns than banks engaged in large deals, which suggests that

36
acquirers taking large deals may spend too much on M&As, and the market fears they therefore
will have insufficient funds to finance the post-merger restructuring and investments. However,
no results on deal size effects are statistically significant in multivariate regression.
As for determinants of excess returns in mergers, companies with higher profitability, cost
efficiency, growth rate, larger size and sufficient capital reserves appear to realize greater excess
returns with M&As announcements while companies with higher credit risks before
announcements tend to generate lower excess returns. Liquidity risks do not have significant
effects on value creations in M&As. The positive effects of change in size on excess returns
provides favorable evidence on growth-generating-value hypothesis that banks with high growth
rate before the merger announcement could benefit in shareholder wealth from M&As. The
positive effects of size on excess returns are inconsistent with other relative papers, which may be
raised by the fact that government-owned banks are the dominant player on the market. The biggest
four state-owned banks own more than 50% of the total assets in the industry, which makes it
difficult for smaller banks to profit in the ever growing competed market.
Based on the paper, there are some guidelines for further researches. Firstly, post-merger
performances are not observed in this paper because of limitation in data availability. Campa and
Hernando (2006) argue that some synergies in managerial efficiencies would take a while to appear.
Since the consolidation waves in the Chinese banking sector started in recent years, it is impossible
to observe whether potential synergies are partially or fully achieved at present. It is inaccurate to
conclude that mergers are economically successful if the post-merger achievements are not
examined yet. Secondly, there are always better balance-sheet indicators to fit the model better.
Thirdly, the opposite signs on the domestic dummy in the basic regression and robust tests suggest
that there is omitted variables bias.
37
References
Allen, L., & Jagtiani, J. (2000). The risk effects of combining banking, securities, and insurance
activities. Journal of Economics and Business, 485-497.
Altunbas, Y., & Marques, D. (2008). Mergers and acquisitions and bank performance in Europe:
The role of strategis similarities. Journal of Economics and Business, 204-222.
Amel, D., Barnes, C., Panetta, F., & Salleo, C. (2004). Consolidation and efficiency in the
financial sector: A review of the international evidence. Journal of Banking & Finance,
2493-2519.
Anderson, C. W., Becher, D. A., & Campbell, T. L. (2004). Bank mergers, the market for bank
CEOs, and managerial incentives. Journal of Financial Intermediation, 6-27.
Andrade, G., Mitchell, M., & Stafford, E. (2001). New evidence and perspectives on mergers.
Journal of Economic Perspectives, 103-120.
Ariff, M., & Can, L. (2009). IMF bank-restructuring efficiency outcomes: Evidence from East
Asia. Journal of Financial Services Research, 167-187.
Barth, J. S., Caprio, G., & Levine, R. (2006). Rethinking bank regulation: Till angels govern.
Cambridge University Press.
Becher, D. A., & Campbell, T. L. (2005). Interstate banking deregulation and the changing
nature of bank mergers. The Journal of Financial Research, 1-20.
Beitel, P., Shiereck, D., & Wahrenburg, M. (2004). Explaining M&A success in European banks.
European Finanical Management, 109-139.
Berger, A., N, Hasan, I., & Zhou, M. (2009). Bank ownership and efficiency in China: What will
happen in the world's largest nation? Journal of Banking & Finance, 113-130.
Berger, A. N., Demsetz, R. S., & Strahan, P. E. (1999). The consolidation of the financial
services industry: Causes, consequences, and implications for the future. Journal of
Banking & Finance, 135-194.
Berger, A. N., DeYoung, R., & Udell, G. F. (2001). Efficiency barries to the consolidation of the
European financial services industry. European Finanical Management, 117-130.

38
Berger, A. N., Hunter, W. C., & Timme, S. G. (1993). The efficiency of financial institutions: A
review and preview of research past, present and future. Journal of Banking & Finance,
221-249.
Brewer, E., & Jagtiani, J. (2007). How much would banks be willing to pay to become "Too-
Big-to-Fail"and to capture other benefits? Federal Reserve Bank of Kansas City Research
Working Paper.
Campa, J. M., & Hernando, I. (2005). M&Asperformance in the European fiancnial industry.
Financial Economics and International Macroeconomics discussion paper.
Cornett, M. M., Hovakimian, G., Palia, D., & Tehranian, H. (2003). The impact of the manager-
shareholder conflict on acquiring bank returns. Journal of Banking & Finance, 103-131.
Cornett, M. M., McNutt, J. J., & Tehranian, H. (2006). Performance changes around bank
mergers: Revenue enhancements versus cost reductions. Journal of Money, Credit and
Banking, 1013-1050.
Cornett, M. M., & Tehranian, H. (1992). Changes in corporate performance associated with bank
acquisitions. Journal of Financial Economics, 221-234.
Correa, R. (2009). Cross-border bank acquisitions: Is there a performance effect? Journal of
Financial Services Research, 169-197.
Crouzill, C., & Laetitia, L. (2008). (Crouzille & Laetitia, 2008) (Crouzille & Laetitia, 2008)
(Crouzille & Laetitia, 2008) Pacific Economic Review, 171-182.
Cybo-Ottone, A., & Murgia, M. (2000). Mergers and shareholder wealth in European banking.
Journal of Banking & Finance, 831-859.
DeLong, G., & Deyoung, R. (2007). Learning by observation: Information spillovers in the
execution and valuation of commercial bank M&As. The Journal of Finance, 181-216.
DeLong, G. L. (2001). Stockholder gains from focusing cersus diversifying bank mergers.
Journal of Financial Economics, 221-252.
DeYoung, R., Evanoff, D. D., & Molyneux, P. (2009). Mergers and acquisitions of financial
institutions: a review of the post-2000 literature. Journal of Financial services research,
36(2-3), 87-110.
Diaz, B. D., Olalla, M. G., & Azofra, S. S. (2004). Bank acquisitions and performance: Evidence
from a panel of European credit entities. Journal of Economics and Business, 377-404.

39
Elsas, R., Hackethal, A., & Holzhauser, M. (2010). The anatomy of bank diversification. Journal
of Banking & Finance, 1274-1287.
Estrella, A. (2001). Mixing and matching: Prospective financial sector mergers and market
valuation. Journal of Banking & Finance, 2367-2392.
Focarelli, D., Panetta, F., & Salleo, C. (2002). Why do bank merge? Journal of Money, Credit
and Banking, 1047-1066.
Fritsch, M. (2007). Long term effects of bank acquisitions in Central and Eastern Europe. SSRN.
Goddard, J., Molyneux, P., & Zhou, T. (2012). Bank mergers and acquisitions in emerging
markets: Evidence from Asia and Latin America. The European Journal of Finance, 419-
438.
Goyal, K., A, & Joshi, V. (2011). Mergers in banking industry of India: Some emerging issues.
Asian Journal of Business and Management Sciences, 157-165.
Hadlock, C., Houston, J., & Ryngaert, M. (1999). The role of managerial incentives in bank
acquisitions. Journal of Banking & Finance, 221-249.
Hagendorff, J., & Keasay, K. (2009). Post-merger strategy and performance: Evidence from the
US and European banking industries. Accounting & Finance, 725-751.
Houston, J. F., James, C. M., & Ryngaert, M. D. (2001). Where do maeger gains come from?
Bank mergers from the perspective of insiders and outsiders. Journal of Financial
Economics, 285-331.
Houston, J. F., Lin, C., & Ma, Y. (2012). Regulatory arbitrage and international bank flows. The
Journal of Finance, 1845-1895.
Hudgins, S. C., & Seifert, B. (1996). Stockholders and international acquisitions of financial
firms: An emphasis on banking. Journal of Financial Services Research, 163-180.
Huizinga, H., Nelissen, J. H. M., & Vennet, V. R. (2001). Efficiency effects of bank mergers and
acquisitions. Tinbergen Institute Discussion Paper.
Kanpp, M., Gart, A., & Becher, D. (2005). Post-merger performance of bank holding companies,
1987-1998. The Financial Review, 549-574.
Karolyi, G. A., & Taboada, A. G. (2014). Regulatory arbitrage and cross-border bank
acquisitions. Journal of Finance, Forthcoming.
40
Lepetit, L., Patry, S., & Rous, P. (2006). Diversification versus specialization: An event study of
M&As in the European banking industry. Applied Financial Economics, 663-669.
Lin, X., & Yi, Z. (2009). Bank ownership reform and bank performances in China. Journal of
Banking & Finance, 20-29.
Malmendier, U., & Tate, G. (2008). Who makes acquisitions? CEO overconfidence and the
market's reaction. Journal of Financial Economics, 20-43.
Mishkin, F. S. (2006). How big a problem is Too Big to Fail? Journal of Economic Literature,
988-1004.
Mitchell, M. L., & Mulherin, H. J. (1996). The impact of industry shocks on takeover and
restructuring activity. Journal of Financial Economics, 193-229.
Moeller, S. B., Schlingemann, F. P., & Stulz, R. M. (2004). Firm size and the gains from
acquisitions. Journal of Financial Ecnomics, 201-228.
Olson, G. T., & Pagano, M. S. (2005). A new application of sustainable growth: A multi-
demensional freamework for evaluationg the long run performance of bank mergers.
Journal of Business Finance & Accounting, 1995-2036.
Ongena, S., Popov, A., & Udell, G. F. (2013). When the cat's away the mice will play: Does
regulation at home affect bank risk-taking abroad. Journal of Financial Economics, 727-
750.
Penas, M. F., & Unal, H. (2004). Gains in bank mergers: Evidence from the bond markets.
Journal of Financial Economics, 149-179.
Pilloff, S. J. (1996). Performance changes and shareholder wealth creation associated with
mergers of publicly traded banking institutions. Journal of Money, Credit and Banking,
294-310.
Piloff, S. J., & Santomero, A. M. (1998). The value effects of bank mergers and acquisitions
Bank Mergers & Acquisitions (pp. 89-78). Dordrecht: Kluwer Academic Publisher.
Resti, A., & Siciliano, G. (2001). Do bank acquisitions increase shareholders'wealth? A
comparison between market-based and accounting-based performance indicators for
some Italian banks. SSRN.
Rosen, R. J. (2004). Betcha can't acquire just one: Merger programs and compensation. Federal
Reserve Bank of Chicage Working Paper.

41
Schmid, M. M., & Walter, I. (2009). Do financial conglomerates create or destroy economic
value? Journal of Finanical Intermediation, 193-216.
Shull, B., & Hanweck, G. A. (2001). Bank Mergers in a Deregulated Environment: Promise and
Peril. Westport: Quorum Books.
Sufian, F. (2004). Theefficiency effects of bank mergers and acquisitions in a developing
economy: Evidence from Malasia. International Journal of Applied Econometrics and
Quantitive Studies, 53-74.
Vennet, R. V. (2002). Cross-border mergers in European banking and bank efficiency. Gent
University working paper.
Wheelock, D., C, & Wilson, P., W,. (2000). Who do banks disappear? The determinants of U.S.
bank failures and acquisitions. The Review of Economics and Statistics, 127-138.