Malhotra 08
34
Chapter Eight Measurement and Scaling: Fundamentals and Comparative Scaling
-
Upload
prabhamohanraj-mohanraj -
Category
Documents
-
view
204 -
download
23
description
Business research methods ppt
Transcript of Malhotra 08
Chapter Eight
Measurement and Scaling: Fundamentals and
Comparative Scaling
8-2
Chapter Outline
1) Overview
2) Measurement and Scaling
3) Primary Scales of Measurement
i. Nominal Scale
ii. Ordinal Scale
iii. Interval Scale
iv. Ratio Scale
4) A Comparison of Scaling Techniques
8-3
Chapter Outline
5) Comparative Scaling Techniques
i. Paired Comparison
ii. Rank Order Scaling
iii. Constant Sum Scaling
iv. Q-Sort and Other Procedures
6) Verbal Protocols
7) International Marketing Research
8) Ethics in Marketing Research

8-4
Chapter Outline
9) Internet and Computer Applications
10) Focus on Burke
11) Summary
12) Key Terms and Concepts
8-5
Measurement and Scaling
Measurement means assigning numbers or other symbols to characteristics of objects according to certain prespecified rules. One-to-one correspondence between the
numbers and the characteristics being measured.
The rules for assigning numbers should be standardized and applied uniformly.
Rules must not change over objects or time.
8-6
Measurement and Scaling
Scaling involves creating a continuum upon which measured objects are located.
Consider an attitude scale from 1 to 100. Each respondent is assigned a number from 1 to 100, with 1 = Extremely Unfavorable, and 100 = Extremely Favorable. Measurement is the actual assignment of a number from 1 to 100 to each respondent. Scaling is the process of placing the respondents on a continuum with respect to their attitude toward department stores.
8-7
7 38
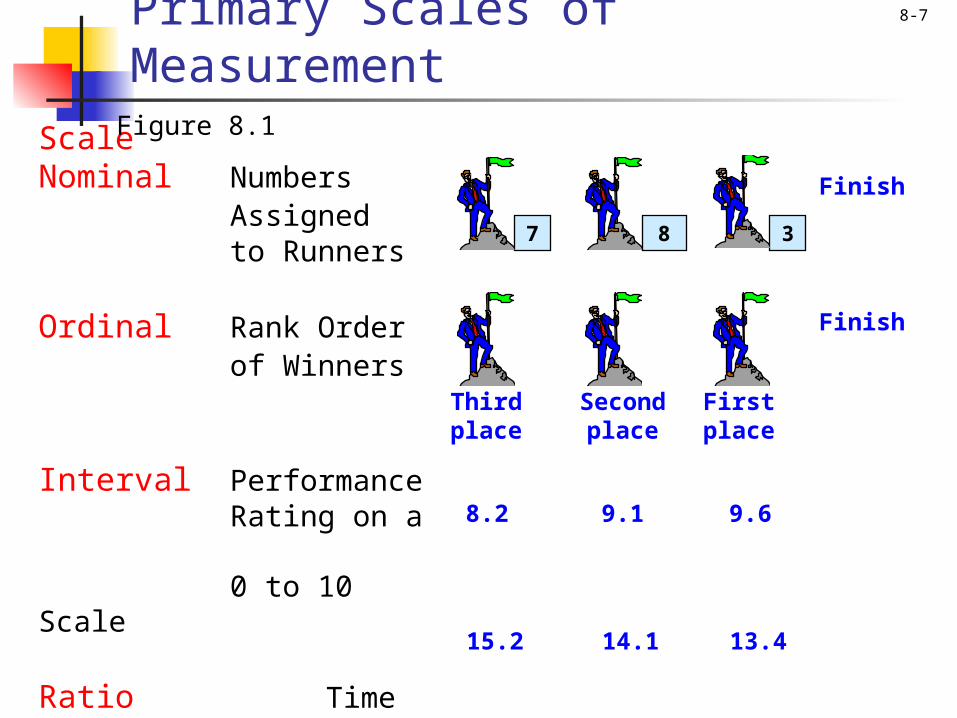
Primary Scales of MeasurementScaleNominal Numbers
Assigned to Runners
Ordinal Rank Orderof Winners
Interval PerformanceRating on a
0 to 10 Scale
Ratio Time to Finish, in
Seconds
Figure 8.1
Thirdplace
Secondplace
Firstplace
Finish
Finish
8.2 9.1 9.6
15.2 14.1 13.4
8-8Primary Scales of MeasurementNominal Scale
It allows the researcher to assign subjects to certain categories or groups.
The numbers serve only as labels or tags for identifying and classifying objects.
When used for identification, there is a strict one-to-one correspondence between the numbers and the objects.
The numbers do not reflect the amount of the characteristic possessed by the objects.
The only permissible operation on the numbers in a nominal scale is counting.
Only a limited number of statistics, all of which are based on frequency counts, are permissible, e.g., percentages, and mode.
8-9Primary Scales of MeasurementNominal Scale
IT categorize individuals or objects into mutually exclusive and collectively exhaustive groups
Example: Variable of gender grouped into 2 categories- male and
female Male assigned as code 1 Female assigned as code 2
OR
American Japanese
Australian Polish
Chinese Russian
German Swiss
Indian Zambian
Every respondent has to fit into one of the above 11 categories .
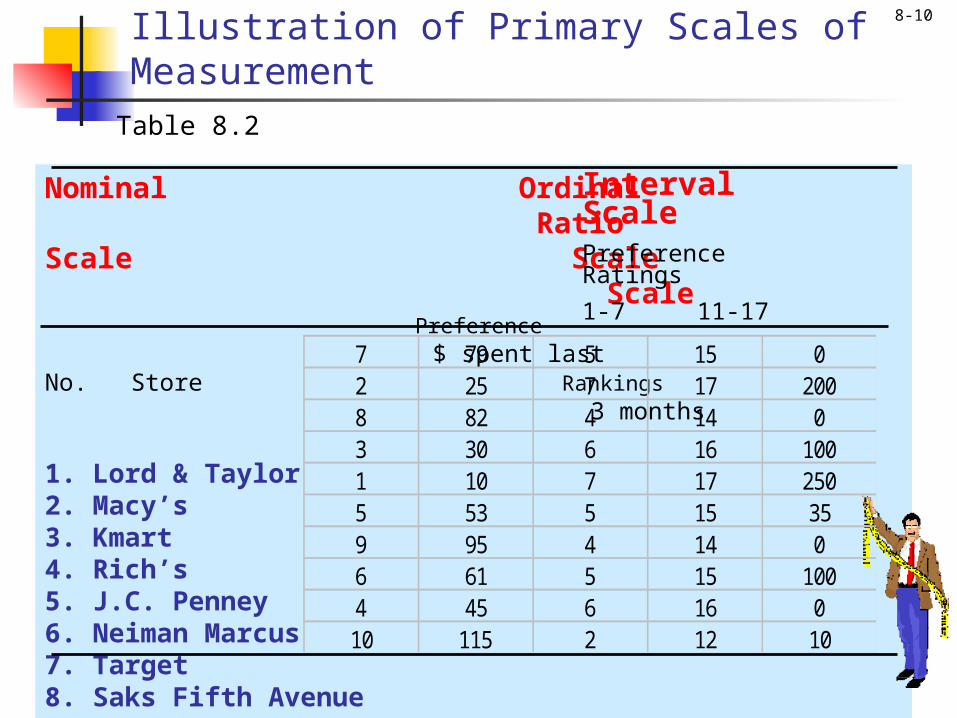
8-10Illustration of Primary Scales of MeasurementTable 8.2
Nominal Ordinal RatioScale Scale Scale
Preference $ spent last No. Store Rankings 3 months
1. Lord & Taylor2. Macy’s3. Kmart4. Rich’s5. J.C. Penney 6. Neiman Marcus 7. Target 8. Saks Fifth Avenue 9. Sears 10.Wal-Mart
IntervalScale Preference Ratings
1-7 11-17
7 79 5 15 02 25 7 17 2008 82 4 14 03 30 6 16 1001 10 7 17 2505 53 5 15 359 95 4 14 06 61 5 15 1004 45 6 16 010 115 2 12 10
8-11Primary Scales of MeasurementOrdinal Scale
A ranking scale in which numbers are assigned to objects to indicate the relative extent to which the objects possess some characteristic.
Can determine whether an object has more or less of a characteristic than some other object, but not how much more or less.
Any series of numbers can be assigned that preserves the ordered relationships between the objects.
In addition to the counting operation allowable for nominal scale data, ordinal scales permit the use of statistics based on centiles, e.g., percentile, quartile, median.
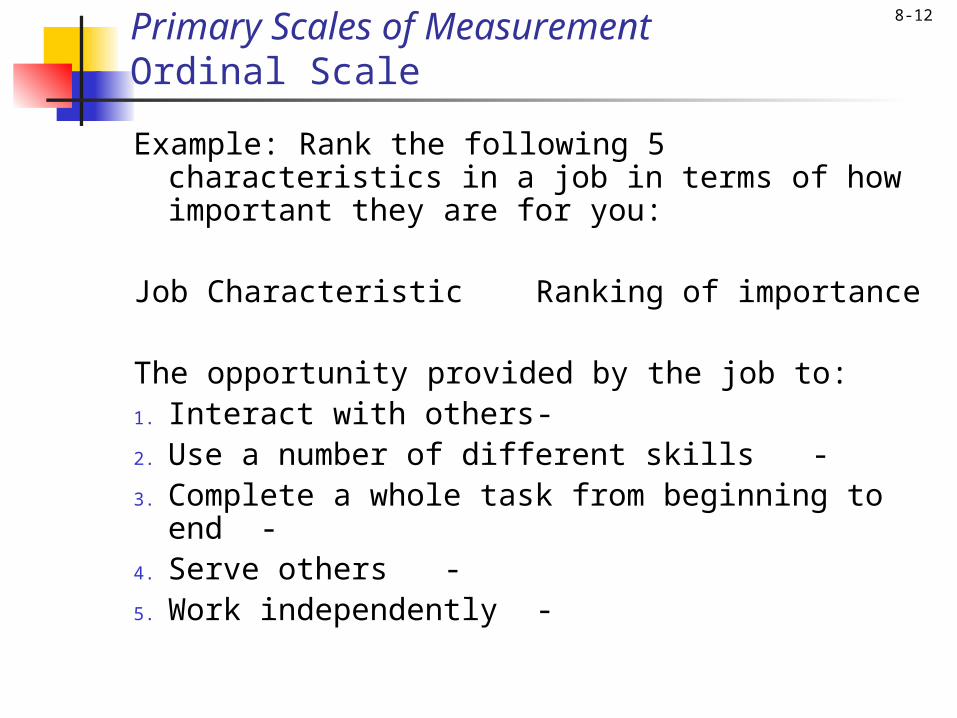
8-12Primary Scales of MeasurementOrdinal Scale
Example: Rank the following 5 characteristics in a job in terms of how important they are for you:
Job Characteristic Ranking of importance
The opportunity provided by the job to:1. Interact with others -2. Use a number of different skills -3. Complete a whole task from beginning to end -4. Serve others -5. Work independently -
8-13Primary Scales of MeasurementInterval Scale
Numerically equal distances on the scale represent equal values in the characteristic being measured.
It permits comparison of the differences between objects.
The location of the zero point is not fixed. Both the zero point and the units of measurement are arbitrary.
Any positive linear transformation of the form y = a + bx will preserve the properties of the scale.
It is meaningful to take ratios of scale values. Statistical techniques that may be used include all
of those that can be applied to nominal and ordinal data, and in addition the arithmetic mean, standard deviation, and other statistics commonly used in marketing research.
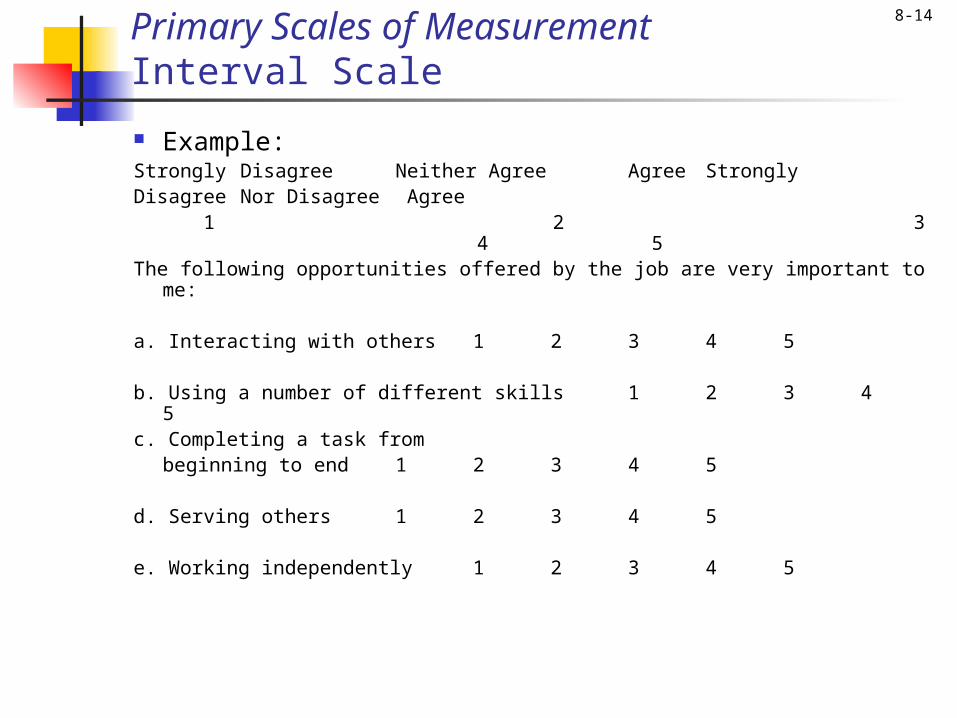
8-14Primary Scales of MeasurementInterval Scale
Example:Strongly Disagree Neither Agree Agree StronglyDisagree Nor Disagree Agree 1 2 3 4 5The following opportunities offered by the job are very important to me:
a. Interacting with others 1 2 3 4 5
b. Using a number of different skills 1 2 3 4 5c. Completing a task from
beginning to end 1 2 3 4 5
d. Serving others 1 2 3 4 5
e. Working independently 1 2 3 4 5

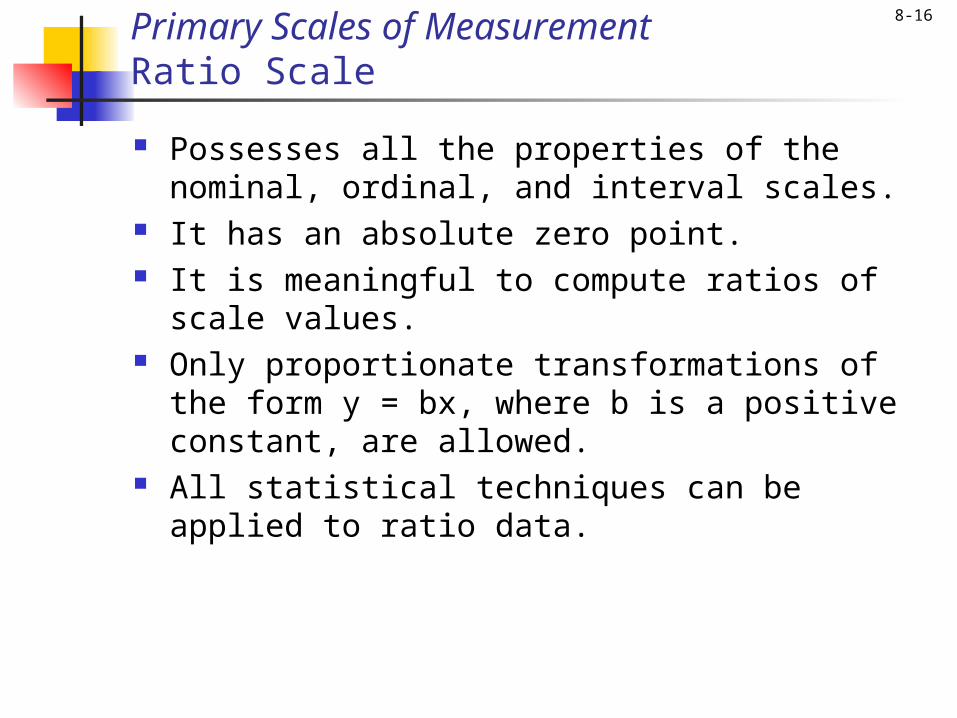
8-15Primary Scales of MeasurementRatio Scale
Possesses all the properties of the nominal, ordinal, and interval scales.
It has an absolute zero point. It is meaningful to compute ratios of scale
values. Only proportionate transformations of the form
y = bx, where b is a positive constant, are allowed.
All statistical techniques can be applied to ratio data.
8-16Primary Scales of MeasurementRatio Scale
Possesses all the properties of the nominal, ordinal, and interval scales.
It has an absolute zero point. It is meaningful to compute ratios of scale
values. Only proportionate transformations of the form
y = bx, where b is a positive constant, are allowed.
All statistical techniques can be applied to ratio data.

8-17Primary Scales of MeasurementRatio Scale
Possesses all the properties of the nominal, ordinal, and interval scales.
It has an absolute zero point. It is meaningful to compute ratios of scale
values. Only proportionate transformations of the form
y = bx, where b is a positive constant, are allowed.
All statistical techniques can be applied to ratio data.

8-18Primary Scales of MeasurementRatio Scale
Example: It is used in organizational research when extra number on objective factors are called for, as in the following questions:
1. How many other organizations did you work for before joining the system?_______________
2. Please indicate the number of children you have in each of the following categories
________ below 3 years of age________ between 3 and 6________ over 6 years but under 12________ 12 years and over3. How many retail outlets do you operate?__________The responses to the questions could range from 0 to any
reasonable figure.
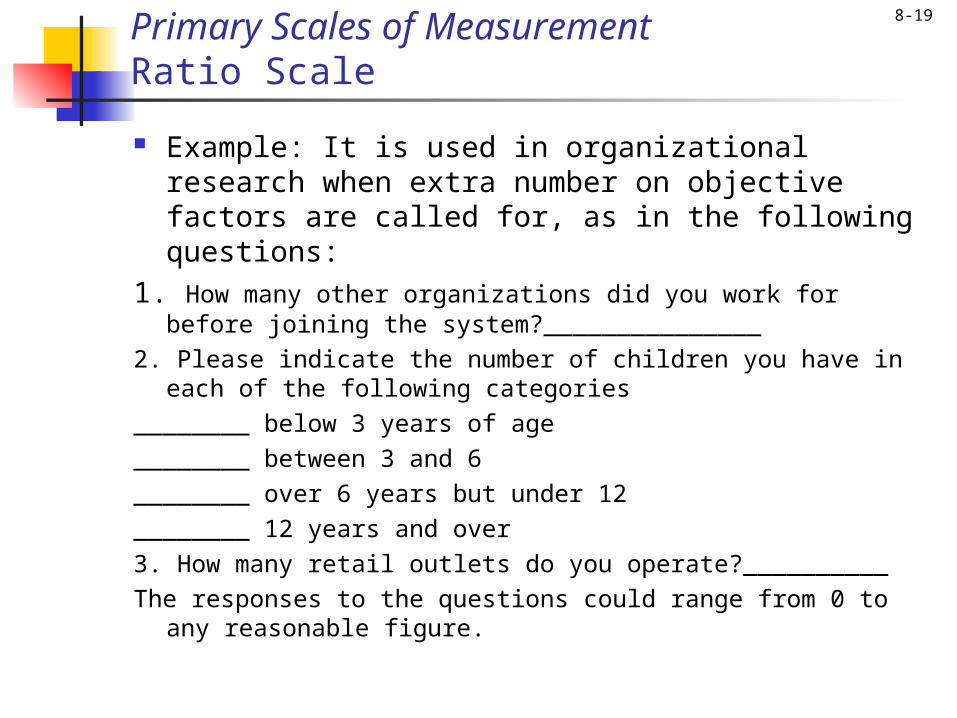
8-19Primary Scales of MeasurementRatio Scale
Example: It is used in organizational research when extra number on objective factors are called for, as in the following questions:
1. How many other organizations did you work for before joining the system?_______________
2. Please indicate the number of children you have in each of the following categories
________ below 3 years of age________ between 3 and 6________ over 6 years but under 12________ 12 years and over3. How many retail outlets do you operate?__________The responses to the questions could range from 0 to any
reasonable figure.
8-20
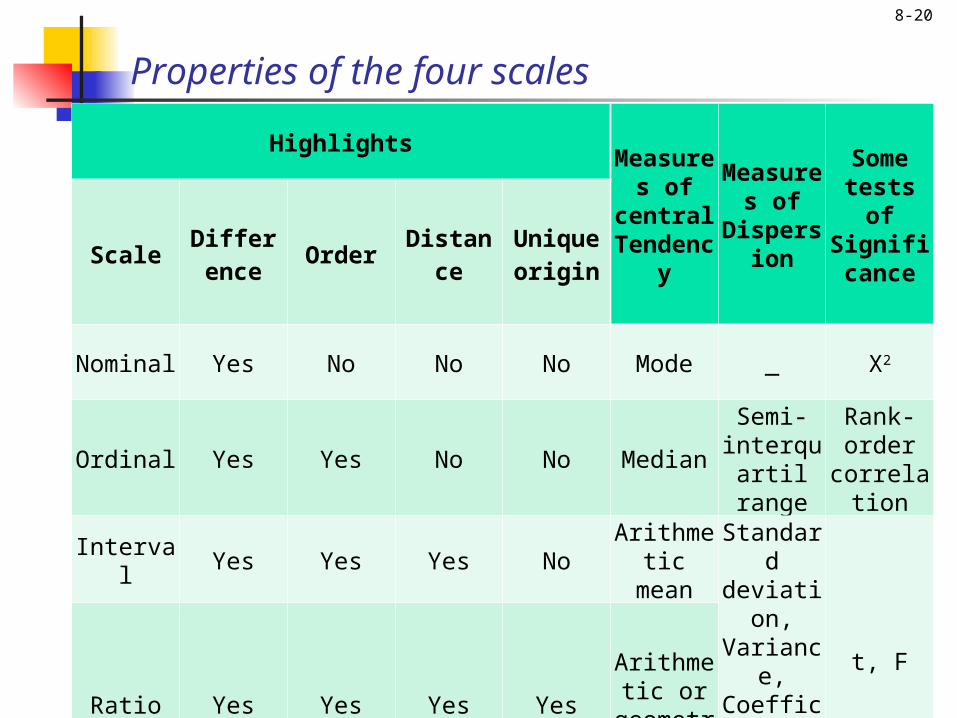
Properties of the four scales
HighlightsMeasures of central Tendency
Measures of
Dispersion
Some tests of
SignificanceScale
Difference
Order DistanceUnique origin
Nominal Yes No No No Mode _ X2
Ordinal Yes Yes No No MedianSemi-
interquartil range
Rank-order
correlation
Interval Yes Yes Yes NoArithmetic
meanStandard deviation, Variance, Coefficien
t of Varation
t, F
Ratio Yes Yes Yes Yes
Arithmetic or
geometric mean
8-21
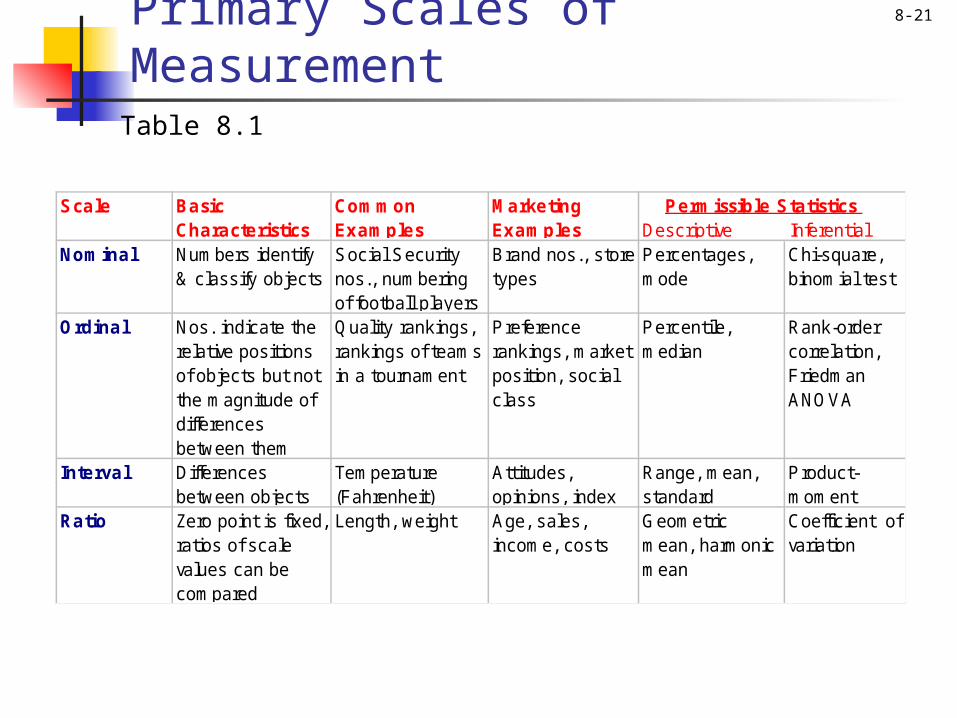
Primary Scales of MeasurementTable 8.1
Scale Basic Characteristics
Common Examples
Marketing Examples
Nominal Numbers identify & classify objects
Social Security nos., numbering of football players
Brand nos., store types
Percentages, mode
Chi-square, binomial test
Ordinal Nos. indicate the relative positions of objects but not the magnitude of differences between them
Quality rankings, rankings of teams in a tournament
Preference rankings, market position, social class
Percentile, median
Rank-order correlation, Friedman ANOVA
Ratio Zero point is fixed, ratios of scale values can be compared
Length, weight Age, sales, income, costs
Geometric mean, harmonic mean
Coefficient of variation
Permissible Statistics Descriptive Inferential
Interval Differences between objects
Temperature (Fahrenheit)
Attitudes, opinions, index
Range, mean, standard
Product-moment
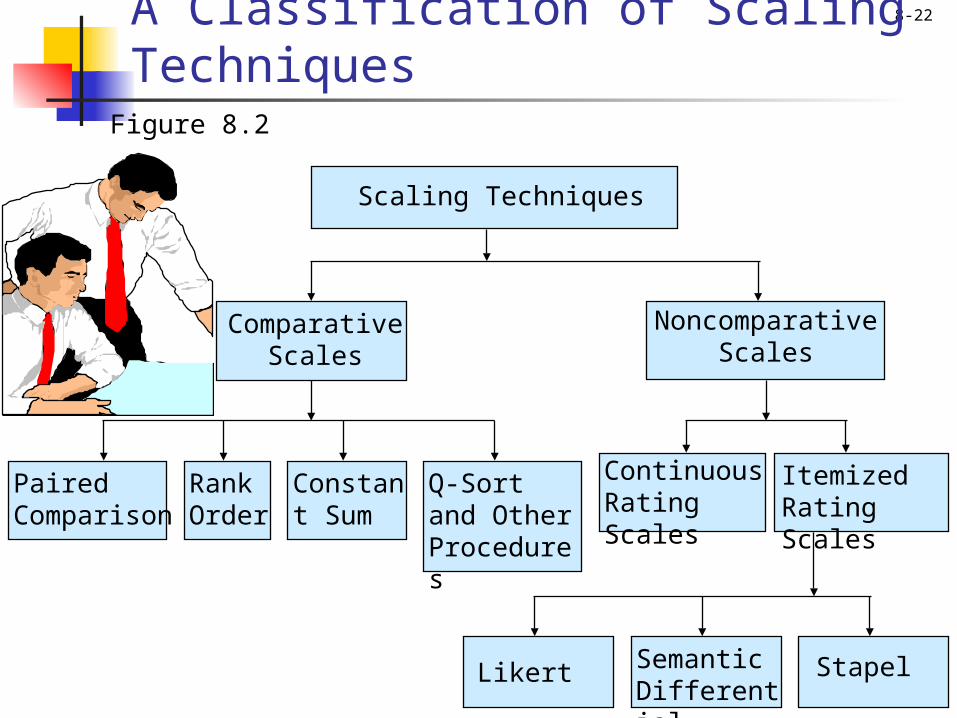
8-22A Classification of Scaling Techniques
Likert Semantic Differential
Stapel
Figure 8.2
Scaling Techniques
NoncomparativeScales
Comparative Scales
Paired Comparison
Rank Order
Constant Sum
Q-Sort and Other Procedures
Continuous Rating Scales
Itemized Rating Scales
8-23A Comparison of Scaling Techniques
Comparative scales involve the direct comparison of stimulus objects. Comparative scale data must be interpreted in relative terms and have only ordinal or rank order properties.
In noncomparative scales, each object is
scaled independently of the others in the stimulus set. The resulting data are generally assumed to be interval or ratio scaled.
8-24Relative Advantages of Comparative Scales
Small differences between stimulus objects can be detected.
Same known reference points for all respondents.
Easily understood and can be applied. Involve fewer theoretical assumptions. Tend to reduce halo or carryover effects from
one judgment to another.
8-25Relative Disadvantages of Comparative Scales
Ordinal nature of the data Inability to generalize beyond the stimulus
objects scaled.
8-26Comparative Scaling TechniquesPaired Comparison Scaling
A respondent is presented with two objects and asked to select one according to some criterion.
The data obtained are ordinal in nature. Paired comparison scaling is the most widely
used comparative scaling technique. With n brands, [n(n - 1) /2] paired comparisons
are required Under the assumption of transitivity, it is
possible to convert paired comparison data to a rank order.
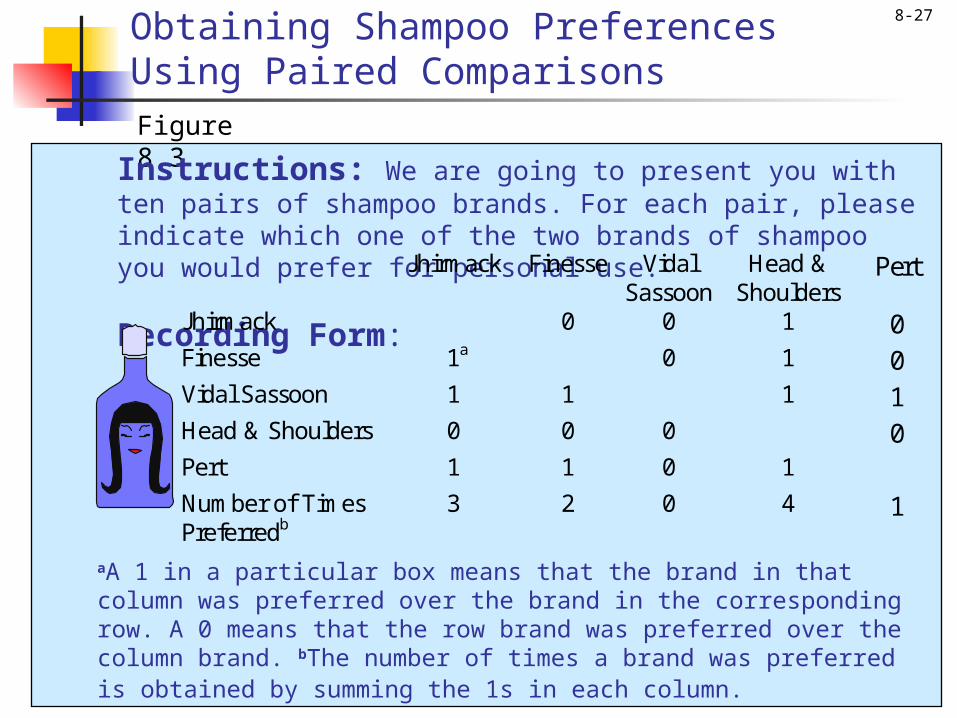
8-27Obtaining Shampoo Preferences Using Paired ComparisonsFigure 8.3Instructions: We are going to present you with ten
pairs of shampoo brands. For each pair, please indicate which one of the two brands of shampoo you would prefer for personal use. Recording Form:
Jhirmack Finesse Vidal Sassoon
Head & Shoulders
Pert
Jhirmack 0 0 1 0 Finesse 1a 0 1 0 Vidal Sassoon 1 1 1 1 Head & Shoulders 0 0 0 0 Pert 1 1 0 1 Number of Times Preferredb
3 2 0 4 1
aA 1 in a particular box means that the brand in that column was preferred over the brand in the corresponding row. A 0 means that the row brand was preferred over the column brand. bThe number of times a brand was preferred is obtained by summing the 1s in each column.
8-28
Paired Comparison Selling
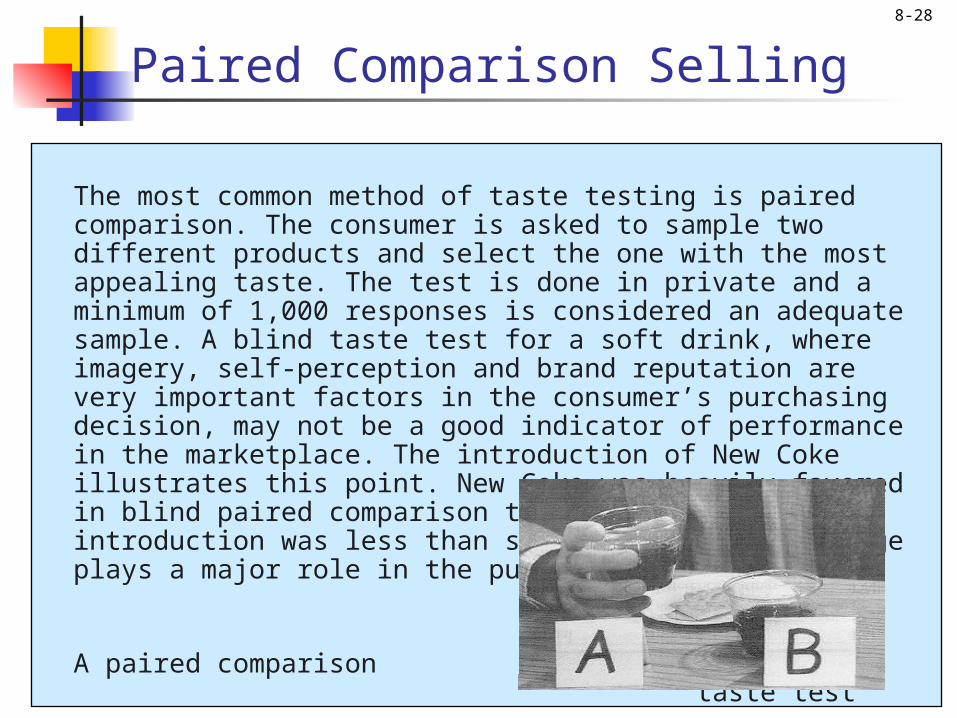
The most common method of taste testing is paired comparison. The consumer is asked to sample two different products and select the one with the most appealing taste. The test is done in private and a minimum of 1,000 responses is considered an adequate sample. A blind taste test for a soft drink, where imagery, self-perception and brand reputation are very important factors in the consumer’s purchasing decision, may not be a good indicator of performance in the marketplace. The introduction of New Coke illustrates this point. New Coke was heavily favored in blind paired comparison taste tests, but its introduction was less than successful, because image plays a major role in the purchase of Coke.
A paired comparison taste test
8-29Comparative Scaling TechniquesRank Order Scaling
Respondents are presented with several objects simultaneously and asked to order or rank them according to some criterion.
It is possible that the respondent may dislike the brand ranked 1 in an absolute sense.
Furthermore, rank order scaling also results in ordinal data.
Only (n - 1) scaling decisions need be made in rank order scaling.
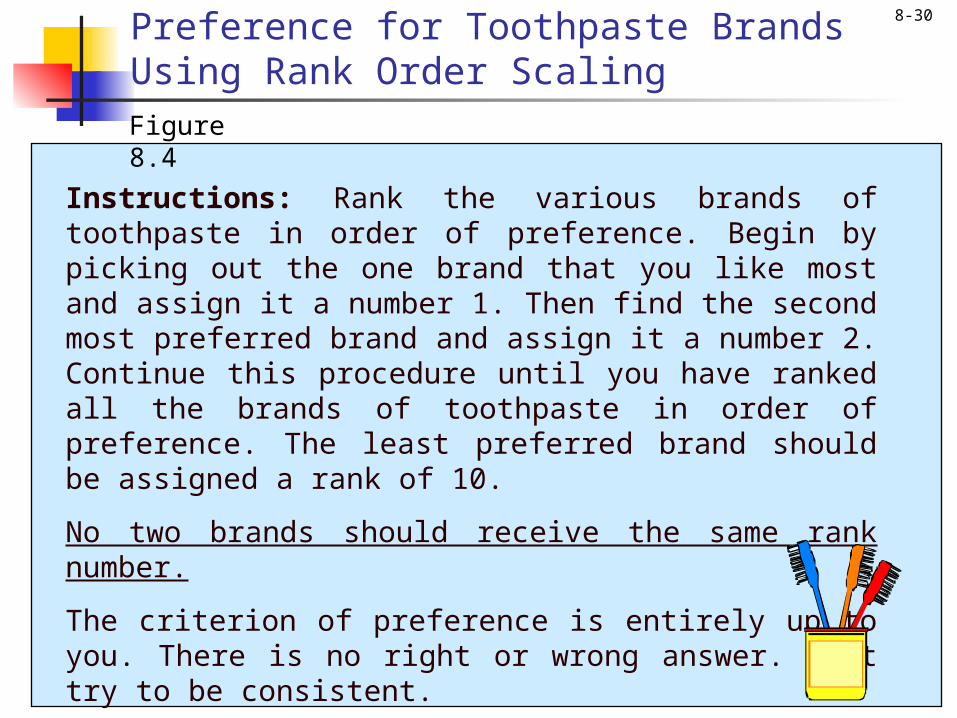
8-30Preference for Toothpaste Brands Using Rank Order ScalingFigure 8.4
Instructions: Rank the various brands of toothpaste in order of preference. Begin by picking out the one brand that you like most and assign it a number 1. Then find the second most preferred brand and assign it a number 2. Continue this procedure until you have ranked all the brands of toothpaste in order of preference. The least preferred brand should be assigned a rank of 10.
No two brands should receive the same rank number.
The criterion of preference is entirely up to you. There is no right or wrong answer. Just try to be consistent.
8-31
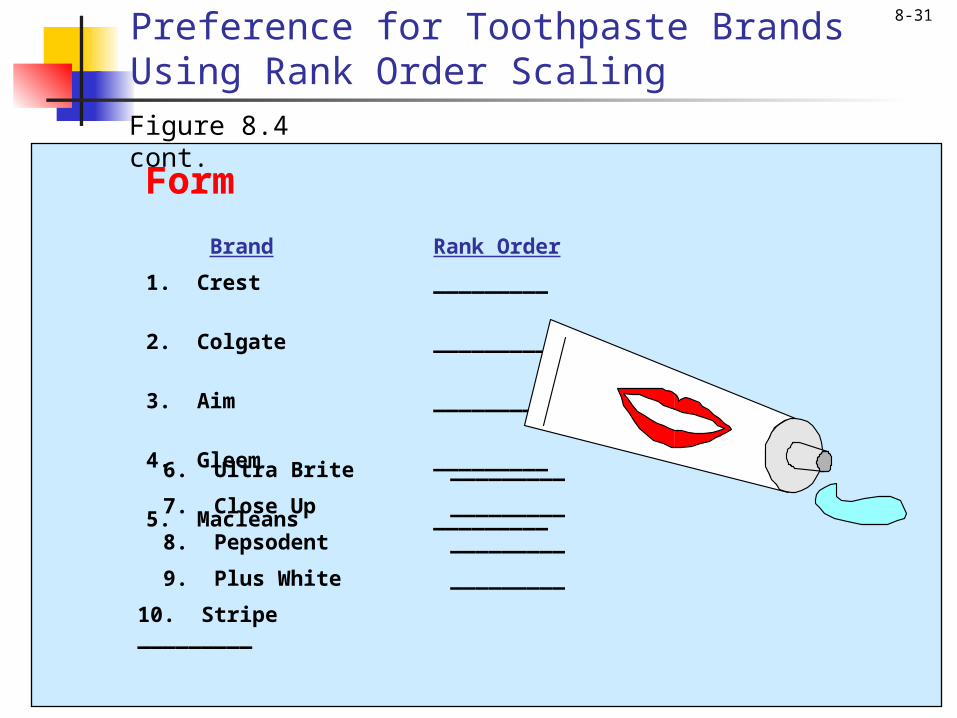
Brand Rank Order
1. Crest _________
2. Colgate _________
3. Aim _________
4. Gleem _________
5. Macleans _________ 6. Ultra Brite _________
7. Close Up _________
8. Pepsodent _________
9. Plus White _________
10. Stripe _________
Preference for Toothpaste Brands Using Rank Order ScalingFigure 8.4 cont.Form
8-32Comparative Scaling TechniquesConstant Sum Scaling
Respondents allocate a constant sum of units, such as 100 points to attributes of a product to reflect their importance.
If an attribute is unimportant, the respondent assigns it zero points.
If an attribute is twice as important as some other attribute, it receives twice as many points.
The sum of all the points is 100. Hence, the name of the scale.
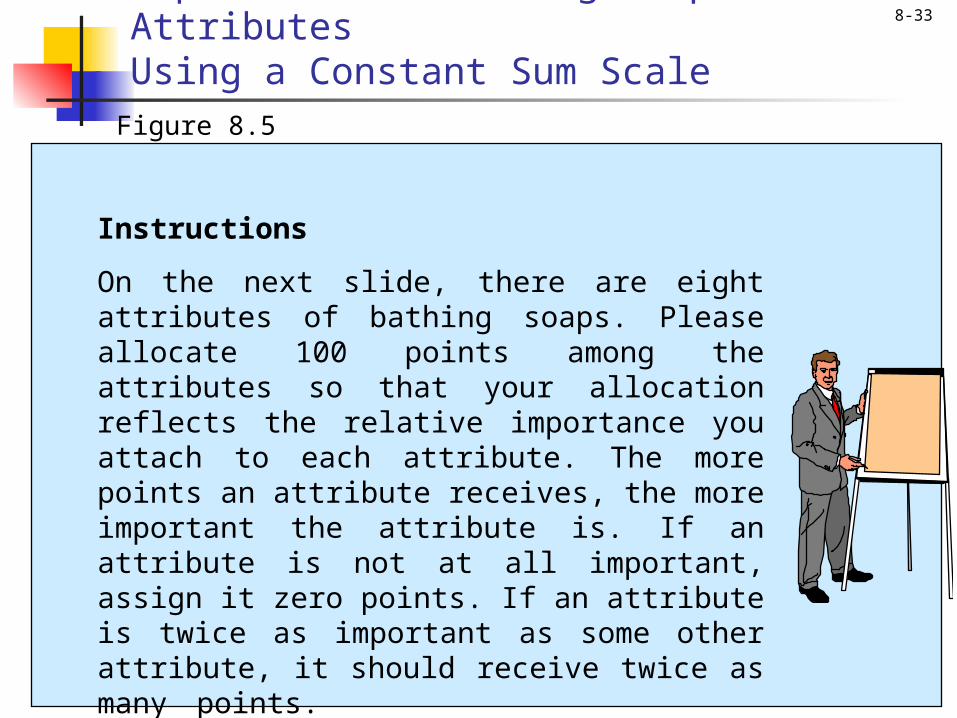
8-33Importance of Bathing Soap AttributesUsing a Constant Sum ScaleFigure 8.5
Instructions
On the next slide, there are eight attributes of bathing soaps. Please allocate 100 points among the attributes so that your allocation reflects the relative importance you attach to each attribute. The more points an attribute receives, the more important the attribute is. If an attribute is not at all important, assign it zero points. If an attribute is twice as important as some other attribute, it should receive twice as many points.
8-34
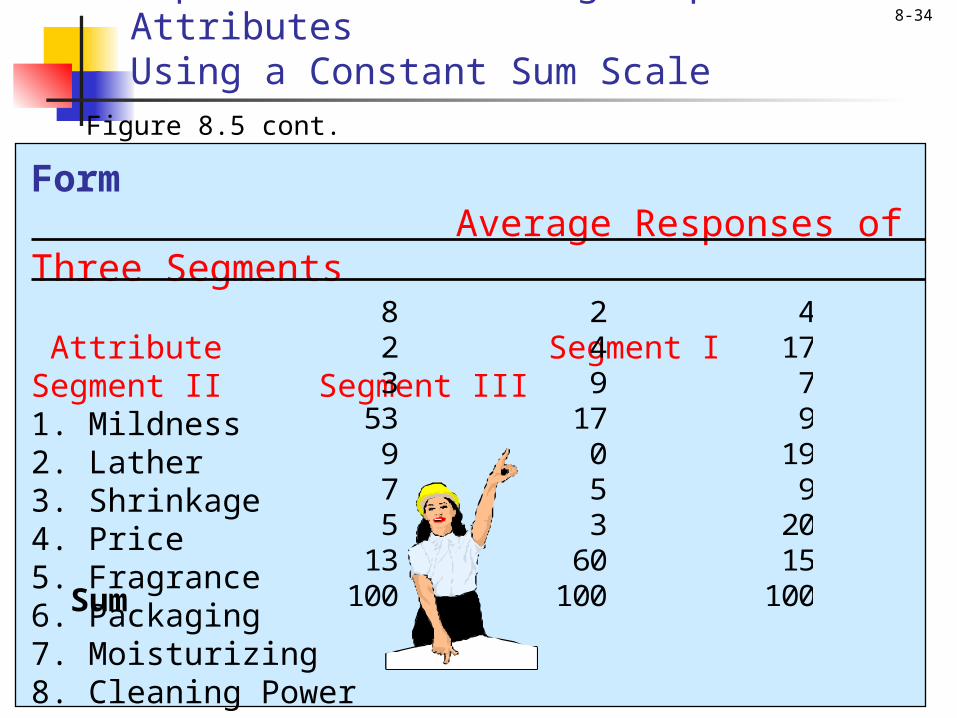
Figure 8.5 cont.
Form Average Responses of Three Segments Attribute Segment I Segment II Segment III1. Mildness2. Lather 3. Shrinkage 4. Price 5. Fragrance 6. Packaging 7. Moisturizing 8. Cleaning Power
Sum
8 2 4 2 4 17 3 9 7
53 17 9 9 0 19 7 5 9 5 3 20
13 60 15 100 100 100
Importance of Bathing Soap AttributesUsing a Constant Sum Scale