
MALDI-TOF Mass Spectrometry Imaging (MSI) for Distribution ... · H Representative ion images of...
6
MALDI-TOF Mass Spectrometry Imaging (MSI) for Distribution Analysis of Anthocyanins in Strawberry Fruits Imaging mass spectrometry (MSI) via matrix-assisted laser desorption / ionization (MALDI) TOF MS enables the simultaneous detection and localization of molecular species across a broad molecular mass range. In biological samples, diverse classes of biomolecules may be sought, including metabolites, sugars, lipids, peptides, and proteins. Depending on the sample and the compound class(es) to be targeted in a given MALDI-TOF MSI study, sample preparation schemes (potential necessities of structural reinforcement of delicate samples, thickness of sample slicing, and optional washing steps) may vary, as may the selection of the most suitable MALDI matrix to enable desorp- tion and ionization of the target classes. Sensitivity and spatial resolution are key elements to successful MSI studies, and matrix application directly influ- ences the quality and quantity of the spectra data obtained. Uniformity of coverage on the sample surface, matrix crystal size, and “extractability” of ana- lytes depend on many variables, including the physical means of application, the selection of application solvent(s), if used, and application temperature. Keywords: Food analysis, mass spectrometry imaging, MALDI-TOF MS Author: Hirofumi Enomoto 1,2,3 ; 1 Department of Biosciences, Faculty of Science and Engineering, 2 Division of Integrated Science and Engineering, Graduate School of Science and Engineering, and 3 Advanced Instrumental Analysis Center of Teikyo University, Teikyo University, Utsunomiya, 320-8551, Japan
Transcript of MALDI-TOF Mass Spectrometry Imaging (MSI) for Distribution ... · H Representative ion images of...

MALDI-TOF Mass Spectrometry Imaging (MSI) for Distribution Analysis of Anthocyanins in Strawberry FruitsImaging mass spectrometry (MSI) via matrix-assisted laser desorption / ionization (MALDI) TOF MS enables the simultaneous detection and localization of molecular species across a broad molecular mass range. In biological samples, diverse classes of biomolecules may be sought, including metabolites, sugars, lipids, peptides, and proteins.
Depending on the sample and the compound class(es) to be targeted in a given MALDI-TOF MSI study, sample preparation schemes (potential necessities of structural reinforcement of delicate samples, thickness of sample slicing, and optional washing steps) may vary, as may
the selection of the most suitable MALDI matrix to enable desorp-tion and ionization of the target classes. Sensitivity and spatial resolution are key elements to successful MSI studies, and matrix application directly influ-ences the quality and quantity of the spectra data obtained.
Uniformity of coverage on the sample surface, matrix crystal size, and “extractability” of ana-lytes depend on many variables, including the physical means of application, the selection of application solvent(s), if used, and application temperature.
Keywords: Food analysis, mass spectrometry imaging, MALDI-TOF MS
Author: Hirofumi Enomoto 1,2,3; 1Department of Biosciences, Faculty of Science and Engineering, 2Division of Integrated Science and Engineering, Graduate School of Science and Engineering, and 3Advanced Instrumental Analysis Center of Teikyo University, Teikyo University, Utsunomiya, 320-8551, Japan

The utility of MSI in food analyses has been demonstrated in the identification and quantitation of metabolites, proteins, and pesticides in various food matrices, including fruits and vegetables [1]. In this study, the distribution of anthocyanin species in strawberries (Fragaria x ananassa) was characterized by MSI. Anthocyanins are polyphenolic compounds present in strawberries, as in other fruits and vegetables naturally red, purple, or blue toned at maturity. Beyond providing vivid color, anthocyanins have shown to have antioxidative, anti-inflammatory, and antitumor activities [2-4], making this class of compounds of interest for nutraceu-tical, skin care, and drug research and development. Pelargonidin and cyanidin derivatives are the most representative anthocyanins in straw-berries, but this class of compounds includes more than 500 entities [2]. The identification, distribution, and relative quantitation of anthocyanins can support studies of natural species and the development of genetically modified varieties of such fruits for the monitoring and development of desirable anthocyanin content characteristics. In addition to “core” profiling via analysis of longitudinal and cross-sectional slices, analysis of surface slices including the strawberry achenes enables a more complete target evaluation and further demonstrates the utility and flexibility of MSI technology.
Methods and Materials
Preliminary Analysis: Preparation and Profiling of Strawberry Extracts
"Tochiotome" strawberry (Fragaria x ananassa Duch.) fruits were cultivated in the Strawberry Research Center (Tochigi, Japan), harvested in winter after ripening, and stored at -80°C until use.
Strawberry fruit extracts were prepared by freeze drying and
then homogenized. Homogenates were suspended in 50% methanol (Sigma-Aldrich, St. Louis, MO, USA) and kept under continuous shaking at room temperature for 2 hours. The solutions were centrifuged at 3000 rpm for 15 minutes, and the supernatants were collected as extracts for analysis.
Strawberry extracts (1 µL) were mixed with an equal volume of 40 mg/mL DHB (2,5-Dihydroxybenzoic acid, in 70% aqueous methanol containing 0.1% FA (formic acid). The mixed solution was deposited onto an indium
tin oxide (ITO)-coated glass slide (Bruker Daltonics, Billerica, MA, USA) and dried before MALDI-MS analysis. MALDI-MS and MS/MS analyses were performed using an ultrafleXtreme MALDI time-of-flight (TOF)/TOF MS system (Bruker Daltonics). MS data was collected in positive-ion reflector mode across a m/z range of 100-600 at a repetition rate of 1000 Hz and was externally calibrated. For MS/MS analysis, the selected precursor ions and the product ions were obtained using collision-induced dissociation MS/MS mode.
Table 1: Anthocyanins identified in this study
Precursor ion, (m/z) [M]+
Fragment ion, (m/z) [M]+
Anthocyanin species
433.1 271 Pelargonidin-3-O-glucoside
449.1 287 Cyanidin-3-O-glucoside
479.1 303 Delphinidin-3-O-glycoside
519.1 271 Pelargonidin-3-O-malonylglucoside
535.1 287 Cyanidin-3-O-malonylglucoside
579.1 271 Pelargonidin-3-O-rutinoside
Figure 1: Mass spectrum obtained from crude strawberry extract using MALDI-MS
400
433.1
449.1
519.1
479.1
535.1
579.1
100
0
450 500 550 600
Rel
ativ
e in
tens
ity
(%)
m/z
478
100
0480
Rel
ativ
e in
tens
ity
(%)
m/z
Sample Preparation of Strawberry Sections for MSI
Fresh mature fruits were immersed in 2% CMC (carboxymethyl cellulose sodium salt, Wako Chemicals) and flash frozen in liquid nitrogen. Subsequently, longitudinal and cross sections, 80 µm thick, were consecutively prepared using a CM 1860 cryostat (Leica Microsystems, Wetzlar, Germany). Sections including achenes, the small shells enclosing
the seeds on the surface of the fruit, were likewise prepared. The sections were then mounted onto ITO-coated glass slides, which were dried in a vacuum desiccator for 20 minutes. The mounted sections were placed in 50 mL conical centrifuge tubes containing silica gel to dry and were stored (within these tubes) at -80°C until analysis.
MALDI matrix was applied to the strawberry sections using a
TM-Sprayer system (HTX Tech- nologies LLC, Carrboro, NC, USA). A DHB solution, 30 mg/mL in 50% aqueous methanol containing 0.1% FA, was used. The solvent flow rate, nozzle speed, number of passes, and temperature were set at 0.2 mL/min, 1200 mm/min, 81 and 85 °C, respectively.
MSI was performed according to a previous study [5] with some modifications. Data was acquired on the Bruker ultrafleXtreme MALDI time-of-flight (TOF)/TOF MS with a step size of 200 µm. The laser diameter was set to medium size. Other measurement conditions were as previously described.
Data Analysis
For the profiling of the strawberry fruit extracts, the obtained MS and MS/MS spectra were analyzed using flexAnalysis 3.4 software (Bruker Daltonics). The sugar moieties of anthocyanin species were identified from their neutral losses and previous reports [6].
For the MSI studies, the acquired mass spectra were normalized by total ion current (TIC) using flexlmaging 4.0 software (Bruker Daltonics). The software was also used to create two-dimensional ion-density maps.
Results and Discussion
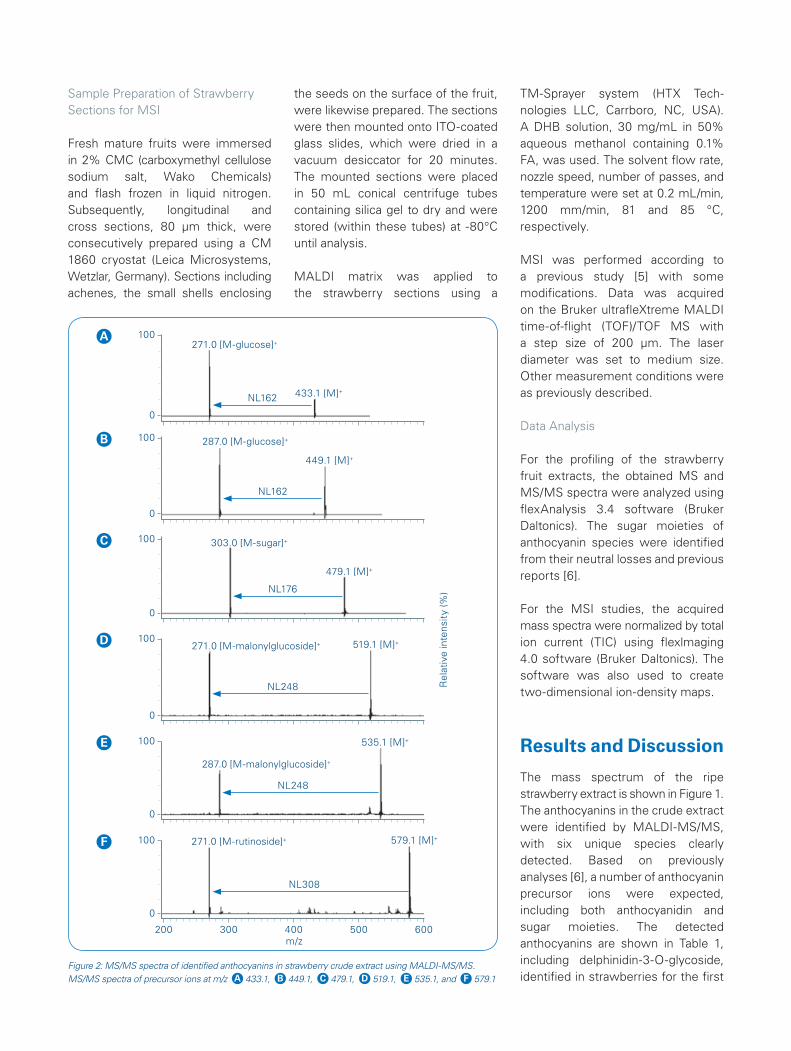
The mass spectrum of the ripe strawberry extract is shown in Figure 1. The anthocyanins in the crude extract were identified by MALDI-MS/MS, with six unique species clearly detected. Based on previously analyses [6], a number of anthocyanin precursor ions were expected, including both anthocyanidin and sugar moieties. The detected anthocyanins are shown in Table 1, including delphinidin-3-O-glycoside, identified in strawberries for the first
Figure 2: MS/MS spectra of identified anthocyanins in strawberry crude extract using MALDI-MS/MS. MS/MS spectra of precursor ions at m/z A 433.1, B 449.1, C 479.1, D 519.1, E 535.1, and F 579.1
Rel
ativ
e in
tens
ity
(%)
F
200
NL308
579.1 [M]+271.0 [M-rutinoside]+100
0
300 400 500 600m/z
E
NL248
535.1 [M]+
287.0 [M-malonylglucoside]+
100
0
D
NL248
519.1 [M]+271.0 [M-malonylglucoside]+100
0
C
NL176
479.1 [M]+
303.0 [M-sugar]+100
0
B
NL162
449.1 [M]+
287.0 [M-glucose]+100
0
A
NL162 433.1 [M]+
271.0 [M-glucose]+100
0

Figure 3: MALDI-MSI analysis of anthocyanins in strawberry sections. A Mass spectrum obtained from a section. B Optical image of a strawberry section. C - H Representative ion images of m/z 433.1, 519.1, 579.1, 449.1, 535.1, and 479.1. Scale bar = 5 mm
Figure 4: MALDI-MSI analysis of anthocyanins in an achene. A Optical image of an achene section. B - G Representative ion images of m/z 433.1, 519.1, 579.1, 449.1, 535.1, and 479.1. Scale bar = 1 mm
G m/z 535.1100
0
H m/z 479.1100
0
C m/z 433.1100
0
A
D m/z 519.1100
0
E m/z 579.1100
0
F m/z 449.1100
0
400
433.1
449.1
519.1
535.1
579.1
100
0
450 500 550 600
Rel
ativ
e in
tens
ity
(%)
m/z
479.1
478
100
0480
Rel
ativ
e in
tens
ity
(%)
m/z
B
Receptacle
Skin
Cortical tissue
Vascular bundle
Pith tissue
Receptacle
B
E
C
F
D
G
m/z 433.1
m/z 449.1
m/z 519.1
m/z 535.1
m/z 579.1
m/z 479.1
100
100
100
100
100
100
0
0
0
0
0
0
A Optical image
Achene

Conclusion
• In this study, anthocyanin compounds were detected and localized within "Tochiotome" strawberry fruits slices via MALDI-TOF MSI on a Bruker ultraflextreme MS system. Embedding the fresh fruit in CMC prior to freezing and slicing maintained the form of the delicate flesh. Matrix application using the HTX Technologies TM-Sprayer provided a uniform and reproducible distribution of the DHB matrix solution, and the use of elevated temperature (85°C) promoted extraction of targeted analytes from the strawberry slices. A preliminary study of extracts prepared from the strawberries confirmed the presence and identities of the anthocyanins. These anthocyanins include delphinidin-3-O-glycoside, identified in strawberries for the first time.
• MSI techniques, such as those made by MALDI-TOF MS, can rapidly provide a unique depth and breadth of molecular spatial distribution information within a sample. This analytical approach can provide significant detail on target compound production during fruit maturation, under different growth conditions, and in varietal selection screens. Knowledge of the expression and localization of these compounds of interest may direct the development of “healthier” fruits for direct consumer consumption and to improve yields in the preparation of anthocyanin-rich extracts. Further, this analytical approach may be applied to help assess the absorption, distribution, and metabolization of anthocyanin compounds – with both topical and oral administration – as their potential benefits for health and well-being are better understood.
time. The MS/MS spectra, shown in Figure 2, indicate the neutral loss of sugars in each of the anthocyanins by the detection of their aglycone forms.
All peaks corresponding to the antho-cyanins identified in the crude extract (Figure 1) were also observed in the spectra from the MSI data collected on strawberry slices (Figure 3A). An optical image of a longitudinal cross section of a strawberry is shown in Figure 3B. Red pigment is present in the skin, cortical, and pith tissues
of the fruit, indicating the presence of anthocyanins, and the detected anthocyanin species showed different distribution patterns within the sections. Pelargonidin species were distributed in the skin, cortical, and pith tissues (Figure 3C-E), whereas cyanidin and delphinidin species were localized in the skin (Figure 3F-H). Their aglycones showed similar distribution patterns to these glycosides (data not shown).
An optical image of an achene section is shown in Figure 4A. As
shown in Figure 4B-F, pelargonidin glycosides and cyanidin glycosides were detected in the (surface) fruit skin, while delphinidin glycoside was only slightly detected (Figure 4G). Cyanidin species were also notably detected on the outer surface of the achene, which is of interest given previous studies indicating that the antioxidant capacity of the achene is considerably higher than that of the strawberry receptacle flesh [7].

Bru
ker
Dal
toni
cs is
con
tinua
lly im
prov
ing
its p
rodu
cts
and
rese
rves
the
rig
ht
to c
hang
e sp
ecifi
catio
ns w
ithou
t no
tice.
© B
ruke
r D
alto
nics
02-
2019
, MT-
120,
18
6736
8
Bruker Daltonik GmbH
Bremen · GermanyPhone +49 (0)421-2205-0
Bruker Scientific LLC
Billerica, MA · USA Phone +1 (978) 663-3660
For Research Use Only. Not for Use in Clinical Diagnostic Procedures.
[email protected] – www.bruker.com
Learn More
References
[1] Yoshimura Y, Goto-Inoue N, Moriyama T, Zaima N. 2016. Significant advancement of mass spectrometry imaging for food chemistry. Food Chem, 210, 200-211.
[2] Lin BW, Gong CC, Song HF, Cui YY. 2016. Effects of anthocyanins on the prevention and treatment of cancer. Br J Pharmacol, 174(11), 1226-1243.
[3] Giampieri F Gasparrini M, Forbes-Hernandez T Y, et al. 2018. Overexpression of the Anthocyanidin Synthase Gene in Strawberry Enhances Antioxidant Capacity and Cytotoxic Effects on Human Hepatic Cancer Cells. J. Agric. Food Chem, 66, 581-592.
[4] Nile S H, Park S W. 2014. Edible berries: bioactive components and their effect on human health. Nutrition, 30, 134-144.
[5] Zaima N, Sasaki T, Tanaka H, et al. 2011. Imaging mass spectrometry-based histopathologic examination of atherosclerotic lesions. Atherosclerosis, 117, 427-32.
[6] Giampieri F, Alvarez-Suarez J M, Battino M. 2014. Strawberry and human health: Effects beyond antioxidant activity. J. Agric. Food Chem, 62, 3867-3876.
[7] Ariza MT, Reboredo-Rodríguez P, Mazzoni L, et al. 2016. Strawberry Achenes Are an Important Source of Bioactive Compounds for Human Health. Int J Mol Sci.17(7):1103.
You are looking for further Information? Check out the link or scan the QR code for more details.
www.bruker.com/maldi-imaging


