MALDI-MS: A Powerful but Underutilized Mass Spectrometric ...
13
93 Vol. 12, No. 3, 2021 ISSN 2233-4203/ e-ISSN 2093-8950 REVIEW www.msletters.org | Mass Spectrometry Letters MALDI-MS: A Powerful but Underutilized Mass Spectrometric Technique for Exosome Research Iqbal Jalaludin 1 , David M. Lubman 2 , and Jeongkwon Kim 1,3 * 1 Department of Chemistry, Chungnam National University, Daejeon, Korea 2 Department of Surgery, University of Michigan Medical Center, Ann Arbor, MI, USA 3 Graduate School of New Drug Discovery and Development, Chungnam National University, Daejeon, Korea Received September 14, 2021, Revised September 25, 2021, Accepted September 27, 2021 First published on the web September 30, 2021; DOI: 10.5478/MSL.2021.12.3.93 Abstract : Exosomes have gained the attention of the scientific community because of their role in facilitating intercellular communi- cation, which is critical in disease monitoring and drug delivery research. Exosome research has grown significantly in recent decades, with a focus on the development of various technologies for isolating and characterizing exosomes. Among these efforts is the use of matrix-assisted laser desorption ionization (MALDI) mass spectrometry (MS), which offers high-throughput direct analysis while also being cost and time effective. MALDI is used less frequently in exosome research than electrospray ionization due to the diverse popu- lation of extracellular vesicles and the impurity of isolated products, both of which necessitate chromatographic separation prior to MS analysis. However, MALDI-MS is a more appropriate instrument for the analytical approach to patient therapy, given it allows for fast and label-free analysis. There is a huge drive to explore MALDI-MS in exosome research because the technology holds great potential, most notably in biomarker discovery. With methods such as fingerprint analysis, OMICs profiling, and statistical analysis, the search for biomarkers could be much more efficient. In this review, we highlight the potential of MALDI-MS as a tool for investigating exo- somes and some of the possible strategies that can be implemented based on prior research. Keywords : MALDI, Mass Spectrometry, Exosomes, Extracellular Vesicles Contents I. Introduction ······································································· 93 II. MALDI-MS ····································································· 95 A. MALDI process ··························································· 95 B. MALDI matrix selection ············································· 96 C. MALDI laser ······························································· 96 III. Extracellular vesicles ····················································· 98 A. Exosome biogenesis ···················································· 98 B. Biological role of exosomes ········································ 99 C. Exosome enrichment methods ···································· 99 a. Ultracentrifugation ··················································· 99 b. Ultrafiltration ···························································· 99 c. Polymer-based enrichment ····································· 100 d. Size exclusion chromatography ····························· 100 IV. MALDI-MS strategies in exosome research ··············· 100 A. Fingerprint analysis ··················································· 101 B. OMICs profiling ························································ 101 C. Statistical analysis ······················································ 101 V. Conclusion ······································································ 101 I. Introduction Various technologies have been developed in the past decades that aim to facilitate the exploration of the emerging field of exosomes, which is becoming more prominent in the scientific community. 1,2 The role of exosomes in mediating intercellular communication 3,4 may be associated with numerous medical issues, including immune responses, 5 viral pathogenicity, 6 pregnancy, 7,8 cardiovascular diseases, 9 central nervous system-related diseases, 10 and tumor progression. 11 To function properly, exosomes transport their cargo containing molecules, such as proteins, metabolites, DNA, messenger RNA, and microRNA, *Reprint requests to Jeongkwon Kim https://orcid.org/0000-0002-0087-1151 E-mail: [email protected]r All the content in Mass Spectrometry Letters (MSL) is Open Access, meaning it is accessible online to everyone, without fee and authors’ permission. All MSL content is published and distributed under the terms of the Creative Commons Attribution License (http://creativecommons.org / licenses/by/3.0/). Under this license, authors reserve the copyright for their content; however, they permit anyone to unrestrictedly use, distribute, and reproduce the content in any medium as far as the original authors and source are cited. For any reuse, redistribution, or reproduction of a work, users must clarify the license terms under which the work was produced.
Transcript of MALDI-MS: A Powerful but Underutilized Mass Spectrometric ...
93
Vol. 12, No. 3, 2021
ISSN 2233-4203/ e-ISSN 2093-8950REVIEW www.msletters.org | Mass Spectrometry Letters
MALDI-MS: A Powerful but Underutilized Mass Spectrometric Technique
for Exosome Research
Iqbal Jalaludin1, David M. Lubman
2, and Jeongkwon Kim
1,3*
1Department of Chemistry, Chungnam National University, Daejeon, Korea2Department of Surgery, University of Michigan Medical Center, Ann Arbor, MI, USA3Graduate School of New Drug Discovery and Development, Chungnam National University, Daejeon, Korea
Received September 14, 2021, Revised September 25, 2021, Accepted September 27, 2021
First published on the web September 30, 2021; DOI: 10.5478/MSL.2021.12.3.93
Abstract : Exosomes have gained the attention of the scientific community because of their role in facilitating intercellular communi-cation, which is critical in disease monitoring and drug delivery research. Exosome research has grown significantly in recent decades,with a focus on the development of various technologies for isolating and characterizing exosomes. Among these efforts is the use ofmatrix-assisted laser desorption ionization (MALDI) mass spectrometry (MS), which offers high-throughput direct analysis while alsobeing cost and time effective. MALDI is used less frequently in exosome research than electrospray ionization due to the diverse popu-lation of extracellular vesicles and the impurity of isolated products, both of which necessitate chromatographic separation prior to MSanalysis. However, MALDI-MS is a more appropriate instrument for the analytical approach to patient therapy, given it allows for fastand label-free analysis. There is a huge drive to explore MALDI-MS in exosome research because the technology holds great potential,most notably in biomarker discovery. With methods such as fingerprint analysis, OMICs profiling, and statistical analysis, the searchfor biomarkers could be much more efficient. In this review, we highlight the potential of MALDI-MS as a tool for investigating exo-somes and some of the possible strategies that can be implemented based on prior research.
Keywords : MALDI, Mass Spectrometry, Exosomes, Extracellular Vesicles
Contents
I. Introduction ······································································· 93
II. MALDI-MS ····································································· 95
A. MALDI process ··························································· 95
B. MALDI matrix selection ············································· 96
C. MALDI laser ······························································· 96
III. Extracellular vesicles ····················································· 98
A. Exosome biogenesis ···················································· 98
B. Biological role of exosomes ········································ 99
C. Exosome enrichment methods ···································· 99
a. Ultracentrifugation ··················································· 99
b. Ultrafiltration ···························································· 99
c. Polymer-based enrichment ····································· 100
d. Size exclusion chromatography ····························· 100
IV. MALDI-MS strategies in exosome research ··············· 100
A. Fingerprint analysis ··················································· 101
B. OMICs profiling ························································ 101
C. Statistical analysis ······················································ 101
V. Conclusion ······································································ 101
I. Introduction
Various technologies have been developed in the past
decades that aim to facilitate the exploration of the
emerging field of exosomes, which is becoming more
prominent in the scientific community.1,2 The role of
exosomes in mediating intercellular communication3,4 may
be associated with numerous medical issues, including
immune responses,5 viral pathogenicity,6 pregnancy,7,8
cardiovascular diseases,9 central nervous system-related
diseases,10 and tumor progression.11 To function properly,
exosomes transport their cargo containing molecules, such as
proteins, metabolites, DNA, messenger RNA, and microRNA,
*Reprint requests to Jeongkwon Kimhttps://orcid.org/0000-0002-0087-1151
E-mail: [email protected]
All the content in Mass Spectrometry Letters (MSL) is Open Access,meaning it is accessible online to everyone, without fee and authors’permission. All MSL content is published and distributed under the terms ofthe Creative Commons Attribution License (http://creativecommons.org /licenses/by/3.0/). Under this license, authors reserve the copyright for theircontent; however, they permit anyone to unrestrictedly use, distribute, andreproduce the content in any medium as far as the original authors andsource are cited. For any reuse, redistribution, or reproduction of a work,users must clarify the license terms under which the work was produced.
Iqbal Jalaludin, David M. Lubman, and Jeongkwon Kim
94 Mass Spectrom. Lett. 2021 Vol. 12, No. 3, 93–105 ©Korean Society for Mass Spectrometry
to specific cells to maintain cellular homeostasis.12,13
Exosomes are not only being studied for their roles in
disease diagnostics and therapeutics14,15 but also as a tool
for drug delivery.16
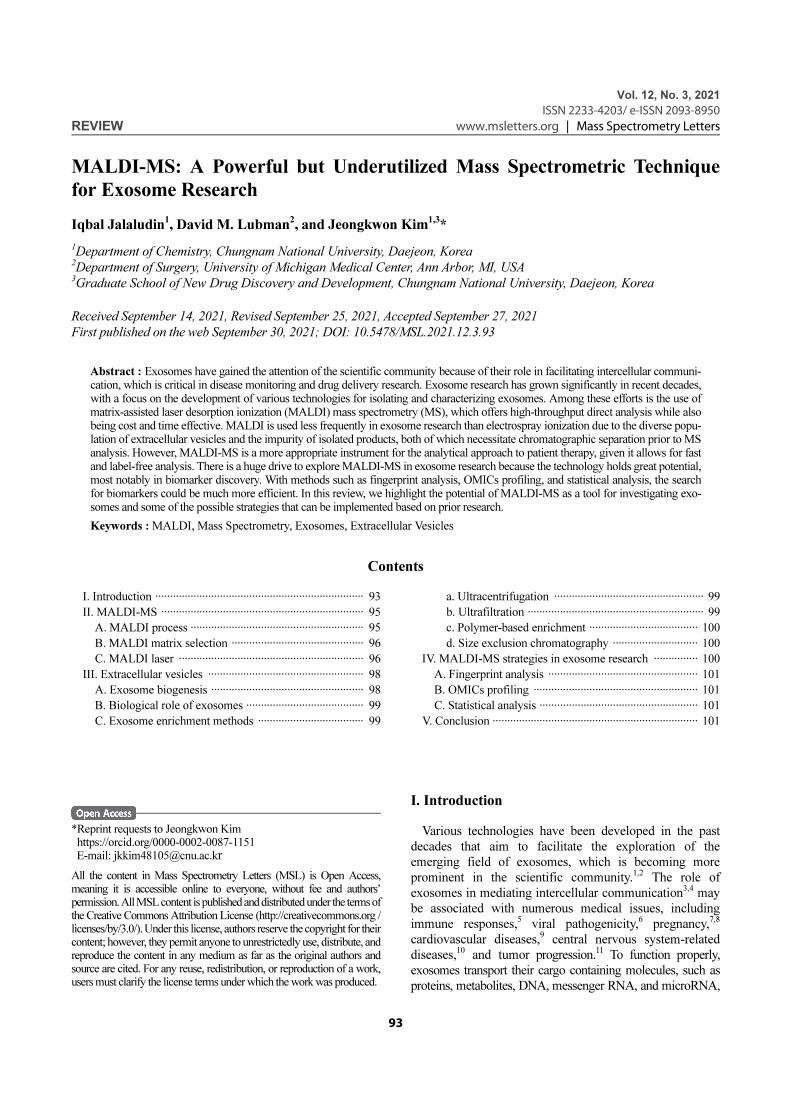
Exosomes are extracellular vesicle subtypes derived
from various cells and are commonly categorized by their
size, which ranges from 30 to 150 nm in diameter.17
Exosomes are produced within the endosomal membrane
as intraluminal vesicles and are secreted into the
extracellular environment after the fusion of multivesicular
bodies (MVBs) with the cell surface.18 The biogenesis of
exosomes is illustrated in Figure 1. Early exosome research
focused heavily on cultured cells, where numerous
observations of exosome secretion were reported.19-21 The
prospect of using exosomes as biomarkers for diseases
diagnosis has prompted researchers to investigate exosomes
from various biological fluids, such as blood,22 urine,23
saliva,24 breast milk,25 amniotic fluid,26 and seminal fluid.27
However, biofluids contain a wide range of constituents and
co-isolation of non-exosome contaminants, such as
lipoproteins28 and non-exosome proteins is likely.29
Furthermore, determining the origin of exosomes, the
physiochemical and biochemical commonalities between
extracellular vesicles, and the heterogeneity of exosomes
poses a challenge to the development of standardized
methods for exosome isolation and analysis.30
Currently, ultracentrifugation is considered the gold standard
for isolating exosomes,31,32 with alternative techniques being
polymer-based precipitation,33 ultrafiltration,34 and size
exclusion chromatography (SEC).35 Each approach has
benefits and limitations that have major impacts on the final
isolated products. For example, the use of ultracentrifugation
has been shown to generate large amounts of exosomes,
but the lengthy isolation procedure may be inefficient for
practical use.29 By contrast, ultrafiltration may reduce
isolation time, but the risk for exosome loss due to
membrane filter clogs requires the use of highly sensitive
techniques for subsequent exosome characterization.29
Exosome research has fortunately emerged alongside
various complementary characterization methodologies,
such as immunoblotting, nanoparticle tracking analysis,
electron microscopy, and mass spectrometry (MS).36,37 MS
instrumentation has frequently been used in exosome
studies for prognostic and diagnostic biomarker
discovery.38 The emergence of soft ionization techniques,
such as matrix-assisted laser desorption ionization
(MALDI) and electrospray ionization (ESI), have
significantly simplified MS analysis and produce less
complicated spectrums for exosome component
identification.
Both MALDI and ESI ionization techniques for MS
emerged in the late 1980s and have been extensively used
for biomolecule studies.39,40 However, based on the results
of electronic searches of the Scopus and PubMed online
databases, exosome research is more frequently performed
using ESI-MS analysis than MALDI ionization. As of
Figure 1. Biogenesis and structure of exosomes. Exosomes and ectosomes (microvesicles) are the two primary types of extracellular
vesicles, which are distinguished by their origin and size. Exosomes (30-150 nm) are released into the extracellular microenvironment
by MVB fusion to the plasma membrane, whereas microvesicles (up to 1 µm) are shed from the outward budding of the plasma
membrane. Exosomes contain numerous biological components, including nucleic acids, proteins, lipids, and metabolites.
A Powerful but Underutilized Mass Spectrometric Technique for Exosome Research
©Korean Society for Mass Spectrometry Mass Spectrom. Lett. 2021 Vol. 12, No. 3, 93–105 95
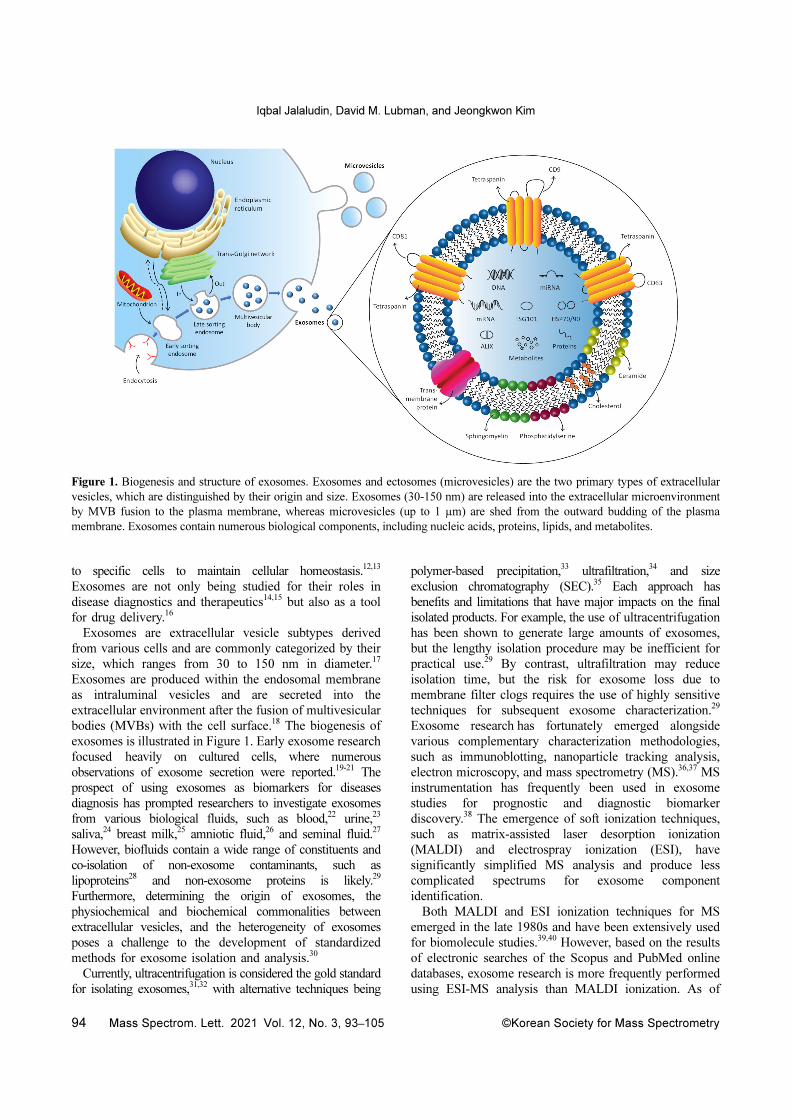
August 6, 2021, the keywords “exosome” and “mass
spectrometry” produced 1030 hits in Scopus and 879 in
PubMed. Adding the term “MALDI” to the preceding
search resulted in 40 hits in Scopus and 60 in PubMed
(Figure 2). Substituting the phrase “MALDI” with “liquid
chromatography,” which is the most typical setting for
ESI-MS analysis, yielded 428 hits in Scopus and 290 in
PubMed (Figure 2). The selection between the two
ionization methods is closely related to methodological
approaches, where ESI-MS being used in bottom-up
proteomics41 and MALDI-MS used in top-down
proteomics.42 However, exosomes comprise a wide range
of components associated with biological functions and
diseases,2 and focusing on a single analytical method is not
sufficiently comprehensive. Hence, there is a need for
MALDI-MS in exosome research, as it allows for the
discovery of more novel insights from different perspectives.
In addition, MALDI-MS is not only capable of performing
high-throughput label-free and direct analysis,43 but it is
also a cost- and time-efficient approach.
The strategies and applications of MALDI-MS analytical
techniques in exosome research are the focus of this
review. A brief introduction to MALDI-MS and exosomes
is provided to assist with the understanding of these
subjects in their respective settings. In addition, the current
trends of exosome research that utilize MALDI-MS are
summarized to demonstrate the ability of MALDI-MS to
serve as a valuable tool in exosome research.
II. MALDI-MS
MS is an analytical tool for determining the mass-to-
charge ratio (m/z) of ionized species. Initially developed in
the early 1900s, it was not extensively employed for
biological substances, such as proteins, until the late 1980s
when MALDI39 and ESI40 were introduced. Both ionization
methods are termed “soft-ionization,” because they prevent
extensive fragmentation of the molecules, resulting in
limited loss of sample integrity.44 MALDI not only has low
fragmentation ionization, it also predominantly produces
singly charged ions, which significantly reduces spectrum
complexity.45 Along with automated features that enable
high throughput and rapid analysis, MALDI is frequently
employed in macromolecule research.46,47 The following
sections provide a brief overview of the basic principles of
MALDI-MS, as well as a brief history and important
findings. MALDI technologies, such as matrices,48-50
lasers,51,52 and desorption/ionization processes,53-55 have
been comprehensively reviewed in other publications.
A. MALDI process
MALDI is an ionization method that uses a laser energy
absorbing matrix to generate ions from large molecules
with little fragmentation.56 Soft ionization methods, such as
MALDI and ESI, are required to ionize large molecules,
such as biomolecules (e.g., DNA, proteins, and
carbohydrates) and polymers, as these molecules are easily
fragmented by other hard ionization methods. Electron
ionization, thermal ionization, and inductively coupled
plasma ionization are examples of hard ionization methods,
which produce complicated spectrums that are difficult to
interpret. MALDI mass spectrum generally display singly
charged ions, which is useful for evaluating complex
samples. Multiply charged ions are often needed for
expanding the mass range on the mass spectrum or
improving fragmentation for structural analysis.57 Several
examples of multiple charged ion studies using MALDI-
MS have been reported.58,59 MALDI involves the use of a
matrix and a laser to facilitate a three-step process, which
involves the incorporation of sample and matrix on a metal
plate, the disintegration of the analyte-matrix solid into
vacuum upon the laser beam ablation, and the ionization of
analyte molecules through ion-molecule reactions in the
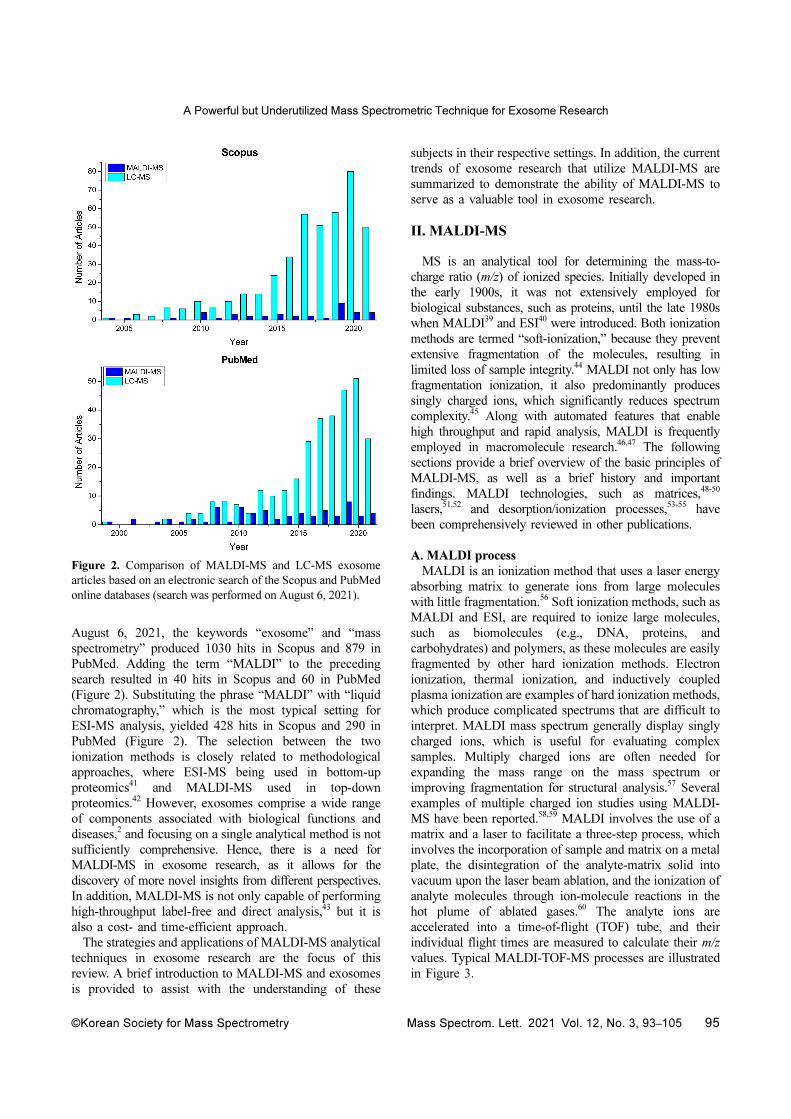
hot plume of ablated gases.60 The analyte ions are
accelerated into a time-of-flight (TOF) tube, and their
individual flight times are measured to calculate their m/z
values. Typical MALDI-TOF-MS processes are illustrated
in Figure 3.
Figure 2. Comparison of MALDI-MS and LC-MS exosome
articles based on an electronic search of the Scopus and PubMed
online databases (search was performed on August 6, 2021).
Iqbal Jalaludin, David M. Lubman, and Jeongkwon Kim
96 Mass Spectrom. Lett. 2021 Vol. 12, No. 3, 93–105 ©Korean Society for Mass Spectrometry
B. MALDI matrix selection
Matrix selection can significantly influence the resulting
mass spectrum.48,61 In general, there are three types of
matrices available: organic, ionic liquid matrices,49 and
inorganic matrices.62 Organic matrices are the most
frequently used in MALDI-MS analysis because they are
widely available and compatible with various analytes. The
drawback of organic matrices is the generation of background
interferences from matrix fragmentation and adduct
formation, which makes elucidation in the low m/z region (<
m/z 500) difficult.63 Sinapinic acid,64 2,5-dihydroxybenzoic
acid (DHB),56 and α-cyano-4-hydroxycinnamic acid (CHCA)65
are examples of typical organic matrices.66 These three
organic matrices have frequently been used in exosome
research to identify biomarkers by profiling proteins and
lipids.37,67,68
Small organic compounds containing aromatic rings with
delocalized π electrons were initially proposed as matrices
as they demonstrated significant resonance absorption at
MALDI laser wavelengths, which are typically in the
ultraviolet (UV) range (337 nm or 355 nm).69 Other factors
important to matrix selection include the ability to tolerate
a high vacuum, the ability to produce analyte ions, the
ability to segregate generated ions to avoid the formation
of analyte clusters, and the ability to homogeneously co-
crystallize with analytes.48 The last two criteria are not
required as ionization and detection is still possible,
although the outcomes may be undesirable. The formation
of analyte clusters, for example, may lead to the generation
of dimers, which can complicate the acquired MALDI
mass spectra. Matrix-analyte crystal homogeneity impacts
“shot-to-shot” reproducibility, which is critical for
quantitative analysis.70,71 In addition, the method used to
mix the matrix and sample may affect crystal homogeneity.
The traditional dried droplet approach has been enhanced
through advances in crystal uniformity that use forced
droplet drying with the freeze-vacuum drying technique72
and recrystallization of dried droplets with acetonitrile.71
To the best of our knowledge, no studies have focused on
comparing MALDI-MS sample preparation methods in
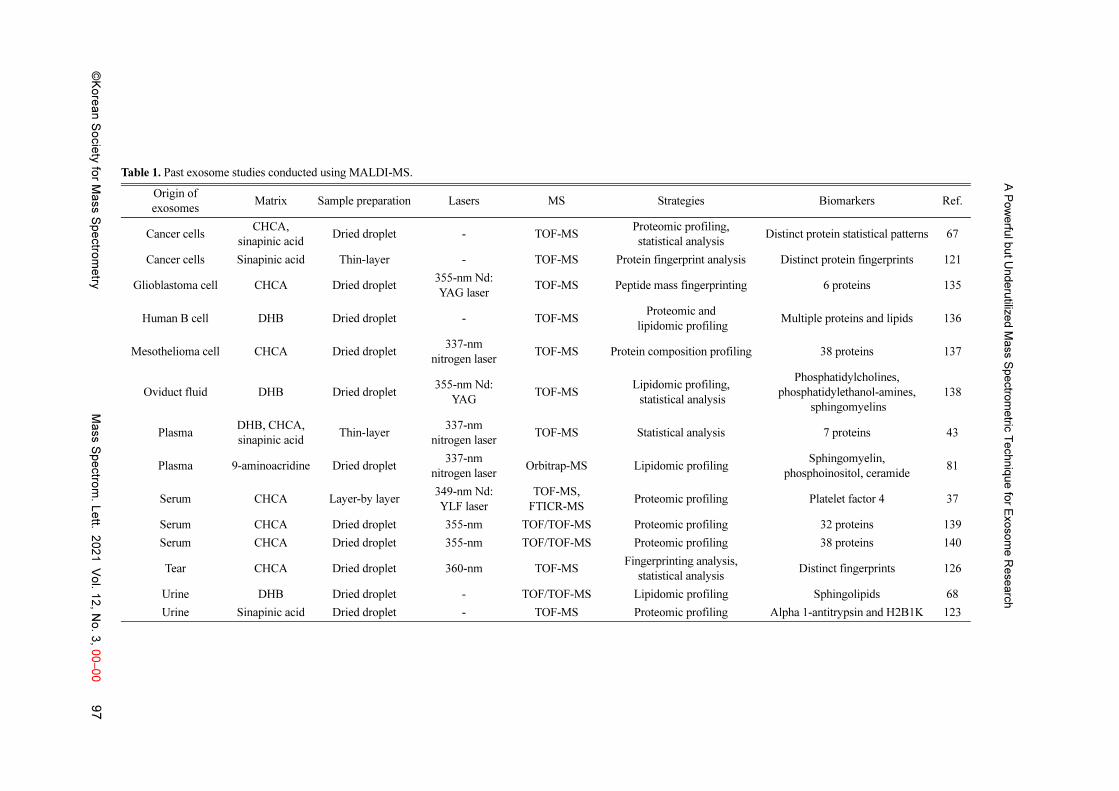
exosome research. Table 1 highlights the exosome studies
that utilize MALDI-MS, as well as the matrix and sample
preparation procedures.
C. MALDI laser
The purpose of the MALDI laser is to irradiate the
samples, which induces ablation and desorption on the
analyte–matrix surface. Various MALDI laser configurations
have been developed since the first application for MS in
1966, in which the laser beam was designed to strike the
back of the samples and ablate the samples on the front side
toward a TOF chamber.73 In 1985, matrix-assisted lasers
produced two peaks for the amino acids tryptophan and
alanine only when simultaneously analyzed using 266 nm
laser light from an Nd:YAG laser.74 Tryptophan was shown
to behave like a laser-absorbing matrix by assisting with
the ionization of alanine, indicating that laser desorption
ionization was matrix-assisted. Today, the Nd:YAG laser at
Figure 3. Schematic diagrams showing MALDI-TOF-MS processes for (a) linear and (b) reflectron modes. Linear mode is often used
for samples with high molecular weight samples, whereas reflectron mode provides high resolution and mass accuracy for low
molecular weight samples.
A P
ow
erfu
l but U
nderu
tilized M
ass S
pectro
metric
Techniq
ue fo
r Exosom
e R
esearc
h
©K
ore
an
So
cie
ty fo
r Ma
ss S
pe
ctro
metry
Ma
ss S
pectro
m. L
ett.
202
1V
ol. 1
2, N
o. 3
, 00–0
097
Table 1. Past exosome studies conducted using MALDI-MS.
Origin of
exosomesMatrix Sample preparation Lasers MS Strategies Biomarkers Ref.
Cancer cellsCHCA,
sinapinic acidDried droplet - TOF-MS
Proteomic profiling,
statistical analysisDistinct protein statistical patterns 67
Cancer cells Sinapinic acid Thin-layer - TOF-MS Protein fingerprint analysis Distinct protein fingerprints 121
Glioblastoma cell CHCA Dried droplet355-nm Nd:
YAG laserTOF-MS Peptide mass fingerprinting 6 proteins 135
Human B cell DHB Dried droplet - TOF-MSProteomic and
lipidomic profilingMultiple proteins and lipids 136
Mesothelioma cell CHCA Dried droplet337-nm
nitrogen laserTOF-MS Protein composition profiling 38 proteins 137
Oviduct fluid DHB Dried droplet355-nm Nd:
YAGTOF-MS
Lipidomic profiling,
statistical analysis
Phosphatidylcholines,
phosphatidylethanol-amines,
sphingomyelins
138
Plasma DHB, CHCA,
sinapinic acidThin-layer
337-nm
nitrogen laserTOF-MS Statistical analysis 7 proteins 43
Plasma 9-aminoacridine Dried droplet337-nm
nitrogen laserOrbitrap-MS Lipidomic profiling
Sphingomyelin,
phosphoinositol, ceramide81
Serum CHCA Layer-by layer349-nm Nd:
YLF laser
TOF-MS,
FTICR-MSProteomic profiling Platelet factor 4 37
Serum CHCA Dried droplet 355-nm TOF/TOF-MS Proteomic profiling 32 proteins 139
Serum CHCA Dried droplet 355-nm TOF/TOF-MS Proteomic profiling 38 proteins 140
Tear CHCA Dried droplet 360-nm TOF-MSFingerprinting analysis,
statistical analysisDistinct fingerprints 126
Urine DHB Dried droplet - TOF/TOF-MS Lipidomic profiling Sphingolipids 68
Urine Sinapinic acid Dried droplet - TOF-MS Proteomic profiling Alpha 1-antitrypsin and H2B1K 123
Iqbal Jalaludin, David M. Lubman, and Jeongkwon Kim
98 Mass Spectrom. Lett. 2021 Vol. 12, No. 3, 93–105 ©Korean Society for Mass Spectrometry
wavelength of 355 nm is one of the most commonly used
UV lasers in commercial applications of MALDI.75
Aside from UV lasers, other lasers developed for
MALDI are visible lasers,76,77 ultrafast lasers,78 infrared
(IR) lasers,79 and two-lasers.80 Each laser has certain benefits
and drawbacks, but UV lasers appear to be more
advantageous, which makes them the obvious choice in
modern MALDI systems. Indeed, direct absorption of UV
and IR lasers can result in the fragmentation of
macromolecules, which may hinder the detection of
molecular ions.77 The use of visible lasers has been proposed
as an alternative due to the transparency of macromolecules
in the visible range.76 However, additional constraints
involving matrix compounds that must absorb laser energy
and promote ionization when desorbed with analytes make
visible lasers less efficient.51
MALDI-MS analyses of exosome research do not always
specify laser type and wavelength, because the laser in most
commercial MALDI-MS equipment is not interchangeable.
Low-repetition-rate lasers, such as the nitrogen laser (~100
Hz), have been actively used in exosome research,43,81 along
with higher-repetition-rate lasers such as Nd:YAG (~10 kHz)
and Nd:YLF (~5 kHz).37 To the best of our knowledge,
studies comparing the use of different lasers in exosome
research have not been pursued. The types of lasers used in
previous exosome studies are listed in Table 1.
III. Extracellular vesicles
Current extracellular vesicle research focuses on
classification, isolation techniques, and understanding their
biological role in disease progression and therapy.82
Despite a considerable increase in publications and studies,
extracellular vesicle research remains limited due to a lack
of understanding resulting from the absences of a standard
reference, limited replication of the findings, and a lack of
examples that integrate the fundamental science with
patient treatment.82 Difficulties generating highly purified
extracellular vesicles, performing single-particle detection,
and imaging extracellular vesicles at a reliable resolution
hinder extracellular vesicle research from reaching the next
step of clinical application.82,83
Extracellular vesicles are often classified into two types:
exosomes and ectosomes.84 Exosomes, as previously stated,
are of endosomal origin and average 100 nm in size, whereas
ectosomes, also known as microvesicles, are larger vesicles
(up to 1 µm) produced by the direct outward budding of the
plasma membrane (Figure 1).83 The following sections focus
on exosomes, specifically their biogenesis and general
biological functions. In addition, common isolation methods
are briefly discussed to set a base for the subsequent topic.
Comprehensive reviews of exosome biogenesis83, intercellular
communication4, homeostasis85, biomarkers23,38, isolation
techniques36, and potential applications14,15 have been
discussed in other publications.
A. Exosome biogenesis
Exosomes are produced in the endosomal membrane as
intraluminal vesicles beginning with the double
invagination (inward budding) of the plasma membrane.
The final steps involve the creation of MVB-containing
intraluminal vesicles before the release of the exosome into
the extracellular milieu. The first invagination is an
endocytosis process that occurs at the plasma membrane
and produces a cup-shaped pocket that holds cell-surface
and extracellular proteins. Following the separation of the
invaginated structures from the membrane, early sorting
endosomes (ESEs) are formed and in certain cases, may
merge with ESEs produced by constituents of the
endoplasmic reticulum, mitochondria, and the trans-Golgi
network. ESEs later mature into late-sorting endosomes
(LSEs), where the second invagination occurs, resulting in
the formation of intraluminal vesicles. Further modification
may occur here, although the final formation of the
intraluminal vesicle is the introduction of cytoplasmic
constituents into the LSE or their release into the cytoplasm.
In addition, the size of the intraluminal vesicles varies
depending on the volume of invagination and the proteins
originally introduced from the cell surfaces. LSE develops
into MVB, which include intraluminal vesicles in their
final form, ready to fuse with the plasma membrane. MVB
fusion results in intraluminal vesicles (or exosomes, in this
case) being released into the extracellular space through
the exocytosis process.83
Several proteins involved in the formation and
biogenesis of exosomes can be found on the surface of the
exosome membrane or within exosomes. Exosome surface
proteins include tetraspanin proteins (e.g., CD9, CD81, and
CD63),86 while proteins contained in exosomes include
apoptosis-linked gene 2-interacting protein X (ALIX) and
tumor susceptibility gene 101 (TSG101), all of which are
frequently used as markers for exosome characterization.87
Other types of proteins found in exosomes are classified as
chaperone proteins (e.g., Hsp70 and Hsp90), enzymes
(e.g., GAPDH and ATPase), signaling proteins (e.g., EGFR
and HIF-1α), and exoskeletal proteins (e.g., actin and
tubulin).88 Certain exosome proteins are cell-specific, such
as MHC-I/II on the surface of dendritic cell-derived
exosomes and PD-L1 on the surface of cancer cell-derived
exosomes.83 Exosome membrane structures are primarily
built by lipids, including phospholipids, spingolipids, and
cholesterol that act to increase exosome flexibility and
rigidity, as well as protect the exosome contents from
various stimuli in the circulating fluids.89 Other lipids, such
as fatty acids90 and eicosanoids,91 are contained inside and
transported by exosomes and are subjected to intercellular
communication rather than the structural components of
exosomes. Exosomes also include nucleic acid-based
components such as DNA and RNA (e.g., messenger RNA
and microRNA), which may affect the expression of
genetic information in recipient cells.92
A Powerful but Underutilized Mass Spectrometric Technique for Exosome Research
©Korean Society for Mass Spectrometry Mass Spectrom. Lett. 2021 Vol. 12, No. 3, 93–105 99
B. Biological role of exosomes
The primary purpose of exosomes is to contain and deliver
biological components that serve as information to recipient
cells. Exosomes are considered mediators of various
biological processes, including intercellular communication3
and maintenance of cellular homeostasis.12 Exosomes
discharged into the extracellular environment by their parent
cells merge their membrane contents with the recipient cell
plasma membrane and deliver effectors, such as transcrip-
tion molecules, oncogenes, and small and large non-coding
regulatory RNAs.93 In addition to their role in therapeutics,
such as stem cell maintenance,94 tissue repair,95 and blood
coagulation,96 exosomes also affect disease pathogenesis,
including tumor growth,97 inflammation,98 and immuno-
suppression.99
C. Exosome enrichment methods
The selected isolation method affects exosome recovery
and can result in possible discrepancies in the identification of
biological components associated with exosomes. The
ultracentrifugation enrichment approach is currently considered
the gold standard for isolating exosomes as it requires only one
ultracentrifuge, no special or expensive consumables, and
minimal skill for operation with no specialized sample
preparation.29 However, this method has several drawbacks,
including co-sedimentation, aggregation formation, exosome
rupture, and a prolonged enrichment process that could
influence the results. Other typical exosome isolation methods
include polymer-based enrichment,33 ultrafiltration,34 size
exclusion chromatography,32,35 and affinity bead or column
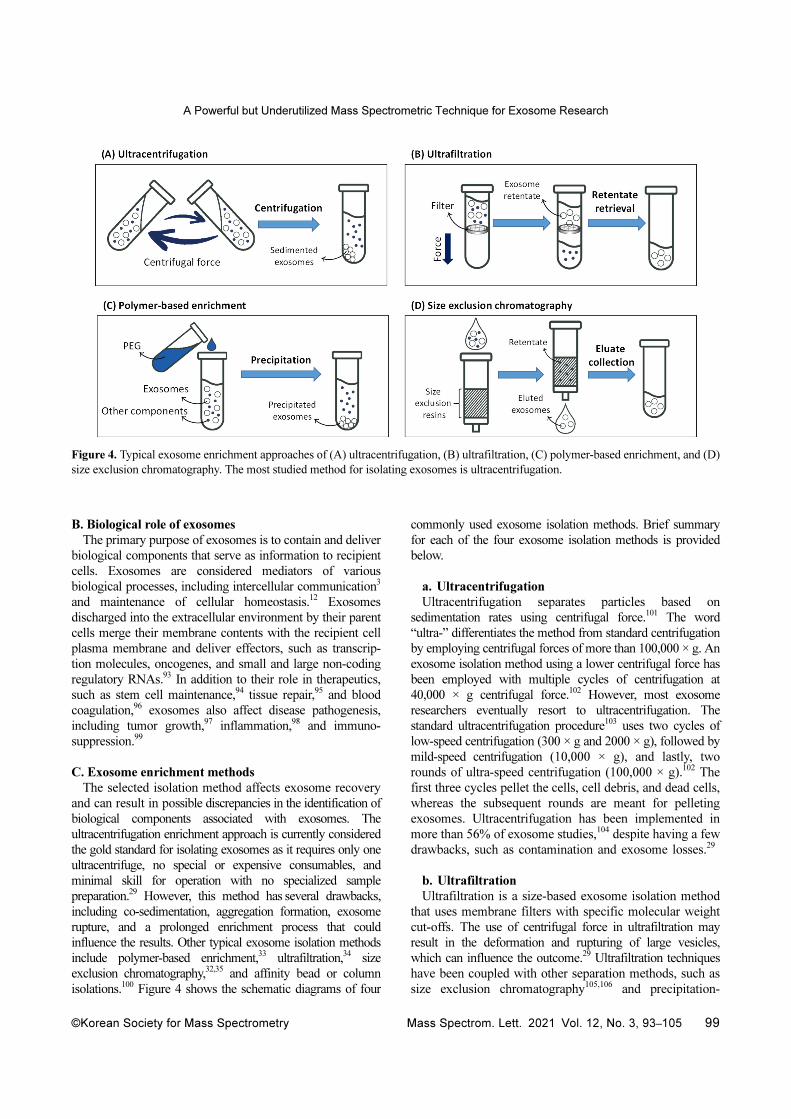
isolations.100 Figure 4 shows the schematic diagrams of four
commonly used exosome isolation methods. Brief summary
for each of the four exosome isolation methods is provided
below.
a. Ultracentrifugation
Ultracentrifugation separates particles based on
sedimentation rates using centrifugal force.101 The word
“ultra-” differentiates the method from standard centrifugation
by employing centrifugal forces of more than 100,000 × g. An
exosome isolation method using a lower centrifugal force has
been employed with multiple cycles of centrifugation at
40,000 × g centrifugal force.102 However, most exosome
researchers eventually resort to ultracentrifugation. The
standard ultracentrifugation procedure103 uses two cycles of
low-speed centrifugation (300 × g and 2000 × g), followed by
mild-speed centrifugation (10,000 × g), and lastly, two
rounds of ultra-speed centrifugation (100,000 × g).102 The
first three cycles pellet the cells, cell debris, and dead cells,
whereas the subsequent rounds are meant for pelleting
exosomes. Ultracentrifugation has been implemented in
more than 56% of exosome studies,104 despite having a few
drawbacks, such as contamination and exosome losses.29
b. Ultrafiltration
Ultrafiltration is a size-based exosome isolation method
that uses membrane filters with specific molecular weight
cut-offs. The use of centrifugal force in ultrafiltration may
result in the deformation and rupturing of large vesicles,
which can influence the outcome.29 Ultrafiltration techniques
have been coupled with other separation methods, such as
size exclusion chromatography105,106 and precipitation-
Figure 4. Typical exosome enrichment approaches of (A) ultracentrifugation, (B) ultrafiltration, (C) polymer-based enrichment, and (D)
size exclusion chromatography. The most studied method for isolating exosomes is ultracentrifugation.
Iqbal Jalaludin, David M. Lubman, and Jeongkwon Kim
100 Mass Spectrom. Lett. 2021 Vol. 12, No. 3, 93–105 ©Korean Society for Mass Spectrometry
based enrichment,107 to improve the efficacy of exosome
enrichment.104-106 The ultrafiltration method was initially
used to enrich exosomes from large volumes of medium (>
1 L), using a 500 kDa hollow fiber membrane employed
under constant pressure108 for clinical application.103
c. Polymer-based enrichment
Polymer-based enrichment or the exosome precipitation
method modifies exosome solubility and dispersibility,
allowing exosomes to precipitate in biological fluids.29
ExoQuick and Total Exosome Isolation are examples of
two commercial polymer-based isolation kits that use
volume-excluding polymers, such polyethylene glycol,
dextrans, and polyvinyls as reagents.33 The method is adapted
from the viral isolation method that uses a polyethylene glycol
solution because viruses are biophysically similar to
exosomes.33,109 The ExoQuick protocol calls for only a few
steps, beginning with the introduction of a polymer solution
into the samples, followed by incubation for a specified
duration, and finally, sample collection through
centrifugation.110 Many researchers have been drawn to
this polymer-based enrichment method because of its
ease of use, but researchers are always seeking
alternatives due to its low purity and high cost.33 This
approach is continually being improved, and has resulted
in superior versions of the method, such as the ExtraPEG
procedure.33
d. Size exclusion chromatography
Like ultrafiltration, SEC utilizes size to separate exosomes
from other components using solid-phase extraction (SPE)111
or liquid chromatography (LC),112 where larger particles elute
first, followed by small vesicles and proteins.113 The stationary
phase, which can be a porous gel filtration polymer, is a
critical component of SEC systems, unlike the mobile phase.
A few examples of gel polymers are crosslinked dextrans,
agarose, and polyacrylamide.113 SEC is considered an ideal
method for therapeutic applications and biomarker discovery
because the integrity and characteristics of the exosomes are
preserved.114 SEC enrichment of exosomes has certain issues
related to yield and purity. First, the purity is equivalent to
ultracentrifugation combined with density gradient, which
is considered high compared to other techniques.115
Second, SEC combined with other approaches, such as
ultrafiltration or ultracentrifugation, results in clean exosomes
with considerably lower total protein content.116 Finally,
circulating proteins, such as albumin and apolipoproteins,
continue to contaminate exosomes due to their
abundance.117
IV. MALDI-MS strategies in exosome research
MALDI-MS is used in exosome research because of its
compatibility with clinical applications due to the rapid and
direct analytical capabilities.118 Exosome research is
currently focused on LC-MS, as many of the studies have
been analytical in nature. Indeed, LC-MS is a valuable
analytical tool; especially, LC combined with tandem mass
spectrometry (LC-MS/MS) is currently the most widely
used analytical methodology to characterize exosome
proteins.119 However, exosome research has garnered
clinical attention120 and a more appropriate instrument,
such as MALDI-MS, is required to translate exosome
strategies from basic science to patient care.82
Recent research has demonstrated the ability of MALDI-
MS to examine intact exosomes without the requirement
for exosome lysis or labeling.121 Several interesting
conclusions have been reached, including that exosome
fingerprints help in differentiating parental cells. Three
phases of intact melanoma cell lines (SBCI2, WM115, and
WM239) could not be discriminated by mass spectral
fingerprints; however, the exosomes derived from the
corresponding cell lines were able to distinguishable.121
This discovery suggests that each cell line secretes unique
exosomes that can distinguish not just between cancer
stages, but also between normal cells. The mass spectral
fingerprints of exosomes derived from cell lines would be
incredibly useful to analyze exosomes isolated from biofluids,
as the exosome origin is generally unknown. Specific proteins
that serve as melanoma biomarker proteins could only be
identified using exosome mass spectral fingerprints.121
Premelanosome protein, a melanoma diagnostic marker
implicated in melanosome maturation from stages I and II,
was not found in the mass spectral fingerprint of the
WM115 melanoma cell, but was found in the associated
exosomes.119 Exosomes may improve crucial indicators for
a more accurate diagnosis and prognosis, allowing for the
appropriate treatment to be determined.
Using exosomes as a tool in cancer monitoring is
appealing to cancer researchers because invasive cancer
monitoring, such as tissue biopsy, can be avoided.122 The
term “liquid biopsy” is associated with exosome research67
and OMICs profiling with MALDI-MS has led to the
discovery of disease biomarkers.66 Proteome profiling of
urine exosomes resulted in the identification of fragmented
alpha-1 antitrypsin and histone H2B1K peptides.123 As a
result, two peaks observed by MALDI-MS were identified as
biomarkers to discriminate between urothelial carcinoma
patients and healthy individuals.123
MALDI-MS analysis can be challenging, particularly
when dealing with complex spectra containing peaks
irrelevant to the experimental subjects. Statistical methods
such as principal component analysis (PCA) and partial
least squares discriminant analysis (PLS-DA) help
distinguish and highlight important peaks that respond to
biological variables. Han et al. (2021) showed that PCA of
MALDI-MS mass spectra from plasma-derived exosomes
could discriminate between healthy controls and patients
with osteosarcoma and lung cancer. The investigation was
extended to osteosarcoma lung metastasis, which resulted
A Powerful but Underutilized Mass Spectrometric Technique for Exosome Research
©Korean Society for Mass Spectrometry Mass Spectrom. Lett. 2021 Vol. 12, No. 3, 93–105 101
in the discovery of seven biomarkers that differentiate this
disease from non-lung metastasis.43 Many recent MALDI-
MS strategies in exosome research have led to biomarker
discovery and an essential component of these efforts is the
selection of the method.
Table 1 summarizes the strategies for exosome research
using MALDI-MS, including the matrix, sample
preparation, lasers, and mass analyzers used in the
respective studies. All studies used organic matrices, with
DHB and CHCA being the most frequently used. The 9-
aminoacridine matrix is specifically used for lipidomic
analysis in the negative ion mode, which results in the
detection of anionic lipid species.81 The selection of the
matrix reflects the OMICs profiling routine use, with DHB
and CHCA matrices prevalent in proteomics,124 while
matrix selection in lipidomics is based on the specific lipid
species being studied.48
Sample integration with the matrix is often performed
using the dried droplet method. This procedure can be
carried out by either reconstituting the loaded samples with
the matrix solution or directly integrating the samples with
the matrix before applying them to the MALDI plates.
Reproducibility remains an issue because the standard
dried droplet approach cannot resolve hot-spot
formation.70, 71, 125 Thus, improving the surface uniformity
of MALDI sample spots for exosome research should be a
focus. The laser and mass analyzer used in the respective
studies may have been limited by available resources,
although the use of TOF/TOF MS and Fourier transform
ion cyclotron resonance MS can elucidate the molecules
and provide high-resolution mass spectra, respectively.
However, TOF-MS is sufficient for most strategies.
A. Fingerprint analysis
MALDI-MS fingerprint analysis uses variation in
spectrum profiles and major peaks to distinguish between
exosomes. The peaks reflect a variety of biological
components, particularly when the study is conducted on
intact exosomes.121 The majority of MALDI-MS fingerprint
analyses result in the identification of proteins or their
fragments that may serve as disease biomarkers.43,67 Although
mass spectral fingerprint analysis has been performed on
exosomes derived from cultured cells,37,121 only a few
studies have been conducted on exosomes derived from
biofluids.126 This may result from the complexity of biofluids
and wide variation in exosomes, which complicates the mass
spectrum. Hence, a MALDI-MS spectral fingerprint database
for exosomes derived from cells may allow the origin of
exosomes recovered from biofluids to be determined. To
the best of our knowledge, no spectral database for
exosomes derived from cell lines has been developed such
as SpectraBank for microbial identification.127
B. OMICs profiling
OMICs profiling aims to identify, characterize, and
quantify biological components involved in the
construction and function of exosomes, such as proteins,
lipids, and metabolites.128 Exosome surface proteins
contain information about their origin, which is useful for
classifying exosomes recovered from biofluids.129
Proteome profiling may be carried out by extracting and
sequentially analyzing proteins using MALDI-MS for top-
down protein identification or fingerprint analysis.
Lipidomic composition analysis by MALDI-MS may not
be as useful as proteomics because lipid detection by
MALDI-MS is highly selective for the specific matrix.48 A
lipidomic profiling study on plasma exosomes found that
only sphingomyelin, phosphoinositol, and ceramide
species could be identified with high confidence when
employing the 9-aminoacridine matrix in negative mode.81
Furthermore, there were no significant differences in lipid
composition between plasma and its exosomes, indicating
the classification of exosomes based on lipid composition
may not be feasible.81
C. Statistical analysis
Software tools Proteome Discoverer™ (Thermo) for
proteomics130 and the LIPID MAPS® for lipidomics131 now
allow for direct analysis of acquired mass spectra.127,128
However, obtaining numerous datasets may make it difficult
to determine the relevant features in the spectrum. One
straightforward method compares features with the largest
quantitative changes, although significant differences
between two classes (e.g., control and sample) may not
represent mechanistic differences.132 In this case, statistical
techniques may be beneficial. There are two methods in
statistical analysis: univariate and multivariate methods.
Analyses of variance (ANOVAs), t-tests, and p-values are
examples of univariate analysis, in which scores are used to
rank input characteristics.132 P-value is often used in
exosome research to measure the level of significance of a
feature.133 For multivariate analysis, PCA, PLS-DA and
clustering methods are frequently used in exosome
studies.43,67 Multivariate techniques are more resistant to
error than univariate methods, which makes them more
accurate for feature selection.132 Metaboanalyst 5.0134,
SPSS, and MATLAB are examples of statistical analysis
software packages.131
V. ConclusionMALDI-MS is a powerful tool for exosome research,
much like LC-MS/MS. The insufficient amount of
exosome research publications employing MALDI-MS
requires attention as this method is well-suited for clinical
use. While the approach has drawbacks, such as difficulty
detecting a wide variety of exosome lipid species due to
matrix selectivity, the knowledge gained will be valuable
for future research. We outlined three commonly utilized
exosome research strategies when using MALDI-MS:
fingerprint analysis, OMICs profiling, and statistical
Iqbal Jalaludin, David M. Lubman, and Jeongkwon Kim
102 Mass Spectrom. Lett. 2021 Vol. 12, No. 3, 93–105 ©Korean Society for Mass Spectrometry
analysis, all of which can be dependent and independent of
one another. Fingerprint analysis may be the most
promising method in terms of the clinical applicability of
MALDI-MS for exosome research. The focus of MALDI-
MS sample preparation should be the identification of a
standard method for preparing exosomes while avoiding
common issues, such as hot spot formation. Furthermore,
we propose developing a MALDI-MS mass spectral
fingerprint database for exosomes, similar to SpectraBank,
for microbiological characterization. All mass spectra of
exosomes would be gathered from a respected origin,
ensuring that all references are consistent and valid. We
recommend additional exosome studies be performed on
MALDI-MS to fully realize the potential of this technique
and maximize its usefulness.
Acknowledgements
This research was supported by Basic Science Research
Program through the National Research Foundation of
Korea (NRF) funded by the Ministry of Education
(2016R1D1A1B02008854) and by the National Cancer
Institute under grant 1R01 CA160254 (DML).
References
1. Chen, B. Y.; Sung, C. W.; Chen, C.; Cheng, C. M.; Lin, D.P.; Huang, C. T.; Hsu, M. Y. Clin. Chim. Acta 2019, 493,14, DOI: 10.1016/j.cca.2019.02.021.
2. Gurunathan, S.; Kang, M. H.; Jeyaraj, M.; Qasim, M.;Kim, J. H. Cells 2019, 8, DOI: 10.3390/cells8040307.
3. Meldolesi, J. Curr. Biol. 2018, 28, R435, DOI: 10.1016/j.cub.2018.01.059.
4. Mathivanan, S.; Ji, H.; Simpson, R. J. J. Proteom. 2010,73, 1907, DOI: 10.1016/j.jprot.2010.06.006.
5. Gehrmann, U.; Näslund, T. I.; Hiltbrunner, S.; Larssen, P.;Gabrielsson, S. Semin. Cancer Biol. 2014, 28, 58, DOI:10.1016/j.semcancer.2014.05.003.
6. Rodrigues, M.; Fan, J.; Lyon, C.; Wan, M.; Hu, Y.Theranostics 2018, 8, 2709, DOI: 10.7150/thno.20576.
7. Mitchell, M. D.; Peiris, H. N.; Kobayashi, M.; Koh, Y. Q.;Duncombe, G.; Illanes, S. E.; Rice, G. E.; Salomon, C.Am. J. Obstet. Gynecol. 2015, 213, S173, DOI: 10.1016/j.ajog.2015.07.001.
8. Konečná, B.; Tóthová, Ľ.; Repiská, G. Int. J. Mol. Sci.2019, 20, 2890, DOI: 10.3390/ijms20122890.
9. Bellin, G.; Gardin, C.; Ferroni, L.; Chachques, J. C.;Rogante, M.; Mitrečić, D.; Ferrari, R.; Zavan, B. Cells2019, 8, 166, DOI: 10.3390/cells8020166.
10. Liu, W.; Bai, X.; Zhang, A.; Huang, J.; Xu, S.; Zhang, J.Front. Mol. Neurosci. 2019, 12, 240, DOI: 10.3389/fnmol.2019.00240.
11. Whiteside, T.L. Adv. Clin. Chem. 2016, 74, 103, DOI:10.1016/bs.acc.2015.12.005.
12. Zhang, W.; Zhou, X.; Zhang, H.; Yao, Q.; Liu, Y.; Dong,
Z. Am. J. Physiol. Renal Physiol. 2016, 311, F844, DOI:10.1152/ajprenal.00429.2016.
13. Mashouri, L.; Yousefi, H.; Aref, A. R.; Ahadi, A. M.;Molaei, F.; Alahari, S.K. Mol. Cancer 2019, 18, 75, DOI:10.1186/s12943-019-0991-5.
14. Soares Martins, T.; Trindade, D.; Vaz, M.; Campelo, I.;Almeida, M.; Trigo, G.; da Cruz e Silva, O. A. B.;Henriques, A.G. J. Neurochem. 2021, 156, 162, DOI:10.1111/jnc.15112.
15. Kanninen, K.M.; Bister, N.; Koistinaho, J.; Malm, T.Biochim. Biophys. Acta Mol. Basis Dis. 2016, 1862, 403,DOI: 10.1016/j.bbadis.2015.09.020.
16. Shao, J.; Zaro, J.; Shen, Y. Int. J. Nanomedicine 2020, 15,9355, DOI: 10.2147/IJN.S281890.
17. van Niel, G.; D'Angelo, G.; Raposo, G. Nat. Rev. Mol.Cell Biol. 2018, 19, 213, DOI: 10.1038/nrm.2017.125.
18. McAndrews, K. M.; Kalluri, R. Mol. Cancer 2019, 18,52, DOI: 10.1186/s12943-019-0963-9.
19. Trams, E. G.; Lauter, C.J.; Salem, N., Jr.; Heine, U.Biochim. Biophys. Acta 1981, 645, 63, DOI: 10.1016/0005-2736(81)90512-5.
20. Harding, C.; Heuser, J.; Stahl, P. Eur. J. Cell Biol. 1984,35, 256.
21. Raposo, G.; Nijman, H. W.; Stoorvogel, W.; Liejendekker,R.; Harding, C. V.; Melief, C. J.; Geuze, H. J. J. Exp.Med. 1996, 183, 1161, DOI: 10.1084/jem.183.3.1161.
22. Nguyen, H.-Q.; Lee, D.; Kim, Y.; Bang, G.; Cho, K.; Lee,Y.-S.; Yeon, J. E.; Lubman, D. M.; Kim, J. J. Proteom.2021, 245, 104278, DOI: 10.1016/j.jprot.2021.104278.
23. Street, J. M.; Koritzinsky, E. H.; Glispie, D. M.; Star, R.A.; Yuen, P. S. Adv. Clin. Chem. 2017, 78, 103, DOI:10.1016/bs.acc.2016.07.003.
24. Hyun, K. A.; Gwak, H.; Lee, J.; Kwak, B.; Jung, H. I.Micromachines 2018, 9, DOI: 10.3390/mi9070340.
25. Mirza, A. H.; Kaur, S.; Nielsen, L. B.; Størling, J.; Yarani,R.; Roursgaard, M.; Mathiesen, E. R.; Damm, P.; Svare,J.; Mortensen, H. B.; Pociot, F. Front. Immunol. 2019, 10,2543, DOI: 10.3389/fimmu.2019.02543.
26. Dixon, C. L.; Sheller-Miller, S.; Saade, G. R.; Fortunato,S. J.; Lai, A.; Palma, C.; Guanzon, D.; Salomon, C.;Menon, R. Endocrinology 2018, 159, 2229, DOI:10.1210/en.2018-00073.
27. Yang, C.; Guo, W. B.; Zhang, W. S.; Bian, J.; Yang, J. K.;Zhou, Q. Z.; Chen, M. K.; Peng, W.; Qi, T.; Wang, C. Y.;Liu, C. D. Andrology 2017, 5, 1007, DOI: 10.1111/andr.12412.
28. Karimi, N.; Cvjetkovic, A.; Jang, S. C.; Crescitelli, R.;Hosseinpour Feizi, M. A.; Nieuwland, R.; Lötvall, J.;Lässer, C. Cell. Mol. Life Sci. 2018, 75, 2873, DOI:10.1007/s00018-018-2773-4.
29. Li, P.; Kaslan, M.; Lee, S. H.; Yao, J.; Gao, Z.Theranostics 2017, 7, 789, DOI: 10.7150/thno.18133.
30. Doyle, L. M.; Wang, M. Z. Cells 2019, 8, 727, DOI:10.3390/cells8070727.
31. Momen-Heravi, F. Methods Mol. Biol. 2017, 1660, 25,DOI: 10.1007/978-1-4939-7253-1_3.
A Powerful but Underutilized Mass Spectrometric Technique for Exosome Research
©Korean Society for Mass Spectrometry Mass Spectrom. Lett. 2021 Vol. 12, No. 3, 93–105 103
32. An, M. R.; Wu, J.; Zhu, J. H.; Lubman, D. M. J. ProteomeRes. 2018, 17, 3599, DOI: 10.1021/acs.jproteome.8b00479.
33. Rider, M. A.; Hurwitz, S. N.; Meckes, D. G. Sci. Rep.2016, 6, 23978, DOI: 10.1038/srep23978.
34. Cheruvanky, A.; Zhou, H.; Pisitkun, T.; Kopp, J. B.;Knepper, M. A.; Yuen, P. S. T.; Star, R. A. Am. J. Physiol.Renal Physiol. 2007, 292, F1657, DOI: 10.1152/ajprenal.00434.2006.
35. Navajas, R.; Corrales, F. J.; Paradela, A. Methods Mol.Biol. 2019, 1959, 39, DOI: 10.1007/978-1-4939-9164-8_3.
36. Zhang, Y.; Bi, J.; Huang, J.; Tang, Y.; Du, S.; Li, P. Int. J.Nanomedicine 2020, 15, 6917, DOI: 10.2147/IJN.S264498.
37. Nguyen, H. Q.; Lee, D.; Kim, Y.; Paek, M.; Kim, M.;Jang, K. S.; Oh, J.; Lee, Y. S.; Yeon, J. E.; Lubman, D.M.; Kim, J. Anal. Chem. 2019, 91, 13297, DOI: 10.1021/acs.analchem.9b04198.
38. Wang, Y.-T.; Shi, T.; Srivastava, S.; Kagan, J.; Liu, T.;Rodland, K. D. Cancers 2020, 12, 2335, DOI: 10.3390/cancers12092335.
39. Tanaka, K.; Waki, H.; Ido, Y.; Akita, S.; Yoshida, Y.;Yoshida, T.; Matsuo, T. Rapid Commun. Mass Spectrom.1988, 2, 151, DOI: 10.1002/rcm.1290020802.
40. Fenn, J. B.; Mann, M.; Meng, C. K.; Wong, S. F.;Whitehouse, C. M. Science 1989, 246, 64, DOI: 10.1126/science.2675315.
41. Zhang, Y.; Fonslow, B. R.; Shan, B.; Baek, M. C.; Yates,J. R., III. Chem. Rev. 2013, 113, 2343, DOI: 10.1021/cr3003533.
42. Catherman, A. D.; Skinner, O. S.; Kelleher, N. L.Biochem. Biophys. Res. Commun. 2014, 445, 683, DOI:10.1016/j.bbrc.2014.02.041.
43. Han, Z.; Peng, C.; Yi, J.; Wang, Y.; Liu, Q.; Yang, Y.;Long, S.; Qiao, L.; Shen, Y. iScience 2021, 24, 102906,DOI: 10.1016/j.isci.2021.102906.
44. Soeriyadi, A. H.; R.Whittaker, M.; Boyer, C.; Davis, T. P.J. Polym. Sci. A Polym. Chem. 2013, 51, 1475, DOI:10.1002/pola.26536.
45. El-Aneed, A.; Cohen, A.; Banoub, J. Appl. Spectrosc.Rev. 2009, 44, 210, DOI: 10.1080/05704920902717872.
46. Ekström, S.; Onnerfjord, P.; Nilsson, J.; Bengtsson, M.;Laurell, T.; Marko-Varga, G. Anal. Chem. 2000, 72, 286,DOI: 10.1021/ac990731l.
47. Weigt, D.; Sammour, D. A.; Ulrich, T.; Munteanu, B.;Hopf, C. Sci. Rep. 2018, 8, 11260, DOI: 10.1038/s41598-018-29677-z.
48. Leopold, J.; Popkova, Y.; Engel, K. M.; Schiller, J.Biomolecules 2018, 8, 173, DOI: 10.3390/biom8040173.
49. Kobylis, P.; Stepnowski, P.; Caban, M. Microchem. J.2021, 164, 105983, DOI: 10.1016/j.microc.2021.105983.
50. Qiao, Z.; Lissel, F. Chem. Asian J. 2021, 16, 868, DOI:10.1002/asia.202100044.
51. Murray, K. K. J. Mass Spectrom. 2021, 56, e4664, DOI:10.1002/jms.4664.
52. Murray, K. K.; Seneviratne, C. A.; Ghorai, S. Methods
2016, 104, 118, DOI: 10.1016/j.ymeth.2016.03.002.53. Dreisewerd, K. Chem. Rev. 2003, 103, 395, DOI:
10.1021/cr010375i.54. Knochenmuss, R.; Zenobi, R. Chem. Rev. 2003, 103, 441,
DOI: 10.1021/cr0103773.55. Wang, C. C.; Lai, Y. H.; Ou, Y. M.; Chang, H. T.; Wang,
Y. S. Philos. Trans. A Math. Phys. Eng. Sci. 2016, 374,20150371, DOI: 10.1098/rsta.2015.0371.
56. Strupat, K.; Karas, M.; Hillenkamp, F. Int. J. MassSpectrom. Ion Processes 1991, 111, 89, DOI: 10.1016/0168-1176(91)85050-V.
57. Trimpin, S.; Inutan, E. D.; Herath, T. N.; McEwen, C. N.Anal. Chem. 2010, 82, 11, DOI: 10.1021/ac902066s.
58. Patil, A. A.; Ly Lại, T. K.; Wang, C.-W.; Chen, G.-F.; Du,B.-X.; Chiang, C.-K.; Peng, W.-P. Int. J. Mass Spectrom.2021, 462, 116539, DOI: 10.1016/j.ijms.2021.116539.
59. Choi, H.; Lee, D.; Kim, Y.; Nguyen, H.-Q.; Han, S.; Kim,J. J. Am. Soc. Mass Spectrom. 2019, 30, 1174, DOI:10.1007/s13361-019-02213-7.
60. Karas, M.; Krüger, R. Chem. Rev. 2003, 103, 427, DOI:10.1021/cr010376a.
61. Wiangnon, K.; Cramer, R. Anal. Chem. 2015, 87, 1485,DOI: 10.1021/ac504412p.
62. Shi, C. Y.; Deng, C. H. Analyst 2016, 141, 2816, DOI:10.1039/c6an00220j.
63. Lee, D.; Kim, Y.; Jalaludin, I.; Nguyen, H.-Q.; Kim, M.;Seo, J.; Jang, K.-S.; Kim, J. Food Chem. 2021, 342,128356, DOI: 10.1016/j.foodchem.2020.128356.
64. Beavis, R. C.; Chait, B. T.; Standing, K. G. RapidCommun. Mass Spectrom. 1989, 3, 436, DOI: 10.1002/rcm.1290031208.
65. Beavis, R. C.; Chaudhary, T.; Chait, B. T. Org. MassSpectrom. 1992, 27, 156, DOI: 10.1002/oms.1210270217.
66. Kim, J. Mass Spectrom. Lett. 2015, 6, 27, DOI: 10.5478/MSL.2015.6.2.27.
67. Stübiger, G.; Nairn, M. D.; Abban, T. K.; Openshaw, M.E.; Mancera, L.; Herzig, B.; Wuczkowski, M.; Senfter,D.; Mader, R. M. Anal. Chem. 2018, 90, 13178, DOI:10.1021/acs.analchem.8b03756.
68. Singhto, N.; Vinaiphat, A.; Thongboonkerd, V. Sci. Rep.2019, 9, 13834, DOI: 10.1038/s41598-019-50195-z.
69. Horneffer, V.; Dreisewerd, K.; Lüdemann, H. C.;Hillenkamp, F.; Läge, M.; Strupat, K. Int. J. MassSpectrom. 1999, 185-187, 859, DOI: 10.1016/S1387-3806(98)14218-5.
70. O'Rourke, M. B.; Djordjevic, S. P.; Padula, M. P. MassSpectrom. Rev. 2018, 37, 217, DOI: 10.1002/mas.21515.
71. Nguyen, H.-Q.; Lee, D.; Kim, Y.; Kim, M. S.; Jang, K.-S.;Kim, J. Rapid Commun. Mass Spectrom. 2019, 33, 1481,DOI: 10.1002/rcm.8491.
72. Shin, D.; Lee, D.; Kim, Y.; Kim, I.; Paek, J.; Kim, J.Rapid Commun. Mass Spectrom. 2018, 32, 1746, DOI:10.1002/rcm.8225.
73. Fenner, N. C.; Daly, N. R. Rev. Sci. Instrum. 1966, 37,1068, DOI: 10.1063/1.1720410.
74. Karas, M.; Bachmann, D.; Hillenkamp, F. Anal. Chem.
Iqbal Jalaludin, David M. Lubman, and Jeongkwon Kim
104 Mass Spectrom. Lett. 2021 Vol. 12, No. 3, 93–105 ©Korean Society for Mass Spectrometry
1985, 57, 2935, DOI: 10.1021/ac00291a042.75. Phan, N. T. N.; Fletcher, J. S.; Ewing, A. G. Imaging Mass
Spectrometry for Single-Cell Analysis. In ReferenceModule in Chemistry, Molecular Sciences and ChemicalEngineering: Elsevier: Amsterdam, 2014.
76. Kim, J.-H.; Paek, K.; Kang, W. Bull. Korean Chem. Soc.2002, 23, 315, DOI: 10.5012/bkcs.2002.23.2.315.
77. Kang, W.; Kim, J.; Paek, K.; Shin, K.S. Rapid Commun.Mass Spectrom. 2001, 15, 941. https://doi.org/https://doi.org/10.1002/rcm.313.
78. Demirev, P.; Westman, A.; Reimann, C.T.; Håkansson, P.;Barofsky, D.; Sundqvist, B.U.R.; Cheng, Y.D.; Seibt, W.;Siegbahn, K. Rapid Commun. Mass Spectrom. 1992, 6, 187.https://doi.org/https://doi.org/10.1002/rcm.1290060307.
79. Overberg, A.; Karas, M.; Bahr, U.; Kaufmann, R.;Hillenkamp, F. Rapid Commun. Mass Spectrom. 1990, 4,293, DOI: 10.1002/rcm.1290040808.
80. Tang, X.; Sadeghi, M.; Olumee, Z.; Vertes, A. RapidCommun. Mass Spectrom. 1997, 11, 484, DOI: 10.1002/(SICI)1097-0231(199703)11:5<484::AID-RCM895>3.0.CO;2-2.
81. Peterka, O.; Jirásko, R.; Chocholoušková, M.; Kuchař, L.;Wolrab, D.; Hájek, R.; Vrána, D.; Strouhal, O.; Melichar, B.;Holčapek, M. Biochim. Biophys. Acta Mol. Cell Biol. Lipids2020, 1865, 158634, DOI: 10.1016/j.bbalip.2020.158634.
82. Roy, S.; Hochberg, F. H.; Jones, P. S. J. Extracell. Vesicles2018, 7, 1438720, DOI: 10.1080/20013078.2018.1438720.
83. Kalluri, R.; LeBleu, V. S. Science 2020, 367, eaau6977,DOI: 10.1126/science.aau6977.
84. Cocucci, E.; Meldolesi, J. Trends Cell Biol. 2015, 25,364, DOI: 10.1016/j.tcb.2015.01.004.
85. Takahashi, A.; Okada, R.; Nagao, K.; Kawamata, Y.;Hanyu, A.; Yoshimoto, S.; Takasugi, M.; Watanabe, S.;Kanemaki, M. T.; Obuse, C.; Hara, E. Nat. Commun.2017, 8, 15287, DOI: 10.1038/ncomms15287.
86. Andreu, Z.; Yáñez-Mó, M. Front. Immunol. 2014, 5, 442,DOI: 10.3389/fimmu.2014.00442.
87. Larios, J.; Mercier, V.; Roux, A.; Gruenberg, J. J. CellBiol. 2020, 219, e201904113, DOI: 10.1083/jcb.201904113.
88. Hosseini-Beheshti, E.; Pham, S.; Adomat, H.; Li, N.;Tomlinson Guns, E. S. Mol. Cell. Proteom. 2012, 11, 863,DOI: 10.1074/mcp.M111.014845.
89. Zheng, X.; Xu, K. L.; Zhou, B. T.; Chen, T.; Huang, Y. Q.;Li, Q. L.; Wen, F.; Ge, W. T.; Wang, J.; Yu, S. J.; Sun, L.F.; Zhu, L.; Liu, W.; Gao, H. H.; Yue, L.; Cai, X.; Zhang,Q. H.; Ruan, G.; Zhu, T. H.; Wu, Z. H.; Zhu, Y.; Shao, Y.K.; Guo, T. N.; Zheng, S. J. Extracell. Vesicles 2020, 9,1750202, DOI: 10.1080/20013078.2020.1750202.
90. Garcia, N. A.; González-King, H.; Grueso, E.; Sánchez,R.; Martinez-Romero, A.; Jávega, B.; O'Connor, J. E.;Simons, P. J.; Handberg, A.; Sepúlveda, P. PLoS One 2019,14, e0217546, DOI: 10.1371/journal.pone.0217546.
91. Mosaad, E.; Peiris, H. N.; Holland, O.; Morean Garcia, I.;Mitchell, M. D. Front. Physiol. 2020, 11, DOI: 10.3389/fphys.2020.594313.
92. Turchinovich, A.; Drapkina, O.; Tonevitsky, A. Front.Immunol. 2019, 10, 202, DOI: 10.3389/fimmu.2019.00202.
93. Kosaka, N.; Yoshioka, Y.; Fujita, Y.; Ochiya, T. J. Clin.Investig. 2016, 126, 1163, DOI: 10.1172/JCI81130.
94. Gradilla, A. C.; González, E.; Seijo, I.; Andrés, G.;Bischoff, M.; González-Mendez, L.; Sánchez, V.; Callejo,A.; Ibáñez, C.; Guerra, M.; Ortigão-Farias, J. R.;Sutherland, J. D.; González, M.; Barrio, R.; Falcón-Pérez,J. M.; Guerrero, I. Nat. Commun. 2014, 5, 5649, DOI:10.1038/ncomms6649.
95. Zhang, S.; Chuah, S. J.; Lai, R. C.; Hui, J. H. P.; Lim, S.K.; Toh, W. S. Biomaterials 2018, 156, 16, DOI: 10.1016/j.biomaterials.2017.11.028.
96. Gesierich, S.; Berezovskiy, I.; Ryschich, E.; Zöller, M.Cancer Res. 2006, 66, 7083, DOI: 10.1158/0008-5472.Can-06-0391.
97. Wortzel, I.; Dror, S.; Kenific, C. M.; Lyden, D. Dev. Cell2019, 49, 347, DOI: 10.1016/j.devcel.2019.04.011.
98. Elahi, F. M.; Casaletto, K. B.; La Joie, R.; Walters, S. M.;Harvey, D.; Wolf, A.; Edwards, L.; Rivera-Contreras, W.;Karydas, A.; Cobigo, Y.; Rosen, H. J.; DeCarli, C.; Miller,B. L.; Rabinovici, G. D.; Kramer, J. H. Alzheimers.Dement. 2020, 16, 681, DOI: 10.1016/j.jalz.2019.09.004.
99. Chen, G.; Huang, A. C.; Zhang, W.; Zhang, G.; Wu, M.;Xu, W.; Yu, Z.; Yang, J.; Wang, B.; Sun, H.; Xia, H.; Man,Q.; Zhong, W.; Antelo, L. F.; Wu, B.; Xiong, X.; Liu, X.;Guan, L.; Li, T.; Liu, S.; Yang, R.; Lu, Y.; Dong, L.;McGettigan, S.; Somasundaram, R.; Radhakrishnan, R.;Mills, G.; Lu, Y.; Kim, J.; Chen, Y. H.; Dong, H.; Zhao,Y.; Karakousis, G. C.; Mitchell, T. C.; Schuchter, L. M.;Herlyn, M.; Wherry, E. J.; Xu, X.; Guo, W. Nature 2018,560, 382, DOI: 10.1038/s41586-018-0392-8.
100.Zhu, J.; Zhang, J.; Ji, X.; Tan, Z.; Lubman, D. M. J. ProteomeRes. 2021, in press, DOI: 10.1021/acs.jproteome.1c00549.
101.Livshits, M. A.; Khomyakova, E.; Evtushenko, E. G.;Lazarev, V. N.; Kulemin, N. A.; Semina, S. E.;Generozov, E. V.; Govorun, V. M. Sci. Rep. 2015, 5,17319, DOI: 10.1038/srep17319.
102.Kim, J.; Tan, Z.; Lubman, D. M. Electrophoresis 2015,36, 2017, DOI: 10.1002/elps.201500131.
103.Théry, C.; Amigorena, S.; Raposo, G.; Clayton, A. Curr.Protoc. Cell Biol. 2006, Chapter 3, Unit 3.22, DOI:10.1002/0471143030.cb0322s30.
104.Zarovni, N.; Corrado, A.; Guazzi, P.; Zocco, D.; Lari, E.;Radano, G.; Muhhina, J.; Fondelli, C.; Gavrilova, J.;Chiesi, A. Methods 2015, 87, 46, DOI: 10.1016/j.ymeth.2015.05.028.
105.Nordin, J. Z.; Lee, Y.; Vader, P.; Mäger, I.; Johansson, H.J.; Heusermann, W.; Wiklander, O. P. B.; Hällbrink, M.;Seow, Y.; Bultema, J. J.; Gilthorpe, J.; Davies, T.;Fairchild, P. J.; Gabrielsson, S.; Meisner-Kober, N. C.;Lehtiö, J.; Smith, C. I. E.; Wood, M. J. A.; Andaloussi, S.E. L. Nanomedicine 2015, 11, 879, DOI: 10.1016/j.nano.2015.01.003.
106.Benedikter, B. J.; Bouwman, F. G.; Vajen, T.; Heinzmann,A. C. A.; Grauls, G.; Mariman, E. C.; Wouters, E. F. M.;
A Powerful but Underutilized Mass Spectrometric Technique for Exosome Research
©Korean Society for Mass Spectrometry Mass Spectrom. Lett. 2021 Vol. 12, No. 3, 93–105 105
Savelkoul, P. H.; Lopez-Iglesias, C.; Koenen, R. R.;Rohde, G. G. U.; Stassen, F. R. M. Sci. Rep. 2017, 7,15297, DOI: 10.1038/s41598-017-15717-7.
107.He, L.; Zhu, D.; Wang, J.; Wu, X. Int. J. Mol. Med. 2019,43, 83, DOI: 10.3892/ijmm.2018.3944.
108.Lamparski, H.G.; Metha-Damani, A.; Yao, J.-Y.; Patel, S.;Hsu, D.-H.; Ruegg, C.; Le Pecq, J.-B. J. Immunol.Methods 2002, 270, 211, DOI: 10.1016/S0022-1759(02)00330-7.
109.Lewis, G. D.; Metcalf, T. G. Appl. Environ. Microbiol.1988, 54, 1983, DOI: 10.1128/aem.54.8.1983-1988.1988.
110.Zhu, L.; Qu, X. H.; Sun, Y. L.; Qian, Y. M.; Zhao, X. H.World J. Gastroenterol. 2014, 20, 6651, DOI: 10.3748/wjg.v20.i21.6651.
111.Allelein, S.; Medina-Perez, P.; Lopes, A. L. H.; Rau, S.;Hause, G.; Kölsch, A.; Kuhlmeier, D. Sci. Rep. 2021, 11,11585, DOI: 10.1038/s41598-021-91129-y.
112.Huang, T.; He, J. Methods Mol. Biol. 2017, 1660, 191,DOI: 10.1007/978-1-4939-7253-1_15.
113.Sidhom, K.; Obi, P. O.; Saleem, A. Int. J. Mol. Sci. 2020,21, 6466, DOI: 10.3390/ijms21186466.
114.Gámez-Valero, A.; Monguió-Tortajada, M.; Carreras-Planella, L.; Franquesa, M.; Beyer, K.; Borràs, F. E. Sci.Rep. 2016, 6, 33641, DOI: 10.1038/srep33641.
115.Lobb, R. J.; Becker, M.; Wen, S. W.; Wong, C. S. F.;Wiegmans, A. P.; Leimgruber, A.; Möller, A. J. Extracell.Vesicles 2015, 4, 27031, DOI: 10.3402/jev.v4.27031.
116.Muller, L.; Hong, C.-S.; Stolz, D. B.; Watkins, S. C.;Whiteside, T. L. J. Immunol Methods 2014, 411, 55, DOI:10.1016/j.jim.2014.06.007.
117.Lane, R. E.; Korbie, D.; Trau, M.; Hill, M. M. Proteomics2019, 19, 1800156, DOI: 10.1002/pmic.201800156.
118.Jagadeesan, K. K.; Ekström, S. SLAS Discov. 2017, 22,1246, DOI: 10.1177/2472555217727517.
119.Bandu, R.; Oh, J. W.; Kim, K. P. Exp. Mol. Med. 2019,51, 1, DOI: 10.1038/s12276-019-0218-2.
120.Hu, Q.; Su, H.; Li, J.; Lyon, C.; Tang, W.; Wan, M.; Hu,T. Y. Precis. Clin. Med. 2020, 3, 54, DOI: 10.1093/pcmedi/pbaa007.
121.Zhu, Y.; Pick, H.; Gasilova, N.; Li, X.; Lin, T.-E.; Laeubli,H. P.; Zippelius, A.; Ho, P.-C.; Girault, H. H. Chem 2019, 5,1318, DOI: 10.1016/j.chempr.2019.04.007.
122.Kalishwaralal, K.; Kwon, W. Y.; Park, K. S. Biotechnol.J. 2019, 14, e1800430, DOI: 10.1002/biot.201800430.
123.Lin, S.-Y.; Chang, C.-H.; Wu, H.-C.; Lin, C.-C.; Chang,K.-P.; Yang, C.-R.; Huang, C.-P.; Hsu, W.-H.; Chang, C.-T.; Chen, C.-J. Sci. Rep. 2016, 6, 34446, DOI: 10.1038/srep34446.
124.Laugesen, S.; Roepstorff, P. J. Am. Soc. Mass Spectrom.2003, 14, 992, DOI: 10.1016/S1044-0305(03)00262-9.
125.Szaéjli, E.; Feheér, T.; Medzihradszky, K. F. Mol. Cell.Proteom. 2008, 7, 2410, DOI: 10.1074/mcp.M800108-MCP200.
126.Zhang, T.; Hu, L.; Ma, H.; Ni, F.; Liu, F.; Chen, H. J.Proteome Res. 2020, 19, 3644, DOI: 10.1021/acs.jproteome.0c00138.
127.Böhme, K.; Fernández-No, I. C.; Barros-Velázquez, J.;Gallardo, J. M.; Cañas, B.; Calo-Mata, P. Electrophoresis2012, 33, 2138, DOI: 10.1002/elps.201200074.
128.Vailati-Riboni, M.; Palombo, V.; Loor, J. J. What AreOmics Sciences? In Periparturient Diseases of DairyCows: A Systems Biology Approach, Springer: Cham,2017.
129.Wu, D.; Yan, J.; Shen, X.; Sun, Y.; Thulin, M.; Cai, Y.;Wik, L.; Shen, Q.; Oelrich, J.; Qian, X.; Dubois, K. L.;Ronquist, K. G.; Nilsson, M.; Landegren, U.; Kamali-Moghaddam, M. Nat. Commun. 2019, 10, 3854, DOI:10.1038/s41467-019-11486-1.
130.Orsburn, B. C. Proteomes 2021, 9, 15. https://doi.org/10.3390/proteomes9010015.
131.Liebisch, G.; Fahy, E.; Aoki, J.; Dennis, E. A.; Durand, T.;Ejsing, C. S.; Fedorova, M.; Feussner, I.; Griffiths, W. J.;Köfeler, H.; Merrill, A. H.; Murphy, R. C.; O'Donnell, V.B.; Oskolkova, O.; Subramaniam, S.; Wakelam, M. J. O.;Spener, F. J. Lipid Res. 2020, 61, 1539, DOI: 10.1194/jlr.S120001025.
132.Lualdi, M.; Fasano, M. J. Proteom. 2019, 198, 18, DOI:10.1016/j.jprot.2018.12.004.
133.Patel, G. K.; Khan, M. A.; Zubair, H.; Srivastava, S. K.;Khushman, M. D.; Singh, S.; Singh, A. P. Sci. Rep. 2019,9, 5335, DOI: 10.1038/s41598-019-41800-2.
134.Pang, Z.; Chong, J.; Zhou, G.; de Lima Morais, D. A.;Chang, L.; Barrette, M.; Gauthier, C.; Jacques, P.-É.; Li,S.; Xia, J. Nucleic Acids Res. 2021, 49, W388, DOI:10.1093/nar/gkab382.
135.Chun, S.; Ahn, S.; Yeom, C.-H.; Park, S. Biology 2016, 5,50, DOI: 10.3390/biology5040050.
136.Wubbolts, R.; Leckie, R. S.; Veenhuizen, P. T.;Schwarzmann, G.; Möbius, W.; Hoernschemeyer, J.; Slot,J. W.; Geuze, H. J.; Stoorvogel, W. J. Biol. Chem. 2003,278, 10963, DOI: 10.1074/jbc.M207550200.
137.Hegmans, J. P. J. J.; Bard, M. P. L.; Hemmes, A.; Luider,T. M.; Kleijmeer, M. J.; Prins, J.-B.; Zitvogel, L.; Burgers,S. A.; Hoogsteden, H. C.; Lambrecht, B. N. Am. J.Pathol. 2004, 164, 1807, DOI: 10.1016/S0002-9440(10)63739-X.
138.Banliat, C.; Le Bourhis, D.; Bernardi, O.; Tomas, D.;Labas, V.; Salvetti, P.; Guyonnet, B.; Mermillod, P.; Saint-Dizier, M. Int. J. Mol. Sci. 2020, 21, 5326, DOI: 10.3390/ijms21155326.
139.Xie, X. F.; Chu, H. J.; Xu, Y. F.; Hua, L.; Wang, Z. P.;Huang, P.; Jia, H. L.; Zhang, L. Cardiol. J. 2019, 26, 584,DOI: 10.5603/CJ.a2018.0032.
140.Zhang, L.; Wang, W.; Bai, J.; Xu, Y.-F.; Li, L.-Q.; Hua,L.; Deng, L.; Jia, H.-L. Rev. Port. Cardiol. 2016, 35, 265,DOI: 10.1016/j.repc.2015.11.016.
![PRACTICE OF POLYMER MALDI 11maldi.ch.pw.edu.pl/pomiary/Artykuly/liang-li/ocr/021-040_unity-reader.pdf · 2.2 PRACTICE OF POLYMER MALDI 11 MALDI sources [10]; these have also become](https://static.fdocuments.in/doc/165x107/5e20a425f916e801c369e9f7/practice-of-polymer-maldi-22-practice-of-polymer-maldi-11-maldi-sources-10-these.jpg)