Lafargeasiaresearch.daiwacm.com/eg/cgi-bin/files/20151103my_Lafarge... · Lafarge Malaysia’s...
12
3 November 2015 Affin Hwang Investment Bank Bhd (14389-U) (Formerly known as HwangDBS Investment Bank Bhd) Page 1 of 12 Potential industry oversupply The acquisition of Holcim Malaysia is expected to be completed by end-November 2015. Coupled with Lafarge’s on-going capacity expansion, the exercise would raise the group’s grinding capacity by up to 18%. However, we expect stiff price competition in 2016, in anticipation of a potential oversupply. We lower our 2015-17E EPS by 3-13%, but maintain our HOLD with a lower TP of RM8.80 (based on a 2016E PER of 23x, its past-5-year average). New capacity into 2016 Lafarge Malaysia’s proposed acquisition of Holcim Malaysia as well as its on-going capacity expansion would potentially raise the group’s grinding capacity by 18% to 15.3MT/year, maintaining its position as the industry leader. In 2016, we expect more new capacity to come on stream from other cement manufacturers, potentially raising industry-rated-grinding capacity by about 14% to 36.1m tonnes a year. Risk of price competition In 2014, cement production stood at 22.5m tonnes, while local consumption reached close to 18m tonnes. The potential slew of supply may potentially create a short-term oversupply and subsequently exert pressure on selling prices, as manufacturers will likely raise price rebates to garner, if not to maintain existing market share. However, the downtrend in coal prices is positive for cement manufacturers, in our view. Cutting our 2015-17E earnings by 3-13% Despite the anticipation of higher capacity as well as cheaper cost of coal, we are lowering our 2015-17E EPS by 3.3-12.7% on; (i) higher capex (borrowing costs); (ii) stronger US$/RM forecast, and (iii) more competitive average selling prices. Maintaining HOLD with a lower TP of RM8.80 Even though we cut our EPS forecast, we maintain our HOLD on Lafarge. However, we trim our 12-month TP to RM8.80 (from RM9.05 previously), based on a 2016E PER of 23x (from 21x), but still set at its past-5-year- average PER. Our TP implies an EV/tonne of installed capacity of US$210, vs. an EV/tonne valuation of about US$230 for local and regional players. Risks to our call include a further decline/reversal in coal prices and worse- than-anticipated price competition. Earnings & Valuation Summary FYE 31 Dec 2013 2014 2015E 2016E 2017E Revenue (RMm) 2,853.4 2,743.1 3,282.4 3,523.3 3,672.3 EBITDA (RMm) 655.1 494.0 593.4 628.1 621.7 Pretax profit (RMm) 514.9 345.2 408.5 434.0 438.4 Net profit (RMm) 366.6 256.0 306.4 325.5 328.8 EPS (sen) 43.1 30.1 36.1 38.3 38.7 PER (x) 21.1 30.2 25.2 23.8 23.5 Core net profit (RMm) 360.7 247.3 306.4 325.5 328.8 Core EPS (sen) 42.5 29.1 36.1 38.3 38.7 Core EPS growth (%) 3.4 -31.4 23.9 6.2 1.0 Core PER (x) 21.4 31.3 25.2 23.8 23.5 Net DPS (sen) 41.0 30.0 33.0 35.0 35.0 Dividend Yield (%) 4.5 3.3 3.6 3.8 3.8 EV/EBITDA (x) 11.5 15.1 13.2 12.4 12.4 Chg in EPS (%) -3.3 -11.8 -12.7 Affin/Consensus (x) 0.9 0.9 0.9 Source: Company, Affin Hwang forecasts, Bloomberg Company Update Lafarge Malaysia LMC MK Sector: Building Materials RM9.10 @ 2 November 2015 HOLD (maintain) Downside 3% Price Target: RM8.80 Previous Target: RM9.05 Price Performance 1M 3M 12M Absolute +0.5% -6.7% -13.3% Rel to KLCI -1.6% -2.3% -3.5% Stock Data Issued shares (m) 849.7 Mkt cap (RMm)/(US$m) 7,732/1,799 Avg daily vol - 6mth (m) 0.5 52-wk range (RM) 8.38-10.80 Est free float 25% BV per share (RM) 3.67 P/BV (x) 2.48 Net cash/ (debt) (RMm) (2Q15) 367.9 ROE (2015F) 9.7% Derivatives Nil Shariah Compliant Yes Key Shareholders Lafarge Cement UK 51.0% EPF 9.5% SASB 7.3% Source: Affin, Bloomberg Sharifah Farah (603) 2146 7538 [email protected]
Transcript of Lafargeasiaresearch.daiwacm.com/eg/cgi-bin/files/20151103my_Lafarge... · Lafarge Malaysia’s...

3 November 2015
Affin Hwang Investment Bank Bhd (14389-U) (Formerly known as HwangDBS Investment Bank Bhd)
Page 1 of 12
Potential industry oversupply
The acquisition of Holcim Malaysia is expected to be completed by
end-November 2015. Coupled with Lafarge’s on-going capacity
expansion, the exercise would raise the group’s grinding capacity
by up to 18%. However, we expect stiff price competition in 2016, in
anticipation of a potential oversupply. We lower our 2015-17E EPS
by 3-13%, but maintain our HOLD with a lower TP of RM8.80 (based
on a 2016E PER of 23x, its past-5-year average).
New capacity into 2016
Lafarge Malaysia’s proposed acquisition of Holcim Malaysia as well as its
on-going capacity expansion would potentially raise the group’s grinding
capacity by 18% to 15.3MT/year, maintaining its position as the industry
leader. In 2016, we expect more new capacity to come on stream from
other cement manufacturers, potentially raising industry-rated-grinding
capacity by about 14% to 36.1m tonnes a year.
Risk of price competition
In 2014, cement production stood at 22.5m tonnes, while local
consumption reached close to 18m tonnes. The potential slew of supply
may potentially create a short-term oversupply and subsequently exert
pressure on selling prices, as manufacturers will likely raise price rebates
to garner, if not to maintain existing market share. However, the downtrend
in coal prices is positive for cement manufacturers, in our view.
Cutting our 2015-17E earnings by 3-13%
Despite the anticipation of higher capacity as well as cheaper cost of coal,
we are lowering our 2015-17E EPS by 3.3-12.7% on; (i) higher capex
(borrowing costs); (ii) stronger US$/RM forecast, and (iii) more competitive
average selling prices.
Maintaining HOLD with a lower TP of RM8.80
Even though we cut our EPS forecast, we maintain our HOLD on Lafarge.
However, we trim our 12-month TP to RM8.80 (from RM9.05 previously),
based on a 2016E PER of 23x (from 21x), but still set at its past-5-year-
average PER. Our TP implies an EV/tonne of installed capacity of US$210,
vs. an EV/tonne valuation of about US$230 for local and regional players.
Risks to our call include a further decline/reversal in coal prices and worse-
than-anticipated price competition.
Earnings & Valuation Summary FYE 31 Dec 2013 2014 2015E 2016E 2017E Revenue (RMm) 2,853.4 2,743.1 3,282.4 3,523.3 3,672.3 EBITDA (RMm) 655.1 494.0 593.4 628.1 621.7 Pretax profit (RMm) 514.9 345.2 408.5 434.0 438.4 Net profit (RMm) 366.6 256.0 306.4 325.5 328.8 EPS (sen) 43.1 30.1 36.1 38.3 38.7 PER (x) 21.1 30.2 25.2 23.8 23.5 Core net profit (RMm) 360.7 247.3 306.4 325.5 328.8 Core EPS (sen) 42.5 29.1 36.1 38.3 38.7 Core EPS growth (%) 3.4 -31.4 23.9 6.2 1.0 Core PER (x) 21.4 31.3 25.2 23.8 23.5 Net DPS (sen) 41.0 30.0 33.0 35.0 35.0 Dividend Yield (%) 4.5 3.3 3.6 3.8 3.8 EV/EBITDA (x) 11.5 15.1 13.2 12.4 12.4 Chg in EPS (%) -3.3 -11.8 -12.7 Affin/Consensus (x) 0.9 0.9 0.9 Source: Company, Affin Hwang forecasts, Bloomberg
Company Update
Lafarge Malaysia LMC MK Sector: Building Materials
RM9.10 @ 2 November 2015
HOLD (maintain) Downside 3%
Price Target: RM8.80 Previous Target: RM9.05
Price Performance
1M 3M 12M Absolute +0.5% -6.7% -13.3% Rel to KLCI -1.6% -2.3% -3.5%
Stock Data
Issued shares (m) 849.7 Mkt cap (RMm)/(US$m) 7,732/1,799 Avg daily vol - 6mth (m) 0.5 52-wk range (RM) 8.38-10.80 Est free float 25% BV per share (RM) 3.67 P/BV (x) 2.48 Net cash/ (debt) (RMm) (2Q15) 367.9
ROE (2015F) 9.7% Derivatives Nil Shariah Compliant Yes
Key Shareholders
Lafarge Cement UK 51.0% EPF 9.5% SASB 7.3% Source: Affin, Bloomberg
Sharifah Farah
(603) 2146 7538 [email protected]

3 November 2015
Affin Hwang Investment Bank Bhd (14389-U) (Formerly known as HwangDBS Investment Bank Bhd)
Page 2 of 12
New stream of capacity
Acquisition of Holcim Malaysia
The proposed acquisition of Holcim is expected to be completed by as
early as November-15. It will instantly raise Lafarge’s grinding capacity by
9.2% to 14.14m MT/year. Holcim’s plant, which is located in Pasir Gudang,
Johor will complement one of Lafarge’s grinding plants in the same area,
taking the total annual grinding capacity in Johor to 1.96m tonnes, making
the merged entity the leader within the Southern region.
Likely to raise borrowings
Although Lafarge had sufficient cash balances of RM363m as at end-June
2015, we gather that it will likely raise bank borrowings to partially fund the
RM330m Holcim acquisition. Lafarge is also in the midst of expanding its
existing grinding facilities in Kanthan, Perak and Rawang, Selangor.
Assuming full funding via bank borrowings, it will translate into an
estimated net gearing of only 4.8%.
Synergies from acquisition
Amongst the apparent synergies to be derived from the merger include:
(i) Cost benefit through increase in economies of scale and
bargaining power, reduction in redundancy and consolidation of
corporate overhead.
(ii) Operational efficiency through the implementation of best
practices – logistics, distribution, procurement and energy
consumption.
Organic expansion on track
Lafarge’s on-going expansion at its Kanthan as well as its Rawang
integrated plants are on track for completion in 2016. The expansion will
have a combined additional grinding capacity of up to 1.2m tonnes a year
and about 500k tonnes of clinker capacity. Upon completion, Lafarge will
have a total grinding capacity of up to 15.3m tonnes and clinker capacity of
8.8m tonnes a year (fig 1). Recap that, the group has allocated RM250-
300m capex for the expansion.
Fig 1: Total capacity for the enlarged entity
Source: Company, Affin Hwang estimates
3 November 2015
Affin Hwang Investment Bank Bhd (14389-U) (Formerly known as HwangDBS Investment Bank Bhd)
Page 3 of 12
Potential industry oversupply
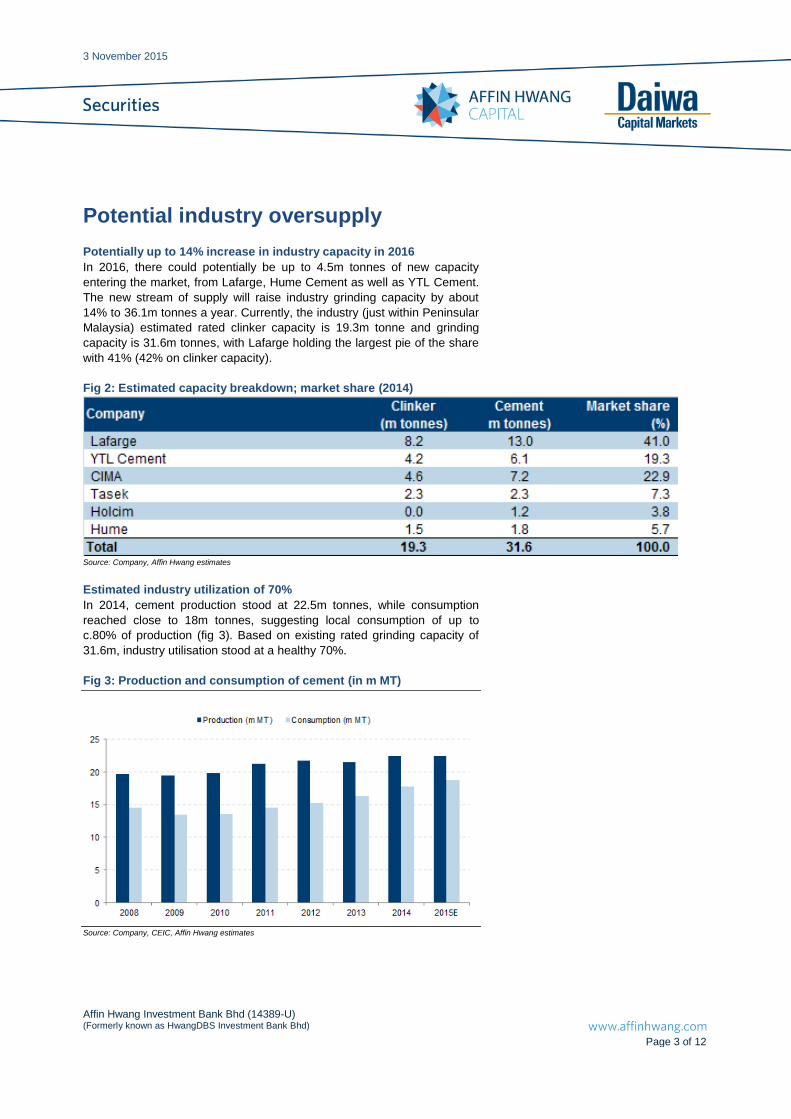
Potentially up to 14% increase in industry capacity in 2016
In 2016, there could potentially be up to 4.5m tonnes of new capacity
entering the market, from Lafarge, Hume Cement as well as YTL Cement.
The new stream of supply will raise industry grinding capacity by about
14% to 36.1m tonnes a year. Currently, the industry (just within Peninsular
Malaysia) estimated rated clinker capacity is 19.3m tonne and grinding
capacity is 31.6m tonnes, with Lafarge holding the largest pie of the share
with 41% (42% on clinker capacity).
Fig 2: Estimated capacity breakdown; market share (2014)
Source: Company, Affin Hwang estimates
Estimated industry utilization of 70%
In 2014, cement production stood at 22.5m tonnes, while consumption
reached close to 18m tonnes, suggesting local consumption of up to
c.80% of production (fig 3). Based on existing rated grinding capacity of
31.6m, industry utilisation stood at a healthy 70%.
Fig 3: Production and consumption of cement (in m MT)
Source: Company, CEIC, Affin Hwang estimates

3 November 2015
Affin Hwang Investment Bank Bhd (14389-U) (Formerly known as HwangDBS Investment Bank Bhd)
Page 4 of 12
Potential oversupply over the next few years?
Based on the potential incoming grinding-rated capacity, and assuming a
similar 70% utilisation rate on a total of 36.1m tonnes, production may
reach up to 25.3m tonnes a year, suggesting that there could potentially
be a huge gap between supply and consumption over the next few years.
Pressure on selling prices
Under these circumstances, we expect net selling prices for Ordinary
Portland Cement (OPC) to come under pressure. While we have seen the
catalogue prices being raised, rebates, however, may widen as players
jostle for market share.
Fig 4: Hike in gross ASPs
Source: Company , various newspapers (ie, The Star)
Coal continues to be on the downtrend
On a more positive note, the average cost of coal has fallen YTD by 15%
yoy to US$61 per tonne compared to an average of US$72 per tonne in
2014. The positive impact from the lower coal price will likely be more
apparent in 2016 as Lafarge normally locks in the bulk of its 12-month coal
requirements ahead. This impact will, however, be partially negated by the
strengthening of the greenback against the ringgit.
Fig 5: The price trend of coal (US$/MT)
Source: Bloomberg
3 November 2015
Affin Hwang Investment Bank Bhd (14389-U) (Formerly known as HwangDBS Investment Bank Bhd)
Page 5 of 12
Earnings forecasts
Borrowings to partially fund the acquisition
We have factored in the RM330m Holcim acquisition into our forecast.
Based on management’s guidance, Lafarge will likely raise borrowings of
up to RM300m to partially fund the acquisition and also to finance part of
their working capital.
Potential one-off staff consolidation costs in 4Q15
Following the acquisition, we believe that Lafarge may likely incur one-off
expenses due to a potential staff voluntary separation scheme in 4Q15, as
part of the exercise to reduce work redundancies as well as the
consolidation of corporate overheads.
Benefit from the downtrend in coal prices…
Given the further downtrend in coal prices, we have cut our coal-cost
assumption to US$60/MT and US$65/MT for 2016E and 2017E,
respectively (from US$65/MT and US$70/MT previously), while
maintaining our 2015E coal cost assumption at US$65/MT. Our sensitivity
analysis shows that for every US$5 drop in coal prices, our earnings would
improve by +5.6%.
…but impact partially negated by weakening RM against US$
While Lafarge will benefit from a cheaper price of coal, the impact will
partially be negated by the appreciation of the US$ against the RM, which
has strengthened by more than 20% over the past one year. We have
raised our US$/RM assumption to US$3.80 – US$4.00 from RM3.70 –
US$3.80 previously, in line with our house view.
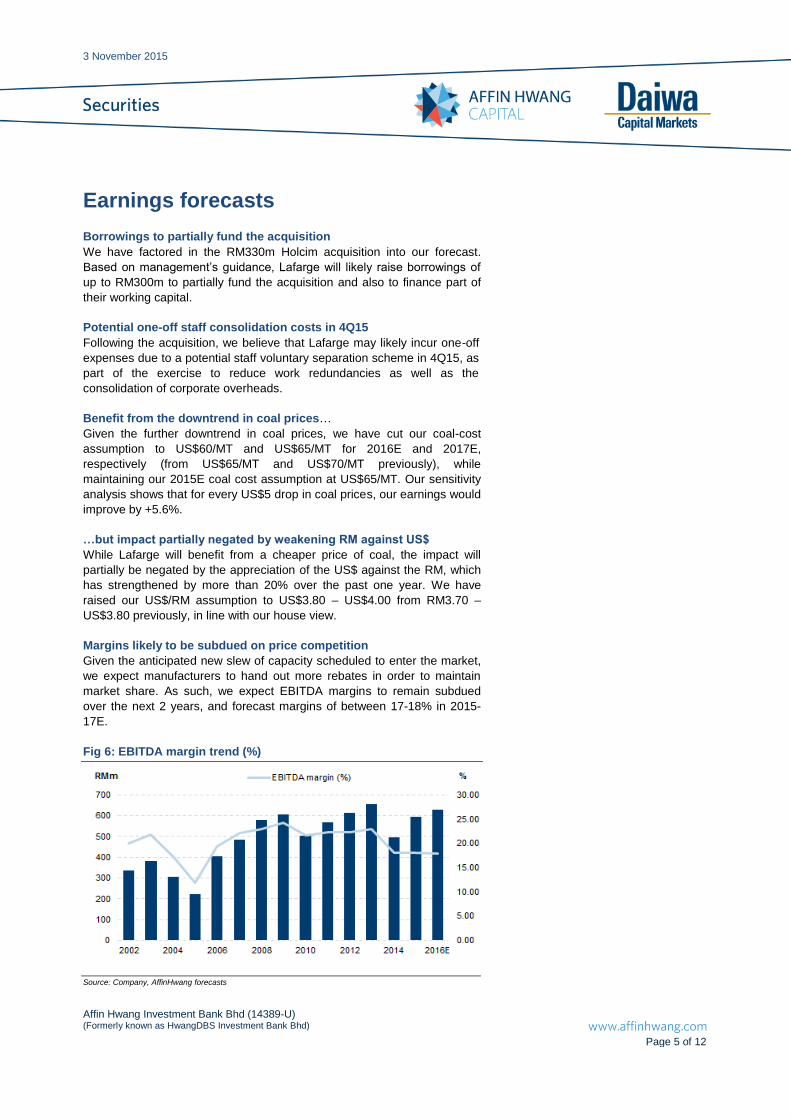
Margins likely to be subdued on price competition
Given the anticipated new slew of capacity scheduled to enter the market,
we expect manufacturers to hand out more rebates in order to maintain
market share. As such, we expect EBITDA margins to remain subdued
over the next 2 years, and forecast margins of between 17-18% in 2015-
17E.
Fig 6: EBITDA margin trend (%)
Source: Company, AffinHwang forecasts

3 November 2015
Affin Hwang Investment Bank Bhd (14389-U) (Formerly known as HwangDBS Investment Bank Bhd)
Page 6 of 12
Valuation and Recommendation
Cutting our 2015-17E EPS by 3-13%
Despite the anticipation of higher capacity as well as cheaper cost of coal,
we have lowered our 2015-17E EPS by 3.3%-12.7% on; (i) higher capex
(borrowing costs); (ii) stronger US$/RM forecast, and (iii) more competitive
average selling prices.
Maintaining HOLD with a lower TP of RM8.80
Over the past five years, shares of Lafarge have been trading within a PER
range of 15-30x, with an average of 23x. At current price levels, shares are
trading at a 23.8x 2016E EPS, which is within their past-5-year-average
trading range. Despite the cut in our EPS forecast, we maintain our HOLD
recommendation on Lafarge. However, we have lowered our 12-month
target price to RM8.80 (from RM9.05 previously), based on 23x 2016E
PER (from 21x) and still equivalent to its past-5-year-average PER. Our TP
also implies an EV/tonne of installed capacity of US$210, comparable to
EV/tonne valuations of about US$230 for local and regional players.
Overall, while the acquisition as well as the on-going capacity expansion is
positive for the group for a long-term sustainability, we believe the potential
new stream of capacity within the industry coming on stream in 2016 will
likely create an oversupply and may subsequently exert pressure on
selling prices, as manufacturers will likely raise price rebates to garner, if
not to maintain existing market share.
Fig 7: 5-year PER trend (x)
Source: Bloomberg, AffinHwang estimates
3 November 2015
Affin Hwang Investment Bank Bhd (14389-U) (Formerly known as HwangDBS Investment Bank Bhd)
Page 7 of 12
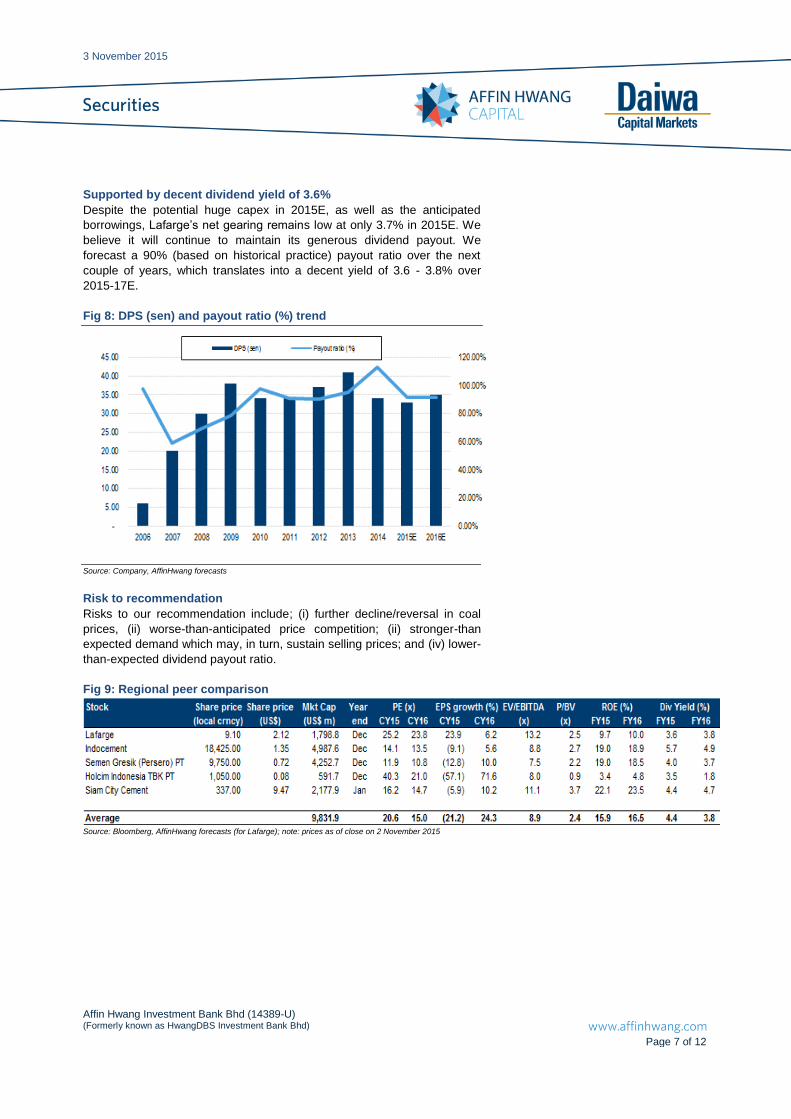
Supported by decent dividend yield of 3.6%
Despite the potential huge capex in 2015E, as well as the anticipated
borrowings, Lafarge’s net gearing remains low at only 3.7% in 2015E. We
believe it will continue to maintain its generous dividend payout. We
forecast a 90% (based on historical practice) payout ratio over the next
couple of years, which translates into a decent yield of 3.6 - 3.8% over
2015-17E.
Fig 8: DPS (sen) and payout ratio (%) trend
Source: Company, AffinHwang forecasts
Risk to recommendation
Risks to our recommendation include; (i) further decline/reversal in coal
prices, (ii) worse-than-anticipated price competition; (ii) stronger-than
expected demand which may, in turn, sustain selling prices; and (iv) lower-
than-expected dividend payout ratio.
Fig 9: Regional peer comparison
Source: Bloomberg, AffinHwang forecasts (for Lafarge); note: prices as of close on 2 November 2015

3 November 2015
Affin Hwang Investment Bank Bhd (14389-U) (Formerly known as HwangDBS Investment Bank Bhd)
Page 8 of 12
Fig 10: Construction projects announced and in the pipeline
Project Value
(RMbn) Comment
Potential listed co. winners
Pan-Borneo Highway 28.9 RM16.1bn for 1,090-km highway in Sarawak. RM12.8bn for 706-km highway in Sabah. Cost increased from initial estimate of RM27bn. Start in 2016, complete in 2021.
Cahya Mata Sarawak, Naim, WCT
Mass Rapid Transit Line 2 28.0 Start in 2Q16, complete in 2022
MMC-Gamuda (PDP), IJM, Suncon
Light Rail Transit Line 3 10.0 Cost increased from initial estimate of RM9bn. Start in 2016, complete in 2020
MRCB-George Kent (PDP), IJM, Suncon
Sungai Besi-Ulu Klang Expressway 5.3 Privatised project under Prolintas Sdn Bhd
IJM, Suncon, WCT, Ahmad Zaki
Damansara-Shah Alam Expressway 4.2 Privatised project under Prolintas Sdn Bhd
IJM, Suncon, WCT, Ahmad Zaki
Bus Rapid Transit (KL-Klang) 1.5 IJM, Suncon, WCT
Upgrade 700 km of rural roads nationwide
1.4
Bus Rapid Transit (Kota Kinabalu) 1.0 IJM, Suncon, WCT
Jalan Tun Razak Traffic Dispersal Scheme
0.9 Public-private partnership project
IJM, Suncon, WCT, Ahmad Zaki
Rural electrification 0.9
Water treatment plants 0.9 Taliworks, Loh & Loh
Flood mitigation 0.7 MRCB, Ekovest
Rural water supply 0.6
Improve reliability of Sabah electricity supply
0.5
MRCB
Upgrade road in FELDA settlements 0.2
Pulau Indah Expressway NA
Central Spine Road NA
Build 5 new hospitals NA In Pasir Gudang, Kemaman, Pendang, Maran, Cyberjaya
IJM
Total 84.9 Source: MOF, AffinHwang
3 November 2015
Affin Hwang Investment Bank Bhd (14389-U) (Formerly known as HwangDBS Investment Bank Bhd)
Page 9 of 12
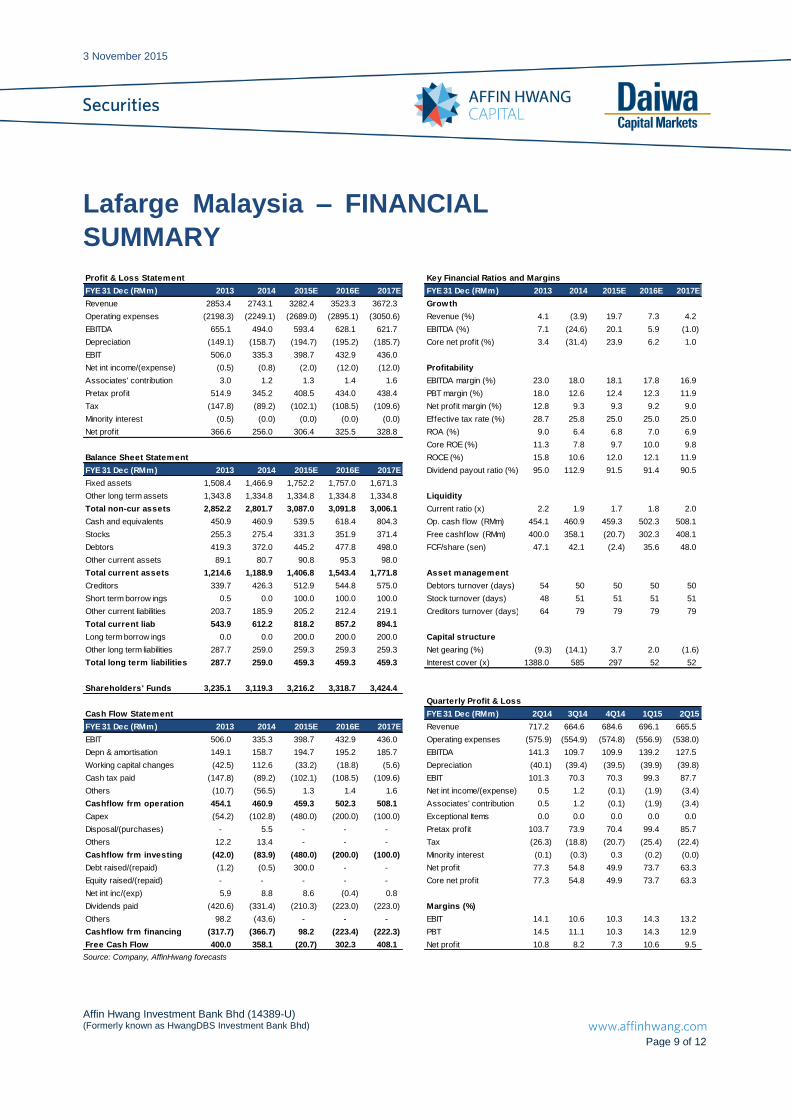
Lafarge Malaysia – FINANCIAL
SUMMARY
Profit & Loss Statement Key Financial Ratios and Margins
FYE 31 Dec (RMm) 2013 2014 2015E 2016E 2017E FYE 31 Dec (RMm) 2013 2014 2015E 2016E 2017E
Revenue 2853.4 2743.1 3282.4 3523.3 3672.3 Growth
Operating expenses (2198.3) (2249.1) (2689.0) (2895.1) (3050.6) Revenue (%) 4.1 (3.9) 19.7 7.3 4.2
EBITDA 655.1 494.0 593.4 628.1 621.7 EBITDA (%) 7.1 (24.6) 20.1 5.9 (1.0)
Depreciation (149.1) (158.7) (194.7) (195.2) (185.7) Core net profit (%) 3.4 (31.4) 23.9 6.2 1.0
EBIT 506.0 335.3 398.7 432.9 436.0
Net int income/(expense) (0.5) (0.8) (2.0) (12.0) (12.0) Profitability
Associates' contribution 3.0 1.2 1.3 1.4 1.6 EBITDA margin (%) 23.0 18.0 18.1 17.8 16.9
Pretax profit 514.9 345.2 408.5 434.0 438.4 PBT margin (%) 18.0 12.6 12.4 12.3 11.9
Tax (147.8) (89.2) (102.1) (108.5) (109.6) Net profit margin (%) 12.8 9.3 9.3 9.2 9.0
Minority interest (0.5) (0.0) (0.0) (0.0) (0.0) Effective tax rate (%) 28.7 25.8 25.0 25.0 25.0
Net profit 366.6 256.0 306.4 325.5 328.8 ROA (%) 9.0 6.4 6.8 7.0 6.9
Core ROE (%) 11.3 7.8 9.7 10.0 9.8
Balance Sheet Statement ROCE (%) 15.8 10.6 12.0 12.1 11.9
FYE 31 Dec (RMm) 2013 2014 2015E 2016E 2017E Dividend payout ratio (%) 95.0 112.9 91.5 91.4 90.5
Fixed assets 1,508.4 1,466.9 1,752.2 1,757.0 1,671.3
Other long term assets 1,343.8 1,334.8 1,334.8 1,334.8 1,334.8 Liquidity
Total non-cur assets 2,852.2 2,801.7 3,087.0 3,091.8 3,006.1 Current ratio (x) 2.2 1.9 1.7 1.8 2.0
Cash and equivalents 450.9 460.9 539.5 618.4 804.3 Op. cash f low (RMm) 454.1 460.9 459.3 502.3 508.1
Stocks 255.3 275.4 331.3 351.9 371.4 Free cashflow (RMm) 400.0 358.1 (20.7) 302.3 408.1
Debtors 419.3 372.0 445.2 477.8 498.0 FCF/share (sen) 47.1 42.1 (2.4) 35.6 48.0
Other current assets 89.1 80.7 90.8 95.3 98.0
Total current assets 1,214.6 1,188.9 1,406.8 1,543.4 1,771.8 Asset management
Creditors 339.7 426.3 512.9 544.8 575.0 Debtors turnover (days) 54 50 50 50 50
Short term borrow ings 0.5 0.0 100.0 100.0 100.0 Stock turnover (days) 48 51 51 51 51
Other current liabilities 203.7 185.9 205.2 212.4 219.1 Creditors turnover (days) 64 79 79 79 79
Total current liab 543.9 612.2 818.2 857.2 894.1
Long term borrow ings 0.0 0.0 200.0 200.0 200.0 Capital structure
Other long term liabilities 287.7 259.0 259.3 259.3 259.3 Net gearing (%) (9.3) (14.1) 3.7 2.0 (1.6)
Total long term liabilities 287.7 259.0 459.3 459.3 459.3 Interest cover (x) 1388.0 585 297 52 52
Shareholders' Funds 3,235.1 3,119.3 3,216.2 3,318.7 3,424.4
Quarterly Profit & Loss
Cash Flow Statement FYE 31 Dec (RMm) 2Q14 3Q14 4Q14 1Q15 2Q15
FYE 31 Dec (RMm) 2013 2014 2015E 2016E 2017E Revenue 717.2 664.6 684.6 696.1 665.5
EBIT 506.0 335.3 398.7 432.9 436.0 Operating expenses (575.9) (554.9) (574.8) (556.9) (538.0)
Depn & amortisation 149.1 158.7 194.7 195.2 185.7 EBITDA 141.3 109.7 109.9 139.2 127.5
Working capital changes (42.5) 112.6 (33.2) (18.8) (5.6) Depreciation (40.1) (39.4) (39.5) (39.9) (39.8)
Cash tax paid (147.8) (89.2) (102.1) (108.5) (109.6) EBIT 101.3 70.3 70.3 99.3 87.7
Others (10.7) (56.5) 1.3 1.4 1.6 Net int income/(expense) 0.5 1.2 (0.1) (1.9) (3.4)
Cashflow frm operation 454.1 460.9 459.3 502.3 508.1 Associates' contribution 0.5 1.2 (0.1) (1.9) (3.4)
Capex (54.2) (102.8) (480.0) (200.0) (100.0) Exceptional Items 0.0 0.0 0.0 0.0 0.0
Disposal/(purchases) - 5.5 - - - Pretax profit 103.7 73.9 70.4 99.4 85.7
Others 12.2 13.4 - - - Tax (26.3) (18.8) (20.7) (25.4) (22.4)
Cashflow frm investing (42.0) (83.9) (480.0) (200.0) (100.0) Minority interest (0.1) (0.3) 0.3 (0.2) (0.0)
Debt raised/(repaid) (1.2) (0.5) 300.0 - - Net profit 77.3 54.8 49.9 73.7 63.3
Equity raised/(repaid) - - - - - Core net profit 77.3 54.8 49.9 73.7 63.3
Net int inc/(exp) 5.9 8.8 8.6 (0.4) 0.8
Dividends paid (420.6) (331.4) (210.3) (223.0) (223.0) Margins (%)
Others 98.2 (43.6) - - - EBIT 14.1 10.6 10.3 14.3 13.2
Cashflow frm financing (317.7) (366.7) 98.2 (223.4) (222.3) PBT 14.5 11.1 10.3 14.3 12.9
Free Cash Flow 400.0 358.1 (20.7) 302.3 408.1 Net profit 10.8 8.2 7.3 10.6 9.5 Source: Company, AffinHwang forecasts
3 November 2015
Affin Hwang Investment Bank Bhd (14389-U) (Formerly known as HwangDBS Investment Bank Bhd)
Page 10 of 12
Important Disclosures and Disclaimer
This publication is prepared by Affin Hwang Investment Bank Berhad (“Affin Hwang”) and reviewed by Daiwa Securities Group Inc. and/or its non-U.S. affiliates (collectively, “Daiwa”), and is distributed and/or originated from outside Malaysia by Daiwa Securities Group Inc. and/or its non-U.S. affiliates, except to the extent expressly provided herein. The role of Daiwa Securities Group Inc. and/or its non-U.S. affiliates in connection with this publication is solely limited to the review and distribution of this publication ; and Daiwa Securities Group Inc. and/or its non-U.S. affiliates are not involved in the preparation of this publication in any other way. This research is for Daiwa clients only and the publication and the contents hereof are intended for information purposes only, and may be subject to change without further notice. Other than disclosures relating to Daiwa, this research is based on current public information that Affin Hwang and Daiwa consider reliable, but we do not represent it is accurate or complete, and it should not be relied on as such. The analysts named in this report may have from time to time discussed with clients, including Daiwa’s salespersons and traders, or may discuss in this report, trading strategies that reference catalysts or events that may have a near-term impact on the market price of the equity securities discussed in this report, which impact may be directionally counter to the analysts' published price target expectations for such stocks. Any such trading strategies are distinct from and do not affect the analysts' fundamental equity rating for such stocks, which rating reflects a stock's return potential relative to its coverage group as described herein. Any use, disclosure, distribution, dissemination, copying, printing or reliance on this publication for any other purpose without our prior consent or approval is strictly prohibited. Neither Affin Hwang ,Daiwa Securities Group Inc. nor any of its or their respective parent, holding, subsidiaries or affiliates, nor any of its or their respective directors, officers, servants and employees, represent nor warrant the accuracy or completeness of the information contained herein or as to the existence of other facts which might be significant, and will not accept any responsibility or liability whatsoever for any use of or reliance upon this publication or any of the contents hereof. Neither this publication, nor any content hereof, constitute, or are to be construed as, an offer or solicitation of an offer to buy or sell any of the securities or investments mentioned herein in any country or jurisdiction where such an offer or solicitation would be illegal nor, unless expressly provided, any recommendation or investment opinion or advice. Any view, recommendation, opinion or advice expressed in this publication constitutes the views of the analyst(s) named herein and does not necessarily reflect those of Affin Hwang, Daiwa Securities Group Inc. and/or its affiliates nor any of its respective directors, officers, servants and employees except where the publication states otherwise. This research report is not to be relied upon by any person in making any investment decision or otherwise advising with respect to, or dealing in, the securities mentioned, as it does not take into account the specific investment objectives, financial situation and particular needs of any person. Clients should consider whether any advice or recommendation in this research is suitable for their particular circumstances and, if appropriate, seek professional advice, including tax advice. The price and value of investments referred to in this research and the income from them may fluctuate. Past performance is not a guide to future performance, future returns are not guaranteed, and a loss of original capital may occur. Fluctuations in exchange rates could have adverse effects on the value or price of, or income derived from, certain investments. Certain transactions, including those involving futures, options, and other derivatives, give rise to substantial risk and are not suitable for all investors. Investors should review current options disclosure documents in relation to such investments. All research reports are disseminated and available to our clients simultaneously through electronic publication to our internal client websites. Not all research content is redistributed to our clients or available to third-party aggregators, nor is Daiwa and Affin Hwang responsible for the redistribution of our research by third party aggregators. Affin Hwang, Daiwa Securities Group Inc., its subsidiaries and affiliates, and its or their respective directors, officers and employees, from time to time may have trades as principals, or may have positions in, or have other interests in the securities of the company under research including market making activities, derivatives in respect of such securities or may have also performed investment banking and other services for the issuer of such securities. The following are additional disclosures. Ownership of Securities For “Ownership of Securities” information, please visit BlueMatrix disclosure link at https://daiwa3.bluematrix.com/sellside/Disclosures.action. Investment Banking Relationship For “Investment Banking Relationship”, please visit BlueMatrix disclosure link at https://daiwa3.bluematrix.com/sellside/Disclosures.action.
Japan
Disclosure of Interest of Daiwa Securities Group Inc.
Investment Banking Relationship
Within the preceding 12 months, the subsidiaries and/or affiliates of Daiwa Securities Group Inc. * has lead-managed public offerings and/or secondary offerings (excluding straight bonds) of the securities of the following companies: Modern Land (China) Co. Ltd (1107 HK); econtext Asia Ltd (1390 HK); Accordia Golf Trust (AGT SP); Hua Hong Semiconductor Ltd (1347 HK); GF Securities Co Ltd (1776 HK); Mirae Asset Life Insurance Co Ltd (085620 KS).
*Subsidiaries of Daiwa Securities Group Inc. for the purposes of this section shall mean any one or more of: Daiwa Capital Markets Hong Kong Limited (大和資本市場香港有限公
司), Daiwa Capital Markets Singapore Limited, Daiwa Capital Markets Australia Limited, Daiwa Capital Markets India Private Limited, Daiwa-Cathay Capital Markets Co., Ltd.,
Daiwa Securities Capital Markets Korea Co., Ltd.
This research may only be distributed in Japan to “qualified institutional investors”, as defined in the Financial Instruments and Exchange Act (Article 2 (3) (i)), as amended from time to time.
Disclosure of Interest of Affin Hwang Investment Bank -
Hong Kong
This research is distributed in Hong Kong by Daiwa Capital Markets Hong Kong Limited (大和資本市場香港有限公司) (“DHK”) which is regulated by the Hong Kong Securities and
Futures Commission. Recipients of this research in Hong Kong may contact DHK in respect of any matter arising from or in connection with this research. Relevant Relationship (DHK) DHK may from time to time have an individual employed by or associated with it serves as an officer of any of the companies under its research coverage.
Singapore
This research is distributed in Singapore by Daiwa Capital Markets Singapore Limited and it may only be distributed in Singapore to accredited investors, expert investors and institutional investors as defined in the Financial Advisers Regulations and the Securities and Futures Act (Chapter 289), as amended from time to time. By virtue of distribution to these category of investors, Daiwa Capital Markets Singapore Limited and its representatives are not required to comply with Section 36 of the Financial Advisers Act (Chapter 110) (Section 36 relates to disclosure of Daiwa Capital Markets Singapore Limited’s interest and/or its representative’s interest in securities). Recipients of this research in Singapore may contact Daiwa Capital Markets Singapore Limited in respect of any matter arising from or in connection with the research.
Australia
This research is distributed in Australia by Daiwa Capital Markets Stockbroking Limited and it may only be distributed in Australia to wholesale investors within the meaning of the Corporations Act. Recipients of this research in Australia may contact Daiwa Capital Markets Stockbroking Limited in respect of any matter arising from or in connection with the research.
India
This research is distributed in India to Institutional Clients only by Daiwa Capital Markets India Private Limited (Daiwa India) which is an intermediary registered with Securities & Exchange Board of India as a Stock Broker, Merchant Bank and Research Analyst. Daiwa India, its Research Analyst and their family members and its associates do not have any financial interest save as disclosed or other undisclosed material conflict of interest in the securities or derivatives of any companies under coverage. Daiwa India and its associates may have received compensation for any products other than Investment Banking (as disclosed) or brokerage services from the subject company in this report during the past 12 months. Unless otherwise stated in BlueMatrix disclosure link at https://daiwa3.bluematrix.com/sellside/Disclosures.action, Daiwa India and its associates do not hold more than 1% of any companies covered in this research report.
There is no material disciplinary action against Daiwa India by any regulatory authority impacting equity research analysis activities as of the date of this report.

3 November 2015
Affin Hwang Investment Bank Bhd (14389-U) (Formerly known as HwangDBS Investment Bank Bhd)
Page 11 of 12
Taiwan
This research is distributed in Taiwan by Daiwa-Cathay Capital Markets Co., Ltd and it may only be distributed in Taiwan to institutional investors or specific investors who have signed recommendation contracts with Daiwa-Cathay Capital Markets Co., Ltd in accordance with the Operational Regulations Governing Securities Firms Recommending Trades in Securities to Customers. Recipients of this research in Taiwan may contact Daiwa-Cathay Capital Markets Co., Ltd in respect of any matter arising from or in connection with the research.
Philippines
This research is distributed in the Philippines by DBP-Daiwa Capital Markets Philippines, Inc. which is regulated by the Philippines Securities and Exchange Commission and the Philippines Stock Exchange, Inc. Recipients of this research in the Philippines may contact DBP-Daiwa Capital Markets Philippines, Inc. in respect of any matter arising from or in connection with the research. DBP-Daiwa Capital Markets Philippines, Inc. recommends that investors independently assess, with a professional advisor, the specific financial risks as well as the legal, regulatory, tax, accounting, and other consequences of a proposed transaction. DBP-Daiwa Capital Markets Philippines, Inc. may have positions or may be materially interested in the securities in any of the markets mentioned in the publication or may have performed other services for the issuers of such securities.
For relevant securities and trading rules please visit SEC and PSE link at http://www.sec.gov.ph/irr/AmendedIRRfinalversion.pdf and http://www.pse.com.ph/ respectively.
United Kingdom
This research report is produced by Daiwa Securities Co. Ltd. and/or its affiliates and is distributed in the European Union, Iceland, Liechtenstein, Norway and Switzerland. Daiwa Capital Markets Europe Limited is authorised and regulated by The Financial Conduct Authority (“FCA”) and is a member of the London Stock Exchange and Eurex. This publication is intended for investors who are not Retail Clients in the United Kingdom within the meaning of the Rules of the FCA and should not therefore be distributed to such Retail Clients in the United Kingdom. Should you enter into investment business with Daiwa Capital Markets Europe’s affiliates outside the United Kingdom, we are obliged to advise that the protection afforded by the United Kingdom regulatory system may not apply; in particular, the benefits of the Financial Services Compensation Scheme may not be available. Daiwa Capital Markets Europe Limited has in place organisational arrangements for the prevention and avoidance of conflicts of interest. Our conflict management policy is available at http://www.uk.daiwacm.com/about-us/corporate-governance-regulatory.
Germany
This document is distributed in Germany by Daiwa Capital Markets Europe Limited, Niederlassung Frankfurt which is regulated by BaFin (Bundesanstalt fuer Finanzdienstleistungsaufsicht) for the conduct of business in Germany.
Bahrain
This research material is distributed in Bahrain by Daiwa Capital Markets Europe Limited, Bahrain Branch, regulated by The Central Bank of Bahrain and holds Investment Business Firm – Category 2 license and having its official place of business at the Bahrain World Trade Centre, South Tower, 7th floor, P.O. Box 30069, Manama, Kingdom of Bahrain. Tel No. +973 17534452 Fax No. +973 535113
United States
This report is distributed in the U.S. by Daiwa Capital Markets America Inc. (DCMA). It may not be accurate or complete and should not be relied upon as such. It reflects the preparer’s views at the time of its preparation, but may not reflect events occurring after its preparation; nor does it reflect DCMA’s views at any time. Neither DCMA nor the preparer has any obligation to update this report or to continue to prepare research on this subject. This report is not an offer to sell or the solicitation of any offer to buy securities. Unless this report says otherwise, any recommendation it makes is risky and appropriate only for sophisticated speculative investors able to incur significant losses. Readers should consult their financial advisors to determine whether any such recommendation is consistent with their own investment objectives, financial situation and needs. This report does not recommend to U.S. recipients the use of any of DCMA’s non-U.S. affiliates to effect trades in any security and is not supplied with any understanding that U.S. recipients of this report will direct commission business to such non-U.S. entities. Unless applicable law permits otherwise, non-U.S. customers wishing to effect a transaction in any securities referenced in this material should contact a Daiwa entity in their local jurisdiction. Most countries throughout the world have their own laws regulating the types of securities and other investment products which may be offered to their residents, as well as a process for doing so. As a result, the securities discussed in this report may not be eligible for sales in some jurisdictions. Customers wishing to obtain further information about this report should contact DCMA: Daiwa Capital Markets America Inc., Financial Square, 32 Old Slip, New York, New York 10005 (Tel no. 212-612-7000). Ownership of Securities For “Ownership of Securities” information please visit BlueMatrix disclosure link at https://daiwa3.bluematrix.com/sellside/Disclosures.action. Investment Banking Relationships For “Investment Banking Relationships” please visit BlueMatrix disclosure link at https://daiwa3.bluematrix.com/sellside/Disclosures.action. DCMA Market Making For “DCMA Market Making” please visit BlueMatrix disclosure link at https://daiwa3.bluematrix.com/sellside/Disclosures.action. Research Analyst Conflicts For updates on “Research Analyst Conflicts” please visit BlueMatrix disclosure link at https://daiwa3.bluematrix.com/sellside/Disclosures.action. The principal research analysts who prepared this report have no financial interest in securities of the issuers covered in the report, are not (nor are any members of their household) an officer, director or advisory board member of the issuer(s) covered in the report, and are not aware of any material relevant conflict of interest involving the analyst or DCMA, and did not receive any compensation from the issuer during the past 12 months except as noted: no exceptions. Research Analyst Certification For updates on “Research Analyst Certification” and “Rating System” please visit BlueMatrix disclosure link at https://daiwa3.bluematrix.com/sellside/Disclosures.action. The views about any and all of the subject securities and issuers expressed in this Research Report accurately reflect the personal views of the research analyst(s) primarily responsible for this report (or the views of the firm producing the report if no individual analysts[s] is named on the report); and no part of the compensation of such analyst(s) (or no part of the compensation of the firm if no individual analyst[s)] is named on the report) was, is, or will be directly or indirectly related to the specific recommendations or views contained in this Research Report.
For stocks and sectors in Malaysia covered by Affin Hwang, the following rating system is in effect:
Stocks:
BUY: Total return is expected to exceed +10% over a 12-month period
HOLD: Total return is expected to be between -5% and +10% over a 12-month period
SELL: Total return is expected to be below -5% over a 12-month period
NOT RATED: Affin Hwang Investment Bank Berhad does not provide research coverage or rating for this company. Report is intended as information only and not as a recommendation
Sectors:
OVERWEIGHT: Industry, as defined by the analyst’s coverage universe, is expected to outperform the KLCI benchmark over the next 12 months
NEUTRAL: Industry, as defined by the analyst’s coverage universe, is expected to perform inline with the KLCI benchmark over the next 12 months
UNDERWEIGHT: Industry, as defined by the analyst’s coverage universe is expected to under-perform the KLCI benchmark over the next 12 months
Conflict of Interest Disclosure
Ownership of Securities
For “Ownership of Securities” information, please visit BlueMatrix disclosure Link at https://daiwa3.bluematrix.com/sellside/Disclosures.action.
3 November 2015
Affin Hwang Investment Bank Bhd (14389-U) (Formerly known as HwangDBS Investment Bank Bhd)
Page 12 of 12
Investment Banking Relationships
For “Investment Banking Relationship”, please visit BlueMatrix disclosure Link at https://daiwa3.bluematrix.com/sellside/Disclosures.action.
Relevant Relationships
Affin Hwang may from time to time have an individual employed by or associated with it serves as an officer of any of the companies under its research coverage.
Affin Hwang market making
Affin Hwang may from time to time make a market in securities covered by this research.
Additional information may be available upon request.
Japan - additional notification items pursuant to Article 37 of the Financial Instruments and Exchange Law
(This Notification is only applicable where report is distributed by Daiwa Securities Co. Ltd.) If you decide to enter into a business arrangement with us based on the information described in materials presented along with this document, we ask you to pay close attention to the following items.
In addition to the purchase price of a financial instrument, we will collect a trading commission* for each transaction as agreed beforehand with you. Since commissions may be included in the purchase price or may not be charged for certain transactions, we recommend that you confirm the commission for each transaction.
In some cases, we may also charge a maximum of ¥ 2 million (including tax) per year as a standing proxy fee for our deposit of your securities, if you are a non-resident of Japan.
For derivative and margin transactions etc., we may require collateral or margin requirements in accordance with an agreement made beforehand with you. Ordinarily in such cases, the amount of the transaction will be in excess of the required collateral or margin requirements.
There is a risk that you will incur losses on your transactions due to changes in the market price of financial instruments based on fluctuations in interest rates, exchange rates, stock prices, real estate prices, commodity prices, and others. In addition, depending on the content of the transaction, the loss could exceed the amount of the collateral or margin requirements.
There may be a difference between bid price etc. and ask price etc. of OTC derivatives handled by us.
Before engaging in any trading, please thoroughly confirm accounting and tax treatments regarding your trading in financial instruments with such experts as certified public accountants. *The amount of the trading commission cannot be stated here in advance because it will be determined between our company and you based on current market conditions and the content of each transaction etc.
When making an actual transaction, please be sure to carefully read the materials presented to you prior to the execution of agreement, and to take responsibility for your own decisions regarding the signing of the agreement with us. Corporate Name: Daiwa Securities Co. Ltd. Financial instruments firm: chief of Kanto Local Finance Bureau (Kin-sho) No.108 Memberships: Japan Securities Dealers Association, The Financial Futures Association of Japan Japan Investment Advisers Association Type II Financial Instruments Firms Association