MALAYSIAN STATISTICS - workstory.s3.amazonaws.com · MALAYSIAN STATISTICS ON MEDICINES 2009 & 2010...
206
Transcript of MALAYSIAN STATISTICS - workstory.s3.amazonaws.com · MALAYSIAN STATISTICS ON MEDICINES 2009 & 2010...

MALAYSIAN STATISTICSON MEDICINES 2009 & 2010
Edited by:Siti Fauziah A., Kamarudin A., Nik Nor Aklima N.O.
With contributions from:Faridah Aryani MY., Fatimah AR., Sivasampu S., Rosliza L., Rosaida M.S., Kiew K.K., Tee H.P., Ooi B.P., Ooi E.T., Ghan S.L., Sugendiren S., Ang S.Y., Muhammad Radzi A.H. , Masni M., Muhammad Yazid J., Nurkhodrulnada M.L., Letchumanan G.R.R., Fuziah M.Z., Yong S.L., Mohamed Noor R., Daphne G., Chang K.M., Tan S.M., Sinari S., Lim Y.S., Tan H.J., Goh A.S., Wong S.P., Fong AYY., Zoriah A, Omar I., Amin AN., Lim CTY, Feisul Idzwan M., Azahari R., Khoo E.M., Bavanandan S., Sani Y., Wan Azman W.A., Yusoff M.R., Kasim S., Kong S.H., Haarathi C., Nirmala J., Sim K.H., Azura M.A., Suganthi T., Chan L.C., Choon S.E., Chang S.Y., Roshidah B., Ravindran J., Nik Mohd Nasri N.I, Wan Hamilton W.H., Zaridah S., Maisarah A.H., Rohan Malek J., Selvalingam S., Lei C.M., Hazimah H., Zanariah H., Hong Y.H.J., Chan Y.Y., Lin S.N., Sim L.H., Leong K.N., Norhayati N.H.S, Sameerah S.A.R, Rahela A.K., Yuzlina M.Y., Hafizah ZA ., Myat SK., Wan Nazuha W.R, Lim YS,Wong H.S., Rosnawati Y., Ong S.G., Mohd. Shahrir M.S., Hussein H., Mary S.C., Marzida M., Choo Y. M., Nadia A.R., Sapiah S., Mohd. Sufian A., Tan R.Y.L., Norsima Nazifah S., Nurul Faezah M.Y., Raymond A.A., Md. Hanip M.R., Toh C.L., Nor Hayati A., Azizul A., Mazni M.J., Umi Adzlin S., Noor Ratna N., Shamini R., Roslina A.M., Pang Y.K., Nurhayati M.M., Suhadah A., Pang S.F., Valuyeetham K.A., Leow W.L., Aswani Yanti B., Elias H., Bethel L., Shamala R., Manimegahlai S., Nur Izzura M.S., Valuyeetham K.A., Leow W.L., Aswani Yanti B., Primuharsa Putra S.H.A., Ho B.K., Husni H., Chan P.L., Norazida A.R., Saraiza A.B., Tan K.K., Rohani J., Nor
Saleha I.T., Saidatul Norbaya B., Najwa A.H.
A publication of thePHARMACEUTICAL SERVICES DIVISION AND
THE CLINICAL RESEARCH CENTREMINISTRY OF HEALTH
2
MALAYSIAN STATISTICS ON MEDICINES 2009 & 2010
December 2014Ministry of Health Malaysia
Published jointly by:
The National Medicines Use SurveyPharmaceutical Services DivisionMinistry of HealthLot 36, Jalan Universiti46350 Petaling JayaMalaysia
Tel : (603) 7841 3200Fax : (603) 7968 2222Website : http://www.pharmacy.gov.my
AND
The National Medicine Use SurveyClincial Research CentreMinistry of Health3rd Floor, MMA House124, Jalan Pahang50286 Kuala LumpurMalaysia
Tel : (603) 4043 9300Fax : (603) 4043 9400e-mail : [email protected] : http://www.crc.gov.my
This report is copyrighted. Reproduction and dissemination of this report in part or in whole for research, educational or other non-commercial purpose are authorized without any prior written permission from the copyright holders provided the source is fully acknowledged. Suggested citation is: Pharmaceutical Services Division and Clinical Research Centre, Ministry of Health Malaysia. Malaysian Statistcs on Medicine 2009 & 2010. Kuala Lumpur 2014
This report is also published electronically on website of the Pharmaceutical Services Division at: http://www.pharmacy.gov.my and the website of the Clinical Research Cenre at: http://www.crc.gov.my
Funding:The National Medicines Use Survey is funded by Operational Budget from Pharamceutical Services Division, Ministry of Health.
3
MALAYSIAN STATISTICS ON MEDICINES 2009 & 2010
PREFACE
Ensuring access to quality and affordable medicines is an important objective of Malaysia’s National Medicines Policy. The National Medicines Use Survey (NMUS) was conducted with the intent to continuously and systematically collect data on medicines in the hope to further improve their use as well as to provide a tool for better decision making in the allocation of healthcare resources for the Malaysian population.
The NMUS is into its ninth year and we are about to publish the sixth report of the Malaysian Statistics on Medicines (MSOM) 2009-2010. Initially from the first publication of MSOM 2004, we have progressively enhancing the data processing by scaling up the survey to a large sample size that requires time to compute and modify data processor to cater for the immense data.
MSOM 2009 & 2010, the drug utilization data is tabulated in such a way as to allow comparison of utilization between 2009 and 2010 as both data were analysed using the same statistical methods. The data was not compared to MSOM 2008 in order to expedite the most current data that is possible to publish at given time and resources. We are optimistic that as NMUS matures, there will be more chapters deliberated and the data processing methodologies will constantly refined, future MSOM reports will continue to produce accurate and reliable statistics on Malaysian medicines consumption at all time.
We sincerely hope that this MSOM 2009-2010 report will be useful to relevant healthcare professionals, serving as a source of reference and baseline for embarking in future research or clinical audits towards promoting rational prescribing and effective medicines use.
We would like to thank all staff who had worked very hard in ensuring the success of the NMUS, all agencies and institutions that had helped in providing data, all expert panel members and everyone who has in one way or another contributed enthusiastically to the success of the NMUS and the writing of this report. No matter how much we can do by ourselves on the national level, whether it be research or development, it is never enough. In a spirit of true cooperation, we must join in an action-oriented effort to uphold the rational use of medicine and healthcare of our nation.
Pharmaceutical Services DivisionMinistry of Health Malaysia
4
MALAYSIAN STATISTICS ON MEDICINES 2009 & 2010
ACKNOWLEDGEMENTS
The National Medicines Use Survey would like to thank the following for their participation, assistance, support or contributions:
• DirectorGeneralofHealth,Malaysia• DeputyDirectorGeneralofHealth(ResearchandTechnicalSupport),MinistryofHealth(MOH)• DeputyDirectorGeneralofHealth(MedicalServices),MOH• DeputyDirectorGeneralofHealth(PublicHealth),MOH• SeniorDirectorofPharmaceuticalServicesDivision,MOH• SeniorDirectorofOralHealthDivision,MOH• Director,NationalPharmaceuticalControlBureau,MOH• Director,ClinicalResearchCentre,MOH• HeadsofClinicalServices,MOH• ProcurementandPrivatisationDivision,MOH
• Allmedicaldoctors,pharmacistsandsupportpersonnelwhoparticipatedintheNMUSsurveys
• All participating public and private hospitals which provided or allowed access to their medicinesprocurement data
• UniversityofMalayaMedicalCentre,HospitalUniversitiKebangsaanMalaysia,HospitalUniversitiSainsMalaysia, Lumut Armed Forces Hospital, Terendak Armed Forces Hospital
• MembersoftheNMUSExpertPanelswhocontributedtowritingthisreport
• AssociationofPrivateHospitalsMalaysia,MalaysianOrganisationofPharmaceuticalIndustries(MOPI)and Pharmaceutical Association of Malaysia (PhAMA)
• Malaysian Medical Council, Malaysian Medical Association, Malaysian Pharmaceutical Society, TheAcademy of Family Physicians, Primary Care Doctors Association Malaysia, Malaysian Dental Association, Malaysian Private Dental Practitioners Association
• PharmaniagaLogisticsSdnBhd.andForteTechSolutionsSdn.Bhd.
• Allwhohaveinonewayoranothersupportedand/orcontributedtothesuccessoftheNMUSandthisreport
Dr. Salmah binti Bahri Chairman
Dr. Goh Pik Pin Co-Chairman
National Medicines Use Survey, Ministry of Health Malaysia
5
MALAYSIAN STATISTICS ON MEDICINES 2009 & 2010
ABOUT THE NATIONAL MEDICINES USE SURVEY
The National Medicines Use Survey (NMUS) is a project initiated and supported by the MOH to collect information on the supply, procurement, prescription, dispensing and use of drugs in Malaysia. The NMUS is designed to support the implementation of our National Medicines Policy (NMP). The objectives of NMP are to ensure only safe, efficacious and good quality medicines are available for use in Malaysia, as well as to promote equitable access to, and rational and cost-effective use of these medicines, ultimately leading to improved health for all Malaysians. In supporting this, the NMUS provides the functional capacity for the collection, analysis, reporting and dissemination of data on drug utilization in Malaysia.
The NMUS is jointly sponsored by:• PharmaceuticalServicesDivision,MinistryofHealth• ClinicalResearchCentre,NationalInstitutesofHealth,MinistryofHealth
Purpose of the NMUS
The availability of high quality, reliable and timely information on medicines use is crucial for any discussion on improving the use of medicines in Malaysia.The objective of the NMUS is therefore to quantify the present state and time trends of medicines utilization at various levels of our health care system, whether national, regional, local or institutional.
Routinely compiled statistics on medicines utilization have many uses, such as:1. Estimate the consumption of medicines and describe pattern of medicines use through assessing which
alternative drugs are being used for particular conditions and to what extent.2. Estimate the number of medicine users overall, by age, sex and geography and over time. 3. Estimate on the basis of known disease epidemiology to what extent medicines are under or over-used. 4. Relate the number of adverse drug reactions reported to our pharmacovigilance system to the number of
people exposed to the drug in order to assess the magnitude of the problem, or to estimate the degree of under-reporting of adverse events
5. Provide a crude estimate of disease prevalence based on its utilization rate.6. Estimate expenditure on pharmaceuticals, which constitutes a significant proportion of our healthcare
expenditure.
Monitor and evaluate the effects of interventions to improve the use of medicines. These interventions may be educational effort, promotional campaign, formulary restriction, medicines reimbursement scheme or regulatory measures
6
MALAYSIAN STATISTICS ON MEDICINES 2009 & 2010
NMUS STEERING COMMITTEE
Chairman Dr. Salmah binti Bahri Director of Pharmacy Practice and Development Pharmaceutical Services Division, Ministry of Health, Malaysia Co- Chairman Dr. Goh Pik Pin Director Clinical Research Centre, National Institutes of Health, Ministry of Health, Malaysia Members Dr. Sheamini a/p Sivasampu Head Healthcare Statistics Unit Clinical Research Centre, National Institutes of Health, Ministry of Health, Malaysia
Ms. Siti Fauziah binti Abu Senior Principal Assistant Director Pharmaceutical Services Division, Ministry of Health, Malaysia
Mr. Kamarudin bin Ahmad Senior Assistant Director Pharmaceutical Services Division, Ministry of Health, Malaysia
Ms. Nik Nor Aklima binti Nik Othseman Senior Assistant Director Pharmaceutical Services Division, Ministry of Health, Malaysia
7
MALAYSIAN STATISTICS ON MEDICINES 2009 & 2010
NMUS PROJECT TEAM
Chairman Dr. Salmah binti Bahri Co-Chairman Dr. Goh Pik Pin
NMUS Project Staff
NMUS Project Coordinator Dr. Sheamini a/p Sivasampu Mr. Kamarudin bin Ahmad
NMUS Project Manager Mr. Kamarudin Bin Ahmad Pharmacist Liaison Officer Ms. Siti Fauziah binti Abu
NMUS Pharmacist Ms. Nik Nor Aklima binti Nik Othseman
Technical Support Staff
Pharmaco-Epidemiologist Dr. Faridah Aryani binti Md. Yusof Dr. Nour Hanah binti Othman
Data Entry Personnel Ms. Safura binti Saad Ms. Nurul Rahmah binti Abdul Rahim Statistician Dr. Hoo Ling Ping IT Manager Ms. Celine Tsai Pao Chien Database Developer/Administrator Mr. Ahmad Hafizh bin Ayob Network Administrator Mr. Scott Huang Li Surin Mr. Adlan bin Ab. Rahman

8
MALAYSIAN STATISTICS ON MEDICINES 2009 & 2010
MEMBERS OF NMUS EXPERT PANELS1. Pharmacoeconomics MEMBERS INSTITUTION
Dr. Faridah Aryani bt Md. Yusof Pharmaceutical Services Division, Minsitry of Health Dr. Sheamini Sivasampu Clinical Research Centre, Ministry of Health Dr. Nour Hanah bt Othman Pharmaceutical Services Division, Minsitry of Health Fatimah bt Abdul Rahim Pharmaceutical Services Division, Minsitry of Health Rosliza bt Lajis Pharmaceutical Services Division, Minsitry of Health
2. Gastrointestinal Therapeutics MEMBERS INSTITUTION
Dr. Hjh. Rosaida bt. Mohd. Said Ampang Hospital Dr. Tee Hoi Poh Tengku Ampuan Afzan Hospital Dr Ooi Boon Phoe Pulau Pinang Hospital Dr. Kiew Kuang Kiat Sultanah Bahiyah Hospital Dr. Ooi Ee Thiam Kuala Lumpur Hospital Sugendiren Sugeran Putrajaya Hospital Ang Sie Yung Tengku Ampuan Rahmah Hospital Ghan Sheah Lin Universiti Kebangsaan Malaysia Medical Centre 3. Antiobesity MEMBERS INSTITUTION
Dr. Masni bt. Mohamad Putrajaya Hospital Prof. Madya Dr. Muhammad Yazid b. Jalaludin Universiti Malaya Medical Centre Norafidah bt Idris Serdang Hospital Nurkhodrulnada bt Muhamad Lattepi Kuala Lumpur Hospital 4. Antidiabetics MEMBERS INSTITUTION
Dr. G.R. Letchuman a/k Ramanathan Taiping Hospital Dr. Fuziah bt Mohd. Zain Putrajaya Hospital Dr. Yong Sy Liang Tengku Ampuan Rahimah Hospital Daphne Gima Putrajaya Hospital Mohamed Noor bin Ramli Universiti Kebangsaan Malaysia Medical Centre 5. Haematology MEMBERS INSTITUTION
Dr. Sinari Salleh Kuala Krai Hospital Dr. Tan Sen Mui Ampang Hospital Lim Yeok Siew Ampang Hospital Tan Hui Jun Ampang Hospital 6. Cardiovascular Therapeutics MEMBERS INSTITUTION
Dato’ Dr. Omar Ismail Pulau Pinang Hospital Dato’ Dr. Amin Ariff b. Nuruddin National Heart Institute Carilyn Lim Ti Yuen Tengku Ampuan Rahimah Hospital Pn. Yanti Nasyuhana bt Md Sani Heart Centre, General Hospital Sarawak Prof. Madya Datin Dr Zoriah Bt Aziz Universiti Malaya 7. Antihypertensives and Renal Therapeutics MEMBERS INSTITUTION
Dato’ Dr. Azhari Rosman National Heart Institute Prof. Dr. Khoo Ee Ming Universiti Malaya Medical Centre Dr. Sunita Bavanandan Kuala Lumpur Hospital Pn Yanti Nasyuhana bt Md Sani Heart Centre, General Hospital Sarawak
9
MALAYSIAN STATISTICS ON MEDICINES 2009 & 2010
8. Antilipidemia MEMBERS INSTITUTION
Prof. Dr. Wan Azman b. Wan Ahmad Universiti Malaya Medical Centre Prof. Madya Dr. Sazzli Shahlan bin Kassim Universiti Teknologi Mara Dr. Rahal Yusoff Kuala Lumpur Hospital Kong Shue Hong Universiti Kebangsaan Malaysia Medical Centre Haarathi Chandriah Pharmaceutical Services Division, Minsitry of Health Nirmala A/P Jagan Kuala Lumpur Hospital 9. Dermatology MEMBERS INSTITUTION
Datuk Dr.Roshidah bt. Baba Melaka Hospital Dr. Choon Siew Eng Sultanah Aminah Hospital Dr. Chan Lee Chin Pulau Pinang Hospital Dr. Suganthi Thevarajah Kuala Lumpur Hospital Dr. Azura bt Mohd. Affandi Kuala Lumpur Hospital Chang Shian Yi Raja Permaisuri Bainun Hospital 10. Obstetrics and Gynaecology MEMBERS INSTITUTION
Dato’ Dr. Ravindran Jegasothy Kuala Lumpur Hospital Prof. Dato’ Dr. Nik Mohd Nasri b. Nik Ismail Universiti Sains Islam Malaysia Dr. Wan Hamilton bt Wan Hassan Serdang Hospital Dr. Zaridah bt Shaffie Tuanku Fauziah Hospital Maisarah bt Abdul Hamid Kuala Lumpur Hospital 11. Urology MEMBERS INSTITUTION
Brig. Jen.Dato’ Dr. Selvalingam Sothilingam Hospital Angkatan Tentera Tuanku Mizan Hazimah bt Hashim Pharmaceutical Services Division, Minsitry of Health 12. Endocrine and Metabolic Therapeutics MEMBERS INSTITUTION
Dr. Zanariah bt. Hussein Putrajaya Hospital Dr. Janet Hong Putrajaya Hospital Lin Shu Ning Tengku Ampuan Rahimah Hospital Chan Yeen Yee Teluk Intan Hospital 13. Anti-infectives MEMBERS INSTITUTION
Dr. Benedict Sim Sungai Buloh Hospital Dr. Leong Kar Nim Pulau Pinang Hospital Dr. Muhammad Nazri bin Aziz Sungai Buloh Hospital Dr. Nor Hayati Shaharuddin Melaka Hospital Rahela bt Ambaras Khan Sungai Buloh Hospital Pn. Yuzlina bt Muhamad Yunus Putrajaya Hospital
14. Antineoplastics, Oncology MEMBERS INSTITUTION
Dr. Myat Soe Khine Sultan Ismail Hospital Dr. Hafizah Zahara bt Ahmad National Cancer Centre Wan Nazuha bt Wan Rusik Kuala Lumpur Hospital Lim Yeok Siew Ampang Hospital 15. Steroids and Immunosuppressives MEMBERS INSTITUTION
Dr. Wong Hin Seng Selayang Hospital Dr. Rosnawati bt. Yahya Kuala Lumpur Hospital Dr. Ong Swee Gaik Kuala Lumpur Hospital
10
MALAYSIAN STATISTICS ON MEDICINES 2009 & 2010
16. Musculoskeletal Therapeutics MEMBERS INSTITUTION
Dr. Heselyn Hussein Putrajaya Hospital Prof. Madya Mohd. Shahrir Mohd. Said Universiti Kebangsaan Malaysia Medical Centre 17. Analgesics and Anaesthetics MEMBERS INSTITUTION
Prof. Dr Marzida bt Mansor Universiti Malaya Medical Centre Dr. Mary S. Cardosa Selayang Hospital Nadia Ahmad Ridzwan Selayang Hospital Choo Yan Mei Tengku Ampuan Rahimah Hospital 18. Neurology MEMBERS INSTITUTION
Dato’ Dr. Md. Hanip b. Rafia Kuala Lumpur Hospital Prof. Dato’ Dr. Raymond Azman Ali Universiti Kebangsaan Malaysia Medical Centre Dr. Sapiah bt. Sapuan Sultanah Aminah Hospital Dr Raymond Tan Yen Leong Kuala Lumpur Hospital Dr. Mohd. Sufian Adenan Kuala Lumpur Hospital Norsima Nazifah bt Sidek Sultanah Nur Zahirah Hospital Nurul Faezah bt Mohd Yusof Sultanah Nur Zahirah Hospital 19. Psychiatric Therapeutics MEMBERS INSTITUTION
Dr. Toh Chin Lee Selayang Hospital Dr. Azizul b. Awaluddin Putrajaya Hospital Dr. Mazni binti Mat Junus Serdang Hospital Dr. Nor Hayati Ali Selayang Hospital Dr. Umi Adzlin bt. Silim Putrajaya Hospital Noor Ratna bt. Naharuddin Permai Hospital Shamini a/p Rama Bahagia Hospital 20. Respiratory Therapeutics MEMBERS INSTITUTION
Dr Nurhayati binti Mohd Marzuki Institute of Respiratory Medicine Prof. Madya Dr. Pang Yong Kek Universiti Malaya Medical Centre Prof. Dr. Roslina bt. Manap Universiti Kebangsaan Malaysia Medical Centre Pn Suhadah bt Ahad Melaka Hospital Pang Siow Fen Tengku Ampuan Najihah Hospital 21. Otorhinolaryngology MEMBERS INSTITUTION
Dr. Veluyeetham a/l Komaru Ambu Tuanku Jaafar Hospital Dr. Saraiza bt. Abu Bakar Serdang Hospital Dr. Primuharsa Putra bin Sabir Husin Athar KPJ Seremban Specialist Hospital/KPJ Healthcare University College Aswani Yanti bt Baharuddin Ampang Hospital Leow Wooi Leong Kuala Lumpur Hospital 22. Ophthalmology MEMBERS INSTITUTION
Dr. Elias Hussein Selayang Hospital Dr. Bethel Indira Livingstone Tuanku Jaafar Hospital Dr.Shamala Retnasabapathy Sg. Buloh Hospital Nur Izzura Akmal bt Mohd Shoid Melaka Hospital Manimegahlai A/P Selvaratnam Raja Permaisuri Bainun Hospital

11
MALAYSIAN STATISTICS ON MEDICINES 2009 & 2010
23. Cough and Cold MEMBERS INSTITUTION
Dr. Saraiza bt. Abu Bakar Serdang Hospital Dr. Primuharsa Putra bin Sabir Husin Athar KPJ Seremban Specialist Hospital/KPJ Healthcare University College Dr. Tan Kah Kee Tuanku Jaafar Hospital Dr. Ho Bee Kiau Klinik Kesihatan Botanik Dr. Husni bin Hussain Klinik Kesihatan Putrajaya Chan Pui Lim Pharmacy Service Division, Ministry of Health Norazida bt. Abdul Rahman Clinical Research Centre, Ministry of Health 24. Vaccines MEMBERS INSTITUTION
Dr. Rohani bt Jahis Disease Control Division, Ministry of Health Dr. Tan Kah Kee Tuanku Jaafar Hospital, Negeri Sembilan Najwa bt Ahmad Hamdi Family Health Development Division, Ministry of Health Nik Nor Aklima bt Nik Othseman Pharmacy Service Division, Ministry of Health
12
MALAYSIAN STATISTICS ON MEDICINES 2009 & 2010
CONTENTS
PREFACEACKNOWLEDGEMENTSABOUT THE NATIONAL MEDICINES USE SURVEYNMUS STEERING COMMITTEENMUS PROJECT TEAMMEMBERS OF NMUS EXPERT PANELSCONTENTSMETHODSABBREVIATIONS
Chapter 1 : Use of Medicines in Malaysia ........................................................................................................Chapter 2 : Expenditures on Medicines in Malaysia…………………………………………….........….Chapter 3 : Use of Drugs for Acid Related Disorders ...................................................................................Chapter 4 : Use of Antiobesity Drugs …………....................................................................….......................Chapter 5 : Use of Antidiabetic Drugs...............................................................................................................Chapter 6 : Use of Antianaemic Drugs………….............................................................................................Chapter 7 : Use of Antihaemorrhagics…………..............................................................................................Chapter 8 : Use of Drugs for Cardiovascular Disorders ...............................................................................Chapter 9 : Use of Antihypertensives ........................................................................................................……Chapter 10: Use of Lipid Modifying Drugs .............................................................................….....................Chapter 11: Use of Dermatologicals …………........................................................................................…….Chapter 12: Use of Gynaecologicals, Sex Hormones and Hormonal Contraceptives ……...........…….....Chapter 13: Use of Urologicals ..............................................................................………......….............…….Chapter 14: Use of Drugs for Endocrine Disorders ............................................................................………Chapter 15: Use of Anti-Infectives ............................................................................................................….....Chapter 16: Use of Antineoplastic Agents, Including Endocrine Therapy and Immunostimulants. .......Chapter 17: Use of Systemic Corticosteroids and Immunosuppressive Agents........................…..........….Chapter 18: Use of Drugs for Rheumatological and Bone Disorders ….....................................................Chapter 19: Use of Opioid Analgesics ..…………….....................................................................…………..Chapter 20: Use of Drugs for Neurological Disorders ……...........................................................…………Chapter 21: Use of Drugs for Psychiatric Disorders .......................................................................................Chapter 22: Use of Drugs for Obstructive Airway Diseases .........................................................................Chapter 23: Use of Antihistamines and Nasal Decongestants ...……................................................……..Chapter 24: Use of Ophthalmologicals …………...................................................................................……..Chapter 25: Use of Otologicals ...............................................................................…..................…………….Chapter 26: Use of Drugs for Cough and Cold.................................................................................................Chapter 27: Use of Vaccines.................................................................................................................................
Appendix 1: Participants of the National Medicines Use Survey
222936404246485062697382899497111120123128130138147151156163165170

13
MALAYSIAN STATISTICS ON MEDICINES 2009 & 2010
METHODSLian L.M.1, Hafizh A.A.2, Hazimah H.1, Gan H.H.1, Kok L.C.1, Leow A.Y.1, Lim J.Y.2, Thoo S.2, Hoo L.P.3, Faridah A.M.Y.4, Lim T.O.1
1. Clinical Research Centre, National Institutes of Health, MOH 2. Altus Solutions Sdn. Bhd.,3. Stats Consult Sdn. Bhd., 4. Pharmaceutical Services Division, MOH
Introduction
The NMUS is designed, broadly speaking, to estimate the quantity and pattern of use of medicines in Malaysia, as well as to estimate our expenditure on pharmaceuticals. This is an ambitious project which requires multiple surveys at the various levels of the medicines supply and distribution chain in the country (Figure 1) in order to capture all the required data to meet its purpose. Due to limitations of manpower and resources this project must of necessity be undertaken in phases. We have realistically targeted data sources that are absolutely critical and accessible, leaving the most inaccessible data sources for the future, hoping to build on the foundations laid by earlier surveys and capitalise on their successes.
Figure 1: Medicines Supply & Distribution Sysytem and Source of Data
Manufacturer / Importer
Distributor / Wholesaler
Primary Care / GP Hospital Pharmacy
Consumer / Patients
Hence, the statistics on medicines use and expenditure in this report are estimated from data from a limited number of surveys (which were essential and critical) that could be successfully completed nation-wide. The scope was also deliberately limited to “Prescription- Only Medicines” (obviously the pharmaceuticals of greatest interest) and excludes Over-the-Counter (OTC) medicines, traditional or herbal products and food supplements. “Prescription-Only Medicines” include all drugs classified as “poisons” under the Poisons Act 1952 (revised 1989). 1
As the NMUS matures, we should be able to provide more accurate and reliable estimates, as well as more informative and detailed analyses.
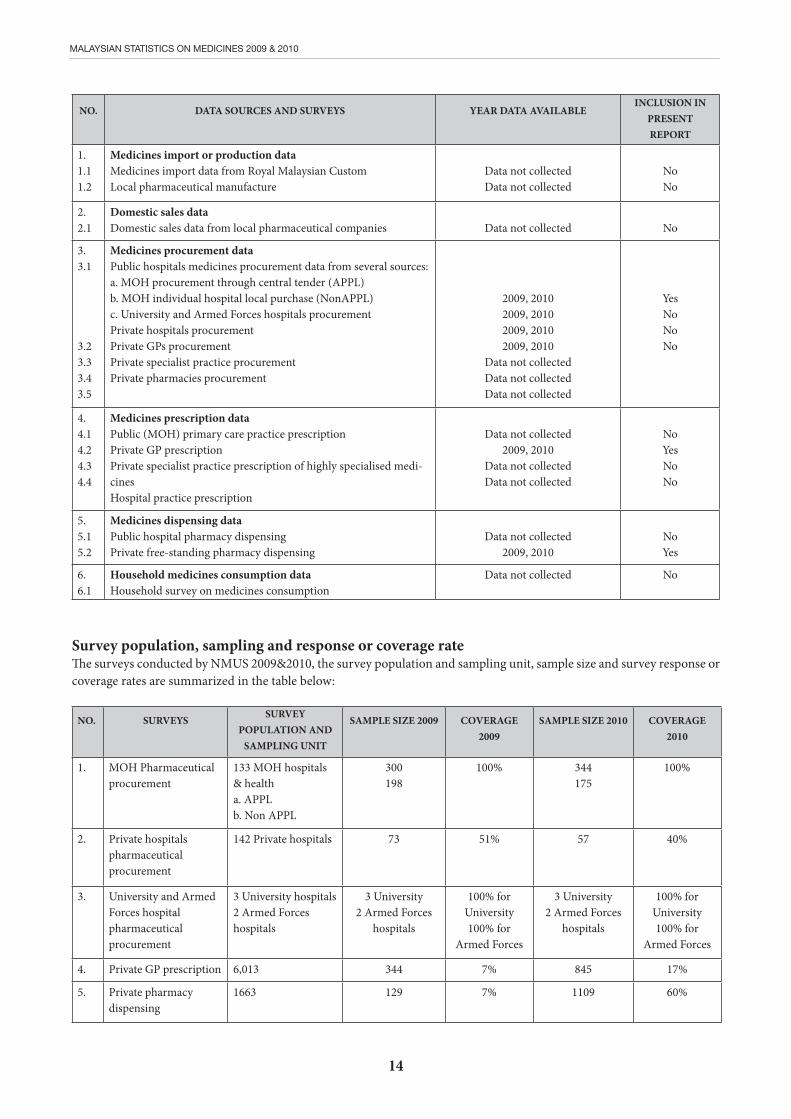
NMUS Surveys
The NMUS 2009-2010 conducted several surveys in order to capture data at the various levels of the medicines supply and distribution system in the country. The sources of data, data collection surveys, data availability and comments on data inclusion in this report are summarised in the table below:
14
MALAYSIAN STATISTICS ON MEDICINES 2009 & 2010
NO. DATA SOURCES AND SURVEYS YEAR DATA AVAILABLEINCLUSION IN
PRESENT REPORT
1.1.11.2
Medicines import or production dataMedicines import data from Royal Malaysian CustomLocal pharmaceutical manufacture
Data not collectedData not collected
NoNo
2.2.1
Domestic sales dataDomestic sales data from local pharmaceutical companies Data not collected No
3.3.1
3.23.33.43.5
Medicines procurement dataPublic hospitals medicines procurement data from several sources:a. MOH procurement through central tender (APPL)b. MOH individual hospital local purchase (NonAPPL)c. University and Armed Forces hospitals procurementPrivate hospitals procurementPrivate GPs procurementPrivate specialist practice procurementPrivate pharmacies procurement
2009, 20102009, 20102009, 20102009, 2010
Data not collectedData not collectedData not collected
YesNoNoNo
4.4.14.24.34.4
Medicines prescription dataPublic (MOH) primary care practice prescriptionPrivate GP prescriptionPrivate specialist practice prescription of highly specialised medi-cinesHospital practice prescription
Data not collected2009, 2010
Data not collectedData not collected
NoYesNoNo
5.5.15.2
Medicines dispensing dataPublic hospital pharmacy dispensingPrivate free-standing pharmacy dispensing
Data not collected2009, 2010
NoYes
6.6.1
Household medicines consumption dataHousehold survey on medicines consumption
Data not collected No
Survey population, sampling and response or coverage rateThe surveys conducted by NMUS 2009&2010, the survey population and sampling unit, sample size and survey response or coverage rates are summarized in the table below:
NO. SURVEYS SURVEY POPULATION AND
SAMPLING UNIT
SAMPLE SIZE 2009 COVERAGE 2009
SAMPLE SIZE 2010 COVERAGE 2010
1. MOH Pharmaceutical procurement
133 MOH hospitals & healtha. APPLb. Non APPL
300198
100% 344175
100%
2. Private hospitals pharmaceutical procurement
142 Private hospitals 73 51% 57 40%
3. University and Armed Forces hospital pharmaceutical procurement
3 University hospitals2 Armed Forces hospitals
3 University2 Armed Forces
hospitals
100% for University100% for
Armed Forces
3 University2 Armed Forces
hospitals
100% for University100% for
Armed Forces
4. Private GP prescription 6,013 344 7% 845 17%
5. Private pharmacy dispensing
1663 129 7% 1109 60%

15
MALAYSIAN STATISTICS ON MEDICINES 2009 & 2010
Data collectionThe surveys conducted by NMUS collected data either by1. Download from existing databases2. Primary data collection3. These are described below.
NO. SURVEYS DATA DOWNLOAD FROM EXISTING DATABASES
1. MOH Pharmaceutical procurement
Pharmaniaga pharmaceutical procurement databases, central database as well as individual hospitals and health district local purchase database
2. Private hospitals pharmaceutical procurement
Individual hospitals’ pharmaceutical procurement databases
3. University and Armed Forces hospital pharmaceutical procurement
Individual hospitals’ pharmaceutical procurement databases
4. Private GP prescription A sample of GPs collected prescription data in a randomly selected week. The sample being distributed over 3 four-monthly cycle
5. Private Pharmacy dispensing A sample of pharmacies with resident pharmacist collected dispensing data in a randomly selected week. The sample being distributed over 3 four-monthly cycle
Data managementThe collected data, whether in databases or in paper or electronic data collection form, was compiled into a single database, appropriately processed and coded prior to statistical analysis.
The NMUS database was created in MS SQL Server. The application has three modules: Contact Management, Data Entry (Retail Pharmacy) and Data Processing.
• ContactManagementmodule was used to collect the establishments’ survey details, log and track all the correspondence documents with SDP, and forecast, plan and schedule the conduct of the survey.
• DataEntrymodule was used to collect the data submitted by the SDP in paper form. It has been designed to collect data from GP prescription survey and pharmacy dispensing survey using paper CRF, prescription booklets or template.
• DataProcessingmodule was used to clean, manage and process the medicines data prior to statistical analysis. The automated data processing functionalities included ATC coding, DDD Assignment, Total Dosage Calculation and Unit Conversions.
The data processing steps were as follows:
NO. DATA PROCESSING FOR DOWNLOADED DATABASE
1. Data were downloaded from the existing database of the following data sources •MOHAPPLProcurement•MOHNon-APPLProcurement•PrivateHospitalProcurement•UniversityProcurement•ArmedForcesProcurement•GPPrescription•PrivatePharmacyDispensing•eNMUSWebApplication•NationalMedicalCareSurvey(NMCS)PrimaryCarePrescriptiondatasetThe data downloaded could be in flat file format, e.g. TXT/ XLS/PDF and etc, or database files such as Access/ Oracle/ SQL and etc.
2. The required variables were registration number, drug description, packaging description, supplier name, value procured, quantity procured, year procured and etc.
3. Next, the required fields/ variables were imported into database and then extracted using SQL queries. The extracted data were then normalized by separating into multiple, related tables in a single compiled database.
4. Some of the data required aggregation, e.g. total a few transactions on the same drug into one record, to speed up subsequent query performance
5. The data were then be linked to the respective SDP in the main contact table.

16
MALAYSIAN STATISTICS ON MEDICINES 2009 & 2010
NO. DATA PROCESSING FOR PRIMARY SURVEY DATA
1. Data entryData was entered into the Data Entry module of the database.Prior to data entry, data entry personnel were briefed on how to use the application and enter the data. Necessary precautions were given verbally, for example, to check each clinic by office ID and name, as there are clinics with many branches of the same name.A demonstration was done on data entry during the briefing.Personnel were supervised while doing the first few entries to make sure they know how to do it correctly.A standard document on steps/ precautions for data entry was given to each personnel.They were also given a softcopy of the list of pharmaceutical products (scheduled poison and non-scheduled poison) obtained from National Pharmaceuticals Control Bureau, to cross check the spelling of drugs when the writing is less legible.
2. Edit checksSurvey forms were cross-checked against the database.Selection of survey form was by data entry personnel, randomly by survey date. If number of drug entries for selected date were not sufficient, more survey dates were included.Items checked:
a. Number of patients were same in survey form and databaseb. Number of drug entry/ drug prescribed was same in survey form and database.c. Age, sex of patient was entered correctly.d, Drug particulars were entered correctly.
3. Calculations and Derived variables•DoseperdaywasobtainedbyDosage*frequency•DosepervisitwasobtainedbyDosage*frequency*duration
4. Visual review and manual assessment of entries if there were misspellings.
NO. COMMON DATA PROCESSING STEPS
1. BPFK Registered Product ListAn estimated 11,305 ‘prescription’ products from 35,570 products registered with BPFK were coded to ATC INN (Level 5). The coded BPFK drugs list served as an internal drug dictionary for medicines data coding.
2. Data Parsing by programmingThe variables ‘Drug Description’ and ‘Packaging Description’ in medicines (procurement/ prescription/ dispensing) data were parsed into smaller parts using a specially written computer program. Parsing facilitated the auto-coding process and dosage calculation later.
The variable ‘Drug Description’ was parsed into ‘Brand’, ‘INN’, ‘Dosage’, ‘Unit’ and ‘Route’e.g. Zocor Tab 80 mgBrand – ZocorInn – noneDosage – 80Unit- mgRoute – Tab
The variable ‘Packaging Description’ was parsed into ‘Big Unit’, ‘Small Unit’ and ‘Factor’e.g. Pack of 10 tabsBig Unit – PackSmall Unit – tabsFactor – 10
3. ATC Coding•Theparsed‘Brand’wasthenlinkedtothecodedBPFKdruglisttoobtaintheATC,INNandDDD.However,ifacertain
brand had more than one DDD, the administration route had to be considered when assigning the DDD.• Ontheotherhand,anyparsed‘INN’waslinkeddirectlytotheATCLevel5toobtainthestandardINNandDDD.
Similarly, if a certain INN had more than one DDD, the administration route had to be considered when assigning the DDD.
• VisualreviewandmanualcodingofresidualmedicinesdatatoATCwascarriedoutforresidualdatawhichwerenotauto-processed due to incompleteness or inconsistencies.
17
MALAYSIAN STATISTICS ON MEDICINES 2009 & 2010
NO. COMMON DATA PROCESSING STEPS
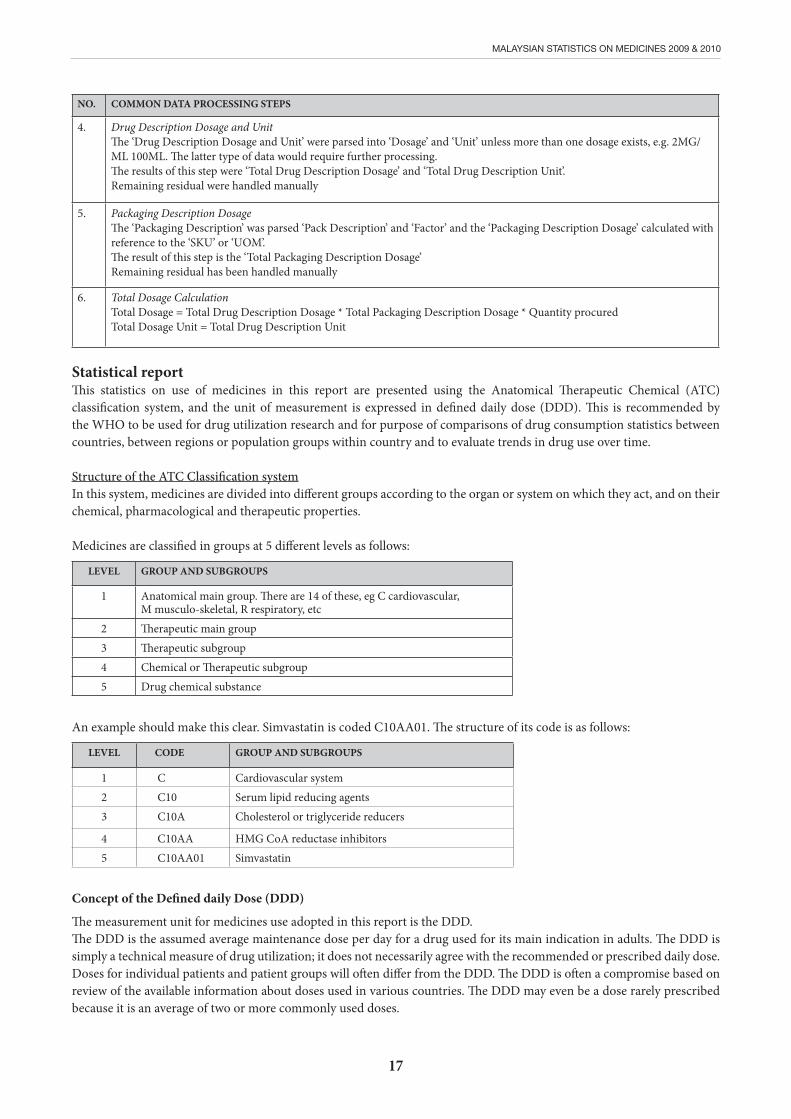
4. Drug Description Dosage and UnitThe ‘Drug Description Dosage and Unit’ were parsed into ‘Dosage’ and ‘Unit’ unless more than one dosage exists, e.g. 2MG/ML 100ML. The latter type of data would require further processing.The results of this step were ‘Total Drug Description Dosage’ and ‘Total Drug Description Unit’.Remaining residual were handled manually
5. Packaging Description DosageThe ‘Packaging Description’ was parsed ‘Pack Description’ and ‘Factor’ and the ‘Packaging Description Dosage’ calculated with reference to the ‘SKU’ or ‘UOM’. The result of this step is the ‘Total Packaging Description Dosage’Remaining residual has been handled manually
6. Total Dosage CalculationTotalDosage=TotalDrugDescriptionDosage*TotalPackagingDescriptionDosage*QuantityprocuredTotal Dosage Unit = Total Drug Description Unit
Statistical reportThis statistics on use of medicines in this report are presented using the Anatomical Therapeutic Chemical (ATC) classification system, and the unit of measurement is expressed in defined daily dose (DDD). This is recommended by the WHO to be used for drug utilization research and for purpose of comparisons of drug consumption statistics between countries, between regions or population groups within country and to evaluate trends in drug use over time.
Structure of the ATC Classification systemIn this system, medicines are divided into different groups according to the organ or system on which they act, and on their chemical, pharmacological and therapeutic properties.
Medicines are classified in groups at 5 different levels as follows:
LEVEL GROUP AND SUBGROUPS
1 Anatomical main group. There are 14 of these, eg C cardiovascular, M musculo-skeletal, R respiratory, etc
2 Therapeutic main group3 Therapeutic subgroup4 Chemical or Therapeutic subgroup5 Drug chemical substance
An example should make this clear. Simvastatin is coded C10AA01. The structure of its code is as follows:
LEVEL CODE GROUP AND SUBGROUPS
1 C Cardiovascular system2 C10 Serum lipid reducing agents3 C10A Cholesterol or triglyceride reducers
4 C10AA HMG CoA reductase inhibitors5 C10AA01 Simvastatin
Concept of the Defined daily Dose (DDD)
The measurement unit for medicines use adopted in this report is the DDD. The DDD is the assumed average maintenance dose per day for a drug used for its main indication in adults. The DDD is simply a technical measure of drug utilization; it does not necessarily agree with the recommended or prescribed daily dose. Doses for individual patients and patient groups will often differ from the DDD. The DDD is often a compromise based on review of the available information about doses used in various countries. The DDD may even be a dose rarely prescribed because it is an average of two or more commonly used doses.
18
MALAYSIAN STATISTICS ON MEDICINES 2009 & 2010
3651000ˆ
×××
PdddT
PdddT
××1000ˆ
Medicines use statistics in this report are presented for most drugs as numbers of DDDs per 1000 inhabitants per day. Some interpretative notes follows:
• TheDDDs/1000inhabitants/dayprovidesaroughestimateoftheproportionofpopulationtreateddailywithcertaindrugs. For example, the figure 10 DDDs/1000 inhabitants/day indicates that 1% (10/1000) of the population on average might get a certain drug or group of drugs every day in the year.
• TheDDDs/1000inhabitants/dayismostusefulfordrugsusedinthetreatmentofchronicdiseasesandespeciallywhenthere is a good agreement between the average prescribed daily dose and the DDD.
• Formostdrugs, theirDDDs/1000 inhabitants/dayare calculated for the totalpopulation includingall ageand sexgroups. Where a drug use is limited to particular age or sex groups, then it will be more meaningful to express the figure for the relevant age-sex groups only. For example DDDs/1000 children age<12 /day, or DDDs/1000 women in reproductive age groups/day.
For anti-infectives (or other drugs normally used in short duration), the medicine use statistics are presented as DDD per inhabitant per year. This gives an estimate of the number of days for which each inhabitant is, on average, treated annually. For example, 5 DDDs/inhabitant/year indicates that the utilization is equivalent to the treatment of every inhabitant with a 5-days course in the year.
In interpreting drug utilization statistics expressed using DDD as in this report, readers are caution to bear in mind the following limitations:
• AmedicinemayhaveseveralindicationswhiletheDDDisbasedonthemainindicationinadults.• Medicinesprocuredorprescribedordispensed,aspresentedhere,maynotnecessarilybeconsumed.• DDDmay be difficult to assign or not assign at all for certainmedicines, for examplesmedicines withmultiple
ingredients, topical products, anti-neoplastic drugs and anaesthetic agents.• MedicinesnewlyintroducedintothemarketmayyethaveATCandDDDassignedtoit.• TheDDDassigned toadrug isprimarilybasedonothercountries’ experienceandmaynot reflect thecommonly
prescribed adult dose in Malaysia
For most parts of this report, only drugs with WHO-assigned DDDs are included in the utilisation statistics. However, a few groups of drugs which do not have WHO-assigned DDDs, namely the Antineoplastics, Dermatologicals, Ophthalmologicals, Otologicals, Cough and Cold Combinations and Vaccines were given DDDs based on the WHO general guidelines to enable us to present the national utilisation and patterns of use, relative to drugs within the respective groups only.
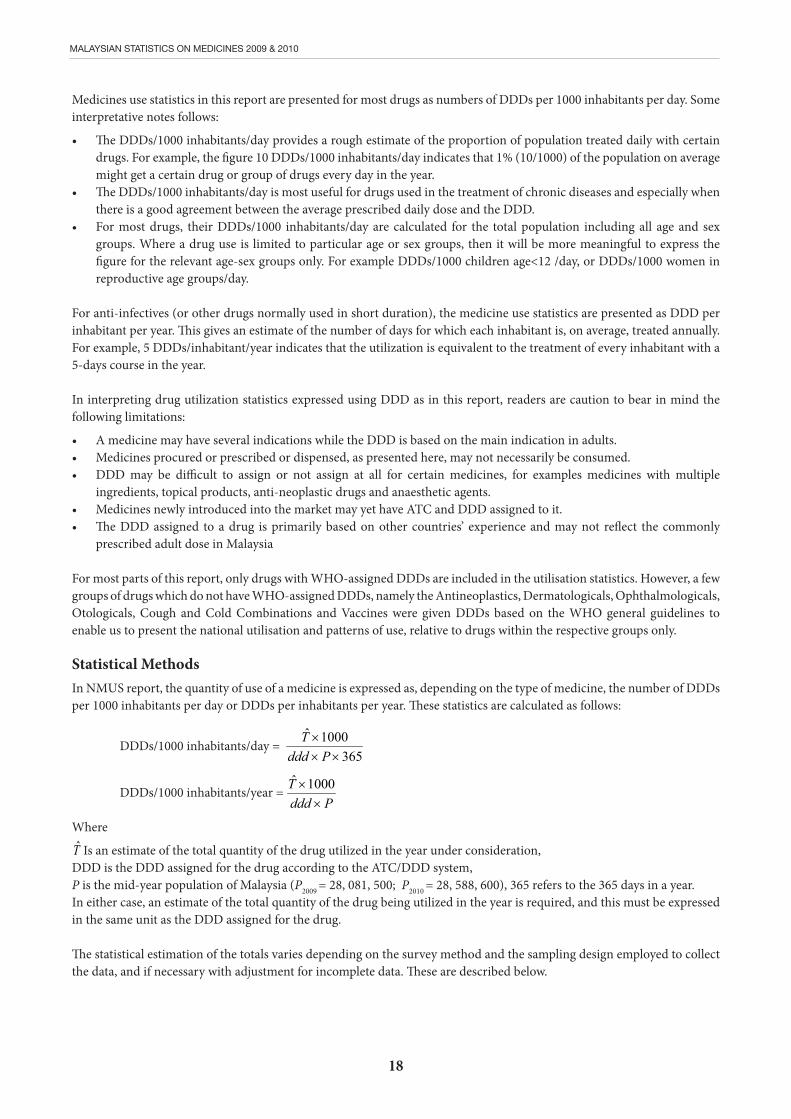
Statistical MethodsIn NMUS report, the quantity of use of a medicine is expressed as, depending on the type of medicine, the number of DDDs per 1000 inhabitants per day or DDDs per inhabitants per year. These statistics are calculated as follows:
DDDs/1000 inhabitants/day =
DDDs/1000 inhabitants/year =
Where
T̂ Is an estimate of the total quantity of the drug utilized in the year under consideration,DDD is the DDD assigned for the drug according to the ATC/DDD system,P is the mid-year population of Malaysia (P2009 = 28, 081, 500; P2010 = 28, 588, 600), 365 refers to the 365 days in a year.In either case, an estimate of the total quantity of the drug being utilized in the year is required, and this must be expressed in the same unit as the DDD assigned for the drug.
The statistical estimation of the totals varies depending on the survey method and the sampling design employed to collect the data, and if necessary with adjustment for incomplete data. These are described below.
19
MALAYSIAN STATISTICS ON MEDICINES 2009 & 2010
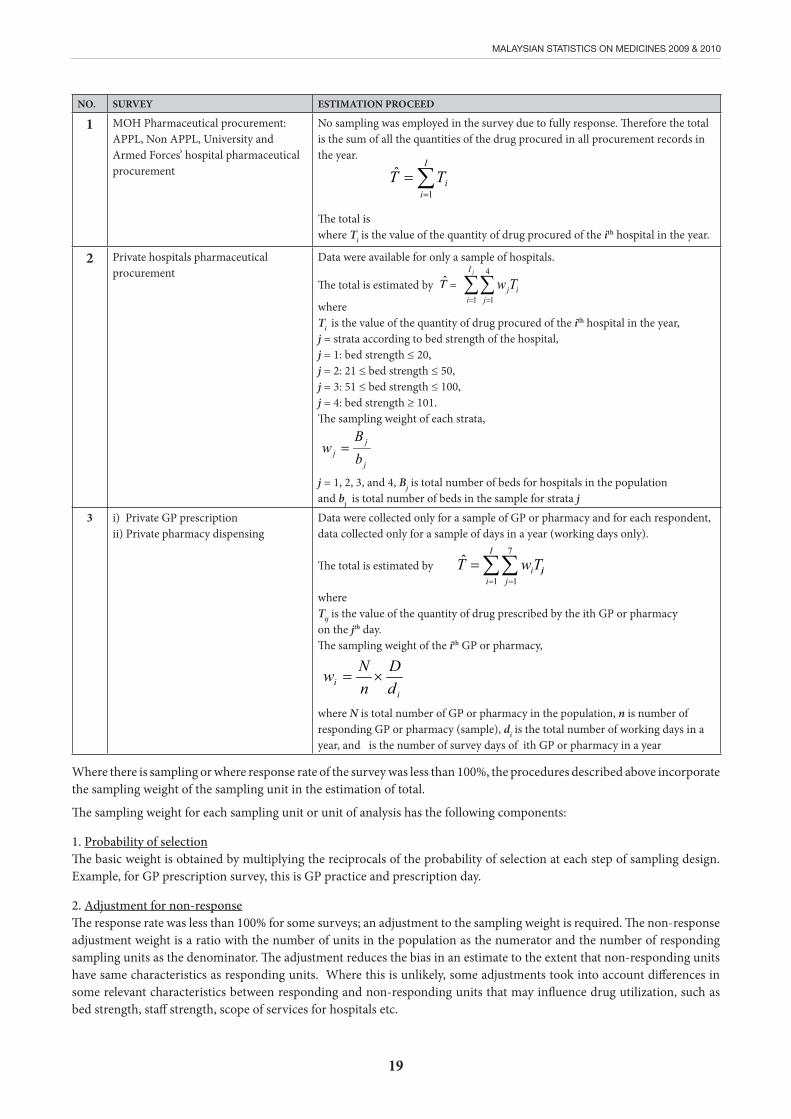
NO. SURVEY ESTIMATION PROCEED
1 MOH Pharmaceutical procurement: APPL, Non APPL, University and Armed Forces’ hospital pharmaceutical procurement
No sampling was employed in the survey due to fully response. Therefore the total is the sum of all the quantities of the drug procured in all procurement records in the year.
The total is where Ti is the value of the quantity of drug procured of the ith hospital in the year.
2 Private hospitals pharmaceutical procurement
Data were available for only a sample of hospitals.
The total is estimated by T̂ =
whereTi is the value of the quantity of drug procured of the ith hospital in the year,j = strata according to bed strength of the hospital,j = 1: bed strength ≤ 20,j = 2: 21 ≤ bed strength ≤ 50,j = 3: 51 ≤ bed strength ≤ 100,j = 4: bed strength ≥ 101.The sampling weight of each strata,
j = 1, 2, 3, and 4, Bj is total number of beds for hospitals in the populationand bj is total number of beds in the sample for strata j
3 i) Private GP prescriptionii) Private pharmacy dispensing
Data were collected only for a sample of GP or pharmacy and for each respondent, data collected only for a sample of days in a year (working days only).
The total is estimated by
whereTij is the value of the quantity of drug prescribed by the ith GP or pharmacyon the jth day.The sampling weight of the ith GP or pharmacy,
ii d
DnNw ×=
where N is total number of GP or pharmacy in the population, n is number of responding GP or pharmacy (sample), di is the total number of working days in a year, and is the number of survey days of ith GP or pharmacy in a year
∑∑= =
jI
i jijTw
1
4
1
j
jj b
Bw =
∑∑= =
=I
i jijiTwT
1
7
1
ˆ
Where there is sampling or where response rate of the survey was less than 100%, the procedures described above incorporate the sampling weight of the sampling unit in the estimation of total.
The sampling weight for each sampling unit or unit of analysis has the following components:
1. Probability of selectionThe basic weight is obtained by multiplying the reciprocals of the probability of selection at each step of sampling design. Example, for GP prescription survey, this is GP practice and prescription day.
2. Adjustment for non-responseThe response rate was less than 100% for some surveys; an adjustment to the sampling weight is required. The non-response adjustment weight is a ratio with the number of units in the population as the numerator and the number of responding sampling units as the denominator. The adjustment reduces the bias in an estimate to the extent that non-responding units have same characteristics as responding units. Where this is unlikely, some adjustments took into account differences in some relevant characteristics between responding and non-responding units that may influence drug utilization, such as bed strength, staff strength, scope of services for hospitals etc.
∑=
=I
iiTT
1
ˆ
20
MALAYSIAN STATISTICS ON MEDICINES 2009 & 2010
EXPENDITURE ESTIMATION METHODOLOGYStudy PopulationThe MSOM encompasses private & public healthcare providers in Malaysia consisting of
a. The public health sector which consists of hospitals and primary care clinics of the Ministry of Health, UniversityHospitals under the Ministry of Higher Education and MilitaryHospitals under the Ministry of Defence.
b. The Private health sector consisting of private hospitals and general practitioners in Malaysia
c. Private sector retail pharmacies
MethodologyThe expenditure on a particular drug in a given year is the quantity of drug used in that year multiplied by the price of the drug;
Total expenditure = Quantity of drug utilisation x Price of drug
Quantity of drug utilisation (DDDs/1000 inhabitants/day) is determined from the drug utilisation data presented elsewhere in this report.
‘Price of drug’ is the median price for each drug chemical substance (5th level ATC classification) denominated in Daily Defined Doses (DDD). The median price is determined from data collected in NMUS, taking into account price variations for dosage forms (route of administration), and differences between prices in public and private sectors. Thus there are two sets of median prices for each drug chemical substance i.e. public and private median prices.
Prices for the public sector were determined from procurement data for MOH, University and Armed Forces healthcare establishments whilst private sector prices were determined from procurement data of private hospitals. As GP prescriptions & retail pharmacy dispensing data obtained by NMUS did not contain any data usable for calculating prices, the prices estimated from private hospitals were applied to GP and Pharmacy data.
The expenditure for each procurement item is calculated as Ei = p50i * DDDi where p50 is the median price, DDD is the quantity of utilisation and “i” refers to the drug chemical substance. The total expenditure on a drug chemical substance in a particular sector is the sum of all procurement, prescription and dispensing of the item items in that sector. The total expenditure for the country is the sum of total expenditure in all the sectors.
References:WHO Collaborating Centre for Drug Statistics Methodology, Guidelines for ATC classification and DDD assignment 2011. Oslo, 2011.
21
MALAYSIAN STATISTICS ON MEDICINES 2009 & 2010
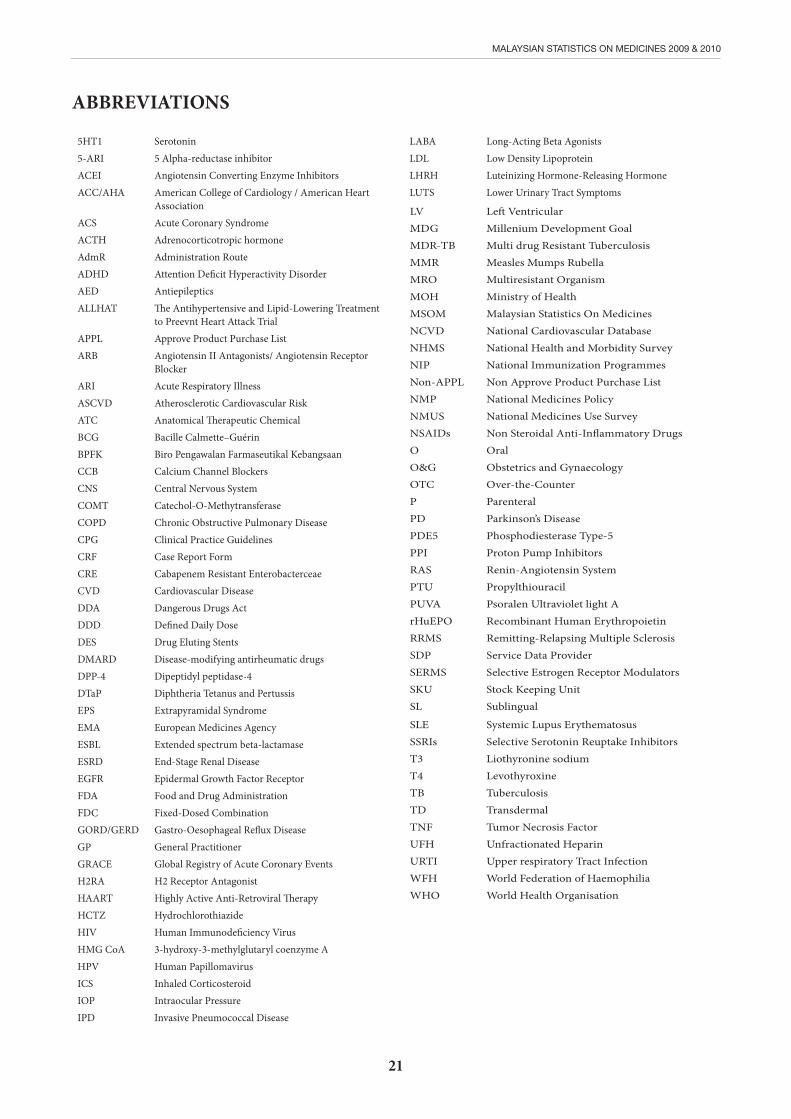
ABBREVIATIONS
5HT1 Serotonin5-ARI 5 Alpha-reductase inhibitorACEI Angiotensin Converting Enzyme InhibitorsACC/AHA American College of Cardiology / American Heart
AssociationACS Acute Coronary SyndromeACTH Adrenocorticotropic hormoneAdmR Administration RouteADHD Attention Deficit Hyperactivity DisorderAED AntiepilepticsALLHAT The Antihypertensive and Lipid-Lowering Treatment
to Preevnt Heart Attack TrialAPPL Approve Product Purchase ListARB Angiotensin II Antagonists/ Angiotensin Receptor
BlockerARI Acute Respiratory IllnessASCVD Atherosclerotic Cardiovascular RiskATC Anatomical Therapeutic ChemicalBCG Bacille Calmette–GuérinBPFK Biro Pengawalan Farmaseutikal KebangsaanCCB Calcium Channel BlockersCNS Central Nervous SystemCOMT Catechol-O-MethytransferaseCOPD Chronic Obstructive Pulmonary DiseaseCPG Clinical Practice GuidelinesCRF Case Report FormCRE Cabapenem Resistant EnterobacterceaeCVD Cardiovascular DiseaseDDA Dangerous Drugs ActDDD Defined Daily DoseDES Drug Eluting StentsDMARD Disease-modifying antirheumatic drugsDPP-4 Dipeptidyl peptidase-4DTaP Diphtheria Tetanus and PertussisEPS Extrapyramidal SyndromeEMA European Medicines AgencyESBL Extended spectrum beta-lactamaseESRD End-Stage Renal Disease EGFR Epidermal Growth Factor ReceptorFDA Food and Drug AdministrationFDC Fixed-Dosed CombinationGORD/GERD Gastro-Oesophageal Reflux DiseaseGP General PractitionerGRACE Global Registry of Acute Coronary EventsH2RA H2 Receptor AntagonistHAART Highly Active Anti-Retroviral TherapyHCTZ Hydrochlorothiazide HIV Human Immunodeficiency VirusHMG CoA 3-hydroxy-3-methylglutaryl coenzyme AHPV Human PapillomavirusICS Inhaled CorticosteroidIOP Intraocular PressureIPD Invasive Pneumococcal Disease
LABA Long-Acting Beta AgonistsLDL Low Density LipoproteinLHRH Luteinizing Hormone-Releasing HormoneLUTS Lower Urinary Tract Symptoms
LV Left Ventricular MDG Millenium Development GoalMDR-TB Multi drug Resistant TuberculosisMMR Measles Mumps RubellaMRO Multiresistant OrganismMOH Ministry of HealthMSOM Malaysian Statistics On MedicinesNCVD National Cardiovascular DatabaseNHMS National Health and Morbidity SurveyNIP National Immunization ProgrammesNon-APPL Non Approve Product Purchase ListNMP National Medicines Policy NMUS National Medicines Use SurveyNSAIDs Non Steroidal Anti-Inflammatory DrugsO OralO&G Obstetrics and GynaecologyOTC Over-the-CounterP ParenteralPD Parkinson’s DiseasePDE5 Phosphodiesterase Type-5PPI Proton Pump InhibitorsRAS Renin-Angiotensin SystemPTU PropylthiouracilPUVA Psoralen Ultraviolet light ArHuEPO Recombinant Human Erythropoietin RRMS Remitting-Relapsing Multiple SclerosisSDP Service Data ProviderSERMS Selective Estrogen Receptor ModulatorsSKU Stock Keeping UnitSL Sublingual
SLE Systemic Lupus ErythematosusSSRIs Selective Serotonin Reuptake Inhibitors T3 Liothyronine sodiumT4 LevothyroxineTB TuberculosisTD TransdermalTNF Tumor Necrosis FactorUFH Unfractionated HeparinURTI Upper respiratory Tract InfectionWFH World Federation of HaemophiliaWHO World Health Organisation
22
MALAYSIAN STATISTICS ON MEDICINES 2009 & 2010
CHAPTER 1 : USE OF MEDICINES IN MALAYSIA
Faridah Aryani M.Y.1, Fatimah A.R.1, Sivasampu S.2, Rosliza L.1
1.Pharmaceutical Services Division, Ministry of Health, 2.National Clinical Research Centre, Ministry of Health
In this chapter, we report the national estimates for use of medicines in Malaysia from the National Medicines Use Survey 2009 and 2010. This is in line with MOH policy in keeping timely evidence based informations. Statistics for the most commonly used medicines by therapeutic group and by drugs are shown in the tables below. Detailed statistics for all drugs are given in other chapters for specific therapeutic groups. Statistics are tabulated to facilitate comparison with 2009 and 2010 utilisation.
As in previous years, the National Medicines Use Survey (NMUS) 2009 and 2010 included only drugs which were prescription medicines. Meanwhile, non-prescription medicines such as over-the-counter (OTC) medicines, traditional and complimentary medicines were excluded from the analysis.
The unit of measure adopted for utilisation estimates in this report is the Defined Daily Doses (DDDs) according to the World Health Organisation (WHO) Anatomical Therapeutic Chemical (ATC) classification and DDD assignment system1. The statistics are expressed as number of DDDs per 1000 population per day. The Malaysian Statistics on Medicines (MSOM) 2009 and 2010, covers mainly medicines which have WHO-assigned DDDs. However, statistics for several classes of drugs which do not have WHO-assigned DDDs, i.e. Antineoplastics, Dermatologicals, Opthalmologicals, Otologicals, Cough and Cold preparations and Vaccines, are also reported in the respective chapters using DDDs assigned locally, based on WHO Guidelines. In this chapter, only drugs with WHO assigned DDDs are presented in ranking tables for therapeutic groups and individual drugs, to enable comparison with other countries.
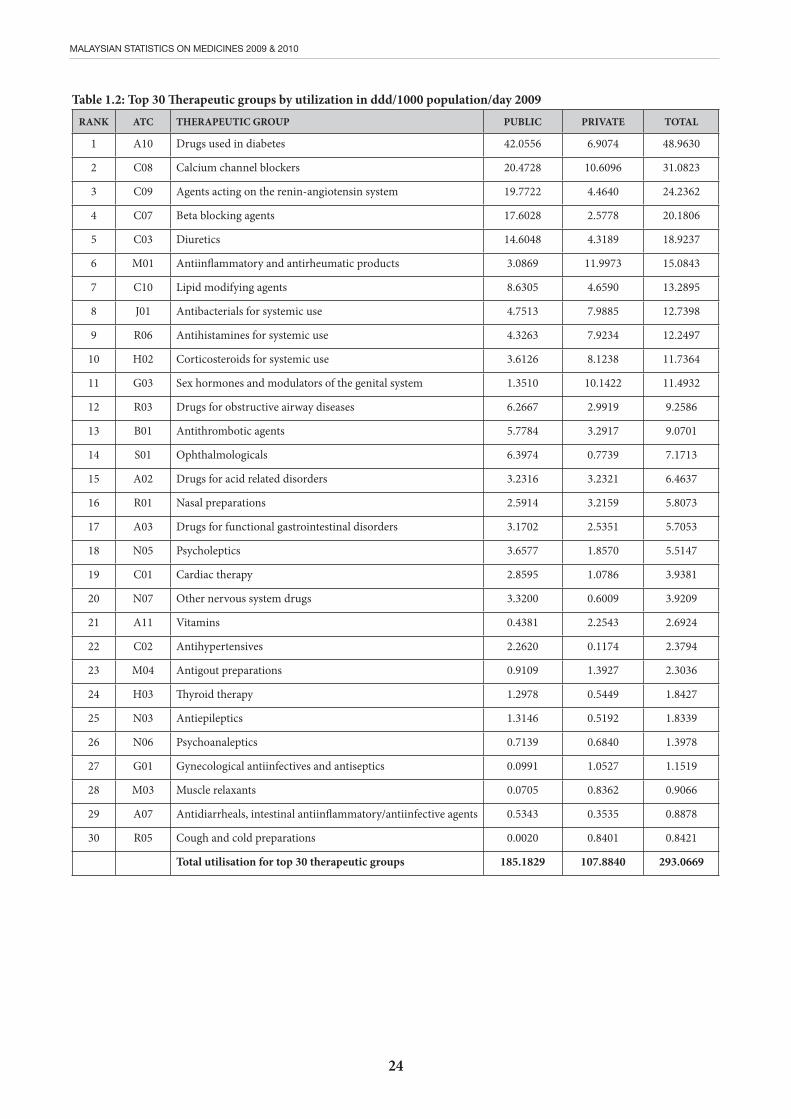
There have not been many changes over the two year period for the top 10 therapeutic groups of drugs utilised, except for sex hormones and modulators of the genital system drugs have moved into the top 10 list in 2010 and the increase is apparent in the public side. It is interesting to note that corticosteroids has increased greatly in private sector in 2009 and normalised in 2010. However, this phenomenon is unexplainable.
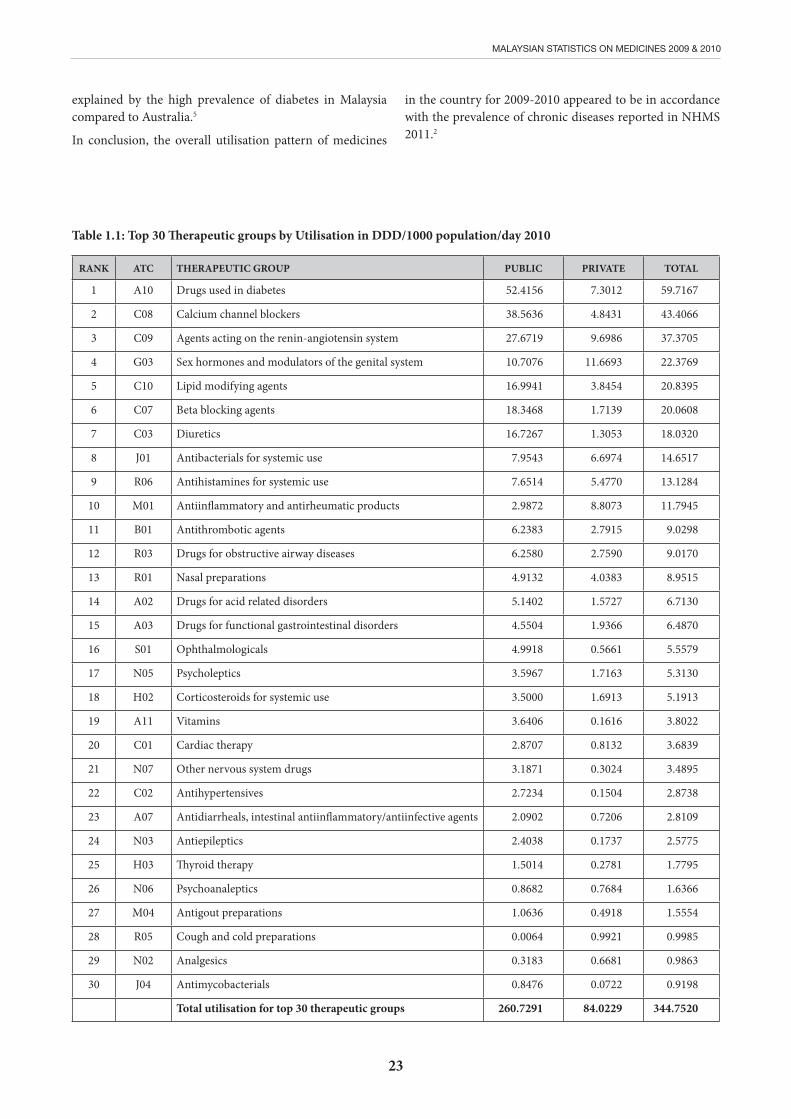
Among the therapeutic groups, drugs used in diabetes (A10) were still the highest in terms of utilisation for both years (Table 1.1, Table 1.2). An estimate of 4.89% (2009) and 5.97% (2010) of the Malaysian population was on drugs from this therapeutic group. This increment of utilisation was apparent in the public sector (24.6%) and highlights the magnitude of the burden of non-communicable disease in
the public sector.
For both years, almost all the drugs used for the cardiovascular systems, has increased in the public sector. This increase was highest for calcium channel blockers (C08) followed by lipid modifying agents (C10) and agents acting on the renin angiotensin system (C09) as shown in Table 1.1 and 1.2. However, there is only a slight decrease for beta-blocking agents.
There was a notable reduction (21.8%) for anti-inflammatory and antirheumatic medicines over the 2 years period. It was clearly shown that the private sector is the major contributor with the percentage of reduction of 26.6%. The other therapeutic groups mostly used are antibacterials and antihistamines for systemic use where the drugs were amoxicillin, chlorphenamine, cetirizine and loratadine.
There was an increase (40.8%) in the drug utilisation for the top 30 therapeutic groups over the two years in the public sector. In contrast, the private sector showed 22.1% reduction.
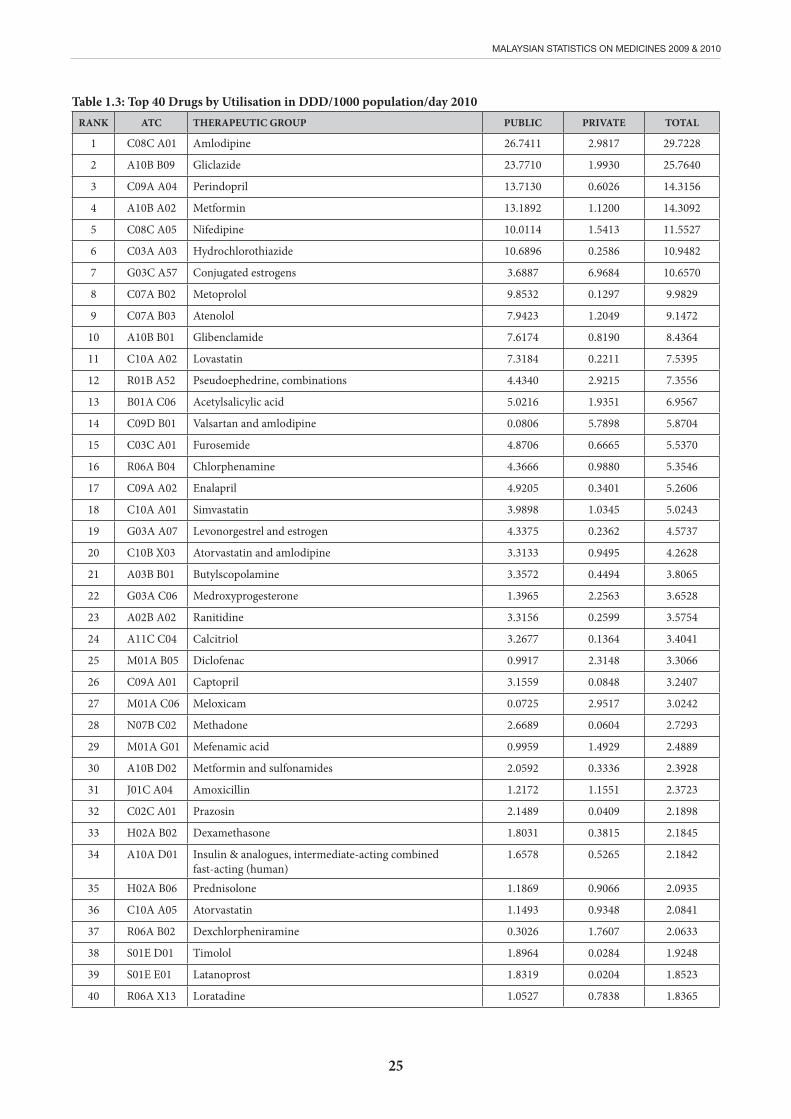
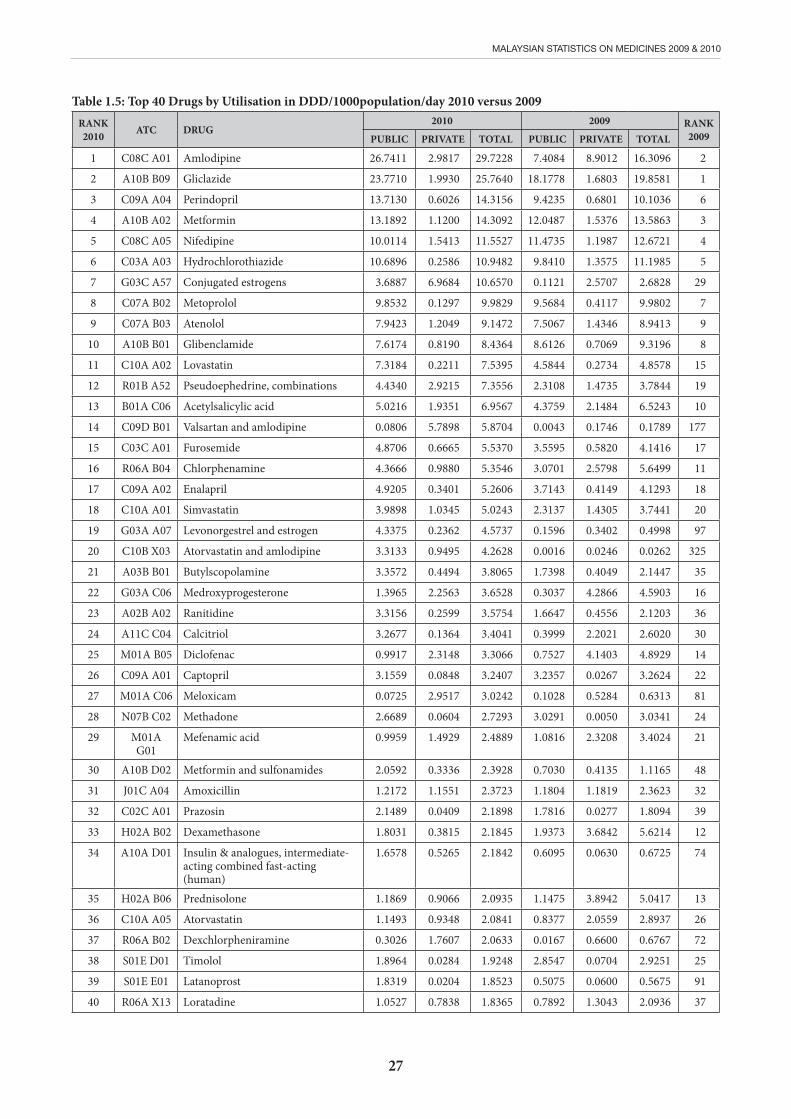
Overall, there was not much difference in ranking for the top 10 individual drug by utilisation when compared to 2010 and 2009. Details are available in Table 1.3 and Table 1.4.
Amlodipine was the most utilised drug in 2010 (Table 1.3). The high utilisation (three fold) of amlodipine was due to change in prescribing category in the MOH formulary listing from A to B and the introduction of generic amlodipine in the public sector. Gliclazide ranked the second highest drug utilised in 2010 but topped the list in 2009 (Table 1.4). Due to its characteristic with less hypoglycaemic effect, Gliclazide was a more preferred choice compared to Glibenclamide.
Most drug in top 20 drugs utilised in 2010 and 2009 were drugs for diabetes and cardiovascular disorders (Table 1.5). This is consistent with the increasing prevalence of chronic disease in Malaysia. The NHMS 20112, reported that the overall prevalence of diabetes was 15.2% compared to 2006 (11.6%), hypertension 32.7% compared to 2006 (32.2%) and dyslipidaemia, 35.1% compared to 20.7% in year 2006, for patients ≥ 18 years.
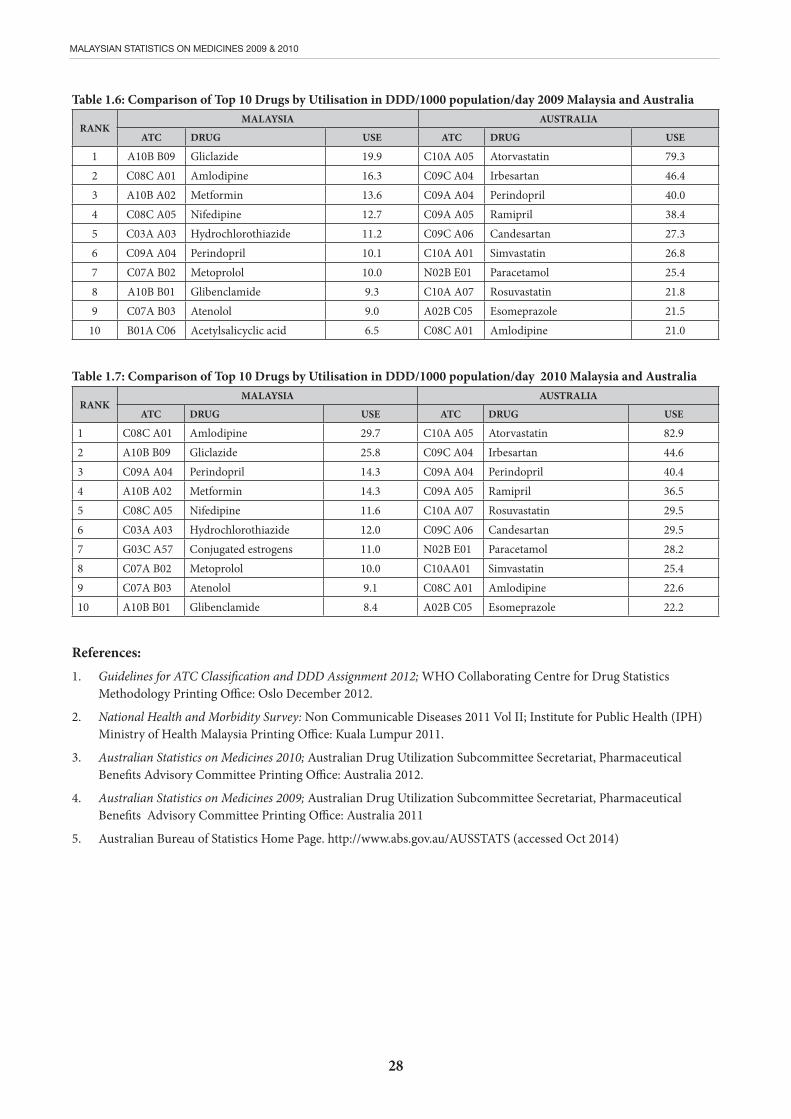
Cardiovascular drugs dominated the top 10 drugs by utilisation for Australia for both years.3,4 Meanwhile antidiabetic drugs and cardiovascular drugs both appeared among the top 10 drugs listing in Malaysia. Ranking for individual drugs for Malaysia differed somewhat from that of Australia as shown in Table 1.6 and 1.7. This could be
23
MALAYSIAN STATISTICS ON MEDICINES 2009 & 2010
explained by the high prevalence of diabetes in Malaysia compared to Australia.5
In conclusion, the overall utilisation pattern of medicines
RANK ATC THERAPEUTIC GROUP PUBLIC PRIVATE TOTAL
1 A10 Drugs used in diabetes 52.4156 7.3012 59.7167
2 C08 Calcium channel blockers 38.5636 4.8431 43.4066
3 C09 Agents acting on the renin-angiotensin system 27.6719 9.6986 37.3705
4 G03 Sex hormones and modulators of the genital system 10.7076 11.6693 22.3769
5 C10 Lipid modifying agents 16.9941 3.8454 20.8395
6 C07 Beta blocking agents 18.3468 1.7139 20.0608
7 C03 Diuretics 16.7267 1.3053 18.0320
8 J01 Antibacterials for systemic use 7.9543 6.6974 14.6517
9 R06 Antihistamines for systemic use 7.6514 5.4770 13.1284
10 M01 Antiinflammatory and antirheumatic products 2.9872 8.8073 11.7945
11 B01 Antithrombotic agents 6.2383 2.7915 9.0298
12 R03 Drugs for obstructive airway diseases 6.2580 2.7590 9.0170
13 R01 Nasal preparations 4.9132 4.0383 8.9515
14 A02 Drugs for acid related disorders 5.1402 1.5727 6.7130
15 A03 Drugs for functional gastrointestinal disorders 4.5504 1.9366 6.4870
16 S01 Ophthalmologicals 4.9918 0.5661 5.5579
17 N05 Psycholeptics 3.5967 1.7163 5.3130
18 H02 Corticosteroids for systemic use 3.5000 1.6913 5.1913
19 A11 Vitamins 3.6406 0.1616 3.8022
20 C01 Cardiac therapy 2.8707 0.8132 3.6839
21 N07 Other nervous system drugs 3.1871 0.3024 3.4895
22 C02 Antihypertensives 2.7234 0.1504 2.8738
23 A07 Antidiarrheals, intestinal antiinflammatory/antiinfective agents 2.0902 0.7206 2.8109
24 N03 Antiepileptics 2.4038 0.1737 2.5775
25 H03 Thyroid therapy 1.5014 0.2781 1.7795
26 N06 Psychoanaleptics 0.8682 0.7684 1.6366
27 M04 Antigout preparations 1.0636 0.4918 1.5554
28 R05 Cough and cold preparations 0.0064 0.9921 0.9985
29 N02 Analgesics 0.3183 0.6681 0.9863
30 J04 Antimycobacterials 0.8476 0.0722 0.9198
Total utilisation for top 30 therapeutic groups 260.7291 84.0229 344.7520
Table 1.1: Top 30 Therapeutic groups by Utilisation in DDD/1000 population/day 2010
in the country for 2009-2010 appeared to be in accordance with the prevalence of chronic diseases reported in NHMS 2011.2
24
MALAYSIAN STATISTICS ON MEDICINES 2009 & 2010
Table 1.2: Top 30 Therapeutic groups by utilization in ddd/1000 population/day 2009RANK ATC THERAPEUTIC GROUP PUBLIC PRIVATE TOTAL
1 A10 Drugs used in diabetes 42.0556 6.9074 48.9630
2 C08 Calcium channel blockers 20.4728 10.6096 31.0823
3 C09 Agents acting on the renin-angiotensin system 19.7722 4.4640 24.2362
4 C07 Beta blocking agents 17.6028 2.5778 20.1806
5 C03 Diuretics 14.6048 4.3189 18.9237
6 M01 Antiinflammatory and antirheumatic products 3.0869 11.9973 15.0843
7 C10 Lipid modifying agents 8.6305 4.6590 13.2895
8 J01 Antibacterials for systemic use 4.7513 7.9885 12.7398
9 R06 Antihistamines for systemic use 4.3263 7.9234 12.2497
10 H02 Corticosteroids for systemic use 3.6126 8.1238 11.7364
11 G03 Sex hormones and modulators of the genital system 1.3510 10.1422 11.4932
12 R03 Drugs for obstructive airway diseases 6.2667 2.9919 9.2586
13 B01 Antithrombotic agents 5.7784 3.2917 9.0701
14 S01 Ophthalmologicals 6.3974 0.7739 7.1713
15 A02 Drugs for acid related disorders 3.2316 3.2321 6.4637
16 R01 Nasal preparations 2.5914 3.2159 5.8073
17 A03 Drugs for functional gastrointestinal disorders 3.1702 2.5351 5.7053
18 N05 Psycholeptics 3.6577 1.8570 5.5147
19 C01 Cardiac therapy 2.8595 1.0786 3.9381
20 N07 Other nervous system drugs 3.3200 0.6009 3.9209
21 A11 Vitamins 0.4381 2.2543 2.6924
22 C02 Antihypertensives 2.2620 0.1174 2.3794
23 M04 Antigout preparations 0.9109 1.3927 2.3036
24 H03 Thyroid therapy 1.2978 0.5449 1.8427
25 N03 Antiepileptics 1.3146 0.5192 1.8339
26 N06 Psychoanaleptics 0.7139 0.6840 1.3978
27 G01 Gynecological antiinfectives and antiseptics 0.0991 1.0527 1.1519
28 M03 Muscle relaxants 0.0705 0.8362 0.9066
29 A07 Antidiarrheals, intestinal antiinflammatory/antiinfective agents 0.5343 0.3535 0.8878
30 R05 Cough and cold preparations 0.0020 0.8401 0.8421
Total utilisation for top 30 therapeutic groups 185.1829 107.8840 293.0669
25
MALAYSIAN STATISTICS ON MEDICINES 2009 & 2010
Table 1.3: Top 40 Drugs by Utilisation in DDD/1000 population/day 2010RANK ATC THERAPEUTIC GROUP PUBLIC PRIVATE TOTAL
1 C08C A01 Amlodipine 26.7411 2.9817 29.7228
2 A10B B09 Gliclazide 23.7710 1.9930 25.7640
3 C09A A04 Perindopril 13.7130 0.6026 14.3156
4 A10B A02 Metformin 13.1892 1.1200 14.3092
5 C08C A05 Nifedipine 10.0114 1.5413 11.5527
6 C03A A03 Hydrochlorothiazide 10.6896 0.2586 10.9482
7 G03C A57 Conjugated estrogens 3.6887 6.9684 10.6570
8 C07A B02 Metoprolol 9.8532 0.1297 9.9829
9 C07A B03 Atenolol 7.9423 1.2049 9.1472
10 A10B B01 Glibenclamide 7.6174 0.8190 8.4364
11 C10A A02 Lovastatin 7.3184 0.2211 7.5395
12 R01B A52 Pseudoephedrine, combinations 4.4340 2.9215 7.3556
13 B01A C06 Acetylsalicylic acid 5.0216 1.9351 6.9567
14 C09D B01 Valsartan and amlodipine 0.0806 5.7898 5.8704
15 C03C A01 Furosemide 4.8706 0.6665 5.5370
16 R06A B04 Chlorphenamine 4.3666 0.9880 5.3546
17 C09A A02 Enalapril 4.9205 0.3401 5.2606
18 C10A A01 Simvastatin 3.9898 1.0345 5.0243
19 G03A A07 Levonorgestrel and estrogen 4.3375 0.2362 4.5737
20 C10B X03 Atorvastatin and amlodipine 3.3133 0.9495 4.2628
21 A03B B01 Butylscopolamine 3.3572 0.4494 3.8065
22 G03A C06 Medroxyprogesterone 1.3965 2.2563 3.6528
23 A02B A02 Ranitidine 3.3156 0.2599 3.5754
24 A11C C04 Calcitriol 3.2677 0.1364 3.4041
25 M01A B05 Diclofenac 0.9917 2.3148 3.3066
26 C09A A01 Captopril 3.1559 0.0848 3.2407
27 M01A C06 Meloxicam 0.0725 2.9517 3.0242
28 N07B C02 Methadone 2.6689 0.0604 2.7293
29 M01A G01 Mefenamic acid 0.9959 1.4929 2.4889
30 A10B D02 Metformin and sulfonamides 2.0592 0.3336 2.3928
31 J01C A04 Amoxicillin 1.2172 1.1551 2.3723
32 C02C A01 Prazosin 2.1489 0.0409 2.1898
33 H02A B02 Dexamethasone 1.8031 0.3815 2.1845
34 A10A D01 Insulin & analogues, intermediate-acting combinedfast-acting (human)
1.6578 0.5265 2.1842
35 H02A B06 Prednisolone 1.1869 0.9066 2.0935
36 C10A A05 Atorvastatin 1.1493 0.9348 2.0841
37 R06A B02 Dexchlorpheniramine 0.3026 1.7607 2.0633
38 S01E D01 Timolol 1.8964 0.0284 1.9248
39 S01E E01 Latanoprost 1.8319 0.0204 1.8523
40 R06A X13 Loratadine 1.0527 0.7838 1.8365

26
MALAYSIAN STATISTICS ON MEDICINES 2009 & 2010
Table 1.4: Top 40 Drugs by Utilisation in DDD/1000population/day 2009RANK ATC THERAPEUTIC GROUP PUBLIC PRIVATE TOTAL
1 A10B B09 Gliclazide 18.1778 1.6803 19.8581
2 C08C A01 Amlodipine 7.4084 8.9012 16.3096
3 A10B A02 Metformin 12.0487 1.5376 13.5863
4 C08C A05 Nifedipine 11.4735 1.1987 12.6721
5 C03A A03 Hydrochlorothiazide 9.8410 1.3575 11.1985
6 C09A A04 Perindopril 9.4235 0.6801 10.1036
7 C07A B02 Metoprolol 9.5684 0.4117 9.9802
8 A10B B01 Glibenclamide 8.6126 0.7069 9.3196
9 C07A B03 Atenolol 7.5067 1.4346 8.9413
10 B01A C06 Acetylsalicylic acid 4.3759 2.1484 6.5243
11 R06A B04 Chlorphenamine 3.0701 2.5798 5.6499
12 H02A B02 Dexamethasone 1.9373 3.6842 5.6214
13 H02A B06 Prednisolone 1.1475 3.8942 5.0417
14 M01A B05 Diclofenac 0.7527 4.1403 4.8929
15 C10A A02 Lovastatin 4.5844 0.2734 4.8578
16 G03A C06 Medroxyprogesterone 0.3037 4.2866 4.5903
17 C03C A01 Furosemide 3.5595 0.5820 4.1416
18 C09A A02 Enalapril 3.7143 0.4149 4.1293
19 R01B A52 Pseudoephedrine, combinations 2.3108 1.4735 3.7844
20 C10A A01 Simvastatin 2.3137 1.4305 3.7441
21 M01A G01 Mefenamic acid 1.0816 2.3208 3.4024
22 C09A A01 Captopril 3.2357 0.0267 3.2624
23 M01A H01 Celecoxib 0.5008 2.7031 3.2039
24 N07B C02 Methadone 3.0291 0.0050 3.0341
25 S01E D01 Timolol 2.8547 0.0704 2.9251
26 C10A A05 Atorvastatin 0.8377 2.0559 2.8937
27 A03F A01 Metoclopramide 1.3942 1.4387 2.8329
28 R03A C02 Salbutamol 2.3432 0.4322 2.7755
29 G03C A57 Conjugated estrogens 0.1121 2.5707 2.6828
30 A11C C04 Calcitriol 0.3999 2.2021 2.6020
31 A02B C01 Omeprazole 1.0069 1.3640 2.3709
32 J01C A04 Amoxicillin 1.1804 1.1819 2.3623
33 S01E B01 Pilocarpine 2.1927 0.1438 2.3366
34 R06A E07 Cetirizine 0.1615 2.0564 2.2179
35 A03B B01 Butylscopolamine 1.7398 0.4049 2.1447
36 A02B A02 Ranitidine 1.6647 0.4556 2.1203
37 R06A X13 Loratadine 0.7892 1.3043 2.0936
38 C03B A11 Indapamide 0.0194 1.8839 1.9032
39 C02C A01 Prazosin 1.7816 0.0277 1.8094
40 C08C A02 Felodipine 1.3870 0.3641 1.7511
27
MALAYSIAN STATISTICS ON MEDICINES 2009 & 2010
Table 1.5: Top 40 Drugs by Utilisation in DDD/1000population/day 2010 versus 2009RANK2010 ATC DRUG
2010 2009 RANK2009PUBLIC PRIVATE TOTAL PUBLIC PRIVATE TOTAL
1 C08C A01 Amlodipine 26.7411 2.9817 29.7228 7.4084 8.9012 16.3096 2
2 A10B B09 Gliclazide 23.7710 1.9930 25.7640 18.1778 1.6803 19.8581 1
3 C09A A04 Perindopril 13.7130 0.6026 14.3156 9.4235 0.6801 10.1036 6
4 A10B A02 Metformin 13.1892 1.1200 14.3092 12.0487 1.5376 13.5863 3
5 C08C A05 Nifedipine 10.0114 1.5413 11.5527 11.4735 1.1987 12.6721 4
6 C03A A03 Hydrochlorothiazide 10.6896 0.2586 10.9482 9.8410 1.3575 11.1985 5
7 G03C A57 Conjugated estrogens 3.6887 6.9684 10.6570 0.1121 2.5707 2.6828 29
8 C07A B02 Metoprolol 9.8532 0.1297 9.9829 9.5684 0.4117 9.9802 7
9 C07A B03 Atenolol 7.9423 1.2049 9.1472 7.5067 1.4346 8.9413 9
10 A10B B01 Glibenclamide 7.6174 0.8190 8.4364 8.6126 0.7069 9.3196 8
11 C10A A02 Lovastatin 7.3184 0.2211 7.5395 4.5844 0.2734 4.8578 15
12 R01B A52 Pseudoephedrine, combinations 4.4340 2.9215 7.3556 2.3108 1.4735 3.7844 19
13 B01A C06 Acetylsalicylic acid 5.0216 1.9351 6.9567 4.3759 2.1484 6.5243 10
14 C09D B01 Valsartan and amlodipine 0.0806 5.7898 5.8704 0.0043 0.1746 0.1789 177
15 C03C A01 Furosemide 4.8706 0.6665 5.5370 3.5595 0.5820 4.1416 17
16 R06A B04 Chlorphenamine 4.3666 0.9880 5.3546 3.0701 2.5798 5.6499 11
17 C09A A02 Enalapril 4.9205 0.3401 5.2606 3.7143 0.4149 4.1293 18
18 C10A A01 Simvastatin 3.9898 1.0345 5.0243 2.3137 1.4305 3.7441 20
19 G03A A07 Levonorgestrel and estrogen 4.3375 0.2362 4.5737 0.1596 0.3402 0.4998 97
20 C10B X03 Atorvastatin and amlodipine 3.3133 0.9495 4.2628 0.0016 0.0246 0.0262 325
21 A03B B01 Butylscopolamine 3.3572 0.4494 3.8065 1.7398 0.4049 2.1447 35
22 G03A C06 Medroxyprogesterone 1.3965 2.2563 3.6528 0.3037 4.2866 4.5903 16
23 A02B A02 Ranitidine 3.3156 0.2599 3.5754 1.6647 0.4556 2.1203 36
24 A11C C04 Calcitriol 3.2677 0.1364 3.4041 0.3999 2.2021 2.6020 30
25 M01A B05 Diclofenac 0.9917 2.3148 3.3066 0.7527 4.1403 4.8929 14
26 C09A A01 Captopril 3.1559 0.0848 3.2407 3.2357 0.0267 3.2624 22
27 M01A C06 Meloxicam 0.0725 2.9517 3.0242 0.1028 0.5284 0.6313 81
28 N07B C02 Methadone 2.6689 0.0604 2.7293 3.0291 0.0050 3.0341 24
29 M01A G01
Mefenamic acid 0.9959 1.4929 2.4889 1.0816 2.3208 3.4024 21
30 A10B D02 Metformin and sulfonamides 2.0592 0.3336 2.3928 0.7030 0.4135 1.1165 48
31 J01C A04 Amoxicillin 1.2172 1.1551 2.3723 1.1804 1.1819 2.3623 32
32 C02C A01 Prazosin 2.1489 0.0409 2.1898 1.7816 0.0277 1.8094 39
33 H02A B02 Dexamethasone 1.8031 0.3815 2.1845 1.9373 3.6842 5.6214 12
34 A10A D01 Insulin & analogues, intermediate-acting combined fast-acting (human)
1.6578 0.5265 2.1842 0.6095 0.0630 0.6725 74
35 H02A B06 Prednisolone 1.1869 0.9066 2.0935 1.1475 3.8942 5.0417 13
36 C10A A05 Atorvastatin 1.1493 0.9348 2.0841 0.8377 2.0559 2.8937 26
37 R06A B02 Dexchlorpheniramine 0.3026 1.7607 2.0633 0.0167 0.6600 0.6767 72
38 S01E D01 Timolol 1.8964 0.0284 1.9248 2.8547 0.0704 2.9251 25
39 S01E E01 Latanoprost 1.8319 0.0204 1.8523 0.5075 0.0600 0.5675 91
40 R06A X13 Loratadine 1.0527 0.7838 1.8365 0.7892 1.3043 2.0936 37
28
MALAYSIAN STATISTICS ON MEDICINES 2009 & 2010
Table 1.6: Comparison of Top 10 Drugs by Utilisation in DDD/1000 population/day 2009 Malaysia and Australia
RANKMALAYSIA AUSTRALIA
ATC DRUG USE ATC DRUG USE
1 A10B B09 Gliclazide 19.9 C10A A05 Atorvastatin 79.32 C08C A01 Amlodipine 16.3 C09C A04 Irbesartan 46.43 A10B A02 Metformin 13.6 C09A A04 Perindopril 40.04 C08C A05 Nifedipine 12.7 C09A A05 Ramipril 38.45 C03A A03 Hydrochlorothiazide 11.2 C09C A06 Candesartan 27.36 C09A A04 Perindopril 10.1 C10A A01 Simvastatin 26.87 C07A B02 Metoprolol 10.0 N02B E01 Paracetamol 25.48 A10B B01 Glibenclamide 9.3 C10A A07 Rosuvastatin 21.89 C07A B03 Atenolol 9.0 A02B C05 Esomeprazole 21.5
10 B01A C06 Acetylsalicyclic acid 6.5 C08C A01 Amlodipine 21.0
Table 1.7: Comparison of Top 10 Drugs by Utilisation in DDD/1000 population/day 2010 Malaysia and Australia
RANKMALAYSIA AUSTRALIA
ATC DRUG USE ATC DRUG USE
1 C08C A01 Amlodipine 29.7 C10A A05 Atorvastatin 82.92 A10B B09 Gliclazide 25.8 C09C A04 Irbesartan 44.63 C09A A04 Perindopril 14.3 C09A A04 Perindopril 40.44 A10B A02 Metformin 14.3 C09A A05 Ramipril 36.55 C08C A05 Nifedipine 11.6 C10A A07 Rosuvastatin 29.56 C03A A03 Hydrochlorothiazide 12.0 C09C A06 Candesartan 29.57 G03C A57 Conjugated estrogens 11.0 N02B E01 Paracetamol 28.28 C07A B02 Metoprolol 10.0 C10AA01 Simvastatin 25.49 C07A B03 Atenolol 9.1 C08C A01 Amlodipine 22.610 A10B B01 Glibenclamide 8.4 A02B C05 Esomeprazole 22.2
References:1. Guidelines for ATC Classification and DDD Assignment 2012; WHO Collaborating Centre for Drug Statistics
Methodology Printing Office: Oslo December 2012.
2. National Health and Morbidity Survey: Non Communicable Diseases 2011 Vol II; Institute for Public Health (IPH) Ministry of Health Malaysia Printing Office: Kuala Lumpur 2011.
3. Australian Statistics on Medicines 2010; Australian Drug Utilization Subcommittee Secretariat, Pharmaceutical Benefits Advisory Committee Printing Office: Australia 2012.
4. Australian Statistics on Medicines 2009; Australian Drug Utilization Subcommittee Secretariat, Pharmaceutical Benefits Advisory Committee Printing Office: Australia 2011
5. Australian Bureau of Statistics Home Page. http://www.abs.gov.au/AUSSTATS (accessed Oct 2014)

29
MALAYSIAN STATISTICS ON MEDICINES 2009 & 2010
CHAPTER 2 : EXPENDITURE ON MEDICINES IN MALAYSIA
Faridah Aryani M.Y.1, Rosliza L.1, Fatimah A.R.1, Sivasampu S.2, Nour Hanah O.1
1. Pharmaceutical Services Division, Ministry of Health; 2. Clinical Research Centre, Ministry of Health
This chapter discusses the drug expenditure for 2010 in comparison to that of 2009. The comparison was made by therapeutic groups as well as by individual drugs. This analysis includes all drugs in the National Medicines Use Survey (NMUS) database with usable price data, including those without WHO assigned DDDs, as expenditure (total cost) is not affected by the unit of measure for drug utilisation.
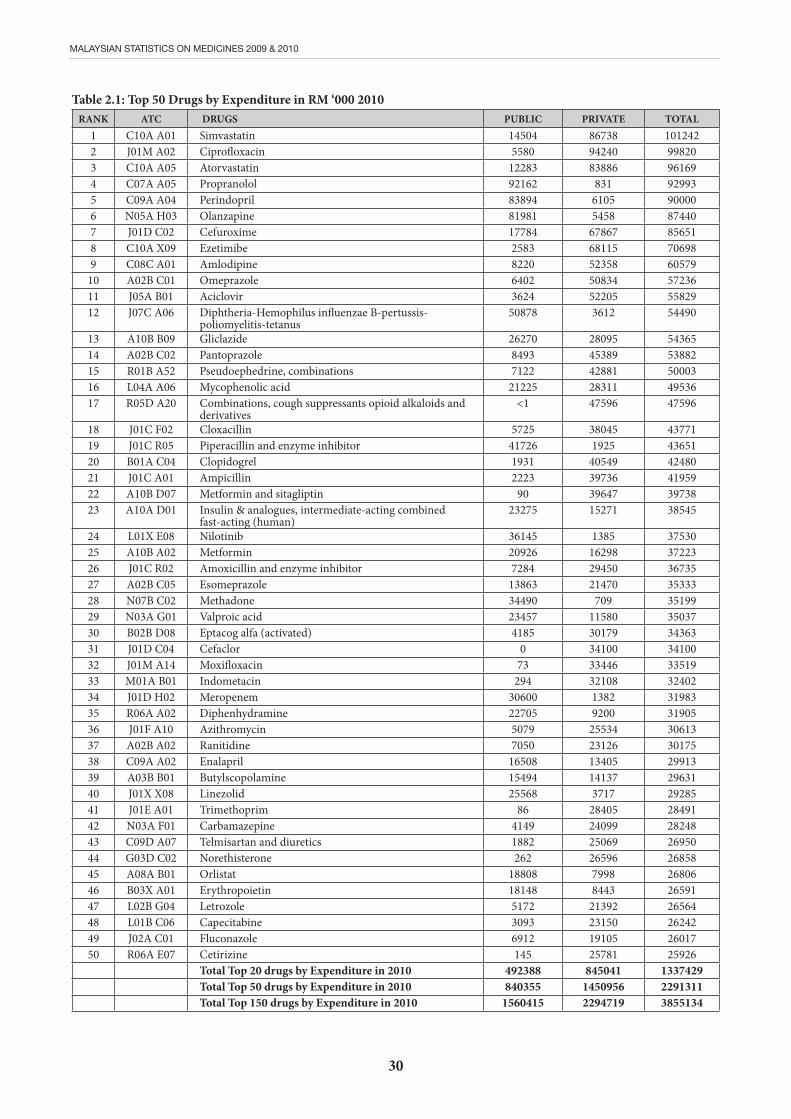
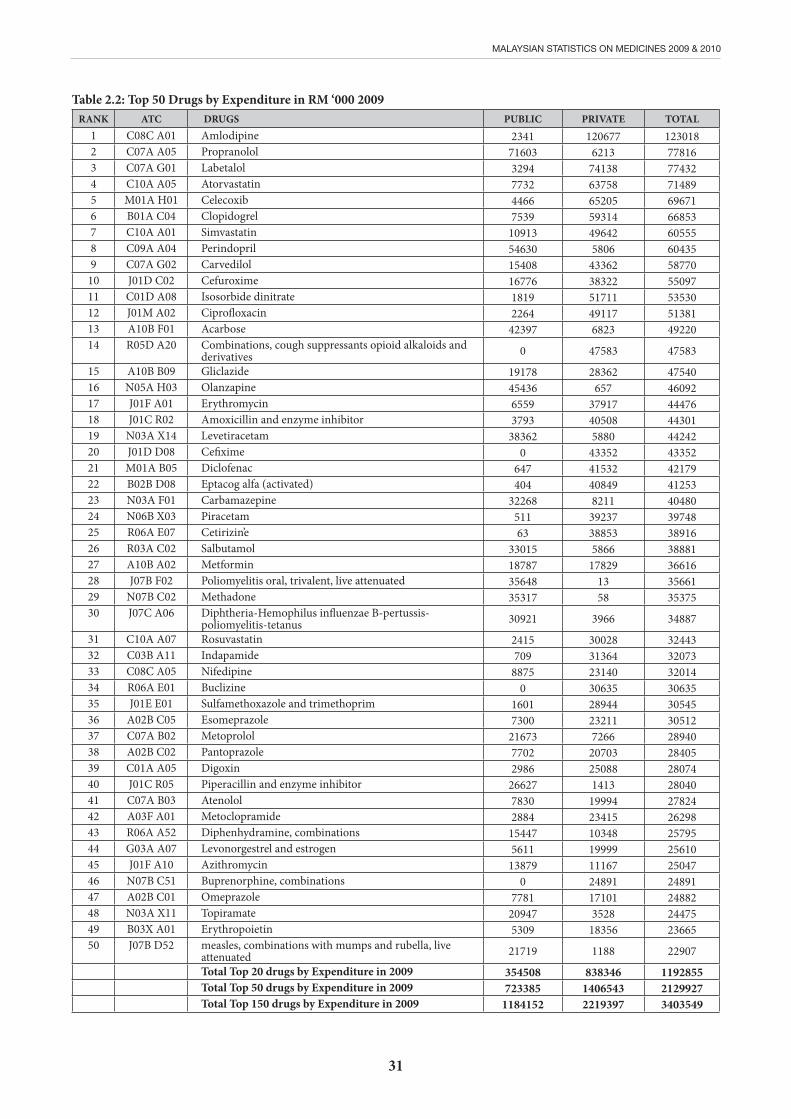
There was a 7.6% increase in drug expenditure for the top 50 drugs in 2010 when compared to 2009. This increase (16.2%) was mainly contributed by the public sector expenditure. In comparison there was a small increase in expenditure (3.1%) seen in the private sector. A similar trend was evident when comparing the top 150 drugs by expenditure; with notable increase in public sector expenditure.
Among the top 40 drugs, the highest expenditure was reported for amlodipine in 2009 (RM123.0 million) and simvastatin in 2010 (RM101.2 million). For these two drugs, more than 50% of the total expenditure was contributed by the private sector. The drugs which were common for both years in the top 10 list of expenditure were simvastatin, atorvastatin, propranolol, perindopril and amlodipine. Amlodipine becomes much more affordable when its generic form was introduced in 2009. This was evident in the public sector as the expenditure for amlodipine dropped 10-fold, from RM85.8 million in 2008 to RM8.2 million in 2010 (Table 2.1).
Antibacterial for systemic use was the highest ranked therapeutic group (J01) in expenditure for both years. The five common antibacterial agents used in both years were ciprofloxacin, cefuroxime, piperacillin and enzyme inhibitor, amoxacillin and enzyme inhibitor, and azithromycin (Table 2.1 and 2.2). Another important finding is that the total expenditure of lipid modifying agents (C10) has increased from RM210.1 million in 2009 to RM328.9 million in 2010; an increase of more than 50%. The expenditure for diabetic drug (A10) has increased by 23.8% for the private sector as compared to only 15.2% in public sector. Beta blocking agents, antihistamines for
systemic use and agents acting on the renin-angiotensin system remain in the top 10 therapeutic groups in both years as shown in Table 2.3 and 2.4.
Antidiabetics, lipid modifying agents and cardiovascular drugs were next in the expenditure ranking. There was an increase in the expenditure for antidiabetic drugs by 14.7% in 2010 when compared to 2009 and a great increase (56.0%) for lipid modifying agents as presented in Table 2.6. Conversely, there is a decline in spending on cardiovascular drugs and this is due to a significant drop in drug spending by the private sector.
The total expenditure for antineoplastics (L01) and psycholeptics (N05) in 2010 ranked 5th and 6th respectively, however both the therapeutic groups were not in the top 10 list in 2009 as shown in Table 2.4. The fact that the psycholeptics are being ranked 6th for the total expenditure in Malaysia for 2010 and was absent in the top 10 expenditure for private sector, reflected the burden of mental illness in the public sector. It is also noted that antineoplastics have made an appearance in both sectors in 2010 but was absent in 2009. This is not unexpected in view of the rising usage and emergence of new specialised drugs in the market. In Australia, antineoplastics ranked 4th in the top 10 expenditure list for therapeutic groups for 2009-2010 period2.
The Malaysian statistics was compared with the Australian drug expenditure list in Table 2.7. In both sectors in Malaysia, antibacterials for systemic use accounted for the highest costs for in 2009 and 2010. Interestingly, this therapeutic group was not among the top 10 drug expenditure for Australia since 2007. Both countries share the common disease burden of non-communicable diseases where the therapeutics groups related to their treatment were mostly listed in the top 10 expenditure.
In conclusion, the increase in expenditure on medicines every year is an indication of the increasing burden of diseases whereby the commitment of the healthcare industries in the country to treat the population and to combat the emerging diseases is essential.
30
MALAYSIAN STATISTICS ON MEDICINES 2009 & 2010
Table 2.1: Top 50 Drugs by Expenditure in RM ‘000 2010RANK ATC DRUGS PUBLIC PRIVATE TOTAL
1 C10A A01 Simvastatin 14504 86738 1012422 J01M A02 Ciprofloxacin 5580 94240 998203 C10A A05 Atorvastatin 12283 83886 961694 C07A A05 Propranolol 92162 831 929935 C09A A04 Perindopril 83894 6105 900006 N05A H03 Olanzapine 81981 5458 874407 J01D C02 Cefuroxime 17784 67867 856518 C10A X09 Ezetimibe 2583 68115 706989 C08C A01 Amlodipine 8220 52358 60579
10 A02B C01 Omeprazole 6402 50834 5723611 J05A B01 Aciclovir 3624 52205 5582912 J07C A06 Diphtheria-Hemophilus influenzae B-pertussis-
poliomyelitis-tetanus50878 3612 54490
13 A10B B09 Gliclazide 26270 28095 5436514 A02B C02 Pantoprazole 8493 45389 5388215 R01B A52 Pseudoephedrine, combinations 7122 42881 5000316 L04A A06 Mycophenolic acid 21225 28311 4953617 R05D A20 Combinations, cough suppressants opioid alkaloids and
derivatives<1 47596 47596
18 J01C F02 Cloxacillin 5725 38045 4377119 J01C R05 Piperacillin and enzyme inhibitor 41726 1925 4365120 B01A C04 Clopidogrel 1931 40549 4248021 J01C A01 Ampicillin 2223 39736 4195922 A10B D07 Metformin and sitagliptin 90 39647 3973823 A10A D01 Insulin & analogues, intermediate-acting combined
fast-acting (human)23275 15271 38545
24 L01X E08 Nilotinib 36145 1385 3753025 A10B A02 Metformin 20926 16298 3722326 J01C R02 Amoxicillin and enzyme inhibitor 7284 29450 3673527 A02B C05 Esomeprazole 13863 21470 3533328 N07B C02 Methadone 34490 709 3519929 N03A G01 Valproic acid 23457 11580 3503730 B02B D08 Eptacog alfa (activated) 4185 30179 3436331 J01D C04 Cefaclor 0 34100 3410032 J01M A14 Moxifloxacin 73 33446 3351933 M01A B01 Indometacin 294 32108 3240234 J01D H02 Meropenem 30600 1382 3198335 R06A A02 Diphenhydramine 22705 9200 3190536 J01F A10 Azithromycin 5079 25534 3061337 A02B A02 Ranitidine 7050 23126 3017538 C09A A02 Enalapril 16508 13405 2991339 A03B B01 Butylscopolamine 15494 14137 2963140 J01X X08 Linezolid 25568 3717 2928541 J01E A01 Trimethoprim 86 28405 2849142 N03A F01 Carbamazepine 4149 24099 2824843 C09D A07 Telmisartan and diuretics 1882 25069 2695044 G03D C02 Norethisterone 262 26596 2685845 A08A B01 Orlistat 18808 7998 2680646 B03X A01 Erythropoietin 18148 8443 2659147 L02B G04 Letrozole 5172 21392 2656448 L01B C06 Capecitabine 3093 23150 2624249 J02A C01 Fluconazole 6912 19105 2601750 R06A E07 Cetirizine 145 25781 25926
Total Top 20 drugs by Expenditure in 2010 492388 845041 1337429Total Top 50 drugs by Expenditure in 2010 840355 1450956 2291311Total Top 150 drugs by Expenditure in 2010 1560415 2294719 3855134
31
MALAYSIAN STATISTICS ON MEDICINES 2009 & 2010
Table 2.2: Top 50 Drugs by Expenditure in RM ‘000 2009RANK ATC DRUGS PUBLIC PRIVATE TOTAL
1 C08C A01 Amlodipine 2341 120677 1230182 C07A A05 Propranolol 71603 6213 778163 C07A G01 Labetalol 3294 74138 774324 C10A A05 Atorvastatin 7732 63758 714895 M01A H01 Celecoxib 4466 65205 696716 B01A C04 Clopidogrel 7539 59314 668537 C10A A01 Simvastatin 10913 49642 605558 C09A A04 Perindopril 54630 5806 604359 C07A G02 Carvedilol 15408 43362 58770
10 J01D C02 Cefuroxime 16776 38322 5509711 C01D A08 Isosorbide dinitrate 1819 51711 5353012 J01M A02 Ciprofloxacin 2264 49117 5138113 A10B F01 Acarbose 42397 6823 4922014 R05D A20 Combinations, cough suppressants opioid alkaloids and
derivatives 0 47583 47583
15 A10B B09 Gliclazide 19178 28362 4754016 N05A H03 Olanzapine 45436 657 4609217 J01F A01 Erythromycin 6559 37917 4447618 J01C R02 Amoxicillin and enzyme inhibitor 3793 40508 4430119 N03A X14 Levetiracetam 38362 5880 4424220 J01D D08 Cefixime 0 43352 4335221 M01A B05 Diclofenac 647 41532 4217922 B02B D08 Eptacog alfa (activated) 404 40849 4125323 N03A F01 Carbamazepine 32268 8211 4048024 N06B X03 Piracetam 511 39237 3974825 R06A E07 Cetirizin’e 63 38853 3891626 R03A C02 Salbutamol 33015 5866 3888127 A10B A02 Metformin 18787 17829 3661628 J07B F02 Poliomyelitis oral, trivalent, live attenuated 35648 13 3566129 N07B C02 Methadone 35317 58 3537530 J07C A06 Diphtheria-Hemophilus influenzae B-pertussis-
poliomyelitis-tetanus 30921 3966 34887
31 C10A A07 Rosuvastatin 2415 30028 3244332 C03B A11 Indapamide 709 31364 3207333 C08C A05 Nifedipine 8875 23140 3201434 R06A E01 Buclizine 0 30635 3063535 J01E E01 Sulfamethoxazole and trimethoprim 1601 28944 3054536 A02B C05 Esomeprazole 7300 23211 3051237 C07A B02 Metoprolol 21673 7266 2894038 A02B C02 Pantoprazole 7702 20703 2840539 C01A A05 Digoxin 2986 25088 2807440 J01C R05 Piperacillin and enzyme inhibitor 26627 1413 2804041 C07A B03 Atenolol 7830 19994 2782442 A03F A01 Metoclopramide 2884 23415 2629843 R06A A52 Diphenhydramine, combinations 15447 10348 2579544 G03A A07 Levonorgestrel and estrogen 5611 19999 2561045 J01F A10 Azithromycin 13879 11167 2504746 N07B C51 Buprenorphine, combinations 0 24891 2489147 A02B C01 Omeprazole 7781 17101 2488248 N03A X11 Topiramate 20947 3528 2447549 B03X A01 Erythropoietin 5309 18356 2366550 J07B D52 measles, combinations with mumps and rubella, live
attenuated 21719 1188 22907
Total Top 20 drugs by Expenditure in 2009 354508 838346 1192855Total Top 50 drugs by Expenditure in 2009 723385 1406543 2129927Total Top 150 drugs by Expenditure in 2009 1184152 2219397 3403549
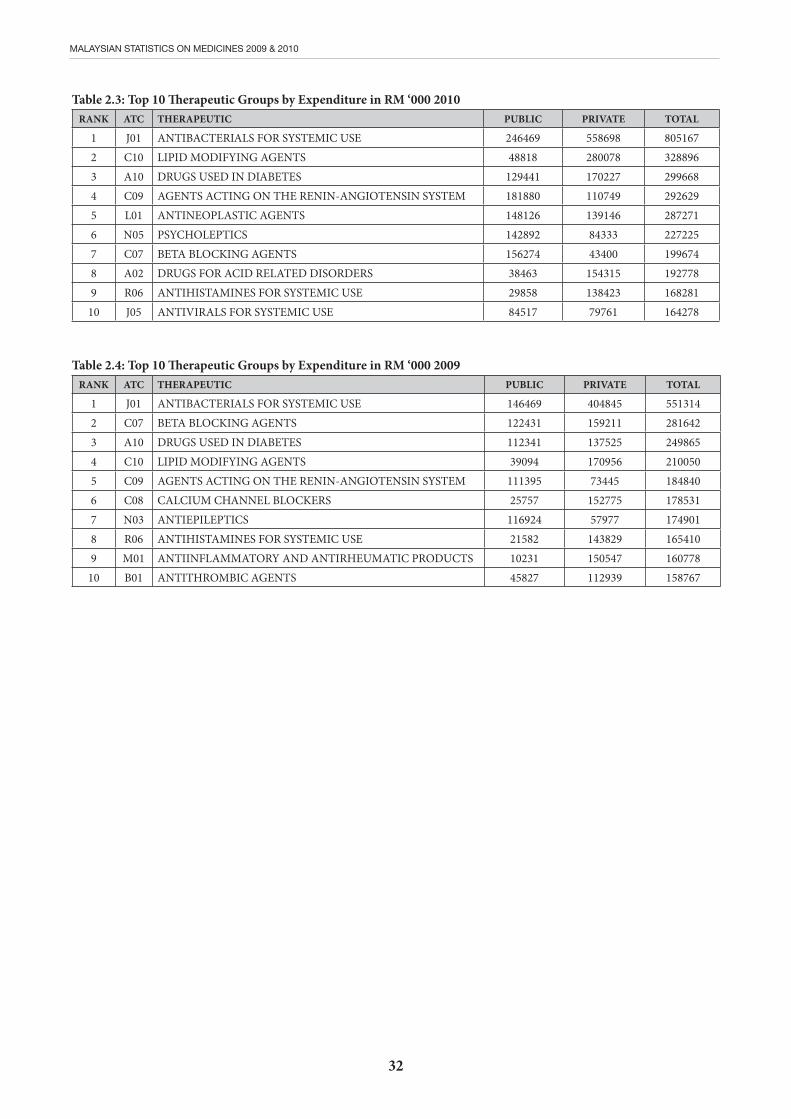
32
MALAYSIAN STATISTICS ON MEDICINES 2009 & 2010
Table 2.3: Top 10 Therapeutic Groups by Expenditure in RM ‘000 2010RANK ATC THERAPEUTIC PUBLIC PRIVATE TOTAL
1 J01 ANTIBACTERIALS FOR SYSTEMIC USE 246469 558698 8051672 C10 LIPID MODIFYING AGENTS 48818 280078 3288963 A10 DRUGS USED IN DIABETES 129441 170227 2996684 C09 AGENTS ACTING ON THE RENIN-ANGIOTENSIN SYSTEM 181880 110749 2926295 L01 ANTINEOPLASTIC AGENTS 148126 139146 2872716 N05 PSYCHOLEPTICS 142892 84333 2272257 C07 BETA BLOCKING AGENTS 156274 43400 1996748 A02 DRUGS FOR ACID RELATED DISORDERS 38463 154315 1927789 R06 ANTIHISTAMINES FOR SYSTEMIC USE 29858 138423 168281
10 J05 ANTIVIRALS FOR SYSTEMIC USE 84517 79761 164278
Table 2.4: Top 10 Therapeutic Groups by Expenditure in RM ‘000 2009 RANK ATC THERAPEUTIC PUBLIC PRIVATE TOTAL
1 J01 ANTIBACTERIALS FOR SYSTEMIC USE 146469 404845 5513142 C07 BETA BLOCKING AGENTS 122431 159211 2816423 A10 DRUGS USED IN DIABETES 112341 137525 2498654 C10 LIPID MODIFYING AGENTS 39094 170956 2100505 C09 AGENTS ACTING ON THE RENIN-ANGIOTENSIN SYSTEM 111395 73445 1848406 C08 CALCIUM CHANNEL BLOCKERS 25757 152775 1785317 N03 ANTIEPILEPTICS 116924 57977 1749018 R06 ANTIHISTAMINES FOR SYSTEMIC USE 21582 143829 1654109 M01 ANTIINFLAMMATORY AND ANTIRHEUMATIC PRODUCTS 10231 150547 160778
10 B01 ANTITHROMBIC AGENTS 45827 112939 158767
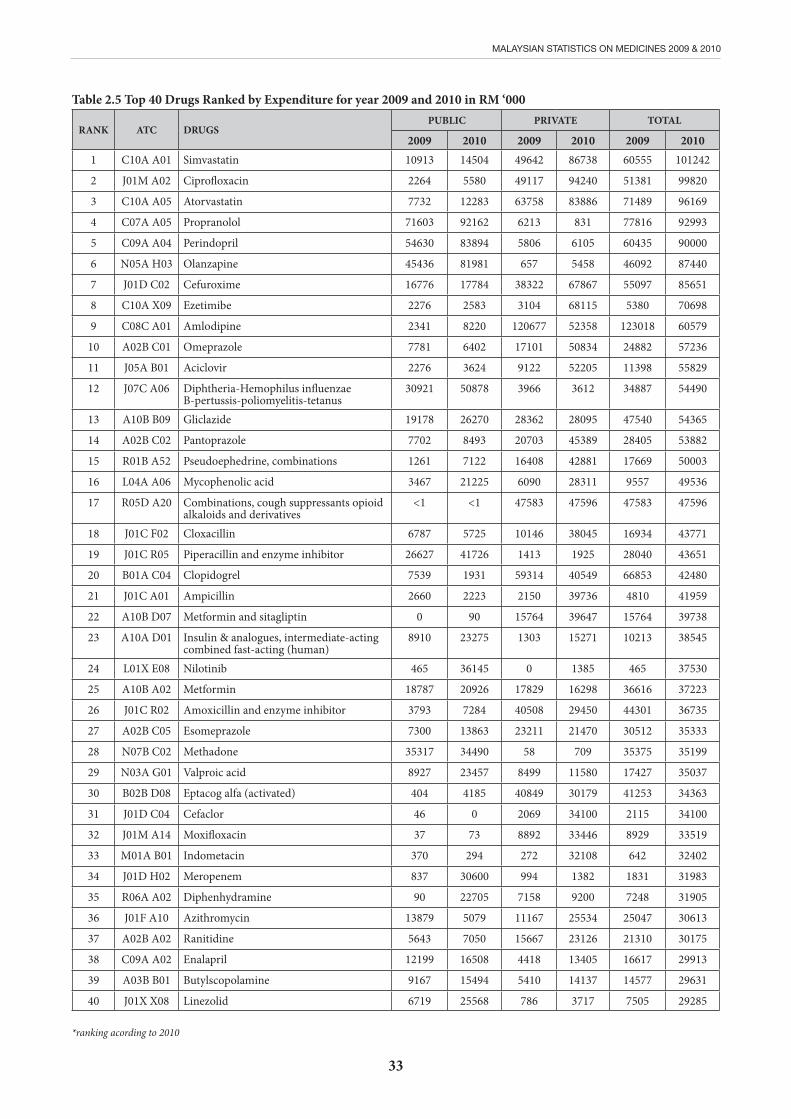
33
MALAYSIAN STATISTICS ON MEDICINES 2009 & 2010
Table 2.5 Top 40 Drugs Ranked by Expenditure for year 2009 and 2010 in RM ‘000
RANK ATC DRUGSPUBLIC PRIVATE TOTAL
2009 2010 2009 2010 2009 20101 C10A A01 Simvastatin 10913 14504 49642 86738 60555 101242
2 J01M A02 Ciprofloxacin 2264 5580 49117 94240 51381 99820
3 C10A A05 Atorvastatin 7732 12283 63758 83886 71489 96169
4 C07A A05 Propranolol 71603 92162 6213 831 77816 92993
5 C09A A04 Perindopril 54630 83894 5806 6105 60435 90000
6 N05A H03 Olanzapine 45436 81981 657 5458 46092 87440
7 J01D C02 Cefuroxime 16776 17784 38322 67867 55097 85651
8 C10A X09 Ezetimibe 2276 2583 3104 68115 5380 70698
9 C08C A01 Amlodipine 2341 8220 120677 52358 123018 60579
10 A02B C01 Omeprazole 7781 6402 17101 50834 24882 57236
11 J05A B01 Aciclovir 2276 3624 9122 52205 11398 55829
12 J07C A06 Diphtheria-Hemophilus influenzae B-pertussis-poliomyelitis-tetanus
30921 50878 3966 3612 34887 54490
13 A10B B09 Gliclazide 19178 26270 28362 28095 47540 54365
14 A02B C02 Pantoprazole 7702 8493 20703 45389 28405 53882
15 R01B A52 Pseudoephedrine, combinations 1261 7122 16408 42881 17669 50003
16 L04A A06 Mycophenolic acid 3467 21225 6090 28311 9557 49536
17 R05D A20 Combinations, cough suppressants opioid alkaloids and derivatives
<1 <1 47583 47596 47583 47596
18 J01C F02 Cloxacillin 6787 5725 10146 38045 16934 43771
19 J01C R05 Piperacillin and enzyme inhibitor 26627 41726 1413 1925 28040 43651
20 B01A C04 Clopidogrel 7539 1931 59314 40549 66853 42480
21 J01C A01 Ampicillin 2660 2223 2150 39736 4810 41959
22 A10B D07 Metformin and sitagliptin 0 90 15764 39647 15764 39738
23 A10A D01 Insulin & analogues, intermediate-acting combined fast-acting (human)
8910 23275 1303 15271 10213 38545
24 L01X E08 Nilotinib 465 36145 0 1385 465 37530
25 A10B A02 Metformin 18787 20926 17829 16298 36616 37223
26 J01C R02 Amoxicillin and enzyme inhibitor 3793 7284 40508 29450 44301 36735
27 A02B C05 Esomeprazole 7300 13863 23211 21470 30512 35333
28 N07B C02 Methadone 35317 34490 58 709 35375 35199
29 N03A G01 Valproic acid 8927 23457 8499 11580 17427 35037
30 B02B D08 Eptacog alfa (activated) 404 4185 40849 30179 41253 34363
31 J01D C04 Cefaclor 46 0 2069 34100 2115 34100
32 J01M A14 Moxifloxacin 37 73 8892 33446 8929 33519
33 M01A B01 Indometacin 370 294 272 32108 642 32402
34 J01D H02 Meropenem 837 30600 994 1382 1831 31983
35 R06A A02 Diphenhydramine 90 22705 7158 9200 7248 31905
36 J01F A10 Azithromycin 13879 5079 11167 25534 25047 30613
37 A02B A02 Ranitidine 5643 7050 15667 23126 21310 30175
38 C09A A02 Enalapril 12199 16508 4418 13405 16617 29913
39 A03B B01 Butylscopolamine 9167 15494 5410 14137 14577 29631
40 J01X X08 Linezolid 6719 25568 786 3717 7505 29285
*ranking acording to 2010
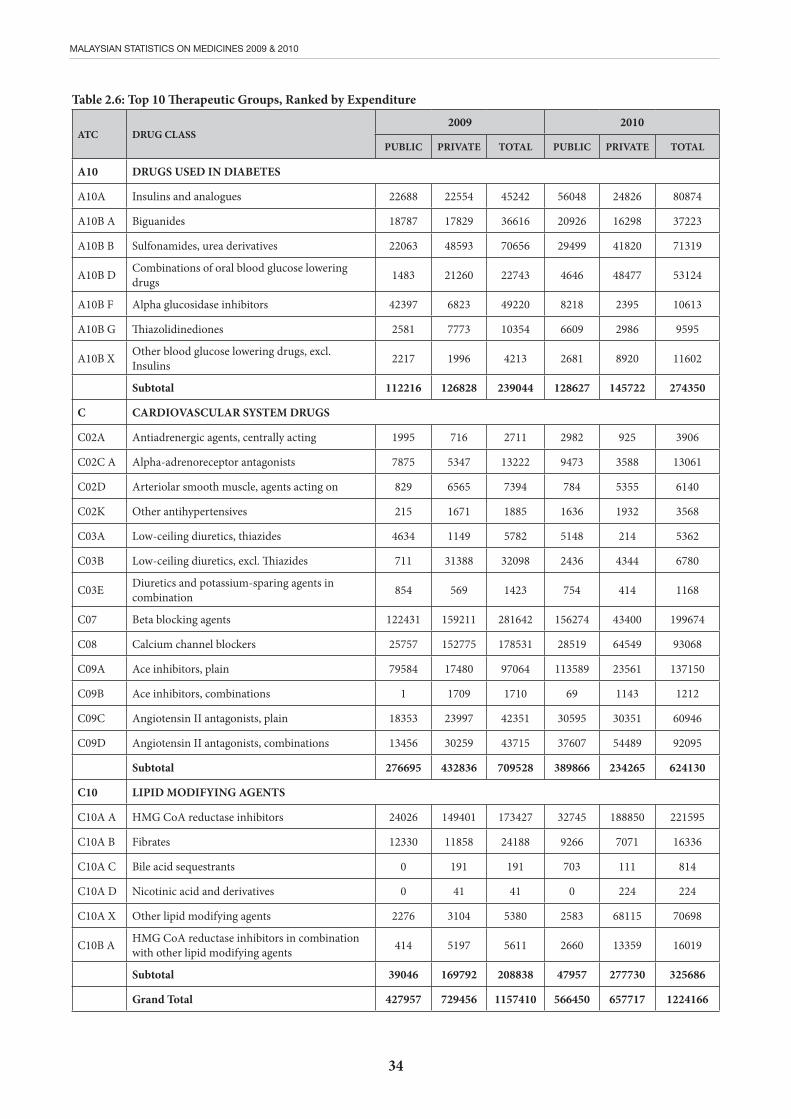
34
MALAYSIAN STATISTICS ON MEDICINES 2009 & 2010
Table 2.6: Top 10 Therapeutic Groups, Ranked by Expenditure
ATC DRUG CLASS2009 2010
PUBLIC PRIVATE TOTAL PUBLIC PRIVATE TOTAL
A10 DRUGS USED IN DIABETES
A10A Insulins and analogues 22688 22554 45242 56048 24826 80874
A10B A Biguanides 18787 17829 36616 20926 16298 37223
A10B B Sulfonamides, urea derivatives 22063 48593 70656 29499 41820 71319
A10B D Combinations of oral blood glucose lowering drugs 1483 21260 22743 4646 48477 53124
A10B F Alpha glucosidase inhibitors 42397 6823 49220 8218 2395 10613
A10B G Thiazolidinediones 2581 7773 10354 6609 2986 9595
A10B X Other blood glucose lowering drugs, excl. Insulins 2217 1996 4213 2681 8920 11602
Subtotal 112216 126828 239044 128627 145722 274350
C CARDIOVASCULAR SYSTEM DRUGS
C02A Antiadrenergic agents, centrally acting 1995 716 2711 2982 925 3906
C02C A Alpha-adrenoreceptor antagonists 7875 5347 13222 9473 3588 13061
C02D Arteriolar smooth muscle, agents acting on 829 6565 7394 784 5355 6140
C02K Other antihypertensives 215 1671 1885 1636 1932 3568
C03A Low-ceiling diuretics, thiazides 4634 1149 5782 5148 214 5362
C03B Low-ceiling diuretics, excl. Thiazides 711 31388 32098 2436 4344 6780
C03E Diuretics and potassium-sparing agents in combination 854 569 1423 754 414 1168
C07 Beta blocking agents 122431 159211 281642 156274 43400 199674
C08 Calcium channel blockers 25757 152775 178531 28519 64549 93068
C09A Ace inhibitors, plain 79584 17480 97064 113589 23561 137150
C09B Ace inhibitors, combinations 1 1709 1710 69 1143 1212
C09C Angiotensin II antagonists, plain 18353 23997 42351 30595 30351 60946
C09D Angiotensin II antagonists, combinations 13456 30259 43715 37607 54489 92095
Subtotal 276695 432836 709528 389866 234265 624130
C10 LIPID MODIFYING AGENTS
C10A A HMG CoA reductase inhibitors 24026 149401 173427 32745 188850 221595
C10A B Fibrates 12330 11858 24188 9266 7071 16336
C10A C Bile acid sequestrants 0 191 191 703 111 814
C10A D Nicotinic acid and derivatives 0 41 41 0 224 224
C10A X Other lipid modifying agents 2276 3104 5380 2583 68115 70698
C10B A HMG CoA reductase inhibitors in combination with other lipid modifying agents 414 5197 5611 2660 13359 16019
Subtotal 39046 169792 208838 47957 277730 325686
Grand Total 427957 729456 1157410 566450 657717 1224166
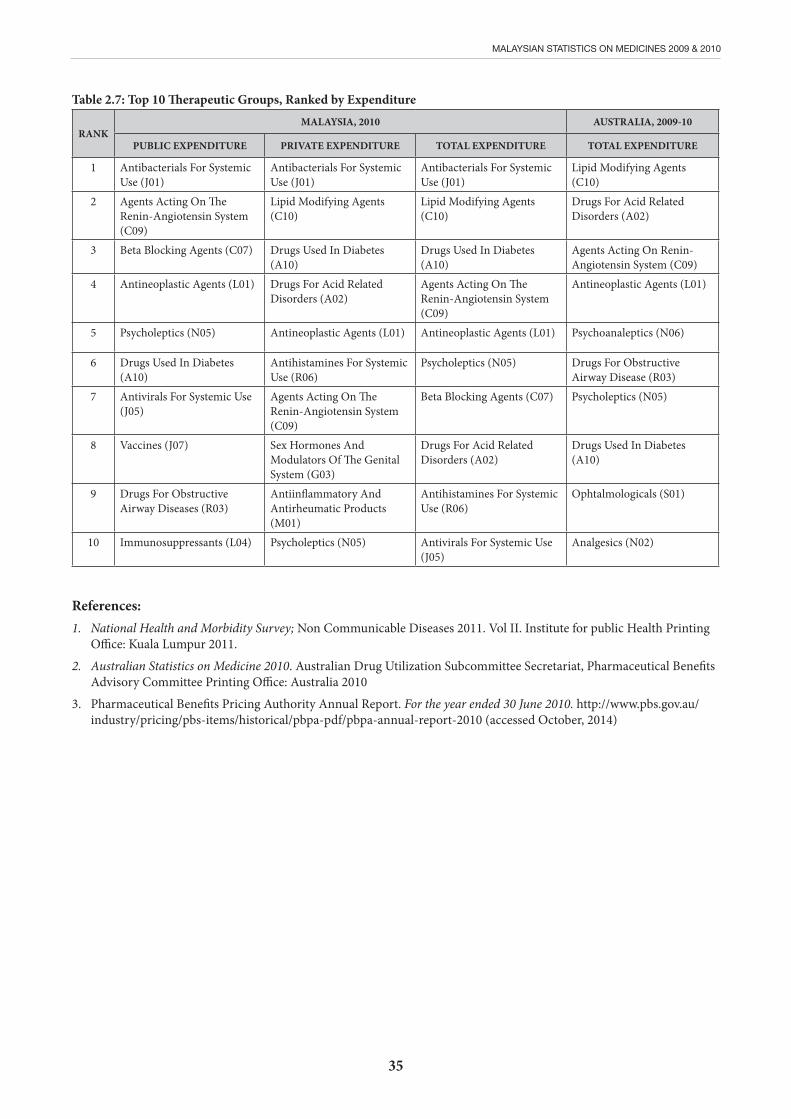
35
MALAYSIAN STATISTICS ON MEDICINES 2009 & 2010
Table 2.7: Top 10 Therapeutic Groups, Ranked by Expenditure
RANKMALAYSIA, 2010 AUSTRALIA, 2009-10
PUBLIC EXPENDITURE PRIVATE EXPENDITURE TOTAL EXPENDITURE TOTAL EXPENDITURE
1 Antibacterials For Systemic Use (J01)
Antibacterials For Systemic Use (J01)
Antibacterials For Systemic Use (J01)
Lipid Modifying Agents (C10)
2 Agents Acting On The Renin-Angiotensin System (C09)
Lipid Modifying Agents (C10)
Lipid Modifying Agents (C10)
Drugs For Acid Related Disorders (A02)
3 Beta Blocking Agents (C07) Drugs Used In Diabetes (A10)
Drugs Used In Diabetes (A10)
Agents Acting On Renin-Angiotensin System (C09)
4 Antineoplastic Agents (L01) Drugs For Acid Related Disorders (A02)
Agents Acting On The Renin-Angiotensin System (C09)
Antineoplastic Agents (L01)
5 Psycholeptics (N05) Antineoplastic Agents (L01) Antineoplastic Agents (L01) Psychoanaleptics (N06)
6 Drugs Used In Diabetes (A10)
Antihistamines For Systemic Use (R06)
Psycholeptics (N05) Drugs For Obstructive Airway Disease (R03)
7 Antivirals For Systemic Use (J05)
Agents Acting On The Renin-Angiotensin System (C09)
Beta Blocking Agents (C07) Psycholeptics (N05)
8 Vaccines (J07) Sex Hormones And Modulators Of The Genital System (G03)
Drugs For Acid Related Disorders (A02)
Drugs Used In Diabetes (A10)
9 Drugs For Obstructive Airway Diseases (R03)
Antiinflammatory And Antirheumatic Products (M01)
Antihistamines For Systemic Use (R06)
Ophtalmologicals (S01)
10 Immunosuppressants (L04) Psycholeptics (N05) Antivirals For Systemic Use (J05)
Analgesics (N02)
References:1. National Health and Morbidity Survey; Non Communicable Diseases 2011. Vol II. Institute for public Health Printing
Office: Kuala Lumpur 2011.
2. Australian Statistics on Medicine 2010. Australian Drug Utilization Subcommittee Secretariat, Pharmaceutical Benefits Advisory Committee Printing Office: Australia 2010
3. Pharmaceutical Benefits Pricing Authority Annual Report. For the year ended 30 June 2010. http://www.pbs.gov.au/industry/pricing/pbs-items/historical/pbpa-pdf/pbpa-annual-report-2010 (accessed October, 2014)

36
MALAYSIAN STATISTICS ON MEDICINES 2009 & 2010
CHAPTER 3 : USE OF DRUGS FOR ALIMENTARY DISORDERSRosaida M.S.1, Kiew K.K.2, Tee H.P.3, Ooi B.P.4, Ooi E.T.5, Ghan S.L.6, Sugendiren S.7, Ang S.Y.8, Muhammad Radzi A.H.2
1. Hospital Ampang, Selangor, 2. Hospital Sultanah Bahiyah, Alor Setar, 3. Hospital Tengku Ampuan Afzan,Kuantan, 4. Hospital Pulau Pinang, Pulau Pinang, 5. Hospital Kuala Lumpur, 6. UKM Medical Centre, Selangor, 7. Hospital Putrajaya, Putrajaya, 8. Hospital Tengku Ampuan Rahimah, Klang, Selangor.
Acid-related diseases comprise a variety of disorders that affect the esophagus, stomach and duodenum. Peptic ulcer disease and gastro-oesophageal reflux disease (GORD) remain the common cause of acid-related gastrointestinal diseases. Even though the prevalence of GORD in Asian countries is lower compared to developed nations, the prevalence is steadily rising1,2. Data from Southeast and Western Asia shows that the prevalence of GORD is higher compared to Eastern Asia from 6.3% - 18.3% vs. 5.2% - 8.5% (2005 – 2010)3. Malaysian data meanwhile shows that the prevalence of GORD to be between 0.9% and 13.4%4,5 whereas a study in the US shows up to 44% of adults experiencing it at least once monthly6.
In this survey, the total utilisation of medicines for acid-related disorder in 2010 increased to 6.7124 DDD/1000 population/day compared to 6.5802 DDD/1000 population/day in 2009, contributed mainly by an increase usage in H2RA. The trend of medication used for acid related disorders has reverted from proton pump inhibitors to H2-receptor antagonist (H2RA) from 2009 – 2010, i.e. 3.5456 vs. 3.0213 and 2.6693 vs. 4.033 DDD/1000 population/ day respectively.
Ranitidine (2.1203 DDD/1000 population/day in year 2009 and 3.5754 DDD/1000 population/day in year 2010) was the most commonly H2-receptor antagonists prescribed followed by Cimetidine (0.5032 DDD/1000 population/day in year 2009 and 0.2994 DDD/1000 population/day in year 2010). The usage of Ranitidine had increased by 68.6% from year 2009 to year 2010 whereas the usage of Cimetidine had reduced by 40.5% during the same period. The other H2-receptor antagonists such as Famotidine is not widely prescribed in Malaysia and mainly used by the private practitioner. Similar with Cimetidine, the usage was in reducing trend (60%) too. Ranitidine (80.74%) and Cimetidine (11.39%) accounted for 92.13% of H2-receptor antagonists being used in 2009 and 2010. This trend shows that Ranitidine is more preferable than other H2-receptor antagonists. The trend is more obvious in the public sector whereby Ranitidine use increased from 1.6647 DDD/1000 population/day to 3.3156 DDD/1000 population/day. The preference for H2-receptor antagonists may be explained by easy access to the drugs, familiarity with prescription and cheaper cost especially with the generic formulation.
Amongst the PPI, the trend showed an increasing trend from 2007-2009 (2.9856- 3.5456 DDD/1000 population/day) but it showed a sharp drop in 2010 to 2.6693 DDD/1000 population. The most commonly prescribed PPI in 2010
remains omeprazole (1.627 DDD/1000 population/day), accounting for 60% of total PPI prescribed, followed by pantoprazole 18.5%, esomeprazole 17.1%, lansoprazole 2.2% and rabeprazole 1.4%. The reason for the sharp drop in the trend of PPI use in 2010 can probably be attributed to the multiple warnings issued by the FDA and EMA7-11 with regards to the PPI-Clopidogrel interaction where the efficacy of Clopidogrel is postulated to be reduced due to the interaction of PPI with the CYP2C19 enzyme needed for the activation of the prodrug Clopidogrel to active drug. This reduction trend however was not reflected in the statistics of Australia, Finland and Norway where the use of PPI continued to increase in 2010. The predominant PPI were also different in Australia12 (Esomeprazole), Finland13 (Pantoprazole) and Norway14 (Esomeprazole) showing a global difference in trend.
The data collected for eradication of H. Pylori regimen is inadequate to do a meaningful analysia. This may be due to lack of mechanism to capture the data where the individual drugs were prescribed separately in the presence of a high number of possible combinations of PPI and antibiotics. The limited data available on combined therapy of pantoprazole-amoxicillin-clarithromycin (used only in private sector) showed a decrease in usage from 0.0011 to 0.0004 (63%) DDD/1000 population/day. This trend is consistent with the decrease in the prevalence of H. Pylori infection in Malaysia. One local study showed the prevalence of H. Pylori associated duodenal ulcers dropped from 90.1% (1989-90) to 69.8% (1999-2000) while the prevalence of gastric ulcers dropped from 86.6% (1989-90) to 56.8% (1999-2000)5.
The usage of drugs for functional bowel disorders was generally in the increasing trend, 0.1614 DDD/1000 population/day (2009) and 0.2433 DDD/1000 population/day (2010) compared to 0.1138DDD/1000 population/day in 2008. The usage was lower than Australia12 (0.3DDD/1000 population/day in 2010) and Finland13 (1.43DDD/1000 population/day in 2009). Mebeverine was the most popular drug used in this group of gastrointestinal disorder in 2009 (0.3623) but there was a surge in usage of Trimebutine in 2010 (from 0.003DDD/1000 population/day in 2009 to 0.1911DDD/1000 population/day in 2010), mainly in the private sector. Trimebutine was more popular than Mebeverine in 2010. Dicycloverine and Glycopyrronium bromide usage remained low in both years.
Antispasmodic drugs usage was low in general. Butylscopolamine was the commonest drug used. There

37
MALAYSIAN STATISTICS ON MEDICINES 2009 & 2010
was a markedly increase usage of this drug from 2.1447 to 3.8065DDD/1000 population/day especially from the public sector, doubling form 2009 to 2010. Silicones was only used in private sector (0.1515 and 0.2361DDD/1000 population/day in 2009 and 2010)
In the management of motility disorders, Metoclopromide remained the most popular drug but its usage in decreased (2.8329 to 1.5776DDD/1000 population/day from 2009 to 2010). Domperidone usage was doubled from 2009 to 2010 in public.
Table 3.1: Use of Medicines for Acid Related Disorders by Drug Class, in DDD/1000 population/day 2009-2010 ATC DRUG CLASS 2009 2010A02B A H2-receptor antagonists 3.0213 4.0333A02B B Prostaglandins 0.0124 0.0099A02B C Proton pump inhibitors 3.5456 2.6693A02B D Combinations for eradication of Helicobacter pylori 0.0011 0.0004A02B X Other drugs for peptic ulcer and gastro-oesophageal reflux disease (GORD) <0.0001 <0.0001
Table 3.2: Use of Medicines for by Acid Related Disorders Drug Class and Agents, in DDD/1000 population/day 2009-2010
ATC DRUG CLASS AND AGENTS SECTOR 2009 2010A02B A H2-receptor antagonists A02B A01
Cimetidine Public 0.1968 0.0992Private 0.3064 0.2002Total 0.5032 0.2994
A02B A02
Ranitidine Public 1.6647 3.3156Private 0.4556 0.2599Total 2.1203 3.5754
A02B A03
Famotidine Public <0.0001 -Private 0.3978 0.1585Total 0.3978 0.1585
A02B B Prostaglandins A02B B01
Misoprostol Public <0.0001 <0.0001Private 0.0124 0.0099Total 0.0124 0.0099
A02B C Proton pump inhibitorsA02B C01
Omeprazole Public 1.0069 1.2584Private 1.3640 0.3685Total 2.3709 1.6270
A02B C02
Pantoprazole Public 0.2109 0.2685Private 0.2291 0.2238Total 0.4400 0.4923
A02B C03
Lansoprazole Public 0.0240 0.0244Private 0.0507 0.0344Total 0.0747 0.0587
A02B C04
Rabeprazole Public 0.0204 0.0096Private 0.1918 0.0274Total 0.2123 0.0370
Conclusion
There is a drop in the usage of PPI in the study period due to concern issued by FDA on concomitant use with Clopidogrel. This reduced use of PPI has resulted in the use of H2 receptor antagonist overtaking that of PPI and became the preferred drugs for acid-related disorders from 2009-2010.

38
MALAYSIAN STATISTICS ON MEDICINES 2009 & 2010
ATC DRUG CLASS AND AGENTS SECTOR 2009 2010A02B C05
Esomeprazole Public 0.1124 0.1645Private 0.3354 0.2898Total 0.4477 0.4543
A02B D Combinations for eradication of Helicobacter pylori A02B D04
Pantoprazole, amoxicillin and clarithromycin Public - -Private 0.0011 0.0004Total 0.0011 0.0004
A02B X Other drugs for peptic ulcer and gastro-oesophageal reflux disease (GORD)A02B X05
Bismuth subcitrate Public - -Private <0.0001 <0.0001Total <0.0001 <0.0001
Table 3.3: Use of Medicines for Gastrointestinal Disorders by Drug Class and Agents, in DDD/1000 population/day 2009-2010
ATC DRUG CLASS AND AGENTS SECTOR 2009 2010A03A A Synthetic anticholinergics, esters with tertiary amino group A03A A04
Mebeverine Public 0.0193 0.0196Private 0.3430 0.0297Total 0.3623 0.0493
A03A A05
Trimebutine Public - 0.0002Private 0.0030 0.1910Total 0.0030 0.1911
A03A A07
Dicycloverine Public - -Private 0.0014 0.0011Total 0.0014 0.0011
A03A B Synthetic anticholinergics, quaternary ammonium compounds A03A B02
Glycopyrronium bromide Public 0.0001 0.0006Private <0.0001 <0.0001Total 0.0002 0.0006
A03A D Papaverine and derivatives A03A D01
Papaverine Public - -Private <0.0001 <0.0001Total <0.0001 <0.0001
A03A D02
Drotaverine Public - -Private 0.0703 0.0474Total 0.0703 0.0474
A03A X Other drugs for functional bowel disorders A03A X13
Silicones Public - -Private 0.1515 0.2361Total 0.1515 0.2361
A03A X58 Alverine, combinations Public - <0.0001Private 0.0099 0.0072Total 0.0099 0.0072
A03B A Belladonna alkaloids, tertiary aminesA03B A01
Atropine Public 0.0059 0.0441Private 0.0095 0.0068Total 0.0154 0.0509
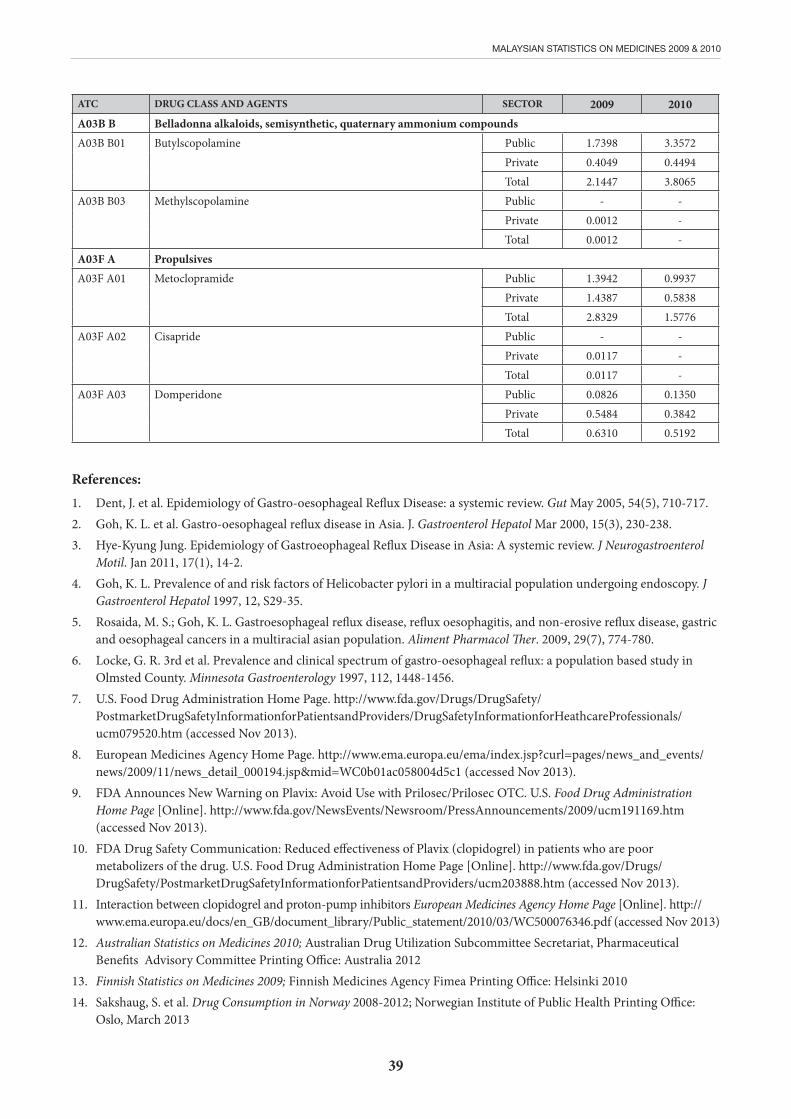
39
MALAYSIAN STATISTICS ON MEDICINES 2009 & 2010
ATC DRUG CLASS AND AGENTS SECTOR 2009 2010A03B B Belladonna alkaloids, semisynthetic, quaternary ammonium compounds A03B B01
Butylscopolamine Public 1.7398 3.3572Private 0.4049 0.4494Total 2.1447 3.8065
A03B B03
Methylscopolamine Public - -Private 0.0012 -Total 0.0012 -
A03F A Propulsives A03F A01
Metoclopramide Public 1.3942 0.9937Private 1.4387 0.5838Total 2.8329 1.5776
A03F A02
Cisapride Public - -Private 0.0117 -Total 0.0117 -
A03F A03
Domperidone Public 0.0826 0.1350Private 0.5484 0.3842Total 0.6310 0.5192
References:1. Dent, J. et al. Epidemiology of Gastro-oesophageal Reflux Disease: a systemic review. Gut May 2005, 54(5), 710-717.2. Goh, K. L. et al. Gastro-oesophageal reflux disease in Asia. J. Gastroenterol Hepatol Mar 2000, 15(3), 230-238.3. Hye-Kyung Jung. Epidemiology of Gastroeophageal Reflux Disease in Asia: A systemic review. J Neurogastroenterol
Motil. Jan 2011, 17(1), 14-2.4. Goh, K. L. Prevalence of and risk factors of Helicobacter pylori in a multiracial population undergoing endoscopy. J
Gastroenterol Hepatol 1997, 12, S29-35.5. Rosaida, M. S.; Goh, K. L. Gastroesophageal reflux disease, reflux oesophagitis, and non-erosive reflux disease, gastric
and oesophageal cancers in a multiracial asian population. Aliment Pharmacol Ther. 2009, 29(7), 774-780.6. Locke, G. R. 3rd et al. Prevalence and clinical spectrum of gastro-oesophageal reflux: a population based study in
Olmsted County. Minnesota Gastroenterology 1997, 112, 1448-1456.7. U.S. Food Drug Administration Home Page. http://www.fda.gov/Drugs/DrugSafety/
PostmarketDrugSafetyInformationforPatientsandProviders/DrugSafetyInformationforHeathcareProfessionals/ucm079520.htm (accessed Nov 2013).
8. European Medicines Agency Home Page. http://www.ema.europa.eu/ema/index.jsp?curl=pages/news_and_events/news/2009/11/news_detail_000194.jsp&mid=WC0b01ac058004d5c1 (accessed Nov 2013).
9. FDA Announces New Warning on Plavix: Avoid Use with Prilosec/Prilosec OTC. U.S. Food Drug Administration Home Page [Online]. http://www.fda.gov/NewsEvents/Newsroom/PressAnnouncements/2009/ucm191169.htm (accessed Nov 2013).
10. FDA Drug Safety Communication: Reduced effectiveness of Plavix (clopidogrel) in patients who are poor metabolizers of the drug. U.S. Food Drug Administration Home Page [Online]. http://www.fda.gov/Drugs/DrugSafety/PostmarketDrugSafetyInformationforPatientsandProviders/ucm203888.htm (accessed Nov 2013).
11. Interaction between clopidogrel and proton-pump inhibitors European Medicines Agency Home Page [Online]. http://www.ema.europa.eu/docs/en_GB/document_library/Public_statement/2010/03/WC500076346.pdf (accessed Nov 2013)
12. Australian Statistics on Medicines 2010; Australian Drug Utilization Subcommittee Secretariat, Pharmaceutical Benefits Advisory Committee Printing Office: Australia 2012
13. Finnish Statistics on Medicines 2009; Finnish Medicines Agency Fimea Printing Office: Helsinki 201014. Sakshaug, S. et al. Drug Consumption in Norway 2008-2012; Norwegian Institute of Public Health Printing Office:
Oslo, March 2013
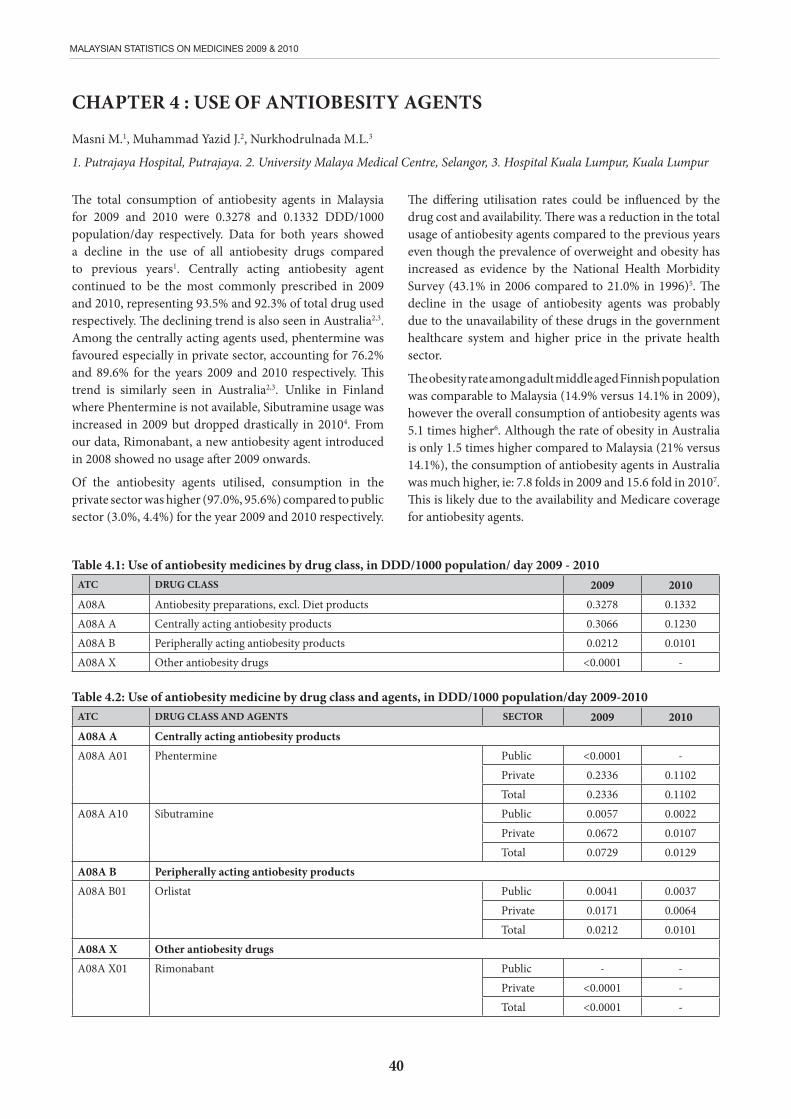
40
MALAYSIAN STATISTICS ON MEDICINES 2009 & 2010
The total consumption of antiobesity agents in Malaysia for 2009 and 2010 were 0.3278 and 0.1332 DDD/1000 population/day respectively. Data for both years showed a decline in the use of all antiobesity drugs compared to previous years1. Centrally acting antiobesity agent continued to be the most commonly prescribed in 2009 and 2010, representing 93.5% and 92.3% of total drug used respectively. The declining trend is also seen in Australia2,3.Among the centrally acting agents used, phentermine was favoured especially in private sector, accounting for 76.2% and 89.6% for the years 2009 and 2010 respectively. This trend is similarly seen in Australia2,3. Unlike in Finland where Phentermine is not available, Sibutramine usage was increased in 2009 but dropped drastically in 20104. From our data, Rimonabant, a new antiobesity agent introduced in 2008 showed no usage after 2009 onwards.
Of the antiobesity agents utilised, consumption in the private sector was higher (97.0%, 95.6%) compared to public sector (3.0%, 4.4%) for the year 2009 and 2010 respectively.
CHAPTER 4 : USE OF ANTIOBESITY AGENTS
Masni M.1, Muhammad Yazid J.2, Nurkhodrulnada M.L.3
1. Putrajaya Hospital, Putrajaya. 2. University Malaya Medical Centre, Selangor, 3. Hospital Kuala Lumpur, Kuala Lumpur
The differing utilisation rates could be influenced by the drug cost and availability. There was a reduction in the total usage of antiobesity agents compared to the previous years even though the prevalence of overweight and obesity has increased as evidence by the National Health Morbidity Survey (43.1% in 2006 compared to 21.0% in 1996)5. The decline in the usage of antiobesity agents was probably due to the unavailability of these drugs in the government healthcare system and higher price in the private health sector.
The obesity rate among adult middle aged Finnish population was comparable to Malaysia (14.9% versus 14.1% in 2009), however the overall consumption of antiobesity agents was 5.1 times higher6. Although the rate of obesity in Australia is only 1.5 times higher compared to Malaysia (21% versus 14.1%), the consumption of antiobesity agents in Australia was much higher, ie: 7.8 folds in 2009 and 15.6 fold in 20107.This is likely due to the availability and Medicare coverage for antiobesity agents.
Table 4.1: Use of antiobesity medicines by drug class, in DDD/1000 population/ day 2009 - 2010ATC DRUG CLASS 2009 2010A08A Antiobesity preparations, excl. Diet products 0.3278 0.1332A08A A Centrally acting antiobesity products 0.3066 0.1230A08A B Peripherally acting antiobesity products 0.0212 0.0101A08A X Other antiobesity drugs <0.0001 -
Table 4.2: Use of antiobesity medicine by drug class and agents, in DDD/1000 population/day 2009-2010ATC DRUG CLASS AND AGENTS SECTOR 2009 2010A08A A Centrally acting antiobesity productsA08A A01
Phentermine Public <0.0001 -Private 0.2336 0.1102Total 0.2336 0.1102
A08A A10
Sibutramine Public 0.0057 0.0022Private 0.0672 0.0107Total 0.0729 0.0129
A08A B Peripherally acting antiobesity productsA08A B01
Orlistat Public 0.0041 0.0037Private 0.0171 0.0064Total 0.0212 0.0101
A08A X Other antiobesity drugsA08A X01
Rimonabant Public - -Private <0.0001 -Total <0.0001 -
41
MALAYSIAN STATISTICS ON MEDICINES 2009 & 2010
References:1. Malaysian Statistics on Medicines 2008; Pharmaceutical Services Division & Clinical Research Centre, Ministry of
Health Malaysia Printing Office: Kuala Lumpur 2013.
2. Australian Statistics on Medicine 2009 15th Edition; Australian Government Department of Health and Ageing Printing Office: Commonwealth of Australia 2011.
3. Australian Statistics on Medicine 2010 16th Edition; Australian Government Department of Health and Ageing Printing Office: Commonwealth of Australia 2012.
4. Finnish Statistics of Medicine 2010; Finnish Medicines Agency Fimea & Social Insurance Institution Printing Office: Helsinki 2011.
5. The Third National Health and Morbidity Survey (NHMS III) 2006; Institute for Public Health (IPH) Ministry of Health Malaysia Printing Office: Kuala Lumpur 2008.
6. Metadata for OECD Health Data 2011-version November 2011. OECD Home Page [Online]. http://www.oecd.org/redirect/health/health-systems/oecdhealthdata2012-frequentlyrequesteddata.htm (accessed Nov 27 2013).
7. Australian Bureau of Statistics Home Page. http://www.abs.gov.au/AUSSTATS/[email protected]/DetailsPage/4364.02007-2008%20(Reissue)?OpenDocument (accessed Nov 27 2013).

42
MALAYSIAN STATISTICS ON MEDICINES 2009 & 2010
CHAPTER 5 : USE OF ANTI-DIABETIC DRUGS
Letchumanan G.R.R.1, Fuziah M.Z.2, Yong S.L.3, Mohamed Noor R.4, Daphne G.2
1. Taiping Hospital, Perak, 2. Putrajaya Hospital, W.P. Putrajaya, 3. Tengku Ampuan Rahimah Hospital, Klang 4. University Malaya Medical Centre, Selangor
In the year 2009, the total consumption of anti-diabetic medications was 51.3862 DDD/1000 population/day which was lower than 2010 (60.0626 DDD/1000 population/day)1. This could be driven by the higher purchase of Gliclazide MR which became a contract item in the public sector in 2009. However, the overall trend of the use of antidiabetic has increased by 28.6% over the period of 2007/2008 to 2009/2010, reflecting higher prevalence of diabetes and hopefully, more appropriate early therapy.
Oral Hypoglycaemic AgentsThe use of sulphonylurea in 2009/2010 had increased by 16.2% as compared to 2007/2008. The overall use of glibenclamide had reduced, and chlorpropamide was not used in the public sector at all. Gliclazide was still the main sulphonylurea being used in both the public and private sectors. This was consistent with the trend where second generation of sulphonylureas were being used more widely because of less hypoglycaemia.
The use of metformin had steadily increased over the years in the public sector and this was expected as it is the first line therapy. However, the use of metformin had reduced in the private sector as more combinations of oral hypoglycaemic agents with metformin were being used. This is in line with the rule that usage of combinations improves compliance and cost saving.
The use of acarbose was higher in 2009 than in 2010. The use of the DPP-4 inhibitors almost doubled within a year, and this was higher in the private sector, also probably due to its higher cost. This is due to the fact that this group are weight neutral, causes less hypoglycemia, and can be used in renal impairment. The overall use of thiazolidinediones was low at that time due to its widely reported adverse events. Finally, the use of repaglinide and nateglinide remained low due to its high cost, multiple dosing and no positive outcome trials.
InsulinThe overall use of insulin in 2010 had increased remarkably. This could be due to multiple factors such as, the launching of CPG Type 2 Diabetes Mellitus in 2009 and increased awareness of insulin via nationwide road shows. As a whole,
it is noticed that premixed insulin are still more popular in Malaysia as compared to other insulins because of patients’ preference for lesser injections.
There was a decrease in the use of insulin glargine in the private sector as compared to the years 2007/2008 as there were reports of possible association of glargine with cancer then, which were later refuted. We observe an increase in the use of insulin analogues, both in the private and public sectors between 2009/2010. There was an unexpected drop in the private sector in the use of premixed insulin in 2010.
Comparison with Other CountriesThe overall insulin use in Malaysia (5.7884 DDD/1000/day) is far behind compared to Australia (18.141 DDD/1000/day) in 2010, and it is observed that Australia used predominantly insulin analogues (14.303 DDD/1000/day), which was about three quarter of their total insulin usage. In comparison, Malaysia’s usage of insulin analogues only constituted less than 10% of the total insulin usage. In contrast, Australia’s usage of premixed insulin 33.4% of their total insulin usage, whereas Malaysia’s premixed insulin use was 46.7% of our total insulin use.
Our biguanide use was comparable to Australia (13.984 DDD/1000/day for Australia vs 14.5749 DDD/1000/day). In contrast, Australia’s use of sulphonylureas (15.463 DDD/1000/day) and acarbose (0.139 DDD/1000/day) was lower compared to Malaysia. Finally, Australia’s use of DPP-4 inhibitors (0.935 DDD/1000/day vs 0.4555 DDD/1000/day) was higher compared to Malaysia.
ConclusionIn conclusion, there was an encouraging rise in the use of metformin and insulin in the country in 2009/2010. However, our overall use of insulin was still much lower compared to Australia. There was a trend of rise in the use of newer antidiabetics such as the DPP-4 inhibitors and insulin analogues. It was also interesting to note that there was a difference in the prescribing tendency of doctors between private and public sectors. There was an immediate drop in the usage of insulin glargine in the private sector after adverse reports, and also high use of combination oral therapy in the private sector.

43
MALAYSIAN STATISTICS ON MEDICINES 2009 & 2010
Table 5.1: Use of Anti-Diabetics by Drug Class, in DDD/1000 population/day 2009-2010ATC DRUG CLASS 2009 2010A10A Insulins and analogues 2.4267 5.7884A10B A Biguanides 13.5929 14.5749A10B B Sulfonamides, urea derivatives 29.8889 34.7268A10B D Combinations of oral blood glucose lowering drugs 1.4454 3.6747A10B F Alpha glucosidase inhibitors 3.4349 0.7213A10B G Thiazolidinediones 0.1628 0.1063A10B H Dipeptidyl peptidase 4 (DPP-4) inhibitors 0.2236 0.4555A10B X Other blood glucose lowering drugs, excl. insulins 0.2110 0.0147
Table 5.2: Use of Anti-Diabetics by Drug Class and Agents, in DDD/1000 population/day 2009-2010ATC DRUG CLASS AND AGENTS SECTOR 2009 2010A10A B Insulins and analogues for injection, fast-acting
A10A B01
Insulin (human) Public 0.5680 1.6862Private 0.0665 0.0435Total 0.6345 1.7297
A10A B04
Insulin lispro Public 0.0003 0.0010Private 0.0041 0.0030Total 0.0044 0.0040
A10A B05
Insulin aspart Public 0.0002 0.0343Private 0.0048 0.0196Total 0.0051 0.0538
A10A B06
Insulin glulisine Public - -Private - <0.0001Total - <0.0001
A10A C Insulins and analogues for injection, intermediate-actingA10A C01
Insulin (human) Public 0.5954 1.2579Private 0.0242 0.0171Total 0.6196 1.2750
A10A D Insulins and analogues for injection, intermediate-acting combined with fast-actingA10A D01
Insulin & analogues, intermediate-acting combined fast-acting (human)
Public 0.6937 1.8650Private 0.0411 0.0183Total 0.7348 2.3978
A10A D04
Insulin lispro Public - <0.0001Private 0.0003 0.0009Total 0.0003 0.0009
A10A D05
Insulin aspart Public 0.0155 0.0696Private 0.3316 0.1378Total 0.3471 0.2074
A10A E Insulins and analogues for injection, long-actingA10A E04
Insulin glargine Public 0.0561 0.0905
Private 0.0146 0.0074Total 0.0708 0.0979
A10A E05
Insulin detemir Public - 0.0123Private 0.0103 0.0096Total 0.0103 0.0218
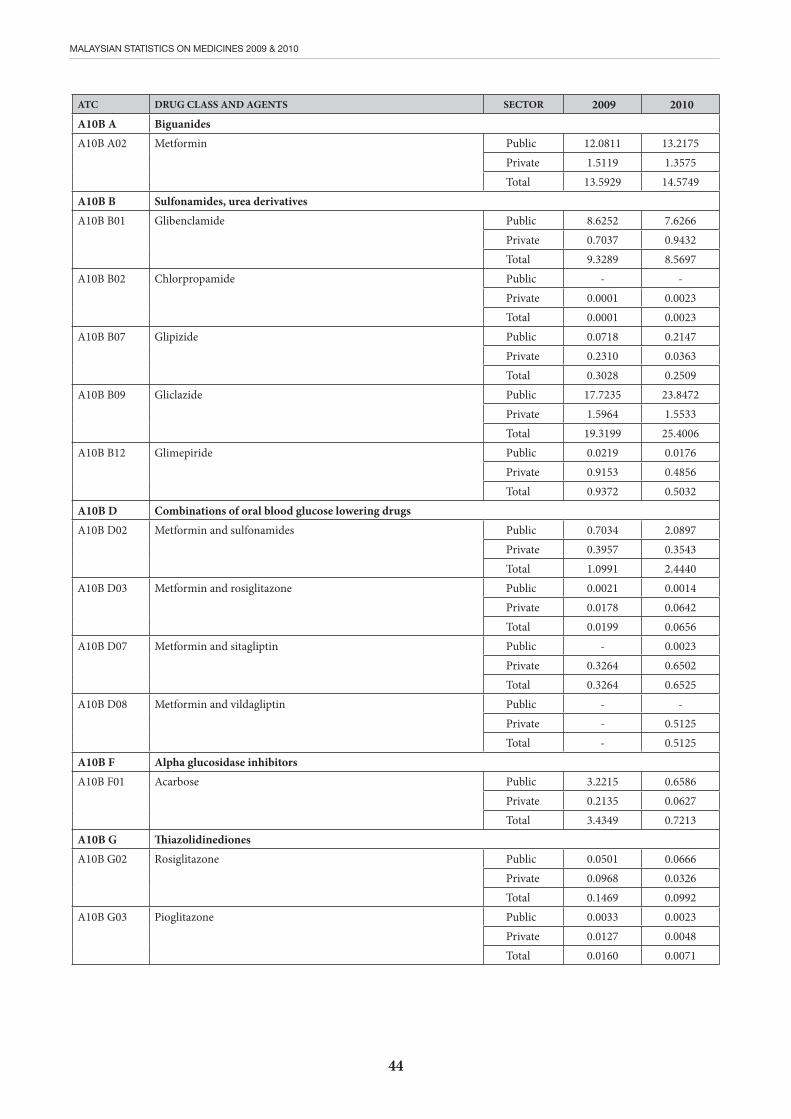
44
MALAYSIAN STATISTICS ON MEDICINES 2009 & 2010
ATC DRUG CLASS AND AGENTS SECTOR 2009 2010A10B A BiguanidesA10B A02
Metformin Public 12.0811 13.2175Private 1.5119 1.3575Total 13.5929 14.5749
A10B B Sulfonamides, urea derivativesA10B B01
Glibenclamide Public 8.6252 7.6266Private 0.7037 0.9432Total 9.3289 8.5697
A10B B02
Chlorpropamide Public - -Private 0.0001 0.0023Total 0.0001 0.0023
A10B B07
Glipizide Public 0.0718 0.2147Private 0.2310 0.0363Total 0.3028 0.2509
A10B B09
Gliclazide Public 17.7235 23.8472Private 1.5964 1.5533Total 19.3199 25.4006
A10B B12
Glimepiride Public 0.0219 0.0176Private 0.9153 0.4856Total 0.9372 0.5032
A10B D Combinations of oral blood glucose lowering drugsA10B D02
Metformin and sulfonamides Public 0.7034 2.0897Private 0.3957 0.3543Total 1.0991 2.4440
A10B D03
Metformin and rosiglitazone Public 0.0021 0.0014Private 0.0178 0.0642Total 0.0199 0.0656
A10B D07
Metformin and sitagliptin Public - 0.0023Private 0.3264 0.6502Total 0.3264 0.6525
A10B D08
Metformin and vildagliptin Public - -Private - 0.5125Total - 0.5125
A10B F Alpha glucosidase inhibitorsA10B F01
Acarbose Public 3.2215 0.6586Private 0.2135 0.0627Total 3.4349 0.7213
A10B G ThiazolidinedionesA10B G02
Rosiglitazone Public 0.0501 0.0666Private 0.0968 0.0326Total 0.1469 0.0992
A10B G03
Pioglitazone Public 0.0033 0.0023Private 0.0127 0.0048Total 0.0160 0.0071

45
MALAYSIAN STATISTICS ON MEDICINES 2009 & 2010
ATC DRUG CLASS AND AGENTS SECTOR 2009 2010
A10B H Dipeptidyl peptidase 4 (DPP-4) inhibitorsA10B H01
Sitagliptin Public 0.0038 0.0229Private 0.2198 0.4297Total 0.2236 0.4527
A10B H02
Vildagliptin Public - <0.0001Private - 0.0028Total - 0.0028
A10B X Other blood glucose lowering drugs, excl. Insulins A10B X02
Repaglinide Public 0.1237 0.0078Private 0.0578 0.0030Total 0.1815 0.0107
A10B X03
Nateglinide Public <0.0001 <0.0001Private 0.0082 0.0006Total 0.0083 0.0006
A10B X04
Exenatide Public 0.0002 0.0001Private 0.0006 0.0008Total 0.0009 0.0009
A10B X06
Benfluorex Public - -Private 0.0204 0.0024Total 0.0204 0.0024
References:1. Malaysian Statistics on Medicines 2008; Pharmaceutical Services Division & Clinical Research Centre, Ministry of
Health Malaysia Printing Office: Kuala Lumpur 2013.
2. Australian Statistics on Medicines 2010; Australian Drug Utilization Subcommittee Secretariat, Pharmaceutical Benefits Advisory Committee Printing Office: Australia 2012.
3. Consumption in the Nordic Countries 2004-2008; Nordic Medico Statistical Committee, Medicines Printing Office: Copenhagen 2009.
4. Guidelines for ATC Classification and DDD Assignment 2012; WHO Collaborating Centre for Drug Statistics Methodology Printing Office: Oslo December 2012.
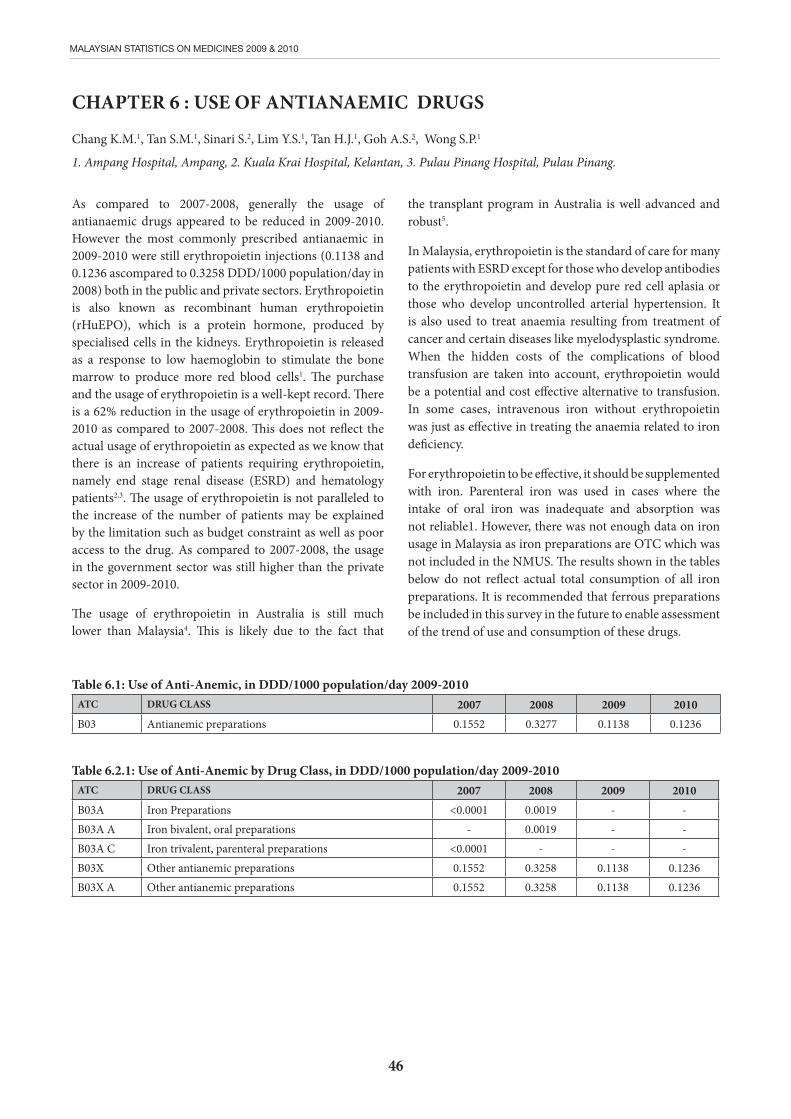
46
MALAYSIAN STATISTICS ON MEDICINES 2009 & 2010
CHAPTER 6 : USE OF ANTIANAEMIC DRUGS
Chang K.M.1, Tan S.M.1, Sinari S.2, Lim Y.S.1, Tan H.J.1, Goh A.S.3, Wong S.P.1
1. Ampang Hospital, Ampang, 2. Kuala Krai Hospital, Kelantan, 3. Pulau Pinang Hospital, Pulau Pinang.
Table 6.1: Use of Anti-Anemic, in DDD/1000 population/day 2009-2010 ATC DRUG CLASS 2007 2008 2009 2010B03 Antianemic preparations 0.1552 0.3277 0.1138 0.1236
Table 6.2.1: Use of Anti-Anemic by Drug Class, in DDD/1000 population/day 2009-2010ATC DRUG CLASS 2007 2008 2009 2010B03A Iron Preparations <0.0001 0.0019 - -B03A A Iron bivalent, oral preparations - 0.0019 - -B03A C Iron trivalent, parenteral preparations <0.0001 - - -B03X Other antianemic preparations 0.1552 0.3258 0.1138 0.1236B03X A Other antianemic preparations 0.1552 0.3258 0.1138 0.1236
As compared to 2007-2008, generally the usage of antianaemic drugs appeared to be reduced in 2009-2010. However the most commonly prescribed antianaemic in 2009-2010 were still erythropoietin injections (0.1138 and 0.1236 ascompared to 0.3258 DDD/1000 population/day in 2008) both in the public and private sectors. Erythropoietin is also known as recombinant human erythropoietin (rHuEPO), which is a protein hormone, produced by specialised cells in the kidneys. Erythropoietin is released as a response to low haemoglobin to stimulate the bone marrow to produce more red blood cells1. The purchase and the usage of erythropoietin is a well-kept record. There is a 62% reduction in the usage of erythropoietin in 2009-2010 as compared to 2007-2008. This does not reflect the actual usage of erythropoietin as expected as we know that there is an increase of patients requiring erythropoietin, namely end stage renal disease (ESRD) and hematology patients2,3. The usage of erythropoietin is not paralleled to the increase of the number of patients may be explained by the limitation such as budget constraint as well as poor access to the drug. As compared to 2007-2008, the usage in the government sector was still higher than the private sector in 2009-2010.
The usage of erythropoietin in Australia is still much lower than Malaysia4. This is likely due to the fact that
the transplant program in Australia is well advanced and robust5.
In Malaysia, erythropoietin is the standard of care for many patients with ESRD except for those who develop antibodies to the erythropoietin and develop pure red cell aplasia or those who develop uncontrolled arterial hypertension. It is also used to treat anaemia resulting from treatment of cancer and certain diseases like myelodysplastic syndrome. When the hidden costs of the complications of blood transfusion are taken into account, erythropoietin would be a potential and cost effective alternative to transfusion. In some cases, intravenous iron without erythropoietin was just as effective in treating the anaemia related to iron deficiency.
For erythropoietin to be effective, it should be supplemented with iron. Parenteral iron was used in cases where the intake of oral iron was inadequate and absorption was not reliable1. However, there was not enough data on iron usage in Malaysia as iron preparations are OTC which was not included in the NMUS. The results shown in the tables below do not reflect actual total consumption of all iron preparations. It is recommended that ferrous preparations be included in this survey in the future to enable assessment of the trend of use and consumption of these drugs.
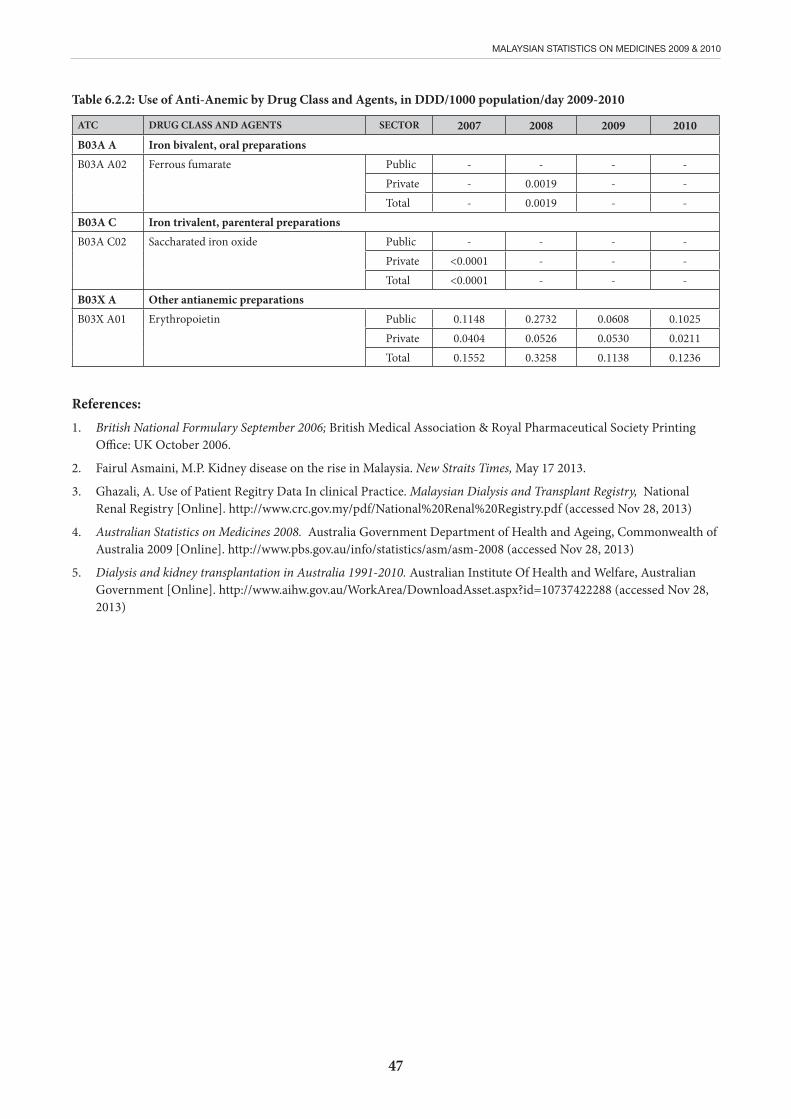
47
MALAYSIAN STATISTICS ON MEDICINES 2009 & 2010
Table 6.2.2: Use of Anti-Anemic by Drug Class and Agents, in DDD/1000 population/day 2009-2010
ATC DRUG CLASS AND AGENTS SECTOR 2007 2008 2009 2010B03A A Iron bivalent, oral preparationsB03A A02 Ferrous fumarate Public - - - -
Private - 0.0019 - -Total - 0.0019 - -
B03A C Iron trivalent, parenteral preparationsB03A C02 Saccharated iron oxide Public - - - -
Private <0.0001 - - -Total <0.0001 - - -
B03X A Other antianemic preparationsB03X A01 Erythropoietin Public 0.1148 0.2732 0.0608 0.1025
Private 0.0404 0.0526 0.0530 0.0211Total 0.1552 0.3258 0.1138 0.1236
References:1. British National Formulary September 2006; British Medical Association & Royal Pharmaceutical Society Printing
Office: UK October 2006.
2. Fairul Asmaini, M.P. Kidney disease on the rise in Malaysia. New Straits Times, May 17 2013.
3. Ghazali, A. Use of Patient Regitry Data In clinical Practice. Malaysian Dialysis and Transplant Registry, National Renal Registry [Online]. http://www.crc.gov.my/pdf/National%20Renal%20Registry.pdf (accessed Nov 28, 2013)
4. Australian Statistics on Medicines 2008. Australia Government Department of Health and Ageing, Commonwealth of Australia 2009 [Online]. http://www.pbs.gov.au/info/statistics/asm/asm-2008 (accessed Nov 28, 2013)
5. Dialysis and kidney transplantation in Australia 1991-2010. Australian Institute Of Health and Welfare, Australian Government [Online]. http://www.aihw.gov.au/WorkArea/DownloadAsset.aspx?id=10737422288 (accessed Nov 28, 2013)
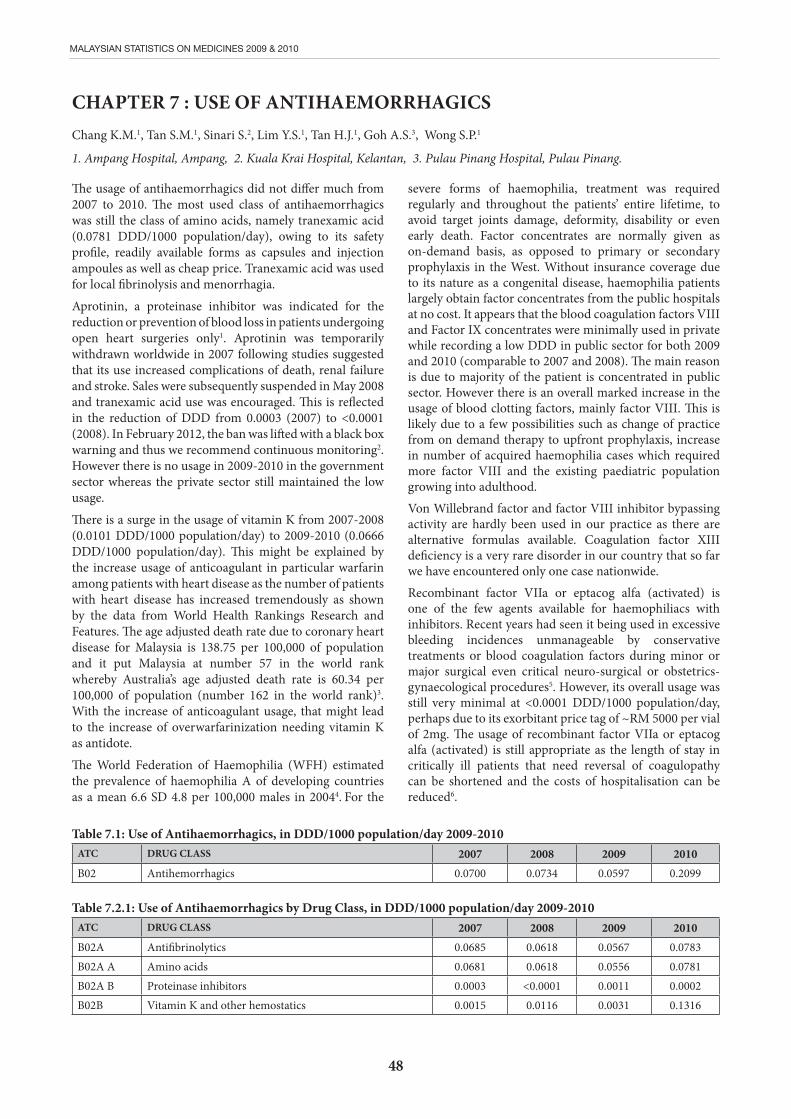
48
MALAYSIAN STATISTICS ON MEDICINES 2009 & 2010
CHAPTER 7 : USE OF ANTIHAEMORRHAGICSChang K.M.1, Tan S.M.1, Sinari S.2, Lim Y.S.1, Tan H.J.1, Goh A.S.3, Wong S.P.1
1. Ampang Hospital, Ampang, 2. Kuala Krai Hospital, Kelantan, 3. Pulau Pinang Hospital, Pulau Pinang.
The usage of antihaemorrhagics did not differ much from 2007 to 2010. The most used class of antihaemorrhagics was still the class of amino acids, namely tranexamic acid (0.0781 DDD/1000 population/day), owing to its safety profile, readily available forms as capsules and injection ampoules as well as cheap price. Tranexamic acid was used for local fibrinolysis and menorrhagia.
Aprotinin, a proteinase inhibitor was indicated for the reduction or prevention of blood loss in patients undergoing open heart surgeries only1. Aprotinin was temporarily withdrawn worldwide in 2007 following studies suggested that its use increased complications of death, renal failure and stroke. Sales were subsequently suspended in May 2008 and tranexamic acid use was encouraged. This is reflected in the reduction of DDD from 0.0003 (2007) to <0.0001 (2008). In February 2012, the ban was lifted with a black box warning and thus we recommend continuous monitoring2.However there is no usage in 2009-2010 in the government sector whereas the private sector still maintained the low usage.
There is a surge in the usage of vitamin K from 2007-2008 (0.0101 DDD/1000 population/day) to 2009-2010 (0.0666 DDD/1000 population/day). This might be explained by the increase usage of anticoagulant in particular warfarin among patients with heart disease as the number of patients with heart disease has increased tremendously as shown by the data from World Health Rankings Research and Features. The age adjusted death rate due to coronary heart disease for Malaysia is 138.75 per 100,000 of population and it put Malaysia at number 57 in the world rank whereby Australia’s age adjusted death rate is 60.34 per 100,000 of population (number 162 in the world rank)3. With the increase of anticoagulant usage, that might lead to the increase of overwarfarinization needing vitamin K as antidote.
The World Federation of Haemophilia (WFH) estimated the prevalence of haemophilia A of developing countries as a mean 6.6 SD 4.8 per 100,000 males in 20044. For the
severe forms of haemophilia, treatment was required regularly and throughout the patients’ entire lifetime, to avoid target joints damage, deformity, disability or even early death. Factor concentrates are normally given as on-demand basis, as opposed to primary or secondary prophylaxis in the West. Without insurance coverage due to its nature as a congenital disease, haemophilia patients largely obtain factor concentrates from the public hospitals at no cost. It appears that the blood coagulation factors VIII and Factor IX concentrates were minimally used in private while recording a low DDD in public sector for both 2009 and 2010 (comparable to 2007 and 2008). The main reason is due to majority of the patient is concentrated in public sector. However there is an overall marked increase in the usage of blood clotting factors, mainly factor VIII. This is likely due to a few possibilities such as change of practice from on demand therapy to upfront prophylaxis, increase in number of acquired haemophilia cases which required more factor VIII and the existing paediatric population growing into adulthood.
Von Willebrand factor and factor VIII inhibitor bypassing activity are hardly been used in our practice as there are alternative formulas available. Coagulation factor XIII deficiency is a very rare disorder in our country that so far we have encountered only one case nationwide.
Recombinant factor VIIa or eptacog alfa (activated) is one of the few agents available for haemophiliacs with inhibitors. Recent years had seen it being used in excessive bleeding incidences unmanageable by conservative treatments or blood coagulation factors during minor or major surgical even critical neuro-surgical or obstetrics-gynaecological procedures5. However, its overall usage was still very minimal at <0.0001 DDD/1000 population/day, perhaps due to its exorbitant price tag of ~RM 5000 per vial of 2mg. The usage of recombinant factor VIIa or eptacog alfa (activated) is still appropriate as the length of stay in critically ill patients that need reversal of coagulopathy can be shortened and the costs of hospitalisation can be reduced6.
Table 7.1: Use of Antihaemorrhagics, in DDD/1000 population/day 2009-2010 ATC DRUG CLASS 2007 2008 2009 2010B02 Antihemorrhagics 0.0700 0.0734 0.0597 0.2099
Table 7.2.1: Use of Antihaemorrhagics by Drug Class, in DDD/1000 population/day 2009-2010ATC DRUG CLASS 2007 2008 2009 2010B02A Antifibrinolytics 0.0685 0.0618 0.0567 0.0783B02A A Amino acids 0.0681 0.0618 0.0556 0.0781B02A B Proteinase inhibitors 0.0003 <0.0001 0.0011 0.0002B02B Vitamin K and other hemostatics 0.0015 0.0116 0.0031 0.1316
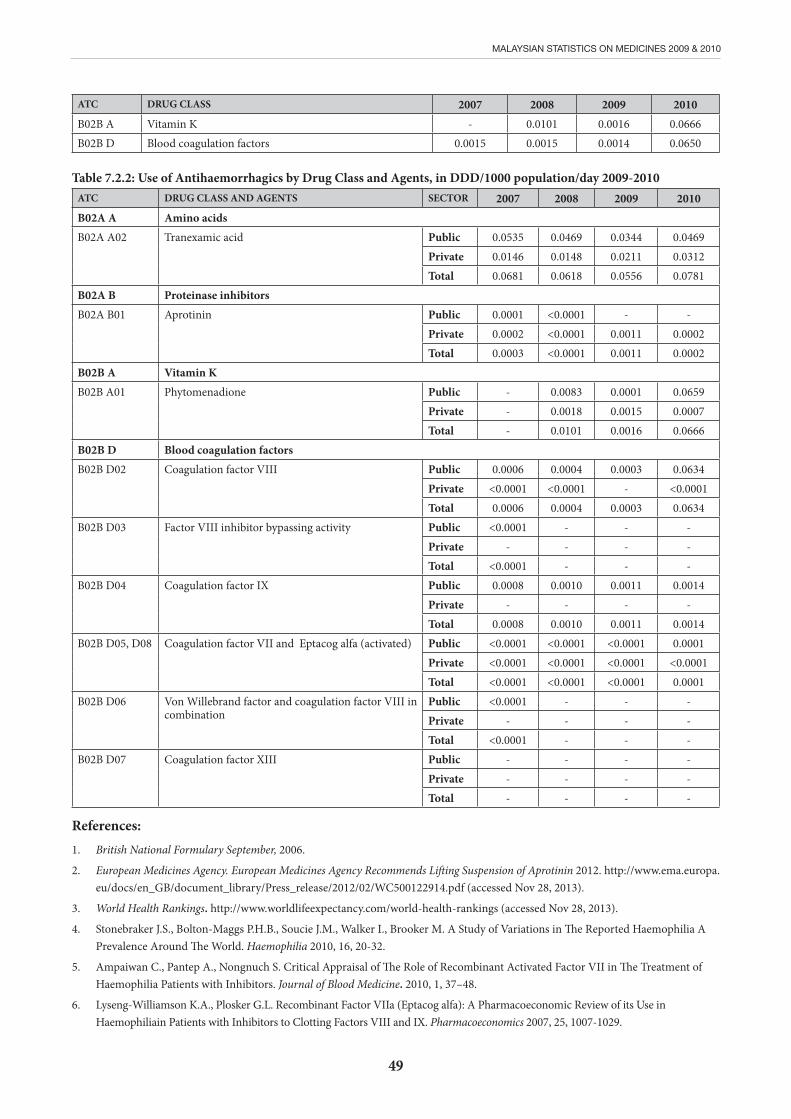
49
MALAYSIAN STATISTICS ON MEDICINES 2009 & 2010
ATC DRUG CLASS 2007 2008 2009 2010B02B A Vitamin K - 0.0101 0.0016 0.0666B02B D Blood coagulation factors 0.0015 0.0015 0.0014 0.0650
Table 7.2.2: Use of Antihaemorrhagics by Drug Class and Agents, in DDD/1000 population/day 2009-2010ATC DRUG CLASS AND AGENTS SECTOR 2007 2008 2009 2010B02A A Amino acidsB02A A02 Tranexamic acid Public 0.0535 0.0469 0.0344 0.0469
Private 0.0146 0.0148 0.0211 0.0312Total 0.0681 0.0618 0.0556 0.0781
B02A B Proteinase inhibitorsB02A B01 Aprotinin Public 0.0001 <0.0001 - -
Private 0.0002 <0.0001 0.0011 0.0002Total 0.0003 <0.0001 0.0011 0.0002
B02B A Vitamin KB02B A01 Phytomenadione Public - 0.0083 0.0001 0.0659
Private - 0.0018 0.0015 0.0007Total - 0.0101 0.0016 0.0666
B02B D Blood coagulation factorsB02B D02 Coagulation factor VIII Public 0.0006 0.0004 0.0003 0.0634
Private <0.0001 <0.0001 - <0.0001Total 0.0006 0.0004 0.0003 0.0634
B02B D03 Factor VIII inhibitor bypassing activity Public <0.0001 - - -Private - - - -Total <0.0001 - - -
B02B D04 Coagulation factor IX Public 0.0008 0.0010 0.0011 0.0014Private - - - -Total 0.0008 0.0010 0.0011 0.0014
B02B D05, D08 Coagulation factor VII and Eptacog alfa (activated) Public <0.0001 <0.0001 <0.0001 0.0001Private <0.0001 <0.0001 <0.0001 <0.0001Total <0.0001 <0.0001 <0.0001 0.0001
B02B D06 Von Willebrand factor and coagulation factor VIII in combination
Public <0.0001 - - -Private - - - -Total <0.0001 - - -
B02B D07 Coagulation factor XIII Public - - - -Private - - - -Total - - - -
References:1. British National Formulary September, 2006.
2. European Medicines Agency. European Medicines Agency Recommends Lifting Suspension of Aprotinin 2012. http://www.ema.europa.eu/docs/en_GB/document_library/Press_release/2012/02/WC500122914.pdf (accessed Nov 28, 2013).
3. World Health Rankings. http://www.worldlifeexpectancy.com/world-health-rankings (accessed Nov 28, 2013).
4. Stonebraker J.S., Bolton-Maggs P.H.B., Soucie J.M., Walker I., Brooker M. A Study of Variations in The Reported Haemophilia A Prevalence Around The World. Haemophilia 2010, 16, 20-32.
5. Ampaiwan C., Pantep A., Nongnuch S. Critical Appraisal of The Role of Recombinant Activated Factor VII in The Treatment of Haemophilia Patients with Inhibitors. Journal of Blood Medicine. 2010, 1, 37–48.
6. Lyseng-Williamson K.A., Plosker G.L. Recombinant Factor VIIa (Eptacog alfa): A Pharmacoeconomic Review of its Use in Haemophiliain Patients with Inhibitors to Clotting Factors VIII and IX. Pharmacoeconomics 2007, 25, 1007-1029.

50
MALAYSIAN STATISTICS ON MEDICINES 2009 & 2010
CHAPTER 8 : USE OF DRUGS FOR CARDIOVASCULAR DISORDERS
Fong A.Y.Y.1, Zoriah A.2, Omar I.3, Amin A.N.4, Lim C.T.Y.5, Feisul Idzwan M.6
1. Sarawak General Hospital 2. Faculty of Medicine, University of Malaya 3. Penang Hospital 4. National Heart Institute 5. Hospital Tengku Ampuan Rahimah, Klang 6. Disease Control Division, Ministry of Health Malaysia
This chapter presents information on the use of antithrombotic agents (B01) and drugs for cardiovascular disorders excluding antihypertensive (C02) and lipid modifying agents (C10) for the year 2009 and 2010.
Drugs used in management of cardiovascular disease (CVD) remain frequently prescribed in Malaysia. In 2009 and 2010, there was predominant usage of evidence based drugs, in part due to the rising prevalence of cardiovascular risk factors and improved access of patients with CVD to healthcare facilities1-2.
Listed in Table 8.1 are the DDD/1000 population/day for antithrombotic agents and drugs for cardiovascular disorders by therapeutic subgroups. Overall in 2010 compared to data from previous year, there was little change in the use of antithrombotic agents (down by 31.2%)
Antithrombotic drugs are commonly prescribed in 2009 and 2010, with an overall DDD/1000 population/day of 10.1730 & 10.7483 respectively. Within this group, aspirin (acetylsalicyclic acid) was the commonly used, with a rising DDD/1000 population/day of 6.5070 in 2009, 7.4262 in 2010, with the rise primarily being accounted for at the public centres. Thus, aspirin remained the most widely used agent in 2010 constituting more than69% of the total use of all antithrombotic agents.
Among oral anti-thrombotic drugs, clopidogrel was most commonly prescribed, followed by ticlopidine – 0.8680 vs 0.6240. It was noted that clopidogrel use fell in 2010 compared to previous year. However, its use was substantially higher in the private compared to public centres – 0.6390 vs 0.2290, in 2010; while the opposite was true for ticlopidine – 0.0590 vs 0.5640 in private compared to public centres. While the reduction in the use of clopidogrel could be associated with the shift from use of Drug Eluting Stents (DES) to the bare-metal stents in 2007-2008 periods, the perceived problem with stents has now been resolved with the introduction of newer third generation’s stents. Since parsugrel was only introduced in June 2010, it was unlikely that the decrease use of clopidogrel in 2010 could be attributed to the intoduction of parsugrel even though it has been noted that therapy with parsugrel has been associated with significantly reduced rates of ischemic events, including stent thrombosis3.
Table 8.2.1 shows that of all types of antithrombotic agents, over the one-year period the use of heparin group (BO1AB) decreased considerably by 2.8 fold predominantly in the
private sector. The use of alternatives such as enoxaparin (0.0972 in 2009, 0.1128 in 2010) and fondaparinux (0.0043 in 2009, 0.0153 in 2010) remained relatively low, and we were therefore unable to completely explain the drop in Heparin usage. It is reassuring to note the overall slight increase in the use of subcutaneous enoxaparin which offer several advantages over unfractionated heparin (UFH). The use of UFH during percutaneous coronary intervention is limited by its unpredictable effect, risk of infection, the need for close monitoring, and the uncertainty around optimal levels of activated clotting time4-6.
Warfarin use in 2009 and 2010 was significant in Malaysia, and the amount reduced from year 2009 to 2010: 0.7340 to 0.3599, respectively. Among thrombolytics/fibrinolytics, the most commonly used was Streptokinase, and predominantly used in the public centres compared to private centres (0.0007 vs 0.0004, in 2009; 0.0008 vs <0.0001, in 2010). The use of other injectable antithrombotics remained low over the 2009 to 2010 period (<0.0001).
The established cardiac glycoside digoxin remained commonly used in Malaysia, being indicated for use in both heart failure and arrhythmias, with a DDD/1000 population/day of 3.9566 in 2009 and 0.4037 in 2010. Other commonly prescribed antiarrhythmics were amiodarone and flecainide. Amiodarone use was 0.0740 in 2009 and 0.0690 in 2010, while flecainide was 0.0092 in 2009 and 0.0133 in 2010. Both these drugs were used more commonly in private compared to public centres.
For adrenergic and dopaminergic agents, with the exception of ephedrine, the use of these drugs remained low and were consistent between 2009 and 2010. The use of ephedrine increased from 0.0027 in 2009 to 0.0102 in 2010, most likely due to its use for non-cardiac indications.
The use of oral nitrates revealed interesting findings, with the shorter acting isosorbide dinitrate demonstrating a higher usage compared to the longer acting isosorbide mononitrate version. The DDD/1000 population/day for the former was 1.0276 and 1.1204 in 2009 and 2010 respectively; while for the latter, 0.4313 and 0.4615, in 2009 and 2010 respectively. The majority of the dinitrate was prescribed in the public sector, while the mononitrate in the private sector. The anti-ischaemic compound trimetazidine was commonly prescribed in Malaysia, with a DDD/1000 population/day of 5.1812 in 2009, and 1.2401 in 2010, respectively, and with more the twice the use seen in the public sector compared
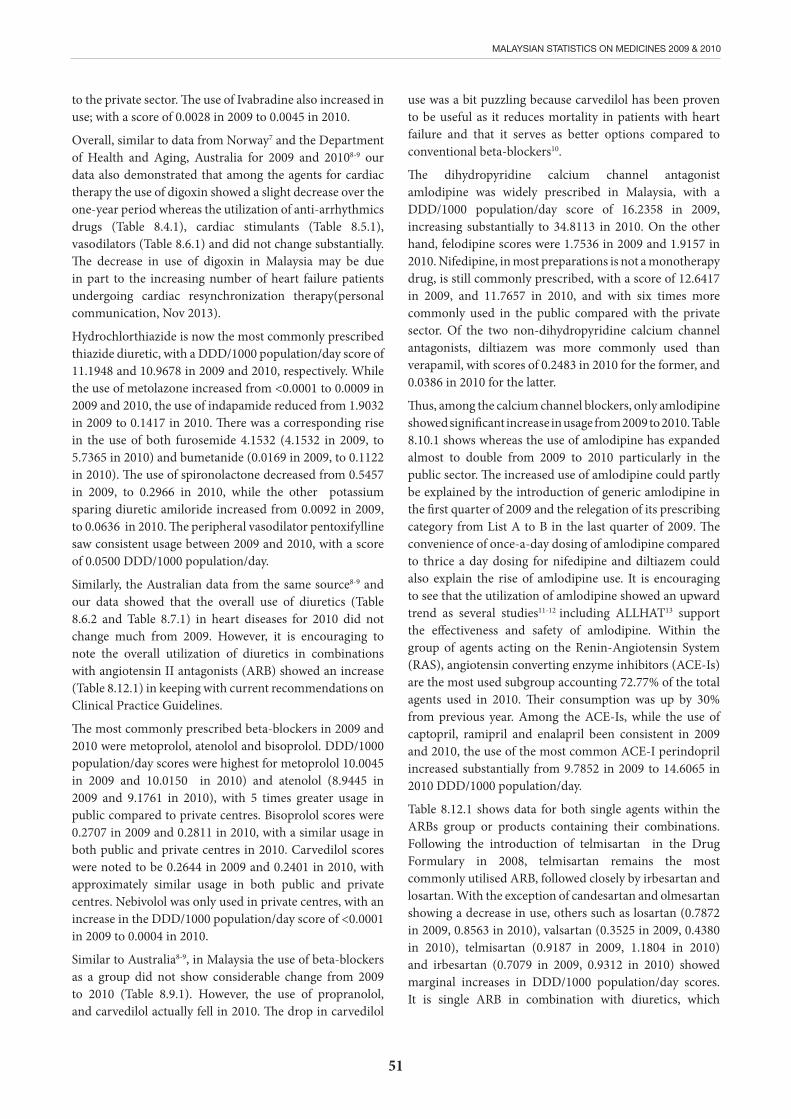
51
MALAYSIAN STATISTICS ON MEDICINES 2009 & 2010
to the private sector. The use of Ivabradine also increased in use; with a score of 0.0028 in 2009 to 0.0045 in 2010.
Overall, similar to data from Norway7 and the Department of Health and Aging, Australia for 2009 and 20108-9 our data also demonstrated that among the agents for cardiac therapy the use of digoxin showed a slight decrease over the one-year period whereas the utilization of anti-arrhythmics drugs (Table 8.4.1), cardiac stimulants (Table 8.5.1), vasodilators (Table 8.6.1) and did not change substantially. The decrease in use of digoxin in Malaysia may be due in part to the increasing number of heart failure patients undergoing cardiac resynchronization therapy(personal communication, Nov 2013).
Hydrochlorthiazide is now the most commonly prescribed thiazide diuretic, with a DDD/1000 population/day score of 11.1948 and 10.9678 in 2009 and 2010, respectively. While the use of metolazone increased from <0.0001 to 0.0009 in 2009 and 2010, the use of indapamide reduced from 1.9032 in 2009 to 0.1417 in 2010. There was a corresponding rise in the use of both furosemide 4.1532 (4.1532 in 2009, to 5.7365 in 2010) and bumetanide (0.0169 in 2009, to 0.1122 in 2010). The use of spironolactone decreased from 0.5457 in 2009, to 0.2966 in 2010, while the other potassium sparing diuretic amiloride increased from 0.0092 in 2009, to 0.0636 in 2010. The peripheral vasodilator pentoxifylline saw consistent usage between 2009 and 2010, with a score of 0.0500 DDD/1000 population/day.
Similarly, the Australian data from the same source8-9 and our data showed that the overall use of diuretics (Table 8.6.2 and Table 8.7.1) in heart diseases for 2010 did not change much from 2009. However, it is encouraging to note the overall utilization of diuretics in combinations with angiotensin II antagonists (ARB) showed an increase (Table 8.12.1) in keeping with current recommendations on Clinical Practice Guidelines.
The most commonly prescribed beta-blockers in 2009 and 2010 were metoprolol, atenolol and bisoprolol. DDD/1000 population/day scores were highest for metoprolol 10.0045 in 2009 and 10.0150 in 2010) and atenolol (8.9445 in 2009 and 9.1761 in 2010), with 5 times greater usage in public compared to private centres. Bisoprolol scores were 0.2707 in 2009 and 0.2811 in 2010, with a similar usage in both public and private centres in 2010. Carvedilol scores were noted to be 0.2644 in 2009 and 0.2401 in 2010, with approximately similar usage in both public and private centres. Nebivolol was only used in private centres, with an increase in the DDD/1000 population/day score of <0.0001 in 2009 to 0.0004 in 2010.
Similar to Australia8-9, in Malaysia the use of beta-blockers as a group did not show considerable change from 2009 to 2010 (Table 8.9.1). However, the use of propranolol, and carvedilol actually fell in 2010. The drop in carvedilol
use was a bit puzzling because carvedilol has been proven to be useful as it reduces mortality in patients with heart failure and that it serves as better options compared to conventional beta-blockers10.
The dihydropyridine calcium channel antagonist amlodipine was widely prescribed in Malaysia, with a DDD/1000 population/day score of 16.2358 in 2009, increasing substantially to 34.8113 in 2010. On the other hand, felodipine scores were 1.7536 in 2009 and 1.9157 in 2010. Nifedipine, in most preparations is not a monotherapy drug, is still commonly prescribed, with a score of 12.6417 in 2009, and 11.7657 in 2010, and with six times more commonly used in the public compared with the private sector. Of the two non-dihydropyridine calcium channel antagonists, diltiazem was more commonly used than verapamil, with scores of 0.2483 in 2010 for the former, and 0.0386 in 2010 for the latter.
Thus, among the calcium channel blockers, only amlodipine showed significant increase in usage from 2009 to 2010. Table 8.10.1 shows whereas the use of amlodipine has expanded almost to double from 2009 to 2010 particularly in the public sector. The increased use of amlodipine could partly be explained by the introduction of generic amlodipine in the first quarter of 2009 and the relegation of its prescribing category from List A to B in the last quarter of 2009. The convenience of once-a-day dosing of amlodipine compared to thrice a day dosing for nifedipine and diltiazem could also explain the rise of amlodipine use. It is encouraging to see that the utilization of amlodipine showed an upward trend as several studies11-12 including ALLHAT13 support the effectiveness and safety of amlodipine. Within the group of agents acting on the Renin-Angiotensin System (RAS), angiotensin converting enzyme inhibitors (ACE-Is) are the most used subgroup accounting 72.77% of the total agents used in 2010. Their consumption was up by 30% from previous year. Among the ACE-Is, while the use of captopril, ramipril and enalapril been consistent in 2009 and 2010, the use of the most common ACE-I perindopril increased substantially from 9.7852 in 2009 to 14.6065 in 2010 DDD/1000 population/day.
Table 8.12.1 shows data for both single agents within the ARBs group or products containing their combinations. Following the introduction of telmisartan in the Drug Formulary in 2008, telmisartan remains the most commonly utilised ARB, followed closely by irbesartan and losartan. With the exception of candesartan and olmesartan showing a decrease in use, others such as losartan (0.7872 in 2009, 0.8563 in 2010), valsartan (0.3525 in 2009, 0.4380 in 2010), telmisartan (0.9187 in 2009, 1.1804 in 2010) and irbesartan (0.7079 in 2009, 0.9312 in 2010) showed marginal increases in DDD/1000 population/day scores. It is single ARB in combination with diuretics, which
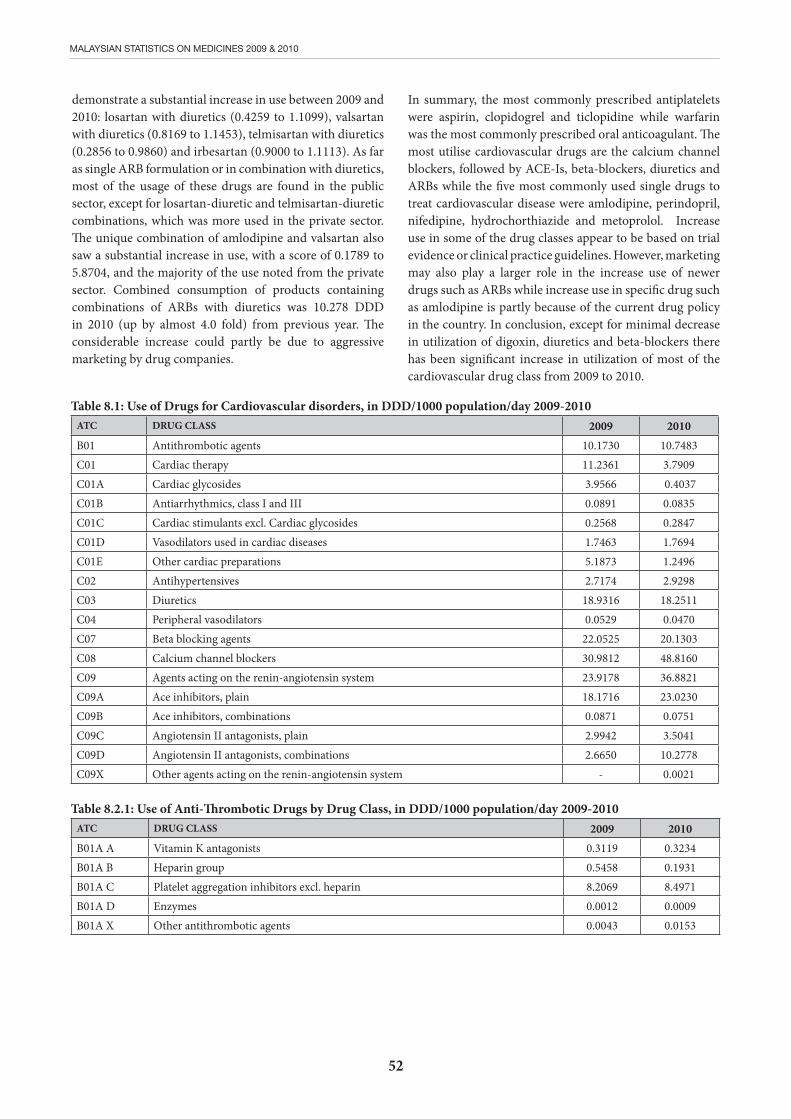
52
MALAYSIAN STATISTICS ON MEDICINES 2009 & 2010
demonstrate a substantial increase in use between 2009 and 2010: losartan with diuretics (0.4259 to 1.1099), valsartan with diuretics (0.8169 to 1.1453), telmisartan with diuretics (0.2856 to 0.9860) and irbesartan (0.9000 to 1.1113). As far as single ARB formulation or in combination with diuretics, most of the usage of these drugs are found in the public sector, except for losartan-diuretic and telmisartan-diuretic combinations, which was more used in the private sector. The unique combination of amlodipine and valsartan also saw a substantial increase in use, with a score of 0.1789 to 5.8704, and the majority of the use noted from the private sector. Combined consumption of products containing combinations of ARBs with diuretics was 10.278 DDD in 2010 (up by almost 4.0 fold) from previous year. The considerable increase could partly be due to aggressive marketing by drug companies.
In summary, the most commonly prescribed antiplatelets were aspirin, clopidogrel and ticlopidine while warfarin was the most commonly prescribed oral anticoagulant. The most utilise cardiovascular drugs are the calcium channel blockers, followed by ACE-Is, beta-blockers, diuretics and ARBs while the five most commonly used single drugs to treat cardiovascular disease were amlodipine, perindopril, nifedipine, hydrochorthiazide and metoprolol. Increase use in some of the drug classes appear to be based on trial evidence or clinical practice guidelines. However, marketing may also play a larger role in the increase use of newer drugs such as ARBs while increase use in specific drug such as amlodipine is partly because of the current drug policy in the country. In conclusion, except for minimal decrease in utilization of digoxin, diuretics and beta-blockers there has been significant increase in utilization of most of the cardiovascular drug class from 2009 to 2010.
Table 8.1: Use of Drugs for Cardiovascular disorders, in DDD/1000 population/day 2009-2010ATC DRUG CLASS 2009 2010B01 Antithrombotic agents 10.1730 10.7483C01 Cardiac therapy 11.2361 3.7909C01A Cardiac glycosides 3.9566 0.4037C01B Antiarrhythmics, class I and III 0.0891 0.0835C01C Cardiac stimulants excl. Cardiac glycosides 0.2568 0.2847C01D Vasodilators used in cardiac diseases 1.7463 1.7694C01E Other cardiac preparations 5.1873 1.2496C02 Antihypertensives 2.7174 2.9298C03 Diuretics 18.9316 18.2511C04 Peripheral vasodilators 0.0529 0.0470C07 Beta blocking agents 22.0525 20.1303C08 Calcium channel blockers 30.9812 48.8160C09 Agents acting on the renin-angiotensin system 23.9178 36.8821C09A Ace inhibitors, plain 18.1716 23.0230C09B Ace inhibitors, combinations 0.0871 0.0751C09C Angiotensin II antagonists, plain 2.9942 3.5041C09D Angiotensin II antagonists, combinations 2.6650 10.2778C09X Other agents acting on the renin-angiotensin system - 0.0021
Table 8.2.1: Use of Anti-Thrombotic Drugs by Drug Class, in DDD/1000 population/day 2009-2010ATC DRUG CLASS 2009 2010B01A A Vitamin K antagonists 0.3119 0.3234B01A B Heparin group 0.5458 0.1931B01A C Platelet aggregation inhibitors excl. heparin 8.2069 8.4971B01A D Enzymes 0.0012 0.0009B01A X Other antithrombotic agents 0.0043 0.0153
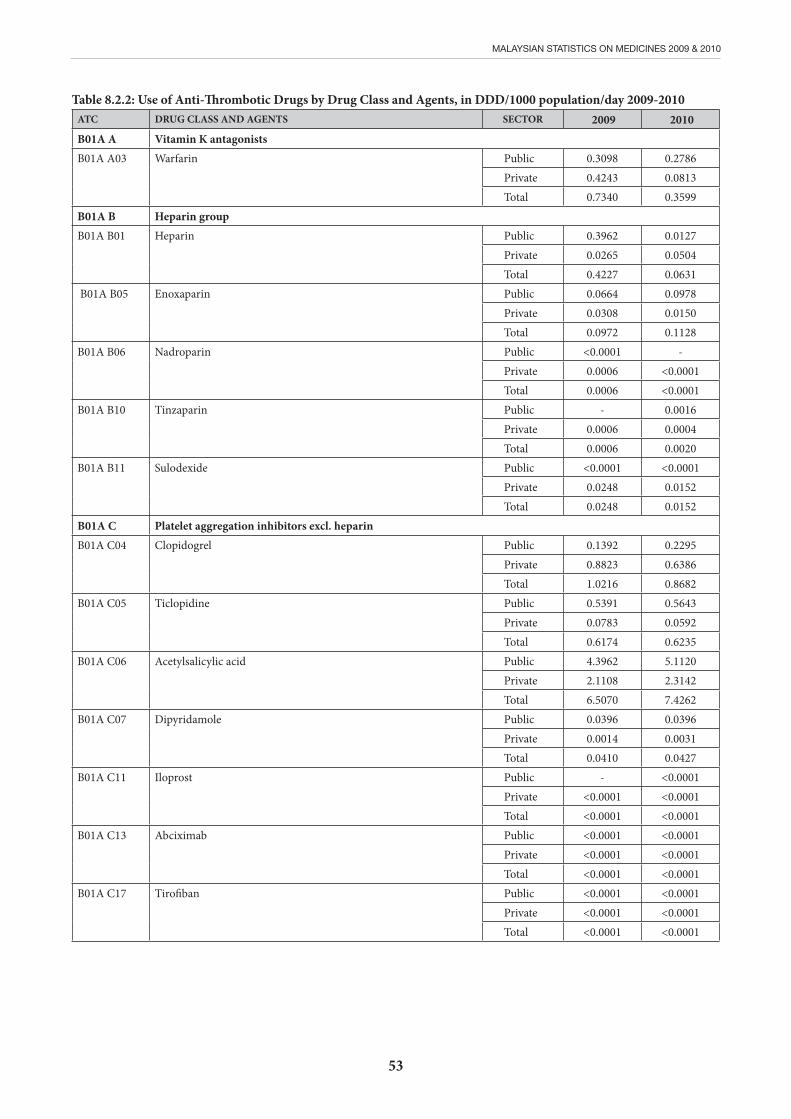
53
MALAYSIAN STATISTICS ON MEDICINES 2009 & 2010
Table 8.2.2: Use of Anti-Thrombotic Drugs by Drug Class and Agents, in DDD/1000 population/day 2009-2010ATC DRUG CLASS AND AGENTS SECTOR 2009 2010B01A A Vitamin K antagonistsB01A A03
Warfarin Public 0.3098 0.2786Private 0.4243 0.0813Total 0.7340 0.3599
B01A B Heparin groupB01A B01
Heparin Public 0.3962 0.0127Private 0.0265 0.0504Total 0.4227 0.0631
B01A B05
Enoxaparin Public 0.0664 0.0978Private 0.0308 0.0150Total 0.0972 0.1128
B01A B06
Nadroparin Public <0.0001 -Private 0.0006 <0.0001Total 0.0006 <0.0001
B01A B10 Tinzaparin Public - 0.0016Private 0.0006 0.0004Total 0.0006 0.0020
B01A B11
Sulodexide Public <0.0001 <0.0001Private 0.0248 0.0152Total 0.0248 0.0152
B01A C Platelet aggregation inhibitors excl. heparinB01A C04 Clopidogrel Public 0.1392 0.2295
Private 0.8823 0.6386Total 1.0216 0.8682
B01A C05
Ticlopidine Public 0.5391 0.5643Private 0.0783 0.0592Total 0.6174 0.6235
B01A C06
Acetylsalicylic acid Public 4.3962 5.1120Private 2.1108 2.3142Total 6.5070 7.4262
B01A C07
Dipyridamole Public 0.0396 0.0396Private 0.0014 0.0031Total 0.0410 0.0427
B01A C11
Iloprost Public - <0.0001Private <0.0001 <0.0001Total <0.0001 <0.0001
B01A C13
Abciximab Public <0.0001 <0.0001Private <0.0001 <0.0001Total <0.0001 <0.0001
B01A C17
Tirofiban Public <0.0001 <0.0001Private <0.0001 <0.0001Total <0.0001 <0.0001

54
MALAYSIAN STATISTICS ON MEDICINES 2009 & 2010
ATC DRUG CLASS AND AGENTS SECTOR 2009 2010B01A C18
Triflusal Public - -Private 0.0017 0.0006Total 0.0017 0.0006
B01A C23
Cilostazol Public 0.0002 -Private 0.0007 0.0055Total 0.0009 0.0055
B01A D EnzymesB01A D01
Streptokinase Public 0.0007 0.0008Private 0.0004 <0.0001Total 0.0011 0.0008
B01A D02
Alteplase Public <0.0001 <0.0001Private <0.0001 <0.0001Total <0.0001 <0.0001
B01A D04
Urokinase Public <0.0001 <0.0001Private <0.0001 <0.0001Total <0.0001 <0.0001
B01A D10
Drotrecogin alfa (activated) Public <0.0001 <0.0001Private - <0.0001Total <0.0001 <0.0001
B01A D11
Tenecteplase Public <0.0001 <0.0001Private <0.0001 <0.0001Total <0.0001 <0.0001
B01A X Other antithrombotic agentsB01A X05
Fondaparinux Public 0.0032 0.0140Private 0.0011 0.0014Total 0.0043 0.0153
Table 8.3.1: Use of Cardiac Glycosides by Drug Class and Agents, in DDD/1000 population/day 2009-2010ATC DRUG CLASS AND AGENTS SECTOR 2009 2010C01A Cardiac glycosidesC01A A05
Digoxin Public 2.4799 0.3328Private 1.4768 0.0709Total 3.9566 0.4037
Table 8.4.1: Use of Anti-Aryhtmics by Drug Class and Agents, in DDD/1000 population/day 2009-2010ATC DRUG CLASS AND AGENTS SECTOR 2009 2010C01B A Antiarrhythmics, class IaC01B A02
Procainamide Public - <0.0001Private - -Total - <0.0001
C01B B Antiarrhythmics, class IbC01B B01
Lidocaine Public 0.0042 <0.0001Private <0.0001 0.0001Total 0.0043 0.0002
C01B B02
Mexiletine Public -Private - -Total - -
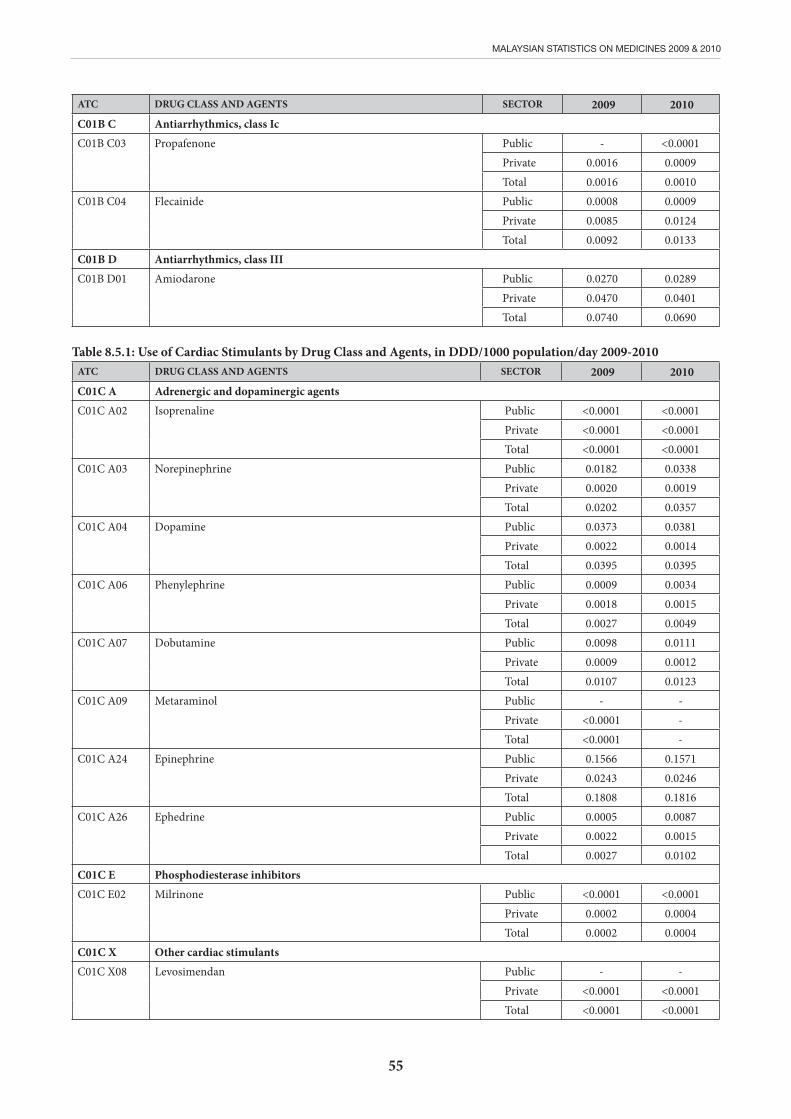
55
MALAYSIAN STATISTICS ON MEDICINES 2009 & 2010
ATC DRUG CLASS AND AGENTS SECTOR 2009 2010C01B C Antiarrhythmics, class IcC01B C03
Propafenone Public - <0.0001Private 0.0016 0.0009Total 0.0016 0.0010
C01B C04
Flecainide Public 0.0008 0.0009Private 0.0085 0.0124Total 0.0092 0.0133
C01B D Antiarrhythmics, class IIIC01B D01
Amiodarone Public 0.0270 0.0289Private 0.0470 0.0401Total 0.0740 0.0690
Table 8.5.1: Use of Cardiac Stimulants by Drug Class and Agents, in DDD/1000 population/day 2009-2010ATC DRUG CLASS AND AGENTS SECTOR 2009 2010C01C A Adrenergic and dopaminergic agentsC01C A02
Isoprenaline Public <0.0001 <0.0001Private <0.0001 <0.0001Total <0.0001 <0.0001
C01C A03
Norepinephrine Public 0.0182 0.0338Private 0.0020 0.0019Total 0.0202 0.0357
C01C A04
Dopamine Public 0.0373 0.0381Private 0.0022 0.0014Total 0.0395 0.0395
C01C A06
Phenylephrine Public 0.0009 0.0034Private 0.0018 0.0015Total 0.0027 0.0049
C01C A07
Dobutamine Public 0.0098 0.0111Private 0.0009 0.0012Total 0.0107 0.0123
C01C A09
Metaraminol Public - -Private <0.0001 -Total <0.0001 -
C01C A24
Epinephrine Public 0.1566 0.1571Private 0.0243 0.0246Total 0.1808 0.1816
C01C A26
Ephedrine Public 0.0005 0.0087Private 0.0022 0.0015Total 0.0027 0.0102
C01C E Phosphodiesterase inhibitorsC01C E02
Milrinone Public <0.0001 <0.0001Private 0.0002 0.0004Total 0.0002 0.0004
C01C X Other cardiac stimulants C01C X08
Levosimendan Public - -Private <0.0001 <0.0001Total <0.0001 <0.0001
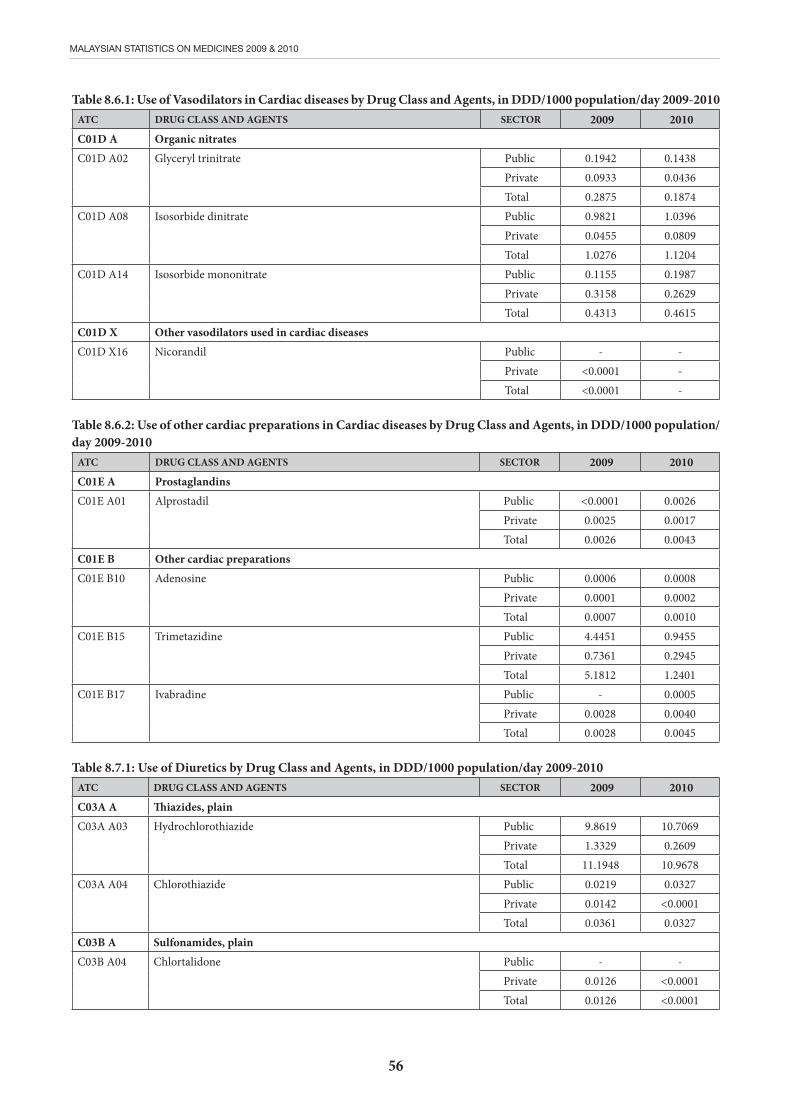
56
MALAYSIAN STATISTICS ON MEDICINES 2009 & 2010
Table 8.6.1: Use of Vasodilators in Cardiac diseases by Drug Class and Agents, in DDD/1000 population/day 2009-2010ATC DRUG CLASS AND AGENTS SECTOR 2009 2010C01D A Organic nitratesC01D A02
Glyceryl trinitrate Public 0.1942 0.1438Private 0.0933 0.0436Total 0.2875 0.1874
C01D A08
Isosorbide dinitrate Public 0.9821 1.0396Private 0.0455 0.0809Total 1.0276 1.1204
C01D A14
Isosorbide mononitrate Public 0.1155 0.1987Private 0.3158 0.2629Total 0.4313 0.4615
C01D X Other vasodilators used in cardiac diseasesC01D X16
Nicorandil Public - -Private <0.0001 -Total <0.0001 -
Table 8.6.2: Use of other cardiac preparations in Cardiac diseases by Drug Class and Agents, in DDD/1000 population/day 2009-2010
ATC DRUG CLASS AND AGENTS SECTOR 2009 2010C01E A ProstaglandinsC01E A01
Alprostadil Public <0.0001 0.0026Private 0.0025 0.0017Total 0.0026 0.0043
C01E B Other cardiac preparationsC01E B10
Adenosine Public 0.0006 0.0008Private 0.0001 0.0002Total 0.0007 0.0010
C01E B15
Trimetazidine Public 4.4451 0.9455Private 0.7361 0.2945Total 5.1812 1.2401
C01E B17
Ivabradine Public - 0.0005Private 0.0028 0.0040Total 0.0028 0.0045
Table 8.7.1: Use of Diuretics by Drug Class and Agents, in DDD/1000 population/day 2009-2010ATC DRUG CLASS AND AGENTS SECTOR 2009 2010C03A A Thiazides, plainC03A A03
Hydrochlorothiazide Public 9.8619 10.7069Private 1.3329 0.2609Total 11.1948 10.9678
C03A A04
Chlorothiazide Public 0.0219 0.0327Private 0.0142 <0.0001Total 0.0361 0.0327
C03B A Sulfonamides, plainC03B A04
Chlortalidone Public - -Private 0.0126 <0.0001Total 0.0126 <0.0001

57
MALAYSIAN STATISTICS ON MEDICINES 2009 & 2010
ATC DRUG CLASS AND AGENTS SECTOR 2009 2010C03B A08
Metolazone Public <0.0001 0.0005Private - 0.0004Total <0.0001 0.0009
C03B A11
Indapamide Public 0.0194 0.0237Private 1.8839 0.1180Total 1.9032 0.1417
C03C A Sulfonamides, plainC03C A01
Furosemide Public 3.5828 4.9055Private 0.5704 0.8310Total 4.1532 5.7365
C03C A02
Bumetanide Public 0.0083 0.0033Private 0.0085 0.1089Total 0.0169 0.1122
C03D A Aldosterone antagonistsC03D A01
Spironolactone Public 0.2255 0.2376Private 0.3202 0.0589Total 0.5457 0.2966
C03D A04
Eplerenone Public <0.0001 <0.0001Private - 0.0002Total <0.0001 0.0003
C03D B Other potassium-sparing agentsC03D B01
Amiloride Public - 0.0623Private 0.0092 0.0013Total 0.0092 0.0636
C03E A Low-ceiling diuretics and potassium-sparing agentsC03E A01
Hydrochlorothiazide and potassium-sparing agents Public 0.9291 0.8063Private 0.1308 0.0925Total 1.0599 0.8988
Table 8.8.1: Use of Peripheral Vasodilators by Drugs Class and Agents, in DDD/1000 population/day 2009-2010ATC DRUG CLASS AND AGENTS SECTOR 2009 2010
C04A C01
Nicotinic acid Public - -Private - 0.0005Total - 0.0005
C04A D03
Pentoxifylline Public 0.0305 0.0338Private 0.0210 0.0118Total 0.0515 0.0457
C04A E01
Ergoloid mesylates Public - -Private 0.0013 0.0008Total 0.0013 0.0008
C04A X02
Phenoxybenzamine Public <0.0001 <0.0001Private <0.0001 <0.0001Total <0.0001 <0.0001
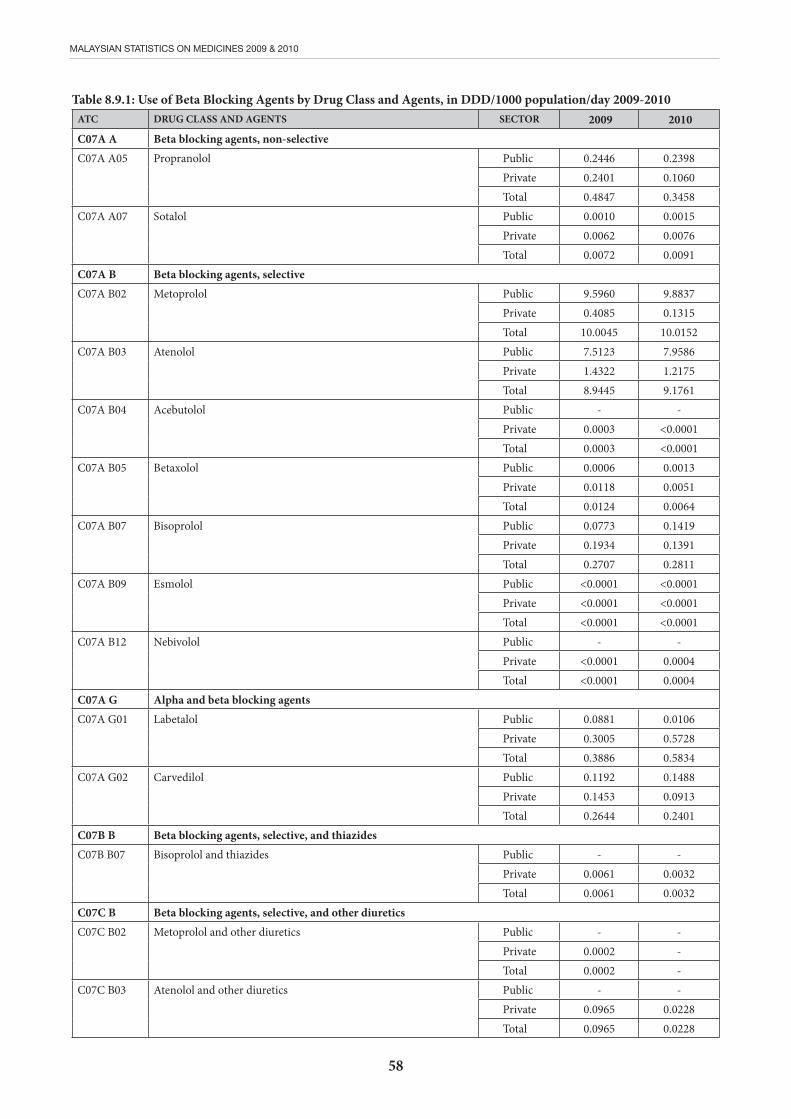
58
MALAYSIAN STATISTICS ON MEDICINES 2009 & 2010
Table 8.9.1: Use of Beta Blocking Agents by Drug Class and Agents, in DDD/1000 population/day 2009-2010ATC DRUG CLASS AND AGENTS SECTOR 2009 2010C07A A Beta blocking agents, non-selectiveC07A A05
Propranolol Public 0.2446 0.2398Private 0.2401 0.1060Total 0.4847 0.3458
C07A A07
Sotalol Public 0.0010 0.0015Private 0.0062 0.0076Total 0.0072 0.0091
C07A B Beta blocking agents, selectiveC07A B02
Metoprolol Public 9.5960 9.8837Private 0.4085 0.1315Total 10.0045 10.0152
C07A B03
Atenolol Public 7.5123 7.9586Private 1.4322 1.2175Total 8.9445 9.1761
C07A B04
Acebutolol Public - -Private 0.0003 <0.0001Total 0.0003 <0.0001
C07A B05
Betaxolol Public 0.0006 0.0013Private 0.0118 0.0051Total 0.0124 0.0064
C07A B07
Bisoprolol Public 0.0773 0.1419Private 0.1934 0.1391Total 0.2707 0.2811
C07A B09
Esmolol Public <0.0001 <0.0001Private <0.0001 <0.0001Total <0.0001 <0.0001
C07A B12
Nebivolol Public - -Private <0.0001 0.0004Total <0.0001 0.0004
C07A G Alpha and beta blocking agentsC07A G01
Labetalol Public 0.0881 0.0106Private 0.3005 0.5728Total 0.3886 0.5834
C07A G02
Carvedilol Public 0.1192 0.1488Private 0.1453 0.0913Total 0.2644 0.2401
C07B B Beta blocking agents, selective, and thiazidesC07B B07
Bisoprolol and thiazides Public - -Private 0.0061 0.0032Total 0.0061 0.0032
C07C B Beta blocking agents, selective, and other diureticsC07C B02
Metoprolol and other diuretics Public - -Private 0.0002 -Total 0.0002 -
C07C B03
Atenolol and other diuretics Public - -Private 0.0965 0.0228Total 0.0965 0.0228
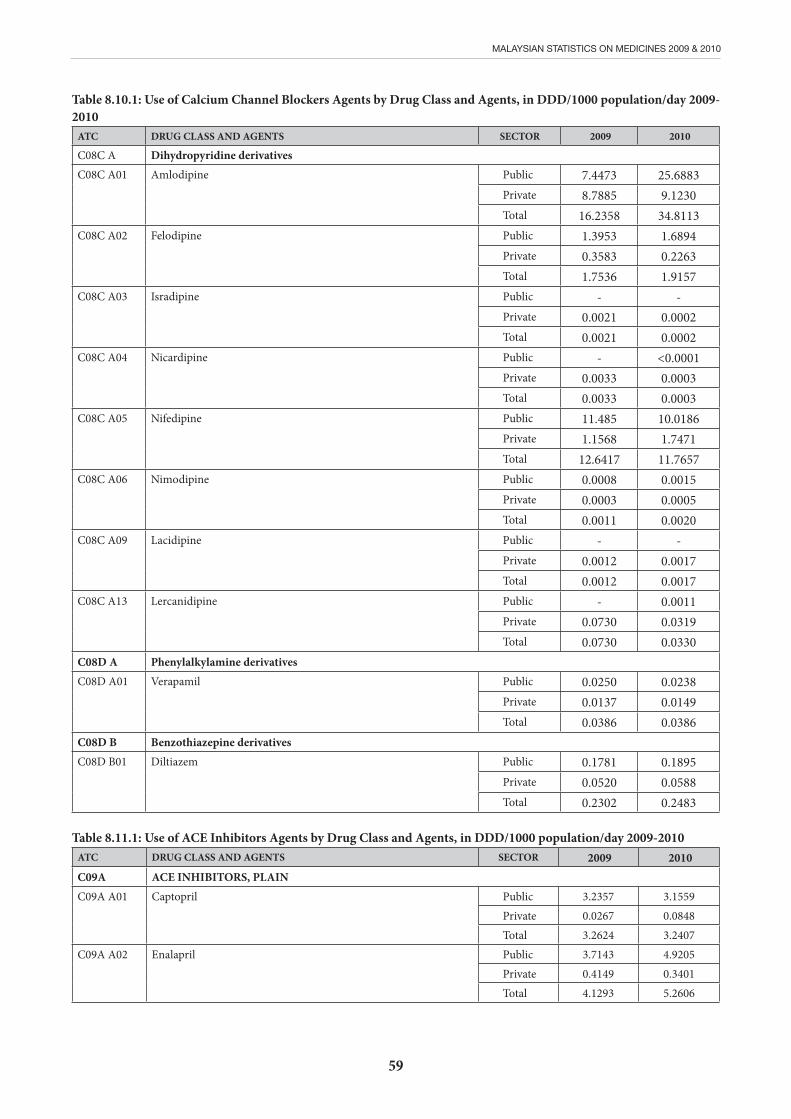
59
MALAYSIAN STATISTICS ON MEDICINES 2009 & 2010
Table 8.10.1: Use of Calcium Channel Blockers Agents by Drug Class and Agents, in DDD/1000 population/day 2009-2010
ATC DRUG CLASS AND AGENTS SECTOR 2009 2010
C08C A Dihydropyridine derivativesC08C A01
Amlodipine Public 7.4473 25.6883Private 8.7885 9.1230Total 16.2358 34.8113
C08C A02
Felodipine Public 1.3953 1.6894Private 0.3583 0.2263Total 1.7536 1.9157
C08C A03
Isradipine Public - -Private 0.0021 0.0002Total 0.0021 0.0002
C08C A04
Nicardipine Public - <0.0001Private 0.0033 0.0003Total 0.0033 0.0003
C08C A05
Nifedipine Public 11.485 10.0186Private 1.1568 1.7471Total 12.6417 11.7657
C08C A06
Nimodipine Public 0.0008 0.0015Private 0.0003 0.0005Total 0.0011 0.0020
C08C A09
Lacidipine Public - -Private 0.0012 0.0017Total 0.0012 0.0017
C08C A13
Lercanidipine Public - 0.0011Private 0.0730 0.0319Total 0.0730 0.0330
C08D A Phenylalkylamine derivativesC08D A01
Verapamil Public 0.0250 0.0238Private 0.0137 0.0149Total 0.0386 0.0386
C08D B Benzothiazepine derivatives C08D B01
Diltiazem Public 0.1781 0.1895Private 0.0520 0.0588Total 0.2302 0.2483
Table 8.11.1: Use of ACE Inhibitors Agents by Drug Class and Agents, in DDD/1000 population/day 2009-2010ATC DRUG CLASS AND AGENTS SECTOR 2009 2010C09A ACE INHIBITORS, PLAINC09A A01
Captopril Public 3.2357 3.1559Private 0.0267 0.0848Total 3.2624 3.2407
C09A A02
Enalapril Public 3.7143 4.9205Private 0.4149 0.3401Total 4.1293 5.2606
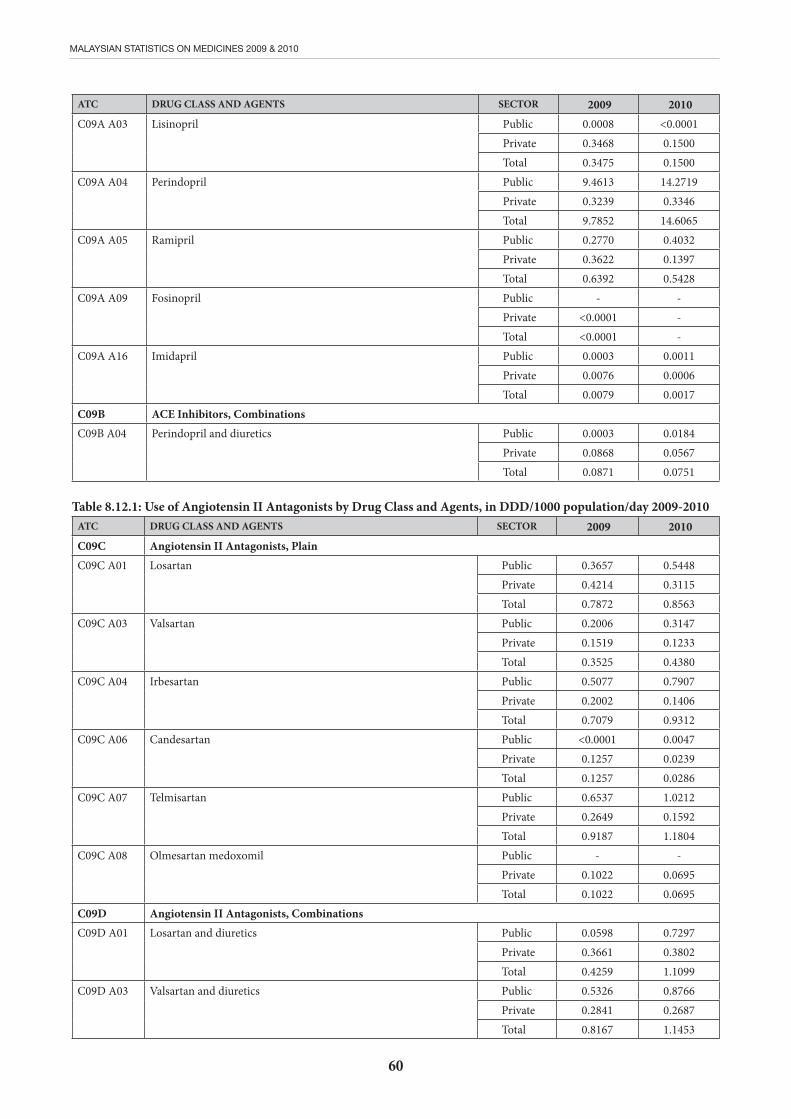
60
MALAYSIAN STATISTICS ON MEDICINES 2009 & 2010
ATC DRUG CLASS AND AGENTS SECTOR 2009 2010C09A A03
Lisinopril Public 0.0008 <0.0001Private 0.3468 0.1500Total 0.3475 0.1500
C09A A04
Perindopril Public 9.4613 14.2719Private 0.3239 0.3346Total 9.7852 14.6065
C09A A05
Ramipril Public 0.2770 0.4032Private 0.3622 0.1397Total 0.6392 0.5428
C09A A09
Fosinopril Public - -Private <0.0001 -Total <0.0001 -
C09A A16
Imidapril Public 0.0003 0.0011Private 0.0076 0.0006Total 0.0079 0.0017
C09B ACE Inhibitors, CombinationsC09B A04
Perindopril and diuretics Public 0.0003 0.0184Private 0.0868 0.0567Total 0.0871 0.0751
Table 8.12.1: Use of Angiotensin II Antagonists by Drug Class and Agents, in DDD/1000 population/day 2009-2010ATC DRUG CLASS AND AGENTS SECTOR 2009 2010C09C Angiotensin II Antagonists, PlainC09C A01
Losartan Public 0.3657 0.5448Private 0.4214 0.3115Total 0.7872 0.8563
C09C A03
Valsartan Public 0.2006 0.3147Private 0.1519 0.1233Total 0.3525 0.4380
C09C A04
Irbesartan Public 0.5077 0.7907Private 0.2002 0.1406Total 0.7079 0.9312
C09C A06
Candesartan Public <0.0001 0.0047Private 0.1257 0.0239Total 0.1257 0.0286
C09C A07
Telmisartan Public 0.6537 1.0212Private 0.2649 0.1592Total 0.9187 1.1804
C09C A08
Olmesartan medoxomil Public - -Private 0.1022 0.0695Total 0.1022 0.0695
C09D Angiotensin II Antagonists, CombinationsC09D A01
Losartan and diuretics Public 0.0598 0.7297Private 0.3661 0.3802Total 0.4259 1.1099
C09D A03
Valsartan and diuretics Public 0.5326 0.8766Private 0.2841 0.2687Total 0.8167 1.1453
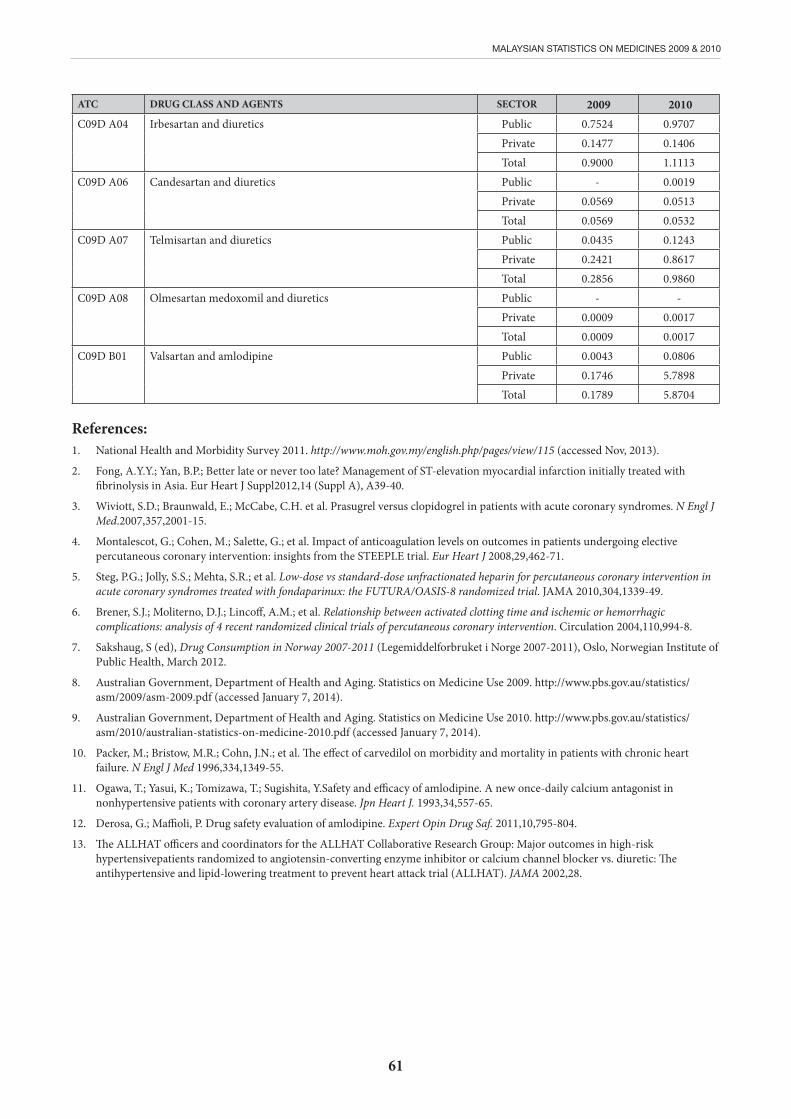
61
MALAYSIAN STATISTICS ON MEDICINES 2009 & 2010
ATC DRUG CLASS AND AGENTS SECTOR 2009 2010C09D A04
Irbesartan and diuretics Public 0.7524 0.9707Private 0.1477 0.1406Total 0.9000 1.1113
C09D A06
Candesartan and diuretics Public - 0.0019Private 0.0569 0.0513Total 0.0569 0.0532
C09D A07
Telmisartan and diuretics Public 0.0435 0.1243Private 0.2421 0.8617Total 0.2856 0.9860
C09D A08
Olmesartan medoxomil and diuretics Public - -Private 0.0009 0.0017Total 0.0009 0.0017
C09D B01
Valsartan and amlodipine Public 0.0043 0.0806Private 0.1746 5.7898Total 0.1789 5.8704
References:1. National Health and Morbidity Survey 2011. http://www.moh.gov.my/english.php/pages/view/115 (accessed Nov, 2013).
2. Fong, A.Y.Y.; Yan, B.P.; Better late or never too late? Management of ST-elevation myocardial infarction initially treated with fibrinolysis in Asia. Eur Heart J Suppl2012,14 (Suppl A), A39-40.
3. Wiviott, S.D.; Braunwald, E.; McCabe, C.H. et al. Prasugrel versus clopidogrel in patients with acute coronary syndromes. N Engl J Med.2007,357,2001-15.
4. Montalescot, G.; Cohen, M.; Salette, G.; et al. Impact of anticoagulation levels on outcomes in patients undergoing elective percutaneous coronary intervention: insights from the STEEPLE trial. Eur Heart J 2008,29,462-71.
5. Steg, P.G.; Jolly, S.S.; Mehta, S.R.; et al. Low-dose vs standard-dose unfractionated heparin for percutaneous coronary intervention in acute coronary syndromes treated with fondaparinux: the FUTURA/OASIS-8 randomized trial. JAMA 2010,304,1339-49.
6. Brener, S.J.; Moliterno, D.J.; Lincoff, A.M.; et al. Relationship between activated clotting time and ischemic or hemorrhagic complications: analysis of 4 recent randomized clinical trials of percutaneous coronary intervention. Circulation 2004,110,994-8.
7. Sakshaug, S (ed), Drug Consumption in Norway 2007-2011 (Legemiddelforbruket i Norge 2007-2011), Oslo, Norwegian Institute of Public Health, March 2012.
8. Australian Government, Department of Health and Aging. Statistics on Medicine Use 2009. http://www.pbs.gov.au/statistics/asm/2009/asm-2009.pdf (accessed January 7, 2014).
9. Australian Government, Department of Health and Aging. Statistics on Medicine Use 2010. http://www.pbs.gov.au/statistics/asm/2010/australian-statistics-on-medicine-2010.pdf (accessed January 7, 2014).
10. Packer, M.; Bristow, M.R.; Cohn, J.N.; et al. The effect of carvedilol on morbidity and mortality in patients with chronic heart failure. N Engl J Med 1996,334,1349-55.
11. Ogawa, T.; Yasui, K.; Tomizawa, T.; Sugishita, Y.Safety and efficacy of amlodipine. A new once-daily calcium antagonist in nonhypertensive patients with coronary artery disease. Jpn Heart J. 1993,34,557-65.
12. Derosa, G.; Maffioli, P. Drug safety evaluation of amlodipine. Expert Opin Drug Saf. 2011,10,795-804.
13. The ALLHAT officers and coordinators for the ALLHAT Collaborative Research Group: Major outcomes in high-risk hypertensivepatients randomized to angiotensin-converting enzyme inhibitor or calcium channel blocker vs. diuretic: The antihypertensive and lipid-lowering treatment to prevent heart attack trial (ALLHAT). JAMA 2002,28.
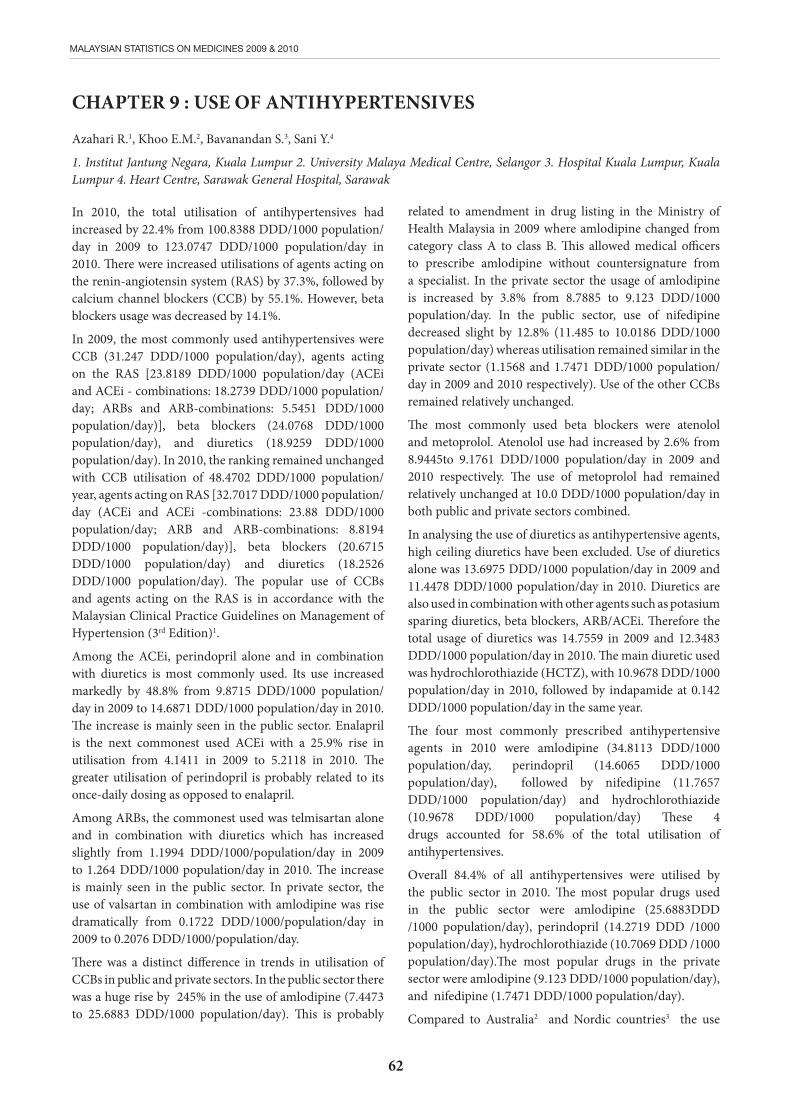
62
MALAYSIAN STATISTICS ON MEDICINES 2009 & 2010
CHAPTER 9 : USE OF ANTIHYPERTENSIVES
Azahari R.1, Khoo E.M.2, Bavanandan S.3, Sani Y.4
1. Institut Jantung Negara, Kuala Lumpur 2. University Malaya Medical Centre, Selangor 3. Hospital Kuala Lumpur, Kuala Lumpur 4. Heart Centre, Sarawak General Hospital, Sarawak
In 2010, the total utilisation of antihypertensives had increased by 22.4% from 100.8388 DDD/1000 population/day in 2009 to 123.0747 DDD/1000 population/day in 2010. There were increased utilisations of agents acting on the renin-angiotensin system (RAS) by 37.3%, followed by calcium channel blockers (CCB) by 55.1%. However, beta blockers usage was decreased by 14.1%.
In 2009, the most commonly used antihypertensives were CCB (31.247 DDD/1000 population/day), agents acting on the RAS [23.8189 DDD/1000 population/day (ACEi and ACEi - combinations: 18.2739 DDD/1000 population/day; ARBs and ARB-combinations: 5.5451 DDD/1000 population/day)], beta blockers (24.0768 DDD/1000 population/day), and diuretics (18.9259 DDD/1000 population/day). In 2010, the ranking remained unchanged with CCB utilisation of 48.4702 DDD/1000 population/year, agents acting on RAS [32.7017 DDD/1000 population/day (ACEi and ACEi -combinations: 23.88 DDD/1000 population/day; ARB and ARB-combinations: 8.8194 DDD/1000 population/day)], beta blockers (20.6715 DDD/1000 population/day) and diuretics (18.2526 DDD/1000 population/day). The popular use of CCBs and agents acting on the RAS is in accordance with the Malaysian Clinical Practice Guidelines on Management of Hypertension (3rd Edition)1.
Among the ACEi, perindopril alone and in combination with diuretics is most commonly used. Its use increased markedly by 48.8% from 9.8715 DDD/1000 population/day in 2009 to 14.6871 DDD/1000 population/day in 2010. The increase is mainly seen in the public sector. Enalapril is the next commonest used ACEi with a 25.9% rise in utilisation from 4.1411 in 2009 to 5.2118 in 2010. The greater utilisation of perindopril is probably related to its once-daily dosing as opposed to enalapril.
Among ARBs, the commonest used was telmisartan alone and in combination with diuretics which has increased slightly from 1.1994 DDD/1000/population/day in 2009 to 1.264 DDD/1000 population/day in 2010. The increase is mainly seen in the public sector. In private sector, the use of valsartan in combination with amlodipine was rise dramatically from 0.1722 DDD/1000/population/day in 2009 to 0.2076 DDD/1000/population/day.
There was a distinct difference in trends in utilisation of CCBs in public and private sectors. In the public sector there was a huge rise by 245% in the use of amlodipine (7.4473 to 25.6883 DDD/1000 population/day). This is probably
related to amendment in drug listing in the Ministry of Health Malaysia in 2009 where amlodipine changed from category class A to class B. This allowed medical officers to prescribe amlodipine without countersignature from a specialist. In the private sector the usage of amlodipine is increased by 3.8% from 8.7885 to 9.123 DDD/1000 population/day. In the public sector, use of nifedipine decreased slight by 12.8% (11.485 to 10.0186 DDD/1000 population/day) whereas utilisation remained similar in the private sector (1.1568 and 1.7471 DDD/1000 population/day in 2009 and 2010 respectively). Use of the other CCBs remained relatively unchanged.
The most commonly used beta blockers were atenolol and metoprolol. Atenolol use had increased by 2.6% from 8.9445to 9.1761 DDD/1000 population/day in 2009 and 2010 respectively. The use of metoprolol had remained relatively unchanged at 10.0 DDD/1000 population/day in both public and private sectors combined.
In analysing the use of diuretics as antihypertensive agents, high ceiling diuretics have been excluded. Use of diuretics alone was 13.6975 DDD/1000 population/day in 2009 and 11.4478 DDD/1000 population/day in 2010. Diuretics are also used in combination with other agents such as potasium sparing diuretics, beta blockers, ARB/ACEi. Therefore the total usage of diuretics was 14.7559 in 2009 and 12.3483 DDD/1000 population/day in 2010. The main diuretic used was hydrochlorothiazide (HCTZ), with 10.9678 DDD/1000 population/day in 2010, followed by indapamide at 0.142 DDD/1000 population/day in the same year.
The four most commonly prescribed antihypertensive agents in 2010 were amlodipine (34.8113 DDD/1000 population/day, perindopril (14.6065 DDD/1000 population/day), followed by nifedipine (11.7657 DDD/1000 population/day) and hydrochlorothiazide (10.9678 DDD/1000 population/day) These 4 drugs accounted for 58.6% of the total utilisation of antihypertensives.
Overall 84.4% of all antihypertensives were utilised by the public sector in 2010. The most popular drugs used in the public sector were amlodipine (25.6883DDD /1000 population/day), perindopril (14.2719 DDD /1000 population/day), hydrochlorothiazide (10.7069 DDD /1000 population/day).The most popular drugs in the private sector were amlodipine (9.123 DDD/1000 population/day), and nifedipine (1.7471 DDD/1000 population/day).
Compared to Australia2 and Nordic countries3 the use

63
MALAYSIAN STATISTICS ON MEDICINES 2009 & 2010
of antihypertensives in Malaysia is low. In Finland4 and Norway5, drugs acting on the RAS were the most commonly prescribed agents rather than CCBS. Another difference seen is the use of fixed-dose combinations. In Malaysia in
Table 9.1: Use of Anti-Hypertensives by Drug Class, in DDD/1000 population/day 2009-2010ATC DRUG CLASS 2009 2010C02 Antihypertensives 2.7174 2.9298C02A Antiadrenergic agents, centrally acting 0.3830 0.3281C02C Antiadrenergic agents, peripherally acting 2.3209 2.5874C02D Arteriolar smooth muscle, agents acting on 0.0132 0.0137C02K Other antihypertensives 0.0004 0.0005C03 Diuretics 18.9259 18.2526C03A Low-ceiling diuretics, thiazides 11.2308 11.0005C03B Low-ceiling diuretics, excl. Thiazides 1.9151 0.1437C03C High-ceiling diuretics 4.1700 5.9043C03D Potassium-sparing agents 0.5516 0.3036C03E Diuretics and potassium-sparing agents in combination 1.0584 0.9005C04 Peripheral vasodilators 0.0528 0.0489C07 Beta blocking agents 24.0768 20.6715C08 Calcium channel blockers 31.2470 48.4702C09 Agents acting on the renin-angiotensin system 23.8189 32.7017C09A Ace inhibitors, plain 18.1876 23.7994C09B Ace inhibitors, combinations 0.0863 0.0806C09C Angiotensin II antagonists, plain 2.9559 3.8305C09D Angiotensin II antagonists, combinations 2.5892 4.9889C09X Other agents acting on the renin-angiotensin system - 0.0023
Table 9.2: Use of Anti-Hypertensives by Drug Class and Agents, in DDD/1000 population/day 2009-2010ATC DRUG CLASS AND AGENTS SECTOR 2009 2010C02A Antiadrenergic Agents, Centrally ActingC02A B01
Methyldopa (levorotatory) Public 0.3388 0.2943Private 0.0183 0.0066Total 0.3571 0.3009
C02A C01
Clonidine Public - -Private - -Total - -
C02A C05
Moxonidine Public 0.0003 0.0016Private 0.0256 0.0256Total 0.0258 0.0272
C02C A Alpha-adrenoreceptor antagonistsC02C A01
Prazosin Public 1.7879 2.1579Private 0.0273 0.0432Total 1.8152 2.2010
C02C A04
Doxazosin Public 0.2910 0.3016Private 0.2147 0.0848Total 0.5057 0.3864
2010 for example, the use of fixed-dose combination ARB/diuretic was 4.7044DDD/100 population/day as compared to 36.900 DDD/1000 population/day in Norway5. This may be due to cost considerations.
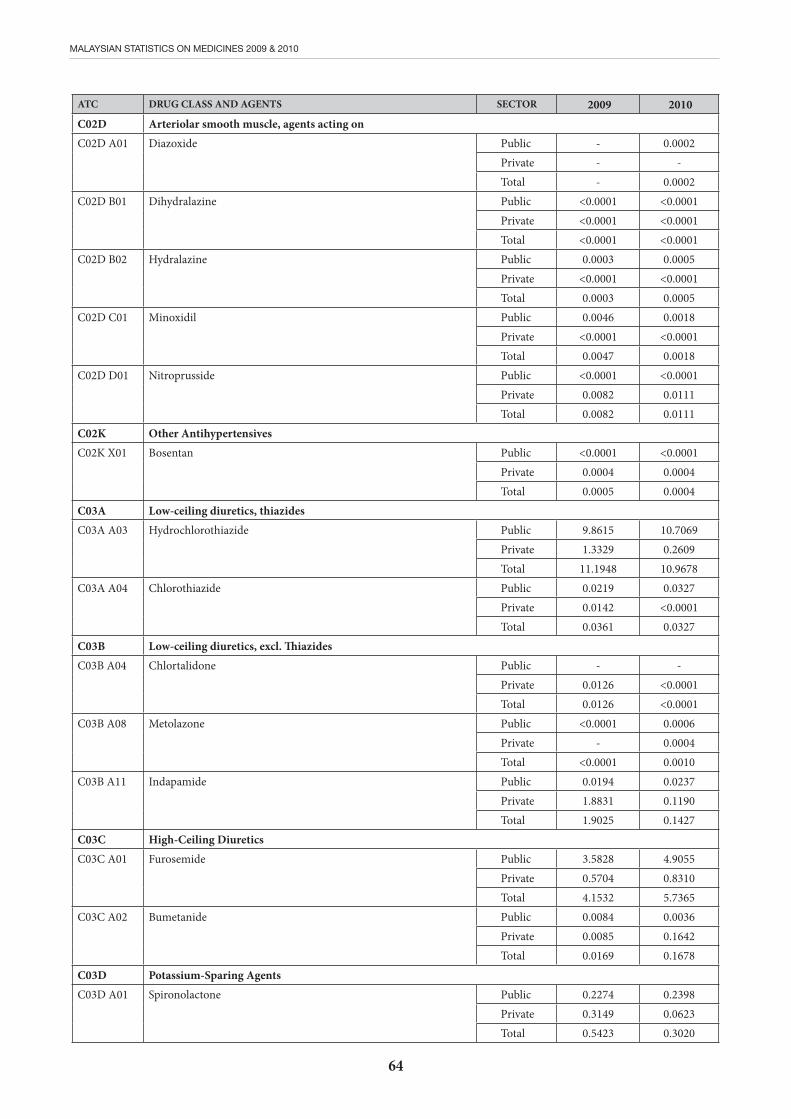
64
MALAYSIAN STATISTICS ON MEDICINES 2009 & 2010
ATC DRUG CLASS AND AGENTS SECTOR 2009 2010C02D Arteriolar smooth muscle, agents acting onC02D A01
Diazoxide Public - 0.0002Private - -Total - 0.0002
C02D B01
Dihydralazine Public <0.0001 <0.0001Private <0.0001 <0.0001Total <0.0001 <0.0001
C02D B02
Hydralazine Public 0.0003 0.0005Private <0.0001 <0.0001Total 0.0003 0.0005
C02D C01
Minoxidil Public 0.0046 0.0018Private <0.0001 <0.0001Total 0.0047 0.0018
C02D D01
Nitroprusside Public <0.0001 <0.0001Private 0.0082 0.0111Total 0.0082 0.0111
C02K Other AntihypertensivesC02K X01
Bosentan Public <0.0001 <0.0001Private 0.0004 0.0004Total 0.0005 0.0004
C03A Low-ceiling diuretics, thiazidesC03A A03
Hydrochlorothiazide Public 9.8615 10.7069Private 1.3329 0.2609Total 11.1948 10.9678
C03A A04
Chlorothiazide Public 0.0219 0.0327Private 0.0142 <0.0001Total 0.0361 0.0327
C03B Low-ceiling diuretics, excl. ThiazidesC03B A04
Chlortalidone Public - -Private 0.0126 <0.0001Total 0.0126 <0.0001
C03B A08
Metolazone Public <0.0001 0.0006Private - 0.0004Total <0.0001 0.0010
C03B A11
Indapamide Public 0.0194 0.0237Private 1.8831 0.1190Total 1.9025 0.1427
C03C High-Ceiling Diuretics C03C A01
Furosemide Public 3.5828 4.9055Private 0.5704 0.8310Total 4.1532 5.7365
C03C A02
Bumetanide Public 0.0084 0.0036Private 0.0085 0.1642Total 0.0169 0.1678
C03D Potassium-Sparing AgentsC03D A01
Spironolactone Public 0.2274 0.2398Private 0.3149 0.0623Total 0.5423 0.3020
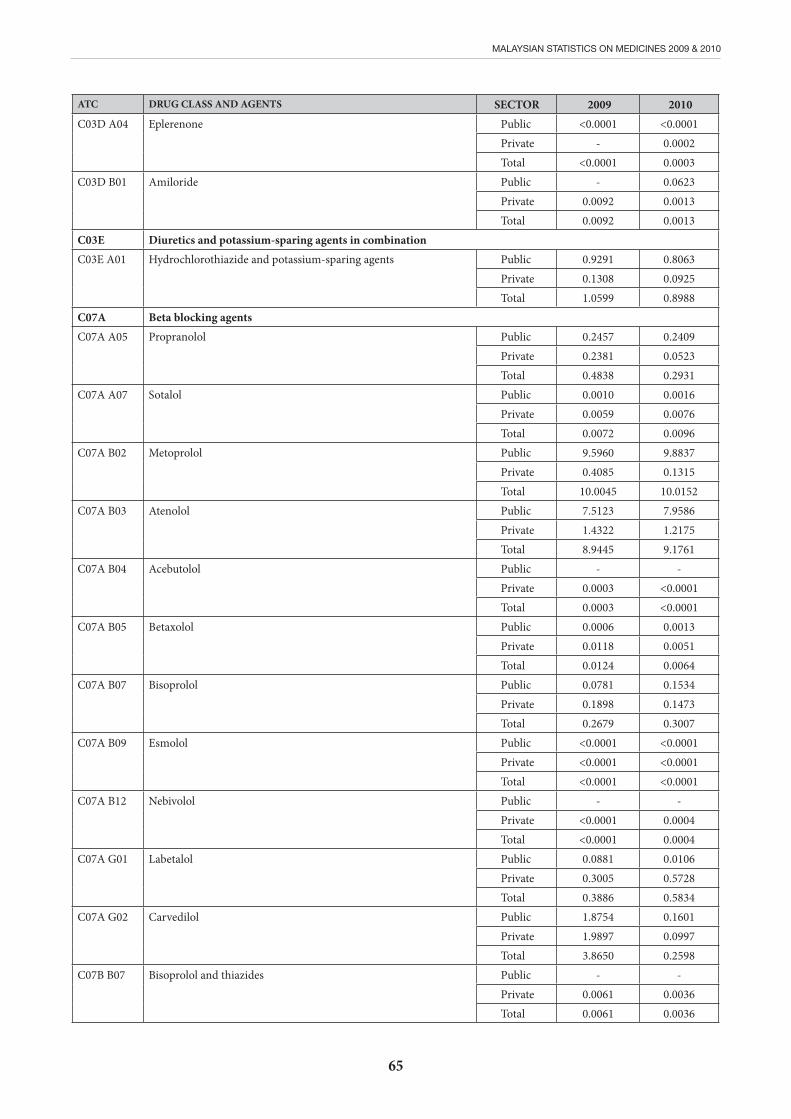
65
MALAYSIAN STATISTICS ON MEDICINES 2009 & 2010
ATC DRUG CLASS AND AGENTS SECTOR 2009 2010C03D A04
Eplerenone Public <0.0001 <0.0001Private - 0.0002Total <0.0001 0.0003
C03D B01
Amiloride Public - 0.0623Private 0.0092 0.0013Total 0.0092 0.0013
C03E Diuretics and potassium-sparing agents in combinationC03E A01
Hydrochlorothiazide and potassium-sparing agents Public 0.9291 0.8063Private 0.1308 0.0925Total 1.0599 0.8988
C07A Beta blocking agentsC07A A05
Propranolol Public 0.2457 0.2409Private 0.2381 0.0523Total 0.4838 0.2931
C07A A07
Sotalol Public 0.0010 0.0016Private 0.0059 0.0076Total 0.0072 0.0096
C07A B02
Metoprolol Public 9.5960 9.8837Private 0.4085 0.1315Total 10.0045 10.0152
C07A B03
Atenolol Public 7.5123 7.9586Private 1.4322 1.2175Total 8.9445 9.1761
C07A B04
Acebutolol Public - -Private 0.0003 <0.0001Total 0.0003 <0.0001
C07A B05
Betaxolol Public 0.0006 0.0013Private 0.0118 0.0051Total 0.0124 0.0064
C07A B07
Bisoprolol Public 0.0781 0.1534Private 0.1898 0.1473Total 0.2679 0.3007
C07A B09
Esmolol Public <0.0001 <0.0001Private <0.0001 <0.0001Total <0.0001 <0.0001
C07A B12
Nebivolol Public - -Private <0.0001 0.0004Total <0.0001 0.0004
C07A G01
Labetalol Public 0.0881 0.0106Private 0.3005 0.5728Total 0.3886 0.5834
C07A G02
Carvedilol Public 1.8754 0.1601Private 1.9897 0.0997Total 3.8650 0.2598
C07B B07
Bisoprolol and thiazides Public - -Private 0.0061 0.0036Total 0.0061 0.0036
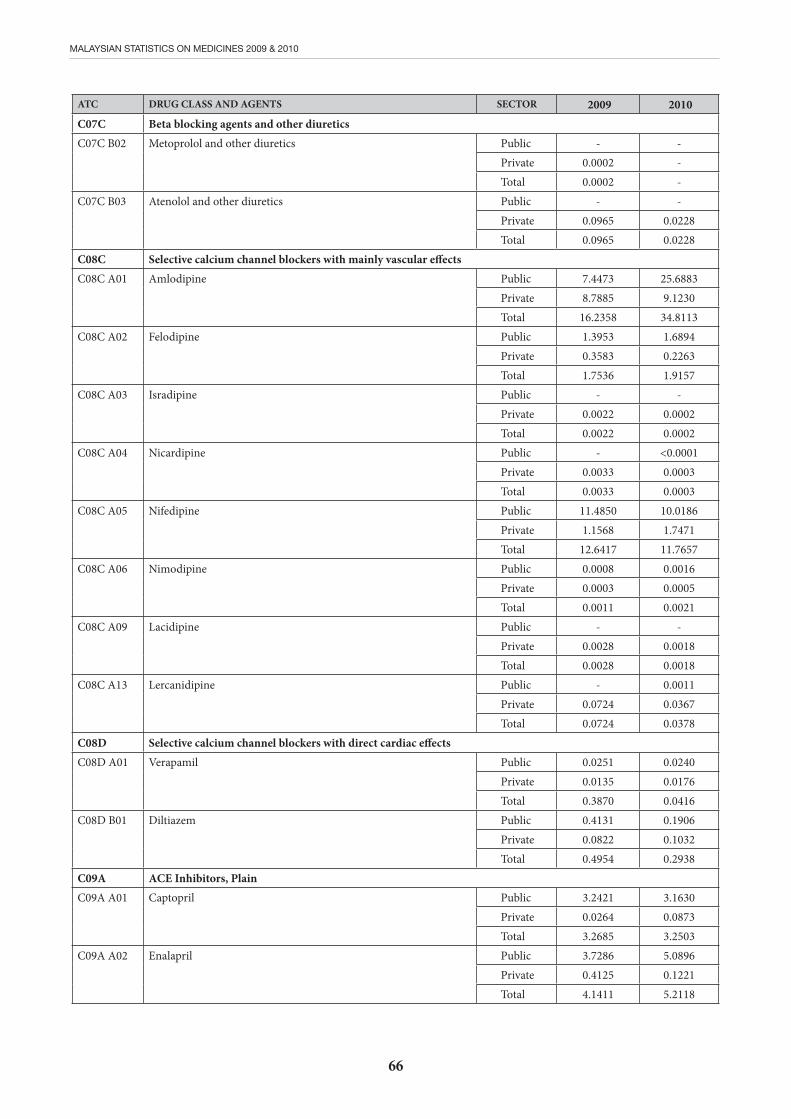
66
MALAYSIAN STATISTICS ON MEDICINES 2009 & 2010
ATC DRUG CLASS AND AGENTS SECTOR 2009 2010C07C Beta blocking agents and other diureticsC07C B02
Metoprolol and other diuretics Public - -Private 0.0002 -Total 0.0002 -
C07C B03
Atenolol and other diuretics Public - -Private 0.0965 0.0228Total 0.0965 0.0228
C08C Selective calcium channel blockers with mainly vascular effectsC08C A01
Amlodipine Public 7.4473 25.6883Private 8.7885 9.1230Total 16.2358 34.8113
C08C A02
Felodipine Public 1.3953 1.6894Private 0.3583 0.2263Total 1.7536 1.9157
C08C A03
Isradipine Public - -Private 0.0022 0.0002Total 0.0022 0.0002
C08C A04
Nicardipine Public - <0.0001Private 0.0033 0.0003Total 0.0033 0.0003
C08C A05
Nifedipine Public 11.4850 10.0186Private 1.1568 1.7471Total 12.6417 11.7657
C08C A06
Nimodipine Public 0.0008 0.0016Private 0.0003 0.0005Total 0.0011 0.0021
C08C A09
Lacidipine Public - -Private 0.0028 0.0018Total 0.0028 0.0018
C08C A13
Lercanidipine Public - 0.0011Private 0.0724 0.0367Total 0.0724 0.0378
C08D Selective calcium channel blockers with direct cardiac effectsC08D A01
Verapamil Public 0.0251 0.0240Private 0.0135 0.0176Total 0.3870 0.0416
C08D B01
Diltiazem Public 0.4131 0.1906Private 0.0822 0.1032Total 0.4954 0.2938
C09A ACE Inhibitors, PlainC09A A01
Captopril Public 3.2421 3.1630Private 0.0264 0.0873Total 3.2685 3.2503
C09A A02
Enalapril Public 3.7286 5.0896Private 0.4125 0.1221Total 4.1411 5.2118
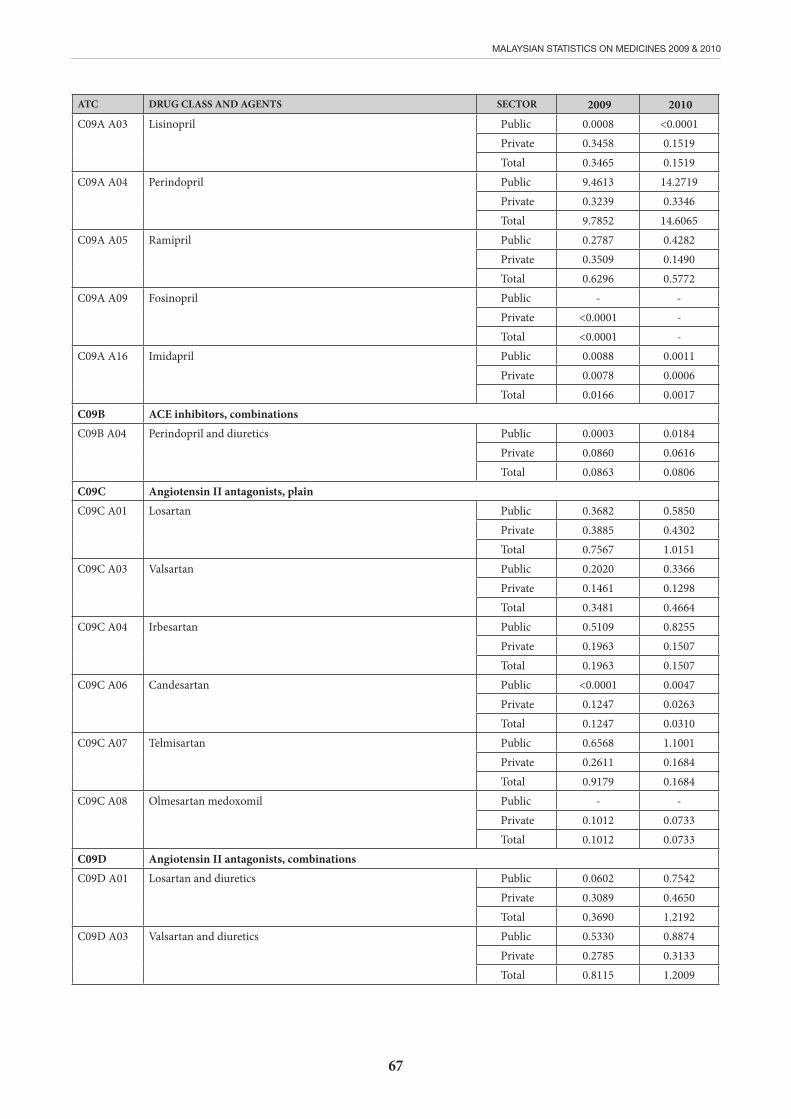
67
MALAYSIAN STATISTICS ON MEDICINES 2009 & 2010
ATC DRUG CLASS AND AGENTS SECTOR 2009 2010C09A A03
Lisinopril Public 0.0008 <0.0001Private 0.3458 0.1519Total 0.3465 0.1519
C09A A04
Perindopril Public 9.4613 14.2719Private 0.3239 0.3346Total 9.7852 14.6065
C09A A05
Ramipril Public 0.2787 0.4282Private 0.3509 0.1490Total 0.6296 0.5772
C09A A09
Fosinopril Public - -Private <0.0001 -Total <0.0001 -
C09A A16
Imidapril Public 0.0088 0.0011Private 0.0078 0.0006Total 0.0166 0.0017
C09B ACE inhibitors, combinationsC09B A04
Perindopril and diuretics Public 0.0003 0.0184Private 0.0860 0.0616Total 0.0863 0.0806
C09C Angiotensin II antagonists, plainC09C A01
Losartan Public 0.3682 0.5850Private 0.3885 0.4302Total 0.7567 1.0151
C09C A03
Valsartan Public 0.2020 0.3366Private 0.1461 0.1298Total 0.3481 0.4664
C09C A04
Irbesartan Public 0.5109 0.8255Private 0.1963 0.1507Total 0.1963 0.1507
C09C A06
Candesartan Public <0.0001 0.0047Private 0.1247 0.0263Total 0.1247 0.0310
C09C A07
Telmisartan Public 0.6568 1.1001Private 0.2611 0.1684Total 0.9179 0.1684
C09C A08
Olmesartan medoxomil Public - -Private 0.1012 0.0733Total 0.1012 0.0733
C09D Angiotensin II antagonists, combinationsC09D A01
Losartan and diuretics Public 0.0602 0.7542Private 0.3089 0.4650Total 0.3690 1.2192
C09D A03
Valsartan and diuretics Public 0.5330 0.8874Private 0.2785 0.3133Total 0.8115 1.2009
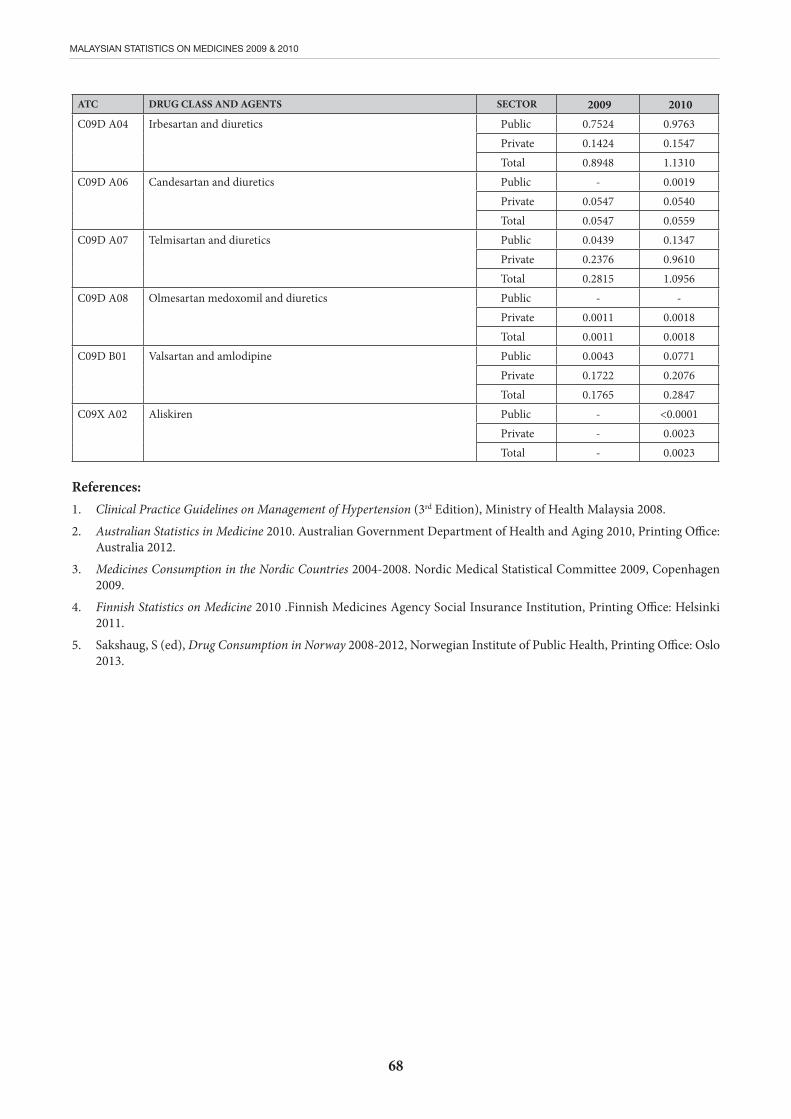
68
MALAYSIAN STATISTICS ON MEDICINES 2009 & 2010
ATC DRUG CLASS AND AGENTS SECTOR 2009 2010C09D A04
Irbesartan and diuretics Public 0.7524 0.9763Private 0.1424 0.1547Total 0.8948 1.1310
C09D A06
Candesartan and diuretics Public - 0.0019Private 0.0547 0.0540Total 0.0547 0.0559
C09D A07
Telmisartan and diuretics Public 0.0439 0.1347Private 0.2376 0.9610Total 0.2815 1.0956
C09D A08
Olmesartan medoxomil and diuretics Public - -Private 0.0011 0.0018Total 0.0011 0.0018
C09D B01
Valsartan and amlodipine Public 0.0043 0.0771Private 0.1722 0.2076Total 0.1765 0.2847
C09X A02
Aliskiren Public - <0.0001Private - 0.0023Total - 0.0023
References:1. Clinical Practice Guidelines on Management of Hypertension (3rd Edition), Ministry of Health Malaysia 2008.
2. Australian Statistics in Medicine 2010. Australian Government Department of Health and Aging 2010, Printing Office: Australia 2012.
3. Medicines Consumption in the Nordic Countries 2004-2008. Nordic Medical Statistical Committee 2009, Copenhagen 2009.
4. Finnish Statistics on Medicine 2010 .Finnish Medicines Agency Social Insurance Institution, Printing Office: Helsinki 2011.
5. Sakshaug, S (ed), Drug Consumption in Norway 2008-2012, Norwegian Institute of Public Health, Printing Office: Oslo 2013.
69
MALAYSIAN STATISTICS ON MEDICINES 2009 & 2010
CHAPTER 10 : USE OF LIPID MODIFYING DRUGS
Wan Azman W.A.1, Yusoff M.R.2, Kasim S.3, Kong S.H.4, Haarathi C.5, Nirmala J.6, Sim K.H.7
1.Department of Medicine, University Malaya Medical Centre, 2. Department of Medicine, Hospital Kuala Lumpur, 3. Department of Medicine, Universiti Teknologi MARA, Sungai Buloh 4. UKM Medical Centre, Kuala Lumpur 5. Pharmaceutical Services Division, Ministry of Health 6. Hospital Kuala Lumpur, 7. National Heart Association of Malaysia
In Malaysia, cardiovascular disease (CVD) is the leading cause of death in both men and women1. Our National Cardiovascular Database (NCVD) – Acute Coronary Syndrome (ACS) registry, revealed that Malaysians develop ACS at a younger age (58 years) compared to population in Thailand (65 years), mainland China (63 years) and western countries (GRACE Registry – 66 years, Canada – 68 years). Majority of patients were managed medically, with low rates of cardiac interventions, the latter depends largely on availability of cardiac catheterisation laboratory resources. Most patients (96.0%) had at least one established cardiovascular risk factors. The prevalent risk factors are hypertension (72.6%), dyslipidaemia (55.9%) and/or diabetes (55.0%)2.
Based on the Malaysian National Health and Morbidity Survey 2011, the prevalence of hypertension in Malaysia for adults ≥ 18 years has increased from 32.2% in 2006 to 32.7% in 2011. For hypercholesterolemia, 35.1% (6.2 million) of adults 18 years and above have elevated cholesterol. Of these, 8.4% are known to have hypercholesterolemia however 26.6% are previously undiagnosed with hypercholesterolemia3.
The high prevalence of cardiovascular risk factors indicate the need for primary prevention programme.
In the prevention of CVD, efforts should be aimed at reducing global risks. Systematic reviews and large randomised clinical trials have found that lowering cholesterol in people at high risk of cardiovascular events substantially reduced the risk of overall mortality, cardiovascular mortality and non-fatal cardiovascular events. Lipid modifying agents remain the mainstay in the management of dyslipidemia. The 3-hydroxy-3-methylglutaryl coenzyme-A (HMG Co-A) reductase inhibitors, or widely known as statins, are the most commonly prescribed lipid modifying agents. Primary and secondary prevention trials have confirmed that statins constitute the single most effective type of treatment for reducing cholesterol and reducing cardiovascular risk4-9.The treatment target and practice guideline regarding the use of statins in various cardiovascular presentations have been well documented10,11,12. The lower the low-density lipoprotein (LDL), the better the outcome13,14. However the 2013 ACC/AHA guideline on the treatment of blood cholesterol to reduce atherosclerotic cardiovascular risk (ASCVD) in adults provides a new perspective on the
LDL-C and/or non HDL-C treatment goals. The guideline focus on the appropriate intensity of statin therapy to reduce ASCVD risk in those most likely to benefit15.
A good standard of practice with regards to ACS pharmacotherapy among Malaysian patients has been noted. About 91.0% of our ACS patients were given statin upon discharge2,16. The most prescribed statin in Malaysia was simvastatin (57.6%). Eighty percent (80.4%) of its use accounts from the public sector. Its widespread availability across the country makes simvastatin the number one used statin in Malaysia. The second most commonly used statin was lovastatin which accounts for 27.2% of the overall statins used in the year 2010. There has been an increase in the overall usage of atorvastatin compared to 2008 contributed mainly by a 2 fold increase in the private sector. As for rosuvastatin, the usage has decreased in the public and the private sector by 25%. The use of pravastatin has also declined (35.2%) compared to 2008.
The fibrate group remains the second most commonly used lipid modifying agent. Compared to 2008, the overall usage has reduced by 16.1%. Gemfibrozil is still the most commonly used fibrate (73.9%), however there is an increasing trend in the use of fenofibrate (17.7%) in the public sector.
Ezetimibe, a cholesterol absorption inhibitor, usage has remained the same. There is an increase of its use in the public sector (45.8%). Overall, the use of combination therapy with simvastatin and ezetimibe has decreased by 16.8%. The combination drug of atorvastatin and amlodipine has had a significant utilization, accounting for 20.5% of the total lipid modifying agents used in 2010.
Referring to utilization pattern of lipid modifying agents in other countries, the Nordic countries especially Finland has shown an increase in the use of lipid modifying agents by 18% from 2008 to 2010. Simvastatin remains the dominant statin in these countries possibly due to its cheaper cost when compared to atorvastatin. The other lipid lowering agents (fibrates, bile acid sequestrants, nicotinic acid) represents a small proportion of agents used in a stable trend17,18. In Australia, the top three statins used in the public sector remains to be atorvastatin, rosuvastatin and simvastatin in descending order. Statin is the most prescribed lipid modifying agent followed by combination
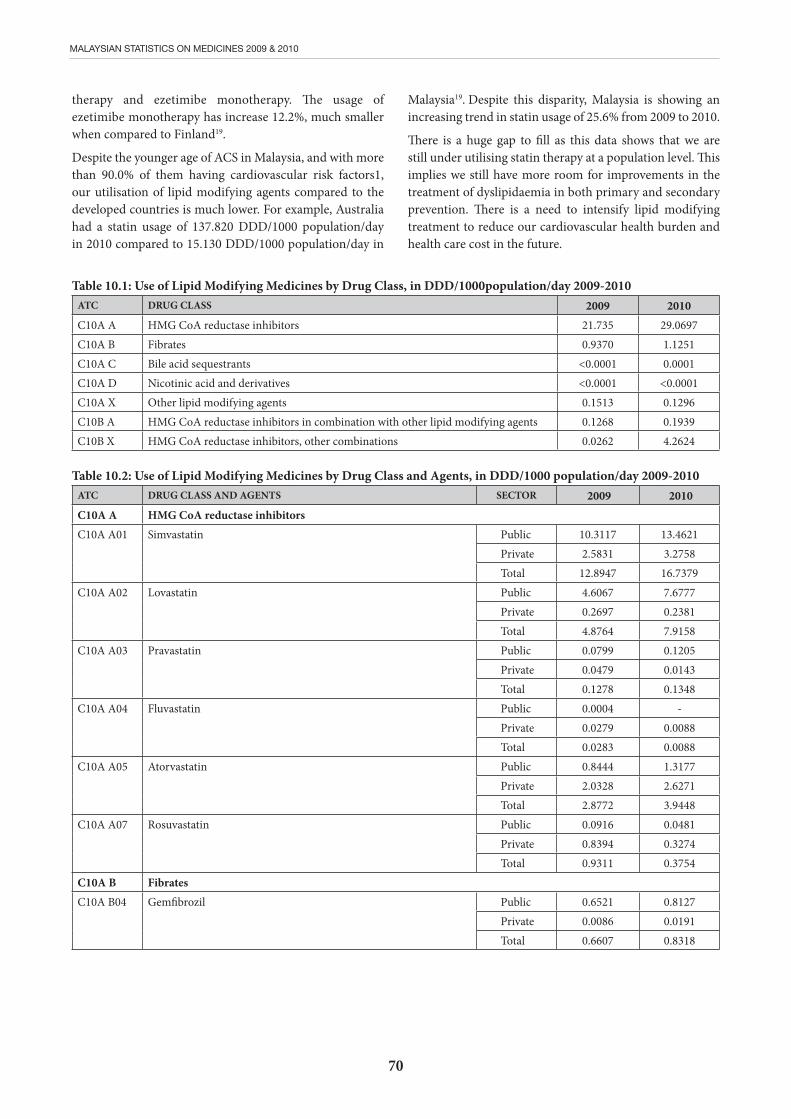
70
MALAYSIAN STATISTICS ON MEDICINES 2009 & 2010
therapy and ezetimibe monotherapy. The usage of ezetimibe monotherapy has increase 12.2%, much smaller when compared to Finland19.
Despite the younger age of ACS in Malaysia, and with more than 90.0% of them having cardiovascular risk factors1, our utilisation of lipid modifying agents compared to the developed countries is much lower. For example, Australia had a statin usage of 137.820 DDD/1000 population/day in 2010 compared to 15.130 DDD/1000 population/day in
Malaysia19. Despite this disparity, Malaysia is showing an increasing trend in statin usage of 25.6% from 2009 to 2010.
There is a huge gap to fill as this data shows that we are still under utilising statin therapy at a population level. This implies we still have more room for improvements in the treatment of dyslipidaemia in both primary and secondary prevention. There is a need to intensify lipid modifying treatment to reduce our cardiovascular health burden and health care cost in the future.
Table 10.1: Use of Lipid Modifying Medicines by Drug Class, in DDD/1000population/day 2009-2010ATC DRUG CLASS 2009 2010C10A A HMG CoA reductase inhibitors 21.735 29.0697C10A B Fibrates 0.9370 1.1251C10A C Bile acid sequestrants <0.0001 0.0001C10A D Nicotinic acid and derivatives <0.0001 <0.0001C10A X Other lipid modifying agents 0.1513 0.1296C10B A HMG CoA reductase inhibitors in combination with other lipid modifying agents 0.1268 0.1939C10B X HMG CoA reductase inhibitors, other combinations 0.0262 4.2624
Table 10.2: Use of Lipid Modifying Medicines by Drug Class and Agents, in DDD/1000 population/day 2009-2010ATC DRUG CLASS AND AGENTS SECTOR 2009 2010C10A A HMG CoA reductase inhibitorsC10A A01 Simvastatin Public 10.3117 13.4621
Private 2.5831 3.2758Total 12.8947 16.7379
C10A A02 Lovastatin Public 4.6067 7.6777Private 0.2697 0.2381Total 4.8764 7.9158
C10A A03 Pravastatin Public 0.0799 0.1205Private 0.0479 0.0143Total 0.1278 0.1348
C10A A04 Fluvastatin Public 0.0004 -Private 0.0279 0.0088Total 0.0283 0.0088
C10A A05 Atorvastatin Public 0.8444 1.3177Private 2.0328 2.6271Total 2.8772 3.9448
C10A A07 Rosuvastatin Public 0.0916 0.0481Private 0.8394 0.3274Total 0.9311 0.3754
C10A B FibratesC10A B04 Gemfibrozil Public 0.6521 0.8127
Private 0.0086 0.0191Total 0.6607 0.8318
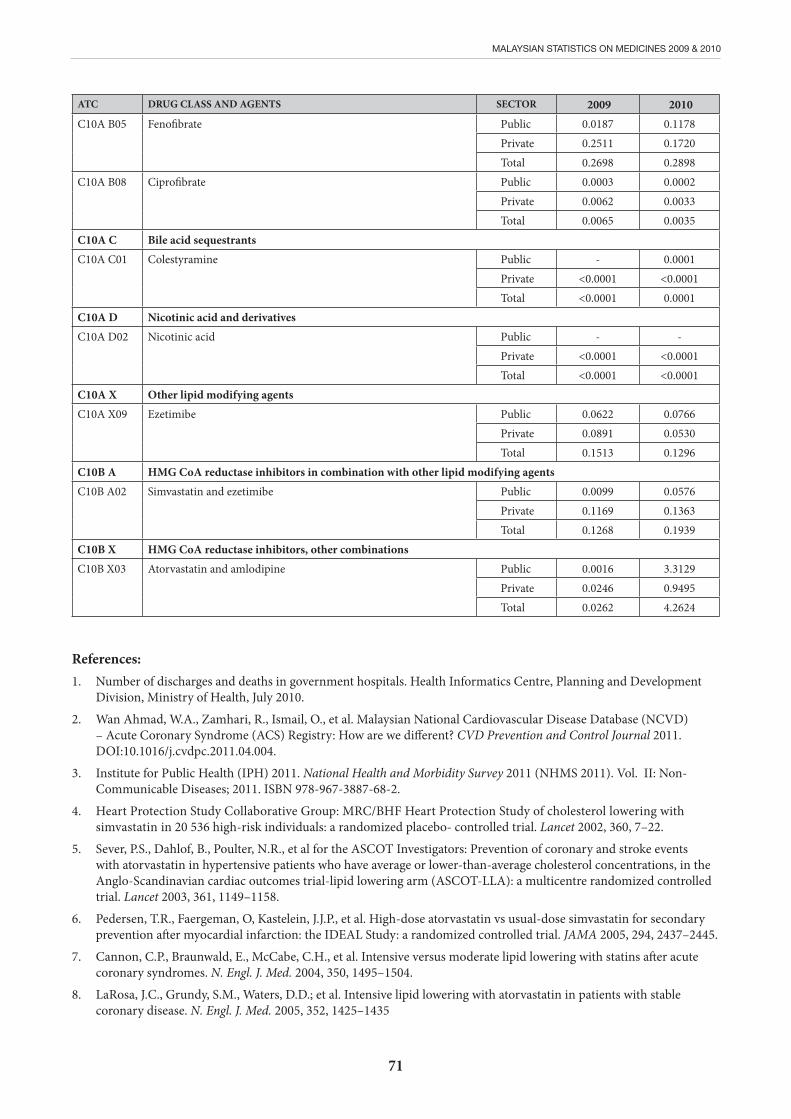
71
MALAYSIAN STATISTICS ON MEDICINES 2009 & 2010
ATC DRUG CLASS AND AGENTS SECTOR 2009 2010C10A B05 Fenofibrate Public 0.0187 0.1178
Private 0.2511 0.1720Total 0.2698 0.2898
C10A B08
Ciprofibrate Public 0.0003 0.0002Private 0.0062 0.0033Total 0.0065 0.0035
C10A C Bile acid sequestrantsC10A C01
Colestyramine Public - 0.0001Private <0.0001 <0.0001Total <0.0001 0.0001
C10A D Nicotinic acid and derivativesC10A D02
Nicotinic acid Public - -Private <0.0001 <0.0001Total <0.0001 <0.0001
C10A X Other lipid modifying agentsC10A X09
Ezetimibe Public 0.0622 0.0766Private 0.0891 0.0530Total 0.1513 0.1296
C10B A HMG CoA reductase inhibitors in combination with other lipid modifying agentsC10B A02
Simvastatin and ezetimibe Public 0.0099 0.0576Private 0.1169 0.1363Total 0.1268 0.1939
C10B X HMG CoA reductase inhibitors, other combinationsC10B X03
Atorvastatin and amlodipine Public 0.0016 3.3129Private 0.0246 0.9495Total 0.0262 4.2624
References:1. Number of discharges and deaths in government hospitals. Health Informatics Centre, Planning and Development
Division, Ministry of Health, July 2010.
2. Wan Ahmad, W.A., Zamhari, R., Ismail, O., et al. Malaysian National Cardiovascular Disease Database (NCVD) – Acute Coronary Syndrome (ACS) Registry: How are we different? CVD Prevention and Control Journal 2011. DOI:10.1016/j.cvdpc.2011.04.004.
3. Institute for Public Health (IPH) 2011. National Health and Morbidity Survey 2011 (NHMS 2011). Vol. II: Non-Communicable Diseases; 2011. ISBN 978-967-3887-68-2.
4. Heart Protection Study Collaborative Group: MRC/BHF Heart Protection Study of cholesterol lowering with simvastatin in 20 536 high-risk individuals: a randomized placebo- controlled trial. Lancet 2002, 360, 7–22.
5. Sever, P.S., Dahlof, B., Poulter, N.R., et al for the ASCOT Investigators: Prevention of coronary and stroke events with atorvastatin in hypertensive patients who have average or lower-than-average cholesterol concentrations, in the Anglo-Scandinavian cardiac outcomes trial-lipid lowering arm (ASCOT-LLA): a multicentre randomized controlled trial. Lancet 2003, 361, 1149–1158.
6. Pedersen, T.R., Faergeman, O, Kastelein, J.J.P., et al. High-dose atorvastatin vs usual-dose simvastatin for secondary prevention after myocardial infarction: the IDEAL Study: a randomized controlled trial. JAMA 2005, 294, 2437–2445.
7. Cannon, C.P., Braunwald, E., McCabe, C.H., et al. Intensive versus moderate lipid lowering with statins after acute coronary syndromes. N. Engl. J. Med. 2004, 350, 1495–1504.
8. LaRosa, J.C., Grundy, S.M., Waters, D.D.; et al. Intensive lipid lowering with atorvastatin in patients with stable coronary disease. N. Engl. J. Med. 2005, 352, 1425–1435
72
MALAYSIAN STATISTICS ON MEDICINES 2009 & 2010
9. Sacks, F.M., Pfeffer, M.A.; Moye, L.A., et al. The effect of pravastatin on coronary events after myocardial infarction in patients with average cholesterol levels: Cholesterol and Recurrent Events Trial investigators. N. Engl. J. Med. 1996, 335, 1001–1009.
10. Grundy, S.M., Cleement, J.I., Merz, C.N.; et al. Implications of recent clinical trials for the National Cholesterol Education Program Adult Treatment Panel III guidelines. J. Am. Coll. Cardiol. 2004, 44(3), 720-732.
11. Smith, S.C. Jr., Allen, J., Blair, S.N., et al. ACC/AHA guidelines for secondary prevention for patients with coronary and other atherosclerotic vascular disease: 2006 update: endorsed by the National Heart, Lung and Blood Institute. Circulation 2006, 113(19), 2363-2372.
12. Clinical Practice Guidelines: Management of Dyslipidemia 2011. 4th edition. Ministry of Health, June 2011.
13. Van der Harst, P., Voors, A.A., et al. Intensive versus moderate lipid lowering with statins after acute coronary syndromes. N. Engl. J. Med. 2004, 351, 714-717.
14. Waters, D.D., Guyton, J.R., Herrington, D.M., et al. Treating to New Targets (TNT) Study: does lowering low-density lipoprotein cholesterol levels below currently recommended guidelines yield incremental clinical benefit? Am. J. Cardiol. 2004, 93, 154-158.
15. Stone, N.J., Robinson, J., Lichtenstein, A.H., et al. 2013 ACC/AHA guideline on the treatment of blood cholesterol to reduce atherosclerotic cardiovascular risk in adults: a report of the American College of Cardiology/American Heart Association Task Force on Practice Guidelines. J Am Coll Cardiol. 2013; DOI:10.1016/j.jacc.2013.11.002.
16. Wan Ahmad, W.A., Ramesh, S.V., Zambahari, R. Malaysia-ACute CORonary syndromes Descriptive study (ACCORD): Evaluation of the compliance with existing guidelines in patients with Acute Coronary Sydrome. Singapore Med. J. 2011, 52(7), 508-511.
17. Finnish Statistics on Medicines 2010. Finnish Medicines Agency Fimea & Social Insurance Institution, Helsinki 2011.
18. Sakshaug, S. Drug Consumption in Norway 2008-2012 (Legemiddelforbruket i Norge 2008-2012), Norwegian Institute of Public Health, Oslo, legemiddelstatistikk 2013:1
19. Australian Statistics on Medicines 2010. Australian Government Department of Health and Ageing. Commonwealth of Australia 2012.
73
MALAYSIAN STATISTICS ON MEDICINES 2009 & 2010
CHAPTER 11 :USE OF DERMATOLOGICALS
Azura M.A.1, Suganthi T. 1, Chan L.C.2, Choon S.E.3, Chang S.Y.4, Roshidah B.5
1. Hospital Kuala Lumpur, Kuala Lumpur 2. Hospital Pulau Pinang, Pulau Pinang 3. Hospital Sultanah Aminah, Johor Bahru 4. Hospital Raja Permaisuri Bainun , Ipoh 5. Hospital Melaka, Melaka.
Topical medications remain the mainstay treatment for many dermatological conditions1-3. Data collected were analysed to determine the trend of utilisation in both the public and private sectors. Dermatological medications included in this study were antifungals, anti-psoriatics, antibiotics, antivirals, corticosteroids, anti-acne agents, hair growth stimulants, depigmenting agents and calcineurin inhibitors. Utilisation of topical medication is measured in g/ml/1000 population/day, whereas the utilisation of systemic agent is measured in DDD/1000 population/day. The utilization of topical antifungals except selenium sulfide had dropped by 60.0% from 2009 to 2010. Topical azoles were the most commonly prescribed antifungal. Single agent topical azoles were preferred by the public sector, whereas fixed dose combinations of azole with corticosteroids were favoured by the private sector in both 2009 and 20104. Similarly the utilization of systemic antifungals such as griseofulvin, itraconazole, ketoconazole and terbinafine has dropped by 50.0%. The most commonly prescribed systemic antifungal was ketoconazole followed by griseofulvin, fluconazole, itraconazole and terbinafine. The reduction in the usage of both topical and systemic antifungal was an interesting observation. The overall usage of oral ketoconazole had declined by almost 50.0% possibly due to heightened awareness of its potential hepatotoxicity5. This reduction in ketoconazole use may explain the increase use of selenium compound, an alternative treatment of pityriasis versicolor.
There was no data available on the usage of tar-based preparation, despite its wide use in the public sector. This finding was also observed in the previous report. As with the previous year, it was not possible to analyse the use of topical corticosteroids for psoriasis, as the information on its use for individual dermatological conditions was unavailable. Dithranol, although effective, had the potential to irritate and stain the skin, thus out of favour in both the private and public sectors6. The total utilization of calcipotriol had dropped by 30.0% from 2009 to 2010, mainly due to reduced usage in the private sector. There was an overall increased usage of calcipotriol combination, due to marked increased usage in the public sector by 14 fold. It was not possible to determine the utilisation pattern of systemic antipsoriatic agents, as this survey did not document the indications for treatment. Methotrexate and cyclosporin, two conventional systemic anti-psoriatic agents, were also used in other non-dermatological conditions. Acitretin use for the treatment of psoriasis continued to decrease over the past four years.
The overall usage of topical methoxsalen had increased by 150% from 2009 to 2010. However, the overall use of oral methoxsalen has decreased by 65.0% from 2009 to 2010. This was because PUVA therapy as a treatment option for psoriasis had gone out of favour in the private sector7.
There was an overall reduction of 64.0% in the usage of topical antibiotic from 2009 to 2010. There was a dramatic reduction in the use of topical fucidic acid in the private sector. The two commonly used topical antibiotics were fusidic acid and neomycin. The two least favoured topical antibiotics were chloramphenicol and amikacin.
The usage of silver sulfadiazine has reduced from 2009 to 2010, probably due to the awareness of its sensitizing effects. There was also a marked reduction in the usage of topical acyclovir from 2009 to 2010. The usage of imiquimod, an effective treatment for genital wart8, remained low, probably due to its high cost.
There was an overall increase in the usage of topical steroid from 2009 to 2010. There was a 2.7 fold increase in the usage of topical steroid in the public sector. However, there was a marked reduction in the usage in the private sector. The two most frequently prescribed topical corticosteroids were betamethasone and hydrocortisone, whilst the least prescribed topical corticosteroid was flucinonide. The overall usage of very potent topical corticosteroid, such as clobetasol had dropped by three folds. When the frequency of the usage of individual topical corticosteroids in 2009 and 2010 was analyzed, very potent corticosteroid (clobetasol) accounted for 13% of overall topical corticosteroids usage in the private sector versus 1% in the public sector.
Fixed dose combination of betamethasone and antibiotic was the preferred combination in both the public and private sectors. The use of topical steroid and antibiotic combination was high in the private sector, compared to the public sector. However the overall usage of this combination had dropped. Combination of betamethasone and salicylic acid was mainly utilized in the private sector as compared to the public sector in both years.
Fusidic acid remained the preferred choice in both topical and medicated dressing. However its overall usage was low in both sectors.
Topical treatment for acne vulgaris includes benzoyl peroxide, retinoid, topical antibiotic and azelaic acid9,10.
The preference of topical anti-acne medications differed between the public and private sectors. In the absence of
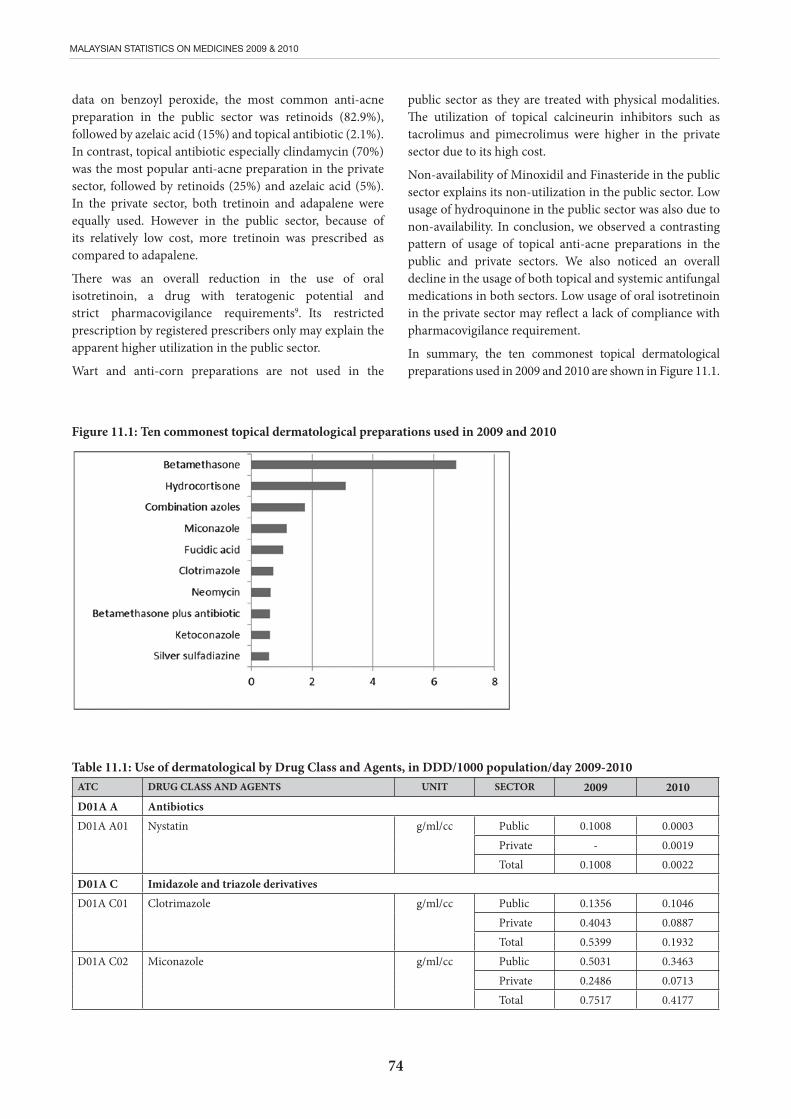
74
MALAYSIAN STATISTICS ON MEDICINES 2009 & 2010
data on benzoyl peroxide, the most common anti-acne preparation in the public sector was retinoids (82.9%), followed by azelaic acid (15%) and topical antibiotic (2.1%). In contrast, topical antibiotic especially clindamycin (70%) was the most popular anti-acne preparation in the private sector, followed by retinoids (25%) and azelaic acid (5%). In the private sector, both tretinoin and adapalene were equally used. However in the public sector, because of its relatively low cost, more tretinoin was prescribed as compared to adapalene.
There was an overall reduction in the use of oral isotretinoin, a drug with teratogenic potential and strict pharmacovigilance requirements9. Its restricted prescription by registered prescribers only may explain the apparent higher utilization in the public sector.
Wart and anti-corn preparations are not used in the
public sector as they are treated with physical modalities. The utilization of topical calcineurin inhibitors such as tacrolimus and pimecrolimus were higher in the private sector due to its high cost.
Non-availability of Minoxidil and Finasteride in the public sector explains its non-utilization in the public sector. Low usage of hydroquinone in the public sector was also due to non-availability. In conclusion, we observed a contrasting pattern of usage of topical anti-acne preparations in the public and private sectors. We also noticed an overall decline in the usage of both topical and systemic antifungal medications in both sectors. Low usage of oral isotretinoin in the private sector may reflect a lack of compliance with pharmacovigilance requirement.
In summary, the ten commonest topical dermatological preparations used in 2009 and 2010 are shown in Figure 11.1.
Table 11.1: Use of dermatological by Drug Class and Agents, in DDD/1000 population/day 2009-2010
ATC DRUG CLASS AND AGENTS UNIT SECTOR 2009 2010D01A A Antibiotics D01A A01
Nystatin g/ml/cc Public 0.1008 0.0003Private - 0.0019Total 0.1008 0.0022
D01A C Imidazole and triazole derivativesD01A C01
Clotrimazole g/ml/cc Public 0.1356 0.1046Private 0.4043 0.0887Total 0.5399 0.1932
D01A C02
Miconazole g/ml/cc Public 0.5031 0.3463Private 0.2486 0.0713Total 0.7517 0.4177
Figure 11.1: Ten commonest topical dermatological preparations used in 2009 and 2010
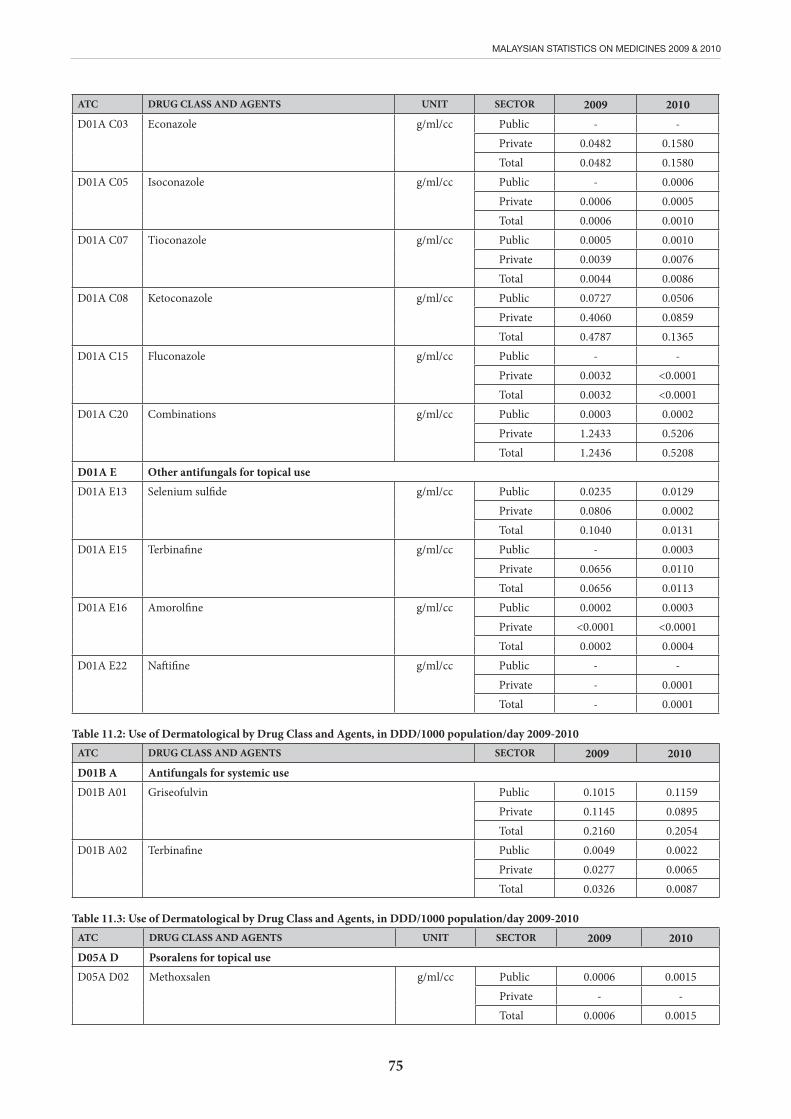
75
MALAYSIAN STATISTICS ON MEDICINES 2009 & 2010
ATC DRUG CLASS AND AGENTS UNIT SECTOR 2009 2010D01A C03
Econazole g/ml/cc Public - -Private 0.0482 0.1580Total 0.0482 0.1580
D01A C05 Isoconazole g/ml/cc Public - 0.0006Private 0.0006 0.0005Total 0.0006 0.0010
D01A C07 Tioconazole g/ml/cc Public 0.0005 0.0010Private 0.0039 0.0076Total 0.0044 0.0086
D01A C08 Ketoconazole g/ml/cc Public 0.0727 0.0506Private 0.4060 0.0859Total 0.4787 0.1365
D01A C15 Fluconazole g/ml/cc Public - -Private 0.0032 <0.0001Total 0.0032 <0.0001
D01A C20 Combinations g/ml/cc Public 0.0003 0.0002Private 1.2433 0.5206Total 1.2436 0.5208
D01A E Other antifungals for topical use D01A E13 Selenium sulfide g/ml/cc Public 0.0235 0.0129
Private 0.0806 0.0002Total 0.1040 0.0131
D01A E15 Terbinafine g/ml/cc Public - 0.0003Private 0.0656 0.0110Total 0.0656 0.0113
D01A E16 Amorolfine g/ml/cc Public 0.0002 0.0003Private <0.0001 <0.0001Total 0.0002 0.0004
D01A E22
Naftifine g/ml/cc Public - -Private - 0.0001Total - 0.0001
Table 11.2: Use of Dermatological by Drug Class and Agents, in DDD/1000 population/day 2009-2010ATC DRUG CLASS AND AGENTS SECTOR 2009 2010D01B A Antifungals for systemic useD01B A01
Griseofulvin Public 0.1015 0.1159Private 0.1145 0.0895Total 0.2160 0.2054
D01B A02
Terbinafine Public 0.0049 0.0022Private 0.0277 0.0065Total 0.0326 0.0087
Table 11.3: Use of Dermatological by Drug Class and Agents, in DDD/1000 population/day 2009-2010ATC DRUG CLASS AND AGENTS UNIT SECTOR 2009 2010D05A D Psoralens for topical use D05A D02
Methoxsalen g/ml/cc Public 0.0006 0.0015Private - -Total 0.0006 0.0015
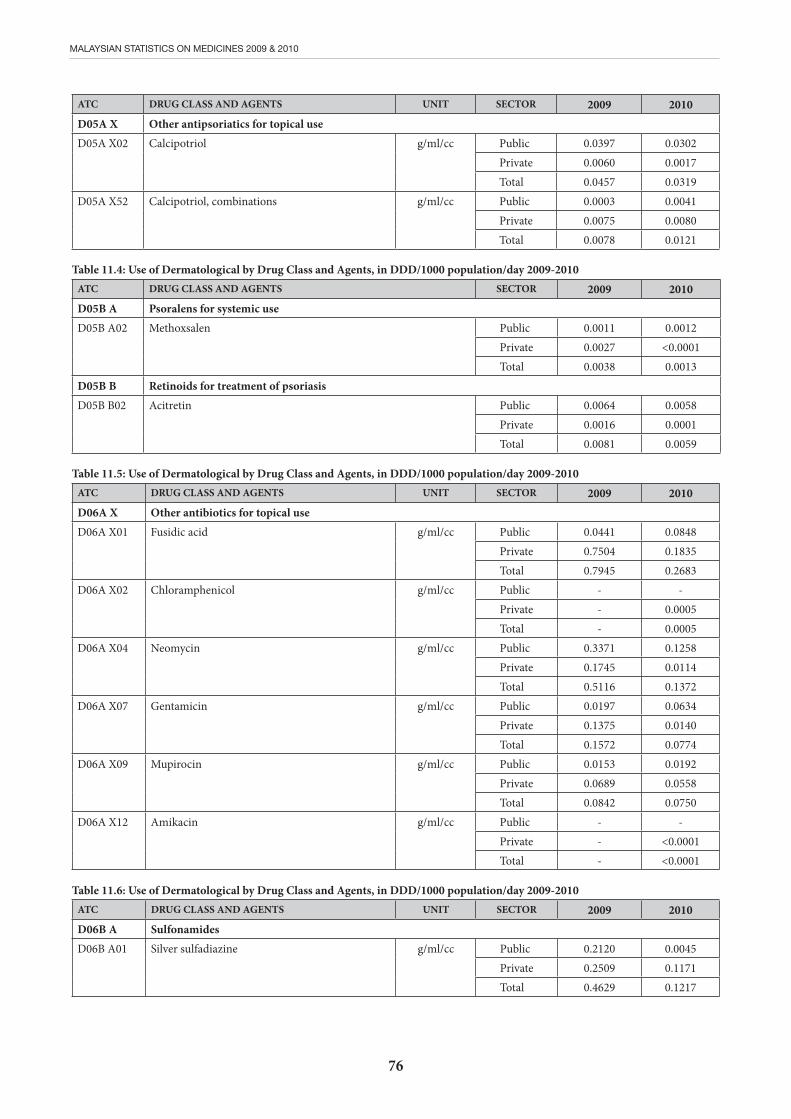
76
MALAYSIAN STATISTICS ON MEDICINES 2009 & 2010
ATC DRUG CLASS AND AGENTS UNIT SECTOR 2009 2010D05A X Other antipsoriatics for topical useD05A X02
Calcipotriol g/ml/cc Public 0.0397 0.0302Private 0.0060 0.0017Total 0.0457 0.0319
D05A X52
Calcipotriol, combinations g/ml/cc Public 0.0003 0.0041Private 0.0075 0.0080Total 0.0078 0.0121
Table 11.4: Use of Dermatological by Drug Class and Agents, in DDD/1000 population/day 2009-2010ATC DRUG CLASS AND AGENTS SECTOR 2009 2010D05B A Psoralens for systemic use D05B A02
Methoxsalen Public 0.0011 0.0012Private 0.0027 <0.0001Total 0.0038 0.0013
D05B B Retinoids for treatment of psoriasis D05B B02
Acitretin Public 0.0064 0.0058Private 0.0016 0.0001Total 0.0081 0.0059
Table 11.5: Use of Dermatological by Drug Class and Agents, in DDD/1000 population/day 2009-2010ATC DRUG CLASS AND AGENTS UNIT SECTOR 2009 2010D06A X Other antibiotics for topical useD06A X01
Fusidic acid g/ml/cc Public 0.0441 0.0848Private 0.7504 0.1835Total 0.7945 0.2683
D06A X02
Chloramphenicol g/ml/cc Public - -Private - 0.0005Total - 0.0005
D06A X04
Neomycin g/ml/cc Public 0.3371 0.1258Private 0.1745 0.0114Total 0.5116 0.1372
D06A X07
Gentamicin g/ml/cc Public 0.0197 0.0634Private 0.1375 0.0140Total 0.1572 0.0774
D06A X09
Mupirocin g/ml/cc Public 0.0153 0.0192Private 0.0689 0.0558Total 0.0842 0.0750
D06A X12
Amikacin g/ml/cc Public - -Private - <0.0001Total - <0.0001
Table 11.6: Use of Dermatological by Drug Class and Agents, in DDD/1000 population/day 2009-2010ATC DRUG CLASS AND AGENTS UNIT SECTOR 2009 2010D06B A Sulfonamides D06B A01
Silver sulfadiazine g/ml/cc Public 0.2120 0.0045Private 0.2509 0.1171Total 0.4629 0.1217
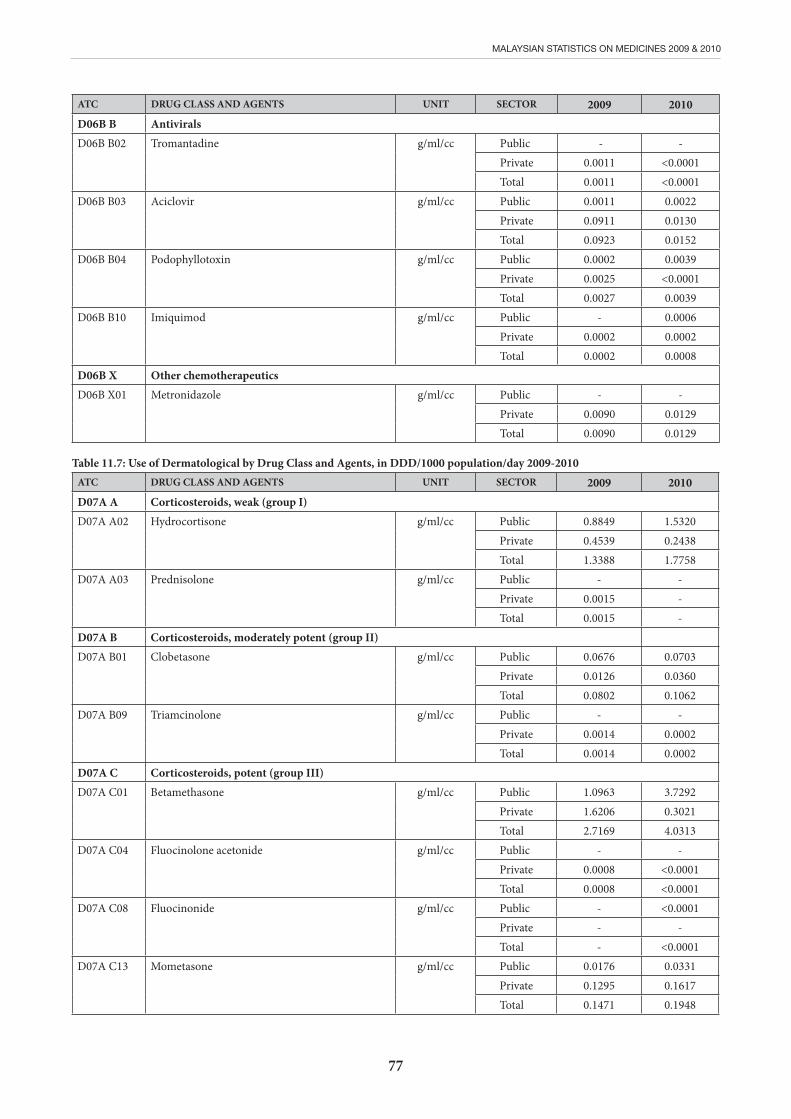
77
MALAYSIAN STATISTICS ON MEDICINES 2009 & 2010
ATC DRUG CLASS AND AGENTS UNIT SECTOR 2009 2010D06B B AntiviralsD06B B02
Tromantadine g/ml/cc Public - -Private 0.0011 <0.0001Total 0.0011 <0.0001
D06B B03
Aciclovir g/ml/cc Public 0.0011 0.0022Private 0.0911 0.0130Total 0.0923 0.0152
D06B B04
Podophyllotoxin g/ml/cc Public 0.0002 0.0039Private 0.0025 <0.0001Total 0.0027 0.0039
D06B B10
Imiquimod g/ml/cc Public - 0.0006Private 0.0002 0.0002Total 0.0002 0.0008
D06B X Other chemotherapeutics D06B X01
Metronidazole g/ml/cc Public - -Private 0.0090 0.0129Total 0.0090 0.0129
Table 11.7: Use of Dermatological by Drug Class and Agents, in DDD/1000 population/day 2009-2010ATC DRUG CLASS AND AGENTS UNIT SECTOR 2009 2010D07A A Corticosteroids, weak (group I)D07A A02
Hydrocortisone g/ml/cc Public 0.8849 1.5320Private 0.4539 0.2438Total 1.3388 1.7758
D07A A03
Prednisolone g/ml/cc Public - -Private 0.0015 -Total 0.0015 -
D07A B Corticosteroids, moderately potent (group II)D07A B01
Clobetasone g/ml/cc Public 0.0676 0.0703Private 0.0126 0.0360Total 0.0802 0.1062
D07A B09
Triamcinolone g/ml/cc Public - -Private 0.0014 0.0002Total 0.0014 0.0002
D07A C Corticosteroids, potent (group III)D07A C01
Betamethasone g/ml/cc Public 1.0963 3.7292Private 1.6206 0.3021Total 2.7169 4.0313
D07A C04
Fluocinolone acetonide g/ml/cc Public - -Private 0.0008 <0.0001Total 0.0008 <0.0001
D07A C08
Fluocinonide g/ml/cc Public - <0.0001Private - -Total - <0.0001
D07A C13
Mometasone g/ml/cc Public 0.0176 0.0331Private 0.1295 0.1617Total 0.1471 0.1948
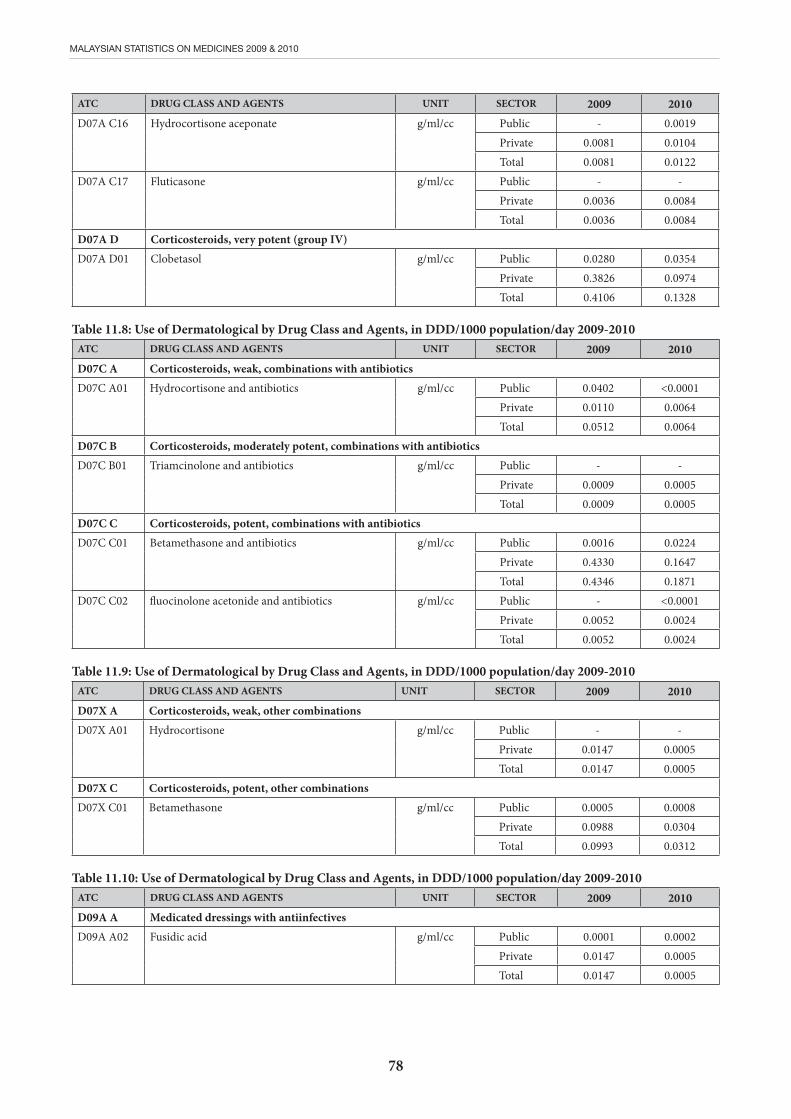
78
MALAYSIAN STATISTICS ON MEDICINES 2009 & 2010
ATC DRUG CLASS AND AGENTS UNIT SECTOR 2009 2010D07A C16
Hydrocortisone aceponate g/ml/cc Public - 0.0019Private 0.0081 0.0104Total 0.0081 0.0122
D07A C17
Fluticasone g/ml/cc Public - -Private 0.0036 0.0084Total 0.0036 0.0084
D07A D Corticosteroids, very potent (group IV)D07A D01
Clobetasol g/ml/cc Public 0.0280 0.0354Private 0.3826 0.0974Total 0.4106 0.1328
Table 11.8: Use of Dermatological by Drug Class and Agents, in DDD/1000 population/day 2009-2010ATC DRUG CLASS AND AGENTS UNIT SECTOR 2009 2010D07C A Corticosteroids, weak, combinations with antibioticsD07C A01
Hydrocortisone and antibiotics g/ml/cc Public 0.0402 <0.0001Private 0.0110 0.0064Total 0.0512 0.0064
D07C B Corticosteroids, moderately potent, combinations with antibioticsD07C B01
Triamcinolone and antibiotics g/ml/cc Public - -Private 0.0009 0.0005Total 0.0009 0.0005
D07C C Corticosteroids, potent, combinations with antibioticsD07C C01
Betamethasone and antibiotics g/ml/cc Public 0.0016 0.0224Private 0.4330 0.1647Total 0.4346 0.1871
D07C C02
fluocinolone acetonide and antibiotics g/ml/cc Public - <0.0001Private 0.0052 0.0024Total 0.0052 0.0024
Table 11.9: Use of Dermatological by Drug Class and Agents, in DDD/1000 population/day 2009-2010ATC DRUG CLASS AND AGENTS UNIT SECTOR 2009 2010D07X A Corticosteroids, weak, other combinations D07X A01
Hydrocortisone g/ml/cc Public - -Private 0.0147 0.0005Total 0.0147 0.0005
D07X C Corticosteroids, potent, other combinations D07X C01
Betamethasone g/ml/cc Public 0.0005 0.0008Private 0.0988 0.0304Total 0.0993 0.0312
Table 11.10: Use of Dermatological by Drug Class and Agents, in DDD/1000 population/day 2009-2010ATC DRUG CLASS AND AGENTS UNIT SECTOR 2009 2010D09A A Medicated dressings with antiinfectivesD09A A02
Fusidic acid g/ml/cc Public 0.0001 0.0002Private 0.0147 0.0005Total 0.0147 0.0005
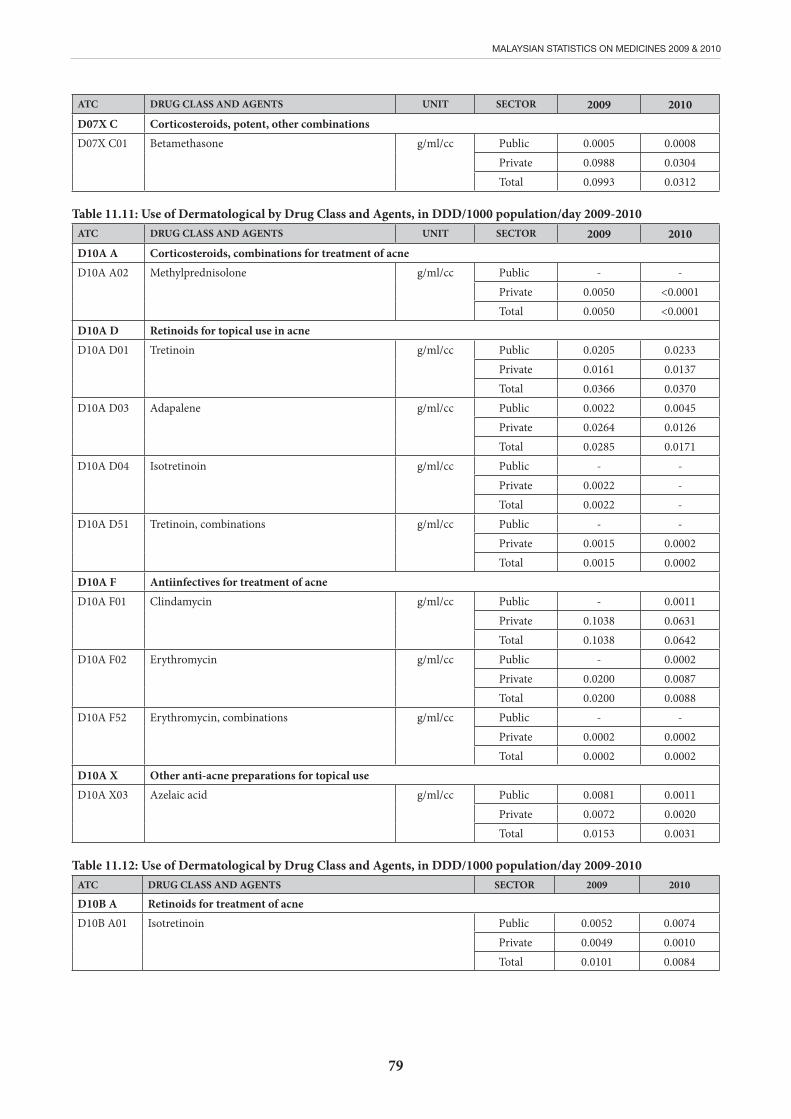
79
MALAYSIAN STATISTICS ON MEDICINES 2009 & 2010
ATC DRUG CLASS AND AGENTS UNIT SECTOR 2009 2010D07X C Corticosteroids, potent, other combinations D07X C01
Betamethasone g/ml/cc Public 0.0005 0.0008Private 0.0988 0.0304Total 0.0993 0.0312
Table 11.11: Use of Dermatological by Drug Class and Agents, in DDD/1000 population/day 2009-2010ATC DRUG CLASS AND AGENTS UNIT SECTOR 2009 2010D10A A Corticosteroids, combinations for treatment of acne D10A A02
Methylprednisolone g/ml/cc Public - -Private 0.0050 <0.0001Total 0.0050 <0.0001
D10A D Retinoids for topical use in acne D10A D01
Tretinoin g/ml/cc Public 0.0205 0.0233Private 0.0161 0.0137Total 0.0366 0.0370
D10A D03
Adapalene g/ml/cc Public 0.0022 0.0045Private 0.0264 0.0126Total 0.0285 0.0171
D10A D04
Isotretinoin g/ml/cc Public - -Private 0.0022 -Total 0.0022 -
D10A D51
Tretinoin, combinations g/ml/cc Public - -Private 0.0015 0.0002Total 0.0015 0.0002
D10A F Antiinfectives for treatment of acne D10A F01
Clindamycin g/ml/cc Public - 0.0011Private 0.1038 0.0631Total 0.1038 0.0642
D10A F02
Erythromycin g/ml/cc Public - 0.0002Private 0.0200 0.0087Total 0.0200 0.0088
D10A F52
Erythromycin, combinations g/ml/cc Public - -Private 0.0002 0.0002Total 0.0002 0.0002
D10A X Other anti-acne preparations for topical use D10A X03
Azelaic acid g/ml/cc Public 0.0081 0.0011Private 0.0072 0.0020Total 0.0153 0.0031
Table 11.12: Use of Dermatological by Drug Class and Agents, in DDD/1000 population/day 2009-2010ATC DRUG CLASS AND AGENTS SECTOR 2009 2010
D10B A Retinoids for treatment of acne D10B A01
Isotretinoin Public 0.0052 0.0074Private 0.0049 0.0010Total 0.0101 0.0084

80
MALAYSIAN STATISTICS ON MEDICINES 2009 & 2010
Table 11.13: Use of Dermatological by Drug Class and Agents, in DDD/1000 population/day 2009-2010ATC DRUG CLASS AND AGENTS UNIT SECTOR 2009 2010D11A C Medicated shampoos D11A C03
Selenium compounds g/ml/cc Public 0.0586 0.4303Private 0.0687 0.0181Total 0.1274 0.4484
D11A F Wart and anti-corn preparations D11A F00
Wart and anti-corn preparations g/ml/cc Public - -Private 0.0020 0.0006Total 0.0020 0.0006
D11A H Agents for dermatitis, excluding corticosteroids D11A H01
Tacrolimus g/ml/cc Public 0.0003 0.0006Private 0.0051 0.0061Total 0.0054 0.0067
D11A H02
Pimecrolimus g/ml/cc Public <0.0001 0.0003Private 0.0001 0.0003Total 0.0001 0.0005
D11A X Other dermatologicals D11A X01
Minoxidil g/ml/cc Public - -Private 0.0076 0.0073Total 0.0076 0.0073
D11A X10
Finasteride mg Public <0.0001 -Private 0.0019 0.0008Total 0.0020 0.0008
D11A X11
Hydroquinone g/ml/cc Public - 0.0008Private 0.0038 0.0052Total 0.0038 0.0060
Table 11.14: Use of Antifungal in Dermatology by Drug Class and Agents, in DDD/1000 population/day 2009-2010ATC DRUG CLASS AND AGENTS UNIT SECTOR 2009 2010J02A B Imidazole derivatives J02A B02
Ketoconazole g Public 0.0069 0.0127Private 0.2996 0.1439Total 0.3065 0.1566
J02A C Triazole derivatives J02A C01
Fluconazole g Public 0.0140 0.0181Private 0.0569 0.0418Total 0.0708 0.0599
J02A C02
Itraconazole g Public 0.0262 0.0202Private 0.0169 0.0143Total 0.0431 0.0345
J02A C03 Voriconazole g Public 0.0004 0.0011Private <0.0001 0.0001Total 0.0004 0.0012
81
MALAYSIAN STATISTICS ON MEDICINES 2009 & 2010
References :1. Malaysian Statistics on Medicines 2008; Pharmaceutical Services Division & Clinical Research Centre, Ministry of
Health Malaysia Printing Office: Kuala Lumpur 2013.
2. Australian Statistics on Medicine 2010 16th Edition; Australian Government Department of Health and Ageing Printing Office: Commonwealth of Australia 2012.
3. Consumption in the Nordic Countries 2004-2008; Nordic Medico Statistical Committee, Medicines Printing Office: Copenhagen 2009.
4. Greenberg, H.L.; Shwayder, T.A.; Bieszk, N. et al. Clotrimazole/ Betamethasone Diproprionate: A review of cost and complications in the treatment of common cutaneous fungal infections. Pediatric Dermatology 2002,19(1),78-81.
5. García, R.; Duque.; Castellsague.; Pérez-Gutthann.; Stricker. A cohort study on the risk of acute liver injury among users of ketoconazole and other antifungal drugs. British Journal of Clinical Pharmacology 1999,48(6),847–852.
6. Yawalkar, N.;Management of Psoriasis; Karger; Switzerland, 2009; pp 162.
7. Kunnamo, I.;Evidence-based Medicine Guidelines; Wiley; West Sussex, 2005; pp 441.
8. Tyring, S.; Conant, M.; Marini, M. et al. Imiquimod: An international updates on therapeutic uses in dermatology. Int J Dermatol 2002,41,810-816.
9. Stein, R.H.; Lebwohl, M. Acne Therapy: Clinical Pearls. Seminars In Cutaneous Medicine and Surgery 2001,20(3),184-189.
10. Thielitz, A.; Abdel-Naser, M.B.; Fluhr, J.W. et al. Topical retinoids in acne –an evidence-based overview. J Dtsch Dermatol Ges 2008,6(12),1023-1031.

82
MALAYSIAN STATISTICS ON MEDICINES 2009 & 2010
CHAPTER 12: USE OF GYNAECOLOGICALS, SEX HORMONES AND HORMONAL CONTRACEPTIVES
Ravindran J.1, Maisarah A.H.1, Nik Mohd Nasri N.I.2, Wan Hamilton W.H.3, Zaridah S.4
1. Kuala Lumpur Hospital, Kuala Lumpur 2. Malaysian Islamic Science University, Negeri Sembilan 3. Serdang Hospital, Selangor, 4. Tunku Fauziah Hospital, Perlis. This chapter reviews the trends in drug usage in Obstetrics & Gynaecology (O&G) for the years 2009 to 2010. The initiation of a number of health clinics named as 1Malaysia Clinics in 2010 contributed to a change in prescribing patterns in O&G drugs as the policy for these clinics allowed the prescription of some gynaecologicals and hormonal contraceptives by assistant medical officers and community nurses.
The use of gynaecological anti-infectives and antiseptics showed a marked increase in 2009 and 2010 as compared with 2008. Usage of other gynaecologicals (oxytocics, prostaglandins, prolactin inhibitors and atosiban) was slightly reduced in 2009 but increased up to 10 fold in 2010, whereas sex hormones and modulators of the genital system showed a marked increase in 2009 as compared to 2008. The use then doubled in 2010.
The overall increase in anti-infectives and antiseptics can be correlated to the rising caesarean section rate and almost universal use of prophylactic antibiotics in all obstetric and gynaecological surgery. It was noted that universal prophylaxis antibiotics usage in Obstetrics and Gynaecology was classified under anti-infective groups and some of the imidazole derivatives such as miconazole, econazole and metronidazole were also classified under the dermatological and anti-infective groups. The use of imidazole derivatives in gynaecological practice is quite prevalent especially as treatment and prophylaxis for anaerobic infections as well as fungal infections in the reproductive tract.
The use of nystatin continued to show marked reduction in 2008 but usage has shown marked increase (almost 200 times) in 2010. This may be due to the opening of 1Malaysia Clinic as alluded to earlier and cheaper cost as compared to the alternatives.
The utilization of oxytoxics dropped from in 2009 as compared to 2008 but increased in 2010. Methylergometrine was still used in private hospitals with marked reducing trends in the period studied. However in public hospitals, it was not used at all for both years. On the contrary, the public hospitals utilised ergometrine more than the private. The utilization of oxytocin and syntometrine is not yet captured in this survey although the recommendation was made in 2008 MSOM. Future drug utilisation reviews should capture the use of oxytocin and syntometrine as these oxytocics are more relevant to current evidence based protocols.
Carboprost had doubled its utilization in this survey. Although carboprost is an expensive uterotonic drug, it is utilized because it is one of the first line prostaglandins in the protocol for the management of primary post partum haemorrhage.
Preterm labour and births still remain a significant health issue in Malaysian obstetric practice. The suppression of preterm labour is the still the main strategy used to prevent preterm births. The use of tocolytic agents such as nifedipine, salbutamol and terbutalinefor the indication of preterm labour remain outside the scope of this chapter as the main indication for the use of these drugs is other than for an obstetric indication. It is hoped that the use of the main drug for this indication i.e. nifedipine will be captured in future years. The use of atosiban which is the only registered drug for the indication of suppression of preterm labour remains very low in both years in both the private and public sectors.
Bromocriptine use continues to show the decline which was evident over 2007-2008 in both sectors. Bromocriptine was still the prevalent prolactin inhibitor used in Malaysia compared to cabergoline. There was a minimal increase in cabergoline use in the public sector in 2010 compared to 2009. It was not possible to separate the use of prolactin inhibitors for the indications of suppression of lactation and hyperprolactinemia in this survey. It had been previously recommended that there should be a reversal towards favouring cabergoline instead of bromocriptine due to the worries of cardiovascular complications and the worries of the risk of the concurrent use of anti-hypertensives with bromocriptine, especially in pre-eclamptic mothers. This change in prescribing pattern was not yet evident in the current survey.
Hormonal contraceptives for systemic use continued its sharp increase compared to the previous years. The increase was contributed mainly by the increase in the usage of fixed combination oestrogens and progestogens such as levonorgesterel and oestrogen in the public sector. This may have been due to a policy to use contraception as a strategy to reduce maternal mortality in the effort to meet MDG 5 targets. No significant increase in the use of other contraceptives was noted.
Emergency contraceptive use showed a decline in 2009 before increasing to previous levels in 2010. This was mainly contributed by the increase in the use of levonorgesterel in
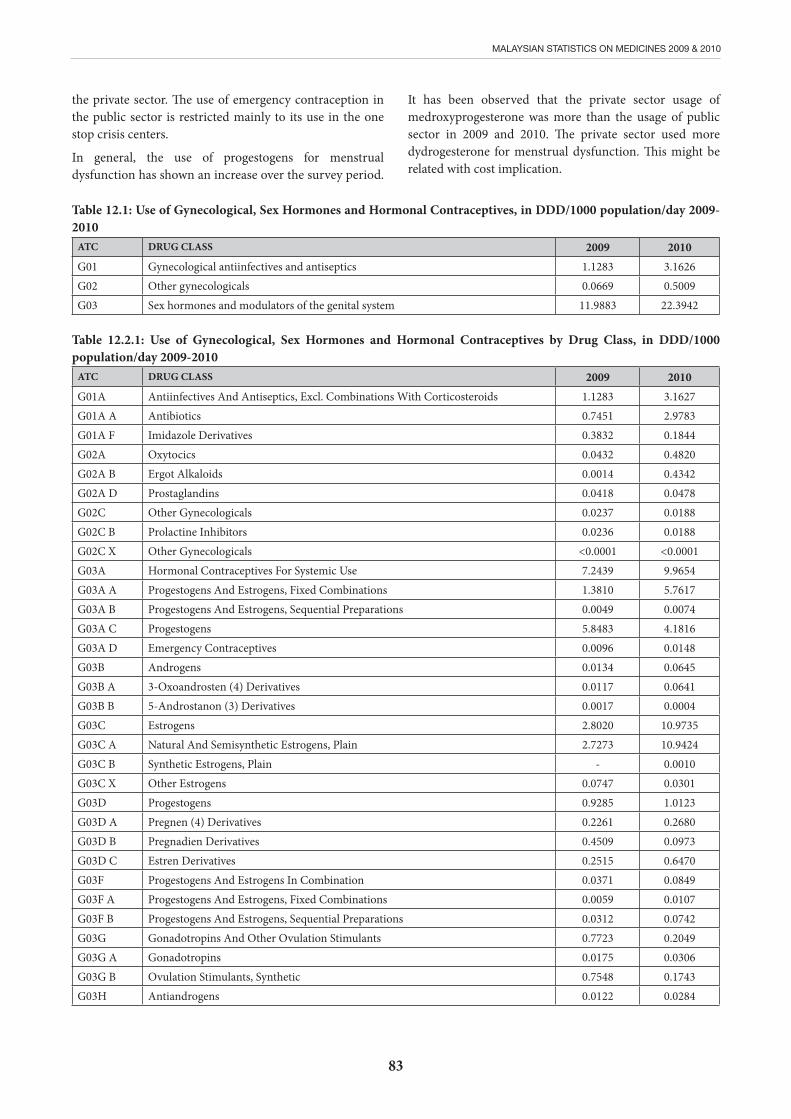
83
MALAYSIAN STATISTICS ON MEDICINES 2009 & 2010
the private sector. The use of emergency contraception in the public sector is restricted mainly to its use in the one stop crisis centers.
In general, the use of progestogens for menstrual dysfunction has shown an increase over the survey period.
It has been observed that the private sector usage of medroxyprogesterone was more than the usage of public sector in 2009 and 2010. The private sector used more dydrogesterone for menstrual dysfunction. This might be related with cost implication.
Table 12.1: Use of Gynecological, Sex Hormones and Hormonal Contraceptives, in DDD/1000 population/day 2009-2010
ATC DRUG CLASS 2009 2010G01 Gynecological antiinfectives and antiseptics 1.1283 3.1626G02 Other gynecologicals 0.0669 0.5009G03 Sex hormones and modulators of the genital system 11.9883 22.3942
Table 12.2.1: Use of Gynecological, Sex Hormones and Hormonal Contraceptives by Drug Class, in DDD/1000 population/day 2009-2010
ATC DRUG CLASS 2009 2010G01A Antiinfectives And Antiseptics, Excl. Combinations With Corticosteroids 1.1283 3.1627G01A A Antibiotics 0.7451 2.9783G01A F Imidazole Derivatives 0.3832 0.1844G02A Oxytocics 0.0432 0.4820G02A B Ergot Alkaloids 0.0014 0.4342G02A D Prostaglandins 0.0418 0.0478G02C Other Gynecologicals 0.0237 0.0188G02C B Prolactine Inhibitors 0.0236 0.0188G02C X Other Gynecologicals <0.0001 <0.0001G03A Hormonal Contraceptives For Systemic Use 7.2439 9.9654G03A A Progestogens And Estrogens, Fixed Combinations 1.3810 5.7617G03A B Progestogens And Estrogens, Sequential Preparations 0.0049 0.0074G03A C Progestogens 5.8483 4.1816G03A D Emergency Contraceptives 0.0096 0.0148G03B Androgens 0.0134 0.0645G03B A 3-Oxoandrosten (4) Derivatives 0.0117 0.0641G03B B 5-Androstanon (3) Derivatives 0.0017 0.0004G03C Estrogens 2.8020 10.9735G03C A Natural And Semisynthetic Estrogens, Plain 2.7273 10.9424G03C B Synthetic Estrogens, Plain - 0.0010G03C X Other Estrogens 0.0747 0.0301G03D Progestogens 0.9285 1.0123G03D A Pregnen (4) Derivatives 0.2261 0.2680G03D B Pregnadien Derivatives 0.4509 0.0973G03D C Estren Derivatives 0.2515 0.6470G03F Progestogens And Estrogens In Combination 0.0371 0.0849G03F A Progestogens And Estrogens, Fixed Combinations 0.0059 0.0107G03F B Progestogens And Estrogens, Sequential Preparations 0.0312 0.0742G03G Gonadotropins And Other Ovulation Stimulants 0.7723 0.2049G03G A Gonadotropins 0.0175 0.0306G03G B Ovulation Stimulants, Synthetic 0.7548 0.1743G03H Antiandrogens 0.0122 0.0284
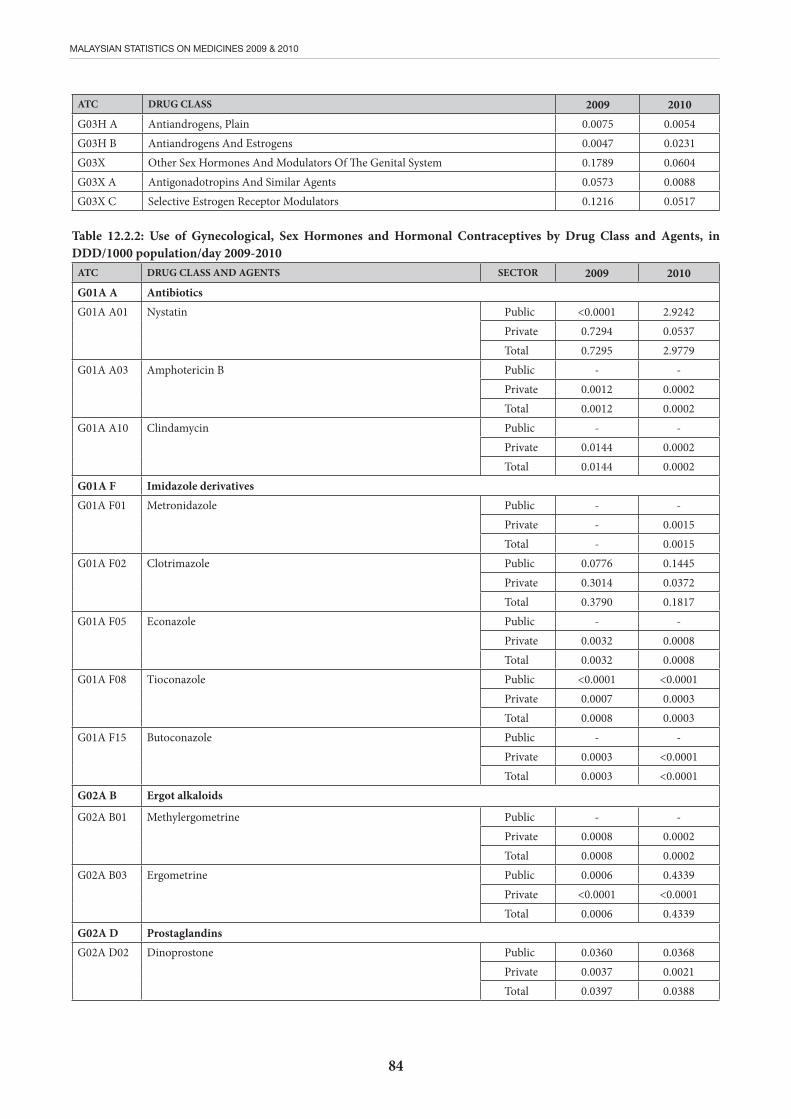
84
MALAYSIAN STATISTICS ON MEDICINES 2009 & 2010
ATC DRUG CLASS 2009 2010G03H A Antiandrogens, Plain 0.0075 0.0054G03H B Antiandrogens And Estrogens 0.0047 0.0231G03X Other Sex Hormones And Modulators Of The Genital System 0.1789 0.0604G03X A Antigonadotropins And Similar Agents 0.0573 0.0088G03X C Selective Estrogen Receptor Modulators 0.1216 0.0517
Table 12.2.2: Use of Gynecological, Sex Hormones and Hormonal Contraceptives by Drug Class and Agents, in DDD/1000 population/day 2009-2010
ATC DRUG CLASS AND AGENTS SECTOR 2009 2010G01A A AntibioticsG01A A01
Nystatin Public <0.0001 2.9242Private 0.7294 0.0537Total 0.7295 2.9779
G01A A03
Amphotericin B Public - -Private 0.0012 0.0002Total 0.0012 0.0002
G01A A10
Clindamycin Public - -Private 0.0144 0.0002Total 0.0144 0.0002
G01A F Imidazole derivativesG01A F01
Metronidazole Public - -Private - 0.0015Total - 0.0015
G01A F02
Clotrimazole Public 0.0776 0.1445Private 0.3014 0.0372Total 0.3790 0.1817
G01A F05
Econazole Public - -Private 0.0032 0.0008Total 0.0032 0.0008
G01A F08
Tioconazole Public <0.0001 <0.0001Private 0.0007 0.0003Total 0.0008 0.0003
G01A F15
Butoconazole Public - -Private 0.0003 <0.0001Total 0.0003 <0.0001
G02A B Ergot alkaloids
G02A B01
Methylergometrine Public - -Private 0.0008 0.0002Total 0.0008 0.0002
G02A B03
Ergometrine Public 0.0006 0.4339Private <0.0001 <0.0001Total 0.0006 0.4339
G02A D ProstaglandinsG02A D02
Dinoprostone Public 0.0360 0.0368Private 0.0037 0.0021Total 0.0397 0.0388
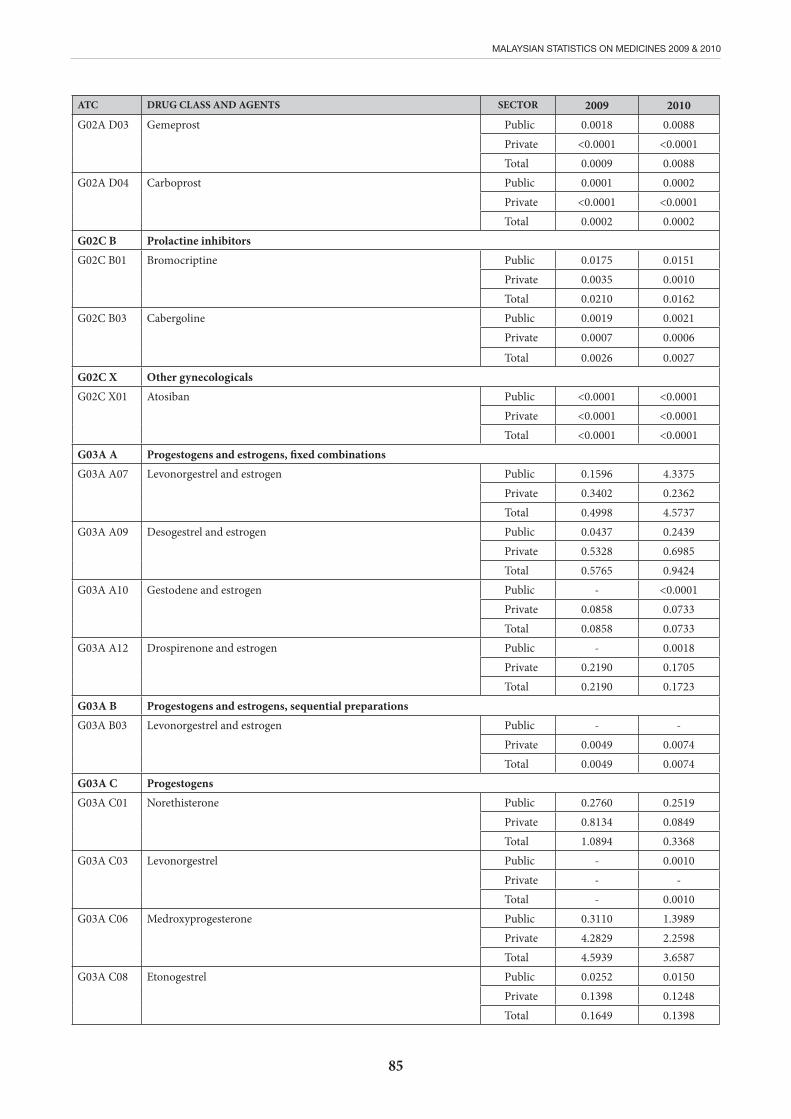
85
MALAYSIAN STATISTICS ON MEDICINES 2009 & 2010
ATC DRUG CLASS AND AGENTS SECTOR 2009 2010G02A D03
Gemeprost Public 0.0018 0.0088Private <0.0001 <0.0001Total 0.0009 0.0088
G02A D04
Carboprost Public 0.0001 0.0002Private <0.0001 <0.0001Total 0.0002 0.0002
G02C B Prolactine inhibitorsG02C B01
Bromocriptine Public 0.0175 0.0151Private 0.0035 0.0010Total 0.0210 0.0162
G02C B03
Cabergoline Public 0.0019 0.0021Private 0.0007 0.0006
Total 0.0026 0.0027G02C X Other gynecologicalsG02C X01
Atosiban Public <0.0001 <0.0001Private <0.0001 <0.0001Total <0.0001 <0.0001
G03A A Progestogens and estrogens, fixed combinationsG03A A07
Levonorgestrel and estrogen Public 0.1596 4.3375Private 0.3402 0.2362Total 0.4998 4.5737
G03A A09
Desogestrel and estrogen Public 0.0437 0.2439Private 0.5328 0.6985Total 0.5765 0.9424
G03A A10
Gestodene and estrogen Public - <0.0001Private 0.0858 0.0733Total 0.0858 0.0733
G03A A12
Drospirenone and estrogen Public - 0.0018Private 0.2190 0.1705Total 0.2190 0.1723
G03A B Progestogens and estrogens, sequential preparationsG03A B03
Levonorgestrel and estrogen Public - -Private 0.0049 0.0074Total 0.0049 0.0074
G03A C ProgestogensG03A C01
Norethisterone Public 0.2760 0.2519Private 0.8134 0.0849Total 1.0894 0.3368
G03A C03
Levonorgestrel Public - 0.0010Private - -Total - 0.0010
G03A C06
Medroxyprogesterone Public 0.3110 1.3989Private 4.2829 2.2598Total 4.5939 3.6587
G03A C08
Etonogestrel Public 0.0252 0.0150Private 0.1398 0.1248Total 0.1649 0.1398
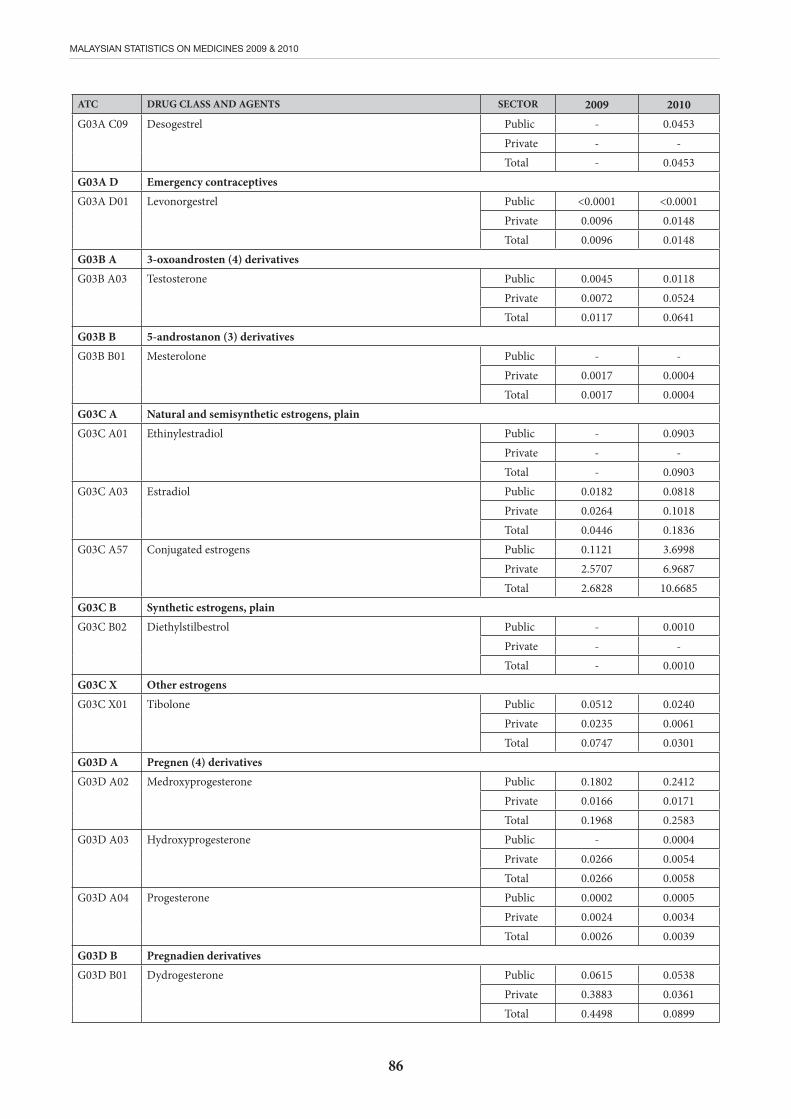
86
MALAYSIAN STATISTICS ON MEDICINES 2009 & 2010
ATC DRUG CLASS AND AGENTS SECTOR 2009 2010G03A C09
Desogestrel Public - 0.0453Private - -Total - 0.0453
G03A D Emergency contraceptivesG03A D01
Levonorgestrel Public <0.0001 <0.0001Private 0.0096 0.0148Total 0.0096 0.0148
G03B A 3-oxoandrosten (4) derivativesG03B A03
Testosterone Public 0.0045 0.0118Private 0.0072 0.0524Total 0.0117 0.0641
G03B B 5-androstanon (3) derivativesG03B B01
Mesterolone Public - -Private 0.0017 0.0004Total 0.0017 0.0004
G03C A Natural and semisynthetic estrogens, plainG03C A01
Ethinylestradiol Public - 0.0903Private - -Total - 0.0903
G03C A03
Estradiol Public 0.0182 0.0818Private 0.0264 0.1018Total 0.0446 0.1836
G03C A57
Conjugated estrogens Public 0.1121 3.6998Private 2.5707 6.9687Total 2.6828 10.6685
G03C B Synthetic estrogens, plainG03C B02
Diethylstilbestrol Public - 0.0010Private - -Total - 0.0010
G03C X Other estrogensG03C X01
Tibolone Public 0.0512 0.0240Private 0.0235 0.0061Total 0.0747 0.0301
G03D A Pregnen (4) derivativesG03D A02
Medroxyprogesterone Public 0.1802 0.2412Private 0.0166 0.0171Total 0.1968 0.2583
G03D A03
Hydroxyprogesterone Public - 0.0004Private 0.0266 0.0054Total 0.0266 0.0058
G03D A04
Progesterone Public 0.0002 0.0005Private 0.0024 0.0034Total 0.0026 0.0039
G03D B Pregnadien derivativesG03D B01
Dydrogesterone Public 0.0615 0.0538Private 0.3883 0.0361Total 0.4498 0.0899
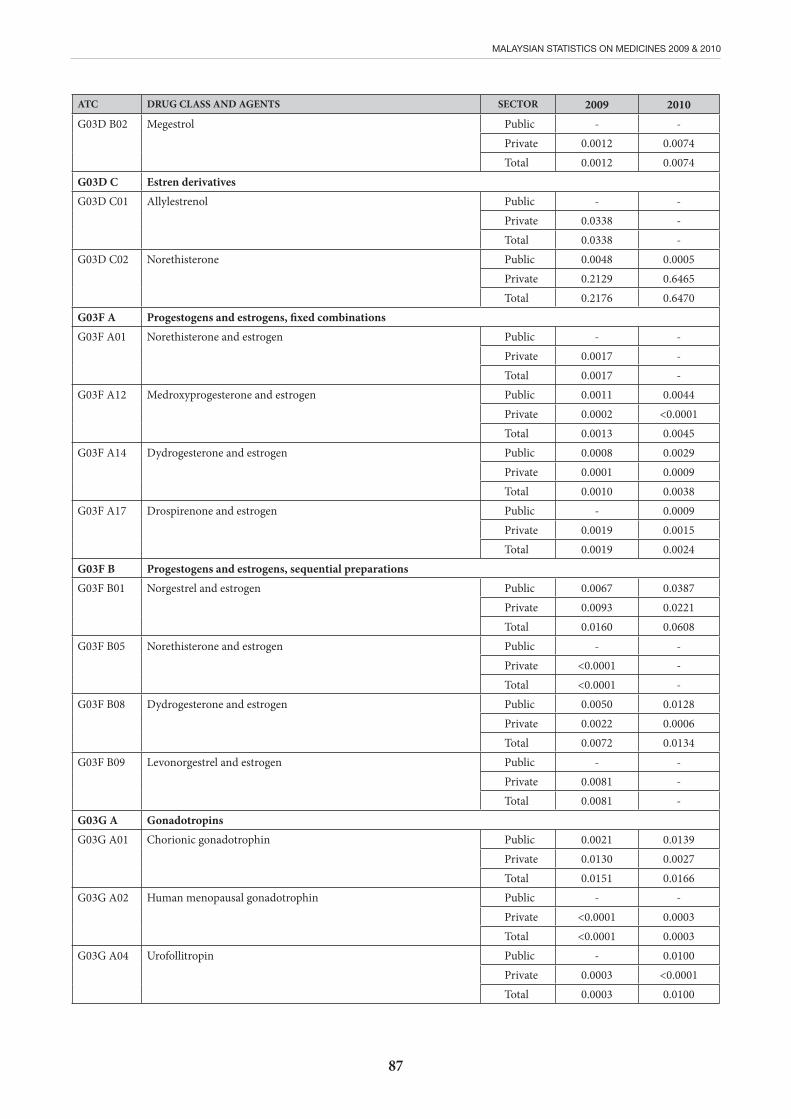
87
MALAYSIAN STATISTICS ON MEDICINES 2009 & 2010
ATC DRUG CLASS AND AGENTS SECTOR 2009 2010G03D B02
Megestrol Public - -Private 0.0012 0.0074Total 0.0012 0.0074
G03D C Estren derivativesG03D C01
Allylestrenol Public - -Private 0.0338 -Total 0.0338 -
G03D C02
Norethisterone Public 0.0048 0.0005Private 0.2129 0.6465Total 0.2176 0.6470
G03F A Progestogens and estrogens, fixed combinationsG03F A01
Norethisterone and estrogen Public - -Private 0.0017 -Total 0.0017 -
G03F A12
Medroxyprogesterone and estrogen Public 0.0011 0.0044Private 0.0002 <0.0001Total 0.0013 0.0045
G03F A14
Dydrogesterone and estrogen Public 0.0008 0.0029Private 0.0001 0.0009Total 0.0010 0.0038
G03F A17
Drospirenone and estrogen Public - 0.0009Private 0.0019 0.0015Total 0.0019 0.0024
G03F B Progestogens and estrogens, sequential preparationsG03F B01
Norgestrel and estrogen Public 0.0067 0.0387Private 0.0093 0.0221Total 0.0160 0.0608
G03F B05
Norethisterone and estrogen Public - -Private <0.0001 -Total <0.0001 -
G03F B08
Dydrogesterone and estrogen Public 0.0050 0.0128Private 0.0022 0.0006Total 0.0072 0.0134
G03F B09
Levonorgestrel and estrogen Public - -Private 0.0081 -Total 0.0081 -
G03G A GonadotropinsG03G A01
Chorionic gonadotrophin Public 0.0021 0.0139Private 0.0130 0.0027Total 0.0151 0.0166
G03G A02
Human menopausal gonadotrophin Public - -Private <0.0001 0.0003Total <0.0001 0.0003
G03G A04
Urofollitropin Public - 0.0100Private 0.0003 <0.0001Total 0.0003 0.0100
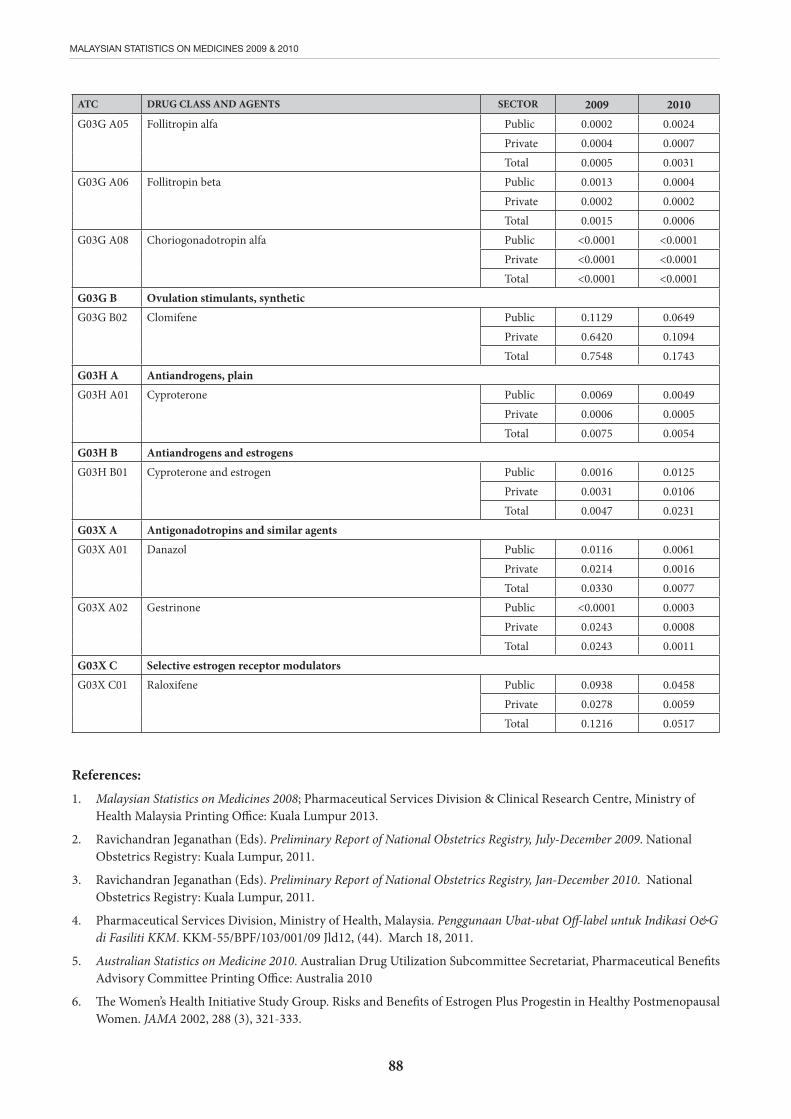
88
MALAYSIAN STATISTICS ON MEDICINES 2009 & 2010
ATC DRUG CLASS AND AGENTS SECTOR 2009 2010G03G A05
Follitropin alfa Public 0.0002 0.0024Private 0.0004 0.0007Total 0.0005 0.0031
G03G A06
Follitropin beta Public 0.0013 0.0004Private 0.0002 0.0002Total 0.0015 0.0006
G03G A08
Choriogonadotropin alfa Public <0.0001 <0.0001Private <0.0001 <0.0001Total <0.0001 <0.0001
G03G B Ovulation stimulants, syntheticG03G B02
Clomifene Public 0.1129 0.0649Private 0.6420 0.1094Total 0.7548 0.1743
G03H A Antiandrogens, plainG03H A01
Cyproterone Public 0.0069 0.0049Private 0.0006 0.0005Total 0.0075 0.0054
G03H B Antiandrogens and estrogensG03H B01
Cyproterone and estrogen Public 0.0016 0.0125Private 0.0031 0.0106Total 0.0047 0.0231
G03X A Antigonadotropins and similar agentsG03X A01
Danazol Public 0.0116 0.0061Private 0.0214 0.0016Total 0.0330 0.0077
G03X A02
Gestrinone Public <0.0001 0.0003Private 0.0243 0.0008Total 0.0243 0.0011
G03X C Selective estrogen receptor modulatorsG03X C01
Raloxifene Public 0.0938 0.0458Private 0.0278 0.0059Total 0.1216 0.0517
References:1. Malaysian Statistics on Medicines 2008; Pharmaceutical Services Division & Clinical Research Centre, Ministry of
Health Malaysia Printing Office: Kuala Lumpur 2013.
2. Ravichandran Jeganathan (Eds). Preliminary Report of National Obstetrics Registry, July-December 2009. National Obstetrics Registry: Kuala Lumpur, 2011.
3. Ravichandran Jeganathan (Eds). Preliminary Report of National Obstetrics Registry, Jan-December 2010. National Obstetrics Registry: Kuala Lumpur, 2011.
4. Pharmaceutical Services Division, Ministry of Health, Malaysia. Penggunaan Ubat-ubat Off-label untuk Indikasi O&G di Fasiliti KKM. KKM-55/BPF/103/001/09 Jld12, (44). March 18, 2011.
5. Australian Statistics on Medicine 2010. Australian Drug Utilization Subcommittee Secretariat, Pharmaceutical Benefits Advisory Committee Printing Office: Australia 2010
6. The Women’s Health Initiative Study Group. Risks and Benefits of Estrogen Plus Progestin in Healthy Postmenopausal Women. JAMA 2002, 288 (3), 321-333.
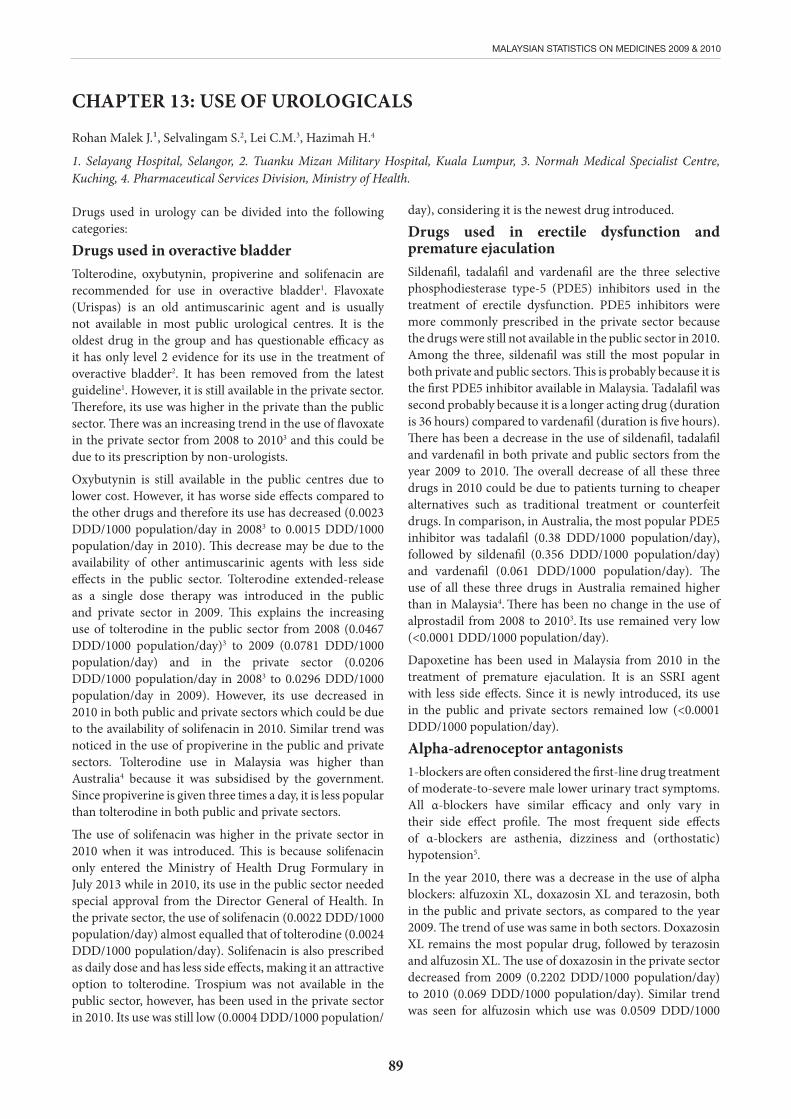
89
MALAYSIAN STATISTICS ON MEDICINES 2009 & 2010
CHAPTER 13: USE OF UROLOGICALS
Rohan Malek J.¹, Selvalingam S.2, Lei C.M.3, Hazimah H.4
1. Selayang Hospital, Selangor, 2. Tuanku Mizan Military Hospital, Kuala Lumpur, 3. Normah Medical Specialist Centre, Kuching, 4. Pharmaceutical Services Division, Ministry of Health. Drugs used in urology can be divided into the following categories:
Drugs used in overactive bladderTolterodine, oxybutynin, propiverine and solifenacin are recommended for use in overactive bladder1. Flavoxate (Urispas) is an old antimuscarinic agent and is usually not available in most public urological centres. It is the oldest drug in the group and has questionable efficacy as it has only level 2 evidence for its use in the treatment of overactive bladder2. It has been removed from the latest guideline1. However, it is still available in the private sector. Therefore, its use was higher in the private than the public sector. There was an increasing trend in the use of flavoxate in the private sector from 2008 to 20103 and this could be due to its prescription by non-urologists.
Oxybutynin is still available in the public centres due to lower cost. However, it has worse side effects compared to the other drugs and therefore its use has decreased (0.0023 DDD/1000 population/day in 20083 to 0.0015 DDD/1000 population/day in 2010). This decrease may be due to the availability of other antimuscarinic agents with less side effects in the public sector. Tolterodine extended-release as a single dose therapy was introduced in the public and private sector in 2009. This explains the increasing use of tolterodine in the public sector from 2008 (0.0467 DDD/1000 population/day)3 to 2009 (0.0781 DDD/1000 population/day) and in the private sector (0.0206 DDD/1000 population/day in 20083 to 0.0296 DDD/1000 population/day in 2009). However, its use decreased in 2010 in both public and private sectors which could be due to the availability of solifenacin in 2010. Similar trend was noticed in the use of propiverine in the public and private sectors. Tolterodine use in Malaysia was higher than Australia4 because it was subsidised by the government. Since propiverine is given three times a day, it is less popular than tolterodine in both public and private sectors.
The use of solifenacin was higher in the private sector in 2010 when it was introduced. This is because solifenacin only entered the Ministry of Health Drug Formulary in July 2013 while in 2010, its use in the public sector needed special approval from the Director General of Health. In the private sector, the use of solifenacin (0.0022 DDD/1000 population/day) almost equalled that of tolterodine (0.0024 DDD/1000 population/day). Solifenacin is also prescribed as daily dose and has less side effects, making it an attractive option to tolterodine. Trospium was not available in the public sector, however, has been used in the private sector in 2010. Its use was still low (0.0004 DDD/1000 population/
day), considering it is the newest drug introduced.
Drugs used in erectile dysfunction and premature ejaculationSildenafil, tadalafil and vardenafil are the three selective phosphodiesterase type-5 (PDE5) inhibitors used in the treatment of erectile dysfunction. PDE5 inhibitors were more commonly prescribed in the private sector because the drugs were still not available in the public sector in 2010. Among the three, sildenafil was still the most popular in both private and public sectors. This is probably because it is the first PDE5 inhibitor available in Malaysia. Tadalafil was second probably because it is a longer acting drug (duration is 36 hours) compared to vardenafil (duration is five hours). There has been a decrease in the use of sildenafil, tadalafil and vardenafil in both private and public sectors from the year 2009 to 2010. The overall decrease of all these three drugs in 2010 could be due to patients turning to cheaper alternatives such as traditional treatment or counterfeit drugs. In comparison, in Australia, the most popular PDE5 inhibitor was tadalafil (0.38 DDD/1000 population/day), followed by sildenafil (0.356 DDD/1000 population/day) and vardenafil (0.061 DDD/1000 population/day). The use of all these three drugs in Australia remained higher than in Malaysia4. There has been no change in the use of alprostadil from 2008 to 20103. Its use remained very low (<0.0001 DDD/1000 population/day).
Dapoxetine has been used in Malaysia from 2010 in the treatment of premature ejaculation. It is an SSRI agent with less side effects. Since it is newly introduced, its use in the public and private sectors remained low (<0.0001 DDD/1000 population/day).
Alpha-adrenoceptor antagonists1-blockers are often considered the first-line drug treatment of moderate-to-severe male lower urinary tract symptoms. All α-blockers have similar efficacy and only vary in their side effect profile. The most frequent side effects of α-blockers are asthenia, dizziness and (orthostatic) hypotension5.
In the year 2010, there was a decrease in the use of alpha blockers: alfuzoxin XL, doxazosin XL and terazosin, both in the public and private sectors, as compared to the year 2009. The trend of use was same in both sectors. Doxazosin XL remains the most popular drug, followed by terazosin and alfuzosin XL. The use of doxazosin in the private sector decreased from 2009 (0.2202 DDD/1000 population/day) to 2010 (0.069 DDD/1000 population/day). Similar trend was seen for alfuzosin which use was 0.0509 DDD/1000
90
MALAYSIAN STATISTICS ON MEDICINES 2009 & 2010
population/day in 2009 but decreased to 0.0149 DDD/1000 population/day in 2010. Tamsulosin was introduced in 2010 and since it is a new drug, its use in the public and private centres was relatively low (0.0011 DDD/1000 population/day for each sector). However, in Australia, tamsulosin was a preferred drug4 due to its increase prostate selectivity. Alfuzosin dan doxazosin were not available in Australia.
5-alpha reductase inhibitorsThe two 5-alpha reductase inhibitors used were finasteride (5α-reductase type 2 inhibitor) and dutasteride (5α-reductase types 1 and 2 inhibitor). Between the two in 2010, finasteride was the favoured drug in the public sector. This could be due to the prescribing practice and the wider availability of this drug in most of the public hospitals. The use of finasteride has been steadily decreasing in the private sector from 0.0223 DDD/1000 population/day in 20073 to 0.0087 DDD/1000 population/day in 2010. There was a steep increase in the use of dutasteride from 0.0551 in 20083 to 0.1399 in 2009 in the public sector and from 0.0185 DDD/1000 population/day in 20083 to 0.0399 DDD/1000 population/day in 2009 in the private sector. This increase may be due to the increased publicity for dutasteride as a dual 5α-reductase inhibitor. However, there was a decreasing trend in the use of dutasteride in the public and private sectors between 2009 and 2010. This may be because finasteride was the more preferred option in the public hospitals due to its lower cost. The use of finasteride and dutasteride in the public sector in the year 2010 was almost similar to the year 2009. The use of finasteride in Australia in 2010 (0.17 DDD/1000 population/day)4 exceeded the use in both public and private sectors in Malaysia. The use of dutasteride in Australia in 2010 (0.041 DDD/1000 population/day) was lower than the use of dutasteride in the public sector in Malaysia. Finasteride was the preferred drug in Australia in 20104.
Gonadotropin releasing hormone analoguesLong-acting luteinising hormone releasing hormone (LHRH) agonists have been used in the treatment of advanced prostate cancer6 and are currently the main forms of androgen deprivation treatment in the public and private sectors. The use of buserelin was low in the public and private sectors because it is not commonly used in the treatment of metastatic prostate cancer. In 2010, the most commonly used LHRH analogue in the public sector was goserelin (0.0231 DDD/1000 population/day), followed by leuprorelin (0.0135 DDD/1000 population/day). In the private sector, the most common LHRH analogue in 2010 was leuprorelin (0.014 DDD/1000 population/day), followed by goserelin (0.0068 DDD/1000 population/day). Lucrin@ three-monthly injection became available in 2010, making it a more attactive option in the private sector. The use of leuprorelin increased between 20083 and 2009 in both public and private sectors. However, there was a drop in its use in 2010. The use of goserelin
reduced in the public sector in 2009, however, showed an increase in 2010. Overall, the use of LHRH analogues were higher in the public sector and this may be because more cancer patients are seen in the public sector. Also there is an overall drop in the use of LHRH analogues in 2010 in both the public and private sectors and this may be due to the stage migration of prostate cancer where less patients with metastatic prostate cancer are being diagnosed. The use of LHRH analogues in Australia was very much higher for leuprorelin (0.819 DDD/1000 population/day) and goserelin (0.589 DDD/1000 population/day) because of the higher incidence of prostate cancer in Australia7 and also because these drugs were reimbursed through the Pharmaceutical Benefit Scheme4.
Anti-androgensThe anti-androgens are indicated for metastatic prostate cancer. It is used during the initiation of LHRH analogue to prevent the ‘flare phenomenon’ or added to either surgical or pharmacological castration for complete androgen blockade. Cyproterone is the oldest drug6. Cyproterone use is more popular in the public sector. However, there was a decline in its use in both public and private sectors in 2010. The most popular anti-androgen in 2010 in both public and private sectors was bicatulamide (0.008 DDD/1000 population/day). Bicatulamide is the preferred anti-androgen because it is non-steroidal and has less side effects6. Overall, there has been a decreasing trend in the use of anti-androgens in 2009 and 2010, possibly due to stage migration of prostate cancer and less metastatic prostate cancer diagnosis. The use of bicatulamide in Australia in 2010 was much higher (0.125 DDD/1000 population/day)4 than in Malaysia (0.0091 DDD/1000 population/day). Bicatulamide was still the most popular anti-androgen in Australia4.
TestosteroneTestosterone replacement therapy is recommended in male hypogonadism for patients with a decline in muscle mass and strength, reduced bone mineral density at the lumbar spine, and decreased libido and erection8. In the public sector, the use of testosterone supplement reached its peak in 2008 (0.0196 DDD/1000 population/day)3, then decline to 0.0045 DDD/1000 population/day) in 2009 and increased again to 0.0118 DDD/1000 population/day in 2010. As in the private sector, there was a steep increase in the use of testosterone supplement in 2010 (0.0524 DDD/1000 population/day) compared to 0.0072 DDD/1000 population/day in 2009. This could be due to the rise in men’s health clinics as well as better awareness among patients who visit the private sectors. Therefore, it is not surprising that the overall use of testosterone replacement therapy was much higher in the private sector than the public sector. The cost of testosterone treatment is high9,10 and this may be a limiting factor to its use in the public sector. The use in Australia in 2010 was much higher
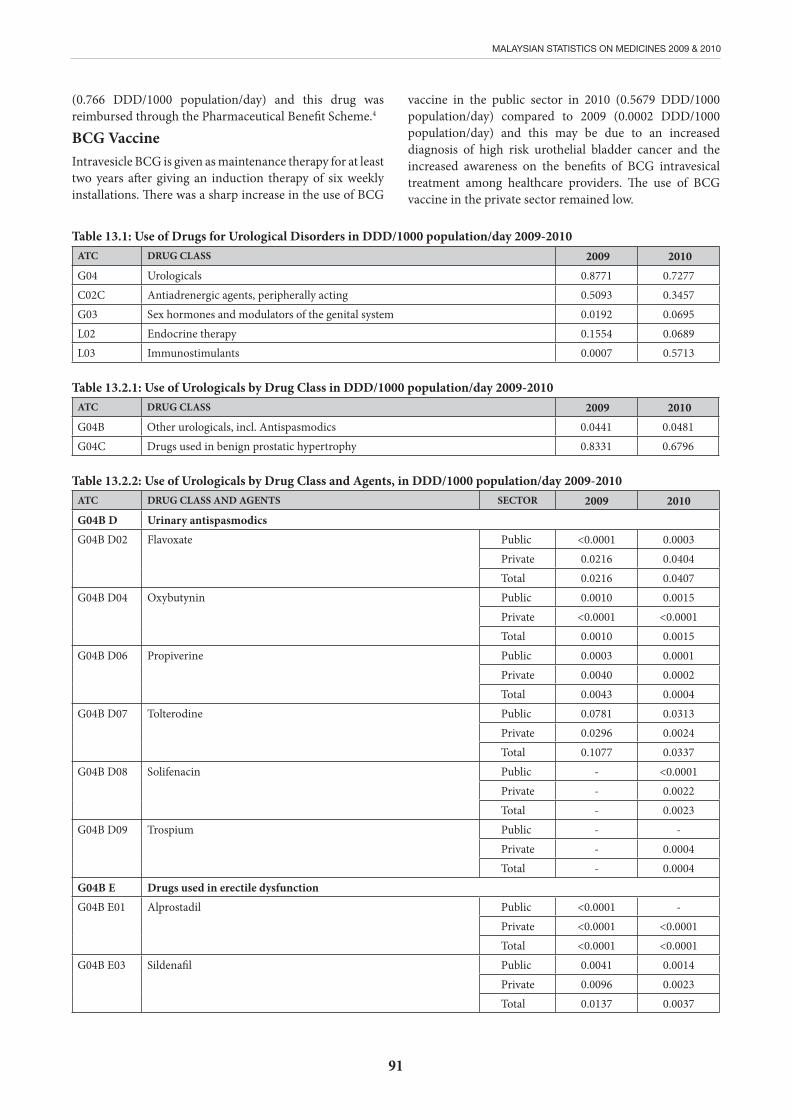
91
MALAYSIAN STATISTICS ON MEDICINES 2009 & 2010
(0.766 DDD/1000 population/day) and this drug was reimbursed through the Pharmaceutical Benefit Scheme.4
BCG VaccineIntravesicle BCG is given as maintenance therapy for at least two years after giving an induction therapy of six weekly installations. There was a sharp increase in the use of BCG
vaccine in the public sector in 2010 (0.5679 DDD/1000 population/day) compared to 2009 (0.0002 DDD/1000 population/day) and this may be due to an increased diagnosis of high risk urothelial bladder cancer and the increased awareness on the benefits of BCG intravesical treatment among healthcare providers. The use of BCG vaccine in the private sector remained low.
Table 13.1: Use of Drugs for Urological Disorders in DDD/1000 population/day 2009-2010
ATC DRUG CLASS 2009 2010G04 Urologicals 0.8771 0.7277C02C Antiadrenergic agents, peripherally acting 0.5093 0.3457G03 Sex hormones and modulators of the genital system 0.0192 0.0695L02 Endocrine therapy 0.1554 0.0689L03 Immunostimulants 0.0007 0.5713
Table 13.2.1: Use of Urologicals by Drug Class in DDD/1000 population/day 2009-2010ATC DRUG CLASS 2009 2010G04B Other urologicals, incl. Antispasmodics 0.0441 0.0481G04C Drugs used in benign prostatic hypertrophy 0.8331 0.6796
Table 13.2.2: Use of Urologicals by Drug Class and Agents, in DDD/1000 population/day 2009-2010ATC DRUG CLASS AND AGENTS SECTOR 2009 2010G04B D Urinary antispasmodicsG04B D02
Flavoxate Public <0.0001 0.0003Private 0.0216 0.0404Total 0.0216 0.0407
G04B D04
Oxybutynin Public 0.0010 0.0015Private <0.0001 <0.0001Total 0.0010 0.0015
G04B D06
Propiverine Public 0.0003 0.0001Private 0.0040 0.0002Total 0.0043 0.0004
G04B D07
Tolterodine Public 0.0781 0.0313Private 0.0296 0.0024Total 0.1077 0.0337
G04B D08
Solifenacin Public - <0.0001Private - 0.0022Total - 0.0023
G04B D09
Trospium Public - -Private - 0.0004Total - 0.0004
G04B E Drugs used in erectile dysfunctionG04B E01
Alprostadil Public <0.0001 -Private <0.0001 <0.0001Total <0.0001 <0.0001
G04B E03
Sildenafil Public 0.0041 0.0014Private 0.0096 0.0023Total 0.0137 0.0037
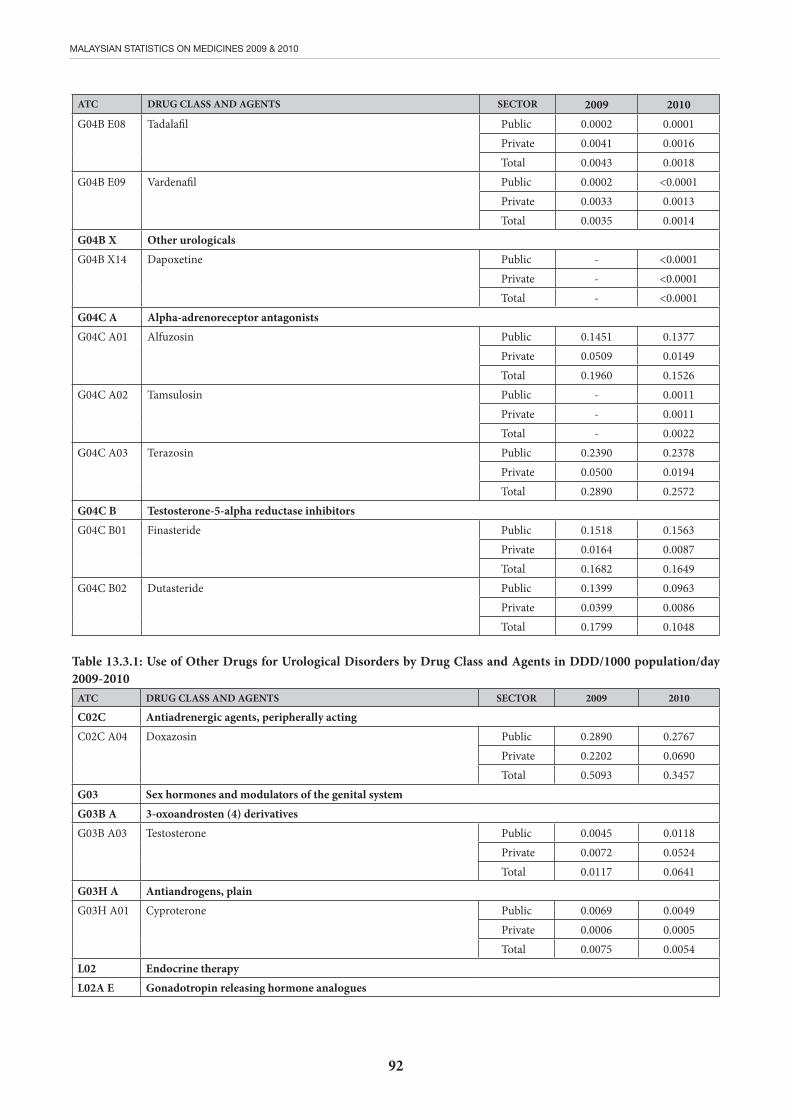
92
MALAYSIAN STATISTICS ON MEDICINES 2009 & 2010
ATC DRUG CLASS AND AGENTS SECTOR 2009 2010G04B E08
Tadalafil Public 0.0002 0.0001Private 0.0041 0.0016Total 0.0043 0.0018
G04B E09
Vardenafil Public 0.0002 <0.0001Private 0.0033 0.0013Total 0.0035 0.0014
G04B X Other urologicalsG04B X14
Dapoxetine Public - <0.0001Private - <0.0001Total - <0.0001
G04C A Alpha-adrenoreceptor antagonistsG04C A01
Alfuzosin Public 0.1451 0.1377Private 0.0509 0.0149Total 0.1960 0.1526
G04C A02
Tamsulosin Public - 0.0011Private - 0.0011Total - 0.0022
G04C A03
Terazosin Public 0.2390 0.2378Private 0.0500 0.0194Total 0.2890 0.2572
G04C B Testosterone-5-alpha reductase inhibitorsG04C B01
Finasteride Public 0.1518 0.1563Private 0.0164 0.0087Total 0.1682 0.1649
G04C B02
Dutasteride Public 0.1399 0.0963Private 0.0399 0.0086Total 0.1799 0.1048
Table 13.3.1: Use of Other Drugs for Urological Disorders by Drug Class and Agents in DDD/1000 population/day 2009-2010
ATC DRUG CLASS AND AGENTS SECTOR 2009 2010
C02C Antiadrenergic agents, peripherally actingC02C A04
Doxazosin Public 0.2890 0.2767Private 0.2202 0.0690Total 0.5093 0.3457
G03 Sex hormones and modulators of the genital systemG03B A 3-oxoandrosten (4) derivativesG03B A03
Testosterone Public 0.0045 0.0118Private 0.0072 0.0524Total 0.0117 0.0641
G03H A Antiandrogens, plainG03H A01
Cyproterone Public 0.0069 0.0049Private 0.0006 0.0005Total 0.0075 0.0054
L02 Endocrine therapyL02A E Gonadotropin releasing hormone analogues
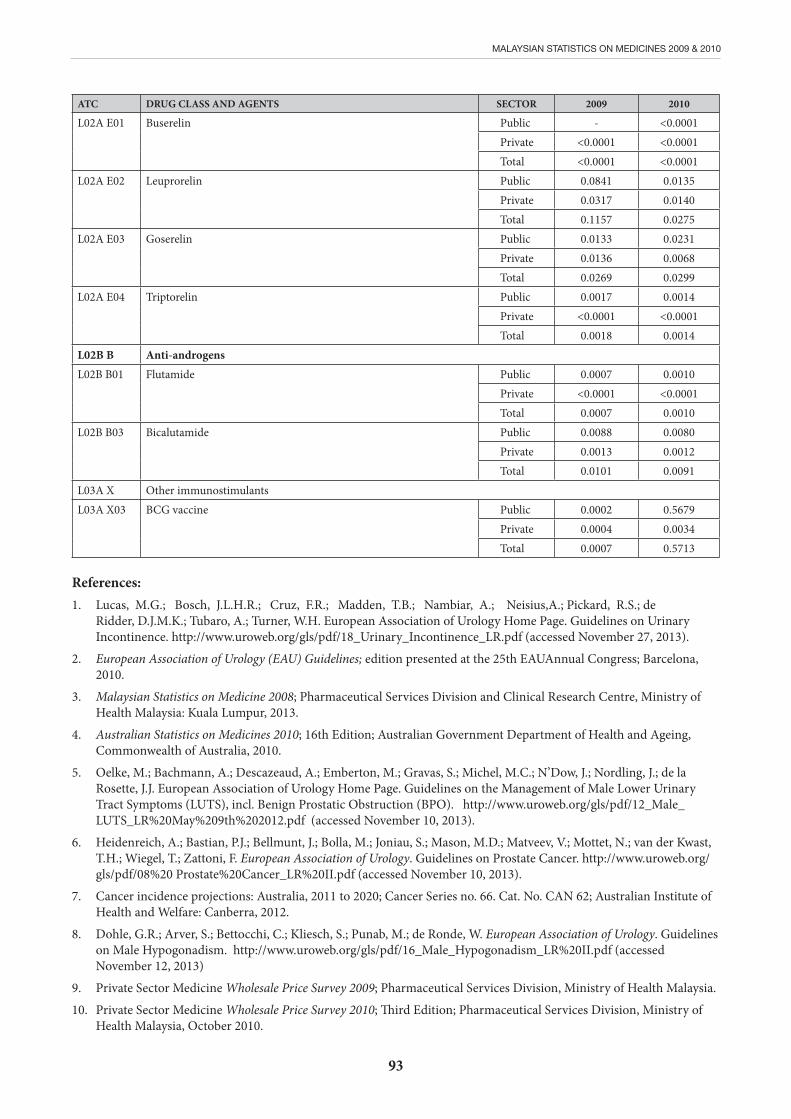
93
MALAYSIAN STATISTICS ON MEDICINES 2009 & 2010
ATC DRUG CLASS AND AGENTS SECTOR 2009 2010
L02A E01
Buserelin Public - <0.0001Private <0.0001 <0.0001Total <0.0001 <0.0001
L02A E02
Leuprorelin Public 0.0841 0.0135Private 0.0317 0.0140Total 0.1157 0.0275
L02A E03
Goserelin Public 0.0133 0.0231Private 0.0136 0.0068Total 0.0269 0.0299
L02A E04
Triptorelin Public 0.0017 0.0014Private <0.0001 <0.0001Total 0.0018 0.0014
L02B B Anti-androgensL02B B01
Flutamide Public 0.0007 0.0010Private <0.0001 <0.0001Total 0.0007 0.0010
L02B B03
Bicalutamide Public 0.0088 0.0080Private 0.0013 0.0012Total 0.0101 0.0091
L03A X Other immunostimulantsL03A X03
BCG vaccine Public 0.0002 0.5679Private 0.0004 0.0034Total 0.0007 0.5713
References:1. Lucas, M.G.; Bosch, J.L.H.R.; Cruz, F.R.; Madden, T.B.; Nambiar, A.; Neisius,A.; Pickard, R.S.; de
Ridder, D.J.M.K.; Tubaro, A.; Turner, W.H. European Association of Urology Home Page. Guidelines on Urinary Incontinence. http://www.uroweb.org/gls/pdf/18_Urinary_Incontinence_LR.pdf (accessed November 27, 2013).
2. European Association of Urology (EAU) Guidelines; edition presented at the 25th EAUAnnual Congress; Barcelona, 2010.
3. Malaysian Statistics on Medicine 2008; Pharmaceutical Services Division and Clinical Research Centre, Ministry of Health Malaysia: Kuala Lumpur, 2013.
4. Australian Statistics on Medicines 2010; 16th Edition; Australian Government Department of Health and Ageing, Commonwealth of Australia, 2010.
5. Oelke, M.; Bachmann, A.; Descazeaud, A.; Emberton, M.; Gravas, S.; Michel, M.C.; N’Dow, J.; Nordling, J.; de la Rosette, J.J. European Association of Urology Home Page. Guidelines on the Management of Male Lower Urinary Tract Symptoms (LUTS), incl. Benign Prostatic Obstruction (BPO). http://www.uroweb.org/gls/pdf/12_Male_LUTS_LR%20May%209th%202012.pdf (accessed November 10, 2013).
6. Heidenreich, A.; Bastian, P.J.; Bellmunt, J.; Bolla, M.; Joniau, S.; Mason, M.D.; Matveev, V.; Mottet, N.; van der Kwast, T.H.; Wiegel, T.; Zattoni, F. European Association of Urology. Guidelines on Prostate Cancer. http://www.uroweb.org/gls/pdf/08%20 Prostate%20Cancer_LR%20II.pdf (accessed November 10, 2013).
7. Cancer incidence projections: Australia, 2011 to 2020; Cancer Series no. 66. Cat. No. CAN 62; Australian Institute of Health and Welfare: Canberra, 2012.
8. Dohle, G.R.; Arver, S.; Bettocchi, C.; Kliesch, S.; Punab, M.; de Ronde, W. European Association of Urology. Guidelines on Male Hypogonadism. http://www.uroweb.org/gls/pdf/16_Male_Hypogonadism_LR%20II.pdf (accessed November 12, 2013)
9. Private Sector Medicine Wholesale Price Survey 2009; Pharmaceutical Services Division, Ministry of Health Malaysia.
10. Private Sector Medicine Wholesale Price Survey 2010; Third Edition; Pharmaceutical Services Division, Ministry of Health Malaysia, October 2010.
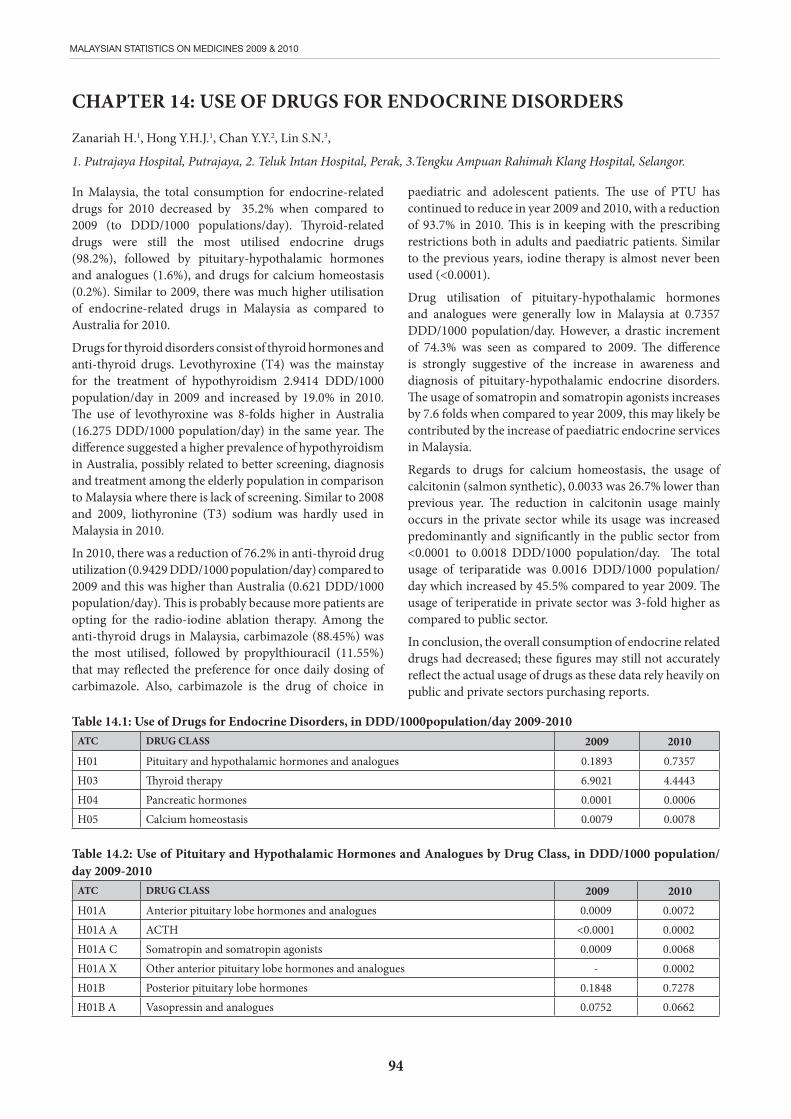
94
MALAYSIAN STATISTICS ON MEDICINES 2009 & 2010
CHAPTER 14: USE OF DRUGS FOR ENDOCRINE DISORDERS
Zanariah H.1, Hong Y.H.J.1, Chan Y.Y.2, Lin S.N.3,
1. Putrajaya Hospital, Putrajaya, 2. Teluk Intan Hospital, Perak, 3.Tengku Ampuan Rahimah Klang Hospital, Selangor. In Malaysia, the total consumption for endocrine-related drugs for 2010 decreased by 35.2% when compared to 2009 (to DDD/1000 populations/day). Thyroid-related drugs were still the most utilised endocrine drugs (98.2%), followed by pituitary-hypothalamic hormones and analogues (1.6%), and drugs for calcium homeostasis (0.2%). Similar to 2009, there was much higher utilisation of endocrine-related drugs in Malaysia as compared to Australia for 2010.
Drugs for thyroid disorders consist of thyroid hormones and anti-thyroid drugs. Levothyroxine (T4) was the mainstay for the treatment of hypothyroidism 2.9414 DDD/1000 population/day in 2009 and increased by 19.0% in 2010. The use of levothyroxine was 8-folds higher in Australia (16.275 DDD/1000 population/day) in the same year. The difference suggested a higher prevalence of hypothyroidism in Australia, possibly related to better screening, diagnosis and treatment among the elderly population in comparison to Malaysia where there is lack of screening. Similar to 2008 and 2009, liothyronine (T3) sodium was hardly used in Malaysia in 2010.
In 2010, there was a reduction of 76.2% in anti-thyroid drug utilization (0.9429 DDD/1000 population/day) compared to 2009 and this was higher than Australia (0.621 DDD/1000 population/day). This is probably because more patients are opting for the radio-iodine ablation therapy. Among the anti-thyroid drugs in Malaysia, carbimazole (88.45%) was the most utilised, followed by propylthiouracil (11.55%) that may reflected the preference for once daily dosing of carbimazole. Also, carbimazole is the drug of choice in
paediatric and adolescent patients. The use of PTU has continued to reduce in year 2009 and 2010, with a reduction of 93.7% in 2010. This is in keeping with the prescribing restrictions both in adults and paediatric patients. Similar to the previous years, iodine therapy is almost never been used (<0.0001).
Drug utilisation of pituitary-hypothalamic hormones and analogues were generally low in Malaysia at 0.7357 DDD/1000 population/day. However, a drastic increment of 74.3% was seen as compared to 2009. The difference is strongly suggestive of the increase in awareness and diagnosis of pituitary-hypothalamic endocrine disorders. The usage of somatropin and somatropin agonists increases by 7.6 folds when compared to year 2009, this may likely be contributed by the increase of paediatric endocrine services in Malaysia.
Regards to drugs for calcium homeostasis, the usage of calcitonin (salmon synthetic), 0.0033 was 26.7% lower than previous year. The reduction in calcitonin usage mainly occurs in the private sector while its usage was increased predominantly and significantly in the public sector from <0.0001 to 0.0018 DDD/1000 population/day. The total usage of teriparatide was 0.0016 DDD/1000 population/day which increased by 45.5% compared to year 2009. The usage of teriperatide in private sector was 3-fold higher as compared to public sector.
In conclusion, the overall consumption of endocrine related drugs had decreased; these figures may still not accurately reflect the actual usage of drugs as these data rely heavily on public and private sectors purchasing reports.
Table 14.1: Use of Drugs for Endocrine Disorders, in DDD/1000population/day 2009-2010ATC DRUG CLASS 2009 2010
H01 Pituitary and hypothalamic hormones and analogues 0.1893 0.7357H03 Thyroid therapy 6.9021 4.4443H04 Pancreatic hormones 0.0001 0.0006H05 Calcium homeostasis 0.0079 0.0078
Table 14.2: Use of Pituitary and Hypothalamic Hormones and Analogues by Drug Class, in DDD/1000 population/day 2009-2010
ATC DRUG CLASS 2009 2010H01A Anterior pituitary lobe hormones and analogues 0.0009 0.0072H01A A ACTH <0.0001 0.0002H01A C Somatropin and somatropin agonists 0.0009 0.0068H01A X Other anterior pituitary lobe hormones and analogues - 0.0002H01B Posterior pituitary lobe hormones 0.1848 0.7278H01B A Vasopressin and analogues 0.0752 0.0662
95
MALAYSIAN STATISTICS ON MEDICINES 2009 & 2010
ATC DRUG CLASS 2009 2010H01C Hypothalamic hormones 0.0036 0.0007H01C B Somatostatin and analogues 0.0036 0.0006H01C C Anti-gonadotropin-releasing hormones <0.0001 <0.0001H03A Thyroid preparations 2.9414 3.5014H03A A Thyroid hormones 2.9414 3.5014H03B Antithyroid preparations 3.9607 0.9429H03B A Thiouracils 1.7310 0.1089H03B B Sulfur-containing imidazole derivatives 2.2298 0.8340H03C Iodine therapy - <0.0001H03C A Iodine therapy - <0.0001H04A Glycogenolytic hormones 0.0001 0.0006H04A A Glycogenolytic hormones 0.0001 0.0006H05A Parathyroid hormones and analogues 0.0011 0.0016H05A A Parathyroid hormones and analogues 0.0011 0.0016H05B Anti-parathyroid agents 0.0068 0.0062H05B A Calcitonin preparations 0.0045 0.0033H05B X Other anti-parathyroid agents 0.0022 0.0029
Table 14.3.1: Use of Thyroid Therapy by Drug Class, in DDD/1000 population/day 2009-2010ATC DRUG CLASS 2009 2010H03A Thyroid preparations 2.9414 3.5014H03A A Thyroid hormones 2.9414 3.5014H03B Antithyroid preparations 3.9607 0.9429H03B A Thiouracils 1.7310 0.1089H03B B Sulfur-containing imidazole derivatives 2.2298 0.8340H03C Iodine therapy - <0.0001H03C A Iodine therapy - <0.0001
Table 14.3.2: Use of Thyroid Therapy by Drug Class and Agents, in DDD/1000 population/day 2009-2010ATC DRUG CLASS AND AGENTS SECTOR 2009 2010
H03A A Thyroid hormonesH03A A01
Levothyroxine sodium Public 2.3223 2.2185Private 0.6191 1.2829Total 2.9414 3.5014
H03A A02
Liothyronine sodium Public - -Private <0.0001 <0.0001Total <0.0001 <0.0001
H03B A ThiouracilsH03B A02
Propylthiouracil Public 1.0682 0.0788Private 0.6627 0.0301Total 1.7310 0.1089
H03B B Sulfur-containing imidazole derivativesH03B B01
Carbimazole Public 1.1999 0.6650Private 1.0299 0.1689Total 2.2298 0.8340
H03C A Iodine therapyH03C AXX
Fake INN for H03C A Public - -Private - <0.0001Total - <0.0001
96
MALAYSIAN STATISTICS ON MEDICINES 2009 & 2010
Table 14.4.1: Use of Pancreatic Hormones by Drug Class, in DDD/1000 population/day 2009-2010ATC DRUG CLASS AND AGENTS 2009 2010
H04A Glycogenolytic hormones 0.0001 0.0006H04A A Glycogenolytic hormones 0.0001 0.0006
Table 14.4.2: Use of Pancreatic Hormones by Drug Class and Agents, in DDD/1000 population/day 2009-2010ATC DRUG CLASS AND AGENTS SECTOR 2009 2010H04A A Glycogenolytic hormonesH04A A01
Glucagon Public 0.0001 0.0006Private <0.0001 <0.0001Total 0.0001 0.0006
Table 14.5.1: Use of Pancreatic Hormones by Drug Class, in DDD/1000 population/day 2009-2010ATC DRUG CLASS 2009 2010H05A Parathyroid hormones and analogues 0.0011 0.0016H05A A Parathyroid hormones and analogues 0.0011 0.0016H05B Anti-parathyroid agents 0.0068 0.0062H05B A Calcitonin preparations 0.0045 0.0033H05B X Other anti-parathyroid agents 0.0022 0.0029
Table 14.5.2: Use of Pancreatic Hormones by Drug Class and Agents, in DDD/1000 population/day 2009-2010ATC DRUG CLASS AND AGENTS SECTOR 2009 2010H05A A Parathyroid hormones and analoguesH05A A02
Teriparatide Public - 0.0004Private 0.0011 0.0012Total 0.0011 0.0016
H05B A Calcitonin preparationsH05B A01
Calcitonin (salmon synthetic) Public <0.0001 0.0018Private 0.0044 0.0015Total 0.0045 0.0033
H05B X Other anti-parathyroid agentsH05B X02
Paricalcitol Public 0.0008 0.0016Private 0.0014 0.0012Total 0.0022 0.0029
References:1. Malaysian Statistics on Medicines 2008; Pharmaceutical Services Division & Clinical Research Centre, Ministry of
Health Malaysia Printing Office: Kuala Lumpur 2013.
2. Australian Statistics on Medicines 2008 14th Edition; Australian Drug Utilization Subcommittee Secretariat, Pharmaceutical Benefits Advisory Committee Printing Office: Australia 2009.
3. Guidelines for ATC Classification and DDD Assignment 2012; WHO Collaborating Centre for Drug Statistics Methodology Printing Office: Oslo December 2012.
97
MALAYSIAN STATISTICS ON MEDICINES 2009 & 2010
CHAPTER 15: USE OF ANTIINFECTIVES
Sim L.H.1, Leong K.N.2, Norhayati N.H.S3, Sameerah S.A.R.4, Rahela A.K.1, Yuzlina M.Y.5
1. Sungai Buloh Hospital, Selangor, 2. Pulau Pinang Hospital, Pulau Pinang, 3. Melaka Hospital, Melaka, 4. National Pharmaceutical Control Bureau, Ministry of Health, 5. Hospital Putrajaya, Wilayah Persekutuan Putrajaya. Anti-infectives remain the largest group of drugs used in Malaysian health facilities apart from antidiabetics, antihypertensives and lipid lowering agents. This chapter covers the various trends of usage of anti-infectives starting with antibacterials, then antituberculous medications, antimalarials, antivirals and lastly antimycotics.
In 2010, anti-bacterial use increased by 16% compared to 2009. Among the antibacterials, penicillins constituted 44.8% of total antibacterial usage in 2009 and this increased to 55.5% in 2010. Amoxicillin was the most widely used penicillin in 2009 and 2010. The public sector contributed 38.8% of usage of amoxicillin in 2010. According to the National Care Medical Survey 2010, about 29.6% of prescriptions containing antibiotics were issued for respiratory tract infection in the primary sector. Amoxicillin was prescribed in 35% of cases. This supports the recommendations of the National Antibiotic Guidelines of 2008 of using narrow spectrum penicillins for suspected community acquired pneumonia. Nonetheless it also reveals the common practise at primary care settings of giving antibiotics to treat respiratory tract infections which are mainly viral in origin. Inappropriate use of antibiotics leads to increases in antimicrobial resistance among bacteria (Musher 2003).
Cephalosporins constituted 18.4% of total antibacterial use in 2009 and 7.2% of total antibacterial use in 2010. 3rd generation (44.4%) was the most widely used group of cephalosporins in 2009 whilst 2nd generation (53.3%) was the highest in 2010. Among 2nd generation cephalosporins, cefuroxime constituted 71.5% to 95.6% usage. There was a marked increase in the usage of cefaclor (6.5 fold) from 2009 to 2010 and this phenomena was predominantly observed in private sector. Ceftriaxone and cefixime were the most common 3rd generation cephalosporins used in 2009 and 2010. Cefixime was used only in private sectors. However, usage of both these drugs dropped tremendously in 2010 (83.6% for ceftriaxone and 99.3% for cefixime). The restrcitive use of 3rd generation of cephalosporins is encouraged to minimise the rate of ESBL infection.
Antimicrobial Stewardship Programmes promote de-escalation of antibiotics by initially promoting the use of broad spectrum antibiotics such as carbapenems in very ill patients upfront and then deescalating of a narrow spectrum once cultures are available to minimize the emergence of resistance organisms. In Malaysia, usage of
carbapenem increased tremendously in 2010 (9.5 fold) and this was mainly contributed to by meropenem usage in the public sector (33 folds). More efforts are needed to promote the judicious use of carbapenems to curb the emergence of Carbapenem Resistant Enterobactericeae (CRE). CRE has been increasing in Malaysia from 1 case in 2010 to 28 cases in 2011 (Medical Development Division, MOH 2013).
Acinetobacter baumanie multiresistant organism (MRO) became more prevalent in Malaysia in 2010. This is evident by the increase in usage of polymyxins (polymyxin B and colistin) in 2010 compared to 2009. Since Acinetobacter MRO is only sensitive to limited antibiotics like polymyxins and tigecycline, the appropriate use of polymyxins need to be emphasized to minimise the emergence of any resistance towards these antibiotics.
Under the tetracyclines, there was an increase in 2009 in the DDD/1000 population/day compared to 2007 and 2008 to 1.805 from 1.100 and 1.155 respectively. This increase was mainly contributed by doxycycline usage in private sector. Leptospirosis became a notifiable disease around that time due to increased reports of mortalities within the country. This likely triggered an increase in doxycycline usage. Its usage may also be a reflection of the trend of patients seeking treatment of acne in the private sector.
In the sulphonamides and trimethoprim group, there was a substantial increase in trimethoprim but a corresponding drop in the usage of sulfamethoxazole-trimethoprim in the private sector in 2010 compared to 2009. In view that most of the usage of this antibiotic is for treatment for urinary tract infections, the drop in the combination drug is likely due to a simplification of therapy to avoid the side effects of the sulphur component of sulfamethoxazole.
Among the macrolides, there was a doubling in the use of erythromycin in 2010 compared to the years before in the public sector. Apart from its anti-infective properties, erythromycin is also being increasingly used as a motility agent in critically ill patients in ICU. A more substantial increase was seen in the usage of azithromycin from 0.091 in 2007 and 2008 to 0.536 and 1.518 in 2009 and 2010 respectively in the private sector. This constitutes a jump of almost 6 fold and 16 fold in those years. While some of the increase can be explained by the increased awareness of the need to cover for atypical infections in community acquired pneumonias (the national antibiotic guidelines

98
MALAYSIAN STATISTICS ON MEDICINES 2009 & 2010
were published at the end of 2008), there is also a possibility that the increase in 2010 purchasing was done due to marketing forces as Azithromycin was losing its patent in the subsequent year. It is also interesting to note that the usage of azithromycin in the private sector exceeded 10 times its usage in the public sector. Taking into consideration the increasing resistance of Streptococcal pneumonia towards azithromycin in the country, this liberal usage in the private sector is of concern.
For aminoglycosides, there was generally an increase in the usage of gentamicin, amikacin and netilmicin in the public sector in both 2009 and 2010 compared to the years before. This is a reflection of the increase in multi-resistant hospital acquired infections as the bulk of aminoglycosides are used in the intensive care units and mainly for patients who have resistant organisms that are only susceptible to this group of drugs.
Going on to the fluoroquinolones group, ofloxacin usage in the public sector in 2010 saw a drop while there was a corresponding increase in the usage of levofloxacin in that year. This reflects a switch in usage of ofloxacin to levofloxacin as an alternative agent for tuberculosis and also would reflect the increase in the number of drug resistant TB cases where levofloxacin is a useful agent. An increase in the use of ciprofloxacin in the public sector and moxifloxacin in the private sector in 2010 is again a cause for concern since it has been repeatedly reported as contributing to the general increase in antibiotic resistance among bacteria. This alarming trend is further emphasised when comparing quinolone usage which was many fold higher in the private practise compared to the public sector.
Among the other antibacterials, there has been a decrease in the usage of vancomycin in the public sector while the usage of linezolid has increased especially in 2010. This shows a general trend among doctors of being increasingly wary of vancomycin and its associated toxicities and the increased availability of alternative agents for its use against methicillin resistant Staphylococcus aureus.
As for tuberculosis (TB), the incidence in Malaysia has increased from 81.4 in 2010 to 83.5 per 100,000 populations in 20111. The rate of MDR-TB cultures had also increased from 0.3% in 2005 to 1.3% in 2011. Hence, the utilization of antimycobacterials also increased. The Fixed-Dose Combinations (FDCs) are preferred to ensure patient’s compliance and acceptability and success in treatment1,2. However, the usage of FDCs is still lower compared to individual drugs in both the public and the private hospitals.
Malaria elimination is now a goal of many countries in Southeast Asia and the Western Pacific, and large reductions in prevalence have been achieved. Malaysia has had one of the most successful malaria control programs in the region, and aims to be malaria-free by 20203. The incidence of malaria in Malaysia has reduced from 0.5 per 1000 population in 2000 to 0.2 per 1000 population since 20084. Since 2010, there were no locally acquired malaria cases reported in 3 states and 2 Federal Territories in Malaysia. However, the incidence of malaria was still high in the East Malaysia ie up to 0.8 per 1000 population4. A total of 4.4% of all malaria cases were notified in Sabah, with this percentage increasing slightly over the years from a median of 3.98% from 1992–2001 to 5.20% from 2002–2011 (p = 0.049)5. On the other hand, thenumber of imported cases is on the rise in West Malaysia4. This pattern can explain the marked increment in the antimalarial usage from 2009 to 2010.
Malaysia remains a low prevalence country for HIV. A modest increase in the use of all anti-retroviral agents is seen from 2009 to 2010. The public sector remains the center of treatment for the majority of HIV positive patients requiring HAART. Usage of fixed dose formulation of antiretrovirals continue to increase in view of the ease of delivery of medications to patients. Protease inhibitors use is much lower compared to other agents due to their status as second line drugs and higher cost. Nevirapine usage remains static while there is a trend towards more efavirenz based HAART.
Agents for treatment of both hepatitis B and C (entecavir, telbivudine, adefovir and ribavirin) also showed modest increases. On the other hand there was a reduction in oseltamivir usage. In light of the significant increment in anti-bacterial use, perhaps health care practitioners are still over-treating upper respiratory tract viral infections with antibacterials.
With regards to antimycotics, there was a 3-fold increase in the utilization of amphotericin B in the public hospital in 2010 when compared to 2009. However, on the whole the NMUS data showed a gradual reduction in the use of systemic antimycotics. A bigger reduction is seen in the private compared to the public hospital. The reason behind this is difficult to be determined as systemic fungal infection is not a notifiable disease.
It is the writing committee’s recommendation that more detailed studies are carried out into the usage of particular antibiotics mainly those that are on the increase and those with significant public health effects. Public health campaigns to discourage inappropriate usage of antibiotics would go a long way toward reducing the threat of mutltiresistance among microorganisms.
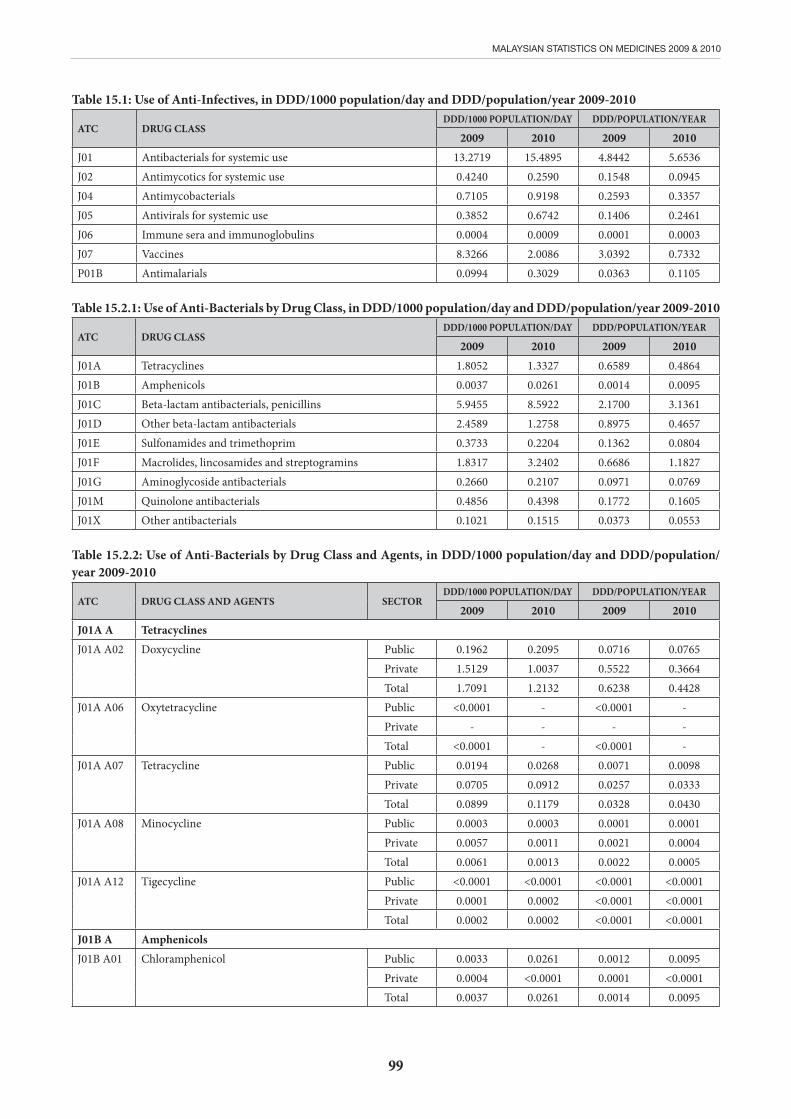
99
MALAYSIAN STATISTICS ON MEDICINES 2009 & 2010
Table 15.1: Use of Anti-Infectives, in DDD/1000 population/day and DDD/population/year 2009-2010
ATC DRUG CLASSDDD/1000 POPULATION/DAY DDD/POPULATION/YEAR
2009 2010 2009 2010J01 Antibacterials for systemic use 13.2719 15.4895 4.8442 5.6536J02 Antimycotics for systemic use 0.4240 0.2590 0.1548 0.0945J04 Antimycobacterials 0.7105 0.9198 0.2593 0.3357J05 Antivirals for systemic use 0.3852 0.6742 0.1406 0.2461J06 Immune sera and immunoglobulins 0.0004 0.0009 0.0001 0.0003J07 Vaccines 8.3266 2.0086 3.0392 0.7332P01B Antimalarials 0.0994 0.3029 0.0363 0.1105
Table 15.2.1: Use of Anti-Bacterials by Drug Class, in DDD/1000 population/day and DDD/population/year 2009-2010
ATC DRUG CLASSDDD/1000 POPULATION/DAY DDD/POPULATION/YEAR
2009 2010 2009 2010J01A Tetracyclines 1.8052 1.3327 0.6589 0.4864J01B Amphenicols 0.0037 0.0261 0.0014 0.0095J01C Beta-lactam antibacterials, penicillins 5.9455 8.5922 2.1700 3.1361J01D Other beta-lactam antibacterials 2.4589 1.2758 0.8975 0.4657J01E Sulfonamides and trimethoprim 0.3733 0.2204 0.1362 0.0804J01F Macrolides, lincosamides and streptogramins 1.8317 3.2402 0.6686 1.1827J01G Aminoglycoside antibacterials 0.2660 0.2107 0.0971 0.0769J01M Quinolone antibacterials 0.4856 0.4398 0.1772 0.1605J01X Other antibacterials 0.1021 0.1515 0.0373 0.0553
Table 15.2.2: Use of Anti-Bacterials by Drug Class and Agents, in DDD/1000 population/day and DDD/population/year 2009-2010
ATC DRUG CLASS AND AGENTS SECTORDDD/1000 POPULATION/DAY DDD/POPULATION/YEAR
2009 2010 2009 2010J01A A TetracyclinesJ01A A02 Doxycycline Public 0.1962 0.2095 0.0716 0.0765
Private 1.5129 1.0037 0.5522 0.3664Total 1.7091 1.2132 0.6238 0.4428
J01A A06 Oxytetracycline Public <0.0001 - <0.0001 -Private - - - -Total <0.0001 - <0.0001 -
J01A A07 Tetracycline Public 0.0194 0.0268 0.0071 0.0098Private 0.0705 0.0912 0.0257 0.0333Total 0.0899 0.1179 0.0328 0.0430
J01A A08 Minocycline Public 0.0003 0.0003 0.0001 0.0001Private 0.0057 0.0011 0.0021 0.0004Total 0.0061 0.0013 0.0022 0.0005
J01A A12 Tigecycline Public <0.0001 <0.0001 <0.0001 <0.0001Private 0.0001 0.0002 <0.0001 <0.0001Total 0.0002 0.0002 <0.0001 <0.0001
J01B A AmphenicolsJ01B A01 Chloramphenicol Public 0.0033 0.0261 0.0012 0.0095
Private 0.0004 <0.0001 0.0001 <0.0001Total 0.0037 0.0261 0.0014 0.0095
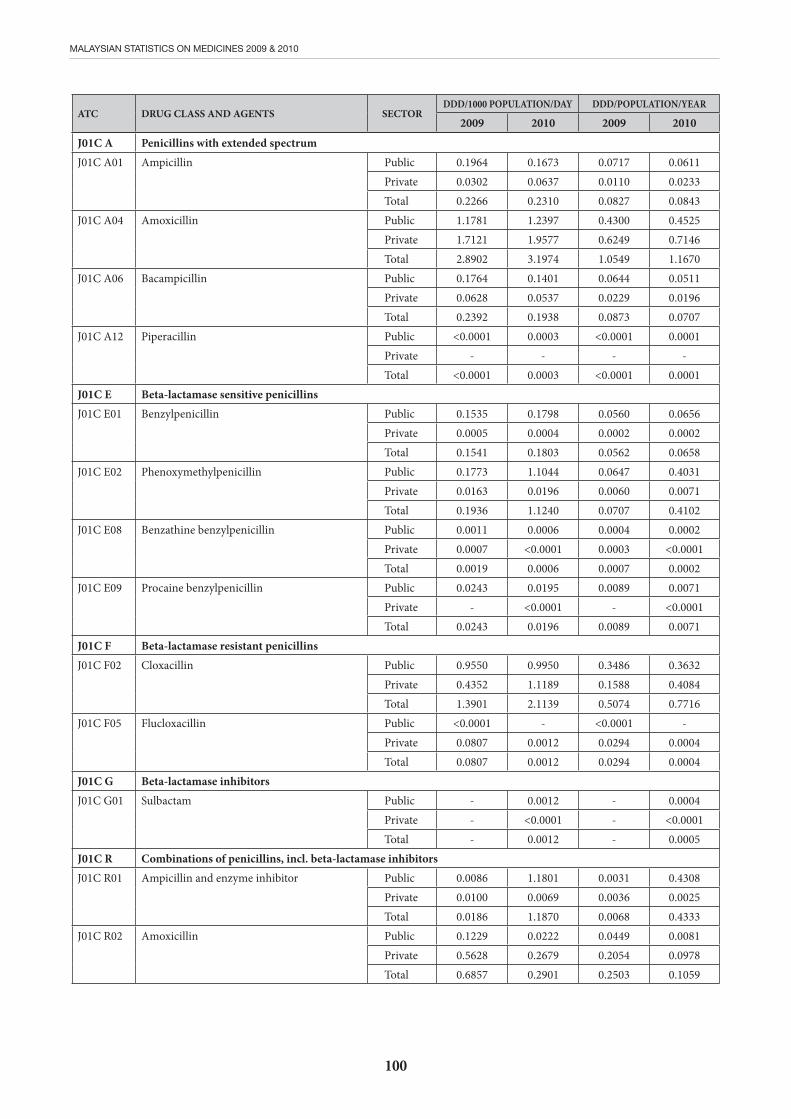
100
MALAYSIAN STATISTICS ON MEDICINES 2009 & 2010
J01C A Penicillins with extended spectrumJ01C A01 Ampicillin Public 0.1964 0.1673 0.0717 0.0611
Private 0.0302 0.0637 0.0110 0.0233Total 0.2266 0.2310 0.0827 0.0843
J01C A04 Amoxicillin Public 1.1781 1.2397 0.4300 0.4525Private 1.7121 1.9577 0.6249 0.7146Total 2.8902 3.1974 1.0549 1.1670
J01C A06 Bacampicillin Public 0.1764 0.1401 0.0644 0.0511Private 0.0628 0.0537 0.0229 0.0196Total 0.2392 0.1938 0.0873 0.0707
J01C A12 Piperacillin Public <0.0001 0.0003 <0.0001 0.0001Private - - - -Total <0.0001 0.0003 <0.0001 0.0001
J01C E Beta-lactamase sensitive penicillinsJ01C E01 Benzylpenicillin Public 0.1535 0.1798 0.0560 0.0656
Private 0.0005 0.0004 0.0002 0.0002Total 0.1541 0.1803 0.0562 0.0658
J01C E02 Phenoxymethylpenicillin Public 0.1773 1.1044 0.0647 0.4031Private 0.0163 0.0196 0.0060 0.0071Total 0.1936 1.1240 0.0707 0.4102
J01C E08 Benzathine benzylpenicillin Public 0.0011 0.0006 0.0004 0.0002Private 0.0007 <0.0001 0.0003 <0.0001Total 0.0019 0.0006 0.0007 0.0002
J01C E09 Procaine benzylpenicillin Public 0.0243 0.0195 0.0089 0.0071Private - <0.0001 - <0.0001Total 0.0243 0.0196 0.0089 0.0071
J01C F Beta-lactamase resistant penicillinsJ01C F02 Cloxacillin Public 0.9550 0.9950 0.3486 0.3632
Private 0.4352 1.1189 0.1588 0.4084Total 1.3901 2.1139 0.5074 0.7716
J01C F05 Flucloxacillin Public <0.0001 - <0.0001 -Private 0.0807 0.0012 0.0294 0.0004Total 0.0807 0.0012 0.0294 0.0004
J01C G Beta-lactamase inhibitorsJ01C G01 Sulbactam Public - 0.0012 - 0.0004
Private - <0.0001 - <0.0001Total - 0.0012 - 0.0005
J01C R Combinations of penicillins, incl. beta-lactamase inhibitorsJ01C R01 Ampicillin and enzyme inhibitor Public 0.0086 1.1801 0.0031 0.4308
Private 0.0100 0.0069 0.0036 0.0025Total 0.0186 1.1870 0.0068 0.4333
J01C R02 Amoxicillin Public 0.1229 0.0222 0.0449 0.0081Private 0.5628 0.2679 0.2054 0.0978Total 0.6857 0.2901 0.2503 0.1059
ATC DRUG CLASS AND AGENTS SECTORDDD/1000 POPULATION/DAY DDD/POPULATION/YEAR
2009 2010 2009 2010
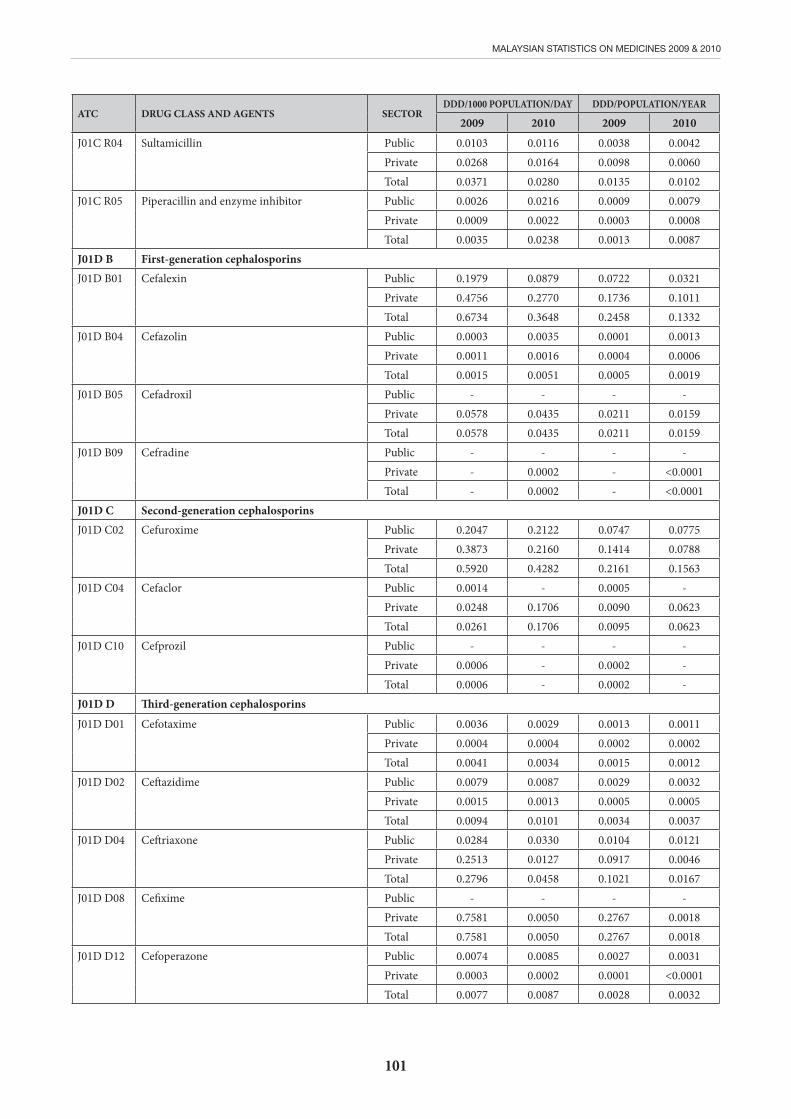
101
MALAYSIAN STATISTICS ON MEDICINES 2009 & 2010
J01C R04 Sultamicillin Public 0.0103 0.0116 0.0038 0.0042Private 0.0268 0.0164 0.0098 0.0060Total 0.0371 0.0280 0.0135 0.0102
J01C R05 Piperacillin and enzyme inhibitor Public 0.0026 0.0216 0.0009 0.0079Private 0.0009 0.0022 0.0003 0.0008Total 0.0035 0.0238 0.0013 0.0087
J01D B First-generation cephalosporinsJ01D B01 Cefalexin Public 0.1979 0.0879 0.0722 0.0321
Private 0.4756 0.2770 0.1736 0.1011Total 0.6734 0.3648 0.2458 0.1332
J01D B04 Cefazolin Public 0.0003 0.0035 0.0001 0.0013Private 0.0011 0.0016 0.0004 0.0006Total 0.0015 0.0051 0.0005 0.0019
J01D B05 Cefadroxil Public - - - -Private 0.0578 0.0435 0.0211 0.0159Total 0.0578 0.0435 0.0211 0.0159
J01D B09 Cefradine Public - - - -Private - 0.0002 - <0.0001Total - 0.0002 - <0.0001
J01D C Second-generation cephalosporinsJ01D C02 Cefuroxime Public 0.2047 0.2122 0.0747 0.0775
Private 0.3873 0.2160 0.1414 0.0788Total 0.5920 0.4282 0.2161 0.1563
J01D C04 Cefaclor Public 0.0014 - 0.0005 -Private 0.0248 0.1706 0.0090 0.0623Total 0.0261 0.1706 0.0095 0.0623
J01D C10 Cefprozil Public - - - -Private 0.0006 - 0.0002 -Total 0.0006 - 0.0002 -
J01D D Third-generation cephalosporins
J01D D01 Cefotaxime Public 0.0036 0.0029 0.0013 0.0011Private 0.0004 0.0004 0.0002 0.0002Total 0.0041 0.0034 0.0015 0.0012
J01D D02 Ceftazidime Public 0.0079 0.0087 0.0029 0.0032Private 0.0015 0.0013 0.0005 0.0005Total 0.0094 0.0101 0.0034 0.0037
J01D D04 Ceftriaxone Public 0.0284 0.0330 0.0104 0.0121Private 0.2513 0.0127 0.0917 0.0046Total 0.2796 0.0458 0.1021 0.0167
J01D D08 Cefixime Public - - - -Private 0.7581 0.0050 0.2767 0.0018Total 0.7581 0.0050 0.2767 0.0018
J01D D12 Cefoperazone Public 0.0074 0.0085 0.0027 0.0031Private 0.0003 0.0002 0.0001 <0.0001Total 0.0077 0.0087 0.0028 0.0032
ATC DRUG CLASS AND AGENTS SECTORDDD/1000 POPULATION/DAY DDD/POPULATION/YEAR
2009 2010 2009 2010
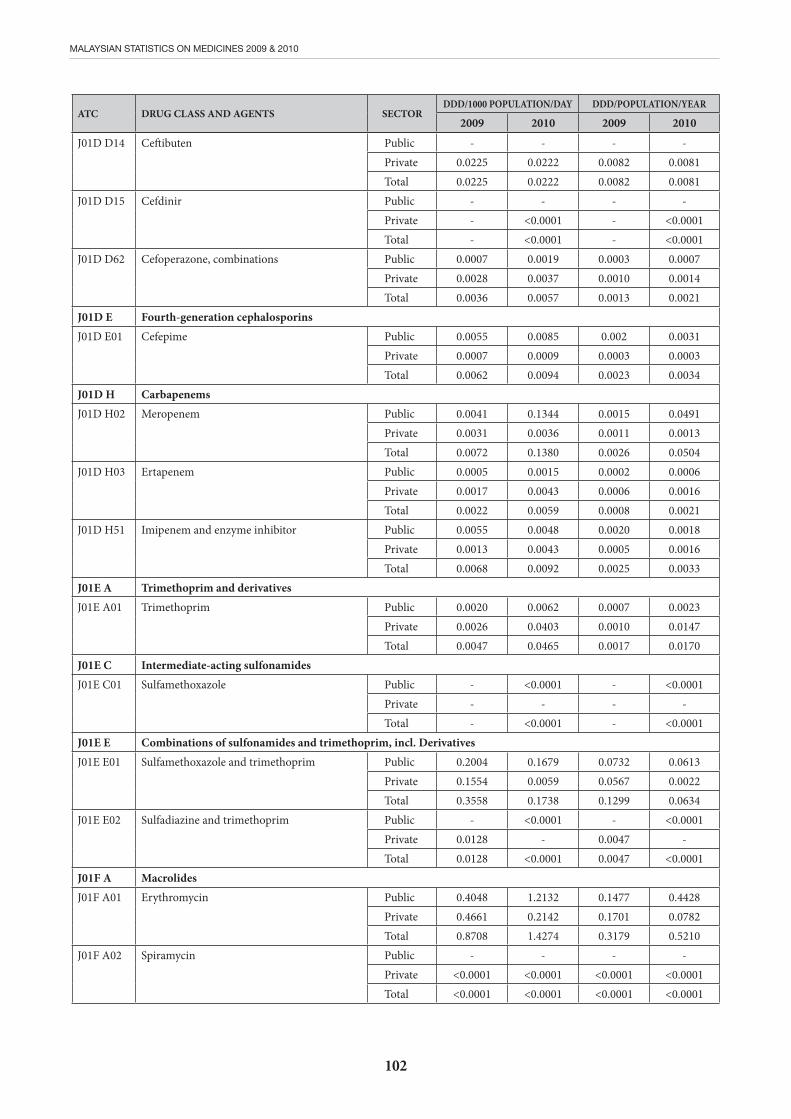
102
MALAYSIAN STATISTICS ON MEDICINES 2009 & 2010
J01D D14 Ceftibuten Public - - - -Private 0.0225 0.0222 0.0082 0.0081Total 0.0225 0.0222 0.0082 0.0081
J01D D15 Cefdinir Public - - - -Private - <0.0001 - <0.0001Total - <0.0001 - <0.0001
J01D D62 Cefoperazone, combinations Public 0.0007 0.0019 0.0003 0.0007Private 0.0028 0.0037 0.0010 0.0014Total 0.0036 0.0057 0.0013 0.0021
J01D E Fourth-generation cephalosporinsJ01D E01 Cefepime Public 0.0055 0.0085 0.002 0.0031
Private 0.0007 0.0009 0.0003 0.0003Total 0.0062 0.0094 0.0023 0.0034
J01D H CarbapenemsJ01D H02 Meropenem Public 0.0041 0.1344 0.0015 0.0491
Private 0.0031 0.0036 0.0011 0.0013Total 0.0072 0.1380 0.0026 0.0504
J01D H03 Ertapenem Public 0.0005 0.0015 0.0002 0.0006Private 0.0017 0.0043 0.0006 0.0016Total 0.0022 0.0059 0.0008 0.0021
J01D H51 Imipenem and enzyme inhibitor Public 0.0055 0.0048 0.0020 0.0018Private 0.0013 0.0043 0.0005 0.0016Total 0.0068 0.0092 0.0025 0.0033
J01E A Trimethoprim and derivativesJ01E A01 Trimethoprim Public 0.0020 0.0062 0.0007 0.0023
Private 0.0026 0.0403 0.0010 0.0147Total 0.0047 0.0465 0.0017 0.0170
J01E C Intermediate-acting sulfonamidesJ01E C01 Sulfamethoxazole Public - <0.0001 - <0.0001
Private - - - -Total - <0.0001 - <0.0001
J01E E Combinations of sulfonamides and trimethoprim, incl. DerivativesJ01E E01 Sulfamethoxazole and trimethoprim Public 0.2004 0.1679 0.0732 0.0613
Private 0.1554 0.0059 0.0567 0.0022Total 0.3558 0.1738 0.1299 0.0634
J01E E02 Sulfadiazine and trimethoprim Public - <0.0001 - <0.0001Private 0.0128 - 0.0047 -Total 0.0128 <0.0001 0.0047 <0.0001
J01F A MacrolidesJ01F A01 Erythromycin Public 0.4048 1.2132 0.1477 0.4428
Private 0.4661 0.2142 0.1701 0.0782Total 0.8708 1.4274 0.3179 0.5210
J01F A02 Spiramycin Public - - - -Private <0.0001 <0.0001 <0.0001 <0.0001Total <0.0001 <0.0001 <0.0001 <0.0001
ATC DRUG CLASS AND AGENTS SECTORDDD/1000 POPULATION/DAY DDD/POPULATION/YEAR
2009 2010 2009 2010

103
MALAYSIAN STATISTICS ON MEDICINES 2009 & 2010
J01F A05 Oleandomycin Public - - - -Private - 0.0002 - <0.0001Total - 0.0002 - <0.0001
J01F A06 Roxithromycin Public - - - -Private 0.0939 0.0513 0.0343 0.0187Total 0.0939 0.0513 0.0343 0.0187
J01F A09 Clarithromycin Public 0.0093 0.0225 0.0034 0.0082Private 0.2453 0.1642 0.0896 0.0599Total 0.2547 0.1867 0.0930 0.0682
J01F A10 Azithromycin Public 0.0578 0.0407 0.0211 0.0148Private 0.5357 1.5175 0.1955 0.5539Total 0.5934 1.5582 0.2166 0.5687
J01F F LincosamidesJ01F F01 Clindamycin Public 0.0019 0.0040 0.0007 0.0015
Private 0.0160 0.0092 0.0059 0.0034Total 0.0179 0.0133 0.0065 0.0048
J01F F02 Lincomycin Public - - - -Private 0.0009 0.0031 0.0003 0.0011Total 0.0009 0.0031 0.0003 0.0011
J01G A StreptomycinsJ01G A01 Streptomycin Public 0.1606 0.1014 0.0586 0.0370
Private 0.0001 0.0002 <0.0001 <0.0001Total 0.1607 0.1016 0.0587 0.0371
J01G B Other aminoglycosidesJ01G B03 Gentamicin Public 0.0796 0.0788 0.0290 0.0288
Private 0.0019 0.0009 0.0007 0.0003Total 0.0814 0.0798 0.0297 0.0291
J01G B04 Kanamycin Public 0.0005 0.0001 0.0002 <0.0001Private 0.0002 0.0002 <0.0001 <0.0001Total 0.0007 0.0003 0.0003 0.0001
J01G B06 Amikacin Public 0.0201 0.0266 0.0074 0.0097Private 0.0004 0.0004 0.0001 0.0001Total 0.0205 0.0270 0.0075 0.0099
J01G B07 Netilmicin Public 0.0020 0.0013 0.0007 0.0005Private 0.0007 0.0007 0.0002 0.0003Total 0.0027 0.0020 0.0010 0.0007
J01M A FluoroquinolonesJ01M A01 Ofloxacin Public 0.0117 0.0091 0.0043 0.0033
Private 0.1075 0.0337 0.0392 0.0123Total 0.1192 0.0428 0.0435 0.0156
J01M A02 Ciprofloxacin Public 0.0315 0.0856 0.0115 0.0312Private 0.2011 0.1713 0.0734 0.0625Total 0.2326 0.2569 0.0849 0.0938
J01M A03 Pefloxacin Public 0.0004 0.0003 0.0001 0.0001Private - 0.0005 - 0.0002Total 0.0004 0.0009 0.0001 0.0003
ATC DRUG CLASS AND AGENTS SECTORDDD/1000 POPULATION/DAY DDD/POPULATION/YEAR
2009 2010 2009 2010

104
MALAYSIAN STATISTICS ON MEDICINES 2009 & 2010
J01M A06 Norfloxacin Public <0.0001 <0.0001 <0.0001 <0.0001Private 0.0753 0.0367 0.0275 0.0134Total 0.0753 0.0367 0.0275 0.0134
J01M A12 Levofloxacin Public 0.0006 0.0053 0.0002 0.0019Private 0.0245 0.0357 0.0090 0.0130Total 0.0252 0.0410 0.0092 0.0150
J01M A14 Moxifloxacin Public 0.0001 0.0001 <0.0001 <0.0001Private 0.0290 0.0554 0.0106 0.0202Total 0.0291 0.0555 0.0106 0.0202
J01M A17 Prulifloxacin Public - - - -Private 0.0002 - <0.0001 -Total 0.0002 - <0.0001 -
J01M B Other quinolonesJ01M B04 Pipemidic acid Public - - - -
Private 0.0036 0.0061 0.0013 0.0022Total 0.0036 0.0061 0.0013 0.0022
J01X A Glycopeptide antibacterialsJ01X A01 Vancomycin Public 0.0034 0.0001 0.0013 <0.0001
Private 0.0008 0.0007 0.0003 0.0003Total 0.0043 0.0008 0.0016 0.0003
J01X A02 Teicoplanin Public 0.0001 0.0002 <0.0001 <0.0001Private 0.0002 0.0002 <0.0001 <0.0001Total 0.0003 0.0004 0.0001 0.0001
J01X B PolymyxinsJ01X B01 Colistin Public <0.0001 0.0003 <0.0001 0.0001
Private - <0.0001 - <0.0001Total <0.0001 0.0003 <0.0001 0.0001
J01X B02 Polymyxin B Public <0.0001 0.0003 <0.0001 <0.0001Private <0.0001 <0.0001 <0.0001 <0.0001Total <0.0001 0.0003 <0.0001 0.0001
J01X C Steroid antibacterialsJ01X C01 Fusidic acid Public 0.0086 0.0490 0.0031 0.0179
Private 0.0027 0.0012 0.0010 0.0005Total 0.0113 0.0502 0.0041 0.0183
J01X D Imidazole derivativesJ01X D01 Metronidazole Public 0.0442 0.0394 0.0161 0.0144
Private 0.0230 0.0484 0.0084 0.0177Total 0.0672 0.0878 0.0245 0.0321
J01X E Nitrofuran derivativesJ01X E01 Nitrofurantoin Public 0.0022 0.0021 0.0008 0.0008
Private 0.0031 0.0010 0.0011 0.0004Total 0.0054 0.0031 0.0020 0.0011
J01X X Other antibacterialsJ01X X01 Fosfomycin Public - - - -
Private 0.0112 0.0009 0.0041 0.0003Total 0.0112 0.0009 0.0041 0.0003
ATC DRUG CLASS AND AGENTS SECTORDDD/1000 POPULATION/DAY DDD/POPULATION/YEAR
2009 2010 2009 2010
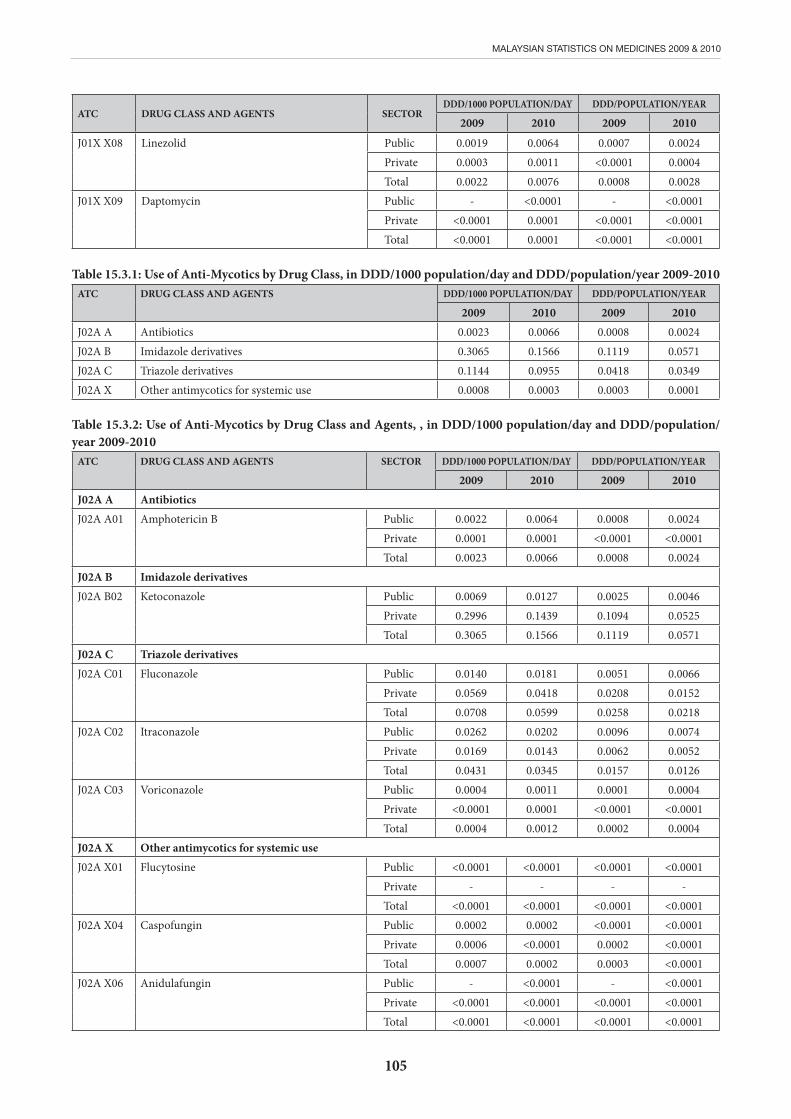
105
MALAYSIAN STATISTICS ON MEDICINES 2009 & 2010
J01X X08 Linezolid Public 0.0019 0.0064 0.0007 0.0024Private 0.0003 0.0011 <0.0001 0.0004Total 0.0022 0.0076 0.0008 0.0028
J01X X09 Daptomycin Public - <0.0001 - <0.0001Private <0.0001 0.0001 <0.0001 <0.0001Total <0.0001 0.0001 <0.0001 <0.0001
Table 15.3.1: Use of Anti-Mycotics by Drug Class, in DDD/1000 population/day and DDD/population/year 2009-2010ATC DRUG CLASS AND AGENTS DDD/1000 POPULATION/DAY DDD/POPULATION/YEAR
2009 2010 2009 2010J02A A Antibiotics 0.0023 0.0066 0.0008 0.0024J02A B Imidazole derivatives 0.3065 0.1566 0.1119 0.0571J02A C Triazole derivatives 0.1144 0.0955 0.0418 0.0349J02A X Other antimycotics for systemic use 0.0008 0.0003 0.0003 0.0001
Table 15.3.2: Use of Anti-Mycotics by Drug Class and Agents, , in DDD/1000 population/day and DDD/population/year 2009-2010
ATC DRUG CLASS AND AGENTS SECTOR DDD/1000 POPULATION/DAY DDD/POPULATION/YEAR
2009 2010 2009 2010J02A A AntibioticsJ02A A01
Amphotericin B Public 0.0022 0.0064 0.0008 0.0024Private 0.0001 0.0001 <0.0001 <0.0001Total 0.0023 0.0066 0.0008 0.0024
J02A B Imidazole derivativesJ02A B02
Ketoconazole Public 0.0069 0.0127 0.0025 0.0046Private 0.2996 0.1439 0.1094 0.0525Total 0.3065 0.1566 0.1119 0.0571
J02A C Triazole derivativesJ02A C01
Fluconazole Public 0.0140 0.0181 0.0051 0.0066Private 0.0569 0.0418 0.0208 0.0152Total 0.0708 0.0599 0.0258 0.0218
J02A C02
Itraconazole Public 0.0262 0.0202 0.0096 0.0074Private 0.0169 0.0143 0.0062 0.0052Total 0.0431 0.0345 0.0157 0.0126
J02A C03
Voriconazole Public 0.0004 0.0011 0.0001 0.0004Private <0.0001 0.0001 <0.0001 <0.0001Total 0.0004 0.0012 0.0002 0.0004
J02A X Other antimycotics for systemic use J02A X01
Flucytosine Public <0.0001 <0.0001 <0.0001 <0.0001Private - - - -Total <0.0001 <0.0001 <0.0001 <0.0001
J02A X04
Caspofungin Public 0.0002 0.0002 <0.0001 <0.0001Private 0.0006 <0.0001 0.0002 <0.0001Total 0.0007 0.0002 0.0003 <0.0001
J02A X06
Anidulafungin Public - <0.0001 - <0.0001Private <0.0001 <0.0001 <0.0001 <0.0001Total <0.0001 <0.0001 <0.0001 <0.0001
ATC DRUG CLASS AND AGENTS SECTORDDD/1000 POPULATION/DAY DDD/POPULATION/YEAR
2009 2010 2009 2010

106
MALAYSIAN STATISTICS ON MEDICINES 2009 & 2010
Table 15.4.1: Use of Anti-Mycobacterials by Drug Class, in DDD/1000 population/day and DDD/population/year 2009-2010
ATC DRUG CLASS AND AGENTS SECTORDDD/1000 POPULATION/DAY DDD/POPULATION/YEAR
2009 2010 2009 2010J04A B AntibioticsJ04A B01
Cycloserine Public 0.0010 0.0015 0.0004 0.0005Private - - - -Total 0.0010 0.0015 0.0004 0.0005
J04A B02
Rifampicin Public 0.2172 0.1981 0.0793 0.0723Private 0.0160 0.0181 0.0058 0.0066Total 0.2332 0.2162 0.0851 0.0789
J04A B04
Rifabutin Public - <0.0001 - <0.0001Private - - - -Total - <0.0001 - <0.0001
J04A C HydrazidesJ04A C01
Isoniazid Public 0.2407 0.4085 0.0879 0.1491Private 0.0113 0.0123 0.0041 0.0045Total 0.2521 0.4208 0.092 0.1536
J04A D Thiocarbamide derivativesJ04A D03
Ethionamide Public 0.0011 0.0016 0.0004 0.0006Private <0.0001 - <0.0001 -Total 0.0011 0.0016 0.0004 0.0006
J04A K Other drugs for treatment of tuberculosisJ04A K01
Pyrazinamide Public 0.1000 0.0880 0.0365 0.0321Private 0.0063 0.0045 0.0023 0.0016Total 0.1062 0.0925 0.0388 0.0338
J04A K02
Ethambutol Public 0.0681 0.0812 0.0249 0.0297Private 0.0084 0.0333 0.0031 0.0122Total 0.0765 0.1145 0.0279 0.0418
J04A M Combinations of drugs for treatment of tuberculosisJ04A M02
Rifampicin and isoniazid Public - <0.0001 - <0.0001Private 0.0055 0.0019 0.0020 0.0007Total 0.0055 0.0020 0.0020 0.0007
J04A M05
Rifampicin, pyrazinamide and isoniazid Public - <0.0001 - <0.0001Private 0.0023 0.0003 0.0008 0.0001Total 0.0023 0.0003 0.0008 0.0001
J04A M06
Rifampicin, pyrazinamide, ethambutol & isoniazid
Public 0.0003 0.0003 0.0001 0.0001Private 0.0022 0.0002 0.0008 <0.0001Total 0.0025 0.0005 0.0009 0.0002
J04B A Drugs for treatment of lepraJ04B A01
Clofazimine Public 0.0016 0.0022 0.0006 0.0008Private - <0.0001 - <0.0001Total 0.0016 0.0023 0.0006 0.0008
J04B A02
Dapsone Public 0.0281 0.0660 0.0102 0.0241Private 0.0004 0.0014 0.0001 0.0005Total 0.0285 0.0673 0.0104 0.0246
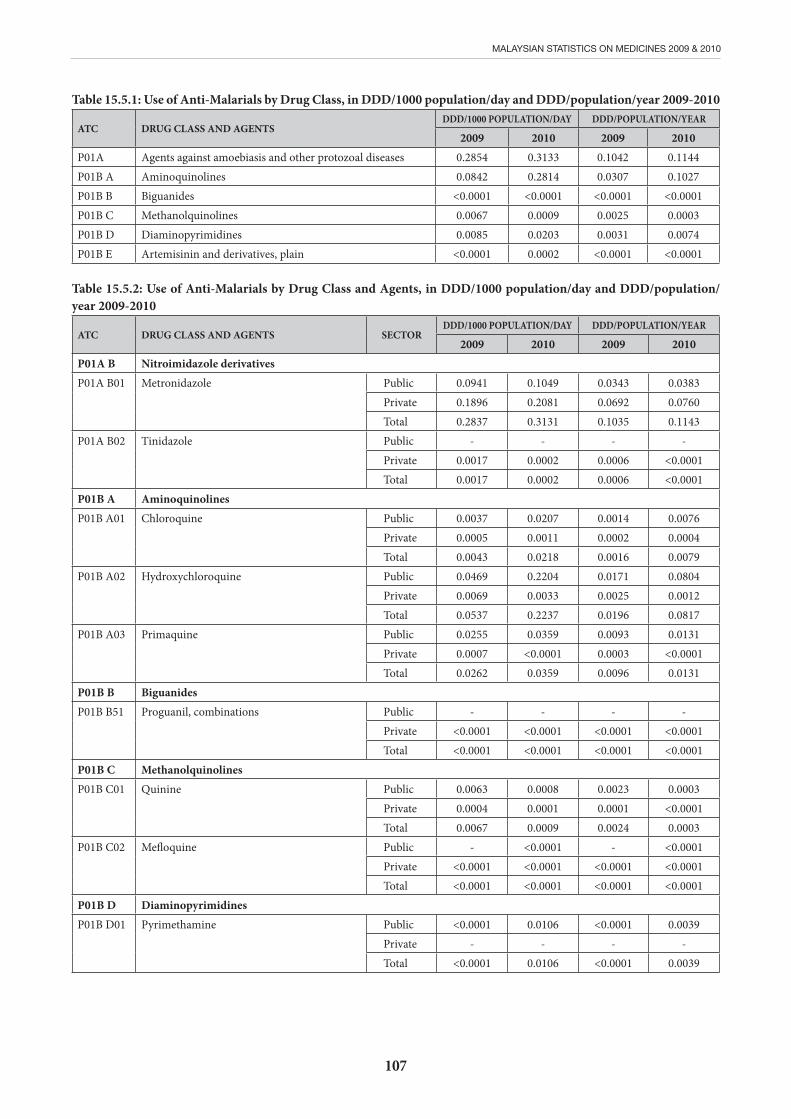
107
MALAYSIAN STATISTICS ON MEDICINES 2009 & 2010
Table 15.5.1: Use of Anti-Malarials by Drug Class, in DDD/1000 population/day and DDD/population/year 2009-2010
ATC DRUG CLASS AND AGENTSDDD/1000 POPULATION/DAY DDD/POPULATION/YEAR
2009 2010 2009 2010P01A Agents against amoebiasis and other protozoal diseases 0.2854 0.3133 0.1042 0.1144P01B A Aminoquinolines 0.0842 0.2814 0.0307 0.1027P01B B Biguanides <0.0001 <0.0001 <0.0001 <0.0001P01B C Methanolquinolines 0.0067 0.0009 0.0025 0.0003P01B D Diaminopyrimidines 0.0085 0.0203 0.0031 0.0074P01B E Artemisinin and derivatives, plain <0.0001 0.0002 <0.0001 <0.0001
Table 15.5.2: Use of Anti-Malarials by Drug Class and Agents, in DDD/1000 population/day and DDD/population/year 2009-2010
ATC DRUG CLASS AND AGENTS SECTORDDD/1000 POPULATION/DAY DDD/POPULATION/YEAR
2009 2010 2009 2010P01A B Nitroimidazole derivatives P01A B01
Metronidazole Public 0.0941 0.1049 0.0343 0.0383Private 0.1896 0.2081 0.0692 0.0760Total 0.2837 0.3131 0.1035 0.1143
P01A B02
Tinidazole Public - - - -Private 0.0017 0.0002 0.0006 <0.0001Total 0.0017 0.0002 0.0006 <0.0001
P01B A AminoquinolinesP01B A01
Chloroquine Public 0.0037 0.0207 0.0014 0.0076Private 0.0005 0.0011 0.0002 0.0004Total 0.0043 0.0218 0.0016 0.0079
P01B A02
Hydroxychloroquine Public 0.0469 0.2204 0.0171 0.0804Private 0.0069 0.0033 0.0025 0.0012Total 0.0537 0.2237 0.0196 0.0817
P01B A03
Primaquine Public 0.0255 0.0359 0.0093 0.0131Private 0.0007 <0.0001 0.0003 <0.0001Total 0.0262 0.0359 0.0096 0.0131
P01B B BiguanidesP01B B51
Proguanil, combinations Public - - - -Private <0.0001 <0.0001 <0.0001 <0.0001Total <0.0001 <0.0001 <0.0001 <0.0001
P01B C MethanolquinolinesP01B C01
Quinine Public 0.0063 0.0008 0.0023 0.0003Private 0.0004 0.0001 0.0001 <0.0001Total 0.0067 0.0009 0.0024 0.0003
P01B C02
Mefloquine Public - <0.0001 - <0.0001Private <0.0001 <0.0001 <0.0001 <0.0001Total <0.0001 <0.0001 <0.0001 <0.0001
P01B D DiaminopyrimidinesP01B D01
Pyrimethamine Public <0.0001 0.0106 <0.0001 0.0039Private - - - -Total <0.0001 0.0106 <0.0001 0.0039
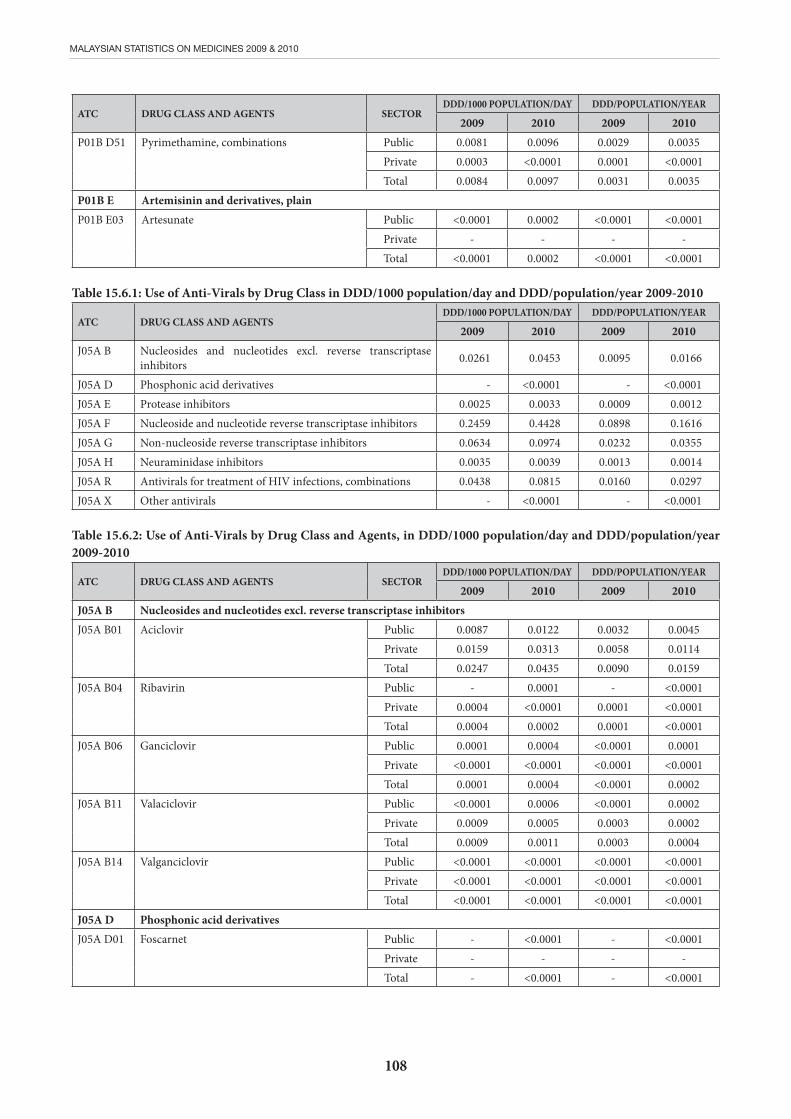
108
MALAYSIAN STATISTICS ON MEDICINES 2009 & 2010
ATC DRUG CLASS AND AGENTS SECTORDDD/1000 POPULATION/DAY DDD/POPULATION/YEAR
2009 2010 2009 2010P01B D51
Pyrimethamine, combinations Public 0.0081 0.0096 0.0029 0.0035Private 0.0003 <0.0001 0.0001 <0.0001Total 0.0084 0.0097 0.0031 0.0035
P01B E Artemisinin and derivatives, plainP01B E03
Artesunate Public <0.0001 0.0002 <0.0001 <0.0001Private - - - -Total <0.0001 0.0002 <0.0001 <0.0001
Table 15.6.1: Use of Anti-Virals by Drug Class in DDD/1000 population/day and DDD/population/year 2009-2010
ATC DRUG CLASS AND AGENTSDDD/1000 POPULATION/DAY DDD/POPULATION/YEAR
2009 2010 2009 2010J05A B Nucleosides and nucleotides excl. reverse transcriptase
inhibitors 0.0261 0.0453 0.0095 0.0166
J05A D Phosphonic acid derivatives - <0.0001 - <0.0001J05A E Protease inhibitors 0.0025 0.0033 0.0009 0.0012J05A F Nucleoside and nucleotide reverse transcriptase inhibitors 0.2459 0.4428 0.0898 0.1616J05A G Non-nucleoside reverse transcriptase inhibitors 0.0634 0.0974 0.0232 0.0355J05A H Neuraminidase inhibitors 0.0035 0.0039 0.0013 0.0014J05A R Antivirals for treatment of HIV infections, combinations 0.0438 0.0815 0.0160 0.0297J05A X Other antivirals - <0.0001 - <0.0001
Table 15.6.2: Use of Anti-Virals by Drug Class and Agents, in DDD/1000 population/day and DDD/population/year 2009-2010
ATC DRUG CLASS AND AGENTS SECTORDDD/1000 POPULATION/DAY DDD/POPULATION/YEAR
2009 2010 2009 2010J05A B Nucleosides and nucleotides excl. reverse transcriptase inhibitorsJ05A B01
Aciclovir Public 0.0087 0.0122 0.0032 0.0045Private 0.0159 0.0313 0.0058 0.0114Total 0.0247 0.0435 0.0090 0.0159
J05A B04
Ribavirin Public - 0.0001 - <0.0001Private 0.0004 <0.0001 0.0001 <0.0001Total 0.0004 0.0002 0.0001 <0.0001
J05A B06
Ganciclovir Public 0.0001 0.0004 <0.0001 0.0001Private <0.0001 <0.0001 <0.0001 <0.0001Total 0.0001 0.0004 <0.0001 0.0002
J05A B11
Valaciclovir Public <0.0001 0.0006 <0.0001 0.0002Private 0.0009 0.0005 0.0003 0.0002Total 0.0009 0.0011 0.0003 0.0004
J05A B14
Valganciclovir Public <0.0001 <0.0001 <0.0001 <0.0001Private <0.0001 <0.0001 <0.0001 <0.0001Total <0.0001 <0.0001 <0.0001 <0.0001
J05A D Phosphonic acid derivativesJ05A D01
Foscarnet Public - <0.0001 - <0.0001Private - - - -Total - <0.0001 - <0.0001
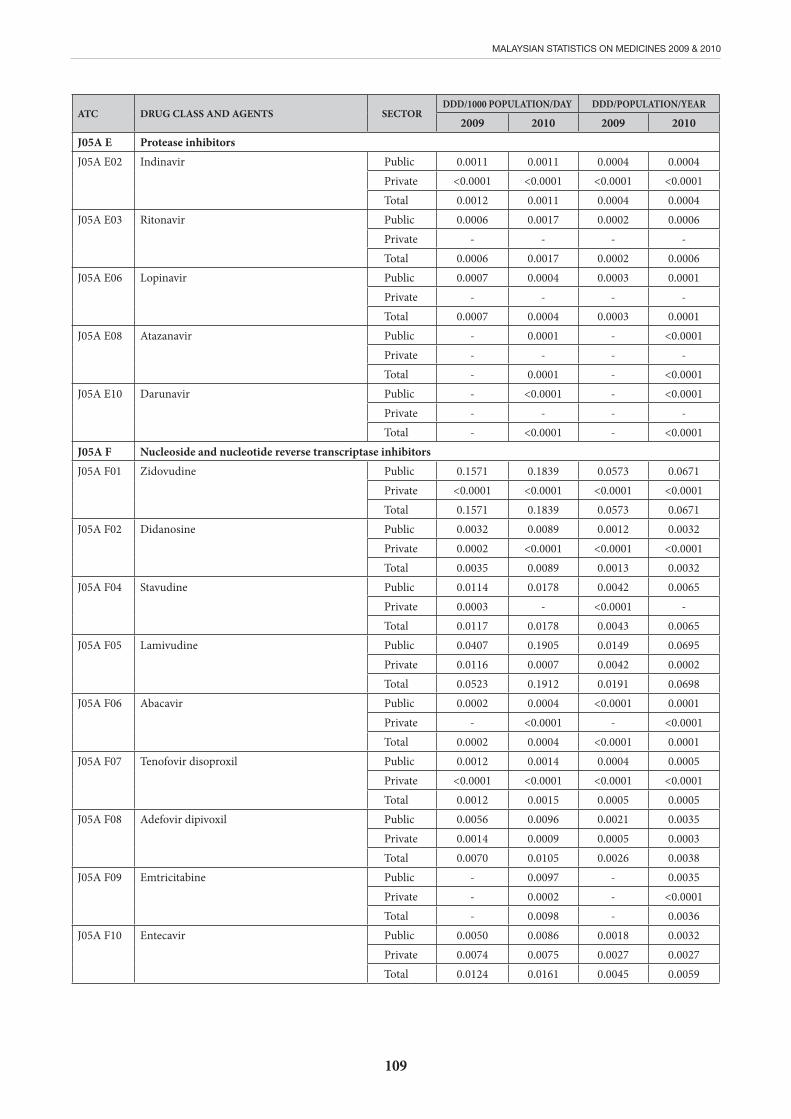
109
MALAYSIAN STATISTICS ON MEDICINES 2009 & 2010
ATC DRUG CLASS AND AGENTS SECTORDDD/1000 POPULATION/DAY DDD/POPULATION/YEAR
2009 2010 2009 2010J05A E Protease inhibitorsJ05A E02
Indinavir Public 0.0011 0.0011 0.0004 0.0004Private <0.0001 <0.0001 <0.0001 <0.0001Total 0.0012 0.0011 0.0004 0.0004
J05A E03
Ritonavir Public 0.0006 0.0017 0.0002 0.0006Private - - - -Total 0.0006 0.0017 0.0002 0.0006
J05A E06
Lopinavir Public 0.0007 0.0004 0.0003 0.0001Private - - - -Total 0.0007 0.0004 0.0003 0.0001
J05A E08
Atazanavir Public - 0.0001 - <0.0001Private - - - -Total - 0.0001 - <0.0001
J05A E10
Darunavir Public - <0.0001 - <0.0001Private - - - -Total - <0.0001 - <0.0001
J05A F Nucleoside and nucleotide reverse transcriptase inhibitors J05A F01
Zidovudine Public 0.1571 0.1839 0.0573 0.0671Private <0.0001 <0.0001 <0.0001 <0.0001Total 0.1571 0.1839 0.0573 0.0671
J05A F02
Didanosine Public 0.0032 0.0089 0.0012 0.0032Private 0.0002 <0.0001 <0.0001 <0.0001Total 0.0035 0.0089 0.0013 0.0032
J05A F04
Stavudine Public 0.0114 0.0178 0.0042 0.0065Private 0.0003 - <0.0001 -Total 0.0117 0.0178 0.0043 0.0065
J05A F05
Lamivudine Public 0.0407 0.1905 0.0149 0.0695Private 0.0116 0.0007 0.0042 0.0002Total 0.0523 0.1912 0.0191 0.0698
J05A F06
Abacavir Public 0.0002 0.0004 <0.0001 0.0001Private - <0.0001 - <0.0001Total 0.0002 0.0004 <0.0001 0.0001
J05A F07
Tenofovir disoproxil Public 0.0012 0.0014 0.0004 0.0005Private <0.0001 <0.0001 <0.0001 <0.0001Total 0.0012 0.0015 0.0005 0.0005
J05A F08
Adefovir dipivoxil Public 0.0056 0.0096 0.0021 0.0035Private 0.0014 0.0009 0.0005 0.0003Total 0.0070 0.0105 0.0026 0.0038
J05A F09
Emtricitabine Public - 0.0097 - 0.0035Private - 0.0002 - <0.0001Total - 0.0098 - 0.0036
J05A F10
Entecavir Public 0.0050 0.0086 0.0018 0.0032Private 0.0074 0.0075 0.0027 0.0027Total 0.0124 0.0161 0.0045 0.0059
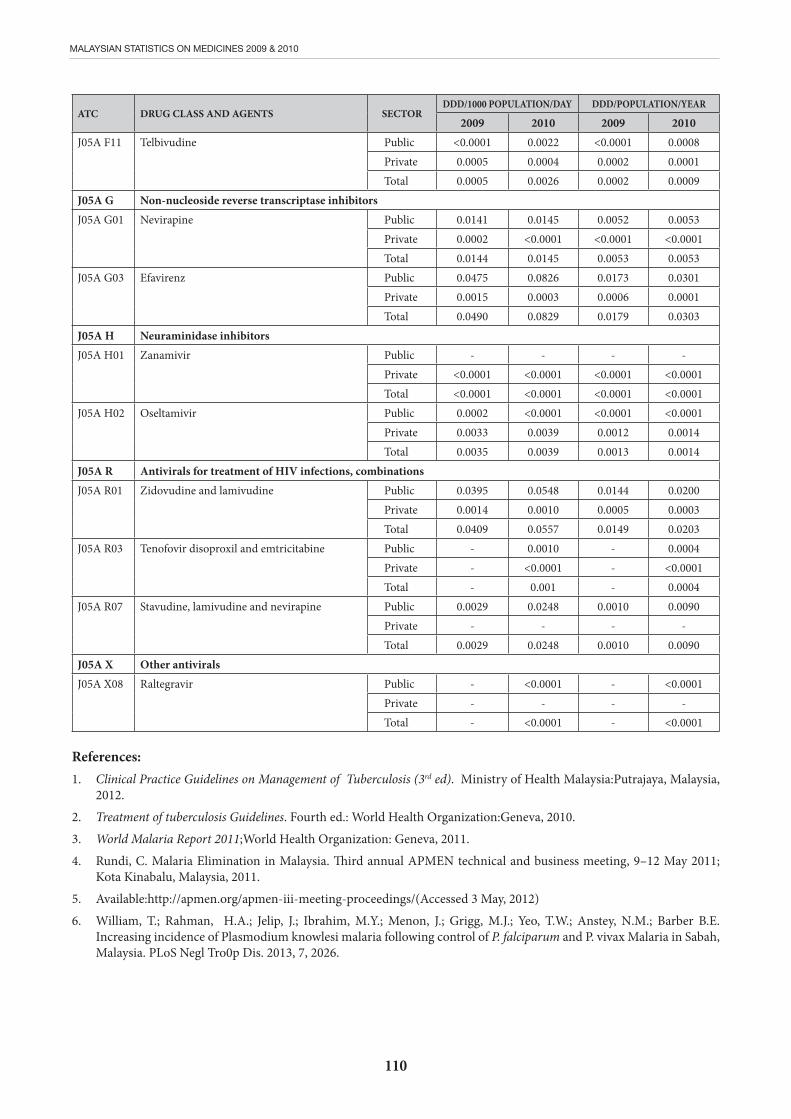
110
MALAYSIAN STATISTICS ON MEDICINES 2009 & 2010
ATC DRUG CLASS AND AGENTS SECTORDDD/1000 POPULATION/DAY DDD/POPULATION/YEAR
2009 2010 2009 2010J05A F11
Telbivudine Public <0.0001 0.0022 <0.0001 0.0008Private 0.0005 0.0004 0.0002 0.0001Total 0.0005 0.0026 0.0002 0.0009
J05A G Non-nucleoside reverse transcriptase inhibitors J05A G01
Nevirapine Public 0.0141 0.0145 0.0052 0.0053Private 0.0002 <0.0001 <0.0001 <0.0001Total 0.0144 0.0145 0.0053 0.0053
J05A G03
Efavirenz Public 0.0475 0.0826 0.0173 0.0301Private 0.0015 0.0003 0.0006 0.0001Total 0.0490 0.0829 0.0179 0.0303
J05A H Neuraminidase inhibitorsJ05A H01
Zanamivir Public - - - -Private <0.0001 <0.0001 <0.0001 <0.0001Total <0.0001 <0.0001 <0.0001 <0.0001
J05A H02
Oseltamivir Public 0.0002 <0.0001 <0.0001 <0.0001Private 0.0033 0.0039 0.0012 0.0014Total 0.0035 0.0039 0.0013 0.0014
J05A R Antivirals for treatment of HIV infections, combinations J05A R01
Zidovudine and lamivudine Public 0.0395 0.0548 0.0144 0.0200Private 0.0014 0.0010 0.0005 0.0003Total 0.0409 0.0557 0.0149 0.0203
J05A R03
Tenofovir disoproxil and emtricitabine Public - 0.0010 - 0.0004Private - <0.0001 - <0.0001Total - 0.001 - 0.0004
J05A R07
Stavudine, lamivudine and nevirapine Public 0.0029 0.0248 0.0010 0.0090Private - - - -Total 0.0029 0.0248 0.0010 0.0090
J05A X Other antiviralsJ05A X08
Raltegravir Public - <0.0001 - <0.0001Private - - - -Total - <0.0001 - <0.0001
References:1. Clinical Practice Guidelines on Management of Tuberculosis (3rd ed). Ministry of Health Malaysia:Putrajaya, Malaysia,
2012.
2. Treatment of tuberculosis Guidelines. Fourth ed.: World Health Organization:Geneva, 2010.
3. World Malaria Report 2011;World Health Organization: Geneva, 2011.
4. Rundi, C. Malaria Elimination in Malaysia. Third annual APMEN technical and business meeting, 9–12 May 2011; Kota Kinabalu, Malaysia, 2011.
5. Available:http://apmen.org/apmen-iii-meeting-proceedings/(Accessed 3 May, 2012)
6. William, T.; Rahman, H.A.; Jelip, J.; Ibrahim, M.Y.; Menon, J.; Grigg, M.J.; Yeo, T.W.; Anstey, N.M.; Barber B.E. Increasing incidence of Plasmodium knowlesi malaria following control of P. falciparum and P. vivax Malaria in Sabah, Malaysia. PLoS Negl Tro0p Dis. 2013, 7, 2026.
111
MALAYSIAN STATISTICS ON MEDICINES 2009 & 2010
CHAPTER 16: USE OF ANTINEOPLASTICS AGENTS, INCLUDING ENDOCRINE THERAPY AND IMMUNOSTIMULANTS
Hafizah Z.A .1, Myat S.K.2, Wan Nazuha W.R. 3, Lim Y.S. 4
1. National Cancer Institute, Putrajaya, 2. Sultan Ismail Hospital, Johor, 3. Kuala Lumpur Hospital, Kuala Lumpur, 4. Ampang Hospital, Selangor.
In 2007, cancer was the third common cause of death at 11.26 percent in Ministry of Health Malaysia Hospitals after Heart Disease and Diseases of Pulmonary Circulation and Septicaemia1. Nearly 70,000 new cancer cases were diagnosed among Malaysians in Peninsular Malaysia between 2003 and 2005, according to a report released in early 2008 on the incidence of the disease in West Malaysia. The most frequent cancer during this period was breast cancer (18 percent) followed by large bowel cancer (11.9 percent) and lung cancer (7.4 percent)2.
Systemic therapy for cancer had evolved from the use of chemotherapy drugs to targeted therapies with less toxicity. New agents are being incorporated into routine practice both in private and public sectors. This report will describe the total utilisation of antineoplastic agents, endocrine therapy and immnostimulants for 2009 and 2010.
For 2009, in the public sector, the 10 antineoplastic agents with the highest overall usage in solid tumours were the 5-flurouracil, capecitabine, cyclophosphamide, methotrexate, gemcitabine, carboplatin, imatinib, etoposide, doxorubicin and cisplatin. For 2010 the top 10 agents were 5-flurouracil, cyclophosphamide, capecitabine, methotrexate, imatinib, gemcitabine, carboplatin, etoposide, doxorubicin and paclitaxel. In private sector for both years, capecitabine was on the top of the list as it was is more convenient for the patients.
There was an increment by six fold from 2009 to 2010 for imatinib usage which could be explained by the introduction of MYPAP (Malaysia Patient Assisted Programme) for gastrointestinal stromal tumour.
Since the introduction of free EGFR test in public sector, the usage of gefitinib and erlotinib which is a targeted treatment for lung cancer has increased compared to private sector. After pemetrexed was registered in Malaysia in 2006 for non-squamous lung cancer, there has been a steady increase both in public and private sector.
Private sector used more lapatinib if compared to trastuzumab in view of cheaper price and convenient in administration (lapatinib is in oral form) in HER2 positive breast cancer. It is also in the top 10 list for both years in
term of usage in private sector. Trastuzumab usage had increased significantly in 2010 by 16 fold in public sector after it was approved for use in adjuvant setting for 1 year (17 cycles).
Bevacizumab was another type of targeted therapy that was gaining popularity in both public and private centre since it’s registration in Malaysia in 2005. Most significant increase had been observed in public sector in which it is being prescribed as a treatment for metastatic colorectal cancer.
Temozolomide is an alkylating agent used in post-operative setting in patients diagnosed with Glioblastoma Multiforme concurrent with radiotherapy and as single agent. Its usage had increased significantly in public sector, although in private sector remained the same.
According to the different drug classes, for antimetabolites, fluorouracil was the most used agent followed by capecitabine. This could be explained by the fact that fluorouracil was used in many types of cancer which included breast, colorectal and head & neck. As for capecitabine, it was used more frequently in breast and colorectal cancer as an oral alternative of fluorouracil and in patients who did not tolerate fluorouracil.
The most used alkylating agent was cyclophosphamide as it was commonly used in breast cancer patients either in adjuvant or metastatic setting3. Breast cancer was also the commonest cancer in Malaysia.
In the platinum group, there was a drastic increase in the usage for carboplatin in private sector in which it was ranked as number 10 in 2009 but jumped to 2nd place in 2010.
ENDOCRINE THERAPY
Comparing 2009 to 2010, there was a reduction in the usage of tamoxifen in the private sector as opposed to public sector, in which the figure remained the same. However there was an increment in the usage of aromatase inhibitors in particular exemestane in both sectors.
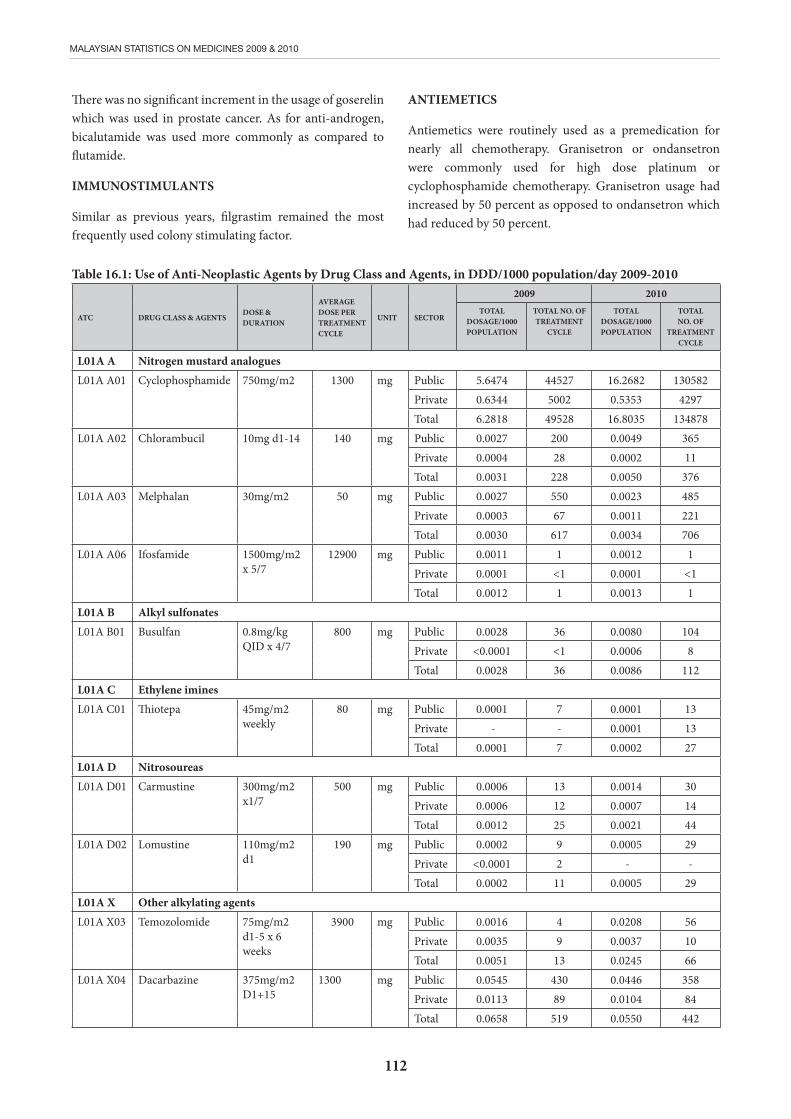
112
MALAYSIAN STATISTICS ON MEDICINES 2009 & 2010
There was no significant increment in the usage of goserelin which was used in prostate cancer. As for anti-androgen, bicalutamide was used more commonly as compared to flutamide.
IMMUNOSTIMULANTS
Similar as previous years, filgrastim remained the most frequently used colony stimulating factor.
ANTIEMETICS
Antiemetics were routinely used as a premedication for nearly all chemotherapy. Granisetron or ondansetron were commonly used for high dose platinum or cyclophosphamide chemotherapy. Granisetron usage had increased by 50 percent as opposed to ondansetron which had reduced by 50 percent.
Table 16.1: Use of Anti-Neoplastic Agents by Drug Class and Agents, in DDD/1000 population/day 2009-2010
ATC DRUG CLASS & AGENTSDOSE & DURATION
AVERAGE DOSE PER TREATMENT CYCLE
UNIT SECTOR
2009 2010TOTAL
DOSAGE/1000 POPULATION
TOTAL NO. OF TREATMENT
CYCLE
TOTAL DOSAGE/1000 POPULATION
TOTAL NO. OF
TREATMENT CYCLE
L01A A Nitrogen mustard analoguesL01A A01 Cyclophosphamide 750mg/m2 1300 mg Public 5.6474 44527 16.2682 130582
Private 0.6344 5002 0.5353 4297Total 6.2818 49528 16.8035 134878
L01A A02 Chlorambucil 10mg d1-14 140 mg Public 0.0027 200 0.0049 365Private 0.0004 28 0.0002 11Total 0.0031 228 0.0050 376
L01A A03 Melphalan 30mg/m2 50 mg Public 0.0027 550 0.0023 485Private 0.0003 67 0.0011 221Total 0.0030 617 0.0034 706
L01A A06 Ifosfamide 1500mg/m2 x 5/7
12900 mg Public 0.0011 1 0.0012 1Private 0.0001 <1 0.0001 <1Total 0.0012 1 0.0013 1
L01A B Alkyl sulfonatesL01A B01 Busulfan 0.8mg/kg
QID x 4/7800 mg Public 0.0028 36 0.0080 104
Private <0.0001 <1 0.0006 8Total 0.0028 36 0.0086 112
L01A C Ethylene iminesL01A C01 Thiotepa 45mg/m2
weekly80 mg Public 0.0001 7 0.0001 13
Private - - 0.0001 13Total 0.0001 7 0.0002 27
L01A D NitrosoureasL01A D01 Carmustine 300mg/m2
x1/7500 mg Public 0.0006 13 0.0014 30
Private 0.0006 12 0.0007 14Total 0.0012 25 0.0021 44
L01A D02 Lomustine 110mg/m2 d1
190 mg Public 0.0002 9 0.0005 29Private <0.0001 2 - -Total 0.0002 11 0.0005 29
L01A X Other alkylating agentsL01A X03 Temozolomide 75mg/m2
d1-5 x 6 weeks
3900 mg Public 0.0016 4 0.0208 56Private 0.0035 9 0.0037 10Total 0.0051 13 0.0245 66
L01A X04 Dacarbazine 375mg/m2 D1+15
1300 mg Public 0.0545 430 0.0446 358Private 0.0113 89 0.0104 84Total 0.0658 519 0.0550 442
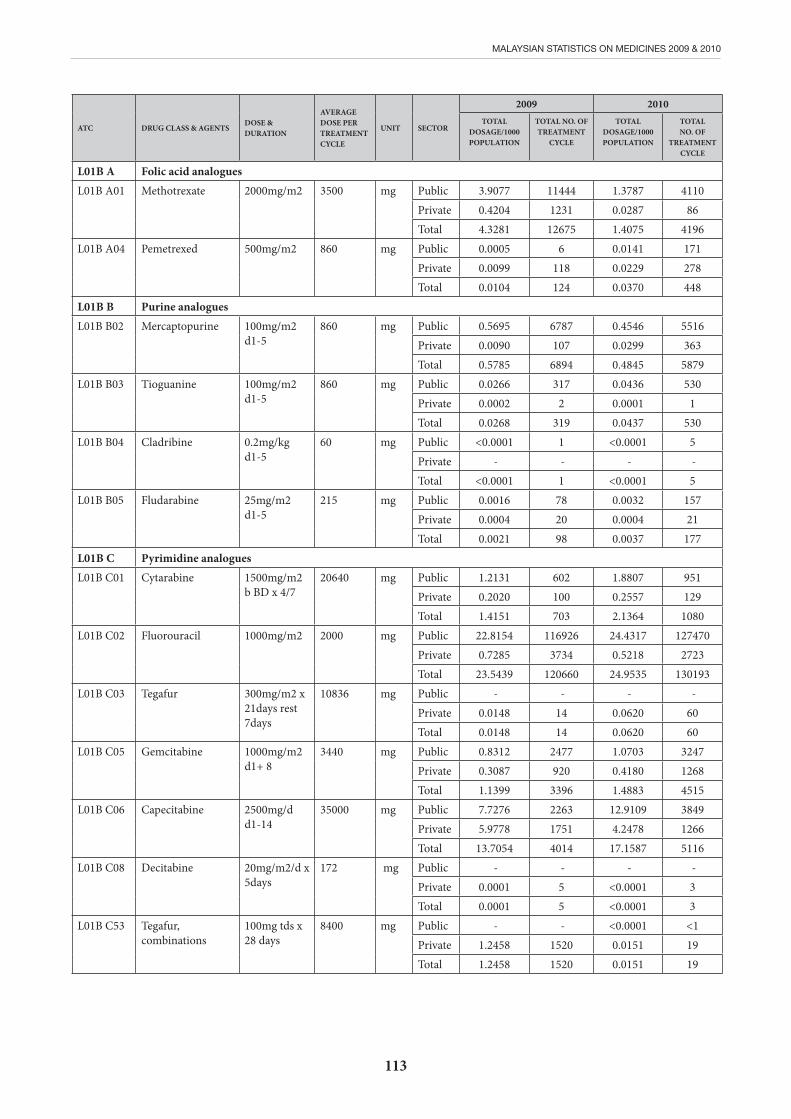
113
MALAYSIAN STATISTICS ON MEDICINES 2009 & 2010
ATC DRUG CLASS & AGENTSDOSE & DURATION
AVERAGE DOSE PER TREATMENT CYCLE
UNIT SECTOR
2009 2010TOTAL
DOSAGE/1000 POPULATION
TOTAL NO. OF TREATMENT
CYCLE
TOTAL DOSAGE/1000 POPULATION
TOTAL NO. OF
TREATMENT CYCLE
L01B A Folic acid analoguesL01B A01 Methotrexate 2000mg/m2 3500 mg Public 3.9077 11444 1.3787 4110
Private 0.4204 1231 0.0287 86Total 4.3281 12675 1.4075 4196
L01B A04 Pemetrexed 500mg/m2 860 mg Public 0.0005 6 0.0141 171Private 0.0099 118 0.0229 278Total 0.0104 124 0.0370 448
L01B B Purine analoguesL01B B02 Mercaptopurine 100mg/m2
d1-5860 mg Public 0.5695 6787 0.4546 5516
Private 0.0090 107 0.0299 363Total 0.5785 6894 0.4845 5879
L01B B03 Tioguanine 100mg/m2 d1-5
860 mg Public 0.0266 317 0.0436 530Private 0.0002 2 0.0001 1Total 0.0268 319 0.0437 530
L01B B04 Cladribine 0.2mg/kg d1-5
60 mg Public <0.0001 1 <0.0001 5Private - - - -Total <0.0001 1 <0.0001 5
L01B B05 Fludarabine 25mg/m2 d1-5
215 mg Public 0.0016 78 0.0032 157Private 0.0004 20 0.0004 21Total 0.0021 98 0.0037 177
L01B C Pyrimidine analoguesL01B C01 Cytarabine 1500mg/m2
b BD x 4/720640 mg Public 1.2131 602 1.8807 951
Private 0.2020 100 0.2557 129Total 1.4151 703 2.1364 1080
L01B C02 Fluorouracil 1000mg/m2 2000 mg Public 22.8154 116926 24.4317 127470Private 0.7285 3734 0.5218 2723Total 23.5439 120660 24.9535 130193
L01B C03 Tegafur 300mg/m2 x 21days rest 7days
10836 mg Public - - - -Private 0.0148 14 0.0620 60Total 0.0148 14 0.0620 60
L01B C05 Gemcitabine 1000mg/m2 d1+ 8
3440 mg Public 0.8312 2477 1.0703 3247Private 0.3087 920 0.4180 1268Total 1.1399 3396 1.4883 4515
L01B C06 Capecitabine 2500mg/d d1-14
35000 mg Public 7.7276 2263 12.9109 3849Private 5.9778 1751 4.2478 1266Total 13.7054 4014 17.1587 5116
L01B C08 Decitabine 20mg/m2/d x 5days
172 mg Public - - - -Private 0.0001 5 <0.0001 3Total 0.0001 5 <0.0001 3
L01B C53 Tegafur, combinations
100mg tds x 28 days
8400 mg Public - - <0.0001 <1Private 1.2458 1520 0.0151 19Total 1.2458 1520 0.0151 19
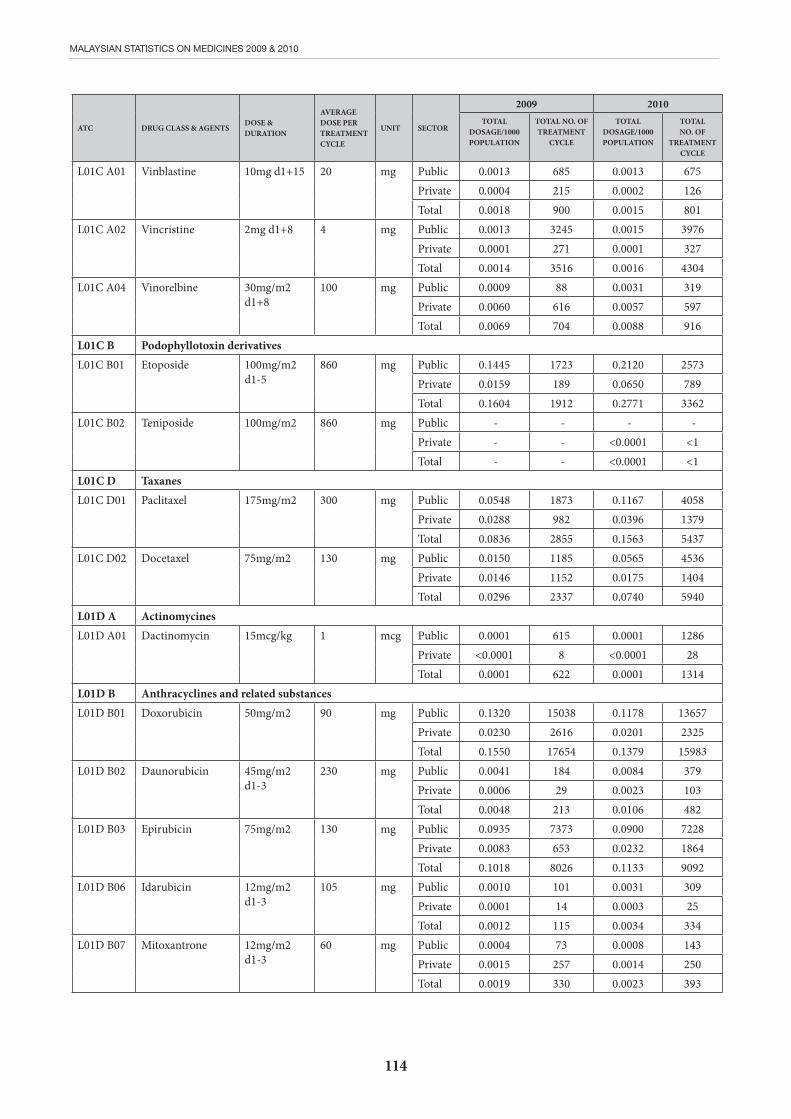
114
MALAYSIAN STATISTICS ON MEDICINES 2009 & 2010
ATC DRUG CLASS & AGENTSDOSE & DURATION
AVERAGE DOSE PER TREATMENT CYCLE
UNIT SECTOR
2009 2010TOTAL
DOSAGE/1000 POPULATION
TOTAL NO. OF TREATMENT
CYCLE
TOTAL DOSAGE/1000 POPULATION
TOTAL NO. OF
TREATMENT CYCLE
L01C A01 Vinblastine 10mg d1+15 20 mg Public 0.0013 685 0.0013 675Private 0.0004 215 0.0002 126Total 0.0018 900 0.0015 801
L01C A02 Vincristine 2mg d1+8 4 mg Public 0.0013 3245 0.0015 3976Private 0.0001 271 0.0001 327Total 0.0014 3516 0.0016 4304
L01C A04 Vinorelbine 30mg/m2 d1+8
100 mg Public 0.0009 88 0.0031 319Private 0.0060 616 0.0057 597Total 0.0069 704 0.0088 916
L01C B Podophyllotoxin derivativesL01C B01 Etoposide 100mg/m2
d1-5860 mg Public 0.1445 1723 0.2120 2573
Private 0.0159 189 0.0650 789Total 0.1604 1912 0.2771 3362
L01C B02 Teniposide 100mg/m2 860 mg Public - - - -Private - - <0.0001 <1Total - - <0.0001 <1
L01C D TaxanesL01C D01 Paclitaxel 175mg/m2 300 mg Public 0.0548 1873 0.1167 4058
Private 0.0288 982 0.0396 1379Total 0.0836 2855 0.1563 5437
L01C D02 Docetaxel 75mg/m2 130 mg Public 0.0150 1185 0.0565 4536Private 0.0146 1152 0.0175 1404Total 0.0296 2337 0.0740 5940
L01D A ActinomycinesL01D A01 Dactinomycin 15mcg/kg 1 mcg Public 0.0001 615 0.0001 1286
Private <0.0001 8 <0.0001 28Total 0.0001 622 0.0001 1314
L01D B Anthracyclines and related substancesL01D B01 Doxorubicin 50mg/m2 90 mg Public 0.1320 15038 0.1178 13657
Private 0.0230 2616 0.0201 2325Total 0.1550 17654 0.1379 15983
L01D B02 Daunorubicin 45mg/m2 d1-3
230 mg Public 0.0041 184 0.0084 379Private 0.0006 29 0.0023 103Total 0.0048 213 0.0106 482
L01D B03 Epirubicin 75mg/m2 130 mg Public 0.0935 7373 0.0900 7228Private 0.0083 653 0.0232 1864Total 0.1018 8026 0.1133 9092
L01D B06 Idarubicin 12mg/m2 d1-3
105 mg Public 0.0010 101 0.0031 309Private 0.0001 14 0.0003 25Total 0.0012 115 0.0034 334
L01D B07 Mitoxantrone 12mg/m2 d1-3
60 mg Public 0.0004 73 0.0008 143Private 0.0015 257 0.0014 250Total 0.0019 330 0.0023 393
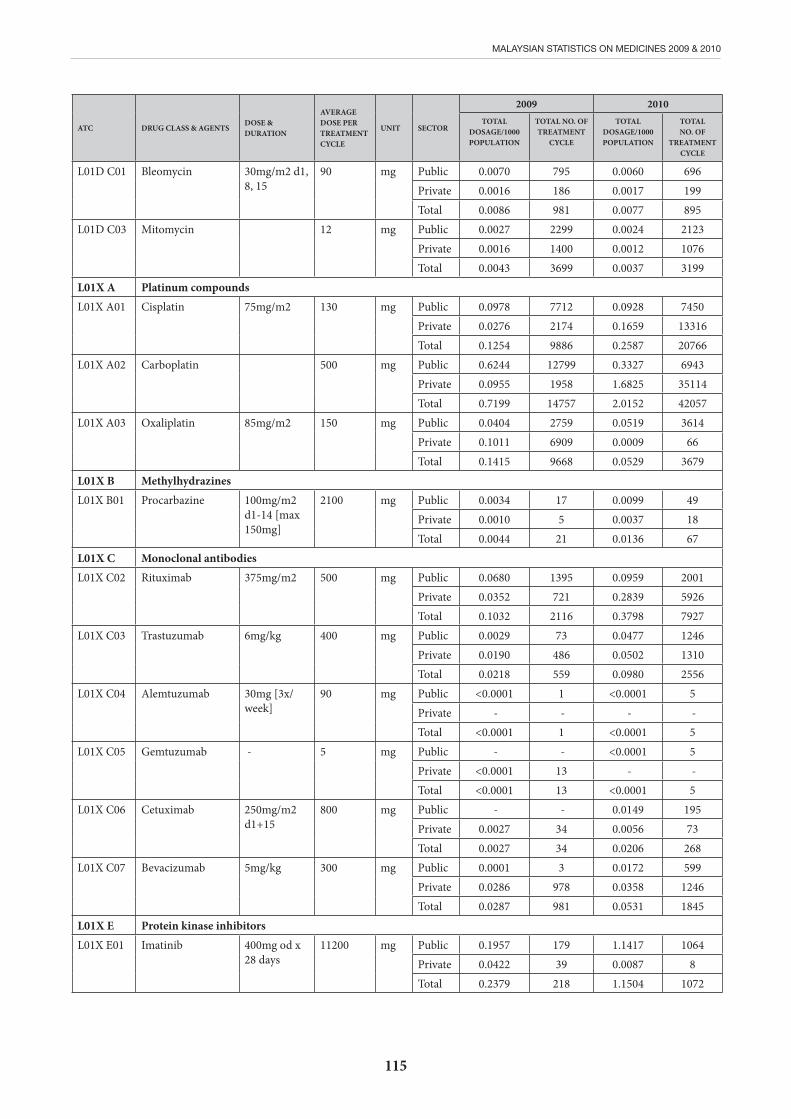
115
MALAYSIAN STATISTICS ON MEDICINES 2009 & 2010
ATC DRUG CLASS & AGENTSDOSE & DURATION
AVERAGE DOSE PER TREATMENT CYCLE
UNIT SECTOR
2009 2010TOTAL
DOSAGE/1000 POPULATION
TOTAL NO. OF TREATMENT
CYCLE
TOTAL DOSAGE/1000 POPULATION
TOTAL NO. OF
TREATMENT CYCLE
L01D C01 Bleomycin 30mg/m2 d1, 8, 15
90 mg Public 0.0070 795 0.0060 696Private 0.0016 186 0.0017 199Total 0.0086 981 0.0077 895
L01D C03 Mitomycin 12 mg Public 0.0027 2299 0.0024 2123Private 0.0016 1400 0.0012 1076Total 0.0043 3699 0.0037 3199
L01X A Platinum compoundsL01X A01 Cisplatin 75mg/m2 130 mg Public 0.0978 7712 0.0928 7450
Private 0.0276 2174 0.1659 13316Total 0.1254 9886 0.2587 20766
L01X A02 Carboplatin 500 mg Public 0.6244 12799 0.3327 6943Private 0.0955 1958 1.6825 35114Total 0.7199 14757 2.0152 42057
L01X A03 Oxaliplatin 85mg/m2 150 mg Public 0.0404 2759 0.0519 3614Private 0.1011 6909 0.0009 66Total 0.1415 9668 0.0529 3679
L01X B MethylhydrazinesL01X B01 Procarbazine 100mg/m2
d1-14 [max 150mg]
2100 mg Public 0.0034 17 0.0099 49Private 0.0010 5 0.0037 18Total 0.0044 21 0.0136 67
L01X C Monoclonal antibodiesL01X C02 Rituximab 375mg/m2 500 mg Public 0.0680 1395 0.0959 2001
Private 0.0352 721 0.2839 5926Total 0.1032 2116 0.3798 7927
L01X C03 Trastuzumab 6mg/kg 400 mg Public 0.0029 73 0.0477 1246Private 0.0190 486 0.0502 1310Total 0.0218 559 0.0980 2556
L01X C04 Alemtuzumab 30mg [3x/week]
90 mg Public <0.0001 1 <0.0001 5Private - - - -Total <0.0001 1 <0.0001 5
L01X C05 Gemtuzumab - 5 mg Public - - <0.0001 5Private <0.0001 13 - -Total <0.0001 13 <0.0001 5
L01X C06 Cetuximab 250mg/m2 d1+15
800 mg Public - - 0.0149 195Private 0.0027 34 0.0056 73Total 0.0027 34 0.0206 268
L01X C07 Bevacizumab 5mg/kg 300 mg Public 0.0001 3 0.0172 599Private 0.0286 978 0.0358 1246Total 0.0287 981 0.0531 1845
L01X E Protein kinase inhibitorsL01X E01 Imatinib 400mg od x
28 days11200 mg Public 0.1957 179 1.1417 1064
Private 0.0422 39 0.0087 8Total 0.2379 218 1.1504 1072

116
MALAYSIAN STATISTICS ON MEDICINES 2009 & 2010
ATC DRUG CLASS & AGENTSDOSE & DURATION
AVERAGE DOSE PER TREATMENT CYCLE
UNIT SECTOR
2009 2010TOTAL
DOSAGE/1000 POPULATION
TOTAL NO. OF TREATMENT
CYCLE
TOTAL DOSAGE/1000 POPULATION
TOTAL NO. OF
TREATMENT CYCLE
L01X E02 Gefitinib 250mg od x 28 days
7000 mg Public 0.0002 <1 0.0612 91Private 0.0815 119 0.0548 82Total 0.0817 120 0.1161 173
L01X E03 Erlotinib 100mg od x 28 days
2800 mg Public - - 0.0238 89Private 0.0304 111 0.0157 59Total 0.0304 111 0.0395 147
L01X E04 Sunitinib 37.5mg x4/52 rest 2/52
1050 mg Public 0.0005 5 0.0057 57Private 0.0002 2 0.0001 1Total 0.0007 7 0.0059 58
L01X E05 Sorafenib 400mg bd x 28 days
22400 mg Public 0.0001 <1 0.0236 11Private 0.0033 2 0.0057 3Total 0.0034 2 0.0293 14
L01X E06 Dasatinib 70mg bd x 28 days
3920 mg Public <0.0001 <1 0.0073 19Private 0.0004 1 - -Total 0.0004 1 0.0073 19
L01X E07 Lapatinib 1250mg od x 28 days
35000 mg Public - - 0.0636 19Private 0.3018 88 0.1278 38Total 0.3018 88 0.1914 57
L01X E08 Nilotinib 400mg bd x 28 days
38528 mg Public 0.0640 17 0.0820 22Private - - 0.0016 <1Total 0.0640 17 0.0837 23
L01X E09 Temsirolimus 25 mg per week x 4
100 mg Public - - - -Private - - <0.0001 1Total - - <0.0001 1
L01X X Other antineoplastic agentsL01X X02 Asparaginase 10000iu/m2 20000 iu Public 2.8744 1473 4.6804 2442
Private 0.4133 212 0.2767 144Total 3.2877 1685 4.9571 2586
L01X X05 Hydroxycarbamide 500mg tds x 28 days
42000 mg Public 13.1101 3199 43.508 10809Private 2.2703 554 1.8150 451Total 15.3804 3753 45.3229 11260
L01X X11 Estramustine 280mg tds d1-5
4200 mg Public - - - -Private <0.0001 <1 0.0001 <1Total <0.0001 <1 0.0001 <1
L01X X14 Tretinoin 45mg/m2 d1-15 q12 weeks
1160 mg Public 0.0142 125 0.0156 141Private 0.0026 23 0.0052 46Total 0.0168 148 0.0208 187
L01X X17 Topotecan 1.25mg/m2 d2-6
10 mg Public - - 0.0002 191Private <0.0001 23 <0.0001 14Total <0.0001 23 0.0002 205
L01X X19 Irinotecan 180mg/m2 310 mg Public 0.0129 427 0.0248 835Private 0.0090 298 0.0089 299Total 0.0219 724 0.0337 1134
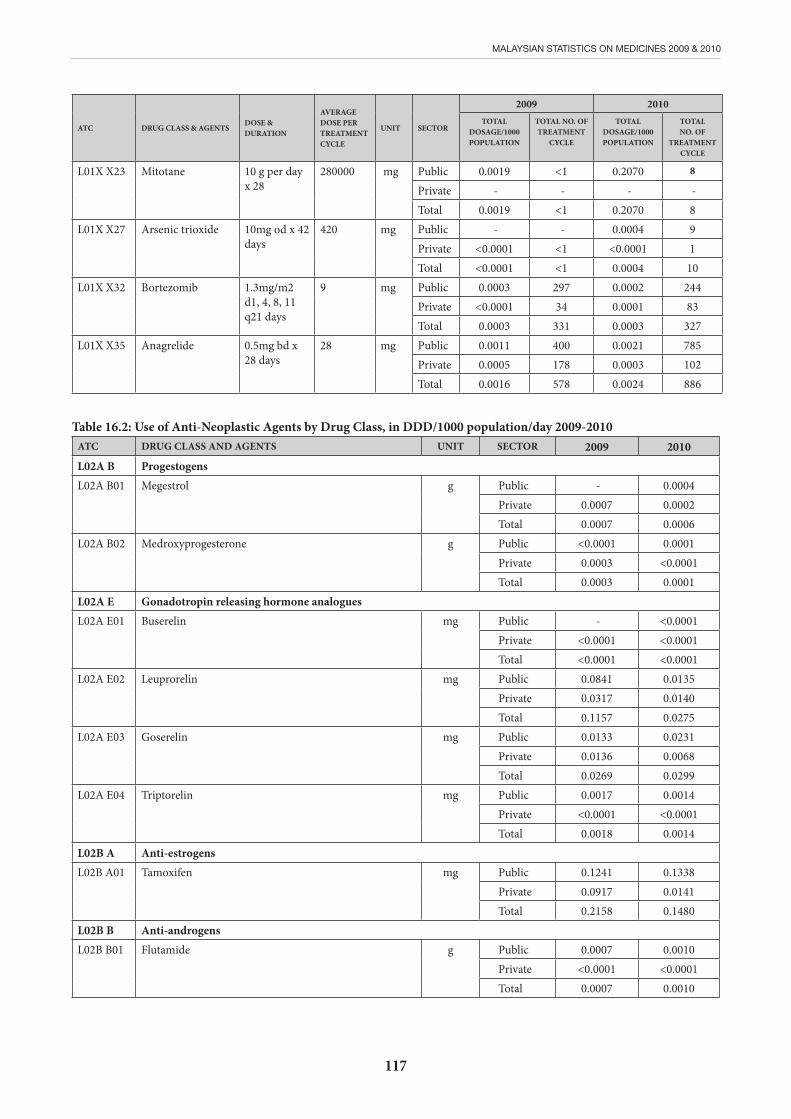
117
MALAYSIAN STATISTICS ON MEDICINES 2009 & 2010
ATC DRUG CLASS & AGENTSDOSE & DURATION
AVERAGE DOSE PER TREATMENT CYCLE
UNIT SECTOR
2009 2010TOTAL
DOSAGE/1000 POPULATION
TOTAL NO. OF TREATMENT
CYCLE
TOTAL DOSAGE/1000 POPULATION
TOTAL NO. OF
TREATMENT CYCLE
L01X X23 Mitotane 10 g per day x 28
280000 mg Public 0.0019 <1 0.2070 8
Private - - - -Total 0.0019 <1 0.2070 8
L01X X27 Arsenic trioxide 10mg od x 42 days
420 mg Public - - 0.0004 9Private <0.0001 <1 <0.0001 1Total <0.0001 <1 0.0004 10
L01X X32 Bortezomib 1.3mg/m2 d1, 4, 8, 11 q21 days
9 mg Public 0.0003 297 0.0002 244Private <0.0001 34 0.0001 83Total 0.0003 331 0.0003 327
L01X X35 Anagrelide 0.5mg bd x 28 days
28 mg Public 0.0011 400 0.0021 785Private 0.0005 178 0.0003 102Total 0.0016 578 0.0024 886
Table 16.2: Use of Anti-Neoplastic Agents by Drug Class, in DDD/1000 population/day 2009-2010ATC DRUG CLASS AND AGENTS UNIT SECTOR 2009 2010L02A B ProgestogensL02A B01
Megestrol g Public - 0.0004Private 0.0007 0.0002Total 0.0007 0.0006
L02A B02
Medroxyprogesterone g Public <0.0001 0.0001Private 0.0003 <0.0001Total 0.0003 0.0001
L02A E Gonadotropin releasing hormone analoguesL02A E01
Buserelin mg Public - <0.0001Private <0.0001 <0.0001Total <0.0001 <0.0001
L02A E02
Leuprorelin mg Public 0.0841 0.0135Private 0.0317 0.0140Total 0.1157 0.0275
L02A E03
Goserelin mg Public 0.0133 0.0231Private 0.0136 0.0068Total 0.0269 0.0299
L02A E04
Triptorelin mg Public 0.0017 0.0014Private <0.0001 <0.0001Total 0.0018 0.0014
L02B A Anti-estrogensL02B A01
Tamoxifen mg Public 0.1241 0.1338Private 0.0917 0.0141Total 0.2158 0.1480
L02B B Anti-androgens L02B B01
Flutamide g Public 0.0007 0.0010Private <0.0001 <0.0001Total 0.0007 0.0010
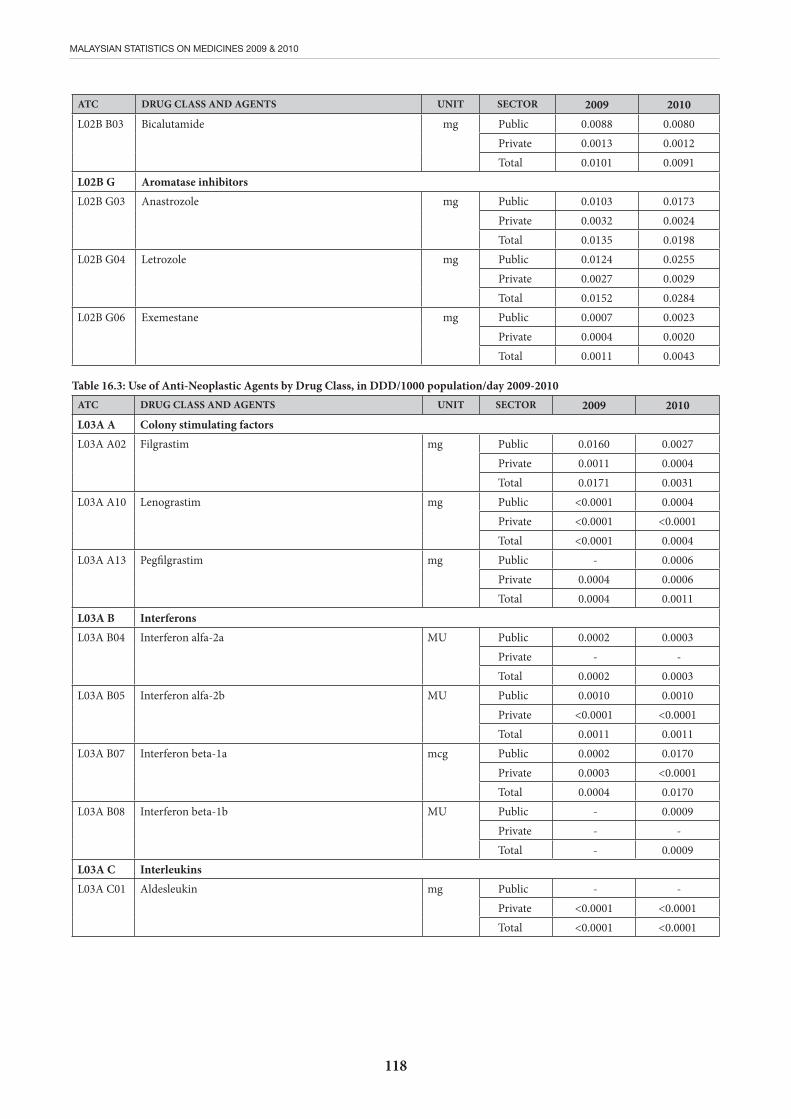
118
MALAYSIAN STATISTICS ON MEDICINES 2009 & 2010
ATC DRUG CLASS AND AGENTS UNIT SECTOR 2009 2010L02B B03
Bicalutamide mg Public 0.0088 0.0080Private 0.0013 0.0012Total 0.0101 0.0091
L02B G Aromatase inhibitorsL02B G03
Anastrozole mg Public 0.0103 0.0173Private 0.0032 0.0024Total 0.0135 0.0198
L02B G04
Letrozole mg Public 0.0124 0.0255Private 0.0027 0.0029Total 0.0152 0.0284
L02B G06
Exemestane mg Public 0.0007 0.0023Private 0.0004 0.0020Total 0.0011 0.0043
Table 16.3: Use of Anti-Neoplastic Agents by Drug Class, in DDD/1000 population/day 2009-2010ATC DRUG CLASS AND AGENTS UNIT SECTOR 2009 2010L03A A Colony stimulating factors L03A A02
Filgrastim mg Public 0.0160 0.0027Private 0.0011 0.0004Total 0.0171 0.0031
L03A A10 Lenograstim mg Public <0.0001 0.0004Private <0.0001 <0.0001Total <0.0001 0.0004
L03A A13 Pegfilgrastim mg Public - 0.0006Private 0.0004 0.0006Total 0.0004 0.0011
L03A B Interferons L03A B04 Interferon alfa-2a MU Public 0.0002 0.0003
Private - -Total 0.0002 0.0003
L03A B05 Interferon alfa-2b MU Public 0.0010 0.0010Private <0.0001 <0.0001Total 0.0011 0.0011
L03A B07 Interferon beta-1a mcg Public 0.0002 0.0170Private 0.0003 <0.0001Total 0.0004 0.0170
L03A B08 Interferon beta-1b MU Public - 0.0009Private - -Total - 0.0009
L03A C InterleukinsL03A C01
Aldesleukin mg Public - -Private <0.0001 <0.0001Total <0.0001 <0.0001
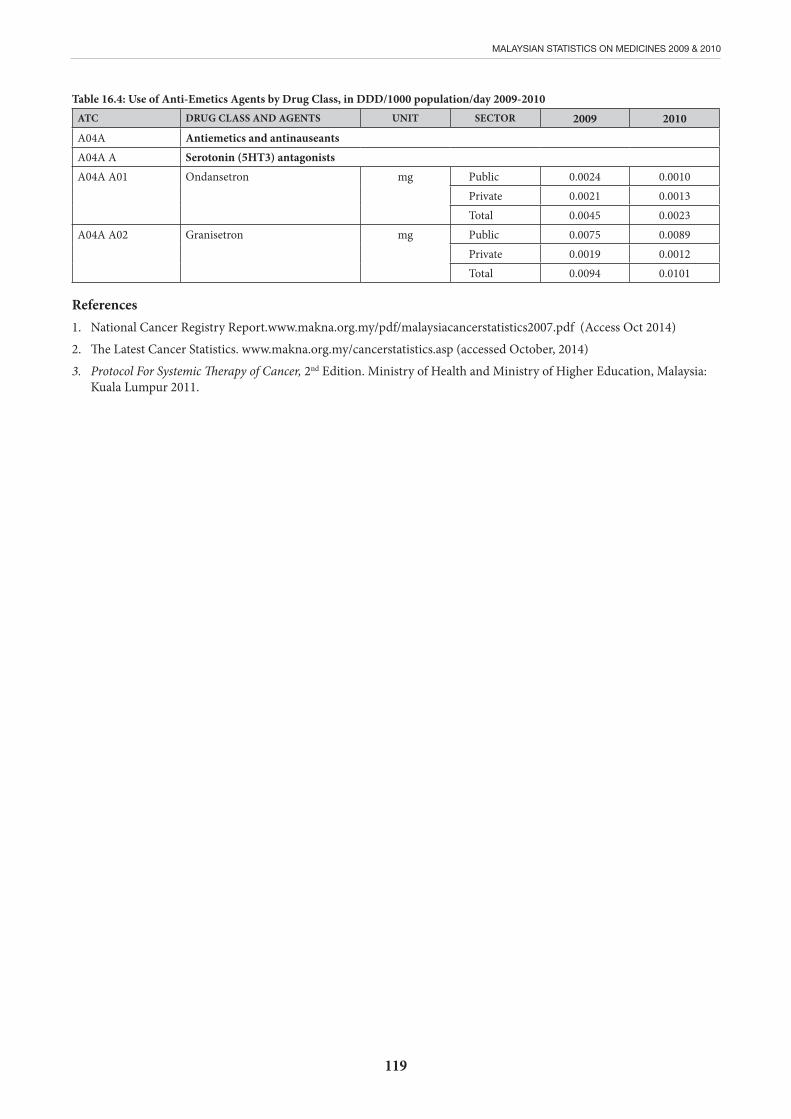
119
MALAYSIAN STATISTICS ON MEDICINES 2009 & 2010
Table 16.4: Use of Anti-Emetics Agents by Drug Class, in DDD/1000 population/day 2009-2010ATC DRUG CLASS AND AGENTS UNIT SECTOR 2009 2010A04A Antiemetics and antinauseantsA04A A Serotonin (5HT3) antagonistsA04A A01 Ondansetron mg Public 0.0024 0.0010
Private 0.0021 0.0013Total 0.0045 0.0023
A04A A02
Granisetron mg Public 0.0075 0.0089Private 0.0019 0.0012Total 0.0094 0.0101
References 1. National Cancer Registry Report.www.makna.org.my/pdf/malaysiacancerstatistics2007.pdf (Access Oct 2014)
2. The Latest Cancer Statistics. www.makna.org.my/cancerstatistics.asp (accessed October, 2014)
3. Protocol For Systemic Therapy of Cancer, 2nd Edition. Ministry of Health and Ministry of Higher Education, Malaysia: Kuala Lumpur 2011.

120
MALAYSIAN STATISTICS ON MEDICINES 2009 & 2010
CHAPTER 17: USE OF SYSTEMIC CORTICOSTEROIDS AND IMMUNOSUPPRESIVES AGENTS
Wong H.S.1, Rosnawati Y.2, Ong S.G.2,
1. Selayang Hospital, Selangor, 2. Hospital Kuala Lumpur, Kuala Lumpur.
The list of drugs in this chapter includes mineralocorticoids, glucocorticoids and immunosuppressants such as selective immunosupressants, tumor necrosis factor-α inhibitors, interleukin inhibitors, calcineurin inhibitors, antimetabolites and other immunosuppressants.
Systemic Corticosteroids
Systemic corticosteroids usage in Malaysia for 2009 and 2010 were 11.3204 DDD/1000 population/day and 7.9479 DDD/1000 population/day respectively and were more than 50% higher than those reported in 20081. The difference in the usage of corticosteroids in 2009 and 2010 was mainly due to a reduction in the use of prednisolone in the private sector from 3.8210 DDD/1000 population/day to 0.9371 DDD/1000 population/day. Despite the marked increased in the usage of systemic corticosteroid over the last 2 years, it is still much lower than that reported in Australia2, Finland3 and Norway4 where the DDD/1000 population/day for systemic corticosteroids ranged from 14.90 to 18.74.
Glucocorticoids remained the most commonly used corticosteroids in 2009 and 2010 and accounted for 99.7% of all systemic corticosteroids used in this country. Prednisolone was the most popular glucocorticoids and contributed to 44.2% of the total glucocorticoids used in 2009 (4.9875 DDD/1000 population/day) but reduced to 26.9% in 2010. This is primarily due to a 76.7% reduction in the use of prednisolone in the private sector. Dexamethasone remained the second most commonly used glucocorticoids and in 2009 and 2010, it accounted for about a third.
Betamethasone was essentially used in the private sector and has increased by 25-fold over the last 4 years1. In 2010, it accounted for 25.8% of all glucocorticoids used in this country. Methylprednisolone and triamcinolone usage remained very low (1%) and registered a further 50% reduction in 2010.
The use of mineralocorticoids continued to decrease over the last 3 years1 with a reduction of 29.0% in 2009 and 49.7% in 2010 when compared to 2008.
Immunosuppressive Agents
The use of immunosuppressive agents in Malaysia has remained relative low and unchanged over the last few years1 with a DDD/1000 population/day of only 0.455 in 2010. This is 5 – 20 times lower than the usage reported in Australia2, Finland2 and Norway4 which have a DDD/1000 population/day of 2.03 – 7.65 for immunosuppressive agents. This vast difference in the usage of immunosuppressive agents is partly contributed by the very low usage of transplant immunosuppressive agents (especially cyclosporine A and tacrolimus) as the number of solid organ transplant recipients were less than 1900 in the Malaysia during that period5-7.
For calcineurin inhibitors, there was a decrease in the usage of ciclosporin in 2010 compared to 2009 with a corresponding increase in tacrolimus usage; reflecting the preference for tacrolimus over ciclosporine as the primary immunosuppressive agent in solid organ transplantation. The usage of mycophenolic acid continued to increase from 20081 and the usage in 2010 was 6.8 times higher compared to 2009. As the number of transplant recipients remained relatively unchanged during this period, this increase is solely due to the use of mycophenolic acid for non transplant indication especially SLE.
There was a marked increase (11-fold) in the usage of leflunomide in 2010 compared to 2009 and this is primarily due to its increasing use in rheumatoid arthritis. More cases of rheumatoid arthritis have been diagnosed over the past 10 years due to a growing awareness about this disease and the importance of using disease modifying antirheumatic drugs (DMARDs) as first-line therapy. One of the DMARDs includes leflunomide.
Azathioprine, thalidomide and methotrexate were mainly used in the public sector and while the use of azathioprine remained unchanged, thalidomide and methotrexate usage have demonstrated a gradual reduction over the last 4 years1.
Due to the high cost, the overall usage of tumor necrosis factor-α inhibitors, interleukin inhibitors and rabbit anti-human thymocyte immunoglobulin remained low and relatively unchanged over the last 4 years1.
Table 17.1: Use of Systemic Corticosteroids and Immunosuppressive Agents by Drug Class, in DDD/1000 population/day 2009-2010
ATC DRUG CLASS 2009 2010
H02A A Mineralocorticoids 0.0240 0.0170
H02A B Glucocorticoids 11.2964 7.9309
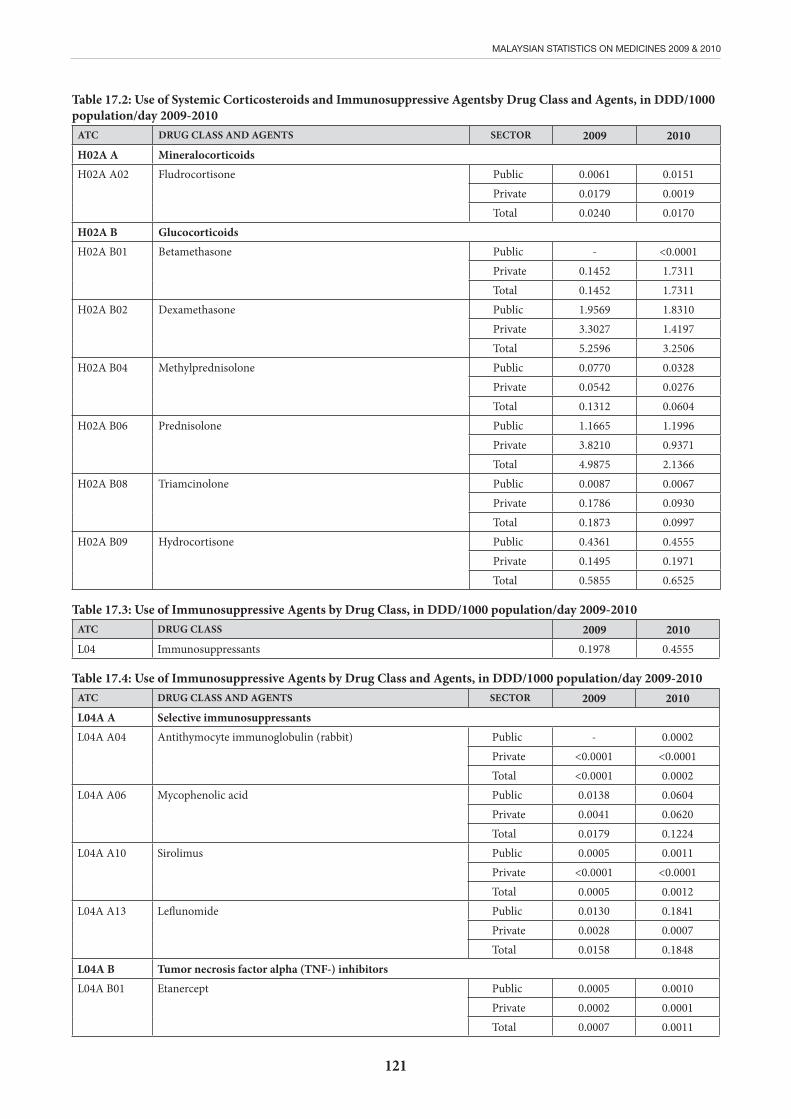
121
MALAYSIAN STATISTICS ON MEDICINES 2009 & 2010
Table 17.2: Use of Systemic Corticosteroids and Immunosuppressive Agentsby Drug Class and Agents, in DDD/1000 population/day 2009-2010
ATC DRUG CLASS AND AGENTS SECTOR 2009 2010H02A A MineralocorticoidsH02A A02
Fludrocortisone Public 0.0061 0.0151Private 0.0179 0.0019Total 0.0240 0.0170
H02A B GlucocorticoidsH02A B01
Betamethasone Public - <0.0001Private 0.1452 1.7311Total 0.1452 1.7311
H02A B02
Dexamethasone Public 1.9569 1.8310Private 3.3027 1.4197Total 5.2596 3.2506
H02A B04
Methylprednisolone
Public 0.0770 0.0328Private 0.0542 0.0276Total 0.1312 0.0604
H02A B06
Prednisolone Public 1.1665 1.1996Private 3.8210 0.9371Total 4.9875 2.1366
H02A B08
Triamcinolone Public 0.0087 0.0067Private 0.1786 0.0930Total 0.1873 0.0997
H02A B09
Hydrocortisone Public 0.4361 0.4555Private 0.1495 0.1971Total 0.5855 0.6525
Table 17.3: Use of Immunosuppressive Agents by Drug Class, in DDD/1000 population/day 2009-2010ATC DRUG CLASS 2009 2010L04 Immunosuppressants 0.1978 0.4555
Table 17.4: Use of Immunosuppressive Agents by Drug Class and Agents, in DDD/1000 population/day 2009-2010ATC DRUG CLASS AND AGENTS SECTOR 2009 2010L04A A Selective immunosuppressantsL04A A04 Antithymocyte immunoglobulin (rabbit) Public - 0.0002
Private <0.0001 <0.0001Total <0.0001 0.0002
L04A A06 Mycophenolic acid Public 0.0138 0.0604Private 0.0041 0.0620Total 0.0179 0.1224
L04A A10 Sirolimus Public 0.0005 0.0011Private <0.0001 <0.0001Total 0.0005 0.0012
L04A A13 Leflunomide Public 0.0130 0.1841Private 0.0028 0.0007Total 0.0158 0.1848
L04A B Tumor necrosis factor alpha (TNF-) inhibitorsL04A B01 Etanercept Public 0.0005 0.0010
Private 0.0002 0.0001Total 0.0007 0.0011
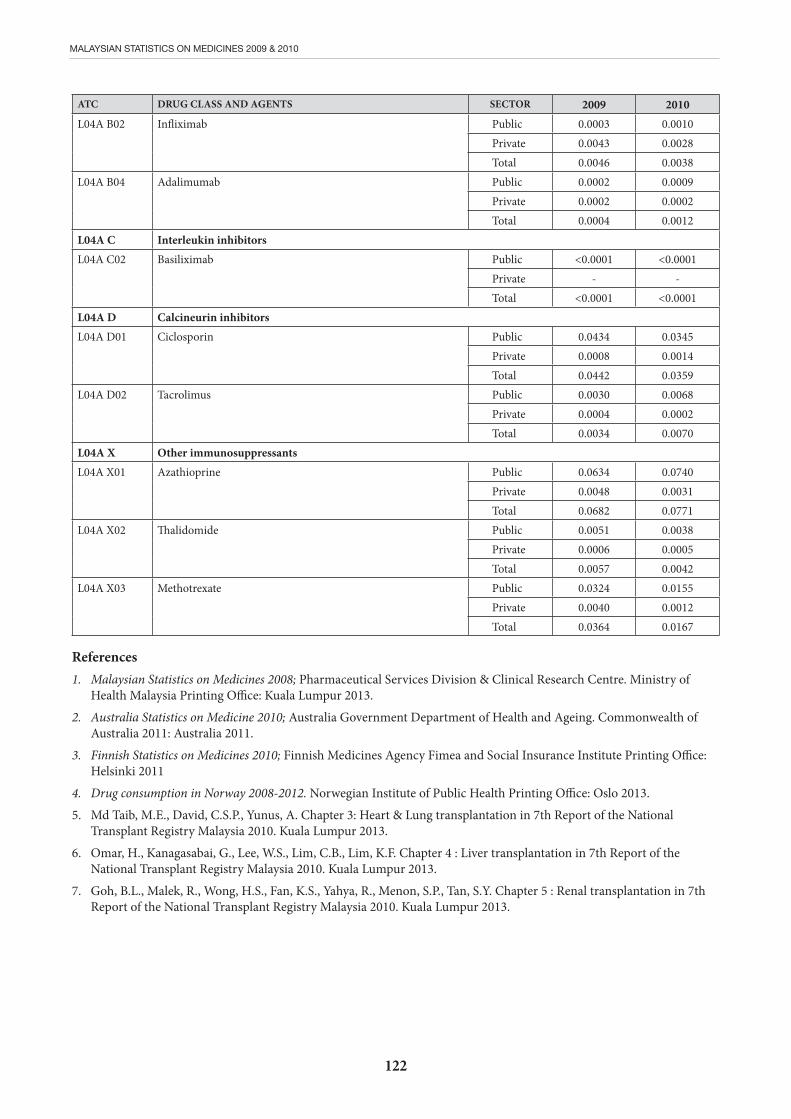
122
MALAYSIAN STATISTICS ON MEDICINES 2009 & 2010
ATC DRUG CLASS AND AGENTS SECTOR 2009 2010L04A B02 Infliximab Public 0.0003 0.0010
Private 0.0043 0.0028Total 0.0046 0.0038
L04A B04 Adalimumab Public 0.0002 0.0009Private 0.0002 0.0002Total 0.0004 0.0012
L04A C Interleukin inhibitorsL04A C02 Basiliximab Public <0.0001 <0.0001
Private - -Total <0.0001 <0.0001
L04A D Calcineurin inhibitorsL04A D01 Ciclosporin Public 0.0434 0.0345
Private 0.0008 0.0014Total 0.0442 0.0359
L04A D02 Tacrolimus Public 0.0030 0.0068Private 0.0004 0.0002Total 0.0034 0.0070
L04A X Other immunosuppressantsL04A X01 Azathioprine Public 0.0634 0.0740
Private 0.0048 0.0031Total 0.0682 0.0771
L04A X02 Thalidomide Public 0.0051 0.0038Private 0.0006 0.0005Total 0.0057 0.0042
L04A X03 Methotrexate Public 0.0324 0.0155Private 0.0040 0.0012Total 0.0364 0.0167
References1. Malaysian Statistics on Medicines 2008; Pharmaceutical Services Division & Clinical Research Centre. Ministry of
Health Malaysia Printing Office: Kuala Lumpur 2013.
2. Australia Statistics on Medicine 2010; Australia Government Department of Health and Ageing. Commonwealth of Australia 2011: Australia 2011.
3. Finnish Statistics on Medicines 2010; Finnish Medicines Agency Fimea and Social Insurance Institute Printing Office: Helsinki 2011
4. Drug consumption in Norway 2008-2012. Norwegian Institute of Public Health Printing Office: Oslo 2013.
5. Md Taib, M.E., David, C.S.P., Yunus, A. Chapter 3: Heart & Lung transplantation in 7th Report of the National Transplant Registry Malaysia 2010. Kuala Lumpur 2013.
6. Omar, H., Kanagasabai, G., Lee, W.S., Lim, C.B., Lim, K.F. Chapter 4 : Liver transplantation in 7th Report of the National Transplant Registry Malaysia 2010. Kuala Lumpur 2013.
7. Goh, B.L., Malek, R., Wong, H.S., Fan, K.S., Yahya, R., Menon, S.P., Tan, S.Y. Chapter 5 : Renal transplantation in 7th Report of the National Transplant Registry Malaysia 2010. Kuala Lumpur 2013.

123
MALAYSIAN STATISTICS ON MEDICINES 2009 & 2010
CHAPTER 18: USE OF DRUGS FOR RHEUMATOLOGICALS AND BONE DISORDERS
Mohd. Shahrir M.S.1, Hussein H.2
1.UKM Medical Centre, Selangor, 2. Hospital Putrajaya, Putrajaya
Drugs that are used for rheumatological and bone disorders are selective estrogen receptor modulators (SERMS), calcitonin preparations, anti-inflammatory and anti-rheumatic products, muscle-relaxants, antigout preparations and drugs for treatment for bone diseases. Anti- inflammatory and antirheumatic products’ usage ranked as 10th most used drugs by therapeutic group in Malaysia in 2010 (11.7605 DDD/1000 population/day) with estimated 1.18% population utilising them1.
Overall, the use of drugs for rheumatological and bone disorders in 2010 were reduced compared with 2009 with the exception of drugs for treatment of bone diseases1. In 2010, anti-inflammatory and antirheumatic products ranked first (11.7605 DDD/1000 population/day), followed by antigout preparations (1.5554 DDD/1000 population/day), drugs for treatment of bone diseases (0.6718 DDD/1000 population/day) and then muscle relaxant (0.2786 DDD/1000 population/day).However, in Finland2, this pattern was seen in the trend of usage only for the top drug but the second and third were for treatment of bone diseases followed by muscle relaxant. Antigout preparations in Finland ranked fourth2.
For the use of non-steroidal anti-inflammatory drugs (NSAIDs), the top three drugs were acetic acid derivatives and related substances (3.6334 DDD/1000 population/day), followed by oxicams (3.3544 DDD/1000 population/day) and fenamates (2.7669 DDD/1000 population/day). The usage of fenamates (18.4%) and coxib group (75.6%) were reduced but the usage of acetic acid derivatives and
related substances (15.5%) and oxicams (145.6%) were increased in 2010. This trend of reduction in usage of coxib is also seen in Australia3.
The three most used antigout preparations were allopurinol, colchicine and probenecid. There was a reduced usage of allopurinol and colchicine in 2010 (2.8%, 86.4%) but the usage of probenecid increased by 125%.This drastic trend in the reduction of colchicine was seen in the private sector. Benzbromarone was not prescribed at all in 2010.
The three common drugs for treatment for bone diseases were alendronic acid and cholecalciferol (0.3966 DDD/1000 population/day), Alendronic acid (0.2227 DDD/1000 population/day) and ibandronic acid (0.0279 DDD/1000 population/day). There was an increasing trend of usage of alendronic acid and cholecalciferol (77.2%) and usage of alendronic acid (36.8%) but usage ibandronate were reduced by 39.1%. The usage of alendronic acid in Finland was reduced between 2009 till 20102.
The top three muscle relaxant drugs used in 2010 were eperisone, baclofen and orphenadrine (citrate).The usage of eperisone (37.7%) and orphenadrine (citrate) (78.4%) were reduced in 2010 compared to 2009.
As for calcium homeostasis agent, both teriparatide and paricalcitol had a remarkable increase in usage (45.5% and 31.8% respectively). The usage of calcitonin (salmon synthetic) was reduced by 26.7%.
The usage of raloxifene was reduced in 2010 by 7.51%.
Table 18.1: Use of Drugs for Rheumatological and Bone Disorders, in DDD/1000 population/day 2009-2010ATC DRUG CLASS 2009 2010G03X C Selective estrogen receptor modulators 0.0559 0.0517H05B A Calcitonin preparations 0.0045 0.0033M01 Antiinflammatory and antirheumatic products 13.0335 11.7605M03 Muscle relaxants 0.9066 0.2786M04 Antigout preparations 2.3036 1.5554M05 Drugs for treatment of bone diseases 0.4877 0.6718
Table 18.2.1: Use of Non-Steroidal Anti-inflammatory drugs by Drug Class, in DDD/1000 population/day 2009-2010ATC DRUG CLASS 2009 2010M01A B Acetic acid derivatives and related substances 3.1474 3.6344M01A C Oxicams 1.3658 3.3544M01A E Propionic acid derivatives 0.9619 1.0677M01A G Fenamates 3.3898 2.7669M01A H Coxibs 4.1660 1.0151
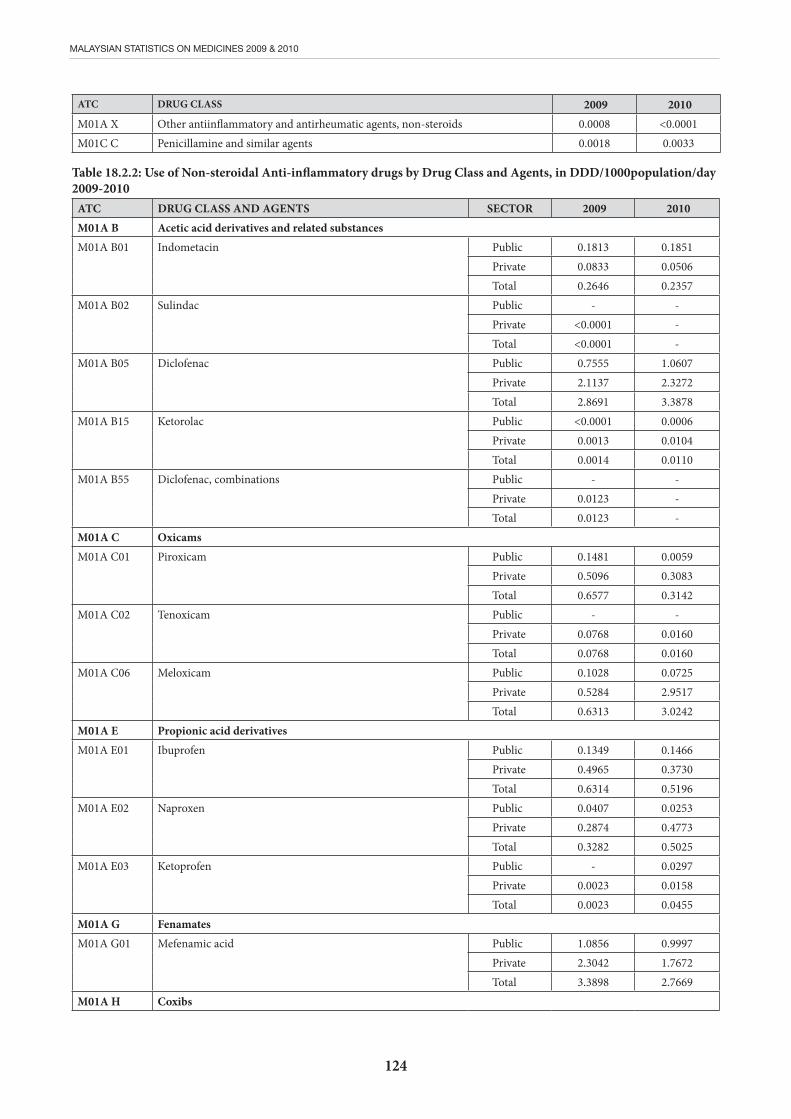
124
MALAYSIAN STATISTICS ON MEDICINES 2009 & 2010
ATC DRUG CLASS 2009 2010M01A X Other antiinflammatory and antirheumatic agents, non-steroids 0.0008 <0.0001M01C C Penicillamine and similar agents 0.0018 0.0033
Table 18.2.2: Use of Non-steroidal Anti-inflammatory drugs by Drug Class and Agents, in DDD/1000population/day 2009-2010
ATC DRUG CLASS AND AGENTS SECTOR 2009 2010M01A B Acetic acid derivatives and related substancesM01A B01
Indometacin Public 0.1813 0.1851Private 0.0833 0.0506Total 0.2646 0.2357
M01A B02
Sulindac
Public - -Private <0.0001 -Total <0.0001 -
M01A B05
Diclofenac Public 0.7555 1.0607Private 2.1137 2.3272Total 2.8691 3.3878
M01A B15
Ketorolac Public <0.0001 0.0006Private 0.0013 0.0104Total 0.0014 0.0110
M01A B55
Diclofenac, combinations
Public - -Private 0.0123 -Total 0.0123 -
M01A C OxicamsM01A C01
Piroxicam
Public 0.1481 0.0059Private 0.5096 0.3083Total 0.6577 0.3142
M01A C02
Tenoxicam
Public - -Private 0.0768 0.0160Total 0.0768 0.0160
M01A C06
Meloxicam
Public 0.1028 0.0725Private 0.5284 2.9517Total 0.6313 3.0242
M01A E Propionic acid derivativesM01A E01
Ibuprofen
Public 0.1349 0.1466Private 0.4965 0.3730Total 0.6314 0.5196
M01A E02
Naproxen
Public 0.0407 0.0253Private 0.2874 0.4773Total 0.3282 0.5025
M01A E03
Ketoprofen
Public - 0.0297Private 0.0023 0.0158Total 0.0023 0.0455
M01A G FenamatesM01A G01
Mefenamic acid
Public 1.0856 0.9997Private 2.3042 1.7672Total 3.3898 2.7669
M01A H Coxibs
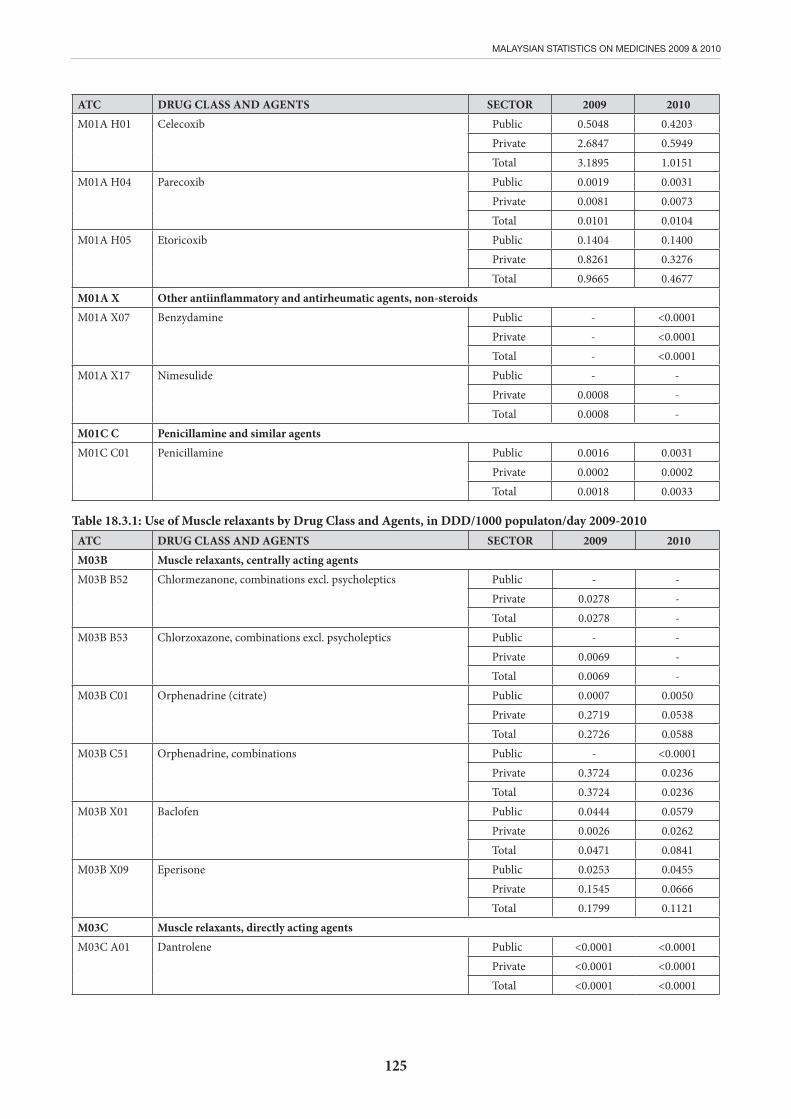
125
MALAYSIAN STATISTICS ON MEDICINES 2009 & 2010
ATC DRUG CLASS AND AGENTS SECTOR 2009 2010M01A H01
Celecoxib
Public 0.5048 0.4203Private 2.6847 0.5949Total 3.1895 1.0151
M01A H04
Parecoxib
Public 0.0019 0.0031Private 0.0081 0.0073Total 0.0101 0.0104
M01A H05
Etoricoxib
Public 0.1404 0.1400Private 0.8261 0.3276Total 0.9665 0.4677
M01A X Other antiinflammatory and antirheumatic agents, non-steroids M01A X07
Benzydamine
Public - <0.0001Private - <0.0001Total - <0.0001
M01A X17
Nimesulide
Public - -Private 0.0008 -Total 0.0008 -
M01C C Penicillamine and similar agents M01C C01
Penicillamine
Public 0.0016 0.0031Private 0.0002 0.0002Total 0.0018 0.0033
Table 18.3.1: Use of Muscle relaxants by Drug Class and Agents, in DDD/1000 populaton/day 2009-2010ATC DRUG CLASS AND AGENTS SECTOR 2009 2010M03B Muscle relaxants, centrally acting agentsM03B B52
Chlormezanone, combinations excl. psycholeptics Public - -Private 0.0278 -Total 0.0278 -
M03B B53
Chlorzoxazone, combinations excl. psycholeptics Public - -Private 0.0069 -Total 0.0069 -
M03B C01
Orphenadrine (citrate)
Public 0.0007 0.0050Private 0.2719 0.0538Total 0.2726 0.0588
M03B C51
Orphenadrine, combinations
Public - <0.0001Private 0.3724 0.0236Total 0.3724 0.0236
M03B X01
Baclofen
Public 0.0444 0.0579Private 0.0026 0.0262Total 0.0471 0.0841
M03B X09
Eperisone
Public 0.0253 0.0455Private 0.1545 0.0666Total 0.1799 0.1121
M03C Muscle relaxants, directly acting agents M03C A01
Dantrolene
Public <0.0001 <0.0001Private <0.0001 <0.0001Total <0.0001 <0.0001

126
MALAYSIAN STATISTICS ON MEDICINES 2009 & 2010
Table 18.4.1: Use of Anti-Gout preparations by Drug Class, in DDD/1000 population/day 2009-2010ATC DRUG CLASS AND AGENTS SECTOR 2009 2010M04A Antigout preparationsM04A A01
Allopurinol
Public 0.8755 1.0121Private 0.6052 0.4267Total 1.4807 1.4388
M04A B01
Probenecid
Public 0.0011 0.0018Private 0.0013 0.0036Total 0.0024 0.0054
M04A B03
Benzbromarone
Public - -Private - <0.0001Total - <0.0001
M04A C01
Colchicine
Public 0.0343 0.0497Private 0.7862 0.0615Total 0.8205 0.1112
Table 18.5.1: Use of Bone diseases therapy by Drug Class, in DDD/1000 population/day 2009-2010ATC DRUG CLASS AND AGENTS SECTOR 2009 2010M05 Drugs for treatment of bone diseases M05B A02
Clodronic acid
Public 0.0019 0.0013Private 0.0006 0.0003Total 0.0026 0.0015
M05B A03
Pamidronic acid
Public 0.0001 0.0009Private 0.0002 <0.0001Total 0.0003 0.0009
M05B A04
Alendronic acid
Public 0.0660 0.2143Private 0.0968 0.0084Total 0.1628 0.2227
M05B A06
Ibandronic acid
Public 0.0042 0.0184Private 0.0416 0.0095Total 0.0458 0.0279
M05B A07
Risedronic acid
Public 0.0011 0.0039Private 0.0214 0.0010Total 0.0225 0.0049
M05B A08
Zoledronic acid Public 0.0002 0.0003Private 0.0002 0.0007Total 0.0004 0.0010
M05B B03
Alendronic acid and colecalciferol Public 0.0458 0.2882Private 0.1779 0.1084Total 0.2237 0.3966
M05B X03
Strontium ranelate
Public <0.0001 0.0010Private 0.0295 0.0153Total 0.0295 0.0163
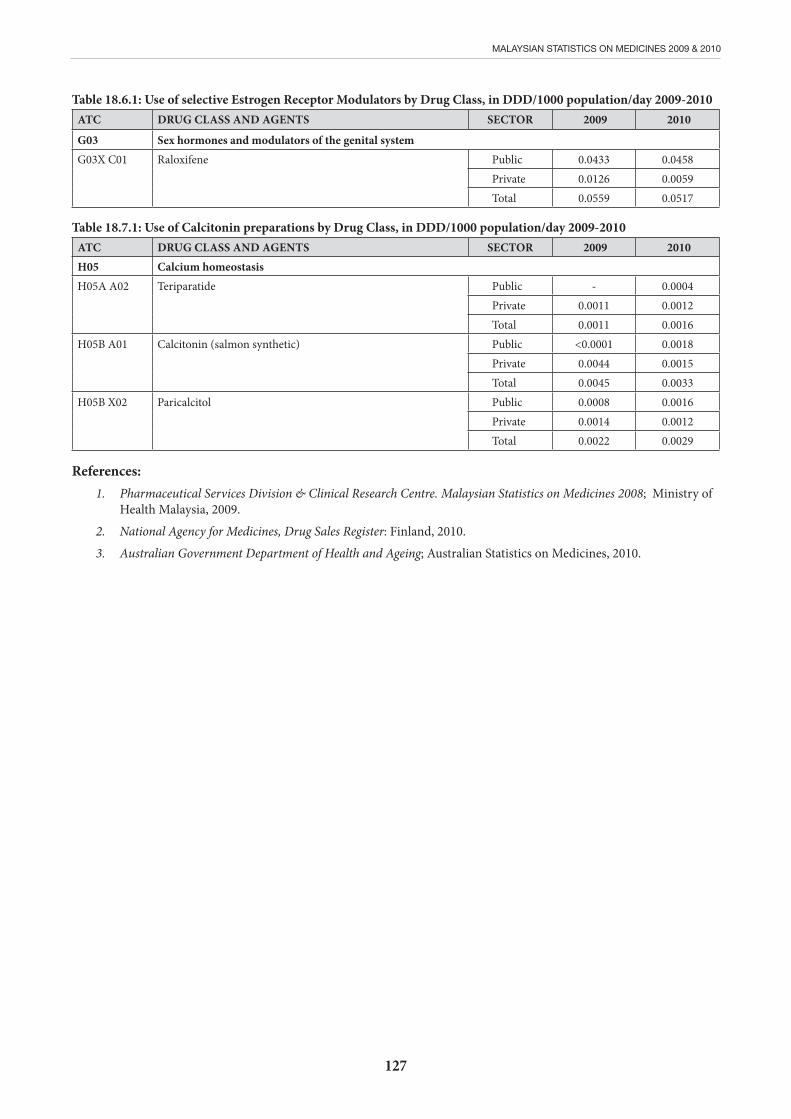
127
MALAYSIAN STATISTICS ON MEDICINES 2009 & 2010
Table 18.6.1: Use of selective Estrogen Receptor Modulators by Drug Class, in DDD/1000 population/day 2009-2010ATC DRUG CLASS AND AGENTS SECTOR 2009 2010
G03 Sex hormones and modulators of the genital systemG03X C01
Raloxifene
Public 0.0433 0.0458Private 0.0126 0.0059Total 0.0559 0.0517
Table 18.7.1: Use of Calcitonin preparations by Drug Class, in DDD/1000 population/day 2009-2010ATC DRUG CLASS AND AGENTS SECTOR 2009 2010H05 Calcium homeostasisH05A A02
Teriparatide
Public - 0.0004Private 0.0011 0.0012Total 0.0011 0.0016
H05B A01 Calcitonin (salmon synthetic) Public <0.0001 0.0018Private 0.0044 0.0015Total 0.0045 0.0033
H05B X02
Paricalcitol
Public 0.0008 0.0016Private 0.0014 0.0012Total 0.0022 0.0029
References:1. Pharmaceutical Services Division & Clinical Research Centre. Malaysian Statistics on Medicines 2008; Ministry of
Health Malaysia, 2009.
2. National Agency for Medicines, Drug Sales Register: Finland, 2010.
3. Australian Government Department of Health and Ageing; Australian Statistics on Medicines, 2010.
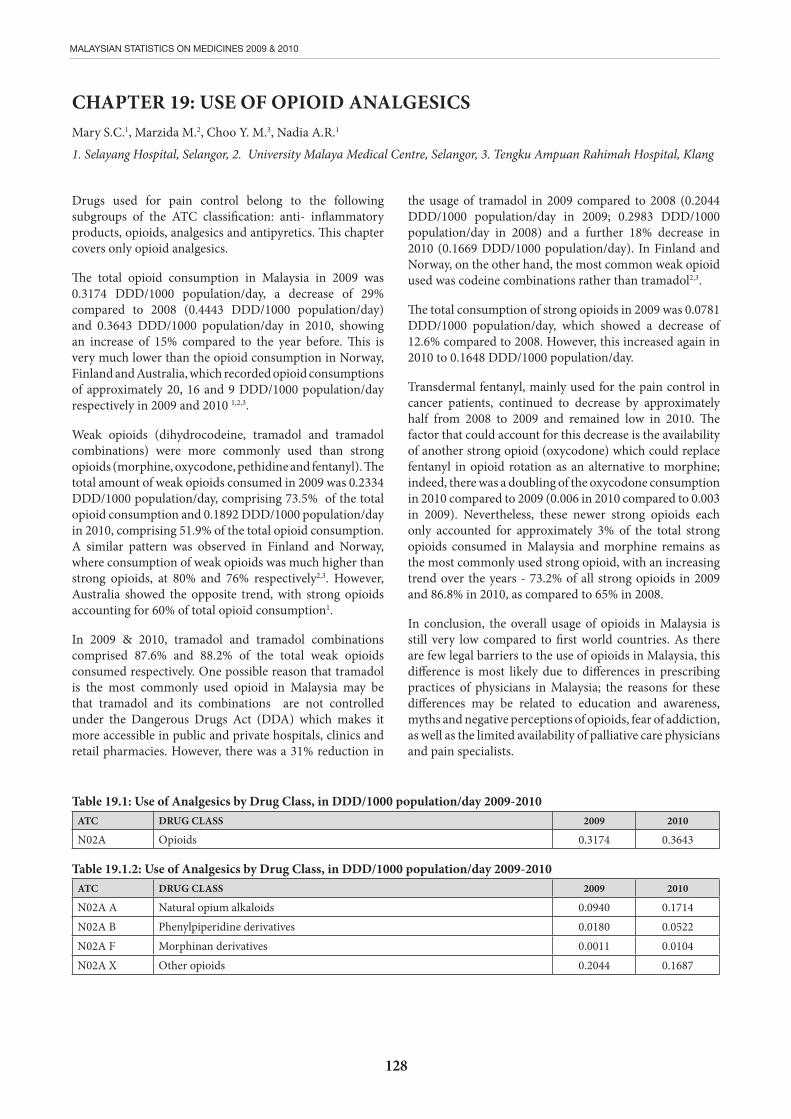
128
MALAYSIAN STATISTICS ON MEDICINES 2009 & 2010
CHAPTER 19: USE OF OPIOID ANALGESICS Mary S.C.1, Marzida M.2, Choo Y. M.3, Nadia A.R.1
1. Selayang Hospital, Selangor, 2. University Malaya Medical Centre, Selangor, 3. Tengku Ampuan Rahimah Hospital, Klang
the usage of tramadol in 2009 compared to 2008 (0.2044 DDD/1000 population/day in 2009; 0.2983 DDD/1000 population/day in 2008) and a further 18% decrease in 2010 (0.1669 DDD/1000 population/day). In Finland and Norway, on the other hand, the most common weak opioid used was codeine combinations rather than tramadol2,3.
The total consumption of strong opioids in 2009 was 0.0781 DDD/1000 population/day, which showed a decrease of 12.6% compared to 2008. However, this increased again in 2010 to 0.1648 DDD/1000 population/day.
Transdermal fentanyl, mainly used for the pain control in cancer patients, continued to decrease by approximately half from 2008 to 2009 and remained low in 2010. The factor that could account for this decrease is the availability of another strong opioid (oxycodone) which could replace fentanyl in opioid rotation as an alternative to morphine; indeed, there was a doubling of the oxycodone consumption in 2010 compared to 2009 (0.006 in 2010 compared to 0.003 in 2009). Nevertheless, these newer strong opioids each only accounted for approximately 3% of the total strong opioids consumed in Malaysia and morphine remains as the most commonly used strong opioid, with an increasing trend over the years - 73.2% of all strong opioids in 2009 and 86.8% in 2010, as compared to 65% in 2008.
In conclusion, the overall usage of opioids in Malaysia is still very low compared to first world countries. As there are few legal barriers to the use of opioids in Malaysia, this difference is most likely due to differences in prescribing practices of physicians in Malaysia; the reasons for these differences may be related to education and awareness, myths and negative perceptions of opioids, fear of addiction, as well as the limited availability of palliative care physicians and pain specialists.
Drugs used for pain control belong to the following subgroups of the ATC classification: anti- inflammatory products, opioids, analgesics and antipyretics. This chapter covers only opioid analgesics.
The total opioid consumption in Malaysia in 2009 was 0.3174 DDD/1000 population/day, a decrease of 29% compared to 2008 (0.4443 DDD/1000 population/day) and 0.3643 DDD/1000 population/day in 2010, showing an increase of 15% compared to the year before. This is very much lower than the opioid consumption in Norway, Finland and Australia, which recorded opioid consumptions of approximately 20, 16 and 9 DDD/1000 population/day respectively in 2009 and 2010 1,2,3.
Weak opioids (dihydrocodeine, tramadol and tramadol combinations) were more commonly used than strong opioids (morphine, oxycodone, pethidine and fentanyl). The total amount of weak opioids consumed in 2009 was 0.2334 DDD/1000 population/day, comprising 73.5% of the total opioid consumption and 0.1892 DDD/1000 population/day in 2010, comprising 51.9% of the total opioid consumption. A similar pattern was observed in Finland and Norway, where consumption of weak opioids was much higher than strong opioids, at 80% and 76% respectively2,3. However, Australia showed the opposite trend, with strong opioids accounting for 60% of total opioid consumption1.
In 2009 & 2010, tramadol and tramadol combinations comprised 87.6% and 88.2% of the total weak opioids consumed respectively. One possible reason that tramadol is the most commonly used opioid in Malaysia may be that tramadol and its combinations are not controlled under the Dangerous Drugs Act (DDA) which makes it more accessible in public and private hospitals, clinics and retail pharmacies. However, there was a 31% reduction in
Table 19.1: Use of Analgesics by Drug Class, in DDD/1000 population/day 2009-2010ATC DRUG CLASS 2009 2010
N02A Opioids 0.3174 0.3643
Table 19.1.2: Use of Analgesics by Drug Class, in DDD/1000 population/day 2009-2010ATC DRUG CLASS 2009 2010
N02A A Natural opium alkaloids 0.0940 0.1714N02A B Phenylpiperidine derivatives 0.0180 0.0522N02A F Morphinan derivatives 0.0011 0.0104N02A X Other opioids 0.2044 0.1687
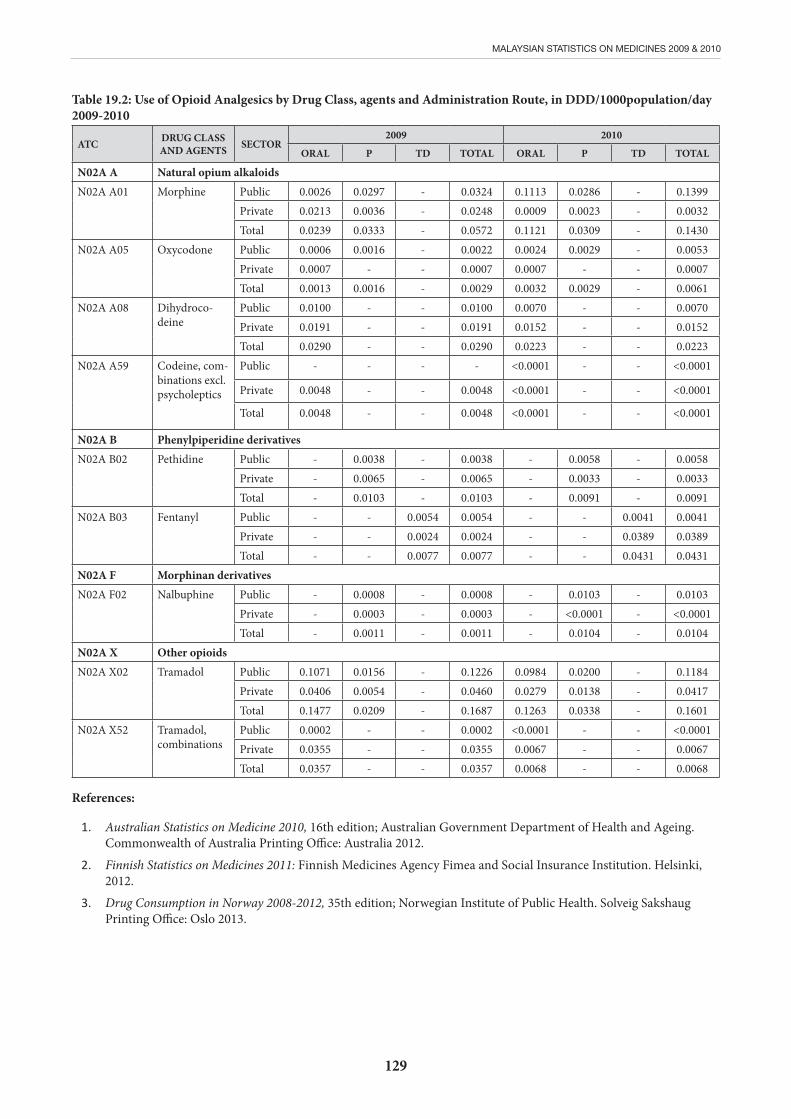
129
MALAYSIAN STATISTICS ON MEDICINES 2009 & 2010
Table 19.2: Use of Opioid Analgesics by Drug Class, agents and Administration Route, in DDD/1000population/day 2009-2010
ATC DRUG CLASS AND AGENTS SECTOR
2009 2010
ORAL P TD TOTAL ORAL P TD TOTAL
N02A A Natural opium alkaloidsN02A A01 Morphine Public 0.0026 0.0297 - 0.0324 0.1113 0.0286 - 0.1399
Private 0.0213 0.0036 - 0.0248 0.0009 0.0023 - 0.0032Total 0.0239 0.0333 - 0.0572 0.1121 0.0309 - 0.1430
N02A A05 Oxycodone Public 0.0006 0.0016 - 0.0022 0.0024 0.0029 - 0.0053Private 0.0007 - - 0.0007 0.0007 - - 0.0007Total 0.0013 0.0016 - 0.0029 0.0032 0.0029 - 0.0061
N02A A08 Dihydroco-deine
Public 0.0100 - - 0.0100 0.0070 - - 0.0070Private 0.0191 - - 0.0191 0.0152 - - 0.0152Total 0.0290 - - 0.0290 0.0223 - - 0.0223
N02A A59 Codeine, com-binations excl. psycholeptics
Public - - - - <0.0001 - - <0.0001
Private 0.0048 - - 0.0048 <0.0001 - - <0.0001
Total 0.0048 - - 0.0048 <0.0001 - - <0.0001
N02A B Phenylpiperidine derivativesN02A B02 Pethidine Public - 0.0038 - 0.0038 - 0.0058 - 0.0058
Private - 0.0065 - 0.0065 - 0.0033 - 0.0033Total - 0.0103 - 0.0103 - 0.0091 - 0.0091
N02A B03 Fentanyl Public - - 0.0054 0.0054 - - 0.0041 0.0041Private - - 0.0024 0.0024 - - 0.0389 0.0389Total - - 0.0077 0.0077 - - 0.0431 0.0431
N02A F Morphinan derivativesN02A F02 Nalbuphine Public - 0.0008 - 0.0008 - 0.0103 - 0.0103
Private - 0.0003 - 0.0003 - <0.0001 - <0.0001Total - 0.0011 - 0.0011 - 0.0104 - 0.0104
N02A X Other opioidsN02A X02 Tramadol Public 0.1071 0.0156 - 0.1226 0.0984 0.0200 - 0.1184
Private 0.0406 0.0054 - 0.0460 0.0279 0.0138 - 0.0417Total 0.1477 0.0209 - 0.1687 0.1263 0.0338 - 0.1601
N02A X52 Tramadol, combinations
Public 0.0002 - - 0.0002 <0.0001 - - <0.0001Private 0.0355 - - 0.0355 0.0067 - - 0.0067Total 0.0357 - - 0.0357 0.0068 - - 0.0068
References:
1. Australian Statistics on Medicine 2010, 16th edition; Australian Government Department of Health and Ageing. Commonwealth of Australia Printing Office: Australia 2012.
2. Finnish Statistics on Medicines 2011: Finnish Medicines Agency Fimea and Social Insurance Institution. Helsinki, 2012.
3. Drug Consumption in Norway 2008-2012, 35th edition; Norwegian Institute of Public Health. Solveig Sakshaug Printing Office: Oslo 2013.
130
MALAYSIAN STATISTICS ON MEDICINES 2009 & 2010
CHAPTER 20: USE OF DRUGS FOR NEUROLOGICAL DISORDERSapiah S.1, Mohd. Sufian A.2, Tan R.Y.L.2, Norsima Nazifah S.3, Nurul Faezah M.Y.3, Raymond A.A.4, Md. Hanip M.R.2
1.Sultanah Aminah Hospital, Johor Bharu, 2. Kuala Lumpur Hospital, Kuala Lumpur, 3. Sultanah Nur Zahirah Hospital, Kuala Terengganu, 4. Universiti Kebangsaan Malaysia Medical Centre
For 2009 and 2010, we analysed four major categories of neurological drugs. These include the antiepileptic drugs (AEDs), drugs for Parkinson’s disease (PD), antimigraine preparations and central nervous system (CNS) drugs for other nervous system disorders (drugs mainly used to treat vertigo and multiple sclerosis). The latter drugs were grouped together as ‘other nervous system drugs’.
In general, there was an increase in the usage of AEDs and antimigraine preparations compared to 20081. By far, AEDs remained the most frequently prescribed group of neurological drugs for both years (1.8339 and 2.5767, respectively). This can be explained by its usage in other conditions including treatment for migraine, neuropathic pain and selected psychiatric conditions2. The second largest group being dispensed was drugs for Parkinson’s disease (PD) (0.785 and 0.8393, respectively). The last two groups, ‘other nervous system drugs and antimigraine preparations reported a slight reduction in its usage between 2009 and 2010.
Antiepileptic drugs
The most commonly prescribed antiepileptic drug (AED) in 2009 and 2010 was valproic acid, which also showed a more than three-fold increase in its use between 2009 and 2010. This was probably due to its wide spectrum of antiepileptic efficacy, absence of enzyme induction and decline in the use of other older AEDs.
Valproic acid is also indicated for the prevention of migraine and treatment of mood disorders.3,4,5 The use of the oldest AEDs, namely phenobarbitone, primidone and ethosuximide remained low and continued to show a downward trend. Ethosuximide is the most narrow-spectrum AED, being only effective for absence seizures.2,6 Medical practitioners, based on the 2010 Malaysian Epilepsy Consensus Guidelines, would choose a broad spectrum AED to treat absence seizures, given the possibility of other seizure types developing subsequently. Primidone use remained low, and was used for movement disorders, notably, essential tremor6. Phenobarbitone use, although low, was substantially higher than the other 2 oldest AEDs; it is used primarily by paediatricians and for the termination of status epilepticus.
The use of the enzyme-inducing AEDs, carbamazepine and phenytoin remained fairly constant and high, despite the fear of severe skin reactions in the former5 and long-term side effects in the latter. Carbamazepine is the first line AED for partial seizures and phenytoin is used mainly for status epilepticus and seizures arising after acute cerebral insults, such as encephalitis and stroke6. The use of the newer
AEDs, including lamotrigine, topiramate, gabapentin, levetiracetam and pregabalin, continued to rise in both the public and private sectors, except for gabapentin and pregabalin, which are used mainly for neuropathic pain.
Drugs for Parkinson’s disease
The five main classes of drugs used for PD in 2009 and 2010 were levodopa (+peripheral dopamine decarboxylase inhibitos), dopamine agonists (ergot and non-ergot), anticholinergics, adamantine derivatives and the enzyme inhibitors (catechol-O-methyltransferase inhibitors and monoamine oxidase inhibitors)7.
For both 2009 and 2010, the most commonly prescribed drug for parkinsonism was trihexyphenidyl (Artane) (0.5494 and 0.4668, respectively). In comparison to 2008, there was a slight drop in its usage. Other than Parkinson’s disease, trihexyphenidyl is also used for the prevention and treatment of drug-induced extrapyramidal syndrome (EPS)7.
Levodopa and decarboxylase inhibitor combination remains the gold standard therapy for PD with usage of 0.1572 and 0.207, respectively7. An increase was also seen in the other combination therapy, levodopa, decarboxylase inhibitor and COMT inhibitor (0.0014 and 0.0061, respectively).
The usage of ropirinole was similar for both years (0.0061 and 0.0063, respectively), but a significant increase in the utilisation of pramipexole was observed from 2009 to 2010 (0.0024 to 0.0544). Among the enzyme inhibitors, selegiline was dispensed more frequently than entacapone (0.0452 and 0.0598 versus 0.009 and 0.0125, respectively).
Antimigraine preparations
The utilisation of antimigraine preparation in Malaysia dropped 35.6% in 2010 compared to 2009. This drop was due to usage of other agents such as flunarizine which was categorised under antivertigo preparations. The utilization of pizotifen as migraine prophylaxis in the public sector in 2010 was 0.0169 as compared to 0.0091 in 2009. However, utilisation of pizotifen in Malaysia was still low compared to Australia in 20108.
For drugs used to abort migraine attack, the utilisation of selective serotonin (5HT) receptor agonist in public and private sectors was low at 0.0075 in 2010. The total utilisation of ergot alkaloids was generally low in public sector because of their in availability but their usage in the private sector was at 0.0913. A different pattern of utilisation was seen in Australia where by selective serotonin (5HT) receptor agonist ranked the highest followed by ergot alkaloids in 20108.
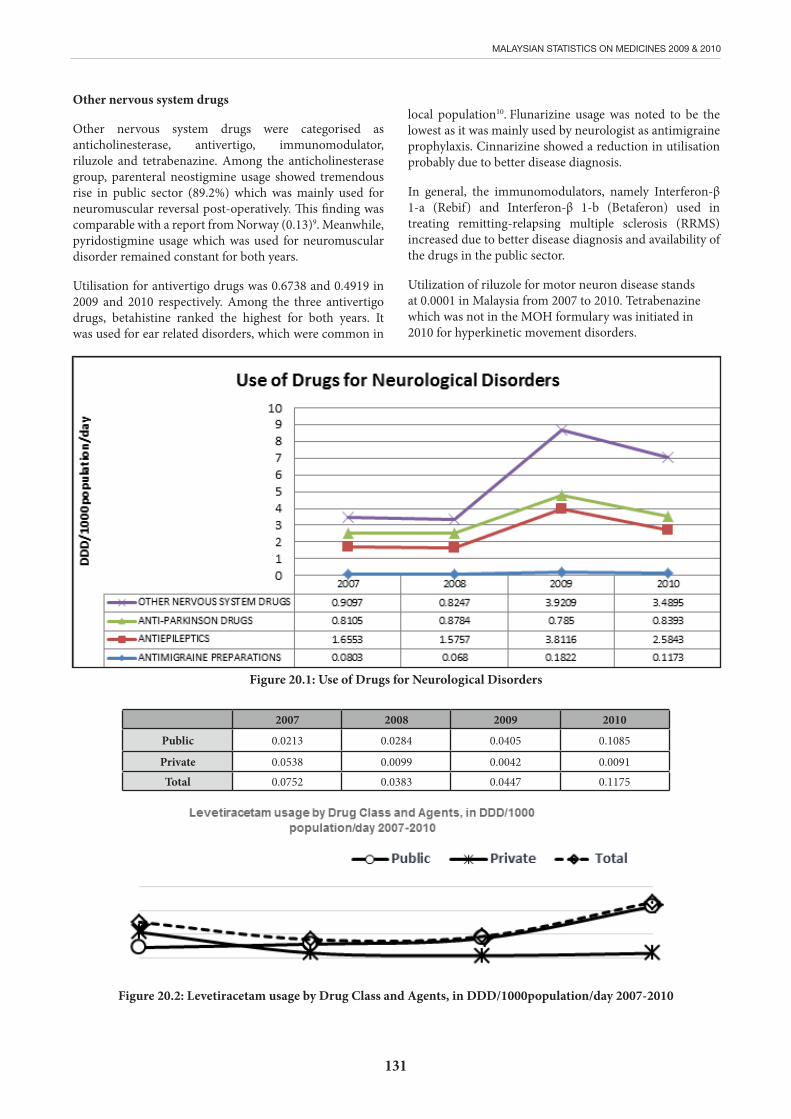
131
MALAYSIAN STATISTICS ON MEDICINES 2009 & 2010
Figure 20.1: Use of Drugs for Neurological Disorders
2007 2008 2009 2010
Public 0.0213 0.0284 0.0405 0.1085
Private 0.0538 0.0099 0.0042 0.0091
Total 0.0752 0.0383 0.0447 0.1175
Figure 20.2: Levetiracetam usage by Drug Class and Agents, in DDD/1000population/day 2007-2010
Other nervous system drugs
Other nervous system drugs were categorised as anticholinesterase, antivertigo, immunomodulator, riluzole and tetrabenazine. Among the anticholinesterase group, parenteral neostigmine usage showed tremendous rise in public sector (89.2%) which was mainly used for neuromuscular reversal post-operatively. This finding was comparable with a report from Norway (0.13)9. Meanwhile, pyridostigmine usage which was used for neuromuscular disorder remained constant for both years.
Utilisation for antivertigo drugs was 0.6738 and 0.4919 in 2009 and 2010 respectively. Among the three antivertigo drugs, betahistine ranked the highest for both years. It was used for ear related disorders, which were common in
local population10. Flunarizine usage was noted to be the lowest as it was mainly used by neurologist as antimigraine prophylaxis. Cinnarizine showed a reduction in utilisation probably due to better disease diagnosis.
In general, the immunomodulators, namely Interferon-β 1-a (Rebif) and Interferon-β 1-b (Betaferon) used in treating remitting-relapsing multiple sclerosis (RRMS) increased due to better disease diagnosis and availability of the drugs in the public sector.
Utilization of riluzole for motor neuron disease stands at 0.0001 in Malaysia from 2007 to 2010. Tetrabenazine which was not in the MOH formulary was initiated in 2010 for hyperkinetic movement disorders.

132
MALAYSIAN STATISTICS ON MEDICINES 2009 & 2010
2007 2008 2009 2010
Public 0.3718 0.3659 0.4869 1.3855
Private 0.0671 0.0417 0.1287 0.0898
Total 0.4389 0.4076 0.6155 1.4754
Figure 20.3: Valproate acid usage by Drug Class and Agents, in DDD/1000 population/day 2007-2010
Table 20.1: Use of Drugs for Neurological Disorders, in DDD/1000population/day 2009-2010ATC DRUG CLASS 2009 2010N02C Antimigraine preparations 0.1822 0.1173N03 Antiepileptics 3.8116 2.5843N04 Anti-parkinson drugs 0.7850 0.8393N06D Anti-dementia drugs 0.0402 0.0936N07 Other nervous system drugs 3.9209 3.4895
Table 20.2: Use of Anti-Epileptics by Drug Class, in DDD/1000population/day 2009-2010ATC DRUG CLASS 2009 2010N03A Antiepileptics 1.8339 2.5767N03A A Barbiturates and derivatives 0.0848 0.0693N03A B Hydantoin derivatives 0.4240 0.4219N03A D Succinimide derivatives - <0.0001N03A E Benzodiazepine derivatives 0.0541 0.0646N03A F Carboxamide derivatives 2.2413 0.2664N03A G Fatty acid derivatives 0.6159 1.4757N03A X Other antiepileptics 0.3915 0.2863
Table 20.3: Use of Anti-Epileptics by Drug Class and Agents, in DDD/1000population/day 2009-2010ATC DRUG CLASS AND AGENTS SECTOR 2009 2010N03A A Barbiturates and derivativesN03A A02
Phenobarbital
Public 0.0701 0.0650Private 0.0141 0.0036Total 0.0842 0.0686
N03A A03
Primidone Public 0.0006 0.0007Private <0.0001 <0.0001Total 0.0006 0.0007
N03A B Hydantoin derivativesN03A B02
Phenytoin
Public 0.3669 0.3865Private 0.0572 0.0354Total 0.4240 0.4219
N03A D Succinimide derivatives
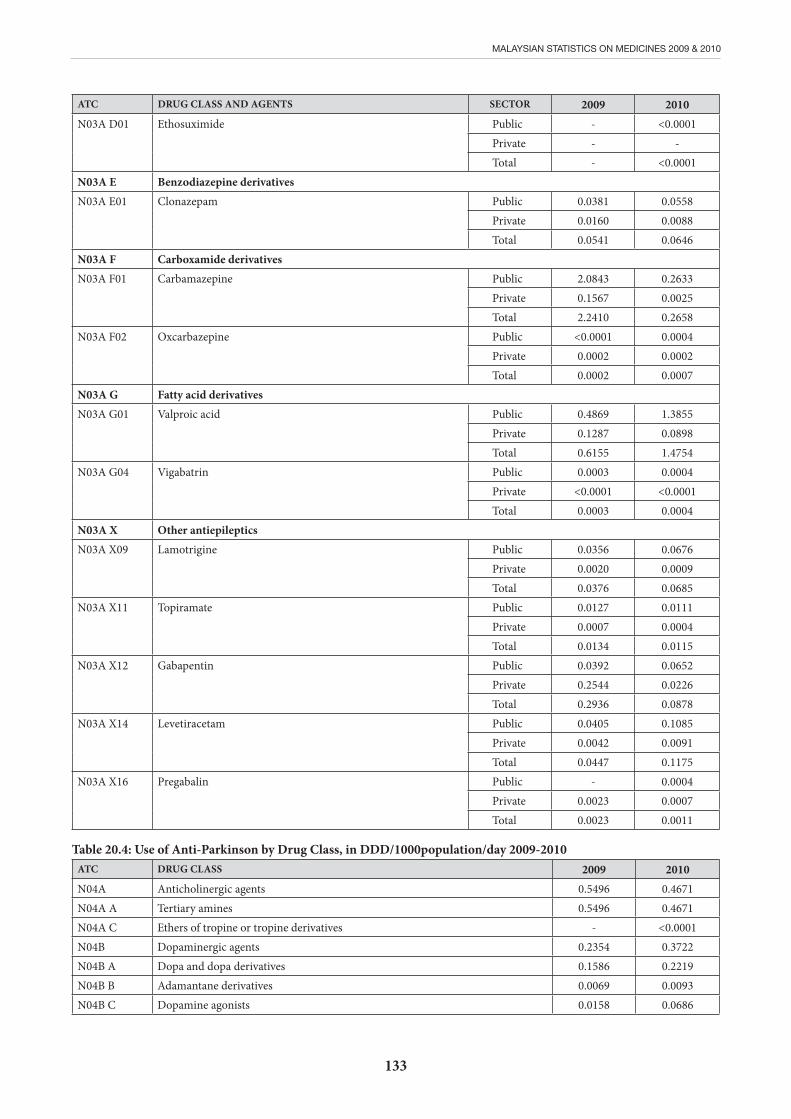
133
MALAYSIAN STATISTICS ON MEDICINES 2009 & 2010
ATC DRUG CLASS AND AGENTS SECTOR 2009 2010N03A D01
Ethosuximide Public - <0.0001Private - -Total - <0.0001
N03A E Benzodiazepine derivativesN03A E01
Clonazepam Public 0.0381 0.0558Private 0.0160 0.0088Total 0.0541 0.0646
N03A F Carboxamide derivativesN03A F01
Carbamazepine Public 2.0843 0.2633Private 0.1567 0.0025Total 2.2410 0.2658
N03A F02
Oxcarbazepine Public <0.0001 0.0004Private 0.0002 0.0002Total 0.0002 0.0007
N03A G Fatty acid derivativesN03A G01
Valproic acid Public 0.4869 1.3855Private 0.1287 0.0898Total 0.6155 1.4754
N03A G04
Vigabatrin
Public 0.0003 0.0004Private <0.0001 <0.0001Total 0.0003 0.0004
N03A X Other antiepileptics N03A X09
Lamotrigine Public 0.0356 0.0676Private 0.0020 0.0009Total 0.0376 0.0685
N03A X11
Topiramate
Public 0.0127 0.0111Private 0.0007 0.0004Total 0.0134 0.0115
N03A X12
Gabapentin
Public 0.0392 0.0652Private 0.2544 0.0226Total 0.2936 0.0878
N03A X14
Levetiracetam Public 0.0405 0.1085Private 0.0042 0.0091Total 0.0447 0.1175
N03A X16
Pregabalin Public - 0.0004Private 0.0023 0.0007Total 0.0023 0.0011
Table 20.4: Use of Anti-Parkinson by Drug Class, in DDD/1000population/day 2009-2010ATC DRUG CLASS 2009 2010N04A Anticholinergic agents 0.5496 0.4671N04A A Tertiary amines 0.5496 0.4671N04A C Ethers of tropine or tropine derivatives - <0.0001N04B Dopaminergic agents 0.2354 0.3722N04B A Dopa and dopa derivatives 0.1586 0.2219N04B B Adamantane derivatives 0.0069 0.0093N04B C Dopamine agonists 0.0158 0.0686
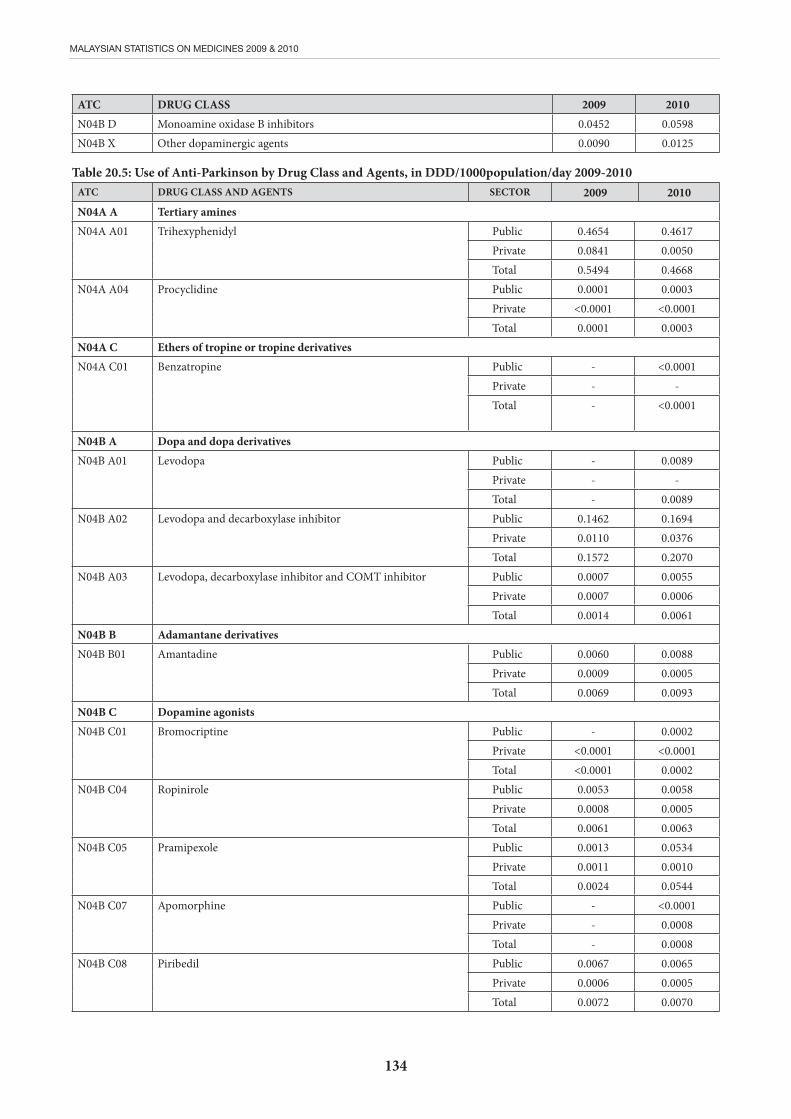
134
MALAYSIAN STATISTICS ON MEDICINES 2009 & 2010
ATC DRUG CLASS 2009 2010N04B D Monoamine oxidase B inhibitors 0.0452 0.0598N04B X Other dopaminergic agents 0.0090 0.0125
Table 20.5: Use of Anti-Parkinson by Drug Class and Agents, in DDD/1000population/day 2009-2010ATC DRUG CLASS AND AGENTS SECTOR 2009 2010N04A A Tertiary aminesN04A A01 Trihexyphenidyl
Public 0.4654 0.4617Private 0.0841 0.0050Total 0.5494 0.4668
N04A A04 Procyclidine Public 0.0001 0.0003Private <0.0001 <0.0001Total 0.0001 0.0003
N04A C Ethers of tropine or tropine derivativesN04A C01 Benzatropine
Public - <0.0001Private - -Total - <0.0001
N04B A Dopa and dopa derivativesN04B A01 Levodopa
Public - 0.0089Private - -Total - 0.0089
N04B A02 Levodopa and decarboxylase inhibitor
Public 0.1462 0.1694Private 0.0110 0.0376Total 0.1572 0.2070
N04B A03
Levodopa, decarboxylase inhibitor and COMT inhibitor Public 0.0007 0.0055Private 0.0007 0.0006Total 0.0014 0.0061
N04B B Adamantane derivativesN04B B01
Amantadine Public 0.0060 0.0088Private 0.0009 0.0005Total 0.0069 0.0093
N04B C Dopamine agonistsN04B C01
Bromocriptine
Public - 0.0002Private <0.0001 <0.0001Total <0.0001 0.0002
N04B C04
Ropinirole
Public 0.0053 0.0058Private 0.0008 0.0005Total 0.0061 0.0063
N04B C05
Pramipexole Public 0.0013 0.0534Private 0.0011 0.0010Total 0.0024 0.0544
N04B C07
Apomorphine
Public - <0.0001Private - 0.0008Total - 0.0008
N04B C08
Piribedil
Public 0.0067 0.0065Private 0.0006 0.0005Total 0.0072 0.0070

135
MALAYSIAN STATISTICS ON MEDICINES 2009 & 2010
ATC DRUG CLASS AND AGENTS SECTOR 2009 2010N04B D Monoamine oxidase B inhibitorsN04B D01 Selegiline
Public 0.0403 0.0571Private 0.0049 0.0027Total 0.0452 0.0598
N04B X Other dopaminergic agentsN04B X02 Entacapone
Public 0.0089 0.0124Private 0.0001 0.0002Total 0.0090 0.0125
Table 20.6: Use of Anti-Migraines by Drug Class, in DDD/1000population/day 2009-2010ATC DRUG CLASS 2009 2010N02C Antimigraine preparations 0.1822 0.1173N02C A Ergot alkaloids 0.1511 0.0917N02C C Selective serotonin (5HT1) agonists 0.0101 0.0075N02C X Other antimigraine preparations 0.0210 0.0181
Table 20.7: Use of Anti-Migraines by Drug Class and Agents, in DDD/1000population/day 2009-2010ATC DRUG CLASS AND AGENTS SECTOR 2009 2010N02C A Ergot alkaloidsN02C A02
Ergotamine
Public - <0.0001Private - 0.0004Total - 0.0004
N02C A52
Ergotamine, combinations excl. psycholeptics
Public <0.0001 0.0001Private 0.1511 0.0911Total 0.1511 0.0913
N02C C Selective serotonin (5HT1) agonistsN02C C01
Sumatriptan
Public 0.0063 0.0052Private 0.0038 0.0023Total 0.0101 0.0075
N02C X Other antimigraine preparationsN02C X01
Pizotifen
Public 0.0091 0.0169Private 0.0119 0.0012Total 0.0210 0.0181
N02C X02
Clonidine
Public - <0.0001Private - -Total - <0.0001
Table 20.8: Use of Other Nervous Systems Drugs by Drug Class, in DDD/1000population/day 2009-2010ATC DRUG CLASS 2009 2010N07A Parasympathomimetics 0.0850 0.2216N07A A Anticholinesterases 0.0850 0.2216N07A B Choline esters - <0.0001N07C Antivertigo preparations 0.6738 0.4919N07C A Antivertigo preparations 0.6738 0.4919L03A Immunostimulants 0.0007 0.0066L03A B Interferons 0.0007 0.0066N07X Other nervous system drugs <0.0001 <0.0001N07X X Other nervous system drugs <0.0001 <0.0001
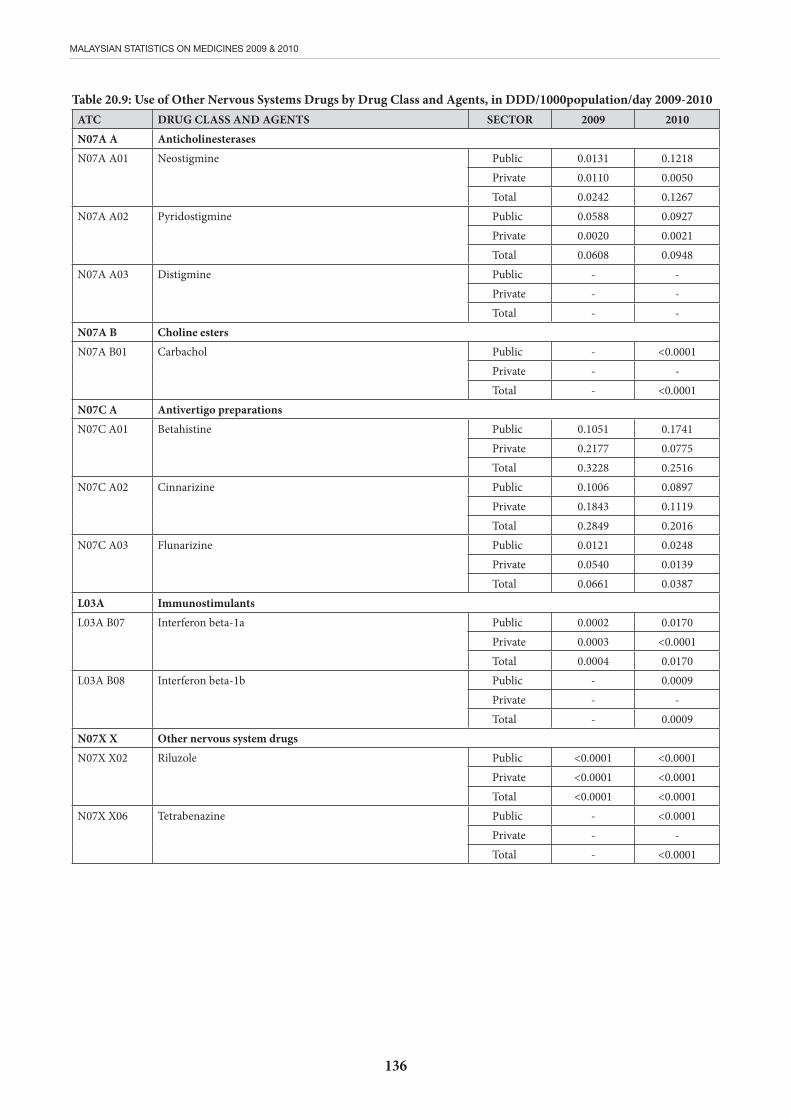
136
MALAYSIAN STATISTICS ON MEDICINES 2009 & 2010
Table 20.9: Use of Other Nervous Systems Drugs by Drug Class and Agents, in DDD/1000population/day 2009-2010ATC DRUG CLASS AND AGENTS SECTOR 2009 2010N07A A AnticholinesterasesN07A A01
Neostigmine
Public 0.0131 0.1218Private 0.0110 0.0050Total 0.0242 0.1267
N07A A02
Pyridostigmine
Public 0.0588 0.0927Private 0.0020 0.0021Total 0.0608 0.0948
N07A A03
Distigmine
Public - -Private - -Total - -
N07A B Choline estersN07A B01
Carbachol
Public - <0.0001Private - -Total - <0.0001
N07C A Antivertigo preparationsN07C A01
Betahistine
Public 0.1051 0.1741Private 0.2177 0.0775Total 0.3228 0.2516
N07C A02
Cinnarizine
Public 0.1006 0.0897Private 0.1843 0.1119Total 0.2849 0.2016
N07C A03
Flunarizine
Public 0.0121 0.0248Private 0.0540 0.0139Total 0.0661 0.0387
L03A ImmunostimulantsL03A B07
Interferon beta-1a
Public 0.0002 0.0170Private 0.0003 <0.0001Total 0.0004 0.0170
L03A B08
Interferon beta-1b
Public - 0.0009Private - -Total - 0.0009
N07X X Other nervous system drugsN07X X02
Riluzole
Public <0.0001 <0.0001Private <0.0001 <0.0001Total <0.0001 <0.0001
N07X X06
Tetrabenazine
Public - <0.0001Private - -Total - <0.0001
137
MALAYSIAN STATISTICS ON MEDICINES 2009 & 2010
References:1. Malaysian Statistics on Medicines 2008; Pharmaceutical Services Division & Clinical Research Centre, Ministry of
Health Malaysia Printing Office: Kuala Lumpur 2013.
2. Raymond, A. A., Tan C. T., Raihanah, A. K., Consensus Guidelines on the Management of Epilepsy 2010. Malaysian Society of Neurosciences, Kuala Lumpur.
3. Rosenberg, G. The mechanisms of action of alproate in neuropsychiatric disorders: can we see the forest for the trees? Cell Mol Life Sci. 2007, 64, 2090–2103.
4. Johannessen, C. U. Mechanisms of action of valproate: a commentatory. Neurochem Int. 2000, 37, 103–110.
5. Johannessen, C. U.; Johannessen, S. I. Valproate: past, present, and future. CNS Drug Rev. 2003, 9, 199–216.
6. Patsalos, P. N. Properties of Antiepileptic Drugs in the Treatment of Idiopathic Generalized Epilepsies. Epilepsia. 2005, 46, 140–144.
7. Malaysian Consensus on Parkinson’s Disease 2006. Malaysian Parkinson’s Disease Association (MPDA).
8. Australian Statistics on Medicines 2010; Australian Drug Utilization Subcommittee Secretariat, Pharmaceutical Benefits Advisory Committee Printing Office: Australia 2012
9. MOH Drug Formulary 2010. Kementerian Kesihatan Malaysia.
10. Sakshaug, S (ed), Drug Consumption in Norway 2008-2012, Norwegian Institute of Public Health, Printing Office: Oslo 2013.
138
MALAYSIAN STATISTICS ON MEDICINES 2009 & 2010
CHAPTER 21: USE OF DRUGS FOR PSYCHIATRIC DISORDERSToh C.L.1, Nor Hayati A.1, Azizul A.2, Mazni M.J.3, Umi Adzlin S.2, Noor Ratna N.4, Shamini R.5,
1. Selayang Hospital, Selangor, 2. Putrajaya Hospital, Putrajaya, 3.Serdang Hospital, Selangor, 4. Hospital Permai, Johor,5.Hospital Bahagia Ulu Kinta, Perak.
An audit study was specifically conducted in 2010 related to the use of controlled substances in registered private medical clinics and pharmacy-licensed premises and there were efforts to create greater awareness of the diversion of psychotropic substances.
In 2009, Alprazolam was the most commonly prescribed anxiolytic (DDD 0.5568); followed by Triazolam (DDD 0.3783; which was prescribed exclusively in private sector); and diazepam (DDD 0.2734). In 2010, the top three were Alprazolam (DDD 0.187), Zolpidem (DDD 0.1411) and Lorazepam (DDD 0.1049). This may again illustrate the impact of enforcement.
However, we should be aware that the overall use of anxiolytics, hypnotics and sedatives were actually very low compared to other developed countries (DDD 3.2414 in 2009; DDD 2.7767 in 2010). The consumption of anxiolytics, hypnotics and sedatives was remarkably lower compared to Norway (DDD 19.55 and DDD 47.75 respectively)6 and Finland (DDD 27.91 and DDD 48.77 respectively) in 20103.
Consumption of antidepressants showed a 16.2% increase; i.e. the DDD increasing from 1.1308 in 2009 to 1.3145 in 2010. The proportion contributed by antidepressants is 23.3% in 2009 compared to 31.2% in 2010. Amongst the different classes, Selective Serotonin Reuptake Inhibitors (SSRIs) remained the biggest contributor in terms of proportion, i.e. 63.3% (DDD 0.7154) in 2009 and 59.87% (DDD 0.787) in 2010.
There were major changes in the top three most-used antidepressants during this time span. For 2009, Fluvoxamine (DDD 0.2009) had lost its grip as the most-used antidepressant, overtaken by Sertaline (DDD 0.2827). The third most-used antidepressant was a tricyclic, Amitriptyline (DDD 0.1476). In year 2010, the top three usages were for Amitriptyline (DDD 0.3516); Escitalopram (DDD 0.3319) and Sertraline (DDD 0.1932). The high use of Amitriptyline may be due to the fact that is it used by many non-psychiatrists for various indications. The increased usage of Escitalopram was driven by the private sector, which shows a noticeable increase in its DDD from 0.096 to 0.2129.
As a whole, utilisation of antidepressants is still much lower in Malaysia as compared to developed countries such as Norway (DDD 56.42)6 and Finland (DDD 68.8)3 in 2010. Malaysia also differed in the choice of antidepressant, where the highest consumption was for Escitalopram in Norway in 2010 (DDD 19.51) and Finland (DDD 11.77).
Psychiatric morbidity is high among adults, children and adolescents as shown in The National Health and Morbidity Survey 20061.Usage of psychotropic drugs may reflect the utilisation of psychiatric services. Good longitudinal data analyses are valuable in forecasting usage trend of psychotropic drugs. Without the data, it is difficult to know whether changes in drug usage are real or can be attributed to better awareness and detection of disease2.
Generally, there was an increased use of all drug classes except for the group of anxiolytics, hypnotics and sedatives (Figure 21.1).
Antipsychotics remained the most widely prescribed drugs in psychiatry. The overall use of antipsychotics had increased 11.8% in 2010 from the previous year. They contributed about 52% of the total use of psychotropic prescriptions. The most utilized antipsychotic in 2009 was haloperidol (DDD 0.4809), however fluphenazine was reported to be the most prescribed drug in 2010 (DDD 2.2031). The use of antipsychotics was predominantly prescribed by the public sector in 2009 and 2010 which was 96.1% and 98.9% respectively.
There was also a similar trend of increased usage of atypical antipsychotics in 2010 (32.4%). The prescription of atypical antipsychotics was higher in the public sector in 2010 as opposed to the higher prescription in private sector in 2009 (42.9%).
It was shown that Risperidone (DDD 0.3927) was the most prescribed antipsychotics in 2010 with remarkable increase (93.73%) from the previous year. This may be attributed to the accessibility of this medication in primary care level as well as the availability of the generic form. Corresponding data from Finland in 2010 reported the most used atypical antipsychotic was Olanzapine (DDD 5.2) and Aripiprazole was the most prescribed drug in Australia (DDD 15)3.
There was a significant drop of 14.34% in the overall usage of anxiolytics, hypnotics and sedatives group from 2009 (DDD 3.2414) to 2010 (DDD 2.7767). The private sector may have contributed to this decline from 2009 (DDD 1.343) to 2010 (DDD 0.3559) while usage in public sector remained stable (DDD 0.2645 in 2009; DDD 0.2877 in 2010). It was likely that this reduction was associated with effective enforcement to curb misuse.
According to the Annual Report of Pharmacy Programme, Ministry of Health Malaysia 2009 and 20104,5, ‘more audits were carried out to stem the misuse of narcotic drugs and psychotropic substances by health care practitioners for purposes other than the legitimate medical purposes’.
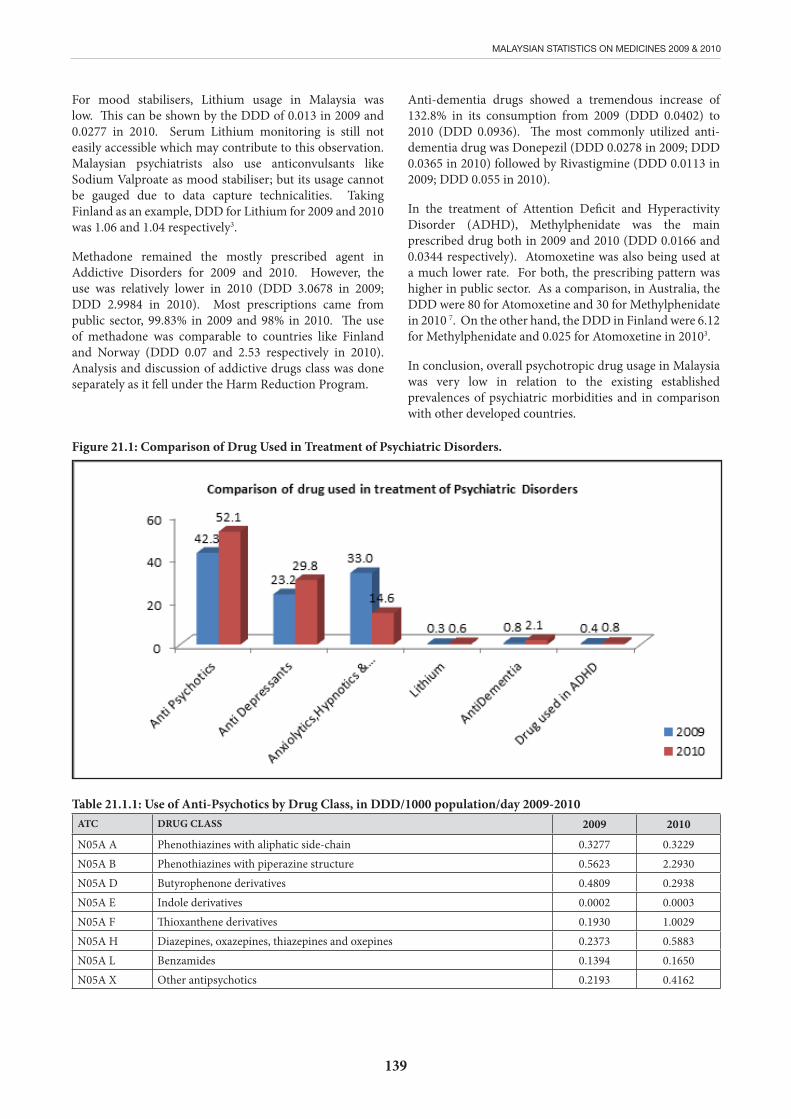
139
MALAYSIAN STATISTICS ON MEDICINES 2009 & 2010
For mood stabilisers, Lithium usage in Malaysia was low. This can be shown by the DDD of 0.013 in 2009 and 0.0277 in 2010. Serum Lithium monitoring is still not easily accessible which may contribute to this observation. Malaysian psychiatrists also use anticonvulsants like Sodium Valproate as mood stabiliser; but its usage cannot be gauged due to data capture technicalities. Taking Finland as an example, DDD for Lithium for 2009 and 2010 was 1.06 and 1.04 respectively3.
Methadone remained the mostly prescribed agent in Addictive Disorders for 2009 and 2010. However, the use was relatively lower in 2010 (DDD 3.0678 in 2009; DDD 2.9984 in 2010). Most prescriptions came from public sector, 99.83% in 2009 and 98% in 2010. The use of methadone was comparable to countries like Finland and Norway (DDD 0.07 and 2.53 respectively in 2010). Analysis and discussion of addictive drugs class was done separately as it fell under the Harm Reduction Program.
Anti-dementia drugs showed a tremendous increase of 132.8% in its consumption from 2009 (DDD 0.0402) to 2010 (DDD 0.0936). The most commonly utilized anti-dementia drug was Donepezil (DDD 0.0278 in 2009; DDD 0.0365 in 2010) followed by Rivastigmine (DDD 0.0113 in 2009; DDD 0.055 in 2010).
In the treatment of Attention Deficit and Hyperactivity Disorder (ADHD), Methylphenidate was the main prescribed drug both in 2009 and 2010 (DDD 0.0166 and 0.0344 respectively). Atomoxetine was also being used at a much lower rate. For both, the prescribing pattern was higher in public sector. As a comparison, in Australia, the DDD were 80 for Atomoxetine and 30 for Methylphenidate in 2010 7. On the other hand, the DDD in Finland were 6.12 for Methylphenidate and 0.025 for Atomoxetine in 20103.
In conclusion, overall psychotropic drug usage in Malaysia was very low in relation to the existing established prevalences of psychiatric morbidities and in comparison with other developed countries.
Figure 21.1: Comparison of Drug Used in Treatment of Psychiatric Disorders.
Table 21.1.1: Use of Anti-Psychotics by Drug Class, in DDD/1000 population/day 2009-2010ATC DRUG CLASS 2009 2010
N05A A Phenothiazines with aliphatic side-chain 0.3277 0.3229N05A B Phenothiazines with piperazine structure 0.5623 2.2930N05A D Butyrophenone derivatives 0.4809 0.2938N05A E Indole derivatives 0.0002 0.0003N05A F Thioxanthene derivatives 0.1930 1.0029N05A H Diazepines, oxazepines, thiazepines and oxepines 0.2373 0.5883N05A L Benzamides 0.1394 0.1650N05A X Other antipsychotics 0.2193 0.4162
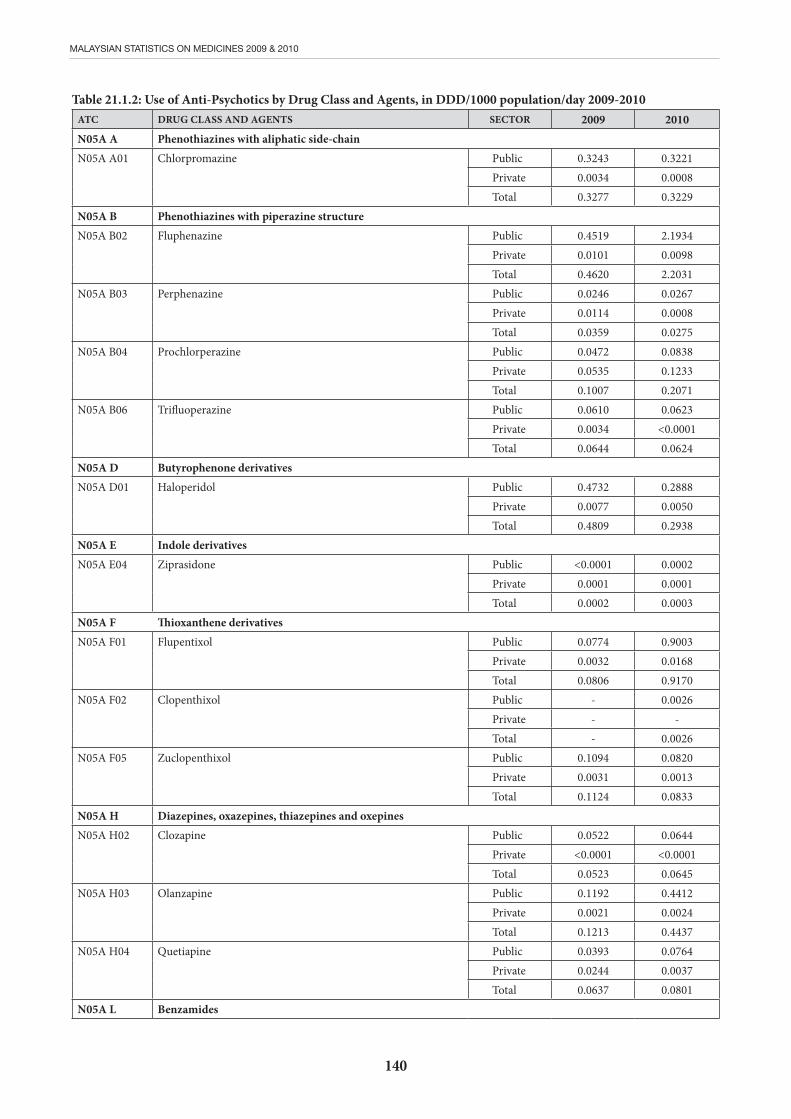
140
MALAYSIAN STATISTICS ON MEDICINES 2009 & 2010
Table 21.1.2: Use of Anti-Psychotics by Drug Class and Agents, in DDD/1000 population/day 2009-2010ATC DRUG CLASS AND AGENTS SECTOR 2009 2010N05A A Phenothiazines with aliphatic side-chainN05A A01
Chlorpromazine
Public 0.3243 0.3221Private 0.0034 0.0008Total 0.3277 0.3229
N05A B Phenothiazines with piperazine structureN05A B02
Fluphenazine
Public 0.4519 2.1934Private 0.0101 0.0098Total 0.4620 2.2031
N05A B03
Perphenazine
Public 0.0246 0.0267Private 0.0114 0.0008Total 0.0359 0.0275
N05A B04
Prochlorperazine
Public 0.0472 0.0838Private 0.0535 0.1233Total 0.1007 0.2071
N05A B06
Trifluoperazine Public 0.0610 0.0623Private 0.0034 <0.0001Total 0.0644 0.0624
N05A D Butyrophenone derivativesN05A D01
Haloperidol
Public 0.4732 0.2888Private 0.0077 0.0050Total 0.4809 0.2938
N05A E Indole derivativesN05A E04
Ziprasidone
Public <0.0001 0.0002Private 0.0001 0.0001Total 0.0002 0.0003
N05A F Thioxanthene derivativesN05A F01 Flupentixol
Public 0.0774 0.9003Private 0.0032 0.0168Total 0.0806 0.9170
N05A F02
Clopenthixol
Public - 0.0026Private - -Total - 0.0026
N05A F05
Zuclopenthixol
Public 0.1094 0.0820Private 0.0031 0.0013Total 0.1124 0.0833
N05A H Diazepines, oxazepines, thiazepines and oxepinesN05A H02
Clozapine
Public 0.0522 0.0644Private <0.0001 <0.0001Total 0.0523 0.0645
N05A H03
Olanzapine
Public 0.1192 0.4412Private 0.0021 0.0024Total 0.1213 0.4437
N05A H04
Quetiapine
Public 0.0393 0.0764Private 0.0244 0.0037Total 0.0637 0.0801
N05A L Benzamides
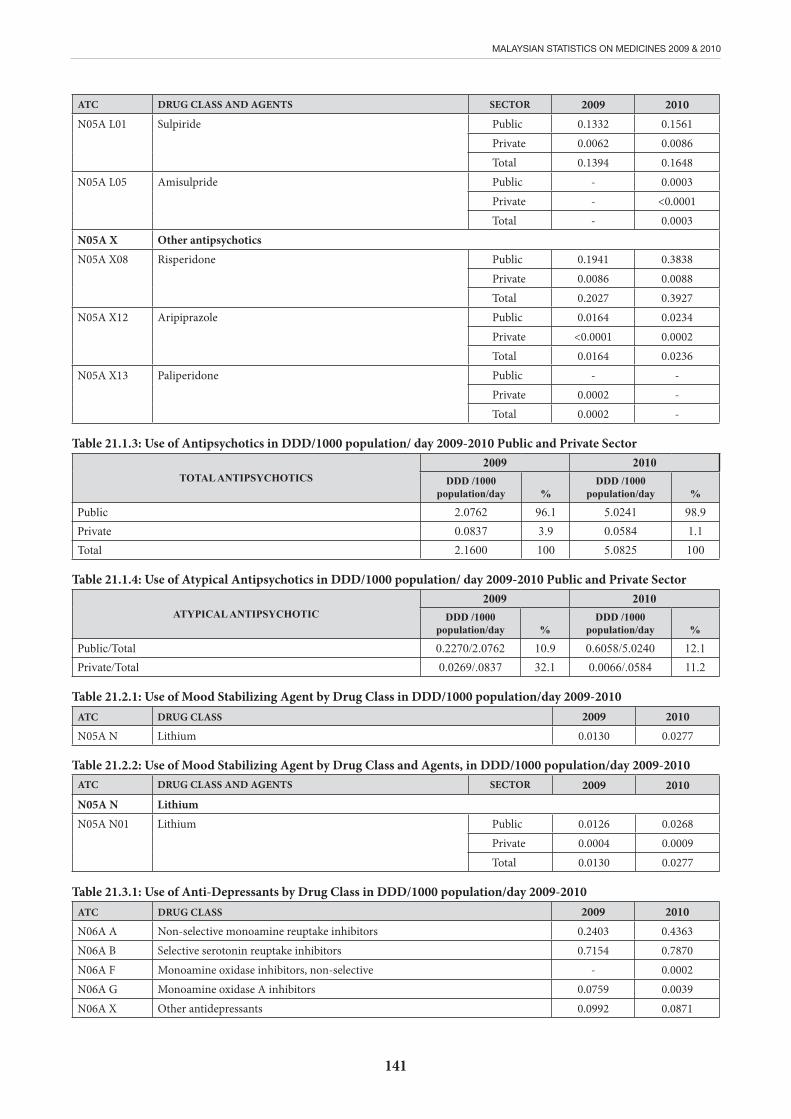
141
MALAYSIAN STATISTICS ON MEDICINES 2009 & 2010
ATC DRUG CLASS AND AGENTS SECTOR 2009 2010N05A L01
Sulpiride
Public 0.1332 0.1561Private 0.0062 0.0086Total 0.1394 0.1648
N05A L05
Amisulpride
Public - 0.0003Private - <0.0001Total - 0.0003
N05A X Other antipsychoticsN05A X08
Risperidone
Public 0.1941 0.3838Private 0.0086 0.0088Total 0.2027 0.3927
N05A X12
Aripiprazole
Public 0.0164 0.0234Private <0.0001 0.0002Total 0.0164 0.0236
N05A X13
Paliperidone
Public - -Private 0.0002 -Total 0.0002 -
Table 21.1.3: Use of Antipsychotics in DDD/1000 population/ day 2009-2010 Public and Private Sector
TOTAL ANTIPSYCHOTICS2009 2010
DDD /1000 population/day %
DDD /1000 population/day %
Public 2.0762 96.1 5.0241 98.9Private 0.0837 3.9 0.0584 1.1Total 2.1600 100 5.0825 100
Table 21.1.4: Use of Atypical Antipsychotics in DDD/1000 population/ day 2009-2010 Public and Private Sector
ATYPICAL ANTIPSYCHOTIC2009 2010
DDD /1000 population/day %
DDD /1000 population/day %
Public/Total 0.2270/2.0762 10.9 0.6058/5.0240 12.1Private/Total 0.0269/.0837 32.1 0.0066/.0584 11.2
Table 21.2.1: Use of Mood Stabilizing Agent by Drug Class in DDD/1000 population/day 2009-2010ATC DRUG CLASS 2009 2010N05A N Lithium 0.0130 0.0277
Table 21.2.2: Use of Mood Stabilizing Agent by Drug Class and Agents, in DDD/1000 population/day 2009-2010ATC DRUG CLASS AND AGENTS SECTOR 2009 2010N05A N LithiumN05A N01 Lithium Public 0.0126 0.0268
Private 0.0004 0.0009Total 0.0130 0.0277
Table 21.3.1: Use of Anti-Depressants by Drug Class in DDD/1000 population/day 2009-2010ATC DRUG CLASS 2009 2010N06A A Non-selective monoamine reuptake inhibitors 0.2403 0.4363N06A B Selective serotonin reuptake inhibitors 0.7154 0.7870N06A F Monoamine oxidase inhibitors, non-selective - 0.0002N06A G Monoamine oxidase A inhibitors 0.0759 0.0039N06A X Other antidepressants 0.0992 0.0871
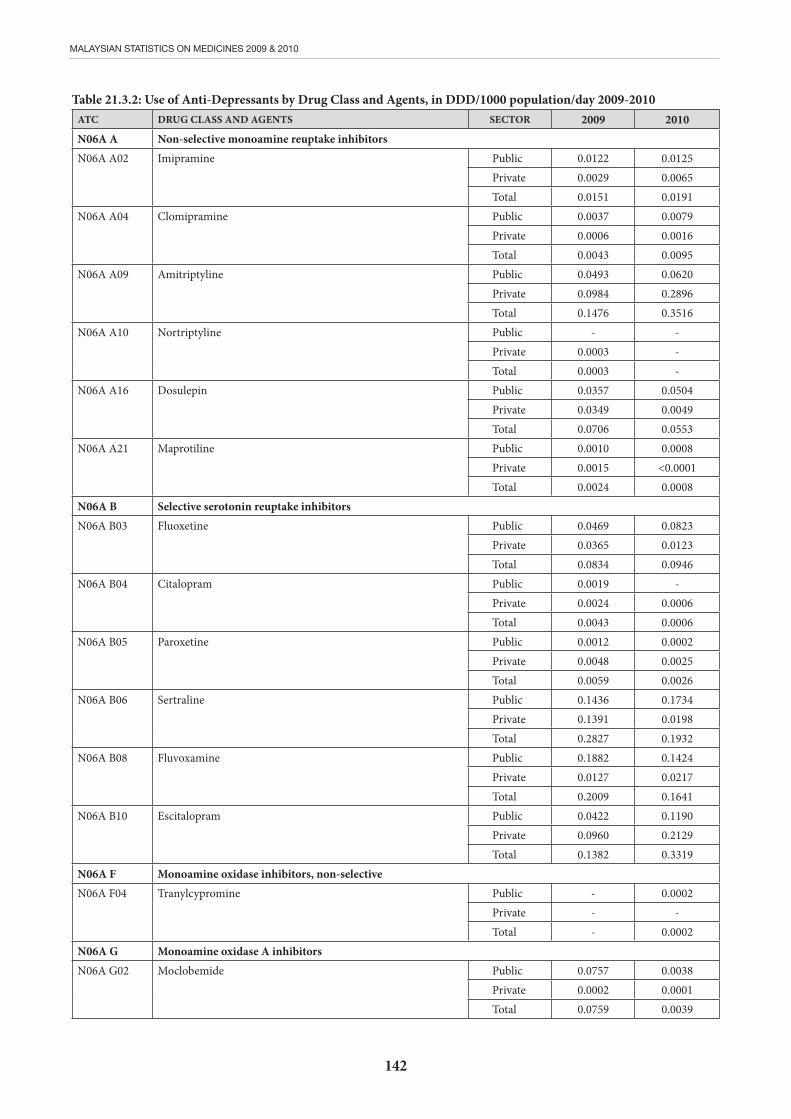
142
MALAYSIAN STATISTICS ON MEDICINES 2009 & 2010
Table 21.3.2: Use of Anti-Depressants by Drug Class and Agents, in DDD/1000 population/day 2009-2010ATC DRUG CLASS AND AGENTS SECTOR 2009 2010N06A A Non-selective monoamine reuptake inhibitorsN06A A02
Imipramine
Public 0.0122 0.0125Private 0.0029 0.0065Total 0.0151 0.0191
N06A A04
Clomipramine
Public 0.0037 0.0079Private 0.0006 0.0016Total 0.0043 0.0095
N06A A09
Amitriptyline Public 0.0493 0.0620Private 0.0984 0.2896Total 0.1476 0.3516
N06A A10
Nortriptyline
Public - -Private 0.0003 -Total 0.0003 -
N06A A16
Dosulepin Public 0.0357 0.0504Private 0.0349 0.0049Total 0.0706 0.0553
N06A A21
Maprotiline
Public 0.0010 0.0008Private 0.0015 <0.0001Total 0.0024 0.0008
N06A B Selective serotonin reuptake inhibitorsN06A B03
Fluoxetine
Public 0.0469 0.0823Private 0.0365 0.0123Total 0.0834 0.0946
N06A B04
Citalopram
Public 0.0019 -Private 0.0024 0.0006Total 0.0043 0.0006
N06A B05
Paroxetine
Public 0.0012 0.0002Private 0.0048 0.0025Total 0.0059 0.0026
N06A B06
Sertraline
Public 0.1436 0.1734Private 0.1391 0.0198Total 0.2827 0.1932
N06A B08
Fluvoxamine
Public 0.1882 0.1424Private 0.0127 0.0217Total 0.2009 0.1641
N06A B10
Escitalopram
Public 0.0422 0.1190Private 0.0960 0.2129Total 0.1382 0.3319
N06A F Monoamine oxidase inhibitors, non-selective N06A F04
Tranylcypromine
Public - 0.0002Private - -Total - 0.0002
N06A G Monoamine oxidase A inhibitorsN06A G02
Moclobemide
Public 0.0757 0.0038Private 0.0002 0.0001Total 0.0759 0.0039

143
MALAYSIAN STATISTICS ON MEDICINES 2009 & 2010
ATC DRUG CLASS AND AGENTS SECTOR 2009 2010N06A X Other antidepressantsN06A X03
Mianserin
Public 0.0002 <0.0001Private <0.0001 0.0002Total 0.0003 0.0003
N06A X11
Mirtazapine
Public 0.0203 0.0282Private 0.0056 0.0061Total 0.0258 0.0344
N06A X12
Bupropion
Public <0.0001 -Private <0.0001 <0.0001Total <0.0001 <0.0001
N06A X14
Tianeptine
Public 0.0002 0.0002Private 0.0012 0.0042Total 0.0014 0.0044
N06A X16
Venlafaxine
Public 0.0142 0.0242Private 0.0018 0.0030Total 0.0160 0.0272
N06A X21
Duloxetine
Public 0.0083 0.0170Private 0.0473 0.0037Total 0.0555 0.0206
N06A X23
Desvenlafaxine
Public - -Private - 0.0002Total - 0.0002
Table 21.4.1: Use of Anxiolytics, Hypnotics and Sedatives by Drug Class and Agents, in DDD/1000 population/day 2009-2010
ATC DRUG CLASS 2009 2010N05B A Benzodiazepine derivatives 1.0065 0.3744N05B B Diphenylmethane derivatives 0.1199 0.0936N05C C Aldehydes and derivatives 1.3867 1.0739N05C D Benzodiazepine derivatives 0.4933 0.1034N05C F Benzodiazepine related drugs 0.1077 0.1658N05C H Melatonin receptor agonists 0.0027 0.0015N05C M Other hypnotics and sedatives 0.1246 0.9640
Table 21.4.2: Use of Anxiolytics, Hypnotics and Sedatives by Drug Class and Agents, in DDD/1000 population/day 2009-2010
ATC DRUG CLASS AND AGENTS SECTOR 2009 2010N05B A Benzodiazepine derivativesN05B A01
Diazepam
Public 0.0604 0.0303Private 0.2130 0.0358Total 0.2734 0.0661
N05B A02
Chlordiazepoxide
Public - -Private 0.0009 <0.0001Total 0.0009 <0.0001
N05B A05
Potassium clorazepate
Public - -Private 0.0027 0.0023Total 0.0027 0.0023

144
MALAYSIAN STATISTICS ON MEDICINES 2009 & 2010
ATC DRUG CLASS AND AGENTS SECTOR 2009 2010N05B A06
Lorazepam
Public 0.0366 0.0683Private 0.0842 0.0365Total 0.1208 0.1049
N05B A08
Bromazepam
Public 0.0019 0.0013Private 0.0129 0.0082Total 0.0148 0.0095
N05B A09
Clobazam
Public 0.0025 0.0007Private 0.0346 0.0040Total 0.0372 0.0047
N05B A12
Alprazolam
Public 0.0856 0.1000Private 0.4712 0.0870Total 0.5568 0.1870
N05B B Diphenylmethane derivativesN05B B01
Hydroxyzine
Public 0.0313 0.0352Private 0.0887 0.0585Total 0.1199 0.0936
N05C C Aldehydes and derivativesN05C C01
Chloral hydrate
Public 1.2229 0.9185Private 0.1638 0.1554Total 1.3867 1.0738
N05C C05
Paraldehyde
Public <0.0001 <0.0001Private <0.0001 -Total <0.0001 <0.0001
N05C D Benzodiazepine derivativesN05C D02
Nitrazepam
Public 0.0025 0.0025Private 0.0089 0.0004Total 0.0114 0.0028
N05C D05
Triazolam
Public - -Private 0.3783 0.0140Total 0.3783 0.0140
N05C D08
Midazolam Public 0.0423 0.0439Private 0.0613 0.0427Total 0.1035 0.0866
N05C F Benzodiazepine related drugsN05C F01
Zopiclone Public - -Private 0.0279 0.0247Total 0.0279 0.0247
N05C F02
Zolpidem
Public 0.0337 0.0408Private 0.0461 0.1003Total 0.0798 0.1411
N05C H Melatonin receptor agonistsN05C H01
Melatonin
Public 0.0025 0.0011Private 0.0002 0.0004Total 0.0027 0.0015
N05C M Other hypnotics and sedatives
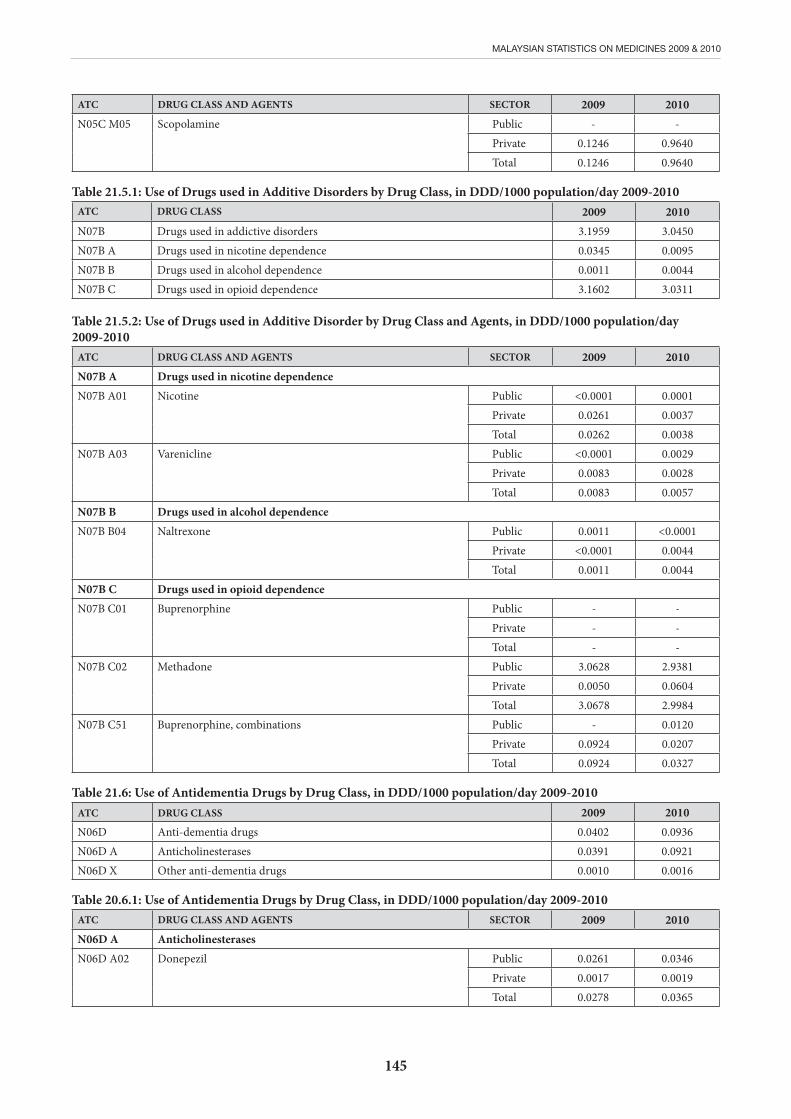
145
MALAYSIAN STATISTICS ON MEDICINES 2009 & 2010
ATC DRUG CLASS AND AGENTS SECTOR 2009 2010N05C M05
Scopolamine
Public - -Private 0.1246 0.9640Total 0.1246 0.9640
Table 21.5.1: Use of Drugs used in Additive Disorders by Drug Class, in DDD/1000 population/day 2009-2010ATC DRUG CLASS 2009 2010N07B Drugs used in addictive disorders 3.1959 3.0450N07B A Drugs used in nicotine dependence 0.0345 0.0095N07B B Drugs used in alcohol dependence 0.0011 0.0044N07B C Drugs used in opioid dependence 3.1602 3.0311
Table 21.5.2: Use of Drugs used in Additive Disorder by Drug Class and Agents, in DDD/1000 population/day 2009-2010
ATC DRUG CLASS AND AGENTS SECTOR 2009 2010N07B A Drugs used in nicotine dependence N07B A01
Nicotine
Public <0.0001 0.0001Private 0.0261 0.0037Total 0.0262 0.0038
N07B A03
Varenicline
Public <0.0001 0.0029Private 0.0083 0.0028Total 0.0083 0.0057
N07B B Drugs used in alcohol dependence N07B B04
Naltrexone
Public 0.0011 <0.0001Private <0.0001 0.0044Total 0.0011 0.0044
N07B C Drugs used in opioid dependence N07B C01
Buprenorphine
Public - -Private - -Total - -
N07B C02
Methadone
Public 3.0628 2.9381Private 0.0050 0.0604Total 3.0678 2.9984
N07B C51
Buprenorphine, combinations
Public - 0.0120Private 0.0924 0.0207Total 0.0924 0.0327
Table 21.6: Use of Antidementia Drugs by Drug Class, in DDD/1000 population/day 2009-2010ATC DRUG CLASS 2009 2010N06D Anti-dementia drugs 0.0402 0.0936N06D A Anticholinesterases 0.0391 0.0921N06D X Other anti-dementia drugs 0.0010 0.0016
Table 20.6.1: Use of Antidementia Drugs by Drug Class, in DDD/1000 population/day 2009-2010ATC DRUG CLASS AND AGENTS SECTOR 2009 2010N06D A AnticholinesterasesN06D A02
Donepezil
Public 0.0261 0.0346Private 0.0017 0.0019Total 0.0278 0.0365
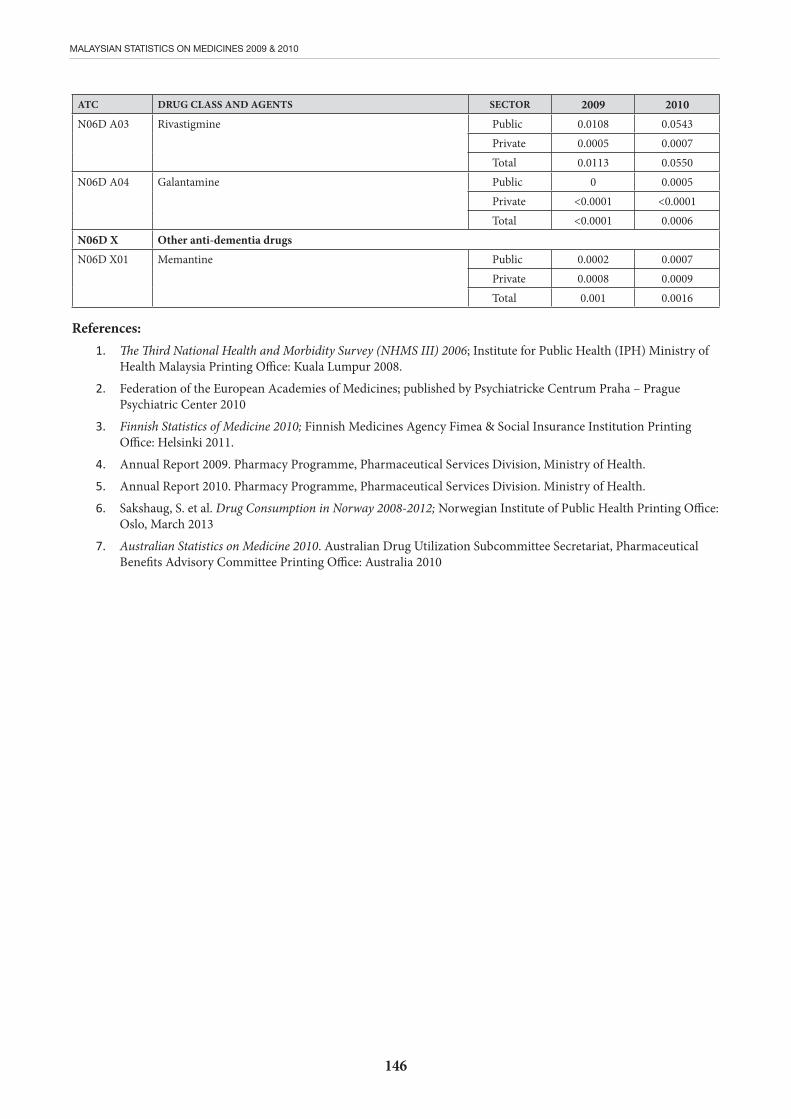
146
MALAYSIAN STATISTICS ON MEDICINES 2009 & 2010
ATC DRUG CLASS AND AGENTS SECTOR 2009 2010N06D A03
Rivastigmine
Public 0.0108 0.0543Private 0.0005 0.0007Total 0.0113 0.0550
N06D A04
Galantamine
Public 0 0.0005Private <0.0001 <0.0001Total <0.0001 0.0006
N06D X Other anti-dementia drugsN06D X01
Memantine
Public 0.0002 0.0007Private 0.0008 0.0009Total 0.001 0.0016
References:1. The Third National Health and Morbidity Survey (NHMS III) 2006; Institute for Public Health (IPH) Ministry of
Health Malaysia Printing Office: Kuala Lumpur 2008.
2. Federation of the European Academies of Medicines; published by Psychiatricke Centrum Praha – Prague Psychiatric Center 2010
3. Finnish Statistics of Medicine 2010; Finnish Medicines Agency Fimea & Social Insurance Institution Printing Office: Helsinki 2011.
4. Annual Report 2009. Pharmacy Programme, Pharmaceutical Services Division, Ministry of Health.
5. Annual Report 2010. Pharmacy Programme, Pharmaceutical Services Division. Ministry of Health.
6. Sakshaug, S. et al. Drug Consumption in Norway 2008-2012; Norwegian Institute of Public Health Printing Office: Oslo, March 2013
7. Australian Statistics on Medicine 2010. Australian Drug Utilization Subcommittee Secretariat, Pharmaceutical Benefits Advisory Committee Printing Office: Australia 2010
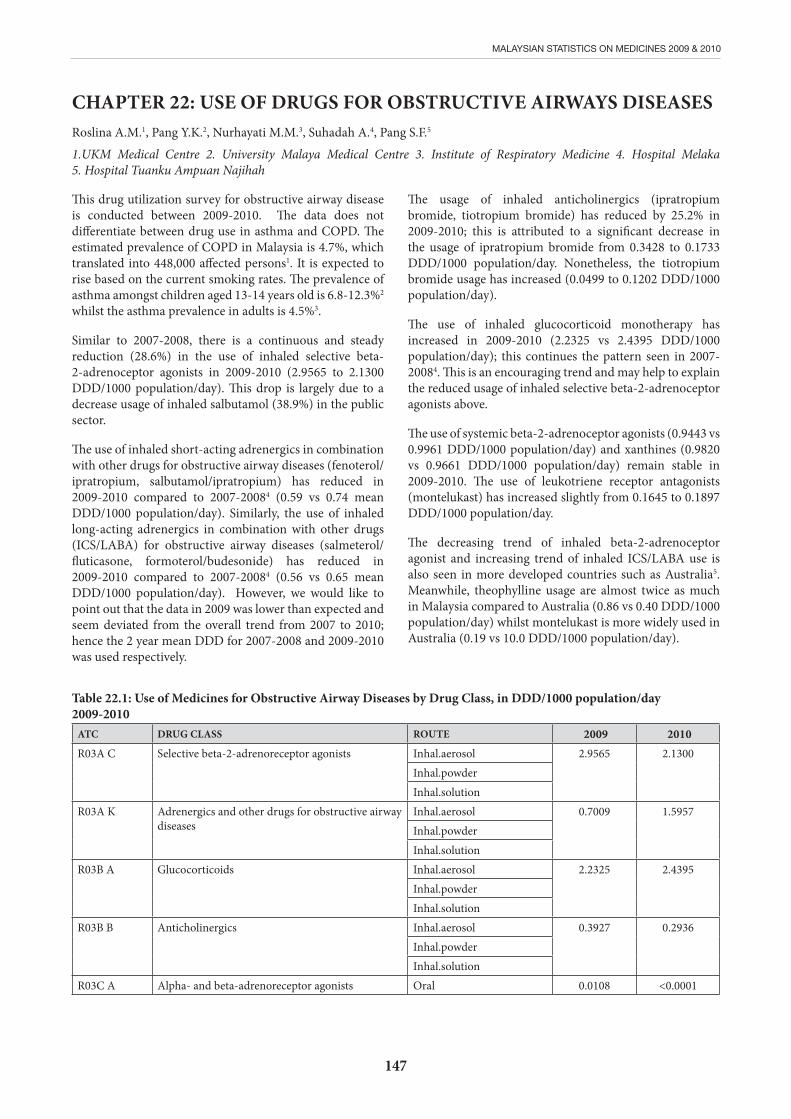
147
MALAYSIAN STATISTICS ON MEDICINES 2009 & 2010
CHAPTER 22: USE OF DRUGS FOR OBSTRUCTIVE AIRWAYS DISEASESRoslina A.M.1, Pang Y.K.2, Nurhayati M.M.3, Suhadah A.4, Pang S.F.5
1.UKM Medical Centre 2. University Malaya Medical Centre 3. Institute of Respiratory Medicine 4. Hospital Melaka 5. Hospital Tuanku Ampuan Najihah
Table 22.1: Use of Medicines for Obstructive Airway Diseases by Drug Class, in DDD/1000 population/day 2009-2010
ATC DRUG CLASS ROUTE 2009 2010R03A C
Selective beta-2-adrenoreceptor agonists
Inhal.aerosol 2.9565 2.1300Inhal.powderInhal.solution
R03A K Adrenergics and other drugs for obstructive airway diseases
Inhal.aerosol 0.7009 1.5957Inhal.powderInhal.solution
R03B A
Glucocorticoids
Inhal.aerosol 2.2325
2.4395
Inhal.powderInhal.solution
R03B B
Anticholinergics
Inhal.aerosol 0.3927
0.2936
Inhal.powderInhal.solution
R03C A Alpha- and beta-adrenoreceptor agonists Oral 0.0108 <0.0001
The usage of inhaled anticholinergics (ipratropium bromide, tiotropium bromide) has reduced by 25.2% in 2009-2010; this is attributed to a significant decrease in the usage of ipratropium bromide from 0.3428 to 0.1733 DDD/1000 population/day. Nonetheless, the tiotropium bromide usage has increased (0.0499 to 0.1202 DDD/1000 population/day).
The use of inhaled glucocorticoid monotherapy has increased in 2009-2010 (2.2325 vs 2.4395 DDD/1000 population/day); this continues the pattern seen in 2007-20084. This is an encouraging trend and may help to explain the reduced usage of inhaled selective beta-2-adrenoceptor agonists above.
The use of systemic beta-2-adrenoceptor agonists (0.9443 vs 0.9961 DDD/1000 population/day) and xanthines (0.9820 vs 0.9661 DDD/1000 population/day) remain stable in 2009-2010. The use of leukotriene receptor antagonists (montelukast) has increased slightly from 0.1645 to 0.1897 DDD/1000 population/day.
The decreasing trend of inhaled beta-2-adrenoceptor agonist and increasing trend of inhaled ICS/LABA use is also seen in more developed countries such as Australia5. Meanwhile, theophylline usage are almost twice as much in Malaysia compared to Australia (0.86 vs 0.40 DDD/1000 population/day) whilst montelukast is more widely used in Australia (0.19 vs 10.0 DDD/1000 population/day).
This drug utilization survey for obstructive airway disease is conducted between 2009-2010. The data does not differentiate between drug use in asthma and COPD. The estimated prevalence of COPD in Malaysia is 4.7%, which translated into 448,000 affected persons1. It is expected to rise based on the current smoking rates. The prevalence of asthma amongst children aged 13-14 years old is 6.8-12.3%2 whilst the asthma prevalence in adults is 4.5%3.
Similar to 2007-2008, there is a continuous and steady reduction (28.6%) in the use of inhaled selective beta-2-adrenoceptor agonists in 2009-2010 (2.9565 to 2.1300 DDD/1000 population/day). This drop is largely due to a decrease usage of inhaled salbutamol (38.9%) in the public sector.
The use of inhaled short-acting adrenergics in combination with other drugs for obstructive airway diseases (fenoterol/ipratropium, salbutamol/ipratropium) has reduced in 2009-2010 compared to 2007-20084 (0.59 vs 0.74 mean DDD/1000 population/day). Similarly, the use of inhaled long-acting adrenergics in combination with other drugs (ICS/LABA) for obstructive airway diseases (salmeterol/fluticasone, formoterol/budesonide) has reduced in 2009-2010 compared to 2007-20084 (0.56 vs 0.65 mean DDD/1000 population/day). However, we would like to point out that the data in 2009 was lower than expected and seem deviated from the overall trend from 2007 to 2010; hence the 2 year mean DDD for 2007-2008 and 2009-2010 was used respectively.
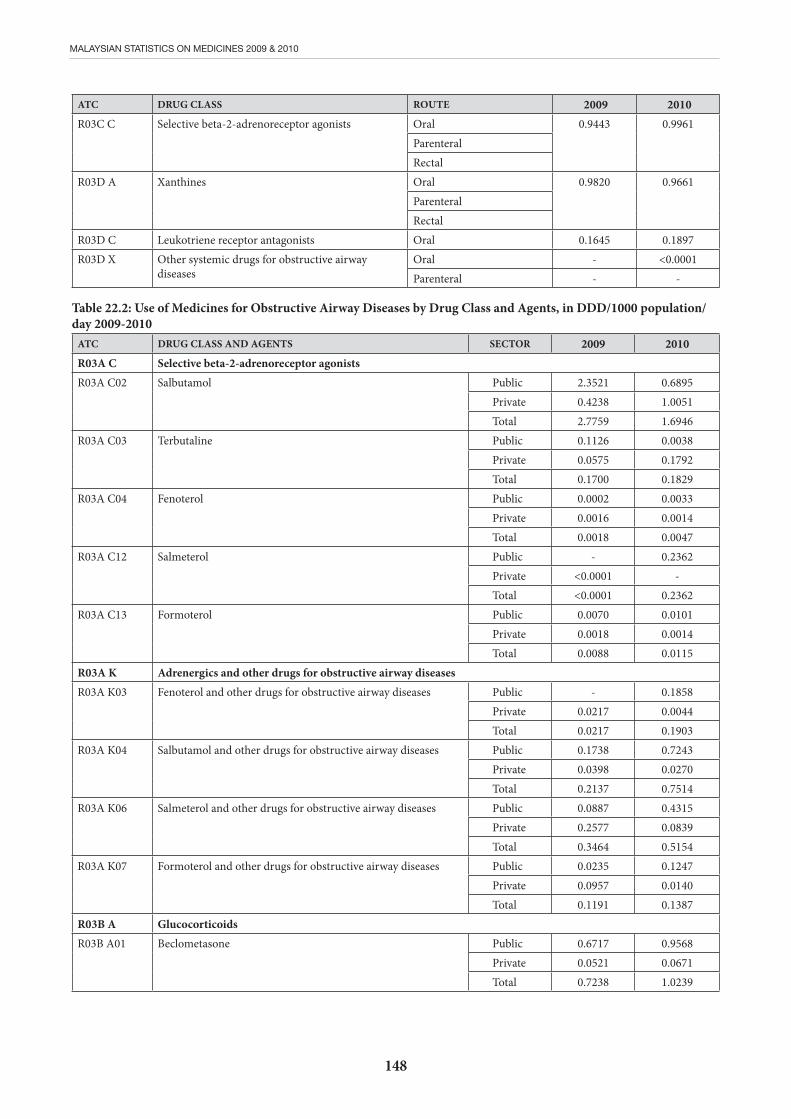
148
MALAYSIAN STATISTICS ON MEDICINES 2009 & 2010
ATC DRUG CLASS ROUTE 2009 2010R03C C
Selective beta-2-adrenoreceptor agonists Oral 0.9443
0.9961
ParenteralRectal
R03D A
Xanthines
Oral 0.9820
0.9661
ParenteralRectal
R03D C Leukotriene receptor antagonists Oral 0.1645 0.1897R03D X Other systemic drugs for obstructive airway
diseasesOral - <0.0001Parenteral - -
Table 22.2: Use of Medicines for Obstructive Airway Diseases by Drug Class and Agents, in DDD/1000 population/day 2009-2010
ATC DRUG CLASS AND AGENTS SECTOR 2009 2010R03A C Selective beta-2-adrenoreceptor agonistsR03A C02
Salbutamol
Public 2.3521 0.6895Private 0.4238 1.0051Total 2.7759 1.6946
R03A C03
Terbutaline
Public 0.1126 0.0038Private 0.0575 0.1792Total 0.1700 0.1829
R03A C04
Fenoterol
Public 0.0002 0.0033Private 0.0016 0.0014Total 0.0018 0.0047
R03A C12
Salmeterol
Public - 0.2362Private <0.0001 -Total <0.0001 0.2362
R03A C13
Formoterol
Public 0.0070 0.0101Private 0.0018 0.0014Total 0.0088 0.0115
R03A K Adrenergics and other drugs for obstructive airway diseasesR03A K03
Fenoterol and other drugs for obstructive airway diseases Public - 0.1858Private 0.0217 0.0044Total 0.0217 0.1903
R03A K04
Salbutamol and other drugs for obstructive airway diseases Public 0.1738 0.7243Private 0.0398 0.0270Total 0.2137 0.7514
R03A K06
Salmeterol and other drugs for obstructive airway diseases Public 0.0887 0.4315Private 0.2577 0.0839Total 0.3464 0.5154
R03A K07
Formoterol and other drugs for obstructive airway diseases Public 0.0235 0.1247Private 0.0957 0.0140Total 0.1191 0.1387
R03B A GlucocorticoidsR03B A01
Beclometasone
Public 0.6717 0.9568Private 0.0521 0.0671Total 0.7238 1.0239
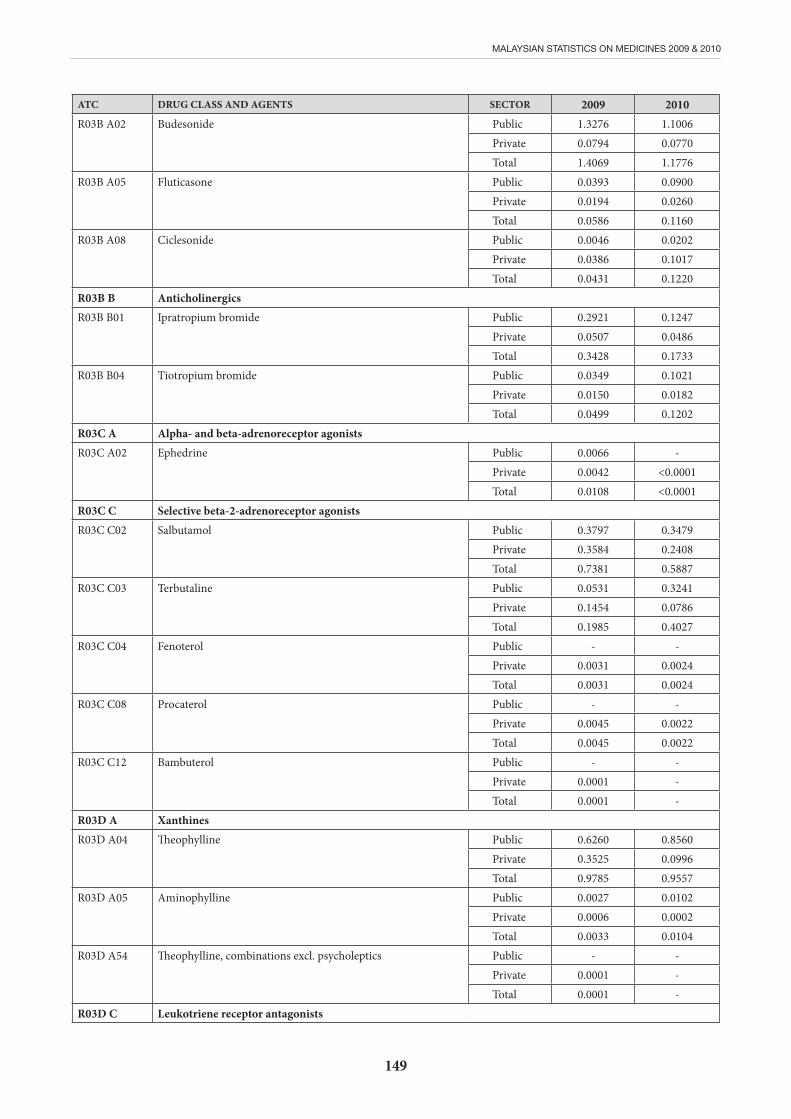
149
MALAYSIAN STATISTICS ON MEDICINES 2009 & 2010
ATC DRUG CLASS AND AGENTS SECTOR 2009 2010R03B A02
Budesonide
Public 1.3276 1.1006Private 0.0794 0.0770Total 1.4069 1.1776
R03B A05
Fluticasone
Public 0.0393 0.0900Private 0.0194 0.0260Total 0.0586 0.1160
R03B A08
Ciclesonide
Public 0.0046 0.0202Private 0.0386 0.1017Total 0.0431 0.1220
R03B B AnticholinergicsR03B B01
Ipratropium bromide
Public 0.2921 0.1247Private 0.0507 0.0486Total 0.3428 0.1733
R03B B04
Tiotropium bromide
Public 0.0349 0.1021Private 0.0150 0.0182Total 0.0499 0.1202
R03C A Alpha- and beta-adrenoreceptor agonistsR03C A02
Ephedrine
Public 0.0066 -Private 0.0042 <0.0001Total 0.0108 <0.0001
R03C C Selective beta-2-adrenoreceptor agonistsR03C C02
Salbutamol
Public 0.3797 0.3479Private 0.3584 0.2408Total 0.7381 0.5887
R03C C03
Terbutaline
Public 0.0531 0.3241Private 0.1454 0.0786Total 0.1985 0.4027
R03C C04
Fenoterol
Public - -Private 0.0031 0.0024Total 0.0031 0.0024
R03C C08
Procaterol
Public - -Private 0.0045 0.0022Total 0.0045 0.0022
R03C C12
Bambuterol
Public - -Private 0.0001 -Total 0.0001 -
R03D A XanthinesR03D A04
Theophylline
Public 0.6260 0.8560Private 0.3525 0.0996Total 0.9785 0.9557
R03D A05
Aminophylline
Public 0.0027 0.0102Private 0.0006 0.0002Total 0.0033 0.0104
R03D A54
Theophylline, combinations excl. psycholeptics
Public - -Private 0.0001 -Total 0.0001 -
R03D C Leukotriene receptor antagonists
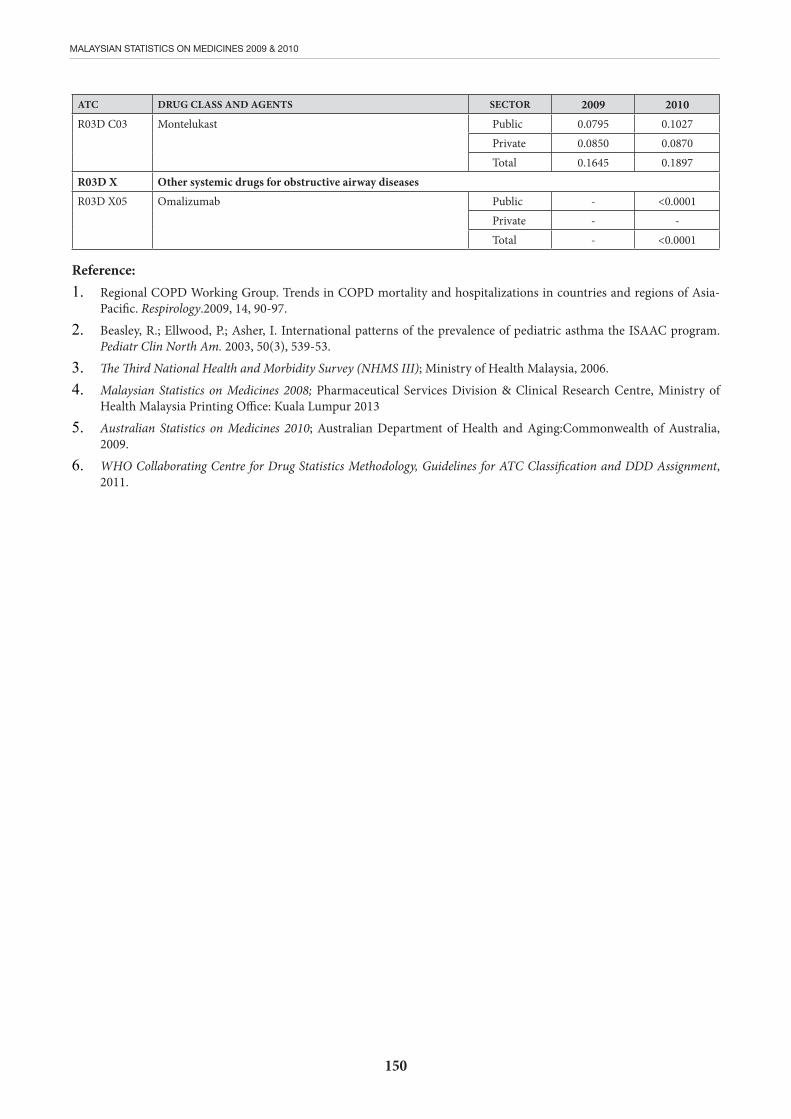
150
MALAYSIAN STATISTICS ON MEDICINES 2009 & 2010
ATC DRUG CLASS AND AGENTS SECTOR 2009 2010R03D C03
Montelukast
Public 0.0795 0.1027Private 0.0850 0.0870Total 0.1645 0.1897
R03D X Other systemic drugs for obstructive airway diseases R03D X05
Omalizumab
Public - <0.0001Private - -Total - <0.0001
Reference:1. Regional COPD Working Group. Trends in COPD mortality and hospitalizations in countries and regions of Asia-
Pacific. Respirology.2009, 14, 90-97.
2. Beasley, R.; Ellwood, P.; Asher, I. International patterns of the prevalence of pediatric asthma the ISAAC program. Pediatr Clin North Am. 2003, 50(3), 539-53.
3. The Third National Health and Morbidity Survey (NHMS III); Ministry of Health Malaysia, 2006.
4. Malaysian Statistics on Medicines 2008; Pharmaceutical Services Division & Clinical Research Centre, Ministry of Health Malaysia Printing Office: Kuala Lumpur 2013
5. Australian Statistics on Medicines 2010; Australian Department of Health and Aging:Commonwealth of Australia, 2009.
6. WHO Collaborating Centre for Drug Statistics Methodology, Guidelines for ATC Classification and DDD Assignment, 2011.

151
MALAYSIAN STATISTICS ON MEDICINES 2009 & 2010
CHAPTER 23: USE OF ANTIHISTAMINES AND NASAL DECONGESTANTSValuyeetham K.A.1, Saraiza A.B.2, Leow W.L.3, Aswani Yanti B.4, Primuharsa Putra S.H.A.5
1. Tuanku Ja’afar Hospital, Seremban, 2. Serdang Hospital, Selangor, 3. Hospital Kuala Lumpur, Kuala Lumpur, 4. AmpangHospital, Selangor, 5. KPJ Seremban Specialist Hospital/KPJ Healthcare University College.
data3 (8.05 DDD/1000 population/day for both years) for mometasone.
The common nasal decongestant used in Malaysia was oxymetazoline. There were no significant changes in the usage of oxymetazoline through 2009 and 2010 in both public and private sectors. However, the usage of oxymetazoline is higher in the private sectors; mainly because its easily available as over-the-counter medication. Our usage of oxymetazoline was higher than the Australian2 data (0.004 and 0.003 DDD/1000 population/day respectively) but much lower than Norwegian3 data (1.85 and 1.65 DDD/1000 population/day respectively).
Antihistamines (R06A) can be divided into several subgroups that are sedative and non-sedative. The most common sedative antihistamines used in Malaysia were diphenhydramine, chlorpheniramine, dexchlorpheniramine and promethazine while the most common non-sedative antihistamines were loratadine, cetirizine, fexofenadine and desloratadine. In general the usage of sedative and non-sedative antihistamines has increased in 2009 and 2010 compared to 20081. In comparison, our usage of antihistamines was higher than Australia2 but lower than Norway3. Among the sedative antihistamines, diphenhydramine (R06AA02) and its’ combination (R06AA52), usage was exceptionally higher than previous years. This can be explained by the high prevalence (29.64 rate per 100 encounter of Upper Respiratory Tract Infection reported in the National Medical Care Survey, 20104
Nasal decongestants and antihistamines are commonly used drugs for allergy and nasal symptoms in otorhinolaryngology clinics in Malaysia. The 2009 and 2010 survey showed usage of nasal preparations was 2.1171 and 3.3519 DDD/population/year respectively, while usage of antihistamines for systemic use was 5.2875 and 4.9504 DDD/population/year respectively.
For nasal preparations (R01), significant increase was shown in daily and yearly usage in 2009 and 2010 as compared to 20081. This may be due to increasing use of pseudoephedrine, combinations (R01BA52) as these preparations are easily available.
Generally,thecommonlyusednasalsteroidsinbothpublic*and private** sectors in 2009 and 2010 are fluticasone, budesonide, mometasone, and beclomethasone. In 2009, the usage of fluticasone was highest followed by mometasone and budesonide. However, in 2010, the usage of budesonide was the highest followed by fluticasone and beclomethasone. This may be due to budesonide nasal spray which has comparable efficacy with other corticosteroid nasal decongestants but can be obtained at lower costs of treatment.
Budesonide usage in 2009 and 2010 was lower than the Australian2 (1.108 and 0.935 DDD/1000 population/day respectively) and Norwegian3 data (3.99 and 3.52 DDD/1000 population/day respectively). The same results were seen when comparing Australian2 (2.352 and 2.353 DDD/1000 population/day respectively) and Norwegian
Footnote:
*publicsectorreferstogovernment-ownedhospitaldanhealthclinics
**privatesectorreferstoprivate-ownedhospitals,generalpractitioners,andretailpharmacies.
Table 23.1: Use of Anti-Histamines and Nasal Decongestants, in DDD/1000 population/day and DDD/population/year 2009-2010
ATC DRUG CLASSDDD/1000 population/day DDD/population/year
2009 2010 2009 2010R01 Nasal preparations 5.8003 9.1834 2.1171 3.3519R06 Antihistamines for systemic use 14.4565 13.5624 5.2875 4.9504
Table 23.2.1: Use of Nasal Decongestants by Drug Class, in DDD/1000 population/day and DDD/population/year 2009-2010
ATC DRUG CLASSDDD/1000 population/day DDD/population/year
2009 2010 2009 2010R01A Decongestants and other nasal preparations for topical use 2.0121 1.5850 0.7344 0.5785R01A A Sympathomimetics, plain 0.3186 0.3145 0.1163 0.1148R01A C Antiallergic agents, excl. corticosteroids 0.0004 0.0001 0.0001 <0.0001
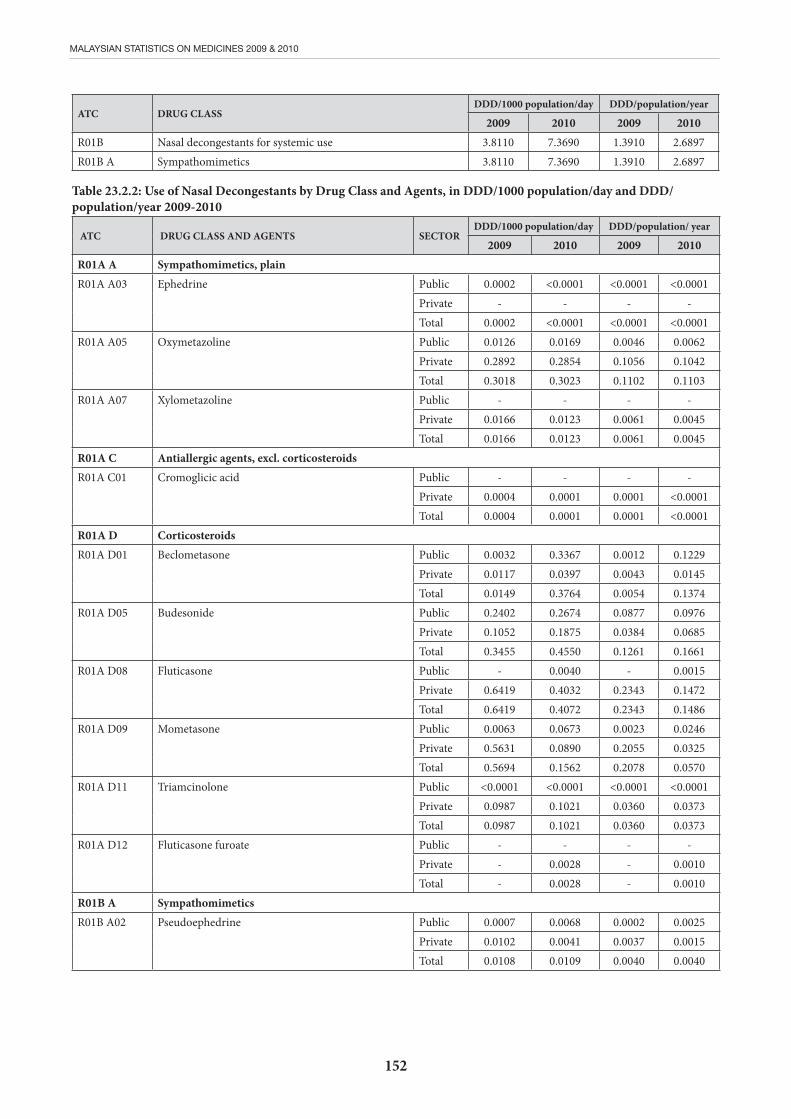
152
MALAYSIAN STATISTICS ON MEDICINES 2009 & 2010
ATC DRUG CLASSDDD/1000 population/day DDD/population/year
2009 2010 2009 2010R01B Nasal decongestants for systemic use 3.8110 7.3690 1.3910 2.6897R01B A Sympathomimetics 3.8110 7.3690 1.3910 2.6897
Table 23.2.2: Use of Nasal Decongestants by Drug Class and Agents, in DDD/1000 population/day and DDD/population/year 2009-2010
ATC DRUG CLASS AND AGENTS SECTORDDD/1000 population/day DDD/population/ year
2009 2010 2009 2010R01A A Sympathomimetics, plainR01A A03 Ephedrine Public 0.0002 <0.0001 <0.0001 <0.0001
Private - - - -Total 0.0002 <0.0001 <0.0001 <0.0001
R01A A05 Oxymetazoline Public 0.0126 0.0169 0.0046 0.0062Private 0.2892 0.2854 0.1056 0.1042Total 0.3018 0.3023 0.1102 0.1103
R01A A07 Xylometazoline Public - - - -Private 0.0166 0.0123 0.0061 0.0045Total 0.0166 0.0123 0.0061 0.0045
R01A C Antiallergic agents, excl. corticosteroidsR01A C01 Cromoglicic acid Public - - - -
Private 0.0004 0.0001 0.0001 <0.0001Total 0.0004 0.0001 0.0001 <0.0001
R01A D CorticosteroidsR01A D01 Beclometasone Public 0.0032 0.3367 0.0012 0.1229
Private 0.0117 0.0397 0.0043 0.0145Total 0.0149 0.3764 0.0054 0.1374
R01A D05 Budesonide Public 0.2402 0.2674 0.0877 0.0976Private 0.1052 0.1875 0.0384 0.0685Total 0.3455 0.4550 0.1261 0.1661
R01A D08 Fluticasone Public - 0.0040 - 0.0015Private 0.6419 0.4032 0.2343 0.1472Total 0.6419 0.4072 0.2343 0.1486
R01A D09 Mometasone Public 0.0063 0.0673 0.0023 0.0246Private 0.5631 0.0890 0.2055 0.0325Total 0.5694 0.1562 0.2078 0.0570
R01A D11 Triamcinolone Public <0.0001 <0.0001 <0.0001 <0.0001Private 0.0987 0.1021 0.0360 0.0373Total 0.0987 0.1021 0.0360 0.0373
R01A D12 Fluticasone furoate Public - - - -Private - 0.0028 - 0.0010Total - 0.0028 - 0.0010
R01B A SympathomimeticsR01B A02 Pseudoephedrine Public 0.0007 0.0068 0.0002 0.0025
Private 0.0102 0.0041 0.0037 0.0015Total 0.0108 0.0109 0.0040 0.0040

153
MALAYSIAN STATISTICS ON MEDICINES 2009 & 2010
ATC DRUG CLASS AND AGENTS SECTORDDD/1000 population/day DDD/population/ year
2009 2010 2009 2010R01B A52 Pseudoephedrine, combinations Public 2.3108 4.4340 0.8435 1.6184
Private 1.4735 2.9215 0.5378 1.0664Total 3.7844 7.3556 1.3813 2.6848
R01B A53 Phenylephrine, combinations Public - - - -Private 0.0158 0.0025 0.0058 0.0009Total 0.0158 0.0025 0.0058 0.0009
Table 23.3.1: Use of Anti-Histamines by Drug Class, in DDD/1000 population/day and DDD/population/year 2009-2010
ATC DRUG CLASSDDD/1000 population/day DDD/population/year
2009 2010 2009 2010R06A Antihistamines for systemic use 14.4565 13.5624 5.2875 4.9504R06A A Aminoalkyl ethers 4.0847 2.7917 1.4909 1.0190R06A B Substituted alkylamines 6.3854 7.8180 2.3306 2.8536R06A D Phenothiazine derivatives 0.5213 0.2888 0.1903 0.1054R06A E Piperazine derivatives 2.3214 2.2908 0.8473 0.8361R06A X Other antihistamines for systemic use 1.1437 0.3731 0.4284 0.1363
Table 23.3.2: Use of Anti-Histamines by Drug Class and Agents, in DDD/1000 population/day and DDD/population/year 2009-2010
ATC DRUG CLASS AND AGENTS SECTORDDD/1000 population/day DDD/population/ year
2009 2010 2009 2010R06A A Aminoalkyl ethers R06A A02
Diphenhydramine Public 0.0046 0.9590 0.0017 0.3500Private 0.1729 0.2112 0.0631 0.0771Total 0.1775 1.1702 0.0648 0.4271
R06A A04
Clemastine Public - - - -Private 0.0116 0.0008 0.0042 0.0003Total 0.0116 0.0008 0.0042 0.0003
R06A A08
Carbinoxamine Public - - - -Private 0.0002 <0.0001 <0.0001 <0.0001Total 0.0002 <0.0001 <0.0001 <0.0001
R06A A52
Diphenhydramine, combinations Public 2.1268 0.0064 0.7763 0.0023Private 1.7686 1.6143 0.6455 0.5892Total 3.8954 1.6207 1.4218 0.5916
R06A B Substituted alkylaminesR06A B01
Brompheniramine Public - - - -Private 0.0984 0.0020 0.0359 0.0007Total 0.0984 0.0020 0.0359 0.0007
R06A B02
Dexchlorpheniramine Public 0.0168 0.3341 0.0061 0.1220Private 0.6313 1.8922 0.2304 0.6907Total 0.6480 2.2263 0.2365 0.8126
R06A B04 Chlorphenamine Public 3.0784 4.3764 1.1236 1.5974Private 2.5554 1.2066 0.9327 0.4404Total 5.6338 5.5830 2.0563 2.0378

154
MALAYSIAN STATISTICS ON MEDICINES 2009 & 2010
ATC DRUG CLASS AND AGENTS SECTORDDD/1000 population/day DDD/population/ year
2009 2010 2009 2010R06A B05
Pheniramine
Public - - - -Private - <0.0001 - <0.0001Total - <0.0001 - <0.0001
R06A B54
Chlorphenamine, combinations Public - - - -Private 0.0053 0.0067 0.0019 0.0024Total 0.0053 0.0067 0.0019 0.0024
R06A D Phenothiazine derivativesR06A D01 Alimemazine Public - - - -
Private <0.0001 <0.0001 <0.0001 <0.0001Total <0.0001 <0.0001 <0.0001 <0.0001
R06A D02 Promethazine Public 0.2575 0.1810 0.0940 0.0661Private 0.1183 0.0870 0.0432 0.0318Total 0.3758 0.2681 0.1372 0.0978
R06A D07 Mequitazine Public - - - -Private 0.0906 0.0091 0.0331 0.0033Total 0.0906 0.0091 0.0331 0.0033
R06A D52 Promethazine, combinations Public - <0.0001 - <0.0001Private 0.0549 0.0116 0.0201 0.0042Total 0.0549 0.0116 0.0201 0.0042
R06A E Piperazine derivativesR06A E01 Buclizine Public - - - -
Private 0.0307 0.0248 0.0112 0.0091Total 0.0307 0.0248 0.0112 0.0091
R06A E05 Meclozine Public - 0.0058 - 0.0021Private 0.0004 0.0017 0.0001 0.0006Total 0.0004 0.0076 0.0001 0.0028
R06A E07 Cetirizine Public 0.1632 0.2284 0.0596 0.0834Private 2.0278 1.3726 0.7401 0.5010Total 2.1910 1.6010 0.7997 0.5843
R06A E09 Levocetirizine Public 0.0032 0.0074 0.0012 0.0027Private 0.0897 0.0662 0.0327 0.0242Total 0.0929 0.0736 0.0339 0.0269
R06A E55 Meclozine, combinations Public 0.0023 0.5437 0.0008 0.1984Private 0.0042 0.0402 0.0015 0.0147Total 0.0064 0.5838 0.0023 0.2131
R06A X Other antihistamines for systemic useR06A X07 Triprolidine Public 0.0004 0.0050 0.0001 0.0018
Private 0.0074 0.0043 0.0027 0.0016Total 0.0078 0.0093 0.0028 0.0034
R06A X09 Azatadine
Public - - - -Private 0.0015 - 0.0005 -Total 0.0015 - 0.0005 -
R06A X13 Loratadine Public <0.0001 <0.0001 <0.0001 <0.0001Private 0.4465 0.0738 0.1630 0.0269Total 0.4466 0.0738 0.1630 0.0270
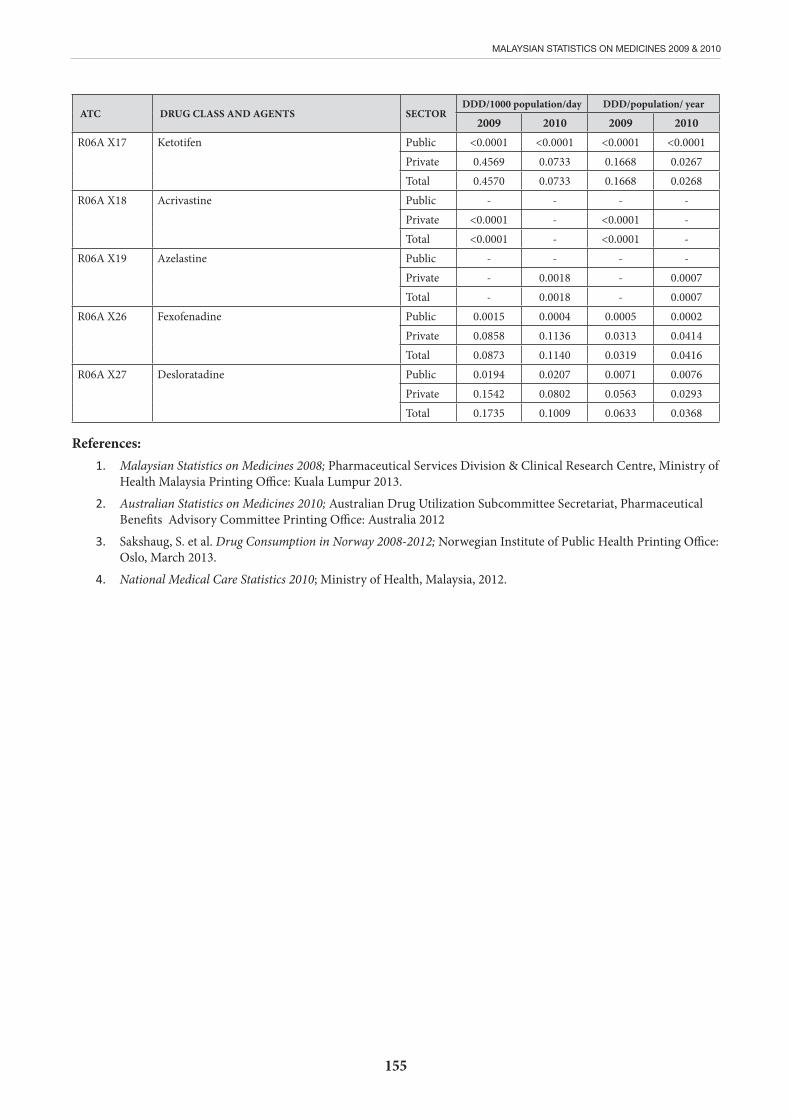
155
MALAYSIAN STATISTICS ON MEDICINES 2009 & 2010
ATC DRUG CLASS AND AGENTS SECTORDDD/1000 population/day DDD/population/ year
2009 2010 2009 2010R06A X17 Ketotifen
Public <0.0001 <0.0001 <0.0001 <0.0001Private 0.4569 0.0733 0.1668 0.0267Total 0.4570 0.0733 0.1668 0.0268
R06A X18 Acrivastine Public - - - -Private <0.0001 - <0.0001 -Total <0.0001 - <0.0001 -
R06A X19 Azelastine Public - - - -Private - 0.0018 - 0.0007Total - 0.0018 - 0.0007
R06A X26 Fexofenadine Public 0.0015 0.0004 0.0005 0.0002Private 0.0858 0.1136 0.0313 0.0414Total 0.0873 0.1140 0.0319 0.0416
R06A X27 Desloratadine
Public 0.0194 0.0207 0.0071 0.0076Private 0.1542 0.0802 0.0563 0.0293Total 0.1735 0.1009 0.0633 0.0368
References:1. Malaysian Statistics on Medicines 2008; Pharmaceutical Services Division & Clinical Research Centre, Ministry of
Health Malaysia Printing Office: Kuala Lumpur 2013.
2. Australian Statistics on Medicines 2010; Australian Drug Utilization Subcommittee Secretariat, Pharmaceutical Benefits Advisory Committee Printing Office: Australia 2012
3. Sakshaug, S. et al. Drug Consumption in Norway 2008-2012; Norwegian Institute of Public Health Printing Office: Oslo, March 2013.
4. National Medical Care Statistics 2010; Ministry of Health, Malaysia, 2012.

156
MALAYSIAN STATISTICS ON MEDICINES 2009 & 2010
CHAPTER 24: USE OF OPHTHALMOLOGICALS Elias H.1, Bethel L.2, Shamala R.3, Manimegahlai S.4, Nur Izzura M.S.5
1. Selayang Hospital, 2. Tuanku Ja’afar Hospital, 3.Sg Buloh Hospital, 4. Raja Permaisuri Bainun Hospital, Ipoh, 5. Malacca Hospital
The National Medicine Use Survey 2009 and 2010 has results on common ophthalmological agents used over a two year period in Malaysia. The source data providers are from the government facilities (100%), university hospitals (100%), army hospitals (100%), private hospitals (23%), general practitioners (7.1%) and retail pharmacies (49%). In view of the fact that many of the private ophthalmology services are non-hospital based, these may not have been captured in the source data sampling.
The groups of agents analysed included anti-infectives, steroids and steroids in combination with anti-infectives, non-steroidal anti-inflammatory agents, anti glaucoma agents, pupil dilating agents, anti-allergens, local anaesthetics and anti-neovascularisation agents.
Drug utilisation statistics are generally expressed as Defined Daily Dose (DDD), the assumed average dose per day of a drug used for its main indication by adults, as the standard unit for reference. However, except for antiglaucoma agents, no DDD have been assigned yet by the WHO for the ophthalmologicals. Thus, for the purpose of this report on the Malaysian statistics on drug utilisation, the total usage in this chapter is expressed in gram or ml or cc, per 1000 population per day.
The most common topical antibiotic used in both public and private sector was chloramphenicol (0.8116g/ml/cc per 1000 population/ day in 2009 and 0.8732g/ml/cc per 1000 population/ day in 2010), followed by gentamicin (0.0726 g/ml/cc per 1000 population/day in 2009 and 0.0511 g/ml/cc per 1000 population/ day in 2010) and fucidic acid (0.0288g/ml/cc per 1000 population/day in 2009 and 0.0180 g/ml/cc per 1000 population/ day in 2010). Usage of chloramphenicol has increased steadily over the years and this is probably due to the expansion of primary care services in the country. It is alarming that there is an increase in the use of combination antibiotics as it may lead to increase in resistance. Most cases of bacterial conjunctivitis can be treated with a single antiobiotic1. In the public sector, there is a two fold increase in the use of moxifloxacin. This may be due to shift in the trend of management of bacterial keratitis towards using a broader spectrum antibiotic in the initial phase and an increased usage in post cataract surgical prophylaxis2,3.
For topical steroids, there is an increasing trend in both the public and private sector. This is partly due to increased number of surgical procedures done in both the public and private sectors for which dexamethasone is the mainstay steroid choice. The use of ketorolac is seeing an increasing trend in both the sectors due to its wider indications such as in the prophylaxis of macular oedema post ocular surgery
particularly in diabetic patients and in laser procedures.
Combination of dexamethasone and antiinfectives showed a reducing pattern in both the sectors because there was some difficulty in procurement of this. Previously this combination was widely used in post ocular surgery. This may explain the increased use of single antibiotic and single steroid prescribed individually for use together in place of combination drugs.
Medical therapy has become the main stay in the management of glaucoma with 13 anti- glaucoma agents available as of 2008. Timolol, a beta blocker is still the most used anti-glaucoma agent (2.9492 DDD/1000 population/ day) in 2009. However, its use is on the decline in 2010 (2.0147 DDD/1000 population/ day). Among the anti-glaucoma agents, latanoprost remains the second commonest used drug in 2009 (0.5675 DDD/1000 population/ day) and 2010 (1.8523 DDD/1000 population/ day). The other commonly used anti-glaucoma agents (in order of usage) were pilocarpine, dorzolamide, betaxolol, brimonidine and bimatoprost. In 2009 and 2010, the fixed combination anti glaucoma agents were still not available in the Ministry of Health (MOH) drug formulary, hence its usage remains the same as of 2008. Clinical practice guidelines on the management of primary open angle glaucoma recommends that topical beta blocker and prostaglandin analogues are the most cost effective IOP lowering agents4. The findings in this survey indicated that prescribing patterns among ophthalmologists seemed to be in accordance to the recommendations.
Among the pupillary dilating agents, tropicamide remains the most frequently used, with an increasing trend in both public and private sector (0.0829 DDD/1000 population/ day in 2009 and 0.0611 DDD/1000 population/ day in 2010). Among the longer acting dilating agents, homatropine (0.1442 DDD/1000 population/ day in 2009 and 0.0154 DDD/1000 population/ day in 2010) is the most common.
Cromoglicic acid remains the commonest anti-allergen followed by olopatadine. The trend is similar to the values in 2008. Among the decongestants, tetrazoline and tetrazoline combinations has the highest usage.
In both sectors, local anaesthetics are used extensively for routine examination of the eye and ocular surgeries. However there is no data for 2009 and 2010. The use of verteporfin and ranibizumab remains similar to 2008.
The range of drugs and its trend used in ophthalmology remains similar over the last two years.

157
MALAYSIAN STATISTICS ON MEDICINES 2009 & 2010
Table 24.1: Use of Ophthalmological by Drug Class and Agents, in DDD/1000 population/day 2009-2010ATC DRUG CLASS AND AGENTS UNIT SECTOR 2009 2010S01A A AntibioticsS01A A01 Chloramphenicol g/ml/cc Public 0.5626 0.6165
Private 0.2490 0.2566Total 0.8116 0.8732
S01A A02 Chlortetracycline g/ml/cc Public 0.0002 0.0002Private - -Total 0.0002 0.0002
S01A A03 Neomycin g/ml/cc Public - -Private 0.0004 -Total 0.0004 -
S01A A09 Tetracycline g/ml/cc Public - -Private 0.0006 -Total 0.0006 -
S01A A10 Natamycin g/ml/cc Public <0.0001 <0.0001Private 0.0002 <0.0001Total 0.0003 <0.0001
S01A A11 Gentamicin g/ml/cc Public 0.0075 0.0089Private 0.0651 0.0422Total 0.0726 0.0511
S01A A12 Tobramycin g/ml/cc Public - <0.0001Private 0.0056 0.0023Total 0.0056 0.0023
S01A A13 Fusidic acid g/ml/cc Public 0.0093 0.0038Private 0.0195 0.0142Total 0.0288 0.0180
S01A A17 Erythromycin g/ml/cc Public - -Private 0.0008 0.0001Total 0.0008 0.0001
S01A A18 Polymyxin B g/ml/cc Public - -Private <0.0001 <0.0001Total <0.0001 <0.0001
S01A A23 Netilmicin g/ml/cc Public - -Private - <0.0001Total - <0.0001
S01A A30 Combinations of different antibiotics g/ml/cc Public 0.0060 0.0111Private 0.0129 0.0172Total 0.0189 0.0283
S01A D AntiviralsS01A D03 Aciclovir g/ml/cc Public 0.0018 0.0006
Private 0.0012 0.0005Total 0.0030 0.0011
S01A D05 Interferon g/ml/cc Public - <0.0001Private - -Total - <0.0001
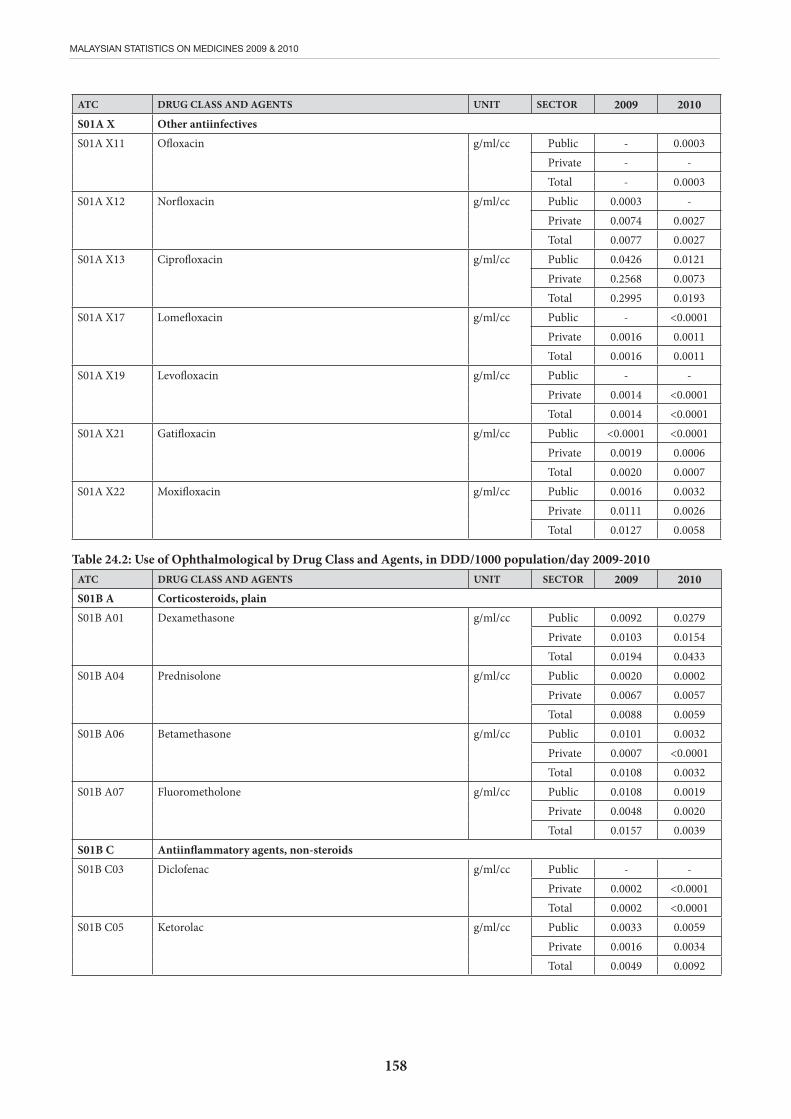
158
MALAYSIAN STATISTICS ON MEDICINES 2009 & 2010
ATC DRUG CLASS AND AGENTS UNIT SECTOR 2009 2010S01A X Other antiinfectivesS01A X11 Ofloxacin g/ml/cc Public - 0.0003
Private - -Total - 0.0003
S01A X12 Norfloxacin g/ml/cc Public 0.0003 -Private 0.0074 0.0027Total 0.0077 0.0027
S01A X13 Ciprofloxacin g/ml/cc Public 0.0426 0.0121Private 0.2568 0.0073Total 0.2995 0.0193
S01A X17 Lomefloxacin g/ml/cc Public - <0.0001Private 0.0016 0.0011Total 0.0016 0.0011
S01A X19 Levofloxacin g/ml/cc Public - -Private 0.0014 <0.0001Total 0.0014 <0.0001
S01A X21 Gatifloxacin g/ml/cc Public <0.0001 <0.0001Private 0.0019 0.0006Total 0.0020 0.0007
S01A X22 Moxifloxacin g/ml/cc Public 0.0016 0.0032Private 0.0111 0.0026Total 0.0127 0.0058
Table 24.2: Use of Ophthalmological by Drug Class and Agents, in DDD/1000 population/day 2009-2010ATC DRUG CLASS AND AGENTS UNIT SECTOR 2009 2010S01B A Corticosteroids, plainS01B A01 Dexamethasone g/ml/cc Public 0.0092 0.0279
Private 0.0103 0.0154Total 0.0194 0.0433
S01B A04 Prednisolone g/ml/cc Public 0.0020 0.0002Private 0.0067 0.0057Total 0.0088 0.0059
S01B A06 Betamethasone g/ml/cc Public 0.0101 0.0032Private 0.0007 <0.0001Total 0.0108 0.0032
S01B A07 Fluorometholone g/ml/cc Public 0.0108 0.0019Private 0.0048 0.0020Total 0.0157 0.0039
S01B C Antiinflammatory agents, non-steroidsS01B C03 Diclofenac g/ml/cc Public - -
Private 0.0002 <0.0001Total 0.0002 <0.0001
S01B C05 Ketorolac g/ml/cc Public 0.0033 0.0059Private 0.0016 0.0034Total 0.0049 0.0092
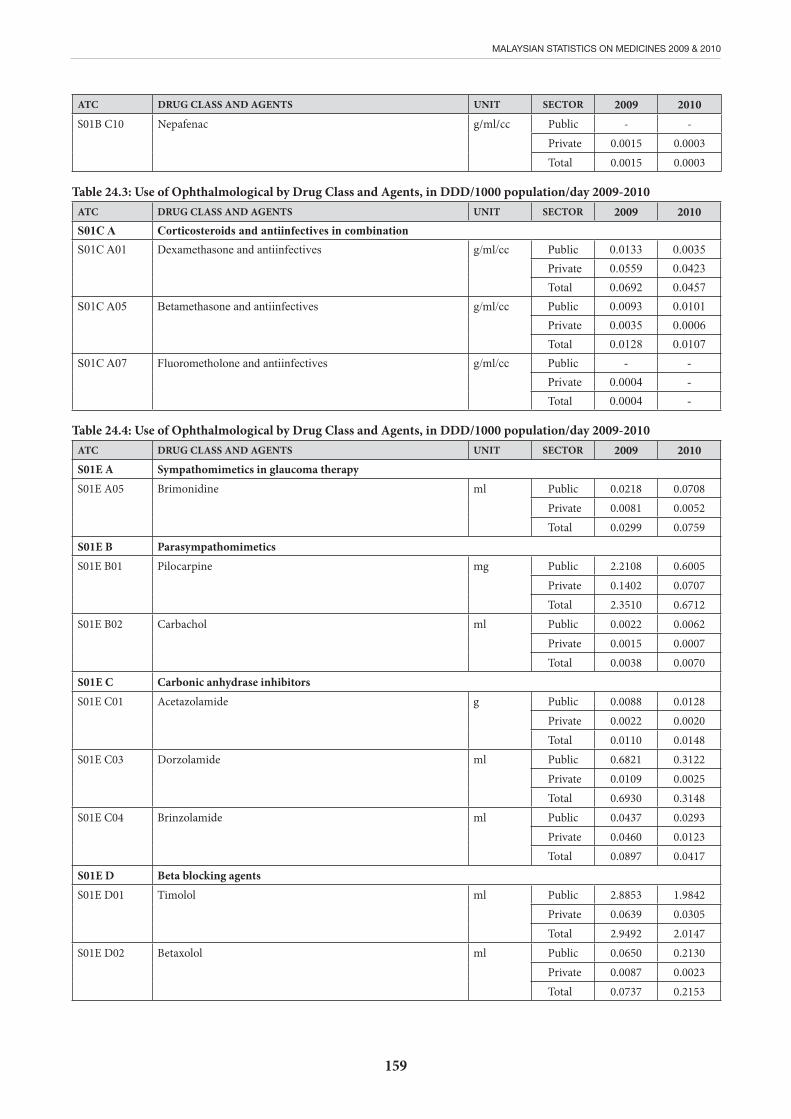
159
MALAYSIAN STATISTICS ON MEDICINES 2009 & 2010
ATC DRUG CLASS AND AGENTS UNIT SECTOR 2009 2010S01B C10 Nepafenac g/ml/cc Public - -
Private 0.0015 0.0003Total 0.0015 0.0003
Table 24.3: Use of Ophthalmological by Drug Class and Agents, in DDD/1000 population/day 2009-2010ATC DRUG CLASS AND AGENTS UNIT SECTOR 2009 2010S01C A Corticosteroids and antiinfectives in combinationS01C A01 Dexamethasone and antiinfectives g/ml/cc Public 0.0133 0.0035
Private 0.0559 0.0423Total 0.0692 0.0457
S01C A05 Betamethasone and antiinfectives g/ml/cc Public 0.0093 0.0101Private 0.0035 0.0006Total 0.0128 0.0107
S01C A07 Fluorometholone and antiinfectives g/ml/cc Public - -Private 0.0004 -Total 0.0004 -
Table 24.4: Use of Ophthalmological by Drug Class and Agents, in DDD/1000 population/day 2009-2010ATC DRUG CLASS AND AGENTS UNIT SECTOR 2009 2010S01E A Sympathomimetics in glaucoma therapyS01E A05 Brimonidine ml Public 0.0218 0.0708
Private 0.0081 0.0052Total 0.0299 0.0759
S01E B ParasympathomimeticsS01E B01 Pilocarpine mg Public 2.2108 0.6005
Private 0.1402 0.0707Total 2.3510 0.6712
S01E B02 Carbachol ml Public 0.0022 0.0062Private 0.0015 0.0007Total 0.0038 0.0070
S01E C Carbonic anhydrase inhibitorsS01E C01 Acetazolamide g Public 0.0088 0.0128
Private 0.0022 0.0020Total 0.0110 0.0148
S01E C03 Dorzolamide ml Public 0.6821 0.3122Private 0.0109 0.0025Total 0.6930 0.3148
S01E C04 Brinzolamide ml Public 0.0437 0.0293Private 0.0460 0.0123Total 0.0897 0.0417
S01E D Beta blocking agentsS01E D01 Timolol ml Public 2.8853 1.9842
Private 0.0639 0.0305Total 2.9492 2.0147
S01E D02 Betaxolol ml Public 0.0650 0.2130Private 0.0087 0.0023Total 0.0737 0.2153
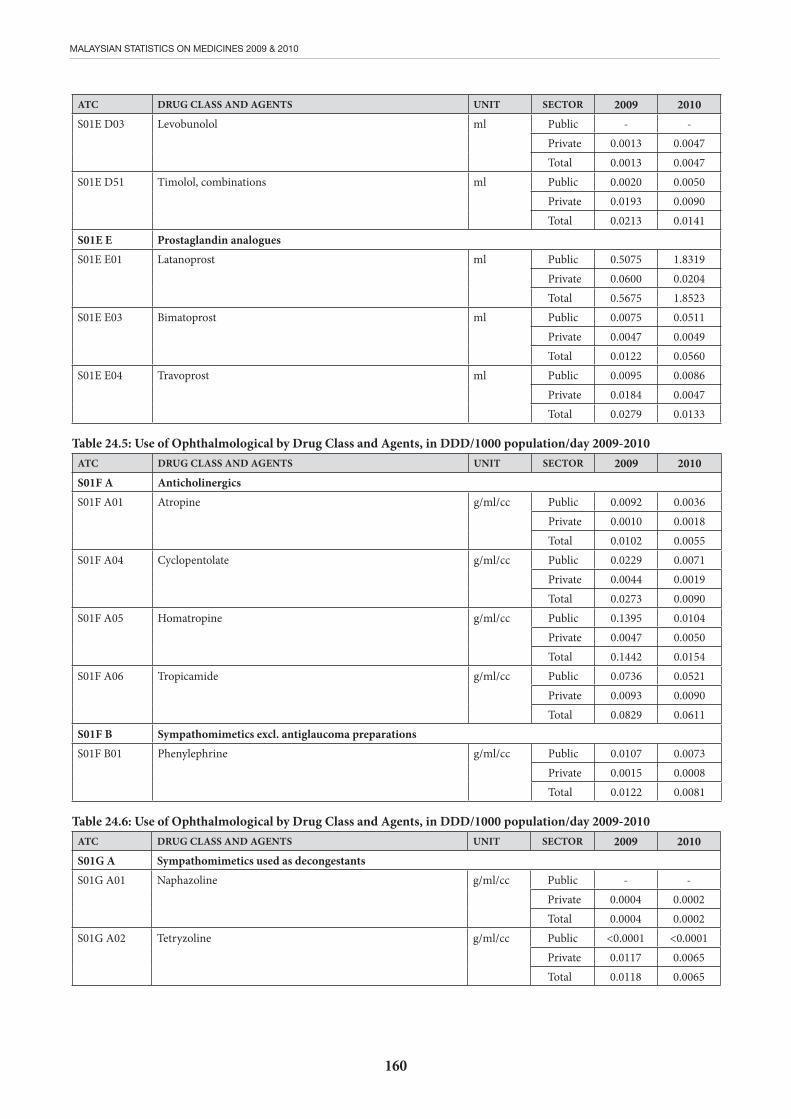
160
MALAYSIAN STATISTICS ON MEDICINES 2009 & 2010
ATC DRUG CLASS AND AGENTS UNIT SECTOR 2009 2010S01E D03 Levobunolol ml Public - -
Private 0.0013 0.0047Total 0.0013 0.0047
S01E D51 Timolol, combinations ml Public 0.0020 0.0050Private 0.0193 0.0090Total 0.0213 0.0141
S01E E Prostaglandin analoguesS01E E01 Latanoprost ml Public 0.5075 1.8319
Private 0.0600 0.0204Total 0.5675 1.8523
S01E E03 Bimatoprost ml Public 0.0075 0.0511Private 0.0047 0.0049Total 0.0122 0.0560
S01E E04 Travoprost ml Public 0.0095 0.0086Private 0.0184 0.0047Total 0.0279 0.0133
Table 24.5: Use of Ophthalmological by Drug Class and Agents, in DDD/1000 population/day 2009-2010ATC DRUG CLASS AND AGENTS UNIT SECTOR 2009 2010S01F A AnticholinergicsS01F A01 Atropine g/ml/cc Public 0.0092 0.0036
Private 0.0010 0.0018Total 0.0102 0.0055
S01F A04 Cyclopentolate g/ml/cc Public 0.0229 0.0071Private 0.0044 0.0019Total 0.0273 0.0090
S01F A05 Homatropine g/ml/cc Public 0.1395 0.0104Private 0.0047 0.0050Total 0.1442 0.0154
S01F A06 Tropicamide g/ml/cc Public 0.0736 0.0521Private 0.0093 0.0090Total 0.0829 0.0611
S01F B Sympathomimetics excl. antiglaucoma preparationsS01F B01 Phenylephrine g/ml/cc Public 0.0107 0.0073
Private 0.0015 0.0008Total 0.0122 0.0081
Table 24.6: Use of Ophthalmological by Drug Class and Agents, in DDD/1000 population/day 2009-2010ATC DRUG CLASS AND AGENTS UNIT SECTOR 2009 2010S01G A Sympathomimetics used as decongestantsS01G A01 Naphazoline g/ml/cc Public - -
Private 0.0004 0.0002Total 0.0004 0.0002
S01G A02 Tetryzoline g/ml/cc Public <0.0001 <0.0001Private 0.0117 0.0065Total 0.0118 0.0065
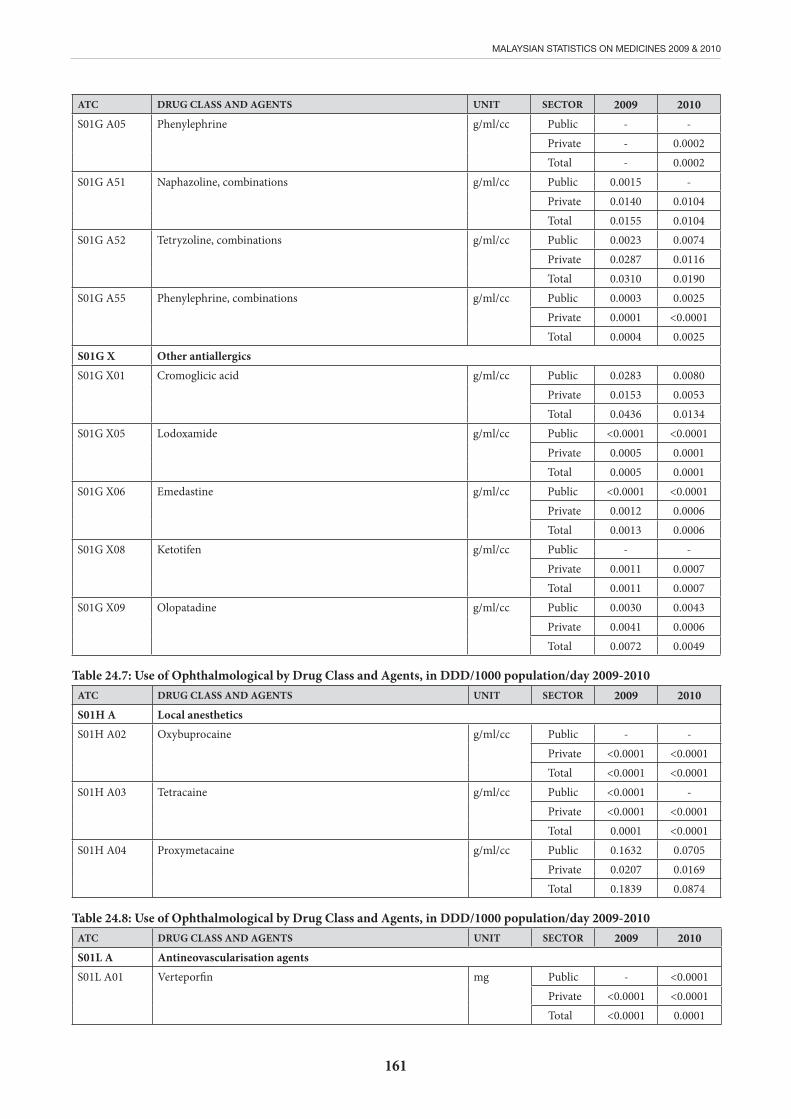
161
MALAYSIAN STATISTICS ON MEDICINES 2009 & 2010
ATC DRUG CLASS AND AGENTS UNIT SECTOR 2009 2010S01G A05 Phenylephrine g/ml/cc Public - -
Private - 0.0002Total - 0.0002
S01G A51 Naphazoline, combinations g/ml/cc Public 0.0015 -Private 0.0140 0.0104Total 0.0155 0.0104
S01G A52 Tetryzoline, combinations g/ml/cc Public 0.0023 0.0074Private 0.0287 0.0116Total 0.0310 0.0190
S01G A55 Phenylephrine, combinations g/ml/cc Public 0.0003 0.0025Private 0.0001 <0.0001Total 0.0004 0.0025
S01G X Other antiallergicsS01G X01 Cromoglicic acid g/ml/cc Public 0.0283 0.0080
Private 0.0153 0.0053Total 0.0436 0.0134
S01G X05 Lodoxamide g/ml/cc Public <0.0001 <0.0001Private 0.0005 0.0001Total 0.0005 0.0001
S01G X06 Emedastine g/ml/cc Public <0.0001 <0.0001Private 0.0012 0.0006Total 0.0013 0.0006
S01G X08 Ketotifen g/ml/cc Public - -Private 0.0011 0.0007Total 0.0011 0.0007
S01G X09 Olopatadine g/ml/cc Public 0.0030 0.0043Private 0.0041 0.0006Total 0.0072 0.0049
Table 24.7: Use of Ophthalmological by Drug Class and Agents, in DDD/1000 population/day 2009-2010ATC DRUG CLASS AND AGENTS UNIT SECTOR 2009 2010S01H A Local anestheticsS01H A02 Oxybuprocaine g/ml/cc Public - -
Private <0.0001 <0.0001Total <0.0001 <0.0001
S01H A03 Tetracaine g/ml/cc Public <0.0001 -Private <0.0001 <0.0001Total 0.0001 <0.0001
S01H A04 Proxymetacaine g/ml/cc Public 0.1632 0.0705Private 0.0207 0.0169Total 0.1839 0.0874
Table 24.8: Use of Ophthalmological by Drug Class and Agents, in DDD/1000 population/day 2009-2010ATC DRUG CLASS AND AGENTS UNIT SECTOR 2009 2010S01L A Antineovascularisation agentsS01L A01 Verteporfin mg Public - <0.0001
Private <0.0001 <0.0001Total <0.0001 0.0001
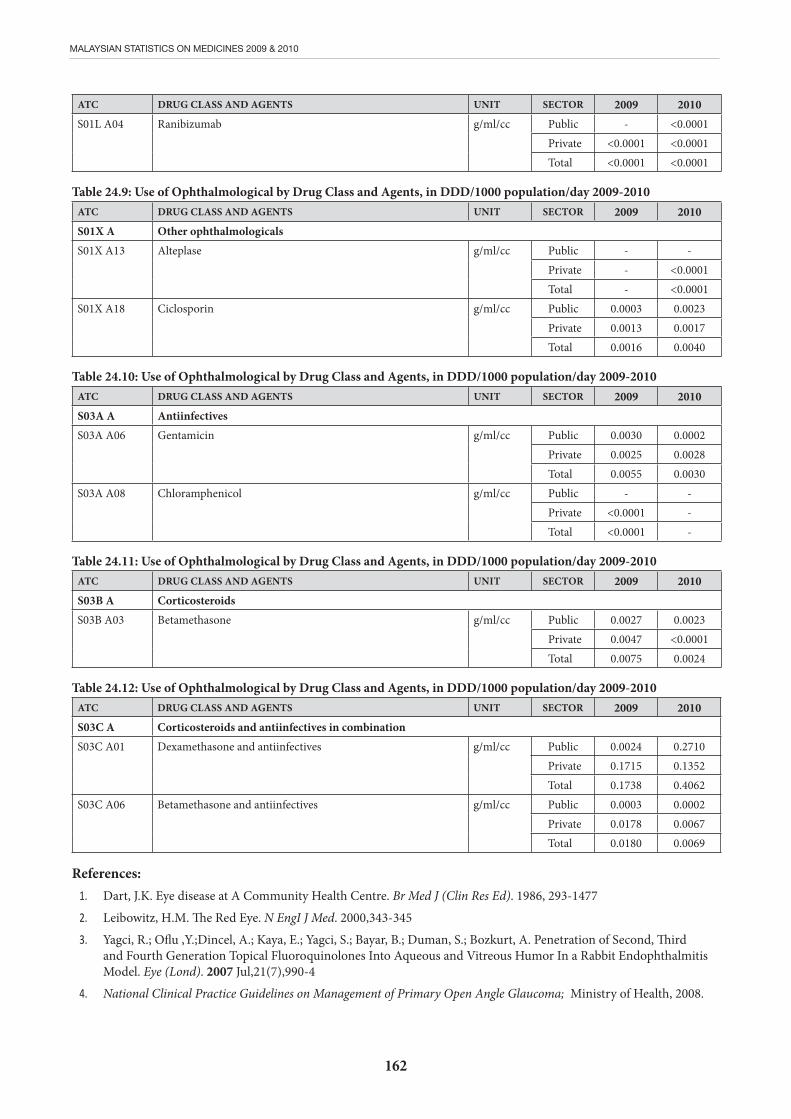
162
MALAYSIAN STATISTICS ON MEDICINES 2009 & 2010
ATC DRUG CLASS AND AGENTS UNIT SECTOR 2009 2010S01L A04 Ranibizumab g/ml/cc Public - <0.0001
Private <0.0001 <0.0001Total <0.0001 <0.0001
Table 24.9: Use of Ophthalmological by Drug Class and Agents, in DDD/1000 population/day 2009-2010ATC DRUG CLASS AND AGENTS UNIT SECTOR 2009 2010S01X A Other ophthalmologicalsS01X A13 Alteplase g/ml/cc Public - -
Private - <0.0001Total - <0.0001
S01X A18 Ciclosporin g/ml/cc Public 0.0003 0.0023Private 0.0013 0.0017Total 0.0016 0.0040
Table 24.10: Use of Ophthalmological by Drug Class and Agents, in DDD/1000 population/day 2009-2010ATC DRUG CLASS AND AGENTS UNIT SECTOR 2009 2010S03A A AntiinfectivesS03A A06 Gentamicin g/ml/cc Public 0.0030 0.0002
Private 0.0025 0.0028Total 0.0055 0.0030
S03A A08 Chloramphenicol g/ml/cc Public - -Private <0.0001 -Total <0.0001 -
Table 24.11: Use of Ophthalmological by Drug Class and Agents, in DDD/1000 population/day 2009-2010ATC DRUG CLASS AND AGENTS UNIT SECTOR 2009 2010S03B A CorticosteroidsS03B A03 Betamethasone g/ml/cc Public 0.0027 0.0023
Private 0.0047 <0.0001Total 0.0075 0.0024
Table 24.12: Use of Ophthalmological by Drug Class and Agents, in DDD/1000 population/day 2009-2010ATC DRUG CLASS AND AGENTS UNIT SECTOR 2009 2010S03C A Corticosteroids and antiinfectives in combinationS03C A01 Dexamethasone and antiinfectives g/ml/cc Public 0.0024 0.2710
Private 0.1715 0.1352Total 0.1738 0.4062
S03C A06 Betamethasone and antiinfectives g/ml/cc Public 0.0003 0.0002Private 0.0178 0.0067Total 0.0180 0.0069
References:1. Dart, J.K. Eye disease at A Community Health Centre. Br Med J (Clin Res Ed). 1986, 293-1477
2. Leibowitz, H.M. The Red Eye. N EngI J Med. 2000,343-345
3. Yagci, R.; Oflu ,Y.;Dincel, A.; Kaya, E.; Yagci, S.; Bayar, B.; Duman, S.; Bozkurt, A. Penetration of Second, Third and Fourth Generation Topical Fluoroquinolones Into Aqueous and Vitreous Humor In a Rabbit Endophthalmitis Model. Eye (Lond). 2007 Jul,21(7),990-4
4. National Clinical Practice Guidelines on Management of Primary Open Angle Glaucoma; Ministry of Health, 2008.

163
MALAYSIAN STATISTICS ON MEDICINES 2009 & 2010
CHAPTER 25: USE OF OTOLOGICALSValuyeetham K.A.1, Saraiza A.B.2, Leow W.L. 3, Aswani Yanti B.4, Primuharsa Putra S.H.A.5
1. Tuanku Ja’afar Hospital, Seremban, 2. Serdang Hospital,Selangor, 3. Hospital Kuala Lumpur, Kuala Lumpur, 4. Ampang Hospital, Selangor, 5. KPJ Seremban Specialist Hospital/KPJ Healthcare University College
Drug utilisation statistics are generally expressed as Defined Daily Dose (DDD), the assumed average dose per day of a drug used for its main indication by adult, as standard unit for reference1. However, no DDD have been assigned yet by WHO for otologicals. Thus, for the purpose of this chapter report, the total usage for otological drugs is expressed in gram or ml or cc, per 1000 population, per day, irrespective of the strength of the preparations.
Otological preparations used in Malaysia are classified into local antiinfectives ear drops, local corticosteroid ear drops and combination of antiinfectives and corticosteroid ear drops. There are two types of otological drugs that are mainly used, corticosteroid and non-corticosteroid
antiinfective preparations. The most widely used antiinfective is chloramphenicol (S02AA01) which is easily available in peripheral government clinics and private general practitioners. The overall usage of chloramphenicol has increased from 20082 to 2010. Other drugs such as gentamicin (S02AA14), and antiinfectives, combination (S02AA30) are less commonly used. The usage of newer generation antiinfective ear drops such as ofloxacin shows an increasing trend.
Generally, there is an increasing trend in the usage of otological corticosteroid in combination with antiinfectives. In comparison, our usage trend was comparable to Australian data3.
Table 25.1: Use of Otologicals by Drug Class and Agents, in DDD/1000 population/day 2009-2010ATC DRUG CLASS AND AGENTS UNIT SECTOR 2009 2010S02A A AntiinfectivesS02A A01
Chloramphenicol g/ml/cc
Public 0.1290 0.1479Private 0.0344 0.0572Total 0.1634 0.2050
S02A A03
Boric acid g/ml/cc
Public - -Private - 0.0004Total - 0.0004
S02A A14
Gentamicin
g/ml/cc
Public - -Private 0.0004 -Total 0.0004 -
S02A A16
Ofloxacin
g/ml/cc
Public 0.0064 0.0075Private 0.2542 0.0052Total 0.2606 0.0127
S02A A30
Antiinfectives, combinations
g/ml/cc Public - -Private 0.0086 0.0031Total 0.0086 0.0031
Table 25.2: Use of Otologicals by Drug Class and Agents, in DDD/1000 population/day 2009-2010ATC DRUG CLASS AND AGENTS UNIT SECTOR 2009 2010S02C A Corticosteroids and antiinfectives in combination S02C A03
Hydrocortisone and antiinfectives
g/ml/cc
Public 0.0019 0.0001Private 0.0065 0.0137Total 0.0084 0.0139
S02C A04
Triamcinolone and antiinfectives g/ml/cc Public 0.0009 -Private 0.0002 -Total 0.0012 -
S02C A06
Dexamethasone and antiinfectives
g/ml/cc
Public 0.0359 <0.0001Private <0.0001 0.0009Total 0.0360 0.0009
164
MALAYSIAN STATISTICS ON MEDICINES 2009 & 2010
References:
1. Guidelines for ATC Classification and DDD Assignment 16th edition; WHO Collaborating Centre for Drug Statistics Methodology, Oslo, 2012.
2. Malaysian Statistics On Medicines 2008; Pharmaceutical Services Division & Clinical Research Centre, Ministry of Health, Malaysia, April 2013.
3. Australian Statistics on Medicines 2010; Commonwealth of Australia, 2012.

165
MALAYSIAN STATISTICS ON MEDICINES 2009 & 2010
CHAPTER 26: USE OF DRUGS FOR COUGH AND COLDTan K.K.1, Primuharsa Putra S.H.A.2, Ho B.K.3, Husni H.4,Chan P.L.5, Norazida A.R.6, Saraiza A.B.7
1. Hospital Tuanku Ja’afar, Seremban 2. KPJ Seremban Specialist Hospital/KPJ Healthcare University College 3. Klinik Kesihatan Bandar Botanik, Klang 4. Klinik Kesihatan Putrajaya 5. Healthcare Statistics Unit, Clinical Research Centre 6. Pharmaceutical Services Division 7. Hospital Serdang, Selangor.
Upper respiratory tract infection (URTI) is one of the leading causes of medical consultations in primary care. The National Medical Care Survey 2010 reported that the prevalence of URTI was 29.64% in all age groups1. Earlier data from the National Health and Morbidity Survey 2006 showed that acute respiratory illness (ARI) affected daily activities of 30.8% of the population with 60.6% of those having ARI sought treatment for the illness. Common cold was the commonest illness reported among those with ARI (16.9%)2.
Cough and cold medicines are commonly used to treat upper respiratory tract symptoms in children and adults. These medicines do not cure the infection, but aim to reduce symptoms such as runny nose and cough. Drugs commonly used for symptomatic relief of URTI include antihistamines, nasal decongestants, cough suppressants, expectorants and mucolytics, in single or multiple-ingredients preparations.
Cough and cold combination products reported in this chapter has been coded according to the standard rules for ATC coding based on WHO guidelines, as shown in Figure 26.1. There is no specific defined daily dose (DDD) assigned by WHO for combinations of cough and cold preparations, though it does recommend that fixed DDDs based on the product’s recommended dosage to be assigned3. For the purpose of comparing usage between the preparations, estimation of the DDDs were done using the standard dose for the main indication in adults, based on average dosage regimen of three times daily. For this report, the DDD adopted for combination of cough and cold preparations are 30ml (oral liquid formulation) and 6 tablets (tablets/capsules/caplets).
Drugs used for cough and cold were categorised by drug class and agents. Overall, systemic antihistamines (R06A) were the most commonly used in year 2009 and 2010 (Table 26.1.1). This was followed by systemic nasal decongestants (R01B) and cough suppressants excluding combinations with expectorants (R05D). Of these main drug classes, total utilisation of systemic nasal decongestants (R01B) and expectorants combinations (R05C) increased from 2009 to 2010, but the rest showed decreasing trend in total utilisation.
The usage of pseudoephedrine combinations (R01BA52) was 1.3813 DDD/population/year in 2009, the highest in its class of systemic nasal decongestants (Table 26.2.1). The number increased up to two-fold in 2010, showing increased in utilisation of this agent. Their usage was also slightly higher in the public sector. If we compared the 2010 data, the consumption of pseudoephedrine combinations was much lower in Finland (2.50 DDD/1000 population/
day) compared to Malaysia (7.36 DDD/1000 population/day)4. There was not much difference in the usage of pseudoephedrine (R01BA02) as it remains low. On the other hand, phenylephrine combinations (R01BA53) were only used in private sector.
As for cough suppressants, most of the products were used in private sectors only, while public sector recorded very minimal usage of dextromethorphan (R05DA09), cough suppressants combinations (R05DA20), and cloperastine (R05DB21). Most of the cough suppressant products were not easily available in public sector especially in the primary care clinics and some were not included in national drug formulary, which led to low utilisation compared to private sector.
As shown in Table 26.1.1, overall utilisation of systemic antihistamines decreased by 6.4% from 2009 to 2010. Chlorpheniramine was the most used systemic antihistamine in 2009, but its utilisation decreased by 0.9% in 2010 (Table 26.2.5). By comparison, dexchlorpheniramine was the second most used drug in 2009 but their utilisation showed little change and decreased an increment of 243% in 2010. Diphenhydramine combination (R06AA52) was the third commonly used drugs in both years. Among the non-sedating antihistamines, cetirizine and loratadine reported highest utilisation. Comparison between sectors showed that non-sedating antihistamines were used more frequently in private sector (Table 26.2.5). Nevertheless, it is important to note that usage of systemic antihistamines in this report also include their use for other indications. Hence this does not reflect the usage for systemic antihistamines for treatment of cough and cold alone.
Several combination products were presented in the table included in this chapter. Among these combination preparations, pseudoephedrine combinations (R01BA52) was the most used, followed by diphenhydramine combinations and promethazine combinations, the latter being mostly used in the private sector.
In conclusion, cough and cold preparations are widely used in Malaysia for symptomatic relief. Most of the drugs showed a decreasing trend in their usage, especially systemic antihistamines. This may be related to increasing awareness towards safety profile of this agent, which discourage the prescribing of antihistamines especially for children below two years. While the data presented in this chapter represented majority of the drugs used for cough and cold, the usage reported was based partially on procurement data which may not accurately reflect total consumption pattern in Malaysia.

166
MALAYSIAN STATISTICS ON MEDICINES 2009 & 2010
Figure 26.1: Guide for ATC coding of cough and cold combination preparations
Table 26.1.1: Use of Cough and Cold Preparations by Drug Class, in DDD/1000 population/day and DDD/population/year 2009-2010
ATC DRUG CLASSDDD/1000 population/day DDD/population/year
2009 2010 2009 2010R01B Nasal decongestants for systemic use 3.8110 7.3690 1.3910 2.6897R03D Other systemic drugs for obstructive airway diseases 1.3550 1.2322 <0.0001 -R05C Expectorants, excl. combinations with cough suppressants 0.1196 0.6672 0.0199 0.0188R05D Cough suppressants, excl. combinations with expectorants 1.0568 0.7413 0.3857 0.2706R05F Cough suppressants and expectorants, combinations 0.0558 0.0177 0.0204 0.0065R06A Antihistamines for systemic use 14.4866 13.5625 5.2847 4.9470
Table 26.2.1: Use of Cough and Cold Preparations by Drug Class, in DDD/1000 population/day and DDD/population/year 2009-2010
ATC DRUG CLASS AND AGENTS SECTOR DDDDDD/1000 population/day DDD/population/year
2009 2010 2009 2010R01B Nasal decongestants for systemic useR01B A SympathomimeticsR01B A02 Pseudoephedrine Public 0.24g 0.0007 0.0068 0.0002 0.0025
Private 0.0102 0.0041 0.0037 0.0015Total 0.0108 0.0109 0.0040 0.0040
R01B A52 Pseudoephedrine, combinations Public 0.24g 2.3108 4.4340 0.8435 1.6184Private 1.4735 2.9215 0.5378 1.0664Total 3.7844 7.3556 1.3813 2.6848
R01B A53 Phenylephrine, combinations Public 6tablet/30ml - - - -Private 0.0158 0.0025 0.0058 0.0009Total 0.0158 0.0025 0.0058 0.0009

167
MALAYSIAN STATISTICS ON MEDICINES 2009 & 2010
Table 26.2.2: Use of Cough and Cold Preparations by Drug Class, in DDD/1000 population/day and DDD/population/year 2009-2010
ATC DRUG CLASS AND AGENTS SECTOR DDDDDD/1000 population/day DDD/population/year
2009 2010 2009 2010R05C Expectorants, excl. combinations with cough suppressantsR05C A ExpectorantsR05C A10 Combinations Public 30ml - - - -
Private 0.0406 0.0415 0.0148 0.0151Total 0.0406 0.0415 0.0148 0.0151
R05C B MucolyticsR05C B10 Combinations Public 30ml - - - -
Private 0.0139 0.0100 0.0051 0.0036Total 0.0139 0.0100 0.0051 0.0036
Table 26.2.3: Use of Cough and Cold Preparations by Drug Class, in DDD/1000 population/day and DDD/population/year 2009-2010
ATC DRUG CLASS AND AGENTS SECTOR DDDDDD/1000 population/day DDD/population/year
2009 2010 2009 2010R05D Cough suppressants, excl. combinations with expectorantsR05D A Opium alkaloids and derivativesR05D A04 Codeine Public 0.1g - - - -
Private 0.0015 0.0056 0.0005 0.0021Total 0.0015 0.0056 0.0005 0.0021
R05D A08 Pholcodine Public 50mg - - - -Private 0.0571 0.0826 0.0208 0.0302Total 0.0571 0.0826 0.0208 0.0302
R05D A09 Dextromethorphan Public 90mg 0.0007 - 0.0002 -Private 0.5938 0.2248 0.2167 0.0820Total 0.5944 0.2248 0.217 0.0820
R05D A20 Combinations, cough suppressants opioid alkaloids and derivatives
Public 6 tablet/ 30ml
<0.0001 <0.0001 <0.0001 <0.0001Private 0.3356 0.3763 0.1225 0.1373Total 0.3356 0.3763 0.1225 0.1373
R05D B Other cough suppressantsR05D B21 Cloperastine Public 60mg - 0.0008 - 0.0003
Private 0.0682 0.0512 0.0249 0.0187Total 0.0682 0.0520 0.0249 0.0190
Table 26.2.4: Use of Cough and Cold Preparations by Drug Class, in DDD/1000 population/day and DDD/population/year 2009-2010
ATC DRUG CLASS AND AGENTS SECTOR DDDDDD/1000 population/day DDD/population/year
2009 2010 2009 2010R05F Cough suppressants and expectorants, combinationsR05F A Opium derivatives and expectorantsR05F A01 Opium derivatives and mucolytics Public 30ml - - - -
Private 0.0442 0.0106 0.0161 0.0039Total 0.0442 0.0106 0.0161 0.0039
R05F A02 Opium derivatives and expectorants
Public 6 tablet/
30ml
- - - -Private 0.0116 0.0072 0.0042 0.0026Total 0.0116 0.0072 0.0042 0.0026
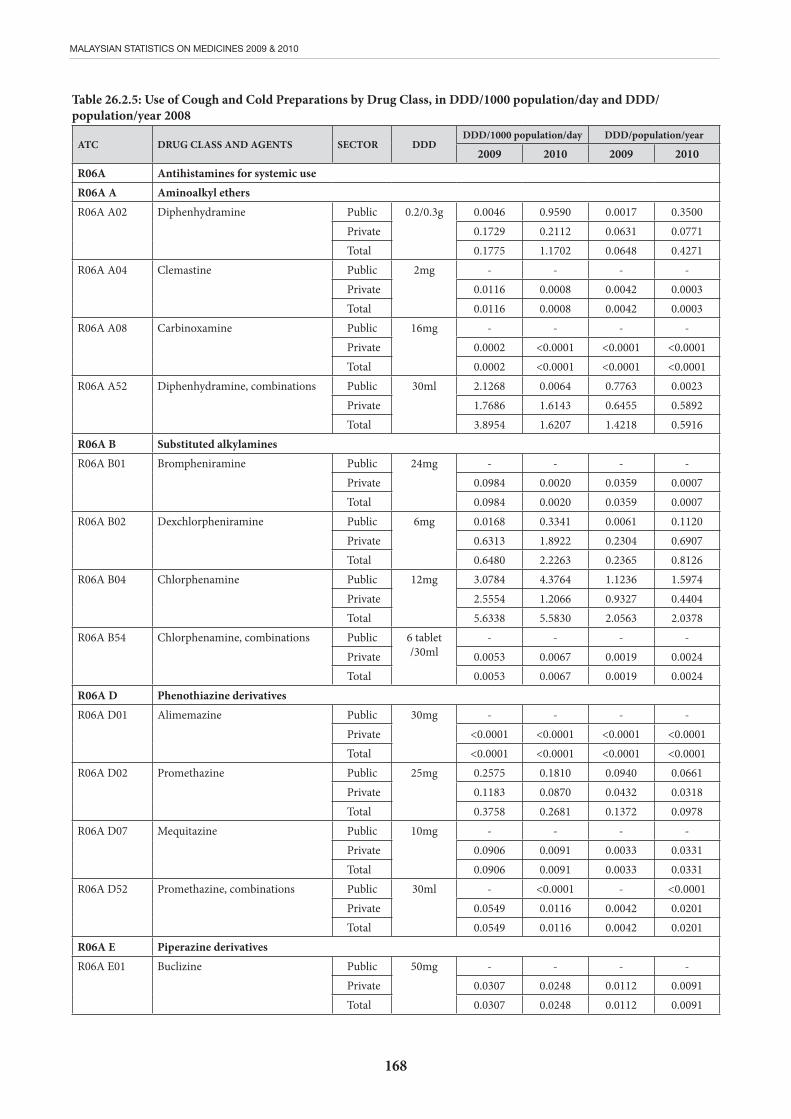
168
MALAYSIAN STATISTICS ON MEDICINES 2009 & 2010
Table 26.2.5: Use of Cough and Cold Preparations by Drug Class, in DDD/1000 population/day and DDD/population/year 2008
ATC DRUG CLASS AND AGENTS SECTOR DDDDDD/1000 population/day DDD/population/year
2009 2010 2009 2010R06A Antihistamines for systemic useR06A A Aminoalkyl ethersR06A A02 Diphenhydramine Public 0.2/0.3g 0.0046 0.9590 0.0017 0.3500
Private 0.1729 0.2112 0.0631 0.0771Total 0.1775 1.1702 0.0648 0.4271
R06A A04 Clemastine Public 2mg - - - -Private 0.0116 0.0008 0.0042 0.0003Total 0.0116 0.0008 0.0042 0.0003
R06A A08 Carbinoxamine Public 16mg - - - -Private 0.0002 <0.0001 <0.0001 <0.0001Total 0.0002 <0.0001 <0.0001 <0.0001
R06A A52 Diphenhydramine, combinations Public 30ml 2.1268 0.0064 0.7763 0.0023Private 1.7686 1.6143 0.6455 0.5892Total 3.8954 1.6207 1.4218 0.5916
R06A B Substituted alkylaminesR06A B01 Brompheniramine Public 24mg - - - -
Private 0.0984 0.0020 0.0359 0.0007Total 0.0984 0.0020 0.0359 0.0007
R06A B02 Dexchlorpheniramine Public 6mg 0.0168 0.3341 0.0061 0.1120Private 0.6313 1.8922 0.2304 0.6907Total 0.6480 2.2263 0.2365 0.8126
R06A B04 Chlorphenamine Public 12mg 3.0784 4.3764 1.1236 1.5974Private 2.5554 1.2066 0.9327 0.4404Total 5.6338 5.5830 2.0563 2.0378
R06A B54 Chlorphenamine, combinations Public 6 tablet /30ml
- - - -Private 0.0053 0.0067 0.0019 0.0024Total 0.0053 0.0067 0.0019 0.0024
R06A D Phenothiazine derivativesR06A D01 Alimemazine Public 30mg - - - -
Private <0.0001 <0.0001 <0.0001 <0.0001Total <0.0001 <0.0001 <0.0001 <0.0001
R06A D02 Promethazine Public 25mg 0.2575 0.1810 0.0940 0.0661Private 0.1183 0.0870 0.0432 0.0318Total 0.3758 0.2681 0.1372 0.0978
R06A D07 Mequitazine Public 10mg - - - -Private 0.0906 0.0091 0.0033 0.0331Total 0.0906 0.0091 0.0033 0.0331
R06A D52 Promethazine, combinations Public 30ml - <0.0001 - <0.0001Private 0.0549 0.0116 0.0042 0.0201Total 0.0549 0.0116 0.0042 0.0201
R06A E Piperazine derivativesR06A E01 Buclizine Public 50mg - - - -
Private 0.0307 0.0248 0.0112 0.0091Total 0.0307 0.0248 0.0112 0.0091
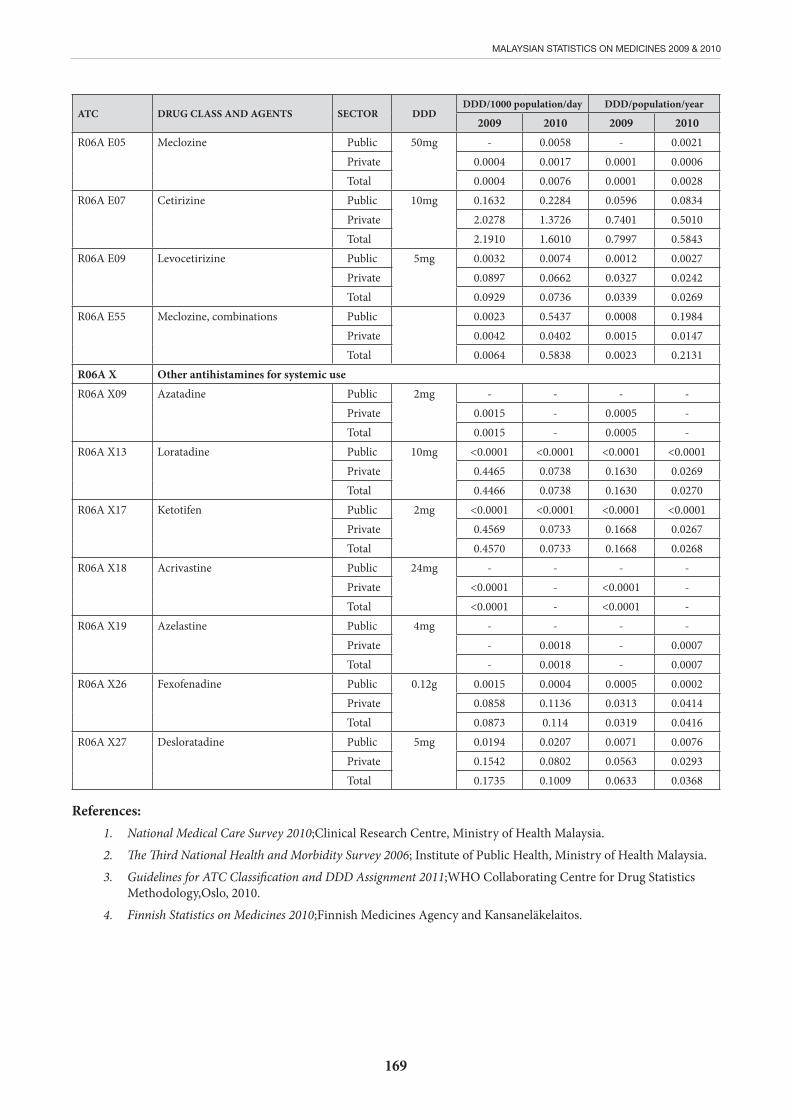
169
MALAYSIAN STATISTICS ON MEDICINES 2009 & 2010
ATC DRUG CLASS AND AGENTS SECTOR DDDDDD/1000 population/day DDD/population/year
2009 2010 2009 2010R06A E05 Meclozine Public 50mg - 0.0058 - 0.0021
Private 0.0004 0.0017 0.0001 0.0006Total 0.0004 0.0076 0.0001 0.0028
R06A E07 Cetirizine Public 10mg 0.1632 0.2284 0.0596 0.0834Private 2.0278 1.3726 0.7401 0.5010Total 2.1910 1.6010 0.7997 0.5843
R06A E09 Levocetirizine Public 5mg 0.0032 0.0074 0.0012 0.0027Private 0.0897 0.0662 0.0327 0.0242Total 0.0929 0.0736 0.0339 0.0269
R06A E55 Meclozine, combinations Public 0.0023 0.5437 0.0008 0.1984Private 0.0042 0.0402 0.0015 0.0147Total 0.0064 0.5838 0.0023 0.2131
R06A X Other antihistamines for systemic useR06A X09 Azatadine Public 2mg - - - -
Private 0.0015 - 0.0005 -Total 0.0015 - 0.0005 -
R06A X13 Loratadine Public 10mg <0.0001 <0.0001 <0.0001 <0.0001Private 0.4465 0.0738 0.1630 0.0269Total 0.4466 0.0738 0.1630 0.0270
R06A X17 Ketotifen Public 2mg <0.0001 <0.0001 <0.0001 <0.0001Private 0.4569 0.0733 0.1668 0.0267Total 0.4570 0.0733 0.1668 0.0268
R06A X18 Acrivastine Public 24mg - - - -Private <0.0001 - <0.0001 -Total <0.0001 - <0.0001 -
R06A X19 Azelastine Public 4mg - - - -Private - 0.0018 - 0.0007Total - 0.0018 - 0.0007
R06A X26 Fexofenadine Public 0.12g 0.0015 0.0004 0.0005 0.0002Private 0.0858 0.1136 0.0313 0.0414Total 0.0873 0.114 0.0319 0.0416
R06A X27 Desloratadine Public 5mg 0.0194 0.0207 0.0071 0.0076Private 0.1542 0.0802 0.0563 0.0293Total 0.1735 0.1009 0.0633 0.0368
References:1. National Medical Care Survey 2010;Clinical Research Centre, Ministry of Health Malaysia.
2. The Third National Health and Morbidity Survey 2006; Institute of Public Health, Ministry of Health Malaysia.
3. Guidelines for ATC Classification and DDD Assignment 2011;WHO Collaborating Centre for Drug Statistics Methodology,Oslo, 2010.
4. Finnish Statistics on Medicines 2010;Finnish Medicines Agency and Kansaneläkelaitos.
170
MALAYSIAN STATISTICS ON MEDICINES 2009 & 2010
CHAPTER 27: USE OF VACCINESTan K.K.1, Rohani J.2, Nor Saleha I.T.2, Saidatul Norbaya B.3, Najwa A.H.3, Nik Nor Aklima N.O.4
1. Tuanku Ja’afar Hospital, Seremban 2. Diseases Control Division, Ministry of Health 3. Family Health Development Division, Ministry of Health, 4. Clinical Research Centre, Ministry of Health.
Control of infectious diseases through vaccination is an important strategy in achieving MDG4 goals of reducing the under-five mortality by two-third in 2015. New vaccines have contributed to significant reduction in morbidity and mortality worldwide1. Understanding the epidemiology of infectious disease in local setting can help to identify and prioritise areas of immunisation needs. Knowing the consumption patterns of vaccines in the country can identify wastage and contribute to immunization planning and cost saving. Furthermore, knowledge of private sector vaccine consumption can contribute to understanding the impact of new vaccines that have not been introduced in the public sector, such as pneumococcal vaccination for preventing invasive pneumococcal disease (IPD). The use of new formulated vaccines with less adverse events has contributed to increase acceptability and compliance by children and parents.
This report served to indicate the procurement and consumption trend of vaccines in the country in year 2008 until 2010. For the purpose of this report, trend of vaccine usage was used rather than DDD (number of vaccine doses for complete vaccination for the defined population). An estimated coverage could be calculated based on number of vaccine consumed for a course per birth cohort with an estimated birth cohort each year about 500,000. For example, DTaP-IPV//Hib vaccination (J07C A06) consists of 4 doses which represent a complete course for children below 2 years, while a course of MMR vaccination (J07B D52) consists of 2 doses indicated for children aged 1 and 7 years old. The population is obtained from Department of Statistics Malaysia2.
Overall, the trend of viral vaccines consumptions was more as compared to bacterial vaccines or combined bacterial-viral vaccines. Hepatitis B vaccines, Human papillomavirus (HPV), measles as well as measles-mumps-rubella (MMR) vaccines were the most used. Hepatitis B usage increased in year 2009 onwards because of change in policy. The 3rd dose which was given with combined DTP-HBV//Hib vaccine to children aged 5 months was changed to hepatitis B monovalent, given at 6 months. There was an increase usage of hepatitis B vaccines adult dose in year 2010. It was most probably due to awareness campaign on hepatitis B vaccination campaign following a nationwide study on seroprevalence of hepatitis B in 2009.
In year 2010, HPV vaccine was introduced into the National Immunisation Programme (NIP). It was given to female students aged 13 years in schools. Meanwhile usage of measles and MMR vaccines were high in 2008 and 2009 because of measles outbreaks that occurred in a few states.
However in 2010, used of MMR vaccine dropped because the MMR multidose preparation was no longer produced by one of the manufacturers. This particular product was the only one that fulfilled the technical specification of MOH.
The amount of rubella vaccine (J07B J01) purchased was also lower in 2010 as compared to the previous years. This was attributed by the change of rubella vaccination policy. The vaccination was given to 12 year old schedule given to school girls. However, when the birth cohort who received MMR (J07B D52) at schools reached their 12-year birthday, they do not need a booster for rubella. MMR was given to school children at seven years old starting in 2004. Hence, rubella vaccination was stopped in 2008/09. Thereafter, the procurement of rubella vaccines were only for women who missed their vaccination during adolescent or adulthood, or given to community as part of an outbreak response. The consumption of influenza vaccine (J07B B02) was high in 2010 as compared to the previous years following the pandemic influenza H1N1. There were influenza H1N1 cases in Malaysia. The intake of influenza vaccine and other viral vaccines not in NIP schedule were higher in private sector as compared to public sector.
Pandemic influenza in 2009 did influence the consumption of pneumococcal vaccines, particularly 10-valent conjugated pneumococcal vaccine (J07A L52). The same noted to 23-valent (J07A L01), the marked increased of usage in 2010 was most probably contributed by heighten awareness and recommendation to the hajj pilgrims. The consumptions of these two vaccines were high in private sector as the MOH did not offer these vaccines yet. Typhoid vaccine (J07AP03) showed a marked increase in consumption in 2010 following the gazzettment and enforcement of Food Hygiene Regulation 2009. However the use of injection typhoid (J07AP03) was significantly higher as compared to oral typhoid vaccine (J07A P01).
The most frequently used combined vaccine in the public sector was diphtheria-pertussis- tetanus-poliomyelitis-Haemophilus influenzae b (DTaP-IPV//Hib) (J0C A06) as the government started using this vaccine in the NIP since 2008. This 5-in-1 vaccine was given to children at the aged of 2, 3, 5 and 18 month. The consumption in public sector was 55 times more as compared to private sector and the amount was slightly higher from the number of birth cohort. The 6-in-1 vaccine, combination of diphtheria-pertussis-tetanus-poliomyelitis-Hepatitis B-Haemophilus influenzae b (J0C A09) was also used in government sector despite DTaP-IPV//Hib already in NIP. However the number was small and probably was used in hospital for special cases.

171
MALAYSIAN STATISTICS ON MEDICINES 2009 & 2010
The consumption of pertussis combined vaccine with tetanus and diphtheria, also known as triple antigen (J07A J52) dropped significantly in 2010. This was the effect of DTaP-IPV//Hib (J07C A06) given to children as booster dose at 18 months. The implementation of Hib booster dose in 2010 also was most probably the cause of high consumption of Hib monovalent vaccine (J07A G01) in private sectors in that year. The amount was double as compared to year 2009.
In this report, it is assumed that procurement data reflects consumption. However, it was noted that in some MOH facilities, the vaccines were procured in big amount, kept as buffer stock for up to two to three months. Hence the number procured in the coming year was noticed to be low. It was noted with DTaP-IPV//Hib vaccine (J0C A06) procurement. It’s usage in the coming year 2011 onwards
Table 27.1: Use of Vaccines by Drug Class in Total Doses and CostATC DRUG CLASS YEAR TOTAL
J07A Bacterial vaccines 2008 5,5292009 24,3572010 15,997
J07B Viral vaccines 2008 5,3832009 52,6482010 19,363
J07C Bacterial and viral combined vaccines 2008 3,2312009 8,2292010 2,908
Table 27.2.1: Use of Bacterial Vaccines by Drug Class and Agents, in Total Doses and Cost for year 2008 – 2010ATC Drug Class and Agents
(Bacterial Vaccines)Defined Population
Population no (‘000)
No. of doses)
Year Public Private Total
J07A E01 Cholera, inactivated, whole cell
General 27,728.7 1 2008 - 101 10128,081.5 2009 - 1,876 1,87628,588.6 2010 - 475 475
J07A G01 Haemophilus influenza B, purified antigen purified
Children below 1 year old
653.4 1 2008 2,393 18,615 21,008669.9 2009 664 12,222 12,887691.5 2010 9 31,610 31,619
J07A G52 Haemophilus influenza B, combinations with pertussis and toxoids
Children below 1 year old
653.4 1 2008 8,899 285 9,185669.9 2009 3,500 - 3,500691.5 2010 - - -
J07A H03 Meningococcus A, C, bivalent purified polysaccharides antigen
General 27,728.7 1 2008 - 96 9628,081.5 2009 - 4 428,588.6 2010 - - -
J07A H04 Meningococcus A, C, Y, W-135, tetravalent purified polysaccharides antigen
General 27,728.7 1 2008 75,522 17,393 92,91528,081.5 2009 1,979,309 12,292 1,991,60128,588.6 2010 2,484,693 22,132 2,506,824
would be able to explain better. This also happened to procurement trend of tetanus toxoid (J07A M01), BCG (J07A N01) and polio vaccine (J07B F02) in 2008 to 2010. This assumption was supported by the average consumptions of these vaccines for the three years which were comparable with the estimated numbers of birth cohort. The calculation took into consideration the 20% wastage of multidose vaccine when it was used.
In conclusion, the consistent trend of presumed consumption of vaccines in the health services; i.e. private and public sectors was in accordance to policy changes, enforcement of Act and Regulations, and local landscape of infectious diseases outbreaks including the occurrence of vaccine preventable diseases. The consumptions data also gave some ideas on the acceptability of vaccines by pubic and the coverage of vaccination.
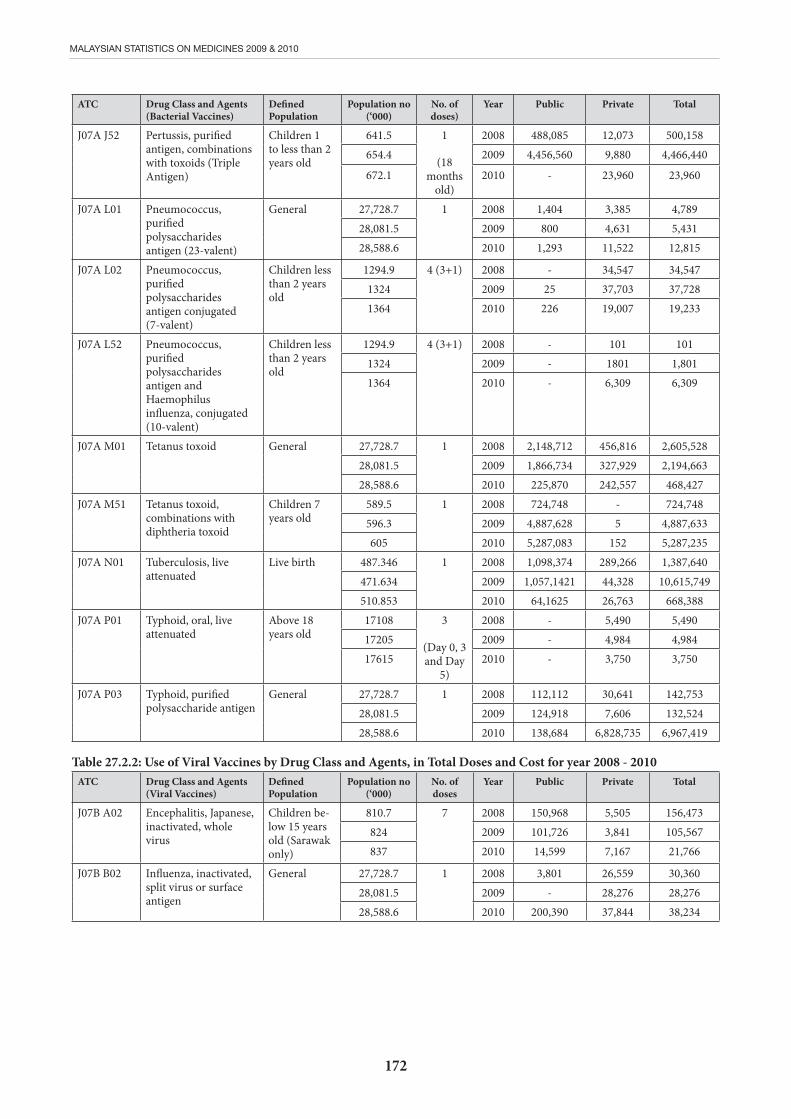
172
MALAYSIAN STATISTICS ON MEDICINES 2009 & 2010
ATC Drug Class and Agents (Bacterial Vaccines)
Defined Population
Population no (‘000)
No. of doses)
Year Public Private Total
J07A J52 Pertussis, purified antigen, combinations with toxoids (Triple Antigen)
Children 1 to less than 2 years old
641.5 1
(18 months
old)
2008 488,085 12,073 500,158654.4 2009 4,456,560 9,880 4,466,440
672.1 2010 - 23,960 23,960
J07A L01 Pneumococcus, purified polysaccharides antigen (23-valent)
General 27,728.7 1 2008 1,404 3,385 4,78928,081.5 2009 800 4,631 5,43128,588.6 2010 1,293 11,522 12,815
J07A L02 Pneumococcus, purified polysaccharides antigen conjugated (7-valent)
Children less than 2 years old
1294.9 4 (3+1) 2008 - 34,547 34,5471324 2009 25 37,703 37,7281364 2010 226 19,007 19,233
J07A L52 Pneumococcus, purified polysaccharides antigen and Haemophilus influenza, conjugated (10-valent)
Children less than 2 years old
1294.9 4 (3+1) 2008 - 101 1011324 2009 - 1801 1,8011364 2010 - 6,309 6,309
J07A M01 Tetanus toxoid General 27,728.7 1 2008 2,148,712 456,816 2,605,52828,081.5 2009 1,866,734 327,929 2,194,66328,588.6 2010 225,870 242,557 468,427
J07A M51 Tetanus toxoid, combinations with diphtheria toxoid
Children 7 years old
589.5 1 2008 724,748 - 724,748596.3 2009 4,887,628 5 4,887,633605 2010 5,287,083 152 5,287,235
J07A N01 Tuberculosis, live attenuated
Live birth 487.346 1 2008 1,098,374 289,266 1,387,640471.634 2009 1,057,1421 44,328 10,615,749510.853 2010 64,1625 26,763 668,388
J07A P01 Typhoid, oral, live attenuated
Above 18 years old
17108 3
(Day 0, 3 and Day
5)
2008 - 5,490 5,49017205 2009 - 4,984 4,98417615 2010 - 3,750 3,750
J07A P03 Typhoid, purified polysaccharide antigen
General 27,728.7 1 2008 112,112 30,641 142,75328,081.5 2009 124,918 7,606 132,52428,588.6 2010 138,684 6,828,735 6,967,419
Table 27.2.2: Use of Viral Vaccines by Drug Class and Agents, in Total Doses and Cost for year 2008 - 2010ATC Drug Class and Agents
(Viral Vaccines)Defined Population
Population no (‘000)
No. of doses
Year Public Private Total
J07B A02 Encephalitis, Japanese, inactivated, whole virus
Children be-low 15 years old (Sarawak only)
810.7 7 2008 150,968 5,505 156,473824 2009 101,726 3,841 105,567837 2010 14,599 7,167 21,766
J07B B02 Influenza, inactivated, split virus or surface antigen
General 27,728.7 1 2008 3,801 26,559 30,36028,081.5 2009 - 28,276 28,27628,588.6 2010 200,390 37,844 38,234
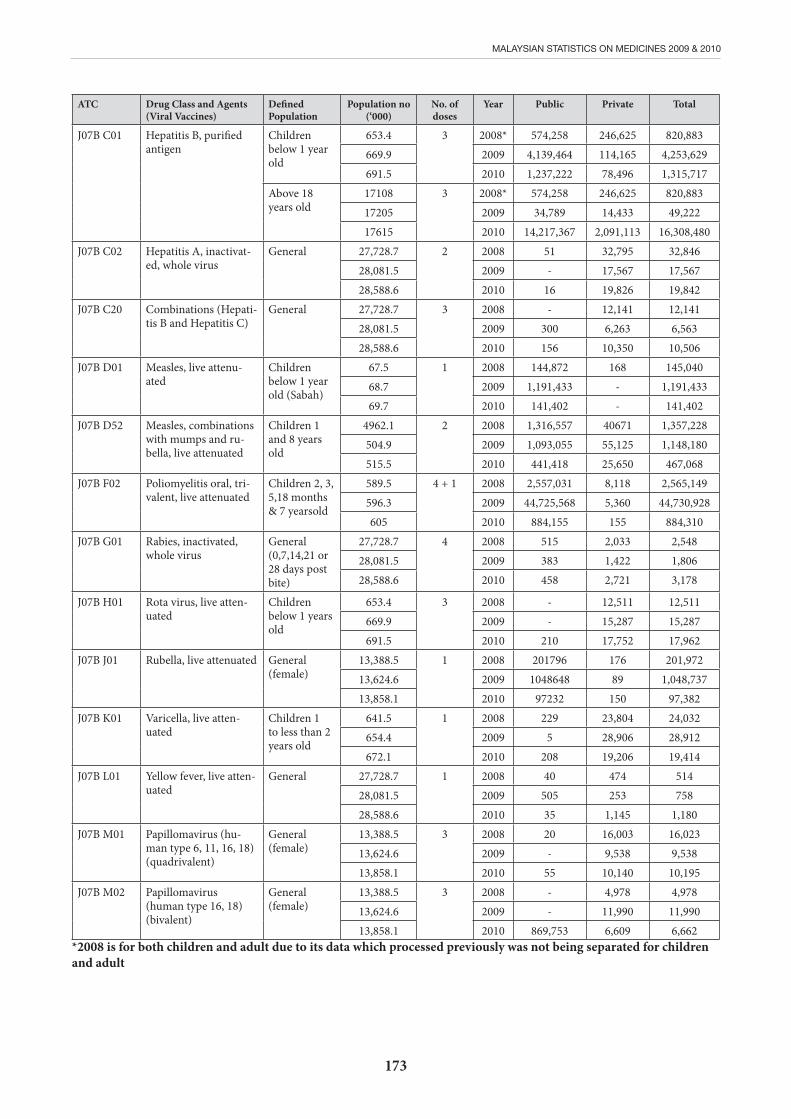
173
MALAYSIAN STATISTICS ON MEDICINES 2009 & 2010
ATC Drug Class and Agents (Viral Vaccines)
Defined Population
Population no (‘000)
No. of doses
Year Public Private Total
J07B C01 Hepatitis B, purified antigen
Children below 1 year old
653.4 3 2008* 574,258 246,625 820,883669.9 2009 4,139,464 114,165 4,253,629691.5 2010 1,237,222 78,496 1,315,717
Above 18 years old
17108 3 2008* 574,258 246,625 820,88317205 2009 34,789 14,433 49,22217615 2010 14,217,367 2,091,113 16,308,480
J07B C02 Hepatitis A, inactivat-ed, whole virus
General 27,728.7 2 2008 51 32,795 32,84628,081.5 2009 - 17,567 17,56728,588.6 2010 16 19,826 19,842
J07B C20 Combinations (Hepati-tis B and Hepatitis C)
General 27,728.7 3 2008 - 12,141 12,14128,081.5 2009 300 6,263 6,56328,588.6 2010 156 10,350 10,506
J07B D01 Measles, live attenu-ated
Children below 1 year old (Sabah)
67.5 1 2008 144,872 168 145,04068.7 2009 1,191,433 - 1,191,43369.7 2010 141,402 - 141,402
J07B D52 Measles, combinations with mumps and ru-bella, live attenuated
Children 1 and 8 years old
4962.1 2 2008 1,316,557 40671 1,357,228504.9 2009 1,093,055 55,125 1,148,180515.5 2010 441,418 25,650 467,068
J07B F02 Poliomyelitis oral, tri-valent, live attenuated
Children 2, 3, 5,18 months & 7 yearsold
589.5 4 + 1 2008 2,557,031 8,118 2,565,149596.3 2009 44,725,568 5,360 44,730,928605 2010 884,155 155 884,310
J07B G01 Rabies, inactivated, whole virus
General (0,7,14,21 or 28 days post bite)
27,728.7 4 2008 515 2,033 2,54828,081.5 2009 383 1,422 1,80628,588.6 2010 458 2,721 3,178
J07B H01 Rota virus, live atten-uated
Children below 1 years old
653.4 3 2008 - 12,511 12,511669.9 2009 - 15,287 15,287691.5 2010 210 17,752 17,962
J07B J01 Rubella, live attenuated General (female)
13,388.5 1 2008 201796 176 201,97213,624.6 2009 1048648 89 1,048,73713,858.1 2010 97232 150 97,382
J07B K01 Varicella, live atten-uated
Children 1 to less than 2 years old
641.5 1 2008 229 23,804 24,032654.4 2009 5 28,906 28,912672.1 2010 208 19,206 19,414
J07B L01 Yellow fever, live atten-uated
General 27,728.7 1 2008 40 474 51428,081.5 2009 505 253 75828,588.6 2010 35 1,145 1,180
J07B M01 Papillomavirus (hu-man type 6, 11, 16, 18) (quadrivalent)
General (female)
13,388.5 3 2008 20 16,003 16,02313,624.6 2009 - 9,538 9,53813,858.1 2010 55 10,140 10,195
J07B M02 Papillomavirus (human type 16, 18) (bivalent)
General (female)
13,388.5 3 2008 - 4,978 4,97813,624.6 2009 - 11,990 11,99013,858.1 2010 869,753 6,609 6,662
*2008 is for both children and adult due to its data which processed previously was not being separated for children and adult

174
MALAYSIAN STATISTICS ON MEDICINES 2009 & 2010
Table 27.2.3: Use of Bacterial & Viral Vaccines, combined by Drug Class & Agent, in Total Doses and Total Cost for year 2008-2010
ATC Drug Class and Agents (Viral Vaccines)
Defined Population
Population no (‘000)
No. of doses Year Public Private Total
J07C A02 D i p h t e r i a - p e r t u s -sis-poliomyelitis-teta-nus
1 - < 2 years old
641.51
2008 368 21701 22069654.4 2009 - 13736 13736672.1 2010 600 14873 15473
J07C A05 Diphter ia-hepat it is B-pertussis-tetanus Below 1 years
old
653.43
2008 83430 832 84262669.9 2009 - - -691.5 2010 - 10864 10864
J07C A06 Diphteria-Haemophi-lus influenza B-pertus-sis-poliomyelitis-teta-nus
Below 1 years old
653.4
3
2008 833125 76552 909677669.9 2009 8119746 63860 8183606
691.5 2010 1350042 47336 1397378
J07C A09 Diphteria-Haemophi-lus influenza B-pertus-sis-poliomyelitis-teta-nus-hepatitis B
Below 2 years old
1294.9
4
2008 31 36581 366121324 2009 - 25723 25723
1364 2010 55934 23587 79521
J07C A10 Typhoid-hepatitis AGeneral
27,728.71
2008 - 55 5528,081.5 2009 - 133 13328,588.6 2010 - 213 213
J07C A11 Diphteria-Haemophi-lus influenza B-pertus-sis-tetanus-hepatitis B
Below 1 years old
653.43
2008 2178173669.9 2009 6200 - 6200691.5 2010 - - -
References
1. WHO Global Vaccine Action Plan. A65/22.11 May 2012
2. Population Dataset 2008;Department of Statistics Malaysia,2009 & 2010.
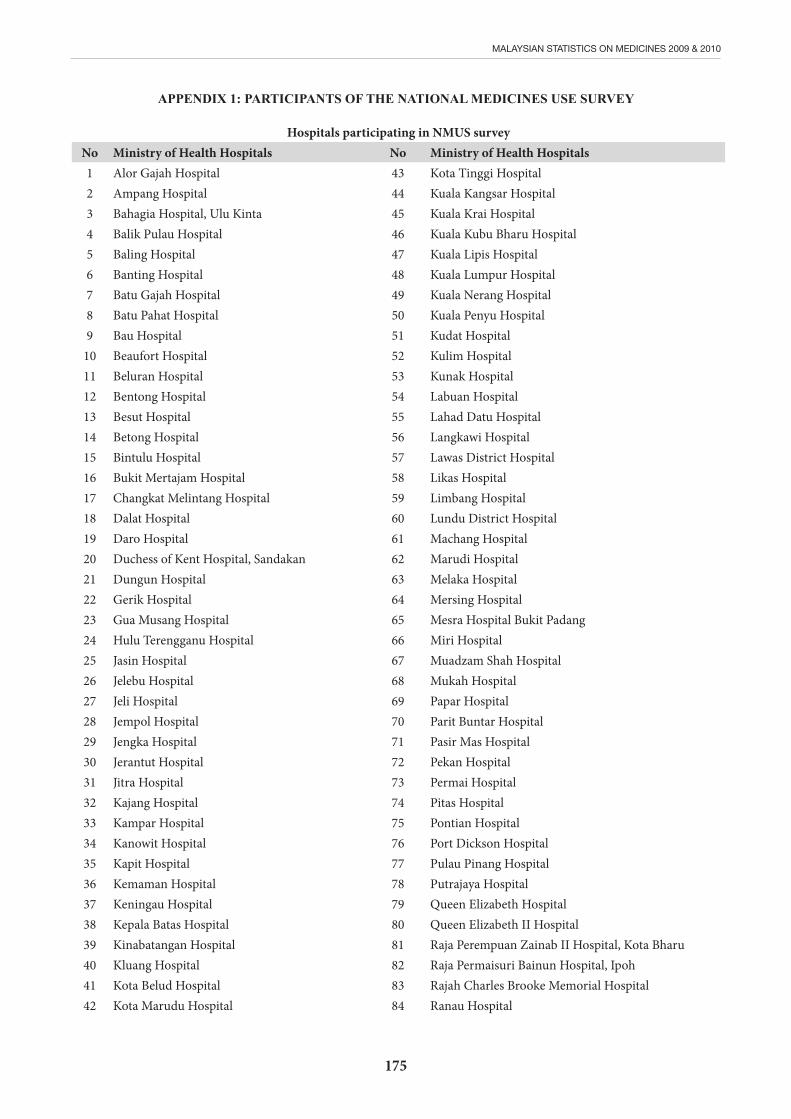
175
MALAYSIAN STATISTICS ON MEDICINES 2009 & 2010
APPENDIX 1: PARTICIPANTS OF THE NATIONAL MEDICINES USE SURVEY
Hospitals participating in NMUS surveyNo Ministry of Health Hospitals No Ministry of Health Hospitals1 Alor Gajah Hospital 43 Kota Tinggi Hospital2 Ampang Hospital 44 Kuala Kangsar Hospital3 Bahagia Hospital, Ulu Kinta 45 Kuala Krai Hospital4 Balik Pulau Hospital 46 Kuala Kubu Bharu Hospital5 Baling Hospital 47 Kuala Lipis Hospital 6 Banting Hospital 48 Kuala Lumpur Hospital7 Batu Gajah Hospital 49 Kuala Nerang Hospital8 Batu Pahat Hospital 50 Kuala Penyu Hospital9 Bau Hospital 51 Kudat Hospital
10 Beaufort Hospital 52 Kulim Hospital11 Beluran Hospital 53 Kunak Hospital12 Bentong Hospital 54 Labuan Hospital13 Besut Hospital 55 Lahad Datu Hospital 14 Betong Hospital 56 Langkawi Hospital15 Bintulu Hospital 57 Lawas District Hospital 16 Bukit Mertajam Hospital 58 Likas Hospital17 Changkat Melintang Hospital 59 Limbang Hospital 18 Dalat Hospital 60 Lundu District Hospital19 Daro Hospital 61 Machang Hospital20 Duchess of Kent Hospital, Sandakan 62 Marudi Hospital21 Dungun Hospital 63 Melaka Hospital22 Gerik Hospital 64 Mersing Hospital23 Gua Musang Hospital 65 Mesra Hospital Bukit Padang24 Hulu Terengganu Hospital 66 Miri Hospital 25 Jasin Hospital 67 Muadzam Shah Hospital 26 Jelebu Hospital 68 Mukah Hospital 27 Jeli Hospital 69 Papar Hospital 28 Jempol Hospital 70 Parit Buntar Hospital29 Jengka Hospital 71 Pasir Mas Hospital30 Jerantut Hospital 72 Pekan Hospital 31 Jitra Hospital 73 Permai Hospital32 Kajang Hospital 74 Pitas Hospital33 Kampar Hospital 75 Pontian Hospital34 Kanowit Hospital 76 Port Dickson Hospital35 Kapit Hospital 77 Pulau Pinang Hospital36 Kemaman Hospital 78 Putrajaya Hospital37 Keningau Hospital 79 Queen Elizabeth Hospital38 Kepala Batas Hospital 80 Queen Elizabeth II Hospital39 Kinabatangan Hospital 81 Raja Perempuan Zainab II Hospital, Kota Bharu40 Kluang Hospital 82 Raja Permaisuri Bainun Hospital, Ipoh41 Kota Belud Hospital 83 Rajah Charles Brooke Memorial Hospital42 Kota Marudu Hospital 84 Ranau Hospital
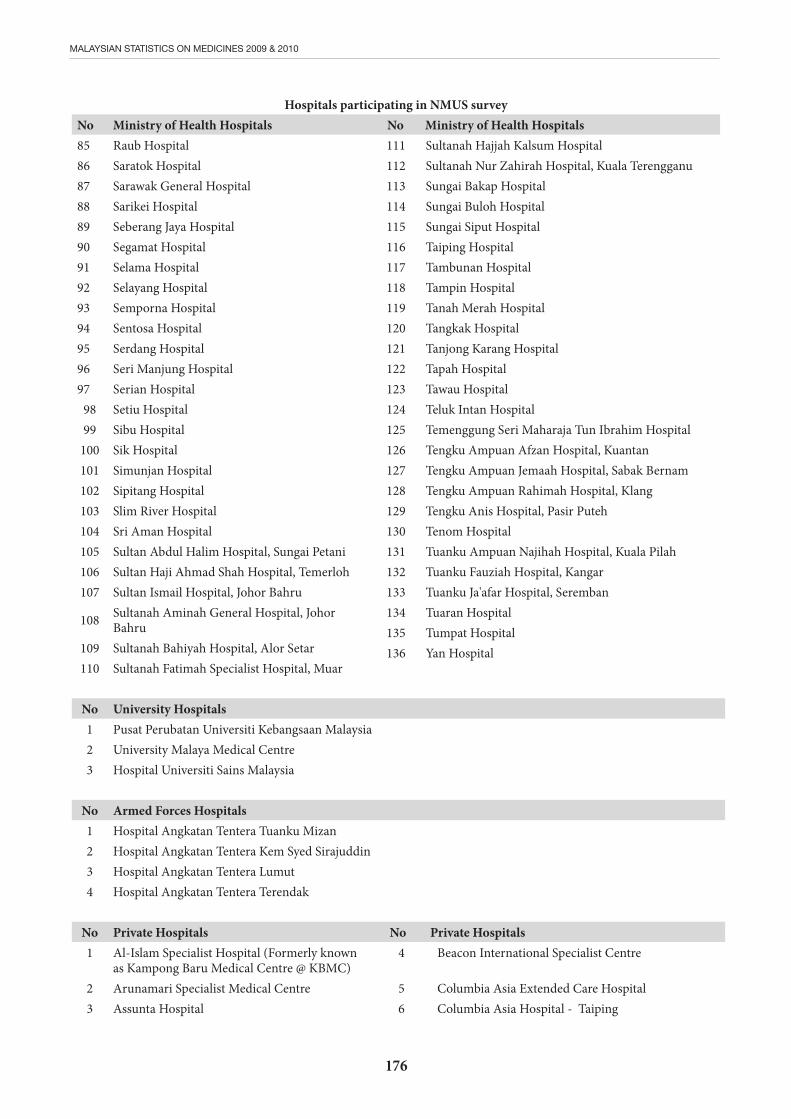
176
MALAYSIAN STATISTICS ON MEDICINES 2009 & 2010
85 Raub Hospital86 Saratok Hospital 87 Sarawak General Hospital88 Sarikei Hospital 89 Seberang Jaya Hospital90 Segamat Hospital91 Selama Hospital 92 Selayang Hospital93 Semporna Hospital 94 Sentosa Hospital95 Serdang Hospital96 Seri Manjung Hospital 97 Serian Hospital
98 Setiu Hospital 99 Sibu Hospital
100 Sik Hospital101 Simunjan Hospital 102 Sipitang Hospital 103 Slim River Hospital 104 Sri Aman Hospital 105 Sultan Abdul Halim Hospital, Sungai Petani106 Sultan Haji Ahmad Shah Hospital, Temerloh107 Sultan Ismail Hospital, Johor Bahru
108 Sultanah Aminah General Hospital, Johor Bahru
109 Sultanah Bahiyah Hospital, Alor Setar110 Sultanah Fatimah Specialist Hospital, Muar
No University Hospitals1 Pusat Perubatan Universiti Kebangsaan Malaysia2 University Malaya Medical Centre3 Hospital Universiti Sains Malaysia
No Armed Forces Hospitals1 Hospital Angkatan Tentera Tuanku Mizan2 Hospital Angkatan Tentera Kem Syed Sirajuddin3 Hospital Angkatan Tentera Lumut4 Hospital Angkatan Tentera Terendak
No Private Hospitals No Private Hospitals1 Al-Islam Specialist Hospital (Formerly known
as Kampong Baru Medical Centre @ KBMC)4 Beacon International Specialist Centre
2 Arunamari Specialist Medical Centre 5 Columbia Asia Extended Care Hospital3 Assunta Hospital 6 Columbia Asia Hospital - Taiping
111 Sultanah Hajjah Kalsum Hospital112 Sultanah Nur Zahirah Hospital, Kuala Terengganu113 Sungai Bakap Hospital114 Sungai Buloh Hospital115 Sungai Siput Hospital 116 Taiping Hospital117 Tambunan Hospital 118 Tampin Hospital119 Tanah Merah Hospital120 Tangkak Hospital121 Tanjong Karang Hospital122 Tapah Hospital 123 Tawau Hospital124 Teluk Intan Hospital 125 Temenggung Seri Maharaja Tun Ibrahim Hospital126 Tengku Ampuan Afzan Hospital, Kuantan127 Tengku Ampuan Jemaah Hospital, Sabak Bernam128 Tengku Ampuan Rahimah Hospital, Klang129 Tengku Anis Hospital, Pasir Puteh130 Tenom Hospital 131 Tuanku Ampuan Najihah Hospital, Kuala Pilah132 Tuanku Fauziah Hospital, Kangar133 Tuanku Ja'afar Hospital, Seremban134 Tuaran Hospital135 Tumpat Hospital136 Yan Hospital
Hospitals participating in NMUS surveyNo Ministry of Health Hospitals No Ministry of Health Hospitals

177
MALAYSIAN STATISTICS ON MEDICINES 2009 & 2010
7 Columbia Asia Hospital - Miri8 Columbia Asia Hospital - Puchong9 Columbia Asia Hospital Seremban
10 Damai Medical and Heart Clinic Sdn. Bhd11 Damai Service Hospital (HQ) Sdn. Bhd. 12 Fatimah Hospital13 Gleneagles Intan Medical Centre14 Gleneagles Medical Centre, Penang15 Hospital Pantai Ayer Keroh Sdn. Bhd.16 Hospital Waqaf An-Nur Pasir Gudang17 Island Hospital18 JB Specialist Hospital Sdn. Bhd 19 Kajang Plaza Medical Centre20 Kelana Jaya Medical Centre21 Kempas Medical Centre22 Kinta Medical Centre Sdn. Bhd. 23 KPJ Ampang Puteri Specialist Hospital 24 KPJ Damansara Specialist Hospital25 KPJ Ipoh Specialist Hospital26 KPJ Johor Specialist Hospital 27 KPJ Kajang Specialist Hospital 28 KPJ Kedah Medical Centre29 KPJ Kuantan Specialist Hospital30 KPJ Kuching Specialist Hospital31 KPJ Penang Specialist Hospital
32 KPJ Perdana Specialist Hospital33 KPJ Puteri Specialist Hospital / Hospital Pakar
Puteri34 KPJ Selangor Specialist Hospital35 KPJ Sentosa Medical Centre Sdn. Bhd.36 KPJ Seremban Specialist Hospital Sdn. Bhd. 37 KPJ Taiping Medical Centre38 KPJ Tawakal Specialist Hospital39 KPMC Puchong Sdn. Bhd40 Kuantan Medical Centre Sdn. Bhd. 41 Loh Guan Lye & Sons Sdn Bhd (Loh Guan Lye
Specialists Centre)42 Lourdes Medical Centre
Public Health Authorities participating in NMUS surveyNo State/District/Area Health Departments No State/District/Area Health Departments1 Pejabat Kesihatan Daerah Alor Gajah 3 Pejabat Kesihatan Daerah Baling2 Pejabat Kesihatan Daerah Bachok 4 Pejabat Kesihatan Daerah Bandar Baharu
43 Mahkota Medical Centre Sdn. Bhd44 Mawar Renal Medical Centre45 Medical Specialist Centre (JB) Sdn. Bhd46 Metro Specialist Hospital47 Miri City Medical Centre48 Mount Miriam Hospital49 National Heart Institute Sdn. Bhd. 50 NCI Cancer Hospital51 Pantai Hospital Batu Pahat52 Pantai Hospital Ampang53 Pantai Hospital Cheras54 Pantai Hospital Ipoh55 Pantai Hospital Klang56 Pantai Hospital Penang (formerly Pantai
Mutiara Hospital)57 Pantai Hospital Sungai Petani58 Penang Adventist Hospital (Adventist Hospital
& Clinic Services (M)59 Perak Community Specialist Hospital60 Prince Court Medical Centre61 Pudu Specialists Centre Sdn. Bhd 62 PUSRAWI Hospital Sdn. Bhd63 Putra Medical Centre64 Putra Specialist Hospital (Batu Pahat) Sdn. Bhd65 Putra Specialist Hospital (Melaka) Sdn. Bhd.66 QHC Medical Center Sdn Bhd 67 Rafflesia Medical Centre
68 Regency Specialist Hospital69 Sibu Specialist Medical Centre70 Sime Darby Medical Centre Subang Jaya71 Sri Kota Specialist Medical Centre (SKSMC)72 Sri Manjung Specialist Centre Sdn Bhd73 Sunway Medical Centre74 The Tun Hussein Onn National Eye Hospital75 Timberland Medical Centre76 Tropicana Medical Centre (M) Sdn Bhd 77 Tung Shin Hospital
Hospitals participating in NMUS surveyNo Private Hospitals No Private Hospitals
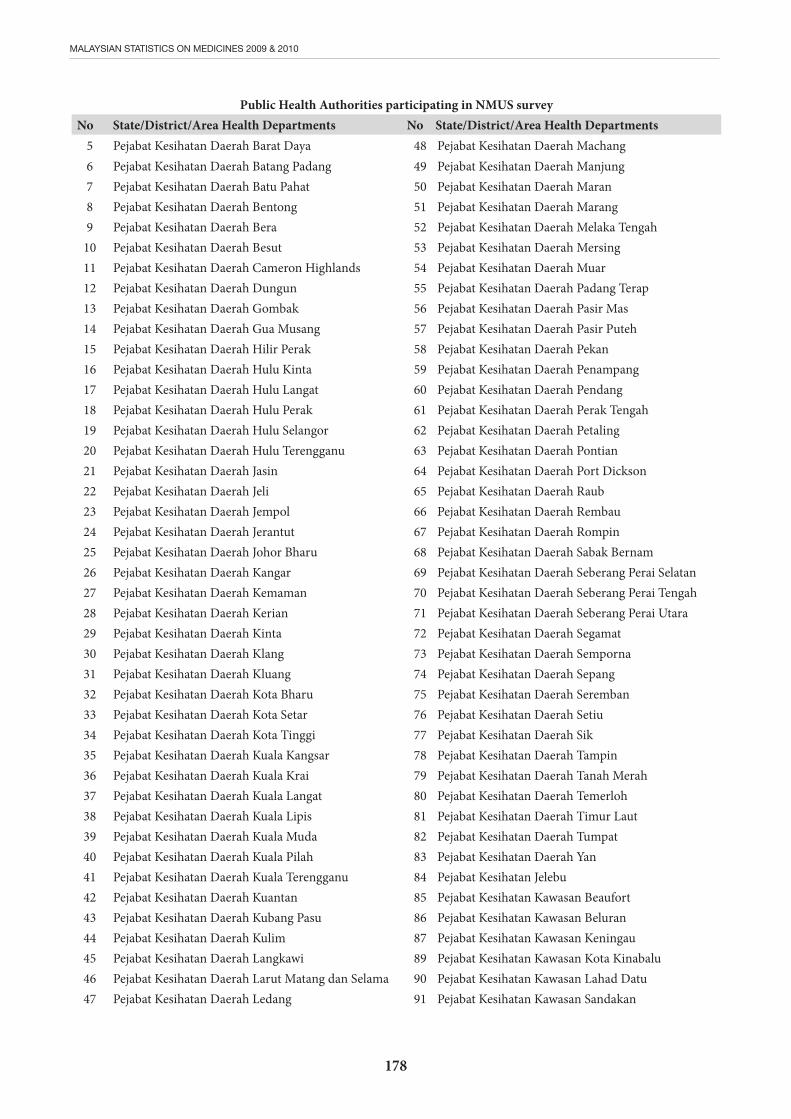
178
MALAYSIAN STATISTICS ON MEDICINES 2009 & 2010
5 Pejabat Kesihatan Daerah Barat Daya 48 Pejabat Kesihatan Daerah Machang6 Pejabat Kesihatan Daerah Batang Padang 49 Pejabat Kesihatan Daerah Manjung7 Pejabat Kesihatan Daerah Batu Pahat 50 Pejabat Kesihatan Daerah Maran8 Pejabat Kesihatan Daerah Bentong 51 Pejabat Kesihatan Daerah Marang9 Pejabat Kesihatan Daerah Bera 52 Pejabat Kesihatan Daerah Melaka Tengah
10 Pejabat Kesihatan Daerah Besut 53 Pejabat Kesihatan Daerah Mersing11 Pejabat Kesihatan Daerah Cameron Highlands 54 Pejabat Kesihatan Daerah Muar12 Pejabat Kesihatan Daerah Dungun 55 Pejabat Kesihatan Daerah Padang Terap13 Pejabat Kesihatan Daerah Gombak 56 Pejabat Kesihatan Daerah Pasir Mas14 Pejabat Kesihatan Daerah Gua Musang 57 Pejabat Kesihatan Daerah Pasir Puteh15 Pejabat Kesihatan Daerah Hilir Perak 58 Pejabat Kesihatan Daerah Pekan16 Pejabat Kesihatan Daerah Hulu Kinta 59 Pejabat Kesihatan Daerah Penampang17 Pejabat Kesihatan Daerah Hulu Langat 60 Pejabat Kesihatan Daerah Pendang18 Pejabat Kesihatan Daerah Hulu Perak 61 Pejabat Kesihatan Daerah Perak Tengah 19 Pejabat Kesihatan Daerah Hulu Selangor 62 Pejabat Kesihatan Daerah Petaling20 Pejabat Kesihatan Daerah Hulu Terengganu 63 Pejabat Kesihatan Daerah Pontian21 Pejabat Kesihatan Daerah Jasin 64 Pejabat Kesihatan Daerah Port Dickson22 Pejabat Kesihatan Daerah Jeli 65 Pejabat Kesihatan Daerah Raub23 Pejabat Kesihatan Daerah Jempol 66 Pejabat Kesihatan Daerah Rembau24 Pejabat Kesihatan Daerah Jerantut 67 Pejabat Kesihatan Daerah Rompin25 Pejabat Kesihatan Daerah Johor Bharu 68 Pejabat Kesihatan Daerah Sabak Bernam26 Pejabat Kesihatan Daerah Kangar 69 Pejabat Kesihatan Daerah Seberang Perai Selatan 27 Pejabat Kesihatan Daerah Kemaman 70 Pejabat Kesihatan Daerah Seberang Perai Tengah 28 Pejabat Kesihatan Daerah Kerian 71 Pejabat Kesihatan Daerah Seberang Perai Utara29 Pejabat Kesihatan Daerah Kinta 72 Pejabat Kesihatan Daerah Segamat30 Pejabat Kesihatan Daerah Klang 73 Pejabat Kesihatan Daerah Semporna31 Pejabat Kesihatan Daerah Kluang 74 Pejabat Kesihatan Daerah Sepang32 Pejabat Kesihatan Daerah Kota Bharu 75 Pejabat Kesihatan Daerah Seremban33 Pejabat Kesihatan Daerah Kota Setar 76 Pejabat Kesihatan Daerah Setiu34 Pejabat Kesihatan Daerah Kota Tinggi 77 Pejabat Kesihatan Daerah Sik35 Pejabat Kesihatan Daerah Kuala Kangsar 78 Pejabat Kesihatan Daerah Tampin36 Pejabat Kesihatan Daerah Kuala Krai 79 Pejabat Kesihatan Daerah Tanah Merah37 Pejabat Kesihatan Daerah Kuala Langat 80 Pejabat Kesihatan Daerah Temerloh38 Pejabat Kesihatan Daerah Kuala Lipis 81 Pejabat Kesihatan Daerah Timur Laut39 Pejabat Kesihatan Daerah Kuala Muda 82 Pejabat Kesihatan Daerah Tumpat40 Pejabat Kesihatan Daerah Kuala Pilah 83 Pejabat Kesihatan Daerah Yan 41 Pejabat Kesihatan Daerah Kuala Terengganu 84 Pejabat Kesihatan Jelebu42 Pejabat Kesihatan Daerah Kuantan 85 Pejabat Kesihatan Kawasan Beaufort43 Pejabat Kesihatan Daerah Kubang Pasu 86 Pejabat Kesihatan Kawasan Beluran44 Pejabat Kesihatan Daerah Kulim 87 Pejabat Kesihatan Kawasan Keningau45 Pejabat Kesihatan Daerah Langkawi 89 Pejabat Kesihatan Kawasan Kota Kinabalu46 Pejabat Kesihatan Daerah Larut Matang dan Selama 90 Pejabat Kesihatan Kawasan Lahad Datu47 Pejabat Kesihatan Daerah Ledang 91 Pejabat Kesihatan Kawasan Sandakan
Public Health Authorities participating in NMUS surveyNo State/District/Area Health Departments No State/District/Area Health Departments
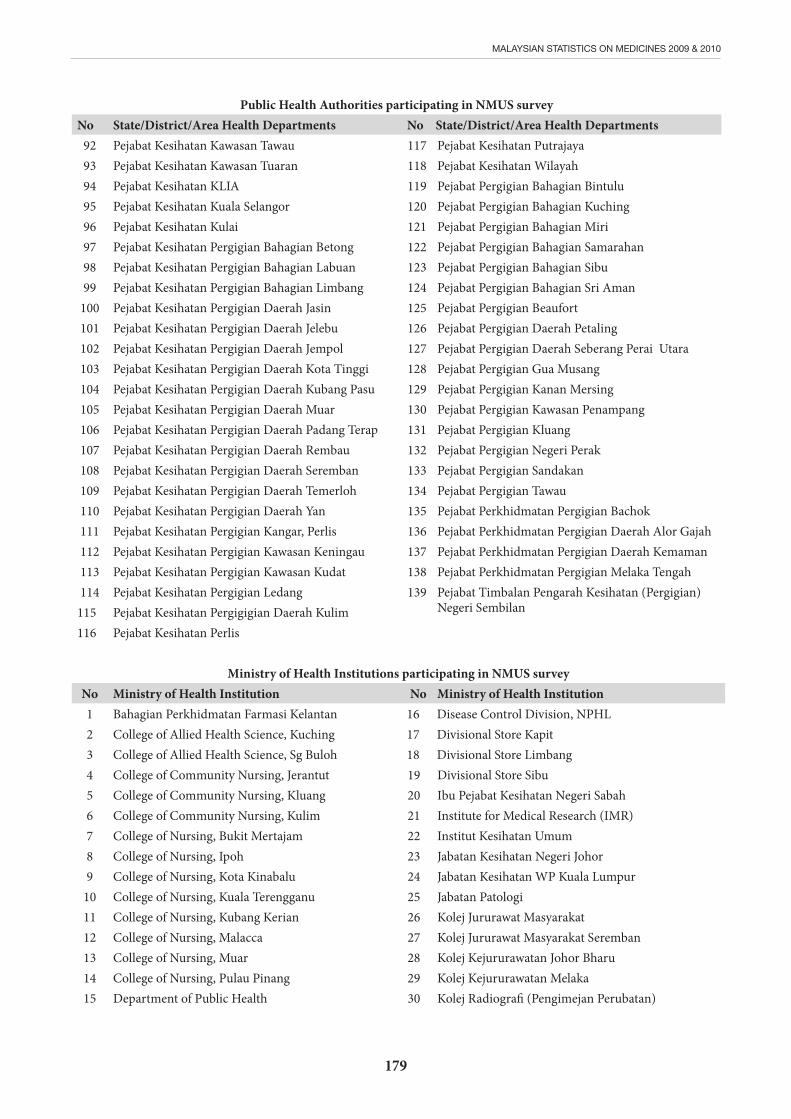
179
MALAYSIAN STATISTICS ON MEDICINES 2009 & 2010
92 Pejabat Kesihatan Kawasan Tawau 117 Pejabat Kesihatan Putrajaya93 Pejabat Kesihatan Kawasan Tuaran 118 Pejabat Kesihatan Wilayah94 Pejabat Kesihatan KLIA 119 Pejabat Pergigian Bahagian Bintulu95 Pejabat Kesihatan Kuala Selangor 120 Pejabat Pergigian Bahagian Kuching96 Pejabat Kesihatan Kulai 121 Pejabat Pergigian Bahagian Miri97 Pejabat Kesihatan Pergigian Bahagian Betong 122 Pejabat Pergigian Bahagian Samarahan98 Pejabat Kesihatan Pergigian Bahagian Labuan 123 Pejabat Pergigian Bahagian Sibu99 Pejabat Kesihatan Pergigian Bahagian Limbang 124 Pejabat Pergigian Bahagian Sri Aman
100 Pejabat Kesihatan Pergigian Daerah Jasin 125 Pejabat Pergigian Beaufort101 Pejabat Kesihatan Pergigian Daerah Jelebu 126 Pejabat Pergigian Daerah Petaling102 Pejabat Kesihatan Pergigian Daerah Jempol 127 Pejabat Pergigian Daerah Seberang Perai Utara103 Pejabat Kesihatan Pergigian Daerah Kota Tinggi 128 Pejabat Pergigian Gua Musang104 Pejabat Kesihatan Pergigian Daerah Kubang Pasu 129 Pejabat Pergigian Kanan Mersing105 Pejabat Kesihatan Pergigian Daerah Muar 130 Pejabat Pergigian Kawasan Penampang106 Pejabat Kesihatan Pergigian Daerah Padang Terap 131 Pejabat Pergigian Kluang107 Pejabat Kesihatan Pergigian Daerah Rembau 132 Pejabat Pergigian Negeri Perak108 Pejabat Kesihatan Pergigian Daerah Seremban 133 Pejabat Pergigian Sandakan109 Pejabat Kesihatan Pergigian Daerah Temerloh 134 Pejabat Pergigian Tawau110 Pejabat Kesihatan Pergigian Daerah Yan 135 Pejabat Perkhidmatan Pergigian Bachok111 Pejabat Kesihatan Pergigian Kangar, Perlis 136 Pejabat Perkhidmatan Pergigian Daerah Alor Gajah112 Pejabat Kesihatan Pergigian Kawasan Keningau 137 Pejabat Perkhidmatan Pergigian Daerah Kemaman113 Pejabat Kesihatan Pergigian Kawasan Kudat 138 Pejabat Perkhidmatan Pergigian Melaka Tengah114 Pejabat Kesihatan Pergigian Ledang 139 Pejabat Timbalan Pengarah Kesihatan (Pergigian)
Negeri Sembilan115 Pejabat Kesihatan Pergigigian Daerah Kulim116 Pejabat Kesihatan Perlis
Ministry of Health Institutions participating in NMUS surveyNo Ministry of Health Institution No Ministry of Health Institution1 Bahagian Perkhidmatan Farmasi Kelantan 16 Disease Control Division, NPHL2 College of Allied Health Science, Kuching 17 Divisional Store Kapit3 College of Allied Health Science, Sg Buloh 18 Divisional Store Limbang4 College of Community Nursing, Jerantut 19 Divisional Store Sibu5 College of Community Nursing, Kluang 20 Ibu Pejabat Kesihatan Negeri Sabah6 College of Community Nursing, Kulim 21 Institute for Medical Research (IMR)7 College of Nursing, Bukit Mertajam 22 Institut Kesihatan Umum8 College of Nursing, Ipoh 23 Jabatan Kesihatan Negeri Johor9 College of Nursing, Kota Kinabalu 24 Jabatan Kesihatan WP Kuala Lumpur
10 College of Nursing, Kuala Terengganu 25 Jabatan Patologi11 College of Nursing, Kubang Kerian 26 Kolej Jururawat Masyarakat12 College of Nursing, Malacca 27 Kolej Jururawat Masyarakat Seremban13 College of Nursing, Muar 28 Kolej Kejururawatan Johor Bharu14 College of Nursing, Pulau Pinang 29 Kolej Kejururawatan Melaka15 Department of Public Health 30 Kolej Radiografi (Pengimejan Perubatan)
Public Health Authorities participating in NMUS surveyNo State/District/Area Health Departments No State/District/Area Health Departments
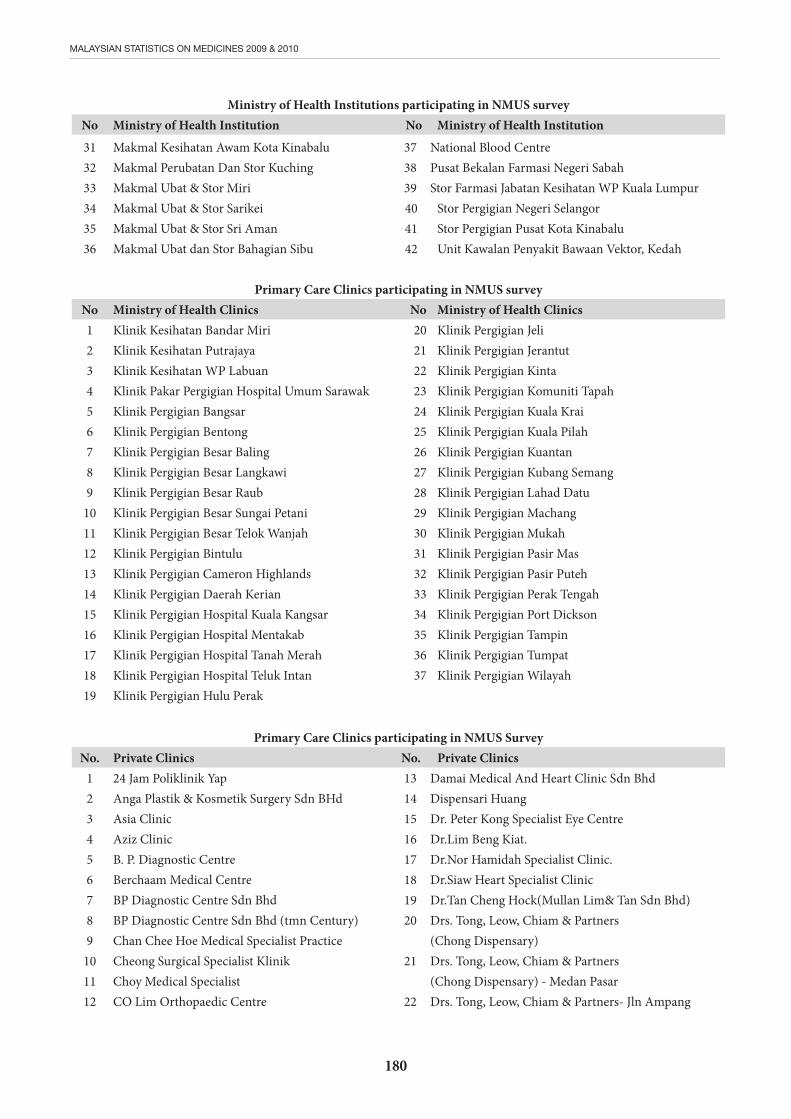
180
MALAYSIAN STATISTICS ON MEDICINES 2009 & 2010
31 Makmal Kesihatan Awam Kota Kinabalu 37 National Blood Centre 32 Makmal Perubatan Dan Stor Kuching 38 Pusat Bekalan Farmasi Negeri Sabah33 Makmal Ubat & Stor Miri 39 Stor Farmasi Jabatan Kesihatan WP Kuala Lumpur34 Makmal Ubat & Stor Sarikei 40 Stor Pergigian Negeri Selangor35 Makmal Ubat & Stor Sri Aman 41 Stor Pergigian Pusat Kota Kinabalu36 Makmal Ubat dan Stor Bahagian Sibu 42 Unit Kawalan Penyakit Bawaan Vektor, Kedah
Primary Care Clinics participating in NMUS surveyNo Ministry of Health Clinics No Ministry of Health Clinics1 Klinik Kesihatan Bandar Miri 20 Klinik Pergigian Jeli2 Klinik Kesihatan Putrajaya 21 Klinik Pergigian Jerantut3 Klinik Kesihatan WP Labuan 22 Klinik Pergigian Kinta4 Klinik Pakar Pergigian Hospital Umum Sarawak 23 Klinik Pergigian Komuniti Tapah5 Klinik Pergigian Bangsar 24 Klinik Pergigian Kuala Krai6 Klinik Pergigian Bentong 25 Klinik Pergigian Kuala Pilah7 Klinik Pergigian Besar Baling 26 Klinik Pergigian Kuantan8 Klinik Pergigian Besar Langkawi 27 Klinik Pergigian Kubang Semang9 Klinik Pergigian Besar Raub 28 Klinik Pergigian Lahad Datu
10 Klinik Pergigian Besar Sungai Petani 29 Klinik Pergigian Machang11 Klinik Pergigian Besar Telok Wanjah 30 Klinik Pergigian Mukah12 Klinik Pergigian Bintulu 31 Klinik Pergigian Pasir Mas13 Klinik Pergigian Cameron Highlands 32 Klinik Pergigian Pasir Puteh14 Klinik Pergigian Daerah Kerian 33 Klinik Pergigian Perak Tengah15 Klinik Pergigian Hospital Kuala Kangsar 34 Klinik Pergigian Port Dickson16 Klinik Pergigian Hospital Mentakab 35 Klinik Pergigian Tampin17 Klinik Pergigian Hospital Tanah Merah 36 Klinik Pergigian Tumpat18 Klinik Pergigian Hospital Teluk Intan 37 Klinik Pergigian Wilayah19 Klinik Pergigian Hulu Perak
Primary Care Clinics participating in NMUS SurveyNo. Private Clinics No. Private Clinics
1 24 Jam Poliklinik Yap 13 Damai Medical And Heart Clinic Sdn Bhd2 Anga Plastik & Kosmetik Surgery Sdn BHd 14 Dispensari Huang3 Asia Clinic 15 Dr. Peter Kong Specialist Eye Centre4 Aziz Clinic 16 Dr.Lim Beng Kiat.5 B. P. Diagnostic Centre 17 Dr.Nor Hamidah Specialist Clinic.6 Berchaam Medical Centre 18 Dr.Siaw Heart Specialist Clinic7 BP Diagnostic Centre Sdn Bhd 19 Dr.Tan Cheng Hock(Mullan Lim& Tan Sdn Bhd)8 BP Diagnostic Centre Sdn Bhd (tmn Century) 20 Drs. Tong, Leow, Chiam & Partners9 Chan Chee Hoe Medical Specialist Practice (Chong Dispensary)
10 Cheong Surgical Specialist Klinik 21 Drs. Tong, Leow, Chiam & Partners11 Choy Medical Specialist (Chong Dispensary) - Medan Pasar12 CO Lim Orthopaedic Centre 22 Drs. Tong, Leow, Chiam & Partners- Jln Ampang
Ministry of Health Institutions participating in NMUS surveyNo Ministry of Health Institution No Ministry of Health Institution
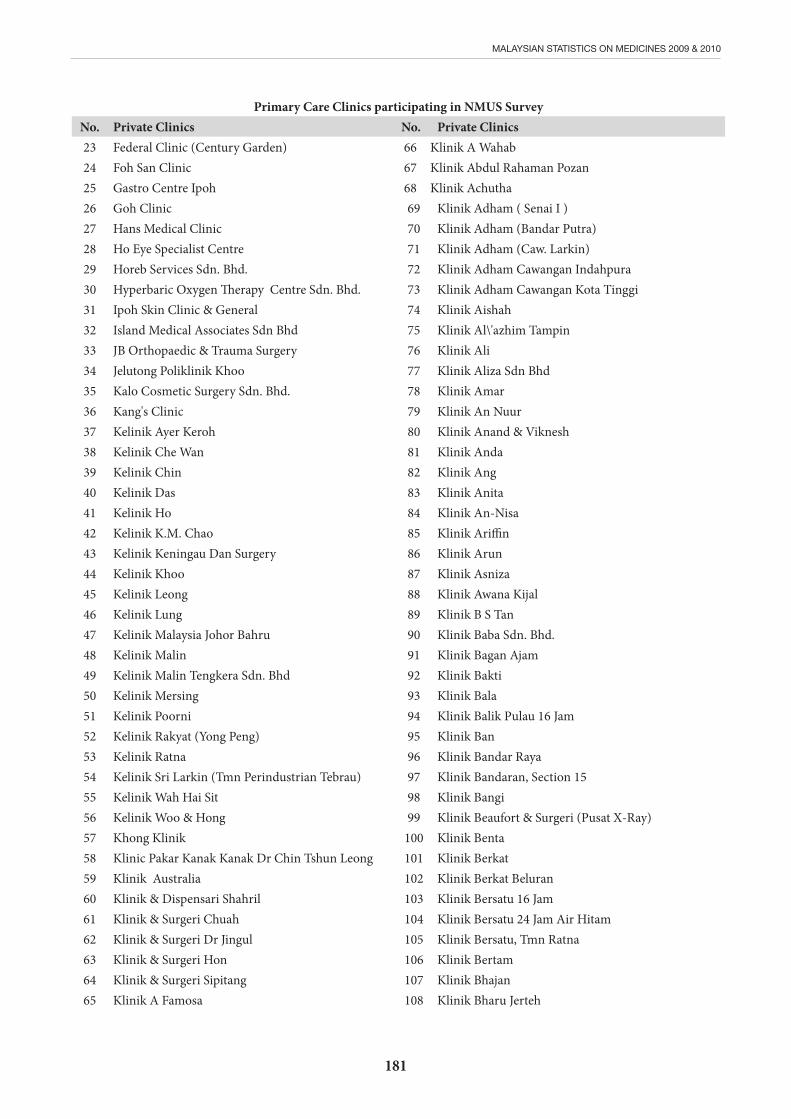
181
MALAYSIAN STATISTICS ON MEDICINES 2009 & 2010
23 Federal Clinic (Century Garden) 66 Klinik A Wahab24 Foh San Clinic 67 Klinik Abdul Rahaman Pozan25 Gastro Centre Ipoh 68 Klinik Achutha26 Goh Clinic 69 Klinik Adham ( Senai I )27 Hans Medical Clinic 70 Klinik Adham (Bandar Putra)28 Ho Eye Specialist Centre 71 Klinik Adham (Caw. Larkin)29 Horeb Services Sdn. Bhd. 72 Klinik Adham Cawangan Indahpura30 Hyperbaric Oxygen Therapy Centre Sdn. Bhd. 73 Klinik Adham Cawangan Kota Tinggi31 Ipoh Skin Clinic & General 74 Klinik Aishah32 Island Medical Associates Sdn Bhd 75 Klinik Al\'azhim Tampin33 JB Orthopaedic & Trauma Surgery 76 Klinik Ali34 Jelutong Poliklinik Khoo 77 Klinik Aliza Sdn Bhd35 Kalo Cosmetic Surgery Sdn. Bhd. 78 Klinik Amar36 Kang's Clinic 79 Klinik An Nuur37 Kelinik Ayer Keroh 80 Klinik Anand & Viknesh38 Kelinik Che Wan 81 Klinik Anda39 Kelinik Chin 82 Klinik Ang40 Kelinik Das 83 Klinik Anita41 Kelinik Ho 84 Klinik An-Nisa42 Kelinik K.M. Chao 85 Klinik Ariffin43 Kelinik Keningau Dan Surgery 86 Klinik Arun44 Kelinik Khoo 87 Klinik Asniza45 Kelinik Leong 88 Klinik Awana Kijal46 Kelinik Lung 89 Klinik B S Tan47 Kelinik Malaysia Johor Bahru 90 Klinik Baba Sdn. Bhd.48 Kelinik Malin 91 Klinik Bagan Ajam49 Kelinik Malin Tengkera Sdn. Bhd 92 Klinik Bakti50 Kelinik Mersing 93 Klinik Bala51 Kelinik Poorni 94 Klinik Balik Pulau 16 Jam52 Kelinik Rakyat (Yong Peng) 95 Klinik Ban53 Kelinik Ratna 96 Klinik Bandar Raya54 Kelinik Sri Larkin (Tmn Perindustrian Tebrau) 97 Klinik Bandaran, Section 1555 Kelinik Wah Hai Sit 98 Klinik Bangi56 Kelinik Woo & Hong 99 Klinik Beaufort & Surgeri (Pusat X-Ray)57 Khong Klinik 100 Klinik Benta58 Klinic Pakar Kanak Kanak Dr Chin Tshun Leong 101 Klinik Berkat59 Klinik Australia 102 Klinik Berkat Beluran60 Klinik & Dispensari Shahril 103 Klinik Bersatu 16 Jam61 Klinik & Surgeri Chuah 104 Klinik Bersatu 24 Jam Air Hitam62 Klinik & Surgeri Dr Jingul 105 Klinik Bersatu, Tmn Ratna63 Klinik & Surgeri Hon 106 Klinik Bertam64 Klinik & Surgeri Sipitang 107 Klinik Bhajan65 Klinik A Famosa 108 Klinik Bharu Jerteh
Primary Care Clinics participating in NMUS SurveyNo. Private Clinics No. Private Clinics
182
MALAYSIAN STATISTICS ON MEDICINES 2009 & 2010
Primary Care Clinics participating in NMUS SurveyNo. Private Clinics No. Private Clinics
109 Klinik Britain110 Klinik Budi Sungai Ara111 Klinik Bukit Jambul112 Klinik C K Chan113 Klinik Ceria114 Klinik Chai115 Klinik Cham116 Klinik Chan & Ng117 Klinik Chee118 Klinik Cheng119 Klinik Cheng & Su, Tmn Sejati Indah120 Klinik Cheng & Su, Wisma Bandaran121 Klinik Chew Dan Surgeri122 Klinik Chin123 Klinik Chin & Surgeri124 Klinik Chin, Jln Sultan Sulaiman125 Klinik Choo126 Klinik Chua127 Klinik Chung & Hon128 Klinik Cinta Sayang, Tmn Ria jaya129 Klinik Comfort130 Klinik Cybermedik131 Klinik Cyril Songan132 Klinik Dan Surgeri Taman Daya133 Klinik Daya Singh Sdn Bhd134 Klinik Desa Ara135 Klinik Dhass Sdn Bhd136 Klinik Diong Mee Nee137 Klinik Doktor Lee138 Klinik Dominic Songan139 Klinik Doreen Khoo140 Klinik Dr Adam141 Klinik Dr Azizah, Tmn Dagang142 Klinik Dr Choo & Liew143 Klinik Dr Choong Dan Jenny Physiotherapy144 Klinik Dr Fateh Mohd dan Rakan-Rakan145 Klinik Dr Halim & Nor146 Klinik Dr Halim Sdn Bhd147 Klinik Dr Kamaludin148 Klinik Dr Lee149 Klinik Dr Lo150 Klinik Dr Monty151 Klinik Dr Najiha
152 Klinik Dr Nida153 Klinik Dr Ramzi154 Klinik Dr Rashidah155 Klinik Dr Rosly156 Klinik Dr Tan Kok Sui157 Klinik Dr. Elis158 Klinik Dr. Jammy Suzana159 Klinik Dr. Kassim160 Klinik Dr. Kon161 Klinik Dr. Kuan Pui Seng162 Klinik Dr. Ng S.G.163 Klinik Dr. Norliazura164 Klinik Dr. Wan Abdul Kadir165 Klinik Dr. Yasiman Perdana166 Klinik Dr.Raimah & X-Ray167 Klinik Dr.Zanawati168 Klinik Eirena169 Klinik Fa\'iza Dan Rakan Rakan170 Klinik Faisal Hamdi171 Klinik Famili172 Klinik Famili Shah Alam173 Klinik Family Hill City174 Klinik Farisya175 Klinik Fatah & Abdullah176 Klinik Fateh Mohd & Rakan-Rakan177 Klinik Fatimah178 Klinik Fernandez Lunas179 Klinik Foo180 Klinik Foong181 Klinik G.S182 Klinik Gan Surgery183 Klinik Genting Uni-Med, Gohtong Jaya184 Klinik Githa (Tmn Mesra, Saleng)185 Klinik Githa, Kelapa Sawit186 Klinik Githa, Tmn Kulai Utama187 Klinik Glugor188 Klinik Goh189 Klinik Goh & Surgeri190 Klinik Gurdip191 Klinik Gurun192 Klinik H.T. Lee
193 Klinik Halbans
194 Klinik Hasbullah

183
MALAYSIAN STATISTICS ON MEDICINES 2009 & 2010
Primary Care Clinics participating in NMUS SurveyNo. Private Clinics No. Private Clinics
195 Klinik Hee
196 Klinik Hee & Annandan Sdn Bhd
197 Klinik Hee (Batang Melaka)
198 Klinik Hee Annandan & Siva
199 Klinik Ho
200 Klinik Ho & Fong
201 Klinik Hon
202 Klinik Hooi
203 Klinik Hosanna
204 Klinik Huang
205 Klinik Hussien
206 Klinik i Care
207 Klinik Idzham Sdn. Bhd, Danau Kota
208 Klinik Ikthiar Kota Jambal
209 Klinik Iman
210 Klinik Inn
211 Klinik Insaf
212 Klinik Insan
213 Klinik Insan Sdn Bhd (Tmn U)
214 Klinik Intan, Johor Bahru
215 Klinik Inthira / Joe Fernandez
216 Klinik Ishi
217 Klinik Isza
218 Klinik Jamaliah
219 Klinik jaya
220 Klinik Joe Fernandez
221 Klinik Joe Fernandez - Tmn Nagasari
222 Klinik Joseph Varghese
223 Klinik Julian Wee
224 Klinik Kamal
225 Klinik Kanak-Kanak Lim
226 Klinik Kanak-kanak Yee & Klinik Lee
227 Klinik Kaulsay
228 Klinik Kaunseling Penawar Care
229 Klinik Kelana Puteri
230 Klinik Keluarga
231 Klinik Keluarga (Segamat)
232 Klinik Keluarga Dan Surgeri
233 Klinik Keluarga Dr.Fauziah
234 Klinik Keluarga Keningau
235 Klinik Keluarga Lee
236 Klinik Kesihatan Ayer Hitam, Batu Pahat
237 Klinik Kesihatan Ayer Molek
238 Klinik Kesihatan Badang
239 Klinik Kesihatan Bagan
240 Klinik Kesihatan Bakar Arang
241 Klinik Kesihatan Bakri
242 Klinik Kesihatan Balai
243 Klinik Kesihatan Bandar Alor Setar
244 Klinik Kesihatan Bandar Baharu
245 Klinik Kesihatan Bandar Tun Razak
246 Klinik Kesihatan Batu Kawa
247 Klinik Kesihatan Bestari Jaya
248 Klinik Kesihatan Biawak
249 Klinik Kesihatan Bidor
250 Klinik Kesihatan Bota Kiri
251 Klinik Kesihatan Changkat Jering
252 Klinik Kesihatan Changkat Keruing
253 Klinik Kesihatan Chenderong Balai
254 Klinik Kesihatan Chini
255 Klinik Kesihatan Gaal
256 Klinik Kesihatan Gopeng
257 Klinik Kesihatan Gual Ipoh
258 Klinik Kesihatan Hutan Melintang
259 Klinik Kesihatan Jalan Baru
260 Klinik Kesihatan Jelai
261 Klinik Kesihatan Kampung Bantal
262 Klinik Kesihatan Kampung Gajah
263 Klinik Kesihatan Kedai Empat
264 Klinik Kesihatan Kepala Batas
265 Klinik Kesihatan Kuah
266 Klinik Kesihatan Kuala Balingian
267 Klinik Kesihatan Kuala Kurau
268 Klinik Kesihatan Kuala Sungai Baru
269 Klinik Kesihatan Kulai Besar
270 Klinik Kesihatan Kulim
271 Klinik Kesihatan Lambor Kiri
272 Klinik Kesihatan Lanchang

184
MALAYSIAN STATISTICS ON MEDICINES 2009 & 2010
273 Klinik Kesihatan Lekir
274 Klinik Kesihatan Lenggeng
275 Klinik Kesihatan Lintang
276 Klinik Kesihatan Long Sukang
277 Klinik Kesihatan Lui Muda
278 Klinik Kesihatan Luyang
279 Klinik Kesihatan Mak Mandin
280 Klinik Kesihatan Menglembu
281 Klinik Kesihatan Merbok
282 Klinik Kesihatan Nanga Ensiring
283 Klinik Kesihatan Nanga Entaih
284 Klinik Kesihatan Nanga Patoh
285 Klinik Kesihatan Nanga Semah
286 Klinik Kesihatan Nanga Tau
287 Klinik Kesihatan Nanga Wak
288 Klinik Kesihatan Nibong Tebal
289 Klinik Kesihatan Padang Luas
290 Klinik Kesihatan Padang Matsirat
291 Klinik Kesihatan Pakan
292 Klinik Kesihatan Palong 4,5,6
293 Klinik Kesihatan Pantai
294 Klinik Kesihatan Pengkalan Chepa
295 Klinik Kesihatan Peringgit
296 Klinik Kesihatan Pertang
297 Klinik Kesihatan Pokok Assam
298 Klinik Kesihatan Putrajaya
299 Klinik Kesihatan Redang Panjang
300 Klinik Kesihatan Sambir
301 Klinik Kesihatan Sanggang
302 Klinik Kesihatan Sematan
303 Klinik Kesihatan Sentul
304 Klinik Kesihatan Spaoh
305 Klinik Kesihatan Sungai Acheh
306 Klinik Kesihatan Sungai Bayor
307 Klinik Kesihatan Sungai Lembing
308 Klinik Kesihatan Sungai Limau Dalam
309 Klinik Kesihatan Tanjung Manis
310 Klinik Kesihatan Tanjung Piandang
311 Klinik Kesihatan Tarat
312 Klinik Kesihatan Tasek Gelugor
313 Klinik Kesihatan Tian
314 Klinik Kesihatan Titi
315 Klinik Kesihatan Trong
316 Klinik Kesihatan Tronoh
317 Klinik Kesihatan Trusan
318 Klinik Kesihatan Tubau
319 Klinik Kesihatan Ujong Pasir
320 Klinik Kesihatan Wakaf Bharu
321 Klinik Khaira
322 Klinik Khaw
323 Klinik Khong
324 Klinik Khor.
325 Klinik Khuzaini & Raja Himah Sdn. Bhd.
326 Klinik King
327 Klinik Kip
328 Klinik Kiu
329 Klinik K-K
330 Klinik Klang Anda
331 Klinik Koeh
332 Klinik Koidupan
333 Klinik Kok
334 Klinik Kok Dan Segeri
335 Klinik Kong Dan Rakan-Rakan
336 Klinik Kook
337 Klinik Kota Bharu
338 Klinik Kota, Yong Peng
339 Klinik Kotaraya (Demak Laut)
340 Klinik Krystal
341 Klinik Kulit Pertama
342 Klinik Kumpulan Muslimah
343 Klinik Kwang
344 Klinik L.T. Wong
345 Klinik Lam
346 Klinik Lathika
347 Klinik Lee
348 Klinik Lenggong
349 Klinik Leong
350 Klinik Liew Choo Sin
Primary Care Clinics participating in NMUS SurveyNo. Private Clinics No. Private Clinics
185
MALAYSIAN STATISTICS ON MEDICINES 2009 & 2010
351 Klinik Lim
352 Klinik Lim & Lau
353 Klinik Lim Chin Chong Sdn Bhd
354 Klinik Lim Siew Kim
355 Klinik Looi
356 Klinik Low
357 Klinik Lua, Jln Sultan Yahya Petra
358 Klinik M. Y. Wong
359 Klinik Mahkota
360 Klinik Maiza
361 Klinik Makmur
362 Klinik Malaysia
363 Klinik Malaysia (Cawangan Jalan Pantai)
364 Klinik Malaysia (Cawangan Sesb)
365 Klinik Mamad Sdn Bhd
366 Klinik Mariana Sdn. Bhd
367 Klinik Masjid Tanah
368 Klinik Medicate Jln Raja Chulan
369 Klinik Medik 24-7, Bandar Country Homes
370 Klinik Medinosis
371 Klinik Medisense Cheras
372 Klinik Medisense.
373 Klinik Mohan
374 Klinik Mok & Loh
375 Klinik Mulia Pasir Gudang
376 Klinik Munnir
377 Klinik Murshid & Tharizah Sdn. Bhd
378 Klinik Mutiara
379 Klinik Mutiara Inanam
380 Klinik Nabilah
381 Klinik Nagoke Sdn Bhd
382 Klinik Naharajan & Imaging Centre
383 Klinik Nasha
384 Klinik Nasir & Surgeri
385 Klinik Naveen
386 Klinik Ng
387 Klinik Ng & Rakan Rakan
388 Klinik Ng Sendirian
389 Klinik Nik
390 Klinik Nik Amrah & Zaliha Sdn Bhd
391 Klinik Nik Amrah & Zaliha Sdn. Bhd
392 Klinik Nirmala
393 Klinik Noh
394 Klinik Noor Shila
395 Klinik Nuqman
396 Klinik P. N. Teoh
397 Klinik P.H Yew
398 Klinik Pakar Dr Adnan Osman (Poliklinik Pakar Perubatan Jitra)
399 Klinik Pakar Dr. Leonard
400 Klinik Pakar George Thava
401 Klinik Pakar Kanak-Kanak Butterworth
402 Klinik Pakar Kanak-Kanak Choo
403 Klinik Pakar Kanak-Kanak dan Bayi Dr Wong Ming Chee.
404 Klinik Pakar Kanak-Kanak Ho
405 Klinik Pakar Kanak-Kanak Kulim
406 Klinik Pakar Kanak-Kanak Lee
407 Klinik Pakar Kanak-Kanak Loo
408 Klinik Pakar Kanak-Kanak Pelangi Sdn Bhd
409 Klinik Pakar Kanak-Kanak S.T. Lim
410 Klinik Pakar Kanak-Kanak T.C. Yeo
411 Klinik pakar kanak-Kanak Tan
412 Klinik Pakar Kanak-kanak Tang
413 Klinik Pakar Kanak-Kanak Teow
414 Klinik Pakar Mata Anna
415 Klinik Pakar Mata Dan Surgeri Masran (Tmn Berlian)
416 Klinik Pakar Mata Khong Sdn Bhd
417 Klinik Pakar Orthopedik John Anatham
418 Klinik Pakar Perubatan Century
419 Klinik Pakar Perubatan Ch Ng
420 Klinik Pakar Perubatan Chan
421 Klinik Pakar Perubatan Foo
422 Klinik Pakar Perubatan Ho
423 Klinik Pakar Wanita dan Kanak-Kanak CT
424 Klinik Pakar Wanita K.C. Foo
425 Klinik Pakar Wanita Tan
426 Klinik Pantai, Rantau
Primary Care Clinics participating in NMUS SurveyNo. Private Clinics No. Private Clinics
186
MALAYSIAN STATISTICS ON MEDICINES 2009 & 2010
427 Klinik Papar Medical Group
428 Klinik Parit Yaani
429 Klinik Pekan
430 Klinik Penawar & Surgeri, Kluang
431 Klinik People (Permas Jaya)
432 Klinik Perdana - Bgn PKINK
433 Klinik Perdana Cawangan Islah
434 Klinik Perdana Melor
435 Klinik Perintis Health Care
436 Klinik Pertama
437 Klinik Pertama ( Tmn Johor Jaya )
438 Klinik Perubatan & Surgeri Dr. Ahmad
439 Klinik Perubatan Chan
440 Klinik Pillai
441 Klinik Pontian
442 Klinik Praba
443 Klinik Prihatin
444 Klinik Public
445 Klinik Public, Kulai
446 Klinik Puteri Anwar
447 Klinik Putra
448 Klinik Ragavan
449 Klinik Rahim Hamzah Halim & Razali Sdn Bhd (Batu 6)
450 Klinik Rahim Hamzah Halim & Razali Sdn Bhd (Jln Sultan Omar)
451 Klinik Rahimah
452 Klinik Rakyat
453 Klinik Ramli & Adibah
454 Klinik Rantau Petronas
455 Klinik Rapha
456 Klinik Rashid Dan Raudhah
457 Klinik Ratnam
458 Klinik Rawatan Ahsan
459 Klinik Rawatan Keluarga
460 Klinik Razak
461 Klinik Redzuan
462 Klinik Rembau
463 Klinik Reuben
464 Klinik Revin
465 Klinik Robert Wong
466 Klinik Rohani
467 Klinik Rompin
468 Klinik Roslina
469 Klinik Rusli
470 Klinik Rusnah
471 Klinik S F Chung
472 Klinik S. T. Ng
473 Klinik Sabrina
474 Klinik Sairam
475 Klinik Sanan
476 Klinik Sandhu Senai
477 Klinik Saujana
478 Klinik Sayyida Sdn.Bhd.
479 Klinik Sein
480 Klinik Sejahtera (Pt. Raja)
481 Klinik Selesa Jaya
482 Klinik Senggarang (Klinik Teo & Tan Sdn BHd)
483 Klinik Sentosa
484 Klinik Sentul
485 Klinik Seong
486 Klinik Seremban
487 Klinik Seri Pulau
488 Klinik Shafee
489 Klinik Shaik M. R.
490 Klinik Shanti
491 Klinik Shatin
492 Klinik Shifak
493 Klinik Sia Dan Surgeri
494 Klinik Siau
495 Klinik Sidhu
496 Klinik Simee
497 Klinik Sinaran
498 Klinik Singapore
499 Klinik Siva
500 Klinik Skudai
501 Klinik Sohvindir
502 Klinik Soma
503 Klinik Soong
Primary Care Clinics participating in NMUS SurveyNo. Private Clinics No. Private Clinics
187
MALAYSIAN STATISTICS ON MEDICINES 2009 & 2010
504 Klinik Special
505 Klinik Sri Cengal
506 Klinik Sri Penawar
507 Klinik Sri Pinang
508 Klinik Sri Rambai
509 Klinik Sri Sulong
510 Klinik Su
511 Klinik Suhaila
512 Klinik Sulaiman
513 Klinik Sulaiman Jerantut
514 Klinik Sulaiman, Jengka
515 Klinik Swaran
516 Klinik Syed Alwi dan Chandran
517 Klinik Syed Badaruddin
518 Klinik Syed Salleh Dan Rakan-Rakan Sdn. Bhd
519 Klinik Syifaa
520 Klinik Tai
521 Klinik Tampin
522 Klinik Tan & Appaduray.
523 Klinik Tan & Lum (Benut)
524 Klinik Tan & Lum (Pekan Nenas)
525 Klinik Tan Dan Rakan-Rakan
526 Klinik Tan Dan Surgeri
527 Klinik Tawakal, Rengit
528 Klinik Team Medic
529 Klinik Tee
530 Klinik Teo
531 Klinik Teo ( Klinik Teo & Tan Sdn Bhd )
532 Klinik Teoh Kim Yong
533 Klinik Teong
534 Klinik Theesan (Taman U)
535 Klinik Toledo
536 Klinik Tony Sim Tong Aik
537 Klinik Topcare ( ALMA ) Sdn Bhd
538 Klinik Tropika Sdn Bhd
539 Klinik Tune
540 Klinik Tweedie
541 Klinik Ujong Pasir
542 Klinik Uma
543 Klinik Ummi
544 Klinik Ummi Azizan
545 Klinik Ummu Roihan Sdn Bhd
546 Klinik United
547 Klinik Utama
548 Klinik Utama & Surgeri
549 Klinik Utama Ipoh
550 Klinik Utama Kosas
551 Klinik Vijayapadmam
552 Klinik Wakaf An-Nur
553 Klinik Wan Fatimah
554 Klinik Wan Suhaimi
555 Klinik Wang
556 Klinik Wanita Wisma Maria
557 Klinik Waqaf An-Nur
558 Klinik Waqaf An-Nur Sarawak
559 Klinik Wawasan
560 Klinik Widuri
561 Klinik Widury
562 Klinik Wira
563 Klinik Wong (Jln Senohong Dua)
564 Klinik Wong (Jln Temenggong)
565 Klinik Wong Choong Howe
566 Klinik Y. L. Khoo Sdn Bhd
567 Klinik Y. M. Lo
568 Klinik Yahya
569 Klinik Yasmin
570 Klinik Yee
571 Klinik Yeoh & Ong
572 Klinik Yeoh Oon Theam Sdn. Bhd
573 Klinik Yii
574 Klinik Yong & Ng
575 Klinik Yusof
576 Klinik Zahra
577 Klinik Zainab
578 Klinik Zainon
579 Klinik Zalfah
580 Klinik Zalina
581 Klinik Zulkifli (Poliklinik & Surgeri)
Primary Care Clinics participating in NMUS SurveyNo. Private Clinics No. Private Clinics
188
MALAYSIAN STATISTICS ON MEDICINES 2009 & 2010
582 Kota Kinabalu Clinic
583 Kumpulan Perubatan SMP Sdn. Bhd (Klinik Pertama)
584 Lee Eye Centre Sdn Bhd
585 Lim Dispensary
586 Lim Eye Specialist Clinic
587 Lim Kok Chee Ear,Nose & Throat Surgery Sdn Bhd
588 Lim Skin Specialist Clinic
589 Ling Eye Specialist Clinic & Surgery
590 Loh Cosmetic & Laser Surgery
591 Loh Medical Clinic
592 Low gastroenterology & Medical Clinic
593 Luke Klinik
594 Marvin Chong Specialist Clinic
595 Mediklinik Ehsan Alor Setar
596 Medi-klinik Teh
597 Merdeka Health Care Clinic
598 Moses Ear, Nose & Throat Clinic
599 Neong Pusat Pakar Perbidanan & sakit Puan
600 New Town Poliklinik
601 Ng Siew Eng Women Specialist Clinic
602 Occupational Health Centre
603 Oh Klinik Pakar Kanak-Kanak
604 Optimax Eye Specialist Centre
605 PC Gastro Medical Specialist Centre Sdn Bhd
606 Peoples kelinik
607 Perdana Polyclinic Lumut
608 Perfect Outcome Sdn Bhd
609 Permai Polyclinics Lintas Plaza
610 Permai Polyclinics Sdn. Bhd
611 Petronas Fertilizer (Kedah) Sdn. Bhd. Industrial Clinic
612 Policlinic Qualimedic Sdn Bhd
613 Polikelinik Bakti, Parit Buntar
614 Poliklinik & Surgeri Batu Gajah
615 Poliklinik Afiat
616 Poliklinik Alex
617 Poliklinik Aman
618 Poliklinik Amin
619 Poliklinik Anggerik
620 Poliklinik Berkat
621 Poliklinik Cempaka (Tmn Air Biru)
622 Poliklinik Chen
623 Poliklinik Chiah
624 Poliklinik Chik
625 Poliklinik Dahlia
626 Poliklinik Damai & Surgeri, Tmn Desa Jaya
627 Poliklinik dan Surgeri Khor
628 Poliklinik Dan Surgeri Rahang (Cawangan Rasah Jaya)
629 Poliklinik Dan Surgeri Serdang
630 Poliklinik Desa Permai
631 Poliklinik Dr Chan
632 Poliklinik Dr. Azhar & Rakan-rakan
633 Poliklinik Dr. Azhar & Rakan-rakan, Plaza Kuala Kedah
634 Poliklinik Dr. C.Y.Ong Sdn. Bhd.
635 Poliklinik Dr. Jalaludin
636 Poliklinik Dr. Velu
637 Poliklinik Duta Jaya
638 Poliklinik Fair Park
639 Poliklinik Famili
640 Poliklinik Fatimah (Taman Daya)
641 Poliklinik Hashim, Sabariah Mohamad
642 Poliklinik Hidayah
643 Poliklinik Hidayah Sdn. Bhd.
644 Poliklinik Hidayah, Kamunting
645 Poliklinik Hijrah (Tmn Puteri Wangsa)
646 Poliklinik Idaman
647 Poliklinik Ihsan (Tmn Kempas)
648 Poliklinik Impian
649 Poliklinik Ipoh Jaya
650 Poliklinik Jaya Skudai
651 Poliklinik Johari
652 Poliklinik John
653 Poliklinik Khor & Arun, Sg Besi
654 Poliklinik Koh
655 Poliklinik Komuniti Air Tawar 2
656 Poliklinik Komuniti Al-Muktafi Billah Shah
Primary Care Clinics participating in NMUS SurveyNo. Private Clinics No. Private Clinics
189
MALAYSIAN STATISTICS ON MEDICINES 2009 & 2010
657 Poliklinik Komuniti Banai
658 Poliklinik Komuniti Batu Anam
659 Poliklinik Komuniti Bukit Besar
660 Poliklinik Komuniti Bundu Tuhan
661 Poliklinik Komuniti Hulu Langat (Klinik Kesihatan Batu 13 1/4)
662 Poliklinik Komuniti Jalan Putra
663 Poliklinik Komuniti Jenjarom
664 Poliklinik Komuniti Jeram
665 Poliklinik Komuniti Kampong Raja type 3
666 Poliklinik Komuniti Kampung Majidee
667 Poliklinik Komuniti Kampung Soeharto
668 Poliklinik Komuniti Karakit
669 Poliklinik Komuniti Ketengah Jaya
670 Poliklinik Komuniti Kg. Bandar
671 Poliklinik Komuniti Klang
672 Poliklinik Komuniti Kota Sarang Semut
673 Poliklinik Komuniti Laka Temin
674 Poliklinik Komuniti Paginatan
675 Poliklinik Komuniti Parit Jawa
676 Poliklinik Komuniti Penangah
677 Poliklinik Komuniti Perancangan
678 Poliklinik Komuniti Pokok Sena
679 Poliklinik Komuniti Pontian (Klinik Kesihatan Pontian)
680 Poliklinik Komuniti Selayang Baru
681 Poliklinik Komuniti Seri Kembangan
682 Poliklinik Komuniti Shah Alam
683 Poliklinik Komuniti Sungai Buloh
684 Poliklinik Komuniti Sungai Pelek
685 Poliklinik Komuniti Telaga
686 Poliklinik Komuniti Telok Datok
687 Poliklinik Komuniti Tinangol
688 Poliklinik Komuniti Tongod
689 Poliklinik Komuniti Tunjang
690 Poliklinik Komuniti Ulu Tiram
691 Poliklinik Kuan
692 Poliklinik Kuek
693 Poliklinik Kumpulan City - Dataran Templer
694 Poliklinik Kumpulan City - Sri Damansara
695 Poliklinik Laksmana Dan Surgeri
696 Poliklinik Leong
697 Poliklinik Leong & Ho
698 Poliklinik Limlee (formerly Poli Klinik)
699 Poliklinik Mah
700 Poliklinik Manjit
701 Poliklinik Maxwell
702 Poliklinik Medic
703 Poliklinik Meor
704 Poliklinik Merdeka
705 Poliklinik Mesra
706 Poliklinik Mulia Jaya
707 Poliklinik Mutiara Cawangan Simpang Kuala
708 Poliklinik Mutiara, Tmn Desa Aman
709 Poliklinik Ng
710 Poliklinik Noriha
711 Poliklinik Ooi
712 PoliKlinik P & Lee (Taman Intan)
713 Poliklinik Pakar Dan Surgeri
714 Poliklinik Pan-Medic
715 Poliklinik Pan-Medic (Farlim)
716 Poliklinik Penawar
717 Poliklinik Penawar - Felda Tenggaroh 2
718 Poliklinik Penawar - Kg Pasir, Tampoi
719 Poliklinik Penawar - Kolam Air
720 Poliklinik Penawar - Masai
721 Poliklinik Penawar - Tanjung Sedili
722 Poliklinik Penawar - Tmn Bintang, Senai
723 Poliklinik Penawar - Tmn Dahlia
724 Poliklinik Penawar - Tmn Daya
725 Poliklinik Penawar - Tmn Istimewa Pandan
726 Poliklinik Penawar - Tmn Rinting
727 Poliklinik Penawar - Tmn Sri Bahagia
727 Poliklinik Penawar - Tmn Sri Bahagia
728 Poliklinik Penawar - Tmn Universiti
729 Poliklinik Penawar (Felda Kledang)
730 Poliklinik Penawar (Jalan Suasa, Pasir Gudang)
731 Poliklinik Penawar (Pusat Bandar, Bandar Penawar)
732 Poliklinik Penawar (Tmn Air Biru)
Primary Care Clinics participating in NMUS SurveyNo. Private Clinics No. Private Clinics

190
MALAYSIAN STATISTICS ON MEDICINES 2009 & 2010
733 Poliklinik Penawar (Tmn Johor Jaya)
734 Poliklinik Penawar (Tmn Kota Masai, Jln Betik)
735 Poliklinik Penawar (Tmn Tun Sri Lanang)
736 Poliklinik Permai
737 Poliklinik Permata, Tmn Permata
738 Poliklinik Porkodi
739 Poliklinik PTP
740 Poliklinik Puteri Dan Surgeri (Jln Niaga, Kota Tinggi)
741 Poliklinik Rakyat - Cawangan Kota Kinabalu
742 Poliklinik Rakyat - Cawangan Putatan
743 Poliklinik Raub & Surgery
744 Poliklinik Ravi
745 Poliklinik Reservoir Garden
746 Poliklinik Rozikin (Masai)
747 Poliklinik Salehudin
748 Poliklinik Sandhu
749 Poliklinik Sejahtera
750 Poliklinik Sejahtera Sdn Bhd
751 Poliklinik Seri Iskandar
752 Poliklinik Sg Jelok
753 Poliklinik Simpang
754 Poliklinik Sunli
755 Poliklinik Sunway
756 Poliklinik Suri
757 Poliklinik Sutera
758 Poliklinik T M Chan
759 Poliklinik Taj 24 Jam, Taman Tampoi Utama
760 Poliklinik Tan
761 Poliklinik Tan & Wong
762 Poliklinik Tanjung
763 Poliklinik Taqwa Simpang Pulai
764 Poliklinik Universiti
765 Poliklinik Utama
766 Poliklinik V-Care
767 Poliklinik Wahidah
768 Poliklinik Zakariya
769 Premier Polyclinic Kingfisher
770 Prince Court Medical Centre
771 Public Poliklinik
772 Pusat Pakar Tulang & Sendi Dr. Yew Khoon Seng
773 Pusat Perubatan Julia
774 Pusat Rawatan An-Nur (Dr.Rosnani)
775 Pusat Tulang Dan Osteoporosis DXA Sdn Bhd
776 Rajagopal Specialist Clinic Sdn. Bhd.
777 Reddy Klinik Butterworth
778 Sarawak Specialist Clinic
779 Selva Klinik
780 Sentosa Klinik Kuantan
781 Sentosa Klinik Taman Tas
782 Sethu Medical Clinic
783 Siburan Union Clinic
784 Simon Wong Medical Specialist Clinic
785 Singapore Children and Family Clinic
786 Sinsuran Clinic
787 Specialist Maternity & Fertility Centre
788 Taiping Specialist Clinic
789 Tang Clinic
790 Tay & Tan Medicare Sdn Bhd ( T & T Clinic)
791 Tay Specialist Surgical Sdn Bhd
792 Teng & Ho Clinic Sdn Bhd
793 Teoh & Tang,Pakar Wanita & Kesuburan,Women Specialist Clinic
794 Teoh Eye Clinic & Surgery
795 The Merican Dispensary
796 The People Dispensary Sdn Bhd (Jln Ibrahim)
797 The People Dispensary Sdn Bhd (Klinik People Masai)
798 Thong Klinik
799 Ting & Ding Surgery Sdn Bhd
800 Titan Inplant Clinic Tg Langsat
801 Titan P Gudang Inplant Clinic
802 Union Clinic
803 Union Clinic (S.A)
804 Wan Lee Seng Specialist Eye Centre Sdn Bhd
805 Wee Kidney & Medical Specialist Clinic Sdn Bhd
806 Yap Psychiatry Specialist Clinic
807 Yoong Clinic Sdn. Bhd
Primary Care Clinics participating in NMUS SurveyNo. Private Clinics No. Private Clinics
191
MALAYSIAN STATISTICS ON MEDICINES 2009 & 2010
Pharmacies participating in NMUS surveyNo. Private Pharmacies No Private Pharmacies
1 51 Avenue Pharmacy Sdn Bhd - Kajang2 51 Avenue Pharmacy Sdn Bhd - Sek 8,
Bdr Baru Bangi3 AA Pharmacy Sdn Bhd4 Abby Pharmacy5 Ace Caring Pharmacy Sdn Bhd6 Activecare Pharmacy Sdn. Bhd.7 AEON Co (M) Bhd.8 Aeon Co. (M) Bhd9 Aeon Co. (M) Bhd (Aeon Wellness Pharmacy)
10 Aeon Co. (M) Bhd (Wellness Pharmacy)11 Aeon Wellness Pharmacy12 AG Pharmacy Sdn.Bhd.13 AK Pharmacy & Naturopathy Centre14 Alcare Pharmacy Sdn Bhd15 Alchemist Pharmacy Sdn Bhd16 Alex Pharmacy17 Alice Pharmacy Sdn Bhd18 Aliph Pharmacy,19 All Care Pharmacy20 All Health Medical Supplies21 Allcare Pharmahealth22 Allin Pertama Pharmacy Sdn Bhd23 Allin Pharmacy24 Alpha Clinics Sdn Bhd25 Alpha.com (ABC) - Pandan Indah26 Alpro Pharmacy (PG) Sdn.Bhd.27 Alpro Pharmacy Holdings Sdn Bhd28 Alpro Pharmacy Holdings Sdn Bhd - Sirusa Jaya,
Teluk Kemang29 Alpro Pharmacy Sdn Bhd - Oceanic Mall, Port
Dickson30 Alpro Pharmacy Sdn. Bhd.31 Alsyifaa Farmasi (Jerantut) Sdn Bhd32 Alsyifaa Farmasi (Pekan) SB33 Always Pharmacy Sdn Bhd34 AM PM Pharmacy Sdn Bhd35 Amcal Pharmacy Sdn Bhd36 Ancare Pharmacy37 Ang Pharmacy38 Apex Pharmacy Sdn. Bhd - City Square39 Apo’s Pharmacy40 Apple Green Pharmacy41 April Pharmacy
42 A-Remedy Pharmacy Sdn.Bhd.43 Armanee Pharmacy Sdn Bhd44 Axis Pharmacy Sdn.Bhd.45 B Y Chan Pharmacy Sdn Bhd - Channel road46 B.B. Pharmacy Sdn.Bhd.47 B.J Pharmacy48 Bahagia Jingga (M) Sdn. Bhd.49 Bahau Pharmacy SB50 Bahau Pharmacy Sdn Bhd51 Bahau Pharmacy Sdn. Bhd.52 Balik Pulau Health-Care53 Baling Pharmacy Sdn. Bhd.54 Bandar Sunway Pharmacy55 Bath Pharmacy Sdn. Bhd.56 Batu Lintang Pharmacy Sdn. Bhd57 BB Boss Sdn Bhd58 BB Pharmaceutical59 Be Caring Pharmacy Sdn Bhd - Jalan 14/2060 Be Caring Sdn Bhd61 Be Med Sdn Bhd 62 Be Pharmacy - Puchong Perdana63 Bemed (SP) Sdn Bhd64 Bemed Lagenda Sdn. Bhd65 Bemed Venture Sdn Bhd (Be Pharmacy)66 Be-P Pharmacy67 Berry Pharmacy68 Bettercare Pharmacy Sdn Bhd69 Big Bee Pharmacy Sdn Bhd70 Bintulu Pharmacy (M) Sdn Bhd - Sg Chua, Kajang71 Bintulu Pharmacy (Semenyih) Sdn Bhd72 Biocare Pharmacy73 Bio-Care Pharmacy Sdn Bhd74 Biochem Pharmacy75 Biofresh Growth Sdn Bhd76 Biohealth Pharmacy Sdn Bhd77 Biolife Plus Pharmacy Sdn Bhd78 Biopharma Link Pharmacy Sdn.Bhd.79 BM Sentosa Pharmacy80 Bond Mega Pharmacy81 Boon Pharmacy Sdn Bhd82 Boon Pharmacy Sdn.Bhd.83 Borneo Dispensary (2) Sdn Bhd84 Borneo Dispensary (Batu 1) Sdn. Bhd
192
MALAYSIAN STATISTICS ON MEDICINES 2009 & 2010
85 Borneo Dispensary (Batu 8) Sdn. Bhd.86 Borneo Dispensary Indah Sdn. Bhd.87 Borneo Dispensary Sdn Bhd88 Breeds Pharmacy89 Breeds Pharmacy Sdn. Bhd.90 Bright Pharmacy Sdn Bhd91 BrightCare Pharmacy92 Bukit Baru Pharmacy Sdn Bhd93 Bukit Mertajam Pharmacy Sdn Bhd 94 C S Lo Pharmacy95 Cameron Pharmacy Sdn Bhd96 Campbell Pharmacy Sdn.Bhd.97 CareLink Pharmacy98 Caremart Pharmacy99 Carene Pharmacy
100 Careplus Pharmacy Sdn. Bhd.101 Caring `N` You Pharmacy Sdn Bhd102 Caring Belle Sdn Bhd - Jln SS2/67103 Caring Health Solutions Sdn Bhd104 Caring Pharmacy (MSF) Sdn Bhd105 Caring Pharmacy (Puchong) Sdn Bhd106 Caring Pharmacy Retail Management Sdn. Bhd107 Caring Pharmacy Sdn Bhd - Bandar Utama108 Caring Pharmacy Sdn Bhd - Happy Garden109 Caring Pharmacy Sdn Bhd - Hartamas110 Caring Pharmacy Sdn Bhd - Sea Park 111 Caring Pharmacy Sdn Bhd - Tmn Kinrara112 Caring Pharmacy Sdn Bhd - Tmn Kok Lian113 Caring Pharmacy Sdn Bhd - Tmn Muda114 Ce-Link Pharmacy Sdn Bhd115 Central Park Pharmacy116 Central Pharmacy Sdn Bhd 117 Centre Point Pharmacys Sdn Bhd 118 Century Pharmacy119 Century Pharmacy Sdn Bhd120 Chen Pharmacy121 Chen Pharmacy 122 Cheryl Pharmacy123 Chester Street Pharmacy124 Chong Guan Pharmacy125 Chuan Pharmacy126 City Healthcare Pharmacy (Air Itam)Sdn.Bhd.127 City Healthcare Pharmacy (Farlim) Sdn.Bhd.
128 City Medic Pharmacy (M) Sdn Bhd129 City Parade Pharmacy130 City Pharmacy131 Citycare Pharmacy132 CK Pharmacy133 CL SU Pharmacy Sdn Bhd134 CMCORP Pharmacy (M) Sdn. Bhd.135 Coco Mart (M) Sdn Bhd136 Complete Wellness Pharmacy SB137 Concept Pharmacy138 Cp Centrecare Pharmacy Sdn. Bhd.139 Cyntex Marketing & Services140 D E Farmasi Sdn Bhd141 Dailycare Pharmacy Sdn Bhd142 Damai Pharmacy (Brighton Hope Sdn Bhd)-
Choice Supermall143 Damai Pharmacy (Brighton Hope Sdn Bhd)-
Desa Ilmu144 Damirals Care Pharmacy145 Danau Desa Pharmacy Sdn Bhd146 D'Ansara PharmaShoppe & H'care SB147 Darlina Pharmacy148 Darul Intelek Pharma Sdn Bhd149 DE Farmasi (Silibin) Sdn Bhd150 De Pharmacy151 Dekad Pharmacy152 Delima Farmasi Sdn Bhd153 Desa Farmasi Sdn Bhd - Jln Pasar 154 Desa Farmasi Sdn Bhd - Nibong Tebal155 Desa Farmasi Sdn Bhd - Sg. Bakap156 Desa Farmasi Sdn Bhd - Tmn Mutiara157 Desmaju Sdn Bhd158 Desmaju Sdn.Bhd.159 Dextro Pharmacy Sdn. Bhd.160 Dillons Pharmacy Sdn. Bhd.161 Dispergal (M) Sdn Bhd162 D'Lo Concept Sdn Bhd163 DM Pharmacy164 Donggongon Pharmacy165 Doses Pharmacy Sdn Bhd166 Doses Pharmacy Sdn. Bhd.167 Drughouse Supplies168 DY Healthcare Sdn.Bhd.169 E & C Pharmacy
Pharmacies participating in NMUS surveyNo. Private Pharmacies No Private Pharmacies
193
MALAYSIAN STATISTICS ON MEDICINES 2009 & 2010
170 E Care Pharmacy171 E.V. Care Pharmacy172 Econurture Sdn Bhd173 EE Syn Pharmacy Sdn Bhd,174 Eennat Pharmacy175 Ego Pharmacy Sdn Bhd 176 Ego Pharmacy Sdn.Bhd.177 Elim Pharmacy178 Elite Pharmacy Sdn.Bhd.179 ESP Life Healthcare Sdn Bhd180 Eucare Pharmacy Sdn. Bhd.181 Evercare Pharmacy182 Excelcare Chemist183 Expertcare Pharmacy Sdn Bhd184 Exquisite Healthcare Sdn. Bhd.185 Extra Care Pharmacy Sdn.Bhd186 Fable Region Sdn Bhd187 Famili-Care Pharmacy188 Far East Pharm (LD) Sdn Bhd 189 Far East Pharmacy Sdn Bhd190 Farmasi Mega Care191 Farmasi Afid 192 Farmasi Agape193 Farmasi Aidan194 Farmasi Aiman195 Farmasi Ain Nur196 Farmasi Air Tawar197 Farmasi Aktif198 Farmasi Al Iman199 Farmasi Al-Ahlam200 Farmasi Alang Sdn Bhd201 Farmasi Aldor202 Farmasi Al-Fatiha203 Farmasi Alma204 Farmasi Alpha Gombak205 Farmasi Alpha Sdn. Bhd206 Farmasi Alychem Sdn. Bhd - Kapar, Klang207 Farmasi Alychem Sdn. Bhd - Payar Jeras,
Sg. Buloh208 Farmasi Alychem Sdn. Bhd - Selayang, Batu Caves209 Farmasi Alychem Sdn. Bhd - Sg. Long, Kajang210 Farmasi Alychem Sdn. Bhd - Suntex, Ulu Langat211 Farmasi Aman
212 Farmasi Ampang213 Farmasi Ampangan Sdn Bhd214 Farmasi Ang & Ang215 Farmasi Annees216 Farmasi Apollo217 Farmasi Ara Jaya218 Farmasi Aries219 Farmasi Ariv Vision220 Farmasi Aslam221 Farmasi Aslam - Putatan Square222 Farmasi Aslam (Sabah) S/B223 Farmasi Asnaf224 Farmasi Assabil225 Farmasi Bagan (BW) Sdn.Bhd.226 Farmasi Bagan Sdn. Bhd.227 Farmasi Bagan Sdn.Bhd.228 Farmasi Baiduri Sdn Bhd229 Farmasi Bajrai,230 Farmasi Bakti Sdn. Bhd.231 Farmasi Balakong Sdn Bhd232 Farmasi Bandar Baru Klang233 Farmasi Banting - Jln Bunga Pekan, Banting234 Farmasi Barakah235 Farmasi Batu Berendam236 Farmasi Batu Maung Sdn.Bhd.237 Farmasi Bentong238 Farmasi Bercham239 Farmasi Berkat240 Farmasi Berlian241 Farmasi Bersatu242 Farmasi Berseri243 Farmasi Bertam244 Farmasi Bestari245 Farmasi Bintang246 Farmasi Budaya Sdn. Bhd.247 Farmasi Cahaya248 Farmasi Cahaya Sdn Bhd249 Farmasi Cahaya Timur250 Farmasi Carrie Sdn Bhd251 Farmasi Cemara252 Farmasi Cemerlang253 Farmasi Cenderawasih254 Farmasi Cenderawasih (Bt. 3) SB
Pharmacies participating in NMUS surveyNo. Private Pharmacies No Private Pharmacies
194
MALAYSIAN STATISTICS ON MEDICINES 2009 & 2010
255 Farmasi Cenderawasih (Pekan) SB256 Farmasi Center Point257 Farmasi Chi Liung258 Farmasi Chia259 Farmasi Country Homes260 Farmasi D’Care FN Sdn. Bhd261 Farmasi Dama Sdn Bhd262 Farmasi Damar Laut263 Farmasi Darul Iman264 Farmasi De JS Sdn. Bhd.265 Farmasi Delima266 Farmasi Desa267 Farmasi Dinamik268 Farmasi Dsafia,269 Farmasi Dunia Sihat Sdn. Bhd.270 Farmasi Durian Tunggal271 Farmasi Duyong272 Farmasi Eckerd273 Farmasi Econ 274 Farmasi Ehsan - Jerteh275 Farmasi Ehsan - Machang276 Farmasi Ehsan Marketing277 Farmasi Ehsan PC278 Farmasi Ehsan Sdn Bhd - Pasir Puteh279 Farmasi Ehsan Setiu280 Farmasi Elcarim Sdn Bhd [ Farmasi Alpha.com ]281 Farmasi Eng Ann282 Farmasi Era Baru Sdn. Bhd.283 Farmasi EV Care284 Farmasi Evercare285 Farmasi Evergreen Health Sdn Bhd286 Farmasi Excare287 Farmasi Fajr288 Farmasi Famili289 Farmasi Fisha290 Farmasi Fitrah291 Farmasi Fung 292 Farmasi Gemas293 Farmasi Goh - Bdr Puchong Jaya294 Farmasi Golden Pills295 Farmasi Goodmedic (Bkt. Mewah) Sdn Bhd296 Farmasi Goodmedic (Indah) Sdn Bhd297 Farmasi Goodmedic (KL) Sdn Bhd
298 Farmasi Goodmedic (Midah) Sdn Bhd299 Farmasi Goodmedic (Taming Jaya) Sdn Bhd300 Farmasi Goodmedic Sdn Bhd301 Farmasi Greenland302 Farmasi Greentree303 Farmasi Gua Musang304 Farmasi Haneem305 Farmasi Harmoni306 Farmasi Hata Square307 Farmasi Hayat308 Farmasi Heal N Care309 Farmasi Hijrah Sdn Bhd310 Farmasi Hing Sdn. Bhd.311 Farmasi HKS312 Farmasi Idaman313 Farmasi Idaman Sdn. Bhd.314 Farmasi Ikhlas315 Farmasi Ikhtiar316 Farmasi Ilhami317 Farmasi Iman318 Farmasi Impian,319 Farmasi Impiana320 Farmasi Indah321 Farmasi Iping Sdn.Bhd.322 Farmasi Iqram323 Farmasi Ismi324 Farmasi Jati325 Farmasi Jaya326 Farmasi Jaya Gading327 Farmasi Jeniang (M) Sdn. Bhd.328 Farmasi Jenjarom329 Farmasi Jerai330 Farmasi Jerteh331 Farmasi Juara (Segamat) Sdn Bhd332 Farmasi Juru333 Farmasi Kauthar334 Farmasi Kelana Jaya Sdn Bhd335 Farmasi Kenangan336 Farmasi Kepala Batas337 Farmasi Kepong - Desa Jaya, Kepong338 Farmasi Ketereh339 Farmasi Kita Sdn Bhd340 Farmasi Klang
Pharmacies participating in NMUS surveyNo. Private Pharmacies No Private Pharmacies

195
MALAYSIAN STATISTICS ON MEDICINES 2009 & 2010
341 Farmasi Klang HealthCare342 Farmasi KNZ343 Farmasi Komuniti Wawasan344 Farmasi Kota Permai Sdn Bhd345 Farmasi Kota Putra346 Farmasi Kota Sdn. Bhd.347 Farmasi Kris348 Farmasi Kuala Selangor349 Farmasi Kuantan 350 Farmasi Lawas351 Farmasi Lemed Sdn Bhd352 Farmasi Liew 353 Farmasi Lim354 Farmasi Lunas355 Farmasi Makmur356 Farmasi Makmur Jaya357 Farmasi Manir358 Farmasi Materia Medica - Putrajaya Hospital359 Farmasi Mawar360 Farmasi Maxheal Sdn. Bhd.361 Farmasi Maxicare362 Farmasi Maxipro (M) Sdn Bhd 363 Farmasi Medi Ehsan364 Farmasi Medi Mesra365 Farmasi Medica366 Farmasi Medi-Nur Sdn. Bhd367 Farmasi Mediplus 368 Farmasi Medipoint Sdn Bhd369 Farmasi Medipro370 Farmasi Medisa371 Farmasi Medivita372 Farmasi Mee Mi373 Farmasi Meera374 Farmasi Mengelembu Baru375 Farmasi Meru Klg376 Farmasi MesraPharma377 Farmasi Mewah378 Farmasi Millenium (Sri Sentosa) Sdn Bhd - Jln
Klang Lama379 Farmasi Millenium Sdn Bhd - Tmn Megah, PJ380 Farmasi MJ (Melaka) Sdn Bhd - Batu Berendam381 Farmasi Muammar382 Farmasi Muar
383 Farmasi Muda Sdn Bhd384 Farmasi Muhibah385 Farmasi Murni Marketing Sdn Bhd386 Farmasi Murni Marketing Sdn. Bhd.387 Farmasi Mutiara Sdn Bhd388 Farmasi My-Chemist (BM) Sdn.Bhd.389 Farmasi My-Chemist (R.Uda)Sdn.Bhd.390 Farmasi My-Chemist Sdn.Bhd.391 Farmasi Naz392 Farmasi Nazifa393 Farmasi Nazifa (Cawangan Gurun)394 Farmasi Nazri Sdn.Bhd395 Farmasi Neu Setbury396 Farmasi Nevens Marketing Sdn Bhd397 Farmasi Nilai398 Farmasi Nova399 Farmasi Nur400 Farmasi Padang401 Farmasi Pakar402 Farmasi Pantai Timur403 Farmasi Pauh Sdn.Bhd.404 Farmasi Paya Terubong Sdn Bhd405 Farmasi PD406 Farmasi Penawar407 Farmasi Pendang408 Farmasi Perdana409 Farmasi Peringgit Sdn Bhd410 Farmasi Permai Sdn. Bhd.411 Farmasi Permaisuri412 Farmasi Permaisuri 413 Farmasi Pertama414 Farmasi Petagas415 Farmasi Pharmacy Sdn Bhd416 Farmasi PJ417 Farmasi Plus Care (M) Sdn. Bhd.418 Farmasi Pontian Sdn Bhd419 Farmasi Prihatin Sdn Bhd420 Farmasi Pudu421 Farmasi Pure Sdn Bhd422 Farmasi QBIZ423 Farmasi R S Sdn. Bhd.424 Farmasi Rakyat425 Farmasi Rapat
Pharmacies participating in NMUS surveyNo. Private Pharmacies No Private Pharmacies
196
MALAYSIAN STATISTICS ON MEDICINES 2009 & 2010
426 Farmasi Rasah Jaya427 Farmasi Rawang - Jln Bandar Rawang 2428 Farmasi Rawang - Jln Maxwell, Rawang429 Farmasi Rimadex Sdn Bhd - Jln Dusun Muda430 Farmasi Rimadex Sdn Bhd - Pauh Panji431 Farmasi Rimadex Sdn Bhd - Wakaf Che Yeh432 Farmasi Rin433 Farmasi Ruby434 Farmasi Saiza435 Farmasi Samudra 436 Farmasi Saujana437 Farmasi Sayang438 Farmasi Sayang Dua439 Farmasi SD440 Farmasi Seberang Jaya441 Farmasi Segar Healthcare Sdn Bhd442 Farmasi Sekilau443 Farmasi Seng444 Farmasi Sentosa445 Farmasi Sentosa Ria Sdn Bhd446 Farmasi Sentral447 Farmasi Sentul - Sentul Pasar448 Farmasi Seraya449 Farmasi Seri Melati450 Farmasi Seri Petaling Sdn Bhd451 Farmasi Seroja452 Farmasi Setia453 Farmasi Setia Indah454 Farmasi Sg Ara455 Farmasi Sg. Karang456 Farmasi Sia457 Farmasi Sihat458 Farmasi Sihat Ria459 Farmasi Sikamat460 Farmasi Simpang461 Farmasi Sinar Kulim462 Farmasi Sinar Sdn Bhd463 Farmasi Siva464 Farmasi Sri Jempol465 Farmasi Sri Kota466 Farmasi Sri Nibong Sdn.Bhd.467 Farmasi Sri Penanti468 Farmasi Sri Pinang
469 Farmasi Sri Pulau Sdn.Bhd.470 Farmasi Srimulia Sdn Bhd471 Farmasi Sungai Way472 Farmasi Suria473 Farmasi Suriani474 Farmasi Sutera (KL) Sdn Bhd475 Farmasi Syaza Sdn Bhd 476 Farmasi Tampin Sdn Bhd477 Farmasi Tan478 Farmasi Tan - PJ Old Town479 Farmasi Tanjong Sepat480 Farmasi Tanjung481 Farmasi Tanjung Bungah482 Farmasi Tasek Sdn Bhd483 Farmasi Taufiq Lim484 Farmasi Tawakkal485 Farmasi Teck Hong486 Farmasi Telok Mas487 Farmasi Teratai488 Farmasi Tesa489 Farmasi Tiara 490 Farmasi Tiara Sdn Bhd491 Farmasi Trio Sdn Bhd - Tmn Sentosa492 Farmasi Truecare Sdn Bhd493 Farmasi Tunjang494 Farmasi Tynehealth495 Farmasi Ubatku Sdn.Bhd.496 Farmasi Ulfah (Vital) 497 Farmasi Ultracare498 Farmasi Ummi 499 Farmasi Unidamai500 Farmasi Unipharm501 Farmasi Unipharma502 Farmasi Utara503 Farmasi Utara Sdn Bhd504 Farmasi Valley505 Farmasi V-Fung Sdn.Bhd.506 Farmasi Vichem & Health Products507 Farmasi Vista Jelita Sdn Bhd 508 Farmasi Vitacare Sdn. Bhd - Carrefour
Subang Jaya 509 Farmasi Vitacare Sdn. Bhd - Tmn Melawati 510 Farmasi Vlmaks
Pharmacies participating in NMUS surveyNo. Private Pharmacies No Private Pharmacies
197
MALAYSIAN STATISTICS ON MEDICINES 2009 & 2010
511 Farmasi Voon Sdn Bhd512 Farmasi Walgreene513 Farmasi Wangsa Sdn. Bhd514 Farmasi Watan515 Farmasi Wellness Sdn. Bhd.516 Farmasi Wu 517 Farmasi Yasmin518 Farmasi Yeo Sdn Bhd - Jln Besar, Seri Kembangan519 Farmasi Yeo Sdn Sdn - Tmn Bukit Serdang520 Farmasi Yogam521 Farmasi Zaman522 Farmasi Zhunion (Miri) Sdn Bhd523 Farmasi ZNZ524 Farmasi Zuli525 Farmasi Zuq Sdn Bhd526 Fawwaz Pharmacy527 Fazlin Pharmacist Sdn Bhd528 Ferringgi Pharmacy529 Firstcare Pharmacy Sdn Bhd530 Forever Pharmacy531 Friend`s Pharmacy ( My Venture Pharma Sdn
Bhd )532 Garden City Pharmacy Sdn Bhd533 Gardenia Pharmacy534 Gaya Pharmacy Supplies535 GC Grace Pharmacy Sdn.Bhd.536 Gch (M) Sdn Bhd (Guardian Pharmacy)537 GCH Retail (M) Sdn Bhd538 GCH Retail (M) Sdn Bhd - Suria KLCC539 GCH Retail (M) Sdn.Bhd.540 GCH Retail (Malaysia) Sdn Bhd541 GCH Retail (Malaysia) Sdn Bhd [Guardian
Pharmacy]542 GCH Retail (Malaysia) Sdn. Bhd.543 GCH Retail (Malaysia)Sdn.Bhd.544 Gerak Utusan Pharmacy Sdn Bhd545 Glad Hope Pharmacy Sdn.Bhd.546 Good Master Pharmacy Sdn.Bhd.547 Good Neighbour Farmasi548 Goodwill Pharmacy 549 GP Pharmacy 550 Grace Pharmacy551 Grandeur Healthcare Sdn Bhd
552 Great Maestro Sdn Bhd553 Green Lane Pharmacy - Kepong Baru554 Green Park Pharmacy Sdn Bhd555 Green Pharmacy556 Guardian GCH Retail (M) Sdn Bhd - Bangsar
Baru557 Guardian Pharmacy558 Guardian Pharmacy - Jaya Jusco Taman Maluri559 Guardian Pharmacy (M) Sdn Bhd560 Guardian Pharmacy (M) Sdn Bhd - Amcorp Mall561 Guardian Pharmacy (M) Sdn Bhd - Ampang Point 562 Guardian Pharmacy (M) Sdn Bhd - Bangsar
Shopping Centre563 Guardian Pharmacy (M) Sdn Bhd - Bintang Plaza
Shopping Complex564 Guardian Pharmacy (M) Sdn Bhd - Central
Square565 Guardian Pharmacy (M) Sdn Bhd - Giant
Hypermarket Bayan Baru566 Guardian Pharmacy (M) Sdn Bhd - Giant
Hypermarket Klang567 Guardian Pharmacy (M) Sdn Bhd - Giant
Hypermarket Kuantan568 Guardian Pharmacy (M) Sdn Bhd - Giant
Hypermarket Plentong569 Guardian Pharmacy (M) Sdn Bhd - Giant
Hypermarket Stadium Shah Alam570 Guardian Pharmacy (M) Sdn Bhd - Giant Sunway
City Ipoh 571 Guardian Pharmacy (M) Sdn Bhd - Gurney Plaza572 Guardian Pharmacy (M) Sdn Bhd - Holiday Plaza573 Guardian Pharmacy (M) Sdn Bhd - Ikano Power
Centre574 Guardian Pharmacy (M) Sdn Bhd - Jalan Dato'
Sheikh Seremban575 Guardian Pharmacy (M) Sdn Bhd - Jalan Rahmat576 Guardian Pharmacy (M) Sdn Bhd - Jalan Satok577 Guardian Pharmacy (M) Sdn Bhd - Jusco Bukit
Raja578 Guardian Pharmacy (M) Sdn Bhd - Jusco Melaka 579 Guardian Pharmacy (M) Sdn Bhd - KB Mall580 Guardian Pharmacy (M) Sdn Bhd - Kelana Jaya581 Guardian Pharmacy (M) Sdn Bhd - KLIA582 Guardian Pharmacy (M) Sdn Bhd - Kompleks
PKNS583 Guardian Pharmacy (M) Sdn Bhd - Midvalley
Megamall
Pharmacies participating in NMUS surveyNo. Private Pharmacies No Private Pharmacies
198
MALAYSIAN STATISTICS ON MEDICINES 2009 & 2010
584 Guardian Pharmacy (M) Sdn Bhd - OUG Plaza585 Guardian Pharmacy (M) Sdn Bhd - Putrajaya586 Guardian Pharmacy (M) Sdn Bhd - Riverside587 Guardian Pharmacy (M) Sdn Bhd - Section 14, PJ588 Guardian Pharmacy (M) Sdn Bhd - Shah Alam
Mall 589 Guardian Pharmacy (M) Sdn Bhd - SS2/64590 Guardian Pharmacy (M) Sdn Bhd - Sunway
Pyramid591 Guardian Pharmacy (M) Sdn Bhd - Taman
Pelangi592 Guardian Pharmacy (M) Sdn Bhd - Taman Tun
Dr Ismail593 Guardian Pharmacy (M) Sdn Bhd - Terminal 1
Shopping Plaza594 Guardian Pharmacy (M) Sdn Bhd - Wisma
Saberkas595 H.T Ong And Choong Medical Services Sdn.Bhd.596 Haitam Health597 Han's Pharmacy Sdn.Bhd.598 Happy Pharmacy Sdn. Bhd.599 Harmoni Farmasi (KT) Sdn Bhd600 Harmoni Farmasi Kemaman Sdn. Bhd.601 Harmoni Farmasi Paka Sdn. Bhd.602 Harmoni Farmasi Sdn Bhd 603 Hasiah Pharmacy604 HB Pharmacy605 HC Pharmacy606 Health Care Pharmacy607 Health Garden Pharmacy (Penang)Sdn.Bhd.608 Health Lane Family Pharmacy - Kg Baru, Sg
Buloh609 Health Lane Family Pharmacy - Selangor
Mansion, Jln Masjid India610 Health Lane Family Pharmacy - Tmn Bkt Maluri,
Kepong611 Health Lane Family Pharmacy - Tmn Sri Gambut612 Health Lane Family Pharmacy Sdn Bhd - Desa
Jaya613 Health Lifespring Sdn Bhd614 Health Link Pharmacy 615 Health Link Pharmacy Sdn Bhd616 Health Pharm617 Health Relief Pharmacy618 Healthcare Pahrmacy
619 Health-Care Pharmacy 620 Healthlink Pharmacy621 Healthmax Family Pharmacy622 HealthQuest Pharmacy Sdn Bhd623 Healthspring Sdn Bhd624 Healthworld Pharmacy Sdn.Bhd.625 Herk Chung Pharmacy (K) Sdn Bhd626 Hock Hai Pharmacy Sdn Bhd627 Hoewell Pharma Sdn Bhd628 Holistic Pharmacy Sdn Bhd629 Home-Care Pharmacy Sdn Bhd630 Honey Pharmacy631 Hong Ai Pharmacy Sdn Bhd632 Hospis Malaysia633 Howe Cheang Medical Supply S.B634 Hucare Pharmacy Sdn. Bhd.635 Hy Pharmacy636 I Medikal Pharmaceutical Sdn. Bhd.637 Ideal Pharmacy638 IJ Pharmacy (M) Sdn. Bhd.639 Impian Pharmahealth640 Inanam Pharmacy641 Innolink Sdn. Bhd.642 Integra Pharmacy Sdn.Bhd643 Integriti Premier Malaysia Sdn Bhd644 Interpharm (M) Sdn. Bhd.645 Irispharm Ventures Sdn Bhd646 Island Chemist Sdn.Bhd.647 Island Pharmacy Sdn.Bhd.648 I-Venture Pharma Sdn Bhd649 J & E Pharmacy 650 J S Pharmacy651 J.O.Y Pharmacy652 Jasa Pharmacy - Bintang Garden Commercial
Centre653 Jasa Pharmacy Sdn Bhd - Jalan Dunlop654 Jaya - Iss Farmasi655 Jecki Medical Supplies Sdn Bhd656 Jian Hong Pharmacy657 Jion Pharmacy Sdn Bhd658 Jitra Pharmacy Sdn Bhd659 Joe Pharmacy,660 JOM Pharmacy
Pharmacies participating in NMUS surveyNo. Private Pharmacies No Private Pharmacies
199
MALAYSIAN STATISTICS ON MEDICINES 2009 & 2010
661 Joy & Health Pharmacy Sdn Bhd662 Joy Pharmacy663 Joy Pharmacy Sdn Bhd664 Joy Pharmacy Sdn. Bhd665 JSM Pharmacy666 Jumbo Pharmacy667 K Pharmacy668 K. P. Farmasi Sdn Bhd669 K.B. Pharmacy Healthcare Sdn. Bhd.670 K.K.Care Pharmacy Sdn. Bhd.671 Kampar Medical Supplies (M) Sdn. Bhd672 Karak Pharmacy673 Karamunsing Pharmacy Sdn. Bhd.674 Karen's Pharmacy Sdn. Bhd.675 KC & Hazrina Healthcare Sdn Bhd - Bazaar UO676 KDH Pharmacy S/B677 Kedai Farmasi Ang Teong 678 Kedai Ubat dan Farmasi Yit Min679 Kek Lin Seng Sdn Bhd680 KH Wong Pharmacy681 Khoo Medical Supplies682 Kian Farmasi (Kel) Sdn Bhd683 Kien Fatt (Midland) Pharm Sdn Bhd684 Kim Yin Pharmacy Sdn. Bhd.685 Kinabalu Pharmacy (Batu Pahat) Sdn. Bhd.686 Kinabalu Pharmacy (Donggongon) SB687 Kinabalu Pharmacy (Donggongon) Sdn Bhd688 Kinabalu Pharmacy (SP) Sdn Bhd689 Kinabalu Pharmacy (Tawau) Sdn Bhd690 Kinabalu Pharmacy Sdn. Bhd.691 Kindred Pharmacy692 Kingstown Pharmacy693 KK Wong Pharmacy694 KNL Medicare695 Koperasi Kedai Buku USM Bhd.696 Kota Kinabalu Dispensary Sdn. Bhd.697 Kreescare Pharmacy698 Kris Care Pharmacy699 KS Hoo Pharmacy700 KU Pharmacy Sdn.Bhd.701 Kuala Lumpur Sports Medicine Centre
Sdn Bhd (Pharmacy Kuala Lumpur Sports Medicine Centre)
702 Kuantan Medical Centre Sdn Bhd
703 Kuantan Specialist Hospital SB704 Kuching Specialist Hospital705 Kulim Pharmacy Sdn. Bhd.706 Kumpulan Farmasi Vitacare Sdn Bhd - Idaman 707 Kumpulan Farmasi Vitacare Sdn Bhd - KLCC708 Kumpulan Farmasi Vitacare Sdn Bhd -
Setiawangsa 709 Kumpulan Farmasi Vitacare Sdn Bhd - The Mall710 Kumpulan Farmasi Vitacare Sdn Bhd - Wangsa
Maju 711 L J Fung Pharmacy Sdn Bhd712 L.T Ling Pharmacy Sdn Bhd713 Labuan Farmasi714 Laila Pharmacy 715 Lau & Partners Pharmacy Sdn Bhd716 Lead Pharmacy717 Lee Farmasi & Baby Centre Sdn Bhd718 Lee Medihome Pharmacy Sdn Bhd719 Leo Pharmacy Sdn.Bhd.720 Life Care Pharmacy721 Life Care Pharmacy Sdn Bhd722 Life Pharmacy723 Life Pharmacy Sdn Bhd724 Lilian Pharmacy725 Lim Medical Supplies Sdn Bhd726 Lim Pharmacy727 Limbang Pharmacy728 Lims' Pharmacy729 Ling Chemist Sdn Bhd 730 Ling Pharmacy731 Link Pharmacy Sdn Bhd732 LJ Fung Pharmacy Sdn Bhd733 Lo Pharmacy 734 Loo Pharmacy735 Lotus Pharmacy736 Loviena Pharmacy737 Ludwig Pro Pharmacy738 Luyang Pharmacy739 Lyn Pharmacy Sdn Bhd740 M.S. Ally Pharma Sdn Bhd741 MAA Pharmacy742 Macallum Pharmacy Sdn.Bhd.743 Macro Health Care744 Maran PharmaShoppe & H'care SB
Pharmacies participating in NMUS surveyNo. Private Pharmacies No Private Pharmacies
200
MALAYSIAN STATISTICS ON MEDICINES 2009 & 2010
745 Master Pharmacy Sdn.Bhd.746 Matang Jaya Pharmacy747 MDS PharmacySdn. Bhd748 Medan Farmasi749 Medan Jaya Pharmacy750 Medica Pharmacy751 Medical Supplies (Labuan) Sdn Bhd752 Medicare Pharmacy753 Medicare Utama Pharmacy754 Medi-Channel Pharma S/B755 Medichem Pharmacy (formely known as Medcare
Pharmacy)756 Medichemie Pharmacy (M) Sdn Bhd - Wakaf Siku757 Medichemie Pharmacy (M) Sdn Bhd - Wisma
Dewma758 Medicine Point Sdn Bhd759 Mediconstant Pharmacy (Ampang) Sdn Bhd -
Jalan Ampang760 Mediconstant Pharmacy (Klang) Sdn Bhd761 Mediconstant Pharmacy (TTDI) Sdn Bhd762 Medi-Home Pharmacy (Bestari) Sdn. Bhd.763 Medi-Home Pharmacy (Perintis) Sdn. Bhd.764 Medi-Home Pharmacy (Perling) Sdn. Bhd.765 Medihouse Sdn Bhd766 Medi-K Pharmacy Sdn Bhd767 Mediland Pharmacy768 Mediland Sdn Bhd769 Medilink Pharmacy (Pasir Gudang) Sdn Bhd770 Medipro Pharmacy Sdn Bhd771 Medisave Pharmacy Sdn Bhd772 Medishop Pharmacy773 Medishop Pharmacy Sdn Bhd774 Medishop Trading775 Medsense Farmasi (PJ) Sdn Bhd776 Medsense Healthcare Sdn Bhd777 Mega City Pharmacy778 Mega Kulim Pharmacy779 Mega Kulim Pharmacy Sdn. Bhd.780 Mega Pharmacy Sdn. Bhd.781 Megacare Pharmacy782 Megamal Pharmacy Sdn.Bhd.783 Meicare Pharmacy 784 Menglembu Farmaseutika Enterprise785 Mercury Pharmacy Sdn. Bhd
786 Mercury Pharmacy Sdn. Bhd - Bandar Baru, Jerantut
787 Mercury Pharmacy Sdn. Bhd - Jln Tengku Bakar788 Mercury Pharmacy Sdn. Bhd - Raub789 Metro Pharmacy 790 Metropharm S/B791 Metropharm Sdn. Bhd792 Metta-Care Pharmacy Sdn Bhd793 MF Pharmaceutikal Sdn Bhd794 Min's Pharmacy Sdn.Bhd.795 Mira Pharmacy796 Miri United Healthcare Sdn. Bhd.797 Mivita Pharmacy798 MN Pharmacy Sdn Bhd - Jln Kuchai799 Moh Heng Pharmacy Sdn Bhd800 Morine Pharmacy801 Multicare Health Pharmacy Sdn Bhd802 Multicare Pharmacy ( L & L ) Sdn Bhd803 Multicare Pharmacy (Bahau) SB804 Multicare Pharmacy Sdn Bhd805 Multipurpose Personal & Convenient806 My Pharmacy807 My Pharmacy – Jalan Wong Ah Fook808 My Pharmacy – Taman Suria809 My Pharmacy (Kulai) Sdn. Bhd. - Taman Tampoi
Indah810 My Pharmacy (M) Sdn Bhd811 My Pharmacy (Pandan) Sdn. Bhd.812 My Pharmacy (Pelangi) Sdn. Bhd813 Myfrenz Pharmacy814 N.S Pharmacy Sdn. Bhd815 Nadi Care Pharmacy816 Naina Mohamed & Sons (PG) Sdn.Bhd.817 Nasra Pharmacy Sdn Bhd818 Natural Healthy Living Sdn Bhd819 Nature - Care Pharmacy Sdn.Bhd.820 Nature Pharmacy821 Naturokare Resources Sdn Bhd822 Neighbourhood Pharmacy (Georgetown)
Sdn.Bhd.823 Neighbourhood Pharmacy (Pg)Sdn.Bhd.824 Neighbourhood Pharmacy (Sabah) Sdn. Bhd.825 Neighbourhood Pharmacy Sdn.Bhd826 Nevens Marketing Sdn Bhd
Pharmacies participating in NMUS surveyNo. Private Pharmacies No Private Pharmacies
201
MALAYSIAN STATISTICS ON MEDICINES 2009 & 2010
827 Ng & Lee Pharmacy (JB) Sdn. Bhd.828 Nice Pharmacy Sdn Bhd829 Nilam Pharmacy830 Normah Medical Specialist Centre,831 North Park Pharmacy832 Nur Medichemie Pharmacy833 Nurina Pharmacy834 Nutra Healthcare835 Nutra Pharmacy836 Nutrimed Pharmacy Enterprise837 Oasis Pharmacy Sdn Bhd838 Ocean Pharmacy Sdn. Bhd.839 Omega Pharmacy840 One-Stop Pharmacy Sdn Bhd841 Orange Pharmacy842 Orange Pharmacy Sdn. Bhd843 Oriental Pharmacy844 Orpla Pharmacy SB845 P J Pharmacy 846 Padawan Pharmacy 847 Pahang Pharmacy Sdn. Bhd - Bentong848 Pahang Pharmacy Sdn. Bhd - Jln Teluk Sisek849 Pahang Pharmacy Sdn. Bhd - Kuala Lipis850 Pahang Pharmacy Sdn. Bhd - Raub851 Pai Wang Pharmacy Sdn Bhd852 PAL Pharmacy853 Palm Pharmacy854 Panacea Pharmacy Enterprise855 Pantai Medical Centre Sdn Bhd856 Park Pharmacy Sdn Bhd 857 PC Murni Pharmacy Sdn Bhd858 Pearl Pharmacy Sdn Bhd859 Penrissen Pharmacy860 People's Pharmacy Sdn Bhd - Jln Bendahara861 People's Pharmacy Sdn Bhd - Tmn Melaka Raya862 Perennial Pharmacy Sdn Bhd - Plaza Tasek,
Skudai863 Perennial Pharmacy Sdn Bhd - Tmn Ungku Tun
Aminah864 Pertanian Farmix (M) Sdn Bhd865 Pharma Consult (Kulim) Sdn. Bhd.866 Pharma Line Marketing Sdn Bhd867 Pharma Utama
868 PharmaCARE (Exquisite Healthcare Sdn. Bhd) - Bdr Baru Permas Jaya
869 PharmaCARE (Exquisite Healthcare Sdn. Bhd) - Plaza Kotaraya, JB
870 Pharmacare Medicine Shoppe 871 Pharma-Consult (Ipoh) Sdn Bhd872 Pharmacopia Sdn Bhd873 Pharmalink Pharmacy Sdn Bhd874 Pharmara Bestari Sdn Bhd875 Pharmasave Pharmacy Sdn Bhd876 Pharmazat Sdn. Bhd.877 Pharmcare Sdn Bhd878 Pharmedic Pharmacy879 Pharmex Pharma (Sarawak) Sdn Bhd880 Pharmex Sdn. Bhd.881 Pills & Poisons Pharmacy Sdn Bhd882 Pills & Tabs Pharmacy883 Plaza Pharmacy 884 Plaza Pharmacy Sdn Bhd885 Pokiong Pharmacy Sdn Bhd886 Poly Khoo Pharmacy887 Poly Pharmacy Sdn Bhd888 Praise Pharmacy Sdn Bhd889 Prime Pharmacy, Centre890 Procare Pharmacy891 Prochem Pharmacy892 Professional Pharmacy893 Prosper Pharmacy894 PT Bumi Sakti Pharma895 Public Chemist (Penampang) Sdn. Bhd.896 Public Chemist (Sabah) Sdn. Bhd897 Publix Pharmacy898 Pulse Pharmacy899 Pure Aid Sdn Bhd (Pure Aid Pharmacy)900 Pure Pharmacy Sdn Bhd901 Pure Pharmacy Sdn Bhd 902 Pure Pharmacy Sdn.Bhd.903 Q-Pharma Sdn Bhd904 Quinpharm (KL) Sdn Bhd905 Quinpharm (M) Sdn Bhd906 Radiant Pharmacy Sdn. Bhd.907 Rantau Pharmacy908 Rawang Medical Supplies909 Razzaq Pharmacy
Pharmacies participating in NMUS surveyNo. Private Pharmacies No Private Pharmacies
202
MALAYSIAN STATISTICS ON MEDICINES 2009 & 2010
910 Region Pharmacy911 Rejang Specialist Hospital Sdn Bhd912 Remedy Pharmacy913 Revive Retail (M) Sdn Bhd914 Rheco Pharmacy915 Rheco Pharmacy 916 Rini (M) Sdn Bhd917 S.P.U. Pharmacy918 Sabah Pharmacy919 Saga Pharmacy Sdn. Bhd.920 Sainuka Habib Sdn Bhd921 Sainuka Habib Sdn Bhd - Batang Berjuntai922 Saksama Potensi Sdn Bhd923 Sam Pharmacy924 Samex Pharmacy (Sabah) Sdn Bhd925 Satok Pharmacy Sdn Bhd926 Saude Heathcare (Yulex Pharmacy)927 Saveway Farmasi 928 Sejahtera Farma Sdn Bhd (Farmasi PharmaCARE)929 Self Care Pharmacy930 Sentosa Pharmacy 931 Seremban Premier Pharmacy Sdn Bhd932 Seriq Medical Supplies Sdn Bhd - Kepong Baru933 Servicare Pharmacy Sdn Bhd934 Setiaraja Pharmacy935 Shiv Pharmacy Sdn. Bhd.,936 Siang Pharmacy937 Siang Pharmacy Sdn.Bhd.938 Sibu Pharmacy Sdn Bhd939 Sibu Specialist Medical Centre940 Siburan Pharmacy941 Sihat Pharmacy942 Sim Healthcare & Farmasi Sdn Bhd943 Sim Pharmacy944 Sime Darby Medical Centre Subang Jaya Sdn Bhd945 Sime Darby Specialist Centre Megah Sdn Bhd946 SIMS Pharmacy947 Sincere Care Pharmacy Sdn Bhd948 Sincere Pharmacy949 Sing Lee Pharmacy950 Sinma Pharmacy Sdn Bhd951 SJ Healthtoday Pharmacy Sdn. Bhd952 SJ Pharmacy
953 SL Ling Pharmacy954 Smartsons Pharmacy Sdn. Bhd.955 Smiles Pharmacy Sdn Bhd956 Softcare Pharmacy957 Solia Pharmacy Sdn Bhd958 Somada Pharma Sdn Bhd959 Sonshine Pharmacy960 Sophia Pharmacy961 Southern Medicare Sdn Bhd962 Southern Pharmacy Sdn. Bhd.963 Spectrum Pharmacy964 Spring Care Pharmacy Sdn Bhd965 SPS Mutiara Pharmacy Sdn Bhd966 Sri Medic Pharmacy Sdn Bhd967 Sri Rambai Pharmacy Sdn.Bhd.968 Standard Pharmacy Sdn Bhd969 Standard Select Sdn Bhd (Goodwill Pharmacy)970 Star Care Pharmacy Sdn Bhd971 Stay Caring Sdn Bhd972 Stay Caring Sdn Bhd - Tmn Selayang Jaya973 Stay Fit Pharmacy Sdn.Bhd.974 Stay Well Pharmacy Sdn.Bhd.975 Sterling Pharmacy Sdn Bhd976 Straits Pharmacy977 Straits Pharmacy( Ayer Keroh) Sdn Bhd978 Summit Co (M) Sdn Bhd979 Sunbright Pharmacy Sdn Bhd980 Sunlight Pharmacy Sdn. Bhd.981 Sunlight Pharmacy (B) Sdn. Bhd.982 Sunlight Pharmacy (KK) Sdn. Bhd983 Sunlight Pharmacy Sdn Bhd
984 Sunshine Pharmacy985 Sunshine Pharmacy Sdn.Bhd.986 Supercare Pharmacy987 Superdrug Pharmacy Sdn Bhd988 Supermed Pharmacy Sdn. Bhd.989 Supreme Pharmacy Sdn Bhd990 Syarikat M.S. Ally Sdn Bhd991 T J Chua Pharmacy Sdn Bhd992 T Town helath Care993 Tal Pharmacy994 Taman Desa Pharmacy Sdn Bhd
Pharmacies participating in NMUS surveyNo. Private Pharmacies No Private Pharmacies
203
MALAYSIAN STATISTICS ON MEDICINES 2009 & 2010
995 Tampoi Indah Pharmacy Sdn. Bhd.996 Tan Pharmacy997 Tang Pharmacy998 Tangkak Pharmacy999 Tanjung Medical Sdn Bhd
1000 Target Pharmacy - Sek 9, Shah Alam1001 Target Pharmacy Sdn Bhd1002 Teluk kumbar Pharmacy1003 Thai Hing Pharmacy Sdn Bhd1004 Thomas Chiang Optometrist & Chiang Pharmacy1005 Timberland Pharmacy 1006 Times Pharmacy Sdn Bhd1007 Tina Pharmaceutical1008 TJ Pharmacy1009 Today Pharmacy1010 Tongod Pharmacy1011 Tonic Pharma Sdn Bhd1012 Top Wellness Pharmacy Sdn Bhd1013 Total Farmasi1014 Tuaran Pharmacy1015 TWL Marketing Sdn Bhd1016 Tyme Resouces1017 U-City Care Pharmacy Sdn. Bhd.1018 Udacare Pharmacy Sdn. Bhd.1019 U-Kang Pharmacy Sdn Bhd1020 UKM Kesihatan Sdn Bhd (UKMSC)1021 UKM Kesihatan Sdn Bhd.(Pharmacy Komuniti
UKM)1022 UMH Pharmacy (Kuching) Sdn Bhd1023 UMH Pharmacy Sdn Bhd1024 Unicare Pharmacy (M) Sdn Bhd1025 Unichem Pharmacy Sdn Bhd1026 United Caring Venture Sdn Bhd1027 United Medical Hall (1979) Sdn Bhd1028 Uniwan Pharmacy1029 V & C Healthy Dispensary1030 Vantage Pharmacy1031 Vcare Pharmacy1032 V-Care Pharmacy1033 Vecare Pharmacy (Sg Dua) Sdn Bhd1034 Vera Pharmacal Sdn Bhd1035 Vertex Pharmacy Sdn. Bhd.1036 Vincent Pharmacy
Pharmacies participating in NMUS surveyNo. Private Pharmacies No Private Pharmacies
1037 Virgin Pharma (M) Sdn. Bhd.1038 Viseutics Pharmacy1039 Vision Care Pharmacy Sdn Bhd1040 Vision Pharmacy Sdn Bhd 1041 Vital Oasis Sdn. Bhd.1042 Vitamedic Pharmacy Sdn Bhd 1043 Vitaplus Enterprise1044 Viva Caring Pharmacy Sdn Bhd - Jln Barat1045 Viva Caring Sdn Bhd - Bangsar Village1046 Viva Caring Sdn Bhd - The Store1047 Viva Caring Sdn Bhd (Caring Pharmacy) - Jln
Radin Anum1048 VK Pharmacy1049 Vycon Pharmacy Sdn Bhd1050 Wah Choi Pharmacy Sdn Bhd1051 Watson Personal Care Stores Sdn Bhd1052 Watson’s Personal Care Stores Sdn. Bhd.1053 Watson’s Personal Care Stores Sdn. Bhd. - Jln
Pantai, Kota Kinabalu1054 Watsons Personal Care Stores Sdn Bhd1055 Watson's Personal Care Stores Sdn Bhd1056 Watson's Personal Care Stores Sdn. Bhd -
Alamanda Putrajaya1057 Watson's Personal Care Stores Sdn. Bhd - Anjung
Precinct 1, Putrajaya1058 Watson's Personal Care Stores Sdn. Bhd - Jusco
Cheras Selatan1059 Watson's Personal Care Stores Sdn. Bhd - Jusco
Seremban 21060 Watson's Personal Care Stores Sdn. Bhd - Jusco
Tebrau City1061 Watson's Personal Care Stores Sdn. Bhd - KLCC1062 Watson's Personal Care Stores Sdn. Bhd - Sg Wang
Plaza1063 Watson's Personal Care Stores Sdn. Bhd - Taman
Maluri Cheras1064 Watson's Personal Care Stores Sdn. Bhd - Tesco
Ipoh 1065 Watson's Personal Care Stores Sdn. Bhd - Tesco
Penang1066 Watsons Personal Care Stores Sdn.Bhd.1067 Watson's Personal Care Stores Sdn.Bhd.1068 We Care Pharmacy (Kepayan Ridge)1069 We Care Pharmacy Sdn Bhd1070 Wellcare Pharmacy
204
MALAYSIAN STATISTICS ON MEDICINES 2009 & 2010
1071 Wellings Pharmacy Sdn.Bhd.1072 Wijaya International Medical Centre Sdn Bhd1073 William Pharmacy 1074 Win-Win Pharmacy Sdn Bhd1075 Wira Pharmacy1076 Wise Pharmacy1077 Wise Pharmacy Sdn.Bhd.1078 XPLUS ONE Pharmacy Sdn. Bhd.1079 XPlus Pharmacy Sdn. Bhd.1080 Y. K. Farmasi Sdn. Bhd.1081 Y.S.P Industries (M) Sdn.Bhd.1082 Yee Hong Parmacy Sdn Bhd1083 Yeung Lok Pharmacy1084 YHC Berkat Farmasi1085 Yin Woh Tong Medical Supply Sdn Bhd
1086 YW Yong Farmasi Sdn Bhd1087 Zenith Pharmacy - Jln Bkt Bintang1088 Zenith Pharmacy (SS1) Sdn. Bhd. (Formerly
known as Etica Pharmacy (KL) Sdn Bhd)1089 Zhunion Pharma (M) Sdn Bhd (Tabuan Jaya)1090 Zing Haw Pharmacy1091 ZMN Pharmacy Sdn Bhd1092 ZNI Pharmacy Sdn. Bhd.,1093 Zona Pharmacy Sdn Bhd1094 Zuera Medic Sdn.Bhd.1095 Zuffa Pharmacy Pendang Sdn Bhd - Jln Sukamari1096 Zuffa Pharmacy Sdn Bhd - Bgn Tabung Haji1097 Zuffa Pharmacy Sdn Bhd - Jln Tingkat Ciku 21098 Zuffa Pharmacy Sdn Bhd - Kompleks Seri Awana1099 Zuffa Pharmacy Sdn Bhd - Tmn Ria Indah