Malaysia Economic Monitor The Quest for Productivity...
56
1 Malaysia Economic Monitor The Quest for Productivity Growth
Transcript of Malaysia Economic Monitor The Quest for Productivity...

1
Malaysia Economic MonitorThe Quest for Productivity Growth

2
Contents
RECENT ECONOMIC DEVELOPMENTS AND OUTLOOK External environment
Domestic economic developments
Outlook
THE QUEST FOR PRODUCTIVITY GROWTH Productivity Macroeconomic overview
Productivity Country Benchmarking
Productivity of Manufacturing Firms

3
Sluggish global economic growth…
Source: World Bank staff calculations
Annual growth rate, %
0.0
1.0
2.0
3.0
4.0
5.0
6.0
2015 2016f 2017f 2018f 2015 2016f 2017f 2018f 2015 2016f 2017f 2018f
Global Advanced EM and Developing
Previous estimate (Jan. 2016)

4
… commodity prices bottoming up…
Source: World Bank Commodity Price Data (Pink Sheet).
Commodity Price Indices
20
40
60
80
100
120
140
Jan
-13
Mar-
13
May-1
3
Jul-13
Sep-1
3
Nov-1
3
Jan
-14
Mar-
14
May-1
4
Jul-14
Sep-1
4
Nov-1
4
Jan
-15
Mar-
15
May-1
5
Jul-15
Sep-1
5
Nov-1
5
Jan
-16
Mar-
16
May-1
6
Jul-16
Sep-1
6
Nov-1
6
Energy Non-energy

5
…and the commodity balance stabilizes
Source: CEIC, DOSM, World Bank staff calculations
Balances, % of GDP (last four quarters)
-5
-3
-1
1
3
5
7
9
11
13
15
200
9Q
1
200
9Q
3
201
0Q
1
201
0Q
3
201
1Q
1
201
1Q
3
20
12
Q1
201
2Q
3
201
3Q
1
201
3Q
3
201
4Q
1
201
4Q
3
201
5Q
1
201
5Q
3
201
6Q
1
201
6Q
3
Commodity Balance
Non-Commodity CA Balance

6
The current account balance has increased
Source: World Bank staff calculations
Balances, % of GDP (last four quarters)
0.6 1.9
-15.0
-10.0
-5.0
0.0
5.0
10.0
15.0
20.0Current Transfers Primary and Secondary Income
Services Balance Goods Balance
Current Account

7
Fiscal consolidation continues despite lower oil-related revenues
Source: MOF, World Bank staff calculations
Balances of the Federal Government, percent of GDP
-6.7
-5.3
-4.7-4.3
-3.8-3.4 -3.2 -3.1 -3.0
-8
-7
-6
-5
-4
-3
-2
-1
0
2009 2010 2011 2012 2013 2014 2015 2016 2017f

8
GDP Growth remains resilient supported by private consumption
Source: CEIC, DOSM, World Bank staff calculations
Contribution to GDP, Y/Y
-4.0
-2.0
0.0
2.0
4.0
6.0
8.0
10.0
12.0
Private consumption Fixed investment Change in inventories
Government Net exports Real GDP

9
Households’ credit growth remained on a downward trend
Source: BNM, World Bank staff calculations
Loans outstanding (banking system); y/y change of 12-mth moving averages,%
0.0
2.0
4.0
6.0
8.0
10.0
12.0
14.0
16.0Passenger cars Residential property
Personal use Credit cards
Total, Households

10
Portfolio outflows were registered in Q3
Source: CEIC, DOSM, World Bank staff calculations
Portfolio flows, RM billion
-30
-25
-20
-15
-10
-5
0
5
10
15
20
25Q
1 2
013
Q2
20
13
Q3 2
013
Q4 2
013
Q1 2
014
Q2 2
014
Q3 2
014
Q4 2
014
Q1 2
015
Q2 2
015
Q3 2
015
Q4 2
015
Q1 2
016
Q2 2
016
Q3
20
16
Residents Non-residents Net portfolio flows

11
Among broad depreciation of currencies
Source: CEIC, BNM, World Bank staff calculationsNote: December data as at 16 December 2016
US$/ currency, Rebase Jan 2016= 100
90
92
94
96
98
100
102
104
106
108
Thai Baht Philippines Peso Indonesia Rupiah
Singapore Dollar Malaysia Ringgit

12
Weak but growing:
• Global economic growth
• Commodity prices
• Global trade
But higher uncertainty:
• Expect volatility

13
GDP growth expected to slowly recover in 2016
Source: CEIC, DOSM, World Bank staff projections
Change from last year, percent
5.5
4.7
6
5
4.2 4.34.5
0.0
1.0
2.0
3.0
4.0
5.0
6.0
7.0
2012 2013 2014 2015 2016f 2017f 2018f

14
Transforming urban transport
The Quest for Productivity Growth

15
Global TFP growth has been slowing down post the global financial crisis…
0.0
1.10.8
-0.3
0.5
-0.5
0.0
0.5
1.0
1.5
2.0
2.5
3.0
3.5
4.0
1990-1995 1996-2000 2001-2005 2006-2010 2011-2014
Capital StockLaborTFP
Source: World Development Indicators (WDI), World Bank staff calculations
Sources of world economic growth, annual growth rate, %

16
and the deceleration has been broad-based across all level of incomes
-1
0
1
2
3
4
5
6
7
199
6-2
00
0
200
1-2
00
5
20
06
-20
10
201
1-2
01
4
199
6-2
00
0
200
1-2
00
5
200
6-2
01
0
201
1-2
01
4
199
6-2
00
0
200
1-2
00
5
200
6-2
01
0
201
1-2
01
4
High income Middle income Lower middle income
Capital StockLabourTFP
Source: WDI, World Bank staff calculations
Sources of world economic growth, annual growth rate, %
17
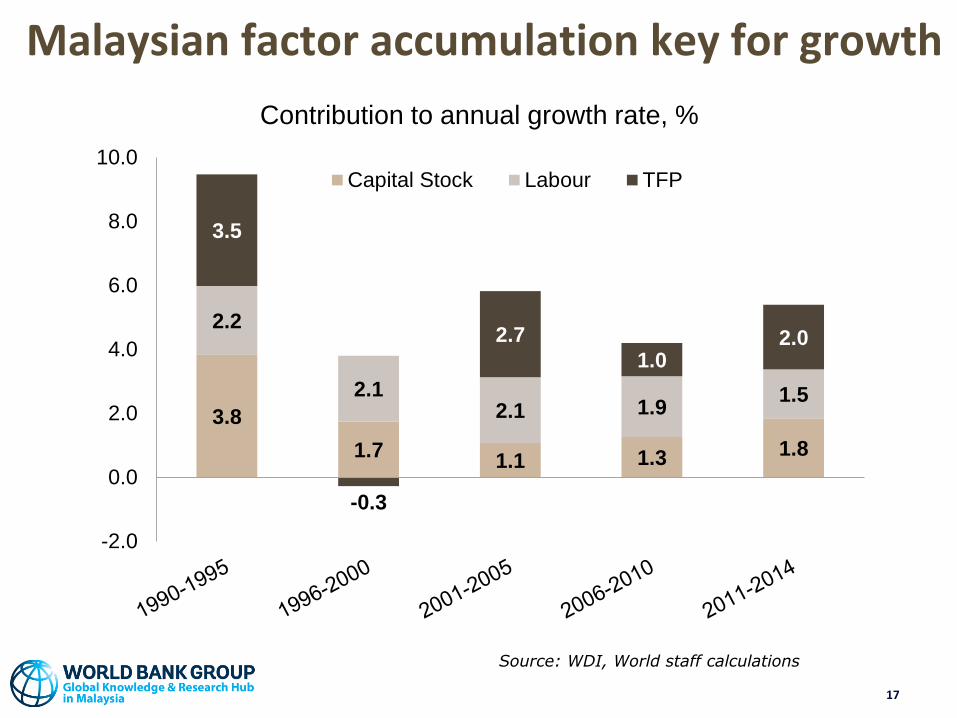
Malaysian factor accumulation key for growth
Source: WDI, World staff calculations
3.8
1.71.1 1.3 1.8
2.2
2.12.1 1.9
1.5
3.5
-0.3
2.7
1.02.0
-2.0
0.0
2.0
4.0
6.0
8.0
10.0Capital Stock Labour TFP
Contribution to annual growth rate, %

18
Malaysia’s TFP growth below high income regional economies
Source: WDI, World Bank staff calculations
2.0 2.0 1.9 1.9 1.83.0
2.00.9
1.91.1 1.4
1.1
1.8
2.2
2.2
2.3 2.1
4.4
0.0
1.0
2.0
3.0
4.0
5.0
6.0
7.0
8.0
9.0
Capital Stock Labour TFP
Contribution to annual growth rate, % (1990-2014)

19
Labour productivity in Malaysia is lower than many regional countries…
Source: WDI, World staff calculations
3.953.39 3.08 2.78 2.65
-1.00
0.00
1.00
2.00
3.00
4.00
5.00
Singapore Korea Thailand Turkey Malaysia
Change in Share of Working Age Population
Change in Participation Rate
Change in Employment rate
Change in Productivity
Value added growth per worker, annual growth rate, % (1990-2014)

20
…but above other peer countries
Source: WDI, World staff calculations
2.582.07
1.110.67
0.24
Indonesia Chile Brazil Peru Mexico
Value added growth per worker, annual growth rate, % (1990-2014)

21
Prior to the 1998 AFC, sectors with higher labour productivity created more employment
Source: WDI, World Bank staff calculations
-1.00
-0.50
0.00
0.50
1.00
1.50
2.00
-1.20 -1.00 -0.80 -0.60 -0.40 -0.20 0.00 0.20 0.40 0.60
Pro
ductivity
Employment
Manufacturing
Other activities*
Wholesale & retail
Mining
Agriculture
*Other activities - Finance,
business services, real estate and
government services
Value added growth per worker by sector, % (1990-1998)

22
After 1998, labour productivity reduced and destroyed employment in manufacturing
Source: WDI, World Bank staff calculations
-1.00
-0.50
0.00
0.50
1.00
1.50
2.00
-1.50 -1.00 -0.50 0.00 0.50 1.00
Pro
ductivity
Employment
ManufacturingOther activities*
Wholesale &
retail
Mining
Agriculture
*Other activities - Finance, business
services, real estate and government
services
Value added growth per worker by sector, % (1999-2014)

23
Higher productivity, key for raising income markedly in the long-run
Source: WDI, World staff calculations
GDP per capita, Malaysia/ Average high-income economies, %
22.228.6
39.748.4
90.8
0
10
20
30
40
50
60
70
80
90
100
Baseline: TFP growth = 1.8%
Scenario 1 (S1): TFP growth = 2.3%
Scenario 2 (S2): S1 + ∆ labour force
Scenario 3 (S3): S2 + human capital + investment
24
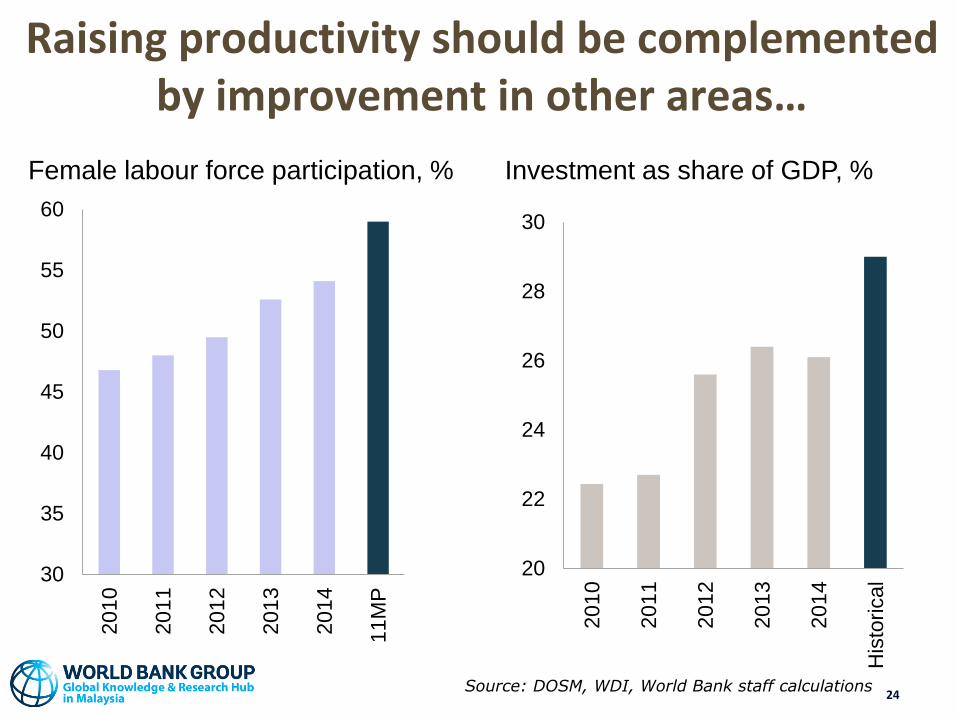
Raising productivity should be complemented by improvement in other areas…
Source: DOSM, WDI, World Bank staff calculations
Female labour force participation, % Investment as share of GDP, %
30
35
40
45
50
55
60
201
0
201
1
201
2
201
3
201
4
11M
P
20
22
24
26
28
30
20
10
20
11
20
12
20
13
20
14
His
torical

25
Sustained employment, in difficult sales environment
Source: World Bank Enterprise Surveys
Real employment growth; Real annual sales growth; Labourproductivity growth, %, 2012-2014
2.8 3.6 3.0
9.1
0.2
5.2
-2.9
5.4
-0.7
2.7
-5.3-3.4
-8
-6
-4
-2
0
2
4
6
8
10
Malaysia High-income &OECD
ASEAN China
Employment
Real annual sales
Labour productivity

26
Large firms lead recent productivity decline…
Source: World Bank Enterprise Surveys
Annual labour productivity growth, %, 2012- 2014
1.0
-3.2
-11.6
-14.0
-12.0
-10.0
-8.0
-6.0
-4.0
-2.0
0.0
2.0
Small (<20) Medium (20-99) Large (>100)

27
…mainly among exporting firms particularly in Malaysia
Source: World Bank Enterprise Surveys
Annual labour productivity growth, %, 2012- 2014
-15.0
-10.0
-5.0
0.0
5.0
Malaysia High-income &OECD
ASEAN China
Exporter Non-exporter

28
Services performed better than manufacturing
Source: World Bank Enterprise Surveys
Annual labour productivity growth, %, (2012-2014)
-16.0
-12.0
-8.0
-4.0
0.0
4.0
8.0
-8.0
-6.0
-4.0
-2.0
0.0
2.0
4.0Manufacturing Services

29
Manufacturing firms in Malaysia have higher variability of TFP…
Source: World Bank Enterprise Surveys
Manufacturing firms TFP (2012-2014)
0.0
0.5
1.0
1.5
2.0
2.5
3.0
3.5
4.0
4.5
Malaysia High-income &OECD
ASEAN China
25th percentile Median 75th percentile

30
…with much of the variability of TFP explained by large and small firms
Source: World staff Enterprise Surveys
Manufacturing firms TFP (2012-2014)
0
1
2
3
4
5
6
Mala
ysia
Hig
h-incom
e &
OE
CD
AS
EA
N
Chin
a
Mala
ysia
Hig
h-incom
e &
OE
CD
AS
EA
N
Chin
a
Mala
ysia
Hig
h-incom
e &
OE
CD
AS
EA
N
Chin
a
Small (<20) Medium (20-99) Large (>100)
25th percentile Median 75th percentile

31
lower productivity mainly explained by non-exporters
Source: World Bank Enterprise Surveys
Manufacturing firms TFP (2012-2014)
0
1
2
3
4
5
6
Mala
ysia
Hig
h-incom
e &
OE
CD
AS
EA
N
Chin
a
Mala
ysia
Hig
h-incom
e &
OE
CD
AS
EA
N
Chin
a
Non-exporters Exporters
25th percentile Median
75th percentile

32
Services productivity in Malaysia seem less productive than comparator countries
Source: World Bank Enterprise Surveys
Ratio of median labour productivity (Services/ Manufacturing)
0.0
0.5
1.0
1.5
2.0
2.5
Mala
ysia
Hig
h-incom
e &
OE
CD
AS
EA
N
Chin
a
Mala
ysia
Hig
h-incom
e &
OE
CD
AS
EA
N
Chin
a
Mala
ysia
Hig
h-incom
e &
OE
CD
AS
EA
N
Chin
a
Small Medium Large

33
Benchmarking Some Potential Drivers of Productivity
Skills Infrastructure
Innovation Efficiency

34
Skills Infrastructure
Innovation Efficiency

35
Malaysia manufacturing firms have a higher share of secondary educated workers…
Source: World Bank Enterprise Surveys
Share of secondary educated workers, % of total workers
0
20
40
60
80
100M
ala
ysia
Hig
h-incom
e &
OE
CD
AS
EA
N
Chin
a
Mala
ysia
Hig
h-i
nco
me
& O
EC
D
AS
EA
N
Chin
a
Manufacturing Services

36
Malaysian firms have lower vacancy rates but report more difficulties in finding skills
Source: World Bank Enterprise Surveys
Firms that find difficult to find skills, %
0
5
10
15
20
25
30
35
40
45
Total Small(<20)
Medium(20-99)
Large(>100)
Malaysia ASEAN
0
20
40
60
80
100 Malaysia ASEAN
Vacancy rate, %

37
Malaysian firms less likely to provide training and train fewer workers, mainly small firms
Source: World Bank Enterprise Surveys
0
20
40
60
80
100
Mala
ysia
Hig
h-incom
e &
OE
CD
AS
EA
N
Chin
a
Mala
ysia
Hig
h-incom
e &
OE
CD
AS
EA
N
Chin
a
Firms offeringformal training
Workers offeredformal training
0
10
20
30
40
50
60
Sm
all
(<20
)
Mediu
m (
20-9
9)
Larg
e (
>1
00)
Sm
all
(<20
)
Mediu
m (
20-9
9)
La
rge
(>
10
0)
Firms offering formaltraining
Workers offeredformal training
Firms that offer training, % Workers trained, %

38
Malaysian SMEs that provide training have higher labour productivity and TFP
Source: World Bank Enterprise Surveys
Median sales per worker, USD Median TFP, %
0
10,000
20,000
30,000
40,000
50,000
60,000
Small (<20) Medium(20-99)
Large(>100)
No training
Training
0.0
1.0
2.0
3.0
4.0
5.0
Small (<20) Medium (20-99)
Large(>100)
No training
Training

39
Skills Infrastructure
Innovation Efficiency

40
Productivity is positively associated with innovation
Source: World Bank Enterprise Surveys
Median sales per worker, USD
0
5,000
10,000
15,000
20,000
25,000
30,000
35,000
Small (<20) Medium (20-99) Large (>100)
No innovation Any innovation

41
Malaysian firms mainly focus on non-technical innovation
Source: World Bank Enterprise Surveys
Percentage of firms that innovate, %
0
10
20
30
40
50
Firms with technicalinnovation
Firms with non-technicalinnovation
Firms who spent onformal R&D
Malaysia ASEAN

42
Skills Infrastructure
Innovation Efficiency

43
Malaysia’s infrastructure compares well although other MICs are catching up
Source: World Economic Forum Global Competitiveness Index
Score (1-7), 2016-2017 and 2006-2007
0
1
2
3
4
5
6
7
2006-2007
2016-2017

44
Malaysia’s logistics performance compares well with other MICs
Source: World Bank Logistics Performance Index
Score (1-5), 2016 and 2007
0
1
2
3
4
5
2007 2016

45
Malaysian firms more likely to have water shortages and less power outages
Source: World Bank Enterprise Surveys
Manufacturing firms experiencing shortages/ outages, %
0
10
20
30
40
Mala
ysia
Hig
h-incom
e &
OE
CD
AS
EA
N
Ch
ina
Mala
ysia
Hig
h-incom
e &
OE
CD
AS
EA
N
Chin
a
At least 1 water shortage in a month At least 1 power outage in a month

46
Skills Infrastructure
Innovation Efficiency

47
Malaysian firms face less regulatory burden…
Source: World Bank Enterprise Surveys
Days, number of visits, time dealing with regulations
0
10
20
30
40
50M
ala
ysia
Hig
h-incom
e &
OE
CD
AS
EA
N
Chin
a
Mala
ysia
Hig
h-i
nco
me
& O
EC
D
AS
EA
N
Chin
a
Mala
ysia
Hig
h-incom
e &
OE
CD
AS
EA
N
Chin
a
Mala
ysia
Hig
h-incom
e &
OE
CD
AS
EA
N
Chin
a
Time spent dealingwith regulations (%)
Avg. visits ormeetings requiredwith tax officials
Days to obtainimport license
Days to obtainoperating license

48
…although regulatory burden increases with firm size
Source: World Bank Enterprise Surveys
Average senior management time spent dealing with regulations, %
0
2
4
6
8
10
12
14
Sm
all
Mediu
m
Larg
e
Sm
all
Mediu
m
Larg
e
Sm
all
Mediu
m
Larg
e
Sm
all
Mediu
m
Larg
e
Malaysia High-income &OECD
ASEAN China

49
Malaysian firms mention regulatory burdens as main constraints in the business environment
Source: World Bank Enterprise Surveys
Ranking of business environment obstacles, percent of firms
0
5
10
15
20
25
30
Pra
ctices
Info
rma
lS
ecto
r
Lic
en
se
s &
Perm
its
Ta
x R
ate
s
Ta
xA
dm
inis
tratio
n
Polit
ical
insta
bili
ty
Corr
up
tion
Lab
or
reg
ula
tio
ns
Access t
oL
an
d
Custo
ms &
Tra
de R
eg
Ele
ctr
icity
Tra
nspo
rta
tion
Access t
oF
ina
nce
Court
s
Cri
me
, T
he
ft &
Dis
ord
er
Ina
deq
uate
lye
du
ca
ted
work
forc
e
Malaysia
High-income & OECD

50
The proportion of Malaysian firms that are credit constrained is similar to comparators
Source: World Bank Enterprise Surveys
Firms financially constrained (fully or partially), % of firms
0
10
20
30
40
50
60
Malaysia High-income &OECD
ASEAN China

51
Gap between most and less productive manufacturing firms declined slightly
Source: DOSM, World Bank staff calculations
Labour productivity growth, %, 2005-2014
9.4
2.8
-1.9
-6.1
-8
-6
-4
-2
0
2
4
6
8
10
12
2005-2010 2010-2014
Above median Below median
Productivity gap:
11.3 ppt
Productivity gap: 8.9 ppt

52
Domestic-oriented manufacturing firms saw smaller decline in labour productivity growth
Source: DOSM, World Bank staff calculations
Labour productivity growth, %, 2005-2014
5.4
-1.5
3.8
-2.6
-3
-2
-1
0
1
2
3
4
5
6
2005-2010 2010-2014 2005-2010 2010-2014
Domestic-oriented Export-oriented

53
Distortions in output markets seem to undermine productivity growth
Source: DOSM, World Bank staff calculations
Productivity and factors distortions Productivity and output market distortions
-2
02
46
8
Cap
ital w
ed
ge
, lo
g(ta
u_k_
we
dg
e)
-4 -2 0 2Physical productivity, log(TFPQ)
l_tau_k_wedge lpoly smooth: l_tau_k_wedge
-4
-2
02
4
Outp
ut w
edg
e , lo
g(ta
u_y_
we
dg
e)
-4 -2 0 2Physical productivity, log(TFPQ)
l_tau_y_wedge lpoly smooth: l_tau_y_wedge

54
Removing distortions to the 1997 US level could increase productivity by 23 percent
Source: DOSM, World Bank staff calculations
TFP gains by misallocation,% TFP gains with US efficiency
42.9
75.7 7886.6
127.5
0
20
40
60
80
100
120
140
22.8 24.530.5
59.2
0
10
20
30
40
50
60
70
Malaysia2014
Turkey2014
China2005
India1994

55
Conclusions Productivity growth in Malaysia has declined since 2008, in part because
slowdown in external demand.
Malaysia shows relatively higher divergence in productivity of firms
In the same manufacturing industry, which can be explained by misallocation of resources across firms.
Between large and small firms, which can be explained by underperforming small firms => need to raise productivity of domestic laggard SMEs
Misallocation in output markets undermine productivity
Productivity benchmarking
Good average education but skills hard to find => training
Innovation but in non-technical areas => technology absorption
Infrastructure compares well => keep the edge on logistics performance
Efficiency limited by misallocation and perceived regulations => competition
Closing the gap with high income economies will require to accelerate productivity growth, while also keeping factor and human capital accumulation