MALAWI POWER SECTOR REFORM PROJECT AND …
247
September 2018 This report was prepared independently by Patricia Delaney, Meredith Feenstra, Billy Hoo, Stella Kalengamaliro, Olga Rostapshova, Daniel Sabet, Sylvia Sun, and Michele Wehle of Social Impact, Inc. at the request of the Millennium Challenge Corporation. MALAWI POWER SECTOR REFORM PROJECT AND INFRASTRUCTURE DEVELOPMENT PROJECT PERFORMANCE EVALUATION Enterprise Survey and Case Study Community Baseline Report MILLENNIUM CHALLENGE CORPORATION
Transcript of MALAWI POWER SECTOR REFORM PROJECT AND …
September 2018
This report was prepared independently by Patricia Delaney, Meredith Feenstra, Billy Hoo, Stella Kalengamaliro, Olga Rostapshova, Daniel Sabet, Sylvia Sun, and Michele Wehle of Social Impact, Inc. at the request of the Millennium Challenge Corporation.
MALAWI POWER SECTOR REFORM PROJECT AND INFRASTRUCTURE DEVELOPMENT PROJECT
PERFORMANCE EVALUATION Enterprise Survey and Case Study Community Baseline Report
MILLENNIUM CHALLENGE CORPORATION

MALAWI POWER SECTOR REFORM PROJECT AND INFRASTRUCTURE DEVELOPMENT PROJECT PERFORMANCE EVALUATION Enterprise Survey and Case Study Community Baseline Report September 2018
DISCLAIMER The authors’ views expressed in this publication do not necessarily reflect the views of the Millennium Challenge Corporation or the United States Government.

MCC Malawi: Enterprise Survey and Case Study Community Baseline Report
TABLE OF CONTENTS
Executive Summary ................................................................................................................. i 1. Introduction ....................................................................................................................... 1
2. Background ....................................................................................................................... 2
2.1 Compact Goals and Objectives................................................................................................ 2
2.2 Description of Compact Activities and Project Logic ................................................................ 2
3. Literature Review .............................................................................................................. 5
4. Evaluation Design ........................................................................................................... 11
4.1 Evaluation Type ..................................................................................................................... 11
4.2 Relevant Evaluation Questions .............................................................................................. 11
4.3 Methodology .......................................................................................................................... 12
4.3.1. Enterprise Survey ........................................................................................................... 13 4.3.2. Enterprise Survey Sampling ........................................................................................... 13 4.3.3. Measurement.................................................................................................................. 15 4.3.4. Enterprise Survey Sample Characteristics ...................................................................... 16 4.3.5. Enterprise Survey Analysis ............................................................................................. 19 4.3.6. Enterprise Survey Challenges and Limitations ................................................................ 20 4.3.7. Case study communities ................................................................................................. 21 4.3.8. FGD Participant Selection .............................................................................................. 22 4.3.9. FGD Challenges and Limitations .................................................................................... 23 4.3.10. IHS4 Oversample of Households in Select Communities ................................................ 24
5. Data Sources and Outcome Definitions ........................................................................ 26
5.1 Data sources ......................................................................................................................... 26
5.1.1. New data sources ........................................................................................................... 26 5.1.2. Existing data sources ...................................................................................................... 26
5.2 Outcome definitions ............................................................................................................... 27
6. Enterprise Survey Findings ........................................................................................... 31
6.1 IDP Q2: What are beneficiary businesses’ consumption/ expenditures patterns for different types of energy? How do consumption/expenditure patterns change as a result of improved electricity? ........................................................................................................................................ 31
6.1.1. Energy Sources .............................................................................................................. 32 6.1.2. Electricity as a Priority .................................................................................................... 32 6.1.3. Electricity Expenditures .................................................................................................. 33
6.2 Core Q1: What declines in poverty, increases in economic growth, reductions in the electricity related cost of doing business, increases in access to electricity, and increases in value added production are observed over the life of the Compact? ..................................................................... 36
6.2.1. Outages .......................................................................................................................... 36 6.2.2. Generator use................................................................................................................. 40

6.2.3. How outages affect operations ....................................................................................... 43 6.2.4. Outage Costs ................................................................................................................. 45 6.2.5. Low Voltage .................................................................................................................... 49
6.3 IDP Q3: Do beneficiary businesses change investments or alter their workforces following improvements in electricity reliability? ............................................................................................... 51
6.3.1. Capital Investments ........................................................................................................ 52 6.3.2. Employment and Labor Costs ......................................................................................... 55 6.3.3. Financial Status and Satisfaction with Profitability .......................................................... 57
6.4 IDP Q4: Does beneficiary male and female entrepreneurs’ satisfaction with ESCOM improve over the life of the Compact? Do these entrepreneurs perceive an improvement in the quality of electricity over the life of the Compact? What factors explain variation in satisfaction with ESCOM? 58
6.4.1. Satisfaction with Electricity Supply .................................................................................. 58 6.4.2. Satisfaction with ESCOM ................................................................................................ 59
6.5 PSRP Q6: Does ESCOM realize improvements in effectiveness and efficiency over the five years of the Compact in procurement, outage response, processing new connections, and response to customer problems? To what extent can observed gains be attributed to the Compact? If there are no improvements or the improvements are minimal, why? ............................................................... 63
6.5.1. ESCOM Fault Response ................................................................................................ 63 6.5.2. New Connections ........................................................................................................... 65 6.5.3. Billing .............................................................................................................................. 66
6.6 PSRP Q7: Is there a reduction in opportunities for corruption and/or a perception of corruption in procurement, service extension, and billing over the five years of the Compact? To what extent can observed gains be attributed to the Compact? If there are no gains or gains are minimal, why? ...... 67
6.6.1. Perceptions of Corruption ............................................................................................... 67 6.6.2. Self-Reported Corruption in Service Extension ............................................................... 69 6.6.3. Attitudes toward Corruption ............................................................................................ 69
6.7 PSRP Q8: Does the quantity and quality of ESCOM communications with the public and the transparency of ESCOM increase over the life of the Compact? To what extent do Compact efforts to improve communications contribute to observed improvements? If there are no improvements or improvements were minimal, why? ................................................................................................... 70
6.7.1. Notification of Outages ................................................................................................... 71 6.7.2. General Communication ................................................................................................. 72
6.8 IDP Q5: Do the attitudes of beneficiary male and female entrepreneurs’ attitudes toward cost-reflective tariffs improve over the life of the Compact? What factors explain variation in beneficiary male and female entrepreneurs’ attitudes toward cost reflective tariffs? ........................................... 73
6.8.1. Attitudes toward Tariffs ................................................................................................... 73 6.8.2. Support for tariff increases for improved services ........................................................... 74 6.8.3. Regression analysis of self-reported willingness to pay .................................................. 77
7. Case Study Community Findings .................................................................................. 79
7.1 Core Question 6: At the household level, the evaluations shall focus on the following program/project/activities impacts on households and individuals: income; expenditures; consumption and access to energy; individual time devoted to leisure and productive activities............................ 80
7.1.1. Energy Consumption, Access to Energy, and Energy Use ............................................. 80 7.1.2. Energy Expenditures ...................................................................................................... 84

MCC Malawi: Enterprise Survey and Case Study Community Baseline Report
7.1.3. Outages and the Quality of Electricity ............................................................................. 87 7.1.4. Time Use ........................................................................................................................ 90
7.2 Core Question 1: What declines in poverty, increases in economic growth, reductions in the electricity related cost of doing business, increases in access to electricity, and increases in value added production are observed over the life of the Compact? .......................................................... 93
7.3 PSRP Question 6: Does ESCOM realize improvements in effectiveness and efficiency over the five years of the Compact in procurement, outage response, processing new connections, and response to customer problems? To what extent can observed gains be attributed to the Compact? If there are no improvements or the improvements are minimal, why? ................................................ 94
7.3.1. Outage Response and Customer Service ....................................................................... 94 7.3.2. Obtaining a Connection .................................................................................................. 96
7.4 PSRP Question 7: Is there a reduction in opportunities for corruption and/or a perception of corruption in procurement, service extension, and billing over the five years of the Compact? To what extent can observed gains be attributed to the Compact? If there are no gains or gains are minimal, why? 98
7.5 PSRP Question 8: Does the quantity and quality of ESCOM communications with the public and the transparency of ESCOM increase over the life of the Compact? To what extent do Compact efforts to improve communications contribute to observed improvements? If there are no improvements or improvements were minimal, why? ..................................................................... 100
8. Conclusions .................................................................................................................. 101
9. Administrative ............................................................................................................... 113
9.1 Institutional Review Board Requirements and Clearances ................................................... 113
9.2 Data Access, Privacy, and Documentation .......................................................................... 113
9.3 Dissemination Plan .............................................................................................................. 113
9.4 Evaluation Team Roles and Responsibilities ....................................................................... 114
10. References ..................................................................................................................... 115
11. Annexes ......................................................................................................................... 119
11.2 Enterprise Survey Instrument ................................................................................................. 131
11.3 Focus Group Discussion Protocols ......................................................................................... 186
11.4 Stakeholder Comments and Evaluator Responses ................................................................. 202
TABLES & FIGURES TABLES Table 1: FGD site selection .................................................................................................................... iii Table 2: Costs of outages by type of cost and customer type ................................................................ vi Table 3: Power generation capacity targets ........................................................................................... 6 Table 4: Total MWh load shed by year ................................................................................................... 7 Table 5: Enterprise survey sample stratification ................................................................................... 15 Table 6: Enterprise survey sample firm attributes, by customer type .................................................... 18 Table 7: Focus group site selection ...................................................................................................... 22 Table 8: Geographic distribution of households surveyed in NSO IHS ................................................. 25 Table 9: Outcome definitions by concept, data source, and question ................................................... 28 Table 10: Energy sources (n=1,021) .................................................................................................... 32 Table 11: Electricity expenditures in the last year and previous year, by customer type and region ..... 34 Table 12: Median annual generator costs by customer type, region, and firm size among surveyed firms reporting each type of cost (USD) ........................................................................................................ 42 Table 13: Impact of outages on operations – delays, by generator use ................................................ 45 Table 14: Median annual generator costs for firms with generators, by customer type ........................ 45 Table 15: Costs of outages and poor-quality electricity by type of cost and generator ownership ........ 46 Table 16: Costs of outages by type of cost and customer type ............................................................ 47 Table 17: Frequency of low voltage (n=1,022) ..................................................................................... 49 Table 18: No. of full-time employees and change over time, by customer type and firm size ............... 56 Table 19: Relationship between satisfaction with electricity supply and employee growth (n=959) ...... 57 Table 20: Predicted probability of dissatisfaction with ESCOM for statistically significant variables...... 61 Table 21: Firms calling to report a fault by region ................................................................................. 63 Table 22: ESCOM's average response time to fix a fault, by customer type and region ....................... 65 Table 23: Perceived corruption in ESCOM ........................................................................................... 68 Table 24: Average number of outage notifications firms received in the last three months ................... 71 Table 25: Perception of fairness of electricity tariff as a fair price for electricity .................................... 73 Table 26: Proportion of firms holding various views on tariffs ............................................................... 74 Table 27: Average % increase in electricity tariffs firms willing to pay to reduce outages by half or almost eliminate them (n=1,021) ..................................................................................................................... 75 Table 28: Geographic distribution of households surveyed in NSO IHS ............................................... 79 Table 29: Household access to electricity ............................................................................................ 80 Table 30: What is your main source of cooking fuel? ........................................................................... 81 Table 31: What is your main source of cooking fuel? (FGD communities) ............................................ 81 Table 32: What is your main source of lighting fuel? ............................................................................ 82 Table 33: In the last 12 months, how frequently did you experience blackouts in your area? ............... 88 Table 34: In the event of a black out, what source of energy do you use for lighting? .......................... 88 Table 35: In the event of a black out, what source of energy do you use for cooking? ......................... 88 Table 36: Predominant time use patterns across males, females, and secondary students ................. 90 Table 37: Costs of outages by type of cost and customer type .......................................................... 103 Table 38: Regression models of satisfaction with electricity supply .................................................... 119 Table 39: Regression Model of perceived fairness of the ESCOM Tariff ............................................ 122 Table 40: Regression results on support for tariff increase ................................................................ 125 Table 41: Predicted Probabilities ....................................................................................................... 128

MCC Malawi: Enterprise Survey and Case Study Community Baseline Report
FIGURES Figure 1: Access to electricity (percent of population) ............................................................................ 9 Figure 2: Distribution of enterprise survey sample, by region and customer type (n=1,024) ................. 17 Figure 3: Enterprise survey sample distribution by sector (n=1,024) .................................................... 19 Figure 4: Biggest obstacle to growth (n=1022) ..................................................................................... 33 Figure 5: Electricity expenditures as proportion of total costs in most recent year, MD customers (in USD) ............................................................................................................................................................ 35 Figure 6: Electricity expenditures as proportion of total costs in most recent year, Three-phase customers (in USD) ............................................................................................................................................... 35 Figure 7: Number of outages reported per month, among firms that did and did not track outages ...... 38 Figure 8: Number of outages reported per month, by customer type (rainy season) ............................ 38 Figure 9: Number of outages reported per month, by customer type (dry season) ............................... 39 Figure 10: Estimated duration of outages in rainy season, by customer type ...................................... 39 Figure 11: Estimated duration of outages in dry season, by customer type .......................................... 40 Figure 12: Main reasons firms do not always run their generator (n=61) .............................................. 41 Figure 13: Generator fuel costs by customer type ................................................................................ 42 Figure 14: Generator maintenance costs by customer type ................................................................. 43 Figure 15: Impact of power outages on business operations, by generator use ................................... 44 Figure 16: Impact of power outages on business operations, by firm size (n=961) .............................. 44 Figure 17: Distribution of outage costs by type for Three Phase customers ......................................... 48 Figure 18: Distribution of outage costs by type for MD customers ........................................................ 48 Figure 19: Reported frequency of low voltage, by region ..................................................................... 50 Figure 20: Impact of low voltage on business, by customer type, region and generator use ................ 51 Figure 21: Proportion of firms reporting capital investment by type of investment, by customer type ... 52 Figure 22: Total capital investment, by customer type.......................................................................... 53 Figure 23: Reasons why firms chose to make new capital investments ............................................... 54 Figure 24: Reasons why firms chose not to make new capital investments ......................................... 55 Figure 25: Economic outlook for business (n=947) .............................................................................. 58 Figure 26: Satisfaction with current revenue and profits (n=947).......................................................... 58 Figure 27: Satisfaction with electricity supply at facility ........................................................................ 59 Figure 28: Dissatisfaction with ESCOM and other utilities .................................................................... 59 Figure 29: Satisfaction with ESCOM by region .................................................................................... 60 Figure 30: Satisfaction with ESCOM's responsiveness to faults, by region (n=1020) ........................... 64 Figure 31: Perceived change in ESCOM's responsiveness over past 12 months (n=1020), by region . 64 Figure 32: Preference for prepaid versus postpaid meters, by customer type ...................................... 66 Figure 33: Billing issues faced by postpaid customers (n= 171) ........................................................... 66 Figure 34: Billing issues faced by prepaid customers (n=407) ............................................................. 67 Figure 35: Agreement that it is sometimes justifiable to make informal payments or bribes to obtain improved services, by region (n=1,020) ............................................................................................... 70 Figure 36: Agreement that it is sometimes justifiable to leverage personal contacts to obtain improved services, by region (n=1,020) ............................................................................................................... 70 Figure 37: Perception of how often outage notifications are accurate, by customer type and region .... 72 Figure 38: Perception of ESCOM customer communications quality, by customer type and region ..... 73 Figure 39: What percent increase in electricity tariffs would you be willing to pay if the number of outages could be reduced by half? (n=1,021) .................................................................................................... 76 Figure 40: What percent increase in electricity tariffs would you be willing to pay if the number of outages could be almost eliminated (n=1021) ................................................................................................... 76 Figure 41: Monthly electricity costs for lower income and middle-high income communities ................ 85

Figure 42: Would you agree or disagree with the following statement: On the whole ESCOM is responsive to the needs of households like mine? (n=406) .................................................................................... 95 Figure 43: How satisfied are you with ESCOM? (n=420) ..................................................................... 95 Figure 44: Distribution of wait to get electricity (weeks after electricity application), n=50 .................... 97 Figure 45: Summary of the IDP project logic ...................................................................................... 111
MCC Malawi: Enterprise Survey and Case Study Community Baseline Report
ACRONYMS Acronym Definition EA Enumeration Areas ENRM Environmental and Natural Resource Management Project ES Enterprise Survey ESCOM Electricity Supply Corporation of Malawi FGD Focus Group Discussion GDP Gross Domestic Product GIS Geographic Information System GoM Government of Malawi IDP Infrastructure Development Project HIS Integrated Household Survey IKI Invest in Knowledge Initiative IPP Independent Power Producer IRP Integrated Resource Plan ITT Indicator Tracking Table kV Kilovolt LV Low voltage MCA-Malawi Millennium Challenge Account – Malawi MCC Millennium Challenge Corporation MCCCI Malawi Confederation of Chambers of Commerce and Industry MD Maximum Demand MERA Malawi Energy Regulatory Authority MIS Management Information System MNREM Ministry of Natural Resources, Energy, and Mining MW Megawatt MWK Malawi Kwacha (currency) NSO National Statistical Office OLS Ordinary Least Squares PSRP Power Sector Reform Project R/P Reima Probe SAR Semi-Annual Review SD Standard Deviation SI Social Impact SMS Short Message Service SSA Sub-Saharan Africa TI Transparency International USD United States Dollar VIF Variance Inflation Factor WB World Bank WTP Willingness to Pay

i SOCIALIMPACT.COM
MCC Malawi: Enterprise Survey and Case Study Community Baseline Report
EXECUTIVE SUMMARY Introduction
On April 7, 2011, The Millennium Challenge Corporation (MCC) signed a five-year, USD $350.7 million Compact with the Government of Malawi (GoM) to address the structural, operational and financial inefficiencies of power subsector institutions, and the generation, transmission and distribution capacity constraints facing the country’s power subsector. The five-year implementation period began on September 20, 2013 and runs through September 19, 2018. The MCC Malawi Compact includes three projects: The Infrastructure Development Project (IDP, allocated $257.1 million), the Power Sector Reform Project (PSRP, allocated $25.7 million), and the Environmental and Natural Resource Management Project (ENRM, allocated $27.9 million). Social Impact (SI)’s evaluation focuses on the IDP and PSRP.
The overarching goal of the Compact is to reduce poverty through economic growth in Malawi. The Compact aims to accomplish this goal by focusing its efforts on three primary objectives:
1. Reduce the cost of doing business in Malawi 2. Expand access to electricity for the Malawian people and businesses 3. Increase value-added production in Malawi
Malawi’s access to electricity rate (11.9 percent) is one of the lowest in the world.1 Its electricity generation capacity is also extremely low, with installed capacity of just 19.6 Megawatt (MW) per million people. In comparison, low- and middle-income countries, on average, produce 24.4 MWh per million people and 796.2 MWh per million people, respectively. 2 In addition to low installed capacity, Malawi is also not producing at full capacity for a variety of reasons, including aging infrastructure, poor maintenance, weak natural resource management, and extreme weather. Demand for electricity is also considerably greater than the supply and is expected to continue to grow. The consequences of the imbalance between supply and demand are frequent outages and load shedding. Low electricity access rates and unreliable supply for those with power connections are major obstacles to economic growth.3 It is estimated that the country loses approximately two percent of GDP due to power outages, and 22 percent of business turnover due to outages.4 The lack of access to reliable electricity negatively affects households in many ways.
This report describes the baseline evaluation data from a) a nationwide geographically-representative sample of businesses with electricity connections, which we refer to as an enterprise survey (ES), and from b) the household survey and focus group discussions (FGD) conducted in select communities. At baseline, the ES, household survey, and FGDs illustrate the challenges frequent outages and poor-quality electricity present to both businesses and households. These data sources also explore businesses and households’ experiences with the Electricity Supply Corporation of Malawi (ESCOM). These data collection activities are expected to be conducted again in 2019 to measure changes over time that might be attributable to the PSRP and the IDP. While the primary goal of this evaluation overall is to track changes over time, this baseline study will fill knowledge gaps related to the costs to Malawi’s businesses and households in
1 The World Bank. 2014. Malawi: Access to electricity (% of population). Washington DC: The World Bank. 2 Foster, Vivien and Shkaratan, Maria. “Malawi’s Infrastructure: A Continental Perspective.” Africa Infrastructure Country Diagnostic. 2010. 3 Ibid., 8-17 4 Ibid.
SOCIALIMPACT.COM ii
response to energy challenges. Specific evaluation questions are included below and the baseline findings for both the ES, household survey, and FGDs are organized by evaluation question.
Enterprise Survey Methodology
Given that all Malawian businesses should benefit from the PSRP and that most will benefit from the IDP, the sample was drawn to be geographically representative of the country’s businesses with existing three-phase or maximum demand (MD) electricity connections with an oversample of MD customers. The sampling frame for the study is based off ESCOM’s customer rolls, and as such, businesses that have no electricity connection or a household electricity connection, including much of the informal sector, were excluded from the population of study. The sampling frame identified a population of 9,991 firms. The survey was designed to be a panel survey, whereby we would interview the same firms at baseline, midline (2017) and endline (2019). To account for expected attrition and to be able to disaggregate on key variables, SI proposed using a relatively large sample of 1,800 firms. Due to several data collection challenges discussed in the body of the report, including the cancelation of the contract of the original data collection firm, the final sample size was limited to 1,024, weighted to be nationally representative, and data collection was spread over the course of more than a year (June 2015-July 2016).
The survey covers a variety of topics in three major parts. The first part obtains information on the firm characteristics and the business environment, including questions on whether electricity is a major obstacle to growth, energy use and dependence on electricity, and awareness and impression of the Millennium Challenge Compact. The second part asks questions about power reliability and quality, gathering data on outages and voltage fluctuations, business response to outages, various costs associated with outages or voltage fluctuations (e.g., generator related costs, idle worker related costs, damaged equipment, lost revenue), satisfaction with the electricity situation in the past 12 months, experience and satisfaction with ESCOM (e.g., fault response, new connections, billing, communications), perceptions of and experiences with corruption in the sector, and attitudes towards tariffs and cost-reflective tariffs. The third part addresses financial and general management of the firm, including questions about electricity costs relative to total business costs, changes in employment in the past year, and levels of investment.
Case Study Communities Methodology
To explore energy challenges and changes over time at the household level, the evaluation selected several case study communities based on 1) region and 2) a combination of income and access to electricity. In addition, all the sites are expected to benefit from the IDP investments. The original evaluation design only involved focus group discussions (FGDs) in these communities; however, in 2016 and 2017 the National Statistical Office (NSO) also conducted a household survey in the selected communities as an oversample of its Fourth Integrated Health Survey (IHS4). Table 1 presents the case study communities. The table differentiates between income and access level on the one hand and region/city on the other hand. To further verify the comparability of the sites prior to data collection, the evaluation team visited each of the research sites and conducted interviews with community leaders. Millennium Challenge Account – Malawi (MCA-Malawi) and ESCOM personnel provided suggestions on which communities would benefit from the IDP.

iii SOCIALIMPACT.COM
MCC Malawi: Enterprise Survey and Case Study Community Baseline Report
Table 1: FGD site selection
Lilongwe Blantyre Mzuzu
Middle-high income with electricity Focus on outages, quality, customer service, and economic decision-making regarding energy use.
Area 18B: (Transmission line)
Limbe Central: Kanjedza (Limbe A substation)
Katoto: New Katoto (transmission)
Lower middle income with electricity Focus on outages, quality, the process of obtaining access, customer service, and economic decision-making regarding energy use.
Area 25C: (Transmission line plus new substation)
Blantyre West: Zingwangwa (Ntonda Substation)
Nkhorongo: (Transmission line plus Sonda substation)
Lower middle income without electricity Focus on barriers to access, the process of obtaining access, and economic decision-making regarding energy use.
Area 25B: Kabwabwa (Transmission line plus new substation)
Blantyre West: Zingwangwa traditional area (Ntonda Substation)
Chibavi: (Transmission line plus Sonda substation)
Three FGDs took place in each community, including an adult male focus group, an adult female focus group, and a youth mixed-gender focus group of secondary students (ages 15-21).5 In total 27 FGDs with 255 participants were conducted from May to July 2015. Participants were randomly recruited by a recruitment team from the data collection firm using a screening instrument that included questions on age, sex, income, electricity access, and level of knowledge about electricity in their household. Upon arrival at the focus group session location, each participant completed a short mini-survey on the topics below. The surveys were read and tallied quickly prior to the discussion. Based on this information, the FGD facilitators refined discussion questions and asked targeted follow-up questions. The discussions covered the following four themes, each of which was introduced with a guiding question:
• Theme 1: Sources of and expenditures on electricity and energy costs • Theme 2: Reported experiences with electricity, including outages and quality of supply (only for
those with a connection) • Theme 3: Time use and income generating activities • Theme 4: Attitudes towards ESCOM, services, and tariffs
In addition to the FGDs, a total of 591 respondents participated in the NSO’s IHS4 survey. Because the sample sizes were relatively small, in the analysis below, we present the data separately for two groups: middle-high income communities with good access to electricity (n=224) and lower income communities with mixed access (n=367). We do not intend for the survey findings to be representative of a population other than these specific case study communities, and the statistics should not be interpreted as representative of the country or income groups.
5 Age ranges for “youth” vary across studies. In this case, the youth age range was selected to maximize the probability that respondents would be enrolled in secondary school.
SOCIALIMPACT.COM iv
Findings
This section synthesizes conclusions drawn from enterprise survey and focus group discussion findings and is organized by question. The evaluation questions cannot be fully answered until endline data analysis and the baseline data will be used in the final evaluation to analyze changes over time to explore the potential impact of the IDP and PSRP investments. This report summarizes the baseline characteristics and provides some preliminary responses using the baseline data. Several core questions can only be addressed at endline, including: Core Q2: What were the results of the intervention? Core Q4: What were the lessons learned and are they applicable to other similar projects? Core Q5: What is the likelihood that the results of the Project will be sustained over time?
As a whole, this report provides baseline data for Core question 3: Are there differences in outcomes of interest by gender, age, and income? Sex and income disaggregated information for businesses and households will be pursued to the extent possible. The survey and FGDs were designed to examine the differences in outcomes across these categories, and these disaggregations are reflected throughout our analysis of baseline outcomes. Household-level baseline data were disaggregated by gender, income and age. We disaggregated the enterprise-level outcomes by sex of respondent and customer type (a proxy for business size); for certain outcomes we disaggregated by business size categories based on number of employees.
The enterprise survey data provides the baseline for Core question 7: At the enterprise level, the evaluation shall focus on the impact of the program/project/activities on: business profitability and productivity; value added production and investment; employment and wage changes; energy consumption and sources of energy used; business losses. Core question 7 focuses on estimating the impact of project activities on business outcomes and will be addressed at endline; the baseline values for the firm-level outcomes of interest are presented within the IDP and PSRP question responses.
The questions are in topical rather than numeric order.
IDP Q2: What are beneficiary businesses’ consumption/expenditure patterns for different types of energy? How do consumption/expenditure patterns change as a result of improved electricity?
Business energy consumption: Electricity is a high priority for Malawian businesses, many of which depend heavily on electricity. Beyond electricity, the second most commonly energy source is biomass fuel (e.g., charcoal, firewood), used by 14 percent of firms. Insufficient or unreliable electricity supply inhibits enterprises’ ability to operate at full capacity and threatens growth. When asked which elements of the business environment present obstacles to growth, 50 percent of respondents in our survey cited the quality and reliability of electricity as the biggest obstacle, and 27 percent as the second biggest obstacle.
Business electricity expenditures: Electricity expenditures were significantly higher for MD customers, with the median MD firm spending around $29,538 in the year prior to the survey on electricity, compared to a median three-phase customer that reported spending $1,867.6 Electricity expenditures represented 48 percent of all business costs for the median three-phase customer and seven percent for the median MD customer. The high percentage of electricity expenses among three phase customers is primarily
6 Kwacha values were converted to U.S. dollars via an average daily exchange rate based on each firm's reported financial year(s).
v SOCIALIMPACT.COM
MCC Malawi: Enterprise Survey and Case Study Community Baseline Report
driven by maize mills, which make up a large proportion of the sample and for whom electricity costs represented 54 percent of costs (median). However, it is important to note that many respondents refused to answer question about financials, and we have concerns with the expenditure estimates provided by some respondents. At endline, we plan to examine ESCOM consumption data, which may be a more reliable measure of firms’ electricity consumption and expenditures.
Core Q1: What declines in poverty, increases in economic growth, reductions in the electricity related cost of doing business, increases in access to electricity, and increases in value added production are observed over the life of the Compact?7
Businesses
Outages: Electricity dependent businesses are vulnerable to power outages, which are more common during the rainy season. There are challenges measuring outages through a survey. Most firms did not track outages, and these firms reported much higher incidence of outages in a typical month than those that kept records. Firms that did not track outages reported experiencing a mean of 14 (median of 12) outages in a typical month in the rainy season, and a mean of eight (median of 10) outages in the dry season. These estimates were higher than the frequency of outages estimated by firms that tracked outages. These firms reported an average of seven outages (median of five) per month in the rainy season, and a mean of four (median of three) in the dry season. Three-phase customers reported slightly more frequent outages than MD customers, which lasted longer on average. This is consistent with expectations, as some MD firms are located along industrial lines that are prioritized during load shedding, and there is some indication that ESCOM is more responsive to MD firms in responding to outages. It should also be noted that the survey occurred during a period of relatively few outages. Outages would later increase dramatically in 2017 and 2018 after a period of low rainfall limited hydroelectric generation.
Response to outages: In response to outages, businesses were forced to totally shut down their operations 74 percent of the time and partially shut down 16 percent of the time. Businesses were able to continue operating with minimal disruption in only ten percent of cases. Generators allowed many firms to maintain operations during outages. Only 18 percent of firms with generators reported experiencing a total or partial shutdown of business during power outages, compared with 85 percent of firms without generators.
Despite their utility, only 25 percent of sampled firms reported using or owning generators. Most MD customers used generators (65 percent), compared to only 13 percent of three-phase customers, and not surprisingly larger firms were far more likely to use generators. The cost of fuel is the largest expense associated with running a generator. In the previous year, the median medium sized business reported spending $1,713 on generator fuel, while the median large business spent $4,012 a year. MD customers spent significantly more than three-phase customers (median $3,585 vs. $974, respectively). In addition to fuel, generator maintenance represents another significant expenditure for businesses. In the previous year,
7 For this report we focus on the costs of outages. Changes in poverty and economic growth asked in the question will be tracked using the WB’s Country Dashboard to obtain poverty trend (both by international and national standards) in Malawi. We are unfortunately not able to speak to changes in value added production, as we were not able to measure inputs and outputs. We do, however, look at new investments and employee growth in IDP Q3.

SOCIALIMPACT.COM vi
the median large business spent a reported $686 to maintain their generator, the median medium business spent $202, small business $95, and the median micro business spent $24 on maintaining their generators.
Outages can also affect business by causing delays in firms receiving inputs from suppliers. Fifteen percent of firms reported instances in the last year in which their suppliers were delayed in delivering inputs due to power outages. Firms that were 100 percent foreign-owned were more likely to experience delays in supplier delivery. Outages substantially affected firms’ ability to provide goods and services to clients on time; 80 percent of firms were delayed in providing goods or services in the last year due to power outages. Those with generators were much less likely to experience delays in providing goods or services to clients.
Costs of outages: As firms completely or partially shut down or switch to generators, they incur a variety of costs, including idle workers, damaged equipment from power surges, surge protection equipment, other costs, and lost revenue, although not technically a cost. As shown in Table 2, we estimate that outages cost the median firm $718 over the course of a year. Outage costs were much higher for MD customers. Although three-phase customers had lower costs associated with outages than MD customers in each category, the difference was most pronounced in lost revenue. Idle workers during outages were the second most commonly cited cost. Fifty-nine percent of firms reported that the firm bears the cost of idle workers during an outage, while 22 percent of firms (almost entirely three phase firms) reported that workers make up the lost time later. The mean cost of idle workers for MD customers ($4,317) is over ten times that of three-phase customers ($430). Approximately a third of the firms surveyed reported experiencing damage to equipment in the last 12 months due to electricity issues such as power surges. The cost of fixing or replacing items damaged from power irregularities was significantly higher for MD customers, with the median MD firm that incurred damage spending $1,605, and the median three phase firm spending $358 in the last year as a result of the damage. Many firms also invested in surge protection equipment. Other costs of outages cited by firms included destruction of raw materials, lost output, restart costs, and others. These costs were especially high for MD customers.
Table 2: Costs of outages by type of cost and customer type
Total Three phase MD N Median N Median N Median
Lost revenue 542 $764 463 $716 79 $7,159 Idle worker costs 407 $131 359 $430 48 $686 Damage costs 336 $361 247 $358 89 $1,605
Surge protection costs 376 $95 232 $84 144 $716 Other costs 218 $430 152 $322 66 $3,580
Total outage costs (including generator) 1024 $718 780 $656 244 $7,938 While outages only led to some delays in receiving inputs from suppliers, outages significantly affected firms’ ability to provide goods and services to clients – as evidenced by the lost revenue estimates above. Eighty percent of firms were delayed in providing goods or services in the last year due to power outages - incurring cost in terms of lost potential business (revenue), particularly in export markets.
Low Voltage: Respondents reported occasional problems with low voltage, with approximately a third of firms reporting low voltage once to several times a month, while 15 percent reported having issues with low voltage once a week or more often. Firms in the North experienced low voltage most frequently.

vii SOCIALIMPACT.COM
MCC Malawi: Enterprise Survey and Case Study Community Baseline Report
Approximately 80 percent of firms in the North and South reported that low voltage had a major impact on their business. Three phase customers were more likely to report major impacts to their business compared to MD customers. Firms with a generator were much less affected by low voltage.
Households
While the enterprise survey explored the relationship between electricity and the costs of doing business with businesses in the formal economy, the FGDs explored how electricity challenges affect household businesses in the informal economy. FGDs suggest that the current electrical supply system limits potential profits in several ways. First, the fluctuation of electrical current and supply creates business losses through spoilage of perishable inputs and products. Second, frequent outages limit productivity in energy-intensive businesses (e.g.: growing chickens for sale). Third, the lack of electricity increases the cost of inputs since business owners are forced to pay for other sources (e.g.: batteries or ice blocks to preserve inventory). Fourth, the early evening time of most blackouts occurs precisely during the time of greatest potential demand for most business. In addition, poor electricity means less time for computer-based work for middle-income participants.
Core Question 6: At the household level, the evaluations shall focus on the following program/project/activities impacts on households and individuals: income; expenditures; consumption and access to energy; individual time devoted to leisure and productive activities.
Energy consumption, access to energy, and energy use. Although electricity access has been steadily increasing, the 2015-2016 Demographic and Health Survey found that only 11 percent of Malawian households and 49 percent of urban households had access to electricity.8 The FGDs make clear that even those with access to electricity strongly prefer electricity but rely on a mix of energy sources that includes charcoal and firewood due to unreliable and poor-quality electrical supply. The 2016-2017 IHS4 oversample in our study communities estimates that 57 percent of residents in the middle-low income communities and 24 percent of residents in the middle-high income communities rely primarily on charcoal for cooking. There was only negligible evidence of a cultural preference for charcoal.
Energy expenditures. On average, households in the lower income communities reported spending USD $13.46 (MWK 9,555) per month on electricity, while households in middle-high income communities spent USD $22.96 (MWK 16,301) per month.9 Over 80 percent of participants in each FGD articulated a belief that electricity is generally less expensive than charcoal; however, many participants felt that charcoal was more cost effective for cooking items that require simmering for a long period (e.g., nsima). Participants with electricity connections held strong and consistent views about the superiority of pre-paid meters over post-paid meters in terms of cost and household budgeting.
Outages and quality of electricity. There was almost 100 percent agreement among FGD participants that electricity outages are frequent, seldom announced, and problematic. Frustration with outages and the lack of communication about them was a major topic of conversation in every FGD. Across regions,
8 National Statistical Office. 2017. Malawi: Demographic and Health Survey, 2015-2016 9 Values reported in Malawian Kwacha were converted to U.S. dollars via an annual average of the exchange rate for 2016, approximately 1 USD = 710.1 MWK. The historical daily exchange rate was sourced at http://www.exchangerates.org.uk/USD-MWK-exchange-rate-history-full.html#.

SOCIALIMPACT.COM viii
most participants agreed that the most frequent time for blackouts was during peak demand between 18:00-20:00, which is problematic for families’ evening routines. Furthermore, over 50 percent of participants in the mini-surveys said that electricity service was “getting worse.” Participants also reported multiple examples of damaged appliances due to voltage fluctuation.
Time usage. FGD participants were asked to create a timeline of their activities from 18:00 to 24:00 on a typical weekday night. Not surprisingly, women, men, and secondary school students exhibit different time use patterns. Blackouts in the evening directly impact the ability of women to cook the evening meal, bathe children, and do housework. A woman in Zingwangwa said: “We indeed go to sleep very early just because even if you wanted to clean your plates at night, you can’t do that, how to do that while in the darkness? You just go and sleep, waiting for morning to come.” Outages not only impact the current period of the outage but also make it more difficult to complete preparations for the next day. Unlike women, men focus most of their evening time on leisure pursuits and productive activities. The lack of electricity during evening hours causes men to leave the house in the evening and leads to behavioral patterns which men themselves recognize as inappropriate and potentially damaging to the family. A man in New Katoto explained, “When you are home and you want to relax with your family, you find that there is a blackout then you start to wonder what you will do. It’s better to go to the bottle shop where there is electricity…that’s what disturbs our program at home.” For youth, poor electricity means less time for study, which is particularly harmful for young women who generally do not leave the house in the afterhours. A Kabwabwa girl said, “We girls cannot be allowed to go out to study at night. My parents will not allow me.” Compared with their peers with electricity connections, households without power lose valuable evening hours and tend to go to sleep at an earlier hour.
IDP Q3: Do beneficiary businesses change investments or alter their workforces following improvements in electricity reliability?
Business investments: About a third of firms reported making substantial new investments in the previous year. The median value of capital investment was $4,916 for three phase firms and $37,515 for MD firms. For firms making an investment, the most popular investment was purchasing or renting new equipment or tools (44 percent of investing firms) or building new structures (40 percent), followed by purchasing or renting additional land (26 percent), upgrading existing structures (22 percent) and hiring more workers (21 percent). There were substantial differences by customer type, with MD firms more likely to make investments in the purchase of new equipment and hiring workers compared to three phase firms. When asked why it was a good time to invest, the majority of respondents among the firms that invested reported the main reason they did so was high demand or access to markets: 69 percent of MD firms and 63 percent of three phase firms. The second most salient reason depended on the customer type. For MD firms, high internal capacity of the firm was the most common reason to invest, cited by 44 percent, while for three phase firms access to financing was the second most cited reason (cited by 39 percent of firms). Only one percent of MD customers and five percent of MD customers cited reliable electricity as a main driver of their investment.
Among firms that did not invest, the most commonly reported reasons why firms had not made new investments were lack of access to finance (45 percent), and a low demand or access to markets (39 percent). In contrast to three-phase customers, a large fraction of MD customers (31 percent) cited poor macroeconomic/political climate as a major reason they did not make new capital investments. Three-phase customers were more likely than MD customers to cite lack of access to finance or to markets as

ix SOCIALIMPACT.COM
MCC Malawi: Enterprise Survey and Case Study Community Baseline Report
an explanation. A fifth of the firms cited the poor reliability of electricity supply as a reason not to make investments. There was no significant relationship observed between satisfaction with electricity service and investment choice, which suggests that electricity was probably one of many factors in investment choices among surveyed firms.
Employment and labor costs: In terms of employment, the median MD firm grew from 54 employees in the previous year to 60 employees in the most recent calendar year. The median three phase firm remained stable at three full time employees. Overall, the mean employment growth was eight percent, or an increase in two employees over the previous year. Median growth rates were similar across regions. While this data suggests a positive trajectory for employment at baseline, it is important to note that the firms in our sample only represent surviving firms. While our survey did not obtain wage information, we collected information on labor costs. Within our sample, the median MD customer spent $64,730 on labor costs in last year, while the median three phase customer spent $859. The median three phase firm spent $286 per year per full time employee, while the median MD firm spent $1,182 per full time employee in the latest year.
Financial status: The ES also included questions on revenues and costs for multiple years. As expected, many firms were unwilling to provide this information. To increase comparability between baseline and endline and to minimize the problems of missing data, we have opted to examine perceptions of financial status: economic outlook and satisfaction with profits and revenues. The answers were normally distributed. Firms in the Central region were slightly less likely to be dissatisfied with their profits and revenue, and MD customers were slightly more likely to be satisfied. While satisfaction with revenue and profits did not differ for firms with and without a generator, firms with a generator had a more positive economic outlook, with only 15 percent of firms with generators having a negative outlook versus 30 percent of firms without a generator. IDP Q4: Does beneficiary male and female entrepreneurs’ satisfaction with ESCOM improve over the life of the Compact? Do these entrepreneurs perceive an improvement in the quality of electricity over the life of the Compact? What factors explain variation in satisfaction with ESCOM?
Business satisfaction: Most respondents reported dissatisfaction with the electricity supply at their facility, with only 33 percent of three phase customers and 41 percent of MD customers reporting they were satisfied with their supply. Northern firms, maize mills, and females were less likely to report satisfaction with supply. Not surprisingly then, firms also expressed high levels of dissatisfaction with ESCOM itself; nearly two-thirds of respondents were either dissatisfied (41 percent) or very dissatisfied (21 percent). Respondents were more dissatisfied with ESCOM than any other utility, including the Roads Authority, Water Board, and Malawi Telecommunications.
Variation in satisfaction: To explain variation in satisfaction with ESCOM, we tested several factors using ordinal logistic and logistic regression. Not surprisingly, the reliability of electricity matters the most to business respondents in Malawi in their evaluation of ESCOM: the odds of dissatisfaction with ESCOM are estimated to be nine times greater if a respondent is very dissatisfied with the quality of supply than if he or she is satisfied with supply. The quality of electricity, measured by the frequency of voltage problems has a weak and generally statistically insignificant relationship with satisfaction, as does perceptions of whether the electricity situation has improved. This latter finding is concerning, as it suggests that customers’ views
SOCIALIMPACT.COM x
towards ESCOM might be based on many years of less than ideal service. If so, it might take several years of consistent improvements for perceptions of ESCOM to change.
Evaluations of ESCOM communications have a moderately strong relationship with overall satisfaction with ESCOM. Those who have experienced billing issues with ESCOM are also more likely to express dissatisfaction. Controlling for other factors, those who perceive corruption to be a major problem have a 73 percent probability of dissatisfaction with ESCOM. Those who perceive tariff rates to be unfair are more likely to be dissatisfied with ESCOM, although the magnitude of this effect is more modest. This also presents a challenge for ESCOM, as tariff rates will only continue to rise.
While many firm attributes have no correlation with satisfaction with ESCOM, two important exceptions include the size of the firm and its location. Micro businesses, those employing less than five employees, were the most likely to be dissatisfied with ESCOM. One possible explanation for this finding is that while many of these firms depend on electricity, they likely lack the influence that their larger peers have. Dissatisfaction is greatest in the Central region where ESCOM’s supply has been the most problematic and Southern respondents generally view ESCOM better than their Northern and Central peers. The type of firm (whether industrial, a maize mill, or a restaurant/hotel), the ownership of the firm or type of connection or line, use of generator had no statistically significant relationship with satisfaction. Gender and education levels do not influence views towards ESCOM; younger respondents are less likely to be dissatisfied with ESCOM. In sum, dissatisfaction seemed overwhelmingly driven by the quality of supply; however, perceptions and experiences with fault response, communications, corruption, and billing problems, also contributed to the dissatisfaction, offering opportunities for ESCOM to improve satisfaction in ways other than improving supply.
PSRP Q6: Does ESCOM realize improvements in effectiveness and efficiency over the five years of the Compact in procurement, outage response, processing new connections, and response to customer problems? To what extent can observed gains be attributed to the Compact? If there are no improvements or the improvements are minimal, why?
Businesses
Fault response: The majority of firms (80 percent) reported calling ESCOM to report a fault in the last 12 months, and firms in the North were slightly less likely to call ESCOM to report faults than firms in Central and South regions (74 percent versus 80 percent). Of the firms calling to report faults, the vast majority called the faults number; however, calls are also made to customer care, personal contacts, and some respondents go in person to the fault center.
We also asked respondents how satisfied they were with ESCOM’s responsiveness to faults. The answers followed a fairly normal distribution: 34 percent were satisfied or very satisfied with ESCOM’s responsiveness with 37 percent were dissatisfied or very dissatisfied. Customers in the North and three-phase customers were less likely to be satisfied with ESCOM’s responsiveness. When asked whether ESCOM’s responsiveness to faults has improved over the past twelve months, many respondents believed it had stayed the same (45 percent); some perceived that fault response had worsened (9 percent) and a large minority (43 percent) believed it had improved. Again, those in the North were less likely to report an improvement. ESCOM’s median response time to fix faults was estimated at 5 hours. Contrary to the perception in the North, the reported response time was actually fastest in the North, with a median response time of only 3 hours.
xi SOCIALIMPACT.COM
MCC Malawi: Enterprise Survey and Case Study Community Baseline Report
New connections: Of the sampled firms, 15 percent had solicited a new electricity connection in the last two years. Most requested a three-phase connection (66 percent), 10 percent requested an MD connection, and 24 percent requested a single-phase connection. Of the firms that applied, 54 percent were able to obtain a connection. Although our sample size for this question was small, the success rate appeared to vary by method of application: approximately three-quarters of firms that used a personal contact or a private contractor obtained a connection. By contrast, 56 percent of firms seeking a connection via ESCOM Customer care obtained one. Among the firms that received a connection, the typical wait time for a quote was 2.5 months (median), and the typical wait time until they got the connection was 3 months (median). The majority of firms who got a connection reported being very dissatisfied or dissatisfied (58 percent) with the process. Among the firms that are still awaiting a connection, the typical firm applied and paid for a connection six months ago (median).
Billing: At the time of data collection, ESCOM was in the process of converting all customers except MD customers to prepaid meters. Within our sample, 63 percent of respondents reported having a prepaid connection, and 34 percent had a postpaid connection. Forty-six percent of postpaid customers reported problems with ESCOM invoices in the last 12 months. Within this group, the most commonly reported problem was incorrect consumption (reported by 61 percent of surveyed postpaid firms), followed by late bills (44 percent), while the third most common problem was an incorrect tariff category (24 percent). Among the prepaid customers, 62 percent of respondents reported having problems with purchasing credit for their prepaid meter in the last 12 months. Within this group more than half of the respondents cited inconveniences purchasing token codes; 32 percent had difficulties due to network issues; and a quarter reported that the prepaid token did not work.
Households
Outage response and customer service: ESCOM service was perceived to be poor and not improving. Fifty-five percent of respondents to the IHS4 oversample in both middle-low and middle-high income study communities were dissatisfied with ESCOM service and only 25 percent were satisfied or very satisfied. Approximately two-thirds of all participants in every FGD reported that ESCOM customer service and outage response was either the same or worse than in the past. (Only about one-third said that it was improving.) The worst customer service was associated with meter reading, bill disputes, fixing damaged appliances, and re-connecting service that has been disconnected by ESCOM. Participants had slightly more favorable views of ESCOM’s responses to reports of faults and outages. Women were more likely than men to report poor treatment. A woman in Chibavi said, “Why should we waste our time going to ESCOM while you know that you will not be helped? It is better to stay home.”
New connections: Wait times for new connections varied among the 50 respondents to the IHS4 oversample that reported having applied for a connection. The median wait time was ten weeks and the average wait time was 25 weeks, almost six months. Wait times were shortest in middle income communities, where adding a connection typically only required installing a drop-line and meter to the household. ESCOM failure to connect households in a timely fashion was a major source of frustration in FGDs. In most FGDs of participants without electricity connections, 75 percent of participants or more rated ESCOM efforts to connect households as poor or very poor. Participants were noticeably frustrated and quite emotional during this section of the discussion. This issue generated the greatest level of discussion of all the FGD topics. Most participants ultimately blamed the lack of responsiveness in providing electrical

SOCIALIMPACT.COM xii
connections on corruption. A man in Kanjedza said, “It is not good. You have constructed a house and you are waiting for electricity for four years. What are you going to be doing in that house? Impossible!”
PSRP Q7: Is there a reduction in opportunities for corruption and/or a perception of corruption in procurement, service extension, and billing over the five years of the Compact? To what extent can observed gains be attributed to the Compact? If there are no gains or gains are minimal, why?
Business perceptions and experiences: Business respondents perceived corruption within ESCOM to be a significant problem: 64 percent of respondents classified it as a “major problem” and 21 percent identified it as a “problem.” Three phase customers and customers in the South were more likely to characterize corruption as a problem within ESCOM. When asked to react to the statement: “ESCOM personnel are more responsive to businesses that provide gifts or make informal payments,” 59 percent agreed or strongly agreed. The majority of respondents (67 percent) also agreed that ESCOM personnel were more responsive to businesses “with personal contacts in ESCOM”. Of the firms that sought a connection in the last two years, 16 percent reported that an ESCOM employee had solicited a gift or informal payment to expedite their connection process.
Household perceptions and experiences: Corruption was perceived to be commonplace among focus group participants, and the topic of corruption arose repeatedly throughout most FGDs. Participants expressed a consensus that ESCOM personnel often resort to corruption (small and large) when interacting with the public. Specific transactions and services are more closely linked with bribery, including establishing a new connection, re-establishing disconnected service, meter reading, and installation of pre-paid meters. Participants also describe a subtler form of favoritism in which social connections at ESCOM are the key to successful interaction. Many participants told stories of needing to mobilize individual contacts at ESCOM to get problems resolved. A Chibavi man explained, “It is not that they literally ask you for a bribe but when you are talking, you see it clearly that they need money, so you pay in a certain way like ‘transport money.’”
PSRP Q8: Does the quantity and quality of ESCOM communications with the public and the transparency of ESCOM increase over the life of the Compact? To what extent do Compact efforts to improve communications contribute to observed improvements? If there are no improvements or improvements were minimal, why?
Business perceptions and experiences: Despite the high frequency of outages, firms reported rarely receiving outage notifications. Firms reported being notified of outages for their facility an average of 1.4 times in the previous three months. MD customers and firms in the South reported more frequent outage notifications than three phase customers or firms in the North. The notifications were not always accurate, and the highest inaccuracies were reported in the Central region. Fifty-five percent of firms reported that outage notifications were accurate “always” or “most of the time.”
Most business respondents characterized ESCOM’s communication with customers as poor. Only four percent of respondents rated ESCOM’s communications as ‘very good,’ with the majority of customers perceiving the communications as poor or very poor. Three phase customers and customers in the North were least satisfied.

xiii SOCIALIMPACT.COM
MCC Malawi: Enterprise Survey and Case Study Community Baseline Report
Household perceptions and experiences: The FGDs revealed almost universal agreement that ESCOM’s current communication of planned outages is poor to very poor. Virtually all participants reported that they no longer pay attention to ESCOM announcements because they are no longer accurate or useful. At the time of data collection, they indicated that the blackouts are so frequent and unpredictable that ESCOM appears to not have a communication strategy in place. In several FGDs, participants took it upon themselves to recommend other forms of communication that ESCOM might utilize. These included: public address system (such as that used by the water board); and SMS messages to affected customers. Participants also contended that ESCOM needs a toll-free line on which to report outages. IDP Q5: Do the attitudes of beneficiary male and female entrepreneurs towards cost-reflective tariffs improve over the life of the Compact? What factors explain variation in beneficiary male and female entrepreneurs’ attitudes towards cost reflective tariffs? Business attitudes towards tariffs: Responding firms were generally not supportive of current electricity tariffs. Less than one-third of respondents agreed or strongly agreed that the tariffs are a fair price for electricity. When asked if businesses should subsidize electricity for poor households, 43 percent agreed that businesses should be responsible for subsidizing the cost of electricity for poor households. At the same time, nearly three-quarters of firms believed that the government should subsidize electricity costs for businesses, with three phase customers being more likely to be in favor of government subsidies than MD customers.
When asked what percent increase in electricity tariffs they would be willing to pay if the number of outages could be reduced (a) by half, or (b) almost entirely eliminated, most respondents indicated some willingness to absorb higher tariffs for improved services. If outages could be reduced by half, the mean increase in tariffs respondents were willing to pay was ten percent and the median increase was five percent. If outages could be almost eliminated, firms were willing to tolerate a larger increase; respondents were willing to pay 21 percent (mean) higher tariffs, with the median respondent willing to pay 10 percent higher tariffs. Firms in the South were more likely to be willing to tolerate a price increase in tariffs.
Explaining variation in attitudes towards tariffs: To shed light on why some firms perceive the existing tariff as fair or support tariff increases for improved electricity services while others do not we used regression analysis to test the effects of various variables on tariff preferences. The baseline data show that those that are very dissatisfied with the electricity supply have twice the odds of disagreeing that the tariff is fair, suggesting that unreliable electricity is a major driver of dissatisfaction with the cost of electricity. Those that are dissatisfied with electricity supply are not more willing to support tariff increases in exchange for improved service. This is illustrative of a fundamental financing dilemma: improving services requires increased revenue, but consumers do not want to pay more precisely because services are poor.
Respondents who view ESCOM’s response to faults as poor or very poor and those who have experienced billing problems are less likely to agree that the current tariff is fair or to support tariff increases for a reduction in outages. Respondents who view corruption in ESCOM as a major problem have approximately twice the odds of perceiving the current tariff as unfair. Those that do not trust ESCOM to convert tariff increases to improved services have around twice the odds of viewing the current tariff as unfair. Southern firms and Northern firms are more likely than those in the Central region to view the current tariff as fair. Those with high electricity costs as a percent of total costs are generally less
SOCIALIMPACT.COM xiv
likely to support tariff increases. Respondents above the age of 40 are less likely to support tariff increases and more likely to view the current tariff as unfair. Those with higher levels of education are also more likely to view the tariff as unfair and although it is not statistically significant, they are consistently less likely to support tariff increases.
These baseline model findings raise major concerns for the future of tariff increases. While there are groups that would favor an increase in tariffs for improved reliability (e.g., firms in the South, mills, firms with a generator), many of the groups that could benefit most from improved services, such as MD firms and firms dependent on electricity, oppose such increases, even when controlling for other related factors, such as possession of a generator.
Assessment of program logic risk
These baseline findings allow us to partially assess the risks to the Compact program logic. Consistent with the program logic, the baseline data shows that 1) electricity problems are a major constraint on business in Malawi and a major challenge confronted by households, 2) outages result in considerable costs to businesses and households, and 3) unreliable electricity makes it difficult for firms to produce goods and services on time and for households to efficiently utilize their time. Not all businesses are affected equally, and unreliable power is in some ways a bigger problem for smaller businesses. MCC’s constraints analysis further notes several industries that are lacking in Malawi or have moved away because of unreliable electricity.10 Of the firms in our sample (a representative sample of ESCOM customers with business connections) over half (53 percent) were classified as maize mills, confirming that Malawi’s economy is poorly diversified. More reliable electricity will likely incentivize additional investments; however, Malawi confronts a host of other challenges to attracting and incentivizing investment (e.g., political uncertainty, weak currency, lack of financing).
In the short term, the power situation for Malawian businesses and households has worsened since data collection. There has been no major new generation capacity added since Kapichira II, commissioned in 2013, and there has been a decrease of generation at existing facilities during 2016 and 2017 due to reduced rainfall. In the meantime, ESCOM has been expanding its customer base, adding around 27,000 new customers each year.11 IDP investments in Nkula A and transmission and distribution infrastructure, and any PSRP-driven efficiency gains within ESCOM will not likely offset the growth in new customers and decreasing supply. As such, the ability of the Compact to achieve its objectives will depend on the successful creation of an enabling environment and new investment in electricity generation and/or connection to the Southern African Power Pool.
Expected completion of IDP investments is September 2018; new solar IPPs are expected during that same year. The endline data collection for enterprise survey and household focus groups is scheduled for mid-2019. If the Compact is successfully concluded and generation capacity substantially increased, we expect to see reductions in outages and costs associated with outages. If businesses feel optimistic about the improvements persisting, we may also observe improvements in firm-level outcomes such as increases in employment and new investments.
10 Millennium Challenge Corporation. (nd) Draft Final Analysis of Constraints to Economic Growth. Washington D.C. 11 Sabet, Daniel, Michele Wehle, Arvid Kruze, Stella Kalengamaliro and Olga Rostapshova. 2017. Power Sector Reform Project Draft Midline Performance Evaluation Report. Social Impact.

1 SOCIALIMPACT.COM
MCC Malawi: Enterprise Survey and Case Study Community Baseline Report
1. INTRODUCTION On April 7, 2011, The Millennium Challenge Corporation (MCC) signed a five-year, USD $350.7 million Compact with the Government of Malawi (GoM) to address the structural, operational and financial inefficiencies of power subsector institutions and the generation, transmission and distribution capacity constraints facing the country’s power subsector. The five-year implementation period began on September 20, 2013 and runs through September 19, 2018. The MCC Malawi Compact includes three projects: The Infrastructure Development Project (IDP, allocated $257.1 million), the Power Sector Reform Project (PSRP, allocated $25.7 million), and the Environmental and Natural Resource Management Project (ENRM, allocated $27.9 million). Social Impact (SI)’s evaluation focuses on the IDP and PSRP.
This report includes baseline evaluation findings from a) a nationwide representative sample of businesses with three-phase and maximum demand electricity connections, which we refer to as an enterprise survey (ES), and b) a household survey and focus group discussions (FGD) conducted in select communities. At baseline, the ES, household survey, and FGDs illustrate the challenge frequent outages and poor-quality electricity present to both businesses and households. These data sources also explore businesses’ and households’ experiences with the Electricity Supply Corporation of Malawi (ESCOM). These research activities are expected to be conducted again in 2019 to measure changes over time that might be attributable to the PSRP and the IDP.

SOCIALIMPACT.COM 2
2. BACKGROUND 2.1 Compact Goals and Objectives The Compact is designed to establish a foundation for the solution to Malawi’s electricity challenges. The overarching goal of the Compact is to “reduce poverty through economic growth in Malawi.” 12 The Compact aims to attain this goal by working towards three primary objectives:
1. Reduce the cost of doing business in Malawi, 2. Expand access to electricity for the Malawian people and businesses, 3. Increase value-added production in Malawi.
In the following sections we explain the IDP and PSRP aspects of the Compact in greater detail.
2.2 Description of Compact Activities and Project Logic IDP Problem: The national electric grid in Malawi has one of the lowest generation capacities in Southern Africa, delivered by an outdated transmission system, with no transmission lines exceeding 132 kV. The lack of both generation and transmission capacity is exacerbated by relatively high technical and non-technical losses. As a result, few Malawians have access to electricity and those that do experience frequent load shedding and blackouts.
IDP Activities: The Infrastructure Development Project (IDP) comprises four activities:
1. The Integrated Resource Plan Activity entails the development of an Integrated Resource Plan (IRP) that identifies a prioritized list of generation projects that will allow the GOM and ESCOM to meet the country’s growing demand for power.
2. The Nkula A Refurbishment Activity involves the refurbishment of the Nkula A hydropower plant, which was originally constructed in 1966. The activity will extend the life of the facility while adding generation capacity of approximately 12 Megawatts (MW).
3. The Transmission Network Upgrade Activity includes the installation of a 400 kilovolt (kV) high voltage power line linking Lilongwe to power generation facilities in the South and the development of a 132 kV line to facilitate transmission in the north of the country around Mzuzu.
4. The Transmission and Distribution Network Upgrade, Expansion, and Rehabilitation Activity will occur in targeted locations throughout the country. It will include upgrading existing network connections, up-rating transformers, constructing new substations, and installing control and communications systems, among other actions.
IDP Logic: Through increasing generation capacity, upgrading the transmission network, and improving transmission and distribution infrastructure, the IDP project aims to increase available power, reduce energy losses, reduce outages, and improve the quality of primary substations.13 Lower energy losses,
12 Millennium Challenge Corporation, First Amendment to Millennium Challenge Compact Between the United States of America Acting Through The Millennium Challenge Corporation and The Republic of Malawi (2013). https://assets.mcc.gov/agreements/Malawi_First_Compact_Amendment_with_Annexes.pdf 13 Increasing available power is not included in the M&E logic model as an outcome; however, it was estimated that generation would increase by approximately 6 MW as a result of the Nkula rehabilitation. This was later increased to 12MW. Millennium Challenge Account-Malawi, MCA-M Monitoring and Evaluation Plan (2013), Annex IV: Infrastructure Development Project Logic.

3 SOCIALIMPACT.COM
MCC Malawi: Enterprise Survey and Case Study Community Baseline Report
reduced outages, and improved quality of infrastructure should allow households and businesses to reduce their energy costs and increase value added production.14 The bulk of funding for IDP activities focuses on improving the transmission system to handle added generation in the future. Furthermore, improvements to the transmission system, if coupled with adequate new generation capacity, may allow for the expansion of the distribution network to more households and businesses, increasing access to electricity.
PSRP Problem: In addition to infrastructure deficiencies, Malawi’s power sector suffers from financial, operational, and governance challenges. At the time of Compact negotiations, the electrical utility, ESCOM, was financially and operationally unsustainable due to low billing and collections rates, insufficient or incorrect customer information, and high technical and non-technical losses, among other factors.15 Inadequate investments had been made to expand generation, transmission, and distribution infrastructure and to maintain existing infrastructure. In addition, ESCOM suffered from several operational and governance challenges related to insufficient management capacity, unresponsive customer service, weak internal controls, political interference, and poor transparency. Broader energy sector governance, involving the regulator the Malawi Energy Regulatory Authority (MERA) and the Ministry of Natural Resources, Energy, and Mining (MNREM), also confronted challenges, as Malawi’s regulators lacked adequate operational cost data to inform tariff design and the sector did not allow for meaningful private sector investment in electricity generation.
PSRP Activities: The PSRP includes a wide array of activities designed to help address financial, operational, and governance challenges among power subsector institutions. The PSRP is divided into three main activities with several sub-activities:
1. The ESCOM Turnaround Activity includes a Finances Sub-Activity designed to develop a detailed financial plan, financial model and a management information system (MIS) for ESCOM. The Turnaround Activity also includes a Corporate Governance Sub-Activity to develop a Corporate Governance Benchmarking Study, and an Operations Sub-Activity, entailing a review of ESCOM’s organizational structure, embedment of a financial and operational turnaround team, planned improvements to procurement processes, the initiation of performance audits and a social and gender assessment.
2. The Regulatory Strengthening Activity also entails three sub-activities, including a Tariff Reform Sub-Activity that involves deployment of a tariff advisor to ESCOM and a regulatory advisor to the Malawi Energy Regulatory Authority (MERA). A second sub-activity aims to build MERA’s capacity through trainings, workshops, exchange visits, peer learning, and a benchmarking study. The third sub-activity, the Enabling Environment for Public and Private Sector Investment Sub-Activity, involves supporting a high-level energy advisor to MNREM and other efforts to encourage private sector investment.
14 While increasing value added production is a Compact Objective, it is not included in the M&E plan. This is likely because the monitoring evaluation systems will not be able to measure this outcome. Nonetheless, the evaluation will be able to speak to this objective through the planned enterprise survey. 15 Millennium Challenge Account-Malawi, MCA-M Monitoring and Evaluation Plan (2013), Annex IV: Power Sector Reform Project Logic; Allen & Overy LLP, Due Diligence Report on the Malawi Power Sector and the Electricity Supply Corporation of Malawi (New York. July 2010).
SOCIALIMPACT.COM 4
3. The Power Sector Reform Agenda Semi-Annual Review (SAR) offers a process for Compact stakeholders to jointly monitor the progress of power sector reform efforts and includes regular meetings to measure progress in achieving targets across several indicators.
PSRP Logic: Through these activities, the PSRP aims to: 1) improve the financial and operational health of ESCOM and rebuild ESCOM into a strong, well-governed and well-managed utility; 2) develop a regulatory environment that supports private sector investment in generation at an affordable cost. As such, the PSRP offers an essential complement to the IDP. While the IDP will primarily improve transmission and distribution infrastructure, the reforms fostered by the PSRP aim to build an energy sector that is financially and operationally sustainable and encourages continual investment into the future.

5 SOCIALIMPACT.COM
MCC Malawi: Enterprise Survey and Case Study Community Baseline Report
3. LITERATURE REVIEW The lack of electricity in Malawi is a major constraint to development. In this section, we detail Malawi’s problem of low electricity supply, illustrate how demand exceeds supply, and explore the resultant loadshedding and power outages. We then explore existing research on the effect of inadequate supply on businesses and on households, prior to presenting the findings from our survey of businesses and focus groups of residents in our case study communities.
Supply of electricity is low. Electricity generation and access rates are extremely low in Malawi. The total installed capacity of the country’s electrical utility ESCOM is about 353 MW, approximately 95 percent of which is generated by hydropower.16 To put Malawi’s installed generation capacity in perspective, writing in 2011, Foster and Shkaratan calculated that low- and middle-income countries, on average, had installed capacity of 24.4 MW of electricity per million people and 796.2 MWh per million people, respectively. In contrast, in Malawi had installed capacity of only 21.5 MW per million people, one of the lowest rates in both sub-Saharan Africa (SSA) and the world.17
In addition, for a variety of reasons, Malawi is rarely able to produce power at full capacity. This is not unique among African countries. When excluding South Africa, nearly 25 percent of SSA’s installed capacity is unavailable due to aging infrastructure and poor maintenance.18 Maintenance problems with new and old infrastructure is common in Malawi. Before the Compact was in place, there was no investment to upgrade the transmission system and much of the equipment had not been replaced or refurbished. This lack of investment resulted in high technical losses, poor quality electricity, and unreliable supply. No additional generation capacity was added to the country for more than ten years after Kapichira I was installed in 2000, which added 64.8 MW in capacity. An additional 64.8 MW was added with Kapichira II in 2013.
Another factor is the inefficiency of hydropower generation on the Shire, stemming from poor natural resource management and extreme weather, including both drought and flooding. Almost all of ESCOM’s power comes from hydropower, and, with the exception of a 4.5 MW facility located in the Northern region on the Wovwe River, all Malawi’s hydroelectric plants are in the southern region along the Shire River. While this power source is inexpensive to generate, it is threatened by both weed growth and sedimentation in the Shire, and dependent on water levels in the river. Rainfall in Malawi has declined year after year, decreasing the water flows in the Shire River. As of the end of 2016, ESCOM reported producing only 200 MWh of power from a total installed capacity of just over 350MW of the hydro plants due to reduced water flows.19
16 Mhango, Lewis B. “New Emerging Issues in the Power Sector in Malawi.” Presented at the Semi-Annual Review of the Millennium Challenge Compact. Ministry of Energy. 2014. 17 Foster, Vivien and Shkaratan, Maria. “Malawi’s Infrastructure: A Continental Perspective.” Policy Research Working Paper 5598. The World Bank. 2011. 18 Ibid. 19 ESCOM. Press release. “An Update on the Current Water Levels and the Energy Situation in Malawi.” December 2016. http://www.escom.mw/rainfall-effect-waterlevels.php.

SOCIALIMPACT.COM 6
Supply is further reduced by technical and non-technical losses, the former of which is aggravated by inadequate transmission capacity and aging infrastructure.20 In 2015, total system losses were between 24.9 and 25.5 percent in the January-June and July-December periods (which surpassed targets by three to five percent).21
Demand exceeds supply. Demand is considerably greater than this limited supply, and it is expected to grow significantly by 2030. In addition, because supply is so low there is likely considerable suppressed demand. Table 3 provides electricity demand projections and the government’s electricity targets to attempt to bridge the access gap. The GoM’s goal is for 30 percent of the population to have access to electricity by 2030, doubling to 60 percent of the population by 2040. Approximately USD $7 billion is needed over the next 15 years to achieve the target of 2,550 MW, in addition to the growth in transmission and distribution. Nearly 60 percent of this investment must come from the private sector, with 20 percent from GoM and ESCOM and another 20 percent from donors.22 The current installed capacity of just over 350 MW, which trails the 420 MW target set for 2015.23
Table 3: Power generation capacity targets
2010 2015 2018 2020 2025 2030
Generation Capacity Target, MW 327 420 720 1,000 1,750 2,550
Electricity Demand Projections, GWh 1,474 2,020 3,600 5,000 9,000 13,200
Source: Saha (2014)
Motivated by performance targets established by MERA, ESCOM is growing the network quickly. On average, ESCOM connects 4,000 customers per month.24 However, the pace of growth is likely worsening the reliability and quality of supply as generation capacity has not increased.
Loadshedding is common. The consequences of the imbalance between supply and demand are frequent outages and loadshedding. Prior to the start of the Compact, among other countries with similar installed generation capacity and power consumption per capita within the region, Foster and Shkaratan report that outages in Malawi were about three times the average levels observed in the peer group. 25 Data from MCA-Malawi’s Indicator Tracking Table (ITT), presented in Table 4, suggests that loadshedding improved dramatically after the commissioning of the Kapichira II plant in 2013, but then worsened with maintenance problems and low water levels in the Shire River.
20 Millennium Challenge Account-Malawi. “MCA-Malawi Progress Report.” Presented at the Semi-Annual Review of the Millennium Challenge Compact. Millennium Challenge Account. 2014. 21 Fourth Semi-Annual Review Progress Report January-December 2015. MCA-Malawi Secretariat. 22 Saha, Govind. “An Issues Paper on Energy Sector Reform.” Presented at the Second Semi-Annual Review of the Millennium Challenge Compact. 2014. 23 ESCOM. “About Us.” http://www.escom.mw/generation.php 24 Fourth Semi-Annual Review Progress Report January-December 2015. MCA-Malawi Secretariat. 25 Foster and Shkaratan. “Malawi’s Infrastructure: A Continental Perspective.

7 SOCIALIMPACT.COM
MCC Malawi: Enterprise Survey and Case Study Community Baseline Report
Table 4: Total MWh load shed by year
Year Total MWh shed
2010 17,026 2011 19,927 2012 25,849 2013 17,595 2014 1,501 2015 44,177
Unreliable electricity has a major impact on businesses. A large body of literature identifies the electricity sector as a key driver of economic development.26 Multiple studies have examined the costs of outages and firm level responses in developing countries. Allcott, Collard-Wexller, and O’Connell found that electricity supply shortages are a substantial cost to Indian manufacturing, accounting for 5-7 percent of revenue reduction for the average plant in the short-run.27 The effect on productivity is somewhat smaller, as plants can reduce inputs in response to shortages. Another study by Mensah using World Bank (WB) Enterprise Survey data across 15 SSA countries also found negative impacts of power outages on firm revenue (3.6 percent reduction on average), employment of labor (especially of temporary workers), and small-scale enterprises, but no significant impact on firm productivity. 28
The impact of power outages does not impact all firms equally. In a study of Indian firms, Alam finds that frequency of power outages lowers the output and profits of only some electricity-intensive industries.29 For example, in contrast to steel mills, she finds that rice mills have adaptation mechanisms available to respond to changes in electricity supply, such as switching to more efficient production technologies and making up the loss by operating for more days. There is also considerable variation across country contexts. In her study of African firms, Mensah finds that South African firms were the most vulnerable to power outages, while Nigerian ones appear to be less affected.30 In a recent paper, Ramachandran et al examine the relationship between firm growth and power availability in sub-Saharan Africa, including Malawi. They find substantial within-country heterogeneity - that some firms can cope well with an unreliable supply of power while many others cannot. One explanation the authors offer is that this may be due to firms’ self-selection into industries with high returns despite unreliable electricity. 31
The use of generators is the primary strategy to mitigate the effects of outages. A 2010 study by Steinbuks and Foster analyzed WB Enterprise Survey data in 25 African countries and found that firm size, the availability and price of emergency electricity back-up provided by government contractors, and export
26 Wamukonya, Njeri. "Power Sector Reform in Developing Countries: Mismatched Agendas." Energy Policy 31, no. 12, 2003: 1273-289; Ferguson, R., W. Wilkinson and R. Hill. “Electricity use and economic development.” Energy Policy, no. 28, 2000: 923-934. 27 Allcott, Hunt, Allan Collard-Wexler, & Stephen D. O’Connell. “How Do Electricity Shortages Affect Industry? Evidence from India.” NBER Working Paper No. 19977, 2014. 28 Mensah, Justice Tei. “Bring Back our Light: Power Outages and Industrial Performance in Sub-Saharan Africa.” Unpublished manuscript. 2016. 29 Alam, Muneeza M. “Coping with Blackouts: Power Outages and Firm Choices.” Unpublished manuscript, 2014. 30 Ibid. 31 Ramachandran, Vijaya, Manju Kedia Shah and Todd Moss. “How Do African Firms Respond to Unreliable Power? Exploring Firm Heterogeneity Using K-Means Clustering.” Center for Global Development Working Paper 493. August 2018.

SOCIALIMPACT.COM 8
regulations play a critical role in the decision to own a generator.32 Even though the costs of self-generation are about three times the cost on average of purchasing subsidized electricity from the public grid, Steinbuks and Foster find that the benefits outweigh the costs; firms with their own generators report a value of lost load of less than US$50 per hour, compared with more than US$150 per hour for those without.33
While self-generation is a commonly used strategy, it is not without its drawbacks, as it has a negative impact on firm productivity, mainly due to the high marginal costs associated with self-generation.34 This constrains firms’ ability to invest into other factor inputs to boost productivity. Furthermore, because there are substantial economies of scale in generator costs, shortages affect small plants more severely.
Improvements in energy efficiency are another strategy employed by firms in response to unreliable or poor-quality electricity. A study by Fisher-Vanden, Mansur, and Wang on 1,340 Chinese energy-consuming industrial enterprises from 1994-2004 found that enterprises re-optimized among the production factors in response to outages by shifting from energy into materials and improved their energy efficiency.35
Unsurprisingly, research has found that low electricity access rates and unreliable supply for those with power connections are also major obstacles to economic growth in Malawi.36 According to Foster and Shkaratan’s 2010 report , outages in Malawi were at that time about three times the average levels observed among other middle and low income African countries.37 It estimated that Malawi loses approximately two percent of gross domestic product (GDP) due to power outages, and 22 percent of business turnover due to outages. In some cases, investments never occur due to the lack of reliable energy, and, in other cases, businesses must bear the high costs of finding private power solutions.38
While the WB has conducted enterprise surveys in Malawi, the WB’s survey has many objectives and is limited in its ability to explore electricity challenges in detail. As such, the enterprise survey data examined here is the most detailed effort to estimate the costs of unreliable and poor-quality electricity to Malawi’s business community and to measure change over time.
Unreliable electricity has a profound effect on households. Malawi’s access to electricity is one of the lowest rates in the world. Figure 1 below illustrates the difference in electricity access between SSA and Malawi from 1990 to 2012. While Malawi’s electrification rate has tripled over the past two decades and continues to grow, in 2012, it still trailed the SSA average by more than 25 percent. Moreover, rates in SSA lag far behind other regions in the world; 50 percent of the population has access to electricity in South Asia, as does more than 80 percent in Latin America.39
32 Steinbuks J. and V. Foster, “When do firms generate? Evidence on in-house electricity supply in Africa.” Energy Economics, no. 32, 2010: 505-514. See also Oseni, Musiliu O. “Power Outages and the Costs of Unsupplied Electricity: Evidence from Backup Generation among Firms in Africa.” EPRG Working Paper 1326. University of Cambridge. 2012. 33 Ibid. 34 Ibid. 35 Fisher-Vanden, Karen, Erin T. Mansur, & Qiong (Juliana) Wang. “Costly Blackouts? Measuring Productivity and Environmental Effects of Electricity Shortages.” NBER Working Paper No. 17741, 2012. 36 Foster and Shkaratan. “Malawi’s Infrastructure: A Continental Perspective.” 37 Ibid. 38 Ibid. Also see Gamula, Gregory E. T., Liu H. and Peng W. "An Overview of the Energy Sector in Malawi." Energy and Power Engineering 05, no 1, 2013: 44-46. 39 Eberhard et al. “Underpowered: The State of the Power Sector in Sub-Saharan Africa.” World Bank. 2008.
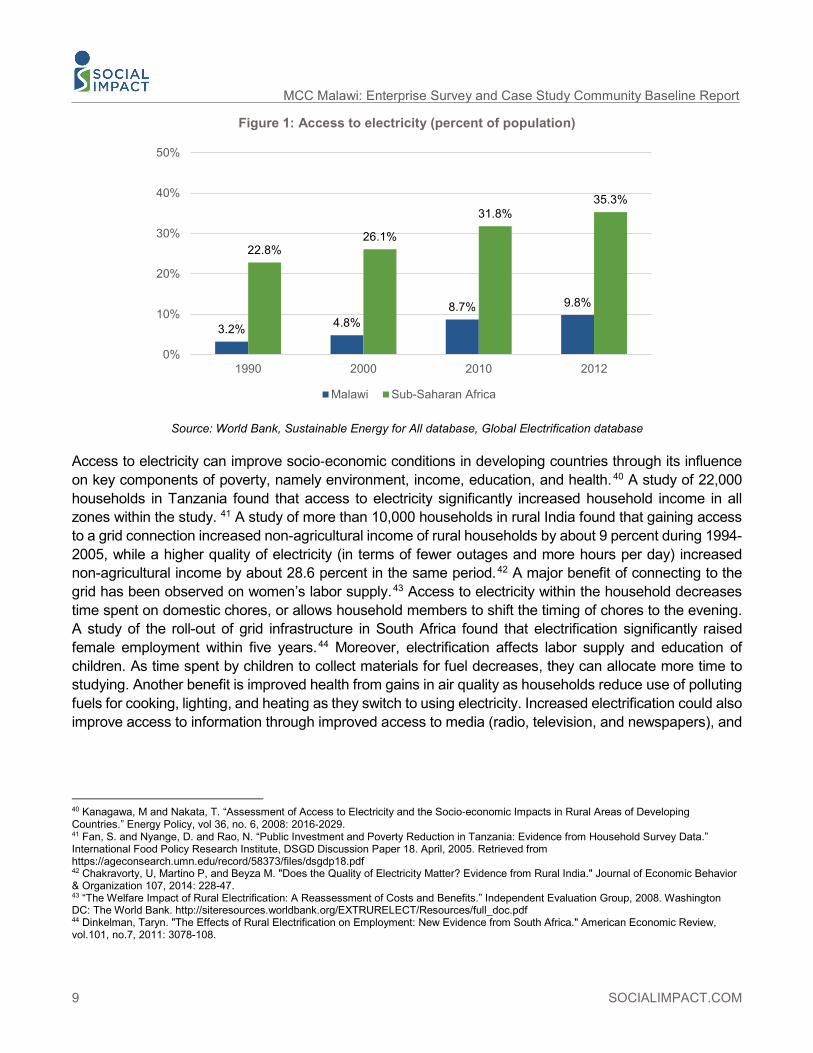
9 SOCIALIMPACT.COM
MCC Malawi: Enterprise Survey and Case Study Community Baseline Report
Figure 1: Access to electricity (percent of population)
Source: World Bank, Sustainable Energy for All database, Global Electrification database
Access to electricity can improve socio‐economic conditions in developing countries through its influence on key components of poverty, namely environment, income, education, and health. 40 A study of 22,000 households in Tanzania found that access to electricity significantly increased household income in all zones within the study. 41 A study of more than 10,000 households in rural India found that gaining access to a grid connection increased non-agricultural income of rural households by about 9 percent during 1994-2005, while a higher quality of electricity (in terms of fewer outages and more hours per day) increased non-agricultural income by about 28.6 percent in the same period.42 A major benefit of connecting to the grid has been observed on women’s labor supply.43 Access to electricity within the household decreases time spent on domestic chores, or allows household members to shift the timing of chores to the evening. A study of the roll-out of grid infrastructure in South Africa found that electrification significantly raised female employment within five years.44 Moreover, electrification affects labor supply and education of children. As time spent by children to collect materials for fuel decreases, they can allocate more time to studying. Another benefit is improved health from gains in air quality as households reduce use of polluting fuels for cooking, lighting, and heating as they switch to using electricity. Increased electrification could also improve access to information through improved access to media (radio, television, and newspapers), and
40 Kanagawa, M and Nakata, T. “Assessment of Access to Electricity and the Socio‐economic Impacts in Rural Areas of Developing Countries.” Energy Policy, vol 36, no. 6, 2008: 2016‐2029. 41 Fan, S. and Nyange, D. and Rao, N. “Public Investment and Poverty Reduction in Tanzania: Evidence from Household Survey Data.” International Food Policy Research Institute, DSGD Discussion Paper 18. April, 2005. Retrieved from https://ageconsearch.umn.edu/record/58373/files/dsgdp18.pdf 42 Chakravorty, U, Martino P, and Beyza M. "Does the Quality of Electricity Matter? Evidence from Rural India." Journal of Economic Behavior & Organization 107, 2014: 228-47. 43 “The Welfare Impact of Rural Electrification: A Reassessment of Costs and Benefits.” Independent Evaluation Group, 2008. Washington DC: The World Bank. http://siteresources.worldbank.org/EXTRURELECT/Resources/full_doc.pdf 44 Dinkelman, Taryn. "The Effects of Rural Electrification on Employment: New Evidence from South Africa." American Economic Review, vol.101, no.7, 2011: 3078-108.
3.2% 4.8%8.7% 9.8%
22.8%26.1%
31.8%35.3%
0%
10%
20%
30%
40%
50%
1990 2000 2010 2012
Malawi Sub-Saharan Africa
SOCIALIMPACT.COM 10
could lead to improvements in women’s awareness of health and family planning. Better nutrition can be gained from improved knowledge and storage facilities from refrigeration.45 Although the benefits of reliable electricity are well documented, some studies have shown that household welfare gains due to enhanced electricity supply are unevenly distributed. A study in Bangladesh, for example, found that the positive effect on incomes is four times higher for wealthier households than for poorer households.46 Unfortunately, with low electrification rates, most Malawians are not able to obtain the benefits of electricity. Moreover, the lack of access to electricity has led to a dependency on burning charcoal and fuel work, producing negative environmental impacts through indoor pollution, deforestation, and soil erosion.47 Although much of the literature to date has focused on electricity access, this evaluation, particularly at endline, will also focus on the role of reliability as a key factor in understanding the benefits of electricity, making an potentially valuable contribution to the literature. The goal of conducting the FGDs in the case study communities is to explore changes over time; however, baseline data provide a deeper understanding of the challenges presented by unreliable and poor-quality electricity supply and how households are responding to those challenges. Given the findings above, case study selection was designed to compare variation in income and variation in access to electricity.
45 The Welfare Impact of Rural Electrification: A Reassessment of Costs and Benefits.” Independent Evaluation Group, 2008. Washington DC: The World Bank 46 Khandker, Shahidur R., Barnes, Douglas F., and Samad, Hussain A. “Welfare Impacts of Rural Electrification: A Case Study from Bangladesh.” Policy Research working paper; no. WPS 4859. Washington DC: World Bank. 2009. 47 Gamula, Gregory E. T. et al. “An Overview of the Energy Sector in Malawi.” Energy and Power Engineering 05, no 1, 2013: 44-46.

11 SOCIALIMPACT.COM
MCC Malawi: Enterprise Survey and Case Study Community Baseline Report
4. EVALUATION DESIGN 4.1 Evaluation Type To evaluate the effectiveness of the IDP and PSRP, this evaluation is a rigorous performance evaluation with data collection events occurring throughout the life of the Compact. The evaluation design includes diverse research methodologies with different timelines for data collection. The evaluation design contains five main components:
• Nationally representative enterprise panel survey of Malawian businesses with non-domestic electricity connections
• FGDs and surveys with residents in nine communities expected to benefit substantially from the Compact
• Intensive metering of the transmission system • Analysis of the Compact’s indicators laid out in the Compact’s Monitoring and Evaluation Plan
and captured in the Indicator Tracking Table • Extensive qualitative research focused on efforts to reform the power sector
As noted above, this report presents baseline evidence from the nationally representative survey of businesses with a three-phase and maximum demand (MD) electricity connection (i.e., not a domestic connection) and household surveys and focus group discussions conducted in case study communities. Qualitative research on the reform efforts and analysis of Compact indicators are addressed in other reports and metering of the transmission system was not yet completed as of this report writing. For more detail on the evaluation design, please refer to the Evaluation Design Report.48
4.2 Relevant Evaluation Questions The Compact evaluation questions are divided into core questions, PSRP-specific research questions, and IDP-specific research questions. The following core evaluation and research questions will be answered by comparing baseline and endline data:
• Core Question 1: What declines in poverty, increases in economic growth, reductions in the electricity-related cost of doing business, increases in access to electricity, and increases in value added production are observed over the life of the Compact?
• Core Question 3: Are there differences in outcomes of interest by gender, age, and income? Sex and income disaggregated information for businesses and households will be pursued to the extent possible.
• Core Question 6: At the household level, the evaluations shall focus on the following program/project/activities impacts on household and individuals: income; expenditures, consumption and access to energy; individual time devoted to leisure and productive activities.
• Core Question 7: At the enterprise level, the evaluation shall focus on the impact of the program/project/activities on: business profitability and productivity; value added production and
48 Sabet, Daniel, Olga Rostapshova, Arvid Kruze, Sarah Tisch, and Michele Wehle. 2014. Evaluation Design Report: Malawi Infrastructure Development and Power Sector Reform Projects. Social Impact. Surveys in FGD communities were not originally included in the evaluation design but were added later and conducted by the National Statistical Office of Malawi. https://data.mcc.gov/evaluations/index.php/catalog/110
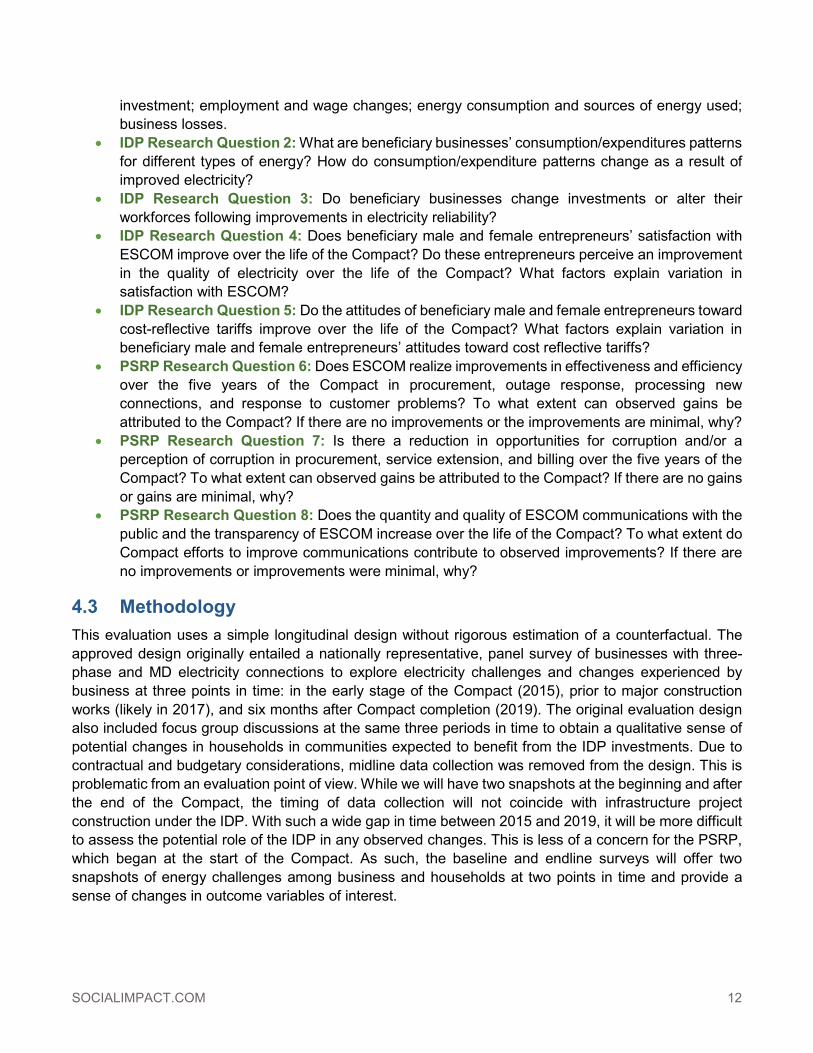
SOCIALIMPACT.COM 12
investment; employment and wage changes; energy consumption and sources of energy used; business losses.
• IDP Research Question 2: What are beneficiary businesses’ consumption/expenditures patterns for different types of energy? How do consumption/expenditure patterns change as a result of improved electricity?
• IDP Research Question 3: Do beneficiary businesses change investments or alter their workforces following improvements in electricity reliability?
• IDP Research Question 4: Does beneficiary male and female entrepreneurs’ satisfaction with ESCOM improve over the life of the Compact? Do these entrepreneurs perceive an improvement in the quality of electricity over the life of the Compact? What factors explain variation in satisfaction with ESCOM?
• IDP Research Question 5: Do the attitudes of beneficiary male and female entrepreneurs toward cost-reflective tariffs improve over the life of the Compact? What factors explain variation in beneficiary male and female entrepreneurs’ attitudes toward cost reflective tariffs?
• PSRP Research Question 6: Does ESCOM realize improvements in effectiveness and efficiency over the five years of the Compact in procurement, outage response, processing new connections, and response to customer problems? To what extent can observed gains be attributed to the Compact? If there are no improvements or the improvements are minimal, why?
• PSRP Research Question 7: Is there a reduction in opportunities for corruption and/or a perception of corruption in procurement, service extension, and billing over the five years of the Compact? To what extent can observed gains be attributed to the Compact? If there are no gains or gains are minimal, why?
• PSRP Research Question 8: Does the quantity and quality of ESCOM communications with the public and the transparency of ESCOM increase over the life of the Compact? To what extent do Compact efforts to improve communications contribute to observed improvements? If there are no improvements or improvements were minimal, why?
4.3 Methodology This evaluation uses a simple longitudinal design without rigorous estimation of a counterfactual. The approved design originally entailed a nationally representative, panel survey of businesses with three-phase and MD electricity connections to explore electricity challenges and changes experienced by business at three points in time: in the early stage of the Compact (2015), prior to major construction works (likely in 2017), and six months after Compact completion (2019). The original evaluation design also included focus group discussions at the same three periods in time to obtain a qualitative sense of potential changes in households in communities expected to benefit from the IDP investments. Due to contractual and budgetary considerations, midline data collection was removed from the design. This is problematic from an evaluation point of view. While we will have two snapshots at the beginning and after the end of the Compact, the timing of data collection will not coincide with infrastructure project construction under the IDP. With such a wide gap in time between 2015 and 2019, it will be more difficult to assess the potential role of the IDP in any observed changes. This is less of a concern for the PSRP, which began at the start of the Compact. As such, the baseline and endline surveys will offer two snapshots of energy challenges among business and households at two points in time and provide a sense of changes in outcome variables of interest.

SOCIALIMPACT.COM 13
MCC Malawi: Enterprise Survey and Case Study Community Baseline Report
4.3.1. Enterprise Survey
Two of the three main objectives of the Compact are related to businesses: reduce the cost of doing business and increase value added production. We attempt to measure the achievement of these objectives through a survey of businesses before and after Compact benefits are realized. The survey covers a variety of topics in three major parts. The first part obtains information on the firm characteristics, the business environment, obstacles to growth, energy use, dependence on electricity, and awareness and impression of the Millennium Challenge Compact. The second part asks questions about power reliability and quality, outages and voltage fluctuations, business response to outages, various costs associated with outages or voltage fluctuations (e.g., generator related costs, idle worker related costs, damaged equipment, lost revenue), satisfaction with the electricity situation in the past 12 months, experience and satisfaction with ESCOM (e.g., fault response, new connections, billing, communications), perceptions of and experiences with corruption in the sector, and attitudes towards tariffs and cost-reflective tariffs. The third part addresses financial and general management of the firm, including questions about electricity costs relative to total business costs, changes in employment in the past year, and recent investments.
In April 2015, MCA-Malawi procured Reima/Probe (R/P) to conduct the enterprise survey. Baseline data collection was expected to be completed between July and September 2015. However, due to multiple issues with the data collection management, continuing delays, shortcomings in quality control, and failure to comply with the contract, MCA-Malawi canceled R/P’s contract in September 2015. A new data collection firm, Invest in Knowledge Initiative (IKI) was contracted to complete the ES baseline data collection starting in March 2016 and lasting until July 2016. In addition, IKI completed back-checks and quality control of both R/P and IKI collected data in December 2016. As such, baseline enterprise survey data is spread over a large period of time.
4.3.2. Enterprise Survey Sampling
Given that all of Malawi’s businesses are expected to benefit from the PSRP and that most will benefit from the IDP, it was not possible to sample a comparison group of firms that will not benefit from the Compact. The ES sample was drawn to be geographically representative of those businesses who possess three-phase or MD electricity connections with ESCOM, with an oversample of MD customers and customers in the North. While the ES does not include a comparison group, it may be possible to distinguish different levels of beneficiary status at endline depending on ESCOM’s ongoing Geographic Information System (GIS) mapping of the network and the quality of metering data. The sampling frame for the study is based on ESCOM’s customer rolls. Therefore, businesses that have no electricity connection or a household electricity connection were excluded from the population of study. The sampling frame identified a population of close to 10,000 firms.
The survey was designed as a panel survey, and the same firms will be interviewed at baseline (2015) and endline (2019). SI originally selected a relatively large sample of 1,850 firms to account for an expected attrition rate of 25 percent (due to firm closures, refusal to be re-interviewed, or inability to locate during subsequent data collection points), and to allow disaggregation on key variables. Due to numerous challenges in data collection (described below), the final sample size was 1,024 firms.

SOCIALIMPACT.COM 14
This survey is not the only survey of businesses conducted in Malawi. The WB also conducted an Enterprise Survey in 2014, which is referenced throughout this report; however, our sampling strategy is substantially different from that adopted by WB. The WB enterprise survey, which is a cross-national survey conducted in 139 countries, stratifies the population by three criteria: sector of activity (measured by the Gross National Income), firm size (small firms are identified as those with 5-19 employees, medium ones with 20-99 employees, and large ones with 100 or above employees), and geographical location (main urban centers and regions). This difference in sampling methodology at least partially explains the difference in findings between the two data collection efforts, which will be discussed in more detail in the following section.49 As noted above, the WB’s enterprise survey addresses a large number of topics, while this enterprise survey is able to focus specifically on electricity concerns.
In general, obtaining participation in the survey was challenging. The ESCOM sampling frame did not include accurate address, location, or contact information, which forced enumerators to expend an enormous amount of effort to simply locate the firms. Once located, many firms were suspicious of the survey and declined to participate. Other firms requested exhaustive documentation of the study and affiliation, but still refused to participate despite letters from MCA-Malawi and the Malawi Confederation of Chambers of Commerce and Industry (MCCCI). When it became clear that a smaller sample would be required, steps were taken to re-sample and ensure a geographically representative sample.
Table 5 compares the final sample with the total population across both region and customer type. Because we know the population parameters for region and customer type, we are able to weight the data to present a nationally representative sample in the report, while also having adequate samples of firms in the Northern region and MD firms to be able to generalize to these subpopulations in disaggregations. Among MD customers, the post-stratification weights are estimated as 0.49 for the North, 0.24 for the Central, and 0.25 for the South regions, and among three-phase customers they are estimated at 0.58 for the North, 1.32 for the Central, and 1.58 for the South regions. In addition to the intended oversampling, the weighting also addresses some sampling bias. For example, our oversample in the North is disproportionately three-phase customers and MD customers are underrepresented in this region; weighting is able to adjust for this limitation. Due to the difficulty in sampling firms and a relatively low response rate (55 percent for three-phase customers and 40 percent for MD customers), it is possible that there is some other unintended sampling bias. Lacking other population parameters, it is difficult to test for this; however, we do observe a similar percent of mills, the largest proportion of our sample, in the final sample as we do in the sampling frame, giving us some confidence that the final sample is representative.
49 The World Bank. 2015. Malawi: Country Profile 2014. Washington DC: The World Bank.

15 SOCIALIMPACT.COM
MCC Malawi: Enterprise Survey and Case Study Community Baseline Report
Table 5: Enterprise survey sample stratification Population Final sample Differences
Freq. Percent Freq. Percent Diff in percent
Post-stratification
weights MD North 48 0% 10 1% 1% 0.49 MD Central 208 2% 89 9% 7% 0.24 MD South 353 4% 145 14% 10% 0.25 MD Total 609 6% 244 24% 18%
3-phase North 1,149 12% 204 20% 8% 0.58 3-phase Central 3,343 33% 259 25% 8% 1.32 3-phase South 4,890 49% 317 31% 18% 1.58 3-phase Total 9,382 94% 780 76% 18%
Total 9,991 100% 1,024 100% 0%
At the time that the study was designed, the sample sizes were large enough to allow for the possibility of future disaggregations based on IDP beneficiary status, account for a 25 percent attrition rate over time, and allow for generalizations across sub-groups (e.g., MD customers).50 With the reduced sample size, assuming an attrition rate of 25 percent, we expect to re-contact 773 firms at endline (including 165 MD firms). Given that this is a simple random sample (as opposed to a cluster sample) stratified on region and customer type, this sample size will still be large enough to detect relatively small differences between waves of the survey, approximately 0.31 standard deviations for MD customers and 0.14 standard deviations for the full sample.
4.3.3. Measurement
To collect data that will allow us to answer the evaluation questions at endline, the enterprise survey covered the following topics:
• Energy use and dependence on electricity • Power reliability and quality: outages and voltage fluctuations • Business response to outages • Diverse costs associated with outages or voltage fluctuations (e.g., generator related costs, idle
worker related costs, damaged equipment, lost revenue) • Changes in employment and new investments • Experience and satisfaction with ESCOM (e.g., fault response, new connections, billing,
communications)
50 Because of the nature of IDP investments, most firms are expected to benefit to some degree from the IDP; however, benefits will vary based on location. For example, some firms are currently located downline from overloaded substations that will be relieved by new or rehabilitated substations. Firms in Blantyre might benefit from distribution infrastructure; however, they will not benefit from new transmission lines feeding Lilongwe and Mzuzu. The evaluation hopes to be able to link firms to their substations using GIS data, to use metering data at those substations to identify variability in IDP benefit, and to explore at endline the impact of variable benefits on changes in key indicators. As of this writing, it is not clear if this will be possible. First, it depends on the utility sharing GIS data that has not been forthcoming. Second, while metering has taken place, key portions of the network remain unmetered. Third, the utility already prioritizes industrial areas and MD firms, which might mitigate potential IDP benefits. As such, the evaluation team will need to have a better understanding of these prioritizations. Finally, the smaller than expected sample sizes might limit the extent to which the evaluation can test the impacts of variable benefits.

SOCIALIMPACT.COM 16
• Perceptions of and experiences with corruption in the sector • Attitudes towards tariffs and cost-reflective tariffs
Operationalization of many of these concepts confronts considerable measurement challenges. Many firms did not keep good records of certain variables of interest, such as outages, and costs (e.g., of generator fuel). For such variables, we first asked whether firms kept track, or documented the amounts. If so, we asked them to refer to their records and answer the question with precise, actual figures using their documentation. However, if the firms did not keep records of certain variables, we asked them to estimate the amounts. For example, we asked firms to report the number and frequency of outages they have experienced in the last year. We first asked if the firm tracked outages: most did not. We then asked those respondents that did not track outages to think about the last 12-month period and report how many times their facility experienced power outages in a typical month, for both the rainy season and dry season.
For some variables, approximations were more challenging, and our survey was designed to make the estimation process more systematic. For example, to determine the cost of running a generator, our survey was designed to help the respondent estimate the amount in several steps. Rather than asking the respondents to estimate how much they spend on fuel for a generator, we asked them to estimate how often they fill up the tank, the size of the tank and the cost of the fuel, then multiplied the value together to estimate the cost of fuel. Finally, we asked whether this approximation appears accurate.
When respondents were not able to provide precise values, and had to resort to approximations, we may expect some bias in the way they chose to approximate various variables. In fact, we found substantial differences in the means, medians, and distributions between those businesses that tracked and did not track such factors. While some of this difference is likely a result of measurement error in the approximations, it is important to note that many of the firms that stated that they tracked distinct variables often provided rounded rather than precise figures, suggesting some level of approximation. In addition, we found some systematic differences in the characteristics of firms that tracked outages, costs and were able to provide financial information. MD customers, large firms, and firms in the Central region were more likely to track outages and provide exact financials. Firms that had multiple facilities were somewhat more likely to track outages and track fuel costs. There were some differences by sector, as well. Manufacturing firms were somewhat more likely to track costs of idle workers and provide exact financials. Food service firms were also somewhat more likely to track fuel costs and track costs of idle workers. Finally, firms that IKI surveyed were more likely to report tracking fuel costs, idle worker costs and provide exact financials than firms surveyed by R/P, which suggests that IKI enumerators may have more effectively elicited this information from respondents than R/P enumerators.
4.3.4. Enterprise Survey Sample Characteristics
For baseline enterprise survey data analysis, we used survey data from 1,024 sampled firms, the quality of which was deemed to be of acceptable (see discussion in Section 4.3.9 below for a description of the quality concerns and data collection challenges). Within our sample, 33 percent of firms were from the Central region, 21 percent from the North and 45 percent from the South. Three quarters of the sample was three phase customers, and almost a quarter was MD customers (Figure 2).

17 SOCIALIMPACT.COM
MCC Malawi: Enterprise Survey and Case Study Community Baseline Report
Figure 2: Distribution of enterprise survey sample, by region and customer type (n=1,024)
The attributes of the firms within the sample are presented in Table 6. The vast majority of the firms in our sample 100 percent domestically owned (82 percent), and 14 percent of firms were mostly, or 100 percent foreign-owned. Almost half of the sampled firms were sole proprietorships, 27 percent were family partnerships and 17 percent were private limited liability companies. There were female owners or senior managers at 18% of sampled three phase firms and 10% of MD firms. The median respondent age was 35 to 39 for MD and three phase firm (the survey asked the respondent to select his or her age category, so we present only the median for this variable).
33% 36% 34%
26%4%
21%
41%
59%45%
T H R E E P H A S E MD T O T A L
Central North South

SOCIALIMPACT.COM 18
Table 6: Enterprise survey sample firm attributes, by customer type
Three phase MD Total
n Mean Median n Mean Median n Mean Median
Total 780 244 1035 Firm age 780 13 10 243 22 15 1021 15 11 Number of employees (latest year) 763 14 4 199 180 73 962 48 5 Respondent age range (category) 780 35-39 244 35-39 1021 35-39
Three phase MD Total n % n % n %
General: Firm has multiple locations 315 40% 85 35% 402 39% Operates year round 755 97% 223 92% 978 96% Owner/senior management female 139 18% 24 10% 165 16% Sector: Wholesale and retail 34 4% 13 5% 47 5% Agriculture, hunting 19 2% 28 11% 48 5% Accommodation/restaurants 52 7% 34 14% 86 8% Construction 9 1% 8 3% 27 2% Other 38 5% 30 12% 58 6% Manufacturing non-food products 69 9% 77 32% 148 14% Manufacturing of food products 559 72% 54 22% 621 60% Legal status: Sole proprietorship 468 60% 31 13% 499 49% Family partnership 217 28% 59 24% 276 27% Private limited liability company 53 7% 117 48% 170 17% Public limited liability company 3 0% 13 5% 16 2% Other 39 5% 23 9% 62 6% Ownership: 100% foreign owned 34 4% 67 28% 101 10% Mostly foreign owned 12 2% 34 14% 46 5% Mostly domestically owned 20 3% 20 8% 40 4% 100% domestically owned 714 92% 122 50% 836 82% Business size by category: Micro (<5 employees) 489 64% 15 8% 504 52% Small (5-19 employees) 206 27% 22 11% 228 24%
Medium (20-99 employees) 53 7% 83 42% 136 14%
Large (100+ employees) 15 2% 79 40% 94 10%
The median firm had been in operation for 11 years, and the mean firm age was 15 years. Of the firms in our sample, an estimated 58 percent were classified as maize mills. The vast majority of firms in our sample were manufacturing firms: 61 percent manufactured food products or beverages and 14 percent engaged in other types of manufacturing (Figure 3). Eight percent of firms reported being in the accommodation and restaurant business, and the remaining 18 percent of firms operated in other sectors. Of these firms, 39 percent had multiple business locations – 34 percent of MD customers and 40 percent of Three Phase customers.

19 SOCIALIMPACT.COM
MCC Malawi: Enterprise Survey and Case Study Community Baseline Report
Figure 3: Enterprise survey sample distribution by sector (n=1,024)
4.3.5. Enterprise Survey Analysis
Most of the analysis in this report is based on basic descriptive statistics disaggregated across key variables, such as customer type and region, where relevant. For most continuous variables, there were a number of outliers, due to heterogeneity in the firms, respondents’ difficulty in estimating or remembering certain values, and data quality issues. For sensitivity analysis, we removed some outliers after quality analysis of the data, on a case by case basis. For example, we eliminated one firm with high revenue because it had few employees while maintaining another because the survey data confirmed it was also a high outlier on employees.
When the sample size allowed, statistics were weighted via sampling weights to account for distribution of customer type and geography in the sample compared to the population. The weights are described in detail above in section 4.3.2. For some outcomes, data for only a sub-sample of the surveyed firms is available (e.g., those seeking new connections), rendering the sample size for certain variables quite small – in those cases we present the sample-level, unweighted statistics and describe the findings accordingly.
For the questions asking for costs or other monetary values, the firms typically reported values in Malawian Kwacha. Given the volatility of the Kwacha, any presentation in US dollars is highly variable based the exchange rate used. To be precise Kwacha values were converted to U.S. dollars via an average daily exchange rate based on each firm's reported financial year(s).51
To further explain some key concepts in response to evaluation questions, we also conducted several regression analyses. All regressions were weighted, and the tables present robust standard errors and use asterisks to identify coefficients statistically significant at 1 percent, 5 percent and 10 percent. To test for severity of multicollinearity in an ordinary least squares regression analysis, we calculated the variance inflation factor (VIF), which is reported for each variable under ordinary least squares (OLS)
51 The historical daily exchange rate was found at http://www.exchangerates.org.uk/USD-MWK-exchange-rate-history-full.html#.
61%
14%
8%
5%
4%2% 6%
Manufacturing of food products
Manufacturing of non-food products
Accomodations
Agriculture, hunting
Wholesale and retail
Construction
Other

SOCIALIMPACT.COM 20
assumptions. VIFs were also estimated under logit and ordered logit assumptions using the collin command on Stata but the values were quite similar. The concern is with the relationship among the variables and that the functional form of the model for the dependent variable is irrelevant to the estimation of collinearity.52
Regressions were used to examine satisfaction with ESCOM and expressed willingness to pay higher tariffs. These are relatively straightforward models; however, due to missing values for some variables, we specify different models with and without the problematic variables. There is a trade-off between these models, with the former better equipped to avoid omitted variable bias and the latter better equipped to avoid sampling bias. The findings were mostly similar across models, and we discuss the regression results in the context of the evaluation questions below.
4.3.6. Enterprise Survey Challenges and Limitations
The baseline enterprise survey confronted several challenges, including delayed implementation, a smaller than expected sample size, and relatively high non-response/contact rate.
Timing-related challenges: The main concern with the baseline data collection was that it was conducted by two different subcontractors, in two separate rounds, at different time periods. As noted above, R/P conducted 874 interviews between July and September 2015 and IKI conducted another 146 interviews from March 2016 to July 2016. While about half of the same enumerators were used between the two data collection periods, it is possible, that different firms might have introduced some differences in the data collection process. More importantly, because the survey took place at different periods, respondents were referring to different time periods in their responses. In some cases, respondents were asked questions like, “In thinking about the last 12-month period, in a TYPICAL month in the dry season, how many times a month did you experience power outages at this facility?” In this case R/P and IKI respondents would have been speaking about different 12-month periods. Nonetheless, so as not to complicate data presentation, in the analysis below, we present the R/P and IKI collected data together, noting potential complications when present.
Data quality concerns: To ensure baseline data quality, IKI was asked to conduct backchecks of potentially problematic R/P interviews. SI purposively identified 280 firms for backchecks. These firms were selected because of potential concerns with the interviewer, the respondents’ position in the firm, or large amounts of missing data. Of these, IKI completed 240 backchecks. IKI’s backchecks found that 39 R/P interviews (16 percent) presented potential irregularities, and these observations were excluded from the analysis.53 The proportion of problematic surveys from among this group of flagged interviews was low enough that the remainder of R/P collected observations were deemed to be of acceptable quality. While we feel reasonably confident in the data presented, it is clear that the exercise would have been more successful if it was conducted by a high-capacity firm experienced with similar enterprise surveys.
Sampling concerns: As noted above, both R/P and IKI experienced substantial challenges in locating firms. The root cause of this was the very minimal information contained within the sampling frame, which often did not provide clear address information. In theory, this was to be overcome through 1) cooperation
52 Menard, Scott. Applied Logistic Regression. Second edition. 2002. 53 In some cases, it appears that interviews were forged, as some back-checked firms reported that no survey had taken place and indicated respondents did not work for the firm. This could not be confirmed in all cases, however, and some of the 21 might have been legitimate observations.

21 SOCIALIMPACT.COM
MCC Malawi: Enterprise Survey and Case Study Community Baseline Report
with ESCOM meter readers, and 2) creation of a scouting team responsible for identifying firms and making appointments. While the scouting team approach yielded an improved contact rate, cooperation with ESCOM and ESCOM meter readers was never realized. Many contacted firms also refused to participate in the survey. The data collection organizations reported high levels of distrust among non-responders, who suspected that the survey had alternative objectives. In particular, some non-responders feared that the survey’s intent was to collect financial information for tax authorities. This perception was likely aggravated by a policy of providing a list of financial indicators to be collected ahead of the interview, which was done to provide interviewees with sufficient time to compile accurate information. In addition, businessmen and women, particularly managers of larger enterprises that are MD customers, are busy people and might not prioritize a survey over other responsibilities. In particular, one of the data collection organizations reported that firms run by individuals of South Asian origin were systematically less likely to participate in the study. Potential sampling bias concerns are discussed above.
Sampling and measurement error in missing data: MCC had a particular interest in concrete financial data, including revenues and diverse costs. While these were included in the instrument, for the reasons suggested above, many firms that participated in the survey did not answer financial questions or even questions about the number of employees. The missing data problem was exacerbated when enumerators skipped far more than just the financial questions when faced with uncooperative respondents. While data were collected electronically, SI did not have real-time access to the data and could not conduct ongoing data quality monitoring. Many data quality problems, including a large number of missing observations, discrepancies in answers, outliers, inappropriate respondents, suspiciously quickly completed surveys, and potentially forged surveys, were only discovered when the datasets were delivered. In the reporting below, we note sample sizes for all questions. This is based on the unweighted sample size to give the reader a sense of the missing data for each question.
Other measurement error: Several survey questions were subject to recall error, including the number and duration of outages, energy-related costs, costs from outages, and financial information. Firms that already tracked this information were more readily able to provide this information, while others offered estimates. As noted above, there were efforts to increase the accuracy of approximations, but there were nonetheless major differences between the estimations and the tracked responses, which suggests recall error. Other questions interrogated sensitive issues, such as corruption, which may have introduced social desirability bias in the responses.
4.3.7. Case study communities
To explore energy challenges and changes over time at the household level, the evaluation selected several case study communities based on 1) region and 2) a combination of income and access to electricity. In addition, all the sites are expected to benefit from the IDP investments. The original evaluation design only involved focus group discussions (FGDs) in case study communities. After the design was completed, however, an opportunity arose to conduct household surveys in the selected communities. The National Statistical Office (NSO) of Malawi was conducting the fourth wave of its large-scale Integrated Health Survey (IHS) and with support from MCA-Malawi, agreed to conduct an oversample of households in case study communities. We first discuss the FGDs and then explain the oversample.

SOCIALIMPACT.COM 22
Table 7 presents the case study communities where household FGDs were conducted. The table differentiates between income and access level and region/city. It should be noted that the income categories presented in Table 7 are rough classifications. We do not have an exact measure of income at the area or ward level, and instead have matched communities based on the percent below the poverty line, as reported by the National Statistics Office using 2008 Census data. Although somewhat dated, the Census is the only data source that provides information at the area or ward level. The table also notes how the community will benefit from the IDP. Communities in Lilongwe and Mzuzu will benefit from improved transmission lines, communities in Blantyre will benefit from improved substations, and many communities will benefit from both improved transmission and distribution infrastructure. To further verify the comparability of the sites prior to data collection, the evaluation team visited each of the research sites and conducted interviews with community leaders. MCA-Malawi and ESCOM personnel provided suggestions on which communities would benefit substantially from the IDP investments. We use the terms middle-high and middle-low as a heuristic to indicate that these are neither the wealthiest communities nor the poorest. In the case of Lilongwe and Blantyre, the final category of “middle-low income without electricity” was drawn from different sections of the same lower-middle income communities, Area 25 in Lilongwe and Zingwangwa in Blantyre.
Table 7: Focus group site selection
Lilongwe Blantyre Mzuzu
Middle-high income with electricity Focus on outages, quality, customer service, and economic decision-making regarding energy use.
Area 18B: (Transmission line)
Limbe Central: Kanjedza (Limbe A substation)
Katoto: New Katoto (transmission)
Middle-low income with electricity Focus on outages, quality, the process of obtaining access, customer service, and economic decision-making regarding energy use.
Area 25C (Transmission line plus new substation)
Blantyre West: Zingwangwa (Ntonda Substation)
Nkhorongo: (Transmission line plus Sonda substation)
Middle-low income without electricity Focus on barriers to access, the process of obtaining access, and economic decision-making regarding energy use.
Area 25B Kabwabwa (Transmission line plus new substation)
Blantyre West: Zingwangwa traditional area (Ntonda Substation)
Chibavi: (Transmission line plus Sonda substation)
4.3.8. FGD Participant Selection
Focus group methodologies work best with relatively homogenous populations where participants feel comfortable speaking openly and where they speak from a common experience.54 There are several variables that could be considered when stratifying and sampling for FGDs to ensure such commonalities, including electricity access, income, expected benefits from the Compact, sex, age, and location. The 54 Copsey, Nathaniel. “Focus groups and the political scientist.” European Research Working Paper Series, no. 2, 2008. European Research Institute.

23 SOCIALIMPACT.COM
MCC Malawi: Enterprise Survey and Case Study Community Baseline Report
approach to site selection ensured homogeneity in terms of electricity access, income, and location. Within these communities focus group participants were then selected to ensure relative homogeneity in age (adult versus youth) and gender. We conducted three FGDs in each community: an adult male focus group, an adult female focus group, and a youth mixed-gender focus group (ages 15-21).55 In total 27 FGDs with 255 participants were conducted from May to July 2015.
A recruitment team from the data collection firm identified participants for the FGDs. Recruiters randomly selected households and household members for participation; however, they utilized a screening instrument to screen for age, sex, income, electricity access, and level of knowledge of electricity in their household. Adults with electricity connections had to be knowledgeable about electricity use, households without electricity must have applied for an electricity connection, and youth had to be enrolled in school. Participants were offered a financial incentive to encourage their participation. While we expect attrition, we will attempt to recruit these same individuals for FGDs at endline.
Upon arrival to the FGD location, each participant completed a short mini-survey on the topics below. The surveys were read and tallied quickly prior to the discussion. Based on this information, the FGD facilitators refined discussion questions and asked targeted follow-up questions. The discussions covered the following four themes, each of which was introduced with a guiding question.
• Theme 1: Sources of and expenditures on electricity and energy costs • Theme 2: Reported experiences with electricity, including outages and quality of supply (only
for those with a connection) • Theme 3: Time use and income generating activities • Theme 4: Attitudes towards ESCOM, services, and tariffs
4.3.9. FGD Challenges and Limitations
While FGDs allow for in-depth, qualitative understanding of select outcomes, they have limitations. Unlike a large-n survey of a representative sample, FGDs do not allow evaluation teams to make confident inferences about an entire population. There can also be systematic biases in the types of people that participate in FGDs and what views are put forward in a group setting, as well as variation in how the dialogue is managed. Furthermore, FGDs have far fewer participants than a large-scale survey, which results in greater random error.56 As such, FGDs are best used to explore topics in-depth and to provide context and further explanation for other more systematic data collection activities, such as the technical monitoring component of the IDP. These limitations should be kept in mind when interpreting the findings.
The same problematic data collection firm that did the original enterprise survey conducted FGDs, which resulted in several important data collection challenges. After considerable delays, hiring of additional oversight personnel, taking over much of the facilitation, and repeating some of the FGDs, the evaluation team overcame most of the challenges that could affect data quality. Remaining concerns include the following:
55 Age ranges for “youth” vary across studies. In this case, the youth age range was selected to maximize the probability that respondents would be enrolled in secondary school. 56 For additional insights into the strengths and limitations of focus groups in evaluations of development aid interventions, please see USAID. November 2013. Technical Note: Focus Group Interviews, http://usaidlearninglab.org/library/technical-note-focus-group-interviews-0

SOCIALIMPACT.COM 24
• The original sampling protocol for FGDs in communities without electricity called for recruiting individuals who had applied for an electricity connection but not yet obtained it. However, this protocol was only strictly followed in the Northern region and many participants in Lilongwe and Blantyre had not applied for a connection.
• The recruitment and FGD mini-survey instruments were inconsistently implemented and raw data were not available for the team’s verification. Responses were aggregated on site and we did not develop a database. As such, the evaluation team was unable to effectively analyze this data or compare individual baseline responses to responses to be captured at endline. For descriptive purposes, we were unable to calculate the percent of total FGD participants that had a particular view. Nonetheless, the way the data were captured did allow us to determine what percent of a specific focus group had a particular view. As such, in the descriptive sections below we use language like “approximately 70-100 percent of participants in each FGD in communities with access to electricity, uses a combination of ESCOM electricity, charcoal, and firewood on a consistent basis.”
• Finally, a minority of the information provided in FGDs was incorrectly captured in notes and transcripts and was therefore not used for the evaluation.
4.3.10. IHS4 Oversample of Households in Select Communities
While the case study communities were selected with a focus group-based methodology, MCA-Malawi worked with the NSO to conduct an oversample of the IHS4 in the selected communities. The sample sizes for the communities is presented in Table 8, for a total of 591 respondents. Because of the relatively small sample sizes, in the analysis below, we present the baseline findings separately for two groups: middle-high income communities with good access to electricity (n=224) and lower income communities with mixed access (n=367). Reflecting these disaggregations, the median house value in middle-high income FGD communities is more than seven times higher than in the middle-low income communities. It should be noted that combining these communities is problematic, as it means combining uneven proportions of households from the North, South, and Central regions. We do not intend for the survey data to be representative of a population other than these specific case-study communities, and the statistics should not be interpreted as representative of the country or income groups. Rather, we are most interested in observing changes over time in this population and speaking in general terms about energy challenges confronted by these communities.
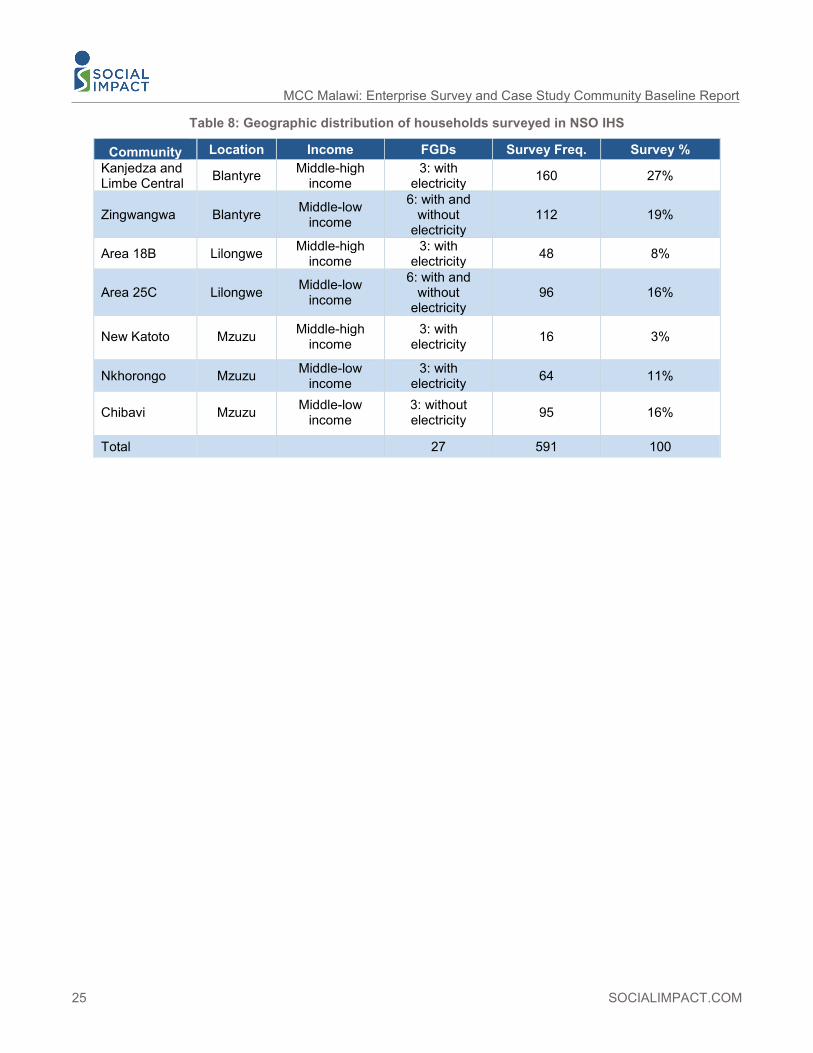
25 SOCIALIMPACT.COM
MCC Malawi: Enterprise Survey and Case Study Community Baseline Report
Table 8: Geographic distribution of households surveyed in NSO IHS
Community Location Income FGDs Survey Freq. Survey % Kanjedza and Limbe Central Blantyre Middle-high
income 3: with
electricity 160 27%
Zingwangwa Blantyre Middle-low income
6: with and without
electricity 112 19%
Area 18B Lilongwe Middle-high income
3: with electricity 48 8%
Area 25C Lilongwe Middle-low income
6: with and without
electricity 96 16%
New Katoto Mzuzu Middle-high income
3: with electricity 16 3%
Nkhorongo Mzuzu Middle-low income
3: with electricity 64 11%
Chibavi Mzuzu Middle-low income
3: without electricity 95 16%
Total 27 591 100

SOCIALIMPACT.COM 26
5. DATA SOURCES AND OUTCOME DEFINITIONS
5.1 Data sources
5.1.1. New data sources
Quantitative data sources
As two of the three main objectives of the Compact are related to businesses—to reduce the cost of doing business and to increase value added production—achievement of these objectives and others can best be measured through a survey of businesses before, during, and after realization of the Compact’s benefits. With benefits spread across consumers and diffused far into the future; without significant increases in generation; and provided the expansion of the customer base, it is not clear to what extent business customers will experience clear improvements in energy supply or reliability. To address this challenge, SI decided to focus on high-energy-use businesses that are very dependent on electricity and thus highly sensitive to improvements in reliability. MD customers account for approximately 80 percent of ESCOM revenues and are the most likely to convert improved electricity into value added production. A sampling frame of businesses was developed from ESCOM’s customer records. When the sampling frame of businesses was being prepared, there were 832 MD customers in the ESCOM network. Given the relatively low number of MD customers, we expanded the population of interest to three-phase commercial connections, of which there were 5,389.
The ES was designed to collect data for the analysis of the different roles and costs of various energy-related and other inputs to production across high energy-use firms within Malawi and examine how these factors may impact productivity and profitability. The survey data enables us to assess whether these relationships vary over time, both before investments under the Malawi Compact come online, as well after the investments have been completed. The survey data also allows us to determine which characteristics, if any, predict whether a firm elects to rely on alternate sources of power during outages (rather than idling production).
Qualitative data sources
The evaluation team conducted 27 FGDs with 255 participants in nine case study communities from May to July 2015. The focus group recruitment was limited to communities expected to benefit from the IDP. The nine sites were selected based on 1) region, and 2) a combination of income and access to electricity. In selecting the sites, we stratified by geography, average community income and access to electricity. By comparing focus group responses across the categories and over time, the evaluation team can speak to the potential impact of varying levels of IDP benefits.
5.1.2. Existing data sources
In addition to these primary sources of data, we use a range of secondary data sources. We analyzed data from the Integrated Household Survey (IHS) which was conducted by Malawi’s National Statistical Office (NSO) for the communities sampled for the FGDs and used it to assess external validity of our findings.

27 SOCIALIMPACT.COM
MCC Malawi: Enterprise Survey and Case Study Community Baseline Report
The IHS conducted by the NSO in 2016 and 2017 is referred to as IHS4 to capture various aspects of household welfare in Malawi.57 The survey uses a stratified two-stage sample design. The primary sampling units selected at the first stage are the census enumerations areas (EAs) that are the smallest operational areas established for the 2008 Malawi Population and Housing Census with well-defined boundaries. The full IHS4 sample comprises 12,480 households in 780 enumeration areas, slightly larger than the 768 EAs surveyed in the previous round of the IHS (IHS3), since the island of Likoma is included in IHS4. The cross-sectional sample is representative at the district-, regional-, urban-rural and national-level and households were visited once throughout the 12 months of fieldwork. Of the 204 panel enumeration areas from IHS3/IHS4, 102 were selected for follow up in IHS4, with two interviews set up to capture both rainy and dry seasons. Up to four adults in each panel household were randomly selected and received an individual-referenced questionnaire on asset ownership and food security. For this study, we focus on the IHS4 survey data from the communities in which the FGDs were conducted and utilize the IHS4 survey data to provide context to the qualitative findings and supplement the FGD data. We disaggregate the survey data from the selected communities into two broad income categories and compare findings across the two groups. Throughout the presentation of the baseline FGD data and analysis, we weave in the IHS4 data where relevant, and discuss both the quantitative survey and qualitative findings in parallel.
We also used data from the 2014 enterprise survey conducted by the World Bank to assess external validity of the findings based on our primary data. This survey is a cross-national survey conducted in 139 countries, stratified over the population by three criteria: sector of activity (measured by the Gross National Income), firm size (small firms are identified as those with 5-19 employees, medium ones with 20-99 employees, and large ones with 100 or above employees), and geographical location (main urban centers and regions).
We also reviewed the data from a survey of maximum demand customers conducted by ESCOM in 2013, for which a sample of 92 respondents was drawn from a population of 286 industrial customers of the public electricity utility in the Southern Region of Malawi.58 The study found that the quality of electricity service was poor irrespective of demographic characteristics of the industrial customers, and thus these customers are dissatisfied with the service offered and are disloyal to the public electricity utility. However, the level of loyalty was moderated by level of consumption – large consumers are less disloyal than small consumers.
5.2 Outcome definitions The outcomes measured by the ES, the IHS4, and the FGDs are derived from the evaluation questions. Table 9 provides operational definitions for the many outcomes explored in this report organized by question and data source.
57 “Sampling and Survey Design.” Living Standards Measurement Study: Malawi. September 2017. Retrieved from http://go.worldbank.org/ZIWEL8UHQ0 58 Chodzaza, Gilbert E. & Gombachika, Harry S. H. “Service quality, customer satisfaction and loyalty among industrial customers of a public electricity utility in Malawi.” International Journal of Energy Sector Management, Vol. 7, no. 2, 2013: 269-282.

SOCIALIMPACT.COM 28
MCC Malawi: Enterprise Survey and Case Study Community Baseline Report
Table 9: Outcome definitions by concept, data source, and question
Question Data source
Outcome concept included in question
Outcome operational definition
Core Q1 ES Poverty Not included here. (WB Country Dashboard) Core Q1 ES Economic growth Not included here. (WB Country Dashboard)
Core Q1 ES Electricity related costs of doing business
Stated impact of power outages on operations
Core Q1 ES Electricity related costs of doing business
Costs associated with outages, including generator costs, idle worker costs, lost revenue, and other costs
Core Q1 ES Electricity related costs of doing business
Costs associated with voltage fluctuations, included damage to equipment and the cost of surge protection equipment
Core Q1 FGD Electricity related costs of doing business
Reported nature of costs of unreliable electricity on household businesses
Core Q1 ES Value added production Not measured, but investments are measured below Core Q6/Q7 IHS3 Energy consumption Source of cooking fuel (national) Core Q6/Q7 IHS4 Energy consumption Source of cooking fuel (case study communities) Core Q6/Q7 IHS4 Energy consumption Source of lighting fuel (case study communities) Core Q6/Q7 FGD Energy consumption Source of cooking and lighting fuel and perceptions of the
benefits of each. Core Q6/Q7 IHS4 Energy expenditures Monthly electricity costs (case study communities) Core Q6/Q7 FGD Energy expenditures Perceptions of electricity and charcoal costs Core Q6/Q7 FGD Time use Reported time use between 18:00 and 23:00
IDP Q2 ES Energy consumption patterns
% of firms reporting use of different energy sources in the last month
IDP Q2 ES Energy consumption patterns
Extent to which electricity is an obstacle to growth compared with other factors
IDP Q2 ES Energy consumption patterns
Electricity expenditures
IDP Q2 ES Energy consumption patterns
Electricity expenditures as a percentage of total costs
IDP Q3 ES Investments Percent of firms making capital investments in the previous year
IDP Q3 ES Investments Type of investment IDP Q3 ES Investments US dollar value of investment IDP Q3 ES Investments Role of electricity reliability in investment decisions IDP Q3 ES Workforce growth Employee growth in the past year
IDP Q4 ES Business satisfaction with ESCOM
Satisfaction with ESCOM, in comparison with other utilities
IDP Q4 ES Perception of the quality of electricity
Satisfaction with electricity supply at selected facility
IDP Q5 ES Perception of fairness of the tariff
Belief that the current electricity tariff is fair
IDP Q5 ES Reported willingness to
pay for improved electricity
Percent increase in the tariff, respondent is willing to pay to cut outages in half
IDP Q5 ES Reported willingness to
pay for improved electricity
Percent increase in the tariff, respondent is willing to pay to almost eliminate outages
PSRP Q6 ES ESCOM effectiveness
and efficiency in procurement
Measured through PSRP qualitative research. Not included here.

29 SOCIALIMPACT.COM
MCC Malawi: Enterprise Survey and Case Study Community Baseline Report
Question Data source
Outcome concept included in question
Outcome operational definition
PSRP Q6 ES ESCOM effectiveness
and efficiency in outage response
Satisfaction with ESCOM’s responsiveness to faults
PSRP Q6 ES ESCOM effectiveness
and efficiency in outage response
Perception of change in ESCOM responsiveness to faults over the last 12 months
PSRP Q6 ES ESCOM effectiveness
and efficiency in outage response
Respondent reported estimate of response time to faults
PSRP Q6 ES
ESCOM effectiveness and efficiency in processing new
connections
Percent of soliciting firms able to obtain a connection
PSRP Q6 ES
ESCOM effectiveness and efficiency in processing new
connections
Wait times to obtain a business connection
PSRP Q6 ES
ESCOM effectiveness and efficiency in processing new
connections
Satisfaction with the ESCOM new connections process
PSRP Q6 IHS4
ESCOM effectiveness and efficiency in processing new
connections
Wait times to obtain a household connection (in case study communities)
PSRP Q6 FGD
ESCOM effectiveness and efficiency in processing new
connections
Experiences with obtaining a household connection
PSRP Q6 ES
Improvements in ESCOM effectiveness
and efficiency in response to customer
problems
Percent of firms reporting problems with ESCOM post-pay billing and prepay
PSRP Q6 IHS4
Improvements in ESCOM effectiveness
and efficiency in response to customer
problems
Perceived ESCOM responsiveness to the needs of households like mine
PSRP Q6 IHS4
Improvements in ESCOM effectiveness
and efficiency in response to customer
problems
Satisfaction with ESCOM
PSRP Q7 ES Perception of corruption Perception of how big a problem corruption is in ESCOM PSRP Q7 ES Perception of corruption Perception if ESCOM personnel are more responsive to
businesses that provide gifts or make informal payments PSRP Q7 FGD Perception of corruption Perception of corruption in ESCOM PSRP Q7 ES Corruption in
procurement Not included here.
PSRP Q7 ES Corruption in service extension
Self-reported bribe solicitations in obtaining electricity connections
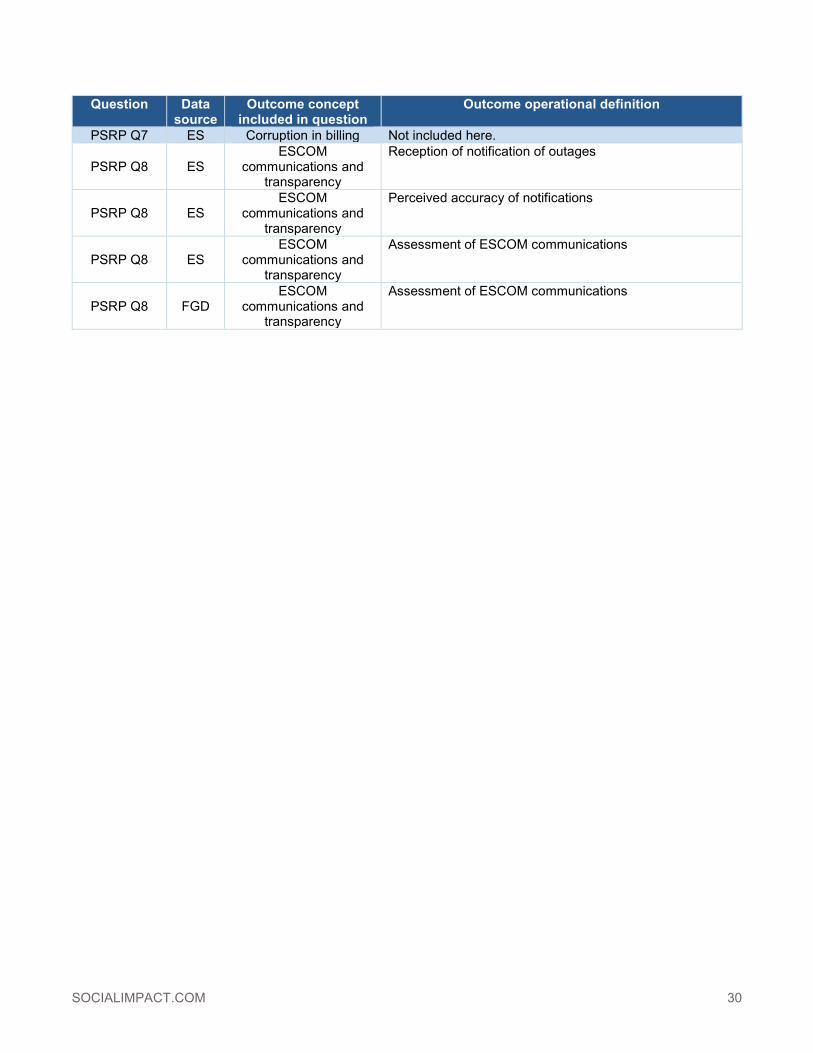
SOCIALIMPACT.COM 30
Question Data source
Outcome concept included in question
Outcome operational definition
PSRP Q7 ES Corruption in billing Not included here.
PSRP Q8 ES ESCOM
communications and transparency
Reception of notification of outages
PSRP Q8 ES ESCOM
communications and transparency
Perceived accuracy of notifications
PSRP Q8 ES ESCOM
communications and transparency
Assessment of ESCOM communications
PSRP Q8 FGD ESCOM
communications and transparency
Assessment of ESCOM communications

31 SOCIALIMPACT.COM
MCC Malawi: Enterprise Survey and Case Study Community Baseline Report
6. ENTERPRISE SURVEY FINDINGS This section describes the baseline findings from the enterprise survey, organized by evaluation question. While it will not be possible to answer these questions until we can compare endline with baseline data, the baseline values for the outcomes of interest relevant to these questions are described within this section.
Below each question, we first present the descriptive statistics of key variables collected to measure outcomes related to the particular question. All data is also disaggregated by customer type, which is a proxy for business size, with most MD customers representing larger businesses, while three phase customers are predominantly smaller businesses – defined by employee headcount. In addition, certain outcomes are disaggregated by business size categories, based on the number of employees. Core question 3 asks for disaggregation of outcomes by gender and income, and where relevant we discuss gender differences.
When the sample size allows, statistics are weighted via sampling weights to account for distribution of customer type and geography in the sample compared to the population. For some outcomes, data for only a sub-sample of the surveyed firms is available (e.g., those seeking new connection), rendering the sample size for certain variables quite small – in those cases we present the sample-level, unweighted statistics and describe the findings accordingly. We then compare our ES data to existing data sources, whenever comparable data is available, including the 2014 WB enterprise survey and the 2013 ESCOM survey. After presenting the findings, we assess program logic risk and summarize our conclusions.
6.1 IDP Q2: What are beneficiary businesses’ consumption/ expenditures patterns for different types of energy? How do consumption/expenditure patterns change as a result of improved electricity?59
This question assumes 1) that the Compact will lead to improved electricity supply to businesses, which in turn 2) will lead businesses to depend more on electricity over other sources of energy. Regarding the first assumption: at baseline data collection, electricity supply was relatively close to the demand of existing customers. This was largely due to the commissioning of the Kapichira II hydroelectric plant in 2013, which added an additional 64.8 MW capacity, an increase of close to 30 percent of the electricity supply. As the IDP does not include substantial new generation, any improvements in reliability and quality from improved transmission and distribution will likely be undermined by the steady increase in new customers to the network. Substantial improvements in the electricity supply at endline (2019) will therefore depend on the commissioning of investments in generation capacity by new Independent Power Producers (IPPs) as a result of the PSRP.
Regarding the second assumption, it is unlikely that the evaluation will be able to observe meaningful changes in consumption patterns that can be attributed to the Compact. As demonstrated below, interviewed firms already derive 98 percent of their energy from ESCOM-supplied electricity, making it unlikely a measurable change would be observed at endline. It is possible some businesses, formal and 59 The evaluation core questions also note: “At the enterprise level, the evaluation shall focus on the impact of the program/project/activities on: business profitability and productivity; value added production and investment; employment and wage changes; energy consumption and sources of energy used; and business losses. These factors are discussed while answering IDP Q2, C1, and IDP Q3. Unfortunately, we were not able to accurately measure either firm outputs or the firm inputs required to estimate productivity.
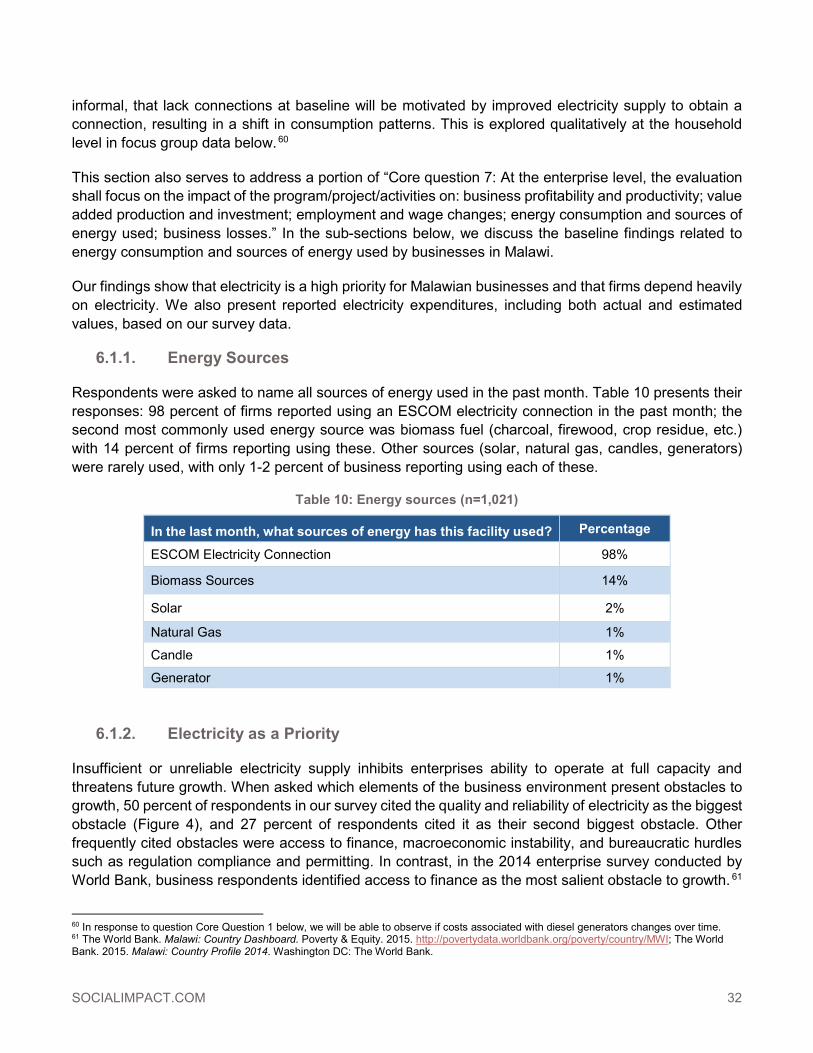
SOCIALIMPACT.COM 32
informal, that lack connections at baseline will be motivated by improved electricity supply to obtain a connection, resulting in a shift in consumption patterns. This is explored qualitatively at the household level in focus group data below.60
This section also serves to address a portion of “Core question 7: At the enterprise level, the evaluation shall focus on the impact of the program/project/activities on: business profitability and productivity; value added production and investment; employment and wage changes; energy consumption and sources of energy used; business losses.” In the sub-sections below, we discuss the baseline findings related to energy consumption and sources of energy used by businesses in Malawi.
Our findings show that electricity is a high priority for Malawian businesses and that firms depend heavily on electricity. We also present reported electricity expenditures, including both actual and estimated values, based on our survey data.
6.1.1. Energy Sources
Respondents were asked to name all sources of energy used in the past month. Table 10 presents their responses: 98 percent of firms reported using an ESCOM electricity connection in the past month; the second most commonly used energy source was biomass fuel (charcoal, firewood, crop residue, etc.) with 14 percent of firms reporting using these. Other sources (solar, natural gas, candles, generators) were rarely used, with only 1-2 percent of business reporting using each of these.
Table 10: Energy sources (n=1,021)
In the last month, what sources of energy has this facility used? Percentage
ESCOM Electricity Connection 98%
Biomass Sources 14%
Solar 2%
Natural Gas 1%
Candle 1%
Generator 1%
6.1.2. Electricity as a Priority
Insufficient or unreliable electricity supply inhibits enterprises ability to operate at full capacity and threatens future growth. When asked which elements of the business environment present obstacles to growth, 50 percent of respondents in our survey cited the quality and reliability of electricity as the biggest obstacle (Figure 4), and 27 percent of respondents cited it as their second biggest obstacle. Other frequently cited obstacles were access to finance, macroeconomic instability, and bureaucratic hurdles such as regulation compliance and permitting. In contrast, in the 2014 enterprise survey conducted by World Bank, business respondents identified access to finance as the most salient obstacle to growth. 61
60 In response to question Core Question 1 below, we will be able to observe if costs associated with diesel generators changes over time. 61 The World Bank. Malawi: Country Dashboard. Poverty & Equity. 2015. http://povertydata.worldbank.org/poverty/country/MWI; The World Bank. 2015. Malawi: Country Profile 2014. Washington DC: The World Bank.

33 SOCIALIMPACT.COM
MCC Malawi: Enterprise Survey and Case Study Community Baseline Report
The differences between our two studies are likely due at least in part to differences in sampling; our sample has a larger proportion of manufacturing firms, but respondents’ answers in our survey were likely to also have been influenced by the knowledge that this survey was focused on electricity related issues. As such, this summary statistic should be interpreted with caution.
Figure 4: Biggest obstacle to growth (n=1022)
6.1.3. Electricity Expenditures
Respondents were asked to report their total electricity costs for the latest year and the year before that.62 First, respondents were asked to provide their expenditures on electricity based on their financial records. Firms that were unable or unwilling to report actual costs of electricity were asked to estimate them via a series of sub-questions. Of the surveyed firms within our sample, 84% provided cost information including electricity expenditures for the latest year and 77% provided this information for the previous year. Due to the relatively high rate of non-response to cost questions within the financial section, the baseline values presented in this section are likely not representative of the entire firm population.
Table 11 presents electricity expenditures for the latest and the previous financial year, and proportion of total costs represented by electricity expenditures, disaggregated by customer type and region. As expected, electricity expenditures were significantly higher for MD customers, with the median MD firm spending $29,340 in the most recent year ($28,830 in the previous year) on electricity, compared to a median three-phase customer who reported spending $1,909 in the most recent financial year and $1,977 the year before that. As percent of total costs, however, electricity expenditures represented only 6-7% of total costs for the median MD firm, compared to almost half of costs of the total costs of the median three phase firms. Electricity expenses are especially salient for maize mills, as many maize mills are small operations with zero to four employees. For maize mills, almost all of which are three-phase
62 Due to delays in data collection associated with the procurement of a new data collection firm, some firms were asked about the 2014 fiscal/calendar year and some were asked about the 2015 fiscal/calendar year. We refer to this throughout the text as previous year or last year.
2%
2%
2%
3%
5%
6%
9%
17%
50%
0% 10% 20% 30% 40% 50% 60%
Business Licensing and Permits
Competition
Other
Customs and Trade Regulations
Tax Rates
Crime, Theft and Disorder
Macroeconomic Instability
Access to Finance
Quality and Reliability of Electricity

SOCIALIMPACT.COM 34
customers, electricity costs represented 55 percent of costs (median), compared to non-mill firms, for which the median percent of all costs represented by electricity was 7 percent.
Table 11: Electricity expenditures in the last year and previous year, by customer type and region
Previous year
n Electricity expenditures (median)
Electricity expenditures as % of total costs (median)
Customer type Three Phase 638 $ 1,977 47%
Customer type MD 155 $ 28,830 6% Region Central 273 $ 2,197 39% Region North 173 $ 1,318 46% Region South 347 $ 2,197 48%
Total 793 $ 2,076 44%
Most recent year
n Electricity expenditures (median)
Electricity expenditures as % of total costs (median)
Customer type Three Phase 709 $ 1,909 48%
Customer type MD 155 $ 29,340 7% Region Central 291 $ 2,167 40% Region North 197 $ 1,241 48% Region South 376 $ 2,104 50%
Total 864 $ 2,005 46% Electricity expenditures were lowest in the North ($1,241 in most recent year), and very similar in Central and South regions - $2,167 and $2,104, respectively. However, as proportion of total costs, there was an appreciable difference: 40% in Central region compared to 50% in South region.
Figure 5 and Figure 6 present histograms of electricity expenditures as proportion of costs in most recent year for MD and three phase customers, respectively. The shapes of the distributions are quite different, with the MD customer distribution skewed strongly to the left, with 60% of firms reporting that electricity expenditures represent 10% of less of their costs. The distribution of three phase customers, on the other hand, is centered above 50%, with the vast majority of customers reporting electricity costs around and even higher than 50% of total costs.

35 SOCIALIMPACT.COM
MCC Malawi: Enterprise Survey and Case Study Community Baseline Report
Figure 5: Electricity expenditures as proportion of total costs in most recent year, MD customers (in USD)
Figure 6: Electricity expenditures as proportion of total costs in most recent year, Three-phase customers (in USD)
As discussed above, many respondents refused to answer questions about their firm’s financials. Respondents who approximated their electricity expenditures tended to report lower values than those

SOCIALIMPACT.COM 36
who reported exact figures.63 The quality of the self-reported estimates on electricity expenditures in the survey was dubious, and the answers were widely distributed and sometimes not consistent with other firm characteristics. At endline, we hope to examine ESCOM consumption data, which may be a more reliable measure of firms’ electricity consumption and expenditures.
6.2 Core Q1: What declines in poverty, increases in economic growth, reductions in the electricity related cost of doing business, increases in access to electricity, and increases in value added production are observed over the life of the Compact?
The ES was designed to provide a detailed estimate of the costs of unreliable and low-quality electricity on businesses, and to track those costs over time. We begin by estimating the outages experienced by firms, then explore how firms respond to outages, and then estimate the costs associated with idle workers, generators, electricity surges, and electricity related production problems.
Changes in poverty and economic growth asked in the question will be tracked using the WB’s Country Dashboard to obtain poverty trend (both by international and national standards) in Malawi. 64 We are unfortunately not able to speak to changes in value added production, as we were not able to measure inputs and outputs. In response to the next question we focus on the related issue of investment.
This section also serves to address a portion of Core question 7: At the enterprise level, the evaluation shall focus on the impact of the program/project/activities on: business profitability and productivity; value added production and investment; employment and wage changes; energy consumption and sources of energy used; business losses. In this sub-section, we discuss the business losses associated with outages and low voltage, and the general impact of poor electricity supply on business operations.
6.2.1. Outages
Outages are common across all regions and customer types. In the 2014 enterprise survey conducted by the WB, businesses in Malawi report approximately seven power outages in a typical month, compared to eight outages across SSA countries and twelve in low income countries. Service delays impose additional costs on firms and may act as barriers to entry and investment.65 Data from a 2013 ESCOM survey of maximum demand customers showed that the quality of electricity service was poor, irrespective of demographic characteristics of the industrial customers, and that these customers are dissatisfied with the electricity service and disloyal to the public electricity utility. 66 We discuss the lack of satisfaction with the electricity supply and with ESCOM’s service in section 6.4.
In our survey, we asked firms to report (or estimate) the number and duration of outages they have experienced in the last year. We first asked if the firm tracked outages: most did not. We then asked those respondents that didn't track outages to think about the last 12-month period and estimate the
63 An analysis between exact and approximate figures suggests that respondents using approximations reported lower electricity costs than those providing more accurate figures, even when controlling for factors like firm size. As such, we consider these figures to be conservative and firms may spend somewhat more on electricity than the numbers presented here. High values were crosschecked against other factors and one outlier was dropped. 64 The World Bank. Malawi: Country Dashboard. Poverty & Equity. 2015. 65 The World Bank. 2015. Malawi: Country Profile 2014. Washington DC: The World Bank. 66 Chodzaza, Gilbert E. & Gombachika, Harry S. H. “Service quality, customer satisfaction and loyalty among industrial customers of a public electricity utility in Malawi.” International Journal of Energy Sector Management, Vol. 7, no. 2, 2013: 269-282.

37 SOCIALIMPACT.COM
MCC Malawi: Enterprise Survey and Case Study Community Baseline Report
frequency and duration of outages separately for the dry season and rainy season. They were asked a) approximately how many times their facility experienced power outages in a typical month in each season, and b) how many hours the typical outage lasted in each season. We asked the firms that tracked outage information to report the total number of outages the facility had experienced during each season within the past year, and the total number of hours of outages within the last year. For our analysis, we excluded several outliers and calculated monthly averages by season.
As expected, firms experienced outages more frequently during the rainy season than during the dry season,67 a result that was consistent across firms that tracked outages and those that did not. As expected, the distribution of estimates of outage frequency for firms that did not track their outages was much higher than those that tracked (i.e., kept records). Firms that did not track reported experiencing a mean of 14 (median of 12) outages in a typical month in the rainy season, and a mean of 8 (median of 10) outages in the dry season. These estimates were higher than the frequency of outages estimated by firms that tracked outages (Figure 7). The mean number of outages was 7 (median of 5) per month in the rainy season, and a mean of 4 (median of 3) in the dry season among firms that recorded outages. Some of the differences in these estimates could be due to recall bias, the difficulty of accurately estimating the outage frequency and duration; and differences in the questions used. Three-phase customers reported slightly more frequent outages than MD customers (
Figure 8 and Figure 9), that lasted longer on average (Figure 10 and Figure 11). This is consistent with expectations, as some MD firms are located along industrial lines that are prioritized during loadshedding, and there is some indication that ESCOM is more responsive to MD firms in responding to outages. In general, outages lasted longer in the rainy season. The median outage lasted 4-5 hours in the dry season and 6-7.5 hours in the rainy season.
67 We classify the rainy season as November through April and the dry season in Malawi as May through October. Source: “Climate of Malawi.” Department of Climate Change and Meteorological Services, Ministry of Natural Resources, Energy and Environment. Retrieved from http://www.metmalawi.com/climate/climate.php. All statistics are weighted.

SOCIALIMPACT.COM 38
Figure 7: Number of outages reported per month, among firms that did and did not track outages
Figure 8: Number of outages reported per month, by customer type (rainy season)
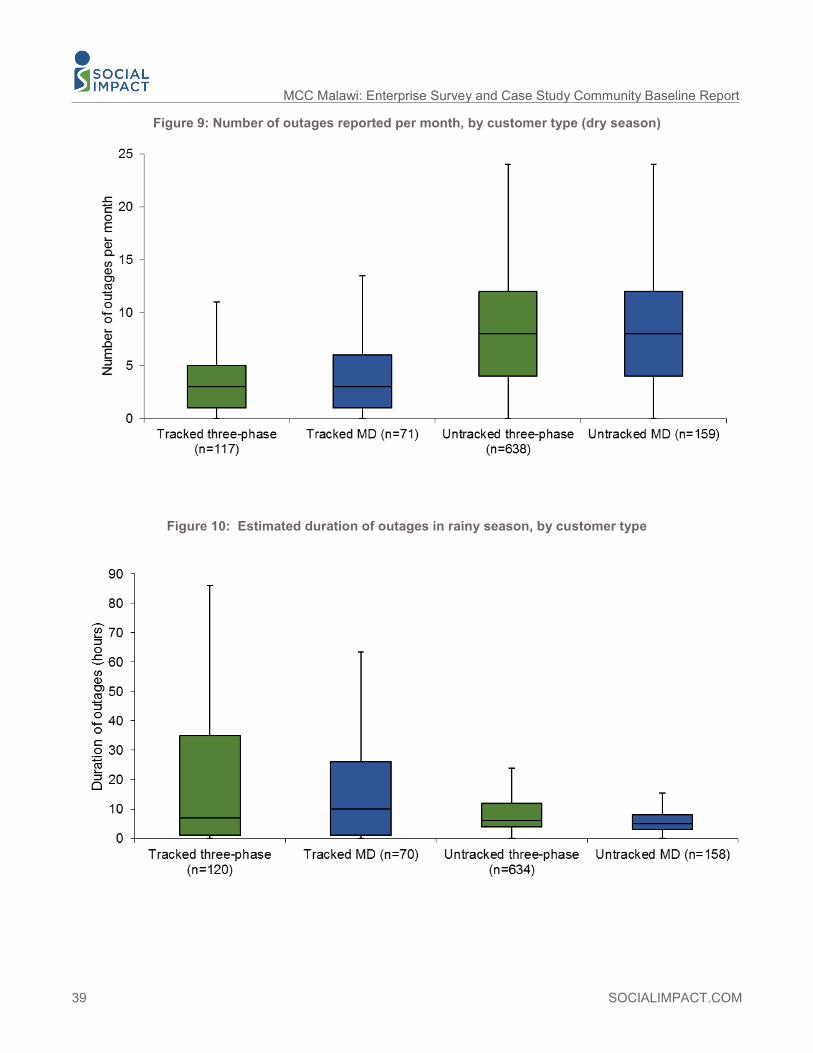
39 SOCIALIMPACT.COM
MCC Malawi: Enterprise Survey and Case Study Community Baseline Report
Figure 9: Number of outages reported per month, by customer type (dry season)
Figure 10: Estimated duration of outages in rainy season, by customer type

SOCIALIMPACT.COM 40
Figure 11: Estimated duration of outages in dry season, by customer type
6.2.2. Generator use
Generators are the most reliable way to mitigate the unpredictable impacts of outages, but only 25 percent of sampled firms reported using or owning generators (n=260). Most MD customers used generators (65 percent), compared to only 13 percent of three-phase customers. Larger firms were far more likely to use generators. Within our sample, only 2.5 percent of microenterprises had generators, compared to 22 percent of small firms, 62 percent of medium firms and 76 percent of large firms. Within our sample, 75 percent of respondents with a generator had only one generator, while the remaining 25 percent had two or more. MD customers were more likely to have more than one generator, with 21 percent having two generators, and 7 percent having three or more. In contrast, only 19 percent of three phase customers that owned generators had more than one generator.
Of the firms using generators, 95 percent owned their generator, and the remaining 5 percent either rented and/or shared their generators. The median MD firm reporting the purchase price for their generator paid approximately USD 6,000, while the median three-phase firm had paid about USD 643. Within our sample of firms with generators, 58 percent had a portable generator, which must be started manually, and 42 percent had standby generators which start automatically in the event of an outage.
Seventy-seven percent of firms with generators in our sample used them every time there is a power outage. As seen in Figure 12, the sampled firms that did not always use their generators (n=61) reported that the main reason was either because it is not cost-effective for prolonged outages (34 percent) or not cost effective for

41 SOCIALIMPACT.COM
MCC Malawi: Enterprise Survey and Case Study Community Baseline Report
short outages (25 percent). Others do not always use their generator because they are able to focus on non-electricity dependent activities (15 percent) or due to maintenance problems (8 percent).68
Figure 12: Main reasons firms do not always run their generator (n=61)
The cost of fuel is the largest expense associated with running a generator, and these costs are summarized in Table 12. Of the firms using generators in our sample, 30 percent tracked the fuel costs of operating their generator. As above and as shown in Figure 13, enterprises that do not track fuel costs might overreport expenditures. In the previous year, the median medium sized business reported spending $1,713 on generator fuel, while the median large business spent $4,012 a year. The median small business spent only $496 on generator fuel per year, while the median microenterprise spent almost double this amount: $835. The expenditures on generator fuel varied by region, with businesses in the South region spending the most ($2,254 at the median), followed by firms in the North (median=$1,518) and Central region (median=$1,291). MD customers spent significantly more than three-phase customers (median $3,585 vs. $974, respectively).
In addition to fuel, generator maintenance represents another significant expenditure for businesses – accounting for approximately 10% of costs associated with owning generators. In the previous year, the median large business spent a reported $686 to maintain their generator, the median medium business spent $202, small business - $95, and the median micro business spent $24 on maintaining their generators (see Table 12 and Figure 14). MD customers spent significantly more on generator maintenance ($538 at the median) than three-phase customers ($119 at the median). Expenditures on generator maintenance varied by region, following a similar pattern to that of fuel expenditures, with businesses in the South spending the most to maintain their generators (median of $1,640), followed by firms in the Central region (median of $239), while customers in the North spent the least ($95 at the median).
68 The mere presence of a generator should not suggest that such firms are able to fully mitigate the impact of outages. While there are firms that have the generation capacity to fully maintain operations when outages occur, these are the minority of generator owners. There are only 62 MD firms (25%) and 30 three-phase customers (4%) that report using a generator every time the power goes out and report that business continues with minimal effect. Qualitative interviews suggest that some MD manufacturing firms only use the generators to keep offices and security lights operating, not their manufacturing operations.
18%
8%
15%
25%
34%
0% 5% 10% 15% 20% 25% 30% 35% 40%
Other
Maintenance problems
Able to focus on non-electricity dependency
Not cost effective for short outages
Not cost effective for long outages

SOCIALIMPACT.COM 42
Table 12: Median annual generator costs by customer type, region, and firm size among surveyed firms reporting each type of cost (USD)
Figure 13: Generator fuel costs by customer type
Estimated Generator fuel costs
Generator fuel costs
(not tracked)
Generator fuel costs (tracked)
Generator maintenance
costs
Total generator
costs
n Median n Median n Median n Median n Median Customer
type Three Phase 96 $974 30 $1,127 66 $955 80 $119 98 $1,216
Customer type MD 146 $3,585 42 $5,834 104 $2,864 140 $538 150 $4,848
Region Central 96 $1,291 26 $2,568 70 $1,291 83 $239 97 $1,628
Region North 20 $1,518 8 $5,162 12 $1,518 17 $95 20 $1,661
Region South 126 $2,254 38 $2,182 88 $2,395 120 $288 131 $2,932
Firm Size Micro 11 $835 3 $1,866 8 $532 8 $24 11 $955
Firm Size Small 51 $496 20 $484 31 $622 41 $95 52 $681
Firm Size Medium 82 $1,713 31 $7,904 51 $1,249 79 $202 83 $2,137
Firm Size Large 69 $4,012 13 $2,148 56 $4,012 63 $686 70 $4,969
Total 242 $1,754 72 $2,182 170 $1,668 220 $239 248 $2,124
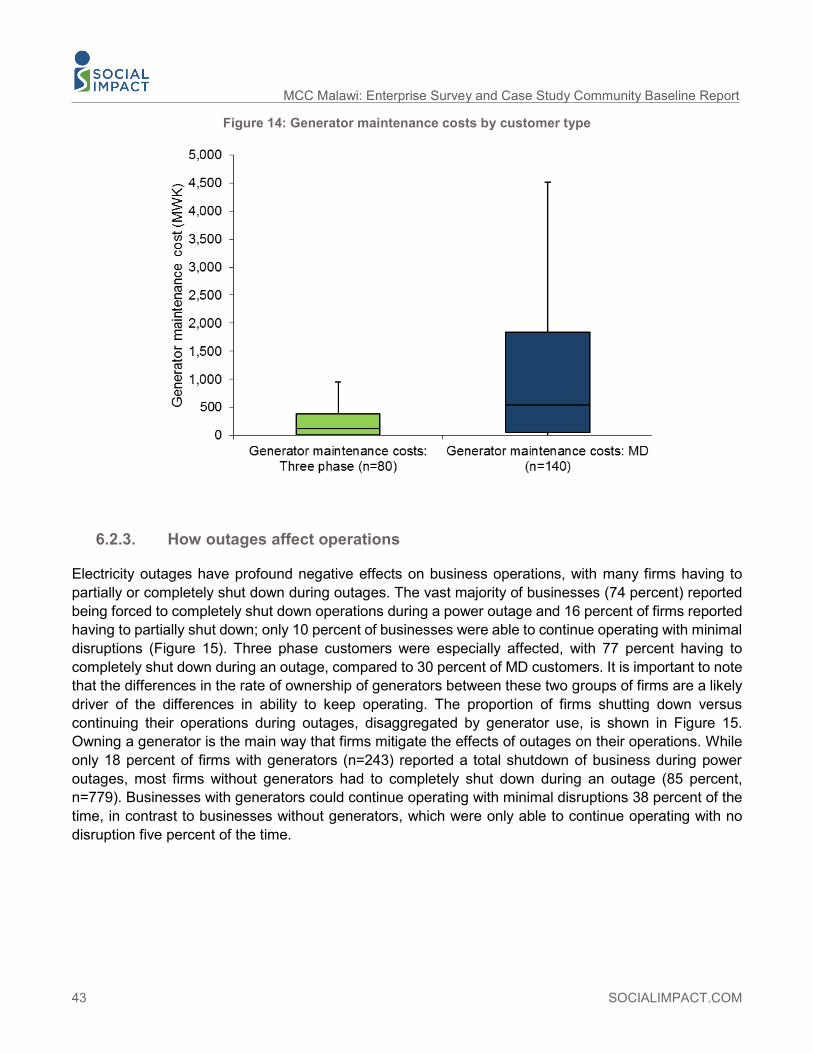
43 SOCIALIMPACT.COM
MCC Malawi: Enterprise Survey and Case Study Community Baseline Report
Figure 14: Generator maintenance costs by customer type
6.2.3. How outages affect operations
Electricity outages have profound negative effects on business operations, with many firms having to partially or completely shut down during outages. The vast majority of businesses (74 percent) reported being forced to completely shut down operations during a power outage and 16 percent of firms reported having to partially shut down; only 10 percent of businesses were able to continue operating with minimal disruptions (Figure 15). Three phase customers were especially affected, with 77 percent having to completely shut down during an outage, compared to 30 percent of MD customers. It is important to note that the differences in the rate of ownership of generators between these two groups of firms are a likely driver of the differences in ability to keep operating. The proportion of firms shutting down versus continuing their operations during outages, disaggregated by generator use, is shown in Figure 15. Owning a generator is the main way that firms mitigate the effects of outages on their operations. While only 18 percent of firms with generators (n=243) reported a total shutdown of business during power outages, most firms without generators had to completely shut down during an outage (85 percent, n=779). Businesses with generators could continue operating with minimal disruptions 38 percent of the time, in contrast to businesses without generators, which were only able to continue operating with no disruption five percent of the time.

SOCIALIMPACT.COM 44
Figure 15: Impact of power outages on business operations, by generator use
There were substantial differences in the rates of shut-down by firm size, mirroring the differences in generator use. Ninety-one percent of microenterprises were forced to totally shut down (Figure 16), as they were the least likely to have generators.
Figure 16: Impact of power outages on business operations, by firm size (n=961)
Outages can also affect business by causing delays in firms receiving inputs from suppliers, and negatively impacting the firms’ ability to deliver their own goods and services on time. Delays in inputs were a problem for a minority of firms: 15 percent of firms reported instances in the last year of their suppliers were delayed in delivering inputs due to power outages. Firms that were 100 percent foreign-owned were more likely to experience delays in supplier delivery. By contrast with inputs, outages substantially affected firms’ ability to provide goods and services to clients on time; 80 percent of firms were delayed in providing goods or services in the last year due to power outages. Table 13 presents

45 SOCIALIMPACT.COM
MCC Malawi: Enterprise Survey and Case Study Community Baseline Report
these findings disaggregated by generator status. Those with generators were much less likely to experience delays in providing goods or services to clients.
Table 13: Impact of outages on operations – delays, by generator use Total No Generator Has Generator
n % n % n % In the last 12 months, were there instances when suppliers were delayed in the delivery of inputs due to power outages?
991 15% 746 12% 245 28%
In thinking of the last 12 months, were there instances when your firm was delayed in providing goods or services to clients due to power outages?
1,012 80% 757 83% 255 65%
6.2.4. Outage Costs
As firms completely or partially shut down or switch to generators, they incur a variety of costs. In the 2014 ES conducted by WB, firms in Malawi reported 5 percent sales lost due to power outages, slightly lower than 5.5 percent across SSA countries and that in low income countries.69
As discussed above, generator fuel and maintenance costs are a major cost of outages. Table 14 summarizes the annual generator costs by customer type for those firms that operate generators. The fuel costs are the main cost of operating the generator, with the median annual cost of fuel $993 for three-phase customers and $3,585 for MD customers. Annual maintenance costs are about one eighth that amount, with the total costs of operating a generator in the last year approximately $1,235 for the median three phase customer and $4,923 for the median MD customer. While these are substantial amounts, generators costs represent only 1% of total costs for the median firm. Consist with the findings above on generator use, this suggests that the median generator-owning firm is not using generators as a full substitute for ESCOM generated electricity.
Table 14: Median annual generator costs for firms with generators, by customer type
Generator costs Three-phase MD All firms Fuel costs n 96 146 242 Fuel costs Median $974 $3,585 $1,754 Maintenance costs n 80 140 220 Maintenance costs Median $119 $538 $231
Total Generator costs n 98 150 248
Median $1,215 $4,848 $2,124 Generator costs as % of total costs
n 70 99 169 Median 2% 1% 1%
69 The World Bank. 2015. Malawi: Country Profile 2014. Washington DC: The World Bank. This statistic was based on a single question asking firms to assess their losses due to power outages. Given the lack of tracking found in our survey, we suspect that this statistic has considerable measurement error.
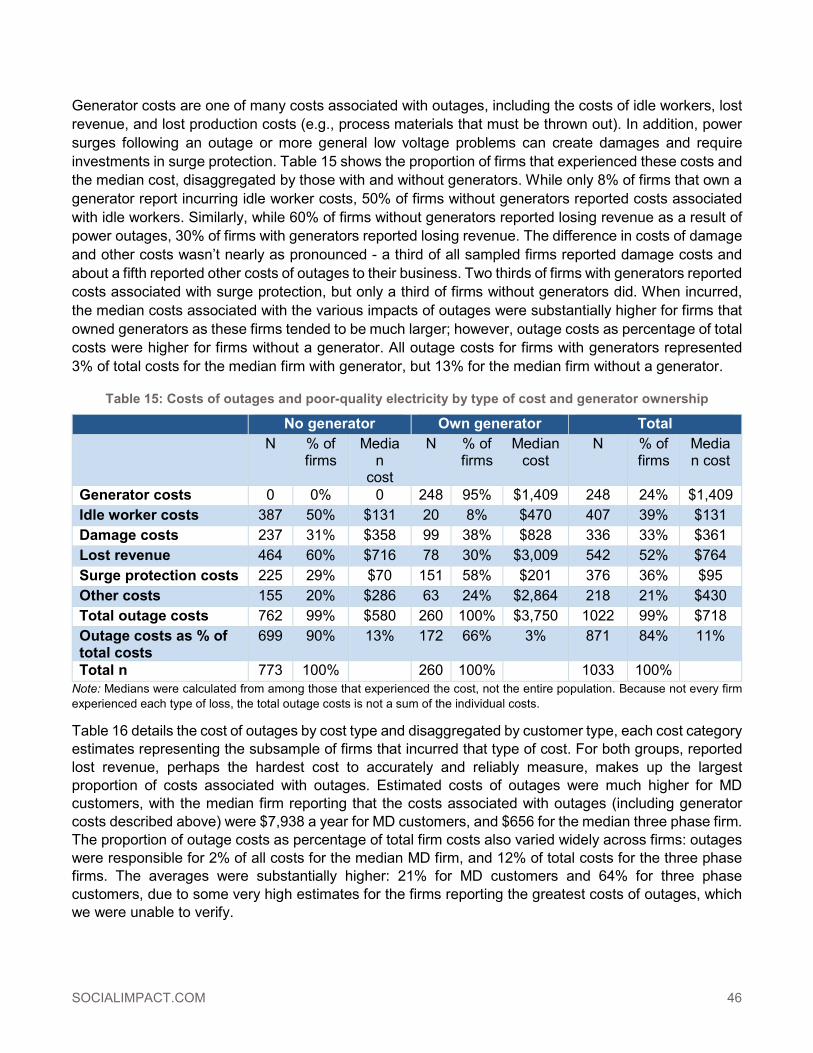
SOCIALIMPACT.COM 46
Generator costs are one of many costs associated with outages, including the costs of idle workers, lost revenue, and lost production costs (e.g., process materials that must be thrown out). In addition, power surges following an outage or more general low voltage problems can create damages and require investments in surge protection. Table 15 shows the proportion of firms that experienced these costs and the median cost, disaggregated by those with and without generators. While only 8% of firms that own a generator report incurring idle worker costs, 50% of firms without generators reported costs associated with idle workers. Similarly, while 60% of firms without generators reported losing revenue as a result of power outages, 30% of firms with generators reported losing revenue. The difference in costs of damage and other costs wasn’t nearly as pronounced - a third of all sampled firms reported damage costs and about a fifth reported other costs of outages to their business. Two thirds of firms with generators reported costs associated with surge protection, but only a third of firms without generators did. When incurred, the median costs associated with the various impacts of outages were substantially higher for firms that owned generators as these firms tended to be much larger; however, outage costs as percentage of total costs were higher for firms without a generator. All outage costs for firms with generators represented 3% of total costs for the median firm with generator, but 13% for the median firm without a generator.
Table 15: Costs of outages and poor-quality electricity by type of cost and generator ownership
No generator Own generator Total N % of
firms Media
n cost
N % of firms
Median cost
N % of firms
Median cost
Generator costs 0 0% 0 248 95% $1,409 248 24% $1,409 Idle worker costs 387 50% $131 20 8% $470 407 39% $131 Damage costs 237 31% $358 99 38% $828 336 33% $361 Lost revenue 464 60% $716 78 30% $3,009 542 52% $764 Surge protection costs 225 29% $70 151 58% $201 376 36% $95 Other costs 155 20% $286 63 24% $2,864 218 21% $430 Total outage costs 762 99% $580 260 100% $3,750 1022 99% $718 Outage costs as % of total costs
699 90% 13% 172 66% 3% 871 84% 11%
Total n 773 100%
260 100%
1033 100%
Note: Medians were calculated from among those that experienced the cost, not the entire population. Because not every firm experienced each type of loss, the total outage costs is not a sum of the individual costs.
Table 16 details the cost of outages by cost type and disaggregated by customer type, each cost category estimates representing the subsample of firms that incurred that type of cost. For both groups, reported lost revenue, perhaps the hardest cost to accurately and reliably measure, makes up the largest proportion of costs associated with outages. Estimated costs of outages were much higher for MD customers, with the median firm reporting that the costs associated with outages (including generator costs described above) were $7,938 a year for MD customers, and $656 for the median three phase firm. The proportion of outage costs as percentage of total firm costs also varied widely across firms: outages were responsible for 2% of all costs for the median MD firm, and 12% of total costs for the three phase firms. The averages were substantially higher: 21% for MD customers and 64% for three phase customers, due to some very high estimates for the firms reporting the greatest costs of outages, which we were unable to verify.
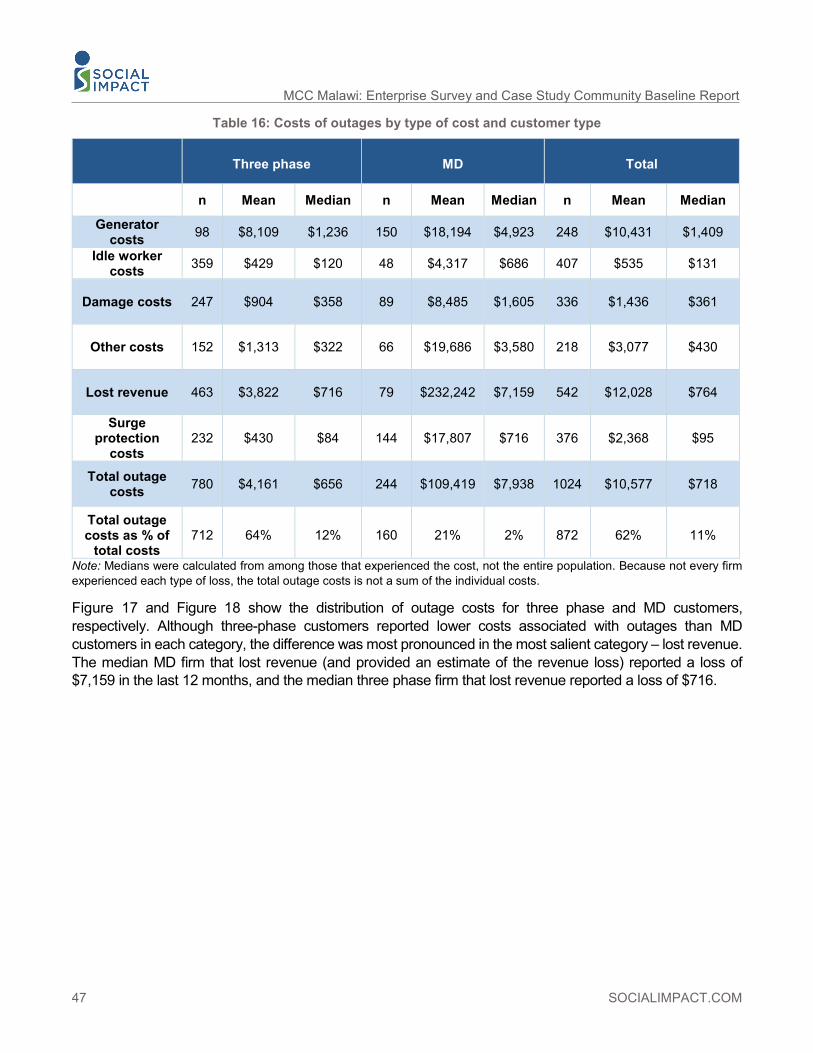
47 SOCIALIMPACT.COM
MCC Malawi: Enterprise Survey and Case Study Community Baseline Report
Table 16: Costs of outages by type of cost and customer type
Three phase MD Total
n Mean Median n Mean Median n Mean Median
Generator costs 98 $8,109 $1,236 150 $18,194 $4,923 248 $10,431 $1,409
Idle worker costs 359 $429 $120 48 $4,317 $686 407 $535 $131
Damage costs 247 $904 $358 89 $8,485 $1,605 336 $1,436 $361
Other costs 152 $1,313 $322 66 $19,686 $3,580 218 $3,077 $430
Lost revenue 463 $3,822 $716 79 $232,242 $7,159 542 $12,028 $764
Surge protection
costs 232 $430 $84 144 $17,807 $716 376 $2,368 $95
Total outage costs 780 $4,161 $656 244 $109,419 $7,938 1024 $10,577 $718
Total outage costs as % of
total costs 712 64% 12% 160 21% 2% 872 62% 11%
Note: Medians were calculated from among those that experienced the cost, not the entire population. Because not every firm experienced each type of loss, the total outage costs is not a sum of the individual costs.
Figure 17 and Figure 18 show the distribution of outage costs for three phase and MD customers, respectively. Although three-phase customers reported lower costs associated with outages than MD customers in each category, the difference was most pronounced in the most salient category – lost revenue. The median MD firm that lost revenue (and provided an estimate of the revenue loss) reported a loss of $7,159 in the last 12 months, and the median three phase firm that lost revenue reported a loss of $716.

SOCIALIMPACT.COM 48
Figure 17: Distribution of outage costs by type for Three Phase customers
Figure 18: Distribution of outage costs by type for MD customers
The cost of idle workers during outages were the second most commonly cited outage cost. 59 percent of firms reported that their firm bears the cost of idle workers during an outage, while 22 percent of firms (almost entirely three phase firms) reported that workers made up the lost time later. Of the subsample of firms that were able to provide an estimate of how much idle workers cost their firms (n=407), the median cost was $686 for the generally larger MD customers and $429 for three-phase customers.
Approximately a third of the firms surveyed reported experiencing damage to equipment in the last 12 months due to electricity issues. Of the sub-sample of firms that provided estimates of the damage costs (n=336), the cost of fixing or replacing items damaged from power outages was $1,605 for the median MD firm that incurred damages in the last year and$358 for the median three-phase firm.
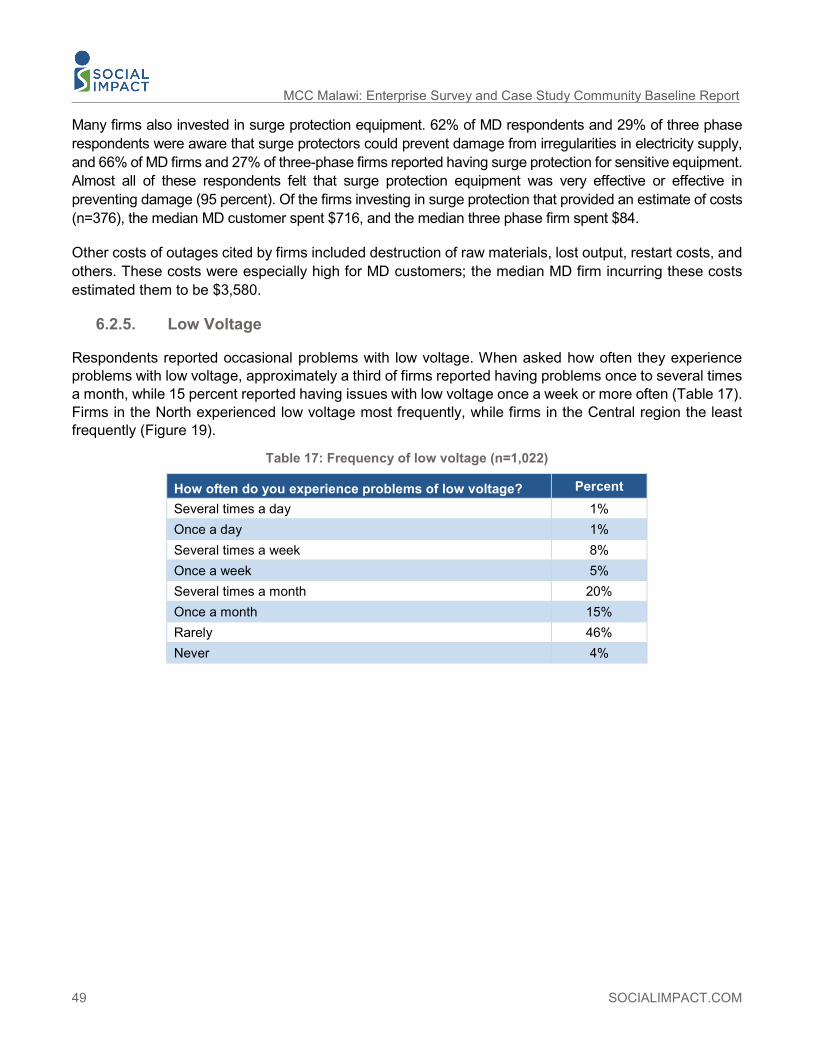
49 SOCIALIMPACT.COM
MCC Malawi: Enterprise Survey and Case Study Community Baseline Report
Many firms also invested in surge protection equipment. 62% of MD respondents and 29% of three phase respondents were aware that surge protectors could prevent damage from irregularities in electricity supply, and 66% of MD firms and 27% of three-phase firms reported having surge protection for sensitive equipment. Almost all of these respondents felt that surge protection equipment was very effective or effective in preventing damage (95 percent). Of the firms investing in surge protection that provided an estimate of costs (n=376), the median MD customer spent $716, and the median three phase firm spent $84.
Other costs of outages cited by firms included destruction of raw materials, lost output, restart costs, and others. These costs were especially high for MD customers; the median MD firm incurring these costs estimated them to be $3,580.
6.2.5. Low Voltage
Respondents reported occasional problems with low voltage. When asked how often they experience problems with low voltage, approximately a third of firms reported having problems once to several times a month, while 15 percent reported having issues with low voltage once a week or more often (Table 17). Firms in the North experienced low voltage most frequently, while firms in the Central region the least frequently (Figure 19).
Table 17: Frequency of low voltage (n=1,022)
How often do you experience problems of low voltage? Percent Several times a day 1% Once a day 1% Several times a week 8% Once a week 5% Several times a month 20% Once a month 15% Rarely 46% Never 4%
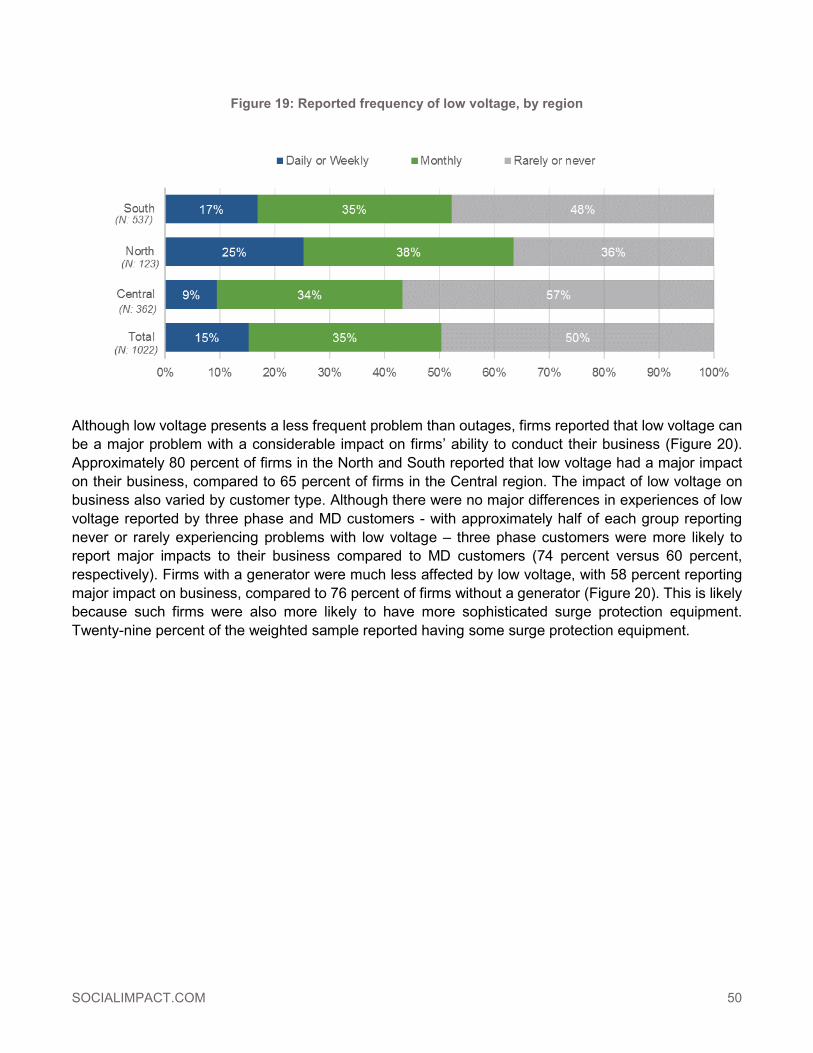
SOCIALIMPACT.COM 50
Figure 19: Reported frequency of low voltage, by region
Although low voltage presents a less frequent problem than outages, firms reported that low voltage can be a major problem with a considerable impact on firms’ ability to conduct their business (Figure 20). Approximately 80 percent of firms in the North and South reported that low voltage had a major impact on their business, compared to 65 percent of firms in the Central region. The impact of low voltage on business also varied by customer type. Although there were no major differences in experiences of low voltage reported by three phase and MD customers - with approximately half of each group reporting never or rarely experiencing problems with low voltage – three phase customers were more likely to report major impacts to their business compared to MD customers (74 percent versus 60 percent, respectively). Firms with a generator were much less affected by low voltage, with 58 percent reporting major impact on business, compared to 76 percent of firms without a generator (Figure 20). This is likely because such firms were also more likely to have more sophisticated surge protection equipment. Twenty-nine percent of the weighted sample reported having some surge protection equipment.
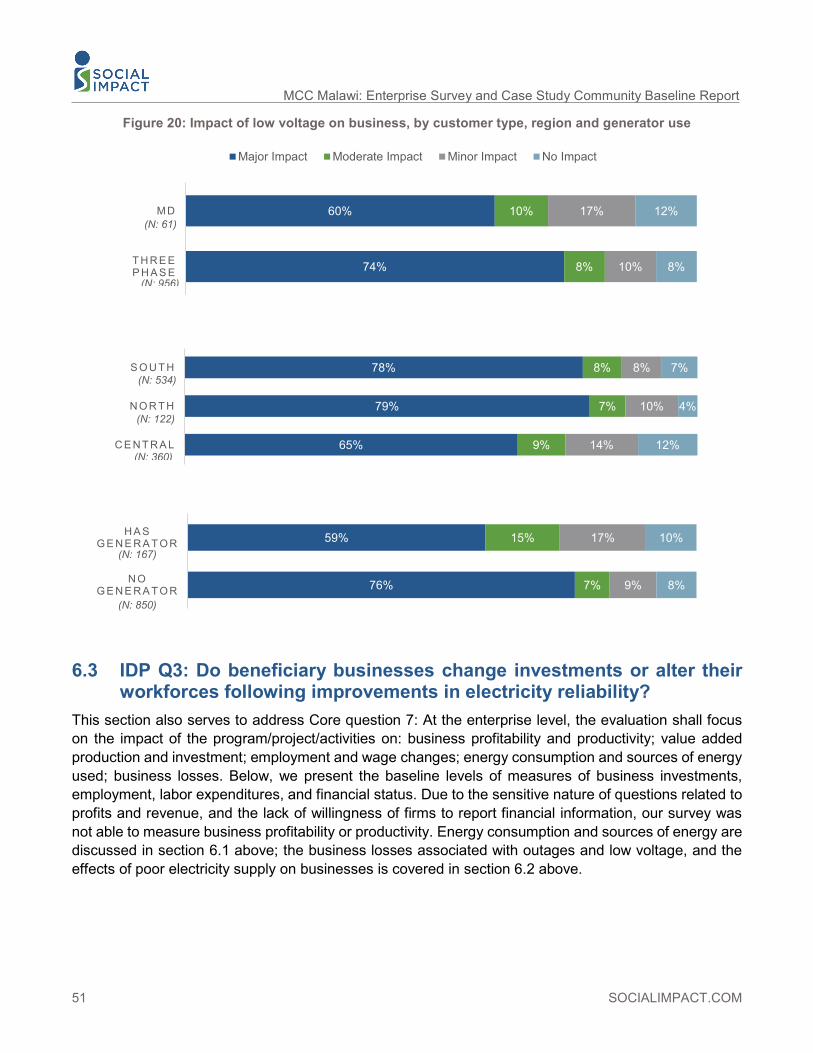
51 SOCIALIMPACT.COM
MCC Malawi: Enterprise Survey and Case Study Community Baseline Report
Figure 20: Impact of low voltage on business, by customer type, region and generator use
6.3 IDP Q3: Do beneficiary businesses change investments or alter their workforces following improvements in electricity reliability?
This section also serves to address Core question 7: At the enterprise level, the evaluation shall focus on the impact of the program/project/activities on: business profitability and productivity; value added production and investment; employment and wage changes; energy consumption and sources of energy used; business losses. Below, we present the baseline levels of measures of business investments, employment, labor expenditures, and financial status. Due to the sensitive nature of questions related to profits and revenue, and the lack of willingness of firms to report financial information, our survey was not able to measure business profitability or productivity. Energy consumption and sources of energy are discussed in section 6.1 above; the business losses associated with outages and low voltage, and the effects of poor electricity supply on businesses is covered in section 6.2 above.
65%
79%
78%
9%
7%
8%
14%
10%
8%
12%
4%
7%
C E N T R A L
N O R T H
S O U T H
(N: 360)
(N: 534)
(N: 122)
76%
59%
7%
15%
9%
17%
8%
10%
N O G E N E R A T O R
H A S G E N E R A T O R
(N: 850)
(N: 167)
74%
60%
8%
10%
10%
17%
8%
12%
T H R E E P H A S E
MD
Major Impact Moderate Impact Minor Impact No Impact
(N: 956)
(N: 61)

SOCIALIMPACT.COM 52
6.3.1. Capital Investments
About a third of firms reported making substantial new investments in the previous year, including 33% of three phase firms and 44% of MD firms. Large firms were more likely to invest: 71% of firms with with at least 100 employees, compared to 25% of the firms with fewer than 5 employees. Domestic firms were slightly more likely to invest (34% did so), compared to foreign owned firms (30%). There were no substantial differences in investment by sex of respondent.
Figure 21 shows the types of capital investments made by firms that invested. The most popular investment was purchasing or renting new equipment or tools (44 percent of firms that made an investment) or building new structures (40 percent), followed by purchasing or renting additional land (26 percent), upgrading existing structures (22 percent) and hiring more workers (21 percent). There were substantial differences by customer type, with MD firms more likely to make investments in the purchase of new equipment and hiring workers compared to three phase firms. The median value of capital investment was $4,916 for three phase firms and $37,515 for MD firms (Figure 22).70
Figure 21: Proportion of firms reporting capital investment by type of investment, by customer type
70 Values reported in Malawian Kwacha were converted to U.S. dollars via an average daily exchange rate based on each firm's reported financial year(s). The historical daily exchange rate was found at http://www.exchangerates.org.uk/USD-MWK-exchange-rate-history-full.html#.

53 SOCIALIMPACT.COM
MCC Malawi: Enterprise Survey and Case Study Community Baseline Report
Figure 22: Total capital investment, by customer type
When asked why it was a good time to invest, the majority of respondents among the firms that invested reported the main reason they did so was high demand or access to markets: 69 percent of MD firms and 63 percent of three phase firms (Figure 23). The second most salient reason depended on the customer type. For MD firms, high internal capacity of the firm was the most common reason to invest, cited by 44 percent, while for three phase firms access to financing was the second most cited reason (cited by 39 percent of firms). Only one percent of MD customers and five percent of three phase customers cited reliable electricity as a main driver of their investment.

SOCIALIMPACT.COM 54
Figure 23: Reasons why firms chose to make new capital investments
We asked respondents whose firms did not make capital investments why they chose not to do so (Figure 24). The most common reasons why firms had not made new investments were lack of access to finance (45 percent), and a low demand or access to markets (39 percent). 20 percent of three-phase firms cited the poor reliability of electricity supply as a reason not to make investments. In contrast to three-phase customers, a large fraction of MD customers (31 percent) cited poor macroeconomic/political climate as a major reason they did not make new capital investments. Three-phase customers were more likely than MD customers to cite lack of access to finance or to markets as an explanation.

55 SOCIALIMPACT.COM
MCC Malawi: Enterprise Survey and Case Study Community Baseline Report
Figure 24: Reasons why firms chose not to make new capital investments
While reliability of electricity was a factor in investment decisions by the surveyed firms, it is one of many factors driving the decision to invest. To further explore the role that electricity plays in investment decisions, we ran a simple bivariate cross-tabulation between satisfaction with electricity and investment choice and observed no significant relationship between the two variables. While this echoes the findings presented here, it is possible that existing and new firms or potential investors would be more likely to make business investments in an improved electricity environment.
6.3.2. Employment and Labor Costs
The survey collected information on labor expenditures, and the number of permanent and part-time/temporary employees for the end of the previous calendar year and the full-time employment figures for the year before that.71
Table 18 presents the baseline employment figures for the firms. At the end of the previous calendar year, the firms in our sample reported a median of 4 employees, and a mean of 36. This was up from a mean of 34 in the previous year, although the median remained the same. The median MD firm grew from 54 employees in the previous year, to 60 employees in the most recent calendar year. The median three phase firm remained stable at three full time employees, and the mean number of employees rose only negligibly from 10.4 to 10.6.
71 Depending on when the survey was conducted, this could either yield numbers for 2014/2015 or 2013/2014.
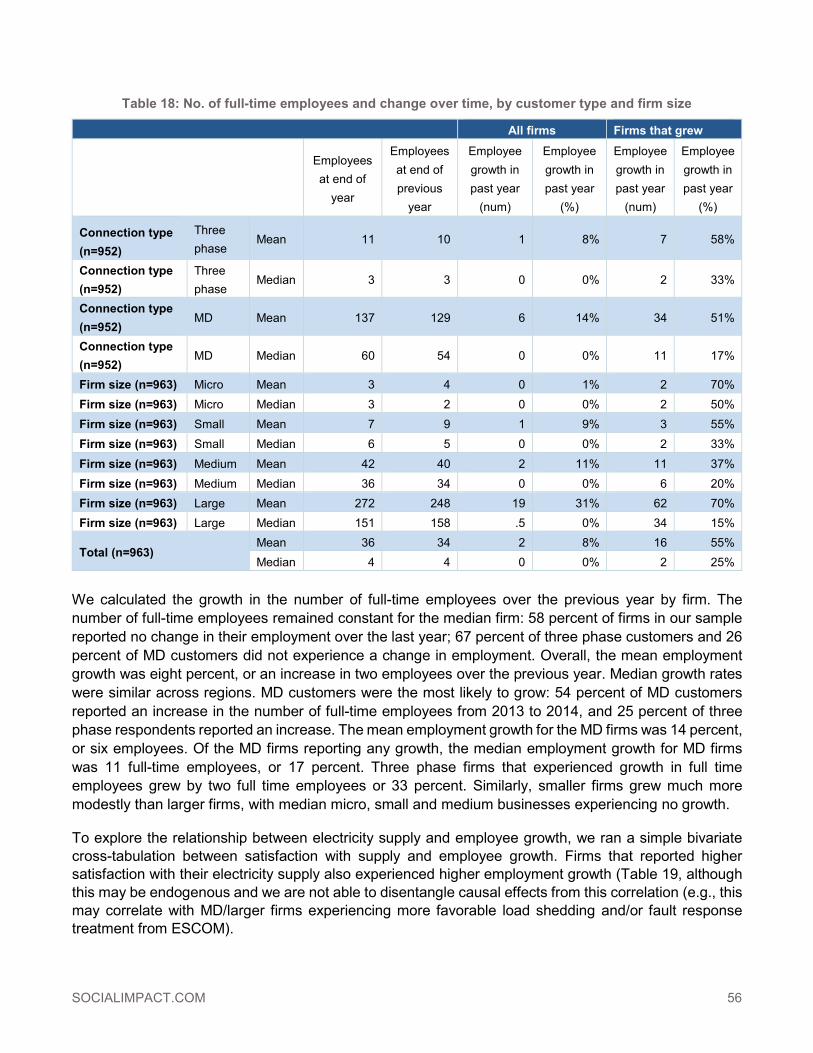
SOCIALIMPACT.COM 56
Table 18: No. of full-time employees and change over time, by customer type and firm size All firms Firms that grew
Employees at end of
year
Employees at end of previous
year
Employee growth in past year
(num)
Employee growth in past year
(%)
Employee growth in past year
(num)
Employee growth in past year
(%)
Connection type (n=952)
Three phase
Mean 11 10 1 8% 7 58%
Connection type (n=952)
Three phase
Median 3 3 0 0% 2 33%
Connection type (n=952)
MD Mean 137 129 6 14% 34 51%
Connection type (n=952)
MD Median 60 54 0 0% 11 17%
Firm size (n=963) Micro Mean 3 4 0 1% 2 70% Firm size (n=963) Micro Median 3 2 0 0% 2 50% Firm size (n=963) Small Mean 7 9 1 9% 3 55% Firm size (n=963) Small Median 6 5 0 0% 2 33%
Firm size (n=963) Medium Mean 42 40 2 11% 11 37% Firm size (n=963) Medium Median 36 34 0 0% 6 20% Firm size (n=963) Large Mean 272 248 19 31% 62 70% Firm size (n=963) Large Median 151 158 .5 0% 34 15%
Total (n=963) Mean 36 34 2 8% 16 55% Median 4 4 0 0% 2 25%
We calculated the growth in the number of full-time employees over the previous year by firm. The number of full-time employees remained constant for the median firm: 58 percent of firms in our sample reported no change in their employment over the last year; 67 percent of three phase customers and 26 percent of MD customers did not experience a change in employment. Overall, the mean employment growth was eight percent, or an increase in two employees over the previous year. Median growth rates were similar across regions. MD customers were the most likely to grow: 54 percent of MD customers reported an increase in the number of full-time employees from 2013 to 2014, and 25 percent of three phase respondents reported an increase. The mean employment growth for the MD firms was 14 percent, or six employees. Of the MD firms reporting any growth, the median employment growth for MD firms was 11 full-time employees, or 17 percent. Three phase firms that experienced growth in full time employees grew by two full time employees or 33 percent. Similarly, smaller firms grew much more modestly than larger firms, with median micro, small and medium businesses experiencing no growth.
To explore the relationship between electricity supply and employee growth, we ran a simple bivariate cross-tabulation between satisfaction with supply and employee growth. Firms that reported higher satisfaction with their electricity supply also experienced higher employment growth (Table 19, although this may be endogenous and we are not able to disentangle causal effects from this correlation (e.g., this may correlate with MD/larger firms experiencing more favorable load shedding and/or fault response treatment from ESCOM).
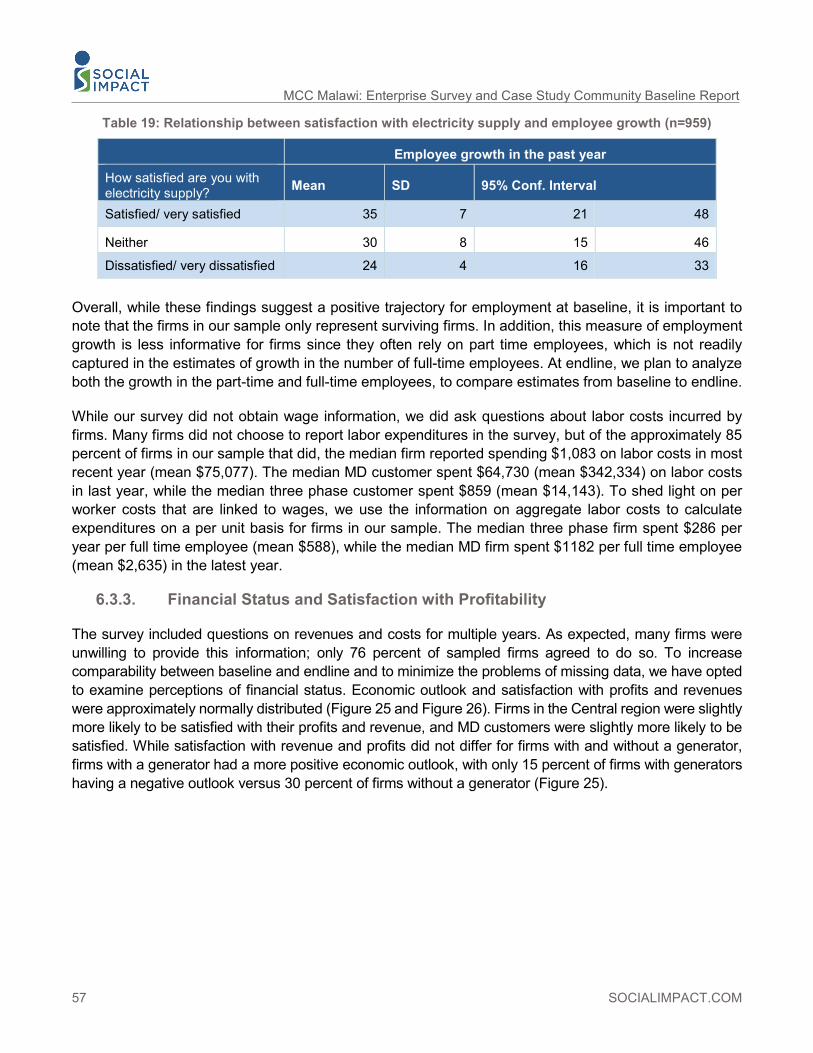
57 SOCIALIMPACT.COM
MCC Malawi: Enterprise Survey and Case Study Community Baseline Report
Table 19: Relationship between satisfaction with electricity supply and employee growth (n=959)
Employee growth in the past year
How satisfied are you with electricity supply? Mean SD 95% Conf. Interval
Satisfied/ very satisfied 35 7 21 48
Neither 30 8 15 46
Dissatisfied/ very dissatisfied 24 4 16 33
Overall, while these findings suggest a positive trajectory for employment at baseline, it is important to note that the firms in our sample only represent surviving firms. In addition, this measure of employment growth is less informative for firms since they often rely on part time employees, which is not readily captured in the estimates of growth in the number of full-time employees. At endline, we plan to analyze both the growth in the part-time and full-time employees, to compare estimates from baseline to endline.
While our survey did not obtain wage information, we did ask questions about labor costs incurred by firms. Many firms did not choose to report labor expenditures in the survey, but of the approximately 85 percent of firms in our sample that did, the median firm reported spending $1,083 on labor costs in most recent year (mean $75,077). The median MD customer spent $64,730 (mean $342,334) on labor costs in last year, while the median three phase customer spent $859 (mean $14,143). To shed light on per worker costs that are linked to wages, we use the information on aggregate labor costs to calculate expenditures on a per unit basis for firms in our sample. The median three phase firm spent $286 per year per full time employee (mean $588), while the median MD firm spent $1182 per full time employee (mean $2,635) in the latest year.
6.3.3. Financial Status and Satisfaction with Profitability
The survey included questions on revenues and costs for multiple years. As expected, many firms were unwilling to provide this information; only 76 percent of sampled firms agreed to do so. To increase comparability between baseline and endline and to minimize the problems of missing data, we have opted to examine perceptions of financial status. Economic outlook and satisfaction with profits and revenues were approximately normally distributed (Figure 25 and Figure 26). Firms in the Central region were slightly more likely to be satisfied with their profits and revenue, and MD customers were slightly more likely to be satisfied. While satisfaction with revenue and profits did not differ for firms with and without a generator, firms with a generator had a more positive economic outlook, with only 15 percent of firms with generators having a negative outlook versus 30 percent of firms without a generator (Figure 25).
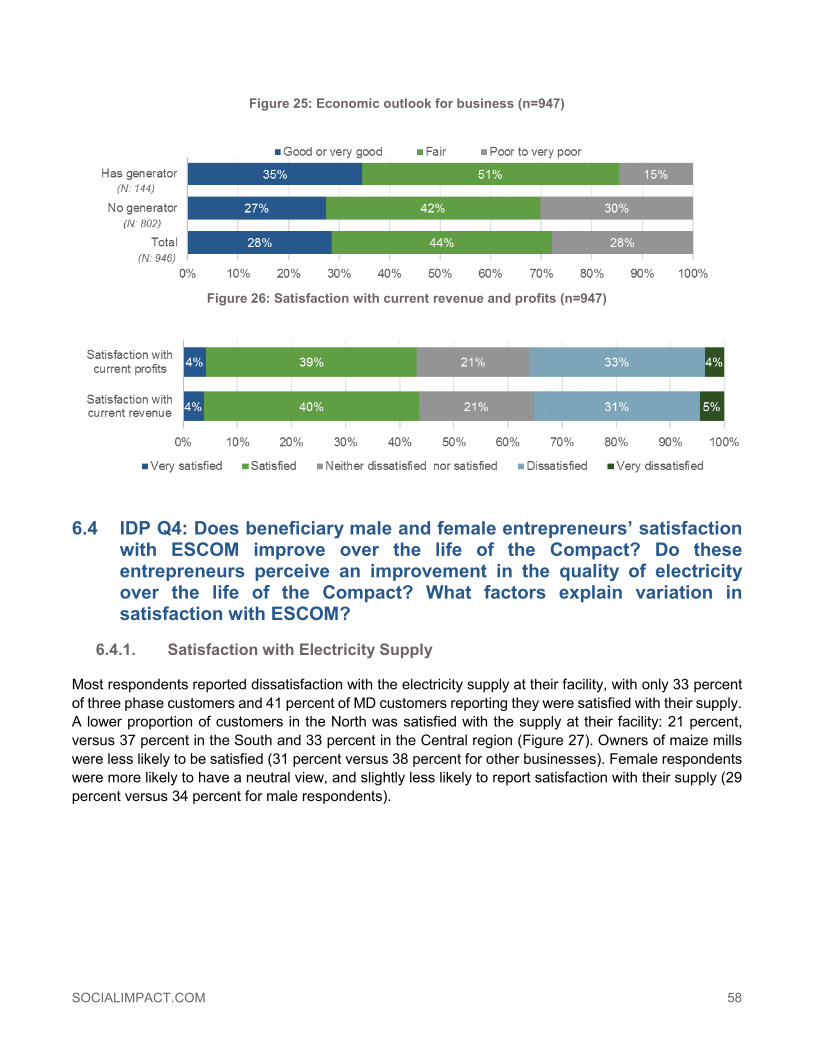
SOCIALIMPACT.COM 58
Figure 25: Economic outlook for business (n=947)
Figure 26: Satisfaction with current revenue and profits (n=947)
6.4 IDP Q4: Does beneficiary male and female entrepreneurs’ satisfaction with ESCOM improve over the life of the Compact? Do these entrepreneurs perceive an improvement in the quality of electricity over the life of the Compact? What factors explain variation in satisfaction with ESCOM?
6.4.1. Satisfaction with Electricity Supply
Most respondents reported dissatisfaction with the electricity supply at their facility, with only 33 percent of three phase customers and 41 percent of MD customers reporting they were satisfied with their supply. A lower proportion of customers in the North was satisfied with the supply at their facility: 21 percent, versus 37 percent in the South and 33 percent in the Central region (Figure 27). Owners of maize mills were less likely to be satisfied (31 percent versus 38 percent for other businesses). Female respondents were more likely to have a neutral view, and slightly less likely to report satisfaction with their supply (29 percent versus 34 percent for male respondents).

59 SOCIALIMPACT.COM
MCC Malawi: Enterprise Survey and Case Study Community Baseline Report
Figure 27: Satisfaction with electricity supply at facility
6.4.2. Satisfaction with ESCOM
Firms expressed high levels of dissatisfaction with ESCOM. Nearly two-thirds of respondents (n=1,022) were either dissatisfied (41 percent) or very dissatisfied (21 percent). Respondents were more dissatisfied with ESCOM than any other utility, including the Roads Authority, Water Board, and Malawi Telecommunications. Figure 28 reports percentage of respondents who reported being dissatisfied or very dissatisfied with ESCOM and other utilities. These findings are consistent with a survey of maximum demand customers conducted by ESCOM in 2013, which found that MD customers are dissatisfied with the service offered and are in the authors terminology “disloyal” to ESCOM. The level of loyalty was moderated by level of consumption – large consumers were less disloyal than small consumers.72
Figure 28: Dissatisfaction with ESCOM and other utilities
72 Loyalty is a composite measure of six concepts, including repeat patronage, self-stated retention, price insensitivity, resistance to counter persuasion, and the likelihood of spreading positive word of mouth information. Chodzaza, Gilbert E. & Gombachika, Harry S. H. “Service quality, customer satisfaction and loyalty among industrial customers of a public electricity utility in Malawi.” International Journal of Energy Sector Management, Vol. 7, no. 2, 2013: 269-282.

SOCIALIMPACT.COM 60
Satisfaction with ESCOM was very similar across customer types, did not vary across firms with and without generators and was similar for male and female respondents. Satisfaction with ESCOM did differ somewhat by region, with customers in the South reporting higher rates of satisfaction with ESCOM than those in other regions (Figure 29).
Figure 29: Satisfaction with ESCOM by region
To explain variation in satisfaction with ESCOM we tested a number of factors using ordinal logistic and logistic regression. Regression analysis allows us to isolate the correlation of each factor with perceptions of ESCOM satisfaction while holding other, potentially confounding factors constant.
We focused on the following categories of explanatory variables:
• Satisfaction with the supply of electricity • Other aspects of ESCOM service, including frequency of low voltage, perceptions of changes in
electricity service, evaluations of ESCOM’s response to faults, evaluations of ESCOM’s communication, experiences with billing issues
• Perception of corruption in ESCOM • Perceptions of the fairness of the tariff • Attributes of the firm, including location, size, ownership, type of firm, type of connection, and use
of a generator • Attributes of the respondent, including gender, education, and age
Full regression results are presented in Annex 11.1, which shows three models exploring variation in responses to the question: “How satisfied are you with the Electricity Supply Corporation of Malawi (ESCOM)?” Models 1 and 2 use ordinal logistic regression to explain variation between those who are (a) satisfied or very satisfied, (b) neither dissatisfied or satisfied, (c) dissatisfied, or (d) very dissatisfied.73 Model 1 includes all theoretically relevant variables, and Model 2 excludes two variables - size of the firm and industrial line - because missing data for these variables could introduce sampling bias. Model 3 uses a logistic regression to explain why respondents are either (a) very satisfied, satisfied, or neither or (b) dissatisfied or very dissatisfied. While there are some minor differences between the three models they generally produce similar results. For ease of interpretation, in Table 20, we present predicted probabilities for the variables in the analysis that are statistically significant in Model 3. The predicted 73 Very satisfied and satisfied were combined given the relatively small number of respondents who were very satisfied.
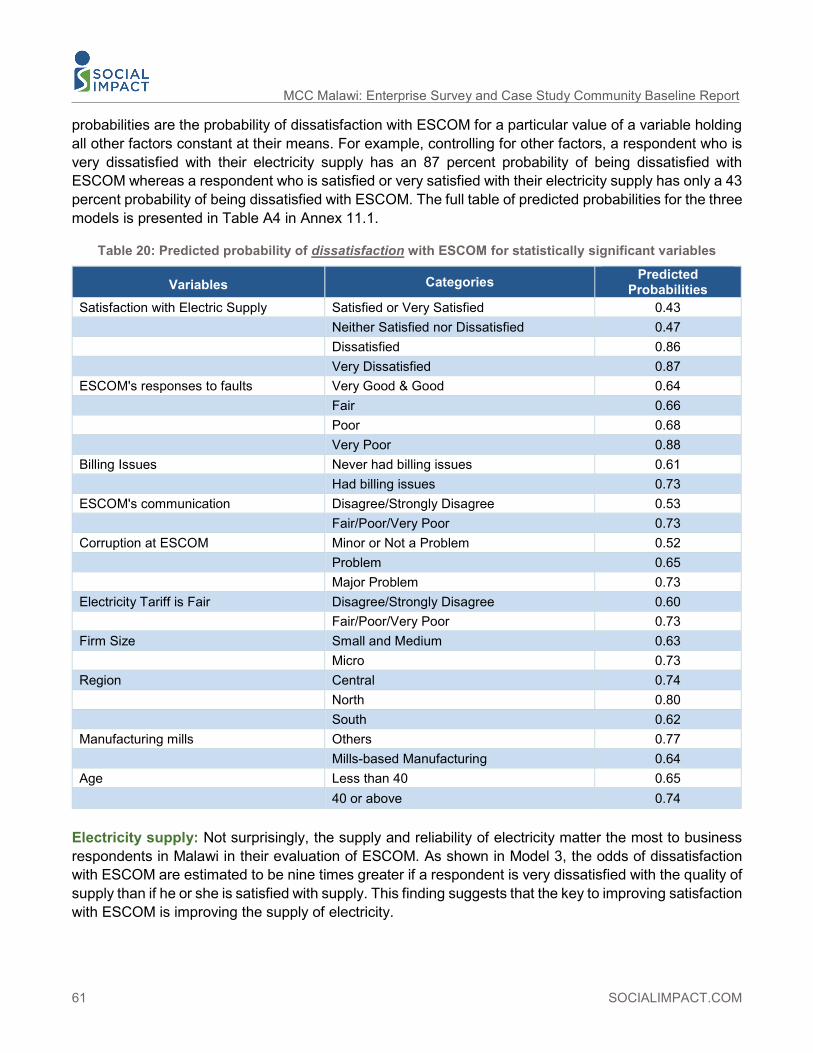
61 SOCIALIMPACT.COM
MCC Malawi: Enterprise Survey and Case Study Community Baseline Report
probabilities are the probability of dissatisfaction with ESCOM for a particular value of a variable holding all other factors constant at their means. For example, controlling for other factors, a respondent who is very dissatisfied with their electricity supply has an 87 percent probability of being dissatisfied with ESCOM whereas a respondent who is satisfied or very satisfied with their electricity supply has only a 43 percent probability of being dissatisfied with ESCOM. The full table of predicted probabilities for the three models is presented in Table A4 in Annex 11.1.
Table 20: Predicted probability of dissatisfaction with ESCOM for statistically significant variables
Variables Categories Predicted Probabilities
Satisfaction with Electric Supply Satisfied or Very Satisfied 0.43 Neither Satisfied nor Dissatisfied 0.47 Dissatisfied 0.86 Very Dissatisfied 0.87
ESCOM's responses to faults Very Good & Good 0.64 Fair 0.66 Poor 0.68 Very Poor 0.88
Billing Issues Never had billing issues 0.61 Had billing issues 0.73 ESCOM's communication Disagree/Strongly Disagree 0.53
Fair/Poor/Very Poor 0.73 Corruption at ESCOM Minor or Not a Problem 0.52
Problem 0.65 Major Problem 0.73
Electricity Tariff is Fair Disagree/Strongly Disagree 0.60 Fair/Poor/Very Poor 0.73 Firm Size Small and Medium 0.63
Micro 0.73 Region Central 0.74
North 0.80 South 0.62
Manufacturing mills Others 0.77 Mills-based Manufacturing 0.64
Age Less than 40 0.65 40 or above 0.74
Electricity supply: Not surprisingly, the supply and reliability of electricity matter the most to business respondents in Malawi in their evaluation of ESCOM. As shown in Model 3, the odds of dissatisfaction with ESCOM are estimated to be nine times greater if a respondent is very dissatisfied with the quality of supply than if he or she is satisfied with supply. This finding suggests that the key to improving satisfaction with ESCOM is improving the supply of electricity.

SOCIALIMPACT.COM 62
Other aspects of ESCOM service: The quality of electricity, measured by the frequency of voltage problems has a weak and generally statistically insignificant relationship with satisfaction, as does perceptions of whether the electricity situation has improved. This latter finding is concerning, as it suggests that customers’ views towards ESCOM might be based on many years of less than ideal service. If so, it might take several years of consistent improvements for perceptions of ESCOM to change.
The predicted probabilities are the probability of dissatisfaction with ESCOM for a particular value of a variable, holding all other factors constant at their means. For example, controlling for other factors, a respondent who is very dissatisfied with their electricity supply has an 87 percent probability of being dissatisfied with ESCOM whereas a respondent who is satisfied or very satisfied with their electricity supply has only a 43 percent probability of being dissatisfied with ESCOM. The full table of predicted probability for the three models is presented in Table A4 in Annex 11.1.
ESCOM’s response to faults does not always explain general satisfaction with ESCOM; however, as shown in Table 20, controlling for other factors, those who evaluate ESCOM response as “very poor” have an 88 percent probability of dissatisfaction compared with an estimated 64 percent probability of dissatisfaction among those who evaluate ESCOM response as good or very good.
Evaluations of ESCOM communications have a moderately strong relationship with overall satisfaction with ESCOM. As shown in Table 20, those who evaluate ESCOM response as fair, poor, or very poor have a 73 percent probability of dissatisfaction compared with an estimated 53 percent probability of dissatisfaction among those who evaluate ESCOM communications as good or very good. Those who have experienced billing issues with ESCOM are also more likely to express dissatisfaction.
Perception of corruption: Controlling for other factors, those who perceive corruption to be a major problem have a 73 percent probability of dissatisfaction with ESCOM.
Tariff: Those who perceive tariff rates to be unfair are more likely to be dissatisfied with ESCOM although the magnitude of this effect is more modest. This also presents a challenge for ESCOM, as tariff rates will only continue to rise.
Attributes of the firm: While many firm attributes have no correlation with satisfaction with ESCOM, two important exceptions include the size of the firm and its location. Micro businesses, those employing less than five employees, were the most likely to be dissatisfied with ESCOM. One possible explanation for this finding is that while many of these firms depend on electricity, they likely lack the influence that their larger peers have. Dissatisfaction is greatest in the Central region where ESCOM’s supply has been the most problematic and Southern respondents generally view ESCOM better than their Northern and Central peers. The type of firm (whether industrial, a maize mill, or a restaurant/hotel) or the ownership of the firm had no statistically significant relationship with satisfaction. The type of connection, type of line, and use of a generator also had no relationship.
Attributes of the individual: Gender and education levels do not influence views towards ESCOM. Interestingly, younger respondents are less likely to be dissatisfied with ESCOM.
In sum, a number of factors explain dissatisfaction and satisfaction with ESCOM. Dissatisfaction is overwhelmingly driven by the quality of supply. In addition, perceptions and experiences with very poor fault response, fair to very poor communications, corruption, and billing problems, all drive dissatisfaction,
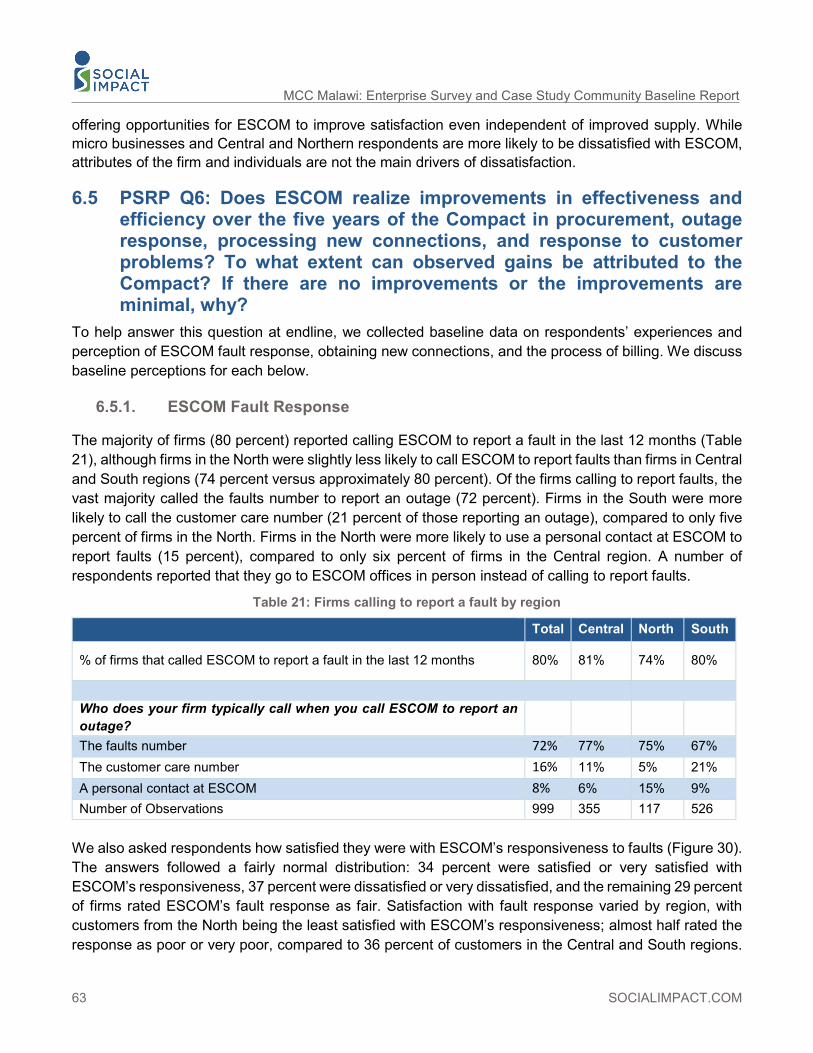
63 SOCIALIMPACT.COM
MCC Malawi: Enterprise Survey and Case Study Community Baseline Report
offering opportunities for ESCOM to improve satisfaction even independent of improved supply. While micro businesses and Central and Northern respondents are more likely to be dissatisfied with ESCOM, attributes of the firm and individuals are not the main drivers of dissatisfaction.
6.5 PSRP Q6: Does ESCOM realize improvements in effectiveness and efficiency over the five years of the Compact in procurement, outage response, processing new connections, and response to customer problems? To what extent can observed gains be attributed to the Compact? If there are no improvements or the improvements are minimal, why?
To help answer this question at endline, we collected baseline data on respondents’ experiences and perception of ESCOM fault response, obtaining new connections, and the process of billing. We discuss baseline perceptions for each below.
6.5.1. ESCOM Fault Response
The majority of firms (80 percent) reported calling ESCOM to report a fault in the last 12 months (Table 21), although firms in the North were slightly less likely to call ESCOM to report faults than firms in Central and South regions (74 percent versus approximately 80 percent). Of the firms calling to report faults, the vast majority called the faults number to report an outage (72 percent). Firms in the South were more likely to call the customer care number (21 percent of those reporting an outage), compared to only five percent of firms in the North. Firms in the North were more likely to use a personal contact at ESCOM to report faults (15 percent), compared to only six percent of firms in the Central region. A number of respondents reported that they go to ESCOM offices in person instead of calling to report faults.
Table 21: Firms calling to report a fault by region
Total Central North South
% of firms that called ESCOM to report a fault in the last 12 months 80% 81% 74% 80%
Who does your firm typically call when you call ESCOM to report an outage?
The faults number 72% 77% 75% 67% The customer care number 16% 11% 5% 21% A personal contact at ESCOM 8% 6% 15% 9% Number of Observations 999 355 117 526
We also asked respondents how satisfied they were with ESCOM’s responsiveness to faults (Figure 30). The answers followed a fairly normal distribution: 34 percent were satisfied or very satisfied with ESCOM’s responsiveness, 37 percent were dissatisfied or very dissatisfied, and the remaining 29 percent of firms rated ESCOM’s fault response as fair. Satisfaction with fault response varied by region, with customers from the North being the least satisfied with ESCOM’s responsiveness; almost half rated the response as poor or very poor, compared to 36 percent of customers in the Central and South regions.

SOCIALIMPACT.COM 64
MD customers were more likely to be satisfied with ESCOM’s fault response; 45 percent of MD firms rated ESCOM’s response as good or very good, compared to 31 percent of three phase customers.
Figure 30: Satisfaction with ESCOM's responsiveness to faults, by region (n=1020)
Respondents were also asked whether ESCOM’s responsiveness to faults has improved over the past twelve months. Many believe it had stayed the same (45 percent); some perceived that fault response had worsened (9 percent) and a large minority (43 percent) believed it had improved (Figure 31). Fewer firms in the North region reported any improvement (27 percent), compared to 39 percent of firms reporting improvement in ESCOM’s responsiveness to faults in Central region and 51 percent of firms in the South region. There were no appreciable differences in perceptions by customer type.
Figure 31: Perceived change in ESCOM's responsiveness over past 12 months (n=1020), by region
ESCOM’s median response time to fix faults was estimated at five hours, with an estimated average response time of 23 hours due to a skewed distribution of responses with several very high outliers (some of which were removed for analysis). The response time was fastest in the North, with a median response time of only three hours, compared to five hours in the Central and South regions.

65 SOCIALIMPACT.COM
MCC Malawi: Enterprise Survey and Case Study Community Baseline Report
Table 22: ESCOM's average response time to fix a fault, by customer type and region
Response time in hours (mean)
Response time in hours (median)
Connection Type Three phase 23 5 Connection Type MD 15 2
Region Central 20 5 Region North 19 3
Region South 26 5 Total 23 5
6.5.2. New Connections
Of the sample firms, 15 percent (147 firms) had solicited a new electricity connection at this or another facility in the last two years. Most requested a three-phase connection (66 percent), 10 percent requested an MD connection, and 24 percent requested a single-phase connection. The vast majority of these firms requested connections from ESCOM customer care (78 percent), 15 percent leveraged a personal contact at ESCOM, and seven percent used a private electricity contractor to act as an intermediary. Of the firms that applied, 54 percent were able to obtain a connection. Although our sample size for this question was small, the success rate appeared to vary by method of application: 77 percent of firms that used a personal contact at ESCOM (n=22) received a connection as did 72 percent of those that used a private contractor as intermediary (n=11). By contrast, only 56 percent of firms seeking a connection via ESCOM Customer care (n=115) obtained one. Among the firms that received a connection, the median wait time from the date of application to receiving a quote was 2.5 months, and the median wait time from paying for a connection until receiving the connection was an additional three months. Among the firms that are still awaiting a connection, the median firm submitted an application and paid for a connection 6 months prior to the survey.74 The median price charged by ESCOM for the connection was MWK 650,900. The majority of firms who got a connection reported being very dissatisfied (21 percent) or dissatisfied (37 percent) with the process, and only 41 percent were satisfied/very satisfied. For the new connection requests reported by firms in our sample, 41 percent reported that ESCOM had to install new poles and 35 percent said ESCOM had to install new transformers to comply with their request; 24 percent of the applying firms in our sample said both were necessary; while 45 percent said no installation of new transformers or poles was necessary in their case.
74 This is higher than the wait time reported in the WB’s enterprise survey, which estimated that Malawian businesses experience an average delay of fifty days in obtaining electric connection, higher than the average of thirty days estimated across SSA countries or 45 days in low income countries (World Bank. Malawi: Country Profile).

SOCIALIMPACT.COM 66
6.5.3. Billing
At the time of data collection, ESCOM was in the process of converting all customers except MD customers to prepaid meters. Prepaid meters are generally not compatible with the energy needs of an MD customer. Within our sample, 63 percent of respondents reported having a prepaid connection, and 34 percent had a postpaid connection, while two percent had both. However, it is important to note that there is some mismatch between ESCOM-reported versus self-reported prepaid or postpaid account status. When asked about whether they preferred a prepaid versus a postpaid meter, the vast majority of three phase customers reported a preference for prepaid meters (82 percent) compared to 36 percent of MD customers; most MD customers preferred postpaid meters (56 percent), and eight percent of MD customers did not express a preference.
Figure 32: Preference for prepaid versus postpaid meters, by customer type
Sixty percent of firms reported issues with billing in the last 12 months. Forty-six percent of postpaid customers reported problems with ESCOM invoices in the last 12 months. Within this group, the most commonly reported problem was incorrect consumption (reported by 61 percent of surveyed postpaid firms), followed by late bills (44 percent), while the third most common problem was an incorrect tariff category (24 percent). Previous payment not being registered, and inconvenience of bill payment options were each reported by around a tenth of the sample (Figure 33).
Figure 33: Billing issues faced by postpaid customers (n= 171)
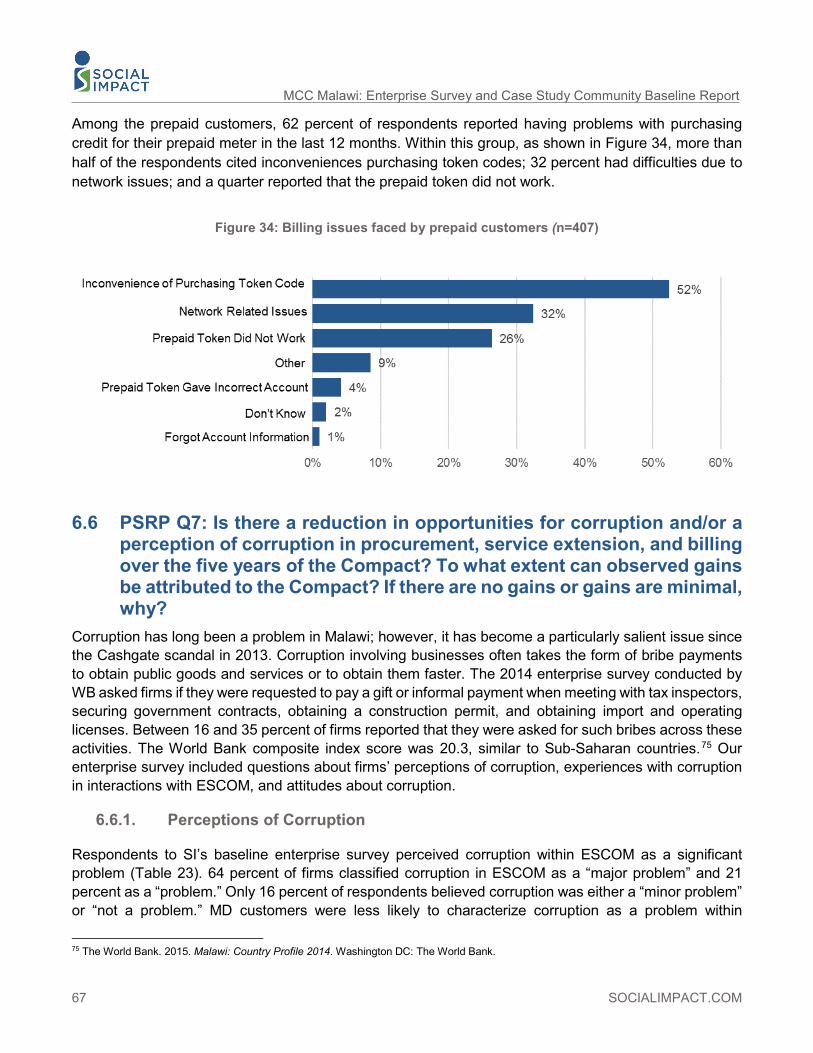
67 SOCIALIMPACT.COM
MCC Malawi: Enterprise Survey and Case Study Community Baseline Report
Among the prepaid customers, 62 percent of respondents reported having problems with purchasing credit for their prepaid meter in the last 12 months. Within this group, as shown in Figure 34, more than half of the respondents cited inconveniences purchasing token codes; 32 percent had difficulties due to network issues; and a quarter reported that the prepaid token did not work.
Figure 34: Billing issues faced by prepaid customers (n=407)
6.6 PSRP Q7: Is there a reduction in opportunities for corruption and/or a perception of corruption in procurement, service extension, and billing over the five years of the Compact? To what extent can observed gains be attributed to the Compact? If there are no gains or gains are minimal, why?
Corruption has long been a problem in Malawi; however, it has become a particularly salient issue since the Cashgate scandal in 2013. Corruption involving businesses often takes the form of bribe payments to obtain public goods and services or to obtain them faster. The 2014 enterprise survey conducted by WB asked firms if they were requested to pay a gift or informal payment when meeting with tax inspectors, securing government contracts, obtaining a construction permit, and obtaining import and operating licenses. Between 16 and 35 percent of firms reported that they were asked for such bribes across these activities. The World Bank composite index score was 20.3, similar to Sub-Saharan countries.75 Our enterprise survey included questions about firms’ perceptions of corruption, experiences with corruption in interactions with ESCOM, and attitudes about corruption.
6.6.1. Perceptions of Corruption
Respondents to SI’s baseline enterprise survey perceived corruption within ESCOM as a significant problem (Table 23). 64 percent of firms classified corruption in ESCOM as a “major problem” and 21 percent as a “problem.” Only 16 percent of respondents believed corruption was either a “minor problem” or “not a problem.” MD customers were less likely to characterize corruption as a problem within
75 The World Bank. 2015. Malawi: Country Profile 2014. Washington DC: The World Bank.

SOCIALIMPACT.COM 68
ESCOM—only 48 percent thought corruption within ESCOM’s corruption is a major problem, compared to 65 percent of three-phase customers. Fifteen percent of MD customers described ESCOM’s corruption as “not a problem,” compared to only five percent of three-phase customers. Firms in the South were especially concerned with corruption, with 70 percent classifying corruption as a major problem compared to 56 percent and 60 percent of customers in the Central and in the North regions, respectively. The perception of corruption was nearly identical between female and male respondents.
Table 23: Perceived corruption in ESCOM
Region Connection Type Total
Central North South Three Phase MD
In your opinion, how big a problem is corruption in ESCOM?
Major problem 56% 60% 70% 65% 48% 64%
Problem 22% 25% 18% 20% 23% 21%
Minor problem 14% 9% 7% 9% 14% 10%
Not a problem 7% 6% 5% 5% 15% 6%
ESCOM personnel are more responsive to businesses that provide gifts or make informal payments
Region Connection Type Total
Central North South Three Phase MD
Strongly agree 18% 16% 21% 20% 10% 19%
Agree 42% 44% 36% 39% 35% 39%
Disagree 37% 40% 38% 37% 46% 38%
Strongly Disagree 3% 0% 5% 3% 8% 4%
ESCOM personnel are more responsive if you have a personal contact in ESCOM.
Strongly agree 18% 23% 21% 20% 15% 20%
Agree 46% 49% 47% 47% 45% 47%
Disagree 34% 28% 27% 29% 36% 30%
Strongly Disagree 3% 0% 5% 3% 4% 3%
When asked if they agreed or disagreed that “ESCOM personnel are more responsive to businesses that provide gifts or make informal payments,” 59 percent agreed/strongly agreed, and 41 percent disagreed /strongly disagreed (Table 23). Three phase customers were more likely to agree strongly (20 percent) than MD customers (10 percent). Views were similar across regions and did not differ much by respondent gender.
Use of personal contacts within ESCOM is another way that firms believed they could get better service. When asked whether ESCOM personnel were more responsive to businesses “with personal contacts in ESCOM,” 67 percent of respondents agreed or strongly agreed, with Three Phase customers somewhat more likely to agree (60 percent).

69 SOCIALIMPACT.COM
MCC Malawi: Enterprise Survey and Case Study Community Baseline Report
6.6.2. Self-Reported Corruption in Service Extension
The Africa Survey 2015 conducted by Transparency International (TI)76 revealed that 13 percent of respondents reported having to pay a bribe to at least one of six public services (including utilities) in the last 12 months in Malawi. This number was lower than the average reported bribe incidence across Sub-Saharan African countries (22 percent), and much lower than Liberia (69 percent), Cameroon (48 percent), or Nigeria (43 percent). On this measure of corruption, Malawi ranked as 19th most corrupt out of 29 Sub-Saharan countries. For utility services specifically, 11 percent of users in Malawi reported having to pay a bribe in the past 12 months, a figure similar to those reporting bribing public school officials (12 percent). Utilities appear to be more corrupt than public hospitals and ID or voters’ card services (only six and three percent of users of those services report having paid a bribe in the last year), but less so than the police, where 28 percent of respondents said they had paid a bribe at least once or twice. While questions about personal experiences with bribery risk social desirability bias, our survey also explored whether firms have experienced ESCOM staff soliciting gifts or informal payments to expedite the connection process. As noted above, 14 percent of firms in our sample had sought a connection in the last two years. Of this unweighted sub-sample, 16 percent reported that an ESCOM employee had solicited a gift or informal payment to expedite their connection process, compatible with TI’s findings.
6.6.3. Attitudes toward Corruption
Respondents to the baseline ES tended to disapprove of corruption, even if it would benefit them. When asked to react to the statement, “Given the way things are in Malawi, it is sometimes justifiable to make informal payments or bribes to obtain improved service,” 68 percent of respondents disagreed or strongly disagreed. Nonetheless, a sizeable minority (32 percent) agreed or strongly agreed with the statement, suggesting some attitudinal acceptance of corruption that respondents were willing to admit to.
When asked to react to the statement that is sometimes justifiable “to leverage one’s personal contacts” to obtain improved service, most respondents also disagreed (38 percent) or strongly disagreed (19 percent). The proportion of respondents who agreed or strongly agreed was higher than for the questions above: 43 percent (Figure 35 and Figure 36).
Attitudes were similar across customer type and by respondent gender for both questions. It is important to note that both of these questions may be subject to social desirability bias, wherein respondents provide an answer that will be viewed favorably by the enumerator or others. Survey respondents may have been reluctant to admit support for paying bribes or leveraging relationships for personal gain. The survey questions were designed to mitigate this bias by posing the situation as a hypothetical and framing it within Malawi’s reality; however, the true fraction of firms that agree with these two statements might actually be higher.
76 Transparency International. “People and Corruption: Africa Survey 2015 – Global Corruption Barometer.” December 1, 2015.

SOCIALIMPACT.COM 70
Figure 35: Agreement that it is sometimes justifiable to make informal payments or bribes to obtain improved services, by region (n=1,020)
Figure 36: Agreement that it is sometimes justifiable to leverage personal contacts to obtain improved services, by region (n=1,020)
6.7 PSRP Q8: Does the quantity and quality of ESCOM communications with the public and the transparency of ESCOM increase over the life of the Compact? To what extent do Compact efforts to improve communications contribute to observed improvements? If there are no improvements or improvements were minimal, why?
To answer this question at endline, we asked enterprises three questions about communications, including if they were notified about outages, if notifications were accurate, and a general assessment about ESCOM communications.

71 SOCIALIMPACT.COM
MCC Malawi: Enterprise Survey and Case Study Community Baseline Report
6.7.1. Notification of Outages
Despite the high frequency of outages, firms reported rarely receiving outage notifications (Table 24). Firms reported receiving outage notifications for their facility in the past three months an average of 1.3 times, with 56 percent not receiving any notifications in that time period. MD customers reported receiving more frequent outage notifications (2.3 per month on average) than three-phase customers (1.3 per month on average); only 34 percent of MD firms received no notifications in the last three months, while 57 percent of three phase customers reported none. There was also considerable variation by region, with firms in the South reporting more than two times the number of outage notifications than in the North, on average.77
Table 24: Average number of outage notifications firms received in the last three months Customer type Region Owns generator Total Three phase MD Central North South Generator No Generator
Mean 1.33 1.27 2.34 1.01 0.73 1.69 2.5 1.1
Median 0 0 1 0 0 1 0 1
Even when firms received notifications, they were often not accurate. Interviews with ESCOM suggest that while the utility is able to notify customers for planned outages with relative accuracy, it is generally unable to reliably notify customers about loadshedding related outages. Figure 37 presents firms’ assessments of the accuracy of outage notifications. Only 55 percent of firms reported that outage notifications were accurate always or most of the time; three phase firms were more likely to rate outage notifications as always accurate - 26 percent compared to 18 percent of MD customers. More than half of respondents in the Central region thought the notifications were typically not accurate (sometimes, rarely or never accurate) compared to 43 percent of firms in the South and 37 percent of firms in the North. Female respondents were more likely to rate the accuracy of outage notifications higher - 66 percent believed they were accurate most or all the time, compared to 54 percent of male respondents.
77 When tested with a regression, both firms in the South and MD firms have a statistically significant independent relationship with higher notification.

SOCIALIMPACT.COM 72
Figure 37: Perception of how often outage notifications are accurate, by customer type and region
6.7.2. General Communication
Almost half of all respondents characterized ESCOM’s communication with customers as poor or very poor (Figure 38). This is consistent with problems identified with ESCOM’s communications in SI’s baseline and midline PSRP qualitative evaluation reports. Only four percent of respondents rated ESCOM’s communications as ‘very good.’ MD customers had slightly more favorable views of ESCOM’s customer communications, with 28% percent rating the communication as good or very good, compared to almost 23% percent of three phase customers. There were substantial differences in perceptions of ESCOM communications by region, with customers in the North being the least satisfied.

73 SOCIALIMPACT.COM
MCC Malawi: Enterprise Survey and Case Study Community Baseline Report
Figure 38: Perception of ESCOM customer communications quality, by customer type and region
6.8 IDP Q5: Do the attitudes of beneficiary male and female entrepreneurs’ attitudes toward cost-reflective tariffs improve over the life of the Compact? What factors explain variation in beneficiary male and female entrepreneurs’ attitudes toward cost reflective tariffs?
6.8.1. Attitudes toward Tariffs
The survey explored the respondents’ attitudes towards current electricity tariffs, subsidies and support for tariff increases. Less than one-third of respondents agreed or strongly agreed that the tariffs are a fair price for electricity, while 47 percent disagreed, and 24 percent strongly disagreed (Table 25). MD customers, who pay higher rates, were less likely to believe the tariffs were fair than three-phase customers.
Table 25: Perception of fairness of electricity tariff as a fair price for electricity
The current electricity tariff is a fair price for electricity. Total Three-phase MD Strongly Agree 5% 5% 2% Agree 25% 25% 20% Disagree 47% 47% 46% Strongly Disagree 24% 23% 32%
Number of observations 1,022 780 242
In Malawi, businesses pay a higher rate for electricity than households, effectively cross-subsidizing the cost of electricity. Respondents were asked for their opinions on subsidization of electricity: whether they

SOCIALIMPACT.COM 74
believed that businesses should subsidize electricity for poor households and whether the government should subsidize the cost of electricity for businesses. Table 26 summarizes the results by customer type, region and gender of respondent. Forty-three percent of respondents agreed that businesses should be responsible for subsidizing the cost of electricity for poor households. MD customers reacted more favorably to cross-subsidization of poor households’ electrical costs, with half of these firms believing business should subsidize their costs compared to 43 percent of three-phase customers. Nearly three-quarters of firms believed that the government should subsidize electricity costs for businesses, with three phase customers being more likely to be in favor government subsidies (73 percent) than MD customers (63 percent). There were some differences across regions, as customers in the Central and the Northern regions were less likely to perceive the tariff as fair than customers in the Southern region, with 21 percent, 25 percent, and 37 percent of customers, respectively, viewing the tariff as fair. Customers in the North were the least likely to believe that businesses should subsidize poor households (27 percent of Northern firms), and the most likely to believe that government should subsidize electricity for businesses (80 percent of Northern firms, compared to 67 percent of firms in Central region and 74 percent in South). Male and female respondents had similar attitudes across the three tariff fairness questions.
Table 26: Proportion of firms holding various views on tariffs Customer type Region Gender
Total Three phase MD Central North South Male Female
Believe tariff is fair (n=1,022) 30% 30% 22% 21% 25% 37% 31% 27%
Believe businesses should subsidize electricity cost for poor households (n=1,021)
43% 42% 50% 41% 27% 48% 44% 39%
Believe government should subsidize electricity cost of businesses (n=1,021)
72% 73% 63% 67% 80% 74% 72% 75%
6.8.2. Support for tariff increases for improved services
Determining business people’s attitudes toward additional tariff increases in a survey is not straightforward, since they can generally be expected to want to minimize costs and there is a strong incentive to answer survey questions about tariff increases strategically rather than honestly. Despite this limitation, the contingent valuation method has been widely used in cost-benefit analysis to elicit such preferences via a survey. Empirical studies have demonstrated that surveys can be used measure willingness to pay (WTP) for a wide range of public infrastructure projects and public services in developing countries and obtain reasonable, consistent answers.78 In our survey, we asked about respondents’ willingness to pay of electricity services as a single product to avoid the part-whole bias that has been observed in multi-good valuation scenarios.79 Because electricity is essentially an inelastic good in a monopoly market, it is not possible to use market data due to very limited price variations.80
78 Whittington, Dale, John Briscoe, Xinming Mu and William Barron. “Estimating the Willingness to Pay for Water Services in Developing Countries: A Case Study of the Use of Contingent Valuation Surveys in Southern Haiti.” Economic Development and Cultural Change, vol. 38, no. 2, 1990: 293-311. 79 Venkatachalam L. “The Contingent Valuation Method: A Review.” Environmental Impact Assessment Review, vol. 24, 2004: 89-124. 80 Breidert, Christoph, Michael Hahsler, and Thomas Reutterer. “A Review of Methods for Measuring Willingness-To-Pay.” Innovative Marketing. 2006.

75 SOCIALIMPACT.COM
MCC Malawi: Enterprise Survey and Case Study Community Baseline Report
We utilized standard self-reported WTP elicitation techniques by providing respondents two specific scenarios to consider. Nonetheless, some bias could exist since the question was strictly hypothetical. Strategic bias may also exist, as respondents may believe their responses would influence ESCOM’s future behavior; results from empirical studies are not conclusive on whether such considerations would bias the self-reported WTP estimate. Our approach was to ask respondents what percent increase in electricity tariffs they would be willing to pay if the number of outages could be reduced by half or almost entirely eliminated. The model results are summarized in Table 27.
Table 27: Average % increase in electricity tariffs firms willing to pay to reduce outages by half or almost eliminate them (n=1,021)
Customer
type Region Gender Generator use
Total Three phase MD Central North South Male Female Generator No
Generator Outages reduced by half Mean 10% 10% 6% 7% 7% 13% 10% 10% 9% 10%
Median 5% 5% 5% 2% 5% 10% 5% 5% 5% 5%
Outages almost eliminated
Mean 21% 21% 13% 15% 16% 25% 21% 20% 17% 21% Median 10% 10% 10% 9% 10.5% 15% 10% 10% 10% 10%
While many respondents stated they would not be willing to pay anything for such improvements in supply, most indicated some willingness to absorb higher tariffs for improved service. If outages could be reduced by half (Figure 39), the mean increase in tariffs respondents were willing to pay was ten percent and the median customer was willing to tolerate a tariff increase of five percent. Only 23 percent of respondents were willing to pay more than 10 percent more for a 50 percent reduction in outages. Firms in the South were more likely to be willing to tolerate a price increase in tariffs, with a mean WTP of a 13 percent increase in tariff (median firm was willing to pay 10% higher tariffs) compared to a mean WTP of seven percent (median two percent and five percent) by firms in Central and North regions, respectively.

SOCIALIMPACT.COM 76
Figure 39: What percent increase in electricity tariffs would you be willing to pay if the number of outages could be reduced by half? (n=1,021)
If outages could be almost eliminated, firms were willing to tolerate an increase in tariff of twice as much as if the outages could be reduced by half (Figure 40). Respondents were willing to pay 21 percent (mean) higher tariffs, with the median respondent willing to pay 10 percent higher tariffs. Ten percent of firms were willing to pay 50 percent or more for tariffs if outages could be close to eliminated. Firms in the South were again more likely to be willing to tolerate a price increase in tariffs to almost eliminate outages, with a mean WTP of a 25 percent increase in tariff (median 15 percent) compared to a mean WTP of 15 percent (median nine percent and 10.5 percent) by firms in Central and North regions, respectively. Figure 40: What percent increase in electricity tariffs would you be willing to pay if the number of outages
could be almost eliminated (n=1021)
There were no perceivable differences in responses to the questions on tariff increase by respondent gender. Firms without a generator were willing to pay slightly more to reduce outages.
77 SOCIALIMPACT.COM
MCC Malawi: Enterprise Survey and Case Study Community Baseline Report
6.8.3. Regression analysis of self-reported willingness to pay
We are interested in why some firms perceive the existing tariff as fair or support tariff increases for improved electricity services while others do not. To shed light on this, we conducted multivariate regression analysis to better understand the correlates of firms’ tariff perceptions and isolate the incremental effects of each factor holding other, potentially confounding factors constant. We analyzed responses to each of the questions, testing the independent effects of many of the same variables that were used above to explain variation in satisfaction with ESCOM, including:
• Satisfaction with the supply of electricity • Other aspects of ESCOM service, including frequency of low-voltage, perceptions of changes in
electricity service, evaluations of ESCOM’s response to faults, evaluations of ESCOM’s communication, experiences with billing issues
• Perception of corruption in ESCOM • Attributes of the firm, including location, size, ownership, type of firm, type of connection, and use
of a generator • Attributes of the respondent, including gender, education, and age.
In addition, we also tested the effects of the perception that ESCOM could turn tariff increases into improved services.
Full regression results are presented in Tables A2 and A3 in Annex 11.1. As above, for each dependent variable we present full models, with all the independent variables of interest, and reduced models, which exclude variables with missing data, including firm size and electricity as a percent of cost. The first model risks some sampling bias introduced by missing data and the second model risks some omitted variable bias from omitted factors. Together, however, they provide a good test of the different factors.
The regression explaining fairness of the tariff involves four models presented in Table A2 in Annex 11.1. The two sets of models include a logit regression comparing those that agree and disagree that the tariff is fair and an ordered logit model comparing those that strongly agree, agree, disagree, and strongly disagree. The model results are quite similar although there are some differences. For ease of interpretation when we interpret coefficients from Table A2, we interpret the findings from the logit models.
Support for an increase in tariffs is an interval level variable ranging from zero to 100 percent. In Table A3 we examine variation in responses through an OLS regression; however, given the high number of respondents that answer zero, we also estimate Tobit models, which take into account such floor effects. For ease of interpretation we only interpret the coefficient from the OLS models but note any divergences between the models.
Electricity supply: Satisfaction with electricity is significantly correlated with perceptions of fairness of the tariff. Those that are very dissatisfied with the electricity supply have twice the odds of disagreeing that the tariff is fair, suggesting that unreliable electricity is a major driver of dissatisfaction with the cost of electricity. Interestingly, however, dissatisfaction with electricity supply does not have a relationship with support for tariff increases in exchange for improved service. This is illustrative of a fundamental financing dilemma: improving services requires increased revenue, but consumers do not want to pay more precisely because services are poor.

SOCIALIMPACT.COM 78
Other aspects of ESCOM services: Evaluations of ESCOM services also influence attitudes towards tariffs. Respondents who view ESCOM’s response to faults as poor or very poor and those who have experienced billing problems are less likely to agree that the current tariff is fair or to support tariff increases for a reduction in outages. Experiences with low voltage and negative evaluation of ESCOM communications, however, are not correlated with tariff attitudes. Perceptions of changes in ESCOM services over the last year are also not predictive. This is potentially concerning, as it means – consistent with the findings above on satisfaction with ESCOM -- that it will likely be hard for ESCOM to overcome the financing dilemma and gain customer confidence in the short term.
Corruption: Respondents who view corruption in ESCOM as a major problem have approximately twice the odds of perceiving the current tariff as unfair. If respondents believe that ESCOM revenues are finding their way into the wrong pockets, then it stands to reason that they would not support the current tariff rate. Surprisingly, however, corruption perception is not associated with a willingness to pay more for electricity.
Trust: Those that do not trust ESCOM to convert tariff increases to improved services have around twice the odds of viewing the current tariff as unfair. This variable is also generally statistically significant and even strongly associated with an unwillingness to pay higher tariffs; however, we only observe this relationship to be statistically significant in the Tobit models.
Attributes of the firm: Southern firms and Northern firms are more likely than those in the Central region to view the current tariff as fair. Southern firms (although not Northern firms) are also more likely to support tariff increases. This finding is statistically significant and strong even when controlling for the type of firm and the type of connection.
MD customers, both on and off an industrial line, are more likely to view the current tariff as unfair, and they are far less likely to support tariff increases for improved services. Mills, by contrast, are not any more likely to view the tariff as fair or unfair, but they are more willing to support tariff increases for improved service.
There is generally not a statistically significant relationship between possessing a generator and attitudes towards tariffs, however, those with a generator are consistently observed to be more supportive of the tariff and tariff increases than those who do not have a generator. This suggests that generators are not insulating firms from unreliable electricity.
Another related variable tested in the model is the percent of electricity as a percent of total costs. Those with high electricity as a percent of total costs are generally less likely to support tariff increases. This makes perfect sense, as tariff increases would dramatically increase their costs of doing business; however, given their dependence on electricity, they are probably the same firms that would benefit the most from improved reliability.
Attributes of the respondent: Age is the most important aspect of the respondent in predicting support for tariff increases. Respondents above the age of 40 are less likely to support tariff increases and more likely to view the current tariff as unfair. Those with higher levels of education are also more likely to view the tariff as unfair and although it is not statistically significant, they are consistently less likely to support tariff increases.
In sum, these results raise major concerns for the future of tariff increases. While there are groups that would favor an increase in tariffs for improved reliability (e.g., firms in the South, mills, firms with a generator), many of the groups that could benefit most from improved services, such as MD firms and firms dependent on electricity, oppose such increases, even when controlling for other related factors, such as possession of a generator.

79 SOCIALIMPACT.COM
MCC Malawi: Enterprise Survey and Case Study Community Baseline Report
7. CASE STUDY COMMUNITY FINDINGS This section presents findings from baseline data collection among households in case study communities, including FGDs conducted in 2015 and household surveys that were added to the evaluation design in 2016-2017. As above, while we will not be able to provide answers to the questions until endline, the baseline findings are organized by evaluation question and when relevant are disaggregated by income, gender and age within each section to address Core Question 3: Are there differences in outcomes of interest by gender, age, and income? Sex and income disaggregated information for businesses and households will be pursued to the extent possible.
As discussed in the methodology section above, we conducted 27 focus groups targeting middle-high income and middle-low income communities expected to benefit from the IDP in Malawi’s three major cities. As seen in Table 28, in middle-low income communities we conducted a set of three focus groups with those that had electricity connections and another set with those that did not have connections. Each set involved separate FGDs with adult males, adult females, and youths enrolled in school. In addition, we use survey data collected by the NSO to complement and contextualize the FGD data. These data were collected in the same communities in 2016 and 2017 as part of an oversample of the IHS4. The sample sizes for the communities is also presented in Table 28. Because of the relatively small sample sizes, in the analysis below we present the results separately for two groups: middle-high income communities with good access to electricity and lower income communities with mixed access. Reflecting these disaggregations, the median house value in middle-high income FGD communities is more than seven times higher than in the middle-low income communities. We use the terms middle-high and middle-low as a heuristic to indicate that these are neither the wealthiest communities nor the poorest.
Table 28: Geographic distribution of households surveyed in NSO IHS
Community Location Income FGDs Survey Freq. Survey % Kanjedza and Limbe Central Blantyre Middle-high
income 3: with
electricity 160 27%
Zingwangwa Blantyre Middle-low income
6: with and without
electricity 112 19%
Area 18B Lilongwe Middle-high income
3: with electricity 48 8%
Area 25C Lilongwe Middle-low income
6: with and without
electricity 96 16%
New Katoto Mzuzu Middle-high income
3: with electricity 16 3%
Nkhorongo Mzuzu Middle-low income
3: with electricity 64 11%
Chibavi Mzuzu Middle-low income
3: without electricity 95 16%
Total 27 591 100
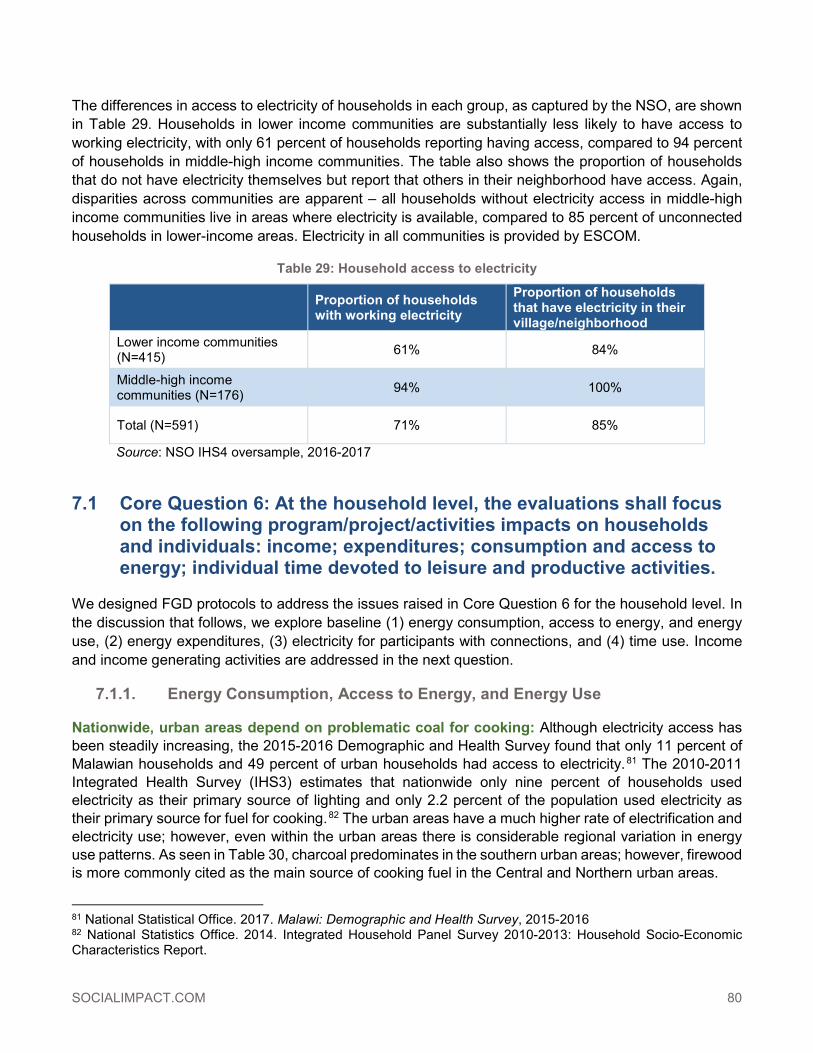
SOCIALIMPACT.COM 80
The differences in access to electricity of households in each group, as captured by the NSO, are shown in Table 29. Households in lower income communities are substantially less likely to have access to working electricity, with only 61 percent of households reporting having access, compared to 94 percent of households in middle-high income communities. The table also shows the proportion of households that do not have electricity themselves but report that others in their neighborhood have access. Again, disparities across communities are apparent – all households without electricity access in middle-high income communities live in areas where electricity is available, compared to 85 percent of unconnected households in lower-income areas. Electricity in all communities is provided by ESCOM.
Table 29: Household access to electricity
Proportion of households with working electricity
Proportion of households that have electricity in their village/neighborhood
Lower income communities (N=415) 61% 84%
Middle-high income communities (N=176) 94% 100%
Total (N=591) 71% 85%
Source: NSO IHS4 oversample, 2016-2017
7.1 Core Question 6: At the household level, the evaluations shall focus on the following program/project/activities impacts on households and individuals: income; expenditures; consumption and access to energy; individual time devoted to leisure and productive activities.
We designed FGD protocols to address the issues raised in Core Question 6 for the household level. In the discussion that follows, we explore baseline (1) energy consumption, access to energy, and energy use, (2) energy expenditures, (3) electricity for participants with connections, and (4) time use. Income and income generating activities are addressed in the next question.
7.1.1. Energy Consumption, Access to Energy, and Energy Use
Nationwide, urban areas depend on problematic coal for cooking: Although electricity access has been steadily increasing, the 2015-2016 Demographic and Health Survey found that only 11 percent of Malawian households and 49 percent of urban households had access to electricity.81 The 2010-2011 Integrated Health Survey (IHS3) estimates that nationwide only nine percent of households used electricity as their primary source of lighting and only 2.2 percent of the population used electricity as their primary source for fuel for cooking.82 The urban areas have a much higher rate of electrification and electricity use; however, even within the urban areas there is considerable regional variation in energy use patterns. As seen in Table 30, charcoal predominates in the southern urban areas; however, firewood is more commonly cited as the main source of cooking fuel in the Central and Northern urban areas.
81 National Statistical Office. 2017. Malawi: Demographic and Health Survey, 2015-2016 82 National Statistics Office. 2014. Integrated Household Panel Survey 2010-2013: Household Socio-Economic Characteristics Report.

81 SOCIALIMPACT.COM
MCC Malawi: Enterprise Survey and Case Study Community Baseline Report
Table 30: What is your main source of cooking fuel?
Energy source Southern urban Central urban Northern urban Total urban
Electricity 12% 11% 2% 11%
Charcoal 65% 41% 35% 51%
Firewood 22% 47% 63% 37%
Other 1% 1% 0% 1%
Total 100% 100% 100% 100% Source: NSO. 2014. Integrated Household Panel Survey 2010-2013
Reliance on firewood and charcoal as a main fuel source is commonly regarded as problematic and frequently blamed for deforestation, loss of biodiversity, reduced water catchment, and pollution.83 Such non-electricity fuel sources are also more expensive, and they are most expensive for the poor. A 2009 study found at that time that the cost of cooking with electricity was 42 percent of the cost of cooking with charcoal.84 A detailed study of the charcoal industry in Malawi conducted in 2007 found that low-income and high-income households had similar charcoal expenditures because low-income households paid a higher price per kilo for charcoal, as they buy it in smaller packages priced commensurate to their spending power.85
Focus group communities use more electricity but are still dependent on biomass. 2016-2017 NSO oversample data provide a “snapshot” of current energy use patterns and rationale for energy use choices at baseline in our focus group communities. Table 31 shows the sources of cooking fuel among respondents in the two income level groups. Given that our focus group communities do not include many of the poorest neighborhoods and are disproportionately middle income, we observe higher electricity use and lower firewood use than in urban areas more generally.86 Charcoal was the most popular source of cooking fuel for respondents in the middle-low income communities (used by 57 percent), while electricity (used by 68 percent) was the most popular source for those in the middle-high income communities.
Table 31: What is your main source of cooking fuel? (FGD communities)
Middle-low income communities Middle-high income communities Total
Charcoal 57% 24% 47% Electricity 19% 68% 34% Firewood 24% 5% 19% Other 0% 3% 1% Number of observations 415 176 591
Source: NSO IHS4 oversample, 2016-2017
83 Kambewa, Patrick, Bennet Mataya, Killy Sichinga, and Todd Johnson. "Charcoal the Reality: A Study of Charcoal Consumption, Trade, and Production in Malawi." International Institute for Environment and Development (IIED). 2007. 84 Government of Malawi. “Malawi Biomass Energy Strategy.” January 2009. Retrieved from http://www.euei-pdf.org/sites/default/files/field_publication_file/EUEI_PDF_BEST_Malawi_Final_report_Jan_2009_EN.pdf 85 Kambewa et al. A Study of Charcoal Consumption, Trade, and Production in Malawi. 86 Some of the differences might also be explained by an expansion in electricity access since 2013.

SOCIALIMPACT.COM 82
Looking at the choice of energy for their lighting needs, we observe a greater reliance on electricity than with cooking. As above, in 2016-2017 we observe much higher rates of electricity use in our focus group communities than in urban areas more generally. This might be somewhat explained by increased electricity access; however, it is primarily due to the wealthier and more connected nature of our focus group communities. In urban areas more generally, the 2013 IHS estimates that 37 percent of urban households use electricity as their primary source of lighting, followed by candles (22 percent), paraffin (20 percent), and battery-based sources (20 percent). Table 32 shows data from the IHS4 oversample in focus group communities. Among 176 respondents in the middle-high income communities, the vast majority (94 percent) use electricity as their main source of lighting. In contrast, only 63 percent of households in the lower-income communities relied on electricity for lighting. Battery/dry cell (23 percent) and candles (10 percent) are two popular sources following electricity. In the following sections we turn to data from the FGDs.
Table 32: What is your main source of lighting fuel?
Lower income communities
Middle-high income communities Total
Electricity 63% 94% 72%
Battery/Dry cell 23% 3% 17%
Candles 10% 1% 7%
Collected firewood 2% 1% 1%
Gas 1% 1% 1%
Other (Specify) 1% 0% 1%
Purchased firewood 0% 1% 0%
Grass 0% 0% 0%
Paraffin 0% 0% 0% Number of observations 415 176 591
Source: NSO IHS4 oversample, 2016-2017 FGD participants use a mix of energy sources. Consistent with the survey findings, none of the 264 participants in the FGDs reported exclusive use of electricity. The majority of households (approximately 70-100 percent in each FGD in communities with access to electricity), used a combination of ESCOM electricity, charcoal, and firewood on a consistent basis.87 A smaller minority of households (20-30 percent) also used solar, generators, or car batteries in their menu of energy choices. Households without access to an ESCOM connection reported a similar mix of non-electricity-based sources, although they are slightly more likely to have solar panels or solar lights as part of their energy mix.
The household appliance inventory revealed that all households had some electrical appliances in their homes (even those without an ESCOM electrical connection). Every household had mobile phone chargers and at least 70 percent of participants in each FGD have a stereo or television. The next most common appliance was a clothes iron. Many households also had computers, cookers and freezers.
87 See note above in the methodology section on the presentation of percentages throughout this section of the report.

83 SOCIALIMPACT.COM
MCC Malawi: Enterprise Survey and Case Study Community Baseline Report
Even households without an ESCOM connection tended to have multiple electrical appliances, including phone chargers (100 percent), televisions (50-70 percent) and irons (50-70 percent).
Participants prefer electricity but are still dependent on other sources. Many participants expressed a strong preference for using electricity, citing the efficiency, cost-effectiveness, and ease of use of the energy source.
Participants cited a variety of reasons for the superiority of electricity including: increased ability to study; to generate small business income; to complete household chores in a timely way; and to feel safe. In households without access to electricity, the preference was even stronger. There was a strong sense among participants from non-electrified households that an electricity connection would offer numerous benefits.
Nonetheless, even electrified households reported not being able to enjoy the full benefits of electrification. As mentioned above, no households reported using electricity exclusively. The unreliable and poor-quality electrical supply was the most common explanation for the decision to utilize other energy sources.88 This is especially important for the time-sensitive (and time intensive) task of cooking the evening meal. As the quotes below demonstrate, many participants described the frustration of starting dinner and then “losing” the meal because the electricity goes out in the middle of cooking. This is particularly inconvenient when cooking the national dish, nsima, since it’s necessary to start the process again from the beginning.
This finding potentially contradicts the common perception that charcoal is “culturally” preferred. A handful of participants did indicate a cultural preference for using charcoal, contending that it makes food “taste better,” but these views were not shared by the majority of participants. Instead, participants tended to view coal use in practical terms. Many respondents argued that charcoal (and to a lesser extent firewood) is more efficient when doing household tasks that require a longer period of time (see below). In addition, a handful of participants mentioned that coal has the ancillary benefit of also providing heat in the house. The relative costs of electricity and charcoal are discussed further below.
There are gender and age differences in energy use. The main gender and age differences are related to ways in which men, women, and young people spend their time in the evenings between 6-12pm, which is discussed in greater detail below. These patterns are obviously related to the division of labor at the household level. Since women are mostly responsible for cooking and for preparing hot water for bathing for the entire family, they were much more aware of the ways in which energy was used for these activities at the household level. Men, on the other hand, reported more detailed information about the use of energy in leisure activities, including watching television, listening to the radio, and using laptop 88 See below for a discussion on outages and surges.
“With charcoal, you are assured of cooking without any disturbance.” (Youth – Chibavi, Mzuzu)
“Every time you want to cook, there is a blackout.” (Woman – Zingwangwa, Blantyre)
“If power outage is put to an end for the whole year, then we can forget about using charcoal” (Youth – Area 25C, Lilongwe)

SOCIALIMPACT.COM 84
computers for entertainment. Youth share some of the responsibility of completing household chores but also reported on their usage of energy while they study.
Gender and income interact. A related distinction emerged at the intersection of gender and socioeconomic class. In the middle-high income communities in all three regions, women are still responsible for most household duties, but they also tend to be more likely to work outside the home. Consequently, several FGDs in each region documented the lack of time faced by these women as the main reason they prefer electricity. Although cost also matters to these women, they are more concerned about the time savings that electricity allows in completing household tasks.
In contrast, the women in lower income communities (both with and without electricity) tended to talk more about weighing the relative financial costs of different sources of energy and the need to use a balance of energy sources for budgetary reasons. They were much less likely to talk about time challenges as most of them tend to spend much of their time inside the home.
Renters have different perceptions. Interestingly, the data from the FGDs in the communities without electricity documents a pattern of behavior that was unanticipated: the role that energy use plays in the decision to secure rental housing. Many of the respondents reported that they were currently living in rental homes without electricity but had previously lived in houses with electricity. Some reported that they had intentionally moved to a rental house without electricity because rentals are less expensive if the home does not have an electrical connection.
Others reported the opposite problem:
A few participants discussed their role as landlords and the difficulties they face because they are unable to charge enough rent to cover their investments when the rental house does not have an ESCOM connection.
7.1.2. Energy Expenditures
In the IHS4 oversample, households reported how much they paid for electricity. While the answers could reflect some recall error in reporting, on average, households in the selected communities in the Central,
“We are very busy, coming from work, lighting charcoal, I find it very tedious” (woman – New Katoto, Mzuzu)
“A house with electricity is very expensive [to rent] and there are persistent blackouts, so even if we pay a lot of money [on rent], the power supply is unreliable.” (Man – Zingwangwa Traditional,
Blantyre)
“Previously, I lived in a certain house…..electricity was 2000 Kwacha per month, but the one I am living in now is not electrified and it is difficult for me.” (Woman – Nkhrongo, Mzuzu)

85 SOCIALIMPACT.COM
MCC Malawi: Enterprise Survey and Case Study Community Baseline Report
Southern and Northern regions estimated that in the week prior to the survey they paid USD $8.05 (MWK 5,720); USD $6.23 (MWK 4,421); and USD $4.31 (MWK 3,060), respectively.89
Figure 41 shows the distribution of reported electricity costs of lower income communities compared to that of high-middle income communities based on IHS4 data. On average, households in the lower income communities spent USD $13.46 (MWK 9,555) per month, while households in middle-high income communities spent USD $22.96 (MWK 16,301) per month.
Figure 41: Monthly electricity costs for lower income and middle-high income communities
Source: NSO IHS4 oversample, 2016-2017
FGDs complement this survey data with a “snapshot” of current perceptions of energy expenditures and their relationship to choices about energy use at baseline.
Difficult to estimate costs: While participants were asked to estimate their monthly expenditures on different energy sources, the consensus among all FGD participants was that the actual cost of electricity is impossible to calculate due to poor service, blackouts, corruption, and inaccurate meter reading. Furthermore, it is also difficult to compare electricity prices with prices of charcoal, wood, and gas due to differing modalities for distribution and variable pricing depending on the season. Given these findings
89 Values reported in Malawian Kwacha were converted to U.S. dollars via an annual average of the exchange rate for 2016, approximately 1 USD = 710.1 MWK. The historical daily exchange rate was sourced at http://www.exchangerates.org.uk/USD-MWK-exchange-rate-history-full.html#.

SOCIALIMPACT.COM 86
and concerns with the survey statistics above, a more observational method or journal based financial tracking method might be required to obtain an accurate estimate of household expenditures on energy.
With some exceptions electricity is recognized as cheaper than charcoal: Despite the difficulties in comparing the prices, over 80 percent of participants in each FGD articulated a belief that electricity is generally less expensive than charcoal. FGD respondents without electricity access were the most vocal about electricity providing good value. Most cited the rising price of charcoal and its scarcity as contributing to this perception. Several respondents compared their current situation using charcoal with past experience as renters in houses with electricity and indicated that using charcoal costs more money.
The exception to the rule is the perception of the cost of cooking items that require simmering for a long period of time. When this topic was raised (by women and youth), other participants agreed that it is not economical to use electricity to cook beans, nsima, or other foods that cook for a long time.
Unfortunately, as noted above, many participants with electricity connections felt like they were not able to obtain the financial benefits for that connection due to irregular supply.
Salient differences by gender and electricity status. In terms of gender, it is clear that men know less about energy prices than women and youth. Consistent with the findings above, participants in non-electric communities were much more likely to think electricity is a better value. Communities with electricity were more mixed in their opinions of the economic benefits of an electricity connection due to frequent outages.
Respondents strongly preferred pre-paid meters. Participants with electricity connections held strong and consistent views about the superiority of pre-paid meters over post-paid meters in terms of cost and household budgeting. This opinion was held in equal measure by respondents with each kind of meter. Pre-paid meters are preferred as users find it easier to budget and easier to see what their actual electricity usage is. While the differences in pre-paid tariff rates are fairly small, most participants also noted that electricity delivered through a pre-paid meter is less expensive than electricity through a post-paid meter.
“Buying charcoal looks cheaper because we buy little by little, but in the end it is a huge cost.” (Man – Zingwangwa traditional)
“If you cook using electricity throughout, you will be committing financial suicide” (Woman – Zingwangwa)
“We usually use charcoal because most of the things we cook take a long time to cook, so it is more
economical to use charcoal than electricity” (Youth – New Katoto)
“Electricity is cheap, but it looks expensive when there are interruptions” (Man – Kanjedza)
“We thought our lives would improve having electrical appliances. Now we are being forced to buy charcoal because electricity is unreliable.” (Woman – Chibavi)

87 SOCIALIMPACT.COM
MCC Malawi: Enterprise Survey and Case Study Community Baseline Report
The major complaints about post-paid meters included: inaccurate meter readings, opportunities for corruption, and the apparent failure of post-paid meters to keep accurate track of electricity usage during periods of frequent blackouts.
7.1.3. Outages and the Quality of Electricity
Outages are a major problem. There was nearly complete agreement among all FGD participants with a connection that electricity outages are very bothersome, seldom announced, and very frequent in every community. Frustration with outages and the lack of communication about them was a major topic of conversation in every FGD. Many participants expressed their frustration, disgust, and anger and most had specific examples of how frequent outages have negatively impacted their lives.
Over 50 percent of participants in the mini-surveys said that electricity service was “getting worse.” Many of those who indicated that electricity service had “stayed the same” said that service had been bad for several years now. Focus groups occurred from May to July of 2015, after the Kapichira II power plant was commissioned, and prior to a major increase in outages in 2016 with a drop-in water levels in the Shire River and subsequent drop in generation. This is to say that the power system should have been at its peak capacity at the time of the FGDs.
By the time of the NSO IHS4 in 2016 and 2017, loadshedding had increased substantially. Table 33 shows the reported frequency of outages by survey respondents with electricity connections in FGD communities, disaggregated by income. Even though most households reported experiencing outages several times a week, the proportion of those in the lower income communities that experienced outages every day is much higher than those in the middle-high income communities. Nonetheless, in the event of an outage, respondents chose candles for lighting and charcoal for cooking as their back-up energy source regardless of socioeconomic class (Table 34 and Table 35).
“There are blackouts daily, but your bill doesn’t change.” (Man – Zingwangwa)
“Post-paid is expensive because meter readers are inaccurate or cheat.” (Woman – Kanjedza)
“It happens that the whole week, electricity is reliable only three days.” (Woman – Chibavi)
“Our biggest challenge ….is that the power supply is unpredictable.” (Man – Area 18B)

SOCIALIMPACT.COM 88
MCC Malawi: Enterprise Survey and Case Study Community Baseline Report
Table 33: In the last 12 months, how frequently did you experience blackouts in your area?
Lower income communities
Middle-high income
communities Total
Never 4% 3% 4%
Every day 27% 17% 23%
Several times a week 48% 70% 57%
Several times a month 21% 9% 16%
n 254 166 420
Source: NSO IHS4 oversample, 2016-2017
Table 34: In the event of a black out, what source of energy do you use for lighting?
Lower income communities
Middle-high income
communities Total
Firewood 0% 1% 0%
Paraffin 0% 1% 0%
Candles 81% 78% 80%
Other (Specify) 19% 20% 19%
Torch 0% 1% 0%
n 254 166 420 Source: NSO IHS4 oversample, 2016-2017
Table 35: In the event of a black out, what source of energy do you use for cooking?
Lower income communities
Middle-high income
communities Total
Charcoal 91% 93% 92% Firewood 9% 3% 6% Gas 0% 2% 1% Other (Specify) 0% 1% 1% Number of observations 253 164 417
Source: NSO IHS4 oversample, 2016-2017
ESCOM does not communicate outages. FGD participants complained that ESCOM did not do an effective job announcing the outages. Many commented that they used to listen to the announcements on the radio or look for them in the newspaper, but they have stopped doing so because they never appear to be accurate. Outages were described as “random” and “too frequent to count.” During many of
89 SOCIALIMPACT.COM
MCC Malawi: Enterprise Survey and Case Study Community Baseline Report
the FGDs, participants had a hard time arriving at consensus on the frequency and length of outages, but they consistently reported frustration with their inability to plan in advance and be prepared.
Power surges damage appliances. Participants also reported multiple examples of damaged appliances due to voltage fluctuation. At least one or two individuals in each group indicated that they had filed formal complaints with ESCOM, but most others indicated that they did not think it would be worth the effort since ESCOM never appears to reimburse people for damaged equipment. In the past, ESCOM did have a policy of reimbursement; however, this no longer appears to be the case. Gender and age differences. All groups are impacted by electricity outages, but the impacts differ according to age, gender, and to a somewhat lesser extent, socioeconomic status. As one woman noted:
Women are dependent on electricity for many household chores, and outages create major challenges for them:
Youth focused most of their comments on the negative impacts of electricity outages on their studies. Since most outages seem to happen during meal preparation, many youth report missing dinner and having difficulty concentrating as a result.
Other challenges include the costs of candles and batteries (to provide light to study in the evening) and the need to travel to schools or churches with electricity to study in the evenings. Girls report that they are especially disadvantaged because their parents do not allow them to leave home after dark. As a result, they are unable to study when blackouts occur. These issues are discussed in greater detail in the next section.
“Imagine a blackout at 10pm. Where do you buy a candle at that time?” (Man – Zingwangwa)
“Us women, who mostly use electricity, need it for cooking; for the children to go to school; and the husband needs to prepare to go to work.” (Woman – Area 25C)
“Poor ESCOM services bring inconveniences. For example, you want to iron clothes in the morning or you want to prepare breakfast and you find that electricity is off. Switching to another source of energy takes more time…we could be doing things at appropriate times.” (Woman –
Chibavi)
“We eat late, so we fail to study. We just sleep.” (Youth – Area 18B)

SOCIALIMPACT.COM 90
MCC Malawi: Enterprise Survey and Case Study Community Baseline Report
7.1.4. Time Use
FGD participants were asked to create a timeline of their activities from 18:00 to 24:00 on a typical weekday night. Across all three regions and within all three types of economic communities, overall time usage patterns during these hours are very similar. Within each community, time usage patterns are clearly linked to Malawian social norms concerning gender and age-based division of labor. Not surprisingly, women, men, and secondary school students exhibit different time use patterns during the 18:00-24:00 time frame. Consequently, each group is impacted differently by the lack of electricity during this time period. Table 36 illustrates the predominant patterns of time usage and preferred activities, gleaned from the FGD data.
Table 36: Predominant time use patterns across males, females, and secondary students
Men Women Secondary Students
18:00 Relaxing or doing busy work Cooking Cooking/Household Chores
19:00 Eating Eating Eating
20:00 Socializing/Leisure Time Chores/ Leisure Time Studying
21:00 Socializing/Leisure Time Chores/ Leisure Time Studying or Sleeping
22:00 Sleeping Sleeping Sleeping
23:00 Sleeping Sleeping Sleeping
Source: Primary FGD data, 2016
Frequent evening blackouts throw off family schedules. Across regions, most participants agreed that the most frequent time for blackouts was between 18:00-20:00. Respondents also reported this as the most inconvenient time. Blackouts at this specific hour directly impact the ability to cook the evening meal, and the inability to cook has multiple ‘downstream’ impacts with respect to housework, preparation for the next day, and family dynamics.
Women are most impacted. Because women typically use their evenings for cooking, bathing children, and doing housework, outages during this time have a major impact on women. Outages not only impact the immediate period of time but also make it more difficult to complete preparations for the next day. They add to the time burden that women face and dramatically decrease the amount of leisure time women have.
“If you have electricity, you clean your plates immediately. Mopping the house is also possible and even washing clothes you can do. Then in the morning, you just take care of the children.”
(Woman – Zingwangwa)

91 SOCIALIMPACT.COM
MCC Malawi: Enterprise Survey and Case Study Community Baseline Report
Women in middle-high income communities, who tend to be employed outside the house, report that they often return from work to a house that has no electricity, making the evening chores much more challenging to complete. These women are also unable to study or complete work on their computers in the evenings.
Women in low income communities complain of the inefficiencies of waiting for the maize grinding facility to open or needing to cook meals twice because electricity ruins the nsima when the power goes out.
Poor electricity appears to aggravate social problems. Unlike women, men focus most of their time on leisure pursuits and income generating activities. The lack of electricity during evening hours leads to behavioral patterns which men themselves recognize as inappropriate and potentially damaging to the family. When men find that there is no electricity at home, they leave the household to pursue leisure activities elsewhere. Many report that this leads to drinking alcohol at bottle shops, carousing with friends, “getting in to trouble”, and “doing things we should not do.”
In addition to the direct impact on their time, many men also commented on how the lack of electricity between 18:00-24:00 also makes it difficult for the household to be prepared to be successful the next day. They were especially focused on their preparedness for work and school. As with middle-high income women, middle-high income men are also unable to use computers in the evenings because of poor electricity.
Among the youth, multiple participants in communities without electricity discussed the linkage between youth misbehavior and lack of electricity. Some boys also mentioned a pattern of leaving the household in the evening to pursue leisure time in a location with electricity. They mentioned watching movies or television but also indicated that such pursuits sometimes land them in trouble.
“You return home from hard work and you want to watch the news, listen to the radio, etc. But there is no power. As such, you are forced to go out again to pass time and sometimes you land yourself
in trouble.” (Man – Zingwanga)
“When you are home and you want to relax with your family, you find that there is a blackout then you start to wonder what you will do. It’s better to go to the bottle shop where there is
electricity…that’s what disturbs our program at home.” (Man – New Katoto)
“I also fail to work at night because of power blackouts. I am therefore forced to wake up the following morning and work to meet the deadline for my reports. My boss is always on my neck
because of power blackouts.” (Man – Area 25C)
“Those of us without electricity, we go out moving up and down…we end up getting caught by the police or the community security personnel.” (Boy – Zingwangwa traditional)

SOCIALIMPACT.COM 92
Poor electricity means less time for study, which is particularly harmful for young women. Youth have household responsibilities during these hours, including assisting with cooking and bathing younger siblings. Such tasks are made more difficult/labor-intensive when electricity supply is inconsistent. However, secondary students complain that lack of electricity in the evenings negatively impacts their ability to study and perform well in school most directly.
While both boys and girls are disadvantaged by the lack of electricity in the evening, girls suffer more because their parents are much less likely to allow them to go outside the household to study in a different location. Over 50 percent of boys in most FGDs indicated that they frequently study at school, at church, or another community location with electricity. Girls are not allowed to study in these locations after dark and are disadvantaged to a greater degree by the lack of electricity.
Households without power lose valuable evening hours. The most significant finding is the striking difference in the bed time between households with and without electricity. Almost 100 percent of women, men, and youth in households without electricity report going to sleep by 21:00. In contrast, virtually 100 percent of respondents in the households with electricity report a bedtime of 22:00 or later.
Across all households without electricity, women generally report that they would use this “extra” hour for cleaning, doing laundry, or helping children to prepare for the next day. Men generally report that they would use this time for socializing or relaxing at home (e.g., talking with their children). Youth indicate that they would like to use this time to study.
“As a student, the most important things we use electricity for is studying” (Youth – New Katoto)
“We need electricity, especially when studying. It becomes difficult when there is a blackout because sometimes we don’t have money for batteries or lighting” (Youth – Area 25C)
“I perform better in school when there are no blackouts.” (Youth – 25C)
“We girls cannot be allowed to go out to study at night. My parents will not allow me.” (Girl – Kabwabwa)
“We just wanted to add that we indeed go to sleep very early just because even if you wanted to clean your plates at night, you can’t do that, how do that while in the darkness? You just go and
sleep, waiting for morning to come.” (Woman – Zingwangwa Traditional)

SOCIALIMPACT.COM 93
MCC Malawi: Enterprise Survey and Case Study Community Baseline Report
7.2 Core Question 1: What declines in poverty, increases in economic growth, reductions in the electricity related cost of doing business, increases in access to electricity, and increases in value added production are observed over the life of the Compact?
While the enterprise survey explored the relationship between electricity and the costs of doing business with businesses in the formal economy, the FGDs explored how electricity challenges affect household businesses in the informal economy. Every FGD included multiple participants who relied on electricity for a home-based business, and these individuals were asked additional questions. Types of businesses included: food production (pastries, popcorn, popsicles); sales of goods (mobile phone credit, used clothing); and services (carpentry, welding, mechanical). There was a clear consensus amongst these respondents that at baseline the lack of electricity and the lack of reliability of the electrical supply currently limit their profits, their productivity, and their ability to expand their business in the future.
The current electrical supply system limits potential profits. First, the fluctuation of electrical current and supply creates business losses through spoilage of perishable inputs and products. Second, frequent outages limit productivity in energy-intensive businesses (e.g., growing chickens for sale). Third, the lack of electricity increases the cost of inputs since business owners are forced to pay for other sources (e.g. batteries or ice blocks to preserve inventory). Fourth, the early evening time of most blackouts occurs precisely during the time of greatest potential demand for most businesses. These concerns are illustrated in the following quotes.
Many participants expressed a wish to create new businesses or to expand existing ones. However, without consistent electricity, most participants are reluctant to try new economic ventures.
“I sell samosa and preparation is done in the evening. So if there is no electricity in the evening, it means preparation will not be done. I try to use candle light…but I do not prepare as much as I do
while using electricity.” (Woman – New Katoto)
“For chickens to grow well, there is a need for enough light. So if ESCOM can help minimize these blackouts, we will be having a lot of profits” (Man – Chibavi)
“Business is slow due to lack of electricity and when darkness comes, you close the business while
with electricity, you continue until you feel it is time to rest.” (Man – Zingwangwa traditional)
“Electricity is not reliable. You cannot start a fresh product business, such as selling drinks. Nobody likes warm drinks. Barbers need electricity. Many people don’t invest in some businesses because
of unreliable electricity.” (Man – Zingwangwa)
“My wish is to do a business raising chickens, but I am currently discouraged because chickens require heat from electricity for them to grow. “ (Woman – 18B)

SOCIALIMPACT.COM 94
For middle-high income participants, poor electricity means less time for computer-based work. In addition to the small business challenges described above, many men and women in the middle-income communities also cited the need for more consistent electricity supply to be able to utilize their computers during the evening hours. Computer use is important for two main reasons: 1) to complete work assignments, including reports, and 2) to complete online courses to support professional growth and small business development.
7.3 PSRP Question 6: Does ESCOM realize improvements in effectiveness and efficiency over the five years of the Compact in procurement, outage response, processing new connections, and response to customer problems? To what extent can observed gains be attributed to the Compact? If there are no improvements or the improvements are minimal, why?
To obtain baseline data for this question, focus group participants were asked about their experience with ESCOM in responding to outages and establishing new connections. Data generated through the FGDs complements data collected from ESCOM and the enterprise survey.
7.3.1. Outage Response and Customer Service
ESCOM service is perceived to be poor and not improving. Approximately two thirds of all participants in every FGD reported that ESCOM customer service and outage response is either the same or worse than in the past. (Only about one third say that it is improving.) The worst customer service is associated with meter reading, bill disputes, fixing damaged appliances, and re-connecting service that has been disconnected by ESCOM. Participants had slightly more favorable views of ESCOM’s responses to reports of faults and outages.
There is strong consensus that ESCOM customer service is poor or very poor. Respondents cite long wait times, inefficient processes (e.g. separate lines for each step in the transaction), rudeness, and lack of responsiveness among employees. Most participants expressed frustration and resignation at the futility of attempting to have ESCOM address problems.
Figure 42 shows that that that majority of IHS4 respondents with electricity connections in FGD communities felt ESCOM is not responsive to the needs of households, a result that held across communities of all socio-economic groups.
“Why should we waste our time going to ESCOM while you know that you will not be helped? It is better to stay home” (Woman – Chibavi)

95 SOCIALIMPACT.COM
MCC Malawi: Enterprise Survey and Case Study Community Baseline Report
Figure 42: Would you agree or disagree with the following statement: On the whole ESCOM is responsive to the needs of households like mine? (n=406)
Source: NSO IHS4 oversample, 2016-2017
Figure 43 shows that respondents with electricity connections are divided in terms of their satisfaction level with ESCOM, with more than half of respondents in both the lower income communities and middle-high income communities saying they are dissatisfied or very dissatisfied with ESCOM. Participants spoke at some length about possible explanations for the lack of high-quality customer service at ESCOM. Some felt that the organization was under-staffed. Others felt that the government failed to hold ESCOM accountable. Several FGDs discussed the monopoly status of ESCOM and argued for increased competition that could make the utility more responsive to customer requests.
Figure 43: How satisfied are you with ESCOM? (n=420)
Source: NSO IHS4 oversample, 2016-2017

SOCIALIMPACT.COM 96
FGD participants were frustrated by the number of outages (and amount of load shedding) but even more frustrated by the lack of adequate communication from ESCOM about planned outages. (See Section 7.5 for more detail.)
Women are more likely than men to report poor treatment from ESCOM staff. Unlike men and youth, many women report that they feel that ESCOM staff are rude and disrespectful to them when they attempt to make a customer service request.
While women describe feeling disrespected by ESCOM staff, most men indicate that they do not even bother to contact ESCOM because they think it will be a waste of time and money (e.g., paying for mobile phone time to make the call).
7.3.2. Obtaining a Connection
Connecting new customers to the grid has been one of ESCOM’s historic weaknesses (See PSRP Baseline Report). Survey respondents without electricity connections in FGD communities were asked why they did not have connections. While many did not answer this question, the most common response was the cost of connecting.
Figure 44 shows the distribution of time households had to wait to get electricity from the time of application among the 50 respondents that reported having applied for a connection. The wait times varied considerably with some households receiving connections within as little as one or two weeks. The median wait time was ten weeks and the average wait time was 25 weeks, almost six months. Wait times were short in middle-high income communities, where adding a connection typically only requires installing a drop-line and meter to the household and can be done relatively quickly.
‘They do not treat you in a proper manner. They can just tell you to sit somewhere and wait…they don’t even care how long you stay there.’ (Woman – Kanjedza)
“ESCOM staff are very boastful. They shout at us as if we are kids.” (Woman – 25C)

SOCIALIMPACT.COM 97
MCC Malawi: Enterprise Survey and Case Study Community Baseline Report
Figure 44: Distribution of wait to get electricity (weeks after electricity application), n=50
Source: NSO IHS4 oversample, 2016-2017
The original sampling protocol for FGDs of individuals without electricity called for recruiting individuals who had applied for an electricity connection but not yet obtained it. This would help ensure that FGDs of those with electricity and without electricity were similar in terms of income (they could both afford a connection) and in terms of motivation (they had both taken steps to obtain a connection.) Unfortunately, this protocol was only strictly followed in the Northern region. In Lilongwe and Blantyre, many participants in the focus group for those without electricity connections had not applied for a connection. As such, below we focus more attention on the focus group in the Mzuzu community of Nkhrongo.
ESCOM failure to connect households in a timely fashion is a major source of frustration. In most FGDs of participants without electricity connections, 75 percent of participants or more rate ESCOM efforts to connect households as poor or very poor. Participants were noticeably frustrated and quite emotional during this section of the discussion. This issue generated by far the greatest level of discussion of all the FGD topics. Most participants ultimately blamed the lack of responsiveness in providing electrical connections on corruption. (See additional data on corruption in the subsequent section.)
For example, in Nkhrongo, of the eight male participants who report that they have applied and paid for the electricity connection, six (75 percent) rate ESCOM’s attempts to connect them as “very poor” while
“You apply for electricity. Then for them to come and do the connection, you have to struggle and eventually you get tired.” (Woman – Area 25C)
“It is not good. You have constructed a house and you are waiting for electricity for four years. What
are you going to be doing in that house? Impossible!” (Man – Kanjedza)
“For me, I just tell my children to get used to candles.” (Man – Zingwangwa traditional)

SOCIALIMPACT.COM 98
one participant rates them as “fair” and one as “good.” Women in Nkhrongo report a similar pattern, with 100 percent reporting that they have applied, paid for the connection, and submitted the certification about the wiring. Half of participants rate ESCOM’s efforts as “fair” while 50 percent rate it as “poor” or “very poor.” Some respondents indicate that they initially applied as far back as 2010 (five years earlier).
Participants mistrust the various reasons given by ESCOM for the delay in providing connections. These include: poor voltage; lack of capacity; lack of cables; long waitlists; and lack of time.
Corruption is perceived to be a driver of inadequate responsiveness. Participants cite their own suspicions about the real reasons for the delay including: corruption; lack of ESCOM capacity; role of social connections in getting service; and a preference for connecting bigger and more affluent houses. (Additional data about experience with and perceptions of corruption is presented in the next section of the report.)
7.4 PSRP Question 7: Is there a reduction in opportunities for corruption and/or a perception of corruption in procurement, service extension, and billing over the five years of the Compact? To what extent can observed gains be attributed to the Compact? If there are no gains or gains are minimal, why?
Corruption is perceived to be commonplace. The topic of corruption came up repeatedly in many different sections of most FGDs.90 Participants expressed a general consensus that ESCOM personnel often resort to corruption (small and large) when interacting with the public. In several discussions, participants laughed knowingly when others utilized common slang expressions for asking for bribes.
Specific transactions and services are more closely linked with bribery, including establishing a new connection, re-establishing disconnected service, meter reading, and installation of pre-paid meters. The qualitative data suggest that participants believe that post-paid meters are much more susceptible to corruption than pre-paid meters due to the reliance on meter-reading. Ironically, they also report that 90 Facilitation about this topic was inconsistent and corruption was not specifically asked about in each focus group. While the subject of corruption did come up in each and every FGD, in the FGDs where it was explicitly asked about, participants were vociferous and detailed in their descriptions of the many examples of corruption among ESCOM personnel.
“They tell you their own reasons that you cannot even know. Since I am not an electrician, next time they will tell me something else.” (Woman- Nkhrongo)
“One keeps following on until your shoes are worn out, but electricity is still not connected. The reason is that they demand something in order to be assisted.” (Woman – Zingwangwa traditional)
“It is not that they literally ask you for a bribe but when you are talking, you see it clearly that they need the money. So you pay in a certain way like ‘transport money.’” (Man – Chibavi)

99 SOCIALIMPACT.COM
MCC Malawi: Enterprise Survey and Case Study Community Baseline Report
because the demand for pre-paid meters outstripped the supply at the time of data collection, the process of switching from post-paid to pre-paid meters also presents a substantial opportunity for corrupt practices.
Respondents in the IHS4 oversample were asked if they had to pay any unofficial payments to receive a connection. Of the 50 respondents that reported seeking a connection, 11, or 22 percent reported paying an unofficial payment, including three in middle-high income areas and seven in middle-low income areas. Given that some respondents might not have wanted to admit to paying a bribe, the actual number might be higher.
Participants were highly distrustful of ESCOM staff, attributing their tendencies to both personal attributes and structural issues. Several people mentioned the likelihood of high-level corruption and collusion with senior government officials.
Knowing the right people also matters. Participants also describe a subtler form of favoritism in which social connections at ESCOM are the key to successful interaction. Many participants told stories of needing to mobilize individual contacts at ESCOM to get problems resolved. Conversely, people reported that the lack of personal connections made them feel that ESCOM was never going to resolve their problems. People in middle-low income communities also argued that services were always better in higher income areas.
“For ESCOM to put a pre-paid meter at your house, you have to bribe them. Where is the transparency here?” (Woman – Kanjedza)
“What matters most is money. If you have money, connection is easy. They ask a bribe even if you
have paid for reconnection after disconnection. They tell many stories.” (Woman – Chibavi)
“They are thieves. They tell each other to go and disconnect the houses where they did not get the bribes.” (Man – Kabwabwa)
“It is rare to see blackouts in rich people’s areas.” (Youth – Area 18B)
“I think these ESCOM people just hates us Chibavi people. They should just tell us what they think we should pay them.” (Youth – Chibavi)

SOCIALIMPACT.COM 100
MCC Malawi: Enterprise Survey and Case Study Community Baseline Report
7.5 PSRP Question 8: Does the quantity and quality of ESCOM communications with the public and the transparency of ESCOM increase over the life of the Compact? To what extent do Compact efforts to improve communications contribute to observed improvements? If there are no improvements or improvements were minimal, why?
At baseline, the FGDs showed almost universal agreement that ESCOM currently does a poor, or very poor, job of communicating planned outages. Virtually all participants reported that they no longer pay attention to ESCOM announcements because they are no longer accurate or useful. Participants described past ESCOM communications as more efficient and more accurate. Currently, they indicate that the blackouts are so frequent and unpredictable that ESCOM appears to not have a communication strategy. Most participants indicated that they think the communication is getting worse, not better.
In several FGDs, participants took it upon themselves to recommend other forms of communication that ESCOM might utilize. These included: public address system (such as that used by the water board) and SMS messages to affected customers. Participants complained that ESCOM needs a toll-free line on which to report outages.

SOCIALIMPACT.COM 101
MCC Malawi: Enterprise Survey and Case Study Community Baseline Report
8. CONCLUSIONS This section synthesizes conclusions drawn from the enterprise survey and focus group discussion findings and is organized by question. The evaluation questions cannot be fully answered until endline data analysis; however, we either offer preliminary responses or summarize baseline findings. Several core questions can only be addressed at endline, including: Core Q2: What were the results of the intervention? Core Q4: What were the lessons learned and are they applicable to other similar projects? Core Q5: What is the likelihood that the results of the Project will be sustained over time?
The answers to the various PSRP and IDP questions together address Core question 3: Are there differences in outcomes of interest by gender, age, and income? Sex and income disaggregated information for businesses and households will be pursued to the extent possible. The survey and FGDs were designed to examine the differences in outcomes across these categories, and these disaggregations are reflected throughout our analysis of baseline outcomes. Household-level results were disaggregated by gender, income and age. We disaggregated the enterprise-level outcomes by sex of respondent and customer type (a proxy for business size); for certain outcomes we disaggregated by business size categories based on number of employees.
The enterprise survey results together serve to provide baseline evidence for Core question 7: At the enterprise level, the evaluation shall focus on the impact of the program/project/activities on: business profitability and productivity; value added production and investment; employment and wage changes; energy consumption and sources of energy used; business losses. Since Core question 7 focuses on estimating the impact of project activities on business outcomes, it will be addressed at endline; the baseline values for the outcomes of interest are presented below within the answers to IDP and PSRP questions.
As in the report, the questions are in topical rather than numeric order.
IDP Q2: What are beneficiary businesses’ consumption/expenditures patterns for different types of energy? How do consumption/expenditure patterns change as a result of improved electricity?
Business energy consumption: Electricity is a high priority for Malawian businesses, many of which depend heavily on electricity. Beyond electricity, the second most commonly energy source is biomass fuel (e.g., charcoal, firewood), used by 14 percent of firms. Insufficient or unreliable electricity supply inhibits enterprises’ ability to operate at full capacity and threatens growth. When asked which elements of the business environment present obstacles to growth, 50 percent of respondents in our survey cited the quality and reliability of electricity as the biggest obstacle, and 27 percent as the second biggest obstacle.
Business electricity expenditures: Electricity expenditures were significantly higher for MD customers, with the median MD firm spending around $29,538 in the year prior to the survey on electricity, compared to a median three-phase customer that reported spending $1,867.91 Electricity expenditures represented 48 percent of all costs for the median three-phase customer and seven percent for the median MD customer. The high percentage of electricity expenses among three phase customers is primarily driven
91 Kwacha values were converted to U.S. dollars via an average daily exchange rate based on each firm's reported financial year(s).

SOCIALIMPACT.COM 102
by maize mills, which make up a large proportion of the sample and for whom electricity costs represented 54 percent of costs (median). However, it is important to note that many respondents refused to answer question about financials and we have concerns with the expenditure estimates provided by some respondents. At endline, we plan to examine ESCOM consumption data, which may be a more reliable measure of firms’ electricity consumption and expenditures.
Core Q1: What declines in poverty, increases in economic growth, reductions in the electricity related cost of doing business, increases in access to electricity, and increases in value added production are observed over the life of the Compact?92
Businesses
Outages: Electricity dependent businesses are vulnerable to power outages, which are more common during the rainy season. There are challenges measuring outages through a survey. Most firms did not track outages, and these reported much higher incidence of outages in a typical month than those that kept records. Firms that did not track outages reported experiencing a mean of 14 (median of 12) outages in a typical month in the rainy season, and a mean of eight (median of 10) outages in the dry season. These estimates were higher than the frequency of outages estimated by firms that tracked outages. These firms reported an average of seven outages (median of five) per month in the rainy season, and a mean of four (median of three) in the dry season. Three-phase customers reported slightly more frequent outages than MD customers, which lasted longer on average. This is consistent with expectations, as some MD firms are located along industrial lines that are prioritized during loadshedding, and there is some indication that ESCOM is more responsive to MD firms in responding to outages.
Response to outages: In response to these outages, businesses were forced to totally shut down their operations 74 percent of the time and partially shut down 16 percent of the time. Businesses were able to continue operating with minimal disruption in only ten percent of cases. Generators allowed many firms to maintain operations during outages. Only 18 percent of firms with generators reported experiencing a total or partial shutdown of business during power outages, compared with 85 percent of firms without generators.
Despite their utility, only 25 percent of sampled firms reported using or owning generators. Most MD customers used generators (65 percent), compared to only 13 percent of three-phase customers, and not surprisingly larger firms were far more likely to use generators. The cost of fuel is the largest expense associated with running a generator. In the previous year, the median medium sized business reported spending $1,713 on generator fuel, while the median large business spent $4,012 a year. MD customers spent significantly more than three-phase customers (median $3,585 vs. $974, respectively). In addition to fuel, generator maintenance represents another significant expenditure for businesses. In the previous year, the median large business spent a reported $686 to maintain their generator, the median medium business spent $202, small business $95, and the median micro business spent $24 on maintaining their generators.
Outages can also affect business by causing delays in firms receiving inputs from suppliers. Fifteen percent of firms reported instances in the last year in which their suppliers were delayed in delivering
92 For this report we focus on the costs of outages. Changes in poverty and economic growth asked in the question will be tracked using the WB’s Country Dashboard to obtain poverty trend (both by international and national standards) in Malawi. We are unfortunately not able to speak to changes in value added production, as we were not able to measure inputs and outputs. We do, however, look at new investments and employee growth in IDP Q3.

103 SOCIALIMPACT.COM
MCC Malawi: Enterprise Survey and Case Study Community Baseline Report
inputs due to power outages. Firms that were 100 percent foreign-owned were more likely to experience delays in supplier delivery. Outages substantially affected firms’ ability to provide goods and services to clients on time; 80 percent of firms were delayed in providing goods or services in the last year due to power outages. Those with generators were much less likely to experience delays in providing goods or services to clients.
Costs of outages: As firms completely or partially shut down or switch to generators, they incur a variety of costs, including idle workers, damaged equipment from power surges, surge protection equipment, other costs, and lost revenue, although not technically a cost. As shown in Table 37, we estimate that outages cost the median firm $718 over the course of a year. Outage costs were much higher for MD customers. Although three-phase customers had lower costs associated with outages than MD customers in each category, the difference was most pronounced in lost revenue. Idle workers during outages were the second most commonly cited cost. Fifty-nine percent of firms reported that the firm bears the cost of idle workers during an outage, while 22 percent of firms (almost entirely three phase firms) reported that workers make up the lost time later. The median cost of idle workers for MD customers ($686) is over 50% greater than that of three-phase customers ($430). Approximately a third of the firms surveyed reported experiencing damage to equipment in the last 12 months due to electricity issues such as power surges. The cost of fixing or replacing items damaged from power irregularities was significantly higher for MD customers, with the median MD firm that incurred damage spending $1,605, and the median three phase firm spending $358 in the last year as a result of the damage. Many firms also invested in surge protection equipment. Other costs of outages cited by firms included destruction of raw materials, lost output, restart costs, and others. These costs were especially high for MD customers.
Table 37: Costs of outages by type of cost and customer type
Total Three phase MD N Median N Median N Median
Lost revenue 542 $764 463 $716 79 $7,159 Idle worker costs 407 $131 359 $430 48 $686 Damage costs 336 $361 247 $358 89 $1,605
Surge protection costs 376 $95 232 $84 144 $716 Other costs 218 $430 152 $322 66 $3,580
Total outage costs (including generator) 1024 $718 780 $656 244 $7,938
Low Voltage: Respondents reported occasional problems with low voltage, with approximately a third of firms having reported low voltage once to several times a month, while 15 percent reported having issues with low voltage once a week or more often. Firms in the North experienced low voltage most frequently. Approximately 80 percent of firms in the North and South reported that low voltage had a major impact on their business. Three phase customers were more likely to report major impacts to their business compared to MD customers. Firms with a generator were much less affected by low voltage.

SOCIALIMPACT.COM 104
MCC Malawi: Enterprise Survey and Case Study Community Baseline Report
Households
While the enterprise survey explored the relationship between electricity and the costs of doing business with businesses in the formal economy, the FGDs explored how electricity challenges affect household businesses in the informal economy. FGDs suggest that the current electrical supply system limits potential profits in several ways. First, the fluctuation of electrical current and supply creates business losses through spoilage of perishable inputs and products. Second, frequent outages limit productivity in energy-intensive businesses (e.g.: growing chickens for sale). Third, the lack of electricity increases the cost of inputs since business owners are forced to pay for other sources (e.g.: batteries or ice blocks to preserve inventory). Fourth, the early evening time of most blackouts occurs precisely during the time of greatest potential demand for most business. In addition, poor electricity means less time for computer-based work for middle-income participants.
Core Question 6: At the household level, the evaluations shall focus on the following program/project/activities impacts on households and individuals: income; expenditures; consumption and access to energy; individual time devoted to leisure and productive activities.
Energy consumption, access to energy, and energy use. The 2013 Integrated Household Survey (IHS) finds that only 9.1 percent of Malawian households and 36.8 percent of urban households have access to electricity, the lowest figures in the world. The FGDs make clear that even those with access to electricity strongly prefer electricity but rely on a mix of energy sources that includes charcoal and firewood due to unreliable and poor-quality electrical supply. There was only negligible evidence of a cultural preference for charcoal.
Energy expenditures. While participants were asked to estimate their monthly expenditures on different energy sources, accurate measures of expenditures could not be obtained without more intensive measurement efforts. Over 80 percent of participants in each FGD articulated a belief that electricity is generally less expensive than charcoal; however, many participants felt that charcoal was more cost effective for cooking items that require simmering for a long period. Participants with electricity connections held strong and consistent views about the superiority of pre-paid meters over post-paid meters in terms of cost and household budgeting.
Outages and quality of electricity. There was almost 100 percent agreement among FGD participants that electricity outages are frequent, seldom announced, and problematic. Frustration with outages and the lack of communication about them was a major topic of conversation in every FGD. Across regions, most participants agreed that the most frequent time for blackouts was during peak demand between 18:00-20:00, which is problematic for families’ evening routines. Furthermore, over 50 percent of participants in the mini-surveys said that electricity service was “getting worse.” Participants also reported multiple examples of damaged appliances due to voltage fluctuation.
Time usage. FGD participants were asked to create a timeline of their activities from 18:00 to 24:00 on a typical weekday night. Not surprisingly, women, men, and secondary school students exhibit different time use patterns. Blackouts in the evening directly impact the ability of women to cook the evening meal, bathe children, and do housework. A woman in Zingwangwa said: “We indeed go to sleep very early just

105 SOCIALIMPACT.COM
MCC Malawi: Enterprise Survey and Case Study Community Baseline Report
because even if you wanted to clean your plates at night, you can’t do that, how do that while in the darkness? You just go and sleep, waiting for morning to come.” Outages not only impact the current period of the outage but also make it more difficult to complete preparations for the next day. Unlike women, men focus most of their evening time on leisure pursuits and productive activities. The lack of electricity during evening hours causes men to leave the house in the evening and leads to behavioral patterns which men themselves recognize as inappropriate and potentially damaging to the family. A man in New Katoto explained, “When you are home and you want to relax with your family, you find that there is a blackout then you start to wonder what you will do. It’s better to go to the bottle shop where there is electricity…that’s what disturbs our program at home.” For youth, poor electricity means less time for study, which is particularly harmful for young women who generally do not leave the house in the afterhours. A Kabwabwa girl said, “We girls cannot be allowed to go out to study at night. My parents will not allow me.” Compared with their peers with electricity connections, households without power lose valuable evening hours and tend to go to sleep at an earlier hour.
IDP Q3: Do beneficiary businesses change investments or alter their workforces following improvements in electricity reliability?
Business investments: About a third of firms reported making substantial new investments in the previous year. The median value of capital investment was $4,916 for three phase firms and $37,515 for MD firms. For firms making an investment, the most popular investment was purchasing or renting new equipment or tools (44 percent of investing firms) or building new structures (40 percent), followed by purchasing or renting additional land (26 percent), upgrading existing structures (22 percent) and hiring more workers (21 percent). There were substantial differences by customer type, with MD firms more likely to make investments in the purchase of new equipment and hiring workers compared to three phase firms. When asked why it was a good time to invest, the majority of respondents among the firms that invested reported the main reason they did so was high demand or access to markets: 69 percent of MD firms and 63 percent of three phase firms. The second most salient reason depended on the customer type. For MD firms, high internal capacity of the firm was the most common reason to invest, cited by 44 percent, while for three phase firms access to financing was the second most cited reason (cited by 39 percent of firms). Only one percent of MD customers and five percent of MD customers cited reliable electricity as a main driver of their investment.
Among firms that did not invest, the most commonly reported reasons why firms had not made new investments were lack of access to finance (45 percent), and a low demand or access to markets (39 percent). In contrast to three-phase customers, a large fraction of MD customers (31 percent) cited poor macroeconomic/political climate as a major reason they did not make new capital investments. Three-phase customers were more likely than MD customers to cite lack of access to finance or to markets as an explanation. A fifth of the firms cited the poor reliability of electricity supply as a reason not to make investments. There was no significant relationship observed between satisfaction with electricity service and investment choice, which suggests that electricity was probably one of many factors in investment choices among surveyed firms.
Employment and labor costs: In terms of employment, the median MD firm grew from 54 employees in the previous year to 60 employees in the most recent calendar year. The median three phase firm remained stable at three full time employees. Overall, the mean employment growth was eight percent,
SOCIALIMPACT.COM 106
or an increase in two employees over the previous year. Median growth rates were similar across regions. While these results suggest a positive trajectory for employment at baseline, it is important to note that the firms in our sample only represent surviving firms. While our survey did not obtain wage information, we collected information on labor costs. Within our sample, the median MD customer spent $64,730 on labor costs in last year, while the median three phase customer spent $859. The median three phase firm spent $286 per year per full time employee, while the median MD firm spent $1,182 per full time employee in the latest year.
Financial status: The ES also included questions on revenues and costs for multiple years. As expected, many firms were unwilling to provide this information. To increase comparability between baseline and endline and to minimize the problems of missing data, we have opted to examine perceptions of financial status: economic outlook and satisfaction with profits and revenues. The answers were normally distributed. Firms in the Central region were slightly more likely to be satisfied with their profits and revenue, and MD customers were slightly more likely to be satisfied. While satisfaction with revenue and profits did not differ for firms with and without a generator, firms with a generator had a more positive economic outlook, with only 15 percent of firms with generators having a negative outlook versus 30 percent of firms without a generator. IDP Q4: Does beneficiary male and female entrepreneurs’ satisfaction with ESCOM improve over the life of the Compact? Do these entrepreneurs perceive an improvement in the quality of electricity over the life of the Compact? What factors explain variation in satisfaction with ESCOM?
Business satisfaction: Most respondents reported dissatisfaction with the electricity supply at their facility, with only 33 percent of three phase customers and 41 percent of MD customers reporting they were satisfied with their supply. Northern firms, maize mills, and females were less likely to report satisfaction with supply. Not surprisingly then, firms also expressed high levels of dissatisfaction with ESCOM itself; nearly two-thirds of respondents were either dissatisfied (41 percent) or very dissatisfied (21 percent). Respondents were more dissatisfied with ESCOM than any other utility, including the Roads Authority, Water Board, and Malawi Telecommunications.
Variation in satisfaction: To explain variation in satisfaction with ESCOM, we tested several factors using ordinal logistic and logistic regression. Not surprisingly, the reliability of electricity matters the most to business respondents in Malawi in their evaluation of ESCOM: the odds of dissatisfaction with ESCOM are estimated to be nine times greater if a respondent is very dissatisfied with the quality of supply than if he or she is satisfied with supply. The quality of electricity, measured by the frequency of voltage problems, has a weak and generally statistically insignificant relationship with satisfaction, as does perceptions of whether the electricity situation has improved. This latter finding is concerning, as it suggests that customers’ views towards ESCOM might be based on many years of less than ideal service. If so, it might take several years of consistent improvements for perceptions of ESCOM to change.
Evaluations of ESCOM communications have a moderately strong relationship with overall satisfaction with ESCOM. Those who have experienced billing issues with ESCOM are also more likely to express dissatisfaction. Controlling for other factors, those who perceive corruption to be a major problem have a 73 percent probability of dissatisfaction with ESCOM. Those who perceive tariff rates to be unfair are more likely to be dissatisfied with ESCOM, although the magnitude of this effect is more modest. This also presents a challenge for ESCOM, as tariff rates will only continue to rise.
107 SOCIALIMPACT.COM
MCC Malawi: Enterprise Survey and Case Study Community Baseline Report
While many firm attributes have no correlation with satisfaction with ESCOM, two important exceptions include the size of the firm and its location. Micro businesses, those employing less than five employees, were the most likely to be dissatisfied with ESCOM. One possible explanation for this finding is that while many of these firms depend on electricity they likely lack the influence that their larger peers have. Dissatisfaction is greatest in the Central region where ESCOM’s supply has been the most problematic and Southern respondents generally view ESCOM better than their Northern and Central peers. The type of firm (whether industrial, a maize mill, or a restaurant/hotel), the ownership of the firm or type of connection or line and use of generator had no statistically significant relationship with satisfaction. Gender and education levels do not influence views towards ESCOM; younger respondents are less likely to be dissatisfied with ESCOM. In sum, dissatisfaction seemed overwhelmingly driven by the quality of supply; however, perceptions and experiences with fault response, communications, corruption, and billing problems, also contributed to the dissatisfaction, offering opportunities for ESCOM to improve satisfaction in ways other than improving supply.
PSRP Q6: Does ESCOM realize improvements in effectiveness and efficiency over the five years of the Compact in procurement, outage response, processing new connections, and response to customer problems? To what extent can observed gains be attributed to the Compact? If there are no improvements or the improvements are minimal, why?
Businesses
Fault response: The majority of firms (80 percent) reported calling ESCOM to report a fault in the last 12 months, and firms in the North were slightly less likely to call ESCOM to report faults than firms in Central and South regions (74 percent versus 80 percent). Of the firms calling to report faults, the vast majority called the faults number; however, calls are also made to customer care, personal contacts, and some respondents go in person to the fault center.
We also asked respondents how satisfied they were with ESCOM’s responsiveness to faults. The answers followed a fairly normal distribution: 34 percent were satisfied or very satisfied with ESCOM’s responsiveness with 37 percent were dissatisfied or very dissatisfied. Customers in the North and three-phase customers were less likely to be satisfied with ESCOM’s responsiveness. When asked whether ESCOM’s responsiveness to faults has improved over the past twelve months, many respondents believed it had stayed the same (45 percent); some perceived that fault response had worsened (9 percent) and a large minority (43 percent) believed it had improved. Again, those in the North were less likely to report an improvement. ESCOM’s median response time to fix faults was estimated at 5 hours. Contrary to the perception in the North, the reported response time was actually fastest in the North, with a median response time of only 3 hours.
New connections: Of the sampled firms, 15 percent had solicited a new electricity connection in the last two years. Most requested a three-phase connection (66 percent), 10 percent requested an MD connection, and 24 percent requested a single-phase connection. Of the firms that applied, 54 percent were able to obtain a connection. Although our sample size for this question was small, the success rate appeared to vary by method of application: approximately three-quarters of firms that used a personal contact or a private contractor obtained a connection. By contrast, 56 percent of firms seeking a
SOCIALIMPACT.COM 108
connection via ESCOM Customer care obtained one. Among the firms that received a connection, the median wait time from the date of application to receiving a quote was 2.5 months, and the median wait time from paying for a connection until receiving the connection was an additional three months. The majority of firms who got a connection reported being very dissatisfied or dissatisfied (58 percent) with the process. Among the firms that are still awaiting a connection, the median firm applied and paid for a connection six months ago.
Billing: At the time of data collection, ESCOM was in the process of converting all customers except MD customers to prepaid meters. Within our sample, 63 percent of respondents reported having a prepaid connection, and 34 percent had a postpaid connection. Forty-six percent of postpaid customers reported problems with ESCOM invoices in the last 12 months. Within this group, the most commonly reported problem was incorrect consumption (reported by 61 percent of surveyed postpaid firms), followed by late bills (44 percent), while the third most common problem was an incorrect tariff category (24 percent). Among the prepaid customers, 62 percent of respondents reported having problems with purchasing credit for their prepaid meter in the last 12 months. Within this group more than half of the respondents cited inconveniences purchasing token codes; 32 percent had difficulties due to network issues; and a quarter reported that the prepaid token did not work.
Households
Outage response and customer service. ESCOM service was perceived to be poor and not improving. Approximately two-thirds of all participants in every FGD reported that ESCOM customer service and outage response was either the same or worse than in the past. (Only about one-third said that it was improving.) The worst customer service is associated with meter reading, bill disputes, fixing damaged appliances, and re-connecting service that has been disconnected by ESCOM. Participants had slightly more favorable views of ESCOM’s responses to reports of faults and outages. Women were more likely than men to report poor treatment. A woman in Chibavi said, “Why should we waste our time going to ESCOM while you know that you will not be helped? It is better to stay home.”
New connections. ESCOM failure to connect households in a timely fashion was a major source of frustration. In most FGDs of participants without electricity connections, 75 percent of participants or more rated ESCOM efforts to connect households as poor or very poor. Participants were noticeably frustrated and quite emotional during this section of the discussion. This issue generated the greatest level of discussion of all the FGD topics. Most participants ultimately blamed the lack of responsiveness in providing electrical connections on corruption. A man in Kanjedza said, “It is not good. You have constructed a house and you are waiting for electricity for four years. What are you going to be doing in that house? Impossible!”
PSRP Q7: Is there a reduction in opportunities for corruption and/or a perception of corruption in procurement, service extension, and billing over the five years of the Compact? To what extent can observed gains be attributed to the Compact? If there are no gains or gains are minimal, why?
Business perceptions and experiences: Business respondents perceived corruption within ESCOM to be a significant problem: 64 percent of respondents classified it as a “major problem” and 21 percent identified it as a “problem.” Three phase customers and customers in the South were more likely to characterize corruption as a problem within ESCOM. When asked to react to the statement: “ESCOM
109 SOCIALIMPACT.COM
MCC Malawi: Enterprise Survey and Case Study Community Baseline Report
personnel are more responsive to businesses that provide gifts or make informal payments,” 59 percent agreed or strongly agreed. The majority of respondents (67 percent) also agreed that ESCOM personnel were more responsive to businesses “with personal contacts in ESCOM”. Of the firms that sought a connection in the last two years, 16 percent reported that an ESCOM employee had solicited a gift or informal payment to expedite their connection process.
Household perceptions and experiences: Corruption was perceived to be commonplace among focus group participants, and the topic of corruption arose repeatedly throughout most FGDs. Participants expressed a consensus that ESCOM personnel often resort to corruption (small and large) when interacting with the public. Specific transactions and services are more closely linked with bribery, including establishing a new connection, re-establishing disconnected service, meter reading, and installation of pre-paid meters. Participants also describe a subtler form of favoritism in which social connections at ESCOM are the key to successful interaction. Many participants told stories of needing to mobilize individual contacts at ESCOM to get problems resolved. A Chibavi man explained, “It is not that they literally ask you for a bribe but when you are talking, you see it clearly that they need money, so you pay in a certain way like ‘transport money.’”
PSRP Q8: Does the quantity and quality of ESCOM communications with the public and the transparency of ESCOM increase over the life of the Compact? To what extent do Compact efforts to improve communications contribute to observed improvements? If there are no improvements or improvements were minimal, why?
Business perceptions and experiences: Despite the high frequency of outages, firms reported rarely receiving outage notifications. Firms reported being notified of outages for their facility an average of 1.4 times in the previous three months. MD customers and firms in the South reported more frequent outage notifications than three phase customers or firms in the North. The notifications were not always accurate, and the highest inaccuracies were reported in the Central region. Fifty-five percent of firms reported that outage notifications were accurate “always” or “most of the time.”
Most business respondents characterized ESCOM’s communication with customers as poor. Only four percent of respondents rated ESCOM’s communications as ‘very good,’ with the majority of customers perceiving the communications as poor or very poor. Three phase customers and customers in the North were least satisfied.
Household perceptions and experiences: The FGDs revealed almost universal agreement that ESCOM’s current communication of planned outages is poor to very poor. Virtually all participants reported that they no longer pay attention to ESCOM announcements because they are not accurate or useful. At the time of data collection, they indicated that the blackouts are so frequent and unpredictable that ESCOM appears to not have a communication strategy in place. In several FGDs, participants took it upon themselves to recommend other forms of communication that ESCOM might utilize. These included: public address system (such as that used by the water board); and SMS messages to affected customers. Participants also contended that ESCOM needs a toll-free line on which to report outages.

SOCIALIMPACT.COM 110
IDP Q5: Do the attitudes of beneficiary male and female entrepreneurs’ towards cost-reflective tariffs improve over the life of the Compact? What factors explain variation in beneficiary male and female entrepreneurs’ attitudes towards cost reflective tariffs?
Business attitudes towards tariffs: Responding firms were generally not supportive of current electricity tariffs. Less than one-third of respondents agreed or strongly agreed that the tariffs are a fair price for electricity. When asked if businesses should subsidize electricity for poor households, 43 percent agreed that businesses should be responsible for subsidizing the cost of electricity for poor households. At the same time, nearly three-quarters of firms believed that the government should subsidize electricity costs for businesses, with three phase customers being more likely to be in favor government subsidies than MD customers.
When asked what percent increase in electricity tariffs they would be willing to pay if the number of outages could be reduced (a) by half, or (b) almost entirely eliminated, most respondents indicated some willingness to absorb higher tariffs for improved services. If outages could be reduced by half, the mean increase in tariffs respondents were willing to pay was ten percent and the median increase was five percent. If outages could be almost eliminated, firms were willing to tolerate a larger increase; respondents were willing to pay 21 percent (mean) higher tariffs, with the median respondent willing to pay 10 percent higher tariffs. Firms in the South were more likely to be willing to tolerate a price increase in tariffs.
Explaining variation in attitudes towards tariffs: To shed light on why some firms perceive the existing tariff as fair or support tariff increases for improved electricity services while others do not, we used regression analysis to test the effects of various variables on tariff preferences. The results show that those that are very dissatisfied with the electricity supply have twice the odds of disagreeing that the tariff is fair, suggesting that unreliable electricity is a major driver of dissatisfaction with the cost of electricity. Those that are dissatisfied with electricity supply are not more willing to support tariff increases in exchange for improved service. This is illustrative of a fundamental financing dilemma: improving services requires increased revenue, but consumers do not want to pay more precisely because services are poor.
Respondents who view ESCOM’s response to faults as poor or very poor and those who have experienced billing problems are less likely to agree that the current tariff is fair or to support tariff increases for a reduction in outages. Respondents who view corruption in ESCOM as a major problem have approximately twice the odds of perceiving the current tariff as unfair. Those that do not trust ESCOM to convert tariff increases to improved services have around twice the odds of viewing the current tariff as unfair. Southern firms and Northern firms are more likely than those in the Central region to view the current tariff as fair. Those with high electricity as a percent of total costs are generally less likely to support tariff increases. Respondents above the age of 40 are less likely to support tariff increases and more likely to view the current tariff as unfair. Those with higher levels of education are also more likely to view the tariff as unfair and although it is not statistically significant, they are consistently less likely to support tariff increases.
These results raise major concerns for the future of tariff increases. While there are groups that would favor an increase in tariffs for improved reliability (e.g., firms in the South, mills, firms with a generator), many of the groups that could benefit most from improved services, such as MD firms and firms especially dependent on electricity, oppose such increases, even when controlling for other related factors, such as possession of a generator.
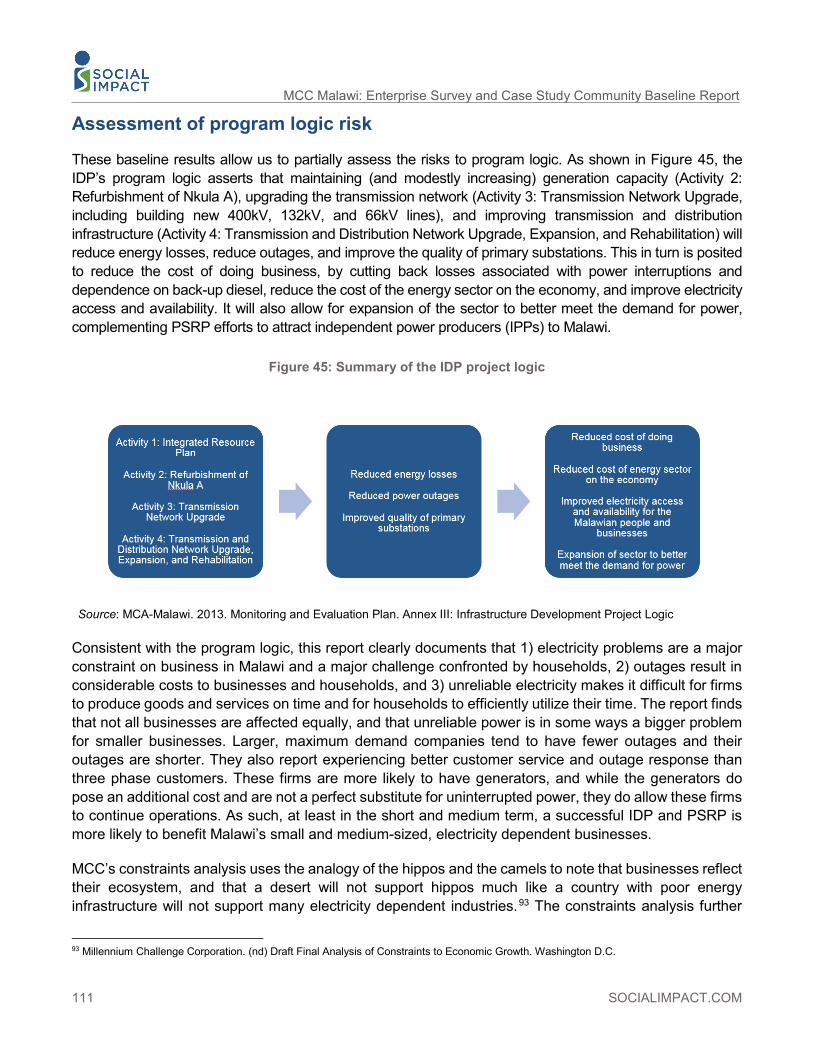
111 SOCIALIMPACT.COM
MCC Malawi: Enterprise Survey and Case Study Community Baseline Report
Assessment of program logic risk
These baseline results allow us to partially assess the risks to program logic. As shown in Figure 45, the IDP’s program logic asserts that maintaining (and modestly increasing) generation capacity (Activity 2: Refurbishment of Nkula A), upgrading the transmission network (Activity 3: Transmission Network Upgrade, including building new 400kV, 132kV, and 66kV lines), and improving transmission and distribution infrastructure (Activity 4: Transmission and Distribution Network Upgrade, Expansion, and Rehabilitation) will reduce energy losses, reduce outages, and improve the quality of primary substations. This in turn is posited to reduce the cost of doing business, by cutting back losses associated with power interruptions and dependence on back-up diesel, reduce the cost of the energy sector on the economy, and improve electricity access and availability. It will also allow for expansion of the sector to better meet the demand for power, complementing PSRP efforts to attract independent power producers (IPPs) to Malawi.
Figure 45: Summary of the IDP project logic
Source: MCA-Malawi. 2013. Monitoring and Evaluation Plan. Annex III: Infrastructure Development Project Logic
Consistent with the program logic, this report clearly documents that 1) electricity problems are a major constraint on business in Malawi and a major challenge confronted by households, 2) outages result in considerable costs to businesses and households, and 3) unreliable electricity makes it difficult for firms to produce goods and services on time and for households to efficiently utilize their time. The report finds that not all businesses are affected equally, and that unreliable power is in some ways a bigger problem for smaller businesses. Larger, maximum demand companies tend to have fewer outages and their outages are shorter. They also report experiencing better customer service and outage response than three phase customers. These firms are more likely to have generators, and while the generators do pose an additional cost and are not a perfect substitute for uninterrupted power, they do allow these firms to continue operations. As such, at least in the short and medium term, a successful IDP and PSRP is more likely to benefit Malawi’s small and medium-sized, electricity dependent businesses.
MCC’s constraints analysis uses the analogy of the hippos and the camels to note that businesses reflect their ecosystem, and that a desert will not support hippos much like a country with poor energy infrastructure will not support many electricity dependent industries.93 The constraints analysis further
93 Millennium Challenge Corporation. (nd) Draft Final Analysis of Constraints to Economic Growth. Washington D.C.

SOCIALIMPACT.COM 112
notes several industries that are lacking in Malawi or have moved away because of unreliable electricity, including heavy sands extraction for light metals, British American Tobacco cigarette manufacturing, the dairy industry, plastics, and textiles. Of the firms in our sample (a representative sample of ESCOM customers) over half (53 percent) were classified as maize mills. As such, the survey confirms that Malawi’s economy is poorly diversified. More reliable electricity will likely incentivize additional investments; however, as the constraints analysis and this survey note, Malawi confronts a host of other challenges to attracting and incentivizing investment (e.g., geographic and importation challenges, macro-economic challenges including a weak currency, political uncertainty, and lack of financing for domestic businesses).
In the short term, the power situation for Malawian businesses and households has worsened since data collection. There has been no major new generation capacity added since Kapichira II, which was commissioned in 2013, and there has been a decrease of generation at existing facilities during 2016 and 2017 due to reduced rainfall. In the meantime, ESCOM has been expanding its customer base, adding around 27,000 new customers each year.94 Demand has been increasing while supply is decreasing. IDP investments in Nkula A and transmission and distribution infrastructure and PSRP generated efficiencies will not likely offset the growth in new customers and decreasing supply. As such, the ability of the Compact to achieve its objectives will depend on the successful creation of an enabling environment and new investment in electricity generation and/or connection to the Southern African Power Pool.
IDP investments are expected to be completed with the Compact in September 2018 while the new solar IPPs are expected to reach financial close in 2018, with the construction and commissioning of new generation sites to take place starting in 2019. The evaluation team is scheduled to begin a second round of enterprise survey and household focus groups beginning in mid-2019. If the Compact is successfully concluded and generation capacity substantially increased, we would expect to see some improvements in terms of a reduction in outages and reduced costs associated with outages. If businesses are confident that these improvements will persist, then we might also observe increases in employment and new investments. Because the survey is a panel, we will not be able to identify new “hippos” that might be investing in Malawi. If there is still uncertainty about the future of the energy sector, then reductions in the costs of outages might not lead to new investment in the short and medium-term.
94 Sabet, Daniel, Michele Wehle, Arvid Kruze, Stella Kalengamaliro and Olga Rostapshova. 2017. Power Sector Reform Project Draft Midline Performance Evaluation Report. Social Impact.

113 SOCIALIMPACT.COM
MCC Malawi: Enterprise Survey and Case Study Community Baseline Report
9. ADMINISTRATIVE 9.1 Institutional Review Board Requirements and Clearances The evaluation received SI IRB approval for the ES and the FGD data collection on May 8, 2015.
9.2 Data Access, Privacy, and Documentation The evaluation team treated the privacy of all participants who participated in data collection with utmost confidentiality throughout the evaluation. To maintain confidentiality and to protect the rights and privacy of those who participated in the enterprise and ESCOM surveys, data files were stripped of identifiers that could permit linkages to individual research participants and excluded variables that could lead to deductive disclosure of the identity of individual subjects. Further, qualitative research methods were designed to protect subjects and guarantee confidentiality to maintain the integrity of the data collection among these groups while minimizing non-response. Transcripts and identifying information were stored in password-protected folders and will not be made publicly available.
SI has prepared clean, raw datasets, to be submitted with the final baseline report. Raw datasets meet the MCC Data Documentation and Anonymization Requirements. Complementary Stata do files will also be submitted to permit replication of data analysis. Data will conform to the documentation requirements outlined in section J.3. of the contract. SI will present and share documents with MCC, MCA-M, and other stakeholders as outlined in the Dissemination Plan below.
In line with MCC’s emphasis on transparency, the findings and data will be shared with the broader donor and development community, contributing to the global knowledge pool and amplifying the utility of this evaluation.
9.3 Dissemination Plan As outlined in SI’s contract with MCC, SI is responsible for several dissemination-related activities, as described below.95
Lead public dissemination efforts: SI will lead public dissemination efforts facilitated by MCA-M and MCC (such as local workshops and conferences), and present at additional conferences to take advantage of other opportunities to publicly disseminate the results of the evaluation. SI will advise MCC on other public dissemination activities and collaborate as appropriate.
Disseminate baseline results: Once the baseline report is reviewed by the Evaluation Management Committee, SI will conduct the following dissemination activities:
• Present baseline results at MCC headquarters and at MCA/Malawi entity headquarters. • SI will review any materials developed by MCC public relations for dissemination on the MCC
website for quality assurance. • If invited, SI will participate in other MCC-funded dissemination and training events, such as MCC
M&E college and MCC Impact Evaluation Workshops.
95 Malawi Performance Evaluation of the Infrastructure Development and Power Sector Reform Projects.

SOCIALIMPACT.COM 114
• In addition to these activities and as detailed above, SI will provide all presentation materials and raw data to MCC upon completion of the evaluation to support learning efforts.
9.4 Evaluation Team Roles and Responsibilities SI is responsible for the overall design, implementation, and dissemination of the evaluation, including the following responsibilities as outlined on page 11 of SI’s contract with MCC:
• Develop a rigorous evaluation design given rules of implementation and feasibility of options • Support MCC and MCA to build buy-in and ownership of evaluation • Develop evaluation materials that are held to international standards • Ensure appropriate review of evaluation materials and research protocols • Manage the data collection firms • Coordinate data collection • Lead data cleaning, analysis, interpretation of results • Produce evaluation reports • Lead public dissemination efforts
The evaluation team comprises technical specialists who provide contributions in their areas of expertise, and headquarters-based staff who support the management and logistics of all aspects of the evaluation. The evaluation team and HQ staff, listed below, work in close collaboration with MCC and MCA-Malawi on all activities and deliverables.
Evaluation Team: Members of the core evaluation team are responsible for contributing to the evaluation design, design implementation, supporting the data collection efforts and in preparing documentation and reports. The Team Leader is responsible for overseeing and guiding the evaluation team’s work to ensure it is of the highest quality, and for compiling and submitting all deliverables to SI HQ for quality assurance. The team’s three sector experts provide input on issues in governance and institutional reform, the power sector, and social and gender issues. The In-Country Coordinator works directly with MCA-Malawi staff to confirm the team’s meetings and interviews and supports the team with data collection efforts when the team is in Malawi. The SI evaluation team consists of the following members:
• Team Leader: Dr. Olga Rostapshova • Governance, Institutional and Reform Expert: Dr. Daniel Sabet • Social and Gender Expert: Patricia Delaney • In-Country Coordinator: Aaron Mapondera
SI Headquarters Staff: The SI HQ staff support the evaluation team with technical, managerial and administrative tasks. These tasks include providing in-person oversight of enumerator training, piloting and data collection activities, cleaning the survey data, and managing subcontractors that were hired to conduct data collection. The Program Manager is responsible for ensuring deliverables conform to MCC and MCA-M’s expectations, and that they are submitted in a timely matter. The SI HQ support team is listed below.
• Program Manager: Michele Wehle • Research Assistant: Billy Hoo • Program Assistants: Veronica Mazariegos, Meredith Feenstra, and Julia Kresky

115 SOCIALIMPACT.COM
MCC Malawi: Enterprise Survey and Case Study Community Baseline Report
10. REFERENCES Alam, Muneeza M. “Coping with Blackouts: Power Outages and Firm Choices.” Yale University, 2014.
Allcott, Hunt, Allan Collard-Wexler, & Stephen D. O’Connell. “How Do Electricity Shortages Affect Industry? Evidence from India.” NBER Working Paper No. 19977, 2014.
“Blackouts affect Malawi small scale businesses.” Nyasa Times. September 2015. http://www.nyasatimes.com/blackouts-affect-malawi-small-scale-businesses/#sthash.8uQFKR3V.dpuf
Breidert, Christoph, Michael Hahsler, and Thomas Reutterer. “A Review of Methods for Measuring Willingness-To-Pay.” Innovative Marketing. 2006.
Chakravorty, Ujjayant, Martino Pelli, and Beyza Ural Marchand. "Does the Quality of Electricity Matter? Evidence from Rural India." Journal of Economic Behavior & Organization 107 (2014): 228-47.
Chodzaza, Gilbert E. & Gombachika, Harry S. H. “Service quality, customer satisfaction and loyalty among industrial customers of a public electricity utility in Malawi.” International Journal of Energy Sector Management, Vol. 7, no. 2, 2013: pp. 269-282.
“Climate of Malawi.” Department of Climate Change and Meteorological Services, Ministry of Natrual Resources, Energy and Environment. Retrieved from http://www.metmalawi.com/climate/climate.php.
Cook, Cynthia C., Tyrell Duncan, Somchai Jitsuchon, Anil Sharma, and Guobao Wu. "Assessing the Impact of Transport and Energy Infrastructure on Poverty Reduction." Asia Development Bank. 2005.
Copsey, Nathaniel. “Focus groups and the political scientist.” European Research Institute. European Research Working Paper Series, no. 2, 2008.
Dinkelman, Taryn. "The Effects of Rural Electrification on Employment: New Evidence from South Africa." American Economic Review, vol.101, no.7, 2011: 3078-108.
Eberhard, Anton, Vivien Foster, Cecilia Briceño-Garmendia, Fatimata Ouedraogo, Daniel Camos, & Maria Shkaratan. “Underpowered: The State of the Power Sector in Sub-Saharan Africa.” Washington, DC: World Bank. 2008. https://openknowledge.worldbank.org/handle/10986/7833
ESCOM. “About Us.” http://www.escom.mw/generation.php
ESCOM. Press release. “An Update on the Current Water Levels and the Energy Situation in Malawi.” December 2016. http://www.escom.mw/rainfall-effect-waterlevels.php.
Fan, S. and Nyange, D. and Rao, N. “Public Investment and Poverty Reduction in Tanzania: Evidence from Household Survey Data.” International Food Policy Research Institute, DSGD Discussion Paper 18. April, 2005. Retrieved from https://ageconsearch.umn.edu/record/58373/files/dsgdp18.pdf
Ferguson, R., W. Wilkinson & R. Hill. “Electricity use and economic development.” Energy Policy, no. 28, 2000: 923-934.

SOCIALIMPACT.COM 116
Fisher-Vanden, Karen, Erin T. Mansur, & Qiong (Juliana) Wang. “Costly Blackouts? Measuring Productivity and Environmental Effects of Electricity Shortages.” NBER Working Paper No. 17741, 2012.
Foster, Vivien and Shkaratan, Maria. “Malawi’s Infrastructure: A Continental Perspective.” Policy Research Working Paper 5598. The World Bank. 2011.
Fourth Semi-Annual Review Progress Report January-December 2015. MCA-Malawi Secretariat.
“Full USD MWK exchange rate history.” Retrieved from http://www.exchangerates.org.uk/USD-MWK-exchange-rate-history-full.html#
“Fury, desperation over electricity loadshedding.” The Nation. December 2015. http://mwnation.com/fury-desperation-over-electricity-loadshedding/
Gamula, Gregory E. T. “An Overview of the Energy Sector in Malawi.” Energy and Power Engineering, vol. 5, no. 1, 2013: 44-46.
“Integrated Household Survey 2010-2011.” Household Socio-Economic Characteristics Report. National Statistical Office, Republic of Malawi. September 2012. Retrieved from http://www.nsomalawi.mw/images/stories/data_on_line/economics/ihs/IHS3/IHS3_Report.pdf
Government of Malawi, “Census Main Report,” National Statistical Office, Zomba, 2009. Retrieved from http://www.mw.one.un.org/wp-content/uploads/2014/04/Malawi-Population-and-Housing-Census-Main-Report-2008.pdf
Government of Malawi. “Malawi Biomass Energy Strategy.” January 2009. Retrieved from http://www.euei-pdf.org/sites/default/files/field_publication_file/EUEI_PDF_BEST_Malawi_Final_report_Jan_2009_EN.pdf
Kambewa, Patrick, Bennet Mataya, Killy Sichinga, and Todd Johnson. "Charcoal the Reality: A Study of Charcoal Consumption, Trade, and Production in Malawi." International Institute for Environment and Development (IIED). 2007. Retrieved from http://pubs.iied.org/pdfs/13544IIED.pdf.
Kanagawa, M and Nakata, T. “Assessment of Access to Electricity and the Socio‐economic Impacts in Rural Areas of Developing Countries.” Energy Policy, vol 36, no. 6, 2008: 2016‐2029.
Khandker, Shahidur R., Barnes, Douglas F., and Samad, Hussain A. “Welfare Impacts of Rural Electrification: A Case Study from Bangladesh.” Policy Research working paper no. WPS 4859. Washington DC: World Bank. 2009.
MCC. Draft Final Analysis of Constraints to Economic Growth. Washington D.C.: Millennium Challenge Account, 2009.
Menard, Scott. Applied Logistic Regression. Second edition. (2002).
Mensah, Justice Tei. “Bring Back our Light: Power Outages and Industrial Performance in Sub-Saharan Africa.” Swedish University of Agricultural Sciences. 2016.
Mhango, Lewis B. “New Emerging Issues in the Power Sector in Malawi.” Presented at the Semi-Annual Review of the Millennium Challenge Compact. Ministry of Energy. 2014.

117 SOCIALIMPACT.COM
MCC Malawi: Enterprise Survey and Case Study Community Baseline Report
Millennium Challenge Corporation. Draft Final Analysis of Constraints to Economic Growth. Washington D.C. (nd).
Millennium Challenge Account-Malawi. “MCA-Malawi Progress Report.” Presented at the Semi-Annual Review of the Millennium Challenge Compact. Millennium Challenge Account. 2014.
National Statistical Office. Malawi: Demographic and Health Survey, 2015-2016. 2017.
Oseni, Musiliu O. “Power Outages and the Costs of Unsupplied Electricity: Evidence from Backup Generation among Firms in Africa.” Judge Business School, University of Cambridge. 2012.
Ramachandran, Vijaya, Manju Kedia Shah and Todd Moss. “How Do African Firms Respond to Unreliable Power? Exploring Firm Heterogeneity Using K-Means Clustering.” Center for Global Development Working Paper 493. August 2018.
Sabet, Daniel, Olga Rostapshova, Arvid Kruze, Sarah Tisch, and Michele Wehle. 2014. Evaluation Design Report: Malawi Infrastructure Development and Power Sector Reform Projects. Social Impact.
Sabet, Daniel, Michele Wehle, Arvid Kruze, Stella Kalengamaliro and Olga Rostapshova. 2017. Power Sector Reform Project Draft Midline Performance Evaluation Report. Social Impact.
Saha, Govind. “An Issues Paper on Energy Sector Reform.” Presented at the Second Semi-Annual Review of the Millennium Challenge Compact. 2014. https://data.mcc.gov/evaluations/index.php/catalog/110
Steinbuks J. and V. Foster, “When do firms generate? Evidence on in-house electricity supply in Africa.” Energy Economics, no. 32, 2010: pp. 505-514.
“The Welfare Impact of Rural Electrification: A Reassessment of Costs and Benefits.” Independent Evaluation Group, 2008. Washington DC: The World Bank. Retrieved from http://siteresources.worldbank.org/EXTRURELECT/Resources/full_doc.pdf
The World Bank. 2014. Malawi Access to electricity (% of population). Washington DC: The World Bank. Retrieved from http://data.worldbank.org/indicator/EG.ELC.ACCS.ZS?locations=MW-ZG
The World Bank. Malawi: Country Profile 2014. Washington DC: The World Bank. 2015.
The World Bank. Malawi: Country Dashboard. Poverty & Equity. 2015. Retrieved from http://povertydata.worldbank.org/poverty/country/MWI
The World Bank. 2014. Sub-Saharan Africa: Access to electricity (% of population). Washington DC: The World Bank.
Transparency International. “Corruption Perception Index 2016.” January 25, 2017. Retrieved from https://www.transparency.org/news/feature/corruption_perceptions_index_2016
Transparency International. “People and Corruption: Africa Survey 2015 – Global Corruption Barometer.” December 1, 2015. Retrieved from https://www.transparency.org/whatwedo/publication/people_and_corruption_africa_survey_2015

SOCIALIMPACT.COM 118
USAID. “Technical Note: Focus Group Interviews.” Bureau for Policy, Planning and Learning. November 1, 2013. Retrieved from https://usaidlearninglab.org/library/technical-note-focus-group-interviews-0
Venkatachalam L. “The Contingent Valuation Method: A Review.” Environmental Impact Assessment Review, vol. 24, 2004: 89-124.
Wamukonya, Njeri. “Power Sector Reform in Developing Countries: Mismatched Agendas.” Energy Policy, vol. 31, no. 12, 2003: 1273-289.
Whittington, Dale, John Briscoe, Xinming Mu and William Barron. “Estimating the Willingness to Pay for Water Services in Developing Countries: A Case Study of the Use of Contingent Valuation Surveys in Southern Haiti.” Economic Development and Cultural Change, vol. 38, no. 2, 1990: pp. 293-311.

119 SOCIALIMPACT.COM
MCC Malawi: Enterprise Survey and Case Study Community Baseline Report
11. ANNEXES 11.1 Regression Results
Table 38: Regression models of satisfaction with electricity supply
Model 1 Model 2ii Model 3iii
Dependent Variable Dissatisfaction with ESCOM
Dissatisfaction with ESCOM
Dissatisfaction with ESCOM
Independent Variables Satisfaction with Electricity Supply (Reference category: Very Satisfied/Satisfied)
Neither Satisfied nor Dissatisfied 1.827*** 1.776*** 1.188 (0.384) (0.347) (0.325)
Dissatisfied 5.961*** 5.775*** 8.138*** (1.239) (1.142) (1.995)
Very Dissatisfied 15.63*** 18.85*** 8.796*** (5.314) (6.159) (3.211)
Frequency of low voltages (Continuous) 0.911 0.915 0.872*
(0.0542) (0.0515) (0.0632) Electricity Conditions from last 12 months (Ref: Improved)
Worsened 1.187 1.221 0.922 (0.263) (0.259) (0.277)
Evaluation of ESCOM's responses to faults (Ref: Very Good/ Good)
Fair 1.371 1.395* 1.078
(0.268) (0.262) (0.274) Poor 1.329 1.403* 1.166
(0.264) (0.266) (0.298) Very Poor 3.043*** 3.102*** 4.139***
(0.942) (0.902) (1.873) Evaluation of ESCOM's communication with Customer (Ref: Very Good/Good)
Fair / Poor / Very Poor 1.753*** 1.598*** 2.424*** (0.337) (0.290) (0.547)
Firm experienced Billing Issues Before (=1) 1.701*** 1.509*** 1.752*** (0.262) (0.220) (0.364)
Corruption at ESCOM (Ref: Minor/No Problem at All)
Problem 1.129 1.084 1.729*
(0.251) (0.227) (0.525) Major Problem 1.751*** 1.534** 2.548***

SOCIALIMPACT.COM 120
Model 1 Model 2ii Model 3iii
Dependent Variable Dissatisfaction with ESCOM
Dissatisfaction with ESCOM
Dissatisfaction with ESCOM
(0.360) (0.296) (0.695) Electricity Tariff is Fair (Ref: Strongly Agree/Agree)
Disagree/Strongly Disagree 1.587** 1.507** 1.795*** (0.297) (0.268) (0.396)
Region (Ref: Central) North 1.011 1.035 1.373
(0.192) (0.189) (0.401) South 0.666** 0.732* 0.557***
(0.116) (0.121) (0.126) Firm Size (Ref: Small and Medium)
Micro 1.412* 1.562* (0.282) (0.399)
Large 1.715 1.048 (0.769) (0.663)
Firm is a Non-Mill Manufacturing Firm (=1) 0.825 0.820 0.643
(0.233) (0.218) (0.275) Firm is a Mill Manufacturing Firm (=1) 0.596* 0.583** 0.549
(0.168) (0.146) (0.223) Firm is a Restaurant (=1) 1.395 1.022 0.767
(0.557) (0.367) (0.372) Foreign Owned Firm (=1) 0.926 1.048 1.481
(0.248) (0.276) (0.621) MD Firm (=1) 1.088 0.947 1.300
(0.299) (0.216) (0.553) Firm uses Industrial Line (=1) 0.988 0.854
(0.197) (0.232) Firm uses generator (=1) 0.694 0.671 0.829
(0.228) (0.190) (0.359) Female Respondent (=1) 0.984 0.961 0.735
(0.188) (0.172) (0.195) Respondent's Education (Continuous) 1.128 1.088 1.143
(0.0906) (0.0856) (0.118) Respondent 40 or above (=1) 1.338* 1.321* 1.497**
(0.200) (0.188) (0.300) Constant 0.124***
(0.0785)
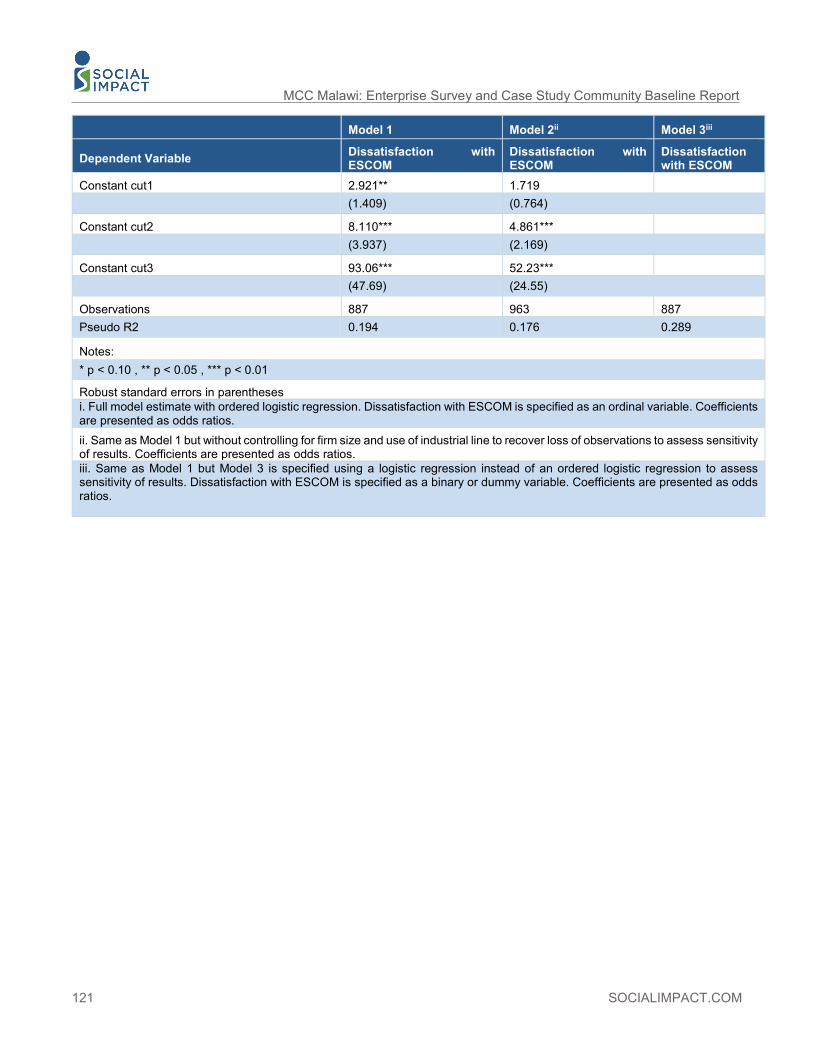
121 SOCIALIMPACT.COM
MCC Malawi: Enterprise Survey and Case Study Community Baseline Report
Model 1 Model 2ii Model 3iii
Dependent Variable Dissatisfaction with ESCOM
Dissatisfaction with ESCOM
Dissatisfaction with ESCOM
Constant cut1 2.921** 1.719 (1.409) (0.764)
Constant cut2 8.110*** 4.861*** (3.937) (2.169)
Constant cut3 93.06*** 52.23*** (47.69) (24.55)
Observations 887 963 887 Pseudo R2 0.194 0.176 0.289
Notes: * p < 0.10 , ** p < 0.05 , *** p < 0.01
Robust standard errors in parentheses i. Full model estimate with ordered logistic regression. Dissatisfaction with ESCOM is specified as an ordinal variable. Coefficients are presented as odds ratios. ii. Same as Model 1 but without controlling for firm size and use of industrial line to recover loss of observations to assess sensitivity of results. Coefficients are presented as odds ratios. iii. Same as Model 1 but Model 3 is specified using a logistic regression instead of an ordered logistic regression to assess sensitivity of results. Dissatisfaction with ESCOM is specified as a binary or dummy variable. Coefficients are presented as odds ratios.
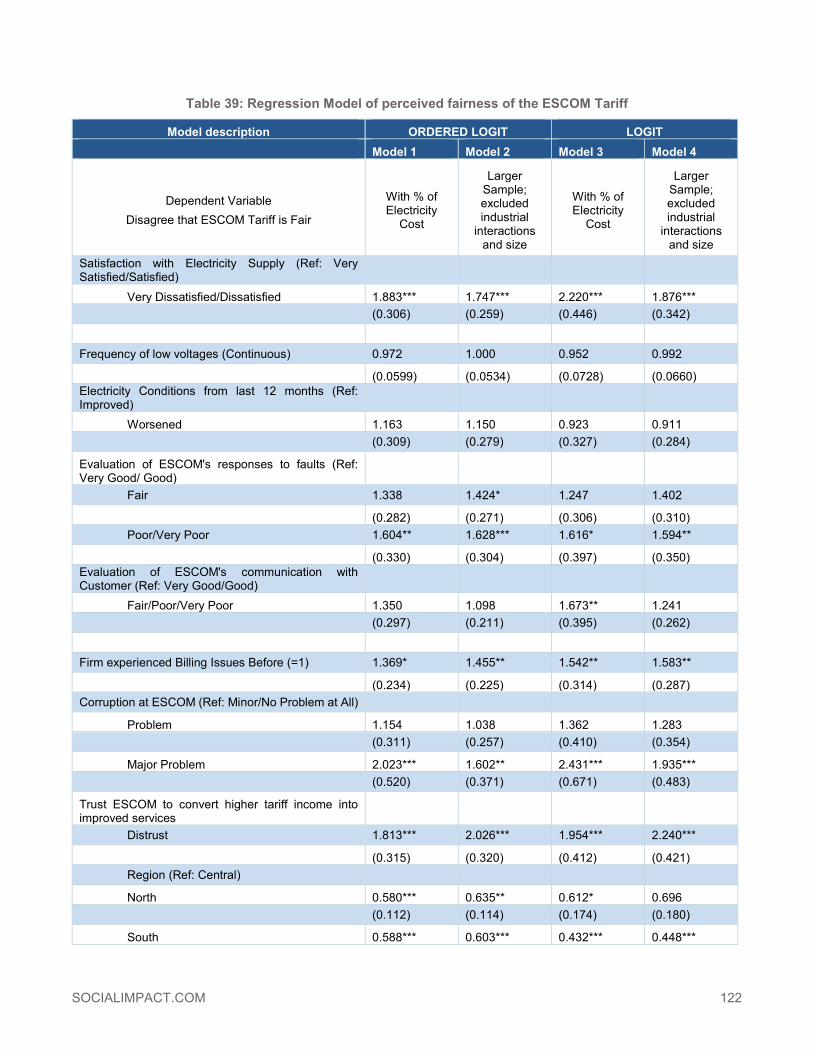
SOCIALIMPACT.COM 122
Table 39: Regression Model of perceived fairness of the ESCOM Tariff
Model description ORDERED LOGIT LOGIT Model 1 Model 2 Model 3 Model 4
Dependent Variable Disagree that ESCOM Tariff is Fair
With % of Electricity
Cost
Larger Sample; excluded industrial
interactions and size
With % of Electricity
Cost
Larger Sample; excluded industrial
interactions and size
Satisfaction with Electricity Supply (Ref: Very Satisfied/Satisfied)
Very Dissatisfied/Dissatisfied 1.883*** 1.747*** 2.220*** 1.876*** (0.306) (0.259) (0.446) (0.342)
Frequency of low voltages (Continuous) 0.972 1.000 0.952 0.992
(0.0599) (0.0534) (0.0728) (0.0660) Electricity Conditions from last 12 months (Ref: Improved)
Worsened 1.163 1.150 0.923 0.911 (0.309) (0.279) (0.327) (0.284)
Evaluation of ESCOM's responses to faults (Ref: Very Good/ Good)
Fair 1.338 1.424* 1.247 1.402
(0.282) (0.271) (0.306) (0.310) Poor/Very Poor 1.604** 1.628*** 1.616* 1.594**
(0.330) (0.304) (0.397) (0.350) Evaluation of ESCOM's communication with Customer (Ref: Very Good/Good)
Fair/Poor/Very Poor 1.350 1.098 1.673** 1.241 (0.297) (0.211) (0.395) (0.262)
Firm experienced Billing Issues Before (=1) 1.369* 1.455** 1.542** 1.583**
(0.234) (0.225) (0.314) (0.287) Corruption at ESCOM (Ref: Minor/No Problem at All)
Problem 1.154 1.038 1.362 1.283 (0.311) (0.257) (0.410) (0.354)
Major Problem 2.023*** 1.602** 2.431*** 1.935*** (0.520) (0.371) (0.671) (0.483)
Trust ESCOM to convert higher tariff income into improved services
Distrust 1.813*** 2.026*** 1.954*** 2.240***
(0.315) (0.320) (0.412) (0.421) Region (Ref: Central)
North 0.580*** 0.635** 0.612* 0.696 (0.112) (0.114) (0.174) (0.180)
South 0.588*** 0.603*** 0.432*** 0.448***

123 SOCIALIMPACT.COM
MCC Malawi: Enterprise Survey and Case Study Community Baseline Report
Model description ORDERED LOGIT LOGIT Model 1 Model 2 Model 3 Model 4 (0.107) (0.0975) (0.101) (0.0918)
Firm Size (Ref: Micro, Small, Medium) Large 2.500** 1.587
(1.165) (0.929)
Firm is a Non-Mill Manufacturing Firm (=1) 0.701 1.055 0.672 1.087 (0.209) (0.277) (0.281) (0.356)
Firm is a Mill Manufacturing Firm (=1) 0.769 1.077 0.750 1.137 (0.229) (0.265) (0.305) (0.361)
Firm is a Restaurant (=1) 0.990 1.398 0.893 1.556 (0.388) (0.412) (0.455) (0.616)
Foreign Owned Firm (=1) 0.543* 0.503*** 0.473** 0.484** (0.199) (0.131) (0.173) (0.144)
Interaction between MD and Industrial (Reference Three-Phase firms) MD Firms MD Firms
MD & Industrial Line 1.749 2.104*** 3.343** 2.539***
(0.613) (0.471) (1.608) (0.743) MD & Not Industrial Line 4.646*** 5.935***
(2.084) (3.996) Firm uses generator (=1) 0.631 0.790 0.695 0.914
(0.190) (0.196) (0.272) (0.291) Percent of Electric Cost 1.864* 1.925
(0.666) (0.880) Female Respondent (=1) 1.114 1.157 1.231 1.360
(0.232) (0.223) (0.332) (0.336) Respondent's Education Categorical (Ref: No Formal Education / Primary School) 1.694**
Secondary School 1.475** 1.219 (0.413) 1.354 (0.292) (0.231) 1.624 (0.301)
Post-Secondary 1.688** 1.725** (0.553) 1.902** (0.444) (0.417) 2.033** (0.614)
Undergraduate 2.915*** 2.300*** (0.710) 1.776* (0.854) (0.605) 1.195 (0.539)
Respondent 40 or above (=1) 1.355* 1.325* (0.239) 1.116 (0.212) (0.192) (0.199)
Constant 1 2.761** 2.358** 0.314** 0.352**
(1.265) (0.947) (0.180) (0.172) Constant 2 30.65*** 24.09***
(14.83) (10.15) Observations 804 960 804 960

SOCIALIMPACT.COM 124
Model description ORDERED LOGIT LOGIT Model 1 Model 2 Model 3 Model 4 Pseudo R2 0.0969 0.0842 0.153 0.129 Notes: For Models 2 and 4, when the Industrial line interactions are removed, the controlled variable becomes MD Dummy (MD=1). Coefficients are presented as odds ratios.

125 SOCIALIMPACT.COM
MCC Malawi: Enterprise Survey and Case Study Community Baseline Report
Table 40: Regression results on support for tariff increase
Model description Q5D: Eliminate Outages by Half Q5E: Eliminate Outages Completely Model 1 Model 2 Model 3 Model 4 Model 5 Model 6 Dependent Variable How much percent increase of tariff will firms be willing to pay to eliminate outages (0-100 percent)
OLS; with Percent of Total Cost
Tobit; with Percent of Total Cost
Tobit; Larger Sample
OLS; with Percent of Total Cost
Tobit; with Percent of Total Cost
Tobit; Larger Sample
Satisfaction with Electricity Supply (Ref: Very Satisfied/Satisfied)
Very Dissatisfied / Dissatisfied -0.717 -0.610 -0.763 -1.487 -1.510 -1.794
(1.135) (1.414) (1.363) (2.067) (2.360) (2.198)
Frequency of low voltages (Continuous) 0.132 0.178 -0.218 0.199 0.242 -0.320
(0.405) (0.496) (0.463) (0.766) (0.860) (0.791) Electricity Conditions from last 12 months (Ref: Improved)
Worsened 1.476 1.758 0.963 4.017 4.850 4.923 (2.068) (2.502) (2.361) (3.595) (4.096) (3.736)
Evaluation of ESCOM's responses to faults (Ref: Very Good/ Good)
Fair -1.583 -1.950 -2.855 -2.321 -2.450 -2.492
(1.549) (1.891) (1.841) (2.644) (2.976) (2.780) Poor/Very Poor -2.685* -3.258* -4.328** -2.120 -2.746 -4.310
(1.615) (1.913) (1.856) (2.855) (3.175) (2.991) Evaluation of ESCOM's communication with Customer (Ref: Very Good/Good)
Fair/Poor/Very Poor 0.926 0.520 2.348 1.793 1.357 3.562 (1.417) (1.690) (1.661) (2.679) (2.963) (2.704)
Firm experienced Billing Issues Before (=1) -2.330** -3.556** -3.377** -5.225** -6.469*** -5.148**
(1.186) (1.465) (1.416) (2.190) (2.475) (2.301) Corruption at ESCOM (Ref: Minor/ No Problem at All)
Problem -2.498 -3.769 -4.032 -3.363 -4.444 -4.555 (2.097) (2.646) (2.543) (3.139) (3.730) (3.515)
Major Problem 0.619 0.911 1.040 3.131 3.579 3.414 (2.093) (2.464) (2.335) (2.990) (3.429) (3.281)
Trust ESCOM to convert higher tariff income into improved services
Distrust -1.041 -2.471 -3.581** -3.299 -5.481** -6.103**
(1.255) (1.520) (1.481) (2.239) (2.533) (2.373) Region (Ref: Central)
North -0.499 0.569 1.284 0.233 2.303 2.976 (1.386) (1.839) (1.735) (2.308) (2.855) (2.649)

SOCIALIMPACT.COM 126
Model description Q5D: Eliminate Outages by Half Q5E: Eliminate Outages Completely Model 1 Model 2 Model 3 Model 4 Model 5 Model 6
South 4.925*** 6.888*** 6.671*** 9.792*** 12.57*** 11.84*** (1.223) (1.617) (1.521) (2.117) (2.578) (2.383)
Firm Size (Ref: Micro, Small, Medium)
Large -2.499 -2.992 -0.253 -1.060
(2.636) (3.496) (5.919) (6.990)
Firm is a Non-Mill Manufacturing Firm (=1) 2.411 1.726 -1.049 2.835 1.945 -1.725
(2.416) (3.149) (2.616) (4.177) (4.947) (4.128)
Firm is a Mill Manufacturing Firm (=1) 5.525** 7.661** 4.526* 7.651* 9.400* 5.362
(2.399) (3.126) (2.405) (4.265) (5.012) (3.848)
Firm is a Restaurant (=1) 5.657 5.277 2.286 6.232 7.126 1.569 (3.517) (4.516) (3.418) (5.111) (5.999) (4.729)
Foreign Owned Firm (=1) -3.556* -3.018 -0.316 -0.888 1.103 2.489 (1.836) (2.651) (2.373) (3.710) (4.332) (3.831)
Interaction between MD and Industrial (Reference Three-Phase firms)
MD & Industrial Line -3.656* -5.150* -4.545** -7.102* -9.330* -6.372*
(2.047) (2.828) (2.068) (4.174) (5.108) (3.251) MD & Not Industrial Line -5.177** -7.271** -7.119* -9.768*
(2.091) (3.327) (4.071) (5.387) Firm uses generator (=1) 3.874 5.622* 3.580 5.129 6.559 3.532
(2.707) (3.314) (2.713) (4.269) (4.879) (4.039) Percent of Electric Cost -7.422*** -9.307*** -7.987 -9.400
(2.853) (3.437) (5.128) (5.741) Female Respondent (=1) 0.900 1.535 -0.146 2.436 2.923 0.134
(1.595) (1.897) (1.777) (2.936) (3.294) (2.935) Respondent's Education Categorical (Ref : No Formal Education / Primary School)
Secondary School 1.450 1.830 1.306 1.683 1.271 1.026 (1.425) (1.756) (1.749) (2.600) (2.927) (2.794)
Post Secondary 1.563 3.394 2.125 1.285 2.781 0.406 (2.056) (2.500) (2.399) (3.504) (3.932) (3.695)
Undergraduate -0.906 -1.166 -2.030 -3.242 -3.926 -5.832 (2.026) (2.593) (2.356) (3.572) (4.110) (3.607)
Respondent 40 or above (=1) -2.935*** -3.360** -3.253** -4.765** -5.468** -4.933** (1.079) (1.354) (1.293) (1.910) (2.200) (2.070)
Sigma (Tobit) 16.43*** 17.08*** 27.73*** 27.92***
(0.939) (0.976) (1.151) (1.096) Constant 9.902*** 6.993* 7.058** 18.25*** 15.47*** 16.15***
(2.952) (3.727) (3.510) (4.995) (5.905) (5.378)

127 SOCIALIMPACT.COM
MCC Malawi: Enterprise Survey and Case Study Community Baseline Report
Model description Q5D: Eliminate Outages by Half Q5E: Eliminate Outages Completely Model 1 Model 2 Model 3 Model 4 Model 5 Model 6 Observations 804 804 960 804 804 960
R2/Pseudo R2 0.097 0.0166 0.0152 0.092 0.0132 0.0126

SOCIALIMPACT.COM 128
Table 41: Predicted Probabilities
Ologit; Pr =Dissatisfied Ologit; Pr =Very Dissatisfied Logit Model; Pr = Dissatisfied and Very Dissastisfied
Delta-method Delta-method Delta-method
Variables Predicted Probabilities
Std. Err.
[95% Conf.
Interval]
Predicted Probabilities
Std. Err.
[95% Conf.
Interval]
Predicted Probabilities
Std. Err.
[95% Conf.
Interval]
Satisfaction with Electric Supply
Satisfied or Very Satisfied 0.35 0.03 0.29 0.41 0.05 0.01 0.03 0.08 0.43 0.04 0.35 0.50
Neither Satisfied not Dissatisfied 0.45 0.03 0.40 0.51 0.10 0.02 0.06 0.13 0.47 0.06 0.36 0.58
Dissatisfied 0.54 0.02 0.49 0.59 0.26 0.03 0.21 0.31 0.86 0.02 0.81 0.90
Very Dissatisfied 0.44 0.05 0.35 0.52 0.48 0.07 0.35 0.60 0.87 0.04 0.79 0.94
ESCOM's responses to faults
Very Good & Good 0.49 0.03 0.44 0.55 0.12 0.02 0.09 0.16 0.64 0.04 0.57 0.72
Fair 0.52 0.03 0.47 0.58 0.16 0.02 0.11 0.20 0.66 0.04 0.58 0.74 Poor 0.52 0.03 0.47 0.57 0.15 0.02 0.11 0.19 0.68 0.04 0.60 0.76
Very Poor 0.53 0.03 0.47 0.59 0.29 0.06 0.18 0.41 0.88 0.04 0.80 0.97
Electricity Tariff is Fair
Disagree/Strongly Disagree 0.48 0.03 0.43 0.54 0.12 0.02 0.08 0.15 0.60 0.05 0.51 0.69
Fair/Poor/Very Poor 0.53 0.02 0.49 0.58 0.17 0.02 0.14 0.21 0.73 0.02 0.68 0.77
ESCOM's communication with Customer

129 SOCIALIMPACT.COM
MCC Malawi: Enterprise Survey and Case Study Community Baseline Report
Ologit; Pr =Dissatisfied Ologit; Pr =Very Dissatisfied Logit Model; Pr = Dissatisfied and Very Dissastisfied
Delta-method Delta-method Delta-method Disagree/Strongly
Disagree 0.47 0.03 0.41 0.53 0.11 0.02 0.07 0.14 0.53 0.05 0.44 0.62
Fair/Poor/Very Poor 0.53 0.02 0.48 0.58 0.17 0.02 0.14 0.21 0.73 0.02 0.69 0.78
Corruption at ESCOM
Minor or Not a Problem 0.48 0.03 0.41 0.54 0.11 0.02 0.07 0.15 0.52 0.06 0.40 0.63
Problem 0.49 0.03 0.44 0.55 0.12 0.02 0.09 0.16 0.65 0.05 0.56 0.74 Major Problem 0.53 0.02 0.49 0.58 0.18 0.02 0.14 0.21 0.73 0.03 0.68 0.78
Firm Size
Small and Medium 0.50 0.03 0.45 0.56 0.13 0.02 0.09 0.17 0.63 0.04 0.55 0.72 Micro 0.53 0.02 0.49 0.58 0.17 0.02 0.14 0.21 0.73 0.03 0.67 0.79
Region
Center 0.54 0.02 0.49 0.58 0.18 0.02 0.14 0.23 0.74 0.03 0.68 0.81 North 0.54 0.02 0.49 0.59 0.18 0.02 0.14 0.23 0.80 0.04 0.73 0.87
South 0.50 0.03 0.45 0.55 0.13 0.02 0.10 0.16 0.62 0.03 0.55 0.69
Mills Manufacturing
Others 0.54 0.02 0.49 0.59 0.20 0.03 0.14 0.27 0.77 0.05 0.66 0.87
Mills-based Manufacturing 0.50 0.03 0.45 0.55 0.13 0.02 0.10 0.17 0.64 0.04 0.57 0.72
Billing Issues
Never had billing issues 0.48 0.03 0.43 0.54 0.12 0.02 0.08 0.15 0.61 0.04 0.54 0.68

SOCIALIMPACT.COM 130
Ologit; Pr =Dissatisfied Ologit; Pr =Very Dissatisfied Logit Model; Pr = Dissatisfied and Very Dissastisfied
Delta-method Delta-method Delta-method
Had billing issues 0.54 0.02 0.49 0.58 0.18 0.02 0.14 0.22 0.73 0.03 0.68 0.78
Age
Less than 40 0.51 0.03 0.46 0.56 0.14 0.02 0.11 0.17 0.65 0.03 0.59 0.71
40 or above 0.53 0.02 0.49 0.58 0.18 0.02 0.14 0.22 0.74 0.03 0.68 0.79 *** Only variables that are significant p<0.05 are selected here

131 SOCIALIMPACT.COM
MCC Malawi: Enterprise Survey and Case Study Community Baseline Report
11.2 Enterprise Survey Instrument This section with firm information should be completed by the enumerator prior to the interview, using information provided by ESCOM and any other available information. The information completed in this section should be verified with the firm during the enumerator visit.
For Enumerator to complete
A1 Interviewer Number
A2 Questionnaire Number
List Account number (s) associated to this firm
A3a Account #1
A3b Account #2 A3c Account #3
List Meter number(s) associated to this firm (List all)
A4a Meter #1 A4b Meter #2
Contact information for individuals (pre-screening)
A5 Name 1 A6 Phone number 1
A7 Name 2 A8 Phone number 2
Address (physical location) Address 2 (if applicable)
A9

SOCIALIMPACT.COM 132
The Screening Instrument will be implemented during the first meeting (when booking appointment to conduct the full survey), BEFORE the pre-interview question module. Enumerators should ask to speak with the MD, owner, or CEO.
Q# Question Option codes Options Instructions to
enumerator Skip patterns
I. Screening Instrument, Introduction and Informed Consent
S1
We are conducting a survey of businesses in Malawi about business challenges – particularly about challenges related to energy and electricity. Your business has been selected to participate in the survey. Before we go any further, we would like you to answer some preliminary questions to make sure that we are in the right place. These initial questions should only take five minutes of your time.
From Pre-interview questions, be sure that you are speaking with either OWNER, MD, CEO
S2 Which of the following categories best applies to the main product or service of this firm.
A Agriculture, hunting and forestry Answer 1b
B Fishing, aquaculture and service activities incidental to fishing
C Mining and quarrying Answer 1c
D Manufacturing Answer 1d
E Electricity, gas and water supply
Answer 1l
F Construction
G
Wholesale and retail trade; repair of motor vehicles, motorcycles and personal and household goods
Answer 1e
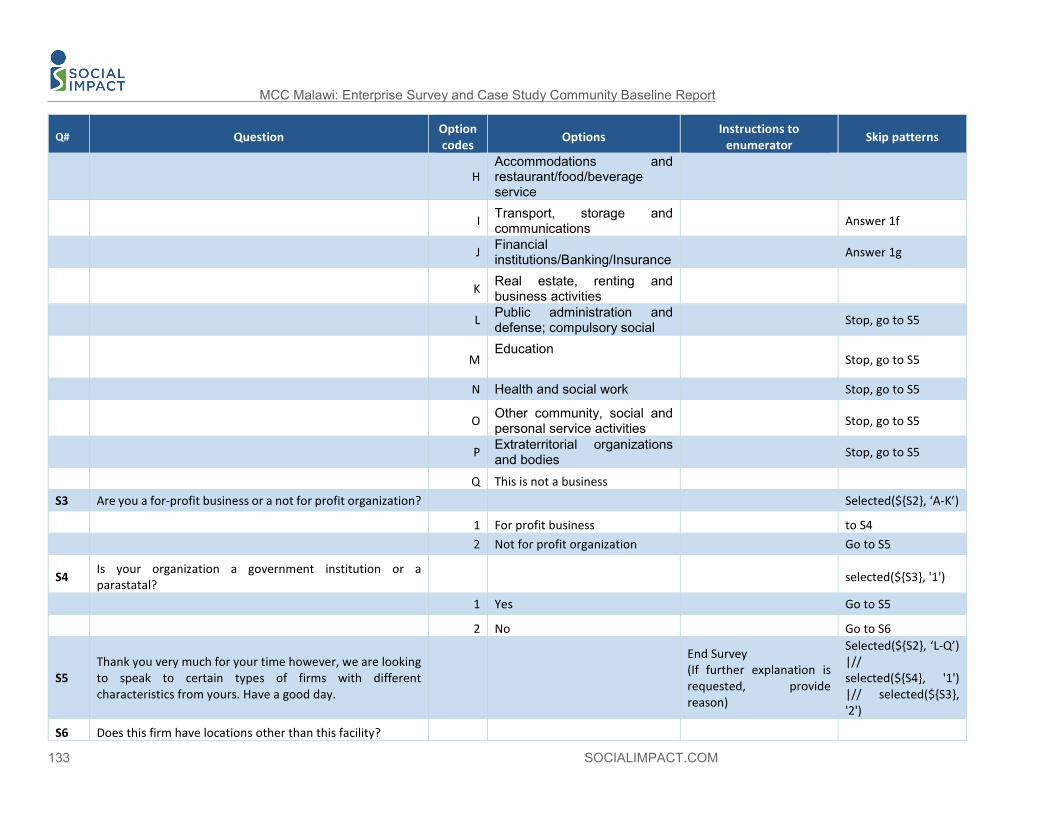
133 SOCIALIMPACT.COM
MCC Malawi: Enterprise Survey and Case Study Community Baseline Report
Q# Question Option codes Options Instructions to
enumerator Skip patterns
H Accommodations and restaurant/food/beverage service
I Transport, storage and communications Answer 1f
J Financial institutions/Banking/Insurance Answer 1g
K Real estate, renting and business activities
L Public administration and defense; compulsory social Stop, go to S5
M Education
Stop, go to S5
N Health and social work Stop, go to S5
O Other community, social and personal service activities Stop, go to S5
P Extraterritorial organizations and bodies Stop, go to S5
Q This is not a business S3 Are you a for-profit business or a not for profit organization? Selected(${S2}, ‘A-K’)
1 For profit business to S4 2 Not for profit organization Go to S5
S4 Is your organization a government institution or a parastatal? selected(${S3}, '1')
1 Yes Go to S5
2 No Go to S6
S5 Thank you very much for your time however, we are looking to speak to certain types of firms with different characteristics from yours. Have a good day.
End Survey (If further explanation is requested, provide reason)
Selected(${S2}, ‘L-Q’) |// selected(${S4}, '1') |// selected(${S3}, '2')
S6 Does this firm have locations other than this facility?

SOCIALIMPACT.COM 134
Q# Question Option codes Options Instructions to
enumerator Skip patterns
1 Yes Go to S7
2 No Go to S9 S7 How many other facilities do you have?
Numeric S7>0
S8
In the survey we would like to ask you a series of questions about electricity challenges at this facility. If, however, there is another facility that uses substantially more electricity than this facility, please let us know and we can focus the questions on this other facility. Is there another facility with substantially higher electricity consumption?
For example, the interview might take place at a commercial outlet selling goods from a manufacturing plant. Alternatively the interview might take place at an office for a mining operation. In these cases, the survey should focus on the plant and mining facility. As a rule of thumb, consumption should be at least three times greater to switch.
selected(${S6, '1')
1 Yes 2 No
S9 What facility will be the focus of the survey? Do not ask this question, simply record the result
1 This facility
2 Another facility (specify) If another facility, specify which facility and location. If S8=1 then S9==2
String
S10
Great! We would like to include your firm and XXXX facility in our survey. The survey includes broad questions about the firm, detailed questions about electricity use, and questions about company finances. In some firms we conduct the interview with one person who is knowledgeable on these issues and with other firms we speak with different people, each knowledgeable about some issues. Who do you recommend we should talk with to complete this survey? What is the best way to contact the individual(s) who will be
Share the pre-interview questionnaire with the interviewee.
Record name and contact information for the interviewee. Record date/time of interview, if set.

135 SOCIALIMPACT.COM
MCC Malawi: Enterprise Survey and Case Study Community Baseline Report
Q# Question Option codes Options Instructions to
enumerator Skip patterns
interviewed? May I schedule a time to speak with this person now? Can I have his/her phone number?
If the respondent is not knowledgeable about the facility where the interview is to take place then thank the person for his/her time and request contact information for the other facility.
MUST READ INFORMED CONSENT: Thank you for taking the time to meet with us today. My name is [NAME] and I am working with Invest in Knowledge Initiative (IKI). We are conducting a survey of businesses in Malawi. We will be asking you questions about the challenges that businesses confront and opportunities for future growth and investment. We are particularly interested in electricity related challenges and will be asking you a number of questions about outages, your response to outages, and energy related costs. Our study is funded by the Millennium Challenge Corporation (MCC), an agency that provides assistance to other countries' development projects, and is being carried out by Social Impact and IKI. Time: The interview is expected to take between 1 hour and 1.5 hours. In addition, we would like to come back in a couple of years and conduct a similar survey again to see how things have changed. Informed consent: There are a few things that I would like to note before we get started: 1. Any information you provide that can identify you or your firm will be kept strictly confidential by the parties conducting this study, including MCC employees, employees of the survey firm, and researchers to the maximum extent permitted by the laws of the United States of America and the laws of Malawi. These users will use the information provided for statistical purposes only. 2. The information that you and others provide will be used to write a report that will be shared with you and made public. 3. While many of the questions are multiple choice, a handful of questions are open ended. For example, we might ask you in what ways electricity presents a
selected(${S4}, '2') &selected(${S3}, '1')
Prompt
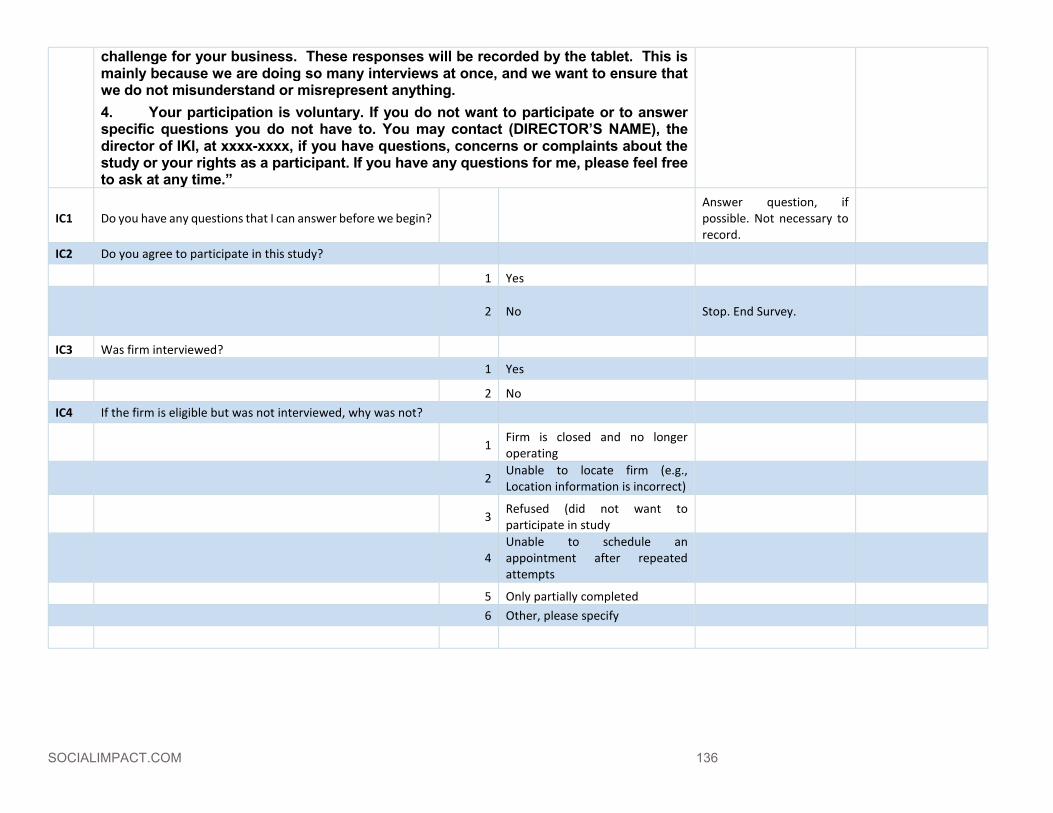
SOCIALIMPACT.COM 136
challenge for your business. These responses will be recorded by the tablet. This is mainly because we are doing so many interviews at once, and we want to ensure that we do not misunderstand or misrepresent anything. 4. Your participation is voluntary. If you do not want to participate or to answer specific questions you do not have to. You may contact (DIRECTOR’S NAME), the director of IKI, at xxxx-xxxx, if you have questions, concerns or complaints about the study or your rights as a participant. If you have any questions for me, please feel free to ask at any time.”
IC1 Do you have any questions that I can answer before we begin? Answer question, if possible. Not necessary to record.
IC2 Do you agree to participate in this study?
1 Yes
2 No Stop. End Survey.
IC3 Was firm interviewed? 1 Yes
2 No IC4 If the firm is eligible but was not interviewed, why was not?
1 Firm is closed and no longer operating
2 Unable to locate firm (e.g., Location information is incorrect)
3 Refused (did not want to participate in study
4 Unable to schedule an appointment after repeated attempts
5 Only partially completed 6 Other, please specify

137 SOCIALIMPACT.COM
MCC Malawi: Enterprise Survey and Case Study Community Baseline Report
Q# Question Option codes Options Instructions to
enumerator Skip patterns
II. General Questions: Firm, and Business Environment
Attributes of the Firm
1 We would like to begin with some introductory questions, are you ready to answer this “General Questions: Firm, and Business Environment” Section?
1 Yes
2 No 1a What is the full name of this firm? Selected (${A2}, ‘1’)
String
1b Which of the following categories best applies to the main product or service of this AGRICULTURE, HUNTING AND FORESTRY firm.
Show card 1b selected(${S2}, 'A')
1 Agriculture, hunting and related service activities
2 Forestry, logging and related service activities
3 Other
1c Which of the following categories best applies to the main product or service of this MINING AND QUARRYING firm. Show card 1c selected(${S2}, 'C')
1 Mining of coal and lignite; extraction of peat
2
Extraction of crude petroleum and natural gas; service activities incidental to oil and gas extraction, excluding surveying
3 Mining of uranium and thorium ores
4 Mining of metal ores
5 Other mining and quarrying 6 Other
1d Which of the following categories best applies to the main product or service of this MANUFACTURING firm. Show card 1d selected(${S2}, 'D')

SOCIALIMPACT.COM 138
1 Manufacture of food products and beverages
2 Manufacture of tobacco products
3 Manufacture of textiles
4 Manufacture of wearing apparel; dressing and dyeing of fur
5
Tanning and dressing of leather; manufacture of luggage, handbags, saddlery, harness and footwear
6
Manufacture of wood and of products of wood and cork, except furniture; manufacture of articles of straw and plaiting materials
7 Manufacture of paper and paper products
8 Publishing, printing and reproduction of recorded media
9 Manufacture of coke, refined petroleum products and nuclear fuel
10 Manufacture of chemicals and chemical products
11 Manufacture of rubber and plastics products
12 Manufacture of other non-metallic mineral products
13 Manufacture of basic metals
14 Manufacture of fabricated metal products, except machinery and equipment
15 Manufacture of machinery and equipment n.e.c.
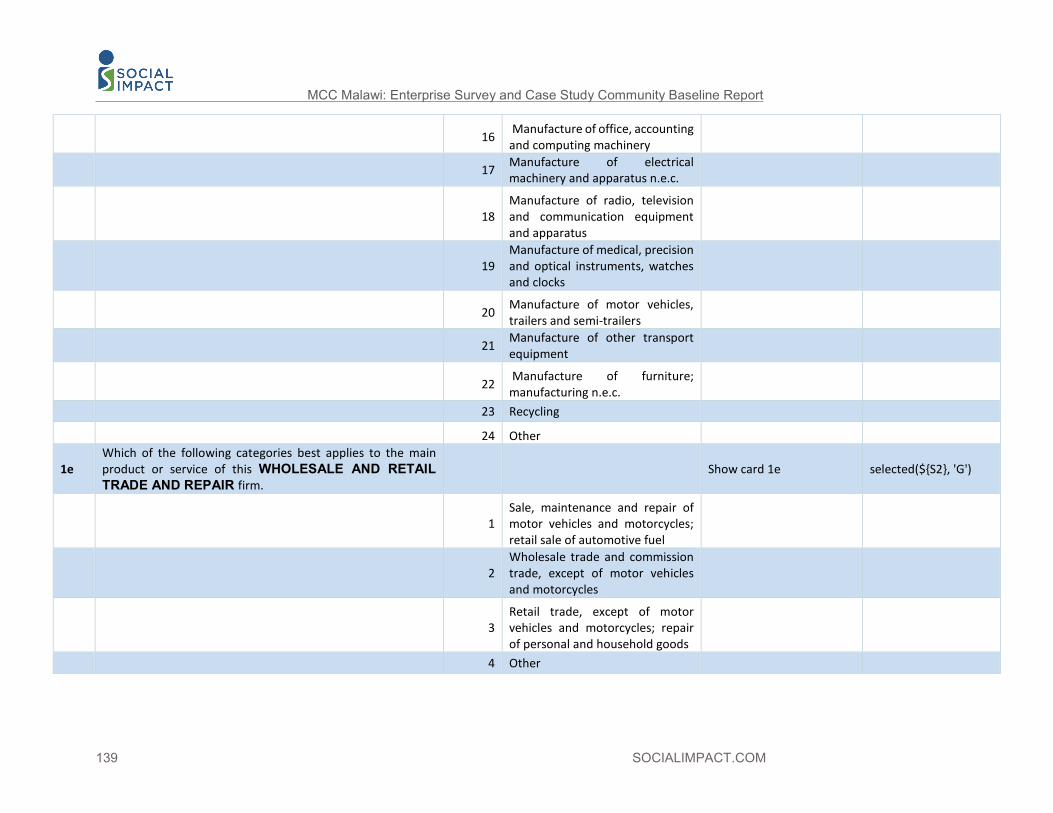
139 SOCIALIMPACT.COM
MCC Malawi: Enterprise Survey and Case Study Community Baseline Report
16 Manufacture of office, accounting and computing machinery
17 Manufacture of electrical machinery and apparatus n.e.c.
18 Manufacture of radio, television and communication equipment and apparatus
19 Manufacture of medical, precision and optical instruments, watches and clocks
20 Manufacture of motor vehicles, trailers and semi-trailers
21 Manufacture of other transport equipment
22 Manufacture of furniture; manufacturing n.e.c.
23 Recycling
24 Other
1e Which of the following categories best applies to the main product or service of this WHOLESALE AND RETAIL TRADE AND REPAIR firm.
Show card 1e selected(${S2}, 'G')
1 Sale, maintenance and repair of motor vehicles and motorcycles; retail sale of automotive fuel
2 Wholesale trade and commission trade, except of motor vehicles and motorcycles
3 Retail trade, except of motor vehicles and motorcycles; repair of personal and household goods
4 Other
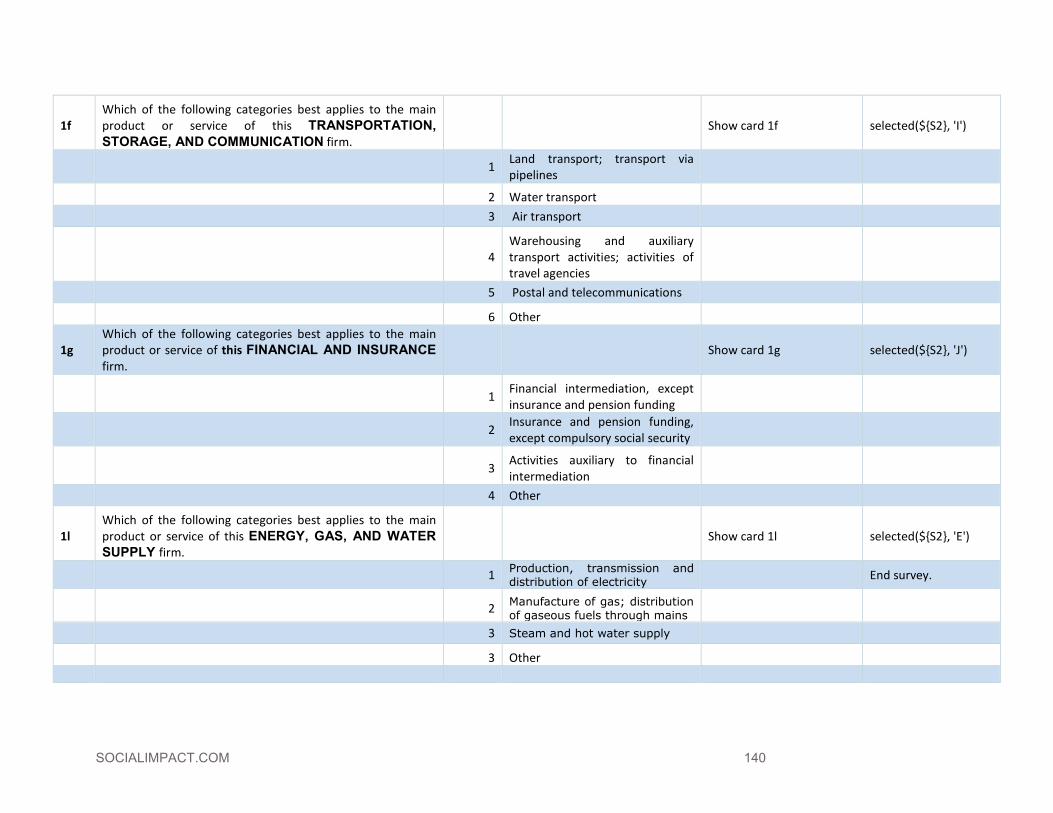
SOCIALIMPACT.COM 140
1f Which of the following categories best applies to the main product or service of this TRANSPORTATION, STORAGE, AND COMMUNICATION firm.
Show card 1f selected(${S2}, 'I')
1 Land transport; transport via pipelines
2 Water transport 3 Air transport
4 Warehousing and auxiliary transport activities; activities of travel agencies
5 Postal and telecommunications
6 Other
1g Which of the following categories best applies to the main product or service of this FINANCIAL AND INSURANCE firm.
Show card 1g selected(${S2}, 'J')
1 Financial intermediation, except insurance and pension funding
2 Insurance and pension funding, except compulsory social security
3 Activities auxiliary to financial intermediation
4 Other
1l Which of the following categories best applies to the main product or service of this ENERGY, GAS, AND WATER SUPPLY firm.
Show card 1l selected(${S2}, 'E')
1 Production, transmission and distribution of electricity End survey.
2 Manufacture of gas; distribution of gaseous fuels through mains
3 Steam and hot water supply
3 Other

141 SOCIALIMPACT.COM
MCC Malawi: Enterprise Survey and Case Study Community Baseline Report
1h In a sentence or less could you very briefly tell me about the work your business does? Summarize
String
1i In what year was this firm founded? Numeric $>!2015
1j What is this firm's current legal status?
If the firm is a partnership but is not formally registered, then select not formally registered.
Show card 1j
1 Sole proprietorship
2 Family partnership 3 Other partnership
4 Private limited liability company 5 Public Limited Liability
6 Not formally registered 7 Other (spontaneous- specify)
String -98 DK
1k Is this firm foreign or domestically owned? Show card 1k
1 100% foreign owned 2 Mostly foreign owned
3 Mostly domestically owned 4 100% domestically owned
Business environment: Now we would like to ask you about some of the obstacles this firm currently confronts.
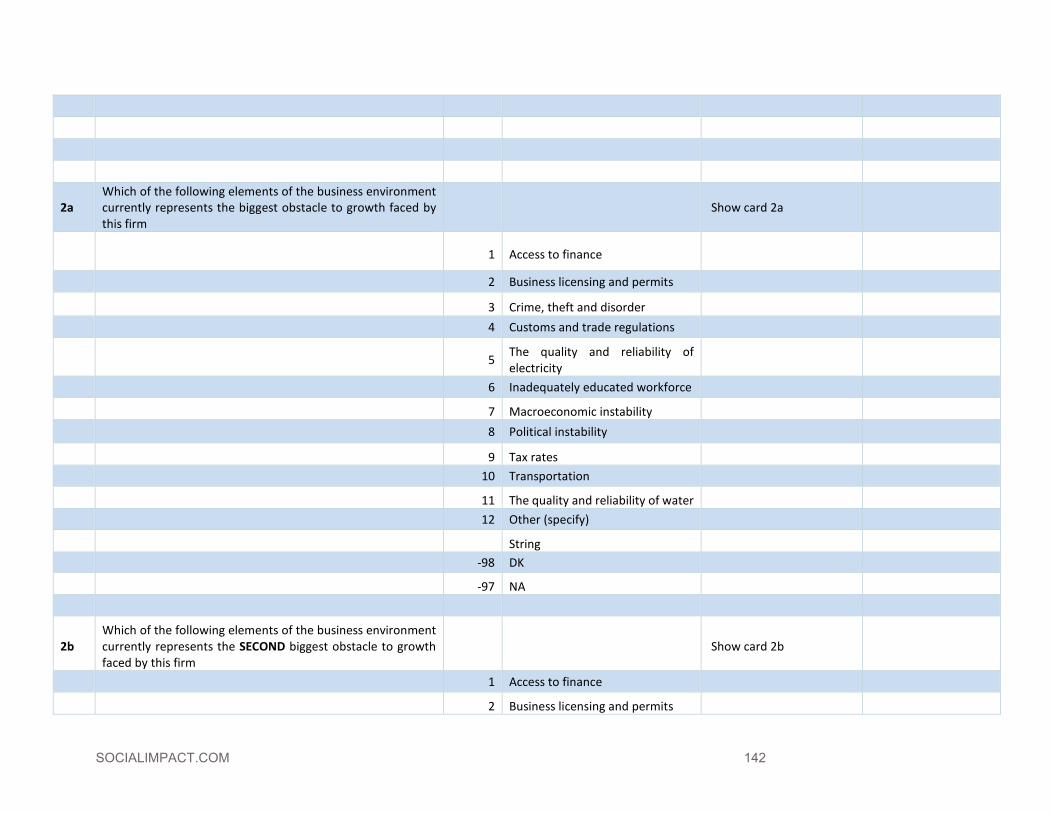
SOCIALIMPACT.COM 142
2a Which of the following elements of the business environment currently represents the biggest obstacle to growth faced by this firm
Show card 2a
1 Access to finance
2 Business licensing and permits
3 Crime, theft and disorder 4 Customs and trade regulations
5 The quality and reliability of electricity
6 Inadequately educated workforce
7 Macroeconomic instability 8 Political instability
9 Tax rates 10 Transportation
11 The quality and reliability of water 12 Other (specify)
String -98 DK
-97 NA
2b Which of the following elements of the business environment currently represents the SECOND biggest obstacle to growth faced by this firm
Show card 2b
1 Access to finance
2 Business licensing and permits

143 SOCIALIMPACT.COM
MCC Malawi: Enterprise Survey and Case Study Community Baseline Report
3 Crime, theft and disorder
4 Customs and trade regulations
5 The quality and reliability of electricity
6 Inadequately educated workforce 7 Macroeconomic instability
8 Political instability 9 Tax rates
10 Transportation 11 The quality and reliability of water
-98 DK
-97 NA
2c
From among these 11 different obstacles to growth, where would you rank electricity as an obstacle to growth?
1 Access to finance
2 Business licensing and permits
3 Crime, theft and disorder
4 Customs and trade regulations
5 The quality and reliability of electricity
6 Inadequately educated workforce
7 Macroeconomic instability
8 Political instability
9 Tax rates
10 Transportation
11 The quality and reliability of water
Prompt: For example, if you thought that electricity was the next biggest obstacle you would say 3. If you thought that electricity was the smallest obstacle you would say 11. SHOW CARD 3
If 2a and 2b don’t include electricity
Numeric Limit to number between 3-11

SOCIALIMPACT.COM 144
ESCOM in comparative perspective
Now we would like to ask you to rate your satisfaction with different providers of public goods and services on the quality of several public services on a scale from 1 to 5 where 1 is very satisfied and 5 is very dissatisfied?
3a How satisfied are you with the Water Board? Show Card 4
1 Very Satisfied
2 Satisfied 3 Neither Satisfied nor Dissatisfied
4 Dissatisfied 5 Very Dissatisfied
3b How satisfied are you with the Roads Authority? Show Card 4 1 Very Satisfied
2 Satisfied 3 Neither dissatisfied nor satisfied
4 Dissatisfied 5 Very Dissatisfied
3c How satisfied are you with Malawi Telecommunications Limited?
Show Card 4
1 Very Satisfied
2 Satisfied
3 Neither dissatisfied nor satisfied
4 Dissatisfied
5 Very Dissatisfied
3d How satisfied are you with the Electricity Supply Corporation of Malawi (ESCOM)?
Show Card 4
1 Very Satisfied

145 SOCIALIMPACT.COM
MCC Malawi: Enterprise Survey and Case Study Community Baseline Report
2 Satisfied 3 Neither dissatisfied nor satisfied
4 Dissatisfied 5 Very Dissatisfied
Energy use
In the following questions on outages, we will be referring to this facility referenced during the screening.
4e How many years has this firm had operations at the selected facility? At selected facility
Numeric 4e>! 2015-1i
4f Does this facility operate year round or is work at this facility seasonal?
1 Year round Go to 4h
2 Seasonal Go to 4g
3 Year round but with seasonal slowdowns and peaks (spontaneous)
Go to 4h
4g In what months does it not operate? Select all that apply selected(${4f},’2’) 1 January
2 February 3 March
4 April 5 May
6 June 7 July
8 August 9 September
10 October

SOCIALIMPACT.COM 146
11 November
12 December
4h In a typical workweek, how many days does this facility usually operate?
At selected facility. If seasonal, responses should refer to the time period in which the firm is operating.
1 One 2 Two
3 Three 4 Four
5 Five 6 Six
7 Seven
4i In a typical workday, how many hours per day does the facility operate?
We recognize that firms might work shorter days on certain days of the week. Focus on the typical day. If seasonal, response should refer to the time period in which the firm is operating.
Numeric 0<4i=<24
4j In thinking about the last month, what sources of energy has this facility used?
Check all that apply. At selected facility. Does not include vehicles and diesel/gasoline for transport
1 ESCOM electricity connection 3 Generator
4 Biomass (all forms: charcoal, firewood, crop residue, etc.)
5 Solar
6 Wind

147 SOCIALIMPACT.COM
MCC Malawi: Enterprise Survey and Case Study Community Baseline Report
7 Kerosene
8 Coal 9 Petroleum
10 Diesel 11 Natural gas
12 Candles 13 Other (specify)
14 None String
4k At this facility, what assets do you have that are powered with electricity?
Select all that apply. At selected facility.
1 Lights
2 Office equipment, such as computers and printers
3 Light machinery
4 Heavy machinery
5 Air conditioning
6 Other (Specify)
String
4l When there is a power outage, do you experience a total or partial shutdown of business?
1 Total
2 Partial
3 Business continues with minimal effect
Attitudinal Questions I
5a Would you agree or disagree with the following statement: the current electricity tariff is a fair price for electricity. Show Card 5
1 Strongly agree
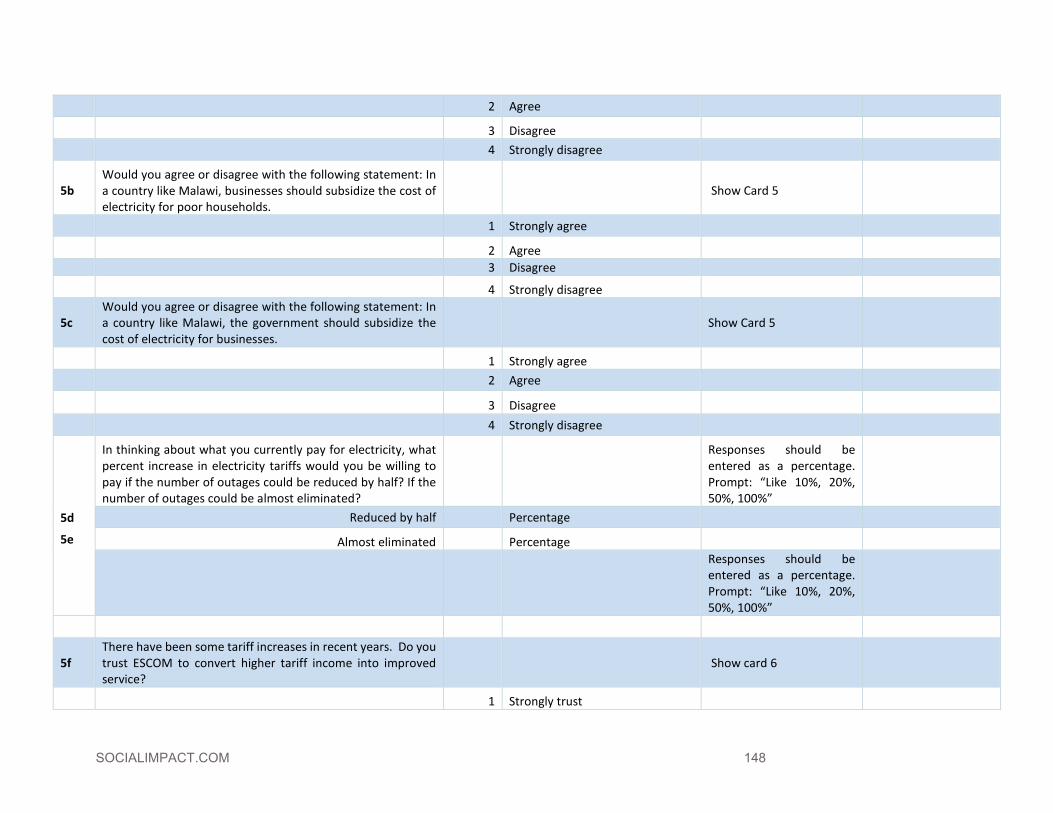
SOCIALIMPACT.COM 148
2 Agree
3 Disagree 4 Strongly disagree
5b Would you agree or disagree with the following statement: In a country like Malawi, businesses should subsidize the cost of electricity for poor households.
Show Card 5
1 Strongly agree
2 Agree 3 Disagree
4 Strongly disagree
5c Would you agree or disagree with the following statement: In a country like Malawi, the government should subsidize the cost of electricity for businesses.
Show Card 5
1 Strongly agree
2 Agree
3 Disagree
4 Strongly disagree
5d
5e
In thinking about what you currently pay for electricity, what percent increase in electricity tariffs would you be willing to pay if the number of outages could be reduced by half? If the number of outages could be almost eliminated?
Responses should be entered as a percentage. Prompt: “Like 10%, 20%, 50%, 100%”
Reduced by half Percentage
Almost eliminated Percentage
Responses should be entered as a percentage. Prompt: “Like 10%, 20%, 50%, 100%”
5f There have been some tariff increases in recent years. Do you trust ESCOM to convert higher tariff income into improved service?
Show card 6
1 Strongly trust

149 SOCIALIMPACT.COM
MCC Malawi: Enterprise Survey and Case Study Community Baseline Report
2 Somewhat trust
3 Somewhat distrust 4 Strongly distrust
-98 DK
5g How would you evaluate the quality of ESCOM’s communication with its customers? Show card 7
1 Very Good 2 Good
3 Fair 4 Poor
5 Very Poor
5h
Would you agree or disagree with the following statement: Given the way things are in Malawi, it is sometimes justifiable to make informal payments or pay bribes to obtain improved service.
Show card 5
1 Strongly agree 2 Agree
3 Disagree 4 Strongly disagree
5i
Would you agree or disagree with the following statement: Given the way things are in Malawi, it is sometimes justifiable to leverage one's personal contacts to obtain improved service.
Show card 5
1 Strongly agree
2 Agree 3 Disagree
4 Strongly disagree 5j In your opinion, how big a problem is corruption in ESCOM?
1 Major problem
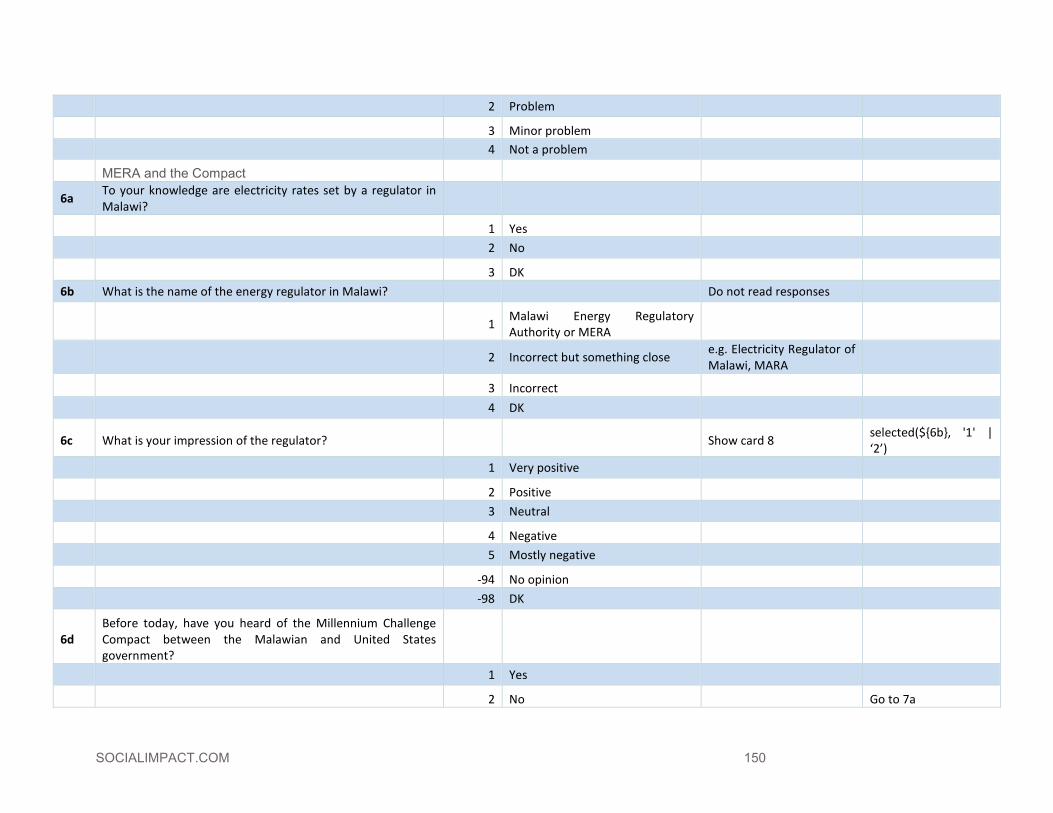
SOCIALIMPACT.COM 150
2 Problem
3 Minor problem
4 Not a problem
MERA and the Compact
6a To your knowledge are electricity rates set by a regulator in Malawi?
1 Yes 2 No
3 DK 6b What is the name of the energy regulator in Malawi? Do not read responses
1 Malawi Energy Regulatory Authority or MERA
2 Incorrect but something close e.g. Electricity Regulator of Malawi, MARA
3 Incorrect
4 DK
6c What is your impression of the regulator? Show card 8 selected(${6b}, '1' | ‘2’)
1 Very positive
2 Positive
3 Neutral
4 Negative
5 Mostly negative
-94 No opinion -98 DK
6d Before today, have you heard of the Millennium Challenge Compact between the Malawian and United States government?
1 Yes
2 No Go to 7a

151 SOCIALIMPACT.COM
MCC Malawi: Enterprise Survey and Case Study Community Baseline Report
-98 DK
6e What is your impression of the Compact Show card 8 selected(${6d}, '1')
1 Very positive 2 Positive
3 Neutral 4 Negative
5 Mostly negative -94 No opinion
-98 DK
III. Power outages
We would like to ask you about electricity outages that this facility has experienced in the previous 12 months. By outages we mean when the power goes out for more than 3 minutes. To answer these questions, we would like to speak to someone who is knowledgeable about electricity and ESCOM related issues at this firm. We are going to ask you for a series of estimates. Please provide us with your best estimate. Are you ready to answer this “Power Outages” section?
It might be necessary in larger firms with specialized roles for the respondent to change
7a How satisfied are you with your electricity supply at this facility? At selected facility.
Show card 4
1 Very dissatisfied 2 Dissatisfied
3 Neither satisfied nor dissatisfied
4 Satisfied
5 Very satisfied
7b Do you keep track of the number, timing, or duration of outages at this facility? Probe: If yes, ask if this
information is accessible
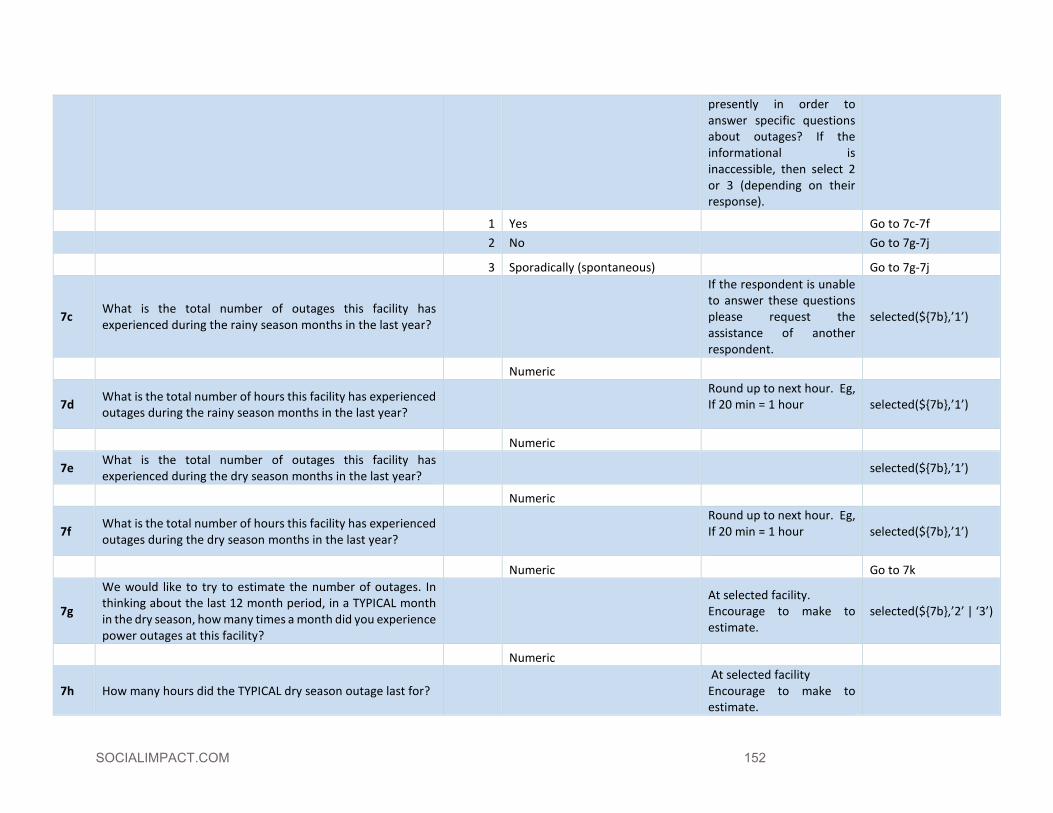
SOCIALIMPACT.COM 152
presently in order to answer specific questions about outages? If the informational is inaccessible, then select 2 or 3 (depending on their response).
1 Yes Go to 7c-7f 2 No Go to 7g-7j
3 Sporadically (spontaneous) Go to 7g-7j
7c What is the total number of outages this facility has experienced during the rainy season months in the last year?
If the respondent is unable to answer these questions please request the assistance of another respondent.
selected(${7b},’1’)
Numeric
7d What is the total number of hours this facility has experienced outages during the rainy season months in the last year?
Round up to next hour. Eg, If 20 min = 1 hour
selected(${7b},’1’)
Numeric
7e What is the total number of outages this facility has experienced during the dry season months in the last year? selected(${7b},’1’)
Numeric
7f What is the total number of hours this facility has experienced outages during the dry season months in the last year?
Round up to next hour. Eg, If 20 min = 1 hour
selected(${7b},’1’)
Numeric Go to 7k
7g
We would like to try to estimate the number of outages. In thinking about the last 12 month period, in a TYPICAL month in the dry season, how many times a month did you experience power outages at this facility?
At selected facility. Encourage to make to estimate.
selected(${7b},’2’ | ‘3’)
Numeric
7h How many hours did the TYPICAL dry season outage last for? At selected facility Encourage to make to estimate.

153 SOCIALIMPACT.COM
MCC Malawi: Enterprise Survey and Case Study Community Baseline Report
Numeric
7i In thinking about the last 12 month period, in a TYPICAL month in the rainy season, how many times a month did you experience power outages at this facility?
At selected facility Encourage to make to estimate.
Numeric
7j How many hours did the TYPICAL rainy season outage last for? At selected facility Encourage to make to estimate.
Numeric
7k Do you know if your electrical line at this facility is an "industrial line.”? An industrial line is one which feeds an industrial park.
1 Industrial line 2 Not industrial line
3
It is supposed to be an industrial line but there is high load shedding anyway [spontaneous – do not read]
-98 Don't know
7l In thinking about the electricity situation 12 months (1 year) ago at this facility, has electricity improved, worsened, or stayed the same?
At selected facility. Electricity might improve and worsen in the course of the year. Respondents should compare the present with how it was 1 year ago. Use NA if the firm was not using the facility one year ago.
SHOW CARD 9
1 Improved greatly
2 Improved somewhat 3 Stayed the same

SOCIALIMPACT.COM 154
4 Worsened somewhat 5 Worsened greatly
-97 NA
7m You might remember that at the end of 2013, a new hydropower plant called Kapichira II began operating. In thinking about the electricity situation before this time, has electricity improved, worsened, or stayed the same?
At selected facility. Use NA if the firm was not using the facility at the end of 2013. SHOW CARD 9
If 4e<2 then skip, Go to 7n
1 Improved greatly 2 Improved somewhat
3 Stayed the same 4 Worsened somewhat
5 Worsened greatly -98 Don’t know
-97 NA
7n How many times in the last 3 months would you estimate that you have received or seen notification of outages for this facility?
“Seen” might include in the newspaper or on the ESCOM website. Outages could be due to planned load-shedding or planned maintenance. Probe: Estimate
Numeric If ==0 Go to Question 8 If $==0 Go to 8
7o How often are these notifications accurate? If 7n >0
1 Always
2 Most of the time
3 Sometimes 4 Rarely
5 Never Generators
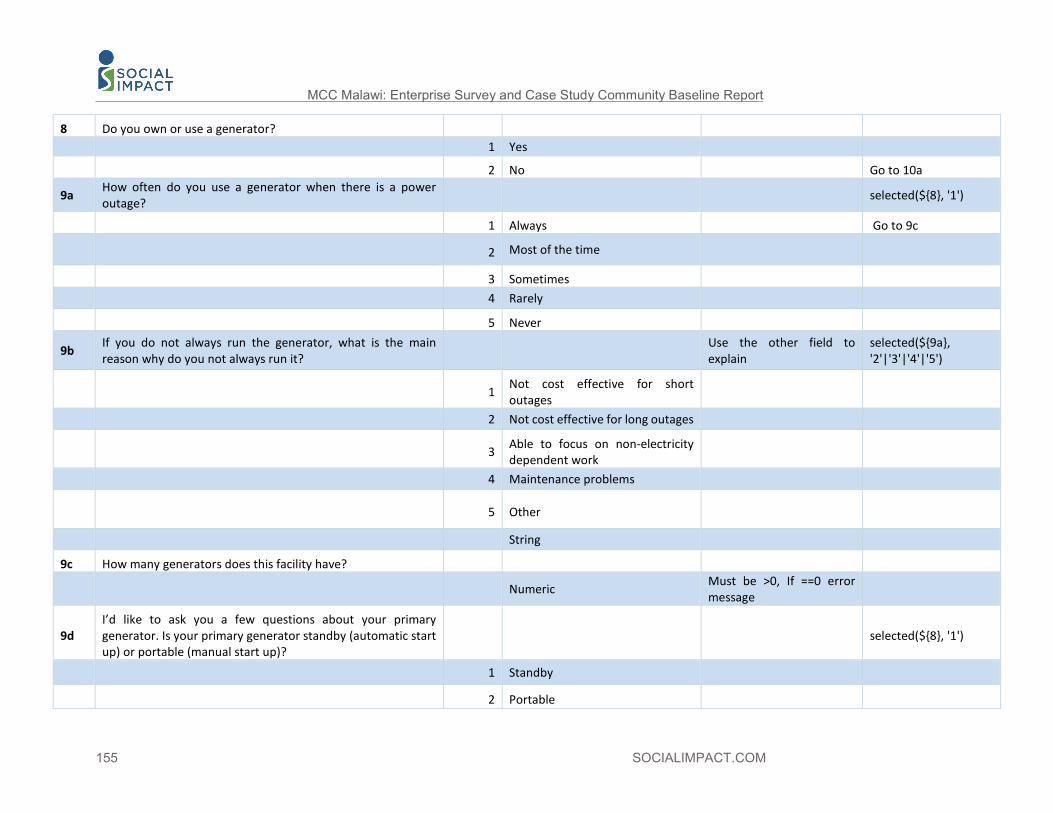
155 SOCIALIMPACT.COM
MCC Malawi: Enterprise Survey and Case Study Community Baseline Report
8 Do you own or use a generator? 1 Yes
2 No Go to 10a
9a How often do you use a generator when there is a power outage? selected(${8}, '1')
1 Always Go to 9c
2 Most of the time
3 Sometimes 4 Rarely
5 Never
9b If you do not always run the generator, what is the main reason why do you not always run it? Use the other field to
explain selected(${9a}, '2'|'3'|'4'|'5')
1 Not cost effective for short outages
2 Not cost effective for long outages
3 Able to focus on non-electricity dependent work
4 Maintenance problems
5 Other
String
9c How many generators does this facility have?
Numeric Must be >0, If ==0 error message
9d I’d like to ask you a few questions about your primary generator. Is your primary generator standby (automatic start up) or portable (manual start up)?
selected(${8}, '1')
1 Standby
2 Portable

SOCIALIMPACT.COM 156
-98 DK
9e What is the wattage of the generator?
Response should be in KW. If the respondent is unsure of the wattage, encourage to respondent to have someone check the wattage and the capacity of the tank. If they do not know, an estimate is acceptable.
selected(${8}, '1')
Numeric
-98 DK
9f Do you own the generator, or is it rented or shared?
Shared might occur if the establishment is a commercial establishment in a shopping plaza
selected(${8}, '1')
1 Own Go to 9g
2 Rented Go to 9i
3 Shared Go to 9i
9g How long ago was the generator purchased? Include notes if did not purchase. For example, if shared
selected(${9f}, '1')
1 Less than one year ago 2 1-5 years ago
3 6-10 years ago 4 11-15 years ago
5 16-20 years ago 6 More than 20 years ago
9h How much did the generator cost in Malawian Kwacha or US Dollars at the time of purchase?
If the respondent does not remember or is not knowledgeable, request that s/he looks up the
selected(${9f}, '1')

157 SOCIALIMPACT.COM
MCC Malawi: Enterprise Survey and Case Study Community Baseline Report
amount or seeks the input of another individual
Numeric Kwacha
Numeric USD (US Dollar) -98 DK/Refused
9i Do you track the fuel costs to running the generator? selected(${8}, '1') 1 Yes Go to 9j
2 No Go to 9k
9j In 2015, how much in Malawian kwacha did you spend on fuel for the generator?
If the respondent only has data available for the firms’ fiscal year, please use the fiscal year and note the fiscal year’s months below
selected(${9i}, '1') Go to 9r
Numeric
String
If Fiscal year, specify Start/End the of Fiscal Year (MM/YYYY-MM/YYYY) If NA leave blank
-98 DK
9k Even if you do not keep track of the fuel costs, we would still like to try to estimate the fuel costs. What is the litre capacity of the generator’s tank?
Push to ensure accurate response.
selected(${9i}, '2')|selected(${9j},’-98’
Numeric
9l How often do you refuel the tank? How many times
selected(${9i}, '2')|selected(${9j},’-98’
Numeric 9l_1 Units 1 Days
2 Weeks 3 Months
4 Years

SOCIALIMPACT.COM 158
9m What fuel does the generator use? selected(${9i}, '2')|selected(${9j},’-98’
1 Diesel
2 Petrol
3 Other (specify)
String
9n What is the cost per litre?
Numeric
9o
So if you consume [import from 9k] litres * [import 9n: MWK8000 per litre of diesel OR [MWKXXXX per litre of petro] * [import 52/9l] times per year then you have fuel costs of [calculate] per year.
selected(${9i}, '2')|selected(${9j},’-98’ TO BE PROGRAMED
Numeric
9p Does this sound correct? Notes if incorrect. Provide corrected estimate. selected(${9i}, '2')
1 Yes
2 No 9q What do you think would be a more accurate estimate? selected(${9i}, '2')
Numeric
9r In 2015, how much in Malawian kwacha did you spend on maintenance for the generator?
If the respondent only has data available for the firms’ fiscal year, please use the fiscal year and note the fiscal year’s months below
selected(${8}, '1')
Numeric -98 DK
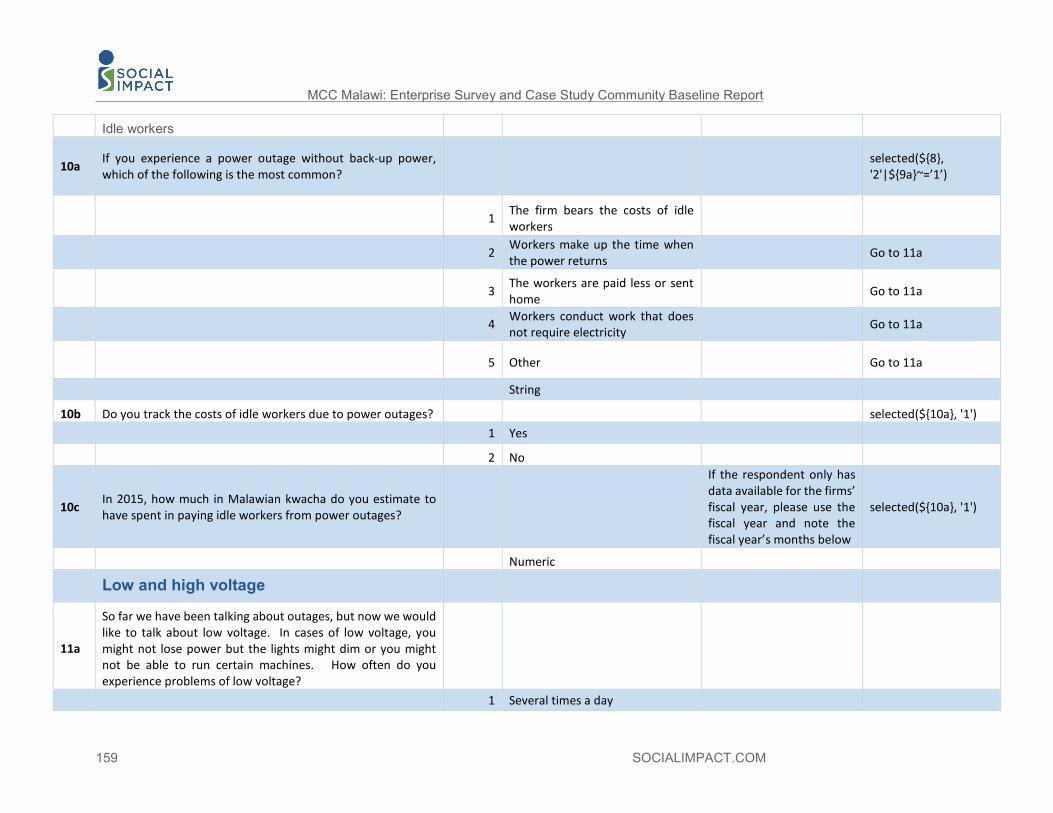
159 SOCIALIMPACT.COM
MCC Malawi: Enterprise Survey and Case Study Community Baseline Report
Idle workers
10a If you experience a power outage without back-up power, which of the following is the most common?
selected(${8}, '2'|${9a}~=’1’)
1 The firm bears the costs of idle workers
2 Workers make up the time when the power returns
Go to 11a
3 The workers are paid less or sent home Go to 11a
4 Workers conduct work that does not require electricity
Go to 11a
5 Other Go to 11a
String
10b Do you track the costs of idle workers due to power outages? selected(${10a}, '1') 1 Yes
2 No
10c In 2015, how much in Malawian kwacha do you estimate to have spent in paying idle workers from power outages?
If the respondent only has data available for the firms’ fiscal year, please use the fiscal year and note the fiscal year’s months below
selected(${10a}, '1')
Numeric
Low and high voltage
11a
So far we have been talking about outages, but now we would like to talk about low voltage. In cases of low voltage, you might not lose power but the lights might dim or you might not be able to run certain machines. How often do you experience problems of low voltage?
1 Several times a day
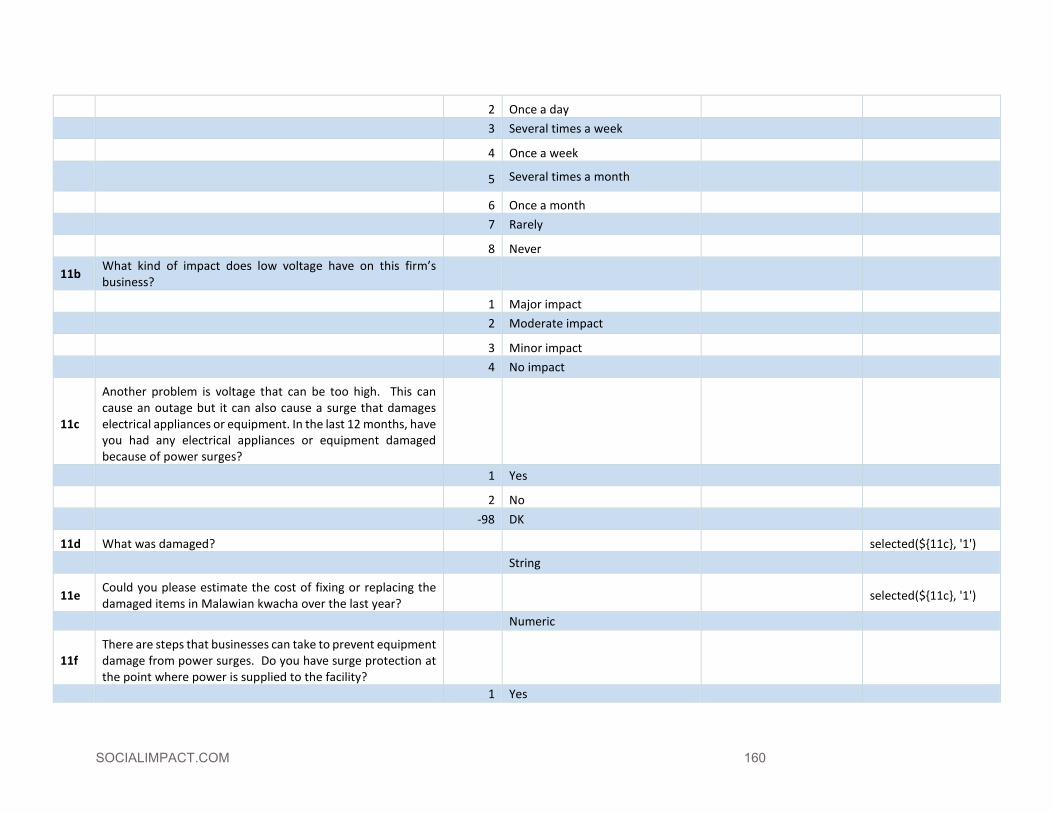
SOCIALIMPACT.COM 160
2 Once a day 3 Several times a week
4 Once a week
5 Several times a month
6 Once a month 7 Rarely
8 Never
11b What kind of impact does low voltage have on this firm’s business?
1 Major impact 2 Moderate impact
3 Minor impact 4 No impact
11c
Another problem is voltage that can be too high. This can cause an outage but it can also cause a surge that damages electrical appliances or equipment. In the last 12 months, have you had any electrical appliances or equipment damaged because of power surges?
1 Yes
2 No -98 DK
11d What was damaged? selected(${11c}, '1') String
11e Could you please estimate the cost of fixing or replacing the damaged items in Malawian kwacha over the last year? selected(${11c}, '1')
Numeric
11f There are steps that businesses can take to prevent equipment damage from power surges. Do you have surge protection at the point where power is supplied to the facility?
1 Yes

161 SOCIALIMPACT.COM
MCC Malawi: Enterprise Survey and Case Study Community Baseline Report
2 No
-98 DK
11g Do you have surge protection for individual pieces of sensitive equipment?
1 Yes
2 No -98 DK
11h How successful do you feel that surge protection equipment is at preventing equipment damage? Show card 10
1 Very effective
2 Effective 3 Ineffective
4 Very ineffective -98 DK
11i How much would you estimate is the value of your surge protection equipment? selected(${11f}, '1' |
${11g}, ‘1’) Numeric
Other costs and lost revenue
12a In the last 12 months, have you experienced any OTHER costs as a result of power outages?
Prompt: For example, there might be labor or material costs to restarting production in a factory, the cost of re-processing materials, or spoilage costs Make sure to emphasize that these costs should not include labor, generator costs or equipment damage. (DO NOT ACCEPT THESE)
1 Yes Go to 12b
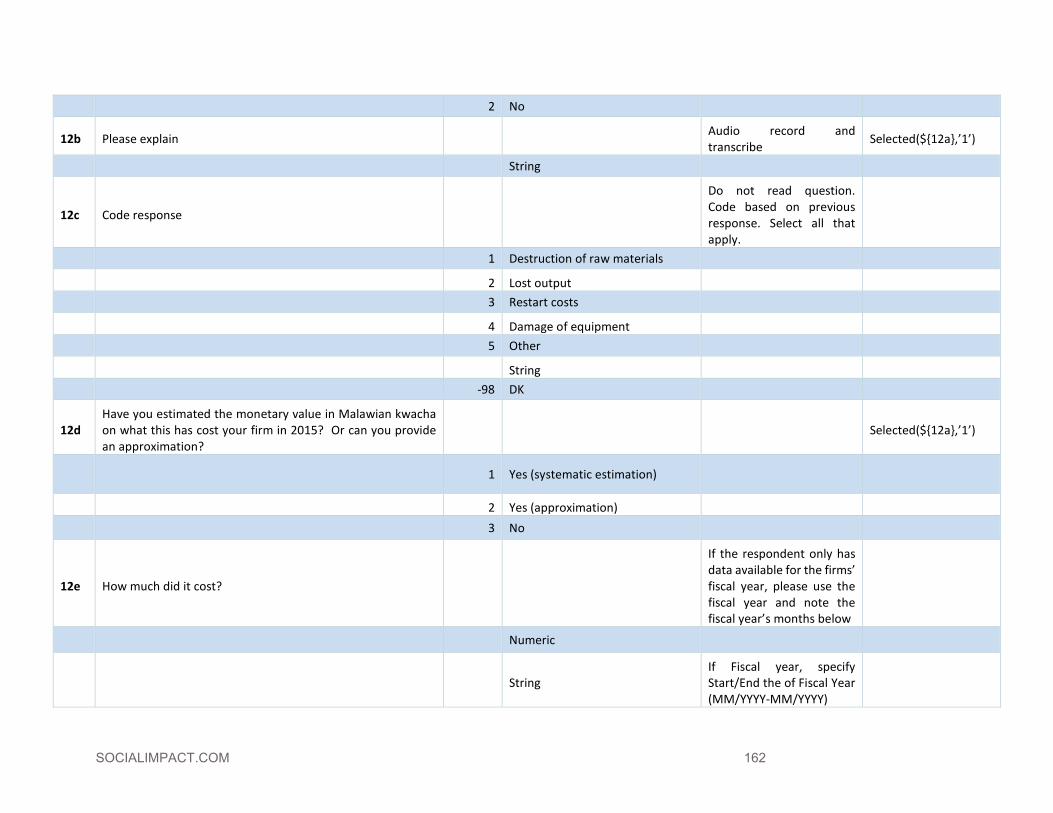
SOCIALIMPACT.COM 162
2 No
12b Please explain Audio record and transcribe Selected(${12a},’1’)
String
12c Code response
Do not read question. Code based on previous response. Select all that apply.
1 Destruction of raw materials
2 Lost output 3 Restart costs
4 Damage of equipment 5 Other
String -98 DK
12d Have you estimated the monetary value in Malawian kwacha on what this has cost your firm in 2015? Or can you provide an approximation?
Selected(${12a},’1’)
1 Yes (systematic estimation)
2 Yes (approximation) 3 No
12e How much did it cost?
If the respondent only has data available for the firms’ fiscal year, please use the fiscal year and note the fiscal year’s months below
Numeric
String If Fiscal year, specify Start/End the of Fiscal Year (MM/YYYY-MM/YYYY)

163 SOCIALIMPACT.COM
MCC Malawi: Enterprise Survey and Case Study Community Baseline Report
12f
We have talked about the COSTS of electricity outages. Now I would like to ask you about lost revenue. Has this firm lost out on potential REVENUE as a result of electricity outages over the course of the last 12 months?
Clarify: For example, a restaurant that uses an electric stove and cannot serve hot lunch to customers or a factory operating at peak operating capacity during a high demand period might lose revenue during outages
1 Yes 2 No
-98 DK
12g Please explain Audio record and transcribe Selected(${12f},’1’)
String
12h Have you estimated the monetary value in Malawian kwacha on what this has cost your firm in 2015? Or can you provide an approximation?
Selected(${12f},’1’)
1 Yes (systematic estimation) 2 Yes (approximation)
3 No
12i How much did it cost?
If the respondent only has data available for the firms’ fiscal year, please use the fiscal year and note the fiscal year’s months below
Selected(${12h},’1’|’2’)
Numeric
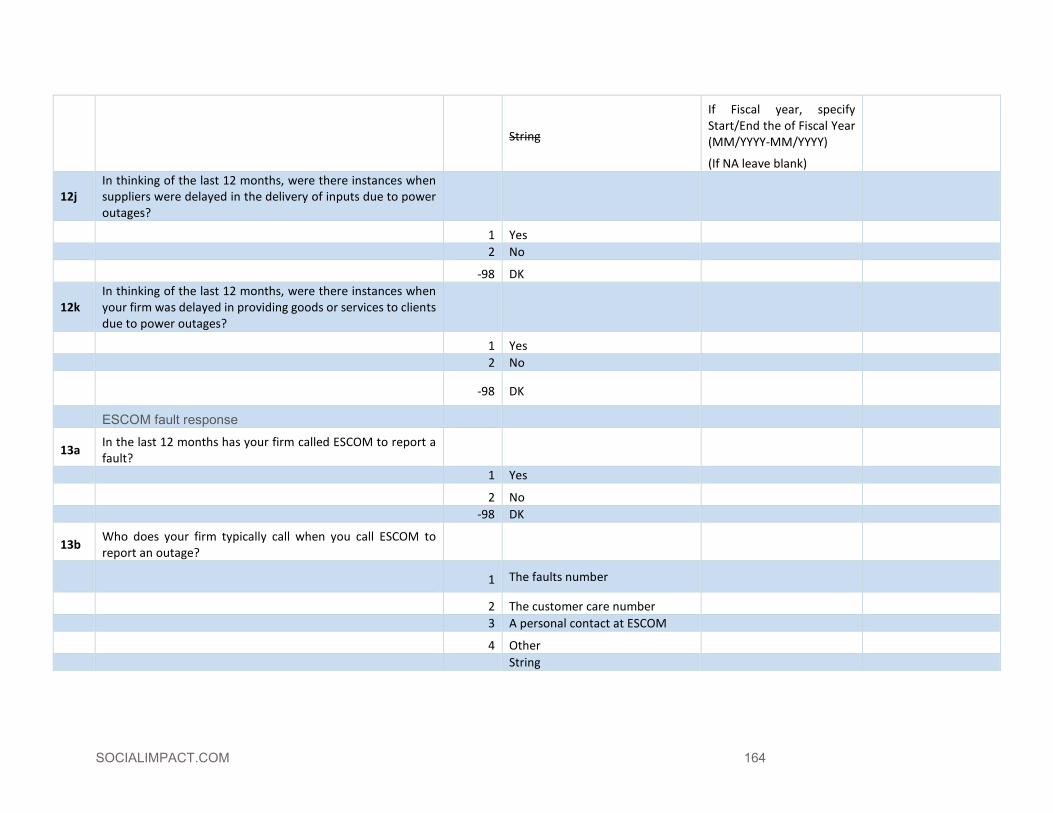
SOCIALIMPACT.COM 164
String
If Fiscal year, specify Start/End the of Fiscal Year (MM/YYYY-MM/YYYY)
(If NA leave blank)
12j In thinking of the last 12 months, were there instances when suppliers were delayed in the delivery of inputs due to power outages?
1 Yes 2 No
-98 DK
12k In thinking of the last 12 months, were there instances when your firm was delayed in providing goods or services to clients due to power outages?
1 Yes 2 No
-98 DK
ESCOM fault response
13a In the last 12 months has your firm called ESCOM to report a fault?
1 Yes
2 No -98 DK
13b Who does your firm typically call when you call ESCOM to report an outage?
1 The faults number
2 The customer care number 3 A personal contact at ESCOM
4 Other String

165 SOCIALIMPACT.COM
MCC Malawi: Enterprise Survey and Case Study Community Baseline Report
13c When there is a fault that requires ESCOM to come and fix a problem, how long does it typically take ESCOM to fix the problem?
Faults exclude load shedding and planned maintenance outages.
Numeric
13d Time Unit 0<13d<4 1 Hours
2 Days 3 Weeks
4 Months 13e How would you evaluate ESCOM's response to faults? Show card 7
1 Very good 2 Good
3 Fair 4 Poor
5 Very poor
13f In comparison with twelve months ago, do you think that ESCOM's response to faults has improved, stayed the same, or worsened?
Show card 9
1 Improved greatly 2 Improved somewhat
3 Stayed the same 4 Worsened somewhat
5 Worsened greatly New connections
14 In the last 24 months, or 2 years, has your firm solicited a new electricity connection for this or any other facility?
1 Yes
2 No Go to 15

SOCIALIMPACT.COM 166
-98 DK
14a Have you obtained the connection? selected(${14}, '1')
1 Yes
2 No
14b From the time you submitted an application, how long did it take for ESCOM personnel to give you a quote?
Record either in months or in days depending on response. Leave blank if still have not received a quote.
selected(${14a}, '1')
Numeric selected(${14a}, '1')
14c Unit of previous answer selected(${14a}, '1') 1 Days
2 Weeks 3 Months
4 Years
14d From the time you paid for the connection, how long did it take for ESCOM personnel to give you a connection? selected(${14a}, '1')
Numeric 14e Units selected(${14a}, '1')
1 Days 2 Weeks
3 Months 4 Years
14f What type of connection did you request? selected(${14a}, '1')
1 Maximum demand
2 Three phase
3 Single phase
14g What was the cost of the connection charged by ESCOM? selected(${14a}, '1')
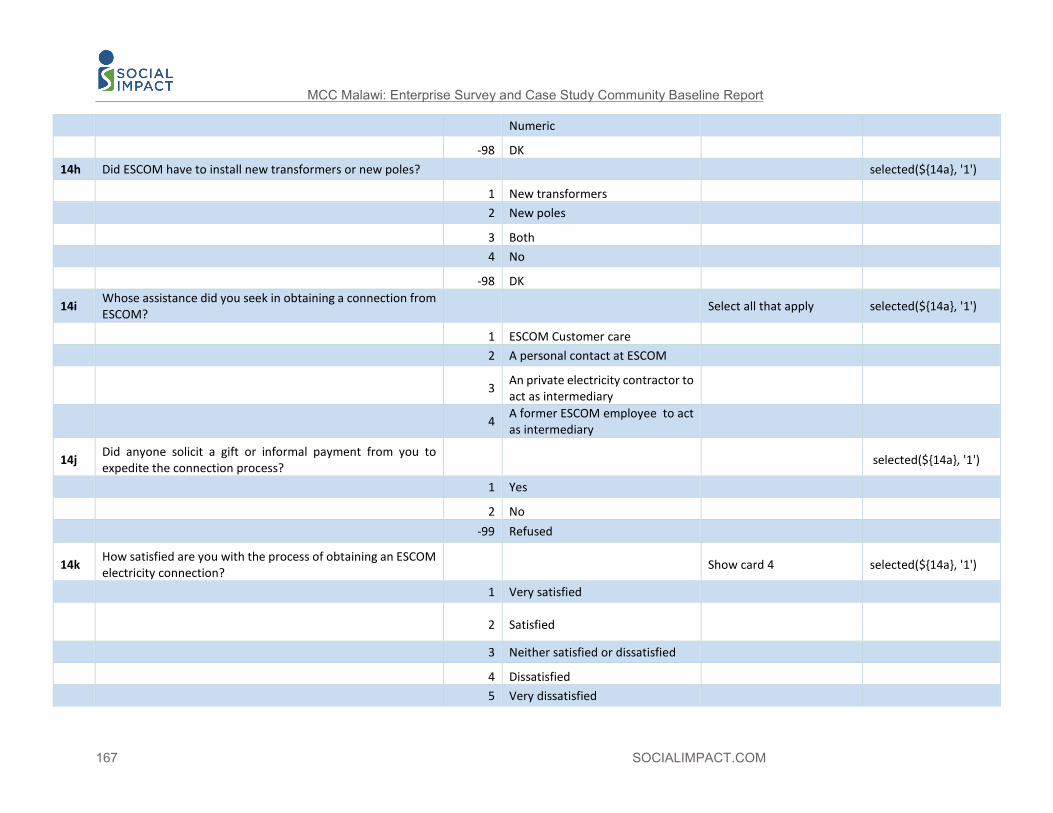
167 SOCIALIMPACT.COM
MCC Malawi: Enterprise Survey and Case Study Community Baseline Report
Numeric
-98 DK 14h Did ESCOM have to install new transformers or new poles? selected(${14a}, '1')
1 New transformers 2 New poles
3 Both 4 No
-98 DK
14i Whose assistance did you seek in obtaining a connection from ESCOM? Select all that apply selected(${14a}, '1')
1 ESCOM Customer care 2 A personal contact at ESCOM
3 An private electricity contractor to act as intermediary
4 A former ESCOM employee to act as intermediary
14j Did anyone solicit a gift or informal payment from you to expedite the connection process? selected(${14a}, '1')
1 Yes
2 No -99 Refused
14k How satisfied are you with the process of obtaining an ESCOM electricity connection?
Show card 4 selected(${14a}, '1')
1 Very satisfied
2 Satisfied
3 Neither satisfied or dissatisfied
4 Dissatisfied
5 Very dissatisfied

SOCIALIMPACT.COM 168
14l How long ago did you submit an initial application requesting a quote?
Record in months. If less than 1 month record 1. If 2 years record as 24 months.
selected(${14a}, '2')
Numeric selected(${14a}, '2')
14m Have you paid for a connection? selected(${14a}, '2') 1 Yes
2 No
14n How long ago did you pay for a connection? Record in months. If less than 1 month record 1. If 2 years record as 24 months.
selected(${14a}, '2')
Numeric 14o What type of connection did you request? selected(${14a}, '2')
1 Maximum demand 2 Three phase
3 Single phase 14p What was the cost of the connection quoted by ESCOM? selected(${14a}, '2')
Numeric -98 DK
14q Did or will ESCOM have to install new transformers or new poles selected(${14a}, '2')
1 New transformers
2 New poles 3 Both
4 No -98 DK
14r Whose assistance have you sought in obtaining a connection from ESCOM? Select all that apply selected(${14a}, '2')
1 ESCOM Customer care
2 A personal contact at ESCOM

169 SOCIALIMPACT.COM
MCC Malawi: Enterprise Survey and Case Study Community Baseline Report
3 A private electricity contractor to act as intermediary
4 A former ESCOM employee to act as intermediary
14s Has anyone solicited a gift or informal payment from you to expedite the connection process?
Note that “refused” is “refused to answer” not “refused to pay the bribe.”
selected(${14a}, '2')
1 Yes 2 No
-99 Refused Billing
15a Do you have a prepaid or post-paid meter? 1 Prepaid
2 Postpaid 3 Both
15b Which do you think is preferable: a prepaid meter or a post-paid meter?
1 Prepaid
2 Postpaid
3 Both are the same (spontaneous)
15c Have you had any problems with ESCOM invoices in the last 12 months? selected(${15a},
'2'|’3’) 1 Yes
2 No
If 15a = 2 and 15c = 2, then Go To 16a If 15a = 3 and 15c = 2, then Go To 15e
3 Yes, but more than a year ago (Unsolicited)

SOCIALIMPACT.COM 170
-98 DK
15d Was the billing problem any one of the following? Select all that apply selected(${15c}, '1') Go to 16a
1 Bill received late 2 Incorrect tariff category
3 Incorrect consumption 4 Previous payment not registered
5 Inconvenience of bill payment options
6 Other
String
15e Have you had any problems with purchasing credit for your prepaid meter in the last 12 months? selected(${15a},
'1'|’3’)
1 Yes 2 No
3 Yes, More than a year ago but not now (Unsolicited)
15f Please explain the problem Record and transcribe selected(${15e}, '1') 1 Prepaid token did not work
2 Prepaid token gave incorrect amount
3 Forgot account information at the time of purchase
4 Inconvenience of purchasing token code
5 Other
String

171 SOCIALIMPACT.COM
MCC Malawi: Enterprise Survey and Case Study Community Baseline Report
-98 Don’t Know
Attitudinal Questions II
Now we would like to get your views on a number of important topics. Please state your personal opinion, as we cannot expect you to represent the opinion of the company.
16a Would you agree or disagree with the following statement: On the whole, ESCOM is responsive to the needs of businesses like mine?
Businesses like yours means similar size, industry, and location
Show Card 5
1 Strongly agree
2 Agree 3 Disagree
4 Strongly disagree
16b Would you agree or disagree with the following statement: ESCOM personnel are more responsive to businesses that provide gifts or make informal payments.
Show Card 5
1 Strongly agree 2 Agree
3 Disagree 4 Strongly disagree
16c Would you agree or disagree with the following statement: ESCOM personnel are more responsive if you have a personal contact in ESCOM.
Show Card 5
1 Strongly agree
2 Agree 3 Disagree
4 Strongly disagree
IV. Financial and Management

SOCIALIMPACT.COM 172
Now we would like to ask you some financial questions about the last three calendar years. For these questions it would be helpful for you to have access to financial information and if a financial manager responded to these questions. Are you ready to answer this “Financial and Management” section?
It might be necessary in larger firms with specialized roles for the respondent to change
17a Will you be able to provide us financial information in calendar years or only in fiscal years?
1 Yes, calendar years Go to 17c
2 Only fiscal years 17b When is your fiscal year
String
Specify Start/End the of Fiscal Year (MM/YYYY-MM/YYYY)
If NA leave blank
17c What were your TOTAL costs in 2015? -99 if Refused
Numeric 17d What were your TOTAL costs in 2014? -99 if Refused
Numeric
17e
If you are unwilling to provide cost information, could you please calculate for me what percent of total costs are made up of electricity costs for the 2015 and 2014 calendar years. Let’s start with 2015.
For respondents that do not provide Total cost information
selected(${17c}, '-99')
Percentage (0-100)
17g How much were your electricity expenditures in 2015? selected(${17c}, 'value')
Numeric -99 Refused
17i Besides electricity costs and any generator costs, what other energy costs did you have in 2015?
This includes costs for biomass, kerosene, coal, petroleum, diesel, gasoline, natural gas, or candles. This does not
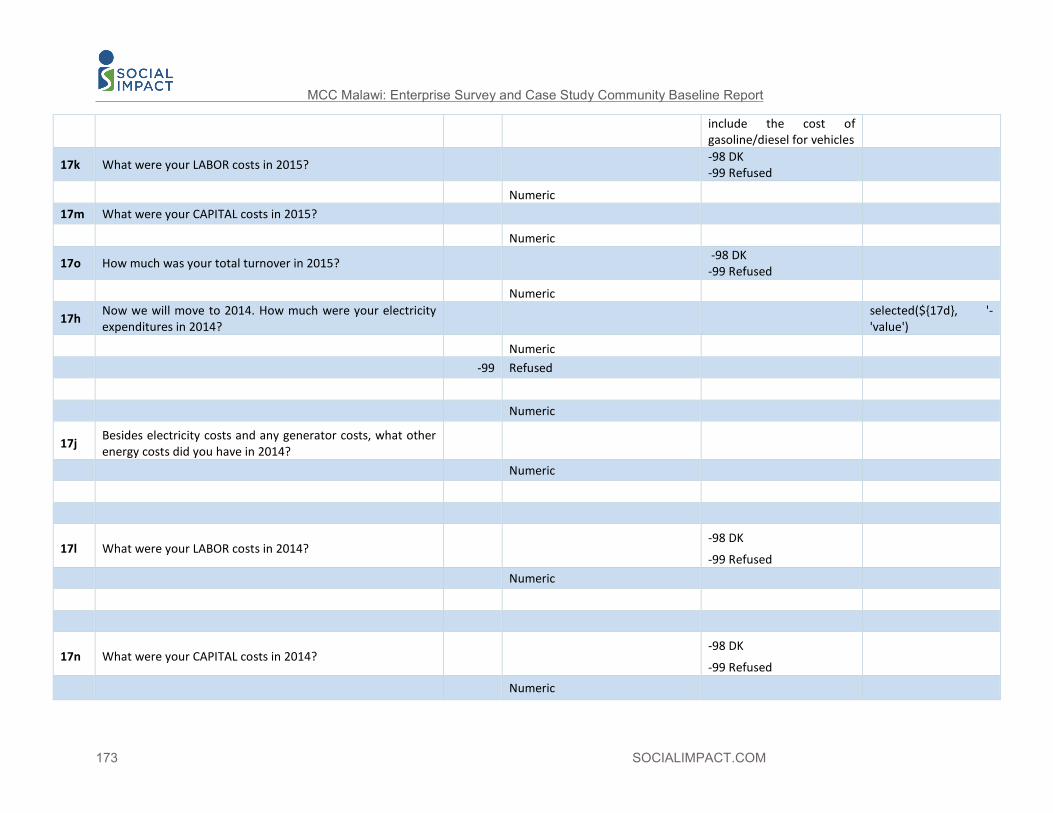
173 SOCIALIMPACT.COM
MCC Malawi: Enterprise Survey and Case Study Community Baseline Report
include the cost of gasoline/diesel for vehicles
17k What were your LABOR costs in 2015? -98 DK -99 Refused
Numeric 17m What were your CAPITAL costs in 2015?
Numeric
17o How much was your total turnover in 2015? -98 DK -99 Refused
Numeric
17h Now we will move to 2014. How much were your electricity expenditures in 2014? selected(${17d}, '-
'value')
Numeric -99 Refused
Numeric
17j Besides electricity costs and any generator costs, what other energy costs did you have in 2014?
Numeric
17l What were your LABOR costs in 2014? -98 DK
-99 Refused
Numeric
17n What were your CAPITAL costs in 2014? -98 DK
-99 Refused
Numeric

SOCIALIMPACT.COM 174
17p How much was your total turnover in 2014? -98 DK
-99 Refused
Numeric
17q Are numbers provided exact amounts or approximations? Do not read question. Enumerators to fill out. I
1 Exact amounts
2 Approximations
18a At the end of 2015 how many permanent, full-time employees did this firm employ? Please include all employees and managers.
-98 DK
Numeric
18b At the end of 2015, how many permanent full-time employees of this firm were female? 18b<=18a
-98 DK
Numeric
18c At the end of 2015, how many temporary or part time employees did this firm employ?
Temporary means employment is less than 12 months -98 DK
Numeric
18d At the end of 2014 how many permanent, full-time employees did this firm employ? Please include all employees and managers
-98 DK
Numeric
19a In 2015, what percentage of this firm‘s sales were DIRECT EXPORTS? -98 DK
Percentage 0=<19a<100
19b In 2015, as a proportion of all material inputs or supplies purchased that year, what percentage of this firm‘s material inputs or supplies were of foreign origin?
Direct or indirect imports. May be an approximation

175 SOCIALIMPACT.COM
MCC Malawi: Enterprise Survey and Case Study Community Baseline Report
Percentage
19c In 2015, did the firm have any loans or line of credit from a formal financial institution?
(0-100)
1 Yes
2 No
Investments and satisfaction
Now I would like to ask you about the growth of your firm.
20a In 2015, did this firm make any substantial new investments?
If the firm is foreign owned, then this question is only concerned with investments in Malawi.
1 Yes
2 No Go to 20f
20b Could you briefly explain: What investments did you make? Select all that apply and specify Show card 11
selected(${20a}, '1')
1 Purchased/rented additional land
2 Built new structures/buildings
3 Upgraded existing structures
4 Purchased/rented new equipment or tools
5 Hired more workers
6 Other(specify)
String

SOCIALIMPACT.COM 176
20c What was the approximate value in Malawian kwacha or US dollar of these investments?
Clarify: if hired workers then the salary costs of those workers for a one year period.
selected(${20a}, '1')
Numeric
20d Currency
1 Malawian kwacha
2 US dollar
20e Why was it a good time to invest? Please select any of the following factors that influenced your decision to invest.
Provide options. Check all that apply.
Show card 12
selected(${20a}, '1')
GO to 21a
1 High demand or access to markets
2 High internal capacity of the firm
3 Good macroeconomic or political climate
4 Access to financing 5 Reliable electricity supply
6 Reliable water supply
7 Low government regulation or taxation
8 Reliable security situation -96 Other (specify)
String
20f Why did you or the firm not make any new investments? Provide options. Check all that apply. Show card 13
selected(${20a}, '2')
1 Inadequate demand or access to markets
2 Lack of internal capacity

177 SOCIALIMPACT.COM
MCC Malawi: Enterprise Survey and Case Study Community Baseline Report
3 Poor macroeconomic or political climate
4 Lack of financing
5 Unreliable electricity supply
6 Unreliable water supply
7 Government regulation or taxation
8 Crime, theft, and disorder
-96 Other (specify)
String
21a How satisfied are you with your current revenue/turnover? Show card 4
1 Very satisfied
2 satisfied
3 Neither dissatisfied nor satisfied
4 Dissatisfied
5 Very dissatisfied
21b How satisfied are you with your current profits? Show card 4
1 Very satisfied
2 satisfied
3 Neither dissatisfied nor satisfied
4 Dissatisfied
5 Very dissatisfied
21c In general, would you say that the economic outlook for your business is:
Show card 7
1 Very Good

SOCIALIMPACT.COM 178
2 Good 3 Fair
4 Poor 5 Very poor
V. Contact information
We are almost done. As we mentioned above, we would like to follow up with you in a year. Could you please provide us with some detailed contact information or your business cards?
B1 Name of the respondent. IF answered String
B2 What is your position in the firm? String
B3 Coding of the position of this respondent 1 MD/President/CEO
2 Chief financial/revenue officer 3 Chief engineer/technical officer
4 Other B4 Sex of this respondent
1 Male 2 Female
B5 What is your age?
Numeric
B6 What was the highest level of education that you completed? 1 No formal education
2 Primary school 3 Secondary school

179 SOCIALIMPACT.COM
MCC Malawi: Enterprise Survey and Case Study Community Baseline Report
4 Post-secondary technical school 5 Undergraduates
6 Post-graduate degree -99 Refused
B7 What sets of questions did this respondent answer? Select all that apply
1 General firm-level/ business environment
2 Power outages 3 Financial/Management
B8 Cell phone number of first respondent Numeric
B9 Office phone number of first respondent C1 Name of the second respondent
String C2 Position of the second respondent
String C3 Coding of the position of the second respondent
1 MD/President/CEO 2 Chief financial/revenue officer
3 Chief engineer/technical officer
-96 Other
C4 Sex of the second respondent 1 Male
2 Female C5 What is your age?
Numeric C6 What is the highest level of education you completed?

SOCIALIMPACT.COM 180
1 No formal education 2 Primary school
3 Secondary school 4 Post-secondary technical school
5 Undergraduate 6 Post-graduate degree
-99 Refused C7 What sets of questions did the respondent answer? Select all that apply
1 General firm-level/business environment
2 Power outages
3 Financial/Management C8 Cellphone number of the second respondent
Numeric C9 Office number of the second respondent
D1 Name of the third respondent String
D2 Position of the third respondent String
D3 Coding of the position of the third respondent 1 MD/President/CEO
2 Chief financial/revenue officer 3 Chief engineer/technical officer
-96 Other D4 Sex of the third respondent
1 Male 2 Female
D5 What is your age? Show card 14
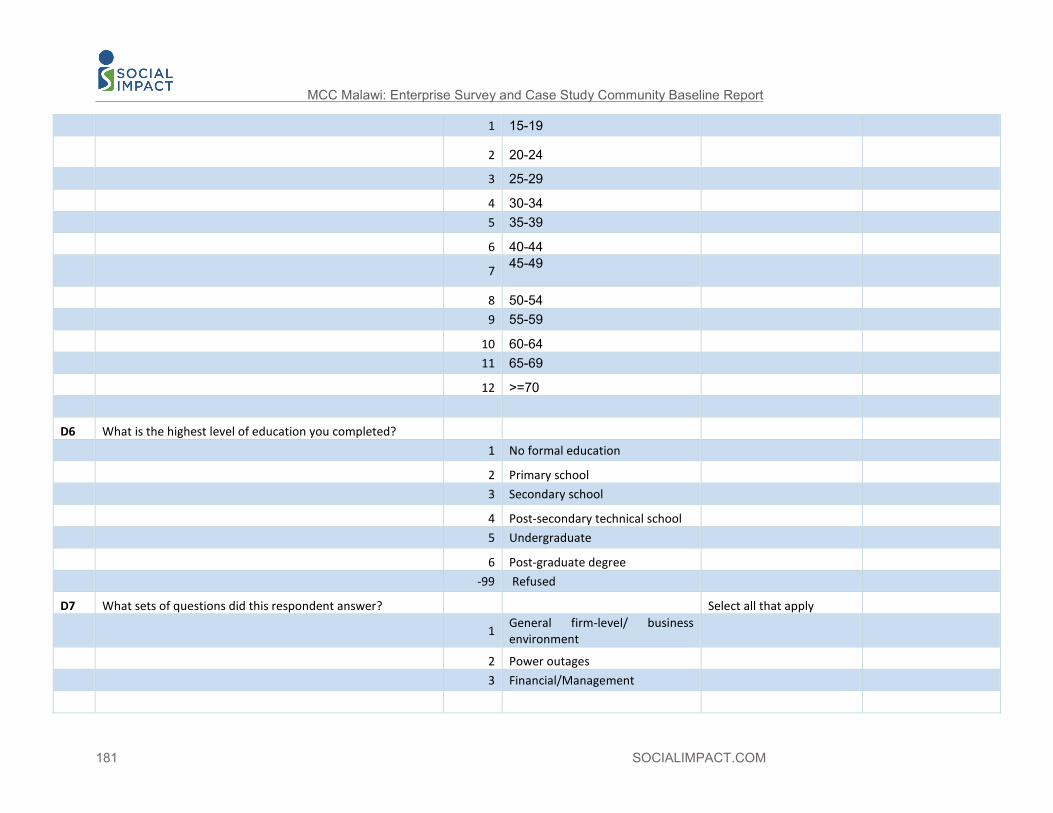
181 SOCIALIMPACT.COM
MCC Malawi: Enterprise Survey and Case Study Community Baseline Report
1 15-19
2 20-24
3 25-29
4 30-34 5 35-39
6 40-44
7 45-49
8 50-54 9 55-59
10 60-64 11 65-69
12 >=70
D6 What is the highest level of education you completed? 1 No formal education
2 Primary school 3 Secondary school
4 Post-secondary technical school 5 Undergraduate
6 Post-graduate degree -99 Refused
D7 What sets of questions did this respondent answer? Select all that apply
1 General firm-level/ business environment
2 Power outages 3 Financial/Management

SOCIALIMPACT.COM 182
Numeric
Numeric
D8 Cellphone number of the third respondent Numeric
D9 Office number of the third respondent Numeric
E1 Company address String
E2 Ward/Area String
E3 Region 1 North
2 Central 3 South
E4 District (North, Center, South) Options are presented by region
1 Balaka
2 Blantyre 3 Chikwawa
4 Chiradzulu 5 Chitipa
6 Dedza 7 Dowa
183 SOCIALIMPACT.COM
MCC Malawi: Enterprise Survey and Case Study Community Baseline Report
8 Karonga 9 Kasungu
10 Likoma 11 Lilongwe
12 Machinga 13 Mangochi
14 Mchinji 15 Mulanje
16 Mwanza 17 Mzimba
18 Neno 19 Nkhatabay
20 Nkhotakota 21 Nsanje
22 Ntcheu 23 Ntchisi
24 Phalombe 25 Rumphi
26 Salima 27 Thyolo
28 Zomba
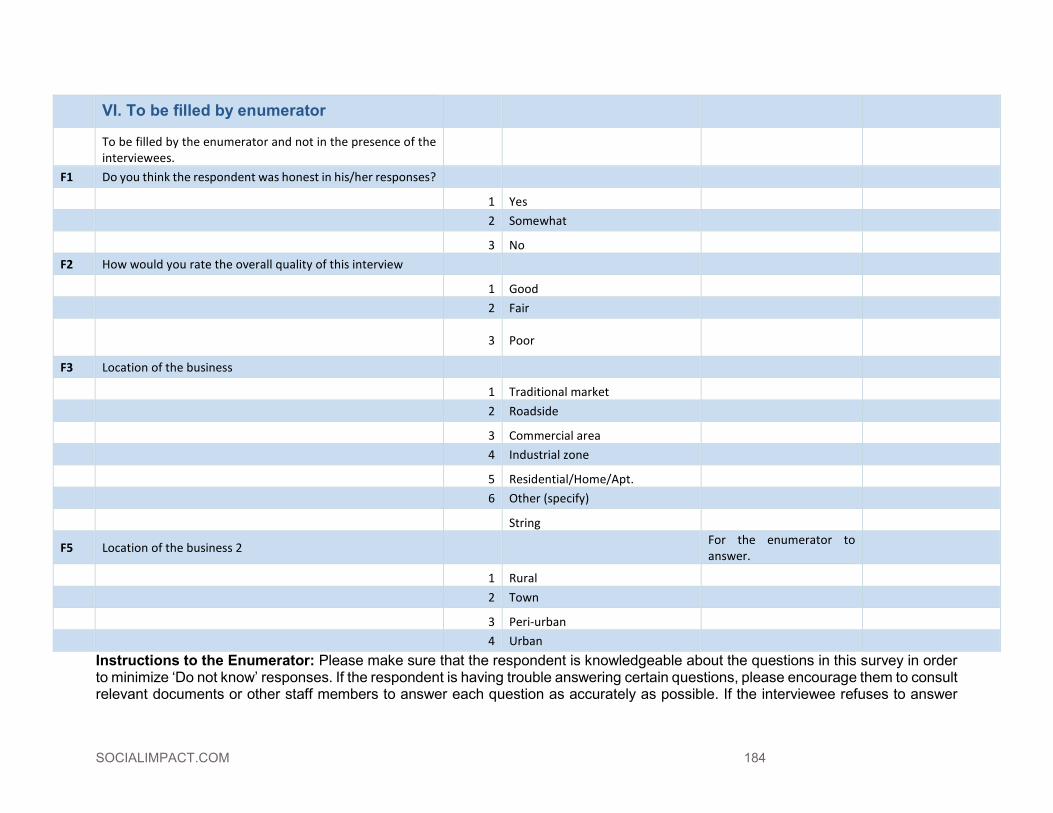
SOCIALIMPACT.COM 184
Instructions to the Enumerator: Please make sure that the respondent is knowledgeable about the questions in this survey in order to minimize ‘Do not know’ responses. If the respondent is having trouble answering certain questions, please encourage them to consult relevant documents or other staff members to answer each question as accurately as possible. If the interviewee refuses to answer
VI. To be filled by enumerator
To be filled by the enumerator and not in the presence of the interviewees.
F1 Do you think the respondent was honest in his/her responses?
1 Yes 2 Somewhat
3 No
F2 How would you rate the overall quality of this interview
1 Good
2 Fair
3 Poor
F3 Location of the business
1 Traditional market
2 Roadside
3 Commercial area
4 Industrial zone
5 Residential/Home/Apt.
6 Other (specify)
String
F5 Location of the business 2 For the enumerator to answer.
1 Rural 2 Town
3 Peri-urban 4 Urban

185 SOCIALIMPACT.COM
MCC Malawi: Enterprise Survey and Case Study Community Baseline Report
certain questions, make sure that you make it clear that the data will be kept confidential and will not be shared with anyone outside the research staff. All results will be presented in aggregate and will not be identified with an individual firm. Allow the interviewee to ask any questions and encourage him/her to feel comfortable answering the questions to the best of their ability. If respondent is not knowledgeable, stop the survey and identify the appropriate individuals who are knowledgeable in these areas. Invite this person to join the interview, or schedule a different time for the interview.

SOCIALIMPACT.COM 186
11.3 Focus Group Discussion Protocols FGD Screening Instrument for Adults with Electricity Region: Focus Group Site: Focus Group Sample: ____ Male ____Female Electricity Status: ________ with electricity ________ without electricity 1). Electricity Access: Does the household have access to ESCOM-provided electricity? Yes No If the answer is NO, the household is not suitable for this FGD. Please move to the next household. If the answer is YES, please proceed to the next question. 2). Location of Residence: Does the individual being screened live in this household currently? Yes No If the answer is NO, the applicant is not suitable for this FGD. Please ask about other potential respondents who DO live in the household. If the answer is YES, please proceed to the next question. 3). Knowledge about Electricity in the Household Are you familiar with electricity usage at your home? Yes No If the answer is NO, the applicant is not suitable for this FGD. Please ask about other potential respondents who are familiar with electricity usage. If the answer is YES, please proceed to the next question. 4). Age Category What is the age group of the prospective participant? Youth Middle Age Elderly Youth = 15-21 Middle Age = 22-55 Elderly = 56-100+
If the prospective participant is a youth, you may try to recruit them for the youth FGD. You may also ask if there are other potential respondents in the same household and then contact them by phone. The desired quota for this variable is at least 1 but no more than 2 elderly participants. 4). Gender Confirm the gender identity of the prospective participant. (If you have already reached your quota for one gender, pro-actively ask if there is an adult of the opposite gender in the household who might be able to participate.) What is the gender of the prospective participant? Male Female 5). Are you available to participate in the FGD? Yes No If the individual is available to participate, please provide them with the letter of invitation and enter their name on the roster. If time allows, you may then proceed to the recruitment mini-survey.

187 SOCIALIMPACT.COM
MCC Malawi: Enterprise Survey and Case Study Community Baseline Report
Recruitment Mini-Survey Questions for Adults in Households with Electricity
Date: Location: ______________ Gender: Male or Female
1. Do you have a prepaid or a post pay meter?
Prepaid Post pay
2. Does your household have any of the following electrical appliances? (Place an ‘X’ on all
that apply)
Refrigerator Cooker Air conditioner Fan Washer Hair Dryer Television Computer Stereo system Electric sewing machine Clothes iron Mobile phone and charger Other(s)
3. In the last year have you or someone in your household contacted ESCOM for any of the following? (Please mark an ‘X’ for all that apply.)
To report a power outage To inquire or complain about planned load shedding or
maintenance outages To report a problem with your meter To address a billing problem To apply for an electricity connection To report damaged appliances or equipment Other
4. On evenings that you are at home, how do you spend your time from 18:00-24:00?
Please help the recruiter to complete a “timeline” picture.
USE THE BACK OF THIS PAPER TO DRAW THE HOUSEHOLD TIMELINE FOLLOWING THE PROTOCOL.

SOCIALIMPACT.COM 188
Mini-Survey Questions for Adults in Households with Electricity
Date: Location: Gender: Male or Female
1. What are the sources of energy used in your home? In one month, how much does your household spend on energy sources?
Mark with X Amount of
Kwacha Electricity through an official ESCOM connection
Electricity through another type of electrical connection
paraffin
Gas
Candles
Charcoal/wood
Generator
Solar power
Car battery
Other batteries or battery cells
Other (Please explain)
2. Check all the boxes of energy you use for home cooking. Circle the type of energy that
you use most often for cooking at home.
Electricity Charcoal Firewood Other
3. Do you feel that electricity services are improving, staying the same, or worsening?
Improving Staying the same Worsening
4. Do you feel that ESCOM customer service is improving, staying the same, or worsening?
Improving Staying the same Worsening
5. Do you or anyone in your household run a business, sell things, or make items to sell out
of your home? (Place an ‘X’ below)
Yes, I do Yes, someone in my household does

189 SOCIALIMPACT.COM
MCC Malawi: Enterprise Survey and Case Study Community Baseline Report
No Thank you for completing the survey! The focus group discussion will start in just a few minutes.

SOCIALIMPACT.COM 190
FGD Menu of Questions for Households with Electricity
Theme High Priority Questions/Probes Lower Priority Questions/Probes
1). Expenditures on Energy
Discuss the answers to the question “what are the sources of energy used in your home.”
Why do some people use non-ESCOM sources? (custom? cost?)
When do you use non-ESCOM sources? (when there are black-outs? at the end of the month?)
Given the cost of other sources of electricity, how would you rate ESCOM’s tariff? Why?
Does the price of electricity or energy have an impact on the appliances you own or use?
Discuss the answers to “how much money has your household spent on energy sources.”
Explain each one (why so much/so little for each?)
Discuss the answers to the question “what source of energy do you use most for cooking at home?” Why? Please explain your preference.
Probe opinions about whether charcoal or electricity is less expensive to cook with.
Could you imagine reducing your use of charcoal in the future? What would need to happen?
2). Experiences with electricity & quality of supply
What problems have you experienced because of problems with the power supply?
How do you think your life would be different if the supply of electricity were better?
Discuss advantages and disadvantages of prepaid versus post-paid meters.
Discuss the answers to the question “what electrical appliances do you have in your home?”
Has anyone had appliances damaged because of problems with the electrical supply? Please discuss.
If people report damage to their appliances, probe what steps they have taken to reduce the problems. (e.g. surge protectors or unplugging appliances)
What can you tell us about your experiences with power outages? How often do they happen? For how long?
Does the season have an impact? Are there more in the dry season or the rainy season?
Are they a major concern or something you are used to?
How often are you notified about scheduled outages?
Are the notices accurate? Can they be counted on for planning activities?
What would be the best way for ESCOM to notify customers of upcoming outages?
Discuss answers to the question “do you feel that electrical services are improving, staying the same, or worsening?” Why?
Explore answer to the question about whether they have a pre-paid or post paid meter?
Explore if pre-paid meter owners have had problems with meters or purchasing credit.

191 SOCIALIMPACT.COM
MCC Malawi: Enterprise Survey and Case Study Community Baseline Report
Theme High Priority Questions/Probes Lower Priority Questions/Probes
Theme High Priority Questions/Probes Lower Priority Questions/Probes
3). Time Use & Income Generation
Discuss the answers to the question “do you run a small business?”
Does electricity play a role in that business?
Discuss the obstacles to growing the business. Probe whether electricity is an obstacle.
How would the business change if electrical supply were better?
Discuss the timeline activities from the recruitment process by asking “How do you spend your time in the evenings between 18:00-24:00 hours?”
What activities require electricity? Does the electrical supply impact your decision-making about how to spend your time?
How do you think this might change if the electrical supply were better?
Probe specific time allocation for working, relaxing, doing domestic work, consuming media, sleeping, and eating.
Ask how different household members are impacted by electrical outages in the evenings.
4). Attitudes towards ESCOM
Discuss the answers to the question “is ESCOM customer service improving, staying the same, or worsening?”
What is your personal experience with contacting ESCOM?
If you have contacted ESCOM in the last year, did they resolve your problem to your satisfaction? Why or why not?
What kinds of interactions have you or another member of your household had with ESCOM?
In the last year, have you or someone in your household contacted ESCOM for any of the following? -to report a power outage-to inquire or complain about loadshedding-to report a problem with yourmeter-to report damaged appliances orequipmentTo address a billing problem
How would you evaluate the quality of ESCOM’s communications?
If you have contacted ESCOM in the last year, how would you evaluate the treatment that you received?

SOCIALIMPACT.COM 192
Region: Focus Group Site: Focus Group Sample: ____ Male ____Female
Electricity Status: ________ with electricity ________ without electricity
1). Electricity Access Does the household have access to ESCOM-provided electricity? Yes No
If the answer is YES, the household is not suitable for this FGD. Please move to the next household. If the answer is NO, please proceed to the next question.
2). Location of Residence
Does the individual being screened live in this household currently? Yes No
If the answer is NO, the applicant is not suitable for this FGD. Please ask about other potential respondents who DO live in the household. If the answer is YES, please proceed to the next question.
3). Application for ESCOM electricity connection Has your household submitted an application for an electricity connection? Yes No
If the answer is NO, the applicant is not suitable for this FGD. If the answer is YES, please proceed to the next question.
4). Age Category What is the age group of the prospective participant? Youth Middle Age
Elderly Youth = 15-21 Middle Age = 22-55 Elderly = 56-100+
If the prospective participant is a youth, attempt to recruit them for the youth FGD. Please ask if there are other potential respondents in the same household. The desired quota for this variable is at least 1 but no more than 2 elderly participants. 4). Gender Confirm the gender identity of the prospective participant. (If you have already reached your quota for one gender, pro-actively ask if there is an adult of the opposite gender in the household who might be able to participate.) What is the gender of the prospective participant? Male Female
5). Are you available to participate in the FGD? Yes No
If the individual is available to participate, please provide them with the letter of invitation and enter their name on the roster. If time allows, you may then proceed to the recruitment mini-survey.
FGD Screening Instrument for Adults without Electricity

193 SOCIALIMPACT.COM
MCC Malawi: Enterprise Survey and Case Study Community Baseline Report
Recruitment Mini-Survey Questions for Adults in Households without Electricity
Date: Location: Gender: Male or Female
1. When did you apply for an electricity connection? (Please circle the year and month)
2015 2014 2013 2012 2011 2010 Year Jan. Feb. Mar. Apr. May. June July Aug. Sept. Oct. Nov. Dec. Month
2. Has your household paid ESCOM for the electricity connection?
Yes No
a. If so, when did this occur? (Please circle the year and month)
2015 2014 2013 2012 2011 2010 Year Jan. Feb. Mar. Apr. May. June July Aug. Sept. Oct. Nov. Dec. Month
3. Has your household submitted documentation to ESCOM that the household is properly
wired by a certified electrician?
Yes No
a. If so, when did this occur? (Please circle the year and month)
2015 2014 2013 2012 2011 2010 Year Jan. Feb. Mar. Apr. May. June July Aug. Sept. Oct. Nov. Dec. Month
4. Does your household have any of the following appliances? (Place an ‘X’ on all that
apply)
Refrigerator Cooker Air conditioner Fan Washer Hair Dryer Television Computer Stereo system Electric sewing machine Clothes iron Mobile phone and charger Other(s)

SOCIALIMPACT.COM 194
5. On evenings that you are at home, how do you spend your time from 18:00-24:00? Please help the recruiter to complete a “timeline” picture.
USE THE BACK OF THIS PAPER TO DRAW THE HOUSEHOLD TIMELINE FOLLOWING THE PROTOCOL.

195 SOCIALIMPACT.COM
MCC Malawi: Enterprise Survey and Case Study Community Baseline Report
Mini-Survey Questions for Adults in Households without Electricity
Date: Location: Gender: Male or Female
1. What are the sources of energy used in your home? In one month, how much does your household spend on energy sources?
Mark with X Amount of
Kwacha Electricity through a non-ESCOM electrical connection
Parrafin
Gas
Candles
Charcoal/wood
Generator
Solar power
Car battery
Other batteries or battery cells
Other (Please explain)
2. Do you or anyone in your household run a business, sell things, or make items to sell out of your home? (Place an ‘X’ below)
Yes, I do Yes, someone in my household does No
3. Has your household submitted an application to ESCOM for an electricity connection?
Yes No
4. How would you evaluate ESCOM’s efforts to connect your household?
Very good Good Fair Poor Very poor
Thank you for completing the survey! The focus group discussion will start in just a few minutes.

SOCIALIMPACT.COM 196
FGD Menu of Questions for Households without Electricity
Theme High Priority Questions/Probes Lower Priority Questions/Probes
1). Expenditures on Energy
Discuss the answers to the question “what are the sources of energy used in your home.” Why do these use those sources in particular?
Given the cost of other sources of electricity, how would you rate ESCOM’s tariff? Why?
Discuss the answers to “how much money has your household spent on energy sources.” How do you think the price of electricity compares?
Does the price of energy have an impact on the appliances you own or use?
“What source of energy do you use most for cooking at home?” Why? Please explain your preference.
Could you imagine reducing your use of charcoal in the future? What would need to happen?
2). Time Use & Income Generation
Discuss the answers to the question “do you run a small business?” Does electricity play a role in that business?
Discuss the obstacles to growing the business. Probe whether electricity is an obstacle. How would the business change if electrical supply were better?
Discuss the timeline activities from the recruitment process by asking “How do you spend your time in the evenings between 18:00-24:00 hours?” How does the lack of electricity impact your life, especially in the evenings? How do you think your life would chance with electricity?
Probe specific time allocation for working, relaxing, doing domestic work, consuming media, sleeping, and eating. Ask how different household members are impacted during these hours by the lack of electricity.
3). Attitudes towards ESCOM
Discuss the answers to the question “when did your household apply for an electricity connection?” Discuss steps in application process: 1). Applying for a connection; 2). Paying for the connection; and 3). Submitting documentation about electrical wiring.
Probe what they think of the process and timing for applying for electricity.
Discuss your answer to the question “how would you evaluate ESCOM’s efforts to connect your household?”
What is your opinion about ESCOM’s tariff? Why?
If you have contacted ESCOM in the last year, how would you evaluate the treatment that you received?
Discuss your experience of corruption with ESCOM? Has ESCOM ever solicited a bribe from you or a member of your household?

197 SOCIALIMPACT.COM
MCC Malawi: Enterprise Survey and Case Study Community Baseline Report
FGD Screening Instrument for Secondary School Students Region: Focus Group Site: Focus Group Sample: ____ Male ____Female Electricity Status: ________ with electricity ________ without electricity 1). Electricity Access: Does the household have access to ESCOM-provided electricity? Yes No Confirm that you have the right type of household for this particular FGD. 2). Location of Residence: Does the individual being screened live in this household currently? Yes No If the answer is NO, the applicant is not suitable for this FGD. Please ask about other potential respondents who DO live in the household. If the answer is YES, please proceed to the next question. 3). Age of Respondent Is the respondent the appropriate age for the study (15-21)? Yes No If the answer is NO, the applicant is not suitable for this FGD. Please ask about other potential respondents in the household. If the answer is YES, please proceed to the next question. 4). School Enrollment Status Is the respondent currently attending secondary school? Yes No l If the answer is yes, please continue with the screening process. If the answer is no, this person is not suitable. Please ask if there is anyone else in the household who would be. 4). Gender Confirm the gender identity of the prospective participant. (If you have already reached your quota for one gender, pro-actively ask if there is a secondary student of opposite gender in the household who might be able to participate.) What is the gender of the prospective participant? Male Female 5). Are you available to participate in the FGD? Yes No If the individual is available to participate, please provide them with the letter of invitation and enter their name on the roster. Be sure to seek the permission for attendance from a parent or other responsible adult. If time allows, you may then proceed to the recruitment mini-survey.
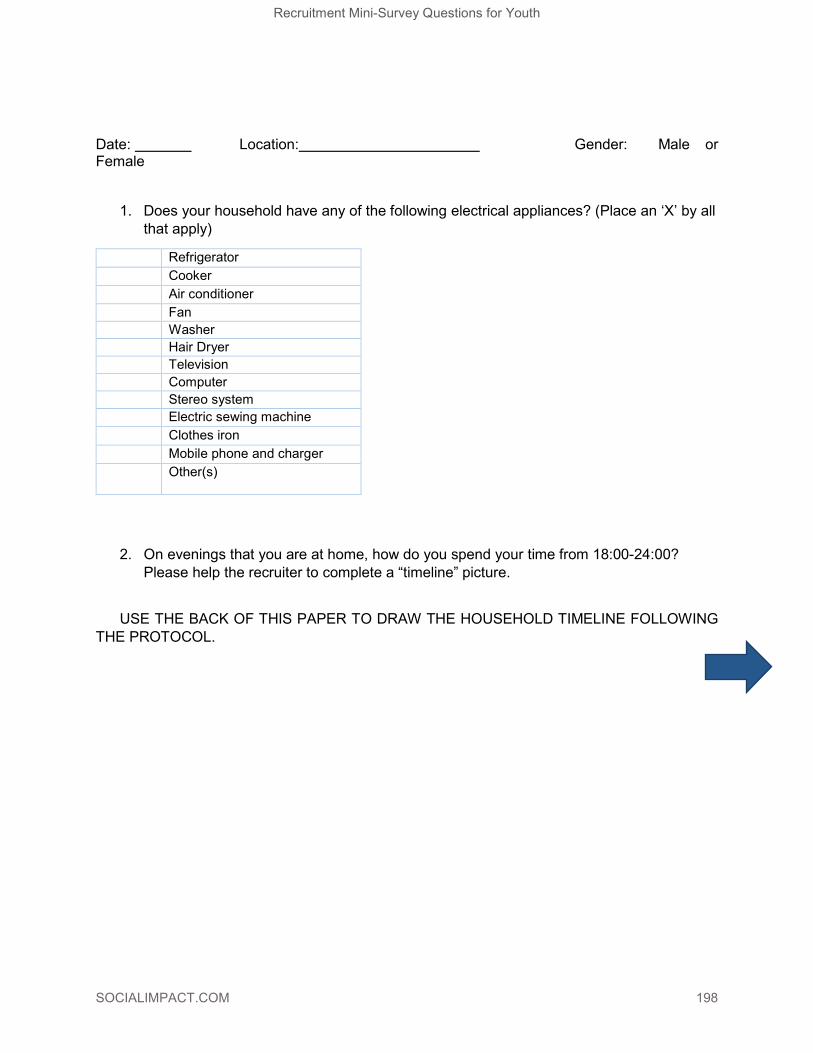
SOCIALIMPACT.COM 198
Date: Location: Gender: Male or Female
1. Does your household have any of the following electrical appliances? (Place an ‘X’ by all that apply)
Refrigerator Cooker Air conditioner Fan Washer Hair Dryer Television Computer Stereo system Electric sewing machine Clothes iron Mobile phone and charger Other(s)
2. On evenings that you are at home, how do you spend your time from 18:00-24:00? Please help the recruiter to complete a “timeline” picture.
USE THE BACK OF THIS PAPER TO DRAW THE HOUSEHOLD TIMELINE FOLLOWING
THE PROTOCOL.
Recruitment Mini-Survey Questions for Youth
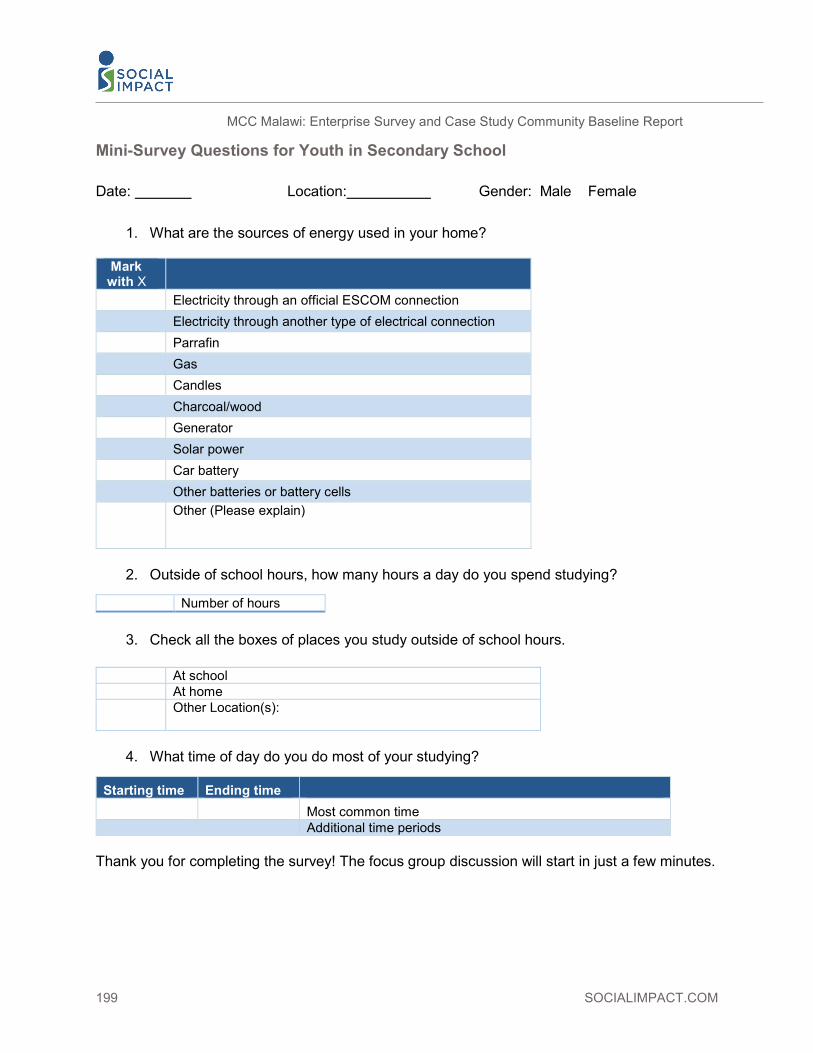
199 SOCIALIMPACT.COM
MCC Malawi: Enterprise Survey and Case Study Community Baseline Report
Mini-Survey Questions for Youth in Secondary School Date: Location: Gender: Male Female
1. What are the sources of energy used in your home?
Mark with X
Electricity through an official ESCOM connection
Electricity through another type of electrical connection
Parrafin
Gas
Candles
Charcoal/wood
Generator
Solar power
Car battery
Other batteries or battery cells
Other (Please explain)
2. Outside of school hours, how many hours a day do you spend studying?
Number of hours
3. Check all the boxes of places you study outside of school hours.
4. What time of day do you do most of your studying?
Starting time Ending time Most common time Additional time periods
Thank you for completing the survey! The focus group discussion will start in just a few minutes.
At school At home Other Location(s):

SOCIALIMPACT.COM 200
FGD Menu of Questions for Youth
Theme High Priority Questions/Probes Lower Priority Questions/Probes
1). Expenditures on Energy
Discuss the answers to the question “what are the sources of energy used in your home.” Why do these use those sources in particular?
Why do you think that your household uses energy in this way?
“What source of energy do you use most for cooking at home?” Why? Please explain.
Could you imagine reducing your use of charcoal in the future? What would need to happen?
2). Time Use & Income Generation
Does anyone in your household run a small business? Does electricity play a role in that business?
Discuss the obstacles to growing the business. Probe whether electricity is an obstacle. How would the business change if electrical supply were better?
Discuss the timeline activities from the recruitment process by asking “How do you spend your time in the evenings between 18:00-24:00 hours?” How might this change with better electrical supply?
Probe specific time allocation for working, relaxing, doing domestic work, consuming media, sleeping, and eating. Ask how different household members use electricity during these hours.
What do you use electricity for? How does this compare with other people in your household?
3). Intersection between electricity and studying
Ask participants to discuss their study habits. When and where do they usually study? Does the quality of electrical supply (e.g. blackouts) impact their studies? Does the price of electricity impact their studies?
Discuss role of black outs, load shedding, and tariff increases on study habits and opportunities. Probe needs leading up to and including exam periods.

201 SOCIALIMPACT.COM
MCC Malawi: Enterprise Survey and Case Study Community Baseline Report
Timeline Activity Protocol Overview: The goal of the timeline activity is to capture a snapshot of how people spend their time at the household level during evening hours. Recruiters will ask people to either complete the diagram themselves or they will transcribe what participants tell them. Additional prompts will encourage people to think about specific activities (e.g. studying, watching television, doing housework) and the specific times during which they do them. When possible, recruiters should ask respondents to differentiate between timelines for different household members (e.g. youth, children, men, women). It may be preferable to use 2 or 3 different timelines for the sake of clarity. Specific Instructions: 1). Explain to participants that you want to understand how they spend their time between 18:00-24:00 hours. 2). Draw a timeline on the back of the mini-survey form (an example is below). 18:00 24:00 3). Ask the participant to help you fill out the timeline by describing what they do during these hours. (You can hand the paper to them if they are comfortable or you can do the writing yourself.)
• People are welcome to use written words OR pictures to represent their activities • You may need to help them get started with a prompt (e.g. What time to you eat?)
4). As they are filling out the timeline, please encourage them to think about the different types of activities we are interested in capturing:
• Eating • Sleeping • Watching TV • Listening to the Radio • Studying • Reading • Cleaning or household chores • Spending time with friends • Cooking • Doing Household Chores • Doing small business work • OTHER
5). If time allows, ask them to repeat the exercise for other people in their household (children, youth, adults, elders). Again, you may need to start with a prompt such as “what about children?” 6). Conclude the exercise by ‘interviewing the diagram’ and asking people additional
follow-up questions about how they use electricity during this time period. Write the notes up.

11.4 Stakeholder Comments and Evaluator Responses Institution Page No. of
draft report Comment Evaluator Responses
MCC 73, Section 7.1.1.
Do you have reliable data on the quantity and value of electricity consumed, by source? It would be interesting to see how the mix of energy sources consumed changes over time (in addition to what the existing charts present).
We have estimates of values of electricity consumed from questions on electricity expenditures from IHS4. All of the relevant data available from the oversample from IHS4 are presented in Section 7.2.2. However, we do not conclude that this data is especially reliable. In the paragraphs below we include the caveat: "While participants were asked to estimate their monthly expenditures on different energy sources, the consensus among all FGD participants was that the actual cost of electricity is impossible to calculate due to poor service, blackouts, corruption, and inaccurate meter reading. Furthermore, it is also difficult to compare electricity prices with prices of charcoal, wood, and gas due to differing modalities for distribution and variable pricing depending on the season." Moreover, we do not have this data available over time as the IHS4 oversample data in the FGD communities was collected in 2016/2017 and will not be repeated. In our view accurate measurement would require a diary based tracking system with a panel of consumers.

203 SOCIALIMPACT.COM
MCC Malawi: Enterprise Survey and Case Study Community Baseline Report
MCC 82 Do we know on average how long blackouts last?
Data on length of blackouts is not available in the IHS4 dataset, unfortunately - respondents were asked only about the frequency of blackouts. However, we present estimates of blackout duration in Section 6.2.1 using data from the enterprise survey; the blackout experiences of 3Phase customers are likely to be similar to those of many households since many of these businesses are located in the same communities. While FGDs did address the frequency of blackouts, FGDs are not a good tool for measurements of this nature.
MCC General Comment 1
The document is written as if it is answering the questions of the evaluation instead of providing an overview of baseline characteristics. I think the overall tone of the document should be changed to reflect that the document is only meant to provide an overview of baseline characteristics that will be used in the final evaluation to analyze changes over time in order to determine the impact of the IDP and PSRP investments.
We have edited the language throughout the document accordingly.

SOCIALIMPACT.COM 204
MCC General Comment 2
In several sections of the document, you provide summary statistics for firms electricity costs and other costs of the firm. However, a more informative statistic would be firms costs as a share of total costs (i.e. electricity costs as a share of total costs). Total costs of electricity do not provide any indication of the burden of electricity costs to the firm or the dependency of the firm on electricity (it makes sense that larger firms would consume more energy and therefore pay more for electricity than smaller firms). Similarly, over time, firms may grow or shrink, which will impact their energy costs, the IDP and PSRP should have an impact on the share of total costs devoted to electricity expenditures. Although there are many firms that do not provide information on firm costs and revenue, I think it is important to provide the descriptive statistics as a share of total costs or firm revenues on the subsample of firms that do provide the information. It is much more informative.
This has been added.
MCC I The report notes that Malawi's "electricity generation rates are also extremely low, producing just 21.5 Megawatt (MW) of electricity per million people." This figure appears to conflate electricity generation (reported in MWh of energy produced) with installed capacity. The figure of 21.5 seems to be derived from dividing the 351 MW of
We have edited the language throughout the document accordingly.
205 SOCIALIMPACT.COM
MCC Malawi: Enterprise Survey and Case Study Community Baseline Report
installed capacity by the population -- if citing this figure, then reference should be made to installed capacity per million people; otherwise suggest using Total electricity supply in MWh, which can be taken from the latest ITT. (Given the issues summarized in the remainder of the paragraph, this should be re-worded to clearly refer to energy production, rather than MW capacity per million.)
MCC I "This report includes baseline evaluation findings from a nationwide representative sample of businesses." Please clarify here what is meant by 'representative' sample, given that the sampled firms are generally not reflective of the median firm type / size within Malawi.
The sample is not representative of businesses; it is representative of businesses with three-phase and maximum demand electricity connections.This excludes most of the informal economy and particularly the many businesses that are run out of people's homes with domestic connections. We use the word "respresenative" to refer to the geographic reach of our sample; we also stratified by type of customer (MD/3Phase) when selecting sampled firms. We have edited to clarify.
MCC Page IV, Paragraph 2 and 3 under findings.
Refer to General Comment 1 Edited accordingly.

SOCIALIMPACT.COM 206
MCC Page VI, Paragraph 1
Refer to General Comment 2 Edited accordingly.
MCC Page VII, Last Paragraph (Section Energy Expenditures)
Refer to General Comment 2 - This should be as a share of total household expenditure.
Unfortunately we do not have reliable data for the total household expenditures thus we present the electricity expenditures directly. There were limits to what data could be collected given the many evaluation questions.
MCC 2 In the opening of Section 2.1, the report states that the Compact was designed as a foundation to the solution to Malawi's electricity "crisis." This is the first time any SI reports have characterized the Compact in this way, or referred to any such crisis. While the power subsector is experiencing many challenges (both acute and chronic), I suggest using the more general language about the Compact that was used in Section 2.1 (Background) of the Midline PSRP report. In general, it doesn't make sense to refer to a 5-year compact investment as designed to address a short-term crisis....
The language has been edited to remove the framing of the situation as "crisis", and instead refer to "challenges."
MCC 5 Refer to comments above from Executive Summary for recommended clarifications (and clear distinction b/w power production vs. capacity).
The text has been edited accordingly.

207 SOCIALIMPACT.COM
MCC Malawi: Enterprise Survey and Case Study Community Baseline Report
MCC 7 "Even though the costs of self-generation are about three times the cost on average of purchasing subsidized electricity from the public grid, the generators only operate a small fraction of the time and do not greatly affect the overall average cost of power to industry." This is an interesting point. Although (assuming) generators only operate a small fraction of the time and don't greatly drive up overall costs, it still implies that outages are significant enough that a firm made a decision to invest in self-generation in the first place; the fixed and marginal costs of doing so are high relative to the amount of time it is used (conversely, if outages are widespread and frequent, the overall cost of power would rise significantly while the relative cost per KWh of self-Gx would fall). There must also be a relationship between the prevalence of outages over the long term (e.g. a year) and the decision to own a generator; (I believe the same authors cited in Footnote 30 published these findings in a 2009 paper with the World Bank; the abstract of that paper notes that their model predicts the prevalence of own generation, among some firms, would remain high even if power supplies were perfectly reliable.)
Thanks. We have simplified the presentation of Steinbuks and Foster's finding to note that across their countries of study the benefits of generators outweigh the costs.

SOCIALIMPACT.COM 208
MCC 10 Good discussion of differential benefits of electricity across income groups. A study from western Kenya by Ted Miguel (UC Berkeley) also support this observation -- a key unknown out of that study was the potential role of reliability (which could not be measured) vs. mere access to a connection. That said, the economic gains from electricity for poorer households may still occur, but possibly over a significantly longer time period. It may be useful to point out that this evaluation, particularly at endline, will also focus on the role of reliability as a key factor in understanding the benefits of electricity - rather than simply looking at access (with no window into reliability - a potential limitation of other studies.
Added this point to the text.
MCC 11 Should the description of a "nationally representative" enterprise survey be clarifified to note that it was over-sampled on the largest firms (and is far from the 'median' enterprise in Malawi according to NSO business census data)? (The further details provided at bottom of p. 14 are helpful here)
We do discuss the oversample and the use of weighting to arrive at a national representative in the paragraphs below, so the results we present are nationally respresentative as summarized in this bullet.
MCC 12 "The original evaluation design also included focus group discussions at the same three periods in time to obtain a qualitative sense of potential changes in households in high beneficiary communities." What does "high"
We have edited the language to refer to communities expected to benefits from IDP investments. We've added more specific information on IDP benefits in the discussion of case selection and Table 6

209 SOCIALIMPACT.COM
MCC Malawi: Enterprise Survey and Case Study Community Baseline Report
beneficiary mean in this context? The report doesn't define this.
MCC 15 Similar comment as above: the paragraph below Table 5 refers to disaggregations based on "IDP beneficiary status," which is not clearly defined -- clarify if this refers to beneficiaries who may be identified based on metering data as receiving a greater magnitude of improved reliability.
We have added a detailed footnote (currently footnote 50) to explain potential variation in benefits and how we hope to be able to measure these at endline using the metering data - although we also note potential limitations to doing so.
MCC Page 16, Last Paragraph
Additional descriptive statistics of the sampled firms would be useful, such as 1.) average number of employees; 2.) Distribution of firm size (number of employees); 3.) Gender of the owner (or respondent); 4.) Average age of the owner (or respondent)
We have now added a table of firm attributes including these and other characteristics of the firms in our sample.
MCC 16 4.3.4 Enterprise Survey Sample Characteristics: could you provide a pie graph (or other chart) showing the breakdown of firms by sector? May consider figures for descriptive stats noted in the comment above as well.
A pie chart showing sectoral breakdown has been added.
MCC Page 25 What does 'disloyal' mean? You say that customers are "disloyal to the public electricity utility".
We have clarified that this is the terminology of the authors of the cited work and added a footnote to note that loyalty is a composite measure of six concepts, including repeat patronage, self stated retention, price

SOCIALIMPACT.COM 210
insensitivity, resistance to counter persuasion, and the likelihood of spreading positive word of mouth information.
MCC 25-26 The outcomes listed in 5.2 are of high interest -- but it is accurate to describe these as "evaluation questions"? They aren't specific evaluation questions as stated in the Design Report.
Language edited to clarify.
MCC 27 "All results are also disaggregated by customer type, which is a proxy for business size, with most MD customers representing larger businesses, while Three Phase customers are predominantly smaller businesses." Is large vs. smaller being referred to in terms of number of employees (the metric used earlier in the report and used by the WB Enterprise Survey), or business revenue?
Revenue and employee base are highly correlated but here we refer to headcount since we have more reliable data on employment than revenue. This has been clarified in text.
MCC Page 27, Paragraph 2
Refer to General Comment 1 Edited accordingly.
MCC 30 With maize mills having zero to 4 employees but electricity comprising 54 percent of all costs, can you clarify if maize mills are generally MD or 3-phase customers?
Maize mills are three-phase customers - clarified in text.
MCC Page 30 Can you provide a table similar to table 9 but provides electricity costs as a percentage of total costs?
Yes, we have now added electricity costs as percentage of total costs to this table.

211 SOCIALIMPACT.COM
MCC Malawi: Enterprise Survey and Case Study Community Baseline Report
MCC Page 31 Figures 4 and 5: I’m not sure I understand the figures, Figure 5 for MDs suggests that the 95th percentile electricity expenditure exceeds 100K but figure 4, which includes all firms does not have a 95th percentile electricity expenditure over 100K, how is that possible?
We have double checked this data and confirmed it is accurate. The reason for the pronounced differences in the shape of the box plots of all firms and the graphs disaggregating by customer type is the drastic differences in the sample sizes - there are 638 3phase firms and only 155 MD firms with expenditure data; so when we graph the total, the distribution is made up mostly of three phase customers, pulling the median and the 25%, 75% and all other percentile values down to levels closer to 3phase expenditures shown in figure 5 than to MD expenditures on electricity shown in Figure 5. We agree this plot is confusing and have now removed it and replaced it with histograms of electricity expenditures as % of total firm costs - as suggested in other MCC comments this may be the more meaningful outcome measure.
MCC 33 The report notes, "In general, outages lasted longer in the dry season. The median outage lasted 4-5 hours in the dry season and 6-7.5 hours in the rainy season." This seems contradictory… but on p. 36, Figures 9 and 10 seem to show that outages lasted longer in the rainy season.
This has been corrected.

SOCIALIMPACT.COM 212
MCC Page 36 Can you provide a table similar to table 10 but provides cost as a percentage of total generator costs?
We added reference to proportion of costs in the text. We did not add these to the table, however, as it already busy, plus due to the differences in the types of estimates different firms were able to provide and given that we don't have every component of every cost for every firm (some tracked fuel costs and some didn't, not all firms could provide estimates of maintenance costs) we have opted to present the median costs among those able to report the particular sub-cost; we also provide the overall costs across all categories for the median firm in the rightmost column, which can be used to get a sense of what proportion of costs are represented by fuel and mainance costs.
MCC 36-37 Regarding Generator use / ownership, can you clarify the figures on 3-phase customers? Section 6.2.2 states that only 13 percent of 3-phase customers use generators, but at the end of the paragraph states that 19 percent of 3-phase customers have more than one generator (suggesting an even larger number have at least 1).
Yes, only 13% of 3Phase firms use generators, and of these firms 19% had more than one generator. Text has been clarified accordingly.

213 SOCIALIMPACT.COM
MCC Malawi: Enterprise Survey and Case Study Community Baseline Report
MCC 37 Did you collect data on the capacity of the generators owned, or the amount spent on purchasing generators?
Yes, we collected this data but we aren't confident that the estimates provided by respondents and recorded by the enumerators are accurate. The data was supposed to be collected in terms of kilowatts but it is clear that in many cases the enumerator wrote down the number of watts. Unfortunately, there is not a good way to sort this out, so we have excluded this from our analysis and will try to correct with better guidance/training at endline, which won't help for evaluation purposes but will for basic descriptive purposes. We have added information about the amount spent.
MCC 40 Figure 15: Are you able to provide the ‘N’ for each category of firm size, as in Figure 14 above (by generator use)? Also, why is the bar for ‘Total’ missing?
This graph has been edited to include the sample size for each cateogry and the total bar.
MCC 41 6.2.4 Outage Costs: "Estimated costs of outages were much higher for MD customers, with the median firm reporting that the costs associated with outages (including generator costs described above) were $7,938 a year for MD customers, and $656 for the median three phase firm." Here, it will be important for the report to provide details / analysis in terms of outage costs as a percentage of total business costs, as
We have added rows to the tables on outage costs as percentage of total costs and added discussion in the text.

SOCIALIMPACT.COM 214
noted in other commnets. We might expect that 3-phase firms will experience higher outage costs as percentage of total costs, especially among those that don't own or use a generator.
MCC Page 42 Can you provide a table similar to table 12 but provides cost as a percentage of total costs?
We have now added information on total generator and outage costs as percentage of total costs.
MCC 42 Between Sections 6.2.2 - 6.2.4, looking at the various costs of outages (including fuel/generator costs), and differences in outage response between firms with / without generators (and impact of outages on operations), it would be helpful to include analysis in 6.2.4 on the differences in outage costs (across all categories: fuel/maintenance, as well as those covered in the 'outage costs' section) between those who primarily use a generator (and experience minimal interruption), and firms that do not use/own a generator. It seems like we would expect firms relying on a generator to primarily experience costs in terms of fuel/maintenance, etc., rather than lost revenue, idle workers, etc. -- the figures on MD customers from Table 12 seem surprising in this sense. Conversely, it would appear reasonable to expect firms without generators to experience a greater proportion of outage costs in the category of
We have added a table disaggregated the outage costs by ownership of generator and added a discussion in text.

215 SOCIALIMPACT.COM
MCC Malawi: Enterprise Survey and Case Study Community Baseline Report
lost revenue, idle workers, etc. This might require separate tables, but would be useful to understand if there are differences here. Similarly, as noted, costs among different firm/customer types could be contextualized by also stating them as a percentage of total business costs (although the dollar figures are helpful to see also).
MCC 42 Table 12 is somewhat difficult to understand, in terms of what is being conveyed by the bottom 2 rows (Total outage costs, excluding generator; Total outage costs, including generator). Are the cost categories from the first 4 rows meant to sum up to either of these figures? There doesn't seem to be any correlation between the Total outage costs figures and the other break-downs of costs - especially since Lost Revenue appears to match or even exceed the Total outage costs; neither of the 'Total cost' categories appear to be described in terms of what other types of costs are included. Following on the point noted above, it's also difficult to see how the breakdown of outage costs is
We have restructured these tables because the total rows were in fact quite misleading (as you point out) because only a fraction of the firms reported each type of non-generator cost of outages and the costs are not actually additive across rows but additive across each firm - with zeros assumed for categories where the firm did not provide an estimate.
SOCIALIMPACT.COM 216
different between firms that use generators and those who don't -- as well as any differences in total outage costs as a percent of total business costs between these 2 different outage coping/response strategies.
MCC 45 Figure 19 appears not to have a color key for the charts - please add.
Done.
MCC 46 6.3.1 Capital Investments: "About a third of firms reported making substantial new investments in the previous year." Could you also provide the MD / 3P breakdown for this? Might also be interesting to see any differences by sector, firm size, gender of owner/respondent, or ownership structure.
Added text on these disaggregations to this section
MCC 50 Employment: would it be possible to explore employee growth differences by sector of the firm? Also, given the finding "Firms that reported higher satisfaction with their electricity supply also experienced higher employment growth," might this also correlate with MD (i.e. larger) firms which may experience more favorable load shedding / fault response treatment from ESCOM?
Unfortunately we do not have a sufficiently diverse sample to allow for meaningful dissaggregation by sector since 737 out of 963 firms for which we have size data are in manufacturing sector, and the other firms are split across a variety of sectors, with the second large sector being accomodation representing n=71. Because the median growth across almost all industries is around zero, the differences between sectors aren't meaningful, in particular given the noisiness of the estimate. We did add

217 SOCIALIMPACT.COM
MCC Malawi: Enterprise Survey and Case Study Community Baseline Report
text to refer to the potential correlation with differences in electricity service by firm size/customer type.
MCC Page 53 An explanation should be provided for why a multivariate analysis is being performed to better understand the correlates of ESCOM satisfaction. For example, the bivariate correlations may be influenced by other factors, and the multivariate analysis allows for you to condition on those factors in order to isolate statistically significant correlates of ESCOM satisfaction.
Edited accordingly.
MCC Page 54 Why is table 16 of predicted probabilities and not marginal effects or odds ratio?
We find the predicted probabilities to be much easier to interpret and more intuitive. The coefficients in the annex are presented as odds ratios, but its easy to over-interpret the size of the effect represented by a high odds ratio.
MCC 59 6.5.2 New Connections: "Among the firms that received a connection, the average wait time for a quote was 2.5 months (median), and the average wait time until they got the connection was three months (median)." Are these additive to each other, or is the
The wait time for the connection is measured from the date of payment for connection, so these are additive in the sense of the amount of time the customer is waiting on ESCOM but they aren't additive in total time as there might be sometime

SOCIALIMPACT.COM 218
latter, average wait time, inclusive of the time spent waiting for a quote?
between date of quote and date of payment. This has been clarified in text.
MCC 66 6.7.2 Generatal Communication: While the summary notes that the majority of customers perceive ESCOM communications as poor or very poor, the percentages depicted for these categories for Three Phase customers in Figure 37 only add up to 49% (35+14); the figure also does not show the total breakdown for all firms (though the numbers for MD customers would appear to drag the overall average below 50%).
We have clarified this in text - we were contrasting the almost half of customers rating communication as poor/very poor, compared to a fifth of respondents rating the communications good/very good. Also a third of respondents perceived communication as fair. We have also added the total bar to the graph for clarity.
MCC 70 The report states: "Firms with a generator were willing to pay slightly more to reduce outages." However the figures in Table 23 suggest the opposite: Willingness to pay 17% higher tariffs among firms with generator vs. 21% among firms without.
We have corrected this typo.

219 SOCIALIMPACT.COM
MCC Malawi: Enterprise Survey and Case Study Community Baseline Report
MCC 72 In the discussion of support for tariff increases by firm type, generator use, etc., it would also be helpful to comment on the survey findings in light of what can be reasonably interpreted based on their reported responses to outages among various firm types (i.e. the "revealed preference" of WTP based on behavior) - e.g. use/ownership of a generator, costs of fuel, etc. Section 6.2.2 noted that 65% of MD firms use or own a generator, and among firms that own generator, 77% of firms use a generator every time there is an outage. Of MD customers, the report notes they are "far less likely to support tariff increases for improved services." Yet, the report also notes, "those with a generator are consistently observed to be more supportive of the tariff and tariff increases than those who do not have a generator. This suggests that generators are not insulating firms from unreliable electricity." Although electricity makes up a greater percentage of total business costs among larger / MD firms (correlated somewhat with those that own a generator), might this suggest that such firms could be answering the expressed WTP questions somewhat strategically and actually do have relatively higher WTP?
It's possible and we recognize the limitations of expressed willingness to pay measures, but there are relatively few firms that are actually paying for generators that allow them to maintain operations. Many of the firms that have generators use them for specific tasks and not to continue business as usual. In footnote 68 we write, "While there are firms that have the generation capacity to fully maintain operations when outages occur, these are the minority of generator owners. There are only 62 MD firms (25%) and 30 three-phase customers (4%) that report using a generator every time the power goes out and report that business continues with minimal effect. Qualitative interviews suggest that some MD manufacturing firms only use the generators to keep offices and security lights operating, not their manufacturing operations." So this behavior indication does suggest a limit on true willingness to pay.

SOCIALIMPACT.COM 220
MCC Section 6.8.3 Throughout section 6.8.3 you use the word “predictor” when discussing the variables used in the regressions, inferring a causal relationship between the dependent variable and the regressors. These are not causal regressions, I suggesting only referring to the relationships as correlations when discussing the coefficients from the multivariate analysis.
We have edited accordingly; however, the term "predictor" does not assume a causal relationship.
MCC Page 69 An explanation should be provided for why a multivariate analysis is being performed to better understand the correlates of ESCOM satisfaction. For example, the bivariate correlations may be influenced by other factors, and the multivariate analysis allows for you to condition on those factors in order to isolate statistically significant correlates of ESCOM satisfaction.
Edited accordingly.
MCC Section 6.8.3 Throughout section 6.8.3 you use the phrase "important predictor", do you mean statistically significant?
Yes, these variables are indeed statistically signficant, this has been clarified.
MCC 88-89 Sections 7.2 and 7.3, the intro/summary under these evaluation questions should be clarified to note these findings relate to baseline, and are therefore not able/intended to answer the evaluation questions in this report.
We added language to the introduction to this section to note that we will not be able to answer the questions and are simply organizing the findings by question. In the questions themselves we highlight that we are presenting baseline findings. We do not state each time that we will not be able to answer the question until endline.

221 SOCIALIMPACT.COM
MCC Malawi: Enterprise Survey and Case Study Community Baseline Report
MCC 93 Same comment as above, for 7.4 This question doesn't have an intro summary so no changes made here.
MCC 94 Regarding the perception of bribery associated with installation of pre-paid meters, this is surprising given the corporate-wide switch to pre-paid meters. Is it intended to be a demand-driven process with customers needing to request a pre-paid meter, or does this account for only certain scenarios?
This was somewhat specific to this time period. At that time the demand for pre-paid meters outstripped the supply and did create an opportunity for corruption. We have noted this in the text.
MCC 98 Costs of outages: See comments on Sections 6.2.2 - 6.2.4 and Table 12 above, regarding the difficulty interpreting how total outage costs are calculated and the need to report costs as percentage of overall business costs. Also, would be important to distinguish and describe the incidence / prevalence of various costs among firms that rely on back-up generation vs. those that don't. Also, I've noted that the report compares the mean cost of idle workers for MD firms to the median cost of the same for 3-phase firms. Unclear why it would compare a mean to a median.
The mean/median issue has been corrected. Please see reponses above re table 12.
SOCIALIMPACT.COM 222
MCC 98 Regarding the delay among 80 percent of firms in providing goods and services due to power outages, the report suggests "this likely incurs a cost in terms of lost potential business." Wouldn't this be similar to (or captured by) the Lost revenue data?
Yes, edited text to tie these together more clearly above and repetition has been elimintated in the conclusion.
MCC 107 The report notes, "IDP investments are expected to be completed with the Compact in September 2018 and new solar IPPs are expected during that same year." Current expectations seem to be that IPPs would only reach financial close in 2018, though even here progress is slow. The construction and commissioning of new generation sites is likely on a longer timeline.
Text has been edited.

SOCIAL IMPACT, INC. 2300 CLARENDON BLVD. SUITE 1000
ARLINGTON, VA 22201