Malawi: MOBILIZING LONG-TERM FINANCE FOR …
164
Document of the World Bank 0 Report No: AUS0002033 . MALAWI: MOBILIZING LONG-TERM FINANCE FOR INFRASTRUCTURE FULL REPORT February 2021 FCI Public Disclosure Authorized Public Disclosure Authorized Public Disclosure Authorized Public Disclosure Authorized
Transcript of Malawi: MOBILIZING LONG-TERM FINANCE FOR …

Document of the World Bank
0
Report No: AUS0002033
.
MALAWI: MOBILIZING LONG-TERM FINANCE FOR
INFRASTRUCTURE FULL REPORT
February 2021
FCI
Pub
lic D
iscl
osur
e A
utho
rized
Pub
lic D
iscl
osur
e A
utho
rized
Pub
lic D
iscl
osur
e A
utho
rized
Pub
lic D
iscl
osur
e A
utho
rized

i
. © 2021 The World Bank 1818 H Street NW, Washington DC 20433 Telephone: 202-473-1000; Internet: www.worldbank.org Some rights reserved
This work is a product of the staff of The World Bank. The findings, interpretations, and conclusions expressed in this work do not necessarily reflect the views of the Executive Directors of The World Bank or the governments they represent. The World Bank does not guarantee the accuracy of the data included in this work. The boundaries, colors, denominations, and other information shown on any map in this work do not imply any judgment on the part of The World Bank concerning the legal status of any territory or the endorsement or acceptance of such boundaries. Rights and Permissions The material in this work is subject to copyright. Because The World Bank encourages dissemination of its knowledge, this work may be reproduced, in whole or in part, for noncommercial purposes as long as full attribution to this work is given. Attribution—Please cite the work as follows: “World Bank. 2021. Malawi: Mobilizing Long-Term Finance for Infrastructure. © World Bank.”
All queries on rights and licenses, including subsidiary rights, should be addressed to World Bank Publications, The World Bank Group, 1818 H Street NW, Washington, DC 20433, USA; fax: 202-522-2625; e-mail: [email protected].

MALAWI: MOBILIZING LONG-TERM FINANCE FOR INFRASTRUCTURE
Document of the World Bank
ii
Table of Contents Acknowledgments ...................................................................................................................................... viii
Executive Summary.......................................................................................................................................... 1
1 Background ............................................................................................................................................ 20
2 Infrastructure Investment Needs ......................................................................................................... 30
3 Why is Long-term Finance Not Flowing to Infrastructure Assets? ................................................. 39
4 Facilitating Access to Long-term Finance ....................................................................................... 84
References .................................................................................................................................................... 116
Annexes.......................................................................................................................................................... 123
Annex 1: Macroeconomic charts ................................................................................................................ 124
Annex 2: Financial sector charts .................................................................................................................. 133
Annex 3: PPP projects - Completed and pipeline ...................................................................................... 136
Annex 4: Key issues affecting the performance and borrowing capacity of SOEs ................................ 138
Annex 5: Potential impact of COVID-19 on the infrastructure sector/SOEs and the financial system .. 147
Annex 6: Doing Business reforms undertaken by Malawi (2008–19) ......................................................... 150

MALAWI: MOBILIZING LONG-TERM FINANCE FOR INFRASTRUCTURE
Document of the World Bank
iii
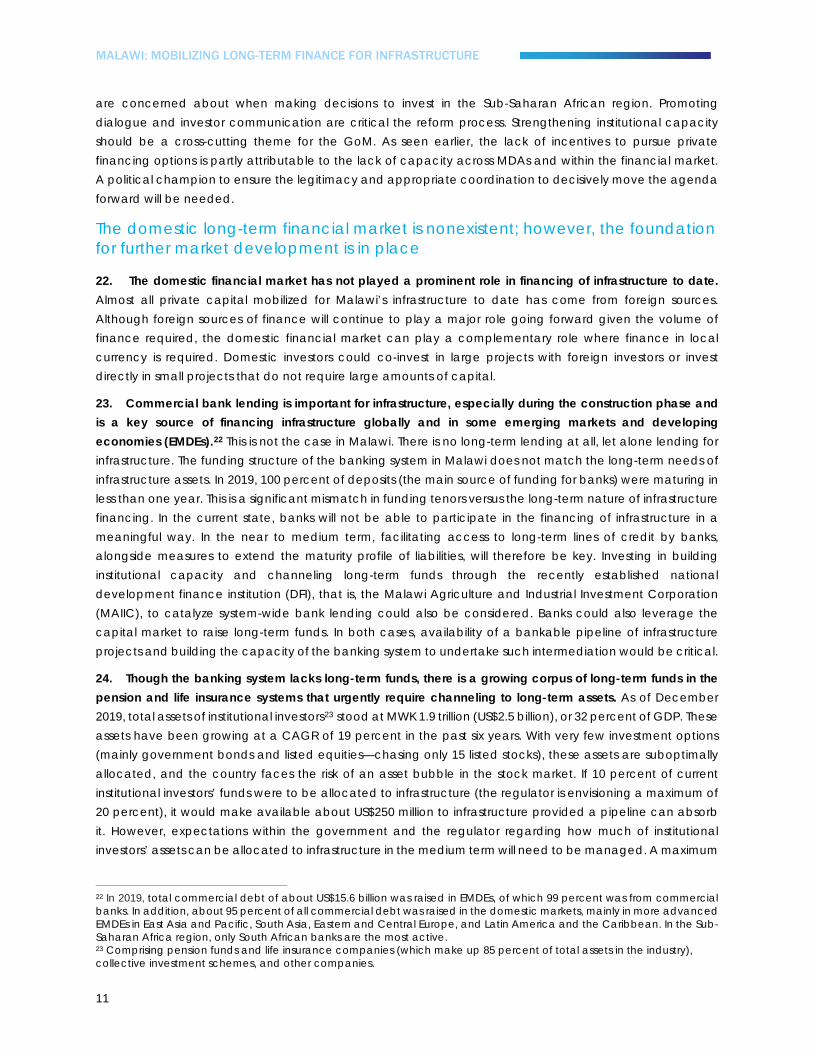
List of figures Figure 1: An ecosystem approach to mobilizing long-term finance for infrastructure ......................................... 5 Figure 2: A coordinated framework of incentives for improved performance of SOEs ....................................... 9 Figure 3: Public investment ....................................................................................................................................... 22 Figure 4: Public capital stock .................................................................................................................................... 22 Figure 5: Cross-border finance to developing countries, 2000–16 ........................................................................ 23 Figure 6: PPP Investment (1998–2017) ...................................................................................................................... 24 Figure 7: Real GDP growth has been volatile and very low in per capita terms ................................................ 26 Figure 8: Malawi’s real GDP per capita has fallen behind peers ......................................................................... 26 Figure 9: The kwacha has depreciated against the US dollar…........................................................................... 27 Figure 10: Food and non-food inflation have decelerated .................................................................................. 27 Figure 11: Interest rate developments ..................................................................................................................... 27 Figure 12: Total investment selected countries ....................................................................................................... 27 Figure 13: Malawi electricity generation installed capacity ................................................................................. 31 Figure 14: Annual power generation ....................................................................................................................... 31 Figure 15: The structure of the electricity sector in Malawi .................................................................................... 33 Figure 16: Number and growth of new customer connections ............................................................................ 34 Figure 17: Access to improved water ...................................................................................................................... 35 Figure 18: Government water, sanitation and hygiene (WASH) spending .......................................................... 36 Figure 19: Average WASH spending of Malawi versus regional peers ................................................................. 36 Figure 20: Projects with private participation in Sub-Saharan Africa ................................................................... 41 Figure 21: PPP Investments ........................................................................................................................................ 41 Figure 22: Approach to assessing SOEs’ market readiness .................................................................................... 48 Figure 23: Distance-to-market score for each SOE ................................................................................................ 49 Figure 24: Accumulated nonresident portfolio flows to emerging markets since the start of various crises .... 56 Figure 25: Commercial and development and export finance institutions (DEFIs)/public debt for projects with private participation.......................................................................................................................................... 58 Figure 26: Local and international commercial debt ............................................................................................ 58 Figure 27: Commercial banks’ sources of funds and deposits maturity structure ............................................... 59 Figure 28: Commercial banks' asset composition and loan maturity structure .................................................. 59 Figure 29: Banks' investments in government securities and loans (2015–19) ...................................................... 60 Figure 30: Composition of banks loans by sector ................................................................................................... 61 Figure 31: Growth of bank lending by sector.......................................................................................................... 61 Figure 32: Distribution of the value of MAIIC approved and pipeline projects by sector .................................. 62 Figure 33: Distribution of the value of MAIIC approved and pipeline by project phase ................................... 62 Figure 34: Horizon IRRs ............................................................................................................................................... 64 Figure 35: Preqin indexa ............................................................................................................................................. 64 Figure 36: Aggregate asset allocation of 7 key markets (1998–2018) .................................................................. 65

MALAWI: MOBILIZING LONG-TERM FINANCE FOR INFRASTRUCTURE
Document of the World Bank
iv
Figure 37: Investors in infrastructure by type, 2015 versus 2019 ............................................................................. 65 Figure 38: Current allocations to alternative assets by asset class: Australian superannuation schemes vs. Global Pension Funds (percentage of total assets) ............................................................................................... 66 Figure 39: Allocation of pension funds AUM ........................................................................................................... 71 Figure 40: Allocation of life insurance AUM ............................................................................................................. 71 Figure 41: Market cap of listed companies ............................................................................................................. 71 Figure 42: Stock market liquidity ............................................................................................................................... 71 Figure 43: Life insurers' solvency ratio - Whole company level .............................................................................. 74 Figure 44: Life insurers' solvency ratio - Life fund level ............................................................................................ 74 Figure 45: The yield curve has been extending ...................................................................................................... 75 Figure 46: Domestic debt has shifted toward longer-maturing instruments ........................................................ 75 Figure 47: Infrastructure projects’ default rates (1966–2016) ................................................................................. 79 Figure 48: Drivers to locate in or consider future investment in Sub-Saharan Africa .......................................... 80 Figure 49: Factors affecting the decision to invest overseas ................................................................................. 80 Figure 50: Evolution of Malawi’s Doing Business (DB) ranking ............................................................................... 80 Figure 51: Malawi’s DB 2019 index scores: 100 = Best performance ..................................................................... 81 Figure 52: Proposed framework for developing project pipeline (PIM-PPP integrated framework) ................. 86 Figure 53: World Bank for infrastructure finance in Kenya ..................................................................................... 90 Figure 54: Various stages of project development and potential sources of funds ........................................... 91 Figure 55: IBNET - Global experience on impact of internal reforms on cash positiona ..................................... 99 Figure 56: Illustrative annual savings based on various internal reforms ............................................................ 100 Figure 57: Access to long-term liquidity to create the mortgage market in Tanzania, facilitated by the World Bank .......................................................................................................................................................................... 106 Figure 58: Potential capital markets instruments .................................................................................................. 108 Figure 59: Public domestic debt shifting from RBM to commercial banks and non-bank sector ................... 127 Figure 60: Domestic debt has been increasing, while external debt has declined ......................................... 127 Figure 61: High primary deficits and interest rates remain key drivers of total public debt ............................. 128 Figure 62: Fiscal deficits regularly overshoot budget levels ................................................................................. 128 Figure 63: Food inflation pressures have started subsiding in 2020 ..................................................................... 128 Figure 64: Inflationary pressures picked up on the regional front ....................................................................... 128 Figure 65: US dollar/MWK official and forex bureau (FXB) rates and spreads through May 6, 2020 ............... 129 Figure 66: US dollar/MWK rate versus selected currencies, real effective exchange rate index, through April 30, 2020 ..................................................................................................................................................................... 129 Figure 67: Private sector credit growth remained strong through March .......................................................... 129 Figure 68: Financial soundness indicators were healthy at the onset of the crisis ............................................ 129 Figure 69: PPP investment in Malawi (1998–2017) ................................................................................................. 130 Figure 70: PPP investment in Mozambique (1998–2017) ...................................................................................... 130 Figure 71: PPP investment in Zambia (1998–2017) ................................................................................................ 130 Figure 72: PPP investment in Tanzania (1998–2017) .............................................................................................. 130

MALAWI: MOBILIZING LONG-TERM FINANCE FOR INFRASTRUCTURE
Document of the World Bank
v
Figure 73: PPP investment in Kenya (1998–2017) .................................................................................................. 130 Figure 74: PPP investment in Uganda (1998–2017) ............................................................................................... 130 Figure 75: PPP investment in Rwanda (1998–2017) ............................................................................................... 131 Figure 76: PPP investment in Ghana (1998–2017) ................................................................................................. 131 Figure 77: PPP investment in Côte d'Ivoire (1998–2017) ....................................................................................... 131 Figure 78: PPP investment in Senegal (1998–2017) ............................................................................................... 131 Figure 79: PPP investment in Myanmar (1998–2017) ............................................................................................. 131 Figure 80: PPP investment in Bangladesh (1998–2017) ......................................................................................... 131 Figure 81: PPP investment in Nepal (1998–2017) ................................................................................................... 132 Figure 82: Regulatory capital .................................................................................................................................. 133 Figure 83: Liquidity ratios ......................................................................................................................................... 133 Figure 84: Private sector credit growth .................................................................................................................. 133 Figure 85: Financial soundness indicators .............................................................................................................. 133 Figure 86: ESCOM - Differentiated tariffs across consumers/uses ....................................................................... 140
List of tables Table 1: The theory of change - Summary of key recommendations and expected results ............................ 16 Table 2: Recommendations implementation summary ........................................................................................ 17 Table 3: Base, low, and high electricity demand forecast .................................................................................... 31 Table 4: Base case generation and transmission cost: 2020–40 ........................................................................... 32 Table 5: Net present value (NPV) for generation expansion scenarios ............................................................... 32 Table 6: WASH sector investments requirements .................................................................................................... 37 Table 7: Investment commitments and no. of projects with private participation in IDA countries ................. 41 Table 8: Capital investment requirements of SOEs ................................................................................................. 48 Table 9: Market readiness scores and borrowing capacity .................................................................................. 49 Table 10: Comparison of select liquidity and asset efficiency indicators of SOEs (2018) ................................... 55 Table 11: The size of the financial sector in Malawi ................................................................................................ 57 Table 12: Capital raising plan of MAIIC ................................................................................................................... 62 Table 13: Pension assets of select African countries (2018) ................................................................................... 68 Table 14: Assets of select African pension funds (2019) ......................................................................................... 68 Table 15: Life insurance assets of select African countries (2019) ........................................................................ 68 Table 16: Assets of select African SWFs/SIFs ............................................................................................................ 68 Table 17: Investment returns of select African institutional investors .................................................................... 69 Table 18: Institutional investors' assets (2014–19) ..................................................................................................... 70 Table 19: Comparison of stock market returns across select African markets .................................................... 72 Table 20: Tax rates and tax administration indicators in Malawi .......................................................................... 83 Table 21: Sample of numeric debt control measures .......................................................................................... 102 Table 22: Selected macroeconomic indicators ................................................................................................... 124

MALAWI: MOBILIZING LONG-TERM FINANCE FOR INFRASTRUCTURE
Document of the World Bank
vi
Table 23: Fiscal accounts ........................................................................................................................................ 126 Table 24: Outstanding bonds on the MSE ............................................................................................................. 134 Table 25: Stock market size and liquidity ............................................................................................................... 135 Table 26: Summary of PPI in Malawi and peer countries ..................................................................................... 136 Table 27: PPPs completed in Malawi (2010–2019)a .............................................................................................. 136 Table 28: Summary of infrastructure PPP pipeline in Malawi ............................................................................... 137 Table 29: Summary of ESCOM's expenditure ........................................................................................................ 141 Table 30: The potential COVID-19 impact on infrastructure sector/SOEs and the financial system - Malawi context ...................................................................................................................................................................... 148
List of boxes Box 1: Potential macroeconomic impact of COVID-19 ........................................................................................ 29 Box 2: The financing structure of the Nacala Railway Corridor project ............................................................... 43 Box 3: An example of procurement risks: Procurement for the Lake Malawi-Salima project ........................... 46 Box 4: Issuance of bonds by RFA .............................................................................................................................. 47 Box 5: Kenya infrastructure finance and World Bank support ............................................................................... 89 Box 6: RFA: Composition and nomination of board members ............................................................................. 96 Box 7: Potential (indicative) criteria for issuing guarantees ................................................................................. 103 Box 8: Pension funds in Tanzania: Risks emanating from political exposure ...................................................... 107 Box 9: GuarantCo: Local currency bond guarantee in Kenya .......................................................................... 110 Box 10: An example of a market-led investment vehicle: Meridiam (Europe, North America, and Africa) .. 113 Box 11: An example of a public-private investment vehicle: PINAI ................................................................... 114

vii

MALAWI: MOBILIZING LONG-TERM FINANCE FOR INFRASTRUCTURE
viii
Acknowledgments This report was prepared by a multidisciplinary team of World Bank staff and consultants in collaboration with the Government of Malawi. The team was led by Neema Mwingu (Senior Financial Sector Specialist and Task Team Leader) and included Anuradha Ray (Senior Financial Sector Specialist), Joel Turkewitz (Lead Public Sector Specialist), Johan Kruger (Consultant), Haeyoung Lee (Private Sector Development Specialist), Dhruva Sahai (Senior Financial Specialist), Kagaba Paul Mukiibi (Energy Specialist), Patrick Hettinger (Senior Economist), Odete Duarte Muximpua (Water Supply and Sanitation Specialist), Josses Mugabi (Senior Water Supply and Sanitation Specialist), Yi Yan (Extended Consultant), Sebastian Phillip Sarmiento-Saher (Consultant), William Nyambo Mwanza (Consultant), Yalenga Loraine Nyirenda (Consultant), Tamara Mwafongo (Team Assistant), Miriam Kalembo (Team Assistant) and MaryIrene Singili (Team Assistant). The report was prepared under the overall guidance of Mara K. Warwick (Country Director for Tanzania, Malawi, Zambia, and Zimbabwe), Hugh Riddell (Country Manager, Malawi), Greg Toulmin (former Country Manager, Malawi), and Niraj Verma (Practice Manager, Finance, Competitiveness and Innovation).
Since the commencement of the assessment, the team received valuable input from the following individuals: Yutaka Yoshino (Program Leader); Prajakta Ajit Chitre (Senior Infrastructure Finance Specialist), Jeffrey John Delmon (Senior Infrastructure Finance Specialist), Helen Mary Martin (Senior Public-Private Partnerships Specialist), Jing Zhao (Senior Financial Sector Specialist), Jane Jamieson (Senior Infrastructure Finance Specialist), and Silvia Maria Tanga (Investment Officer, International Finance Corporation). The team is grateful to the peer reviewers for their valuable inputs and comments: Arnaud D. Dornel (Lead Financial Sector Specialist), Fiona Elizabeth Stewart (Lead Financial Sector Specialist), Lizmara Kirchner (Senior Water Supply and Sanitation Specialist), and Gael Raballand (Lead Public Sector Specialist).
Throughout the preparation of this report, the World Bank has received excellent support and cooperation from the Government of Malawi and the private sector. The team would like to thank the following individuals within the government for their willingness to share their insights, information, and support with the team throughout the process: Mr. Lloyd Muhara (former Chief Secretary to the Government, Office of the President and the Cabinet [OPC]); Mr. Stuart Ligomeka (former Comptroller of Statutory Corporations, OPC); Mr. Cliff Chiunda (Principal Secretary, Administration - OPC and former Secretary to the Treasury); Ms. Seodi White (Chief Director, Public Sector Reforms Management Unit - Ministry of Economic Planning and Development); Mr. Peter Simbani (Principal Secretary, Ministry of Industry and former Acting Chief Director of Economic Planning and Development, Ministry of Finance [MoF]), Mr. Twaib Ali (Acting Director of Debt and Aid Management, MoF), Ms. Betty Ngoma (former Acting Director of Debt and Aid Management, MoF), Mr. Ambrose Mzoma (former Director of Pensions and Financial Sector Policy, MoF), Mr. Hetherwick Njati (former Director of Public Enterprises Reform and Monitoring Unit, MoF),Martha Chizimba (Chief Economist, Public Enterprises Reform and Monitoring Unit, MoF); Mr. Patrick Matanda (Principal Secretary, Ministry of Energy) and his staff, including Mr. Hastings Chipongwe (Director of Policy and Planning); Mr. Gray Nyandule Phiri (former Principal Secretary, Ministry of Agriculture, Irrigation, and Water Development) and

MALAWI: MOBILIZING LONG-TERM FINANCE FOR INFRASTRUCTURE
ix
his staff, including Ms. Emma Mbalame (Director of Water Supply and Sanitation);Mr. Joseph Mwandidya (former Principal Secretary, Ministry of Lands, Housing and Urban Development) and his staff; Dr. Dalitso Kabambe (former Governor of the Reserve Bank of Malawi); Dr. Grant Kabango (Deputy Governor, Economics and Supervision); Ms. Chimwemwe Kachingwe (former Director, Bank Supervision), Mr. Chitani Chigumula (Director, Pensions & Insurance Supervision); Mr. Lanjes Sinoya (Director, Bank Supervision); Mr. Kisukyabo Simwaka (Director, Economic Policy Research); Mr. Rodrick Wiyo (former Director, Financial Markets); Mr. George Chioza (former Director, Financial Sector Regulation); Mr. John Kamanga (Chief Executive Officer [CEO] of the Malawi Stock Exchange); Mr. William Liabunya (CEO of the Electricity Generation Company) and his staff; Dr. Allexon Chiwaya (CEO of the Electricity Supply Corporation of Malawi) and his staff; Mr. Dan Chaweza (CEO of the Blantyre Water Board) and his staff; Mr. Stewart Malata (CEO of the Roads Fund Administration) and his staff; Engineer Emmanuel Matapa (CEO of the Roads Authority) and his staff, including Mr. Joel Longwe (Regional Manager, Central Regional Office) and Mr. Patrick Kamanga (Project Engineer); Mr. Alfonso Chikuni (former CEO of Lilongwe Water Board) and his staff; Mr. Elias Hausi (Director General of the Public Procurement and Disposal of Assets Authority) and his staff; Mr. Timothy Mponela (Assistant Auditor General of the National Audit Office) and his staff; Eng. Titus C. Mtegha (CEO of the Northern Regional Water Board); Mr. Joshua Nthakomwa (Director of Investment, Promotion and Facilitation, Malawi Investment and Trade Center); and the staff from the Malawi Housing Corporation, in particular, Mr. Jordan Chipatala (Director of Finance); Mr. Leslie Majawa (Chief Operations Officer); and Mr. Chancy Chaguluka (Business Research and Development Manager).
Finally, the team would like to thank the following stakeholders from the private sector and the development partners’ community, who provided inputs and advice during the assessment: Ms. Edith Jiya (CEO of Old Mutual Malawi), Mr. Mark Mikwamba (the Managing Director of Old Mutual Investment Group), Ms. Gillian Kachilaondo (CEO of Continental Asset Management), Mr. McFussy Kawawa (CEO of National Bank of Malawi), Mr. Jean Moukala (Acting CEO of the CDH Investment Bank), Mr. Kondwani Mlilima (Chief Risk Officer, Standard Bank), Mr. McLewen C. Sikwese (Head of Global Markets, Standard Bank), Mr. Daniel Dunga (Chief Investment Officer, NICO Asset Managers), Mr. Taz Chaponda (CEO of the Malawi Agriculture and Industrial Investment Corporation [MAIIC]), Ms. Fosters Sikwese (Enterprise Development Specialist, MAIIC), Mr. Armstrong Kamphoni (CEO of Cedar Capital), Mr. Davies B. Makasa (Principal Transport Engineer, African Development Bank); Jonathan Banda (Investment Officer, African Development Bank), Mr. Andrew Spahn (Deputy Director, Energy Office, Power Africa, United States Agency for International Development), and Mr. Thomas Haslett (Senior Energy Advisor, United States Agency for International Development).

MALAWI: MOBILIZING LONG-TERM FINANCE FOR INFRASTRUCTURE
x
Acronyms ABS Asset-backed Securities AfDB African Development Bank AIIM Africa Infrastructure Investment Managers ATI African Trade Insurance Agency ATS Automated Trading System AUM Assets under Management BOO Build, Operate, and Own BOT Build, Operate, and Transfer BWB Blantyre Water Board CAGR Compound Annual Growth Rate CAPEX Capital Expenditure CDS Central Depository System CEO Chief Executive Officer COVID-19 Coronavirus Disease 2019 CPI Consumer Price Index CSD Central Securities Depository DB Doing Business DBJ Development Bank of Jamaica DEFIs Development and Export Finance Institutions DFI Development Finance Institution DSC Department of Statutory Corporations DSCR Debt Service Coverage Ratio DWS Department of Water and Sanitation ECA Export Credit Agency EGENCO Energy Generation Company EIB European Investment Bank EMDEs Emerging Markets and Developing Economies EPC Engineering, Procurement, and Construction EPCF Engineering, Procurement, and Construction and Finance EPPF Eskom Pension & Provident Fund ESCOM Electricity Supply Corporation of Malawi FONSIS SA Senegal’s Fonds Stratégique d’Invéstissments Forex/FX Foreign Exchange FSAP Financial Sector Assessment Program FSDEA Fundo Soberano de Angola FXB Foreign Exchange Bureau GCR Global Credit Rating GDP Gross Domestic Product GEPF Government Employees Pension Fund GFC Global Financial Crisis GNI Gross National Income GoM Government of Malawi IBNET The International Benchmarking Network for Water and Sanitation Utilities

MALAWI: MOBILIZING LONG-TERM FINANCE FOR INFRASTRUCTURE
xi
ICT Information and Communication Technology IDA International Development Association IFC International Finance Corporation IFI International Finance Institution IFPPP Infrastructure Finance Public Private Partnership IMF International Monetary Fund IPP Independent Power Producer IRP Integrated Resource Plan IRR Internal Rate of Return JV Joint Venture KfW Kreditanstalt für Wiederaufbau LIC Low-income Country LMIC Lower-middle-income Country LOE Letter of Expectations LUANAR Lilongwe University of Agriculture and Natural Resources LWB Lilongwe Water Board MAIIC Malawi Agriculture and Industrial Investment Corporation MCC Millennium Challenge Corporation MDAs Ministries, Departments, and Agencies MERA Malawi Energy Regulatory Authority MHC Malawi Housing Corporation MIGA Multilateral Investment Guarantee Agency MIRA Macquarie Infrastructure and Real Assets MoF Ministry of Finance MoEPD Ministry of Economic Planning and Development MSE Malawi Stock Exchange MTN Medium-term Note MV Medium Voltage NISA Nigeria Sovereign Investment Authority NPL Nonperforming Loan NPV Net Present Value NRW Nonrevenue Water NRWB Northern Region Water Board NSO National Statistical Office NWSC National Water and Sewerage Corporation O&M Operation and Maintenance ODA Official Development Assistance OECD Organisation for Economic Co-operation and Development OPC Office of the President and the Cabinet OPEX Operational Expenditure OTC Over-the-counter PAT Profit after Tax PERMU Public Enterprises Reform and Monitoring Unit PFMA Public Finance Management Act PIM Public Investment Management

MALAWI: MOBILIZING LONG-TERM FINANCE FOR INFRASTRUCTURE
xii
PINAI Philippine Investment Alliance for Infrastructure PPA Power Purchase Agreement PPDA Public Procurement and Disposal of Assets Authority PPF Project Preparation Facility PPI Private Participation in Infrastructure PPP Public-Private Partnership PPPC PPP Commission PPPU PPP Unit PSIP Public Sector Investment Program RBM Reserve Bank of Malawi REIT Real Estate Investment Trust RFA Roads Fund Administration SADC Southern African Development Community SAPP Southern African Power Pool SB Single Buyer SDGs Sustainable Development Goals SIF Strategic Investment Fund SMEs Small and Medium Enterprises SOE State-owned Enterprise SPV Special-purpose Vehicle SWF Sovereign Wealth Fund TCX Currency Exchange Fund UNICEF United Nations Children’s Fund WASH Water, Sanitation, and Hygiene WSIP Water Sector Investment Plan y-o-y Year-on-year ZCPN Zero-coupon Promissory Note

1
Executive Summary

MALAWI: MOBILIZING LONG-TERM FINANCE FOR INFRASTRUCTURE
2
Overview
1. This study 1 explores how the Government of Malawi (GoM) can mobilize long-term finance for infrastructure. Infrastructure development involves large amounts of up-front capital expenditure (CAPEX), which poor governments like Malawi struggle to meet given the small tax base, limited room to raise taxes, and the declining official development assistance (ODA).2 In Malawi, this is evidenced by the low level of public investment (which averaged 4.18 percent of the gross domestic product [GDP] between 1998 and 2017). As a result, the public capital stock per capital (a proxy for infrastructure stock) grew at a compound annual growth rate (CAGR) of only 0.88 percent during the same period.3 The large infrastructure investment requirements (about 8 percent of GDP annually for the few sectors and state-owned enterprises [SOEs] covered in this report) compared to the past low level of public investments, and given the growing population which is putting pressure on service delivery, necessitate urgent actions by the GoM to rethink the current modality of financing infrastructure. This study provides a framework for maximizing the volume of investment and finance for infrastructure projects, including the public-private partnership (PPP) projects and those undertaken by SOEs,4 which are the main channel of delivering infrastructure in Malawi. The report recommends how to leverage the large corpus of market-based finance5 from the private sector, coupled with a careful prioritization of where public finance from the GoM and its development partners is essential.
2. Mobilizing finance, especially market-based finance, raises the question of how to fund (pay for) infrastructure, usually from two main sources, namely end-user charges/tariffs and tax revenues. The ability of Malawi to mobilize finance that can be repaid from tariffs will be limited by the high level of poverty, currently forcing the GoM to deal with tariff increases carefully.6 Experience from other countries shows that private investment and financing of infrastructure range from 0 to 1 percent of GDP, with a global average of about 0.5 percent. Data from the International Monetary Fund (IMF) show that, in the past two decades (1998–2017), investments in PPP projects globally averaged 0.51 percent of GDP.7 In addition, estimates by Thomson Reuters show that project finance loans totaled US$282.7 billion (0.33 percent of GDP), of which nearly half (48.7 percent) were loans to power projects.8 This estimate excludes financing through project bonds and equity financing.9 It should be noted that the ratio of investment and financing relative to GDP tends to be higher in low-income countries (LICs) and lower-middle-income countries (LMICs) than in
1 The study was carried out between February 2019 and June 2020. 2 According to the 2018 report of the Organization for Economic Co-operation and Development (OECD) on the Global Outlook for Financing for Sustainable Development, the growth of cross-border financing to poor countries from bilateral and multilateral development partners between 2000 and 2016 was lower than the growth of private capital flows, with a notable decline in multilateral flows post the global financial crisis (GFC). Bilateral and multilateral financing grew at a CAGR of 4 percent compared to 6 percent for private long-term debt/lending and 8 percent for portfolio investment (indirect investment into portfolios of assets such as stocks, bonds, real estate, and infrastructure, typically through investment funds). The CAGR of multilateral flows post the crisis (2009–16) was only 1 percent of GDP. 3 World Bank staff calculations based on IMF data. 4 There are four main channels of investing and financing infrastructure: (a) Direct procurement by the government through line ministries, departments, and agencies (MDAs) (this is out of the scope of this report); (b) Project finance/PPPs, which is financing of long-term infrastructure projects using a nonrecourse or limited-recourse structure. The debt and equity used to finance the project are paid back from the cash flow generated by the project without recourse to the project sponsor or the parent company; hence, lenders look at the debt servicing capacity of the project rather than that of the parent company. This is different from corporate (or balance sheet financing), where lenders provide finance to a company, which may be invested in specific projects, and have full recourse to total assets of the company in case of a default. (c) Private utilities (fully or partially privatized utilities) and/or concessions to a private sector company of state-owned assets. Currently, there are no private utilities in Malawi. (d) SOEs/state-owned utilities with varying degrees of commercialization. 5 Financing based on commercial terms provided by foreign and domestic commercial banks and capital markets investors. 6 End-user charges need to be affordable, otherwise consumers either cannot or will not pay. 7 Based on IMF Investment and Capital Stock Dataset, 2019. 8 https://practiceguides.chambers.com/practice-guides/project-finance-2019-second-edition. 9 In developing countries, equity financing accounts for 10–20 percent of project costs.

MALAWI: MOBILIZING LONG-TERM FINANCE FOR INFRASTRUCTURE
3
developed economies, since they need to invest more in infrastructure than rich countries The analysis based on IMF data shows an average ratio of 0.14 percent of GDP for high-income countries over the past two decades compared to 0.41 percent for LICs and 0.89 percent for LMICs.10 The ratio for Malawi is much lower than the average for LICs, that is, 0.07 percent of GDP in the two decades. Based on these trends, aiming for private investment and financing of about 0.5 percent of GDP annually could be a sustainable vision for Malawi.
3. Since the amount of private capital that can be mobilized relative to the size of the economy and the level of required investment would be small, public finance will remain the main source of financing infrastructure in Malawi in the foreseeable future. Malawi will need to mobilize a combination of three main types of long-term finance: (a) purely market-based sources of finance from foreign and domestic banks and capital market investors; (b) market-based and blended finance 11 from public financiers with commercial mandates such as the International Finance Corporation (IFC) and the Kreditanstalt für Wiederaufbau (KfW); and (c) public sources, that is, direct finance from tax revenues and concessional lending and grants from bilateral donors and multilateral lending institutions such as the World Bank (International Development Association [IDA]) and the African Development Bank (AfDB). These can be intermediated through the national budget or offered directly to projects or SOEs.
4. This report argues that the GoM should put in place measures to maximize market-based sources for projects and SOEs that are commercially viable or whose commercial viability12 could be enhanced and move from the current practice where almost all projects (whether commercially viable or not) are financed by public sources finance. A greater emphasis on additionality in the use of scarce public finance is recommended. Public finance could be best deployed to projects that cannot attract private capital (for example, social infrastructure projects) and those that require government contribution through PPP arrangements. Governments’ contribution in PPPs would vary depending on the commercial viability of the infrastructure sector or project, which is usually lower for power plants and potentially airports; higher for surface transport, water, and sanitation; and highest (almost 100 percent) for social infrastructure. For PPPs in which the majority or 100 percent of finance would come from the public, the motivation for engaging the private sector is not finance but to leverage private sector efficiency in project implementation. Public finance can also be best deployed to address market failures in the enabling environment, which will in turn improve the risk-return profile of projects and unlock the flow of market-based finance.
5. While affordability of fully commercial tariffs imposes limitations on mobilization of private capital, increased focus on infrastructure planning and implementation efficiency, both at the state and SOE level, can improve the fiscal space and borrowing capacity and thus increase the capacity to invest in additional infrastructure. Investment in infrastructure and related borrowing by the GoM or SOEs (including government guarantees to de-risk projects and SOEs), whether funded by tariffs or the state budget, contribute to further build-up of the national debt, which is already high (at 63 percent of GDP in 2019, which has increased from
10 The data include resource-based infrastructure projects which are funded through export/forex revenue of natural resources (for example, the Nacala Project in Mozambique and Malawi which is funded from coal export revenues). If only projects that are funded from domestic revenues (that is, user charges, government pay, or a combination of both) are considered, the ratio could be lower for some countries. 11 This is a package of finance that blends concessional finance from development partners and finance from commercial markets. This type of finance can be availed for projects with high potential impact but would not attract finance on purely commercial terms because the risks are considered too high and/or commercial returns are either unproven or not in line with the level of risk. 12 Commercial viability is achieved when project revenues from user charges exceed costs and yield sufficient returns to repay the cost of capital and when associated risks are considered reasonable by investors.

MALAWI: MOBILIZING LONG-TERM FINANCE FOR INFRASTRUCTURE
4
28 percent of GDP in 2007).13 Therefore, the GoM should always ensure the infrastructure investment program is affordable, both in terms of up-front investment capital and future resource requirements to maintain the already created infrastructure. The report presents recommendations on how this could be achieved by reforming the Public Investment Management (PIM) framework to help (a) reduce and preferably abandon spending on low-priority infrastructure; (b) encourage ministries, department, and agencies (MDAs) to leverage market-based finance for projects that can attract private capital; (c) enhance the efficiency of infrastructure procurement to ensure value for money; and (d) enhance the efficiency of infrastructure project implementation and monitoring, including leveraging private sector efficiency through PPPs. Improving the financial performance of SOEs through better governance and enhanced operational efficiency is also recommended. This will contribute to reduced government outlays in terms of (a) direct support to cover operational expenditure (OPEX), which should always be covered by commercial SOEs; (b) bailouts of poorly performing SOEs; and (c) payments related to defaults on government-guaranteed debt and improve borrowing capacity14 and ability to directly access market-based finance.
6. To manage the fiscal space and ensure the affordability of the infrastructure investment program, it is recommended that, during infrastructure planning, the GoM undertakes an up-front estimation of the potential fiscal impact of long-term deficits that may be created by infrastructure projects, whether projects are undertaken by SOEs or through PPPs and whether they are financed by the public or the private sector. This should include (a) in-depth economic and financial analyses of proposed projects and gauging of the level of outright and/or contingent government support that is needed to improve their commercial viability; (b) risk identification, quantification, and mitigation for PPP projects; and (c) continuous management/monitoring of outright and contingent liabilities and risks.
7. Catalyzing the long-term finance market for infrastructure and making well-thought-out choices in the use of public finance is more important now in light of the global coronavirus disease 2019 (COVID-19), as pressure on public resources increases to respond to the pandemic. As economic activities decline, financial inflows to both global and domestic financial institutions will decrease, money markets will become more volatile, and risk aversion will increase. Utilities that depend on end-user revenues are likely to experience decreased demand and increased levels of unpaid bills across commercial, industrial, and residential consumers, and as a result, suffer from liquidity strain and declining revenues (see Annex 5 for a detailed description of the COVID-19 impact). However, the crisis provides the opportunity for the GoM to “build-back-better” frameworks and systems that will improve the availability of long-term finance. The crisis can be leveraged to motivate and accelerate the needed reforms, which will help improve investors’ confidence and increase access to finance when markets return to normal. In addition, the crisis provides an even stronger case for building a more dynamic and resilient domestic long-term finance market. This will not only complement foreign capital flows but also act as a risk mitigant in future crises when projects struggle to attract finance from international investors due to increased risk aversion and capital flight to safety.
8. Mobilizing long-term finance is an agenda that will require a sustained engagement over a long period. Immediate actions by the GoM are needed, given the growing infrastructure gap and the negative impact
13 To enhance public debt transparency, the International Public Sector Accounting Standards Board and the IMF call for the consolidation of PPP debt, which is usually undertaken off the government balance sheet and government guarantees to attract private capital, which can carry hidden and sometimes higher costs than the traditional public financing, into the accounting of total public debt. This approach is currently taken by the IMF and the World Bank in debt sustainability assessments. 14 Borrowing capacity is determined by the ability of the company to generate discretionary/surplus cash flow, which is a function of revenue generation capacity, operational efficiency, efficient capital planning, and the cost of existing debt. Financiers may offer loans ranging from two to six times the level of earnings before interest, tax, depreciation and amortization (a company that exceeds these ratios is over-indebted) but would further subtract the cost of existing debt to determine the actual free cash flow and hence the capacity to absorb additional debt.

MALAWI: MOBILIZING LONG-TERM FINANCE FOR INFRASTRUCTURE
5
on economic growth and poverty. As this report indicates, the time is ripe to rebuild the relationship between finance and development in Malawi through a well-conceived program of activities that will help establish well-functioning financial/capital markets for long-term financing of public investments. Achieving this objective requires an array of well-coordinated activities relating to strengthening the PIM framework and institutions; ensuring macro-fiscal stability; enhancing bankability of infrastructure projects and SOEs; and deepening the financial/capital market through enabling regulations, testing new solutions, and building the capacity of the domestic financial market players (Figure 1).
9. More fundamentally, success will depend on the GoM establishing efficient mechanisms to coordinate and deliver a range of activities across government; making credible commitments to rule-based governance of SOEs; and providing policy and implementation consistency that is essential to get public officials and private investors to collaborate and adjust their behavior in accordance with laid-out rules and standards. Individual technical achievements in one or more of the identified areas are sustainable to the extent that they build upon each other to introduce rules, procedures, deals, and markets that generate benefits while preventing backsliding to older, familiar, but less efficient means of political and economic governance. In this manner, the technical work program proposed in this report aims to contribute to the larger effort to create a more efficient and transparent pathway for Malawi to mobilize infrastructure finance.
A large infrastructure gap with limited borrowing capacity necessitates reforms
10. The demand analysis in this report has been undertaken through the lenses of the energy and water sectors as illustrative sectors. In addition to being among the priority sectors of the GoM, the energy and (especially the urban) water supply sectors present relatively more immediate commercial opportunities for private investments. These sectors generate commercial revenues from users and have the potential to become self-sustaining. Borrowing capacity has been established for five SOEs in the two sectors: the Energy Generation Company (EGENCO), the Electricity Supply Corporation of Malawi (ESCOM), Lilongwe Water Board (LWB), the Northern Region Water Board (NRWB), and the Blantyre Water Board (BWB). To offer a critical mass for comparison, two more entities with end-user revenue generation capacity, that is, the Malawi Housing Corporation (MHC) and the Roads Fund Administration (RFA), have also been covered.
Figure 1: An ecosystem approach to mobilizing long-term finance for infrastructure
Source: World Bank staff.

MALAWI: MOBILIZING LONG-TERM FINANCE FOR INFRASTRUCTURE
6
11. The infrastructure investment needs in these sectors/SOEs are significant. In the energy and water supply and sanitation sectors alone, about US$7.6 billion would be needed over 15–20 years from 2020 or an annual investment of US$332 million (about 4 percent of 2019 GDP). The investment needs related to MHC and RFA amount to an additional annual requirement of US$326 million15 (a further 4 percent of 2019 GDP). The size of infrastructure investment needs, coupled with (a) decreasing fiscal space of the state, (b) limitations imposed by low affordability of commercial tariffs, (c) indifferent credit profiles of infrastructure SOEs, which limit their capacity to borrow, necessitate the prioritization of the infrastructure investment program and efficiency improvement. Of the seven SOEs covered in this report, only three have bankable demand/borrowing capacity, approximately US$35 million per year (or 0.44 percent of GDP).
12. The report recommends measures to revamp the framework for selecting, procuring, implementing, and monitoring public investment projects. Current practices in the identification, appraisal, and selection of public investment projects reflect the assumption that all projects will be financed by the government. Cost-benefit analysis of projects proposed by MDAs, including consideration of private sector financing as an option has not been undertaken. Reorienting the PIM framework and upgrading the institutional capacity to better plan and implement the public investment program should be the first critical step for the GoM to increase the fiscal space and maximize the volume of investment and finance into infrastructure. A new clear decision-making framework to prioritize private financing and conserve the scarce public resources is recommended in Section 4.1. Establishing a well-structured project preparation facility (PPF) is recommended to avail financial and technical resources for undertaking cost-benefit analysis, carrying out detailed feasibility studies, and supporting transaction structuring and monitoring during implementation, among others.
13. The GoM should also address the weak implementation of/noncompliance with procurement rules and the overall mismanagement of the project life cycle. Procurement of large and complex infrastructure projects is delicate and demanding and hence should follow structured and sequenced phases of the project life cycle within the limits of the existing legal and regulatory framework. Failure to do so (as evidenced in this report) will result in delays, cost overruns, frustrated expectations, and loss of credibility and trust. The report shows that procurement processes in Malawi are not always followed and only 25 percent of tenders go through an open and competitive process. The Public Procurement and Disposal of Assets Authority (PPDA) also reports that the overall compliance with the legal framework across entities has been varying and has fallen over time from 65 to 15 percent (IMF 2018). Addressing these issues will require a combination of (a) PPDA increasing efforts to enforce procurement rules and MDAs ensuring they undertake advance planning of procurement activities; (c) increasing transparency of the procurement process, including publishing information on procurement activities, publishing PPDA’s reports on MDAs’ compliance with procurement rules, ensuring the independence of procurement complaint reviews, and publishing their results; (d) training MDAs on procurement frameworks and regulations, including for the procurement of PPPs and independent power producers (IPPs); and (e) continuously monitoring project implementation and leveraging lessons to further improve procurement processes.
14. Operational improvements by SOEs and governance reforms by the GoM will be required to improve SOEs’ borrowing capacity. For example, the poor performance of ESCOM is a major impediment for the energy sector to attract private capital and is putting the sustainability of the sector at risk. As the transmission and distribution company, ESCOM is the only entity in the sector that generates revenues directly from
15 The detailed financial analysis of SOEs is based on audited financial statements of financial year 2017/18, which could be obtained for all SOEs to enable comparative analysis. However, new material developments observed in 2019 were included.

MALAWI: MOBILIZING LONG-TERM FINANCE FOR INFRASTRUCTURE
7
consumers, hence key to the funding of projects seeking private capital. However, it faces severe financial problems due to inefficiencies, low revenue generation capacity, and liquidity challenges. ESCOM’s financial performance had deteriorated to the extent that it had to request a bailout from the GoM in April 2018. This level of performance has affected (a) ESCOM’s ability to undertake regular operations and maintenance (O&M) and provide quality services and (b) customers’ willingness to pay for tariffs and the ability to raise tariffs, which in turn have limited ESCOM’s ability to borrow and invest, resulting in a vicious cycle of poor services and inability to increase tariffs. Given lessons from other countries such as South Africa,16 the GoM should pay attention to the sustainability of the electricity sector as a whole, starting with ESCOM as the offtaker.
15. Accessing private sector capital can bring with it a host of stringent but beneficial requirements, including much higher expectations of accuracy, timeliness, and transparency in financial operations, as well as proven technical/operational capacity of the SOEs. The right incentives (internal and external to SOEs) will need to be put in place to ensure that SOEs are motivated to make the desired changes. The study finds that, although cost-reflective tariffs17 and enabling environment reforms are important, SOEs can implement several internal reforms (within the control of their boards of directors and managements) to improve performance before resorting to external enabling environment/governance reforms. If SOEs can take actions such as increasing billing/collections (converting to prepaid meters) and thereby reducing outstanding receivables, reducing physical and commercial losses, reducing staff costs, and increasing last-mile connections, they could potentially save up to MWK 62 billion (~US$84 million) or 16 percent of total assets per year.18 EGENCO could save up to 8 percent of its total assets, while ESCOM, LWB, and BWB could save up to 4 percent each and NRWB up to 2 percent.
16. SOEs have limited independence and autonomy and hence are not insulated from political interference. This increases risks for potential lenders and potential liabilities to the GoM. These institutional approaches constrain Malawi’s development in three ways: (a) by imposing huge opportunity costs on the economy in terms of suboptimal and/or forgone infrastructure investments; (b) by precluding market discipline to enhance SOEs’ financial viability, governance, and accountability standards; and (c) by posing macro-fiscal risks and crowding out the fiscal space. As a result, they lack the capacity to engage the private sector.
17. Reforming the weak governance framework and organizational structures and arrangements that will guide the relationship between the GoM and SOEs is necessary. The current governance frameworks in Malawi do not enable SOEs to be efficient and accountable. There is no separation between the function of the state as the owner of SOEs and the responsibility of the board of directors as the highest decision-making bodies within SOEs. The state is involved in the day-to-day management of SOEs, and political interference in SOEs’ decision-making processes is a common practice, with most decisions that are supposed to be made by boards and managements subject to government approval. 19 This is partly
16 South Africa is currently experiencing its worst energy crisis, characterized by power cuts, which reached 6,000 MW in 2019 and with additional 2,000 MW announced in January 2020. This has been caused by years of mismanagement of Eskom (the state-owned utility that generates 95 percent of South Africa’s power), governance failure, escalating costs, and the accumulation of unmanageable debt. 17 One of the key recommendations is for the GoM to ensure that there are regular tariff adjustments, at least to match inflation. Lack of regularity or long delays in tariff increases can erode a utility’s financial health rapidly. However, tariff increases should be tied to clear performance improvement targets. 18 This analysis was only done for six out of seven SOEs, which have similar operating models: EGENCO, ESCOM, LWB, BWB, NRWB, and MHC. 19 The lack of independence, with boards and executive managements taking directions from the state on how to run their business, removes the incentive to improve performance, instead expecting bailouts. In discussions, it was revealed

MALAWI: MOBILIZING LONG-TERM FINANCE FOR INFRASTRUCTURE
8
because boards of directors and executive managements have underperformed in the past, in some cases leading to bailouts of SOEs. In addition, most boards are large and lack diversity of skills (especially private sector skills), with a composition that is excessively skewed toward public sector representation and includes farmers, village chiefs, and so on, lacking the necessary expertise to govern utilities.20 It is recommended that the GoM undertakes reforms to professionalize and empower the board of directors and ensure they are composed in a way that helps them exercise objective and independent judgment, hire qualified and commercial-minded managements, improve SOEs’ performance, and instill confidence in the market that SOEs could be credible borrowers.
18. It should be noted that these improvements alone will not be sufficient to enhance SOEs’ performance. Implementing a coordinated framework of incentives that integrates reform actions by the GoM and a policy direction that will allow market forces to incentivize reforms within SOEs will be imperative (Figure 2). For example, the GoM needs to enable SOEs to focus on their commercial mandates by committing not to interfere with the day-to-day management of SOEs’ operations and putting in place other arrangements that insulate SOEs from political interference. However, complementary actions to increasingly bring in private partners into the financing of SOEs, either in the form of debt or equity, can impose new and more stringent financial and operational discipline within SOEs and enable them to operate with a higher level of efficiency. Overall, utilities’ reform efforts should be closely coordinated with the trajectory of macro-fiscal adjustments and greater financial sector development.
that SOEs usually expect bailouts from the GoM when they fail to repay their debt, which also creates moral hazards on the part of the private sector. Expectations that SOEs will always be bailed out can encourage irresponsible/excessive lending practices. 20 When forming SOE boards, the current practice in Malawi is to have as wide a representation as possible as a way to ensure the interest of the general public is well represented, resulting in the current composition. While the spirit of this practice could be warranted, it does not have to be this way. The interests of the public can best be served by ensuring SOEs are efficient and financially sustainable, which at the basic level is a function of the quality of SOE boards and their executive managements and the quality of the governance framework that enables SOE boards to effectively perform their duties.

MALAWI: MOBILIZING LONG-TERM FINANCE FOR INFRASTRUCTURE
9
Figure 2: A coordinated framework of incentives for improved performance of SOEs
Source: World Bank staff.

MALAWI: MOBILIZING LONG-TERM FINANCE FOR INFRASTRUCTURE
10
PPPs in infrastructure are not new in Malawi but require acceleration, continued reforms, and a champion
19. Use of PPPs/project finance through special-purpose vehicles (SPVs) should be encouraged going forward given the limited borrowing capacity of SOEs. It is to be noted that Malawi has limited experience in PPPs since its infrastructure has largely been financed through public sources. In fact, until early 2019, none of the sectors reviewed in this report had received finance from commercial sources. However, PPPs are not completely new in Malawi. The country has successfully attracted approximately US$1.2 billion of investments through PPP arrangements in the past two decades, of which US$1.1 billion was invested in the railway subsector (that is, the Nacala Railway Corridor). Other sectors included information and communication technology (ICT), inland water transport, and tourism. It should be noted that this is a negligible amount relative to GDP. PPP investments in Malawi averaged 0.07 percent of GDP over a 20-year period (1998–2017) compared to 0.5 percent in Uganda, 0.82 percent in Mozambique, and 0.92 percent in Zambia.21 The PPP landscape in the energy sector is slowly changing, following a legal reform that opened up the generation market to the private sector. A new hydropower PPP project (US$600 million) is under development, and in 2019, a solar project by an IPP (US$67 million) reached financial close.
20. Despite commendable progress made in the past years, especially for a small and economically fragile country like Malawi, the private sector participation/PPP agenda lacks a champion in the government to advance it. In addition, the PPP program is not well integrated into the PIM process and appraisal of proposed investment projects to determine the potential for private sector financing is not a common practice. As highlighted earlier, the viability of projects for private sector financing is not considered or factored in the design/selection of the public investment program. This is partly attributable to the lack of financial and technical resources to undertake detailed appraisals (including the development of all technical studies), which disincentivize MDAs to consider PPPs. PPPs imply a more advanced and efficient form of procurement of infrastructure process and services, which requires specialized skills, causing MDAs to prefer more traditional procurement methods, including unsolicited proposals. The inability to adequately prepare projects puts MDAs at a disadvantage when negotiating with the private sector, elevating their mistrust of the private sector. Consequently, taking a more systematic approach toward developing bankable investment projects, including PPPs, will be crucial. The proposed PPF should provide financial and technical resources needed to move potential PPP projects to bankability, build capacity and understanding among implementing MDAs on the benefits of PPPs, and facilitate dialogue between investors/market participants (foreign and domestic) on one end and MDAs on the other.
21. Accelerating private investments and the PPP program in particular will also require the government’s commitment to continue business environment/cross-cutting and sectoral reforms. Like many African countries, to attract investments into public infrastructure, Malawi must overcome investors’ deep-rooted perception of high risks that the market is unable to mitigate. Even purely private infrastructure developers will face challenges given their exposure to government contracts. Malawi can shift the mindset of investors by undertaking reforms to demonstrate to both domestic and cross-border investors that Malawi as an asset class holds a promising future. The GoM should focus on addressing risks emanating from macroeconomic instability, lack of transparency and inefficiencies in procurement framework and practices, inefficiency in project implementation, and the overall business environment, which are among the top risks that investors
21 It should be noted that investments in Mozambique and Zambia also include large resource-based investments, which contribute to higher ratios than the average for LICs and LMICs respectively. These levels of investments are partly responsible for the high level of total public debt, which as of 2018 stood at 110 percent of GDP in Mozambique and 78 percent in Zambia.
MALAWI: MOBILIZING LONG-TERM FINANCE FOR INFRASTRUCTURE
11
are concerned about when making decisions to invest in the Sub-Saharan African region. Promoting dialogue and investor communication are critical the reform process. Strengthening institutional capacity should be a cross-cutting theme for the GoM. As seen earlier, the lack of incentives to pursue private financing options is partly attributable to the lack of capacity across MDAs and within the financial market. A political champion to ensure the legitimacy and appropriate coordination to decisively move the agenda forward will be needed.
The domestic long-term financial market is nonexistent; however, the foundation for further market development is in place
22. The domestic financial market has not played a prominent role in financing of infrastructure to date. Almost all private capital mobilized for Malawi’s infrastructure to date has come from foreign sources. Although foreign sources of finance will continue to play a major role going forward given the volume of finance required, the domestic financial market can play a complementary role where finance in local currency is required. Domestic investors could co-invest in large projects with foreign investors or invest directly in small projects that do not require large amounts of capital.
23. Commercial bank lending is important for infrastructure, especially during the construction phase and is a key source of financing infrastructure globally and in some emerging markets and developing economies (EMDEs).22 This is not the case in Malawi. There is no long-term lending at all, let alone lending for infrastructure. The funding structure of the banking system in Malawi does not match the long-term needs of infrastructure assets. In 2019, 100 percent of deposits (the main source of funding for banks) were maturing in less than one year. This is a significant mismatch in funding tenors versus the long-term nature of infrastructure financing. In the current state, banks will not be able to participate in the financing of infrastructure in a meaningful way. In the near to medium term, facilitating access to long-term lines of credit by banks, alongside measures to extend the maturity profile of liabilities, will therefore be key. Investing in building institutional capacity and channeling long-term funds through the recently established national development finance institution (DFI), that is, the Malawi Agriculture and Industrial Investment Corporation (MAIIC), to catalyze system-wide bank lending could also be considered. Banks could also leverage the capital market to raise long-term funds. In both cases, availability of a bankable pipeline of infrastructure projects and building the capacity of the banking system to undertake such intermediation would be critical.
24. Though the banking system lacks long-term funds, there is a growing corpus of long-term funds in the pension and life insurance systems that urgently require channeling to long-term assets. As of December 2019, total assets of institutional investors23 stood at MWK 1.9 trillion (US$2.5 billion), or 32 percent of GDP. These assets have been growing at a CAGR of 19 percent in the past six years. With very few investment options (mainly government bonds and listed equities—chasing only 15 listed stocks), these assets are suboptimally allocated, and the country faces the risk of an asset bubble in the stock market. If 10 percent of current institutional investors’ funds were to be allocated to infrastructure (the regulator is envisioning a maximum of 20 percent), it would make available about US$250 million to infrastructure provided a pipeline can absorb it. However, expectations within the government and the regulator regarding how much of institutional investors’ assets can be allocated to infrastructure in the medium term will need to be managed. A maximum
22 In 2019, total commercial debt of about US$15.6 billion was raised in EMDEs, of which 99 percent was from commercial banks. In addition, about 95 percent of all commercial debt was raised in the domestic markets, mainly in more advanced EMDEs in East Asia and Pacific, South Asia, Eastern and Central Europe, and Latin America and the Caribbean. In the Sub-Saharan Africa region, only South African banks are the most active. 23 Comprising pension funds and life insurance companies (which make up 85 percent of total assets in the industry), collective investment schemes, and other companies.

MALAWI: MOBILIZING LONG-TERM FINANCE FOR INFRASTRUCTURE
12
of 10 percent is what is being allocated by some of the pension funds in the most experienced economies in terms of infrastructure finance, such as Australia and Canada. Given the need to build capacity in Malawi, an allocation of 5 percent of institutional investors’ assets to infrastructure could be achieved in the medium to long term.
25. Encouraging prudent investing in infrastructure by pension funds is imperative and will require a robust regulatory framework. While the domestic pension funds have the potential to contribute to the country’s economic development through investments in infrastructure, their first responsibility is to protect their members’ assets and provide adequate retirement payment in the future. Therefore, they should not be coerced into investing in infrastructure projects that are not proven to be bankable; their investment decision must be made on a risk-return basis and be mindful of pensioners’ liquidity needs. The regulator should ensure a balance between encouraging pension funds to diversify their portfolio and contribute to infrastructure investments and ensuring they focus on their primary objective. As a matter of urgency, the draft regulation that has been prepared by the Reserve Bank of Malawi (RBM) to guide investments by pensions should be finalized soon.
26. Although Malawi is at a nascent stage of financial market development, several key foundational elements of a long-term finance market are in place. Progress toward developing capital market infrastructure 24 and the development of a yield curve (currently with bond durations of 10 years) are noteworthy features for Malawi’s long-term finance market development. Opportunities exist to build on the recent progress to nudge the market toward more long-term investments. Support for market creation can take several forms, including availing long-term liquidity in the banking system, increasing the supply of capital market debt issuances, developing enabling regulations, and building capacity of market participants. Given the limited capacity in the market currently, the government and the regulator should facilitate the expansion of the supply of traditional corporate/SOE bonds as a starting point/issuance of SOE bonds (at least two of the assessed SOEs have the capacity to access capital markets, and one of them has already privately placed two bonds with commercial banks). As the PPP program evolves over time and more bankable projects come onstream and become operational, opportunities for project bonds and for infrastructure SPVs to list their shares on the stock market will emerge. The study also proposes that in the medium term, the GoM should consider listing some of its shares in SOEs to mobilize long-term finance but more crucially to inject market discipline in SOEs through greater participation by institutional investors. The study recognizes the need for this to be done carefully considering the political economy in Malawi. This should be informed by adequate analysis, incorporated in an SOE ownership policy (which is recommended under this study) with clear sequenced milestones on how plans to divest shares in some SOEs will be implemented.
27. As a way to deepen the capital market in general, companies (as corporate bond issuers), including large corporations and commercial banks, could be encouraged to issue debt instruments. The current high ratio of loan concentration in the banking system is alarming and indicates the need for companies to move to the capital market, which should help further deepen the market. In December 2019, the largest single
24 In 2017, the Central Depository System (CDS), along with the Malawi National Switch and Automated Transfer System (which automated and simplified all settlement and clearing processes), were implemented. The CDS, which is the key element of the market infrastructure, facilitates trades on the treasury primary market and is capable of supporting registry, custody, settlement, and market data and information management in the primary and secondary markets for bonds and equities. The CDS is linked to the Automated Trading System of the Malawi Stock Exchange (MSE), which was launched in June 2018. All share certificates that were in physical form have been transformed into an electronic form to facilitate electronic transfers of shares. The trade settlement time has improved (less than three days).

MALAWI: MOBILIZING LONG-TERM FINANCE FOR INFRASTRUCTURE
13
borrower in the banking sector had an outstanding loan of 67 percent of core capital 25 of its lender (compared to the RBM’s limit of 25 percent26) and 21 percent of core capital of the entire system, which stood at MWK 215 billion (US$290 million). The largest outstanding loan of one of the smaller banks was 116 percent of core capital. It should be noted that banks are also exposed to the same borrowers. Large corporations also have direct loans from pension funds and life insurance companies, which has contributed to the growth of unlisted investments by institutional investors. Encouraging these corporations to either issue new bonds in the listed market or move their existing private debt with institutional investors to the listed market should be explored. This will benefit the market by (a) reducing concentration in the banking system and (b) increasing the supply of listed instruments (a more transparent market), which works well for institutional investors. In this regard, opportunities for demonstration transactions exist—through engagement with the regulator, investors, and potential issuers. The role of the MSE in promoting new listings and improving the listing regime will be critical.
28. Malawi would not be able to deepen the long-term finance market without testing newer vehicles/mechanisms/capital market instruments and launching learning pilots. The effort by Old Mutual to set up a pooled investment fund is a welcome step. Working with them and other domestic investors to facilitate a more broad-based and practical collaboration (involving the government, DFIs, and the private sector) that can help mobilize capital at scale is worth considering. Given the limitation on the infrastructure project pipeline and because developing a strong pipeline will take time, Malawi’s investors and the government will need to be opportunistic in the way they approach long-term investments. Financing solutions purely focused on traditional economic infrastructure (energy, water, transport, and so on) will not yield the desired outcome of deepening the market due to the lack of a pipeline in these sectors. In addition to the traditional economic infrastructure, investors could explore opportunities in nontraditional sectors (public and private), for example, agriculture-related (on-farm and off-farm) infrastructure (including irrigation infrastructure, cold-chain facilities, and warehousing facilities),27 real estate and housing (including student housing), manufacturing plant facilities (and warehousing), private education facilities (schools), and private hospitals. Malawian investors recognize this and have already started to tap into these opportunities (see Section 3).
Malawi should consider opportunities closer to home - in the African regional markets
29. Malawi can do this by (a) targeting regional investors (or international investors who are active in the Africa region); (b) bundling infrastructure with other countries, which can also increase Malawi’s integration to regional trade; and (c) continuing reforms in line with Southern African Development Community (SADC) capital markets integration program.
30. Given the perception of risk related to African infrastructure among international investors, targeting more African investors and international investors who are already active in Africa and have a better
25 Core (or Tier 1) capital is the core measure of a bank's financial strength from a regulator's point of view. It is composed primarily of common shares and retained profits but may also include non-redeemable non-cumulative preferred shares. 26 The RBM regulation provides for waivers of up to 12 months upon request from a bank. It also requires a bank to provide evidence that attempts to syndicate a loan with other banks failed. The regulation also exempts banks from seeking approval (and from syndicating) if the loan is related to export financing, it is secured by a government guarantee or a government paper, it is collateralized by cash, and it is of trade finance nature (including self-liquidating pre-export and export financing support by cash covered by letters of credit). A World Bank assessment shows that the RBM would need to increase oversight over these limits as banks are not motivated to syndicate with other banks. Ensuring syndication becomes a practice in the market would be critical for large infrastructure deals. 27 Agriculture is the mainstay of the Malawian economy.

MALAWI: MOBILIZING LONG-TERM FINANCE FOR INFRASTRUCTURE
14
understanding of the risk-return profile of African infrastructure would be the best place to start.28 Where opportunities exist, Malawi should consider bundling its infrastructure with other countries in the region—larger infrastructure deals can attract larger amounts of long-term finance, including from global investors. Malawi has already done this in the context of the Nacala Railway Corridor Project of Mozambique which attracted about US$2.7 billion of private investment for Mozambique and Malawi, of which US$1.1 billion was invested in Malawi (see Section 3). Bundling infrastructure may be difficult in the energy and water sector—transmission lines/interconnectors are not attractive investment opportunities for the private sector and water infrastructure is largely domestic. Nevertheless, it would be beneficial to explore regional opportunities in other sectors, especially in transport. It should be noted that these types of transactions are difficult to implement—they require navigating political economies of several countries, take long to structure, and require robust coordination. However, the benefits are substantial when they succeed. In this regard, a harmonized approach and strong collaboration with peer countries in the region will be needed.
31. Malawi should continue to engage on capital market integration efforts being undertaken at the SADC level. A more integrated capital market can contribute to increased liquidity of the domestic capital market. It is noteworthy that the SADC capital market integration program is far behind the one in East Africa. As guided by the Committee of SADC Stock Exchanges, MSE has already harmonized its listing requirements (up to 80 percent) with the ones on the Johannesburg Stock Exchange. While MSE has indicated that the requirements have been adjusted to the Malawi context, there are still concerns by market participants that some of the requirements are stringent and act as hurdles for local firms/institutions. Consequently, listing requirements should be further reviewed to ensure they are efficient/not prohibitive but are also consistent with the need to open up/integrate the Malawi capital market to the SADC regional capital market and align to best practices for regulation and market operations. Greater harmonization of requirements can reduce transaction cost and contribute to more listing, including cross-border listing (large conglomerates tend to be the large issuers pursuing cross-border listing) and attracting regional investment funds for infrastructure, small and medium enterprises (SMEs), and other asset classes.
Implementation of reforms and the need for a high-level commitment and leadership
32. Malawi has made notable progress in several aspects. Forces of change have continually built up over the last several years although the governance arrangements around SOEs have remained relatively constant. Important developments have laid the foundations for domestic capital market deepening, created organizational diversity in the energy market by allowing entry of the private sector, and increased familiarity and expertise in designing and implementing complex capital investment projects with private sector participation.
33. The report gives concrete suggestions on how to move reforms ahead. Recognizing that systemic reforms will take time, the report recommends short-term actions that can build a momentum for change over time. The report emphasizes the value of demonstrations and proposes ways to harness the evolving dynamics within the country, including some of the already implemented reforms in the domestic capital market combined with the ambition of potential first-mover SOEs (that is, SOEs that are ready to access market-based finance such as RFA and EGENCO). For example, RFA has already issued two bonds (MWK 10 billion or approximately US$13.7 million) in the private placement market,29 which was enabled by its strong
28 In addition to being costly and time-consuming, conducting due diligence on infrastructure requires specialist knowledge of the region. 29 This is the market for financial instruments (bonds or equity) which are not listed and traded on the stock exchange but are sold directly to a few selected investors.

MALAWI: MOBILIZING LONG-TERM FINANCE FOR INFRASTRUCTURE
15
revenue performance and a relatively stronger governance framework that minimizes political interference (clearly defined in the Roads Fund Administration Act). RFA plans to issue and list additional bonds of MWK 40–50 billion (approximately US$55–68 million) in the next five years. This experience is already generating interest and discussions among other SOEs and provides some lessons on how to approach the commercial market for finance.
34. The study acknowledges that implementing the recommended actions will be a political process as much as a technical one. The steps identified require changes that are likely to be opposed from many sides. Although they come with high public costs, existing practices and market failures in the financing of capital investments and in the operation of SOEs may provide extensive benefits for certain groups and/or individuals. Experience in Malawi and in other countries demonstrates these benefits will be strongly defended and efforts to modify rules and practices are likely to meet continuous and well-organized resistance. These political challenges will require political solutions. Consequently, the participation and the leadership of high-level government and alignment of actions with the priorities of the government to generate buy-in of the reform agenda should take priority. It is recommended that a ‘champion institution or unit’, preferably within the Office of the President and the Cabinet (OPC), be appointed to ensure legitimacy and coordination to decisively move the reform agenda forward.
35. Table 1 and the following sections describe key recommendations under three main pillars: Pillar 1: Shift policy, the mindset, and government capacity to foster private sector financing of infrastructure; Pillar 2: Enhance the performance of SOEs; and Pillar 3: Deepen the to the long-term finance market. Table 2 presents the proposed implementation timelines for the key recommendations.

16
Table 1: The theory of change - Summary of key recommendations and expected results
PILLAR 1: Shift policy, the mindset, and government capacity to foster private sector financing of infrastructure
PILLAR 2: Enhance the performance of SOEs
PILLAR 3: Deepen the long-term finance market
Target: Key Actions Enablers: Key Actions Enablers: Key Actions
Policy makers Infrastructure operators/SOEs Investors
1. Identify a champion for enhancing private sector participation in infrastructure.
2. Upgrade the PIM architecture, integrate
with the PPP framework, and strengthen MDAs’ capacity.
3. Establish a project preparation facility
(PPF) to support project development—from concept stage to implementation and monitoring.
Reforms Resources Capacity
5. Exercise oversight of SOEs
without interfering and incentivize them to increase operational efficiency.
6. Clearly define and compensate SOEs for noncommercial mandates they perform.
Market regulation Issuer base Markets intermediaries Capacity
7. Facilitate access to long-term liquidity to catalyze commercial bank lending to infrastructure.
8. Issue regulations to
expand the range of long-term finance instruments and vehicles and broaden the investor base.
Enablers: 4. Sustain macroeconomic stability and
advance on business environment reforms.
9. Introduce a program of transaction testing, pilots, and market sounding to systematically link supply and demand sides of the market.
10. Enhance competition/supply of services
and build capacity of market intermediaries.
Capacity
Reforms Dialogue
OUTPUTS
1. Enhanced pipeline of bankable projects and government capacity to procure and manage
PPPs in infrastructure
2. Enhanced creditworthiness of SOEs
3. Greater adoption of long-term finance market instruments and
vehicles
OUTCOME
Enhanced access to long-term finance for infrastructure

MALAWI: MOBILIZING LONG-TERM FINANCE FOR INFRASTRUCTURE
17
Table 2: Recommendations implementation summary
Pillar/recommendation Priority Timeline30 Proposed responsible institution
Pillar 1: Shift policy, the mindset, and government capacity to foster private sector financing of infrastructure 1. Identify a champion for enhancing
private sector participation in infrastructure.
High Short term OPC
2. Upgrade the PIM architecture, integrate with the PPP framework, and strengthen MDAs’ capacity.
High Medium term
MoF, MoEPD
3. Establish a PPF to provide financial and technical resources for project development—from concept stage to implementation and monitoring.
High Short to medium term
MoF, MoEPD
4. Sustain macroeconomic stability and advance on business environment reforms.
Long term (continue)
(a) Continue fiscal consolidation, including prioritization and enhanced efficiency of capital project implementation.
High Long term (continue)
MoF
(b) Develop the government bond market strategy (to support the capital market development) that is consistent with the national debt management strategy.
Medium Medium term (continue)
MoF/RBM
Pillar 2: Enhance the performance of SOEs
5. Exercise oversight of SOEs without interfering and incentivize them to increase operational efficiency.
(a) Rationalize the state ownership in SOEs and create more room for private investors.
Medium Medium term
MoF/Government
(b) Enhance board independence, professionalism, and accountability.
High Short to medium term (start now)
OPC, Office of the Vice President/MoEPD, MoF
(c) SOEs should increase focus on operational improvements.
High Continuous (start now)
SOEs
(d) Ensure regular tariffs adjustment, linked to performance
High Continuous (start now)
GoM/regulators
30 Short term means 1–2 years, medium term is 2–5 years, and long term is over 5 years.

MALAWI: MOBILIZING LONG-TERM FINANCE FOR INFRASTRUCTURE
18
Pillar/recommendation Priority Timeline30 Proposed responsible institution
improvements and matching Inflation.
(e) Encourage responsible borrowing by SOEs.
High Long term (start now)
MoF
(f) Allow competition in the liberalized energy market.
Medium Long term Government
(g) Promote the role of citizen engagement to incentivize accountability and improved service delivery by SOEs.
Medium Continuous (start now)
Government/line ministries/SOEs
6. Clearly define and compensate SOEs for noncommercial mandates they perform.
High Short to medium term
MoF, Office of the Vice President/MoEPD, OPC, line ministries
Pillar 3: Deepen the long-term finance market
7. Facilitate access to long-term liquidity to catalyze commercial bank lending to infrastructure.
(a) Provide lines of credit to MAIIC either to refinance banks’ portfolios or to co-invest with banks.
High Medium term
MoF/RBM
(b) Mandate diversification of banks’ funding profile through long-term bond issuance.
Medium Short to medium term
RBM
8. Issue regulations to expand the range of long-term finance instruments and vehicles and broaden the investor base.
RBM/MoF
(a) Finalize the existing draft of pensions investment directive.
High Short term MoF/RBM
(b) Develop a regulatory framework for the public bond market, accounting for the differences and needs of the corporate bonds compared to project bonds.
High Short term RBM
9. Introduce a program of transaction testing, pilots, and market sounding to systematically link supply and demand sides of the market.
Medium Medium to long term (start now)
RBM/MSE/market participants
(a) Expand the issuer base and pilot capital market instruments.
Medium Long term (start now)
MSE/RBM/SOEs/market participants

MALAWI: MOBILIZING LONG-TERM FINANCE FOR INFRASTRUCTURE
19
Pillar/recommendation Priority Timeline30 Proposed responsible institution
(b) Facilitate creation of nontraditional structures for channeling long-term funds from domestic institutional investors.
Medium Medium term (start now)
Market participants/RBM/Government
10. Enhance competition/supply of services and build capacity of market intermediaries.
High Short to medium term
RBM
Note: MoF = Ministry of Finance. MoEPD = Ministry of Economic Planning and Development.31
31 Until June 2020, Economic Planning and Development was a department of the Ministry of Finance, Economic Planning and Development. In July 2020, the new government restructured this ministry, which resulted in two separate ministries: the MoF and the MoEPD, with the Vice President as the responsible minister. Going forward, strong coordination of activities between the two ministries will be critical.

20
1 Background

MALAWI: MOBILIZING LONG-TERM FINANCE FOR INFRASTRUCTURE
21
1.1. Why this study? 1. Malawi is a small landlocked country in the Southern Africa region32 and among the poorest in the world, with a gross national income (GNI) per capita of US$360 in 2018.33 The economy of the country depends mainly on rain-fed agriculture, which contributes to only one-third of the gross domestic product (GDP), although it drives livelihoods for two-thirds of the population. Malawi is vulnerable to climate change with limited resilience; it ranks ninth on the list of the most climate vulnerable countries. 34 Poverty and inequality remain stubbornly high, at 51.5 percent (2017). Poverty levels in rural areas are higher than in urban
areas—93 percent of the poor live in rural areas compared to 7 percent in urban areas. A key obstacle to
reducing poverty is low agricultural productivity as most of the poor remain locked in low-productivity
subsistence farming.35
2. Insufficient infrastructure constrains Malawi’s economic growth prospects and competitiveness. Poor access to reliable services, especially energy and water supply, aggravates poverty levels and has a negative impact on the health of Malawians. A dense population of about 18 million as of 2018, and expected to double by 2038, is putting pressure on service delivery and environmental sustainability. Access to reliable energy is currently the most pressing infrastructure need. Malawi has one of the lowest electricity access rates at 11 percent of population36 compared to 42 percent in low-income countries (LICs) and 48 percent in Sub-Saharan Africa (excluding high-income countries). Consequently, addressing energy access challenges is among the top five priorities of the Government of Malawi (GoM) as laid out in the third Malawi Growth and Development Strategy (2017–2022), alongside improving agricultural productivity, water development, and climate change management.
3. The Africa Pulse report (2017)37 shows a positive relationship between expanding access to and the quality of infrastructure services and improvements in productivity of economic sectors and people’s quality of life. It is estimated that, closing the infrastructure gap with the median performer of the world (excluding Sub-Saharan Africa) would lead to growth of GDP per capita by 1.7 percent in the Sub-Saharan Africa region. In low-income Sub-Saharan Africa countries like Malawi, growth benefits could improve by narrowing the gap in electricity generation capacity, given the low electricity access rates.
4. Public investment in infrastructure in Malawi has been negligible in the past two decades. Public capital stock per capital (a proxy for infrastructure stock) grew at a compound annual growth rate (CAGR) of 0.88 percent between 1998 and 2017. Sluggish economic growth over the past decade put constraints on the government budget and led to underinvestment. The total public investment averaged about 4.18 percent over a 20-year period (1998–2017). This is lower than in Mozambique (10.7 percent) but similar to Zambia (4.82 percent) and Tanzania (4.21 percent). During the same period, the public capital stock declined at a compound rate of 3 percent.
32 The country is poorly integrated into the Eastern and Southern Africa region, both in physical infrastructure and trade. 33 World Development Indicators. GNI per capita, Atlas method (current US$). 34 https://maplecroft.com/about/news/ccvi.html. 35 World Bank Systematic Country Diagnostic 2018. 36 There are severe disparities between urban (38 percent) and rural areas (4 percent). The inequity among the rich and poor is stark—the poorest 20 percent reports 1 percent electrification rate and the richest 20 percent reports 31 percent. Households consume 84 percent of total primary energy with a staggering 99 percent of household energy supplied by biomass. The environmental impact of increased population growth is exerting significant pressure on Malawi’s forest resources, leading to forest degradation and deforestation at a rate of 2.6 percent per year. 37 https://openknowledge.worldbank.org/handle/10986/26485.

MALAWI: MOBILIZING LONG-TERM FINANCE FOR INFRASTRUCTURE
22
Figure 3: Public investment
Percent of GDP
Figure 4: Public capital stock
Percent of GDP
Source: World Bank staff calculation based on International Monetary Fund (IMF) Investment and Capital Stock Dataset, 2019.
5. With high population growth and the need to boost economic growth, infrastructure investment needs are increasing. For a low-income country with Malawi’s characteristics, infrastructure investment needs are broadly in three categories: (a) new infrastructure to augment productive capacity (which forms the majority of infrastructure investments needs given the existing gap); (b) maintenance infrastructure to ensure continuing economic life of existing infrastructure; and (c) additional infrastructure needs for climate resilience (reconstruction, retrofitting, and so on). The third category is a nontrivial one for Malawi. In the energy and water and sanitation sectors alone, US$7.6 billion will be required over a period of 15–20 years from 2020, or an annual investment of US$332 million (about 4 percent of 2019 GDP) compared to total annual public investment of 4.18 percent of GDP in the past two decades. The two state-owned enterprises (SOEs) in the transport and the housing sectors covered under this study (that is, Roads Fund Administration [RFA] and Malawi Housing Corporation [MHC]) are facing an annual investment gap of US$326 million (a further 4 percent of 2019 GDP).
6. While infrastructure investment needs are growing, the fiscal space has been declining, driven by low revenue mobilization and increased borrowing. From 2007 to 2019, the stock of public debt increased from 28 percent to 63 percent of GDP. The most recent Debt Sustainability Analysis for Malawi shows that the country is at moderate risk of external debt distress but overall high risk of debt distress. Donor financing is also limited. As Figure 5 shows, the growth of cross-border financing to poor countries from bilateral and multilateral development partners between 2000 and 2016 was lower than the growth of private capital flows, with a notable decline in multilateral flows post the global financial crisis (GFC). Bilateral and multilateral flows grew at a CAGR of 4 percent compared to 6 percent for private long-term debt/lending and 8 percent for portfolio investment (that is, indirect investment into portfolios of assets, which may include stocks, bonds, real estate, and infrastructure, typically through investment funds). Post-GFC (2009–2016) CAGR of multilateral flows was only 1 percent.
7. In light of the above, the purpose of this study is to demonstrate how Malawi could mobilize long-term finance for infrastructure by providing a framework for maximizing the volume of investment into and financing of infrastructure projects and SOEs, which are the main channel of delivering infrastructure in Malawi. The report recommends how to leverage the large corpus of market-based finance from the private sector, coupled with a careful prioritization of where public finance from the GoM and its development
0%
5%
10%
15%
20%
25%19
98
2000
2002
2004
2006
2008
2010
2012
2014
2016
Malawi Mozambique
Zambia Tanzania
0%
20%
40%
60%
80%
100%
120%
140%
1998
2000
2002
2004
2006
2008
2010
2012
2014
2016
Malawi Mozambique
Zambia Tanzania

MALAWI: MOBILIZING LONG-TERM FINANCE FOR INFRASTRUCTURE
23
partners is essential. This will require creating conditions and rethinking current modalities/institutional approaches to crowding-in alternative financing, which could take a variety of forms, including better monetization of assets (for example, in the housing sector).38
Figure 5: Cross-border finance to developing countries, 2000–16
CAGR
Source: Organisation for Economic Co-operation and Development (OECD), Global Outlook on Financing for Sustainable Development (2018).
8. Mobilizing finance, especially market-based finance, raises the question of how to fund (pay for) infrastructure, usually from two main sources: end-user charges/tariffs and tax revenues. Malawi’s ability to mobilize finance that can be repaid from tariffs will be limited by the high level of poverty, which currently forces the GoM to deal with tariff increases carefully. Experience from other countries shows that private investment and financing of infrastructure range from 0 to 1 percent of GDP, with a global average of about 0.5 percent. Data from the IMF show that, in the past two decades (1998–2017), investments in public-private partnership (PPP) projects globally averaged 0.51 percent of GDP.
9. In addition, estimates by Thomson Reuters show that project finance loans totaled US$282.7 billion (0.33 percent of GDP), of which nearly half (48.7 percent) were loans to power projects. This estimate excludes financing through project bonds and equity financing. In developing countries, equity financing usually accounts for 10–20 percent of project costs. It should be noted that the ratio of investment and financing relative to GDP tend to be higher in LICs and lower-middle-income countries (LMICs) than in developed economies, since they need to invest more in infrastructure than rich countries. The analysis based on the IMF data shows an average ratio of 0.14 percent of GDP for high-income countries over the past two decades compared to 0.41 percent for LICs and 0.89 percent for LMICs. Malawi has one of the lowest ratios among the LICs, which averaged 0.07 percent of GDP in the two decades. Based on the trends in other countries, aiming for private investment and financing of infrastructure of about 0.5 percent of GDP could be a sustainable vision for Malawi.
38 MHC has a large land portfolio that is not being effectively utilized. This can be used in several ways, for example, by developing new properties for sale, as collateral to acquire debt and as equity contribution in joint ventures (JVs) with the private sector.
4% 3%9%
4% 6% 8%6% 8%12% 9%
24%18%
3%10%
5%0%
58%
-13%
3% 1%5% 3% 7% 7%
Bilateral Multilateral Rimittances FDI PortfolioInvestment
Long-term Debt
2000-16 Pre-GFC (2000-06) During GFC (2007-08) Post GFC (2009-16)

MALAWI: MOBILIZING LONG-TERM FINANCE FOR INFRASTRUCTURE
24
Figure 6: PPP Investment (1998–2017)39
Percent of GDP
Source: World Bank staff calculation based on IMF Investment and Capital Stock Dataset, 2019.
10. Since the amount of private capital that can be mobilized relative to the size of the economy and the level of required investment would be small, public finance will remain the main source of financing infrastructure in Malawi in the foreseeable future. Infrastructure finance will have to come from a combination of three main sources: (a) purely market-based sources of finance from foreign and domestic banks and capital market investors; (b) market-based and blended finance from public financiers with commercial mandates such as the International Finance Corporation (IFC) and Kreditanstalt für Wiederaufbau (KfW); and (c) public sources, that is, direct finance from tax revenues and concessional lending and grants from bilateral donor and multilateral lending institutions such as the World Bank (IDA) and the African Development Bank (AfDB), intermediated through the national budget or provided directly to projects or SOEs. Nevertheless, the report argues that the GoM should put in place measures to maximize market-based sources for projects and SOEs that are commercially viable, or whose commercial viability could be enhanced, and move from the current practice where almost all projects (whether commercially viable or not) are financed by public sources. A greater emphasis on additionality in the use of the scarce public finance is recommended, which should be deployed to projects that cannot attract private capital (for example, social infrastructure projects) and projects that would require government contribution through PPP arrangements. Governments’ contribution in PPPs usually varies depending on (the commercial viability of) the infrastructure sector or project, which is typically lower for power plants and potentially airports, higher for surface transport, water and sanitation, and highest (almost 100 percent) for social infrastructure. For PPPs in which the majority or 100 percent of finance comes from the public, the motivation for engaging the private sector is not finance but to leverage private sector efficiency in project implementation. Public finance can also be best deployed to address market failures in the enabling environment, which will in turn improve the risk-return profile of projects and unlock the flow of market-based finance.
11. Ensuring the efficiency of the Public Investment Management (PIM) framework and SOEs’ operations is recommended as a way to improve the overall capacity of the GoM and SOEs to invest in additional
39 Malawi, Mozambique, Rwanda, Tanzania, and Uganda are LICs while the rest are LMICs.
0.07%0.14% 0.16%0.23%
0.29% 0.30% 0.31%
0.44% 0.45% 0.46% 0.47%0.51%
0.66%0.70%
0.78%0.82% 0.86%
0.92%
Mal
awi
High
Inco
me
Bang
lade
sh
Tanz
ania
Keny
a
Rwan
da
Mya
nma
r
UMIC
s
Nep
al
Ugan
da LIC
s
Wor
ld
Cot
e d'
Ivoi
re
Gha
na
Sene
gal
Moz
ambi
que
LMIC
s
Zam
bia

MALAWI: MOBILIZING LONG-TERM FINANCE FOR INFRASTRUCTURE
25
infrastructure, whether financed by public or private sources or funded from tariffs or government revenue. This can be achieved through enhanced efficiency in project selection (selecting critical and affordable projects), better structuring of PPP projects (including proper allocation of risks), and increased efficiency in project procurement, implementation, and monitoring. By increasing the role of the private sector in infrastructure finance, Malawi can also benefit from new and better technical skills and efficiencies in the design, procurement, construction, and operation of infrastructure assets—both at the project and SOE level.
12. The demand analysis in this report has been undertaken mainly through the lenses of the energy and water sectors as illustrative sectors. In addition to being among the priority sectors of the GoM, the energy and (especially the urban) water supply sectors present relatively more immediate commercial opportunities for private investments. These sectors generate commercial revenues from users and have the potential to become self-sustaining. SOEs’ borrowing capacity has been established for five SOEs in the two sectors: the Energy Generation Company (EGENCO), the Electricity Supply Corporation of Malawi (ESCOM), Lilongwe Water Board (LWB), the Northern Region Water Board (NRWB), and the Blantyre Water Board (BWB). To offer a critical mass for comparison, two more entities with end-user revenue generation capacity, that is, MHC and RFA, have also been covered.
13. The rest of the report is structured as follows:
• Section 1.2 provides the macroeconomic context.
• Chapter 2 includes the assessment of investment needs in the illustrative sectors.
• Chapter 3 describes constraints limiting the flow of long-term finance to infrastructure, highlighting weak institutional frameworks and limited incentives, limited borrowing capacity of infrastructure SOEs, and underdeveloped domestic financial markets as the key constraints.
• Chapter 4 concludes and provides recommendations on how to catalyze infrastructure finance and deepen the domestic long-term finance market.

MALAWI: MOBILIZING LONG-TERM FINANCE FOR INFRASTRUCTURE
26
1.2. Macroeconomic developments 14. Malawi’s economic growth has historically been undermined by exogenous, climate-induced shocks, as well as economic policies and management that have often exacerbated the impact of shocks. Depreciation of the exchange rate, high inflation rates, and persistently high fiscal deficits contributed to macro-instability between 2011 and 2017. This instability contributed to Malawi having one of the lowest investment rates in Sub-Saharan Africa and limited structural transformation. These factors have, in turn, constrained poverty reduction, with a quarter of Malawi’s population living in extreme poverty and about 51.5 percent in ‘moderate poverty’40 in 2017, only marginally lower than 52.4 percent in 2004/5.
15. Growth has generally been low and volatile, with only two periods of high and relatively stable growth, from 1964 to 1979 and, more recently, from 2003 to 2010 (Figure 7). Over the past two decades, Malawi’s real GDP per capita growth rate averaged 1.5 percent, significantly below the average of 3.1 percent for non-resource-rich Sub-Saharan Africa economies. Malawi remains an outlier compared to its peers that are geographically and demographically similar and that were at a similar stage of development in the mid-1990s (Figure 8).
Figure 7: Real GDP growth has been volatile and very low in per capita terms
Real GDP growth and real GDP per capita, percent
Figure 8: Malawi’s real GDP per capita has fallen behind peers
GDP per capita, real US dollar 2010 terms
Source: World Bank Global Economic Prospects data. Source: World Bank World Development Indicators.
16. Inflation in Malawi has been significantly higher than the regional average. High budget deficits with recourse to central bank financing, as well as a volatile exchange rate, exacerbated inflationary pressure. Weak harvests (due to frequent weather shocks) have been a key driver of headline inflation; food inflation constitutes about half of the national consumption basket. Maize accounts for a large share of that basket, especially in rural areas; thus, most Malawians are exposed to movements in maize prices. Inflation rate averaged over 20 percent per year from 2011 to 2016 but has gradually gone down, reaching 9.4 percent
40 The GoM has two poverty measures: ‘moderate poverty’ and ‘ultra-poverty’. Ultra-poverty is calculated with reference to a national poverty line measuring the consumption level needed to satisfy daily calorie requirements. Its value is approximatively US$0.82 in 2011 purchasing power parity. The moderate poor are those whose household expenditure per capita is below the total poverty line—a sum of the food and non-food poverty lines—of US$1.32 (2011 purchasing power parity).
-10
-5
0
5
10
15
2000
2002
2004
2006
2008
2010
2012
2014
2016
2018
Real GDP growth
Real GDP growth per capita
0
200
400
600
800
1,000
1,20020
00
2002
2004
2006
2008
2010
2012
2014
2016
2018
Malawi EthiopiaMozambique RwandaTanzania Uganda

MALAWI: MOBILIZING LONG-TERM FINANCE FOR INFRASTRUCTURE
27
in 2019. Headline inflation decelerated during 2020 to 7.5 percent in October 2020 supported by a decline in food prices and low global oil prices.
17. The Malawi kwacha has been relatively stable since early 2017 but depreciated by over 6 percent between December 2018 and June 2019, before largely recovering most of this ground by mid-August 2019. Additionally, with lower inflation, the Reserve Bank of Malawi (RBM) has reduced policy rates, and commercial lending rates have also declined. Base lending rates significantly reduced from above 33.4 percent in January 2017 to 13.6 percent in November 2020, while maximum lending rates declined from over 44 percent to just over 24 percent in the same period (Figure 11).
Figure 9: The kwacha has depreciated against the US dollar…
Telegraphic transfer (TT) and forex bureau (FXB) cash kwacha/US$ rates and spreads through December
Figure 10: Food and non-food inflation have decelerated
Headline, food and non-food Inflation, y-o-y, percent
Source: World Bank staff calculations based on RBM data. Source: World Bank staff calculations based on National
Statistical Office (NSO) data.
Figure 11: Interest rate developments
Percent
Figure 12: Total investment selected countries
Percent of GDP, period average
Source: World Bank staff based on RBM data. Source: World Bank staff based on IMF World Economic
Outlook data.
700 720 740 760 780 800 820 840 860 880 900
Jan-
17A
pr-1
7Ju
l-17
Oct
-17
Jan-
18A
pr-1
8Ju
l-18
Oct
-18
Jan-
19A
pr-1
9Ju
l-19
Oct
-19
Jan-
20A
pr-2
0Ju
l-20
Oct
-20
TT SellMedian cash sellMax cash sell
0
5
10
15
20
25
Jan-
17A
pr-1
7Ju
l-17
Oct
-17
Jan-
18A
pr-1
8Ju
l-18
Oct
-18
Jan-
19A
pr-1
9Ju
l-19
Oct
-19
Jan-
20A
pr-2
0Ju
l-20
Oct
-20
HeadlineNational FoodNational Non-food
0
10
20
30
40
50
Jan-
17Ap
r-17
Jul-1
7O
ct-1
7Ja
n-18
Apr-
18Ju
l-18
Oct
-18
Jan-
19Ap
r-19
Jul-1
9O
ct-1
9Ja
n-20
Apr-
20Ju
l-20
Oct
-20
Policy rateBase rateInterbank rate364 day TbillMax lending rate
0
10
20
30
40
50
60
70
1980-89 1990-99 2000-09 2010-17
Kenya Malawi
Mozambique Rwanda
Tanzania Zambia

MALAWI: MOBILIZING LONG-TERM FINANCE FOR INFRASTRUCTURE
28
18. Private sector investment generally requires a predictable political environment and macro-fiscal stability that can protect long-term cash flows. Lack of a predictable investment climate leads investors to require various forms of protection and government support, which may be costly and unpractical for the government. Malawi’s macro-fiscal instability has had a negative impact on the level of investment, with Malawi having some of the lowest total investment levels in the region (Figure 12). Similarly, the overall level of credit intermediation has been low compared to peers in the region.41 During 2010 to 2018, it averaged 12.7 percent of GDP in Malawi, compared to 30.9 percent in Kenya, 13.0 percent in Tanzania, 14.8 percent in Zambia, and 27.9 percent in Mozambique. This was largely driven by low economic growth and high inflation, which had a negative impact on firms’ ability to repay loans, increasing default rates and decreasing commercial banks’ risk appetite. In March 2020, the outstanding credit to the private sector was less than 10 percent of GDP and was concentrated in a handful of firms.
19. The historic macroeconomic climate did not promote domestic or international long-term investment in infrastructure due to volatile inflation, high interest rates and currency devaluation. With the recent improvements in the macroeconomic environment, private sector interest in investment is more likely to increase. Relative stability has translated into greater confidence in local currency financing. This has led to increased activities in the capital market in the past two years, with the listing of five corporate bonds. The initial public offering of ICON Properties in 2019 was the first since 2008. In February 2020, Airtel Malawi also offered its shares on the stock exchange. Another local bank (FDH Bank), where the GoM owns 5 percent of the shares, has announced its plans to list on the stock exchange before August 2020.42 Attracting private sector investments will, to a large degree, depend on the confidence of the private sector that the recent gains in the fiscal and monetary policy will be sustained. Most investors are still uncertain about how the macroeconomic environment will evolve and prefer shorter investment horizons. Protection against inflation is a key factor in the way the domestic investors price debt while foreign investors are concerned about stability of exchange rate, hence requiring insurance against currency devaluation. Therefore, maintaining the macroeconomic stability would be required before long-term credit and risk exposure become the norm.
41 For LICs, private sector credit to GDP ratio was 41.2 percent in 2017 (the latest available data) and for Sub-Saharan Africa (excluding high-income countries), the ratio stood at 51.5 percent at the end of 2018 (the latest available data). 42 When the bank was initially sold to FDH Financial Holdings Limited, the GoM’s shareholding was 20 percent.

MALAWI: MOBILIZING LONG-TERM FINANCE FOR INFRASTRUCTURE
29
The global COVID-19 pandemic has affected Malawi’s economy, leading to a contraction in per capita real GDP growth in 2020. Growth is projected at 1.0 percent, compared with an earlier projection of 4.8 percent. With population growth of 3 percent, this will lead to a reduction in per capita GDP growth by 2.0 percent, reducing incomes and increasing poverty. The impact of the COVID-19 pandemic has led to global and domestic factors affecting Malawi’s economy. These include: 1) a disruption in global value chains and trade and logistics; 2) a decrease in tourism; and 3) a decrease in remittances. This has combined with Malawi’s moderate social distancing policies and behavior to also reduce domestic demand. Although a full lockdown was proposed, it was never implemented. Lower international oil prices, on the other hand, have helped reduce the import bill and alleviated fuel and transportation price pressures.
Increased trade logistics costs and delays are also affecting the flow of goods through borders. Malawi’s imports declined by 27 and 26 percent y-o-y in April and May 2020, respectively. This reflected a lockdown in South Africa (Malawi’s key trading partner) which slowed its production and exports, combined with increased border restrictions that slowed cross-border cargo trade, as well as subdued demand. Malawi’s imports have largely rebounded since July 2020, as lockdown measures in South Africa have been lifted and trade disruptions have subsided. However, imports remain subdued due to low demand. Exports were affected by restrictions on foreign and transit ports and the additional safety inspections necessitated by the pandemic. Remittances, which have averaged approximately 1.5 percent of GDP over the last five years and supported incomes, also fell to US$ 150.4 million through October 2020, a 30 percent reduction from the same period in 2019. Strong figures in August and September 2020 offered some signs of recovery.
The services and industry sectors have been heavily affected, particularly the travel and accommodation, and transport sectors. International travel has re-opened since September 2020; however, it is still far below pre-pandemic levels. Although domestic travel and tourism have continued, tourism and transport activity are still substantially below pre-pandemic levels. Retail and wholesale trade also slowed due to weak demand, although mobility restrictions have weighed less on the sector than expected. Manufacturing and construction activity were affected due to disruptions in sourcing materials earlier in the crisis and challenges in maintaining equipment where foreign experts were needed, although the construction sector benefitted from several ongoing projects. The Malawi Chamber of Commerce and Industry carried out a survey in June 2020—when COVID case numbers were accelerating rapidly—which found that the share of firms reporting capacity utilization rates above 76 percent declining from 18 percent in 2017 to just 9 percent in 2020 and 93 percent of firms anticipated revenue reductions of more than 10 percent for the year.
The Malawian economy’s reliance on subsistence farming with some 87 percent of the population working in agriculture, combined with the second consecutive strong agricultural harvest, has mitigated some of the declines in industry and services. Owing to favorable weather conditions and seed availability, almost all of Malawi’s staple crops have shown positive growth. As a result, there should be no impact on food security in the short term, assuming no major blockages to internal trade.
Source: World Bank.
Box 1: Potential macroeconomic impact of COVID-19

30
2 Infrastructure Investment Needs

MALAWI: MOBILIZING LONG-TERM FINANCE FOR INFRASTRUCTURE
31
2.1. Energy sector 20. Malawi has low electricity generation capacity compared to current and projected demand. Current generation capacity of about 485 MW (Figure 13) is not adequate to meet the demand, which (in the base case scenario) is expected to reach 719 MW by 2020, 1,873 MW by 2030, and 4,620 MW by 2040 (Table 3). In addition, the production capacity is highly dependent on hydropower stations in the Shire and Wovwe Rivers (about 76 percent of the installed capacity), with the balance of generation coming from emergency diesel generators.
21. Given the heavy reliance on hydropower and low rainfall in recent years, inadequate water levels during the dry season left the system operating at less than 50 percent of the full hydro capacity.43 Production capacity has dropped to as low as 150 MW (2017) and in January 2020, capacity dropped to around 200 MW. As a result of this and the aging hydro plants that experience frequent outages due to limited maintenance, electricity generation remained fairly constant during 2012–18 (Figure 14). Consequently, load shedding has been a constant since 2016, with daily load sheds of 6–12 hours, exacerbated by high transmission and distribution losses of up to 22 percent and electricity theft of 10 percent per year. Load shedding was the highest in 2017 and 2018—at 162 GWh and 234 GWh, respectively. Until diversification of generation capacity occurs, Malawi’s capacity to meet demand will continue to be vulnerable to climate volatility.
22. The GoM aims to rapidly scale up electricity access from the current 11 percent to 30 percent by 2030. Investments in the electricity sector have been limited in the past and mainly financed by the public sector (including donor financing). The investment requirements for priority generation and transmission projects are too large to be funded through public sector
financing alone. The IRP44 for Malawi funded by the World Bank estimates priority investment amounts in
43 This creates the need for a drought monitoring and preparedness program, including a proper contingency plan. 44 It should be noted that plans are under way to update the IRP based on recent developments.
Figure 13: Malawi electricity generation installed capacity
Figure 14: Annual power generation
GWh
Source: ESCOM, EGENCO. Source: World Bank.
Table 3: Base, low, and high electricity demand forecast
Maximum demand, MW Sent Out Year Base Low High 2020 719 567 982 2030 1,873 1,236 2,591 2037 3,566 2,245 5,217 2040 4,620 2,841 6,946
Source: Malawi Integrated Resource Plan (IRP) (2017).
EGENCO (Hydro),
367.67MW…
Regulated own users, 38.82MW,
8%
AGGREKO (Diesel) ,
78MW, 16%
1,812
1,712
1,862
2,022
1,889
1,7301,795
2012 2013 2014 2015 2016 2017 2018

MALAWI: MOBILIZING LONG-TERM FINANCE FOR INFRASTRUCTURE
32
generation and transmission at about US$3.3 billion and US$1.1 billion, respectively, over 2020–40. This translates to an annual investment requirement of US$220 million (Table 4).45 It should be noted that this is a constrained (base case) scenario in which generation capacity within Malawi is assumed to be (at minimum) equal to the projected peak demand and a relatively conservative assumption on the mean annual flow on the Shire River has been applied. About 150 MW of new domestic generation capacity is assumed to be added to the power system annually. This scenario also assumes that Malawi will be connected to the Southern African Power Pool (SAPP) through Mozambique to enable cross-border trade of electricity, with an average annual net import of 500 GWh over the planning period. The projected investment needs vary substantially when other scenarios are considered, especially when renewable sources are factored in as committed rather than potential/candidate projects and when it is assumed that Malawi will not connect to the SAPP over the planning period and will need to be self-sufficient to meet demand (the isolation scenario) (Table 5).
Table 4: Base case generation and transmission cost: 2020–40
US$, millions Generation Transmission Total Capital expenditure (CAPEX) 3,268 1,140 4,408 Operational expenditure (OPEX) 1,556 600 2,156 Total 4,824 1,740 6,564 Annual CAPEX requirements 220
Source: Malawi IRP 2017.
Table 5: Net present value (NPV) for generation expansion scenarios
US$, millions Present value (discount rate=10%)
Constrained (base case)
scenario
Unconstrained scenario46
Diversification scenario47
Renewable scenario48
Isolation scenario
CAPEX 3,268 2,305 3,406 3,647 3,591
OPEX 1,556 1,278 1,628 1,715 1,676
Net import cost 37 991 23 (90) 0
Cost of unserved energy 632 664 632 622 767
Capacity shortage cost 229 0 237 178 127
NPV of total costs 5,722 5,238 5,926 6,072 6,161
Source: Malawi IRP 2017.
45 It should be noted that annual investment requirements based on the strategic plans of the two sector entities (EGENCO and ESCOM) are much more ambitious—about US$561 million (see Section 3.2 for details). 46 This assumes there is no minimum constraint on the capacity of domestic generation (only 103 MW of new capacity annually will be added to the system) and there is no requirement on system reserve. Therefore, the development plan is optimized purely on minimization of costs and the power system heavily relies on imports to meet the peak load. 47 To reduce the dependency on the Shire River, this scenario assumes that candidate projects on the Shire River (that is, Mpatamanga, Hamilton, and Kholombidzo projects) can only be added once the hydropower projects at Songwe River basin and Fufu dam (drawing water from the South Rukuru River and the North Rumphi River) have been completed. 48 Renewable energy sources are candidate projects in all scenarios but in this scenario, renewable projects (a total of 60 MW of wind, 165 MW of solar, and 100 MW of biomass) are assumed to be committed—that is, they have been agreed upon by the responsible authorities and there is a firm commitment in the form of a signed power purchase agreement (PPA) or a similar contractual agreement—and their capacities are increased throughout the planning period.

MALAWI: MOBILIZING LONG-TERM FINANCE FOR INFRASTRUCTURE
33
23. The GoM recognizes the need to crowd-in private sector investments and has undertaken reforms to liberalize electricity generation market. A new National Energy Policy49 was adopted in 2019 that emphasizes private sector involvement in the energy sector. This was followed by the passing of the Electricity Amendment Act No. 12 of 2016 to allow private sector participation in the electricity generation segment.50 The unbundling of the generation market segment led to the creation of EGENCO to manage state-owned generation assets but expected to compete with the private sector. ESCOM was left with the management of the transmission and distribution assets and the fulfilment of the single buyer (SB) and the system and market operator functions. However, as intended, further reforms were undertaken to divorce the SB function from ESCOM, and in November 2019, the GoM created a new institution, the Power Markets Limited, which assumed the role of the SB. The relationship between ESCOM, EGENCO and other private independent power producers (IPPs) is regulated by Malawi Energy Regulatory Authority (MERA) (Figure 15).
24. Since 2017, several private sector IPPs have shown interest, the largest being in solar (216 MW). In May 2019, ESCOM signed 14 PPAs, 4 with new private sector IPPs and 10 with EGENCO for its existing generation. None of the private IPPs have come into operation; the first plant (JCM Solar of 60 MW) is expected to commence operation in December 2020. The commissioning of these plants
will help reduce Malawi’s overreliance on hydro and dispatch of expensive emergency diesel generation plants. The GoM is also pursuing a PPP for the Mpatamanga hydro power project (350 MW) at an estimated cost of US$1.1 billion, using proposed IDA credit and guarantees to leverage significant amounts of private capital. Once completed, it will be the first major PPP project in the energy sector and will double the current installed capacity.
25. Though the power sector reforms opened up the investment space for the private sector, the critical driver to investor confidence is the financial sustainability of the electricity sector. Key to that is the financial strength of the offtaker (ESCOM). ESCOM’s weak financial performance is against the backdrop of inefficient operations, limited borrowing capacity, and availability of government bailout to meet ESCOM’s CAPEX needs. ESCOM’s operations are undermined by (a) inability to perform regular operation and maintenance (O&M) to ensure service reliability and (b) inability to connect new consumers, leading to a backlog in connections dating back to 2017 (Figure 16).
49 In addition to the energy policy, a National Electrification Strategy was adopted by the government that provides the institutional, technical, and financial parameters for efficient electrification rollout. A few of the key recommendations and action steps under the NES are being undertaken by the IDA-funded Malawi Electricity Access Project. A renewable energy strategy has also been developed and there are plans to put in place a regulatory framework for minigrids. A plan to undertake 10 pre-feasibility studies for minigrids is under way and an off-grid market development fund has been set up with the support of IDA resources to develop the off-grid market, that is, solar home systems and minigrids. 50 This was part of the reforms that were supported by the Millennium Challenge Corporation (MCC).
Figure 15: The structure of the electricity sector in Malawi
Source: World Bank.
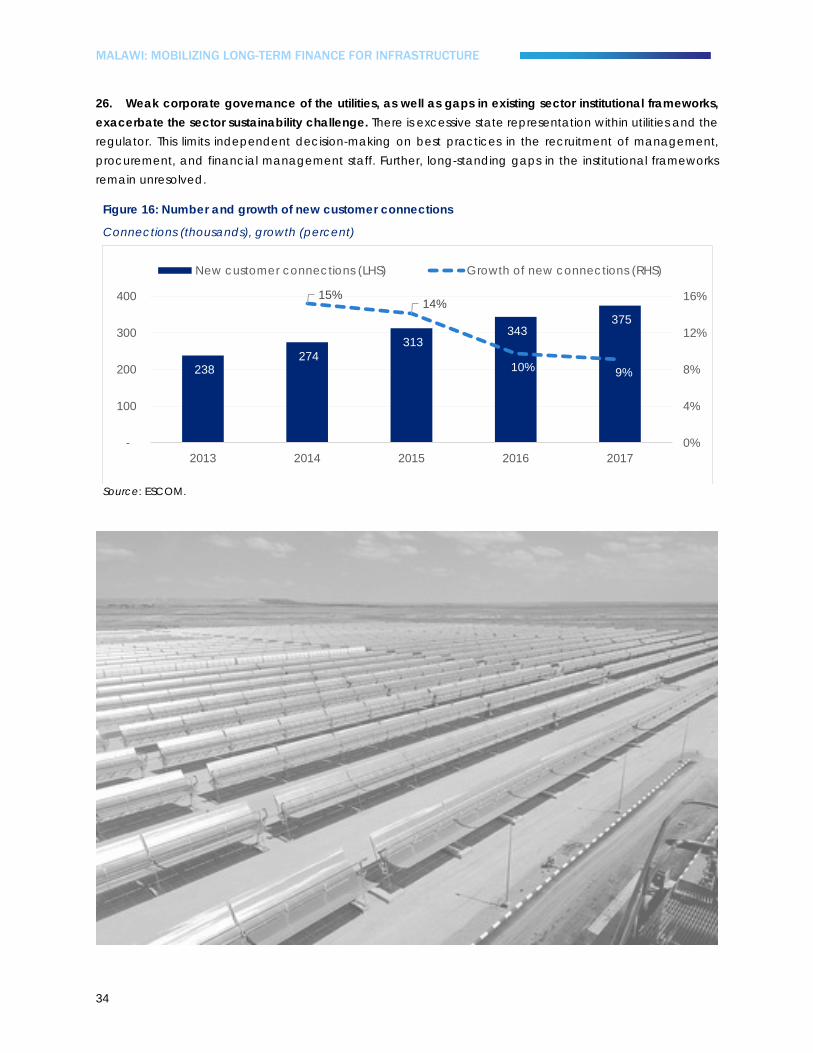
MALAWI: MOBILIZING LONG-TERM FINANCE FOR INFRASTRUCTURE
34
26. Weak corporate governance of the utilities, as well as gaps in existing sector institutional frameworks, exacerbate the sector sustainability challenge. There is excessive state representation within utilities and the regulator. This limits independent decision-making on best practices in the recruitment of management, procurement, and financial management staff. Further, long-standing gaps in the institutional frameworks remain unresolved.
Figure 16: Number and growth of new customer connections
Connections (thousands), growth (percent)
Source: ESCOM.
238 274
313 343
375
15%14%
10% 9%
0%
4%
8%
12%
16%
-
100
200
300
400
2013 2014 2015 2016 2017
New customer connections (LHS) Growth of new connections (RHS)
MALAWI: MOBILIZING LONG-TERM FINANCE FOR INFRASTRUCTURE
35
2.2. Water sector 27. The water sector plays a critical role in Malawi’s economy, as most of the constraints to growth are related to water. Water-reliant sectors contribute an estimated 35 percent to the country’s GDP. Surface water makes up 98 percent of the available water resources, and currently, the hydropower schemes are the main source of power generation for Malawi. The total renewable water resource available in Malawi is estimated at 17.3 km3 per year, or 1,027 m3 per capita per year, which borders on water scarcity.51 Population growth has led to rapid decline in per capita water availability. Lilongwe and Blantyre, the two major cities in Malawi, are growing fast and face shortages of water supply. Further, water resources in Malawi are highly variable between wet and dry seasons and from year to year, and the country’s stock of water storage infrastructure is one of the lowest in the region. Globally, Malawi is currently ranked 5 out of the top 10 countries (with population greater than 1 million) with the highest proportion of population at risk of frequent water shortages.52
28. It should be noted that Malawi has made significant progress in the past two decades in increasing access to water and sanitation services. As Figure 17 shows, access to improved water increased from 52.9 percent in 2010 to 68.8 percent in 2017. However, sanitation access has been lagging. Access to basic sanitation services has slightly improved from 20.8 percent in 2000 to 26.2 percent in 2017. Over a 15-year period (2000-2015) the rate of open defecation declined from 15.7 percent to 6.8 percent. These improvements are partly due to efforts by the Government to introduce the Community Led Total Sanitation Program in 2008.
29. Despite the progress made, a lot more needs to be done (especially in sanitation) to meet the 2030 Sustainable Development Goals (SDGs), which call for universal coverage in improved water and sanitation services. Unsafe drinking water and poor sanitation in both rural and urban areas remain a binding constraint, especially because official access figures mask the poor levels of services. High population growth, dwindling water resources, lagging infrastructure development, and aging water systems create large gaps between supply and demand, leading to unreliable services. The World Bank 2017 Lilongwe Citywide Sanitation Survey showed that only 5 percent of the population is served by a sewer system, while the majority relies on on-site sanitation systems (70 percent pit latrines and 25 percent septic tanks). Existing sewers and sewage treatment plants
are dilapidated due to lack of maintenance, resulting in environmental pollution, as most of the sewage
51 Under the Falkenmark definitions of water scarcity, a country with a total renewable water resource of less than 1,000 m3/capita/year is considered water scarce. 52 Sadoff, C. W., J. W. Hall, D. Grey, J. C. J. H. Aerts, M. Ait-Kadi, C. Brown, A. Cox, et al. 2015. Securing Water, Sustaining Growth: Report of the GWP/OECD Task Force on Water Security and Sustainable Growth. University of Oxford, United Kingdom.
Figure 17: Access to improved water
Percentage of total population
Source: World Bank.
52.9%
20.8%
68.8%
26.2%
0
10
20
30
40
50
60
70
80
Access to basic watersupply
Access to basic sanitation
2000 2017

MALAWI: MOBILIZING LONG-TERM FINANCE FOR INFRASTRUCTURE
36
ends up in the environment without treatment. Emptying and collection of faecal sludge from on-site systems is mainly done by small-scale private sector operators, with minimal regulation from the city council.
30. It is estimated that Malawi loses about US$3.8 per capita or 1.1 percent of the country’s annual GDP due to poor health outcomes attributed to, among others, low access to safely managed sanitation services. The Malawi Water Sector Investment Plan (WSIP) 53 indicates that there are substantial socioeconomic gains for Malawi with every dollar invested, generating net benefits between US$4 and US$14 per dollar invested. The highest net cost-benefit at more than US$14 will be obtained in providing sanitation and eradicating the remaining schools without hygiene facilities. This becomes even more imperative in the context of COVID-19.
31. The water supply and sanitation sector largely relies on donor funding, especially for development projects. The share of government-funded capital projects in the sector declined by almost half from 16 percent in FY2017/18 to 7 percent in 2018/19, that is, MWK 900 million (approximately US$1.23 million). Malawi’s spending in the sector relative to total budget is lower than that of its regional comparators. Data from between 2016/17 and 2018/19 show that the average spending for Malawi was 2.1 percent compared to 3.9 percent for Mozambique and about 3 percent for Tanzania (Figure 18 and Figure 19).54 However, donor-funded capital projects increased from 84 percent in FY2017/18 to 93 percent 2018/19, that is MWK 12.1 billion (~US$16.5 million). Unlike other social sectors where donor resources are declining, the WASH sector experienced an increase in donor funding (though relatively smaller that the size of donor financing into other sectors). The main financiers to the sector are the World Bank, followed by the AfDB, UNICEF, and other development partners.55 Private sector financing has not been tested in the water sector.
53 http://documents.worldbank.org/curated/en/800371468048863175/pdf/801430v10WP0P00Box0379800B00PUBLIC0.pdf 54 https://www.unicef.org/esa/sites/unicef.org.esa/files/2019-04/UNICEF-Malawi-2018-WASH-Budget-Brief.pdf 55 https://www.afdb.org/fileadmin/uploads/afdb/Documents/Project-and-Operations/PAR_Malawi__AR_-_Nkhata_Bay_Town_Water_Supply_and_Sanitation.pdf
Figure 18: Government water, sanitation and hygiene (WASH) spending
Percent of total budget and GDP
Figure 19: Average WASH spending of Malawi versus regional peers
Percent of total budget
Source: UNICEF, based on detailed budget estimates (FY2016/17–2018/19).
Source: UNICEF budget briefs for Mozambique and Tanzania.
0.0%
1.0%
2.0%
3.0%
4.0%
2016/17 2017/18 2018/19
WASH budget (% ofGDP)
WASH budget (% oftotal budget)
eThikwini WASH budget% of GDP (benchmark)
3.9%
3%
2.1%
Mozambique Tanzania Malawi

MALAWI: MOBILIZING LONG-TERM FINANCE FOR INFRASTRUCTURE
37
32. Current spending levels fall far short of the required investments to meet the SDGs. The WSIP estimates that, to achieve full access to improved water and access to sanitation services by 2030, CAPEX of about US$112 million will be required every year (Table 6). Affordability of tariff is generally a challenge in the water supply sector; however, water boards have the potential to increase their revenue generation capacity by becoming more efficient and hence beginning to diversify financing sources. Comparison with other well-
performing utilities such as those in Niger, Gabon, Senegal, and Uganda suggests this is eminently doable. The WSIP suggests that urban utilities should largely be self-sustaining and the GoM and donor resources are expected to be directed toward rural water supply and sanitation. This Is a welcome and practical strategy. The GoM will need to prioritize its resources well and encourage all water utilities to become more efficient and urban utilities to become self-sustaining.
33. The following consideration will be key for future investments in the sector:
(a) Clarity of sewerage and sanitation mandates: The Ministry of Natural Resources56 is responsible for the oversight of the water sector, including water resources management, irrigation, and water supply and sanitation. Urban and small-town water supply is under the responsibility of the two urban water boards (Lilongwe and Blantyre) and the three regional water boards (Northern, Central, and Southern). The Waterworks Act 1995 also mandates urban water boards to provide waterborne sewerage services within their areas of jurisdiction in the municipalities. Despite having the mandate, none of the water boards are providing waterborne sewerage services and all sewerage assets (where they exist) remain with the city councils. Recent highly publicized cases of contamination of Lilongwe city’s drinking water by a leaking sewer pipe have led to renewed calls for more investment in sewerage services by the water boards. Sanitation is currently the mandate of city council but the GoM intends to transfer the responsibility to water boards. Health and environmental risks could also be aggravated by continuing delays in the effective transfer of responsibility for sanitation obligations to the water boards. Clarifying the mandates and ensuring allocation of budget to sanitation are deemed urgent. This is critical in the peri-urban areas where there have been contamination and disease outbreaks.
(b) Funding of urban sanitation/sewerage services and rural water supply and sanitation: With increasing responsibilities over waterborne sewerage and sanitation services, water boards will have to invest a substantially higher amount to address the shortage of sewerage and sanitation services. The provision of sanitation and waterborne sewage systems may affect the creditworthiness of the utilities as these are normally not profitable ventures. Water supply and sewerage services are usually bundled in most countries, for both technical and commercial reasons. Most of the clean water supplied upstream has to be collected and treated as wastewater downstream. Within the limits of
56 Until June 2020, water supply and sanitation and water resources management were under the Ministry of Agriculture, Irrigation and Water Development.
Table 6: WASH sector investments requirements
US$, millions 2021–25 2026–30 Total
Urban water supply 242 260 502
Urban sanitation 36 39 75
Rural water supply 195 107 302
Rural sanitation 46 55 101
Mega projects in bulk water 6 131 137
Total 525 592 1,117
Annual Investments 112
Source: Malawi WSIP.

MALAWI: MOBILIZING LONG-TERM FINANCE FOR INFRASTRUCTURE
38
affordability, consumers are usually willing to pay for potable water but hardly willing to pay for sewerage services. Water boards normally recover a large portion of the costs of delivering waterborne sewerage as a percentage surcharge on water consumed typically between 75 percent and 100 percent. Sanitation services in urban areas such as emptying septic tanks are normally fully paid by the customer and is ideal for privatization. However, the GoM will have to provide supplementary resources to meet water and sanitation access targets (especially in rural areas). Nearly 100 percent subsidies may be needed for rural water and sanitation services. Subsidies, when used, should be well designed to ensure they are (i) not distortionary (encourage efficiency rather than subsidize inefficiencies of the utilities), (ii) well targeted (targeting poor communities), and (iii) transparent to minimize rent-seeking opportunities.
(c) An effective sector regulation model: Malawi does not have an independent regulator for the water supply and sanitation sector. User tariff affordability and cost recovery are essential to the financial sustainability of the sector and the investment program. In 2018, the GoM reversed the approved water tariffs related to LWB, resulting in refunds to customers, citing the price increase was illegal due to inadequate notification of customers. The sector will require an effective and independent regulatory mechanism to (i) oversee tariffs and cost recovery, (ii) set and enforce technical standards, and (iii) ensure the coordinated and sustainable expansion of the sector.
39
3 Why is Long-term Finance Not Flowing to Infrastructure Assets?

MALAWI: MOBILIZING LONG-TERM FINANCE FOR INFRASTRUCTURE
40
3.1. Weak institutional frameworks for enabling private sector participation 34. The World Bank Private Participation in Infrastructure (PPI) data show that most projects in emerging markets and developing economies (EMDEs) are increasingly being financed by private sources. In 2019, private sources contributed 62 percent of investments in EMDE projects. The rest came from public sources (13 percent) and multilateral and bilateral development finance (25 percent). Private sector participation in infrastructure in most LICs is low, but the landscape is changing. PPI data show a sizeable and growing private sector commitment in low-income (IDA) countries. Investment commitments of US$8.7 billion were made for 29 projects across 18 IDA countries in 2019, which was 247 percent higher than commitments made in the previous year. The highest level of commitment went to Lao People’s Democratic Republic and Ghana (Table 7). In Sub-Saharan Africa, like in other regions around the world, the majority of projects with private participation are in the energy sector, especially in renewable energy (Figure 20).
35. The amount of private (PPP) investments flowing to Malawi’s neighbors have been increasing while investments into Malawi have been decreasing. Mozambique and Zambia are notable cases—they have attracted private investments averaging 0.8 percent and 0.9 percent of GDP, respectively, higher than in Malawi (0.07 percent of GDP). As highlighted earlier, some of the investments are large resource-based investments contributing to higher ratios compared to other countries within the same income groups. Most of the investments in Mozambique went to the natural gas and electricity sector, while in Zambia, the majority of the investments went to the electricity sector. Figure 21 shows the evolution of PPP investments in select countries in Southern Africa, including Malawi.
36. In Malawi, spending in the energy and water infrastructure and other economic infrastructure (such as transport) has mostly been financed by public sources. The private investments shown in Figure 21 have taken place in sectors other than water and energy. Between 2005 and 2019, Malawi successfully attracted US$1.2 billion private investment in information and communication technology (ICT) (US$68 million), airline (US$9.8 million), inland water (US$3.5 million), railways (the Nacala Railway Corridor project - US$1.1 billion; see Box 2), tourism/game parks (US$20 million), and recently (2019) solar energy (US$67 million). The JCM Salima Solar project (60 MW)—the first solar IPP in the country which is backed by a guarantee from the Multilateral Investment Guarantee Agency (MIGA) and with a 20-year PPA has been signed with ESCOM—reached financial close in 2019.
37. One notable recent achievement in Malawi is the concluded PPP concession for university student housing in Lilongwe. When it reaches financial close at the end of 2020, it will be Malawi’s first social infrastructure PPP on a build-operate-transfer basis with a 30-year concession period. About US$150–200 million of private investment is expected to be mobilized when the project reaches financial close. The concessionaire, which is a consortium comprising Old Mutual Malawi (largest institutional investor) and M&M Consortium (a South Africa-based property management firm),57 will provide finance and develop and
57 The procurement process has been done in two phases. Old Mutual Malawi and M&M Consortium won the concession under phase one. Old Mutual Malawi signed an agreement for the construction of student accommodation at the College of Medicine and the Lilongwe University of Agriculture and Natural Resources (LUANAR)—Bunda Campus, while M&M Consortium signed agreements for the provision of students’ accommodation at LUANAR (Chancellor College and Polytechnic). The size of Old Mutual Malawi’s and M&M Consortium’s transactions is US$42 million and US$320 million, respectively, both with debt-equity ratio of 80:20. The second phase, currently in the procurement stage, involves the Kamuzu College of Nursing. The PPP Commission (PPPC) has already negotiated with the preferred bidder, NICO Asset Managers (the second largest institutional investor) and is incorporating what was agreed into the main PPP Agreement, to be processed for signing.

MALAWI: MOBILIZING LONG-TERM FINANCE FOR INFRASTRUCTURE
41
manage student housing with a capacity of 7,000 beds. This is the first PPP-infrastructure investment with participation from a domestic pension fund.
38. Additionally, the development of the Mpatamanga hydro power project (US$1.1 billion) is progressing well and is expected to attract finance from international investors, including the International Finance Corporation (IFC), guarantee from the World Bank, and potentially a political insurance from MIGA. Once the project is completed, it will be the first major PPP project in the energy sector. Successful implementation of this project will have a significant impact in terms of lessons for Malawi on how to successfully develop PPPs and hence generate greater commitment to the PPP program. This will send a positive message to the market about the potential and the commitment of the GoM.
Table 7: Investment commitments and no. of projects with private participation in IDA countries
2019
Figure 20: Projects with private participation in Sub-Saharan Africa
Total investments (US$, millions) and no. of projects
Total investment
(US$, millions)
No. of projects
Lao PDR 2,899 2
Ghana 1,533 2
Bangladesh 1,037 5
Nepal 647 1
Sudan 604 1
Côte d'Ivoire 582 2
Mauritania 310 1 Solomon Islands 233 1
Kosovo 212 2
Afghanistan 190 3
Uganda 87 1
Cambodia 75 1
Comoros 74 1
Chad 70 1
Malawi 67 1
Mozambique 56 1
Senegal 54 2
Tanzania 9 1
Total (2019) 8,740 29
Total (2018) 2,522 15 Total (2018–19 Growth) 247%
IDA (Last 5-Year Average) 4,615 23.8
Source: World Bank staff based on IMF data.
Figure 21: PPP Investments
Percent of GDP
Source: World Bank PPI data. Source: World Bank staff based on IMF data.
43
14 6.8
5.3 1.7 1.7 2.2 0.4 0.3
253 55 5414 9 9 6 19 10 0
50
100
150
200
250
300
- 5
10 15 20 25 30 35 40 45
Elec
tric
ity
Port
s
ICT
Railw
ays
Road
s
Airp
orts
Nat
ural
Gas
Wat
er a
nd S
ewar
age
Wat
er T
reat
men
t and
…
Total Investments No. of Projects
0.0%
0.5%
1.0%
1.5%
2.0%
2.5%
3.0%
1994
1996
1998
2000
2002
2004
2006
2008
2010
2012
2014
2016
Tanzania Kenya
Mozambique Zambia
Malawi

MALAWI: MOBILIZING LONG-TERM FINANCE FOR INFRASTRUCTURE
42
39. Overall, the prospects for private sector participation in the infrastructure in Malawi appear to be more promising than in past years. Today, Malawi has a PPP framework that has been tested through six successfully implemented PPP projects in a wide range of sectors. PPP standard procedures and guidelines were launched in March 201858 and a framework for IPPs in the energy sector has been established, covering step-by-step processes for both solicited and unsolicited procurement of IPPs. Moreover, standardized documents for PPP projects (for example, Model Request for Quotations/Request for Proposals and concession agreements) have been developed. These ensure transparency, consistency, and clarity on contractual issues pertaining to the long-term nature of PPP contracts rather than relying on various consultants to prepare project-specific documents on a case-by-case basis, which tends to be a prolonged and costly process. In light of this, the adoption of Model Concession/PPP Agreements can provide additional benefits.
40. Despite the progress made to date, challenges remain. Due to overreliance on public finance in the past decades, institutional frameworks and incentive structures are still designed in favor of public finance. The shift toward accessing multiple forms of financing will require adopting new practices and processes so that due consideration is given to financing options, in how projects are shaped and structured, and in how they are considered within the public financing envelop. New processes will also, undoubtedly, require new skills and capabilities. Below are the challenges that would require the attention of the GoM.
The private sector agenda lacks a champion, leading to the fragmentation in how it is being implemented.
41. Despite the government’s stated national policy direction to crowd-in the private sector in the financing of infrastructure, the agenda has not received full political buy-in, and there is no PPP champion within the government. The PPPC is the main PPP institution in Malawi and the adoption of the private sector participation agenda is often left to the discretion of various line departments which are not only deficient in capacity but also lacking incentives to engage with the private sector. The full commitment and backing of the government would be necessary for this agenda to have the required profile and access to high-level decision makers for effective and timely implementation of projects with private sector participation. Some of the PPPs currently in the pipeline (Annex 3) have been facing delays as they are added to the mainstream procurement pipeline of the ministries, departments, and agencies (MDAs), and there is no accountability for slow progress at the MDA level or at the Cabinet level.
The PIM framework is inefficient and not designed to generate a credible pipeline of projects for potential private sector investments.
42. The efficiency and design of the PIM framework is key for two main reasons, among others. First, spending on large-scale public investment projects has large budgetary implications, both in terms of initial up-front costs and future maintenance costs, affecting the fiscal space. Hence, a careful prioritization and selection of investment projects is critical. The efficiency of project implementation is equally important to minimize project delays and, by default, cost overruns. Second, a well-designed PIM framework and process are critical for increasing private sector participation in infrastructure. Most of the infrastructure is public and its origination within the government must be designed to encourage the participation of the private sector where a cost-benefit tested rationale exists.
58 These procedures and guidelines provide sufficient guidance on value for money assessment, affordability, feasibility, short-listing, and criteria for evaluation.

MALAWI: MOBILIZING LONG-TERM FINANCE FOR INFRASTRUCTURE
43
43. The PIM framework in Malawi is weak, and incentives across the government are not aligned. Current practices in the identification, appraisal, and selection of investment projects reflect the assumption that all projects will be financed by the government. The viability of projects for private financing or investment does not factor in the design or evaluation process. In addition, there are inefficiencies in project procurement, implementation, and monitoring. Below are specific issues contributing to the observed inefficiencies.
The project is part of the Nacala Logistics Corridor, which is a mega regional logistics connectivity program (for the creation and management of railways, highways, ports, and airports) in Mozambique and Malawi and indirectly serves Zambia and Zimbabwe. A total of US$2.73 billion of debt was raised to refinance the project (of which US$1.1 billion is being invested in Malawi, the largest single foreign direct investment Malawi has received to date). Investments will go toward the development of the Nacala Railway, linking the Moatize coal mine in the Tete region of Mozambique, which is owned by Vale SA (the Brazilian mining company) with the export port of Nacala in the northeast of Mozambique. The railway is expected to cover 912 km, travelling through landlocked Malawi. The project entails the construction of 230 km of new lines and the rehabilitation of 682 km of existing track, as well as the construction of a coal export terminal at Nacala with a loading capacity of 18 million tons per year of coal and a further 4 million tons per year of general cargo.
The project special-purpose vehicle (SPV)—the Nacala Logistics Corridor’s SPV—is 35 percent owned by Vale SA, 35 percent owned by Mitsui & Co, and 30 percent owned by Portos e Caminhos de Ferro de Mozambique (the government authority that oversees the railway system of Mozambique and its connected ports). It is noteworthy that, earlier, Vale SA was holding 70 percent of equity in the SPV but later sold half of the shares to Mitsui & Co.
The debt capital was raised from six global and four South African commercial lenders, with two guaranteed tranches and loans from the Japanese export credit agencies (ECAs)—the Japan Bank for International Development and AfDB.
1) The first tranche (US$400 million) was guaranteed by Export Credit Insurance Corporation of South Africa and had four South African lenders: (a) Standard Bank (US$118 million), (b) Investec (US$94 million), (c) ABSA Bank (US$94 million), and (d) Rand Merchant Bank (US$94 million).
2) The second tranche (US$1 billion) was guaranteed by NEXI and had six global lenders: (a) Mitsubishi UFJ Financial Group (US$100 million), (b) Mizuho Bank (US$210 million), (c) Sumitomo Mitsui Banking Corporation (US$210 million), (d) Nippon Life Insurance (US$170 million), (e) Sumitomo Mitsui Trust Holdings (US$100 million), and (f) Standard Chartered Bank (US$210 million).
3) The Japan Bank for International Development invested US$1.03 billion.
4) AfDB invested US$300 million.
The project is unique on several fronts: it is large in scale and scope; it was able to attract a large amount of capital from global and regional investors to construct a rail and port network across two countries in Africa—bringing together many strands of project finance from risk allocation in concession agreements to managing political risk in a big-ticket ECA financing. It also shows the benefits of regional infrastructure projects/bundling infrastructure transactions with other countries.
Source: IJGlobal, World Bank.
Box 2: The financing structure of the Nacala Railway Corridor project

MALAWI: MOBILIZING LONG-TERM FINANCE FOR INFRASTRUCTURE
44
Projects are not screened and appraised through a standardized framework that consider private investments or PPPs as an option.
44. The Public Sector Investment Program (PSIP) Unit within the Ministry of Economic Planning and Development (MoEPD) has the mandate is to filter project proposals from MDAs before their inclusion in the national budget. With the support of the Japan International Cooperation Agency, a database (the PSIP database) has been developed and provides details on new, ongoing, and proposed public projects and estimated financial resources requirements for each. Based on the audit carried out by the IMF in June 2019, the PSIP platform is comprehensive and well designed for portfolio management and monitoring and has well-enforced restrictions on moving budget funds from capital to recurrent spending.
45. However, there are some weaknesses in how the function of the PSIP Unit is being implemented. The PSIP database is mainly used as a repository of all project information rather than as a selection funnel for project prioritization based on clear cost-benefit analysis. As a result, almost all project ideas, regardless of merit or rationale, can gain access to the PSIP database as projects are implemented.59 IMF notes that the database has an unsustainable number of projects (370) with small budget allocations due to limited funding, leading to delays and a large number of uncompleted projects.60 The inability to prioritize projects due to lack of clear eligibility criteria also means that new projects are included in the pipeline, sometimes at the risk of budget cuts for ongoing projects with commitments, which contributes to accumulation of arrears.
46. The PSIP (with the support of the IMF) developed clear project selection criteria and templates that will be used by MDAs in their submission of project proposals to the PSIP. MDAs will be required to provide more detailed information about project proposals, including justification for projects (based on an initial appraisal conducted, including whether private sector financing could be an option); project cost, including capital requirements for each year, and proposed sources of financing; project revenues, if applicable; the list of studies that will need to be undertaken (and funding sources for such studies); and the proposed implementation plan (including whether the project could be implemented in phases). These criteria will form the basis for the PSIP Unit to evaluate proposals and either accept, reject, or return them to MDAs for further work. The developed templates, if implemented well, would contribute to better allocation of budgets and the generation of a pipeline of projects that could potentially be financed by the private sector and ensure the PPP projects are aligned with the planning process and consistent with the country’s developmental goals.
Limited financial and technical resources to facilitate project preparation (from project selection to project design, procurement, implementation, and monitoring)
47. A critical missing piece in the PIM process is the availability of resources for detailed project appraisals and preparation, including feasibility and other technical studies, as well as the capacity/experience to negotiate long-term complex contracts. This not only affects project selection and budgetary allocations and disempowers MDAs by putting them in a position where they cannot effectively negotiate with the private sector and appropriately allocate risks. It also disincentivizes MDAs from pursuing private sector financing options.
59 IMF. 2019. Public Sector Investment Management Database Audit. 60 The IMF notes that it would cost about MWK 2.2 trillion, which is spread thin across many projects.

MALAWI: MOBILIZING LONG-TERM FINANCE FOR INFRASTRUCTURE
45
48. Project preparation is generally costly. It is estimated that the process of project preparation, from initial planning to the beginning of implementation, could amount to 5–10 percent of the total project cost.61 This becomes a deterrent for MDAs when large projects, for example, in the energy sector, are considered. Most of the SOEs reviewed under this study have formulated strategic plans and identified long lists of projects to increase infrastructure investments and improve efficiency. However, they do not have sufficient resources to implement all programs (funding sources have not been clearly identified). The majority of the proposed investments are aspirational and have not been fully developed—most do not have project concepts or have not been developed beyond the concept stage. The PPPC also identifies lack of financial resources and technical capacity for project development as a key constraint to advancing the PPP program in Malawi. MDAs will need to prioritize their investment needs and ensure selectivity based on transparent criteria. Financial resources will also need to be allocated to ensure critical and priority projects, especially those with the potential to attract the private sector, are well prepared.
49. Currently, most of the project preparation activities are donor dependent; hence, only projects with development partners’ interest could receive such support. Other credible projects that could also be financed by the domestic private sector are left without the necessary funding and technical support. This challenge could be addressed by a well-structured project development facility that can coordinate project preparation activities with different arms of the government. Such a facility was provided for in the PPP Act but never materialized due to lack of financial resources. Annex 3 presents an overview of the current PPP pipeline with the delivery of most projects in ‘delayed’ status due to the lack of preparation resources. Discussions with stakeholders within and outside the GoM, including financial institutions, indicate a consensus that such facility is needed.
Noncompliance with procurement laws and limited transparency in the procurement process
50. Projects with private sector participation can be procured either under the PPP law or the Public Procurement and Disposal of Public Assets Act of 2017 (hereafter, the Public Procurement Act). All IPPs are sourced under the IPP framework (which is new and yet to be fully tested) and then procured under the Public Procurement Act. The Malawian PPP Act has been in place for less than 10 years and only few transactions have been implemented under the law. The discussions with stakeholders in various MDAs revealed limited incentives in procuring PPP projects using the PPP framework; hence, consideration of unsolicited proposals is common. 62 While the law is generally strong, implementation of procedures as currently defined in the law takes long. Lack of incentive to pursue PPPs is also partly attributable to the fact that the PPP law requires rigorous processes to be followed while the MDAs lack the capacity and resources to implement them. This emphasizes the need to ensure availability of resources for effective preparation of projects would be critical.
51. While the Public Procurement Act includes adequate provisions on open and competitive tendering, with some allowances for restrictive tendering, compliance is minimal. In practice, the laid-out processes are not well followed, generating implementation risks and additional unplanned costs for the GoM and MDAs. The assessment of the procurement regulator—the PPDA—shows that the overall compliance with the legal framework across entities has been varying and has fallen from 65 percent to 15 percent; only 25 percent of
61 http://documents.worldbank.org/curated/en/206701468158366611/pdf/828000WP0Finan0Box0379879B00PUBLIC0.pdf. 62 While governments around the world deal with unsolicited proposals, they require a robust framework of managing such proposals to minimize procurement risks. Malawi already has such a framework and effective implementation and proper coordination would be key.

MALAWI: MOBILIZING LONG-TERM FINANCE FOR INFRASTRUCTURE
46
tenders go through an open and competitive process. In addition, there is no procurement database that publishes tenders and awarded contracts, and the compliance review process is not transparent (IMF 2018a.)
52. In discussions, MDAs attributed the current issues to long and cumbersome processes in the procurement law. However, the PPDA pointed to the lack of proper and advance project planning, leading to MDAs procuring projects under time pressure, as one of the key reasons for noncompliance with the procurement rules.
Lack of effective project implementation and monitoring
53. Large-scale investment projects are technically difficult to manage, require robust coordination with and management of multiple stakeholders, and are exposed to political risks. These can contribute to delays in project implementation and cost overruns, putting additional fiscal pressure on the government. Most donor-funded projects in Malawi are required to have dedicated project implementation units, which minimizes implementation risks. However, risks are elevated in other projects where such structures do not exist. In this case, the strength and the quality of project implementation and monitoring frameworks are critical. The IMF notes that for domestically funded projects, project monitoring is done centrally by the Economic Planning and Development Department,63 which requires information on project implementation
63 Formally within the MoF and currently within the MoEPD.
The GoM and Lilongwe Water Board (LWB) awarded an engineering, procurement, and construction and finance (EPCF) contractor a contract to develop the Lake Malawi-Salima bulk water project as the next water source for Lilongwe. The estimated project cost of US$350 million would have been too substantial for LWB’s balance sheet to accommodate. It was decided to create an SPV with the GoM as the owner and guarantor for debt, which would have been acquired by the SPV and redeemed using the revenue from the water that would have been sold to LWB. Financing was to be arranged by the EPCF contractor against a GoM guarantee.
In anticipation of a commitment from a Spanish investor, the contractor moved construction equipment on site; however, the finance agreement was not finalized as the GoM was not comfortable with some of the conditions and the investor withdrew its commitment. The contractor submitted a request for payment and was paid MWK 12.66 billion for preliminary establishment costs. This was paid from a bank loan incurred by LWB on behalf of the to-be-created SPV. LWB was requested to accommodate this payment and the loan and temporarily keep it on its balance sheet. LWB did not service the bank loan, with the result that default penalties and interest have accrued (at a further estimated amount of MWK 4 billion). This has resulted in the reduction of the borrowing capacity of LWB. The project and resulting responsibility for the financial implications and obligations are now subject to litigation. With such a substantial amount, litigation can continue for several years. Although LWB has started to repay part of the loan, this scenario also translates to a reputational risk which can limit access to financial markets.
Source: LWB’s financial statements; discussions.
Box 3: An example of procurement risks: Procurement for the Lake Malawi-Salima project

MALAWI: MOBILIZING LONG-TERM FINANCE FOR INFRASTRUCTURE
47
progress to be reported quarterly. 64 However, this is not done regularly and adequately; hence, comprehensive reports on the financial and operational performance of the public investment portfolio are not available.
3.2. Infrastructure delivery in Malawi is mainly through SOEs but they have limited borrowing capacity 54. The institutional channel of delivering infrastructure in Malawi is predominantly through SOEs, making them central to the long-term finance agenda. Many SOEs will require substantial reform before they can attract private capital. Concerns about corporate governance or independence of boards of directors,
professionalism of management, political interference in decision-making, corruption, and poor operational and financial performance were frequently voiced by financial institutions and market participants. Most financing to date has been provided through concessional loans offered by development partners. Success in diversifying infrastructure financing through attracting foreign and domestic private investments depends on the commitment and capability of SOEs to improve their creditworthiness and change the manner in which they approach private investors and whether the enabling environment can facilitate that change.
55. Evidence shows that, where such concerns/risks are minimized, SOEs have a higher chance of raising capital from the market. An example is RFA, which partnered with a local bank in Malawi and successfully issued two bonds through a private placement market and raised MWK 10 billion (in two tranches) for the rehabilitation of roads in Lilongwe (Box 4). The bond issuances were well received by the market, partly due to a relatively tightly defined mandate of RFA and a clear (and legally protected) purpose for collected revenues, which have been growing steadily in the past
years, and a perception that RFA is generally a well-managed SOE (see following sections). The fact that RFA was able to issue a bond without a credit guarantee from the GoM is noteworthy.65
64 The PSIP database is the tool used for tracking projects. 65 Since the purpose of revenue streams is clearly articulated in the law and protects RFA from risks of diverting funds, the market agreed to finance RFA without a credit guarantee. However, the government offered banks a commitment letter that it will not change the law in relation to the fuel levy during the bond repayment period, which gave comfort to potential lenders.
The process of issuing bonds was relatively straightforward as the bonds were not listed or rated. RFA tested the market appetite through an informal process based on a project information sheet. A few domestic commercial banks submitted offers with price and terms. This was followed by negotiation to establish the bank with the most competitive pricing and finally the bond was issued to NBS Bank for a total of MWK 10 billion in two tranches. The first tranche was for MWK 7 billion for a dual carriage way in Lilongwe and the second for MWK 3 billion for the Clover Leaf Interchange in Lilongwe. The bonds were priced at a variable rate of 1.75 percent above the three-month (91-day) treasury bill over 5 years. The principal amount is secured by a stable revenue stream from fuel levy and a written guarantee by the GoM that there will not be a change of policy or legislation that may impair fuel levies. The GoM did not provide a credit guarantee.
Source: World Bank Staff based on LWB’s financial statements and discussions.
Box 4: Issuance of bonds by RFA

MALAWI: MOBILIZING LONG-TERM FINANCE FOR INFRASTRUCTURE
48
56. The quantum of capital investment plans of the seven SOEs under review is significant in relation to their current capacity to borrow. SOEs’ investment strategies and sector plans indicate annual investment requirements of about US$956 million or US$9.6 billion over a 10-year period (2020–2030) (Table 8). These are ambitious plans. For example, the EGENCO capital investment plan of US$4.3 billion over a 15-year period—an annual investment of US$300 million—is much higher than what the energy sector IRP projects for the entire electricity sector projects (an annual investment need of 220 million over the next 20 years). This clearly points to the need for prioritization of investment programs in light of current and potential borrowing capacity and implementation capacity of SOEs, as well as
enabling environment realities.
Figure 22: Approach to assessing SOEs’ market readiness
Source: World Bank staff.
57. Figure 23 depicts SOEs that are close to market (with higher borrowing capacity), and those that are far from accessing market-based finance. SOEs’ ability to access commercial finance has been assessed against specific parameters of governance, operational performance, and financial performance (Figure 22), each receiving a market readiness score of 1 to 5, 5 being the best score (Table 9). The assessment shows that SOEs have several governance challenges, which partly contribute to poor operational and financial
66 BWB and NRWB do not have a comprehensive program of investments.
Key Factors
•Cost coverage•Profitability•Liquidity, Asset efficiency•Funding profile/leverage•Debt absorption capacity
Financial Risk
•Collection •Cost efficiency •Asset efficiency – return on
assets, receivables
Operational Risk
•Board–autonomy•Board – diversity of background•Overall company performance
Governance & Management
Distance to Market
No Market Access
Full Market Access
1 5
•Incapable of borrowing
•Unable to generate consistent operational surplus
•Assets are significantly lower than liabilities
•Transformational reforms required
•Very limited market access
•Irregular generation of operational surplus
•Cannot borrow without significant Government/ external support
•Transformational reforms required
•Market ready with minimal to moderate level of Government / external support
•Operational surplus consistently generated but no ability to contribute to capital projects
•Minimal absorption capacity
•Some operational improvements needed
•Market ready without Government/ external support
•Operational surplus consistently generated contribute to capital projects
•Moderate debt absorption capacity
•Some operational improvements needed
•Quality collateral
•Market ready without Government/ external support
•Operational surplus consistently generated contribute to capital projects
•Full debt absorption capacity
•High quality collateral
Significant sources of contingent liabilities
32 4
Table 8: Capital investment requirements of SOEs
SOE
Assets - 2018
(MWK, billions)
Assets - 2018 (US$,
millions)
Average annual
requirement (US$,
millions)66 EGENCO 73 100 287
ESCOM 177 241 274
BWBa 41 55 Not yet quantified
LWB 54 74 69
NRWBa 39 53 Not yet quantified
MHC 94 128 178
RFA 36b 49 148
Total 513 701 956
Source: SOEs’ annual reports/strategic plans and sector plans. Note: a. BWB and NRWB do not have a comprehensive program of investments; b. These are assets of the Roads Fund (not RFA).

MALAWI: MOBILIZING LONG-TERM FINANCE FOR INFRASTRUCTURE
49
performance. However, SOEs’ operations are also inefficient, leading to low capacity to generate revenue; inability to cover existing asset maintenance costs; and, in turn, poor service and low willingness of customers to pay for services. In most cases, tariffs are not adequate to cover all costs, limiting the ability to invest, which creates a vicious cycle of poor service delivery and inability to increase tariffs.
Table 9: Market readiness scores and borrowing capacity
Market readiness ranking
Name of SOE
2018 PAT (MWK,
billions)
Existing long-term
debt (MWK,
billions)
2018 DSCRa
Average market
readiness score
Potential borrowing
over 10 years (MWK,
billions)
Possible immediate borrowing
(MWK, billions)
1 RFA 0.98 13.00 n.a. 4.20 116 10
2 EGENCO 10.00 5.40 74.00 3.10 103 10
3 LWB 2.46 116.70 2.80 2.60 Very limited borrowing capacity (overcommitted)
4 MHCb 0.26 0.06 8.36 2.40 40 6
5 ESCOM 2.46 — (27.44) 2.20 No borrowing capacityc
6 NRWB 0.15 19.00 0.96 1.80 No borrowing capacity
7 BWB (2.38) 20.40 0.55 1.50 No borrowing capacity
Total 174.56 259 26
Source: World Bank staff based on SOEs’ financial statements Note: DSCR = Debt service coverage ratio; PAT = Profit after tax. a. A minimum threshold acceptable to financial institutions is usually 1.25 for the entire period of credit exposure. b. Can borrow only against collateral and/or guarantee. c. With the right management and increased efforts to improve performance, ESCOM should be able to reverse this quickly.
58. Of the seven SOEs, only three—RFA, EGENCO, and to some extent MHC—could potentially borrow from the commercial market for a total of only MWK 259 billion (~US$354 million) over a 10-year period or US$35
Figure 23: Distance-to-market score for each SOE
Source: World Bank staff.
ESCOM
EGENCO
LWB
BWB
NRWB
MHC
RFA
020406080
100120140160180
- 0.5 1.0 1.5 2.0 2.5 3.0 3.5 4.0 4.5 5.0
Asse
t Size
(MW
K bi
llion)
Distance from Market Market ReadyFar from Market
MALAWI: MOBILIZING LONG-TERM FINANCE FOR INFRASTRUCTURE
50
million annually. This is a limited borrowing capacity67 compared to the capital investment plans of US$956 million annually for the seven SOEs. This shows the need to undertake reforms to improve borrowing capacity, which will require a combination of tariff increases (considering consumers’ ability to pay), improved efficiency, political realities (and enabling environment reforms), and some minimum government support, which must be maintained in developing countries.
59. As Figure 23 shows, RFA is the most creditworthy SOE and sets an example of market access for other SOEs, given its experience of issuing bonds. RFA’s performance is strong, enabled by good governance and management and a dependable stream of revenue from fuel levies and road user charges on cars entering Malawi. RFA has the capacity to borrow up to MWK 116 billion (~US$158 million) over the next 10 years and plans to issue additional bonds worth MWK 40–50 billion (~US$55–68 million) in the stock exchange in the next 5 years.
60. EGENCO is market ready and should be encouraged and assisted to issue a bond. However, at the time of the assessment, the company had high levels of outstanding receivables of about MWK 30 billion related to ESCOM, affecting its liquidity. These need to be resolved and sectorwide measures should be put in place (led by the regulator) to ensure additional receivables do not accumulate. Without such measures, and since EGENCO is a fairly new institution, accessing market finance by EGENCO will require, at the minimum, government ‘payment guarantee’. Negotiations are under way on a number of revenue generation parameters, including the methodology for tariff determination, the term of the PPA with ESCOM and related issues. Given its investment program and financial performance/ability to service debt from internally generated revenues, EGENCO’s balance sheet could absorb up to MWK 103 billion of debt over a 10-year period, with an immediate borrowing capacity of about MWK 10 billion.
61. LWB is profitable and has been improving its performance over the past four to five years. LWB’s current financial performance is sufficient to access commercial finance, but the SOE is already substantially committed to concessional loans (most have not started to disburse), limiting its borrowing capacity. LWB is investing the current loan proceeds in additional revenue generating/cost savings projects and could be ready to access the commercial markets in the medium term. In addition to improving operational efficiency and generating more revenue, the GoM must resolve/repay two commercial bridge financing loans on LWB’s balance sheet related to the Lake Malawi-Salima project described in Box 3.
62. MHC has been making marginal profits since 2016 and in 2018; the PAT was about MWK 260 million (US$354,978). However, this was an accounting profit, driven by land revaluation gains. MHC is not breaking even on the rental portfolio, but its portfolio of properties for sale is profitable. MHC projected an after-tax profit of MWK 581 million (US$782,776) for 2019. It will be important for MHC to not rely on increases in the market value of the land portfolio to create accounting profit but instead focus on generating an operating profit. MHC should improve operational profits of the rental portfolio by improving maintenance, increasing rental rates (which are currently below market rates), and improving collection. In addition, development of new houses and commercial units for sale should be scaled up to increase overall profitability.
63. Despite the limited revenue generation capacity, MHC has a land portfolio that can be used as collateral to acquire debt. Given its quality land collateral, and subject to improved operational performance, MHC could potentially borrow on its own account up to MWK 40 billion (~US$55 million) over the next 10 years (its immediate borrowing capacity is about MWK 6 billion (~US$8.2 million)). MHC plans to
67 Borrowing/debt absorption capacity has been determined based on the discretionary cash flow, which was calculated using the operating income minus commitments such as interest on existing loans and taxes, and then projected over 10 years.

MALAWI: MOBILIZING LONG-TERM FINANCE FOR INFRASTRUCTURE
51
immediately raise MWK 10 billion of debt and gradually increase it to MWK 46 billion per year. It is recommended that before borrowing and investing in construction, a thorough market assessment should be conducted and regularly reviewed. Debt should be used mainly for developing new units for sale. MHC should ensure that refinancing through mortgages is readily available and its capacity to quickly deliver new units is considerably increased. The mortgage market in Malawi is currently underdeveloped, and efforts to deepen the market would be critical. MHC can also enter into JVs with private developers.
64. ESCOM was formally rated by the Global Credit Rating (GCR) of South Africa, based on the 2015/16 financial results and was deemed creditworthy and obtained a domestic investment-grade rating of BBB. The financial performance of ESCOM has substantially deteriorated since the unbundling of the electricity generation subsector to a degree that the entity had to request a bailout from the GoM in April 2018. Part of this deterioration is the hydrological risk68 that is being carried by ESCOM after the unbundling, although the financial indicators had started to decline since 2015, before the unbundling. The 2018 audited annual financial statements reflect liquidity problems, loss of profitability, and inability to cover even operational costs. However, the management of ESCOM is taking steps to address most of the issues and some improvements were observed in 2019. ESCOM does not have any debt absorption capacity currently, and even with a government guarantee, it will not be able to service loans. A formal turnaround strategy would be required and ESCOM is currently receiving support from the MCC in this regard.
65. NRWB is not market ready. The entity has been making small profits but is largely sustained by ad hoc grants from the GoM and is also substantially committed to concessional loans. Without grants, NRWB’s revenues would not be adequate to service substantial amount of commercial debt. NRWB’s current DSCR is below 1, and it faces liquidity challenges due to high levels of outstanding receivables. NRWB should not take additional debt (including concessional loans) in the short term. It would be prudent for NRWB to first concentrate on efficiency improvement to increase internally generated revenue and repay the expensive overdraft facilities. The GoM will need to step in with further assistance for capital investments, especially for expansion of services in rural areas where higher investments per capita will be needed than in urban areas.
66. BWB is technically insolvent with negative equity. It displays all the symptoms of a cash-strapped utility, struggling to make ends meet. No one action would be adequate to resolve BWB’s situation—a comprehensive turnaround program would be required. The only opportunity for private sector involvement would be through a service and management contract to improve operational performance. Below is a summary of key issues contributing to the current performance of SOEs.
68 The PPA between EGENCO and ESCOM defines an ‘adverse hydrological event’ as “a drought or any other event, condition or circumstance resulting in a reduction in the flow of water from the Shire River.” When this risk materializes, EGENCO will have insufficient electricity to sell to ESCOM (and by default ESCOM receives less electricity to sell to consumers), contributing to ESCOM’s inability to recover all costs. This is a force majeure event and a sectorwide risk that will continue to exist until Malawi achieves diversification of power sources and should not be borne by any one sector entity. The PPA provides clear guidance that the risk/cost should be equally shared (50/50) between EGENCO and ESCOM. However, during the transition period (after the unbundling of the generation component of the sector), ESCOM indicated that it was held responsible for the full amount. Negotiations on the matter have been concluded.
MALAWI: MOBILIZING LONG-TERM FINANCE FOR INFRASTRUCTURE
52
The current governance framework in Malawi does not enable SOEs to be efficient and accountable.
67. The GoM has adopted the approach of creating SOEs to deliver certain services as corporate bodies with the government remaining as the owner. However, the assessed SOEs are caught up in a dichotomy, whereby, they are expected to operate commercially and become financially independent, yet they have limited autonomy in the running of their operations. Despite their commercial mandates, SOEs are generally seen as the extension of the government, with their boards of directors set up in a way that leads to undue political interference in the day-to-day operation of SOEs.
68. Currently, SOE boards are largely disempowered, with most decisions subject to government approval. These include case-by-case approval of bank overdrafts and guarantees, external travel by management, quarterly approval of budget, and determination of salary structures, among others, some of which are embedded in the regulatory frameworks. This is partly attributable to the fact that boards of directors and executive managements have underperformed in the past, in some cases leading to bailouts of SOEs. However, the lack of independence, with boards and executive managements taking directions from the state on how to run their business, removes the incentive to improve performance, instead expecting bailouts. In discussions, it was revealed that SOEs usually expect bailouts from the GoM when they fail to repay their debt. This can also create moral hazards for the private sector—sending a negative message to lenders that SOEs will always be bailed out and hence encourages excessive lending to SOEs or lending to SOEs with weak financial position.
69. In addition, SOE boards have little diversity of skills and limited number of independent directors, especially from the private sector. Although some of the board members have considerable relevant technical education and experience, including experience in the private sector, some do not. This, coupled with the current poor performance of SOEs, does little to instill confidence in potential private sector financiers. The risk of political interference in the management of SOEs and the risk of sudden removal of board members if the political administration changes after an election are also sources of concern for financial markets.
70. The oversight function of SOEs in Malawi is fragmented, with the role split between the MoF, the Office of the President and the Cabinet (OPC; the Department of Statutory Corporations - DSC), and the line ministries, with some overlap. The Public Finance Management Act (PFMA) provides the MoF with a financial oversight role, while the DSC has control over administrative and human resource matters and the Public Sector Reform Department, also within the OPC, deals with reforms in the statutory bodies. The line ministries provide oversight of technical issues, compliance with sectoral policies, and tariff adjustments. While the PFMA provides the MoF with a financial oversight role, the mandate of its department, the Public Enterprises Reform and Monitoring Unit (PERMU), is not backed by provisions in the PFMA or other Treasury regulations. The IMF assessment finds that there is limited financial and human capacity within the PERMU.

MALAWI: MOBILIZING LONG-TERM FINANCE FOR INFRASTRUCTURE
53
SOEs are performing noncommercial mandates that are not clearly defined and funded.
71. The assessment shows that SOEs are carrying out a combination of commercial and noncommercial mandates, with no clear framework of how noncommercial mandates should be funded. MHC is expected to provide affordable housing and given its previous legal status as a noncommercial parastatal, its rental rates have been capped by the GoM and rental increases have been subject to government approval. As of 2018, MHC’s rental rates were about 20 percent below the market rate, partly contributing to the losses MHC has been making on its rental business. The Malawi Housing Corporation Act of 1964 was amended in 2016 by Act No. 27 to mandate the corporation to act as a commercial SOE, effectively corporatizing it with a board of directors, granting it borrowing powers subject to the conditions of the PFMA, and allowing entering into JVs with the private sector and management/agency agreements. If MHC is to succeed as a commercial entity, it must be given incentives to succeed. This should include ensuring that any assigned noncommercial mandates do not have a negative impact on its financial performance.
72. Similarly, water utilities will need to substantially increase investments in sewerage and sanitation services, which is usually not profitable. While cross-subsidization between these services and water supply services is to a certain extent possible, government funding for expanding these services, especially by water utilities with a wider rural coverage, will also be required.
Tariffs do not always cover costs…partly due to adjustments of tariffs for affordability and partly due to inefficient operations of the utilities.
73. Commercial SOEs must be able to cover all operational costs from internally generated funds and preferably make a substantial contribution to capital investment. This requires a combination of adequate tariffs and operational efficiency. In Malawi, it is clear that given the level of poverty, it is not possible for users to afford tariffs that can cover all costs (OPEX and CAPEX). For example, the tariff methodology of MERA (the energy sector regulator) is designed to ensure tariffs are cost-reflective but decisions are also subjected to other tests such as the ability of consumers to pay. This means utilities in Malawi must operate in an environment where sharp increases in tariff are not possible. This necessitates improvement in operational efficiency, including reduction in operational losses (technical and commercial) and staff costs and improvement in revenue collection efficiency.
74. The analysis of SOEs’ operations shows that inefficient management plays a big role in their inability to cover costs. Of the two electricity utilities, only EGENCO is able to meet its operational cost from tariffs though it is not able to sufficiently contribute to CAPEX. ESCOM’s operations are not efficient; hence, tariffs do not cover even operational costs. In 2017/18, ESCOM’s staff costs almost doubled compared to the previous year. Total operational losses stood at 20.9 percent in 2017/18 and recent data show current total losses have increased to 22 percent (5 percent for transmission losses and 17 percent for distribution losses). Consequently, MERA approved a base tariff in 2018 that is 60 percent below the tariff that was requested by ESCOM. MERA’s decision factored in that ESCOM (a) has massive overheads, especially associated with staff cost; (b) has not been efficient in collecting outstanding debt; and (c) provided unrealistic revenue projections. This conveys a message to ESCOM to implement internal reforms to become more cost-efficient.
75. Out of the three water SOEs, only LWB and NRWB are able to cover operational costs from tariffs and service long-term concessionary loans. However, tariffs are not adequate to substantially contribute to

MALAWI: MOBILIZING LONG-TERM FINANCE FOR INFRASTRUCTURE
54
CAPEX. Both utilities suffer from high levels of nonrevenue water (NRW)69—at 36 percent and 33 percent, respectively, as of the end of 2017/18. BWB’s current tariff is not adequate to maintain it as a financially healthy utility without external assistance. BWB’s poor operational and financial performance is a combination of inefficiencies (with aging pipes/frequent pipe breaks and NRW at 39 percent as of the end of 2017/18) and low tariffs, which are difficult to increase in a context of poor service delivery. It should be noted that BWB’s biggest challenge is the high cost of pumping water from the current water source (Walker Ferry) on the Shire Valley. The long distance from the water source (40 km from Blantyre) and the high head (800 meters) translates to high energy cost of pumping water—at 41 percent of BWB’s gross revenue in 2017/18. With staff cost and debt servicing cost amounting to 45.5 percent and 13.8 percent of gross revenue, respectively, BWB is left in a loss-making position. In this situation, it is not surprising that maintenance is inadequate, staff are demoralized, and customer service is poor.
76. A critical aspect for water utilities requiring the attention of the GoM is the lack of an independent regulator for economic regulation and the performance of utilities. The setting of water tariffs should be transparent, so that consumers can appreciate water utilities’ challenges (including their costs in providing water). In 2018, the GoM reversed the approved water tariffs for LWB, resulting in a refund of MWK 1.6 billion to customers. The responsible minister deemed the price increase illegal due to incorrect procedures being followed, especially as far as customer notification is concerned.
77. As highlighted earlier, MHC rental rates are below market rate. As a commercial SOE, MHC should be allowed to charge market rates. This will provide sufficient resources to improve maintenance, especially planned maintenance, and increase capacity to develop new housing units. A concerning aspect at the operational level for MHC currently is the low collection rates of rents, ascribed to unwillingness of tenants to pay rent due to inadequate maintenance of the housing units (only 2.8 percent of total costs relate to planned and responsive maintenance of the housing stock). MHC is gradually phasing in rental rate increases, considering affordability for tenants. It should also be noted that MHC operations are not efficient, and the management needs to undertake internal reforms to improve efficiency. Staff costs are high—about 47.0 percent of total expenditure compared to only 2.8 percent for maintenance cost. In addition, land encroachment (due to lack of development and protection/fencing of prime land) is a problem MHC faces, eroding the value of some of its land assets.
78. RFA is an efficient SOE with 10 years of clean audits and is able to cover all operational costs without subsidies from the GoM and contribute to CAPEX. The main source of funding for the Roads Fund is a fuel levy charged on all petrol and diesel imported into Malawi and accounts for over 80 percent of the revenue. As of 2018, the levy was just below MWK 100 per liter (US¢13 per liter) for both petrol and diesel. The levy shows limited variations and is a dependable source of revenue with RFA estimating the volatility to be below 1.5 percent. Fuel revenue posted a double-digit CAGR of about 25 percent between 2010 and 2018. This revenue is supplemented by a road user charge on cars entering Malawi and interest earned on surplus amounts since the fund operates with substantial cash reserves. Another source of revenue is the international transit fees and road access fee on foreign-registered vehicles.
69 NRW is water that has been produced and is ‘lost’ before it reaches the customer. NRW consists of physical (through leaks, sometimes) and commercial losses (non-billed and non-collected revenue) through theft, inadequate data basis/meter inaccuracies, and so on.

MALAWI: MOBILIZING LONG-TERM FINANCE FOR INFRASTRUCTURE
55
SOEs have liquidity challenges, largely attributable to the high receivables from the GoM and its agencies
79. Liquidity will play an important role for SOEs to access market finance. SOEs have substantial outstanding amounts of receivables for services rendered. In most cases, receivables are dominated by the GoM/MDAs and comprise up to 18 percent of the asset value. As Table 10 shows, SOEs have low quick ratios and debtor days averaging 174 days, indicating inability to meet short-term liabilities. Days cash on hand for the majority of SOEs (except for LWB and EGENCO) are also low (below 15 days on average), compared to the recommended 90–180 days for healthy companies. RFA is generally more liquid than other entities but is also suffering from high levels of receivables (at 17.2 percent of total assets in 2018). It should be noted that by the end of 2018/19, RFA’s outstanding receivables had more than doubled to about MWK 12.6 billion (US$17 million), although the debtors’ days had decreased to 65 days and quick ratio increased to 3.5.
80. These levels of unpaid bills deny the SOEs the working capital they need, forcing them to conclude expensive short-term overdraft facilities. NRWB took an overdraft facility of MWK 609 million (~US$831,467) from the National Bank in 2018 to cover liquidity shortfalls. BWB also has an overdraft facility of MWK 900 million (~US$1.2 million) at an annual interest rate of 25 percent, of which MWK 670 million (US$914,751) was utilized at the end of 2017/18. High working capital requirements and steep bank interest rates leave little room to cover capital charges for further investments. ESCOM also relies on expensive overdrafts. This reinforces the need for the government to settle its outstanding debt and for special efforts on the part of the SOEs to improve credit control and collections. Efforts by SOEs should include improvements in technology/data quality to improve efficiency of collection and installation of prepaid meters.
Table 10: Comparison of select liquidity and asset efficiency indicators of SOEs (2018)
BWB EGENCO ESCOM NRWB LWB MHC RFA
Average debtors' days70 130 259 119 194 213 129 122
Outstanding receivables (MWK billions) 4.90 30.00 29.20 3.9 10.00 1.77 6.16
Outstanding receivables (US$, millions) 6.69 40.96 39.87 5.32 13.65 2.41 8.41
Quick ratio71 0.23 1.35 0.05 (0.12) 0.09 0.02 2.16
Source: SOEs’ financial statements
70 The number of days that a company takes to collect cash from debtors, which is indicative of the SOE’s liquidity position and its collection efficiency. 71 A measure of how well a company can meet its short-term financial liabilities. A healthy company should have a quick ratio of above 1.
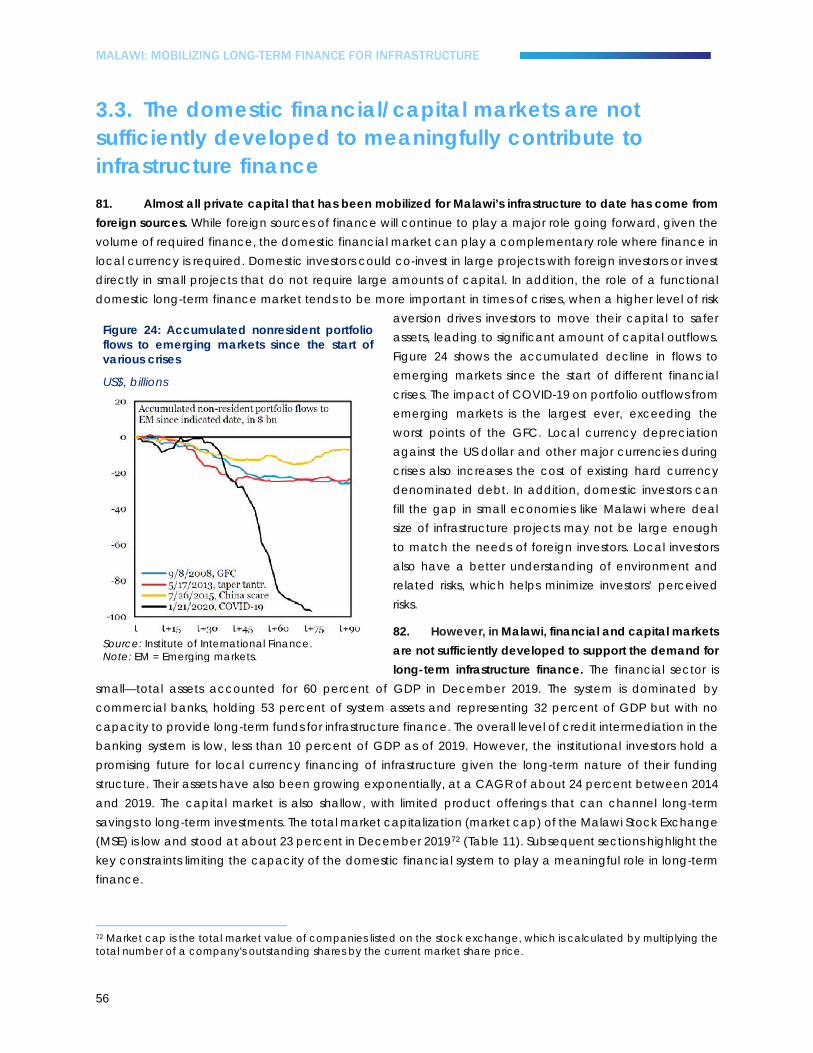
MALAWI: MOBILIZING LONG-TERM FINANCE FOR INFRASTRUCTURE
56
3.3. The domestic financial/capital markets are not sufficiently developed to meaningfully contribute to infrastructure finance 81. Almost all private capital that has been mobilized for Malawi’s infrastructure to date has come from foreign sources. While foreign sources of finance will continue to play a major role going forward, given the volume of required finance, the domestic financial market can play a complementary role where finance in local currency is required. Domestic investors could co-invest in large projects with foreign investors or invest directly in small projects that do not require large amounts of capital. In addition, the role of a functional domestic long-term finance market tends to be more important in times of crises, when a higher level of risk
aversion drives investors to move their capital to safer assets, leading to significant amount of capital outflows. Figure 24 shows the accumulated decline in flows to emerging markets since the start of different financial crises. The impact of COVID-19 on portfolio outflows from emerging markets is the largest ever, exceeding the worst points of the GFC. Local currency depreciation against the US dollar and other major currencies during crises also increases the cost of existing hard currency denominated debt. In addition, domestic investors can fill the gap in small economies like Malawi where deal size of infrastructure projects may not be large enough to match the needs of foreign investors. Local investors also have a better understanding of environment and related risks, which helps minimize investors’ perceived risks.
82. However, in Malawi, financial and capital markets are not sufficiently developed to support the demand for long-term infrastructure finance. The financial sector is
small—total assets accounted for 60 percent of GDP in December 2019. The system is dominated by commercial banks, holding 53 percent of system assets and representing 32 percent of GDP but with no capacity to provide long-term funds for infrastructure finance. The overall level of credit intermediation in the banking system is low, less than 10 percent of GDP as of 2019. However, the institutional investors hold a promising future for local currency financing of infrastructure given the long-term nature of their funding structure. Their assets have also been growing exponentially, at a CAGR of about 24 percent between 2014 and 2019. The capital market is also shallow, with limited product offerings that can channel long-term savings to long-term investments. The total market capitalization (market cap) of the Malawi Stock Exchange (MSE) is low and stood at about 23 percent in December 201972 (Table 11). Subsequent sections highlight the key constraints limiting the capacity of the domestic financial system to play a meaningful role in long-term finance.
72 Market cap is the total market value of companies listed on the stock exchange, which is calculated by multiplying the total number of a company's outstanding shares by the current market share price.
Figure 24: Accumulated nonresident portfolio flows to emerging markets since the start of various crises
US$, billions
Source: Institute of International Finance. Note: EM = Emerging markets.

MALAWI: MOBILIZING LONG-TERM FINANCE FOR INFRASTRUCTURE
57
Table 11: The size of the financial sector in Malawi
December
2018 (US$, billions)
December 2019
(US$, billions)
Percent of total system
assets (2019)
Percent of GDP (2019)
Commercial banks 2.28 2.55 52.51 31.66
Pension 0.98 1.18 24.40 14.71
Insurance 0.91 1.06 21.89 13.19
General insurance 0.07 0.08 1.55 0.93
Life insurance 0.85 0.99 20.34 12.26
Microfinance institutions 0.05 0.06 1.20 0.72 Total financial system assets (US$, billions) 4.22 4.85 100.00 60.28
Total financial system assets (MWK, billions) 3,093.20 3,599.00
Total equity market cap to GDP 23.13 Source: World Bank staff based on RBM Data.73
Global banks and some regional banks play a major role in infrastructure finance…Malawian banks lack long-term liquidity to match the long-term nature of infrastructure assets.
83. Globally, including in some EMDEs, bank lending to infrastructure projects is relatively robust. The 2019 World Bank report on PPI74 shows that commercial debt (mainly debt raised from commercial banks) plays a significant role in financing infrastructure in EMDEs. About US$15.6 billion of commercial debt was raised in 2019, of which 99 percent was from commercial banks). In addition, about 95 percent of this debt was raised in the domestic markets (Figure 25 and Figure 26), mainly in more advanced markets in East Asia and Pacific, the South Asia Region, Eastern and Central Europe, and Latin America and the Caribbean. Most financial markets in the Sub-Saharan Africa region (except in South Africa and to some extent in Nigeria) are underdeveloped and hence their banks play little to no role in infrastructure finance. In 2018, over half of all debt that was raised in Sub-Saharan Africa was provided by local banks, driven by the South African banks.75 In 2019, none of the infrastructure debt raised in Sub-Saharan Africa was from local banks.
73 US dollar values converted from Malawian kwacha values using 2018 and 2019 average exchange rates of 732.33 and 742.23, respectively. 74 https://ppi.worldbank.org/content/dam/PPI/documents/private-participation-infrastructure-annual-2019-report.pdf 75 The South African capital market is the most developed in Africa and can serve the long-term financing needs of infrastructure. This explains the dominance of South African banks in infrastructure finance in the region.

MALAWI: MOBILIZING LONG-TERM FINANCE FOR INFRASTRUCTURE
58
Figure 25: Commercial and development and export finance institutions (DEFIs)/public debt for projects with private participation
US$, billions
Figure 26: Local and international commercial debt
Percent of total commercial debt
Source: World Bank PPI Annual Report (2019). World Bank PPI Annual Report (2019).
84. Malawian banks are not playing a notable role in infrastructure finance. The level of credit intermediation by the banking system in Africa is generally low but the problem is much more pronounced in Malawi. The banking sector in Malawi is dominated by the two largest banks—the National Bank of Malawi and Standard Bank—holding about 46 percent of total banking sector deposits, 44 percent of total loans, and 41 percent of total liabilities.76 Figure 28 shows that only 32 percent of total bank assets went to private sector lending as of December 2019, which is very low. Lending is also concentrated among a few borrowers—59 percent of all loans is lent to the top 10 borrowers in the market.77 The largest single borrower in the market has an outstanding loan of 67 percent of core capital of its lender (compared to the RBM’s limit of 25 percent) and 21 percent of core capital of the entire system, which amounted to MWK 215 billion (US$290 million) as of December 2019. The largest outstanding loan of one of the smaller banks was 116 percent of core capital.
85. These levels of concentration require attention, especially since several banks also have exposures to the same large borrowers, elevating risks in the system. The high concentration of loans in a few firms is attributable to the small size and the undiversified nature of the Malawian economy. There is also a limited number of entities that offer good business opportunities to banks. The RBM regulation allows banks to book exposures beyond their single obligor limits (in strategic sectors/needs of the country).78 These waivers have amplified credit concentration risks, and the Financial Sector Assessment Program (FSAP) recommended phasing them out to reduce risks. The regulation encourages banks to work together to syndicate large loans (which will become even more important in infrastructure finance given the size of infrastructure deals). However, this is not yet a practice, and the current state, in which banks are already exposed to the same large borrowers limits the extent to which banks can syndicate.79 Effective January 2010, the RBM raised the minimum paid-in capital to MWK 10 billion (about U$13.5 million), which should improve the ability of banks (especially small banks) to book large exposures and reduce the need for waivers.
76 Malawi has a total of nine commercial banks. 77 Calculated based on the list of top 10 borrowers of each bank. Some borrowers have loans with multiple banks. 78 The Large Exposures and Credit Concentration Limits for Banks Directive (2012) allows the registrar to waive the 25 percent credit concentration limit only if “the credit facility is in respect of exports from Malawi, is secured by eligible government guarantee, or is in respect of a product or service of strategic national importance.” 79 In fact, as part of their application for the waiver of the 25 percent concentration limit, banks are required to provide evidence that syndication of the credit facility with other banks has failed.
15.0818.0918.46
15.63
2018 2019
DEFI/Public Commercial (Banks, Institutions)
84% 95%
16% 5%
2018 2019
Local International)

MALAWI: MOBILIZING LONG-TERM FINANCE FOR INFRASTRUCTURE
59
86. In the immediate future, the RBM should phase out and eventually stop giving waivers against syndication. This will help create the culture of syndication in the market and later facilitate financing of large infrastructure projects. The current situation in the banking system also points to the need to deepen the capital market as an avenue for large companies to raise capital and diversify from bank loans. The country’s efforts to diversify the economy by investing in the energy, mining, tourism, and other sectors should provide more options for banks in the future and reduce concentration of exposures.
87. Despite the high levels of loan concentration in the system, all banks are well capitalized. At the end of December 2019, the average core capital ratio for the industry stood at 17 percent of risk weighted assets compared to the regulatory minimum of 10 percent while the total capital ratio stood at 21 percent compared to RBM’s minimum threshold of 15 percent.80 Banks are also liquid, with liquidity ratios well above the prudential benchmark. In December 2019, the liquidity ratio stood at 58.9 percent compared to the prudential minimum threshold of 25 percent (Annex 2).
88. The current limited lending to the private sector is partly attributable to the crowding-out effect of government borrowing and high cost of borrowing. On average, banks allocate 42 percent of their assets to securities and investments (Figure 28). This also contributed to the high cost of borrowing. Since yield on government securities started to decline in 2017, banks’ portfolio has slightly shifted (Figure 29). Allocations to treasury bills grew at a slower rate between 2017 and 2019 (a CAGR of 14 percent) compared to 22 percent between 2015 and 2017. Allocations to longer-term government bonds (which offer higher yields) saw a significant jump—a CAGR of 43 percent between 2017 and 2019 compared to −2 percent between 2015 and 2017. Similarly, the lending portfolio grew fast between 2017 and 2019 at a CAGR of 13 percent compared to 2 percent between 2015 and 2017.
80 Malawi is still operating under Basel 2. However, the minimum regulatory thresholds of the RBM are higher than those under Basel 3.
Figure 27: Commercial banks’ sources of funds and deposits maturity structure
December 2019
Figure 28: Commercial banks' asset composition and loan maturity structure
December 2019
Source: World Bank staff based on RBM data. Source: World Bank staff based on RBM data.

MALAWI: MOBILIZING LONG-TERM FINANCE FOR INFRASTRUCTURE
60
Figure 29: Banks' investments in government securities and loans (2015–19)
MWK, billions
Source: RBM.
89. Banks are not lending long term. The funding structure of banks is heavily skewed toward the short end, discouraging undertaking of profitable investments with long time horizon. Deposits (with very short maturities) remain the main source of bank funding, constituting about 65 percent of all liabilities. About 100 percent of deposits as of December 201981 had maturities of less than one year (Figure 27) compared to an investment horizon of 10–30 years for infrastructure. With this funding structure, banks’ capacity to undertake maturity transformation is limited. Consequently, lending is largely short term; 51 percent of all loans have maturities of less than one year and only 4 percent have maturities of over six years. Securities and investments are largely short term (31 percent), mostly government treasury bills, which also have maturities of less than one year (Figure 28).
90. Credit is concentrated in three sectors, which reflects the structure of the economy: wholesale and retail (23 percent), agriculture (19.3 percent), and manufacturing (13.9 percent) (Figure 30). There is some corporate lending to infrastructure sectors and other sectors that require long-term funds. As of December 2019, lending to the electricity/energy, water, and gas sectors stood at 7 percent of total outstanding loans in the system, while lending to construction, real estate, and mining/quarrying constituted 3.1 percent, 1.7 percent, and 0.4 percent, respectively. While these levels of lending are low, these sectors have posted the highest growth in the past five years (Figure 31). Although this is traditional corporate finance (financing of infrastructure is usually undertaken through project finance and requires specific skills), it shows the interest of banks to lend to infrastructure if long-term liquidity would be available. Infrastructure is usually financed by a significant amount of debt (at least 70 percent of total project costs). Most of the debt, especially during the construction phase of infrastructure, is financed by banks. Banks are also better equipped to manage construction risk and have specialized teams that can monitor project risks. In addition, during construction (before the project starts generating cash flow), it is difficult to float any bonds in the market—unlike bank loans, bonds do not allow for gradual disbursement of funds in line with the needs of an infrastructure project.
81 This ratio was 99 percent in December 2018.
142.3 190.9 260.6 348.1 388.623 2.221.7
61.1 62.9397.2 417.7422.1
491.2609.9
2015 2016 2017 2018 2019
Treasury Bills Government Bonds Loans
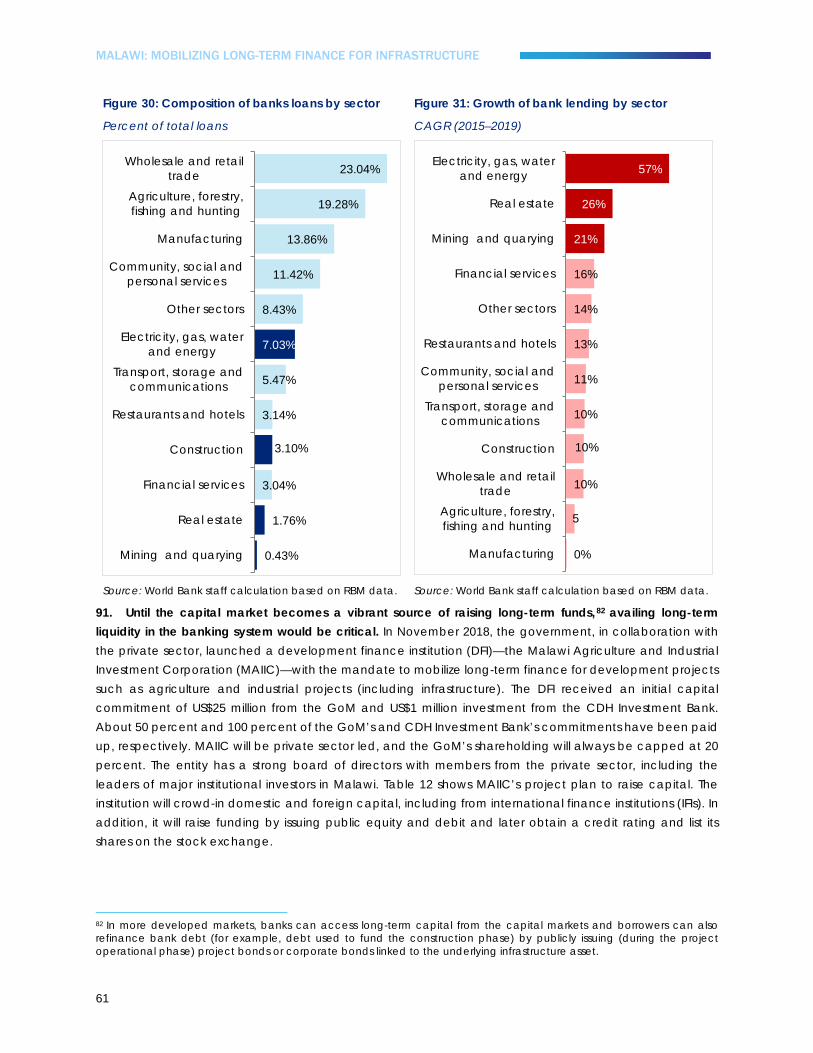
MALAWI: MOBILIZING LONG-TERM FINANCE FOR INFRASTRUCTURE
61
Figure 30: Composition of banks loans by sector
Percent of total loans
Figure 31: Growth of bank lending by sector
CAGR (2015–2019)
Source: World Bank staff calculation based on RBM data. Source: World Bank staff calculation based on RBM data.
91. Until the capital market becomes a vibrant source of raising long-term funds,82 availing long-term liquidity in the banking system would be critical. In November 2018, the government, in collaboration with the private sector, launched a development finance institution (DFI)—the Malawi Agriculture and Industrial Investment Corporation (MAIIC)—with the mandate to mobilize long-term finance for development projects such as agriculture and industrial projects (including infrastructure). The DFI received an initial capital commitment of US$25 million from the GoM and US$1 million investment from the CDH Investment Bank. About 50 percent and 100 percent of the GoM’s and CDH Investment Bank’s commitments have been paid up, respectively. MAIIC will be private sector led, and the GoM’s shareholding will always be capped at 20 percent. The entity has a strong board of directors with members from the private sector, including the leaders of major institutional investors in Malawi. Table 12 shows MAIIC’s project plan to raise capital. The institution will crowd-in domestic and foreign capital, including from international finance institutions (IFIs). In addition, it will raise funding by issuing public equity and debit and later obtain a credit rating and list its shares on the stock exchange.
82 In more developed markets, banks can access long-term capital from the capital markets and borrowers can also refinance bank debt (for example, debt used to fund the construction phase) by publicly issuing (during the project operational phase) project bonds or corporate bonds linked to the underlying infrastructure asset.
0.43%
1.76%
3.04%
3.10%
3.14%
5.47%
7.03%
8.43%
11.42%
13.86%
19.28%
23.04%
Mining and quarying
Real estate
Financial services
Construction
Restaurants and hotels
Transport, storage andcommunications
Electricity, gas, waterand energy
Other sectors
Community, social andpersonal services
Manufacturing
Agriculture, forestry,fishing and hunting
Wholesale and retailtrade
0%
5
10%
10%
10%
11%
13%
14%
16%
21%
26%
57%
Manufacturing
Agriculture, forestry,fishing and hunting
Wholesale and retailtrade
Construction
Transport, storage andcommunications
Community, social andpersonal services
Restaurants and hotels
Other sectors
Financial services
Mining and quarying
Real estate
Electricity, gas, waterand energy
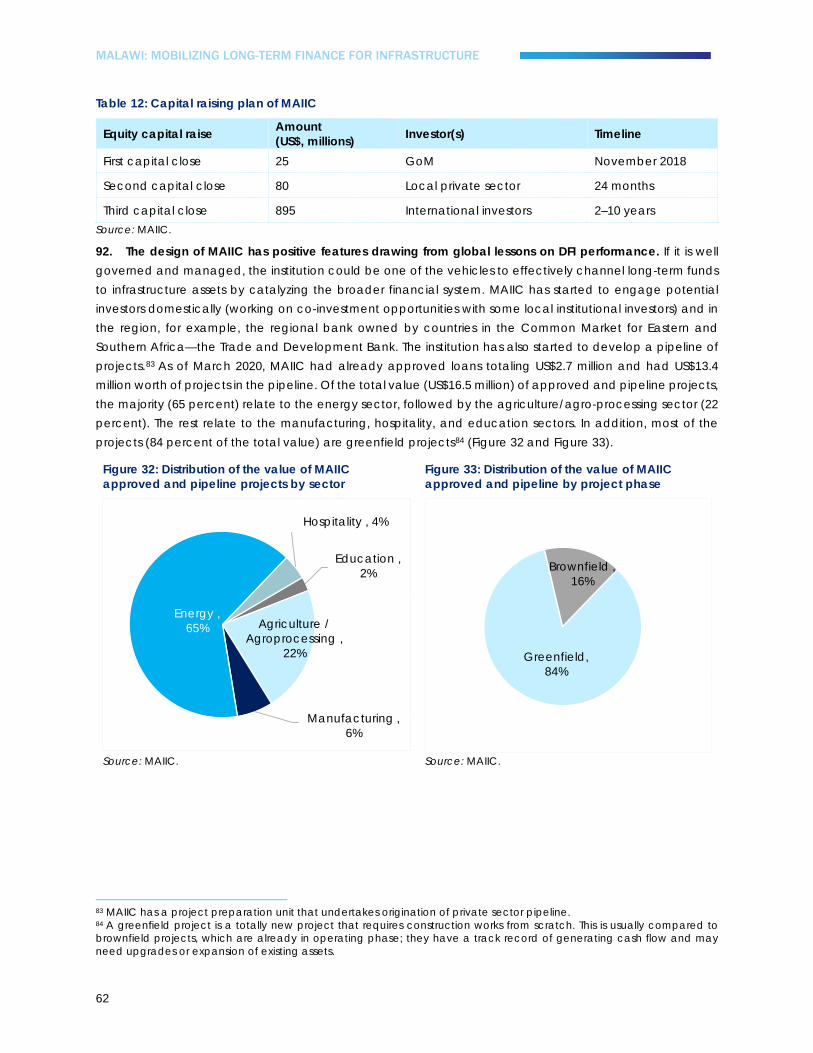
MALAWI: MOBILIZING LONG-TERM FINANCE FOR INFRASTRUCTURE
62
Table 12: Capital raising plan of MAIIC
Equity capital raise Amount (US$, millions) Investor(s) Timeline
First capital close 25 GoM November 2018
Second capital close 80 Local private sector 24 months
Third capital close 895 International investors 2–10 years Source: MAIIC.
92. The design of MAIIC has positive features drawing from global lessons on DFI performance. If it is well governed and managed, the institution could be one of the vehicles to effectively channel long-term funds to infrastructure assets by catalyzing the broader financial system. MAIIC has started to engage potential investors domestically (working on co-investment opportunities with some local institutional investors) and in the region, for example, the regional bank owned by countries in the Common Market for Eastern and Southern Africa—the Trade and Development Bank. The institution has also started to develop a pipeline of projects.83 As of March 2020, MAIIC had already approved loans totaling US$2.7 million and had US$13.4 million worth of projects in the pipeline. Of the total value (US$16.5 million) of approved and pipeline projects, the majority (65 percent) relate to the energy sector, followed by the agriculture/agro-processing sector (22 percent). The rest relate to the manufacturing, hospitality, and education sectors. In addition, most of the projects (84 percent of the total value) are greenfield projects84 (Figure 32 and Figure 33).
Figure 32: Distribution of the value of MAIIC approved and pipeline projects by sector
Figure 33: Distribution of the value of MAIIC approved and pipeline by project phase
Source: MAIIC. Source: MAIIC.
83 MAIIC has a project preparation unit that undertakes origination of private sector pipeline. 84 A greenfield project is a totally new project that requires construction works from scratch. This is usually compared to brownfield projects, which are already in operating phase; they have a track record of generating cash flow and may need upgrades or expansion of existing assets.
Hospitality , 4%
Education , 2%
Agriculture / Agroprocessing ,
22%
Manufacturing , 6%
Energy , 65%
Greenfield,84%
Brownfield ,16%

MALAWI: MOBILIZING LONG-TERM FINANCE FOR INFRASTRUCTURE
63
Institutional investors around the world are increasingly investing in alternative assets, including infrastructure; in Malawi, long-term investors lack investment opportunities and capacity
93. In the context of tighter regulatory requirements for banks on capital adequacy, regulatory lending limits to single borrower groups, and limitations on maturity transformation,85 the role of institutional investors (pension funds, life insurance companies, mutual funds,86 sovereign wealth funds [SWFs],87 and so on) has become more important in the financing of large and long-term investment projects. Institutional investors have signification amount of long-term assets given the long-term nature of their liabilities. In countries within the OECD alone, pension funds, insurance companies, and investment funds/asset managers held at least US$105 trillion of assets under management (AUM) in 2018 (about 200 percent of OECD GDP). About 58 percent of these assets were held by pension funds and insurance companies.88 SWFs are also growing rapidly—global AUM of SWFs stood at about US$20 trillion in March 2019.89
94. Most institutional investors (especially pension funds and life insurance companies) employ cautious investment strategies. Their first responsibility is to provide adequate payment to their customers/members in the future retirement income for their members; hence, they tend to invest in the traditional listed equities and fixed-income instruments (government securities and high-quality/investment-grade corporate bonds), which may include listed infrastructure assets. 90 The owners of (cash flow-generating) infrastructure in countries with vibrant capital markets can tap into institutional investors’ funds through the public debt market. However, the majority of infrastructure assets are unlisted; hence, investors seeking exposure to infrastructure must learn the art of investing in unlisted infrastructure.
95. Given the low yields on traditional assets experienced by investors in the past years, institutional investors have started to diversify their portfolios and increase allocation to alternative assets (including private equity, real estate, and infrastructure) despite the cost and expertise required to manage them. Performance data from Preqin 91 show that unlisted infrastructure has consistently outperformed other alternative asset classes and listed assets in recent years (Figure 34 and Figure 35).92 In addition to offering better internal rates of return (IRRs) than listed investments, infrastructure assets offer a natural match to long-term liabilities of institutional investors and possibility to diversify portfolios as they tend to yield long-term and
85 Maturity transformation, which is at the core of banking, is the practice of banks to accept shorter maturity deposits and lend out long term. 86 Also known as collective investment schemes. They collect money from various investors (small retail/individual and institutional investors) to invest in various securities such as stocks, bonds, and other money market instruments. 87 SWFs are pools of assets owned and managed directly or indirectly by governments to drive a country’s strategic, economic, and social agenda. SWFs are diverse and can be grouped into three categories: (a) capital maximization funds whose liabilities have long-term (multigenerational) profiles and must maximize capital to meet future liabilities (for example, Ghana Heritage Fund, Nigeria’s Future Generation Fund, and some large public pension reserve funds would fall into this category)—their investment horizon would be long; (b) stabilization funds are set up to mainly manage macroeconomic shocks and provide stability to governments’ revenue streams—these would have short-term investment horizons and invest in liquid assets (short and long-dated bonds, money market instruments, and so on); and (c) economic development funds mainly support national development priorities (for example, infrastructure and other development projects)—they tend to have higher allocations to alternative investments (including infrastructure). SWFs are generally funded from a range of sources, including proceeds of commodity exports, fiscal or trade surpluses, privatization proceeds, and pension funds surpluses. 88 World Bank staff calculation based on data from OECD, Australia Bureau of Statistics. and Statista. 89 Invesco (2019); Invesco Global Sovereign Asset Management Study 2019. 90 With listed securities, investors are able to access adequate information about securities they would like to invest in, which makes pricing and performance monitoring easier. 91 Preqin is a global research firm that provides financial data and information on the alternative assets market. 92 Higher returns compensate for illiquidity risk and information asymmetry because most infrastructure assets are unlisted. There is lack of industry standard and benchmarks that can help monitor asset performance. Managing infrastructure assets is therefore complex and investors must ensure availability of relevant expertise.

MALAWI: MOBILIZING LONG-TERM FINANCE FOR INFRASTRUCTURE
64
predictable cash flows and have low correlation with traditional assets in existing portfolios of institutional investors.
Figure 34: Horizon IRRs
Unlisted infrastructure versus public markets
Figure 35: Preqin indexa
Unlisted infrastructure versus public markets
Source: Preqin. Source: Preqin. Note: a. The index tracks performance of closed-end
unlisted infrastructure funds across all vintage years and captures, in index form, the average returns earned by investors, based on the actual amount of capital.
96. Institutional investors’ allocations to alternative assets (including infrastructure) have been growing in the recent decade. For example, according to a 2018 study of the Thinking Ahead Institute of Willis Towers Watson, allocation of pension assets in seven key markets (Australia, Canada, Japan, the Netherlands, Switzerland, the United Kingdom, and the United States) has significantly changed between 1998 and 2018. Allocation to listed equities reduced from 60 percent to 40 percent while allocations to other assets (real estate and other alternatives) increased from 7 percent to 26 percent (Figure 36). According to Preqin, private and public pension funds are currently the main players in infrastructure investments (Figure 37). Australian and Canadian pension funds are the most experienced investors in infrastructure finance in the world. They have over US$1.9 trillion and US$2.7 billion (about 141 percent and 155 percent of 2018 GDP), respectively, third and fourth after pension funds in the United States (US$27.6 trillion) and United Kingdom (US$2.8 trillion) (OECD 2020), and have the highest allocations to alternative assets, particularly infrastructure. While globally 82 percent of pension funds allocate less than 5 percent of their assets to infrastructure, 55 percent of Australia’s superannuation (compulsory) schemes allocate between 5 percent and 10 percent, and 14 percent of the funds allocate over 10 percent (Figure 38).
10.3%7.5%
0.9%
7.2%
27.5%
2.3%0%
5%
10%
15%
20%
25%
30%
1 Year to Jun-18
3 Years to Jun-18
5 Years to Jun-18
Infrastructure
S&P GlobalInfrastructure Index TR
S&P Global Oil IndexTR

MALAWI: MOBILIZING LONG-TERM FINANCE FOR INFRASTRUCTURE
65
Figure 37: Investors in infrastructure by type, 2015 versus 2019
Source: Preqin.
Figure 36: Aggregate asset allocation of 7 key markets (1998–2018)
Source: Thinking Ahead Institute.

MALAWI: MOBILIZING LONG-TERM FINANCE FOR INFRASTRUCTURE
66
Figure 38: Current allocations to alternative assets by asset class: Australian superannuation schemes vs. Global Pension Funds (percentage of total assets)
Source: Preqin.
97. Investors employ different investment strategies such as direct investing (including co-investing )93 and through intermediaries/investment vehicles. Direct investing requires relatively large capital contributions and significant due diligence efforts and expertise. The infrastructure asset class is heterogeneous, and investments have different risk/return characteristics, creating complexities for direct investors. Large institutional investors have the resources and can develop in-house expertise—teams of experts to source assets and finance and manage the investments. A number of co-investment platforms such as the Global Strategic Investment Alliance in Canada and IFC’s Managed Co-Lending Portfolio Program have been created to facilitate efficient flow of capital from large institutional investors, eliminating the need to use intermediaries.
98. Smaller investors have limited capacity and require specialized pooled investment vehicles94 to access infrastructure investments. These include various forms of equity95 and debt infrastructure vehicles. In light of more stringent rules on capital adequacy for banks, infrastructure debt funds offer an alternative to traditional bank debt with longer maturities. Pooled investment vehicles, especially those modelled for like-minded investors—for example, those with long-term investment horizons and looking for stable, predictable, low-risk returns—provide investors with confidence regarding the alignment of interest and can unlock large amounts of capital for infrastructure. In some cases, governments have collaborated with the private sector
93 Direct investments are those made directly in unlisted infrastructure assets without the need to utilize a fund manager for the due diligence process. Co-investing is a form of direct investment in which an investor makes a minority investment directly into an asset, alongside an infrastructure manager or other investors without having to pay fund management fees while having higher control over the assets. 94 These are SPVs or funds established for pooling other investors’ money into a single fund with specialized teams that have expertise in targeted sectors. However, mingling funds with other investors’ funds means investors lose control of the underlying investments. Majority of pension funds and life insurance companies are concerned about misalignment of interests between the investors and most of the existing funds. For example, most of the existing funds have short-term horizons (majority are close-ended funds with maturities of 10 years versus at least 30 years of long-term investors). 95 Infrastructure equity investments usually offer lower correlation to markets and the broader economy while increasing portfolio diversification whereas infrastructure debt can offer stable cash flows and long duration at attractive fixed returns.

MALAWI: MOBILIZING LONG-TERM FINANCE FOR INFRASTRUCTURE
67
and other stakeholders through various mechanisms to facilitate the flow of institutional investors’ funds to infrastructure. These have ranged from facilitating the setting up of investment platforms (and in some cases providing seed capital) to improving the regulatory environment to enable long-term investments.96
99. For most investors, diversification also includes allocations to foreign assets, including assets in EMDEs. Global institutional investors, especially from Canada, Australia, the United States, and South Africa, are investing in African infrastructure assets. However, African leaders are calling for more regional investments from African institutional investors. A number of institutional investors (including pension funds, insurance companies, mutual funds, and SWFs) have emerged in the past decade (Table 13 to Table 16). A variation of SWFs—Strategic Investment Funds (SIFs)—have emerged in the past decade. These are government-owned or public-private funds that adopt private investment funds models for development purposes and crowd-in private investors, to co-invest either at the fund or project level. Well-structured SIFs operate as expert investors on behalf of their sponsors and provide long-term patient capital, primarily equity and may also invest in quasi-equity or debt.97
100. The majority of Africa’s institutional investors’ assets are held by pension funds and life insurers and are concentrated in South Africa. The Government Employees Pension Fund (GEPF) of South Africa is the largest pension fund in Africa with AUM of US$132 billion as of 2019 while Old Mutual and Sanlam are the largest insurance companies in the region with a total of about US$129 billion of AUM between them. Several countries (including Angola, Senegal, and Botswana) have set up SWFs or SIFs for strategic investments in development projects and for preservation of wealth for future generations.
101. The African institutional investors have been instrumental in deepening the capital market by providing liquidity and have helped strengthen the financial system in some African countries. Majority of these institutions are investing in listed stocks, government bonds, and private bonds and have a preference in domestic assets, although some are active across borders. Old Mutual and Sanlam have a strong African presence with subsidiaries in a number of Eastern, Western, and Southern African countries (including Malawi). Old Mutual also has significant experience in infrastructure finance through its infrastructure fund—the Africa Infrastructure Investment Managers (AIIM). AIIM has about US$1.9 billion of AUM and it invests in unlisted infrastructure in Southern, Eastern, and Western Africa, including in toll roads, power generation/ renewable energy, ports, and ICT assets. The GEPF is largely a domestic investor (92 percent to total assets), and 94 percent of its assets are allocated to listed securities. However, the fund is seeking to increase its investments outside South Africa and allocation to alternative assets to reduce the risk of exposure to domestic assets. Most funds plan to diversify investments outside South Africa after posting low returns (Table 17), partly due to low GDP growth, the downgrade of the sovereign credit rating which diminished the investor’s confidence, and domestic political uncertainty (coupled with geopolitics related to the US-China trade wars). Old Mutual possesses a wealth of experience at home and could transfer such capacity to its subsidiary in Malawi.
102. Most African SWFs or SIFs invest domestically, for example, Senegal’s Fonds Stratégique d’Invéstissments (FONSIS SA) and the Nigeria Infrastructure Fund under the Nigeria Sovereign Investment Authority (NISA). However, the Fundo Soberano de Angola (FSDEA) is active outside Angola. Its portfolio is diversified across a number of industries and asset classes, including global private and public stocks, bonds, foreign currencies, financial derivatives, commodities, and infrastructure funds. Initially, the fund focused on investing in the Sub-
96 Because of the sometimes highly political nature of infrastructure investing, it is difficult to remove the influence of the government from any initiative for private institutional infrastructure investment, which emphasizes the need for collaboration between the various parties to achieve the desired outcomes (OECD 2014). 97 World Bank. 2019. Strategic Investment Funds: Challenges and Opportunities.

MALAWI: MOBILIZING LONG-TERM FINANCE FOR INFRASTRUCTURE
68
Saharan Africa hospitality sector (hotels infrastructure), but private equity activities in infrastructure, agriculture, forestry, mining, and health in Sub-Saharan Africa are now emphasized. In June 2017, 57 percent of the fund’s assets were allocated to alternative investments, followed by fixed income (19 percent). In addition, 57 percent of investments were made in Africa followed by Europe (19 percent) and North America (17 percent). These regional institutional investors, with understanding of the risk-return profile of Africa’s infrastructure assets present opportunities for a country like Malawi.
Table 13: Pension assets of select African countries (2018)
Table 14: Assets of select African pension funds (2019)
Country US$, millions
South Africa 500,000 Nigeria 28,136 Namibia 11,628 Kenya 11,452 Botswana 7,358 Egypt 3,965 Ghana 2,700 Malawi 944 Mozambique 91
Pension fund Domicile country
Group AUM (US$, billions)
GEPF South Africa 131.75 Eskom Pension and Provident Fund (EPPF) South Africa 10.29
Government Institutions Pension Fund Namibia 8.34
South African Retirement Annuity Fund South Africa 7.71
Central Retirement Annuity Fund South Africa 7.21
Sentinel Retirement Fund South Africa 5.86 AXA Mansard Pension Nigeria 5.68
Source: OECD and IFC.98 Source: Companies’ financial statements and Global Economic Governance Africa.
98 https://www.ifc.org/wps/wcm/connect/topics_ext_content/ifc_external_corporate_site/sustainability-at-ifc/publications/sba-project-south-africa-pension-fund. 99 The authority manages three sub-funds: (a) the stabilization fund, which was set up to balance the national budget in times of petroleum revenues shortfalls; (b) the future generation fund, which undertakes long-term investment in assets to provide savings for future generations; and (c) the infrastructure fund, which invests in domestic infrastructure development.
Table 15: Life insurance assets of select African countries (2019)
Table 16: Assets of select African SWFs/SIFs
(Latest available data)
Domicile country
Group AUM (US$, billions)
Old Mutual South Africa 74.59 Sanlam South Africa 54.08
Momentum Metropolitan South Africa 35.64
Liberty Group South Africa 32.72
Domicile country
AUM (US$, billions)
Year of data point
FONSIS SAa Senegal 8.56 2017
Pula Fund Botswana 6.90 2016
FSDEA Angola 5.05 2017
NISA99 Nigeria 1.69 2018
Source: Companies’ financial statements. Source: Funds’ annual reports; Global Economic Governance Africa for Pula Fund. Note: a. Mainly invest domestically.

MALAWI: MOBILIZING LONG-TERM FINANCE FOR INFRASTRUCTURE
69
Table 17: Investment returns of select African institutional investors
Minimum target return (%)
Actual return (%)
Year of data point
GEPF n.a. 2.60 2019
EPPF100 Consumer price index (CPI) + 4.50 2.99 2019
Old Mutual Group 17.00 15.20 2019 Sanlam 13.50 11.90 2019 FONSIS SA 12.00 Unknown 2018
NISA Attractive commercial returns 13.80 2018
Source: Annual reports.
103. The institutional investing trends in the global and regional markets provide several lessons for Malawi:
(a) Institutional investors with large amounts of long-term finance can contribute to infrastructure finance and the development of the country. However, infrastructure investing is more complex than investments in traditional asset classes and hence requires enhanced capacity. In addition, pension funds and life insurance companies must pay attention to their fiduciary responsibility.
(b) Given the complexity of direct investment, pooled investment platforms, structured to align with the profile of pension funds’ and life insurance companies’ liabilities is a practical approach to consider. It can address the capacity challenges by investing in specialized infrastructure investment teams and help crowd-in larger amounts of capital. However, the presence of a bankable pipeline of projects is critical for the success of such platforms.
(c) There are a number of African investors that are more likely to invest in bankable projects in Malawi, given their knowledge of risk-return profile of Africa’s infrastructure, which Malawi should target.
Malawian institutional investors have growing pools of long-term funds but lack investment opportunities
104. The institutional investors’ landscape in Malawi is characterized by 29 registered pension funds, of which 22 are private, 6 are quasi-public (public institutions or SOE-linked funds), and 1 is a national public mandatory fund. In addition, there are five life insurance companies, five portfolio managers,101 and two collective investment schemes. Total institutional investors’ assets (including non-pension funds and life insurance-related assets) stood at MWK 1.8 trillion (US$2.5 billion) in 2019 or 32 percent of 2019 GDP (Table 18), of which 85 percent were assets of pension funds and life insurance companies. Assets in the pension and life insurance markets are also concentrated in a few funds/companies. Out of the total pension assets of MWK 878 billion (US$1.18 billion), 57 percent are held by two funds—Old Mutual Unrestricted Fund102 (30 percent) and NICO Unrestricted Fund (27 percent). Asset concentration in the insurance sector is even more pronounced. Two companies—Old Mutual and NICO Life—hold 98.5 percent of total assets, which stood at about MWK 732 billion (about US$1 billion). These two companies have dominated the market since their
100 In 2014, EPPF invested US$30 million into infrastructure projects through private-equity house Abraaj (a Dubai-based private equity firm) and mobile-phone infrastructure through London’s Helios. 101 Portfolio managers manage a range of investments for other institutions (including banks, pension funds and life insurance companies, and other companies), high net worth individuals, collective investment schemes, and so on. The law requires unit trust/collective investment schemes to invest their assets through portfolio/asset managers. 102 These are funds that do not restrict membership of the fund to officers or employees of a specified employer and its related corporates.

MALAWI: MOBILIZING LONG-TERM FINANCE FOR INFRASTRUCTURE
70
establishment. The three smaller players (Vanguard Life, CIC Life, and SMILE Life), which are all relatively new to the market, have struggled to penetrate the market and compete. As a result, they have contributed very little to the development of the market. CIC Life has a niche market in the cooperatives while SMILE Life focuses on group risk business.
105. Institutional investors’ assets have been growing rapidly, driven by the growth of pension assets. Reforms which led to the enactment of the Pensions Act in 2011 have been the main driver of the pension sector growth. Pension funds and life insurance funds in Malawi have been growing rapidly since the launch of the mandatory pension system in 2011. The third largest fund is the Public Service Pension Fund, which was established in 2018 and currently holds 5 percent of the market share. In 2019, the fund’s assets grew by 78 percent. With such growth, it is likely to become the largest fund in the coming years.
Table 18: Institutional investors' assets (2014–19)
MWK, billions
2014 2015 2016 2017 2018 2019 CAGR (%)
Pension and life insurance 470.32 588.29 713.47 1,005.43 1,336.11 1,610.16 23
Pension funds 247.00 312.20 380.80 532.20 716.50 878.26 24
Life insurance companies 223.32 276.09 332.67 473.23 619.61 731.90 22
Portfolio managers, of which: 383.62 481.87 583.33 827.26 1,087.34 1,298.85 23
Pensions and life insurance - 79% 306.34 367.66 444.62 622.70 846.69 1,022.56 18
Companies 15% 53.31 83.44 96.34 140.29 163.49 199.28 21 Collective investment schemes - 1.7% 5.24 7.40 10.33 22.55 20.29 22.00 25
Others - 4% 18.58 23.14 31.47 41.37 56.56 54.63 20
Total institutional investors’ assets 548.00 702.00 852.00 1,210.00 1,577.00 1,886.00 19
Source: World Bank staff calculations based on RBM data.

MALAWI: MOBILIZING LONG-TERM FINANCE FOR INFRASTRUCTURE
71
Figure 39: Allocation of pension funds AUM
2019
Figure 40: Allocation of life insurance AUM
2019
Source: World Bank staff based on RBM data. Source: World Bank staff based on RBM data.
Figure 41: Market cap of listed companies
MWK, trillions
Figure 42: Stock market liquidity
Percent
Source: MSE. Source: MSE.
Note: *MCAP = Market Capitalization.
106. Institutional investors have limited long-term investment opportunities. Despite their long-term liabilities, most of their assets are invested in short-term government securities and bank deposits, accounting for 37 percent of pension assets and 40 percent of life insurance assets, and a handful of listed equities, accounting for about 49 percent and 51 percent of pension and life insurance assets, respectively (Figure 39 and Figure 40). Limited investment options in the formal capital markets are causing institutional investors to search for unlisted investment opportunities in the form of private debt and private equity. Investments in unlisted private debt have been growing faster than private equity investments between 2014 and 2019, at a CAGR of 76 percent compared to a CAGR of 14 percent for private equity investments. Recent data indicate that investors are reallocating assets from government securities to other asset classes given the recent decline in yields on government securities, but options are limited. In 2019, allocation of pension assets to listed equities, unlisted debt, and real estate increased by 52 percent, 48 percent, and 28 percent, respectively,
25.6%
49%
11%
3.5%6.4%
4.1% 0.09%Government Debt
Listed Equity
Cash/FixedDepositsUnlisted Equity
Unlisted Debt
Real Estate
Other Investments
12.1%
1.5%
28.5%50.5%
5.8%Bank depositsand Dues
Real Estate
GovernmentSecurities
Equities
Private Debt
7.44
15.65
1.50
Apr
-16
Aug
-16
Dec
-16
Apr
-17
Aug
-17
Dec
-17
Apr
-18
Aug
-18
Dec
-18
Apr
-19
Aug
-19
Dec
-19
Apr
-20
0.00%
0.20%
0.40%
0.60%
0.80%
1.00%
Jan-
17A
pr-1
7Ju
l-17
Oct
-17
Jan-
18A
pr-1
8Ju
l-18
Oct
-18
Jan-
19A
pr-1
9Ju
l-19
Oct
-19
Jan-
20A
pr-2
0
Total Value of Trades to MarketCapitalisation (TVT/MCAP*)
Total Value of Trades to Gross DomesticProduct (TVT/GDP)

MALAWI: MOBILIZING LONG-TERM FINANCE FOR INFRASTRUCTURE
72
while allocation to government securities declined by 8 percent. At the same time, there was significant growth of fixed deposits—at 67 percent.
107. While listed equities are a preferred home for Malawian institutional investors, they are only a handful. The capital market in Malawi is nascent—there are only 15 listed stocks103 on the MSE with total market capitalization (market cap) of MWK 1.5 trillion (US$2 billion), which is equivalent to 25 percent of GDP (Figure 41). The total market cap declined sharply toward the end of 2018, following the delisting of a bank—the First Merchant Bank Limited—as part of the group restructuring strategy. The group company—FMB Capital Holdings—bought 100 percent of the Malawi subsidiary and listed the group shares on the Stock Exchange of Mauritius. Old Mutual also simultaneously delisted the stock of Old Mutual PLC and relisted Old Mutual Limited on the foreign counter. This followed Old Mutual PLC’s implementation of a strategy called managed separation, which involved separation of its businesses into independently listed stand-alone entities. The current size of the market relative to the GDP is small compared to some countries in Africa, but in some cases, the ratio is higher than in some of the larger African economies. According to the ABSA Africa Financial Markets Report of 2019, South Africa and Botswana have the highest market cap in the region of 292 percent and 204 percent, respectively. The ratios are 9 percent for Nigeria, 18 percent for Namibia, and 14 percent for Tanzania—see Annex 2.
108. Most African capital markets are illiquid 105 and characterized by low trade volumes and market turnover. While Botswana is second in Africa in terms of market size or depth, it is highly illiquid with a market turnover-to-GDP ratio of near zero. The most liquid markets in the region are South Africa with a ratio of 33 percent, followed by Egypt (26 percent), Mauritius (9 percent), and Nigeria and Kenya, both at 6 percent. Tanzania, Zambia, Namibia, and Côte d’Ivoire have ratios
of between 1 percent and 4 percent. Most of the remaining economies (including Malawi - Figure 42) have ratios of close to zero. The size of investors’ assets is larger than what the market in its current state can absorb.
103 Until the end of 2019, there were only 14 stocks. In February 2020, AIRTEL Malawi PLC listed its shares on the stock exchange. 104 https://www.dse.co.tz/sites/default/files/dsefiles/CEO%20Quarterly%20Note%20%28Q1%202020%29.pdf. 105 A stock market is liquid if shares can be rapidly sold with little impact on the share price. Illiquid markets would be characterized by low trade volumes, low turnover, and large spreads between selling and buy prices, among others. Key factors that drive market liquidity include the number of investors, the number and quality of market intermediaries that can facilitate transactions, and the quality of the market infrastructure. Others include regulatory regimes and macroeconomic factors.
Table 19: Comparison of stock market returns across select African markets
Source: Dar es Salaam Stock Exchange.104
YTD (Jan-March 2020)
1Y 3Y 5Y
Botswana Stock Exchange -2.40% -8.10% -21.30% -31.30%BRVM (West Africa) -9.90% -21.00% -47.40% -44.80%Dar es Salaam Stock Exchange -1.20% -30.00% -14.00% -40.00%Egyptian Exchange -10.10% -7.50% 3.50% -36.10%Ghana Stock Exchange 4.10% -9.50% 4.20% 33.70%Johannesburg Stock Exchange -17.90% -25.00% -26.80% -41.20%Lusaka Stock Exchange -7.40% -42.80% -36.80% -68.50%Malawi Stock Exchange -0.60% 11.30% 115.40% 21.90%Nairobi Stock Exchange -10.50% -3.70% 21.10% -23.60%Namibian Stock Exchange -13.10% -12.90% -13.50% 9.30%Nigerian Stock Exchange -3.30% -18.40% -10.90% -51.80%Rwanda Stock Exchange 0.80% -10.20% -14.70% -61.10%Stock Exchange of Mauritius -2.90% -10.20% 7.30% -3.20%Uganda Stock Exchange -5.80% -1.60% 17.60% -36.20%S&P500 -8.60% 6.10% 25.00% 40.40%

MALAWI: MOBILIZING LONG-TERM FINANCE FOR INFRASTRUCTURE
73
Market cap is currently 79 percent of institutional investors’ assets, and the annual stock market turnover stood at MWK 46 billion, which is a small fraction (2.5 percent) of investors’ assets. As a result, investors generally buy-and-hold their equity investments, which contributes to market illiquidity. Under the circumstances, Malawi faces the risk of an asset bubble.106 Discussion with the MSE indicated that institutional investors invest in equities, sometimes not based on underlying fundamentals of a stock but purely because of lack of other options. This may indicate why returns of stock on the MSE have basically outperformed most countries in Africa that have been experiencing depressed returns (Table 19).
109. As a transitional solution, investors could be allowed to invest in long-term foreign assets, which can also help build the capacity of the domestic investors. The current legal framework does not allow foreign investments by domestic investors. The RBM’s draft investment directive for pension funds provides an allowance of up to 10 percent for offshore investments.107 However, discussions with the institutional investors revealed that they would prefer to focus on domestic investments. Old Mutual is already taking the lead to set up a specialized investment vehicle that would pool institutional investors’ funds (domestic and foreign) for long-term investments, including infrastructure. This is a welcome initiative since a purely infrastructure-focused vehicle in Malawi at this stage will face a pipeline challenge. Having a clear pipeline of projects in which to invest is crucial for an infrastructure vehicle to succeed. This is in line with expected changes in the regulatory framework. Recognizing the complexity of investing in infrastructure, the draft investment directive for pension funds requires that any investment in infrastructure or public project is only undertaken through an SPV. Old Mutual will first invest its own funds (and is considering mobilizing a first loss capital108 or insurance from institutions like MIGA) and later crowd-in other domestic and foreign long-term investors.
110. The solvency regulations for life insurance firms encourages longer-term investments in listed and unlisted assets, including infrastructure. However, similar to banks, life insurers are subject to capital solvency rules aimed at minimizing the risk of insolvency. Solvency ratios have significantly declined in the past two years (Figure 43 and Figure 44).109 The RBM’s solvency regime requires meeting solvency requirements at two levels: at the whole company level and at the life fund level; capital charges are applicable at both levels. Most of the smaller companies have managed to meet whole company solvency levels but struggle to meet the life fund solvency. In 2019, of the five life insurers, one life insurer failed to meet minimum solvency requirements at both whole company and life fund levels as of December 2019. One other life insurer failed to meet minimum solvency requirements at the life fund level.110 The RBM introduced a new directive for minimum capital and solvency requirements, which increased the minimum capital for life insurers underwriting all classes of life insurance from MWK 75 million to MWK 1 billion and to MWK 300 million for life insurers underwriting one class of life insurance. The expectation was to see some consolidation of insurers, but this did not happen as all shareholders brought in the necessary capital.
106 An asset bubble occurs when an asset, for example, a stock or housing, dramatically rises in price over a short period without being supported by the value of the product. 107 It is noteworthy that the directive has been in draft form for a number of years. Efforts to expedite its completion will be needed. 108 When a fund’s structure includes first loss capital, the amount pledged is the first to be exposed to any loss suffered by the fund before other (senior) investors begin to absorb losses. First losses (which can be provided by governments and/or development agencies whose interests are to foster market development) are catalytic credit enhancement tools, which can encourage larger flows of capital in nascent markets by improving the risk-return profile of the fund. First loss positions can be in various forms, including taking junior equity position or subordinated debt or providing a guarantee. 109 Out of the five life insurers, one failed to meet minimum solvency requirements at both whole company and life fund levels as of December 2019. One other life insurer failed to meet minimum solvency requirements at the life fund level. 110 RBM. 2019. Financial Institutions Supervision Report.

MALAWI: MOBILIZING LONG-TERM FINANCE FOR INFRASTRUCTURE
74
Figure 43: Life insurers' solvency ratio - Whole company level
Figure 44: Life insurers' solvency ratio - Life fund level
Source: RBM. Source: RBM.
111. The draft regulation for pensions also provides allowance for new asset classes such as real estate investment trusts (REITs) and asset-backed securities (ABS).111 However, in practice, it is difficult to get these products to market in an environment with a thin pipeline of underlying investible assets, a shallow capital market, and a nascent regulatory framework. 112 Getting the basics right by creating the enabling environment would be the right place to start. The market requires more issuers of equity instruments (which can also be supplied by the government selling some of its shares in SOEs). Efforts to deepen the bond market and increase the supply of traditional corporate bonds and quasi-sovereign/SOE bonds would work well for institutional investors. As the creation of investible infrastructure assets improves, project bonds could be tested in the market. Therefore, a new regulatory framework and offer regime to accommodate these instruments would be critical.
112. Currently, the debt capital market is much less developed than the equity market. There are 14 debt instruments listed on the exchange, but only 5 are corporate bonds (with a total issued value of MWK 12.4 billion) and 9 are treasury notes (with a total issued value of MWK 219.9 billion). All five corporate bonds relate to one banking institution (MYBUCKS Banking Corporation), which is issuing bonds as part of its MWK 24 billion 3-year medium-term note (MTN) program. Notably, none of the debt instruments are actively traded on the exchange (Annex 2). However, some secondary trading in the over-the-counter (OTC) market113 has been observed since the introduction of the Central Securities Depository (CSD),114 where transactions are handled bilaterally with limited information on pricing. In both international and domestic markets, it is common for instruments (especially bonds) to be listed on an exchange and later traded in the OTC market. However, given the opaqueness of the OTC market and lack of liquidity in the secondary market in Malawi, measures to ensure transparency of the OTC market to facilitate price discovery would be key.
111 REITs are regulated investment vehicles that enable collective investment in real estate, where investors pool their funds and invest in a trust to benefit from profits or income from underlying real estate assets. REITs can also be listed on the stock exchange. ABS are bonds that are backed by income from underlying pool assets, usually various types of loans, including mortgage loans, infrastructure loans, and even small and medium enterprises (SMEs) and credit card loans. Banks can issue ABS/sell its loans on the capital market, which can help the banks relieve their capital by raising new funds and creating more space for new lending. 112 Even more developed capital markets, like Kenya, have struggled to bring these products to market. 113 OTC or off-exchange trading is direct trading between two parties without the supervision of an exchange or use of brokers. An OTC trade can be executed without other market players being aware of the price as prices are not always published. Hence, by definition, OTC markets are less transparent and liquid and limit possibilities for price discovery. 114 This is an electronic system that holds or maintains records of sold and bought securities and allows digital transfer of securities between investors.
164%
120%
0%
100%
200%
300%Se
p-17
Dec
-17
Mar
-18
Jun-
18Se
p-18
Dec
-18
Mar
-19
Jun-
19Se
p-19
Dec
-19
Mar
-20
Jun-
20Se
p-20
Solvency Ratio
100%
0%50%
100%150%200%250%300%
Sep-
17D
ec-1
7M
ar-1
8Ju
n-18
Sep-
18D
ec-1
8M
ar-1
9Ju
n-19
Sep-
19D
ec-1
9M
ar-2
0Ju
n-20
Sep-
20
Life Fund
Solvency Benchmark

MALAWI: MOBILIZING LONG-TERM FINANCE FOR INFRASTRUCTURE
75
113. Pricing of the debt instruments has been a challenge in Malawi, partly due to macroeconomic uncertainties experienced in the past years and partly due to lack of a benchmark yield curve.115 Investors in Malawi generally target rates of return that exceed inflation. While bonds are best priced at fixed rates, in Malawi, most investors prefer floating interest rates. Both the RFA and the MYBUCKS bonds were floating interest rate bonds, priced at 1.75 percent and 3 percent above the treasury bills rates, respectively.116 While the macroeconomic environment has significantly improved, it takes time for investors’ confidence to recover. Sustaining the recent gains on macroeconomic stability is critical for deepening the capital markets. It is noteworthy, that the government and the RBM are making efforts to develop a benchmark yield curve. Until 2019, the government mainly issued short-term treasury bills, partly responding to the reluctance of investors to commit long term when the macroeconomic environment was unstable. The government has been implementing a deliberate strategy to lengthen the maturity profile of domestic debt. This has resulted in the shift of domestic debt holding from treasury bills toward treasury notes (Figure 46). In September 2019, the government issued its first 10-year note with a face value of MWK 5.98 billion and coupon rate of 9 percent (which was listed on the exchange), having issued a 7-year note earlier in the year. Since then, the government has issued additional three 5-year notes, three 7-year notes, and one 10-year note, which have not yet been listed on the exchange. Based on this and the limited secondary data of government debt traded in the OTC market, a benchmark yield curve of fixed maturities has been created (Figure 45). The GoM has also started to publish a government debt issuance calendar every three months.
115 The curve shows yields to maturity of securities of various maturities—from short- to long-term bonds. For investors, a yield curve is useful for understanding conditions in the financial markets, measuring expected returns on bonds and inflation expectations. For issuers/borrowers, the curve acts as a benchmark for pricing other financial instruments in the market as well as predicting the yield/prices of future government issuances. Government securities are typically used to construct a yield curve as a benchmark, but in more developed and liquid capital markets, corporate bonds can also be used to construct a yield curve. 116 RFA used a three-month treasury bill rate as a benchmark. Since the MYBUCKS bond was an MTN, the benchmark treasury bill rate is to be agreed with investors at the time of issuing each tranche.
Figure 45: The yield curve has been extending
Percent Figure 46: Domestic debt has shifted toward longer-maturing instruments
Public domestic debt by instrument (MWK, billions)
Source: RBM. Source: World Bank staff calculations based on RBM data.
0
5
10
15
20
25
91-D
ay
182
-Day
364-
Da
y
2-Ye
ar
3-Ye
ar
5-Ye
ar
7-Ye
ar
10-Y
ear
16-Apr-20 12-Dec-19
30-Sep-19
- 200 400 600 800
1,000 1,200 1,400 1,600 1,800 2,000 2,200
Jan-
15
Jun-
15
Nov
-15
Ap
r-16
Sep-
16
Feb-
17
Jul-1
7
Dec
-17
Ma
y-18
Oct
-18
Ma
r-19
Aug
-19
Jan-
20
Jun-
20
Treasury bills Treasury notes Others

MALAWI: MOBILIZING LONG-TERM FINANCE FOR INFRASTRUCTURE
76
114. As part of its efforts to enhance market liquidity, the RBM has taken actions to develop the repurchase agreement (repo)117 market, which can help financial institutions and dealers fund their positions and support market-making activities. In 2018, the central bank introduced the global master repo agreement to facilitate the repo market, but banks have not yet started to use it. The central bank is continuing to raise awareness and has held a workshop with market participants with the help of IMF's East Africa Regional Technical Assistance Center.
115. Market infrastructure is a key pillar of capital market development. Malawi has undertaken significant technology upgrades over the past few years in a drive to upgrade trading, clearing, and settlement of trades. In 2017, the CSD, along with the Malawi National Switch and Automated Transfer System (which automated and simplified all settlement and clearing processes), was implemented. The CSD facilitates trades on the treasury primary market and is capable of supporting registry, custody, settlement, and market data and information management in the primary and secondary markets for bonds and equities. The CSD is linked to the Automated Trading System (ATS) of the MSE, which was launched in June 2018. All share certificates have been dematerialized,118 and trade settlement time has improved.
116. Despite this progress, more needs to be done to enhance the efficiency of the system. A few technical gaps have been observed, whereby some market participants are not fully benefiting from the targeted trade settlement time of three days after trade date or less (that is, T+3). Currently, brokers receive payments within three days of the trade; however, their clients (sellers of security) are not able to simultaneously receive their payments. This depends on banking arrangements of different brokers, leading to some clients receiving payments a week after the trade date. In an ideal situation, the CSD (which is linked to the payment system) should be able to allocate commissions, taxes, and payments to clients and settle these simultaneously. The RBM is keen to resolve this, and efforts are under way to address the gaps. The RBM has also indicated the need for boosting human capital capacity of all stakeholders/users of the system so that they are all equipped on how to fully optimize the system. The MSE also wants to develop a mobile platform (to be linked to the CSD and the ATS) to mobilize capital from retail investors.
117. Market intermediaries (for example, market makers,119 primary dealer, 120 brokers, financial/transaction advisors, credit rating agencies, and accounting firms) are critical for reducing information asymmetries and lowering the costs of researching potential investments, exerting corporate control/monitor performance of firms, managing risks, and mobilizing savings, which in turn improves secondary market liquidity. These intermediaries are few in Malawi and those existing have limited capacity given the low level of capital market development. There are only four brokers and few investment advisors. Market makers, primary dealers, and credit rating agencies, who are critical to facilitating better credit analysis (and improving market transparency) and helping investors in investment selection, do not exist.
117 A repo is a form of short-term borrowing for brokers-dealers where a party lends out cash overnight in exchange for a roughly equivalent value of securities, often government securities. This market exists to allow companies that own lots of securities but are short on cash to cheaply borrow money and those with lots of cash to earn a small return while taking little risk, because they hold the risk-free government securities as collateral. A key feature is that the cash borrower agrees to repurchase those securities at a later date (often the next day). 118 Physical (paper-based) certificates have been replaced by electronic certificates. 119 Market makers or liquidity providers are firms (usually large banks and financial institutions) that ensure there is liquidity in the market—they are always able to buy or sell securities at the price they quote with a primary goal of profiting from the spread between bid and offer prices. Market makers that have been designated by the stock exchange commit to ‘make the market’ at all times, even when markets are volatile/erratic, hence keeping the market functioning. 120 Primary dealers are firms with privileges to buy government securities directly from the primary market and obligation to sell them to other investors in the secondary market, hence acting as market makers of government securities.

MALAWI: MOBILIZING LONG-TERM FINANCE FOR INFRASTRUCTURE
77
Local investors lack the experience and specialized skills to structure infrastructure investments.
118. The RBM’s ongoing efforts to move institutional investors toward long-term infrastructure projects are positive steps in the right direction. However, infrastructure assets (which ae mostly unlisted) have different characteristics from other asset classes, presenting unique barriers to entry to most investors, especially pension funds and life insurance companies. The lack of liquidity, the high up-front costs, and the long-term nature of projects require dedicated expertise to understand the risks involved and to effectively manage them. Regulators and market participants have conveyed that local experience in creating markets for these new asset classes is limited and expressed strong interest in being supported to deliver this priority agenda.
119. Investors such as Old Mutual can access expertise at their group level in South Africa, which has enabled them to test a few innovative transactions in the market but not yet sufficient to scale. Project financing of infrastructure is also a new skill that will need to be acquired by local commercial banks. Some banks, for example, Standard Bank, which had a loan portfolio in 2019, could also benefit from group-level expertise in South Africa.

MALAWI: MOBILIZING LONG-TERM FINANCE FOR INFRASTRUCTURE
78
Highlights of capital market development and policy changes across Africa
400%: Oversubscription of Nigeria’s first 30-year government bond issued in 2019
Zambia is introducing a primary dealer system to boost the secondary market for government bonds.
The Seychelles issued the world’s first sovereign blue bond, an instrument developed to finance sustainable marine and fisheries projects.
The Bank of Mozambique approved its first independent licensed broker, Amaramba Capital.
Mauritius launched an e-bond trading and market surveillance system, a new electronic trading system for its government bonds.
The World Bank issued a Rwandan franc denominated bond on the London Stock Exchange
Angola expects its first ever initial public offering in 2020, following a decision to sell some of the shares of a state-owned diamond company.
South Africa’s Financial Sector Conduct Authority published a draft conduct standard determining skills and training requirements for board members of pension funds.
Kenya: Investors have established the Kenya Pension Fund Consortium as a pooled investment vehicle for alternative assets.
Namibia and Kenya issued their first green bonds.
Source: ABSA Africa Financial Markets Index 2019; World Bank; various sources from the internet.

MALAWI: MOBILIZING LONG-TERM FINANCE FOR INFRASTRUCTURE
79
3.4. Perception of high risks and weaknesses in the investment climate minimize investor confidence 121. Private investments, the quality of business environment and investment climate, and management of investors’ perception are positively correlated. Investments in developing countries such as Malawi are generally perceived as riskier (some of these risks are real, while others are perceived). Investors have reasons to worry—infrastructure projects are usually more exposed to sovereign risk. In some African markets, these risks are more pronounced than in developed markets and may translate to inefficiencies in project development and construction and inability of projects to meet cash flow targets. While a gestation period of infrastructure projects is usually 3–5 years, Boston Consulting Group (2017) indicates that gestation periods of 7–10 years are common in Africa. As a result, developers usually assess project costs and timelines in Africa at 20–30 percent higher than in developed economies (in some cases close to 60 percent). The report indicates that some experts reckon this to be closer to 60 percent, which is another important factor in African project costs and therefore in private investors’ higher expected IRRs. Consequently, even domestic investors, who generally have a better understanding of local conditions, would be cautious about investing in public projects.
122. However, in some cases, there are gaps between risks and perception. Another report by Mercer shows that the perception of high risk of investing in Sub-Saharan Africa infrastructure does not always match with the experience of investors who are already active in the region. Although African infrastructure projects’ construction may take longer to complete, these delays do not typically result in greater default risk. As Figure 47 shows, African infrastructure project debt has a lower default rate than similar debt in many developed market regions (for example, North America) and a significantly lower default rate than many other emerging market regions (for example, Latin America and the Caribbean), where premiums are higher.
Figure 47: Infrastructure projects’ default rates (1966–2016)
Source: Mercer, based on Moody’s Investors Service Data.

MALAWI: MOBILIZING LONG-TERM FINANCE FOR INFRASTRUCTURE
80
Figure 48: Drivers to locate in or consider future investment in Sub-Saharan Africa
Source: World Bank, based on International Investors’ Survey.
Figure 49: Factors affecting the decision to invest overseas
1 = Highest Impact; 6 = Least Impact
Figure 50: Evolution of Malawi’s Doing Business (DB) ranking
Source: World Bank (2018g), based on International Investors’ Survey.
Source: World Bank (2018g), based on International Investors’ Survey.
2.51
2.94
3.2
3.21
3.24
4.93
Unpredictable andArbitrary Conduct
Breach of Contract
Lack of Transparency
Currency TransferRestrictions
Expropriation
Discrimination141 145
161171
144 141 133110 111 109
2010
2011
2012
2013
2014
2015
2016
2017
2018
2019

MALAWI: MOBILIZING LONG-TERM FINANCE FOR INFRASTRUCTURE
81
123. Mercer notes that the above default rates should be viewed with caution given the limited number of existing projects with private sector investments in Africa. In addition, the low default rates could be attributable to the fact that private investors would mainly target well-structured projects; most projects would benefit from risk mitigation by DFIs; and demand risk, for example, in energy projects, would be mitigated through offtake/purchase agreements. Nevertheless, the data point to
the need to pay attention to these issues and manage investors’ perception of risks. This can also be achieved through continued business environment and investment climate reforms and investor communication. A 2018 World Bank Survey on Rwanda Investor Perception indicates that political risks and regulatory environment are among the top five factors international investors look at when making decisions to invest in the Sub-Saharan Africa region (Figure 48). More specifically, unpredictable and arbitrary conduct and the risk of breach of contract are the factors with the most impact on the decision to invest overseas (Figure 49).
124. In the past decade, Malawi has undertaken several business reforms. In 2018, it was among the countries that undertook the most reforms covered by the DB Index,121 alongside India, Thailand, Zambia, Nigeria, Brunei Darussalam, Kosovo, Uzbekistan, Djibouti, and El Salvador (Annex 6). Malawi’s DB ranking has improved from 141 in 2010 to 101 in 2019—better than Nigeria (131), Mozambique (138), Tanzania (141), Angola (177), and Ethiopia (159). Some of the reforms undertaken in the past years include establishing a private credit information bureau in 2018 (Getting Credit indicator) and encouraging the use of electronic systems for tax payment in 2010 (Paying Taxes indicator).
125. With respect to the ‘Enforcing Contracts’ indicator, Malawi established a commercial court in 2008, simplified the enforcement of contracts by raising the ceiling for commercial claims that can be brought to the magistrates court in 2011, and adopted new civil procedure rules in 2019 that regulate time standards for key court events. To protect minority investors, the country increased shareholder rights and roles in major corporate decisions in 2017 by clarifying ownership and control structures that prohibit a subsidiary company from acquiring shares issued by its parent company and by extending the ability for shareholders to recover their legal expenses. Adequate insolvency procedures improve investor confidence and mitigate risks. Malawi has addressed some of the issues in its insolvency frameworks by introducing a reorganization procedure, facilitating continuation of the debtor’s business during insolvency proceedings, and introducing regulations for insolvency practitioners (2020). It also adopted new rules in 2012 providing clear procedural
121 It should be noted that the DB ranking is based on specific standardized indicators and does not cover all aspects of the business environment and investment climate. However, it is indicative of the country’s reform agenda.
Figure 51: Malawi’s DB 2019 index scores: 100 = Best performance
Source: World Bank.
77.963.1
45.4
64.9
9058
62.4
65.3
47.4
34.9
Stating a Business
Dealing withConstruction Permit
Getting Electricity
Registering Property
Getting Credit
Protecting MinorityInvestors
Paying Taxes
Trading AcrossBorders
Enforcing Contracts
Resolving Insolvency

MALAWI: MOBILIZING LONG-TERM FINANCE FOR INFRASTRUCTURE
82
requirements and time frames for winding up a company and introduced a new law in 2010 limiting the liquidator’s fees.
126. Despite these excellent reforms, more work lies ahead. Figure 50 shows that there are still weaknesses, especially in enforcing contracts, resolving insolvency, and getting electricity (which is largely attributable to limited investments to date). Investors indicate that it still takes almost two years122 to resolve commercial disputes due to the poor quality of the judicial processes. The Malawian court enforcement process is unanimously perceived by investors to be inefficient, slow, and obstructed by arbitrary injunctions, and the law does not regulate the maximum number of adjournments that can be granted. In light of this, an alternative dispute resolution framework was introduced and is protected by the law, but efficiency of the framework is not yet fully tested. The solvency framework, which came into effect in 2016, has gaps that should be addressed, especially in relation to the participation of creditors during insolvency. For example, the existing framework does not require approval by the creditors for the selection or appointment of the insolvency representatives and the sale of substantial assets of the debtor, and creditors do not have the right to request information from the insolvency representative.
127. The legal framework in Malawi requires that any potential payments by the government related to ‘judgment debts’ of major infrastructure projects, such as the Mpatamanga hydro power project,123 must be covered by the appropriation law and approved by the Parliament. However, the Appropriation Act, 2018, does not cover judgment payments and will need to be amended. In addition, Malawi has not ratified the United Nations Convention on the Recognition and Enforcement of Foreign Arbitral Awards, which is critical for providing assurance to investors that arbitral decisions will be enforced in Malawi.
128. The current tax code and tax administration procedures could benefit from further review to identify opportunities for further simplification and ways to provide incentives that can spur the domestic capital market development. The tax rates for life insurers and pension funds are already lower than the normal corporation tax. However, withholding tax on capital gains is high relative to other countries. In Kenya, withholding tax on earned interest does not apply. In Ghana, the tax regime is considered quite favorable by investors. The tax code also includes exemptions on a variety of capital market taxes such as capital gains earned on listed stocks and interest on government bonds to nonresidents.
122 According to the DB 2020 report, it takes 522 days and about 69 percent of total claim to resolve a commercial dispute, and the judicial processes index is 9.5 out of the maximum of 19 points. 123 For example, termination guarantee payments under implementation agreements.

MALAWI: MOBILIZING LONG-TERM FINANCE FOR INFRASTRUCTURE
83
Table 20: Tax rates and tax administration indicators in Malawi
Corporation tax 30% For locally incorporated companies
Life assurance 21%
Pension funds 15%
Foreign 35% For companies not incorporated in Malawi/subsidiaries of a foreign company
Withholding tax on capital gains (residents and nonresidents)
15% Capital gains are not subject to tax if they are used within 18 months to purchase a qualifying asset similar to or related in service or use to the asset that was sold.
30% If shares are held for less than 12 months
Tax on dividends 15%
Value added tax 16.5%
Time required to obtain value added tax refunds (weeks)
44
Time to complete a corporate income tax correction (weeks)
27.9
129. It should be noted that Malawi used to have an exchange control regime which has been abandoned, save the restriction related to Malawians/residents investing outside of Malawi. Currently, investors are able to expropriate their funds without restrictions, and banks lend in foreign currency, although by adhering to normal RBM prudential rules which require foreign currency (forex) lending of maximum of 65 percent of foreign currency denominated accounts and to clients that are generating revenue from forex. The government is currently preparing a bill that will amend or repeal the Foreign Exchange Act. The RBM department that used to be responsible for forex controls has been restructured and is now responsible for foreign flows monitoring.

84
4 Facilitating Access to Long-term Finance

MALAWI: MOBILIZING LONG-TERM FINANCE FOR INFRASTRUCTURE
85
4.1. Overview 130. Traditional funding models are becoming more constrained and unsustainable for the GoM. A paradigm shift is needed. Accessing market-based finance will require new approaches and structures albeit being adopted progressively. A comprehensive approach is therefore necessary to address constraints in the upstream (and hence enable the creation of bankable infrastructure projects), create new capacity within infrastructure operators (MDAs) and financial market participants, and test new capital market solutions enabled by regulatory reforms to ensure market discipline.
The government needs to seize this opportunity and organize a sustained and concerted policy effort to make progress on three parallel pillars:
Pillar 1: Shift policy, the mindset, and government capacity to foster private sector financing of infrastructure.
Pillar 2: Enhance the performance of SOEs.
Pillar 3: Deepen the long-term finance market.
4.2. Pillar 1: Shift policy, the mindset, and government capacity to foster private sector financing of infrastructure
Identify a champion for enhancing private sector participation in infrastructure
131. Malawi has set up the PPPC as the technical arm of the government to drive the PPP program. However, Malawi needs a designated political champion, a unit (for example, within the OPC) that would ensure legitimacy and appropriate coordination to decisively move the overall private sector participation agenda forward and advocate for other related reforms recommended in this report. As evidenced in this study, Malawi has made progress in a number of areas—PPP and procurement laws/frameworks are in place and are in line with best practice. The regulatory reforms have opened up the electricity generation market. The dedicated PPPC serves as the knowledge center on PPP project preparation, negotiation, and execution. The key going forward is to ensure behavior change, alignment with the private sector participation agenda across MDAs and proper coordination, and a clear understanding of the benefits. A strong high-level champion institution could help achieve these objectives. Commitment can also be generated by ensuring that prioritized projects are aligned with existing government priorities. This is demonstrated in the case of the Mpatamanga project, which is a high-priority project of the GoM and has secured strong political support to develop it as a PPP. SOE governance reforms recommended in Section 4.3 would also require the support and the coordination of the proposed champion.
Upgrade the PIM architecture, integrate with the PPP framework, and strengthen MDAs’ capacity
132. Some infrastructure can only be effectively paid for and funded by the GoM, either because it is not possible to charge users, or users will not pay the full amount to cover the cost of the infrastructure. Infrastructure that can be paid for and funded by users (either in full or in part) should be encouraged, unless the investment is not aligned with the government’s economic, industrial, social, and environmental policies. In cases where support is needed to make projects commercially viable, or where there are segments of the population that cannot afford essential infrastructure services, subsidies can be provided. As highlighted

MALAWI: MOBILIZING LONG-TERM FINANCE FOR INFRASTRUCTURE
86
earlier, this would be necessary in the water and sanitation sector. However, it would be critical for the GoM to ensure provided subsidies are well targeted and not subsidizing inefficiencies of the utilities. For example, instead of providing blanket subsidies toward OPEX of utilities, targeted subsidies toward the CAPEX of connecting new consumers could be prioritized, for example, for the purchase of installation materials for direct labor cost of new connections.
Figure 52: Proposed framework for developing project pipeline (PIM-PPP integrated framework)
Source: World Bank staff.
133. The point at which projects are being selected for public investment is the best time to create a portfolio of projects that can potentially be financed by the private sector. The PSIP Unit, which has the mandate for selecting public investment projects, will need to be empowered to play its gatekeeping role to determine whether projects submitted by MDAs are necessary at all and whether public finance is needed. The PSIP Unit should implement a new framework, as proposed in Figure 52, which should include a clear guidance to MDAs on required standards for submission of project concepts. Project ideas that pass the screening stage will be further developed (including technical studies), with support from the project preparation facility (PPF) proposed in the following section (which is recommended to be housed within the PSIP Unit) and the PPPC. Coordination with the investment promotion agency would be critical for promoting new investment opportunities.
134. The PIM framework should also be adjusted to encourage up-front estimation of the potential fiscal impact of potential long-term deficits that may be created by infrastructure projects, whether the projects
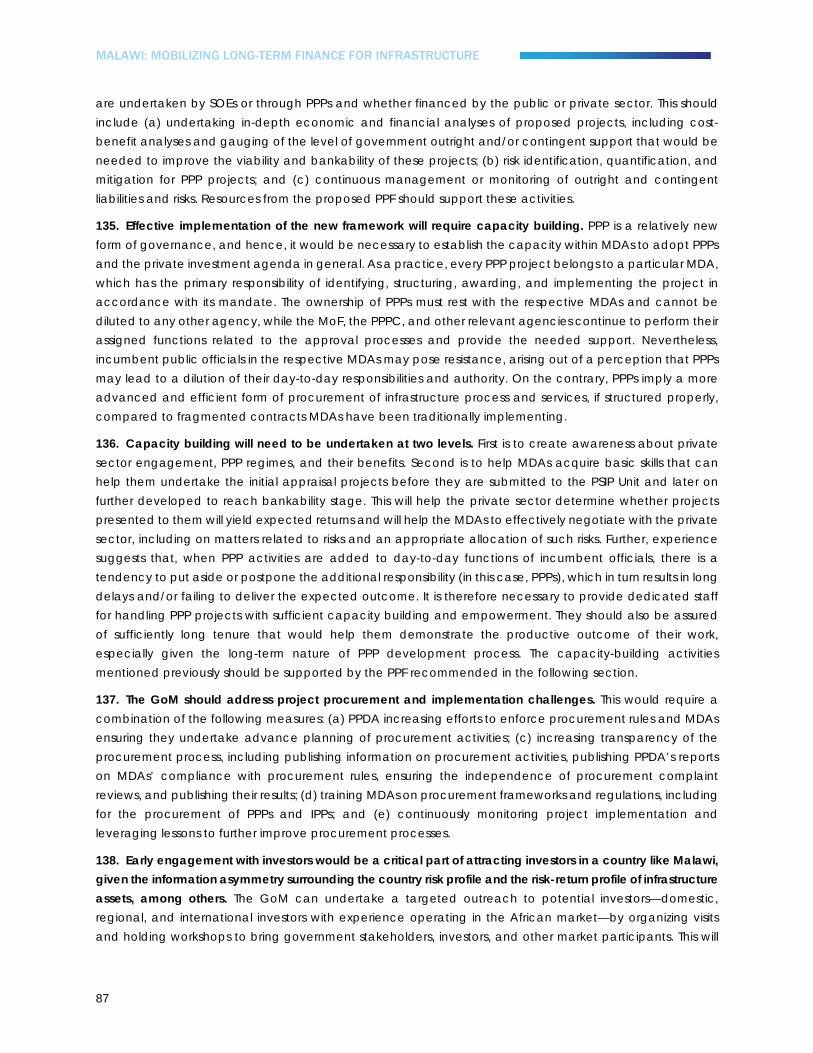
MALAWI: MOBILIZING LONG-TERM FINANCE FOR INFRASTRUCTURE
87
are undertaken by SOEs or through PPPs and whether financed by the public or private sector. This should include (a) undertaking in-depth economic and financial analyses of proposed projects, including cost-benefit analyses and gauging of the level of government outright and/or contingent support that would be needed to improve the viability and bankability of these projects; (b) risk identification, quantification, and mitigation for PPP projects; and (c) continuous management or monitoring of outright and contingent liabilities and risks. Resources from the proposed PPF should support these activities.
135. Effective implementation of the new framework will require capacity building. PPP is a relatively new form of governance, and hence, it would be necessary to establish the capacity within MDAs to adopt PPPs and the private investment agenda in general. As a practice, every PPP project belongs to a particular MDA, which has the primary responsibility of identifying, structuring, awarding, and implementing the project in accordance with its mandate. The ownership of PPPs must rest with the respective MDAs and cannot be diluted to any other agency, while the MoF, the PPPC, and other relevant agencies continue to perform their assigned functions related to the approval processes and provide the needed support. Nevertheless, incumbent public officials in the respective MDAs may pose resistance, arising out of a perception that PPPs may lead to a dilution of their day-to-day responsibilities and authority. On the contrary, PPPs imply a more advanced and efficient form of procurement of infrastructure process and services, if structured properly, compared to fragmented contracts MDAs have been traditionally implementing.
136. Capacity building will need to be undertaken at two levels. First is to create awareness about private sector engagement, PPP regimes, and their benefits. Second is to help MDAs acquire basic skills that can help them undertake the initial appraisal projects before they are submitted to the PSIP Unit and later on further developed to reach bankability stage. This will help the private sector determine whether projects presented to them will yield expected returns and will help the MDAs to effectively negotiate with the private sector, including on matters related to risks and an appropriate allocation of such risks. Further, experience suggests that, when PPP activities are added to day-to-day functions of incumbent officials, there is a tendency to put aside or postpone the additional responsibility (in this case, PPPs), which in turn results in long delays and/or failing to deliver the expected outcome. It is therefore necessary to provide dedicated staff for handling PPP projects with sufficient capacity building and empowerment. They should also be assured of sufficiently long tenure that would help them demonstrate the productive outcome of their work, especially given the long-term nature of PPP development process. The capacity-building activities mentioned previously should be supported by the PPF recommended in the following section.
137. The GoM should address project procurement and implementation challenges. This would require a combination of the following measures: (a) PPDA increasing efforts to enforce procurement rules and MDAs ensuring they undertake advance planning of procurement activities; (c) increasing transparency of the procurement process, including publishing information on procurement activities, publishing PPDA’s reports on MDAs’ compliance with procurement rules, ensuring the independence of procurement complaint reviews, and publishing their results; (d) training MDAs on procurement frameworks and regulations, including for the procurement of PPPs and IPPs; and (e) continuously monitoring project implementation and leveraging lessons to further improve procurement processes.
138. Early engagement with investors would be a critical part of attracting investors in a country like Malawi, given the information asymmetry surrounding the country risk profile and the risk-return profile of infrastructure assets, among others. The GoM can undertake a targeted outreach to potential investors—domestic, regional, and international investors with experience operating in the African market—by organizing visits and holding workshops to bring government stakeholders, investors, and other market participants. This will

MALAWI: MOBILIZING LONG-TERM FINANCE FOR INFRASTRUCTURE
88
facilitate cross-fertilization of ideas and help build an appreciation of both the needs and the opportunities within Malawi. In Kenya, a US$90 million loan supported a comprehensive program that included regulatory reforms, PPP transaction structuring, and investor dialogue activities (Box 5, Figure 53).
139. In addition, the GoM should ensure an active communication program, for example, of reforms being implemented, success of existing projects with private sector participation, and economic and social benefits generated by such projects. The DB Index is a good tool for communicating to international investors about the commitment of the national government to reform the country’s business environment and the investor climate. Hence, efforts to undertake DB reforms should continue. Domestic communication of achievements will go a long way toward changing the mindset of the general population and, by default, policy makers on the benefit of attracting private investments.

89
In 2012, the World Bank (IDA) provided a US$40 million loan for the Infrastructure Finance Public Private Partnership (IFPPP) Project to (a) support the establishment of the PPP law and institutional framework, (b) build the capacity of the PPP Unit (PPPU) and line ministries, (c) finance feasibility studies and transactional advisory support for first-mover projects, and (d) create a multisector PPP pipeline. The loan was designed to create a robust pipeline of projects that could be financed by the private sector. This was followed by an additional financing in 2017 of US$50 million, seeking to further support the origination of national and county PPPs and operationalize a Project Facilitation Fund, which will eventually crowd-in additional resources from various sources to finance the viability gaps in some projects and act as a liquidity reserve for contingent liabilities. The Finance, Competitiveness, and Innovation Practice with the support of the Infrastructure, PPPs, and Guarantees Group at the World Bank is also providing a technical assistance program on infrastructure finance (the Long-Term Finance for Infrastructure PPPs Program), which is geared toward leveraging local currency financing from institutional investors through a capital markets instrument and, in turn, creating a fiscally sustainable way to finance PPPs in Kenya. IFC may provide seed capital to establish such capital market instruments, as it did in Colombia. This infrastructure finance program involves building the capacity of financial regulators, pension funds, and insurance companies for investing in infrastructure so that they feel comfortable providing financing to PPP projects. Results
Five years into implementation of the IFPPP, there is now a fully enacted PPP law (February 2013) and a well-staffed PPPU, including an experienced and well-qualified safeguard specialist. The PPPU is functioning at a high capacity, and PPP regulations are in place. A PPP pipeline of 69 projects that cut across all sectors has been approved as a national priority. A PPPC and a framework to measure fiscal risks and contingent liabilities are fully functional. PPP nodes within the county authorities and a robust capacity-building program that has trained more than 200 stakeholders are in place. IFPPP has not only achieved its objective of improving the enabling environment and generating a pipeline of bankable PPP projects but is also moving toward implementation of these projects. The most tangible outputs of IFPPP have been feasibility studies and transactional advisory support for mobilizing private investment in Kenya’s much-needed infrastructure, including the following first-mover projects in the transport sector: Nairobi-Nakuru-Mau Summit Highway, second Nyali Bridge, Nairobi–Thika, and Nairobi Southern Bypass. Feasibility studies have been supported for other projects that are getting ready to go to market, including student housing, health, and water and sanitation projects. The capacity of financial market regulators, fund managers, and trustees has been enhanced on the risks and features of investing in infrastructure PPPs. Discussions with US and South African investors on co-investment opportunities have been initiated since January 2018.
Lessons learned
Mobilizing private investment into infrastructure is best achieved through a comprehensive approach with multiple work streams: an enabling environment, a pipeline of suitable projects, an investment vehicle, capacity building, and demonstration transaction. Having a live transaction is critical because it provides a focus for investors and allows the development of standards so that other transactions can follow. Eventually, the World Bank Group and other donor support will no longer be needed.
Source: World Bank.
Box 5: Kenya infrastructure finance and World Bank support

90
Figure 53: World Bank for infrastructure finance in Kenya
Source: World Bank.

MALAWI: MOBILIZING LONG-TERM FINANCE FOR INFRASTRUCTURE
91
Establish a facility to provide financial and technical resources for project development - From concept stage to implementation and monitoring
140. A PPF is needed to support creation of bankable projects. The proposed facility should provide comprehensive technical assistance to MDAs in preparing and structuring infrastructure projects, including supporting the structuring of demonstration transactions; facilitating dialogue and negotiations with investors; supporting project implementation monitoring; and building capacity of MDAs (Figure 54). To ensure its effectiveness, the facility will need to also focus on early stage development phase and support MDAs to make right decisions when considering unsolicited proposals. The PPF should also be designed to serve as the center of information on project performance and lessons learned, which can be disseminated to the government/policy makers and investors/market participants to instill confidence on risk-return profile of Malawian assets and MDAs for adjusting strategies based on lessons. The mandate of the facility should also include supporting enabling environment reforms in the priority sectors.
Figure 54: Various stages of project development and potential sources of funds
Source: World Bank staff.
141. A detailed design of the PPF is not within the scope of this study, but the following key considerations should be borne in mind when the GoM designs the PPF:
(a) The scope of the facility. Different countries have set up PPFs, with some facilities focusing only on preparation of PPP projects. There is no one-size-fits-all approach—the design should be based on the dynamics within a country. In Malawi, the early stages of infrastructure projects’ development lack proper processes and skills/technical support. Consequently, it is recommended that the scope of the proposed facility should include support for early stages of project preparation (project definition, prioritization, and selection), which is currently the mandate of the PSIP. The Infrastructure Consortium for Africa 124 reviewed several PPFs in Africa (where PIM frameworks are not well designed) and determined that the effectiveness of many facilities in Africa were mainly hampered
124 https://www.icafrica.org/fileadmin/documents/Publications/Effective_project_preparation_in_Africa_ICA_Report_31_October_2014.pdf.

MALAWI: MOBILIZING LONG-TERM FINANCE FOR INFRASTRUCTURE
92
by the fact that they were not designed to operate as a one-stop shop, providing end-to-end support throughout the transaction process. Most facilities are focusing their support on specific stages of project preparation, with the early stages receiving the least attention.
(b) Sources of funds and sustainability. Since the facility should also focus on the early stages of project development (usually the riskier stage as most projects may not move forward), it will require a combination of public funding/grants from the government or donors and more commercial sources (debt and equity) in later stages. The facility should be designed as a revolving fund and employ a cost-recovery model to ensure sustainability of the fund. In this regard, early stage preparation activities can be funded by public sources but once projects proceed to later stages and reach commercial close, the contractual agreements with financiers should include reimbursement of the preparation cost after financial close, which should be recycled back into the fund to facilitate preparation of other projects. The design should include processes that will ensure that projects that are not worth pursuing are identified early in the process (for example, through a number of reiteration steps) to minimize the amount of resources and time spent on such projects.
(c) The institutional home. Similar to the scope of the facility, there is no single model that can be used. The institutional home for the facility will depend on the scope of the facility, where the critical skills reside, and institutional dynamics within a country. In Malawi, the assessment shows that the critical determining factor is the market failure within the PIM process. The lack of a streamlined process and technical skills at the point of creation of the public investment program is the missing link when it comes to the creation of a bankable pipeline in Malawi. Therefore, the preferred option recommended by this study is that the facility should be housed within the PSIP Unit (currently within the MoEPD), which has the mandate for filtering all public investment projects, hence providing a more centralized approach and direct contact with other MDAs. However, close coordination with the Ministry of Finance (MoF) and other MDAs will be crucial. In countries where a similar facility was placed outside a central ministry within the government (for example, in Jamaica where it was placed within the state-owned Development Bank of Jamaica [DBJ] which had technical skills gained during the privatization era), it became clear early on that the missing link was the early stage of project selection, with the mandate residing within the MoF. Consequently, the DBJ had to ensure it coordinates and works closely with the MoF to generate bankable projects. In Kenya, where a World Bank-funded PPP program has been implemented, the project was housed within the PPPU. However, the unit is a department within the MoF, which works well as far as coordination is concerned. In Malawi, the PPPC is a separate entity outside of the MoF. If it is decided to house the facility within the PPPC, it would be critical to ensure (a) the facility does not focus on PPP projects only, leaving out other projects that may need to raise finance from commercial financiers, and (b) there is a strong coordination mechanism with the PSIP Unit within the MoEPD and other MDAs. It should be noted that housing the facility within a central government ministry has its challenges as there is the risk of political interference. This should be considered when designing the facility to ensure the mandates, governance structure, processes, and procedures are designed in a way that mitigates such risk.

MALAWI: MOBILIZING LONG-TERM FINANCE FOR INFRASTRUCTURE
93
Sustain macroeconomic stability and advance on business environment reforms.
142. Maintaining macroeconomic stability requires the attention of the GoM to spur investments. Ensuring fiscal discipline to manage the public debt and improving revenue mobilization will be key. Successful development of the debt capital market requires a well-developed money market and government bond market to provide a benchmark yield. In turn, this requires the government’s commitment to developing a borrowing practice targeting the domestic debt market and a policy vision that the bond market needs to be developed for the benefit of the economy. In this context, the GoM should ensure it has sovereign debt management and bond market development objectives that are consistent with fiscal and monetary policies and financial sector development strategy. This may require technical assistance from the IMF and/or the World Bank.
143. The ability to improve fiscal space and reduce borrowings will greatly depend on the efficiency of the PIM framework in place. A rigorous process for prioritizing capital investments and overseeing their implementation is essential for directing public finance to its best use and reducing costs associated with government borrowing. In this regard, the support from the proposed PPF will be paramount. The management of contingent liabilities will also require attention. SOEs are currently a significant source of contingent liabilities; hence, efforts to improve their creditworthiness (Section 4.3) will contribute to the reduction of these liabilities.125
144. Availability of forex is usually a key area of concern for foreign investors. While forex availability is not a key focus of discussion under this report, it is worth mentioning the need to address this through a combination of measures. As long-term measures, further diversification of the economy to increase export revenues and develop hedging instruments in the domestic capital market should be considered. In the short to medium term, forex hedging institutions such as the Currency Exchange Fund (TCX)126 could be leveraged for specific transactions, although the enabling environment factors that make investments in Malawi challenging would also affect the cost of such hedging solutions (hence the need for sustained reforms).
145. The GoM should continue business environment reforms to minimize the cost of doing business and provide certainty to investors that their investment will be protected. Infrastructure investors are also interested in the strength of the contract enforcement and the insolvency regimes. As seen earlier, enforcing contracts in Malawi is a time-consuming and costly process that in the end does not yield positive results for investors. The GoM should continue reforms to improve the judicial processes and procedures and promote the use of the alternative dispute resolution mechanism that is already in place. However, it is more important that the upstream precontracting activities (project design/preparation, procurement and selection of the right partners, and efficient implementation and monitoring of project and contracts) are done well to avoid litigations. Reviewing and amending the insolvency framework to increase creditors’ participation during insolvency proceedings will be critical. In addition, the Appropriation Act, 2018, should be amended to provide for potential payments related to ‘judgment debts’ of major infrastructure projects such as the Mpatamanga hydro power project (for example, termination guarantee payments under the Implementation Agreement) and the ‘United Nations Convention on the Recognition and Enforcement of Foreign Arbitral Awards’ should be ratified.
125 Although the management of contingent liabilities was covered under the scope of this study, a detailed study funded by AfDB is currently being undertaken. 126 The TCX was founded in 2007 by a group of DFIs and donors to offer currency hedging solutions for developing and frontier markets investors. The Fund offers currency swaps and forward contracts to provide protection against currency volatility.

MALAWI: MOBILIZING LONG-TERM FINANCE FOR INFRASTRUCTURE
94
146. Malawi should review its tax policy and codes and design a tax regime (incentive structure) that promotes long-term savings and investments by both domestic and foreign investors. This could include tax incentives for investors in long-term infrastructure bonds, better tax treatment of investment vehicles such as SPVs, and REITs, among others. The development of investment vehicles requires changes to the tax regime to ensure tax neutrality, so that profits and income are taxed only once, in the hands of the end investors. However, this should be in line with the overall domestic resource mobilization strategy to ensure the GoM can afford the incentives.
4.3. Pillar 2: Enhance the performance of SOEs 147. For SOEs to enhance their capacity to invest in infrastructure while reducing the draw-down on public finance and minimizing contingent liabilities for the GoM, they must improve their efficiency and borrowing capacity. Accessing private capital brings with it a host of stringent but beneficial requirements, including much higher expectations of accuracy, timeliness, and transparency in financial operations, as well as proven technical/operational capacity of the state organizations. Several reforms, both internal and external to the SOEs, will be required. The right incentives will need to be put in place to ensure that SOEs are motivated to make the desired changes. Commitment of both the management and board of directors of SOEs and the GoM to consistently undertake reforms that will address existing market failures will be required.
148. Reforming the weak governance framework and organizational structures and arrangements that will guide the relationship between the GoM and SOEs is necessary. However, this will be a long process spanning several years. Hence, continuous internal operational improvements by SOEs without relying on external enabling environment reforms by the GoM should be the priority of SOE boards and managements. It should be noted that, in addition to undertaking enabling environment reforms and internal operational improvements, it is imperative to implement a coordinated framework of incentives that integrates reform actions by the GoM and a policy direction that will allow market forces to incentivize reforms within SOEs. For example, the government will need to commit to not interfere with SOEs’ business and allow the entities to focus on commercial mandates by putting in place arrangements that insulate SOEs from political interference, including appointing professional boards and providing them with autonomy to turn around the institutions. However, this needs to be combined with the government commitment to allow market forces to exert outside pressure that will promote efficiency and accountability of SOEs by increasing the role of the private sector and citizen engagement.
149. Implementing these reforms will be politically and technically difficult and the risk of reversing reforms over time is high. In this regard, increasing the role of external incentives becomes paramount. Below is a summary of how the proposed framework of incentives could be implemented.
Exercise oversight of SOEs without interfering and incentive them to increase operational efficiency.
Rationalize the state ownership in SOEs and create more room for private investors 150. Increasing the role of the private sector, both as debt providers and as shareholders (even as minority shareholders), can help increase efficiency and accountability within SOEs. Both private debt and equity providers impose substantial constraints on managements of companies. The equity market, especially for publicly listed shares, puts continuous pressure on companies to improve performance through daily publishing of share prices (and analysts’ reports on attractiveness of those shares), hence communicating the value that investors put on the company. The higher degree of disclosure that goes with listing on the

MALAWI: MOBILIZING LONG-TERM FINANCE FOR INFRASTRUCTURE
95
stock exchange—compliance with international accounting standards, frequent reporting/publishing of results, and so on—can greatly improve SOEs’ transparency, accountability, and performance. Debt providers usually impose additional and often more stringent constraints, requiring managements of companies to agree with creditors on a plan to maintain minimum thresholds of select financial health indicators.
151. In this regard, the GoM should rationalize and make a policy decision on where and how to increase the role of the private sector in commercial SOEs. Currently, the GoM has about 67 statutory corporations, of which half have commercial mandates. The GoM could rationalize the ownership in these entities—determine whether the intended public policy is being achieved and whether public ownership is the best way to achieve such policy. This can help clarify sectors in which the government should be involved in and those to be left to the private sector. Where there is no clear cost-benefit tested rationale for state ownership, the GoM should sell part or all of its shareholding, which could follow various staged approaches with distinct milestones. For example, the private sector usually expresses great interest in the property/housing market (where MHC operates). Hence, the GoM may not need to own a property development company and could decide to leave this business to the private sector. In the medium term, the GoM could also decide to alienate some of the equity in EGENCO, since the entity is also operating in a private market and is expected to operate in a level playing field with the private sector. The GoM’s policy on state ownership should be formally included in an SOE ownership policy (to be developed), which should also communicate the new governance framework for SOEs.
152. Initially, the GoM could consider selling its shares to one or more strategic investors, who can bring capital, new skills, and efficiency. MHC could also benefit from entering into property development JVs with the private sector, with MHC contributing its land portfolio to the equity structure. Later, the GoM should consider selling some of its stake on the stock exchange, which will also serve the purpose of deepening the domestic capital market.
Enhance board independence, professionalism, and accountability 153. It is recommended that the GoM changes the way it currently interacts with SOEs (their boards and managements) and commits to distance itself from day-to-day management of their operations. This will allow SOEs to focus on their commercial mandates. The starting point should be to ensure the SOE boards are independent and their members have the requisite skills. To address this, the GoM should nominate a sufficient number of directors who are independent from executive managements, the government, and business relationships. They should have relevant commercial competences and experiences and should preferably be recruited from the private sector. This will help commercial SOEs become more business focused. The role of the board chair is also crucial as he/she is a key interface between the GoM, the board, and the executive management and must therefore understand the business and be able to provide leadership to both the board and the management.
154. Government representation on boards is normal to keep an eye on performance and act as an early warning for the government should unforeseen and unplanned challenges arise. The representatives (in case they are appointed from the public sector) can bring to the board an understanding of the political environment in which the SOEs have to operate. However, such representation should not dominate the board and preferably should be confined to one voting member plus one observer, if required. The government representatives in the boards should also be nominated based on their qualifications. Some countries have stipulated in a legal framework the minimum formal qualification/skills that a person must

MALAWI: MOBILIZING LONG-TERM FINANCE FOR INFRASTRUCTURE
96
have to be nominated for a position in the board. This would be a good example for Malawi to follow to minimize ambiguity.
155. Overall, the GoM should ensure that the practices as well as the responsibilities and liabilities of SOE boards are not different from those in the national company law. However, it should be noted that the company law in Malawi (which applies to corporatized SOEs like EGENCO, ESCOM, and MHC) also requires reforms. The DB report of 2019 shows that the law allows certain practices which are not in line with best practice. For example, the same individual can be appointed as both the chief executive officer (CEO) and the chairperson of the board of directors. In addition, the law neither mandates the board of directors to include independent and non-executive board members nor to include a separate audit committee, exclusively comprising board members.
156. The function of the boards should comprise providing direction over the management of SOEs, including strategic planning, the appointment or dismissal of executives, and setting of appropriate incentives for management. For hiring of the executive managements, the boards of directors should have powers to recruit and hold them accountable. Members of the executive management should not be appointed by the government (as is the practice currently) but should be competitively recruited by the board of directors. This can be done in consultation with the GoM, either by allowing the state to have a veto power or by the candidate being vetted by the government. However, the ultimate responsibility should lie with the board. Ensuring that the GoM does not directly appoint CEOs will help with the recruitment of competent CEOs and minimize the risk of circumventing the role of SOE boards.
157. In light of the above, the board nomination process is key in Malawi. The ownership policy should define a rule-based process that is (preferably) close to practices used in the private sector. RFA provides some lessons that are worth considering for other boards. The board nomination process (clearly articulated in the Roads Fund Administration Act) removes the conflict of interest by requiring professional bodies (a sort of a committee), including the bankers’ association, and the chamber of commerce, nominate two to three
Composition and nomination
The operations of the Administration shall be managed and controlled by a board which shall consist of the following members to be appointed by the minister: • One member nominated by and representing the
financial institutions in Malawi • One member nominated by and representing the
Malawi Confederation of Commerce and Industry • One member nominated by and representing the fuel
pricing authority • The following members as ex officio: the Secretary to the
Treasury or his/her designated representative and the Secretary for Economic Planning and Development or his/her designated representative.
The board chair
• The board shall elect the chairman and vice chairman of the board from among their number.
• A member ex officio of the board or any person employed in the public service shall not be eligible to be elected chairman or vice chairman of the board but shall have the right to vote on any matter at the meetings of the board.
Source: The Roads Fund Administration Act.
Box 6: RFA: Composition and nomination of board members

MALAWI: MOBILIZING LONG-TERM FINANCE FOR INFRASTRUCTURE
97
members each, out of which the government must select one member. The law also prohibits an ex officio member from taking the chairmanship of the board (Box 6).
158. A notable lesson from RFA is the benefit of ensuring diversity of skills, qualifications, and background within boards of directors, including members with private sector skills and robust understanding of how to efficiently run businesses. Board diversity improves the quality and objectivity of the decision-making process by bringing new voices to board discussions and decisions. It fosters innovation, creativity, and a better understanding of stakeholders’ needs, including of financiers. In the case of RFA, it is the board of directors that identified and moved the RFA management to consider the opportunity to leverage the capital market and use its stable stream of revenue from the fuel levy as security. Decisions to explore opportunities for toll roads, commitment to balance revenues and expenditure (RFA is expected to operate on a balanced budget), and commitment to ensuring value for money in construction projects (in some cases having to cancel nonperforming projects after conducting audits) provide the evidence of a well-governed and managed institution. RFA holds a reputation in the market as a well-managed institution with a good governance structure and limited political interference, which enabled it to access capital markets without a credit guarantee from the GoM.
159. The tenure of board members should be secured for a prescribed period to shelter boards from political processes or undue interference. The boards of directors should not be under a constant threat of removal from the board in the case of disagreements with the state. This would be similar to the interference in the day-to-day operations of the SOEs. It is important that the ownership policy provides guidance on this matter to minimize the risk of the tenure of boards being abruptly shortened without justifiable reasons (which should be stipulated in the ownership policy127).
160. To encourage SOE boards to perform well, several tools would be useful—for example, a board charter, 128 shareholder compact, 129 a board remuneration scheme, and a board evaluation tool. An evaluation tool and process will help the GoM systematically (rather than in an ad hoc manner) identify board members who are not performing according to their professional responsibilities. For the board evaluation to be effective, there must be clarity about objectives and measurable performance indicators to form the basis for the evaluation. The current letters of expectations (LOEs) that the GoM has started to issue should be enhanced. The focus should not be on managing day-to-day decisions of the boards and managements but on ensuring SOEs develop strategic plans and annual business plans, which should contain the expectations of the shareholder, performance targets, and measures to achieve them, including budgets and sources of funding. The GoM should require approvals in different aspects, only in case of deviations from agreed plans. Boards and managements should be held responsible and accountable for implementing the business plan and achieving the set targets. They should have, within the approved budget, the right to recruit staff, terminate the employment of non-performers, establish compensation and incentive frameworks, and incur short-term debt. Regarding compensation and incentive frameworks, if commercial SOEs are to attract talent and improve performance, they should not be expected to have the
127 This may include breach of duties, unlawful behavior, or any conflicts of interest that may have arisen after their appointment. 128 A board charter is a policy document that defines the respective roles, responsibilities, and powers of the board of directors (both individually and collectively) and management in setting the direction, the management, and the control of the organization. The board charter can also define policy relating to board composition and selection, board independence, and the legal requirements relating to conflicts of interest (including those arising when government officials serve on boards). It can also determine the board committee structures. 129 This is an agreement stipulating the relationship between the shareholder and the board of directors, including performance expectations.

MALAWI: MOBILIZING LONG-TERM FINANCE FOR INFRASTRUCTURE
98
same salary scales and incentive schemes as in the government. SOE boards should be allowed to introduce new salary and benefit incentives which reflect market conditions.
161. To improve performance monitoring, the GoM should clearly specify in the ownership policy the government institution that will be responsible for the oversight of SOEs. The mandated institution should coordinate oversight activities with the rest of the government. This would foster better control, reduce staff monitoring requirements, and allow sanctions to be imposed with more ease by the primary department. The logical ministry would be the MoF, which can also facilitate engagement with the private sector. Budgetary resources should be dedicated to strengthening the capacity of the central oversight body.
162. Malawi could also learn from the transformation of the National Water and Sewerage Corporation (NWSC) in Uganda, which is one of the best performing water utilities in Africa currently. At the beginning of the transportation process, the first thing the government did was to appoint a new board which included independent directors from the private sector, which in turn hired a new competent CEO from the private sector. The board and new management also arranged performance contracts with the government, where roles and obligations were clearly spelled out, including non-interference with the corporation's management. NWSC was also allowed to determine the salary and the incentive structure for the utility, which was competitive among Ugandan companies (public and private). At the tactical level, the new board and management devised a series of programs: reversing operational and financial inefficiencies, restoring customer confidence, and achieving commercial sustainability.130
163. Making these proposed changes would significantly improve the performance of SOEs and send a strong, positive message to the private financiers, which would go a long way toward enabling SOEs to access market-based finance.131 It is noteworthy that the implementation framework of the policy is as important as the policy itself. The majority of the proposed recommendations will need to be stipulated in a legal framework for them to be effectively implemented. In this regard, it is recommended to enact a new single SOE law in line with the SOE ownership policy to be developed.
SOEs should increase focus on operational improvements 164. All SOEs need to implement continuous improvement plans that identify inefficiencies and cost-saving opportunities that may not initially require substantial capital investments. These will help SOEs ‘build credibility’ with various stakeholders, including customers (by improving service delivery), the government (by improving performance and reporting), and financial institutions (by strengthening financial performance and ability to service debt). While tariff increases will be needed, they are politically difficult to effect, given poverty levels and vulnerabilities of the population in Malawi and the poor quality of services currently delivered by SOEs. Tariff increases will need to be gradually phased in and tied to performance improvement. In addition, regulators are factoring efficiency improvements in tariff calculations. SOEs will have to identify and implement measures that could help increase internally generated revenue without sharp tariff increases and before regulatory reforms in the enabling environment are implemented.
165. Global experience shows that substantial improvement could be made with each incremental internal reform made by the management. This is illustrated in Figure 55 based on research done in water utilities. This would include using the resources at SOEs’ disposal to improve billing and collection (including increasing
130 https://bear.warrington.ufl.edu/centers/purc/docs/papers/0636_Mugisha_Turning_Around_Struggling.pdf. 131 The recommended reforms could be implemented either through a separate single SOE law or the PFMA, in line with the ownership policy.

MALAWI: MOBILIZING LONG-TERM FINANCE FOR INFRASTRUCTURE
99
metering system), building staff capacity (training), improving customer database, establishing a customer hotline to improve responsiveness to customers, and improving cash management.
166. Continuous improvement plans should include actions such as reduction of nontechnical/commercial losses in the supply or distribution of energy and water by reducing theft, fixing/replacing faulty meters, advancing prepaid metering programs, replacing some of the aging equipment with more efficient and technologically advanced instruments, investing in network rehabilitation and good management information systems for revenue protection, and improving billing and collection (update consumer records and collection methods and ensure receivables are collected on time). Programs to improve customer service and transparency, including establishment of call centers, would be critical. SOEs should also scrutinize their annual and long-term capital budget and assess their organizational structures to identify opportunities for implementing lean and efficient structures. In both private businesses and governments/SOEs, staff levels sometimes increase to unsustainable levels and every now and then thorough assessments are needed to rationalize staff cost. This may lead to actions such as redeployment and reskilling of staff and retrenchment and voluntary early retirement program where necessary. To the extent possible SOEs should also improve new customer connections and address physical/technical issues related to transmission and distribution losses and NRW by upgrading the infrastructure, although in some cases, this may require significant CAPEX, mobilization of large amounts of financing, and tariff increases.
Figure 55: IBNET - Global experience on impact of internal reforms on cash positiona
Source: The International Benchmarking Network for Water and Sanitation Utilities (IBNET). Note: a. Based on research of 650 water utilities by IBNET.
167. Each SOE is unique in the problems that it faces but Figure 56 illustrates the potential impact that can be achieved by ESCOM, EGENCO, LWB, BWB, NRWB, and MHC based on different types of internal reforms that they could implement. The six SOEs could potentially save up to a total of about MWK 62 billion (~US$84 million) or 16 percent of total assets per year. EGENCO could save up to 8 percent of total assets, while ESCOM, LWB, and BWB could save up to 4 percent each and NRWB up to 2 percent. None of these actions require legislative intervention and should be within the control of the boards of directors and managements. Some of the SOEs have started to implement some of the above proposed interventions. ESCOM has introduced a prepaid metering system, which has grown fast and allows cash to be collected in advance from customers. This will eliminate the problem of delayed payments in the future. The portion of revenue that is from prepaid customers rose from 23 percent in 2015 to 40 percent in 2018. ESCOM is expected to fully convert to a prepaid metering system. LWB is prioritizing installation of prepaid meters at all government
15% 29
% 41%
65% 77
% 100%
% w i th c ash c os t
r ec over y o f >1 2 0 %
% af te r i nc r eas i ng c o l lec t i on
r a te to 1 0 0 %
% af te r r edu c i ng
labor c os t s by 1 5 %
% af te r r edu c t i on o f NR W to 2 5 %
% af te r i nc r eas i ng c over age and new
c onnec t i ons by 1 0 %
% af te r i nc r eas i ng
ta r i f f s (theor e t i c a l )

MALAWI: MOBILIZING LONG-TERM FINANCE FOR INFRASTRUCTURE
100
consumers. NRWB is also improving revenue collection through prepaid metering and plans to implement a water enterprise risk management system.
168. This creates the opportunity for the GoM and regulators to develop incentives for SOEs to improve their performance, clearly linked to performance targets along the lines of the indicators highlighted previously. Tariff increases and the GoM’s support in accessing commercial finance (for example, through provision of guarantees) should be linked to quantifiable targets, with SOEs showing progressive improvements and hence sustainability of the entities.
Figure 56: Illustrative annual savings based on various internal reforms MWK, billions
Source: World Bank staff.132
169. In addition to undertaking continuous improvement plans, both ESCOM and BWB will require comprehensive turnaround strategies/plans. Although ESCOM is solvent, there is concern about ESCOM as a going concern in the long term without government bailouts or a turnaround in performance. BWB is technically insolvent and requires a comprehensive strategy to resolve, among others, the high cost of pumping water. A cost-benefit analysis of different options should be carried out. This could include a combination of (a) finding a new raw water source with less energy consumption and (b) creating a local energy source rather than purchasing electricity from ESCOM, given the high amount of electricity required to pump water. These should be supplemented by gradual tariff increases as performance improves. BWB will need direct support from the GoM and/or grants from development partners to address its challenges.
132 It is assumed (a) billing and collection will increase by 10 percent; (b) there will be an increase in losses—both physical losses and commercial losses such as theft, meter inaccuracies, and so on; (c) savings will come from rationalizing the staff complement and deploying people to the right jobs, which will improve productivity; (d) densification/new connections will increase coverage and revenue; and (e) a substantial reduction in existing receivables will reduce the need for expensive overdrafts. Overdraft cost is assumed at 22 percent (note that NRWB has an overdraft of 25 percent).
17.21
34.42 35.65
44.25 44.98
61.59 61.59
-
10
20
30
40
50
60
70
-
5
10
15
20
25
30
35
10% averageincrease inbilling andcollections
10 %reduction inphysical andcommercial
losses
5% saving instaff cost
5% increase inlast mile anddensification
sales
70%convesion to
prepaidmeters
Interestearned onadditional
cash due toreduction inreceivables
Total
ESCOM EGENCO NRWB LWB BWB Cummulative Savings (Right Axis)

MALAWI: MOBILIZING LONG-TERM FINANCE FOR INFRASTRUCTURE
101
Ensure regular tariffs adjustment, linked to performance improvements and matching inflation 170. The GoM/regulators should ensure regular reviews and adjustment of tariffs, at least to match inflation. Lack of regularity or long delays in tariff increases can erode a utility’s financial health rapidly. However, automatic tariff adjustments can encourage inefficiencies; therefore, tariff increases should be tied to clear performance improvement targets. The NWSC in Uganda offers some lessons. It was able to negotiate with its parent ministry an indexation of the tariff, which meant tariff would increase automatically in line with inflation without having to apply for a tariff increase or adjustment.133
171. Tariff increases should be dependable, preferably formula driven, and should not be subject to the discretion of the government and should reflect customers’ willingness to pay. In this regard, the presence of a strong and independent regulator can ensure fairness of tariffs and enforce technical standards. The energy sector already has a regulator (though continuous capacity building would be needed), but this is lacking in other sectors such as water and transport. In the water sector, the Ministry of Natural Resources is responsible for adjusting/approving new tariffs upon requests by water boards. However, this model has not worked well as it is subjected to the political calendar and decisions; hence, water tariffs in Malawi have not been adjusted for the past two to three years.
172. Consequently, a regulatory model for the water sector requires rationalization. Countries regulate water supply and sanitation in different ways. In Kenya, a powerful independent regulator (the Water and Sanitation Regulatory Board) regulates standards and tariffs for water supply and sanitation services for urban and peri-urban areas. In Tanzania, the technical and economic regulation of both the energy and water sector across the country is the mandate of one institution—the Energy and Water Utilities Regulatory Authority. South Africa uses a three-tier model. The Department of Water and Sanitation (DWS) is in charge of setting policies and standards (based on the Bureau of Standards). The water utilities (that report to the DWS) are responsible for providing bulk water and the municipalities are responsible for buying bulk water from the utilities and selling to consumers (including setting tariffs and implement standards). Given that municipality leaders are elected officials, there is community-level monitoring of quality of services and elected officials are held accountable.
173. All models present their own advantages and challenges, and hence the GoM should evaluate options and consider what would work best in the context of Malawi. These may include (a) extending the mandate of the existing energy regulator (MERA) or the National Water Resources Authority to include regulation of water supply and sanitation or (b) creating a new water sector regulator—although this may not be the most cost-efficient option given the size of the country and existence of only five water utilities. Whatever model is adopted, the regulator should be structured to ensure the quality of potable water, regulate tariffs and balance the interests of customers and service providers, serve as a center of excellence and capacity building, and advise the government on policies. The GoM will also need to strengthen the accountability mechanisms using a performance-based approach and empower local communities to monitor the quality of service provision.
Encourage responsible borrowing by SOEs 174. Borrowing can help SOEs raise the needed finance and enforce financial discipline. However, borrowing has implicit government guarantee and may put government finances at risk. Consequently, incentivizing responsible borrowing is paramount. Providing guarantees to enable financially distressed SOEs to acquire
133 https://www.oecd.org/water/GIZ_2018_Access_Study_Part%20II_Narrative%20Report_Briefing_document.pdf.
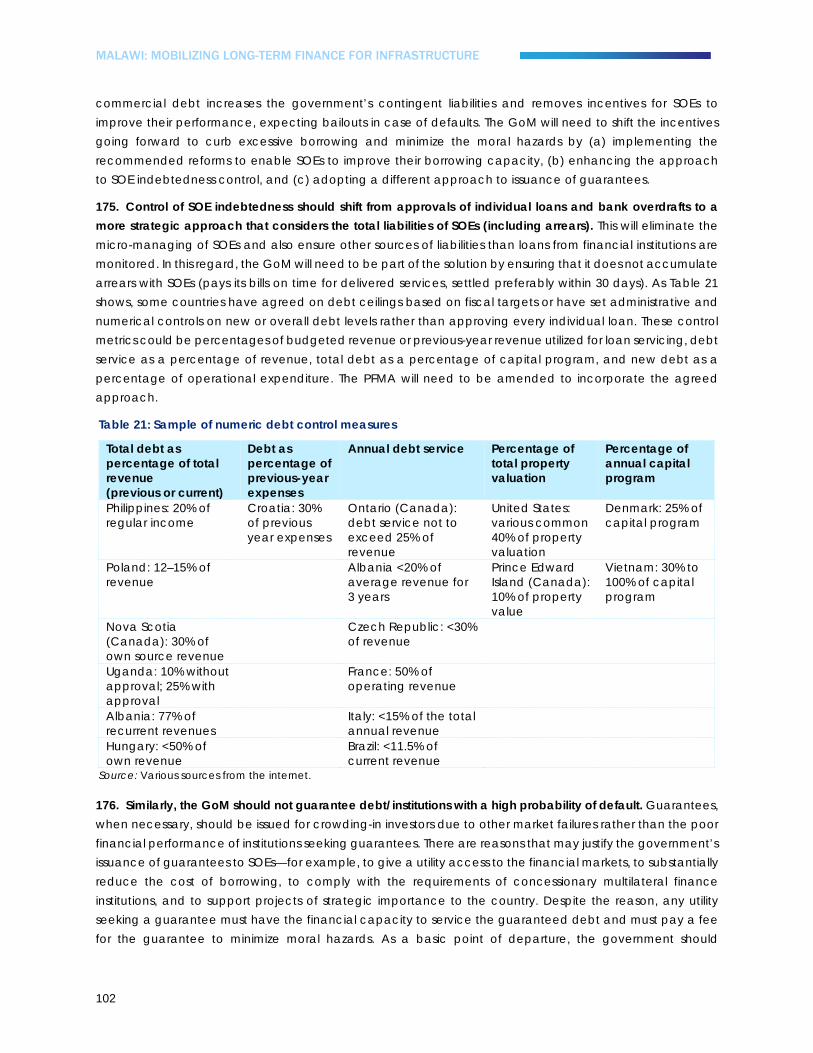
MALAWI: MOBILIZING LONG-TERM FINANCE FOR INFRASTRUCTURE
102
commercial debt increases the government’s contingent liabilities and removes incentives for SOEs to improve their performance, expecting bailouts in case of defaults. The GoM will need to shift the incentives going forward to curb excessive borrowing and minimize the moral hazards by (a) implementing the recommended reforms to enable SOEs to improve their borrowing capacity, (b) enhancing the approach to SOE indebtedness control, and (c) adopting a different approach to issuance of guarantees.
175. Control of SOE indebtedness should shift from approvals of individual loans and bank overdrafts to a more strategic approach that considers the total liabilities of SOEs (including arrears). This will eliminate the micro-managing of SOEs and also ensure other sources of liabilities than loans from financial institutions are monitored. In this regard, the GoM will need to be part of the solution by ensuring that it does not accumulate arrears with SOEs (pays its bills on time for delivered services, settled preferably within 30 days). As Table 21 shows, some countries have agreed on debt ceilings based on fiscal targets or have set administrative and numerical controls on new or overall debt levels rather than approving every individual loan. These control metrics could be percentages of budgeted revenue or previous-year revenue utilized for loan servicing, debt service as a percentage of revenue, total debt as a percentage of capital program, and new debt as a percentage of operational expenditure. The PFMA will need to be amended to incorporate the agreed approach.
Table 21: Sample of numeric debt control measures
Total debt as percentage of total revenue (previous or current)
Debt as percentage of previous-year expenses
Annual debt service Percentage of total property valuation
Percentage of annual capital program
Philippines: 20% of regular income
Croatia: 30% of previous year expenses
Ontario (Canada): debt service not to exceed 25% of revenue
United States: various common 40% of property valuation
Denmark: 25% of capital program
Poland: 12–15% of revenue
Albania <20% of average revenue for 3 years
Prince Edward Island (Canada): 10% of property value
Vietnam: 30% to 100% of capital program
Nova Scotia (Canada): 30% of own source revenue
Czech Republic: <30% of revenue
Uganda: 10% without approval; 25% with approval
France: 50% of operating revenue
Albania: 77% of recurrent revenues
Italy: <15% of the total annual revenue
Hungary: <50% of own revenue
Brazil: <11.5% of current revenue
Source: Various sources from the internet.
176. Similarly, the GoM should not guarantee debt/institutions with a high probability of default. Guarantees, when necessary, should be issued for crowding-in investors due to other market failures rather than the poor financial performance of institutions seeking guarantees. There are reasons that may justify the government’s issuance of guarantees to SOEs—for example, to give a utility access to the financial markets, to substantially reduce the cost of borrowing, to comply with the requirements of concessionary multilateral finance institutions, and to support projects of strategic importance to the country. Despite the reason, any utility seeking a guarantee must have the financial capacity to service the guaranteed debt and must pay a fee for the guarantee to minimize moral hazards. As a basic point of departure, the government should

MALAWI: MOBILIZING LONG-TERM FINANCE FOR INFRASTRUCTURE
103
communicate a no bailout policy and implement it as much as possible to minimize moral hazard on the part of both SOEs and private financiers.
177. The GoM should also consider changing the current approach of assessing proposals from SOEs for guarantees and seek Parliament approval for each guarantee individually. Regarding issuance of guarantees, the GoM could also amend the PFMA to allow the Cabinet and the Parliament to approve a specific value (in Malawi kwacha) of guarantees each year. SOEs wishing to obtain the state guarantee could apply to the MoF, which will make a decision after assessing based on a predefined set of criteria, some of which are proposed in Box 7.134
178. To help SOEs better manage their cash flows and minimize expensive short-term borrowing to cover liquidity shortfalls, the GoM should ensure all government-related outstanding debt and new bills for services rendered are settled within 30 days.
Allow competition in the liberalized energy market
179. Ensuring competition in contestable markets can subject SOEs to pressures that will encourage high levels of efficiency. A level playing field entails everything from the legal and regulatory environment in which entities operate to the conditions under which they access finance or compete for public tenders. EGENCO and MHC operate in competitive markets and should be incentivized to play on a level field with private sector companies. The water SOEs and ESCOM are natural monopolies where private sector competition is not likely in the short term (although competition could also be encouraged among SOEs operating in the same market). Promoting competition is more important in newly liberalized markets like in the electricity generation sector in Malawi, where the incumbent monopoly may seek to maintain its dominant position.
180. The GoM has committed to creating a level playing field between EGENCO and the private sector as a precondition for attracting IPPs. MERA, as the regulator, is charged with ensuring proper regulation of the
134 Approval of guarantees is a time-consuming process. To obtain an approval for a guarantee, an MDA will submit a request to the MoF. The MoF will consider the merit of the application, then make a case in the Cabinet. Once the Cabinet approves, the case is presented in Parliament for approval. To do this on a case-by-case basis is inefficient, both on the part of the government and of the SOE.
Potential eligibility criteria
• Project alignment with the key priorities of the national development plan and the project already included in the business plan of the SOE.
• Strong financial performance and financial sustainability of the SOE—the SOE must prove, based on detailed financial and debt absorption analysis, that it can sustainably service the guaranteed debt.
• Loans from the IFIs that require government guarantee.
Potential prioritization criteria
• Number of people benefiting per dollar invested
• Employment generation potential
• Cost per capita (life cycle capital and running cost)
• Impact on specific select financial ratios of the respective SOE
• Impact on the environment/climate resilience
• Potential risks/risk of failure.
Source: World Bank staff/consultant.
Box 7: Potential (indicative) criteria for issuing guarantees

MALAWI: MOBILIZING LONG-TERM FINANCE FOR INFRASTRUCTURE
104
sector. It is to be noted that implementing this policy in practice might be difficult given the level of development in the power sector in Malawi. The GoM faces a short-term dichotomy, in which there is currently a significant shortfall of electricity in the country. EGENCO is the dominant player in the market and the private sector is not yet generating power at scale. Failure to support EGENCO to create new generation capacity could imply that Malawi would continue to suffer debilitating shortages of power for a considerable time.135 However, such support may in turn create unfair competition with the private sector, initiate a vicious circle of crowding out the private sector, and continue to insulate EGENCO from efficiency-inducing market forces.
181. The GoM could resolve this dichotomy through a combination of measures that would minimize its direct support and ensure any support initially provided is eventually phased out. These may include (a) injecting equity into EGENCO to boost its borrowing capacity and be able to maintain a healthy equity-debt ratio in the generation SPV (Mpatamanga) currently being set up; (b) allowing EGENCO to capitalize dividends to increase its capital until there is real competition in the generation market; then EGENCO should be required to pay dividends to shareholders like the private sector to create a level playing field from a cash flow perspective; and (c) in the medium term, alienating some of the equity in EGENCO to the private sector.
Promote the role of citizen engagement to incentivize accountability and improved service delivery by SOEs
182. Citizen engagement is crucial for carrying out reforms and moving water utilities toward improving the quality of services delivered and in turn improving consumers’ willingness to pay. Efforts by both the GoM and SOEs should be dedicated toward consumer/citizen engagement, including through consumer forums and civil society organizations, both at the national and local levels. SOEs should also set up customer complaints management systems and call centers. Annual surveys to elicit customers’/citizens’ opinions on the quality of services should be considered.
Clearly define and compensate SOEs for noncommercial mandates they perform
183. In the spirit of the GoM’s desire for SOEs to become self-sustaining, a framework is needed for SOEs to be compensated for social mandates they undertake, which are currently not well funded. In the case of MHC, the capping of rental rates should be phased out and there should be a discussion with the government to define and quantify the social mandate and determine a compensation mechanism. In the case of the water utilities, the legal amendment to clarify responsibilities for sanitation, which are expected to move from district council to water utilities, should be implemented soon. To do this in a fair and transparent manner and ensure compensation does not amount to undue subsidies, SOEs should separate the accounting of social activities from that of commercial mandates.136
4.4. Pillar 3: Deepen the long-term finance market 184. Infrastructure financing involves complex structuring of transactions, considering the risks involved in different phases of an infrastructure life cycle. Different types of stakeholders (including commercial banks, institutional investors, and governments/DFIs) can play different roles at different stages. Although institutional
135 Transmission interconnection with neighboring countries is proposed as a near-term solution for partly alleviating the power shortage. 136 The Malawi Rural Electrification Program is a good example. It was started by ESCOM in 1980 and was later (in 1995) handed over to the Department of Energy within the Ministry of Energy. It is funded from levies on all energy sales, Parliament appropriation, and other sources, including donor funding.

MALAWI: MOBILIZING LONG-TERM FINANCE FOR INFRASTRUCTURE
105
investors (to a certain degree) invest in greenfield projects, banks are best placed to finance infrastructure during the construction phase (which can take many years). During this period, infrastructure assets are not generating any cash flow and not suited for fixed-income capital market instruments. In addition, infrastructure projects need a gradual disbursement of funds and bank loans can provide such flexibility. Further, banks have the credit analysis apparatus with large teams and are hence better placed to dedicate time and undertake the credit risks of greenfield projects.137 As a result, greenfield projects are generally highly leveraged during the initial phase with a financing structure of 70–90 percent of debt and 10–30 percent of equity.
185. During the operational phase, as assets start to generate cash flow, fixed-income capital market instruments and institutional investors who have lower risk appetite and prefer certainty of cash flow can step in and give borrowers the opportunity to refinance bank loans through issuance of bonds and relieve bank capital for new lending. Given the political nature of most infrastructure, especially in Africa and Malawi, the risks associated with investing in infrastructure (including market failures in the real sectors, the macroeconomic and the business environment, and tariff structures) make it difficult for infrastructure finance to be met purely by the market. The involvement of the government and DFIs, including through contribution of capital and provision of risk mitigation, is therefore crucial.
186. The following sections highlight different interventions that catalyze the domestic financial market participants to contribute to infrastructure finance, considering the nascent stage of the market development. Catalyzing infrastructure lending by banks will initially require the support of the GoM and DFIs to provide long-term liquidity. However, banks should be able to access the capital market today through traditional corporate bonds.
187. Significantly, Malawi would not be able to deepen the long-term finance market without testing newer vehicles and capital market instruments and launching learning pilots. The efforts by Old Mutual to set up a pooled investment fund is a welcome step. Working with Old Mutual and other domestic investors to facilitate a more broad-based and practical collaboration (involving the government, DFI, and the private sector) that can help mobilize capital at scale is worth considering. The study therefore recommends three interventions to deepen the domestic financial market.
Facilitate access to long-term liquidity to catalyze commercial bank lending to infrastructure
188. If banks can access long-term liquidity, they should be able to seize opportunities in various sectors, including energy projects, for example, solar IPPs, which are not as large in terms of capital requirement compared to large hydro power solutions and gestation periods are shorter. A number of these energy projects should be coming on stream in the next few years as ESCOM has signed PPAs with several entities. Other nontraditional sectors—mortgage/housing, manufacturing facilities, and agriculture-related infrastructure—also offer opportunities for banks.
189. In the initial phases of market development, the GoM and DFIs could facilitate access to long-term liquidity through MAIIC in the form of direct lines of credit, either to refinance banks’ portfolios or to co-invest with banks. MAIIC will also need to mobilize other forms of finance, including equity investments from domestic and foreign investors. Figure 57 shows a market development role that the Government of
137 Due to uncertainties associated with the construction phase, infrastructure projects are relatively more likely to require debt restructurings in unforeseen events, and lenders (usually few in a transaction compared to bond investors who can be many) can quickly negotiate restructurings among each other.

MALAWI: MOBILIZING LONG-TERM FINANCE FOR INFRASTRUCTURE
106
Tanzania, with the support of the World Bank, played at the early stages of the development of the mortgage market by setting up a mortgage refinancing company, providing it with long-term liquidity to onlend to banks. The company also acted as the center of excellence for market development, providing technical assistance to the market and setting standards for mortgage lending as an offering. After 10 years of operation, the company can now access capital markets (it has a 5-year MTN and has already issued two bond tranches) and has mobilized debt and equity investments from other more commercial investors, including from IFC. MAIIC could play a similar role in Malawi. Using a wholesale model that can serve the entire system will allow banks’ deposits to be leveraged without liquidity concerns and give access to long-term liquidity to qualifying banks in the system. Removing long-term funding as a barrier to entry for banks will also promote competition among market participants.
Figure 57: Access to long-term liquidity to create the mortgage market in Tanzania, facilitated by the World Bank
Source: World Bank staff.
190. Banks could also directly access long-term funds through the capital market by issuing corporate bonds. In other countries, financial institutions are the main players in the capital market both as issuers of equity and debt instruments and as investors. A diversified funding profile of banks is also a key indicator of financial stability; hence, the RBM could facilitate the move to the capital market through a regulation that mandates banks to issue long-term bonds to extend the tenor of their liabilities. This could be implemented in a phased manner. Banks’ issuances could range from bonds to meet general long-term lending liquidity needs to more specific issuances, for example, for infrastructure finance and mortgage lending.
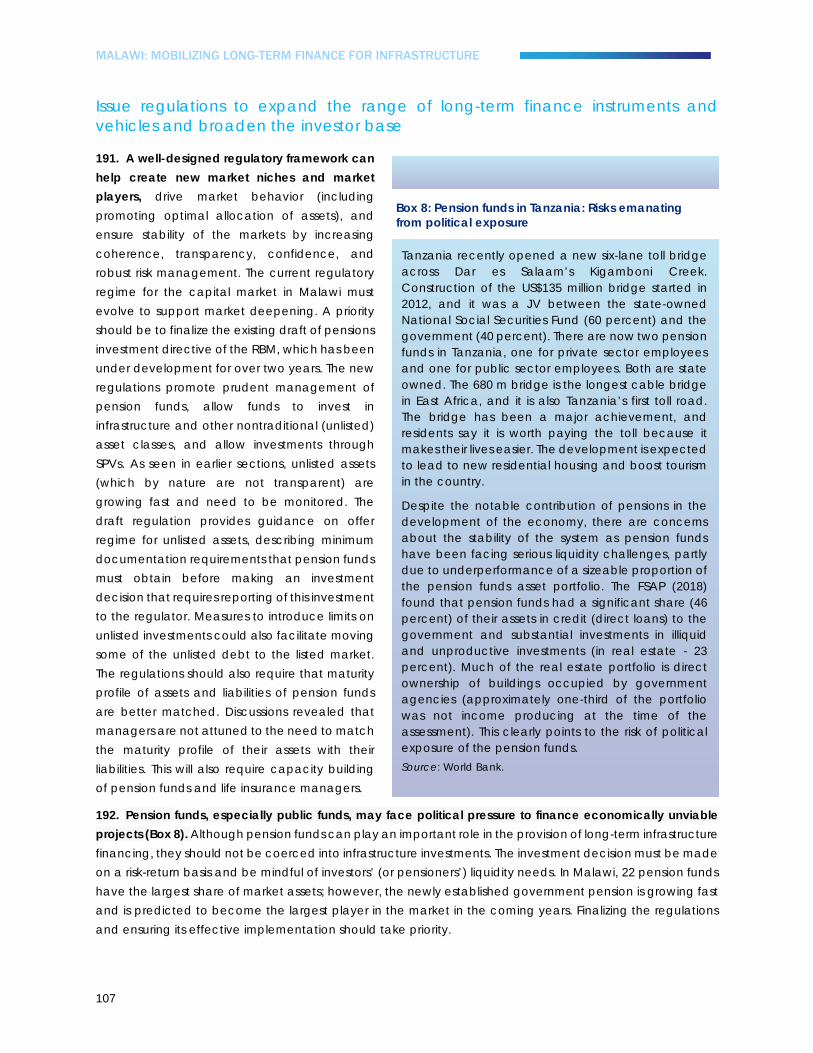
MALAWI: MOBILIZING LONG-TERM FINANCE FOR INFRASTRUCTURE
107
Issue regulations to expand the range of long-term finance instruments and vehicles and broaden the investor base
191. A well-designed regulatory framework can help create new market niches and market players, drive market behavior (including promoting optimal allocation of assets), and ensure stability of the markets by increasing coherence, transparency, confidence, and robust risk management. The current regulatory regime for the capital market in Malawi must evolve to support market deepening. A priority should be to finalize the existing draft of pensions investment directive of the RBM, which has been under development for over two years. The new regulations promote prudent management of pension funds, allow funds to invest in infrastructure and other nontraditional (unlisted) asset classes, and allow investments through SPVs. As seen in earlier sections, unlisted assets (which by nature are not transparent) are growing fast and need to be monitored. The draft regulation provides guidance on offer regime for unlisted assets, describing minimum documentation requirements that pension funds must obtain before making an investment decision that requires reporting of this investment to the regulator. Measures to introduce limits on unlisted investments could also facilitate moving some of the unlisted debt to the listed market. The regulations should also require that maturity profile of assets and liabilities of pension funds are better matched. Discussions revealed that managers are not attuned to the need to match the maturity profile of their assets with their liabilities. This will also require capacity building of pension funds and life insurance managers.
192. Pension funds, especially public funds, may face political pressure to finance economically unviable projects (Box 8). Although pension funds can play an important role in the provision of long-term infrastructure financing, they should not be coerced into infrastructure investments. The investment decision must be made on a risk-return basis and be mindful of investors’ (or pensioners’) liquidity needs. In Malawi, 22 pension funds have the largest share of market assets; however, the newly established government pension is growing fast and is predicted to become the largest player in the market in the coming years. Finalizing the regulations and ensuring its effective implementation should take priority.
Tanzania recently opened a new six-lane toll bridge across Dar es Salaam’s Kigamboni Creek. Construction of the US$135 million bridge started in 2012, and it was a JV between the state-owned National Social Securities Fund (60 percent) and the government (40 percent). There are now two pension funds in Tanzania, one for private sector employees and one for public sector employees. Both are state owned. The 680 m bridge is the longest cable bridge in East Africa, and it is also Tanzania’s first toll road. The bridge has been a major achievement, and residents say it is worth paying the toll because it makes their lives easier. The development is expected to lead to new residential housing and boost tourism in the country.
Despite the notable contribution of pensions in the development of the economy, there are concerns about the stability of the system as pension funds have been facing serious liquidity challenges, partly due to underperformance of a sizeable proportion of the pension funds asset portfolio. The FSAP (2018) found that pension funds had a significant share (46 percent) of their assets in credit (direct loans) to the government and substantial investments in illiquid and unproductive investments (in real estate - 23 percent). Much of the real estate portfolio is direct ownership of buildings occupied by government agencies (approximately one-third of the portfolio was not income producing at the time of the assessment). This clearly points to the risk of political exposure of the pension funds. Source: World Bank.
Box 8: Pension funds in Tanzania: Risks emanating from political exposure

MALAWI: MOBILIZING LONG-TERM FINANCE FOR INFRASTRUCTURE
108
193. There is no regulatory framework for the public bond market; hence, a new framework will be needed. The new framework would need to account for the differences and needs of the corporate bonds compared with project bonds. For example, the type of requirements applicable for the corporate bonds, for example, the requirements to provide several years of financial performance history, would be impractical for project bonds.
Introduce a program of transaction testing, pilots, and market sounding to systematically link supply and demand sides of the market
Expand the issuer base and pilot capital market instruments
194. The GoM and the regulator should support development of instruments that will enable SOEs and private infrastructure operators to access market finance while increasing investment options for institutional investors. This may take the form of quasi-public instruments (for example, utilities/SOEs issuing bonds). The PPP program is still developing. However, over time, as the creation of bankable infrastructure projects advances and more projects become operational, project bonds could also be issued by SPVs, either set up by SOEs/GoM (for example, in the case of the Mpatamanga project) or by private operators (IPPs)—Figure 58.
195. Demand assessment of SOEs shows that their balance sheets could allow RFA and EGENCO to borrow to the tune of MWK 21.9 billion (US$30 million) annually over 10 years. RFA is already beginning to prepare for another bond issue (this time a public issue)—its plan is to issue up to MWK 50 billion (US$68 million) over the next five years. RFA also plans to list on the stock exchange the existing bonds which were privately placed with commercial banks. EGENCO has also indicated that it plans to issue a bond in the near future. LWB could be a candidate for market access in the near future, if borrowing capacity improves. MHC has substantial potential to tap into market-based finance. With its strong collateral, the entity can immediately access commercial bank loans for short-term bridge finance for construction. However, raising a substantial amount of debt in the capital market will require MHC to first develop a detailed strategy for property development based on market demand and other market conditions and improve its overall PAT (which could be achieved within a year, if MHC continues to make incremental internal reforms).
Figure 58: Potential capital markets instruments
Source: World Bank staff.

MALAWI: MOBILIZING LONG-TERM FINANCE FOR INFRASTRUCTURE
109
196. Diversifying funding into more market-based instruments will cause SOEs to exercise discipline due to market monitoring and oversight. RFA’s experience of accessing the capital market offers some
fundamental lessons to the GoM/other SOEs:
• The capital market in Malawi can be accessed for infrastructure funding. The first SOE corporate bond indicates an appetite for quality infrastructure investment opportunities, provided the conditions are right.
• The quality of the SOE board and management and the corresponding credibility in the market are crucial. The management of SOEs must be known by and provide confidence to financial market players, that they have the capacity to improve and sustain performance in the medium to long-term.
• The governance of SOEs must be transparent, accountable, and responsible and seen to be having these attributes by the market.
• The creditworthiness and the consistent discretionary revenue give comfort to the investors, allowing competitive pricing.
• Reasonable yields can be obtained by ensuring transparency and competitiveness.
• SOEs must be innovative in approaching the market in a way that minimizes the need for the government to provide guarantees. The market usually requires guarantee of repayment; hence, the key lies in improving operational and financial performance (sufficient internal resources to meet liquidity ratio, solvency ratio, and so on) to mitigate the risk of defaults, which, in the end, will create more explicit liabilities for the GoM. SOEs could also use ringfenced revenue or monetizable assets (where they exist) as security.
• The policy environment and legislative environment must be consistent and predictable. In the case of RFA, the government provided a guarantee to bond holders that the RFA Act, which provides predictability of policy and board/management actions, will not be changed before the bonds matures.
197. In the medium term, the GoM could also consider selling a portion of its equity in some of the SOEs to mobilize finance and inject private sector efficiency into the SOEs. In addition, if shares are listed on the stock
exchange, it will help increase the supply of equity instruments. EGENCO and MHC hold the potential for future privatization or monetization of assets. The electricity generation sector was unbundled to operate as a private market with eventual privatization of EGENCO, and MHC operates in a market with great private sector interest. Equity investments by the private sector could be an attractive option for the GoM, which could sell a portion of its shareholding at an appropriate premium. This will also bring a new private sector discipline to the governance of the entity and give confidence to both concessional and commercial investors. MHC is also operating in a space that is attractive for the private sector. The GoM’s shares could be sold to either individual investors or to the public through the stock exchange.138
198. If the bridge between investors and the infrastructure providers is to be created, SOEs will need some handholding and innovation in market instruments. The support of transaction advisors will be required. An investment-grade rating, for the institution and/or for the bond, would be value adding. Energy utilities are preparing audited financial statements post unbundling in conformity with national/international accounting
138 Selling shares through the capital market would contribute to further development of the capital market.

MALAWI: MOBILIZING LONG-TERM FINANCE FOR INFRASTRUCTURE
110
regulations. The utilities are also undergoing a financial restructuring process. In anticipation of market access, and if it is justified (following the outcome of the restructuring), the utilities should aim to obtain a credit rating. Such support can also be provided through the proposed PPF.
199. Various forms of credit enhancements will be needed. Some SOEs, such as MHC, have assets that could
be monetized or used as collateral. Institutions such as GuarantCo, which guarantee local currency bonds (Box 9), can play an important role in providing credit enhancement to investors through SOE bonds. GuarantCo provides different forms of guarantees to investors, including partial credit guarantees, partial risk guarantee, liquidity guarantees, and tenor extension. Tenor extension would be an important instrument in the case of Malawian issuers. However, this kind of support to SOEs will need to be closely linked to operational improvements over a credible time frame. Investors in Malawi’s infrastructure could also access credit and investment insurance from the African Trade Insurance (ATI) Agency covering political risk insurance, commercial credit insurance, and insurance against non-honoring of sovereign and sub-sovereign obligation, among others. ATI is also part of the African Energy Guarantee Facility, which is a risk-sharing platform created by the European Investment Bank (EIB), MunichRe, and ATI to boost ATI’s insurance capacity and provide up to US$1 billion in reinsurance capacity for sustainable energy projects in Africa. In this arrangement, EIB guarantees MunichRe, which reinsures ATI, which in turn insures investors in African energy projects. Technical support in structuring and negotiating the terms related to the different types of credit enhancements, which could be provided by development partners, would be critical.
200. Other companies, including commercial banks, can also issue debt instruments to raise long-term
liquidity. The current high ratio of loan concentration in the banking system, with banks exposed to same borrowers, is alarming. Large corporations also have direct loans from pension funds and life insurance companies, which has contributed to the growth of unlisted investments. Encouraging these corporations to either issue new bonds in the listed market or move their existing private debt with institutional investors to the listed market should be explored. This will benefit the market by (a) reducing concentration in the banking system and (b) increasing the supply of listed instruments (a more transparent market), which works well for institutional investors. In this regard, opportunities for demonstration transactions exist—through engagement with the regulator, investors, and potential issuers. The role of the MSE in promoting new listings and continuously improving the listing regime will be critical.
Box 9: GuarantCo: Local currency bond guarantee in Kenya
In late 2019, GuarantCo provided a partial credit guarantee to investors through a KES 5 billion (~US$50 million) MTN program issued by Acorn (a property developer in Kenya), to fund the construction of accommodation for 5,000 students in Nairobi. This was the first ever green bond in Kenya expected to meet international green building standards for water, energy, and construction materials, ensuring lower operation costs and a low-carbon impact over the long term. The bond was rated B1 by Moody’s (higher than the sovereign bond rating of B2) and was the first nongovernmental green bond rated by Moody’s in Africa. Investors from Kenya and the East African Community region bought about 70 percent of bond issue while the rest was bought by foreign investors. There were four Kenyan investors—two commercial banks and two reinsurance companies.
Source: GuarantCo.

MALAWI: MOBILIZING LONG-TERM FINANCE FOR INFRASTRUCTURE
111
Facilitate the creation of nontraditional structures for channeling long-term finance from domestic institutional investors
201. Direct investment in infrastructure by individual investors would prove difficult given their limited experience and the complexity of direct investment which requires specialized skills and teams. With the current growth of long-term funds, investors are feeling the pressure, and Old Mutual is taking the lead to set up a pooled investment vehicle that would crowd-in other like-minded long-term investors. The benefits of establishing a local currency-denominated vehicle include (a) institutional investors’ access to a vehicle that matches their needs and preferences and is aligned with their risk-return-profiles; (b) significant economies of scale in sourcing potential investments and undertaking due diligence of investments using specialized team/managers; (c) risk diversion through a portfolio investment approach; and (d) stronger negotiation position with contractors, concessionaires, and contracting/granting authorities. In addition, having local investors committed to domestic investments lends credibility and a measure of validation and can help generate greater interest from foreign investors who prefer to co-invest with local partners and leverage their local knowledge and networks.
202. Thematic investment funds are an option. Old Mutual is spearheading the setting up of a specialized investment vehicle that would pool institutional investors’ funds (domestic and foreign) for long-term investments, including infrastructure. Old Mutual is looking at collaborative models/structures that could help unlock institutional capital (both domestic and foreign) on a large scale. In discussions, Old Mutual indicated the need for mobilizing first loss capital (which can be provided by a DFI) or MIGA insurance and support for investor dialogue (with both domestic and foreign investors). This provides opportunities for a broader dialogue among investors, the GoM, DFIs, and the regulator facilitating such a structure, for example, through the enabling regulation (the draft RBM regulation pension fund investments which makes provision for SPVs will need to be finalized quickly) potentially providing capital (including a first loss capital) and supporting investor dialogue. Box 10 provides an example of a market-led fund structure that crowds-in pension funds, institutional investors, and DFI to spur investments in greenfield infrastructure projects (which form the majority of projects in Malawi).
203. Typically, investment funds have a focused scope (narrow set of sectors). However, setting up a purely infrastructure fund today in Malawi will face difficulties in accessing a pipeline of investible assets. Old Mutual recognizes this challenge, and hence, its proposed fund is expected to initially include broader infrastructure sectors (for example, housing/real estate). The fund will also maintain an in-house origination team that will be tasked with sourcing projects, working with their partners in South Africa. As the infrastructure pipeline grows, the fund is expected to take a more substantive position in infrastructure assets since they offer the risk-return profile that matches the needs of investors with long-dated liability profile. As highlighted earlier, Old Mutual will initially invest its own funds but over time expect to demonstrate success to other investors and government institutions.
204. The fund manager is an important determinant of fund performance. To avoid potential conflicts of interest and to ensure commercial objectives of the fund, it should be managed by a highly experienced fund manager (under an entity to be established as an asset management company) in a local domicile. Currently, none of the financial institutions (including the pension funds) in Malawi have experience in infrastructure investment, and it will take some time for them to be equipped with adequate expertise to properly carry out necessary due diligence on individual transactions before making final investment decisions. In this respect, it would be necessary to rely on a professional fund manager in the region for the initial years until the domestic pension funds become more familiar with the infrastructure asset class.

MALAWI: MOBILIZING LONG-TERM FINANCE FOR INFRASTRUCTURE
112
205. In other markets, initiatives with government involvement (operating on market-based principles) have been used to encourage institutional investors to invest in infrastructure. Given the political nature of infrastructure projects, collaboration between the government and the private sector could help achieve desired outcomes. Close relationship with the government can enable access to a bankable project pipeline without compromising independence of investment decisions based on viability checks. Box 11 shows an example of how a collaborative initiative with government involvement has been effectively done in the Philippines through the government-led Philippine Investment Alliance for Infrastructure (PINAI). The fund (US$625 million) was initiated by the Government of the Philippines (with the Government Service Insurance System fund holding 64 percent of the fund’s assets) and attracted other private investors—the Dutch pension fund asset manager, APG (24 percent of assets), and Macquarie Infrastructure and Real Assets (MIRA) (2 percent), which is a private asset manager that was selected to manage the PINAI fund. Key success factors for these types of funds include (a) operating models based on market principles, (b) clarity between policy and commercial objectives, (c) professional staff with expertise in creating the value needed for economic return maximization and balancing market compensation to attract professional talent with outreach strategies to ensure teams do not end up operating as oases of excellence, (d) close relationship with the government to enable access to bankable projects without compromising the independence of investment decisions, and (e) continuous market validation to enhance the learning curve. These types of collaborative models can help mobilize larger amounts of needed capital.
206. The World Bank Group could offer some experience from other markets in this regard, including working closely with the relevant government authorities, prospective sponsors, commercial lenders, and fund management entity to provide technical assistance in the structuring of such funds. Its support may include, but not be limited to, conducting analysis of market dynamics and the fund design to meet current and future demand, supporting regulatory reforms, providing support to structure the fund and identify prospective sponsors and fund manager(s), facilitating dialogue between investors (local and foreign) as part of support to mobilize funds, and identifying quality seed infrastructure assets/demonstration transactions for the proposed fund.

MALAWI: MOBILIZING LONG-TERM FINANCE FOR INFRASTRUCTURE
113
Meridiam funds are market-led funds launched in 2006 through an investment of €190 million by the global construction firm AECOM and the Credit Agricole group (via Predica and Credit Agricole Private Equity). Meridiam has now grown to have three PPP equity-only funds, each with a maturity of 25 years investing predominantly in greenfield investments in transportation, social, and environmental infrastructure in OECD countries in Europe and North America. Meridiam also set up a similar fund—the Meridiam Infrastructure Africa Fund—to develop a long-term infrastructure fund dedicated to Africa. The main investor base of Meridiam’s funds are pension funds, followed by life insurance companies. Others include public development institutions, the EIB, European Bank of Reconstruction and Development, the CDC Group, and the Development Bank of Japan.
Structure of the fund Meridiam is involved in projects from the design stage onward and selects leading industrial partners with the specialist skills required. This has been crucial in helping to attract investment from institutional investors like pension funds and insurance companies who traditionally have been averse to taking on greenfield construction risk. Investors also gain assurance in the Meridiam funds, despite the fund taking on construction risk, by investing alongside reputable development institutions. The firm’s extensive experience and strong track record of dealing with reliable contractors to carry out development tasks have been central to help provide confidence to institutional investors to invest in the funds. Because the risk is idiosyncratic, there is an emphasis placed on diversification and having a portfolio of assets that are able to provide a balance between those that perform well and those that fail. Meridiam’s corporate governance guarantees total independence of the investment decision-making process. Its investment committee has responsibility for investment decisions and the fund’s operations. This committee consists of four Meridiam representatives and independent members. The funds invest in projects with an amount no less than €10 million and co-investment solutions enable Meridiam to provide up to €1 billion of equity to a single transaction. The average net return targeted by the fund is 11–12 percent over 25 years.
Benefits The Meridiam funds provide a good example of unlisted equity fund opportunities for institutional investors that have a time horizon and fee structure more aligned with the core economic infrastructure definition that has been sold to institutional investors. The funds also provide a good example of how institutional investment can be attracted into vehicles that take on development risk, an area that institutional investors have been reluctant to be exposed to. It was also noted that having development institutions as investors helps Meridiam gain access to deal flow and prospective investment opportunities without having to scour for deals and go through a costly auction process. As more PPP opportunities become available in jurisdictions around the world, the Meridiam example could be a model for enabling smaller institutional investors that are unable to invest directly to gain access to infrastructure development projects. Source: OECD and Meridiam.
Box 10: An example of a market-led investment vehicle: Meridiam (Europe, North America, and Africa)

MALAWI: MOBILIZING LONG-TERM FINANCE FOR INFRASTRUCTURE
114
The PINAI fund is a government-led initiative with private sector participation set up in 2012. PINAI is an unlisted close-ended fund dedicated to investing in core infrastructure assets in the Philippines. The fund concept arose from efforts by the Government of the Philippines to find ways to catalyze private sector investment in infrastructure. The PINAI fund provides an example of how a fund can be set up with government involvement to help attract institutional investment in the much-needed investment areas of the emerging economies. Structure of the fund The fund was formed in a reverse order compared with most other infrastructure funds, with the cornerstone investors first coming together before the selection was made for an appropriate manager for the fund. Three cornerstone investors make up the fund, the Government Service Insurance System fund (64 percent of fund’s assets), the Asian Development Bank (4 percent), and the Dutch pension fund asset manager APG (24 percent). After a thorough manager selection process, MIRA—a private alternative asset manager—was selected to manage the fund and also provided equity (8 percent) into the fund. The total size of the fund is US$625 million. It is a closed-end fund with a time horizon of 10 years and was structured to invest in equity and equity-like instruments directly in infrastructure businesses and projects. PINAI is managed by MIRA, which is responsible for all major investment, divestment, and management decisions within the fund’s overall mandate. An advisory committee (made up of the cornerstone investors) makes decisions with respect to expanding the fund’s mandate and any related-party transactions. Benefits The unique aspect of the PINAI fund is the close relationship between the manager (MIRA) and its investors because of the small number of parties. The investors in PINAI have a good understanding of market conditions and investment climate, which makes it easier to communicate with each other. While the investors have no formal role in management, mutual sharing of market information and insights greatly assists the sourcing, evaluation, and management of PINAI’s investments. In general, EMDEs like the Philippines face a large gap between investment needs and investment supply. The government, which has an emphasis on infrastructure investment, with a focus on the use of PPPs in the country, is creating a market through its pipeline of PPP projects, allowing the PINAI fund to focus uniquely on the Philippines. Downsides Considering the relatively short time horizon of 10 years, it is argued that there needs to be a balance between the life of the fund and the long-term nature of the assets. Investors generally expect an opportunity to realize their investment after a defined period, with 10 years considered a suitable period to implement management and business improvements. Source: OECD and MIRA.
Box 11: An example of a public-private investment vehicle: PINAI

MALAWI: MOBILIZING LONG-TERM FINANCE FOR INFRASTRUCTURE
115
Enhance competition/supply of services and build capacity of market intermediaries
207. New market intermediaries will need to be created and regulations will be required to facilitate their introduction and operation. The market will require well-regulated, independent, and credible credit rating agencies. In the early stages of market development, Malawi issuers may have to seek the services of agencies in the region such as the GCR of South Africa. As the market develops and regulations are in place, new rating agencies could set up in Malawi. A regulatory framework with incentives for market makers will also be required. In light of its sovereign debt management strategy and by considering the expected benefits on the local market, the GoM should assess and determine the point at which primary dealers could be introduced.
208. Increasing the capacity of market participants will be a critical aspect of market development. All players, existing and those to be created, will need new skills and support to navigate the new territory of infrastructure/long-term investment. The regulator could require training programs for market participants; however, experience is best gathered over time as investors and market participants work on transactions. Knowledge and skills transfer can also take place between some of the firms in Malawi and their group offices in South Africa. The establishment of pooled investment vehicle specialized managers would also be one of the ways to minimize the impact of limited skills within individual companies. Capacity building should be targeted toward increasing the supply of competent transaction advisors, investment managers, and credit analytics firms—transaction costs are high and sometimes opaque due to limited competition. Training and accreditation programs for fund managers to improve their capacity in long-term investments/matching profiles of their assets and liabilities will also be needed.

116
References

MALAWI: MOBILIZING LONG-TERM FINANCE FOR INFRASTRUCTURE
117
References Africa 50. 2018. Annual Report.
African Development Bank. 2019. Unleashing the Potential of Institutional Investors in Africa.
African Development Bank. 2015. Nkhata Bay Water Supply and Sanitation.
African Development Bank, Infrastructure Consortium for Africa. 2018. Infrastructure Financing Trends in Africa - 2018.
African Perspectives Global Insights, South African Institute of International Affairs. 2019. Bridging the Divide: Integrating SADC’s Capital Markets.
American Journal of Theoretical and Applied Business. 2018. Sane Pashane Zuka. Effects of Rent-Controlled Public Housing on the Supply of Private Rented Housing and Household Mobility in Malawi: A Case Study of Malawi Housing Corporation.
Blantyre Water Board. 2018. Strategic Plan 2015–2020.
Bank for International Settlements. 2014. Understanding the Challenges of Infrastructure Finance.
Rwanda’s Capital Market Authority. 2018. Capital Market Master Plan for Rwanda. “Making Capital Market Work for Rwanda.”
CDH Investment Bank. 2018. Feasibility Study Report for the Establishment of a Development Finance Institution in Malawi.
City Climate Finance Leadership Alliance. 2018. Summary of Good Practice of Successful Project Preparation Facilities.
Convergence. 2019. The State of Blended Finance.
Electricity Supply Corporation of Malawi. 2018a. Investment Strategy July 2018 to June 2023.
Electricity Supply Corporation of Malawi. 2018b. Integrated Strategy Plan 2017–2018.
Electricity Supply Corporation of Malawi. 2018c. Malawi Electricity Sector Investment Plan 2018–2023.
Electricity Generation Company. 2018. Strategic Plan 2018 to 2033.
Electricity Generation Company. 2019. Integrated Annual Report.
Eskom Pension and Provident Fund. 2019. Integrated Report.
Federal Ministry for Economic Cooperation and Development (BMZ). 2017. Mobilization of Long-term Savings for Infrastructure Financing in Africa.
Fichtner. 2016. Feasibility Study: Conceptual Design and Tender Documents for the Mozambique Malawi Transmission Line.
Finmark Trust and Habitat for Humanity. 2009. Overview of the Housing Finance Sector in Malawi.
FONSIS SA. 2018. Annual Report.

MALAWI: MOBILIZING LONG-TERM FINANCE FOR INFRASTRUCTURE
118
Fundo Soberano de Angola. 2017. Relatório Trimestral de Actividades.
Fundo Soberano de Angola. 2017. Fundo de Capital de Risco Para o Ramo da Infrastructure.
Gamula, Gregory E. T., Liu Hui, and Wuyuan Peng. 2013. An Overview of The Energy Sector in Malawi.
Global Credit Rating. 2016. ESCOM Credit Rating Report.
Global Economic Governance Africa. 2018. The Case for Infrastructure as an Asset Class.
Global Impact Investing Network. 2013. Catalytic First-Loss Capital.
Government Employees Pension Fund. 2019. Annual Report.
Government of Malawi. 1995. Waterworks Act, 1995.
Government of Malawi. 2003. Public Finance Management Act, 2003.
Government of Malawi. 2013. Water Resources Act, 2013.
Government of Malawi. 2014. Malawi Code: Sector Guidelines for Parastatal Organizations and State-owned Enterprises.
Government of Malawi. 2015. Long-term Finance Policy: Issues and Recommendations.
Government of Malawi. 2017a. Malawi Growth and Development Strategy (MGDS) III.
Government of Malawi. 2017b. Public Procurement and Disposal of Public Assets Act, 2017.
Government of Malawi. 2017c. The Public Service Reforms Commission: Implementation Completion Report.
Government of Malawi. 2017d. The Malawi Growth and Development Strategy 2017 to 2022.
Government of Malawi. 2017e. The Malawi Housing Corporation Amendment Act (No. 2).
Government of Malawi. 2018a. Malawi National Public Sector Reforms Policy, 2018–2022.
Government of Malawi. 2018b. National Energy Policy.
Government of Malawi. 2018c. Report of the Auditor General on the Selected Accounts of Statutory Boards.
Heritage Fund, FirstBanc Financial Services. 2016. Annual Report.
International Finance Corporation. 2018. MCPP: An Innovative Debt Mobilization Platform.
IMF (International Monetary Fund). 2018. Malawi: First Review under the Three-Year Extended Credit Facility Arrangement and Requests for Modification and Waivers of Nonobservance of Performance Criteria - Press Release; Staff Report; and Statement by the Executive Director for Malawi.
IMF. 2007. Capital Market Development in a Small Country: The Case of Slovenia.
IMF. 2014. The Development of Local Capital Markets: Rationale and Challenges.
IMF. 2018a. Malawi: Technical Assistance Report - Public Investment Management Assessment.
IMF. 2018b. Malawi Selected Issues.

MALAWI: MOBILIZING LONG-TERM FINANCE FOR INFRASTRUCTURE
119
Institute of International Finance. 2020. Capital Flows Report: Sudden Stop in Emerging Markets.
International Organization of Securities Commissions. 1999. Influence of Market Makers in the Creation of Liquidity.
International Organization of Securities Commissions. 2002. Development of Corporate Bond Markets in Emerging Market Countries.
International Renewable Energy Agency. 2012. Renewable Energy Technologies: Cost Analysis Series Power Sector Issue 3/5.
Invesco. 2019. Invesco Global Sovereign Asset Management Study.
Lilongwe Water Board. 2015. Infrastructure Investment Plan Implementation, 2016–2026.
Kojima, M., X. Zhou, J. Jeesun Han, J. de Wit, R. Bacon, and C. Trimble. 2016. “Who Uses Electricity in Sub-Saharan Africa? Findings from Household Surveys.” Policy Research Working Paper 7789.
Malawi Electricity Regulatory Agency. 2015. Regulating Energy for Sustainable Development: The New Tariff Methodology.
Malawi Electricity Regulatory Agency. 2018a. Board Revised Revenue Requirements Version 3.2.
Malawi Electricity Regulatory Agency. 2018b. Board Resolution on ESCOM Base Tariff Application for 2018–2022.
Malawi Housing Corporation. 2018. Strategy Plan 2018 to 2023.
Mercer. 2018. Investment in African Infrastructure: Challenges and Opportunities.
Ministry of Agriculture, Irrigation and Water Development. 2012. Malawi Water Sector Investment Plan Volume I.
Milken Institute Center for Financial Markets. 2015. Capital Markets in Rwanda: Assessment and Aspirations.
Milken Institute Center for Financial Markets. 2016. Framing the Issues: Developing Capital Markets in Rwanda.
Ministry of Energy. 2016. Malawi Integrated Resource Plan.
Ministry of Energy. 2018. Malawi National Electrification Strategy Report Gap Analysis Report.
National Hydropower Association. 2018. Information brochures.
National Statistics Office. 2015. Statistical Yearbook.
Netgroup. 2010. ESCOM Financial Sustainability Plan.
Nigeria Sovereign Investment Authority. Annual Report & Accounts 2018.
Northern Region Water Board. 2018. Revised Strategic Plan, 2015-2020.
OECD (Organisation for Economic Co-operation and Development). 2014. Pooling of Institutional Investors Capital - Selected Case Studies in Unlisted Equity.
OECD. 2020. Pension Markets in Focus 2020. http://www.oecd.org/finance/pensionmarketsinfocus.htm.

MALAWI: MOBILIZING LONG-TERM FINANCE FOR INFRASTRUCTURE
120
Old Mutual Limited. 2019. Integrated Annual Report.
OMFIF, ABSA. 2019. ABSA Africa Financial Markets Index 2019.
Overseas Development Institute. 2016a. Project Preparation for Sustainable Infrastructure.
Overseas Development Institute. 2016b. Finding the Pipeline: Project Preparation for Sustainable Infrastructure.
Overseas Development Institute. 2018. Private Infrastructure Financing in Developing Countries: Five Challenges, Five Solutions.
Parliament of the Republic of South Africa. 2015. Report on State-Owned Enterprises for the Standing Committee on Finance.
Preqin. 2016a. Are Co-investments Here to Stay?
Preqin. 2016b. Preqin Special Report: The Infrastructure Market in Africa.
Preqin. 2018. Australia Superannuation Funds in Alternatives.
Preqin. 2019. 2019 Preqin Global Infrastructure Report.
Preqin. 2020a. Preqin Quarterly Update: Infrastructure Q1 2020.
Preqin. 2020b. 2020 Preqin Global Infrastructure Report.
PwC. 2016. Sovereign Investors 2020: A Growing Force.
Public-Private Infrastructure Advisory. 2017. Technical Assistance in Malawi: Impact Assessment Report.
Sanlam. 2019. Integrated Annual Report.
SOE Network for Southern Africa. 2015. Guidelines on the Governance of State-Owned Enterprises for Southern Africa.
Sadoff, C. W., J. W. Hall, D. Grey, J. C. J. H. Aerts, M. Ait-Kadi, C. Brown, A. Cox, S. Dadson, D. Garrick, J. Kelman, P. McCornick, C. Ringler, M. Rosegrant, D. Whittington, and D. Wiberg. 2015. Securing Water, Sustaining Growth: Report of the GWP UNICEF.
Reserve Bank of Malawi. 2018. Financial and Economic Review 52 (2).
Reserve Bank of Malawi. 2019a. Financial Institutions Supervision Annual Report.
Reserve Bank of Malawi. 2019b. Financial Stability Report.
Scottish Government Climate Justice Fund. 2018. The Water Future Program.
Shelter Afrique. 2018. Annual Report.
The Association for Financial Markets in Europe (AFME), The International Capital Market Association. 2015. Guide to Infrastructure Financing: Bank Loans, Debt Private Placement and Public bonds - Smoothing the Pathway for Effective Funding.
MALAWI: MOBILIZING LONG-TERM FINANCE FOR INFRASTRUCTURE
121
The Boston Consulting Group. 2017. Infrastructure Financing in Sub-Saharan Africa: Best Practices from Ten Years in the Field.
The Infrastructure Consortium for Africa. 2014. Effective Project Preparation for Africa’s Infrastructure Development.
The Infrastructure Consortium for Africa. 2012. Assessment of Project Preparation Facilities in Africa. Volume A: Diagnostic & Recommendations.
United Nations Children’s Fund. 2019. Malawi 2018/19 WASH Budget Brief.
United Nations Economic and Social Commission for Asia and the Pacific. 2017. Tapping Capital Markets and Institutional Investors for Infrastructure Development.
United States Agency for International Development. 2016. Understanding the Factors that Drive South African Pension Funds to Invest in the Rest of Africa.
United States Agency for International Development. 2018. Investment Opportunities in African Infrastructure: Challenges and Opportunities.
Willis Towers Watson - Thinking Ahead Institute. 2019. “Global Pension Assets Study 2019.”
World Bank. 1995. Improving State Enterprises Performance: The Role of Internal and External Incentives.
World Bank. 2010. Malawi’s Infrastructure: A Continental Perspective.
World Bank. 2012. Economic Impacts of Poor Sanitation in Africa.
World Bank. 2014a. Corporate Governance of State-Owned Enterprises: A Toolkit.
World Bank. 2014b. Doing More with Less: Smarter Subsidies for Water Supply and Sanitation.
World Bank. 2014c. Public Investment Management for Public-Private Partnerships: A “PIM-for-PPP” Diagnostic Framework.
World Bank. 2014d. Resource Financed Infrastructure: Discussion on a New Form of Infrastructure Finance.
World Bank. 2016a. Strategic Investment Funds: Opportunities and Challenges.
World Bank. 2016b. Discussion Document: Financing Options and Market Sounding of the Electricity Sector.
World Bank. 2016c. Mobilizing Finance for Local Infrastructure Development in Vietnam a City Infrastructure Financing Facility.
World Bank. 2017a. Benchmarking PPP Procurement 2017 in Malawi.
World Bank. 2017b. Introducing Commercial Finance into the Water Sector in Developing Countries.
World Bank. 2017c. Lilongwe Water and Sanitation Project: Project Appraisal Document.
World Bank. 2017d. “Recovery and Financial Viability of the Power Sector in Developing Countries.” Policy Research Paper.
World Bank. 2017e. Promoting the Use of Capital Markets for Infrastructure Finance: Lessons for Securities Market Regulators in Emerging Market Economies.

MALAWI: MOBILIZING LONG-TERM FINANCE FOR INFRASTRUCTURE
122
World Bank. 2018a. “World Bank Group Support for the Reform of State-Owned Enterprises.” Approach Paper.
World Bank. 2018b. Financial Sector Assessment.
World Bank. 2018c. Financing Infrastructure in India: Addressing Constraints to MFD.
World Bank. 2018d. Infrastructure Sector Assessment Program, Indonesia.
World Bank. 2018e. Malawi Systematic Country Diagnostic: Breaking the Cycle of Low Growth and Slow Poverty Reduction.
World Bank. 2018f. Private Participation in Infrastructure (PPI) 2018 Annual Report.
World Bank. 2018g. Rwanda Investor Perceptions Survey 2018.
World Bank. 2018h. Vietnam: Maximizing Finance for Development in the Energy Sector.
World Bank. 2019a. Doing Business 2020.
World Bank. 2019b. Malawi Economic Monitor: Charting a New Economic Course.
World Bank. 2019c. Malawi Electricity Access Project: Project Appraisal Document.
World Bank. 2019d. Malawi Economic Monitor: Strengthening Human Capital Through Nutrition.
World Bank. 2019e. Malawi Poverty Outlook.
World Bank. 2019f. Private Participation in Infrastructure (PPI) 2019 Annual Report.
World Bank Group. 2015. World Bank Group Support to Public-Private Partnerships: Lessons from Experience in Client Countries (FY02–12).
World Economic Forum. 2015. Accelerating Emerging Capital Markets Development: Corporate Bond Markets.
WSP (Water and Sanitation Program). 2012. “Economic Impacts of Poor Sanitation in Africa.” Water and Sanitation Program. The World Bank.
123
Annexes

MALAWI: MOBILIZING LONG-TERM FINANCE FOR INFRASTRUCTURE
124
Annex 1: Macroeconomic charts Table 22: Selected macroeconomic indicators
2015 2016 2017 2018 2019
Est. National accounts and prices
GDP at constant market prices (percentage change) 2.8 2.5 4.0 3.5 4.4
Agriculture (2.0) (2.3) 5.0 2.4 4.3
Industry 3.5 2.4 2.2 2.0 3.4
Services 4.7 4.4 4.0 4.3 4.8
Consumer prices (annual average) 21.9 21.7 11.5 9.2 9.3
Central government (percent of GDP on a fiscal year basis)
Revenue and grants 21.4 21.6 23.5 20.8 20.8
Domestic revenue (tax and nontax) 18.6 17.8 20.0 19.3 18.8
Grants 2.8 3.7 3.5 1.4 2.0
Expenditure and net lending 27.1 27.6 28.2 28.5 27.4
Overall balance (excluding grants) (8.5) (9.8) (8.2) (9.2) (8.6)
Overall balance (including grants) (5.7) (6.1) (4.8) (7.8) (6.5)
Foreign financing 2.5 1.9 2.5 2.5 1.1
Domestic financing 3.3 1.7 0.9 6.2 5.4
Amortization (zero-coupon bonds) 0.8 2.5 1.3 (0.5) (1.4)
Privatization proceeds 0.0 0.0 0.3 0.0 0.0
Money and credit
Money and quasi money (percentage change) 23.7 15.2 19.7 11.4 12.8
Credit to the private sector (percentage change) 29.9 4.6 0.4 11.5 13.7
External sector (US$, millions, unless otherwise indicated)
Exports (goods and services) 1,616 1,502 1,675 1,852 1,993
Imports (goods and services) 2,346 2,569 2,606 2,709 2,771
Gross official reserves 670 605 757 790 777
(months of imports) 3.4 2.9 3.2 3.3 3.2
Current account (percent of GDP) (9.2) (14.7) (11.3) (10.9) (10.0)
Exchange rate (MWK per US$ average) 499.6 718.0 730.3 732.3 —
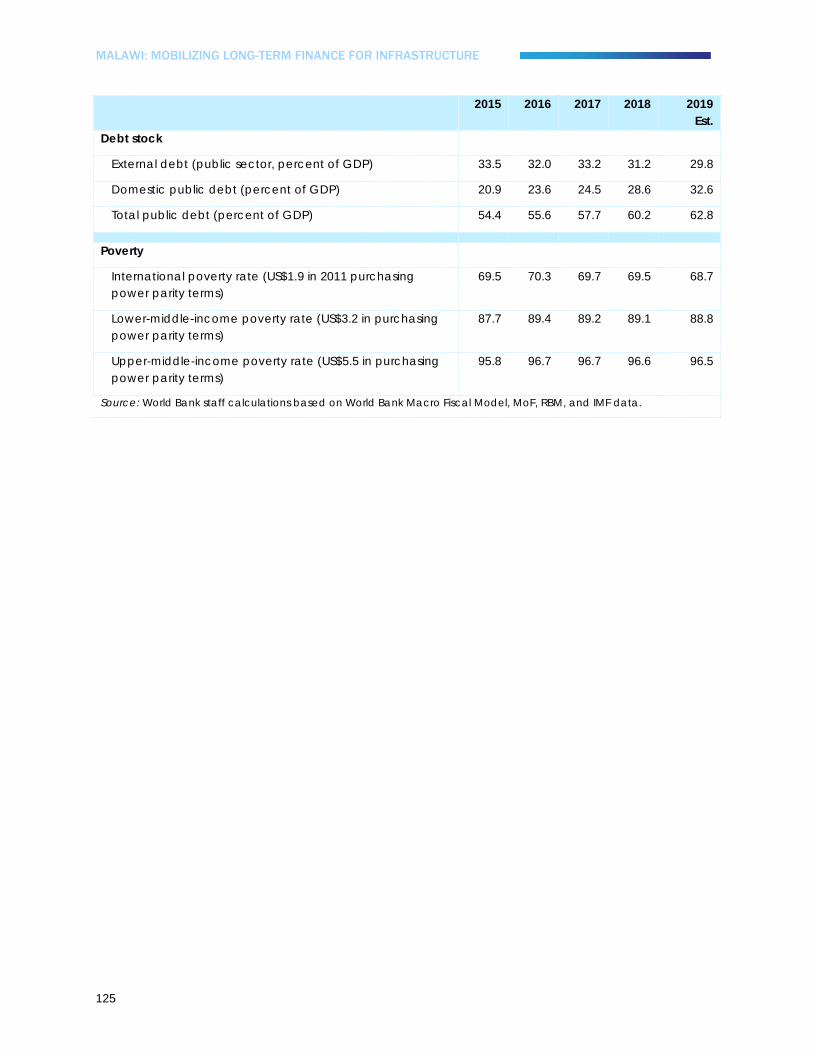
MALAWI: MOBILIZING LONG-TERM FINANCE FOR INFRASTRUCTURE
125
2015 2016 2017 2018 2019
Est. Debt stock
External debt (public sector, percent of GDP) 33.5 32.0 33.2 31.2 29.8
Domestic public debt (percent of GDP) 20.9 23.6 24.5 28.6 32.6
Total public debt (percent of GDP) 54.4 55.6 57.7 60.2 62.8
Poverty
International poverty rate (US$1.9 in 2011 purchasing power parity terms)
69.5 70.3 69.7 69.5 68.7
Lower-middle-income poverty rate (US$3.2 in purchasing power parity terms)
87.7 89.4 89.2 89.1 88.8
Upper-middle-income poverty rate (US$5.5 in purchasing power parity terms)
95.8 96.7 96.7 96.6 96.5
Source: World Bank staff calculations based on World Bank Macro Fiscal Model, MoF, RBM, and IMF data.

MALAWI: MOBILIZING LONG-TERM FINANCE FOR INFRASTRUCTURE
126
Table 23: Fiscal accounts
Percent of GDP
2015/16 2016/17 2017/18 2018/19 2019/20
Outturn Approved Revised
Revenue and grants 21.6 23.5 20.8 20.8 26.2 26.1
Revenue 17.8 20.0 19.3 18.8 23.8 23.2
Tax revenue 16.0 17.6 17.1 17.1 21.8 20.4
Nontax revenue 1.8 2.4 2.2 1.7 1.9 2.8
Grants 3.7 3.5 1.4 2.0 2.5 2.9
Budget support grants 0.5 0.3 — 0.6 — —
Dedicated grants 1.8 1.5 0.5 0.7 1.1 1.1
Project grants 1.4 1.7 0.9 0.7 1.4 1.8
Expenditure and net lending 27.6 28.2 28.5 27.4 28.9 31.0
Recurrent expenditure 23.5 21.7 23.8 22.2 21.5 23.1
Wages and salaries 6.4 6.2 6.5 7.1 7.3 7.7
Interest payments 4.0 4.3 3.9 4.1 4.0 4.0
Foreign 0.3 0.3 0.3 0.3 0.3 0.3
Domestic 3.7 4.1 3.6 3.8 3.8 3.8
Goods and services 5.8 5.9 6.7 6.7 5.6 6.8
Maize purchases 0.8 0.7 0.7 0.2 0.2 0.2
Subsidies and transfers 4.9 3.8 5.0 4.1 4.4 4.5
Fertilizer subsidy 1.8 0.7 0.7 0.7 0.6 0.6
Arrears payments 2.5 1.4 1.6 0.1 0.1 0.1
Zero-coupon Promissory Note (ZCPN) for securitizing arrears1 2.5 1.4 1.5 — — —
Development expenditure 4.0 6.4 4.7 5.0 7.2 7.8
Domestically financed 0.7 0.7 1.6 1.9 2.2 2.3
Foreign financed 3.3 5.8 3.1 3.1 5.1 5.5
Overall balance (including grants) excluding ZCPN3 (3.1) (3.4) (6.2) (6.5) (2.7) (4.9)
Overall balance (including grants) (6.1) (4.8) (7.8) (6.5) (2.7) (4.9)

MALAWI: MOBILIZING LONG-TERM FINANCE FOR INFRASTRUCTURE
127
2015/16 2016/17 2017/18 2018/19 2019/20
Outturn Approved Revised
Financing 6.1 4.9 8.2 6.4 2.7 5.2
Net foreign financing 1.9 2.5 2.5 1.1 1.8 1.8
Gross foreign borrowing 2.4 3.0 3.1 1.6 2.6 2.6
Budget support loans — — 1.3 — — —
Project loans 1.9 2.5 1.7 1.4 2.5 2.5
Other loans 0.5 0.5 0.1 0.2 0.1 0.1
Amortization (0.5) (0.6) (0.6) (0.6) (0.8) (0.8)
Net domestic borrowing 1.7 0.9 6.2 5.4 0.9 3.4
Securitization of domestic arrears 2.5 1.3 (0.5) (1.4) — —
Privatization proceeds — 0.3 — — — —
Memorandum items — —
Primary balance (including ZCPN2) (2.1) (0.5) (3.8) (2.4) 1.4 (0.9)
Primary balance (excluding ZCPN3) 0.9 0.9 (2.3) (2.4) 1.4 (0.9)
Figure 59: Public domestic debt shifting from RBM to commercial banks and non-bank sector
Public domestic debt (MWK, billions)
Figure 60: Domestic debt has been increasing, while external debt has declined
Public debt (Percent of GDP)
Source: World Bank staff calculations based on RBM data.
Source: World Bank staff calculations based on MoF data.
0
100
200
300
400
500
600
700
800
900
Jan-
15M
ay-1
5Se
p-15
Jan-
16M
ay-1
6Se
p-16
Jan-
17M
ay-1
7Se
p-17
Jan-
18M
ay-1
8Se
p-18
Jan-
19M
ay-1
9Se
p-19
Domestic debt held by commercialbanksDomestic debt held by non-banksector
0
10
20
30
40
50
60
70
2014 2015 2016 2017 2018 2019
External Debt

MALAWI: MOBILIZING LONG-TERM FINANCE FOR INFRASTRUCTURE
128
Figure 61: High primary deficits and interest rates remain key drivers of total public debt
Public debt (Percent of GDP)
Figure 62: Fiscal deficits regularly overshoot budget levels
Fiscal deficit, percent of GDP
Source: World Bank staff based on MoF data.
Figure 63: Food inflation pressures have started subsiding in 2020
Headline, food, and non-food Inflation, y-o-y, percent
Figure 64: Inflationary pressures picked up on the regional front
Headline annual inflation, percent, y-o-y, selected countries
Source: World Bank staff calculations based on data from National Statistics Office.
Source: World Bank staff calculations based on data from respective countries’ national statistical offices/central banks.
-10-8-6-4-202468
10
2014 2015 2016 2017 2018 2019
ResidualOther debt creating flowsReal Exchange rateReal GDP growthReal interest ratePrimary deficitChange in debt
-8
-6
-4
-2
0
2Outturn Budget
0.0
5.0
10.0
15.0
20.0
25.0
Jan-
17
Apr
-17
Jul-1
7
Oct
-17
Jan-
18
Apr
-18
Jul-1
8
Oct
-18
Jan-
19
Apr
-19
Jul-1
9
Oct
-19
Jan-
20
Apr
-20
Headline
National Food
National Non-food
0.0
2.0
4.0
6.0
8.0
10.0
12.0
14.0
16.0
18.0
Jun-
17A
ug-1
7O
ct-1
7D
ec-1
7Fe
b-18
Ap
r-18
Jun-
18A
ug-1
8O
ct-1
8D
ec-1
8Fe
b-19
Ap
r-19
Jun-
19A
ug-1
9O
ct-1
9D
ec-1
9Fe
b-20
Ap
r-20
Malawi KenyaTanzania UgandaZambia

MALAWI: MOBILIZING LONG-TERM FINANCE FOR INFRASTRUCTURE
129
Figure 65: US dollar/MWK official and forex bureau (FXB) rates and spreads through May 6, 2020
Figure 66: US dollar/MWK rate versus selected currencies, real effective exchange rate index, through April 30, 2020
January 2017 = 100, a reduction represents MWK appreciation
Source: World Bank staff calculations based on RBM data. Source: World Bank staff calculations based on RBM data.
-
20
40
60
80
100
120
140
160
180
660 680 700 720 740 760 780 800 820 840 860 880
Jan-17 Jan-18 Jan-19 Jan-20
Med FXB Sell Spread (rhs)Official SellMedian FXB SellMax FXB SellMax FXB Sell Spread (rhs)
50
60
70
80
90
100
110
120
130
Jan-
17
Apr
-17
Jul-1
7
Oct
-17
Jan-
18
Apr
-18
Jul-1
8
Oct
-18
Jan-
19
Apr
-19
Jul-1
9
Oct
-19
Jan-
20
US$SA RandZambian kwachaTZ shillingKenya shillingMoz. meticalREER
Figure 67: Private sector credit growth remained strong through March
Private sector credit growth, percent
Figure 68: Financial soundness indicators were healthy at the onset of the crisis
Private sector (percent GDP) and sectoral credit (y-o-y)
Source: World Bank staff calculations based on RBM data. Source: World Bank staff calculations based on RBM data.
-30
-20
-10
0
10
20
30
40
Jan-
17
Apr
-17
Jul-1
7
Oct
-17
Jan-
18
Apr
-18
Jul-1
8
Oct
-18
Jan-
19
Apr
-19
Jul-1
9
Oct
-19
Jan-
20
Private sector credit YoYgrowthPrivate sector credit realgrowth
0
10
20
30
40
50
60
70
Mar
-17
Dec
-17
Jul-1
8
Oct
-18
Jan-
19
Apr
-19
Jul-1
9
Oct
-19
Jan-
20
Non-performing loan ratio(NPL)Return on assets (ROA)

MALAWI: MOBILIZING LONG-TERM FINANCE FOR INFRASTRUCTURE
130
Figure 69: PPP investment in Malawi (1998–2017)
Percent of GDP
Figure 70: PPP investment in Mozambique (1998–2017)
Percent of GDP
Figure 71: PPP investment in Zambia (1998–2017)
Percent of GDP
Figure 72: PPP investment in Tanzania (1998–2017)
Percent of GDP
Figure 73: PPP investment in Kenya (1998–2017)
Percent of GDP
Figure 74: PPP investment in Uganda (1998–2017)
Percent of GDP
Source: World Bank staff calculation based on IMF Investment and Capital Stock Dataset, 2019.
0.16%
0.28%
0.00%0.0%
0.1%
0.2%
0.3%
1994
1996
1998
2000
2002
2004
2006
2008
2010
2012
2014
2016
Average: 0.07%
1.55%
0.37%
0.0%
0.5%
1.0%
1.5%
2.0%
1994
1996
1998
2000
2002
2004
2006
2008
2010
2012
2014
2016
Average: 0.82%
1.71%
2.58%
0.0%
0.5%
1.0%
1.5%
2.0%
2.5%
3.0%
1994
1996
1998
2000
2002
2004
2006
2008
2010
2012
2014
2016
Average: 0.92%
0.83%
0.0%
0.3%
0.5%
0.8%
1.0%
1994
1996
1998
2000
2002
2004
2006
2008
2010
2012
2014
2016
Average: 0.23%
0.53%
0.0%
0.3%
0.5%
0.8%
1994
1996
1998
2000
2002
2004
2006
2008
2010
2012
2014
2016
Average: 0.29%1.59%
0.0%
0.3%
0.6%
0.9%
1.2%
1.5%
1.8%
1994
1996
1998
2000
2002
2004
2006
2008
2010
2012
2014
2016
Average: 0.46%

MALAWI: MOBILIZING LONG-TERM FINANCE FOR INFRASTRUCTURE
131
Figure 75: PPP investment in Rwanda (1998–2017)
Percent of GDP
Figure 76: PPP investment in Ghana (1998–2017)
Percent of GDP
Figure 77: PPP investment in Côte d'Ivoire (1998–2017)
Percent of GDP
Figure 78: PPP investment in Senegal (1998–2017)
Percent of GDP
Figure 79: PPP investment in Myanmar (1998–2017)
Percent of GDP
Figure 80: PPP investment in Bangladesh (1998–2017)
Percent of GDP
Source: World Bank staff calculation based on IMF Investment and Capital Stock Dataset, 2019.
0.77%0.89%
0.0%
0.2%
0.4%
0.6%
0.8%
1.0%
1994
1996
1998
2000
2002
2004
2006
2008
2010
2012
2014
2016
Average: 0.3%
1.17% 1.29%
1.62%
0.0%
0.3%
0.6%
0.9%
1.2%
1.5%
1.8%
1994
1996
1998
2000
2002
2004
2006
2008
2010
2012
2014
2016
Average: 0.7%
1.79%
0.0%
0.5%
1.0%
1.5%
2.0%
1994
1996
1998
2000
2002
2004
2006
2008
2010
2012
2014
2016
Average:0.66%
2.35%
0.0%
0.5%
1.0%
1.5%
2.0%
2.5%
1994
1996
1998
2000
2002
2004
2006
2008
2010
2012
2014
2016
Average:0.78%
1.39%
0.48%
0.0%0.2%0.4%0.6%0.8%1.0%1.2%1.4%1.6%
1994
1996
1998
2000
2002
2004
2006
2008
2010
2012
2014
2016
Average:0.31%
0.34%0.28%
0.0%
0.1%
0.2%
0.3%
0.4%
0.5%
1994
1996
1998
2000
2002
2004
2006
2008
2010
2012
2014
2016
Average: 0.29%

MALAWI: MOBILIZING LONG-TERM FINANCE FOR INFRASTRUCTURE
132
Figure 81: PPP investment in Nepal (1998–2017)
Percent of GDP
Source: World Bank staff calculation based on IMF Investment and Capital Stock Dataset, 2019.
0.95% 1.04%
0.0%
0.2%
0.4%
0.6%
0.8%
1.0%
1.2%
1994
1996
1998
2000
2002
2004
2006
2008
2010
2012
2014
2016
Average: 0.29%

MALAWI: MOBILIZING LONG-TERM FINANCE FOR INFRASTRUCTURE
133
Annex 2: Financial sector charts Figure 82: Regulatory capital
Percent
Figure 83: Liquidity ratios
Percent
Source: RBM. Source: RBM.
020406080
31-M
ar-1
0D
ec-1
0Se
p-11
Jun-
12M
ar-1
3D
ec-1
3Se
p-14
15-J
unM
ar-1
6D
ec-1
6Se
p-17
Jun-
18Se
p-18
Dec
-18
Mar
-19
Jun-
19Se
p-19
Dec
-19
Total capital to total assets
Regulatory total capital to risk weightedassets Regulatory Tier 1 capital to riskweighted assets
0153045607590
31-M
ar-1
0M
ar-1
1M
ar-1
2M
ar-1
3M
ar-1
4 M
arch
15
Mar
-16
Mar
-17
Mar
-18
Sep-
18Ja
n-19
May
-19
Sep-
19Ja
n-20
Total loans to total deposits
Liquid Assets to total assets
Figure 84: Private sector credit growth
Private sector credit growth, percent
Figure 85: Financial soundness indicators
Private sector (Percent GDP) and Sectoral credit (y-o-y)
Source: World Bank staff calculations based on RBM data. Source: World Bank staff calculations based on RBM data.
-30
-20
-10
0
10
20
30
40
Jan-
17A
pr-1
7Ju
l-17
Oct
-17
Jan-
18A
pr-1
8Ju
l-18
Oct
-18
Jan-
19A
pr-1
9Ju
l-19
Oct
-19
Jan-
20
Private sector credit YoYgrowthPrivate sector credit realgrowth
0
5
10
15
20
25
30
Mar
-17
Dec
-17
Jul-1
8
Oct
-18
Jan-
19
Apr
-19
Jul-1
9
Oct
-19
Jan-
20
Non-performing loan ratio(NPL)Return on assets (ROA)

MALAWI: MOBILIZING LONG-TERM FINANCE FOR INFRASTRUCTURE
134
Table 24: Outstanding bonds on the MSE
Maturity (years) Institution Sector Value issued
(MWK) Coupon rate (%)
Maturity date
MWK 14 billion 3-Year Medium Term Note
MYBUCKS Banking Corporation
Financial services (banking) 50,000,000 Based on
T-bill rate plus 3%
(the tenor of T-bill rate is
agreed on with
each investor)
June 2021
MYBUCKS Banking Corporation
Financial services (banking) 1,000,000,000 June 2021
MYBUCKS Banking Corporation
Financial services (banking) 3,000,000,000 June 2021
MYBUCKS Banking Corporation
Financial services (banking) 6,000,000,000
MYBUCKS Banking Corporation
Financial services (banking) 2,350,767,576
2 Years GoM Public sector 64,659,680,000 13.00 September 2020
2 Years GoM Public sector 5,000,000,000 10.00 January 2020
2 Years GoM Public sector 23,791,253,000 10.00 January 2021
3 Years GoM Public sector 13,776,000,000 14.00 October 2021
3 Years GoM Public sector 3,000,000,000 14.00 February 2021
3 Years GoM Public sector 22,570,000,000 14.00 October 2021
5 Years GoM Public sector 39,105,000,000 15.00 November 2023
7 Years GoM Public sector 48,087,041,000 15.50 December 2025
10 Years GoM Public sector 5,980,000,000 9.00 September 2031
Total - corporate bonds 12,400,767,576
Total - government bonds 225,968,974,000
Grand total 238,369,741,576
Source: MSE.

MALAWI: MOBILIZING LONG-TERM FINANCE FOR INFRASTRUCTURE
135
Table 25: Stock market size and liquidity
Market cap (percent of GDP)
Total turnover of equities (percent of market cap)
South Africa 292 33
Botswana 204 0
Mauritius 72 4
Morocco 51 9
Rwanda 35 0
Senegal 33 4
Kenya 25 6
Uganda 22 0
Kenya 25 6
Malawi 23 0
Seychelles 21 3
Côte d’Ivoire 19 4
Namibia 18 2
Zambia 18 1
Egypt 18 26
Ghana 17 0
Tanzania 14 1
Nigeria 9 6
Mozambique 4 0
Cameroon 1 0
Angola 0 0 Source: RBM, ABSA Africa Financial Market Index 2019 Report.
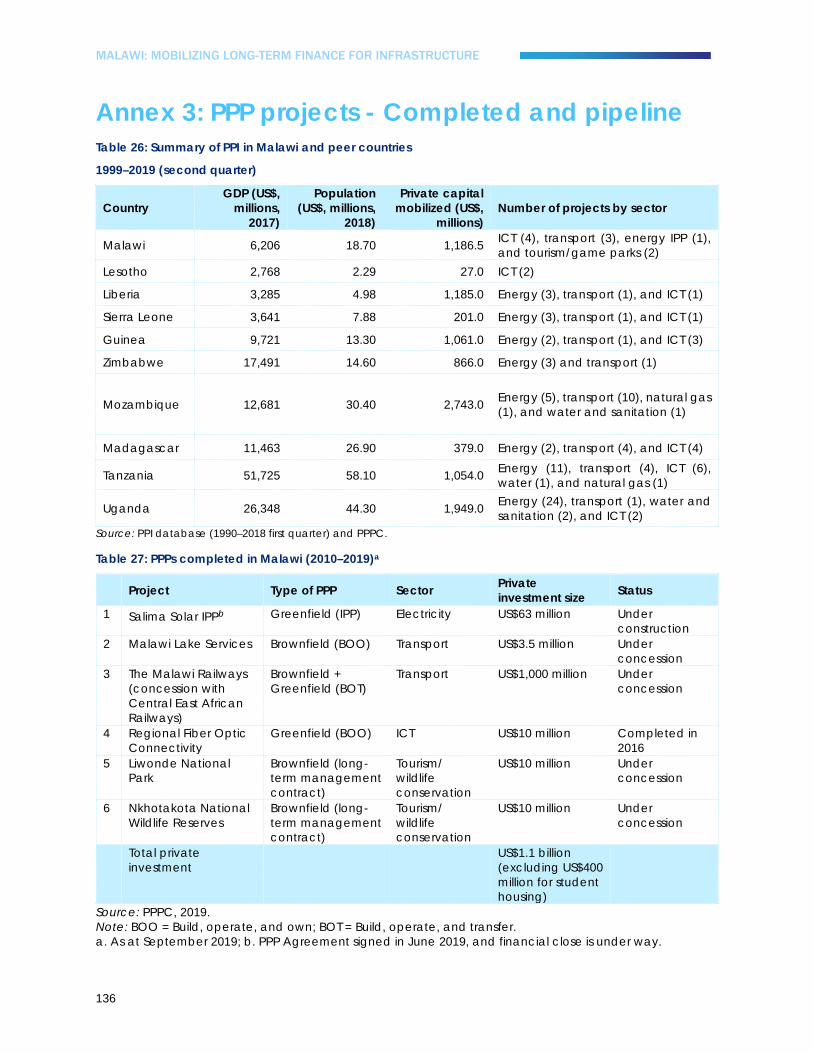
MALAWI: MOBILIZING LONG-TERM FINANCE FOR INFRASTRUCTURE
136
Annex 3: PPP projects - Completed and pipeline Table 26: Summary of PPI in Malawi and peer countries
1999–2019 (second quarter)
Country GDP (US$,
millions, 2017)
Population (US$, millions,
2018)
Private capital mobilized (US$,
millions) Number of projects by sector
Malawi 6,206 18.70 1,186.5 ICT (4), transport (3), energy IPP (1), and tourism/game parks (2)
Lesotho 2,768 2.29 27.0 ICT (2)
Liberia 3,285 4.98 1,185.0 Energy (3), transport (1), and ICT (1)
Sierra Leone 3,641 7.88 201.0 Energy (3), transport (1), and ICT (1)
Guinea 9,721 13.30 1,061.0 Energy (2), transport (1), and ICT (3)
Zimbabwe 17,491 14.60 866.0 Energy (3) and transport (1)
Mozambique 12,681 30.40 2,743.0 Energy (5), transport (10), natural gas (1), and water and sanitation (1)
Madagascar 11,463 26.90 379.0 Energy (2), transport (4), and ICT (4)
Tanzania 51,725 58.10 1,054.0 Energy (11), transport (4), ICT (6), water (1), and natural gas (1)
Uganda 26,348 44.30 1,949.0 Energy (24), transport (1), water and sanitation (2), and ICT (2)
Source: PPI database (1990–2018 first quarter) and PPPC.
Table 27: PPPs completed in Malawi (2010–2019)a
Project Type of PPP Sector Private investment size Status
1 Salima Solar IPPb Greenfield (IPP) Electricity US$63 million Under construction
2 Malawi Lake Services Brownfield (BOO) Transport US$3.5 million Under concession
3 The Malawi Railways (concession with Central East African Railways)
Brownfield + Greenfield (BOT)
Transport US$1,000 million Under concession
4 Regional Fiber Optic Connectivity
Greenfield (BOO) ICT US$10 million Completed in 2016
5 Liwonde National Park
Brownfield (long-term management contract)
Tourism/ wildlife conservation
US$10 million Under concession
6 Nkhotakota National Wildlife Reserves
Brownfield (long-term management contract)
Tourism/ wildlife conservation
US$10 million Under concession
Total private investment
US$1.1 billion (excluding US$400 million for student housing)
Source: PPPC, 2019. Note: BOO = Build, operate, and own; BOT = Build, operate, and transfer. a. As at September 2019; b. PPP Agreement signed in June 2019, and financial close is under way.

MALAWI: MOBILIZING LONG-TERM FINANCE FOR INFRASTRUCTURE
137
Table 28: Summary of infrastructure PPP pipeline in Malawi
Name/sector of the project
Type of PPP Sector Completion date of feasibility
Expected project approval
Current status
1 University Student Housing
Greenfield Education/ Housing
Completed Completed PPP Agreement signed; Financial close under way
2 Mpatamanga Hydro-Electricity
Greenfield Energy Completed December 2017 (Revised date: December 2019)
Procurement stage: Joint Development Agreement with IFC Negotiated. Tenders to commence soon (Size: US$1.1 billion).
3 Songwe Basin project Hydro-Electric
Greenfield Energy Under technical review
December 2017
Delayed
4 Sewerage & Solid Waste Management (Lilongwe, Blantyre, Mzuzu)
Brownfield Water & Sanitation
No funding available
December 2016
Delayed
5 Kamuzu International Airport in Lilongwe
Brownfield Transport No funding available
Delayed (awaiting funding for feasibility study)
6 Chileka International Airpo in Blantyre
Brownfield Transport No funding available
Delayed (awaiting funding for feasibility study)
6 Mangochi International Airport (Greenfield)
Greenfield Transport No Funding available
Delayed (awaiting funding for feasibility study)
7 Modern Bus Terminals (Lilongwe, Blantyre, Muzuzu)
Greenfield Transport No funding available
December 2016
Delayed (awaiting funding for feasibility study)
8 Parking Lots (Lilongwe, Blantyre)
Greenfield Transport No funding available
December 2016
Delayed (awaiting funding for feasibility study)
9 Lilongwe Water Supply and Treatment Facilities
Brownfield+ Greenfield
Water Completed March 2018 Delayed/Stalled (Approval Pending)
10 Shire Valley Irrigation
Greenfield Irrigation Completed September 2017
Financing being arranged by World Bank (Private O&M)
Source: PPPC, 2019.

MALAWI: MOBILIZING LONG-TERM FINANCE FOR INFRASTRUCTURE
138
Annex 4: Key issues affecting the performance and borrowing capacity of SOEs
The current governance framework in Malawi does not enable SOEs to be efficient and accountable.
1. The GoM has adopted the approach of creating SOEs to deliver certain services as corporate bodies, with the government remaining as the owner. However, the assessed SOEs are caught up in a dichotomy, whereby they are expected to operate commercially and become financially independent, yet they have limited autonomy in the running of their operations. Despite their commercial mandates, SOEs are generally seen as the extension of the government, with their boards of directors set up in a way that it facilitates undue political interference in the day-to-day operation of SOEs. For example, the board of EGENCO is very government oriented—out of nine directors, five are from the government. In addition, CEOs of SOEs can be directly appointed and fired by the executive powers or the line ministries, bypassing the role of the board of directors. As a result, the roles and responsibilities of SOE boards are encroached both from above (by the state) and from below (by senior management with strong connection to the executive powers139).
2. Currently, SOE boards are largely disempowered with most decisions subject to government approval. These include case-by-case approval of bank overdrafts and guarantees, external travel by management, quarterly approval of budget, and determination of salary structures, among others, some of which are embedded in the regulatory frameworks. This is partly attributable to the fact that boards of directors and executive managements have underperformed in the past, in some cases leading to bailouts of SOEs. However, the lack of independence, with boards and executive managements taking directions from the state on how to run their business, removes the incentive to improve performance, instead expecting bailouts. During discussions, it was revealed that SOEs usually expect bailouts from the GoM when they fail to repay their debt. This can also create moral hazards on the part of the private sector—sending a negative message to lenders that SOEs will always be bailed out and hence encourage excessive lending to SOEs or lending to SOEs with weak financial position.
3. Consequently, questions around who is appointed to the SOE boards and how they are appointed, who manages the entities, and whether the right incentives (both internal and external) are in place to encourage SOEs to improve their performance are critical questions requiring the attention of the GoM. In addition to being dominated by public officials, the boards of assessed SOEs have little diversity of skills and limited number of independent directors, especially from the private sector. Although some of the board members have considerable experience (including in running businesses) and some have relevant technical education and experience, some boards have farmers, teachers, and religious leaders as members (some holding the position of the board chair). This, coupled with the current poor performance of SOEs, does little to instill confidence in potential private sector financiers. The risk of political interference in the management of SOEs and the risk of a loss of continuity if the political administration changes after an election are also sources of concern for financial markets.
4. When composing SOE boards, the current practice in Malawi is to have as wide a representation in the boards as possible to ensure the interest of the general public is represented, resulting in the current
139 Members of the executive management with strong connections to the state may take instructions directly from the government and circumvent the boards of directors, by default, preventing them from effectively carrying out their roles.

MALAWI: MOBILIZING LONG-TERM FINANCE FOR INFRASTRUCTURE
139
composition described above. While the spirit of this practice could be warranted, it does not have to be this way. The interest of the public can best be served by ensuring SOEs are efficient and financially sustainable, which at the basic level is a function of the quality of SOE boards and their executive managements and the quality of the governance framework that enables SOE boards to effectively perform their duties.
5. Clarity of performance expectations and a robust oversight function are key to enhancing the performance of SOEs. The GoM has started to issue LOEs to SOE boards; LOEs are similar to shareholder compacts. This is a positive move by the GoM; however, the assessment of one LOE indicates the need for the state to distance itself from the day-to-day operations of SOEs. Notably, the performance evaluation framework for SOEs and the oversight function of the state are not adequate. The oversight function of SOEs in Malawi is fragmented, with the role split between the MoF, the OPC/DSC, and the line ministries, with some overlap. The PFMA provides the MoF with a financial oversight role, while the DSC has control over administrative and human resource matters. The Public Sector Reform Department, also within the OPC, deals with reforms in the statutory bodies. The line ministries provide oversight of technical issues, compliance with sectoral policies, and tariff adjustments. While the PFMA provides the MoF with a financial oversight role, the mandate of its department—the PERMU, which is tasked with providing financial oversight—is not backed by provisions in the PFMA or other treasury regulations. The IMF assessment finds that there is limited financial and human capacity within the PERMU.
6. The effectiveness of financial oversight depends on the effectiveness of administrative, human resources, and technical oversight. The overlapping of mandates and limited human and financial resources are undermining accountability. In different discussions, it was clear that SOEs are not consistently complying with PFMA requirements. For example, while SOEs are formally required to submit periodic reports, including performance and management plans and financial reports, neither the SOEs nor the different agencies entrusted with responsibility for state ownership rights ensure that these statutory requirements are fulfilled. In some cases, annual reports were last prepared in 2014.140
Tariffs do not always cover costs, partly due to adjustments of tariffs for affordability and partly due to inefficient operations of the utilities.
7. Commercial SOEs must be able to cover all operational costs from internally generated funds and preferably make a substantial contribution to capital investment. This requires a combination of adequate tariffs and operational efficiency. The major complaints from utilities are that tariffs are not cost-reflective and the regulatory environment is not conducive. While this is the case in Malawi, inefficient management of SOEs plays a big role in the current poor performance of some of the SOEs.
Power utilities
8. MERA has issued a ‘New Tariff Methodology’ with guidelines that require the separation of the different activities to ensure that cost recovery principles are applied in each component of the electricity sector. The electricity generation tariff is composed of a fixed component based on the fixed costs (availability costs) and a variable charge based on estimates made by EGENCO of available capacity for the next four years. ESCOM’s recovery of fixed costs is based on this tariff.
140 The IMF notes that the overall performance of SOEs is not summarized into a consolidated report of their investment activities and financial performance, and there are no data on the financial support provided by the government to the SOEs (for example, subsidies, capital injections, onlending, and loan guarantees).

MALAWI: MOBILIZING LONG-TERM FINANCE FOR INFRASTRUCTURE
140
9. For consumer tariffs, ESCOM submits applications for tariff increases to MERA with budget projections as a basis and MERA takes decisions in consultation with general stakeholders. The approved and accepted costing projections are translated into the base tariff rate for the next four years, adjusted annually against key performance indicators and to cater for unforeseen price increases, for example, due to forex volatility. ESCOM uses the base tariff approved by MERA to calculate a consumer tariff, using the rising block tariff141 methodology with differentiation between single- and three-phase consumers142 (Figure 86). This effectively creates a differentiated tariff between domestic consumers and industrial/commercial consumers and allows some cross-subsidization between the different types of consumers. There is currently no free pro-poor electricity.
Figure 86: ESCOM - Differentiated tariffs across consumers/uses
MWK/kWh
Source: ESCOM.
10. MERA’s methodology is designed to ensure that tariffs are cost-reflective. However, the current electricity tariffs seem inadequate not only because tariff increases have to be done within the limits of affordability of the Malawian population but also because utilities are inefficient, limiting MERA’s ability to increase tariffs to cover their costs. Consequently, improving the operational efficiency of utilities is critical and MERA should continue to link tariff increases with operational improvements.
11. Of the two electricity utilities, only EGENCO is able to meet its operational cost from tariffs though it is not able to sufficiently contribute to CAPEX. EGENCO has been profitable since it started operations in 2017, with a PAT of MWK 10 billion in 2017/18 (US$13.7 million) and MWK 3.1 billion (US$4.2 million) in the first three months of 2018/19. The average approved tariff in both 2016/17 and 2017/18, which amounted to MWK 25 per kWh (US¢3.4 per kWh), was sufficient to cover the operational production cost. The base rate approved by MERA in 2017/18 to 2022 shows an average end-user tariff of MWK 97.50 per kWh and an allowance of 66.58 percent for the purchase of electricity or an average generation cost of MWK 53 per kWh (US¢8.76 per kWh). The consumer price in Malawi is around US¢16 per kWh, of which US¢8.76 per kWh is paid for generation. This is comparable to tariffs in other countries, for example, around US¢8–12 per kWh in Uganda, US¢14 per kWh in Kenya, and US¢16 per kWh in South Africa.
12. ESCOM’s operations are not efficient; hence, tariffs do not currently cover even operational costs. In April 2018, ESCOM applied for a 60 percent increase in base tariff, covering all business units. This would have
141 In the block tariff methodology, tariffs are divided into consumption blocks, with a higher tariff applied when more electricity is consumed. 142 Single-phase supply is used by the majority of households while three-phase supply (which allows higher simultaneous consumption) is normally used in industrial environments.
7349
10385 94
77 71
Ave
rage
Dom
estic
Publ
icin
situt
ions
Gen
eral
Sin
gle
Phas
e
Gen
eral
Thr
eePh
ase
Indu
stria
l-Sm
all
Indu
stria
l-Lar
ge

MALAWI: MOBILIZING LONG-TERM FINANCE FOR INFRASTRUCTURE
141
moved the tariff from the average of MWK 72.3 per kWh to MWK 117.64 per kWh. As mandated, MERA follows an approach of reviewing the proposed budgets for the different business units over a four-year period and then approving specific budgets. The base tariff is determined by considering factors such as estimated consumption, the weighted average costs of finance, capital programs, staff costs, depreciation, and the impact on the economy. After due consideration, consultation with the public, and downward adjustment of the budget submitted by ESCOM to what MERA deemed to be realistic and to encourage greater efficiency,143 MERA approved budgets which would result in a base rate for 2018 to 2022, effective from October 1, 2018. ESCOM’s revenue projection was decreased by 20 percent, head office costs were decreased by 35 percent, and bad debts initially were allowed at 3 percent, but the final base rate requires a reduction to 0.5 percent.144 ESCOM was also required to isolate revenue asset revaluation gains and allocate it to a specific fund to be used only for infrastructure enhancements, additions, and improvements. In addition, MERA resolved that results against key performance indicators will be part of the licensing agreements with electricity sector entities and nonperformance will be subject to penalties. ESCOM is also expected to fully convert to a prepaid system.
13. The operational performance of ESCOM over the last period up to 2016/17 had improved, due to the investments by the MCC, which, among others, upgraded the main north–south transmission lines. However, as of the end of 2017/18, ESCOM’s performance had deteriorated to a loss-making position.145 The signing of an expensive contract with Agrekko for diesel-generated power in response to low water levels in Lake Malawi significantly contributed to the loss. As Table 29 shows, ESCOM costs grew faster than revenues between 2014/15 and 2017/18, at a CAGR of 26.83 percent and 14.34 percent, respectively. In addition, in 2018/19, ESCOM saw a significant jump in head office/staff cost (almost double the cost in the previous year). Similarly, the cost of power more than doubled, largely driven by a substantial increase in the cost of power purchased from EGENCO. In principle, unbundling of the generation function should not have had a dramatic impact on the financial position of ESCOM, as it accounted for a relatively small portion of expenditure. A significant portion of the cost of power purchase from EGENCO is related to capacity charges due to the hydrological risk, which significantly materialized during the year. The PPA between EGENCO and ESCOM is clear that the risk/cost should be equally shared (50/50) between EGENCO and ESCOM. Negotiations related to sharing the capacity charges with EGENCO according to the PPA have been concluded. It should be noted that the hydrological risk has been fully placed in ESCOM, which has created a relatively stable revenue environment for EGENCO. A change in this approach would also affect EGENCO’s profitability, until there is substantial diversification in the sources of power in the country.
Table 29: Summary of ESCOM's expenditure MWK, billions
2014/15 2015/16 2016/17 2017/18
Cost of power: generation and purchases 5.70 7.72 21.61 46.96 Generation by ESCOM 5.70 7.72 6.70 Power purchase from EGENCO (hydro generation) 14.91 34.06 Other power purchase (thermal generation)/Aggreko 12.89
SB cost — — — 2.64
143 Customers are willing to pay for cost-reflective tariff as long as such a tariff is not loaded with inefficiencies and abuses. 144 As best practice, provision for bad debts should not be passed on to end users. 145 It is noteworthy that the results of the last two quarters of 2018/2019 indicate improvement in many areas, like collection efficiency (except collections from the public sector entities), and a small profit of MWK 3.3 billion has been recorded.

MALAWI: MOBILIZING LONG-TERM FINANCE FOR INFRASTRUCTURE
142
2014/15 2015/16 2016/17 2017/18
Transmission system and market operator 3.80 4.43 4.72 5.12 Distribution 18.90 27.06 25.96 19.15 Head office 14.63 23.29 25.85 40.11 Total cost 43.03 62.49 78.13 111.33 Cost CAGR - 26.83% CAGR (revenue) - 14.34%
Source: ESCOM’s financial statements.
14. Lack of a steady flow of revenue means that ESCOM has not adequately invested in O&M of existing infrastructure, contributing to high operational losses. The transmission lines are old and of relatively low voltage (132 kV and 66 kV) which resulted in high transmission losses that aggravated load shedding. The MCC’s support to upgrade transmission capacity with a new 400 kV backbone transmission line running south to north has reduced power losses to 5.5 percent in 2017/18 compared to losses of 7.4 percent in 2012/13. Total losses stood at 20.9 percent in 2017/18. However, recent data show current total losses stand at 22 percent (5 percent correspond to transmission losses and 17 percent correspond to distribution losses). To accommodate the planned electricity generation expansion, the transmission lines’ expansion (for example, the western transmission backbone) and rehabilitation (along with further upgrading to 66 kV and several substations and transformers) will be required.
15. ESCOM is undertaking a densification initiative to increase the number of connections. ESCOM’s distribution system is organized in three major business units and regions—Southern, Central, and Northern. The medium voltage (MV) system covers all 28 administrative districts in Malawi. Despite the low grid utilization, approximately 80 percent of villages/towns live within 7 km from an MV line.146 Given this proximity, the connection growth rate is relatively low due to lack of funds and electricity availability. Connection growth from a relatively low base has been declining from 15 percent to 8 percent over the last five years, indicating that ESCOM’s financial stress is having an impact on new connections and growth. The distribution networks are also based on relatively low voltage, 33 kV and 11 kV, and further contribute to losses. To reduce distribution losses, ESCOM has introduced an ongoing program of on-pole metering, is focusing on improved demand management, and has an ongoing program of replacing/selling light emitting diode lights to replace conventional bulbs. The IDA-financed Malawi Electricity Access Project aims to fund 280,000 connections over the next five years while also investing in network densification and expansion.
146 ESCOM is currently engaged in densification of electric distribution systems and is making additional connections largely using existing infrastructure.

MALAWI: MOBILIZING LONG-TERM FINANCE FOR INFRASTRUCTURE
143
Water utilities
16. Of the three water SOEs, only LWB and NRWB are able to cover operational costs from internally generated revenues/tariff and service long-term concessionary loans. However, tariffs are not adequate to contribute to CAPEX. In addition, NRWB is sustained by grants, given it covers a large rural service area where affordability is low. All water utilities suffer from high levels of NRW and low collection rates.
17. LWB uses a rising block tariff structure (except with the kiosks). The lowest tariff is at the kiosk level at MWK 198 (US¢2 per m3) rising to MWK 1,523 (US$2.03) for high consumption commercial consumers. LWB’s tariff has risen considerably at a CAGR of 29.2 percent between 2010 and 2018, reflecting the high inflation rate; this is in line with rates in other countries. The anticipated capital investment program will require that the tariff be regularly adjusted at least with the CPI to maintain a healthy financial position and allow sufficient discretionary surplus to be generated to service larger loan amounts, without the risk of financial stress.
18. A combination of low water production capacity, increasing population, and high NRW (at 36 percent)147 led to a sharp decline in service availability in Lilongwe to a low of 7 hours per day in 2015/16, although it recently improved to 12 hours a day. Collection rate, which has consistently remained low (at around 85 percent) is a concern. Staff per 1,000 connections (at 7.63 in 2018) is within acceptable norms for large utilities and has been declining since 2010 when it stood at 12.4. Staff costs remained relatively stable and in line with acceptable norms.
19. NRWB’s tariff is also sufficient to fund operations and service some concessionary loans. NRWB uses a simple volumetric tariff structure that charges water on the basis of usage, with a unit price of water fixed per cubic meter. The tariff structure incorporates cross-subsidization to lessen the burden on poor households. The lowest tariff is at the kiosk level at MWK 483 per m3 (US$0.65 per m3) with commercial and industrial consumers on the upper end at MWK 2,331 per m3 (US$3 per m3). NRWB’s average tariff has risen considerably between 2010 and 2019, at a CAGR of about 27 percent.
20. NRWB’s tariffs are higher than those of LWB. NRWB changed tariff structures from rising block to a simple volumetric structure in 2016/17. Hours of supply per day have increased from 18 hours to 21 hours. However, NRW remains high, at 33 percent in 2017/18, although it reduced from 37 percent in 2014/16. Although NRWB has been able to consistently cover operating costs inclusive of depreciation and finance costs, the gap between average unit tariff and unit cost, including financing costs, has remained narrow. The existing tariff levels (already high) pose a challenge on further water tariff increases moving forward. It is therefore imperative that NRWB looks at improving efficiency as a way of cushioning the narrow gap between average unit tariff and cost. NRWB was marginally profitable over the past 4 years with most profitability indicators being on the lower side. However, this is not unacceptable for a service utility with a strong rural coverage.
21. In the case of BWB, the current tariff is not adequate to maintain it as a financially healthy utility without external assistance. BWB’s poor operational and financial performance is a combination of inefficiencies and low tariffs, which are difficult to increase in a context of poor service delivery. BWB’s biggest challenge is the high cost of pumping water from Walker Ferry on the Shire Valley. Distance from the water source and the high head translates to an electricity requirement of 1.9 kWh per cubic meter pumped. The energy costs amounted to US¢30 per m3 in 2016/17, contributing substantially to a production cost of US¢0.58 per m3. In 2017/18, a total of MWK 6.1 billion in electricity cost was incurred to pump water to the Blantyre reservoirs.
147 The acceptable level of NRW is between 20 percent and 25 percent.
MALAWI: MOBILIZING LONG-TERM FINANCE FOR INFRASTRUCTURE
144
BWB, as an institution, is at least 100 years old, and pipes are ageing with frequent pipe breaks. This contributes to high NRW (at 39 percent in 2018).
22. The 2018 electricity cost of MWK 6.1 billion represents about 41 percent of BWB’s gross revenue of MWK 14.84 billion and constitutes 55.5 percent of operating costs (excluding cost of sales). Personnel costs constitute 45.5 percent of gross revenue, and finance cost amounts to a further 13.8 percent. However, if these expenses are viewed against the discretionary revenue,148 staff costs are nearly 90 percent and debt servicing costs are 28 percent, indicating a running deficit. Given the current situation, it is not surprising that maintenance is inadequate, staff are demoralized, and customer service is poor.
MHC
23. MHC owns 5,985 housing units, 175 flats, 8 offices, 26 shops, and 13,379 ha of land, which is replenished on a continuous basis. The corporation is currently building about 200 housing units for sale per year but claims a capacity of up to 5,000, if financial resources were available. This must be seen in the context of a UN-Habitat estimate that about 20,000 houses per year are required, which is supported by a waiting list of 100,000 people.
24. MHC’s financial statements show that the entity has been making marginal profits since 2016 and the 2018 PAT was about MWK 260 million. It is noteworthy that MHC makes a profit on the sale of houses but is losing money on its rental business, with the two activities nearly balancing out with a small operating loss. In 2018, the rental portfolio generated an annual loss of MWK 1.1 billion, the new developments portfolio a profit of MWK 1.5 billion, and the land revaluation a profit of MWK 11.7 billion. Therefore, the overall profitability of MHC is mainly due to the revaluation of properties. It should be noted that this is an accounting profit while liquidity problems are apparent (MHC’s collection rate is low—at 60 percent149). In the 2018/19 projected budget, revenue of the rental portfolio is estimated at MWK 3.5 billion, of which 17.4 percent originates from the government rental pool, 64.0 percent from the private rental pool, 10.5 percent from ground rental, and only 2.6 percent from commercial rental. The revenue on sale of housing units for 2018/19 is budgeted at MWK 2.3 billion while projected expenditure is MWK 5.2 billion.
25. The 2018 loss in the rental portfolio is attributable to the fact that current rental rates are below market rates (due to caps by the GoM). As of 2018, MHC’s rental rate was about 20 percent below the market, which is an improvement from 40 percent below the market in 2016. As a commercial SOE, MHC should be allowed to charge market rates. This will provide sufficient resources to improve maintenance, especially planned maintenance, and increase capacity to develop new housing units. MHC is gradually phasing in rental rates increases, considering the hardship to tenants that can be caused by sharp increases. Any subsidized mandate should be separately accounted for, and MHC should discuss with the GoM on the compensation mechanism.
26. About 47 percent of the expenditure (MWK 1.7 billion) is related to salaries (which is high) and only 2.8 percent is related to planned and responsive maintenance of the housing stock. The staff complement was around 623 in 2018 against an approved complement of 730.150 The budget for 2018/19 allows for a 10 percent increase in staff costs, which, due to the vacancies, translates to 18 percent salary increase and 5 percent merit bonus. It is critical that MHC reviews its organizational structure to identify cost-cutting opportunities.
148 Operational surplus after cost of sales. 149 This is partly ascribed to unwillingness of tenants to pay rent due to inadequate maintenance. 150 Malawi Housing Corporation Strategy Plan 2018 to 2023.

MALAWI: MOBILIZING LONG-TERM FINANCE FOR INFRASTRUCTURE
145
27. It is noteworthy that land invasion/illegal occupancy is a problem MHC faces, eroding the value of some of its land assets. MHC has initiated a program of protecting and developing vacant plots in desirable/established urban areas, which should be accelerated. Land encroachment is normally driven by market forces, and MHC should attempt to anticipate the type of land that would become attractive in the foreseeable future and preemptively develop the plots. Increasing the pace of developing more housing stock will also mitigate the risks of illegal occupation of idle plots. Vulnerable land should be protected by fencing and regular inspection.
RFA
28. RFA is an efficient SOE with 10 years of clean audits and is able to cover all operational costs without subsidies from the GoM and contribute to CAPEX. It charges its expenditure to the Roads Fund as a management fee, which was around 3.47 percent in 2018. The main source of funding for the Roads Fund is a fuel levy charged on all petrol and diesel imported into Malawi and accounts for over 80 percent of the revenue. As of 2018, the levy was just below MWK 100 per liter (US¢13) for both petrol and diesel. This revenue is supplemented by a road user charge on cars entering Malawi and interest earned on surplus amounts since the fund operates with substantial cash reserves. The levy shows limited variations and is a dependable source of revenue, with RFA estimating the volatility to be below 1.5 percent. Fuel revenue posted a double-digit CAGR of about 25 percent between 2010 and 2018. Another source of revenue is the international transit fees and road access fee on foreign-registered vehicles. RFA has outsourced collection of levies and other funds to other agencies such as MERA (fuel levy) and Malawi Revenue Authority. This is part of RFA’s strategy to enhance efficiency. RFA obtained permission in February 2016 to introduce tolls to bolster the Roads Fund. Viability studies were conducted, and implementation is under way (currently at procurement stage).
SOEs have liquidity challenges, largely attributable to the high receivables from the GoM and its agencies.
29. Liquidity will play an important role for SOEs to access market finance. SOEs have substantial outstanding amounts of receivables for services rendered. In most cases receivables are dominated by government MDAs and comprise up to 18 percent of the asset value. This denies the SOEs the working capital they need, forcing them to conclude expensive short-term overdraft facilities. NRWB took an overdraft facility of MWK 609 million (~US$831,467) from the National Bank in 2018 to cover liquidity shortfalls. BWB also has an overdraft facility of MWK 900 million (~US$1.2 million) with FDH at an annual interest rate of 25 percent, of which MWK 670 million (US$914,751) was utilized at the end of 2017/18. High working capital requirements and steep bank interest rates leave very little room to cover capital charges for further investments. ESCOM also relies on expensive overdrafts. This reinforces the need for the government to settle its outstanding debt and for special efforts on the part of the SOEs to improve credit control and collections. Efforts by SOEs should include improvements in technology/data quality to improve efficiency of collection and installation of prepaid meters.
30. RFA’s liquidity condition is strong but it also has high outstanding receivables of about MWK 12.6 billion (US$17.2 million). Its financial health is based on maintaining liquidity at reasonable levels and matching expenditure annually with the available revenue as well as using the reserves to balance any deficit or cash flow delays. As of 2018, the cash and bank balances, together with investments, provide a high level of liquidity at MWK 23 billion, amounting to nearly 60 percent of expenditure. The fund makes transfers to the

MALAWI: MOBILIZING LONG-TERM FINANCE FOR INFRASTRUCTURE
146
various infrastructure providers, and the only meaningful expenditure is the management fee, taxes, and interest while exposure is contained to receivables from the various collection agencies.
31. Since project expenditure can vary, RFA prudently keeps reserves to cover the risk of volatility in expenditure, cash flow, and potential deficits, which were 114 percent, 58 percent, and 45 percent of expenditure during 2016, 2017, and 2018, respectively. In 2018, RFA deliberately reduced the reserves to 45 percent. This is regarded as a justifiable step since the past reserves were too high given the stable level of levy income and lower receivables and liabilities. The reserves of 45 percent of expenditure are still regarded as high and in a sense deny the GoM a bigger social dividend on the proceeds of the fuel levy. It is recommended that RFA manages reserves within the context of fulfilling its mandate—too big a reserve will delay infrastructure investment and too small an amount will expose RFA to risks. Notably, liabilities and receivables have been rising, so the 2018 level of reserve may be justified.

MALAWI: MOBILIZING LONG-TERM FINANCE FOR INFRASTRUCTURE
147
Annex 5: Potential impact of COVID-19 on the infrastructure sector/SOEs and the financial system 1. COVID-19 has started to affect economic sectors in many countries. Malawi is already taking social distancing measures, which are expected to transmit shocks to the economy. The impact is expected to be short term but could extend into the medium term, depending on how long the pandemic and social distancing measures last. The impact of COVID-19 will be felt by individuals first, through loss of jobs and incomes, which will filter through to the economy and financial markets. In the infrastructure space, existing assets will begin to experience liquidity strain, revenue generation capacity decline, and receivables increase. With closure of airports and land borders, the transport sector will take an immediate short-term hit. RFA, the SOE that depends on fuel levies and road user charge on cars entering Malawi, should expect a sizeable decline in revenues. RFA has generally been keeping large amounts of liquidity reserves, which may help the SOE withstand impact in the short term. However, this will be short-lived if travel restrictions are extended for a long period.
2. The power utilities will also be affected by reduced affordability and reduction in industrial activities if social distancing measures are increased. Sales will decline and receivables, which are already high, will increase. EGENCO’s and ESCOM’s ability to meet short-term obligations, including debt servicing, will likely reduce. However, the reduction in electricity consumption could reduce load shedding. ESCOM may need to invest in additional high-cost diesel-based generation to provide uninterrupted power supply to hospitals and health clinics.
3. Given the need to improve hygiene, the water utilities might benefit from the pandemic through increased water sales. However, the SOEs will still face sharp increases in receivables and liquidity stress. MHC will also be negatively affected due to inability of households to pay rent. Liquidity will decrease and so will revenue due to reduction in demand for new houses.
4. Infrastructure projects under construction are likely to face delays and cost overruns given the disruption of global supply chains. In other severely affected countries in Europe, EPC contractors are already trying to test natural force majeure definitions in construction contracts. If things get worse in Malawi and force majeure clauses in contracts are triggered, borrowers/SOEs will have the obligation to report to lenders, giving rise to questions about compliance with project completion dates and borrowers’ liquidity conditions. SOEs with existing hard currency infrastructure loans will also face increased debt servicing costs if the kwacha depreciates due to macroeconomic impacts. This emphasizes the need for SOEs to be more efficient and for the GoM to implement recommended measures to improve SOEs’ autonomy and efficiency, including in procurement.
5. One of the risks for the procurement and financing of greenfield projects is the impact on liquidity in the global and domestic financial system and its knock-on effect on pricing for finance. Malawi will likely experience reduction in foreign financial flows—lower foreign direct investment, remittances,151 and export revenues. In the short term, global financial institutions might scale back funding for infrastructure and shift demand to safer assets. Foreign governments that have been severely affected by the pandemic may reduce allocations to export credit agencies and to their programs in developing countries. Overall, low-cost
151 Most remittances into Malawi are from South Africa, which has been severely hit by COVID-19.

MALAWI: MOBILIZING LONG-TERM FINANCE FOR INFRASTRUCTURE
148
(grants and concessional) finance will become less available while the cost of commercial finance will increase.
6. Given the uncertainties caused by COVID-19, financial/capital markets globally will experience a flight of capital to safer assets. In the domestic financial system, outstanding receivables and demand for working capital by firms/SOEs are likely to increase while banks will also face liquidity challenges as they mostly depend on deposits from firms and individuals. This will necessitate provision of liquidity to the financial system. The GoM has started to implement measures to contain the impact of COVID-19 on the economy and the financial system. The RBM has disbursed MWK 12 billion to commercial banks to give loans to their customers to cushion the effects of COVID-19. The GoM has also announced tax waivers on importation of essential goods for coronavirus management, including personal protective equipment, hand sanitizers, soaps, water treatment chemicals, and many more.
7. As pressure on health spending increases, some of the planned infrastructure by the GoM may be delayed. However, prioritization of projects will be critical. Demand for water and sanitation services will increase as would the need for uninterrupted power supply for hospitals and health clinics, and so should spending in related infrastructure. Development partners’ priorities might also include electricity, water, and sanitation, which may benefit power and water infrastructure SOEs. Table 30 highlights some of the shocks and transmission channels in the context of Malawi and potential measures the SOEs and the GoM could consider. As the government comes up with different responses to contain the virus, SOEs must think of different impact scenarios and devise solutions to survive the pandemic. Becoming more efficient to save costs will be of paramount importance.
Table 30: The potential COVID-19 impact on infrastructure sector/SOEs and the financial system - Malawi context
Transmission of shocks
Impacts on SOEs and the financial system impacts
Potential immediate responses by SOEs and the GoM
1. Labor and household. Health impacts, quarantine and social distancing across the country, and decline in employment and disposable incomes.
• Constrained supply of labor/lost productivity
• Delays in infrastructure projects delivery/lack of equipment due to supply chain disruption/cost overruns
o Force majeure clauses in EPC contracts may be triggered.
• Increase in cost of operations for SOEs
• Decline in SOEs’ revenue (water sector may benefit in the medium to long run due to emphasis on hygiene)/potentially increased need for bailouts for already struggling SOEs
• SOEs should accelerate efficiency improvement programs to reduce cost.
• SOEs to develop risk management and contingency planning/identify alternative methods of project delivery.
• Liquidity support to banks minimize liquidity crunch by the GoM (potentially supported by international partners).
• Liquidity to micro, small, and medium enterprises and large firms, potentially contingent to retaining employees.
• The GoM should repay arrears to firms, including outstanding receivables to infrastructure SOEs. Given the fiscal stress that will be pronounced by COVID-19 related
2. Firm/SOE level impacts. Revenue loss, lost production, and payment delays due to liquidity constraints.

MALAWI: MOBILIZING LONG-TERM FINANCE FOR INFRASTRUCTURE
149
Transmission of shocks
Impacts on SOEs and the financial system impacts
Potential immediate responses by SOEs and the GoM
• Decline in deposits/liquidity challenges in banks and reduction in pension assets
• Increase in nonperforming loans (NPLs) in the financial system
• Increased demand for working capital and trade finance loans/FX loans.
spending, the GoM would have to prioritize the payment of arrears to job-critical firms and SMEs. Such measures may need to be supported by development partners.
• Accelerate recommended governance reforms to improve SOEs’ efficiency, including in procurement (medium term, but start immediately).
3. Financial sector liquidity. Increased drawdowns, lower reflows, and need for crisis preparedness.
• Rising NPLs—need to restructure loans—from micro/personal to large firms
• Liquidity constraints—both local currency and FX—reduced ability to fund drawdowns
• Potential increase for need for capital injection and bailouts.
• Liquidity easing measures through the central bank/enhance emergency liquidity facilities
• Robust NPL resolution framework that differentiates between failing firms and those where economic value can be retrieved
• Clear expectations about banks’ behavior and ensuring banks disclose risks appropriately—to preserve market and credit risk discipline.
4. Trade shocks and financial flows. Through disrupted supply chains and lower capital flows/flight to safety.
• Infrastructure project delays
• Reduced external demand for exports and export earnings
• Greater uncertainty on financial flows/FX/foreign direct investment
o Flight of capital to safe assets
• Currency devaluation—reduced ability for SOEs to meet FX repayments
• A slowdown in remittance inflows.
• Improve public procurement measures.
• Enhance efficiency in border trade—import and export procedures, reducing time while enhancing health safety measures.
• Apply potential reduction in import tariffs on critical infrastructure equipment
• Rationalize export bans.
5. Fiscal channel. Health care versus CAPEX/support to people versus firms/declining fiscal space.
• Reduced tax revenues
• Reduced ability to advance fiscal consolidation measures/increased spending.
• Cut unnecessary expenditure.
• Prioritize investments, including water infrastructure, given the impact on health and hygiene.
• Prioritize concessionary finance.

MALAWI: MOBILIZING LONG-TERM FINANCE FOR INFRASTRUCTURE
150
Annex 6: Doing Business reforms undertaken by Malawi (2008–19) From May 2, 2018, to May 1, 2019, 115 economies implemented 294 business regulatory reforms across the 10 areas measured by DB. Reforms inspired by DB have been implemented by economies in all regions. The following are reforms implemented since DB2008.
Doing business reform making it more difficult to do business.
Change making it more difficult to do business.
DB2019
Registering Property: Malawi made property transfer faster by decentralizing the consent to transfer property to local government authorities.
Enforcing Contracts: Malawi made enforcing contracts easier by adopting new civil procedure rules regulating time standards for key court events.
DB2018 Starting a Business: Malawi made starting a business more expensive by increasing the cost of registering a business with the Registrar General.
Dealing with Construction Permits: Malawi made dealing with construction permits cheaper by halving the fees charged by the city council to process building plan approvals.
Getting Credit: Malawi strengthened access to credit by adopting a new law that establishes clear priority rules inside and outside bankruptcy procedures. Malawi improved access to credit information by establishing a new credit bureau.
Trading across Borders: Malawi made exporting and importing easier by upgrading to a web-based customs data management platform, ASYCUDA World.
Resolving Insolvency: Malawi made resolving insolvency easier by introducing a reorganization procedure, facilitating continuation of the debtor’s business during insolvency proceedings, and introducing regulations for insolvency practitioners.
DB2017 Starting a Business: Malawi made starting a business easier by eliminating the legal requirement to use a company seal and making it optional for entrepreneurs.
Getting Credit: Malawi strengthened access to credit by adopting a new law on secured transactions that implements a functional secured transactions system and establishes a centralized, notice-based, online collateral registry.
Protecting Minority Investors: Malawi strengthened minority investor protections by increasing shareholder rights and role in major corporate decisions, by clarifying ownership and control structures through the prohibition of a subsidiary company from acquiring shares issued by its parent company, and by extending the ability for shareholders to recover their legal expenses.

MALAWI: MOBILIZING LONG-TERM FINANCE FOR INFRASTRUCTURE
151
DB2015 Starting a Business: Malawi made starting a business easier by streamlining company name search and registration and by eliminating the requirement for inspection of company premises before issuance of a business license.
Getting Electricity: Malawi reduced the time required to get electricity by engaging subcontractors to carry out external connection works.
DB2014 Registering Property: Malawi made transferring property easier by reducing the stamp duty.
DB2013 Dealing with Construction Permits: Malawi made dealing with construction permits more expensive by increasing the cost to obtain the plan approval and to register the property.
Paying Taxes: Malawi introduced a mandatory pension contribution for companies.
Trading across Borders: Trading across borders in Malawi became easier thanks to improvements in customs clearance procedures and transport links between the port of Beira in Mozambique and Blantyre.
DB2012 Registering Property: Malawi made property registration slower by no longer sustaining last year’s time improvement in compliance certificate processing times at the Ministry of Lands.
Getting Credit: Malawi improved its credit information system by passing a new law allowing the creation of a private credit bureau.
Resolving Insolvency: Malawi adopted new rules providing clear procedural requirements and time frames for winding up a company.
Employing Workers: Malawi decreased the severance pay applicable in case of redundancy dismissals of workers with 10 years of service.
DB2011 Registering Property: Malawi eased property transfers by cutting the wait for consents and registration of legal instruments by half.
Enforcing Contracts: Malawi simplified the enforcement of contracts by raising the ceiling for commercial claims that can be brought to the magistrates court.
DB2010 Paying Taxes: Malawi made paying taxes less time-consuming for companies by encouraging the use of electronic systems.
Trading across Borders: Malawi reduced delays in clearing goods by implementing a risk-based inspection system and a post destination clearance program for preapproved traders.
Resolving Insolvency: Malawi enhanced its insolvency process through a new law limiting the liquidator’s fees.
DB2008 Enforcing Contracts: Malawi made enforcing contracts easier by opening a commercial court and hiring judges for the court.