Making the World - ICAO
20
Making the World A better place to live SFO August 2016
Transcript of Making the World - ICAO

Making the World
A better place to live
SFOAugust 2016

Facts about consumption (B777)
Flight
113.3Kg Fuel
356.9Kg CO2
per
min
Ground
23.3Kg Fuel
73.4Kg CO2
per
min
APU
3.9Kg Fuel
12.3Kg CO2
per
min
Count Seconds, not minutes
Facts about consumption (B777)
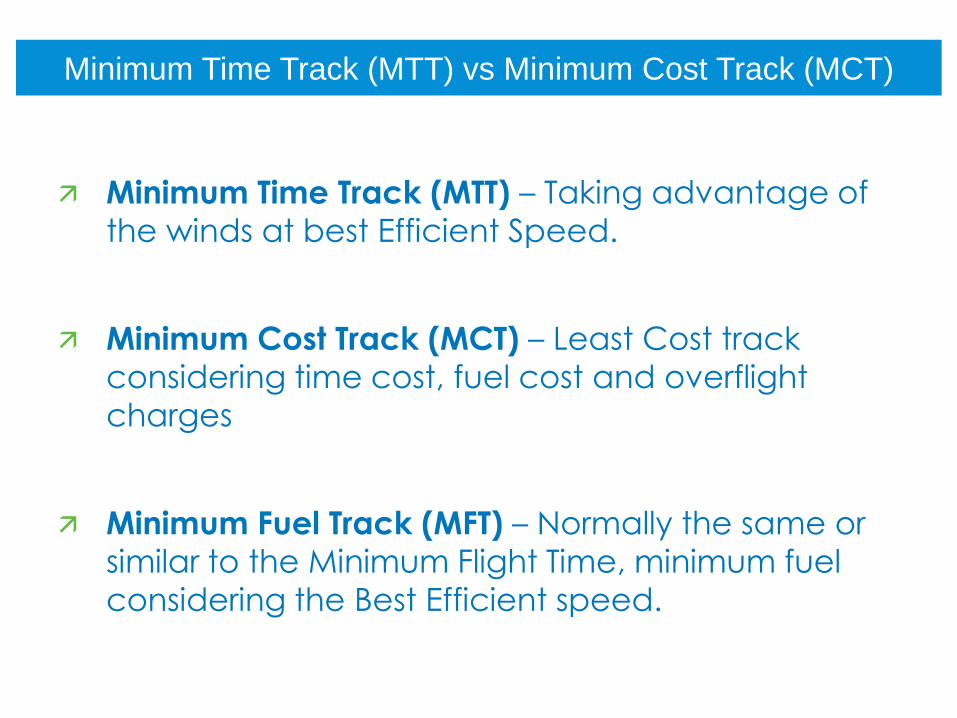
Minimum Time Track (MTT) vs Minimum Cost Track (MCT)
Minimum Time Track (MTT) – Taking advantage of
the winds at best Efficient Speed.
Minimum Cost Track (MCT) – Least Cost track
considering time cost, fuel cost and overflight
charges
Minimum Fuel Track (MFT) – Normally the same or
similar to the Minimum Flight Time, minimum fuel
considering the Best Efficient speed.
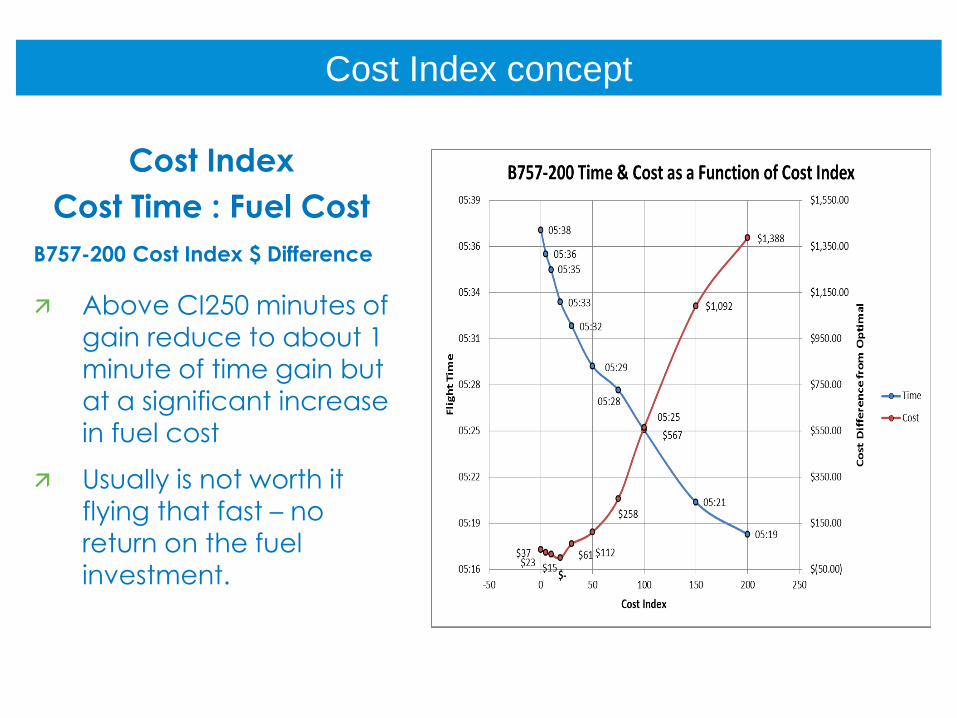
Cost Index concept
Cost Index
Cost Time : Fuel Cost
B757-200 Cost Index $ Difference
Above CI250 minutes of gain reduce to about 1
minute of time gain but
at a significant increase
in fuel cost
Usually is not worth it
flying that fast – no
return on the fuel
investment.

Minimum Time Track (MTT) vs Minimum Cost Track (MCT) concept
Correct Cost Index usage
Assign the expected SID / STAR /
Approach for accurate fuel planning
Optimized flight plan for the defined
strategy Minimum Cost Track (MCT) or
Minimum Time Track (MTT)
Planning according to a CDM plan to
approach Flight Planning to Execution
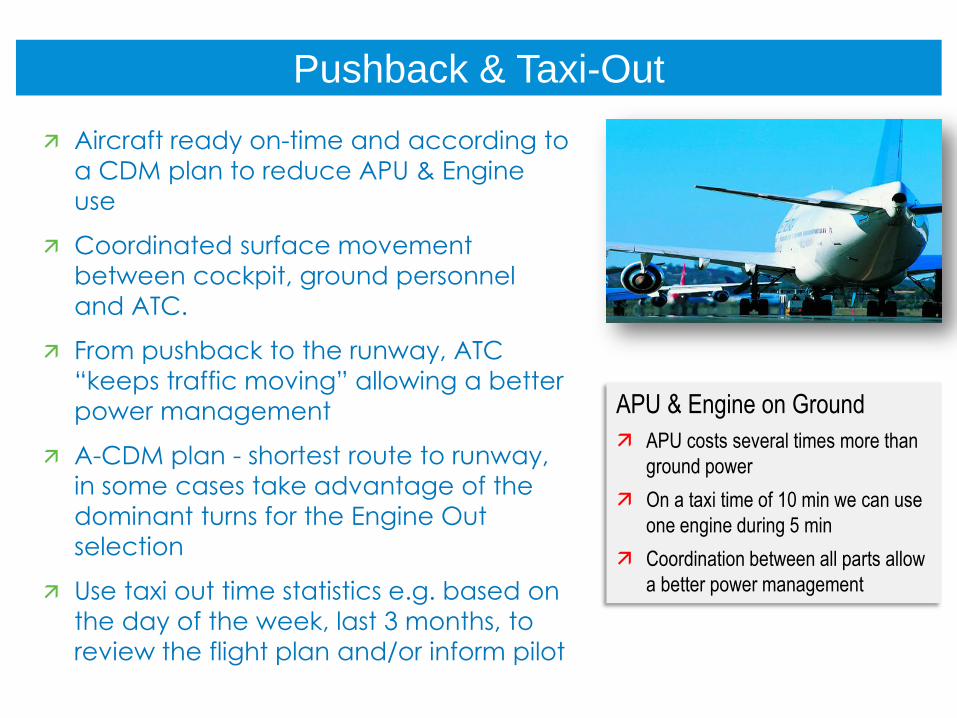
Pushback & Taxi-Out
Aircraft ready on-time and according to
a CDM plan to reduce APU & Engine
use
Coordinated surface movement
between cockpit, ground personnel
and ATC.
From pushback to the runway, ATC
“keeps traffic moving” allowing a better
power management
A-CDM plan - shortest route to runway,
in some cases take advantage of the
dominant turns for the Engine Out
selection
Use taxi out time statistics e.g. based on
the day of the week, last 3 months, to
review the flight plan and/or inform pilot
APU & Engine on Ground
APU costs several times more than
ground power
On a taxi time of 10 min we can use
one engine during 5 min
Coordination between all parts allow
a better power management

Approaching the Runway
ATC updates on take-off sequence to:
Allow pilots to complete pre-take off tasks
reducing runway occupancy
In case of Engine Out Taxi Out calculate and
even coordinate start-up/warm-up time
Better traffic sequencing and RECAT
can also reduce ground time if
available
Rolling take-off avoids or eliminates
intermediate stop reducing runway
occupancy time and hold periods
Intersection take-offs when
performance permits
Runway direction linked to flight route
Runway Selection
Savings per movement also
improves overall airport throughput
Each minute of flight in the ‘wrong-
direction’ equals roughly to 9
minutes of taxi fuel burn
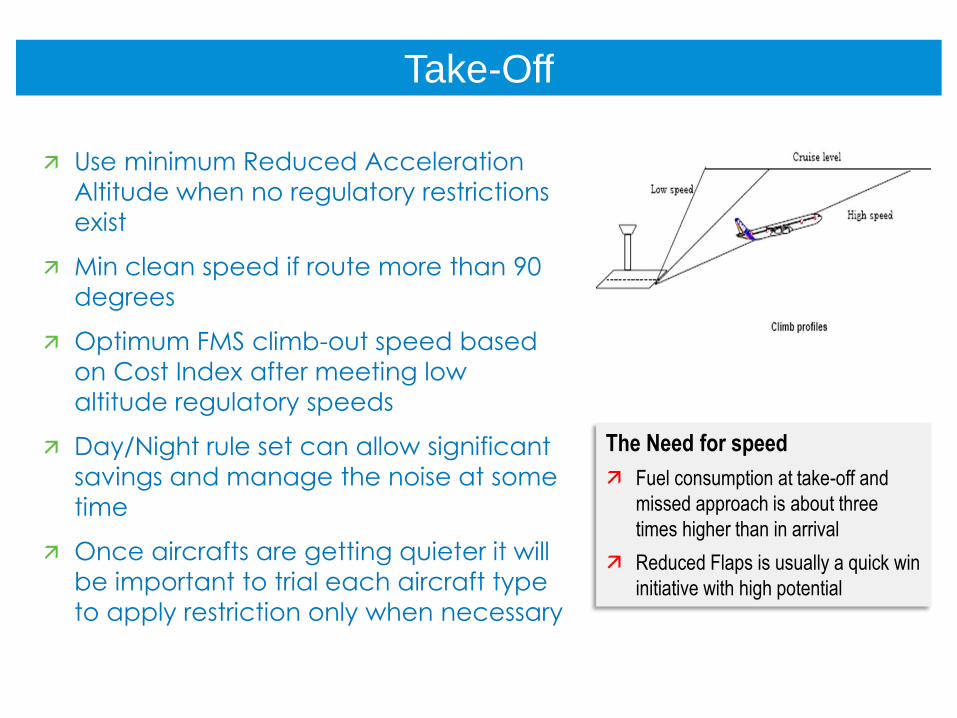
Use minimum Reduced Acceleration
Altitude when no regulatory restrictions
exist
Min clean speed if route more than 90
degrees
Optimum FMS climb-out speed based
on Cost Index after meeting low
altitude regulatory speeds
Day/Night rule set can allow significant
savings and manage the noise at some
time
Once aircrafts are getting quieter it will
be important to trial each aircraft type
to apply restriction only when necessary
The Need for speed
Fuel consumption at take-off and
missed approach is about three
times higher than in arrival
Reduced Flaps is usually a quick win
initiative with high potential
Take-Off

Avoiding steps during climb
+++ CO2 up to FL100
++ CO2 up to FL200
+ CO2 up
to FL300
Track miles vs step climbs
ICAO Doc 9993
Calculate:CO2 saved
After
implementing
CCO track
how many
step climbs,
per aircraft
type, per FL
range

After 4 hours, this aircraft is 24,000kg
lighter and should climb to a higher
optimum altitude
If the flight plan is optimized and
updated, use Flight Plan levels
Challenge the coordination between
sectors to achieve the pretended
optimized level
Use optimized speed based on Cost
Index
Update temperature and winds on the
FMS for more accurate Cost Index
speed and level
Optimum altitudes
Flying 4000ft below optimum can
increase the fuel burn ~350kg per
hour
Reducing Cost Index when ahead of
schedule can additional fuel
EnRoute

Flight Level
Flexibility
Allowing traffic to fly
the optimized altitude

VCP-MEM (Optimized route)Fuel
(lbs)Flt Time
(hrs:mins / mins)
Fuel burn
(lbs/hr)
Fuel
(lbs)Flt Time
(hrs:mins / mins)
Fuel burn
(lbs/hr)
Fuel
(lbs)Flt Time
(hrs:mins / mins)
Fuel burn
(lbs/hr)
QTR1 (Capped until DIBOK) 60 207,719 09:16 / 556 22,416 207,823 09:15 / 555 22,467 208,431 09:14 / 554 22,574
QTR2 (Capped until DIBOK) 60 206,622 09:09 / 549 22,582 206,566 09:09 / 549 22,576 207,084 09:08 / 548 22,673
QTR3 (Capped until DIBOK) 60 203,270 08:58 / 538 22,670 203,534 08:58 / 538 22,699 204,045 08:57 / 537 22,798
QTR4 (Capped until DIBOK) 60 206,561 09:09 / 549 22,575 207,403 09:06 / 546 22,792 208,966 09:04 / 544 23,048
MD11 Fuel plan (lbs) / (flt time)Ops Unrestricted FL
FL340
Capped until: (MKJK FIR)
FL320 FL300
GRU-ATL (Optimized route)Fuel
(lbs)
Flt Time
(hrs:mins / mins)
Fuel burn
(lbs/hr)
Fuel
(lbs)
Flt Time
(hrs:mins / mins)
Fuel burn
(lbs/hr)
Fuel
(lbs)
Flt Time
(hrs:mins / mins)
Fuel burn
(lbs/hr)QTR1 (Capped until DIBOK) 82 112,628 9:13 / 553 12,220 114,128 9:11 / 551 12,427 115,828 9:14 / 554 12,545
QTR2 (Capped until DIBOK) 5 112,908 9:12 / 552 12,272 113,732 9:10 / 550 12,407 115,132 9:11 / 551 12,537
QTR3 (Capped until DIBOK) 5 109,860 8:59 / 539 12,229 110,859 8:58 / 538 12,363 112,559 8:59 / 539 12,530
QTR4 (Capped until DIBOK) 57 112,841 9:13 / 553 12,243 113,641 9:10 / 550 12,397 115,140 9:12 / 552 12,515
B764 Fuel plan (lbs) / (flt time)Ops
FL320 FL300 FL280
Unrestricted FL Capped until: (MKJK FIR)
Savings per annum in Fuel Kg and CO2 Ton
South to North capping FL 320 at DIBOK / ANU
609 Ton | 1,918 Ton CO2 | Year
Brazil (VCP / GRU / GIG) to US (MEM / ATL / JFK)
↗ 3 airlines contributing to this
study
↗ Aiming 1000 flights for an
year period with B767 / B777
↗ 3 routes from Brazil to USA
Potential savings calculation
Case Study
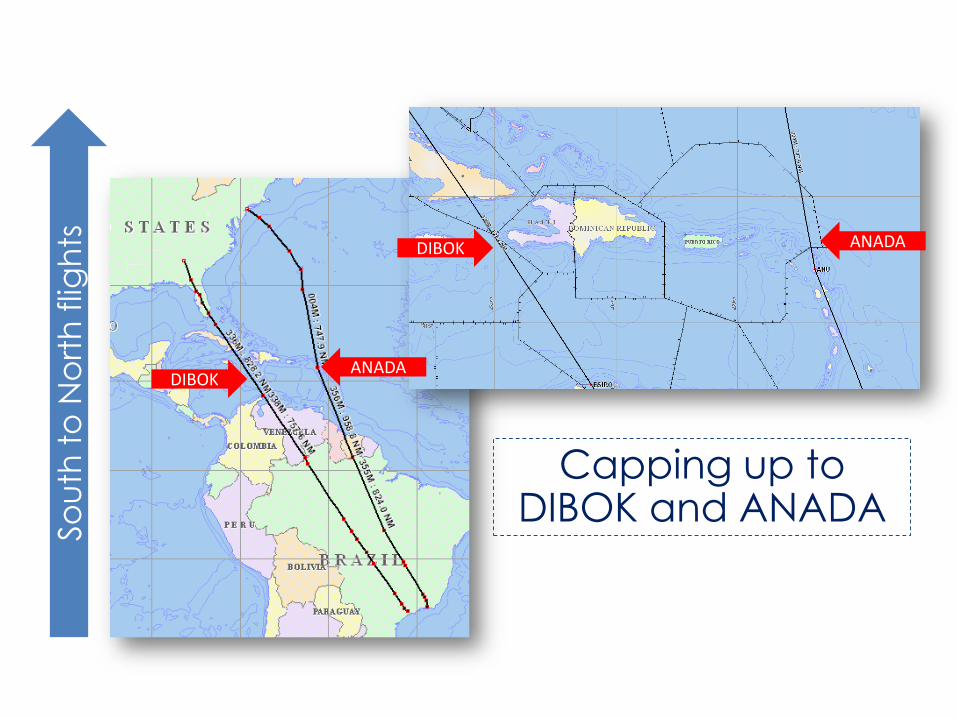
DIBOKANADA
DIBOK ANADA
Capping up to DIBOK and ANADA
So
uth
to
No
rth
flig
hts
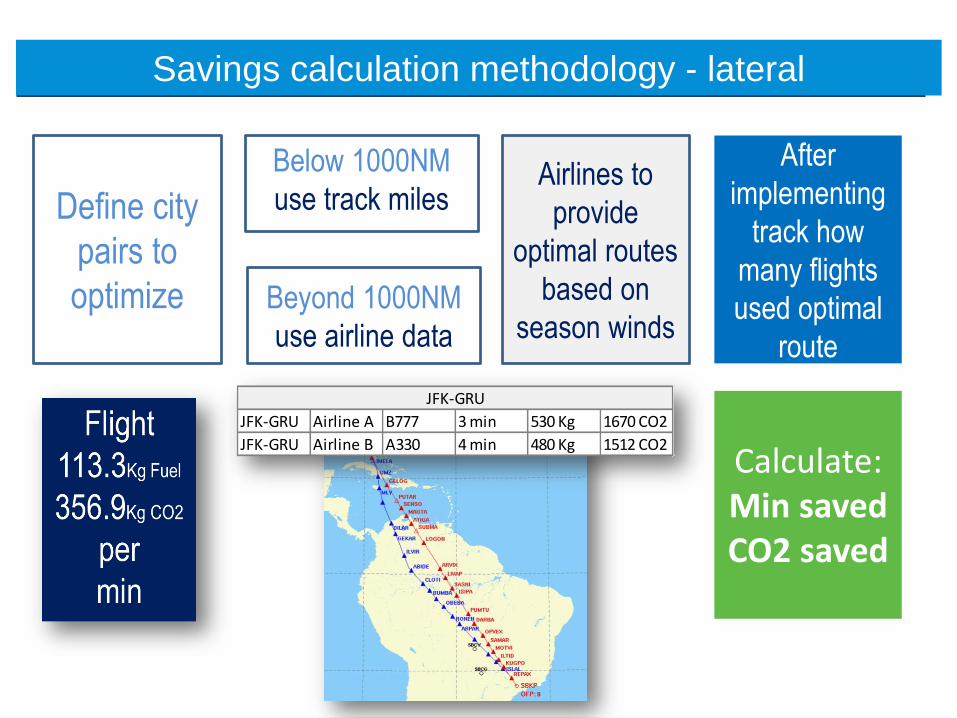
Savings calculation methodology - lateral
Define city
pairs to
optimize
Below 1000NM
use track miles
Beyond 1000NM
use airline data
Airlines to
provide
optimal routes
based on
season winds
After
implementing
track how
many flights
used optimal
route
Calculate:Min savedCO2 saved
JFK-GRU Airline A B777 3 min 530 Kg 1670 CO2
JFK-GRU Airline B A330 4 min 480 Kg 1512 CO2
JFK-GRU

Long term goals & High level Roadmap
FMS optimized descend profile The FMS will calculate the Top of Descend (TOD) as a
function of the Cost Index
On this case, up to 77kg burn difference when optimized
profile is not flown, winds must be loaded on FMS
Calculate:CO2 saved
Number R/T
can mean
vectoring or
level-off,
Track R/T
number and
level off per
a/c type
17IATA Fuel Efficiency Workshop 2015
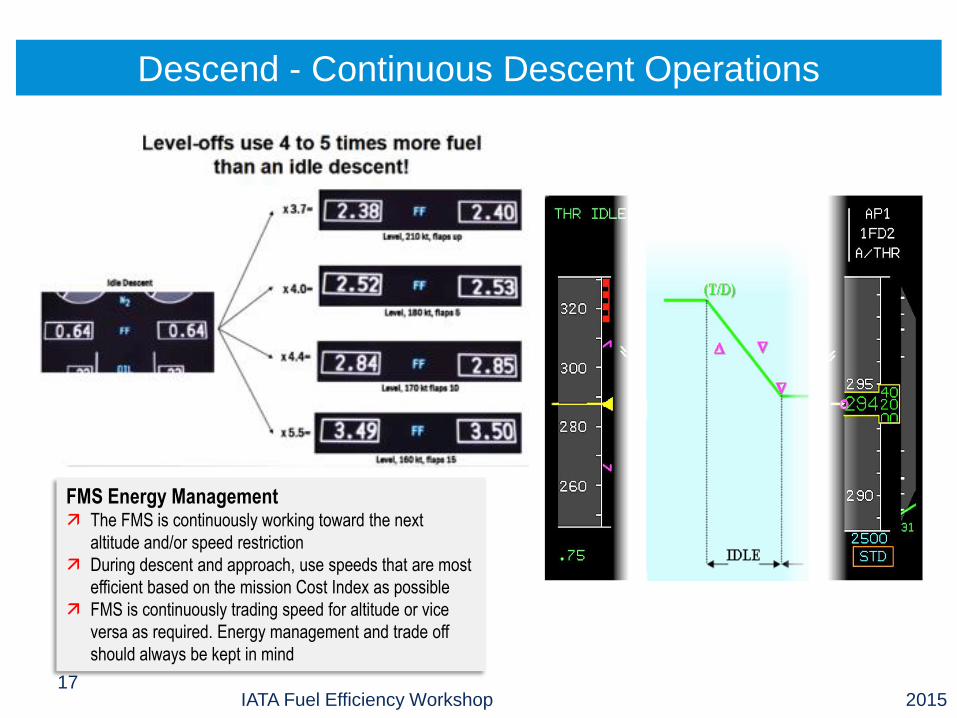
Descend - Continuous Descent Operations
FMS Energy Management The FMS is continuously working toward the next
altitude and/or speed restriction
During descent and approach, use speeds that are most
efficient based on the mission Cost Index as possible
FMS is continuously trading speed for altitude or vice
versa as required. Energy management and trade off
should always be kept in mind

Descend - Continuous Descent Operations
Continuous descent /approach can result in:
Saving 1 min per flight means 30kg-156K tons CO2 / 40% less noise
RECAT and Time Base Separation increase capacity and increases
efficiency
Continuous Descent Operation:
ATC clearance to descend at Pilot’s Discretion
FMS / Flight Idle to incorporate:
Cost Index Speed
Rate of descent
Accurate time predictions at gate
RNAV / RNP Approach
More direct approach reducing time and track
miles
Reduced fuel burn, emissions and less noise
Fewer WX diversions
ATFM best practices
Timely communication to stakeholders before and
during disruption or services
Airlines
Airports
Other ATS or ATFM units
An option could be to use ITOP (IATA’s “one stop shop”
for tactical CDM) that could be used by all ATCs
supervisors or FMPs/FMUs to share information.
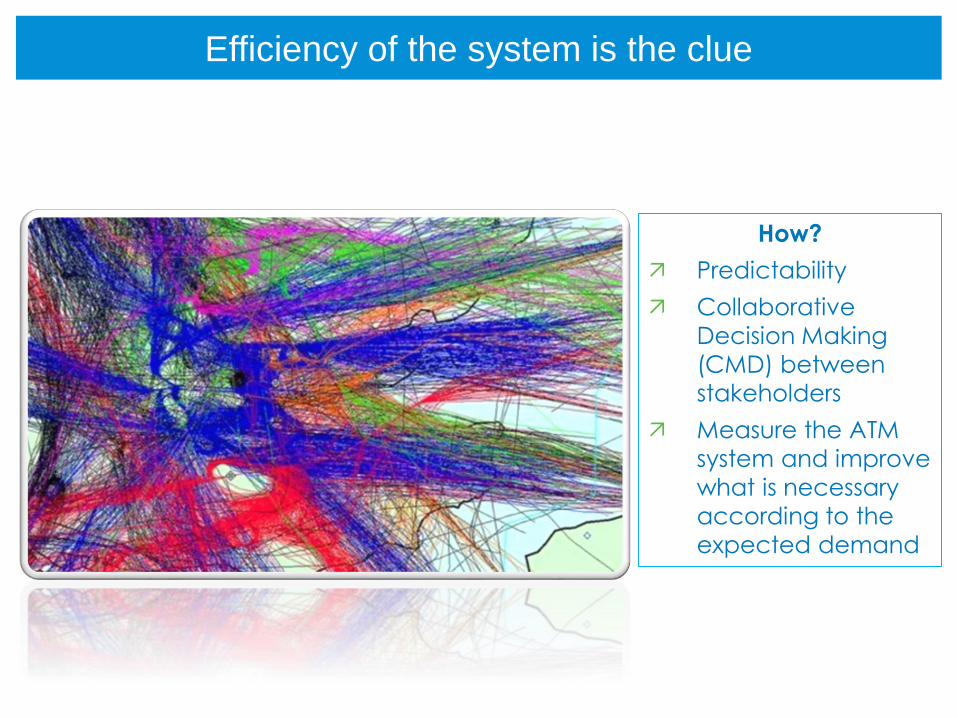
Efficiency of the system is the clue
How?
Predictability
Collaborative
Decision Making
(CMD) between
stakeholders
Measure the ATM
system and improve
what is necessary
according to the
expected demand

THANK YOU
QUESTIONS?